Supplemental Data. De Clercq et al. Plant Cell. (2013). … Data. De Clercq et al. Plant Cell....
34
Supplemental Data. De Clercq et al. Plant Cell. (2013). 10.1105/tpc.113.117168 1 Supplemental Figure 1. Binding of NAC transcription factors with the MDM of the At5g09570, UPOX, and At2g04050 promoter in vitro as shown by electrophoretic-mobility shift assays. Interactions of purified NAC-GST proteins with radioactively-labeled probes of promoter regions containing the MDM element are shown. Interactions were abolished in the presence of excess unlabeled competitor probes or when the MDM sequence was mutated.
Transcript of Supplemental Data. De Clercq et al. Plant Cell. (2013). … Data. De Clercq et al. Plant Cell....

Supplemental Data. De Clercq et al. Plant Cell. (2013). 10.1105/tpc.113.117168
1
Supplemental Figure 1. Binding of NAC transcription factors with the MDM of the At5g09570, UPOX, and At2g04050 promoter in vitro as shown by electrophoretic-mobility shift assays. Interactions of purified NAC-GST proteins with radioactively-labeled probes of promoter regions containing the MDM element are shown. Interactions were abolished in the presence of excess unlabeled competitor probes or when the MDM sequence was mutated.

Supplemental Data. De Clercq et al. Plant Cell. (2013). 10.1105/tpc.113.117168
2
Supplemental Figure 2. Hierarchical clustering of the MRR up-regulated genes in the CORNET stress data set, a compilation of biotic and abiotic stress conditions. Color codes in the heat map represent the actual log2-fold changes in treated plants relative to untreated plants. Conditions are indicated with a color code: cold (blue), heat (red), salt and osmotic (orange), drought (yellow), light and oxidative (white), chemical (purple), nutrient depriviation (brown), mechanical (black), pathogen (green), and other and control (white). The MDS genes containing the cis-regulatory MDM in their 1-kb upstream sequence are indicated with a green bar. (A) Heatmap showing all selected stress conditions. (B) Enlargement of a part of the heat map, indicated by a rectangle in panel A, containing the conditions under which the MDS genes are highly up-regulated and co-expressed.

Supplemental Data. De Clercq et al. Plant Cell. (2013). 10.1105/tpc.113.117168
3
Supplemental Figure 3. Schematic overview of the amplicons used in ChIP-qPCR analyses. The MDM (black box) and the amplicons used in ChIP analyses (purple box) are displayed in the 1-kb upstream intergentic regions of the MDS genes.

Supplemental Data. De Clercq et al. Plant Cell. (2013). 10.1105/tpc.113.117168
4
Supplemental Figure 4. Interaction of ANAC013 with MDS promoters in planta as shown by ChIP. Enrichment of promoter fragments surrounding the MDM after ChIP on control-grown 35S:GFP-ANAC013 and 35S:ANAC013 (as a negative control) (A) and mock- and AA-treated ProANAC013:GFP-ANAC013 and wild-type (Col-0; as a negative control) (B) seedlings with anti-GFP antibody (GFP-IP) and without antibody (NO AB). ACTIN2, CDKA;1, and UBQ10 fragments were used as negative controls. Bars represent fold enrichment relative to the total genomic DNA from one biological sample (% INPUT). Similar data were obtained in at least one other biological repeat experiment and with different independent transgenic lines.

Supplemental Data. De Clercq et al. Plant Cell. (2013). 10.1105/tpc.113.117168
5
Supplemental Figure 5. MRR-mediated gene expression of the MDS regulated by ANAC013 in Arabidopsis. (A) ANAC013-overexpressing plants (35S:ANAC013-6) induce MDS gene expression under nonstressed conditions. Transcript abundance was analyzed with the Nanostring nCounter system, except for five genes (indicated with asterisk) for which the probes were not present on the CodSet en hence were analyzed with qRT-PCR. Bars represent average fold changes relative to wild-type (Col-0) plants from three biological replicates (± SE). Asterisk indicates significant differences to Col-0 (Student’s t test; * P<0.05, ** P<0.01, and *** P<0.001). (B) Failure of ANAC013-miR to fully induce MDS gene expression in response to AA-mediated mitochondrial perturbation. MDS transcript levels were analyzed in wild-type (Col-0) and ANAC013-miR plants that were either mock-treated (Control) or treated with AA for 3 h (3h AA) or 6 h (6h AA). Expression was analyzed by qRT-PCR and data are average expression values (± SE) obtained from three biological replicates. The transcript level of wild-type (Col-0) under nonstressed conditions was arbitrarily set to 1. * indicates a significant difference between ANAC013-miR and Col-0 at an overall significance level of 0.05, **0.01, and ***0.001.
Supplemental Data. De Clercq et al. Plant Cell. (2013). 10.1105/tpc.113.117168
6
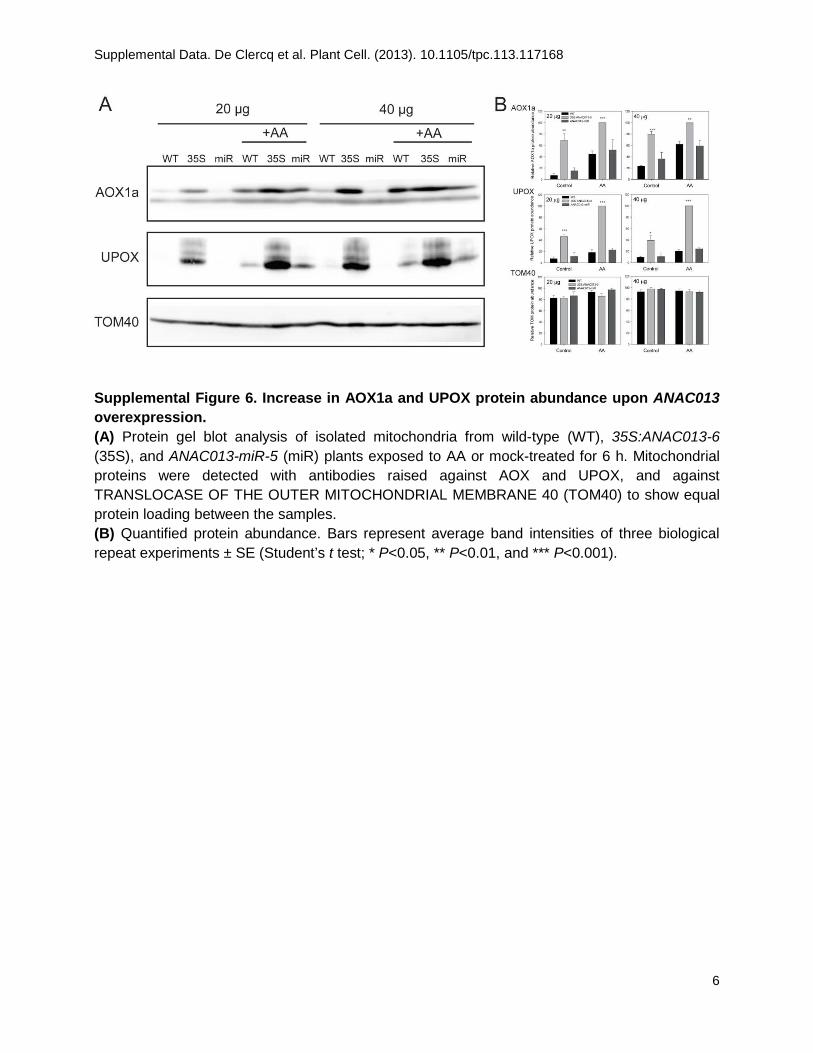
Supplemental Figure 6. Increase in AOX1a and UPOX protein abundance upon ANAC013 overexpression. (A) Protein gel blot analysis of isolated mitochondria from wild-type (WT), 35S:ANAC013-6 (35S), and ANAC013-miR-5 (miR) plants exposed to AA or mock-treated for 6 h. Mitochondrial proteins were detected with antibodies raised against AOX and UPOX, and against TRANSLOCASE OF THE OUTER MITOCHONDRIAL MEMBRANE 40 (TOM40) to show equal protein loading between the samples. (B) Quantified protein abundance. Bars represent average band intensities of three biological repeat experiments ± SE (Student’s t test; * P<0.05, ** P<0.01, and *** P<0.001).

Supplemental Data. De Clercq et al. Plant Cell. (2013). 10.1105/tpc.113.117168
7
Supplemental Figure 7. Autoregulation of ANAC013 expression. (A) Activation by ANAC013 of its own promoter-driven GUS reporter gene in ANAC013-overexpressing plants (35S:ANAC013-6). These results were confirmed in four independent transgenic lines, of which one is shown here. (B) Electrophoretic-mobility shift assays of the binding of NAC transcription factors (ANAC013, ANAC017, ANAC053, and ANAC078) with the MDM of the ANAC013 promoter in vitro. Interactions of purified NAC-GST proteins with a radioactively labeled probe of an ANAC013 promoter region containing the MDM element. Interactions were abolished in the presence of excess unlabeled competitor probes or when the MDM sequence was mutated.
Supplemental Data. De Clercq et al. Plant Cell. (2013). 10.1105/tpc.113.117168
8
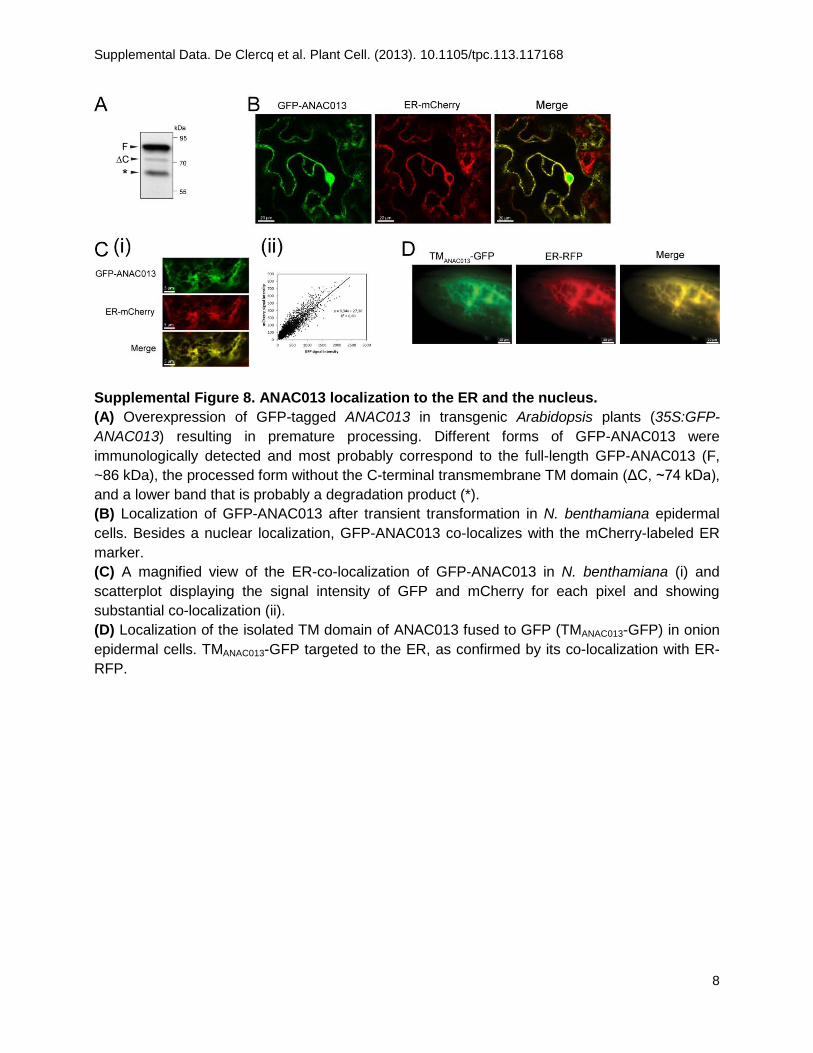
Supplemental Figure 8. ANAC013 localization to the ER and the nucleus. (A) Overexpression of GFP-tagged ANAC013 in transgenic Arabidopsis plants (35S:GFP-ANAC013) resulting in premature processing. Different forms of GFP-ANAC013 were immunologically detected and most probably correspond to the full-length GFP-ANAC013 (F, ~86 kDa), the processed form without the C-terminal transmembrane TM domain (ΔC, ~74 kDa), and a lower band that is probably a degradation product (*). (B) Localization of GFP-ANAC013 after transient transformation in N. benthamiana epidermal cells. Besides a nuclear localization, GFP-ANAC013 co-localizes with the mCherry-labeled ER marker. (C) A magnified view of the ER-co-localization of GFP-ANAC013 in N. benthamiana (i) and scatterplot displaying the signal intensity of GFP and mCherry for each pixel and showing substantial co-localization (ii). (D) Localization of the isolated TM domain of ANAC013 fused to GFP (TMANAC013-GFP) in onion epidermal cells. TMANAC013-GFP targeted to the ER, as confirmed by its co-localization with ER-RFP.
Supplemental Data. De Clercq et al. Plant Cell. (2013). 10.1105/tpc.113.117168
9
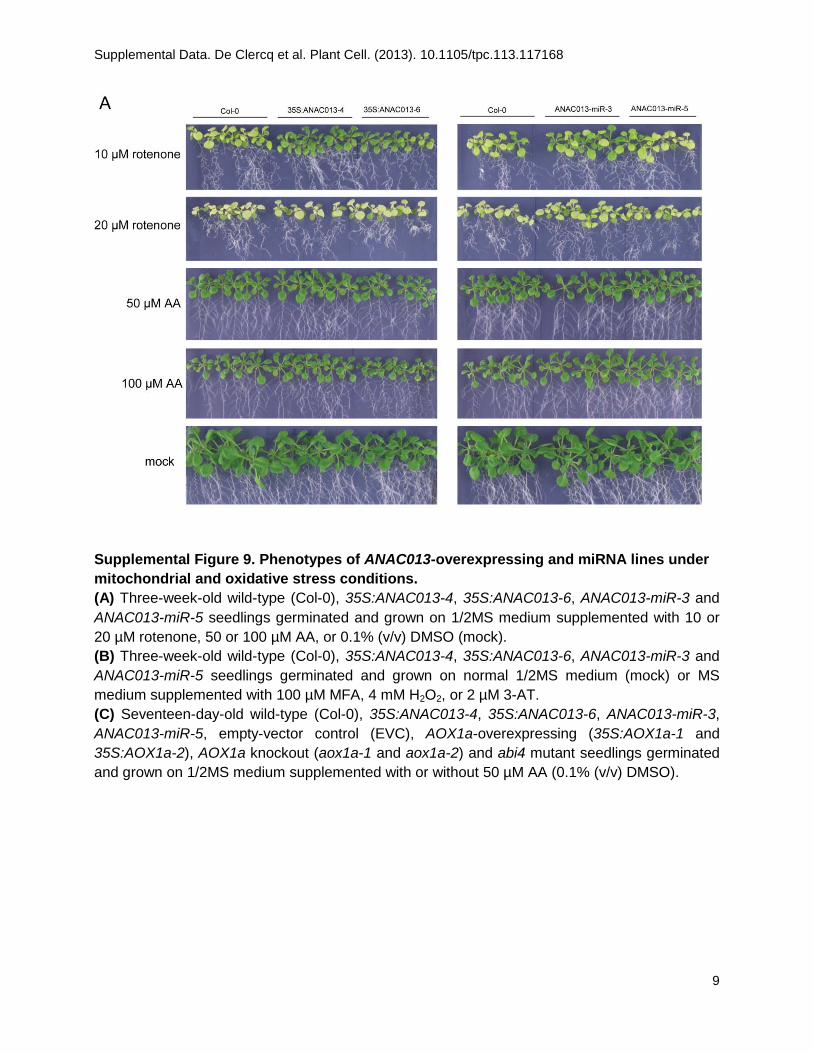
Supplemental Figure 9. Phenotypes of ANAC013-overexpressing and miRNA lines under mitochondrial and oxidative stress conditions. (A) Three-week-old wild-type (Col-0), 35S:ANAC013-4, 35S:ANAC013-6, ANAC013-miR-3 and ANAC013-miR-5 seedlings germinated and grown on 1/2MS medium supplemented with 10 or 20 µM rotenone, 50 or 100 µM AA, or 0.1% (v/v) DMSO (mock). (B) Three-week-old wild-type (Col-0), 35S:ANAC013-4, 35S:ANAC013-6, ANAC013-miR-3 and ANAC013-miR-5 seedlings germinated and grown on normal 1/2MS medium (mock) or MS medium supplemented with 100 µM MFA, 4 mM H2O2, or 2 µM 3-AT. (C) Seventeen-day-old wild-type (Col-0), 35S:ANAC013-4, 35S:ANAC013-6, ANAC013-miR-3, ANAC013-miR-5, empty-vector control (EVC), AOX1a-overexpressing (35S:AOX1a-1 and 35S:AOX1a-2), AOX1a knockout (aox1a-1 and aox1a-2) and abi4 mutant seedlings germinated and grown on 1/2MS medium supplemented with or without 50 µM AA (0.1% (v/v) DMSO).

Supplemental Data. De Clercq et al. Plant Cell. (2013). 10.1105/tpc.113.117168
10
Supplemental Figure 9. Phenotypes of ANAC013-overexpressing and miRNA lines under mitochondrial and oxidative stress conditions. (Continued). (A) Three-week-old wild-type (Col-0), 35S:ANAC013-4, 35S:ANAC013-6, ANAC013-miR-3 and ANAC013-miR-5 seedlings germinated and grown on 1/2MS medium supplemented with 10 or 20 µM rotenone, 50 or 100 µM AA, or 0.1% (v/v) DMSO (mock). (B) Three-week-old wild-type (Col-0), 35S:ANAC013-4, 35S:ANAC013-6, ANAC013-miR-3 and ANAC013-miR-5 seedlings germinated and grown on normal 1/2MS medium (mock) or MS medium supplemented with 100 µM MFA, 4 mM H2O2, or 2 µM 3-AT. (C) Seventeen-day-old wild-type (Col-0), 35S:ANAC013-4, 35S:ANAC013-6, ANAC013-miR-3, ANAC013-miR-5, empty-vector control (EVC), AOX1a-overexpressing (35S:AOX1a-1 and 35S:AOX1a-2), AOX1a knockout (aox1a-1 and aox1a-2) and abi4 mutant seedlings germinated and grown on 1/2MS medium supplemented with or without 50 µM AA (0.1% (v/v) DMSO).

Supplemental Data. De Clercq et al. Plant Cell. (2013). 10.1105/tpc.113.117168
11
Supplemental Figure 9. Phenotypes of ANAC013-overexpressing and miRNA lines under mitochondrial and oxidative stress conditions. (Continued). (A) Three-week-old wild-type (Col-0), 35S:ANAC013-4, 35S:ANAC013-6, ANAC013-miR-3 and ANAC013-miR-5 seedlings germinated and grown on 1/2MS medium supplemented with 10 or 20 µM rotenone, 50 or 100 µM AA, or 0.1% (v/v) DMSO (mock). (B) Three-week-old wild-type (Col-0), 35S:ANAC013-4, 35S:ANAC013-6, ANAC013-miR-3 and ANAC013-miR-5 seedlings germinated and grown on normal 1/2MS medium (mock) or MS medium supplemented with 100 µM MFA, 4 mM H2O2, or 2 µM 3-AT. (C) Seventeen-day-old wild-type (Col-0), 35S:ANAC013-4, 35S:ANAC013-6, ANAC013-miR-3, ANAC013-miR-5, empty-vector control (EVC), AOX1a-overexpressing (35S:AOX1a-1 and 35S:AOX1a-2), AOX1a knockout (aox1a-1 and aox1a-2) and abi4 mutant seedlings germinated and grown on 1/2MS medium supplemented with or without 50 µM AA (0.1% (v/v) DMSO).

Supplemental Data. De Clercq et al. Plant Cell. (2013). 10.1105/tpc.113.117168
12
Supplemental Figure 10. Increased photosynthetic performance of ANAC013-overexpressing plants after exposure to MV-mediated oxidative stress. (A) Maximum efficiency of PSII (F’v/F’m) in leaves of wild-type (Col-0) and 35S:ANAC013 plants at different time points after transfer to 2 μM MV. The youngest leaves are the most affected by MV compared to the older leaves (arrows). (B) Quantification of F’v/F’m of youngest leaves in wild-type and 35S:ANAC013 plants. Data indicate average ± SE (n = 5 plants for 35S:ANAC013, n = 10 plants for Col-0).
Supplemental Data. De Clercq et al. Plant Cell. (2013). 10.1105/tpc.113.117168
13
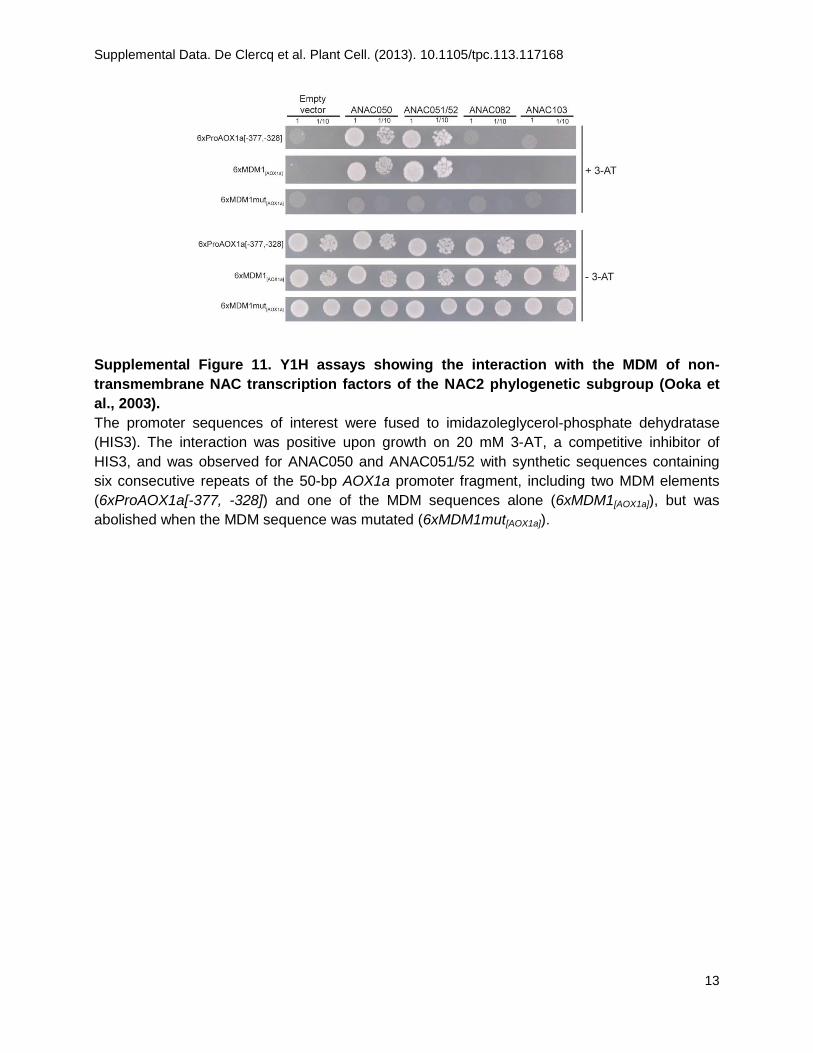
Supplemental Figure 11. Y1H assays showing the interaction with the MDM of non-transmembrane NAC transcription factors of the NAC2 phylogenetic subgroup (Ooka et al., 2003). The promoter sequences of interest were fused to imidazoleglycerol-phosphate dehydratase (HIS3). The interaction was positive upon growth on 20 mM 3-AT, a competitive inhibitor of HIS3, and was observed for ANAC050 and ANAC051/52 with synthetic sequences containing six consecutive repeats of the 50-bp AOX1a promoter fragment, including two MDM elements (6xProAOX1a[-377, -328]) and one of the MDM sequences alone (6xMDM1[AOX1a]), but was abolished when the MDM sequence was mutated (6xMDM1mut[AOX1a]).
Supplemental Data. De Clercq et al. Plant Cell. (2013). 10.1105/tpc.113.117168
14
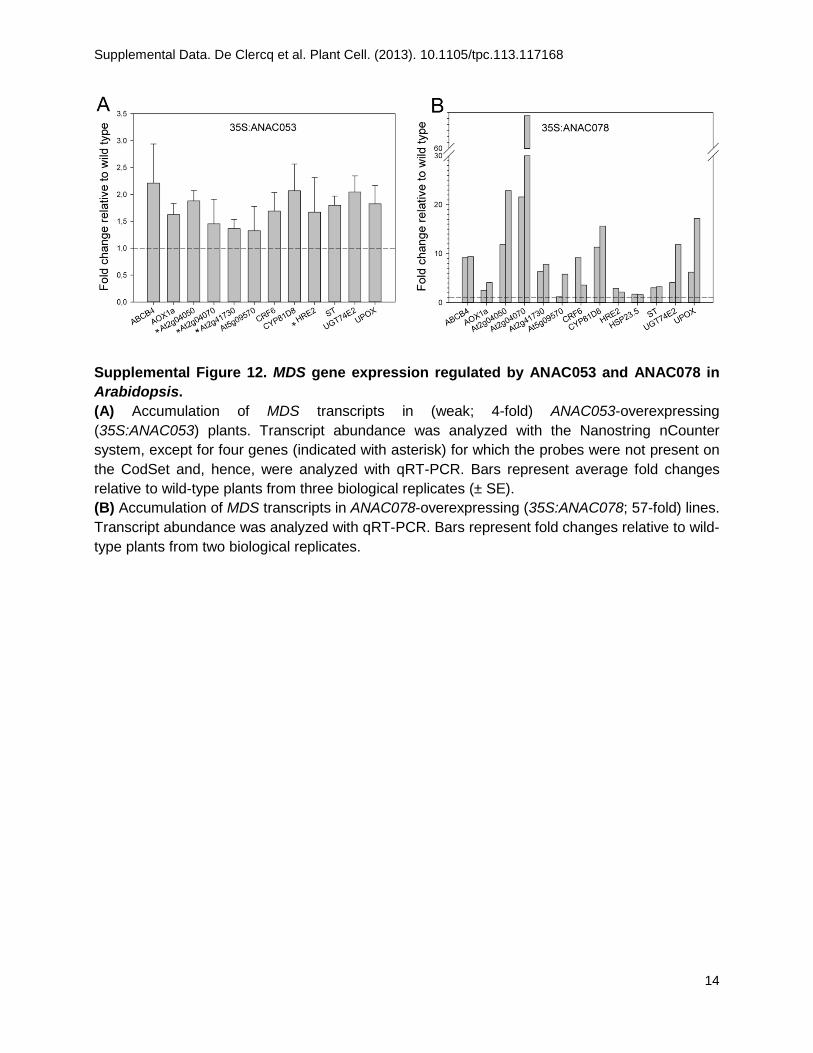
Supplemental Figure 12. MDS gene expression regulated by ANAC053 and ANAC078 in Arabidopsis. (A) Accumulation of MDS transcripts in (weak; 4-fold) ANAC053-overexpressing (35S:ANAC053) plants. Transcript abundance was analyzed with the Nanostring nCounter system, except for four genes (indicated with asterisk) for which the probes were not present on the CodSet and, hence, were analyzed with qRT-PCR. Bars represent average fold changes relative to wild-type plants from three biological replicates (± SE). (B) Accumulation of MDS transcripts in ANAC078-overexpressing (35S:ANAC078; 57-fold) lines. Transcript abundance was analyzed with qRT-PCR. Bars represent fold changes relative to wild-type plants from two biological replicates.

Supplemental Data. De Clercq et al. Plant Cell. (2013). 10.1105/tpc.113.117168
15
Supplemental Figure 13. Diagram summarizing the role of ANAC013 in MRR. Upon mitochondrial perturbation, ANAC013 positively regulates MDS (for mitochondrial dysfunction stimulon) gene expression by binding the MDM (for mitochondrial dysfunction motif) cis-regulatory element. ANAC013 contains a transmembrane domain and is anchored to the endoplasmic reticulum (ER) under nonstressed conditions. Therefore, we hypothesize that upon mitochondrial triggers, ANAC013 is proteolytically released from the ER and translocated to the nucleus to mediate MRR-induced gene expression. AA, Antimycin A; MFA, monofluoroacetate; mtETC, mitochondrial electron transport chain; TCA, tricarboxylic acid.

Supplemental Data. De Clercq et al. Plant Cell. (2013). 10.1105/tpc.113.117168
16
Supplemental Table 1. Overview of MRR microarray data sets used in the meta-analysis Experiment Mitochondrial target Treatment Mutation Upa Downb Reference Rotenone Inhibition of complex I 40 μM rotenone (3 h) - 430 391 Clifton et al. (2005) Oligomycin Inhibition ATP-synthase 0.125 μM oligomycin
(3 h) - 677
551 Clifton et al. (2005)
1.25 μM oligomycin (3 h)
- 551 438
Prohibitin Loss or overexpression of
prohibitin - phb3 141 112 Van Aken et al. (2007)
- phb4 2 0 - 35S:PHB3 17 50 - 35S:PHB4 22 2 MSH1 and RECA3 Mitochondrial genome
rearrangement - msh1 recA3 34 1 Shedge et al. (2010)
RPOTmp Loss of mitochondrial
RNA polymerase - rpoTmp-1 22 36 Kühn et al. (2009)
rpoTmp-2 67 136 TIM23-2 Loss or overexpression of
translocase inner membrane subunit 23-2
- tim23-2 3 0 Wang et al. (2012) - 35S:TIM23-2 70 26
RUG3 Inhibition of complex I
biogenesis - rug3-1 87 24 Kühn et al. (2011)
rug3-2 214 111 NDUFA1 and NDUFS4 Loss of complex I - ndufa1 98 48 Meyer et al. (2009)
ndufs4 2 0 AOX1a(1) Loss of alternative oxidase - aox1a-1 0 0 Giraud et al. (2008)
aox1a-2 0 0 AOX1a(2) Loss or overexpression of
alternative oxidase 35S:AOX1a
aox1a-3 0 0 NCBI GEO database
(Edgar et al., 2002), accession GSE4113
MIA40 Loss of mitochondrial
intermembrane assembly 40
- mia40 0 0 Carrie et al. (2010)
DSR1 Loss of complex II
subunit succinate dehydrogenase 1-1 (SDH1-1)
1 mM salicylic acid (40 minutes)
dsr1 181 271 Gleason et al. (2010)
a Total number of significantly (log2-fold >1; P < 0.01) up-regulated genes. b Total number of significantly (log2-fold <1; P < 0.01) down-regulated genes.

Supplemental Data. De Clercq et al. Plant Cell. (2013). 10.1105/tpc.113.117168
17
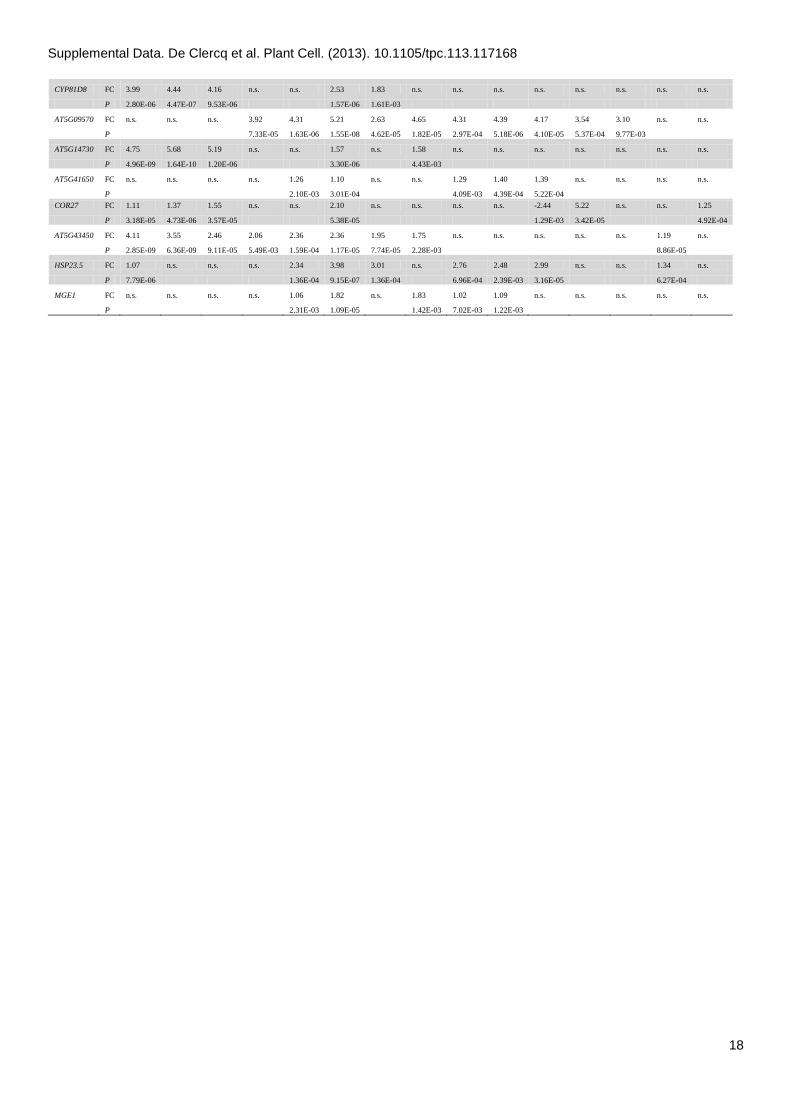
Supplemental Table 2. Expression values of the 34 MRR-up-regulated genes under five or more mitochondrial dysfunction conditions. Actual log2-fold changes (FC) in transgenic or treated plants compared to wild-type or untreated plants, respectively, and Benjamini-Hochberg false discovery rate-corrected P values are presented. n.s., not significant.
Gen
e
Rot
enon
e
Olig
omyc
in (l
ow)
Olig
omyc
in (h
igh)
rpoT
mp-
1
rpoT
mp-
2
phb3
35S:
PHB4
msh
1 re
cA3
35S:
TIM
23-2
rug3
-1
rug3
-2
nduf
a1
nduf
s4
dsr1
+ S
A
35S:
PHB3
AT1G05060 FC 1.40 1.41 1.10 n.s. n.s. 1.18 n.s. n.s. n.s. n.s. n.s. n.s. n.s. 1.29 n.s.
P 1.51E-05 1.10E-05 1.24E-03 2.65E-05 1.74E-05
UGT74E2 FC n.s. n.s. n.s. 2.68 3.11 2.97 2.66 2.70 n.s. n.s. n.s. n.s. n.s. n.s. n.s.
P 4.73E-04 1.63E-06 9.15E-07 2.55E-04 6.55E-03
AT1G24095 FC 1.03 1.14 1.06 n.s. 1.37 2.45 n.s. n.s. n.s. n.s. n.s. n.s. n.s. n.s. n.s.
P 2.58E-04 5.32E-05 3.32E-03 2.94E-03 4.27E-07
ANAC013 FC 1.63 1.87 1.56 n.s. n.s. 2.78 1.28 n.s. n.s. n.s. n.s. n.s. n.s. n.s. n.s.
P 3.38E-05 5.01E-06 1.38E-04 2.52E-07 6.25E-03
AT2G03130 FC n.s. n.s. n.s. 1.63 1.61 3.19 n.s. 2.44 n.s. n.s. n.s. 1.64 n.s. n.s. n.s.
P 1.95E-03 3.81E-04 3.03E-07 4.86E-03 9.08E-03
ST FC 3.02 3.42 2.14 1.78 1.92 3.28 2.44 2.35 1.44 1.56 1.39 n.s. n.s. n.s. n.s.
P 1.08E-08 4.29E-09 1.25E-06 4.01E-03 1.87E-04 4.27E-07 3.11E-04 1.42E-03 7.22E-03 1.72E-03 3.52E-04
AT2G04050 FC 2.23 2.11 1.96 1.61 2.05 4.84 3.38 5.01 n.s. n.s. n.s. n.s. n.s. 1.58 n.s.
P 1.37E-06 9.52E-07 5.64E-05 1.60E-03 2.96E-03 1.55E-08 2.33E-05 8.26E-05 4.72E-04
AT2G04070 FC n.s. n.s. n.s. n.s. 1.12 2.47 2.58 3.01 n.s. n.s. n.s. n.s. n.s. 2.37 n.s.
P 7.20E-03 2.38E-06 1.77E-04 1.27E-03 1.92E-06
AT2G07708 FC n.s. 1.48 1.77 n.s. n.s. n.s. n.s. n.s. n.s. 1.06 1.39 2.60 n.s. n.s. n.s.
P 1.23E-05 3.91E-05 4.62E-03 3.76E-03 5.99E-04
AT2G07783 FC n.s. n.s. n.s. n.s. n.s. 1.02 n.s. 1.46 1.88 1.70 1.54 n.s. n.s. n.s. n.s.
P 2.88E-04 8.11E-03 5.49E-04 2.09E-04 3.68E-04
AT2G07811 FC n.s. 1.32 1.22 n.s. n.s. n.s. n.s. n.s. n.s. 1.18 1.25 1.67 n.s. n.s. n.s.
P 1.80E-04 2.34E-03 2.38E-03 1.75E-03 6.02E-03
NDB4 FC n.s. n.s. n.s. 1.55 1.59 3.53 1.01 2.74 n.s. n.s. n.s. n.s. n.s. -1.18 n.s.
P 4.96E-03 8.14E-04 9.18E-07 7.38E-03 1.27E-03 2.30E-03
UPOX FC 1.46 1.16 n.s. 3.39 3.50 5.48 3.48 2.87 3.40 3.62 3.66 n.s. n.s. 1.18 n.s.
P 3.54E-05 7.69E-05 1.01E-04 1.63E-06 1.55E-08 2.03E-05 2.98E-04 2.97E-04 5.18E-06 3.16E-05 2.03E-04
AT2G32020 FC 3.19 3.68 3.43 n.s. n.s. 2.19 n.s. 2.57 n.s. n.s. n.s. n.s. n.s. 2.03 n.s.
P 1.79E-06 2.46E-07 1.41E-05 5.66E-06 2.43E-03 1.01E-06
ELF4 FC 1.86 1.94 1.77 n.s. n.s. 1.02 n.s. n.s. n.s. -1.38 n.s. 4.28 n.s. n.s. n.s.
P 2.69E-06 6.71E-07 1.42E-05 5.50E-04 1.84E-03 3.64E-04
AT2G41730 FC 4.66 5.18 4.83 3.68 4.17 5.01 3.50 4.55 2.06 1.78 1.55 n.s. n.s. 1.12 n.s.
P 3.71E-06 5.63E-07 1.36E-05 1.05E-04 6.87E-06 1.26E-07 2.03E-05 2.86E-04 5.49E-04 1.67E-03 2.53E-04 1.76E-04
ABCB4 FC 3.73 2.78 2.15 n.s. n.s. 1.78 1.26 3.98 n.s. n.s. n.s. n.s. n.s. 1.34 n.s.
P 2.91E-08 1.80E-07 6.33E-03 1.74E-05 1.04E-03 1.42E-03 1.51E-04
HRE2 FC 3.07 2.64 2.28 n.s. n.s. 2.33 1.30 n.s. n.s. n.s. n.s. n.s. n.s. n.s. n.s.
P 2.88E-07 4.38E-07 1.05E-05 6.09E-07 3.30E-04
COL9 FC n.s. 1.03 1.24 n.s. n.s. 1.44 n.s. n.s. n.s. n.s. -1.39 2.95 n.s. n.s. 1.18
P 2.06E-05 5.17E-05 4.69E-05 4.01E-03 7.97E-04 4.92E-04
AOX1a FC 2.26 2.29 1.98 n.s. 1.16 2.31 1.05 2.32 1.43 n.s. n.s. n.s. n.s. n.s. n.s.
P 1.85E-06 6.49E-07 2.40E-05 2.93E-03 4.27E-07 5.54E-04 2.07E-03 4.09E-03
OXI1 FC 3.64 3.41 2.96 n.s. n.s. 1.13 n.s. n.s. n.s. n.s. n.s. n.s. n.s. 2.50 n.s.
P 2.56E-08 3.44E-08 3.11E-06 1.98E-04 1.44E-06
PHB4 FC n.s. n.s. n.s. n.s. n.s. 1.19 4.93 1.04 1.16 1.17 1.45 n.s. n.s. n.s. n.s.
P 5.25E-05 5.59E-07 3.95E-03 5.45E-03 2.81E-03 1.79E-04
AT3G49320 FC n.s. n.s. n.s. n.s. 1.10 n.s. n.s. 1.62 1.57 1.55 1.95 n.s. n.s. n.s. n.s.
P 1.21E-03 8.13E-03 8.41E-03 1.06E-03 3.49E-04
BCS1 FC 3.04 3.35 2.89 n.s. n.s. 1.96 n.s. n.s. n.s. n.s. n.s. n.s. n.s. 1.71 n.s.
P 1.80E-08 6.36E-09 6.15E-05 2.18E-06 4.83E-05
AT3G61100 FC n.s. n.s. n.s. 1.04 1.31 n.s. n.s. n.s. 1.95 2.13 2.41 n.s. n.s. n.s. n.s.
P 7.94E-03 2.84E-03 7.22E-03 1.22E-03 1.79E-04
CRF6 FC 2.81 3.50 3.16 n.s. n.s. 2.45 1.28 1.63 1.57 1.02 n.s. n.s. n.s. 1.14 n.s.
P 2.31E-06 1.45E-07 1.16E-05 9.15E-07 1.52E-03 6.55E-03 8.88E-03 1.57E-03 5.54E-05
Supplemental Data. De Clercq et al. Plant Cell. (2013). 10.1105/tpc.113.117168
18
CYP81D8 FC 3.99 4.44 4.16 n.s. n.s. 2.53 1.83 n.s. n.s. n.s. n.s. n.s. n.s. n.s. n.s.
P 2.80E-06 4.47E-07 9.53E-06 1.57E-06 1.61E-03
AT5G09570 FC n.s. n.s. n.s. 3.92 4.31 5.21 2.63 4.65 4.31 4.39 4.17 3.54 3.10 n.s. n.s.
P 7.33E-05 1.63E-06 1.55E-08 4.62E-05 1.82E-05 2.97E-04 5.18E-06 4.10E-05 5.37E-04 9.77E-03
AT5G14730 FC 4.75 5.68 5.19 n.s. n.s. 1.57 n.s. 1.58 n.s. n.s. n.s. n.s. n.s. n.s. n.s.
P 4.96E-09 1.64E-10 1.20E-06 3.30E-06 4.43E-03
AT5G41650 FC n.s. n.s. n.s. n.s. 1.26 1.10 n.s. n.s. 1.29 1.40 1.39 n.s. n.s. n.s. n.s.
P 2.10E-03 3.01E-04 4.09E-03 4.39E-04 5.22E-04 COR27 FC 1.11 1.37 1.55 n.s. n.s. 2.10 n.s. n.s. n.s. n.s. -2.44 5.22 n.s. n.s. 1.25
P 3.18E-05 4.73E-06 3.57E-05 5.38E-05 1.29E-03 3.42E-05 4.92E-04
AT5G43450 FC 4.11 3.55 2.46 2.06 2.36 2.36 1.95 1.75 n.s. n.s. n.s. n.s. n.s. 1.19 n.s.
P 2.85E-09 6.36E-09 9.11E-05 5.49E-03 1.59E-04 1.17E-05 7.74E-05 2.28E-03 8.86E-05
HSP23.5 FC 1.07 n.s. n.s. n.s. 2.34 3.98 3.01 n.s. 2.76 2.48 2.99 n.s. n.s. 1.34 n.s.
P 7.79E-06 1.36E-04 9.15E-07 1.36E-04 6.96E-04 2.39E-03 3.16E-05 6.27E-04
MGE1 FC n.s. n.s. n.s. n.s. 1.06 1.82 n.s. 1.83 1.02 1.09 n.s. n.s. n.s. n.s. n.s.
P 2.31E-03 1.09E-05 1.42E-03 7.02E-03 1.22E-03

Supplemental Data. De Clercq et al. Plant Cell. (2013). 10.1105/tpc.113.117168
19
Supplemental Table 3. Presence of the MDM in the MDS gene set and its conservation in orthologous genes of related dicot species
Conservation Gene Starta Endb Strandc Sequence (5'-3')d Sequence P valuef Speciesg AT1G05060 -151 -139 - aacCTTGgagatCAAGgtt CTTGNNNNNCA[AC]G <0.001*** Pt, Vv, Gm, Al -241 -229 + caaCTTGtcaagAAAGtaa -555 -543 + ggaCTTGgaagaCAAAagg UGT74E2 -186 -174 + catCTTGgtcgcCACGgaa CTTGNNNNNCA[AC]G 0.172 Al AT1G24095 -115 -103 + ggaCTTGgagctCAAGcaa NA ANAC013 -143 -131 - ttcCTTGgagaaGAAGgtt CTTGNNNNNGA[AC]G 0.359 Al AT2G03130 -170 -158 + ttgCTTGgagagCAAGttg CTTGNNNNNCA[AC]G 0.259 Al ST -202 -190 - ttaCTTGaagagCACGtag CTTGNNNNNCACG 0.009 Gm, Al -122 -110 + ttaCTTGtagaaCAACctt CTTGNNNNNCAAC 0.043* Pt, Cp AT2G04050 -413 -401 - ttaCTTGggaatCAAGttc CTTGNNNNNCA[AC]G 0.044 Al -354 -342 - ataCTTGgggacCAAGttc AT2G04070 -746 -734 - ttaCTTGggaatCAAGttc CTTGNNNNNCA[AC]G 0.038 Al -688 -676 - acaCTTGgggatCACGttc UPOX -658 -646 - ctcCTTGgagagCAAGtta CTTGNNNNNCA[AC]G 0.28 Al -968 -956 + aacCTTGatgaaGAAGgaa -569 -557 + gtgCTTGcagagAAAGata -532 -520 + gaaCTTGcagagAAAGcaa AT2G32020 -247 -235 + ttgTTTGgcaacCAAGtaa TTTGNNNNNCA[AC]G 0.452 Al AT2G41730 -127 -115 - atgCTTGtccagCAAGata CTTGNNNNNCA[AC]G <0.001*** Pt, Cp, Vv, Gm, Al, Md -92 -80 - atgTTTGgggtaCAAGaaa ABCB4 -551 -539 - tttCTTGacgaaCAAGctg CTTGNNNNNCA[AC]G 0.002** Pt, Gm, Al, Md HRE2 -154 -142 - ttgCTTGacgacCAAGttc CTTGNNNNNCA[AC]G <0.001*** Vv, Gm, Al, Md AOX1a -372 -360 + gctCTTGgcgacCACGcaa CTTGNNNNNCA[AC]G <0.001*** Pt, Vv, Al, Md -345 -333 - tttCTTGgagagCAAGatg OXI1 -167 -155 - tgcCTTGccgggGAAGatt CTTGNNNNNGA[AC]G 0.031 Cp, Al -280 -268 - agcCTTGtttaaAAAGtgt CTTGNNNNNAA[AC]G nd PHB4 -724 -712 - taaCTTGgaaacCAAGtaa CTTGNNNNNCAAG 0.035* Pt, Vv -356 -344 - cttCTTAgagagCAAGatg BCS1 -806 -794 - atcCTTGaacaaCACCctt CTTGNNNNNCA[AC]C 0.246 Md CRF6 -574 -562 + ttgCTTGgagacCAAGcta CTTGNNNNNCA[AC]G <0.001*** Pt, Cp, Al, Md -818 -806 - ttgCTTGgagacCAAGtct CYP81D8 -205 -193 + tttCTTGaggaaCAAGact CTTGNNNNNCA[AC]G nd AT5G09570 -222 -210 - cccCTTGcccgtCACGttt CTTGNNNNNCACG 0.011 Al, Md -238 -226 + gggTTTGgagcgCAAGaaa AT5G14730 -729 -717 - attCTTGattgaCAAGttg CTTGNNNNNCA[AC]G nd -180 -168 - ttaCTTGtgcagCAAGagg AT5G43450 -306 -294 + ttcCTTGcacaaCACAaca CTTGNNNNNCA[AC]A nd -155 -143 + ttcCTTGcacaaCACAaca HSP23.5 -189 -177 + ttaCTTGgagacCACGcag CTTGNNNNNCA[AC]G <0.001*** Pt, Cp, Vv, Gm, Al MGE1 -128 -116 - gttCTTGgggagGAAGcaa
a, b Upstream nucleotide position relative to the translational start codon of the respective gene. c Forward strand (+), reverse strand (-). d MDM sequence including 3-bp surrounding sequence. Capital letters represent the MDM consensus (CTTGNNNNNCA[AC]G) and nucleotides underlined differ from the consensus. e For each Arabidopsis gene containing the MDM consensus sequence (CTTGNNNNNCA[AC]G), indicated in bold, the conservation data for this sequence are displayed. If the consensus is not significantly conserved but a (mismatch) variant of the consensus (not in bold) is conserved, conservation data of the latter are displayed. f Sequences were defined as conserved if present in orthologs of at least two other species (not including Arabidopsis lyrata (Al)) with conservation P value less than 0.05, and are indicated with asterisk (* P<0.05, ** P<0.01, *** P<0.001). nd, not detected. g Species containing the motif in orthologues genes. Al, Arabidopsis lyrata; Cp: Carica papaya; Pt, Populus trichocarpa; Md, Malus domestica; Gm, Glycine max; Vv, Vitis vinifera.

Supplemental Data. De Clercq et al. Plant Cell. (2013). 10.1105/tpc.113.117168
20
Supplemental Table 4. Functional annotations of the MDS genes Gene ID Other
name Descriptiona
AT1G05060 AT1G05680 UGT74E2 Uridine diphosphate glycosyltransferase 74E2 | Encodes a UDP-glucosyltransferase, UGT74E2,
that acts on IBA (indole-3-butyric acid) and affects auxin homeostasis. The transcript and protein levels of this enzyme are strongly induced by H2O2 and may allow integration of ROS (reactive oxygen species) and auxin signaling. This enzyme can also transfer glycosyl groups to several compounds related to the explosive TNT when this synthetic compound is taken up from the environment.
AT1G24095 Putative thiol-disulfide oxidoreductase DCC AT1G32870 ANAC013 AT2G03130 Ribosomal protein L12/ATP-dependent Clp protease adaptor protein ClpS family protein AT2G03760 ST Sulfotransferase 12 | Encodes a brassinosteroid sulfotransferase. In vitro experiements show that
this enzyme has a preference for 24-epibrassinosteroids, particularly 24-epicathasterone, but does not act on castasterone and brassinolide. It is differentially expressed during development, being more abundant in young seedlings and actively growing cell cultures. Expression is induced in response to salicylic acid and methyl jasmonate and bacterial pathogens.
AT2G04050 MATE efflux family protein AT2G04070 MATE efflux family protein AT2G21640 UPOX Encodes a protein of unknown function that is a marker for oxidative stress response. AT2G32020 Acyl-CoA N-acyltransferases (NAT) superfamily protein AT2G41730 AT2G47000 ABCB4 ATP binding cassette subfamily B4 | Multidrug resistance P-glycoprotein (MDR/PGP) subfamily
of ABC transporters. Functions in the basipetal redirection of auxin from the root tip. Exhibits apolar plasma membrane localization in the root cap and polar localization in tissues above.
AT2G47520 HRE2 Integrase-type DNA-binding superfamily protein | encodes a member of the ERF (ethylene response factor) subfamily B-2 of ERF/AP2 transcription factor family. The protein contains one AP2 domain. There are 5 members in this subfamily including RAP2.2 AND RAP2.12.
AT3G22370 AOX1a Alternative oxidase 1A | Encodes AOX1a, an isoform of alternative oxidase that is expressed in rosettes, flowers, and root. The alternative oxidase of plant mitochondria transfers electrons from the ubiquinone pool to oxygen without energy conservations. It is regulated through transcriptional control and by pyruvate. Plays a role in shoot acclimation to low temperature. Also is capable of ameliorating reactive oxygen species production when the cytochrome pathway is inhibited. AOX1a also functions as a marker for mitochondrial retrograde response.
AT3G25250 OXI1 AGC (cAMP-dependent, cGMP-dependent and protein kinase C) kinase family protein | Arabidopsis protein kinase
AT3G27280 PHB4 Part of protein complexes that are necessary for proficient mitochondrial function or biogenesis, thereby supporting cell division and differentiation in apical tissues
AT3G50930 BCS1 Cytochrome BC1 synthesis AT3G61630 CRF6 Cytokinin response factor 6 | CRF6 encodes one of the six cytokinin response factors. CRF5
belongs to the AP2/ERF superfamily of the transcriptional factors. CRF proteins rapidly relocalize to the nucleus in response to cytokinin. Analysis of loos-of-function mutants revealed that the CRFs function redundantly to regulate the development of embryos, cotyledons and leaves.
AT4G37370 CYP81D8 Cytochrome P450, family 81, subfamily D, polypeptide 8 | member of CYP81D AT5G09570 Cox19-like CHCH family protein AT5G14730 AT5G43450 2-Oxoglutarate (2OG) and Fe(II)-dependent oxygenase superfamily protein | encodes a protein
whose sequence is similar to ACC oxidase AT5G51440 HSP23.5 HSP20-like chaperones superfamily protein AT5G55200 MGE1 Co-chaperone GrpE family protein
aGene functional annotations were obtained from TAIR10.
Supplemental Data. De Clercq et al. Plant Cell. (2013). 10.1105/tpc.113.117168
21
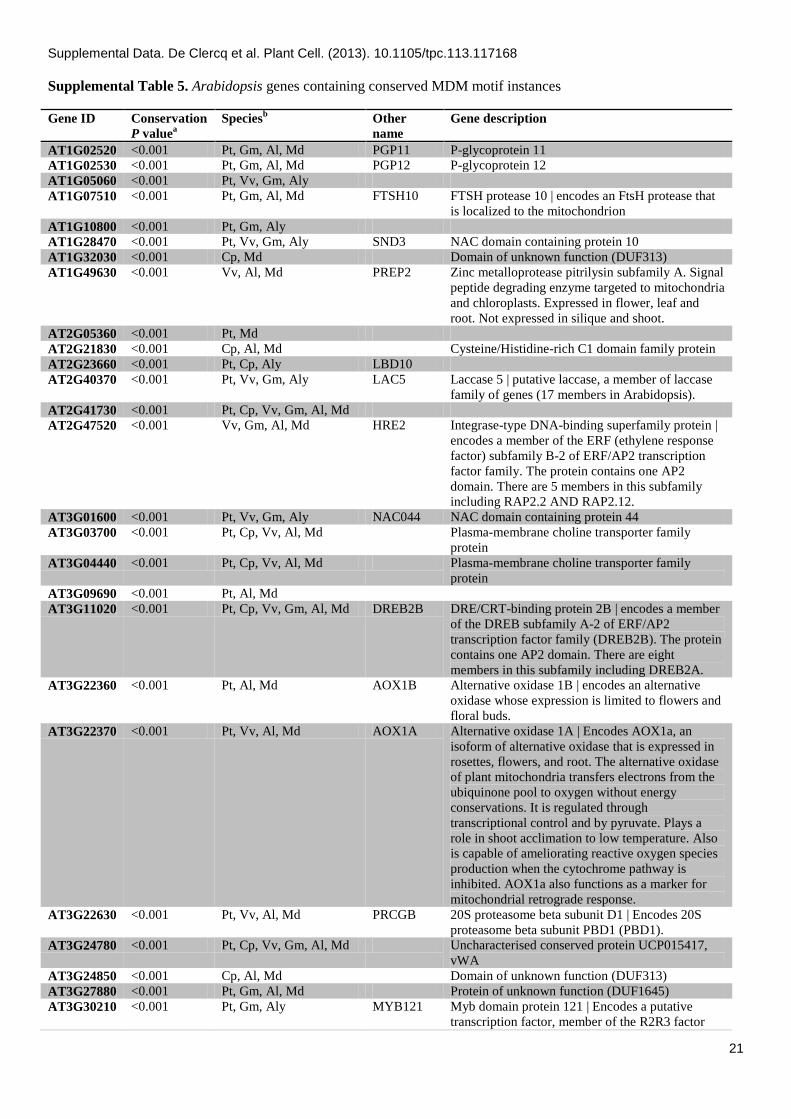
Supplemental Table 5. Arabidopsis genes containing conserved MDM motif instances
Gene ID Conservation
P valuea Speciesb Other
name Gene description
AT1G02520 <0.001 Pt, Gm, Al, Md PGP11 P-glycoprotein 11 AT1G02530 <0.001 Pt, Gm, Al, Md PGP12 P-glycoprotein 12 AT1G05060 <0.001 Pt, Vv, Gm, Aly AT1G07510 <0.001 Pt, Gm, Al, Md FTSH10 FTSH protease 10 | encodes an FtsH protease that
is localized to the mitochondrion AT1G10800 <0.001 Pt, Gm, Aly AT1G28470 <0.001 Pt, Vv, Gm, Aly SND3 NAC domain containing protein 10 AT1G32030 <0.001 Cp, Md Domain of unknown function (DUF313) AT1G49630 <0.001 Vv, Al, Md PREP2 Zinc metalloprotease pitrilysin subfamily A. Signal
peptide degrading enzyme targeted to mitochondria and chloroplasts. Expressed in flower, leaf and root. Not expressed in silique and shoot.
AT2G05360 <0.001 Pt, Md AT2G21830 <0.001 Cp, Al, Md Cysteine/Histidine-rich C1 domain family protein AT2G23660 <0.001 Pt, Cp, Aly LBD10 AT2G40370 <0.001 Pt, Vv, Gm, Aly LAC5 Laccase 5 | putative laccase, a member of laccase
family of genes (17 members in Arabidopsis). AT2G41730 <0.001 Pt, Cp, Vv, Gm, Al, Md AT2G47520 <0.001 Vv, Gm, Al, Md HRE2 Integrase-type DNA-binding superfamily protein |
encodes a member of the ERF (ethylene response factor) subfamily B-2 of ERF/AP2 transcription factor family. The protein contains one AP2 domain. There are 5 members in this subfamily including RAP2.2 AND RAP2.12.
AT3G01600 <0.001 Pt, Vv, Gm, Aly NAC044 NAC domain containing protein 44 AT3G03700 <0.001 Pt, Cp, Vv, Al, Md Plasma-membrane choline transporter family
protein AT3G04440 <0.001 Pt, Cp, Vv, Al, Md Plasma-membrane choline transporter family
protein AT3G09690 <0.001 Pt, Al, Md AT3G11020 <0.001 Pt, Cp, Vv, Gm, Al, Md DREB2B DRE/CRT-binding protein 2B | encodes a member
of the DREB subfamily A-2 of ERF/AP2 transcription factor family (DREB2B). The protein contains one AP2 domain. There are eight members in this subfamily including DREB2A.
AT3G22360 <0.001 Pt, Al, Md AOX1B Alternative oxidase 1B | encodes an alternative oxidase whose expression is limited to flowers and floral buds.
AT3G22370 <0.001 Pt, Vv, Al, Md AOX1A Alternative oxidase 1A | Encodes AOX1a, an isoform of alternative oxidase that is expressed in rosettes, flowers, and root. The alternative oxidase of plant mitochondria transfers electrons from the ubiquinone pool to oxygen without energy conservations. It is regulated through transcriptional control and by pyruvate. Plays a role in shoot acclimation to low temperature. Also is capable of ameliorating reactive oxygen species production when the cytochrome pathway is inhibited. AOX1a also functions as a marker for mitochondrial retrograde response.
AT3G22630 <0.001 Pt, Vv, Al, Md PRCGB 20S proteasome beta subunit D1 | Encodes 20S proteasome beta subunit PBD1 (PBD1).
AT3G24780 <0.001 Pt, Cp, Vv, Gm, Al, Md Uncharacterised conserved protein UCP015417, vWA
AT3G24850 <0.001 Cp, Al, Md Domain of unknown function (DUF313) AT3G27880 <0.001 Pt, Gm, Al, Md Protein of unknown function (DUF1645) AT3G30210 <0.001 Pt, Gm, Aly MYB121 Myb domain protein 121 | Encodes a putative
transcription factor, member of the R2R3 factor

Supplemental Data. De Clercq et al. Plant Cell. (2013). 10.1105/tpc.113.117168
22
gene family (MYB121). AT3G59820 <0.001 Pt, Al, Md AT3G61630 <0.001 Pt, Cp, Al, Md CRF6 Cytokinin response factor 6 | CRF6 encodes one of
the six cytokinin response factors. CRF5 belongs to the AP2/ERF superfamily of the transcriptional factors. CRF proteins rapidly relocalize to the nucleus in response to cytokinin. Analysis of loos-of-function mutants revealed that the CRFs function redundantly to regulate the development of embryos, cotyledons and leaves.
AT3G62260 <0.001 Vv, Gm, Md AT4G05020 <0.001 Pt, Gm, Al, Md NDB2 NAD(P)H dehydrogenase B2 (NDB2) AT4G14800 <0.001 Pt, Vv, Al, Md PBD2 Encodes 20S proteasome beta subunit PBD2
(PBD2). AT4G18990 <0.001 Pt, Vv, Aly XTH29 Xyloglucan endotransglucosylase/hydrolase 29 AT4G21490 <0.001 Pt, Gm, Al, Md NDB3 NAD(P)H dehydrogenase B3 AT4G25200 <0.001 Pt, Cp, Vv, Gm, Aly HSP23.6-
M Mitochondrion-localized small heat shock protein 23.6 | AtHSP23.6-mito mRNA, nuclear gene encoding mitochondrial
AT4G27110 <0.001 Pt, Cp, Vv, Al, Md COBL11 COBRA-like protein 11 precursor AT4G35460 <0.001 Vv, Al, Md NTRB NADPH-dependent thioredoxin reductase B |
NADPH-dependent thioredoxin reductase 1 (NTR1. Similar to E.coli NTR and has conserved NADPH binding domains.
AT4G37030 <0.001 Cp, Vv, Gm, Md AT4G39740 <0.001 Vv, Gm, Al, Md HCC2 Thioredoxin superfamily protein AT5G02970 <0.001 Pt, Al, Md α/β-Hydrolases superfamily protein AT5G05390 <0.001 Pt, Vv, Gm, Aly LAC12 Laccase 12 | putative laccase, a member of laccase
family of genes (17 members in Arabidopsis). AT5G13210 <0.001 Pt, Cp, Vv, Gm, Al, Md Uncharacterised conserved protein UCP015417,
vWA AT5G17300 <0.001 Pt, Vv, Gm, Aly RVE1 Homeodomain-like superfamily protein | Myb-like
transcription factor that regulates hypocotyl growth by regulating free auxin levels in a time-of-day specific manner.
AT5G24050 <0.001 Cp, Al, Md Domain of unknown function (DUF313) AT5G24640 <0.001 Pt, Cp, Vv, Gm, Al, Md AT5G37140 <0.001 Vv, Gm, Al, Md P-loop containing nucleoside triphosphate
hydrolases superfamily protein AT5G40690 <0.001 Pt, Cp, Vv, Gm, Al, Md AT5G43390 <0.001 Pt, Cp, Vv, Gm, Al, Md Uncharacterized conserved protein UCP015417,
vWA AT5G51430 <0.001 Cp, Al, Md EYE Conserved oligomeric Golgi complex component-
related / COG complex component-related | Encodes a protein that is homologous to Cog7, a subunit of the conserved oligomeric Golgi (COG) complex, which is required for the normal morphology and function of the Golgi apparatus. It is likely to be involved in transport or retention of Golgi-localized proteins and in maintenance of Golgi morphology.
AT5G51440 <0.001 Pt, Cp, Vv, Gm, Aly HSP23.5-M
HSP20-like chaperones superfamily protein
AT5G52090 <0.001 Vv, Gm, Al, Md P-loop containing nucleoside triphosphate hydrolases superfamily protein
AT5G53290 <0.001 Pt, Al, Md CRF3 Cytokinin response factor 3 | encodes a member of the ERF (ethylene response factor) subfamily B-5 of ERF/AP2 transcription factor family. The protein contains one AP2 domain. There are 7 members in this subfamily.
AT5G55490 <0.001 Pt, Cp, Vv, Gm, Al, Md GEX1 Gamete expressed protein 1 | Encodes a transmembrane domain containing protein that is expressed in pollen germ cells.

Supplemental Data. De Clercq et al. Plant Cell. (2013). 10.1105/tpc.113.117168
23
AT1G05370 0.002 Cp, Al, Md Sec14p-like phosphatidylinositol transfer family protein
AT1G49900 0.002 Pt, Gm, Md C2H2 type zinc finger transcription factor family AT2G47000 0.002 Pt, Gm, Al, Md PGP4 ATP binding cassette subfamily B4 | Multidrug
resistance P-glycoprotein (MDR/PGP) subfamily of ABC transporters. Functions in the basipetal redirection of auxin from the root tip. Exhibits apolar plasma membrane localization in the root cap and polar localization in tissues above.
AT5G16930 0.002 Pt, Al, Md AAA-type ATPase family protein AT5G37160 0.002 Vv, Gm, Al, Md P-loop containing nucleoside triphosphate
hydrolases superfamily protein AT3G13080 0.003 Pt, Vv, Gm, Al, Md MRP3 Encodes an ATP-dependent MRP-like ABC
transporter able to transport glutathione-conjugates as well as chlorophyll catabolites. The expression of this gene is upregulated by herbicide safeners such as benoxacor and fenclorim.
AT5G24920 0.003 Pt, Md GDU5 Glutamine dumper 5 | Encodes a member of the GDU (glutamine dumper) family proteins involved in amino acid export: At4g31730 (GDU1), At4g25760 (GDU2), At5g57685 (GDU3), At2g24762 (GDU4), At5g24920 (GDU5), At3g30725 (GDU6) and At5g38770 (GDU7).
AT1G06330 0.004 Pt, Vv, Aly Heavy metal transport/detoxification superfamily protein
AT5G09590 0.004 Cp, Gm, Aly MTHSC70-2
Mitochondrial HSO70 2 | heat shock protein 70 (Hsc70-5); nuclear
AT2G16060 0.005 Vv, Gm, Aly NSHB1 Hemoglobin 1 | Encodes a class 1 nonsymbiotic hemoglobin induced by low oxygen levels with very high oxygen affinity. It is not likely to be a hemoglobin transporter because of its extremely high affinity for oxygen.
AT3G18610 0.005 Pt, Al, Md PARLL1 Nucleolin like 2 | Encodes ATNUC-L2 (NUCLEOLIN LIKE 2).
AT4G37910 0.005 Cp, Gm, Aly MTHSC70-1
Mitochondrial heat shock protein 70-1
AT1G74870 0.006 Pt, Al, Md RING/U-box superfamily protein AT5G38800 0.006 Pt, Al, Md BZIP43 Basic leucine-zipper 43 AT3G28580 0.007 Pt, Vv, Md P-loop containing nucleoside triphosphate
hydrolases superfamily protein AT5G25840 0.007 Cp, Al, Md Protein of unknown function (DUF1677) AT1G64930 0.009 Gm, Al, Md CYP89A7 Cytochrome P450, family 87, subfamily A,
polypeptide 7 | member of CYP89A AT5G14980 0.009 Pt, Vvi α/β-Hydrolases superfamily protein AT1G64900 0.01 Gm, Al, Md CYP89A2 Cytochrome P450, family 89, subfamily A,
polypeptide 2 | Encodes cytochrome P450 (CYP89A2).
AT3G23570 0.013 Gm, Al, Md α/β-Hydrolases superfamily protein AT2G37280 0.014 Pt, Cp, Vv, Gm, Md PDR5 Pleiotropic drug resistance 5 AT2G29930 0.017 Gm, Al, Md AT2G31460 0.018 Cp, Md Domain of unknown function (DUF313) AT1G09400 0.019 Gm, Al, Md FMN-linked oxidoreductases superfamily protein AT1G48400 0.019 Cp, Al, Md F-box/RNI-like/FBD-like domains-containing
protein AT4G27740 0.021 Cp, Vvi Yippee family putative zinc-binding protein AT2G07714 0.023 Vv, Al, Md Transcription factor-related AT3G21180 0.044 Pt, Cp, Gm, Md ATACA9 Autoinhibited Ca(2+)-ATPase 9 | one of the type
IIB calcium pump isoforms. encodes an autoinhibited Ca(2+)-ATPase that contains an N-terminal calmodulin binding autoinhibitory domain.

Supplemental Data. De Clercq et al. Plant Cell. (2013). 10.1105/tpc.113.117168
24
aEvolutionary conservation of the MDM consensus (CTTGNNNNNCA[AC]G) was examined in six related dicot species. The MDM consensus was defined as conserved if present in orthologs of at least two other species (not including Arabidopsis lyrata (Aly)) with conservation P value less than 0.05. bSpecies containing the MDM consensus in orthologues genes. Al, Arabidopsis lyrata; Cp, Carica papaya; Pt, Populus trichocarpa; Md, Malus domestica; Gm, Glycine max; Vv, Vitis vinifera.
Supplemental Data. De Clercq et al. Plant Cell. (2013). 10.1105/tpc.113.117168
25
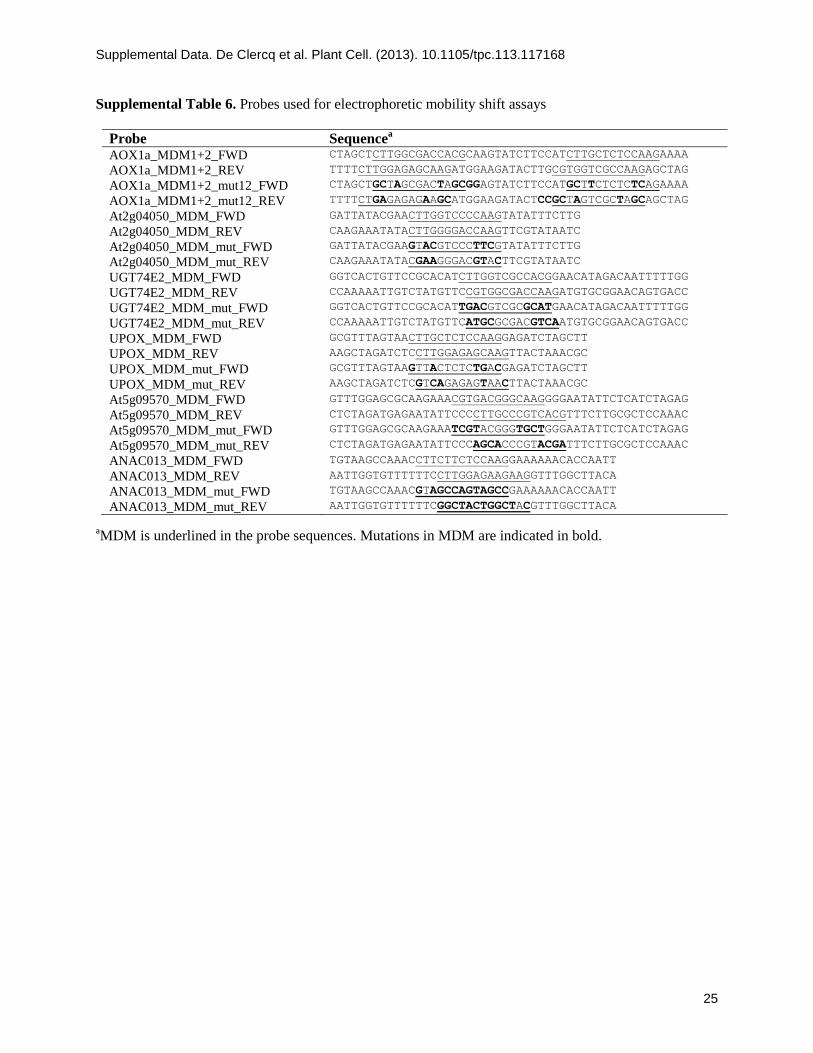
Supplemental Table 6. Probes used for electrophoretic mobility shift assays
Probe Sequencea AOX1a_MDM1+2_FWD CTAGCTCTTGGCGACCACGCAAGTATCTTCCATCTTGCTCTCCAAGAAAA AOX1a_MDM1+2_REV TTTTCTTGGAGAGCAAGATGGAAGATACTTGCGTGGTCGCCAAGAGCTAG
AOX1a_MDM1+2_mut12_FWD CTAGCTGCTAGCGACTAGCGGAGTATCTTCCATGCTTCTCTCTCAGAAAA AOX1a_MDM1+2_mut12_REV TTTTCTGAGAGAGAAGCATGGAAGATACTCCGCTAGTCGCTAGCAGCTAG At2g04050_MDM_FWD GATTATACGAACTTGGTCCCCAAGTATATTTCTTG
At2g04050_MDM_REV CAAGAAATATACTTGGGGACCAAGTTCGTATAATC
At2g04050_MDM_mut_FWD GATTATACGAAGTACGTCCCTTCGTATATTTCTTG At2g04050_MDM_mut_REV CAAGAAATATACGAAGGGACGTACTTCGTATAATC UGT74E2_MDM_FWD GGTCACTGTTCCGCACATCTTGGTCGCCACGGAACATAGACAATTTTTGG
UGT74E2_MDM_REV CCAAAAATTGTCTATGTTCCGTGGCGACCAAGATGTGCGGAACAGTGACC
UGT74E2_MDM_mut_FWD GGTCACTGTTCCGCACATTGACGTCGCGCATGAACATAGACAATTTTTGG UGT74E2_MDM_mut_REV CCAAAAATTGTCTATGTTCATGCGCGACGTCAATGTGCGGAACAGTGACC UPOX_MDM_FWD GCGTTTAGTAACTTGCTCTCCAAGGAGATCTAGCTT
UPOX_MDM_REV AAGCTAGATCTCCTTGGAGAGCAAGTTACTAAACGC
UPOX_MDM_mut_FWD GCGTTTAGTAAGTTACTCTCTGACGAGATCTAGCTT UPOX_MDM_mut_REV AAGCTAGATCTCGTCAGAGAGTAACTTACTAAACGC At5g09570_MDM_FWD GTTTGGAGCGCAAGAAACGTGACGGGCAAGGGGAATATTCTCATCTAGAG
At5g09570_MDM_REV CTCTAGATGAGAATATTCCCCTTGCCCGTCACGTTTCTTGCGCTCCAAAC At5g09570_MDM_mut_FWD GTTTGGAGCGCAAGAAATCGTACGGGTGCTGGGAATATTCTCATCTAGAG At5g09570_MDM_mut_REV CTCTAGATGAGAATATTCCCAGCACCCGTACGATTTCTTGCGCTCCAAAC ANAC013_MDM_FWD TGTAAGCCAAACCTTCTTCTCCAAGGAAAAAACACCAATT
ANAC013_MDM_REV AATTGGTGTTTTTTCCTTGGAGAAGAAGGTTTGGCTTACA
ANAC013_MDM_mut_FWD TGTAAGCCAAACGTAGCCAGTAGCCGAAAAAACACCAATT ANAC013_MDM_mut_REV AATTGGTGTTTTTTCGGCTACTGGCTACGTTTGGCTTACA
aMDM is underlined in the probe sequences. Mutations in MDM are indicated in bold.
Supplemental Data. De Clercq et al. Plant Cell. (2013). 10.1105/tpc.113.117168
26
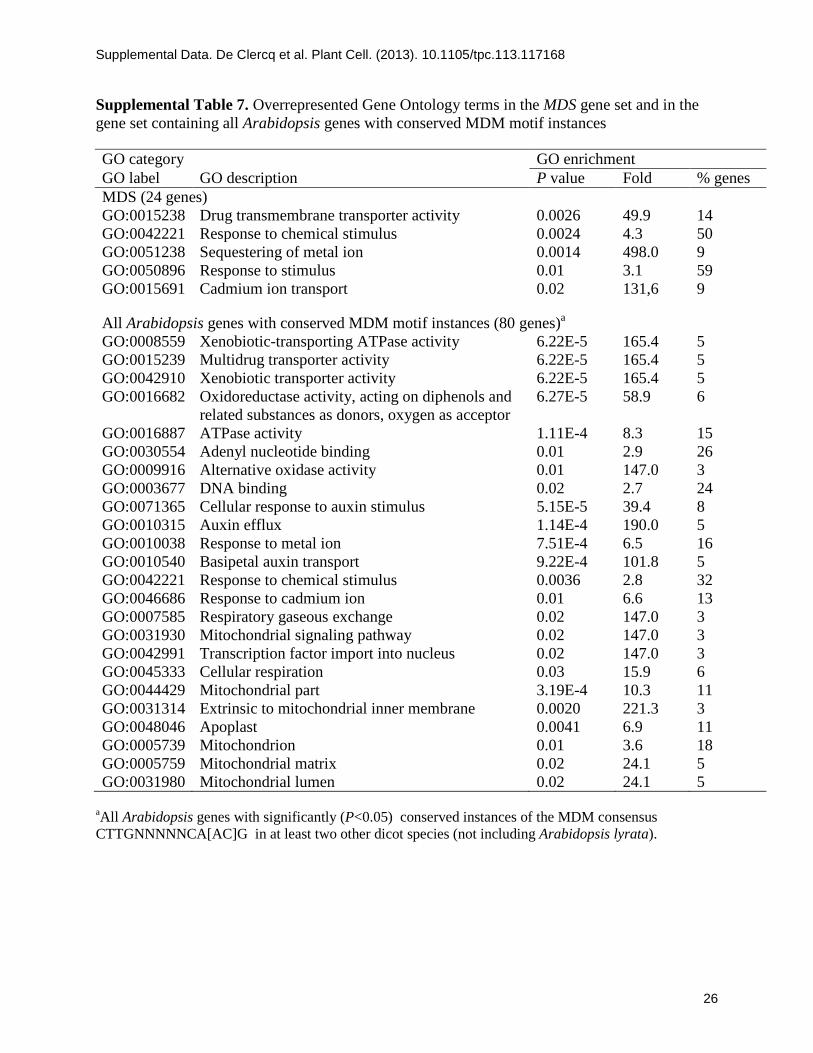
Supplemental Table 7. Overrepresented Gene Ontology terms in the MDS gene set and in the gene set containing all Arabidopsis genes with conserved MDM motif instances GO category GO enrichment GO label GO description P value Fold % genes MDS (24 genes) GO:0015238 Drug transmembrane transporter activity 0.0026 49.9 14 GO:0042221 Response to chemical stimulus 0.0024 4.3 50 GO:0051238 Sequestering of metal ion 0.0014 498.0 9 GO:0050896 Response to stimulus 0.01 3.1 59 GO:0015691 Cadmium ion transport 0.02 131,6 9 All Arabidopsis genes with conserved MDM motif instances (80 genes)a GO:0008559 Xenobiotic-transporting ATPase activity 6.22E-5 165.4 5 GO:0015239 Multidrug transporter activity 6.22E-5 165.4 5 GO:0042910 Xenobiotic transporter activity 6.22E-5 165.4 5 GO:0016682 Oxidoreductase activity, acting on diphenols and
related substances as donors, oxygen as acceptor 6.27E-5 58.9 6
GO:0016887 ATPase activity 1.11E-4 8.3 15 GO:0030554 Adenyl nucleotide binding 0.01 2.9 26 GO:0009916 Alternative oxidase activity 0.01 147.0 3 GO:0003677 DNA binding 0.02 2.7 24 GO:0071365 Cellular response to auxin stimulus 5.15E-5 39.4 8 GO:0010315 Auxin efflux 1.14E-4 190.0 5 GO:0010038 Response to metal ion 7.51E-4 6.5 16 GO:0010540 Basipetal auxin transport 9.22E-4 101.8 5 GO:0042221 Response to chemical stimulus 0.0036 2.8 32 GO:0046686 Response to cadmium ion 0.01 6.6 13 GO:0007585 Respiratory gaseous exchange 0.02 147.0 3 GO:0031930 Mitochondrial signaling pathway 0.02 147.0 3 GO:0042991 Transcription factor import into nucleus 0.02 147.0 3 GO:0045333 Cellular respiration 0.03 15.9 6 GO:0044429 Mitochondrial part 3.19E-4 10.3 11 GO:0031314 Extrinsic to mitochondrial inner membrane 0.0020 221.3 3 GO:0048046 Apoplast 0.0041 6.9 11 GO:0005739 Mitochondrion 0.01 3.6 18 GO:0005759 Mitochondrial matrix 0.02 24.1 5 GO:0031980 Mitochondrial lumen 0.02 24.1 5
aAll Arabidopsis genes with significantly (P<0.05) conserved instances of the MDM consensus CTTGNNNNNCA[AC]G in at least two other dicot species (not including Arabidopsis lyrata).

Supplemental Data. De Clercq et al. Plant Cell. (2013). 10.1105/tpc.113.117168
27
Supplemental Table 8. PCR primers used Primer Sequence Cloning Promoters attB4_ProUGT74E2_FWD GGGGACAACTTTGTATAGAAAAGTTGATTTCACCCATGATATACTGTC attB1r_ProUGT74E2_REV GGGGACTGCTTTTTTGTACAAACTTGTTTCTCCTTCTTTTTAATCTTGTG ProUGT74E2_ΔMDM_FWD CGGTCACTGTTCCGCACATGAACATAGACAATTTTTGG ProUGT74E2_ΔMDM_REV CCAAAAATTGTCTATGTTCATGTGCGGAACAGTGACCG attB4_ProAOX1a_FWD ATAGAAAAGTTGATCTGAAGAGCTTCTAGC attB1r_ProAOX1a_REV TGTACAAACTTGTGTTTCAAATCGGAAAAAGTG ProAOX1a_ΔMDM1_FWD GCGACCACGCAAGTATCTTCCATAAAAATCTACACCGGCTTTAAATTTAC ProAOX1a_ΔMDM1_REV GTAAATTTAAAGCCGGTGTAGATTTTTATGGAAGATACTTGCGTGGTCGC ProAOX1a_ΔMDM2_FWD GACCAATAAGAATCTAGCTCAAGTATCTTCCATCTTGC ProAOX1a_ΔMDM2_REV GCAAGATGGAAGATACTTGAGCTAGATTCTTATTGGTC attB1_ProANAC013_FWD AAAAAGCAGGCTGTAAATTTTTCAGATGAAAGTATT attB2_ProANAC013_REV AGAAAGCTGGGTCACTTTTTTCTCTCTCGTTATC Electrophoretic mobility shift assays, biolistic transformations and Y1H ANAC013_FWD GGGGACAAGTTTGTACAAAAAAGCAGGCTTCGAAGGAGATAGAACCATGGACTTGTCGGTTGAGAACGG ANAC013_NOSTOP_REV GGGGACCACTTTGTACAAGAAAGCTGGGTCTCCACCTCCGGATCCCCATAACAAAGGCCTCCCTGAAC ANAC013_ΔTM_NOSTOP_REV GGGGACCACTTTGTACAAGAAAGCTGGGTCTCCACCTCCGGATCCTTTGTTCTTCTTCTTCTTCTTATC ANAC013_TM_FWD GGGGACAAGTTTGTACAAAAAAGCAGGCTTCGAAGGAGATAGAACCATGCTGGAATCCATTCCTGCAAAGCC ANAC013_ΔTM_REV GGGGACCACTTTGTACAAGAAAGCTGGGTCTCCACCTCCGGATCCTCATTTGTTCTTCTTCTTCTTCTTATC ANAC017_FWD GGGGACAAGTTTGTACAAAAAAGCAGGCTTCGAAGGAGATAGAACCATGGCGGATTCTTCACCCGA ANAC017_short_REV GGGGACCACTTTGTACAAGAAAGCTGGGTCTCCACCTCCGGATCMTCTGTTTCTAATACCCTTCTTTGC ANAC053_FWD GGGGACAAGTTTGTACAAAAAAGCAGGCTTCGAAGGAGATAGAACCATGGGTCGTGGCTCAGTAACATC ANAC053_ΔTM_REV GGGGACCACTTTGTACAAGAAAGCTGGGTCTCCACCTCCGGATCCTCATGCTGAACTATTCCCTGATTTT ANAC078_FWD GGGGACAAGTTTGTACAAAAAAGCAGGCTTCGAAGGAGATAGAACCATGGGTCGTGGCTCAGTGACGTC ANAC078_ΔTM_REV GGGGACCACTTTGTACAAGAAAGCTGGGTCTCCACCTCCGGATCCTCATCTTGTCGCCGTAATTCCTGTCT ANAC082_FWD GGGGACAAGTTTGTACAAAAAAGCAGGCTTCACCATGGGGAAAACTCAACTCGCTC ANAC082_REV GGGGACCACTTTGTACAAGAAAGCTGGGTCTTACATTTTTGGTCTATGTCTC NAC-overexpressing and -miR lines ANAC013_35S_FWD AAAAAGCAGGCTCCACCATGGACTTGTCGGTTGAGAA ANAC013_35S_REV AGAAAGCTGGGTCTCACCATAACAAAGGCCTCC ANAC053_35S_FWD AAAAAGCAGGCTCCACCATGGGTCGTGGCTCAGTAAC ANAC053_35S_REV AGAAAGCTGGGTCTCACCTGGAAGAGACCAAAATG ANAC078_35S_FWD AAAAAGCAGGCTCCACCATGGGTCGTGGCTCAGTG ANAC078_35S_REV AGAAAGCTGGGTCTTACCGAGCAGACACCATG ANAC013-I miR-s gaTGTAACGGTAAGTCCGTCGTTtctctcttttgtattcc ANAC013-II miR-a gaAACGACGGACTTACCGTTACAtcaaagagaatcaatga ANAC013-III miR*s gaAAAGACGGACTTAGCGTTACTtcacaggtcgtgatatg ANAC013-IV miR*a gaAGTAACGCTAAGTCCGTCTTTtctacatatatattcct
qRT-PCR ANAC013_RT_FWD ACCAGACAGATAAACAATGGATCA ANAC013_RT_REV CAGAAGGAACAGGGTTTAGGAA ANAC016_RT_L ATTCACTTCACAGTCAACAGGTG ANAC016_RT_R GCTGATGAGAACTGGCTCCT ANAC017_RT_L CATTTGCTTCACCCTCATCA ANAC017_RT_R CCTTGGGCATTCACACTCAT ANAC053_RT_155_L GCAACAGAGTTTGAGCCAGA ANAC053_RT_155_R GCAGGAATAGCACCCAACAT ANAC078_RT_L CGATATTGATGACATTGACGAGA ANAC078_RT_R CTTGATTCCCCATGACAATAGTT ABCB4_RT_FWD CAAAGTCTCCAAAGTTGCTCTG ABCB4_RT_REV CTCGCTGCTTGTCTCTCTCC AOX1a_RT_FWD TGGTTGTTCGTGCTGACG AOX1a_RT_REV CACGACCTTGGTAGTGAATATCAG ARP7_RT_FWD ACTCTTCCTGATGGACAGGTG ARP7_RT_REV CTCAACGATTCCATGCTCCT at2g04050_RT_FWD CCACAATGGTGAGCTCCAG at2g04050_RT_REV CACCCGCTAACCCAAACA at2g04070_RT_FWD CTCCAGCTCTCCGGTGTC at2g04070_RT_REV GTGAACCCACTAACCCAAACA AT2G28390_FWD AACTCTATGCAGCATTTGATCCACT

Supplemental Data. De Clercq et al. Plant Cell. (2013). 10.1105/tpc.113.117168
28
AT2G28390_REV TGATTGCATATCTTTATCGCCATC at2g41730_RT_FWD GTCACCAAGGCATCGTAAGG at2g41730_RT_REV AAAGCTGGTGGTGAATCGAG at5g09570_RT_FWD GAAACCGTTGTTTCTCAGGTTC at5g09570_RT_REV CCAAAATGGTTGACGCAAT CRF6_RT_FWD TGGCTTGGGACTTTTGTCA CRF6_RT_REV GAGATGAATCGCGGCTCTA CYP81D8_RT_L CGTCTTTCTCGGAACTTTTCA CYP81D8_RT_R AACACCGTCTCCGTAGTAACG HRE2_RT_FWD GAAGCGTAAACCCGTCTCAGT HRE2_RT_REV AATCTCCGCTGCCCATTT HSP23.5_RT_FWD TCAAACCGACATGTTTCTCG HSP23.5_RT_REV AAGCTTCTCGTTGGAGTAAACG ST_RT_FWD GGTCACCAATCCACACCTTC ST_RT_REV CGAAATCTGGGGACTCGTAG UGT74E2_RT_FWD TAACTTCTTCCACACTTCTCATAATCT UGT74E2_RT_REV ACAACAAAAACTAGAGTCAGTAACAAC UPOX_RT_FWD TTCAAAAACACCATGGACAAGA UPOX_RT_REV GCCTCAATTTGCTTCTCTGC
ChIP-qPCR ABCB4_ChIP_FWD ACGCCAATTGTGCTATGGTTACA ABCB4_ChIP_REV TCTTGACGAACAAGCTGTGACTTG ANAC013_ChIP_FWD CGTGTCGTCTCTGTAAGCCAAACCT ANAC013_ChIP_REV TCCGTTCTCAACCGACAAGTCCATC AOX1a_ChIP_FWD AGCTCTTGGCGACCACGCAA AOX1a_ChIP_REV CCCTTGTGGTCATGAGAGAGACT AT2g04050_ChIP_FWD GTGAGTCACGTGTTTGCACTGTGT AT2g04050_ChIP_REV GTGGACGTTGTGGTCAACAGTCAT AT2G04070_ChIP_FWD CAGCCTCAGCTGCACGTTTGA AT2G04070_ChIP_REV ACGTCGTCGTCAACACTCAACA AT2G41730_ChIP_FWD TGCCGACAAAAACAAAAGGTAGACA AT2G41730_ChIP_REV TGGGGCTTACTAAATATGTTTGGGG AT5G09570_ChIP_FWD AGCGCAAGAAACGTGACGGG AT5G09570_ChIP_REV GCGGTGAAGACCACGGGAAGA CRF6_ChIP_FWD TAGCCGGCGCGTGTAGCAAA CRF6_ChIP_REV GTTACCGTACCGAAAGTAGAGCCAA CYP81D8_ChIP_FWD TGTTGAACACGTGGAGGGCATT CYP81D8_ChIP_REV GCAGTTTTGGAAACTTTTGTGGGGT HRE2_ChIP_FWD ACTTGGTCGTCAAGCAAAAACAGC HRE2_ChIP_REV ACGCTTCCAACTCCAAACTAGAACA HSP23.5_ChIP_FWD GCCCCAAAGTGATGGGCCG HSP23.5_ChIP_FWD AGCTGCTAGAGGCTAGAGAGTCG ST_ChIP_FWD AGGTTGTTGACTTGTTGTGATGGAC ST_ChIP_REV GGTGGTGAAATGGTCAACACATCCT UGT74E2_ChIP_FWD GACCTCGGTCACTGTTCCGCA UGT74E2_ChIP_REV ACTACGGCTTTGGTGGGGGA UPOX_ChIP_FWD ACGCTGCGTTTAGTAACTTGCTC UPOX_ChIP_REV GCAAGCACAAGGACGACG ACTIN2_ChIP_FWD ACTACGAGCAGGAGATGGAAACCT ACTIN2_ChIP_REV GCAGCTTCCATTCCCACAAACGAG CDKA1_ChIP_FWD CTTACTCTCAATTAGTCAATCCCC CDKA1_ChIP_REV GATGTAGTGTCAGTGAGACTAGC UBQ10_ChIP_FWD CTATTGCTTCACCGCCTTAGC UBQ10_ChIP_REV GATCACGGTAGAGAGAATTGAGAG

Supplemental Data. De Clercq et al. Plant Cell. (2013). 10.1105/tpc.113.117168
29
Supplemental Table 9. Probes used for generation of artificial promoter constructs
Probe Sequence attB1-P35Smin-attB2_FWD
ACAAGTTTGTACAAAAAAGCAGGCTGCAAGACCCTTCCTCTATATAAGGAAGTTCATTTCATTTGGAGAGGAACCCAGCTTTCTTGTACAAAGTGGT
attB1-P35Smin-attB2_REV
ACCACTTTGTACAAGAAAGCTGGGTTCCTCTCCAAATGAAATGAACTTCCTTATATAGAGGAAGGGTCTTGCAGCCTGCTTTTTTGTACAAACTTGT
attB4-P35Smin-attB2_FWD
ACAACTTTGTATAGAAAAGTTGGCAAGACCCTTCCTCTATATAAGGAAGTTCATTTCATTTGGAGAGGAACCCAGCTTTCTTGTACAAAGTGGT
attB4-P35Smin-attB2_REV
ACCACTTTGTACAAGAAAGCTGGGTTCCTCTCCAAATGAAATGAACTTCCTTATATAGAGGAAGGGTCTTGCCAACTTTTCTATACAAAGTTGT
attB4-6xProAOX1a[-377, -328]-attB1r_FWD
ACAACTTTGTATAGAAAAGTTGTAGCTCTTGGCGACCACGCAAGTATCTTCCATCTTGCTCTCCAAGAAAAATAGCTCTTGGCGACCACGCAAGTATCTTCCATCTTGCTCTCCAAGAAAAATAGCTCTTGGCGACCACGCAAGTATCTTCCATCTTGCTCTCCAAGAAAAATAGCTCTTGGCGACCACGCAAGTATCTTCCATCTTGCTCTCCAAGAAAAATAGCTCTTGGCGACCACGCAAGTATCTTCCATCTTGCTCTCCAAGAAAAATAGCTCTTGGCGACCACGCAAGTATCTTCCATCTTGCTCTCCAAGAAAAACAAGTTTGTACAAAAAAGCAGT
attB4-6xProAOX1a[-377, -328]-attB1r_REV
ACTGCTTTTTTGTACAAACTTGTTTTTCTTGGAGAGCAAGATGGAAGATACTTGCGTGGTCGCCAAGAGCTATTTTTCTTGGAGAGCAAGATGGAAGATACTTGCGTGGTCGCCAAGAGCTATTTTTCTTGGAGAGCAAGATGGAAGATACTTGCGTGGTCGCCAAGAGCTATTTTTCTTGGAGAGCAAGATGGAAGATACTTGCGTGGTCGCCAAGAGCTATTTTTCTTGGAGAGCAAGATGGAAGATACTTGCGTGGTCGCCAAGAGCTATTTTTCTTGGAGAGCAAGATGGAAGATACTTGCGTGGTCGCCAAGAGCTACAACTTTTCTATACAAAGTTGT
attB4-6xMDM1[AOX1a]-attB1r_FWD
ACAACTTTGTATAGAAAAGTTGTCCATCTTGCTCTCCAAGAAAAATCCATCTTGCTCTCCAAGAAAAATCCATCTTGCTCTCCAAGAAAAATCCATCTTGCTCTCCAAGAAAAATCCATCTTGCTCTCCAAGAAAAATCCATCTTGCTCTCCAAGAAAAACAAGTTTGTACAAAAAAGCAGT
attB4-6xMDM1[AOX1a]-attB1r_REV
ACTGCTTTTTTGTACAAACTTGTTTTTCTTGGAGAGCAAGATGGATTTTTCTTGGAGAGCAAGATGGATTTTTCTTGGAGAGCAAGATGGATTTTTCTTGGAGAGCAAGATGGATTTTTCTTGGAGAGCAAGATGGATTTTTCTTGGAGAGCAAGATGGACAACTTTTCTATACAAAGTTGT
attB4-6xMDM1mut[AOX1a]-attB1r_FWD
ACAACTTTGTATAGAAAAGTTGTCCATAAAAAAAGGGGGGAAAAATCCATAAAAAAAGGGGGGAAAAATCCATAAAAAAAGGGGGGAAAAATCCATAAAAAAAGGGGGGAAAAATCCATAAAAAAAGGGGGGAAAAATCCATAAAAAAAGGGGGGAAAAACAAGTTTGTACAAAAAAGCAGT
attB4-6xMDM1mut[AOX1a]-attB1r_REV
ACTGCTTTTTTGTACAAACTTGTTTTTCCCCCCTTTTTTTATGGATTTTTCCCCCCTTTTTTTATGGATTTTTCCCCCCTTTTTTTATGGATTTTTCCCCCCTTTTTTTATGGATTTTTCCCCCCTTTTTTTATGGATTTTTCCCCCCTTTTTTTATGGACAACTTTTCTATACAAAGTTGT

Supplemental Data. De Clercq et al. Plant Cell. (2013). 10.1105/tpc.113.117168
30
Supplemental Methods. Nanostring nCounter assays, UPOX antibody production, protein
gel blots, determination of subcellular localization, and statistical anlayses.
Nanostring nCounter assays
The raw nCounter data were rescaled by dividing each experiment by two factors: (i) the sum of
the positive controls per experiment divided by the median of the sums of the positive controls
over all experiments to correct for technical errors and (ii) the geometric mean of at least three
stable household genes, selected by geNorm (Vandesompele et al., 2002), per experiment divided
by the total geometric mean of these four household genes over all experiments to correct for
differences in mRNA content of the samples. Transcripts differentially expressed between wild
type and 35S:ANAC013-6 were identified through the DESeq package in R (Anders and Huber,
2010), feeding the raw nCounter data and writing the above rescaling factors in the sizeFactors
slot of the package.
UPOX antibody production
For antibodies against UPOX, the full-length cDNA was cloned into pDEST15 with the Gateway
technology (Invitrogen). GST-tagged recombinant proteins were expressed in BL21 (DE3) pLys
cells. Proteins were purified with GST-Sepharose (Scientifix) and inoculated in rabbits with
Freund’s Adjuvant according to the standard protocol (Cooper and Paterson, 2008).
Protein gel blots
For the ANAC013 processing analysis, total protein extracts were prepared from 35S:GFP-
ANAC013 seedlings by grinding leaf material in extraction buffer (phosphate buffered saline, 1%
(v/v) Nonidet 40, 0.5% (w/v) deoxycholate, 0.1% (w/v) sodium dodecyl sulfate (SDS), 10% (v/v)
glycerol), and a protease inhibitor cocktail (Complete, EDTA-free; Roche). Insoluble debris was
removed by centrifugation at 20,800×g for 15 min at 4°C. Proteins (30 μg) were separated by
10% SDS-polyacrylamide gel electrophoresis (PAGE), transferred to a polyvinylidene fluoride
(PVDF) membrane (Immobilon P; Millipore), and immunodetected with anti-GFP monoclonal
Supplemental Data. De Clercq et al. Plant Cell. (2013). 10.1105/tpc.113.117168
31
antibody (Clontech Laboratories) and Western Lightning Plus enhanced chemiluminescence
(PerkinElmer).
For the analysis of AOX1a and UPOX protein levels, mitochondria were isolated as
described previously (Lister et al., 2007) from wild-type, 35S:ANAC013-6, and ANAC013-miR
seedlings that had been treated with 50 μM AA or mock-treated for 6 h. Twenty and 40 μg of
purified mitochondria were separated on a 16% SDS-PAGE gel, transferred to Hybond-C extra
nitrocellulose membranes (GE-Healthcare), and immunodetected with antibodies raised against
AOX (Elthon et al., 1989), TOM40 (Carrie et al., 2009) and UPOX with the BM
Chemiluminescence Western Blotting Kit (Roche) and visualized with the Image Quant RT ECL
Imager (GE Healthcare). The band intensity was quantitated with Quantitiy One (Bio-Rad)
imaging software with the pixel density set to 100 for the highest band detected and that of the
remaining bands relative to it. The average and standard error of band intensities were calculated
from three biological repeat experiments.
Determination of subcellular localization
The localization in tobacco (Nicotiana benthamiana) was analyzed as described (Inzé et al.,
2012). For the localization analyses in epidermal cells of onion (Allium cepa), the full-length
open reading frame (ORF), the ORF minus the TM domain, and isolated TM domain of
ANAC013 was cloned in-frame with GFP by Gateway cloning (Invitrogen) as described (Carrie et
al., 2009) (see Supplemental Table S7 online). Constructs were transiently transformed into onion
epidermal cells by biolistic transformation as described (Carrie et al., 2007). In addition to the
GFP constructs, a series of organelle markers were employed, including an ER-targeted red
fluorescent protein (RFP), a mitochondria-targeted mCherry, and a peroxisome-targeted RFP
(Nelson et al., 2007). The fluorescent proteins were visualized with an BX61 fluorescence
microscope (Olympus) with excitation wavelengths of 460/480 nm for GFP and 535/555 nm for
RFP, whereas emission wavelengths were measured at 495/540 nm for GFP and 570/625 nm for
RFP. Micrographs were captured and processed with the Cell imaging software as described
(Carrie et al., 2007).

Supplemental Data. De Clercq et al. Plant Cell. (2013). 10.1105/tpc.113.117168
32
Statistical analyses
Analysis of wild-type and MDM-deleted promoter activities
Log10-transformed luminescence values were analyzed according to the following model:
Where yijkl is the log10-transformed luminescence value of biological repeat l of independent
transgenic line k of genotype i under condition j. µ represents an overall mean, G is the main
genotype effect, C is the main condition effect, G*C is the interaction effect between genotype
and condition, L is the random effect for the independent transgenic line nested under genotype,
C*L is the random interaction term between condition and independent transgenic line, and ε is
the error term. Lk(Gi), Cj*Lk(Gi), and εijkl were all assumed to be normally distributed random
variables with zero means and variance components σ2L(G) , σ2
C*L(G), and σ2ε, respectively. These
random effects were assumed to be independent with each other. For the random effects, those
models with the lowest Akaike's Information Criterion values were chosen. Significance of the
fixed interaction term was tested with a Wald test. Residual analysis was performed to verify the
model assumptions. Post hoc comparisons were corrected for multiple testing with Bonferroni.
Within each condition, two-sided comparisons were made between the genotypes (promoter
deletion line and wild-type line). All analyses were performed with the mixed model procedure in
SAS Enterprise Guide 5.1 (SAS Institute Inc., 2012, Cary, North Carolina).
Transcript profiling of wild-type and 35S:ANAC013-6 lines under nonstressed conditions
Prior to the analysis, average expression values were taken of the three qRT-PCR technical
repeats. To the expression values that also contained values between 0 and 1, the value 1 was
added prior to transformation (Osborne, 2010). Significant differences in log2 expression values
between the 35S:ANAC013-6 and the wild type were assessed with a two-sample t test for each
gene. Equality of variance was assessed with the Folded F-statistic. In the case of equal
variances, the pooled method was used, in the case of unequal variances the Welch-
Sattherthwaite method was used. The analyses were performed with the t test procedure in SAS
Enterprise Guide 5.1 (SAS Institute Inc., 2012, Cary, North Carolina).
( ) ( ) ijklikjikjijiijkl GLCGLCGCGy εµ ++++++= **
Supplemental Data. De Clercq et al. Plant Cell. (2013). 10.1105/tpc.113.117168
33
Transcript profiling of wild-type and ANAC013-miR lines under nonstressed and AA stress
conditions
The log2-transformed average values of the three technical repeats (see above) were further
analyzed according to following general linear model for each gene separately:
ijkjijiijk CGCGy εµ ++++= *
Where yijk is the log2-transformed expression value of biological repeat k of genotype i under
condition j. µ represents an overall mean, G is the main genotype effect, C is the main condition
effect, G*C is the interaction term between genotype and condition and ε is the error term. εijk
was assumed to be a normally distributed random variable with zero mean and variance
component σ2ε. Residual analysis was performed to verify the model assumptions. For each
condition, two-sided comparisons were made between the two genotypes (wild type (Col-0) and
ANAC013-miR). The analyses were performed with the glm procedure in SAS Enterprise Guide
5.1 (SAS Institute Inc., 2012, Cary, North Carolina).
Supplemental References
Anders, S., and Huber, W. (2010). Differential expression analysis for sequence count data.
Genome Biol. 11: R106.
Carrie, C., Kühn, K., Murcha, M.W., Duncan, O., Small, I.D., O'Toole, N., and Whelan, J.
(2009). Approaches to defining dual-targeted proteins in Arabidopsis. Plant J. 57: 1128-
1139.
Carrie, C., Murcha, M.W., Millar, A.H., Smith, S.M., and Whelan, J. (2007). Nine 3-
ketoacyl-CoA thiolases (KATs) and acetoacetyl-CoA thiolases (ACATs) encoded by five
genes in Arabidopsis thaliana are targeted either to peroxisomes or cytosol but not to
mitochondria. Plant Mol. Biol. 63: 97-108.
Cooper, H.M., and Paterson, Y. (2009). Production of polyclonal antisera. Curr. Protoc.
Neurosci. 48: 5.5.1–5.5.10.
Elthon, T.E., Nickels, R.L., and McIntosh, L. (1989). Monoclonal antibodies to the alternative
oxidase of higher plant mitochondria. Plant Physiol. 89: 1311-1317.
Supplemental Data. De Clercq et al. Plant Cell. (2013). 10.1105/tpc.113.117168
34
Inzé, A., Vanderauwera, S., Hoeberichts, F.A., Vandorpe, M., Van Gaever, T., and Van
Breusegem, F. (2012). A subcellular localization compendium of hydrogen peroxide-
induced proteins. Plant Cell Environ. 35: 308-320.
Lister, R., Carrie, C., Duncan, O., Ho, L.H.M., Howell, K.A., Murcha, M.W., and Whelan,
J. (2007). Functional definition of outer membrane proteins involved in preprotein import
into mitochondria. Plant Cell 19: 3739-3759.
Nelson, B.K., Cai, X., and Nebenführ, A. (2007). A multicolored set of in vivo organelle
markers for co-localization studies in Arabidopsis and other plants. Plant J. 51:
1126-1136.
Osborne, J.W. (2010). Improving your data transformations: applying the Box-Cox
transformation. Pract. Assess. Res. Eval. 15: http://pareonline.net/pdf/v15n12.pdf.
Vandesompele, J., De Preter, K., Pattyn, F., Poppe, B., Van Roy, N., De Paepe, A., and
Speleman, F. (2002). Accurate normalization of real-time quantitative RT-PCR data by
geometric averaging of multiple internal control genes. Genome Biol. 3: research 0034.1-
0034.11. of the highest band detected