
Boter et al-YAB supplemental figures - Plant Cell · FBE2 G-box FBE1 -463 -1 Supplemental Data....
8
Supplemental Figure 1. Yeast two-hybrid assay showing FIL-JAZ3 interaction in the presence of 3-aminotriazole. (A) Yeast two-hybrid assay using JAZ fused to the GAL4 Binding Domain (BD- JAZ) and FIL/YAB fused to the GAL4 Activation Domain (AD-FIL/YAB). Yeast cells cotransformed with the indicated combinations were selected in medium lacking Leu and Trp (-2) and grown for 5 days in medium lacking Ade, His, Leu and Trp without or with 5 mM 3-aminotriazole (-4, -4AT) to select for interactions. BD represents the empty pGBKT7 vector. Numbers above the panel represent JAZs proteins, from JAZ1 (1) to JAZ12 (12). (B) Yeast two-hybrid assay using JAZ3 fused to the GAL4 Binding Domain (BD- JAZ3) and FIL/YAB fused to the GAL4 Activation Domain (AD-FIL/YAB). Yeast cells cotransformed with the indicated combinations were selected in medium lacking Leu and Trp (-2) and grown for 5 days in medium lacking Ade, His, Leu and Trp without or with 3-aminotriazole (-4, -4AT) to select for interactions. BD represents the empty pGBKT7 vector. B AD-FIL AD-YAB2 AD-YAB3 AD-YAB5 BD BD-JAZ3 -2 -4 3AT BD BD-JAZ3 BD-JAZ3 -4 A -2 1 2 3 4 5 6 7 8 9 10 11 12 AD-FIL AD-YAB2 AD-YAB3 AD-YAB5 AD-FIL AD-YAB3 -4 3AT BD-JAZ Supplemental Data. Boter et al. (2015). Plant Cell 10.1105/tpc.15.00220 1
Transcript of Boter et al-YAB supplemental figures - Plant Cell · FBE2 G-box FBE1 -463 -1 Supplemental Data....
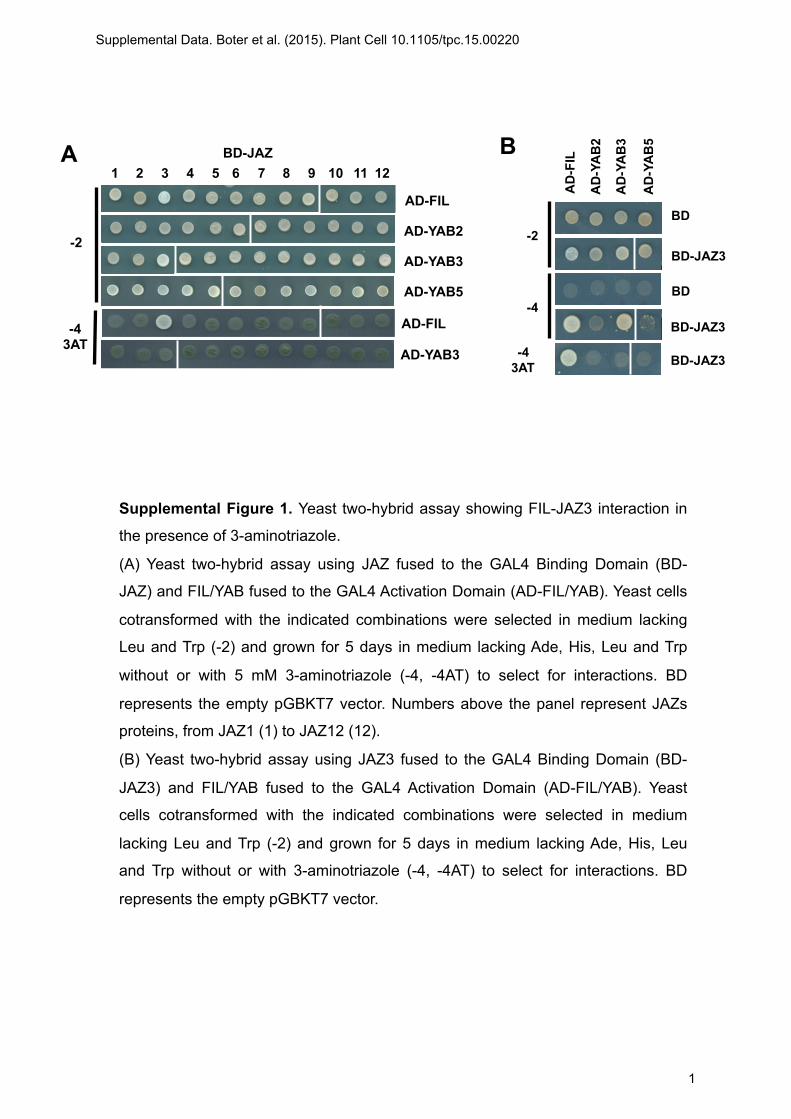
Supplemental Figure 1. Yeast two-hybrid assay showing FIL-JAZ3 interaction in
the presence of 3-aminotriazole.
(A) Yeast two-hybrid assay using JAZ fused to the GAL4 Binding Domain (BD-
JAZ) and FIL/YAB fused to the GAL4 Activation Domain (AD-FIL/YAB). Yeast cells
cotransformed with the indicated combinations were selected in medium lacking
Leu and Trp (-2) and grown for 5 days in medium lacking Ade, His, Leu and Trp
without or with 5 mM 3-aminotriazole (-4, -4AT) to select for interactions. BD
represents the empty pGBKT7 vector. Numbers above the panel represent JAZs
proteins, from JAZ1 (1) to JAZ12 (12).
(B) Yeast two-hybrid assay using JAZ3 fused to the GAL4 Binding Domain (BD-
JAZ3) and FIL/YAB fused to the GAL4 Activation Domain (AD-FIL/YAB). Yeast
cells cotransformed with the indicated combinations were selected in medium
lacking Leu and Trp (-2) and grown for 5 days in medium lacking Ade, His, Leu
and Trp without or with 3-aminotriazole (-4, -4AT) to select for interactions. BD
represents the empty pGBKT7 vector.
B
AD
-FIL
AD
-YA
B2
AD
-YA
B3
AD
-YA
B5
BD
BD-JAZ3 -2
-4 3AT
BD
BD-JAZ3
BD-JAZ3
-4
A
-2
1 2 3 4 5 6 7 8 9 10 11 12
AD-FIL
AD-YAB2
AD-YAB3
AD-YAB5
AD-FIL
AD-YAB3
-4 3AT
BD-JAZ
Supplemental Data. Boter et al. (2015). Plant Cell 10.1105/tpc.15.00220
1

0
5
10
15
20
25
Control COR DEX DEX+COR
A53
0/g
FW
Col0 35s:FIL-GR
Supplemental Figure 2. Anthocyanin content of 7-day-old 35S:FIL-GR transgenic
Arabidopsis seedlings grown on MS medium supplemented with 10 µM
Dexamethasone (DEX) plus/minus 1 µM Coronatine (COR; a mimic of JA-Ile).
EtOH was the solvent used for Cor stock and was added in control treatments.
DMSO is the solvent used for DEX stock and was added in control treatment.
Error bars represent SD. Asterisks indicate statistically significant differences
between 35S:FIL-GR and Col0 in each condition (p-value<0.01, t-test).
*
*
Supplemental Data. Boter et al. (2015). Plant Cell 10.1105/tpc.15.00220
2
A
B
0,0
0,1
0,2
0,3
0,4
0,5
0,6
Ler fil fil/+ yab3
fil yab3 Coler yab235 fil yab235
Hyp
ocot
yl le
ngth
(cm
)
Control 50 µM JA
0
5
10
15
20
25
30
% In
hibi
tion
0,0
0,1
0,2
0,3
0,4
0,5
0,6
0,7
Dex Dex+JA
Hyp
ocot
yl le
ntgh
(cm
)
Col0
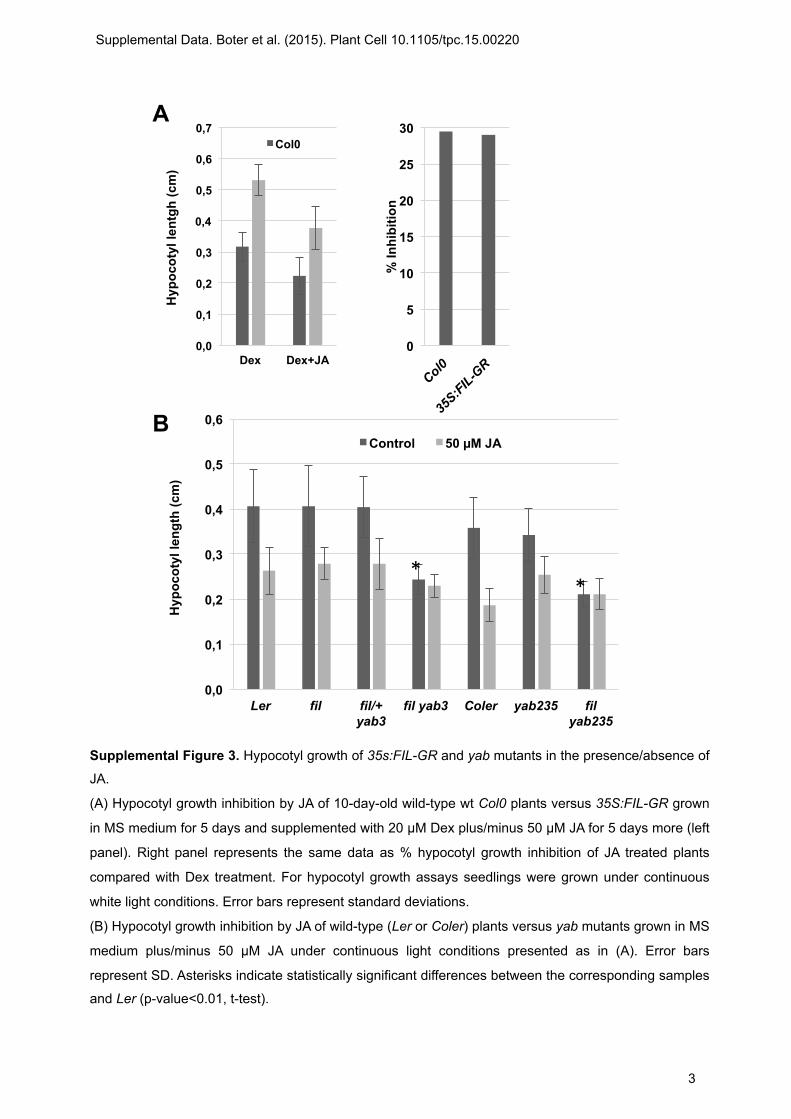
Supplemental Figure 3. Hypocotyl growth of 35s:FIL-GR and yab mutants in the presence/absence of
JA.
(A) Hypocotyl growth inhibition by JA of 10-day-old wild-type wt Col0 plants versus 35S:FIL-GR grown
in MS medium for 5 days and supplemented with 20 µM Dex plus/minus 50 µM JA for 5 days more (left
panel). Right panel represents the same data as % hypocotyl growth inhibition of JA treated plants
compared with Dex treatment. For hypocotyl growth assays seedlings were grown under continuous
white light conditions. Error bars represent standard deviations.
(B) Hypocotyl growth inhibition by JA of wild-type (Ler or Coler) plants versus yab mutants grown in MS
medium plus/minus 50 µM JA under continuous light conditions presented as in (A). Error bars
represent SD. Asterisks indicate statistically significant differences between the corresponding samples
and Ler (p-value<0.01, t-test).
* *
Supplemental Data. Boter et al. (2015). Plant Cell 10.1105/tpc.15.00220
3
0,00
0,50
1,00
1,50
2,00
2,50
3,00
3,50
Ler fil fil/+ yab3 fil yab3 Coler yab235 filyab235
Roo
t len
gth
(cm
)
control 50 µM JA
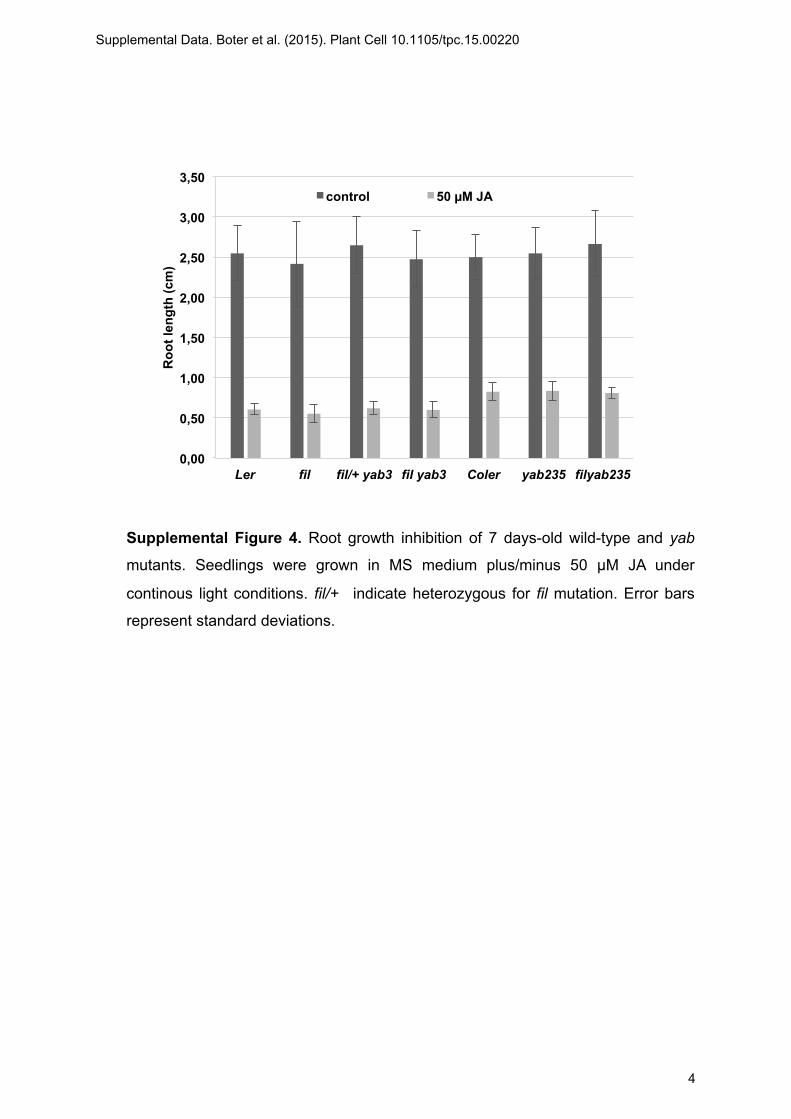
Supplemental Figure 4. Root growth inhibition of 7 days-old wild-type and yab
mutants. Seedlings were grown in MS medium plus/minus 50 µM JA under
continous light conditions. fil/+ indicate heterozygous for fil mutation. Error bars
represent standard deviations.
Supplemental Data. Boter et al. (2015). Plant Cell 10.1105/tpc.15.00220
4

Col0
35S:FIL-GR
coi1-30
Coler
fil/+ yab235
Supplemental Figure 5. Disease symptoms in leaves of wild-type, yab mutants
and 35S:FIL-GR lines. Photographs of detached leaves were taken 4 days after
inoculation.
Supplemental Data. Boter et al. (2015). Plant Cell 10.1105/tpc.15.00220
5
-1180 ctaggttttccatcgtacacgtaaattttcatgcaagaaagcagaaatatacaaatactaacttttagatactgaaaaatgagatcagattctagtcaaattttgttaaaagtatttataaatttaaattgcaagtcctcaaaaagtacgactaaaaatgcttttcttagaaAATGATAAtaaaccggcgttttatatataagtgtttctttttctcttctgtccagaagtaAATCATTAagaaccaatatggcttttcttaaactaatctccgtgataatcaaatctttgatcattctccacacaatcccatcaacaacatcgatctcactagatgcaccaacAATGATTctaatcggcactactaactatagagatagttgtcccaaaaaaaaaaaaaaaaactaactagagagataAATCATAttcaatacatgtactatttctactatacttaagaaaatttgtataccactatcttaactcttaacactgaacatactatacactatcttaactcccaactcttgtaaaagaatatctaattttaagaaaagacttcaaatgcttgttaaatttctagtgaagatgcacattctaaaaactggtaaaatggtaagaaaaaaatatataaaaaaatagccttattaaaatttatatctcctatttctctatccaaactacacggatgaagcttattgttattcatccaccctttttctcaattctgtcctatttcttgtgcatgaaacttctccatcttgtaatcggataAATCATAcccaaattttttctttctgaaaacatatatacccgaacattaattactatcgtcctttctcctaattttgttaagaaacatgtttgtttgtttttagtactgaaaaaggatggagatacttgctagatcctatgaaccttttctctctaggacaaatcagtaaccaaacaataacttagcaaattaagcacgacagctaatacataaaatgtggatatcaaacatgcacgtcacttccttttttccgtCACGTGtttttataaattttctcacatactcacactctctataagacctccAATCATTtgtgaaaccatactatatataccctcttccttgaccaatttacttataccttttacaatttgtttatatattttacgtatctatctttgttccATG
-1
Putative FIL binding element G-box
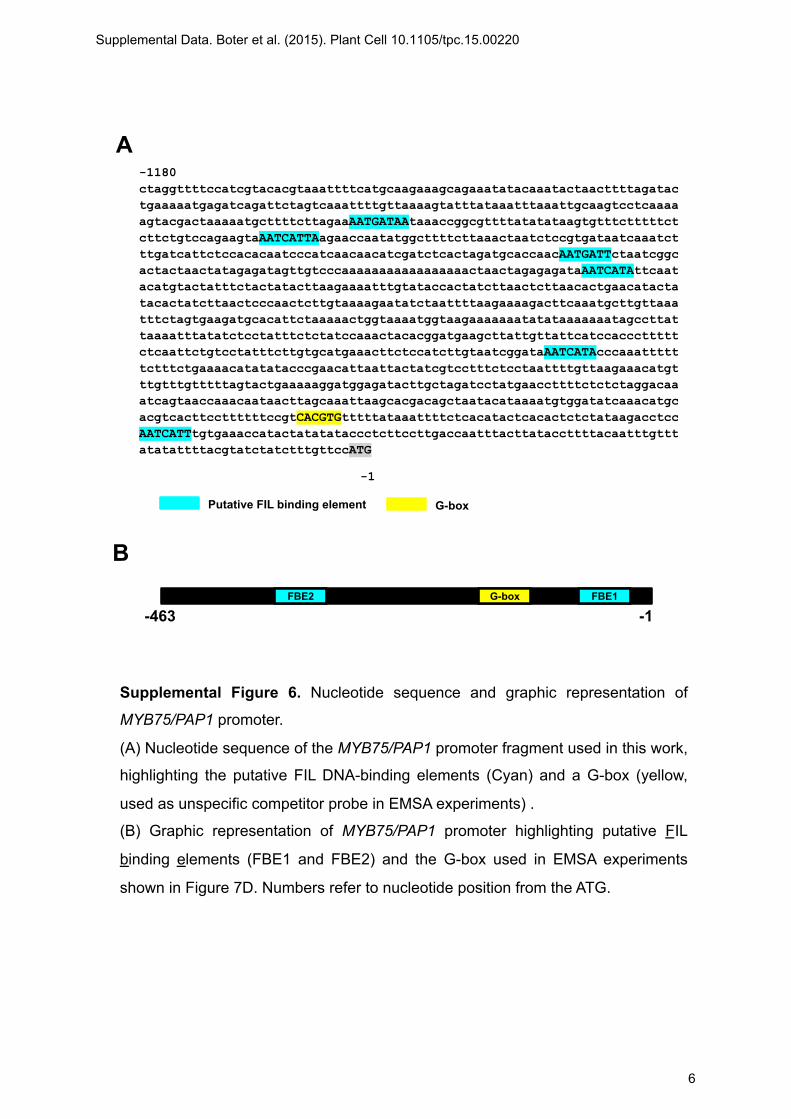
Supplemental Figure 6. Nucleotide sequence and graphic representation of
MYB75/PAP1 promoter.
(A) Nucleotide sequence of the MYB75/PAP1 promoter fragment used in this work,
highlighting the putative FIL DNA-binding elements (Cyan) and a G-box (yellow,
used as unspecific competitor probe in EMSA experiments) .
(B) Graphic representation of MYB75/PAP1 promoter highlighting putative FIL
binding elements (FBE1 and FBE2) and the G-box used in EMSA experiments
shown in Figure 7D. Numbers refer to nucleotide position from the ATG.
A
B FBE1 FBE2 G-box
-1 -463
Supplemental Data. Boter et al. (2015). Plant Cell 10.1105/tpc.15.00220
6
Ler fil yab3
fil yab235 Coler
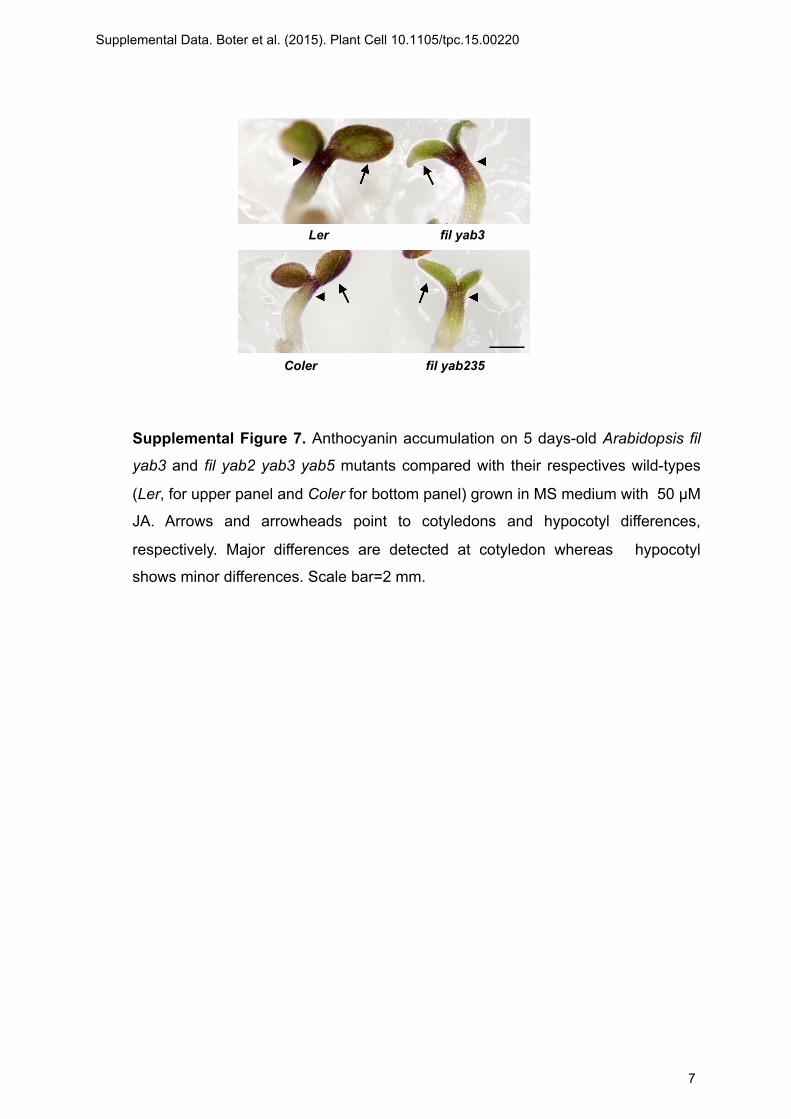
Supplemental Figure 7. Anthocyanin accumulation on 5 days-old Arabidopsis fil
yab3 and fil yab2 yab3 yab5 mutants compared with their respectives wild-types
(Ler, for upper panel and Coler for bottom panel) grown in MS medium with 50 µM
JA. Arrows and arrowheads point to cotyledons and hypocotyl differences,
respectively. Major differences are detected at cotyledon whereas hypocotyl
shows minor differences. Scale bar=2 mm.
Supplemental Data. Boter et al. (2015). Plant Cell 10.1105/tpc.15.00220
7
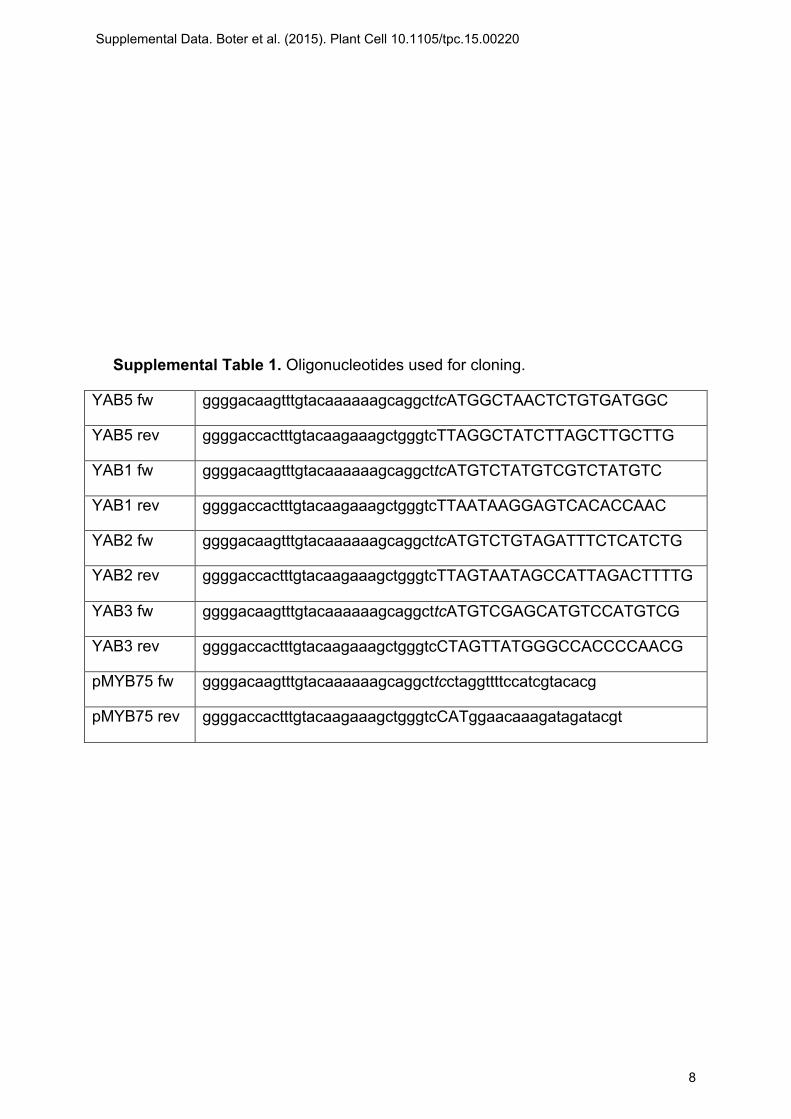
Supplemental Table 1. Oligonucleotides used for cloning.
YAB5 fw ggggacaagtttgtacaaaaaagcaggcttcATGGCTAACTCTGTGATGGC
YAB5 rev ggggaccactttgtacaagaaagctgggtcTTAGGCTATCTTAGCTTGCTTG
YAB1 fw ggggacaagtttgtacaaaaaagcaggcttcATGTCTATGTCGTCTATGTC
YAB1 rev ggggaccactttgtacaagaaagctgggtcTTAATAAGGAGTCACACCAAC
YAB2 fw ggggacaagtttgtacaaaaaagcaggcttcATGTCTGTAGATTTCTCATCTG
YAB2 rev ggggaccactttgtacaagaaagctgggtcTTAGTAATAGCCATTAGACTTTTG
YAB3 fw ggggacaagtttgtacaaaaaagcaggcttcATGTCGAGCATGTCCATGTCG
YAB3 rev ggggaccactttgtacaagaaagctgggtcCTAGTTATGGGCCACCCCAACG
pMYB75 fw ggggacaagtttgtacaaaaaagcaggcttcctaggttttccatcgtacacg
pMYB75 rev ggggaccactttgtacaagaaagctgggtcCATggaacaaagatagatacgt
Supplemental Data. Boter et al. (2015). Plant Cell 10.1105/tpc.15.00220
8