Supplemental Data. Kagale et al. Plant Cell (2014) 10.1105 ... · Supplemental Data. Kagale et al....
11
Arabidopsis thaliana 0.01 0.02 0.05 0.10 0.20 0.50 1.00 2.00 5.00 10.00 20.00 0 200 400 600 800 1000 1200 Arabidopsis lyrata 0.01 0.02 0.05 0.10 0.20 0.50 1.00 2.00 5.00 10.00 20.00 0 200 400 600 800 Armoracia rusticana 0.01 0.02 0.05 0.10 0.20 0.50 1.00 2.00 5.00 10.00 20.00 0 10 20 30 40 50 Barbarea verna 0.01 0.02 0.05 0.10 0.20 0.50 1.00 2.00 5.00 10.00 20.00 0 20 40 60 80 100 Camelina sativa 0.01 0.02 0.05 0.10 0.20 0.50 1.00 2.00 5.00 10.00 20.00 0 1000 2000 3000 4000 5000 6000 Capsella bursa−pastoris 0.01 0.02 0.05 0.10 0.20 0.50 1.00 2.00 5.00 10.00 20.00 0 20 40 60 80 100 120 Capsella rubella 0.01 0.02 0.05 0.10 0.20 0.50 1.00 2.00 5.00 10.00 20.00 0 100 200 300 400 500 600 700 Erysimum cheiri 0.01 0.02 0.05 0.10 0.20 0.50 1.00 2.00 5.00 10.00 20.00 0 20 40 60 80 100 120 Leavenworthia alabamica 0.01 0.02 0.05 0.10 0.20 0.50 1.00 2.00 5.00 10.00 20.00 0 200 400 600 800 Lepidium densiflorum 0.01 0.02 0.05 0.10 0.20 0.50 1.00 2.00 5.00 10.00 20.00 0 100 200 300 400 Lepidium meyenii 0.01 0.02 0.05 0.10 0.20 0.50 1.00 2.00 5.00 10.00 20.00 0 50 100 150 200 Lepidium sativum 0.01 0.02 0.05 0.10 0.20 0.50 1.00 2.00 5.00 10.00 20.00 0 20 40 60 80 100 120 140 Brassica rapa 0.01 0.02 0.05 0.10 0.20 0.50 1.00 2.00 5.00 10.00 20.00 0 500 1000 1500 2000 Cochlearia officinalis 0.01 0.02 0.05 0.10 0.20 0.50 1.00 2.00 5.00 10.00 20.00 0 20 40 60 80 100 120 Draba lactea 0.01 0.02 0.05 0.10 0.20 0.50 1.00 2.00 5.00 10.00 20.00 0 100 200 300 400 500 600 Eutrema salsugineum 0.01 0.02 0.05 0.10 0.20 0.50 1.00 2.00 5.00 10.00 20.00 0 100 200 300 400 500 600 700 Isatis tinctoria 0.01 0.02 0.05 0.10 0.20 0.50 1.00 2.00 5.00 10.00 20.00 0 20 40 60 80 Pringlea antiscorbutica 0.01 0.02 0.05 0.10 0.20 0.50 1.00 2.00 5.00 10.00 20.00 0 10 20 30 40 Schrenkiella parvula 0.01 0.02 0.05 0.10 0.20 0.50 1.00 2.00 5.00 10.00 20.00 0 100 200 300 400 500 600 Sisymbrium officinale 0.01 0.02 0.05 0.10 0.20 0.50 1.00 2.00 5.00 10.00 20.00 0 20 40 60 80 100 Stanleya pinnata 0.01 0.02 0.05 0.10 0.20 0.50 1.00 2.00 5.00 10.00 20.00 0 50 100 150 200 250 Hesperis matronalis 0.01 0.02 0.05 0.10 0.20 0.50 1.00 2.00 5.00 10.00 20.00 0 20 40 60 80 100 120 Aethionema arabicum 0.01 0.02 0.05 0.10 0.20 0.50 1.00 2.00 5.00 10.00 20.00 0 100 200 300 400 500 600 700 Supplemental Figure 1. Histograms of frequency distributions of Ks values obtained by comparing pairs of paralogous genes of 23 Brassicaceae species. Values on the X- and Y-axes represent synonymous distance (Ks) and number of duplicates, respectively. The red line in each histogram represents mixture model fitted with normal distribution components. The dotted lines represent the individual Gaussian components. The complete list of mixture model Gaussian components is provided in Supplemental Dataset 1. Major polyploidy events inferred from each distribution and their estimated ages are listed in Supplemental Table 4. Supplemental Data. Kagale et al. Plant Cell (2014) 10.1105/tpc.114.126391
Transcript of Supplemental Data. Kagale et al. Plant Cell (2014) 10.1105 ... · Supplemental Data. Kagale et al....

Arabidopsis thaliana
0.01 0.02 0.05 0.10 0.20 0.50 1.00 2.00 5.00 10.00 20.00
0
200
400
600
800
1000
1200
Arabidopsis lyrata
0.01 0.02 0.05 0.10 0.20 0.50 1.00 2.00 5.00 10.00 20.00
0
200
400
600
800 Armoracia rusticana
0.01 0.02 0.05 0.10 0.20 0.50 1.00 2.00 5.00 10.00 20.00
0
10
20
30
40
50 Barbarea verna
0.01 0.02 0.05 0.10 0.20 0.50 1.00 2.00 5.00 10.00 20.00
0
20
40
60
80
100
Camelina sativa
0.01 0.02 0.05 0.10 0.20 0.50 1.00 2.00 5.00 10.00 20.00
0
1000
2000
3000
4000
5000
6000 Capsella bursa−pastoris
0.01 0.02 0.05 0.10 0.20 0.50 1.00 2.00 5.00 10.00 20.00
0
20
40
60
80
100
120 Capsella rubella
0.01 0.02 0.05 0.10 0.20 0.50 1.00 2.00 5.00 10.00 20.00
0
100
200
300
400
500
600
700 Erysimum cheiri
0.01 0.02 0.05 0.10 0.20 0.50 1.00 2.00 5.00 10.00 20.00
0
20
40
60
80
100
120
Leavenworthia alabamica
0.01 0.02 0.05 0.10 0.20 0.50 1.00 2.00 5.00 10.00 20.00
0
200
400
600
800 Lepidium densiflorum
0.01 0.02 0.05 0.10 0.20 0.50 1.00 2.00 5.00 10.00 20.00
0
100
200
300
400 Lepidium meyenii
0.01 0.02 0.05 0.10 0.20 0.50 1.00 2.00 5.00 10.00 20.00
0
50
100
150
200 Lepidium sativum
0.01 0.02 0.05 0.10 0.20 0.50 1.00 2.00 5.00 10.00 20.00
0
20
40
60
80
100
120
140
Brassica rapa
0.01 0.02 0.05 0.10 0.20 0.50 1.00 2.00 5.00 10.00 20.00
0
500
1000
1500
2000 Cochlearia officinalis
0.01 0.02 0.05 0.10 0.20 0.50 1.00 2.00 5.00 10.00 20.00
0
20
40
60
80
100
120 Draba lactea
0.01 0.02 0.05 0.10 0.20 0.50 1.00 2.00 5.00 10.00 20.00
0
100
200
300
400
500
600 Eutrema salsugineum
0.01 0.02 0.05 0.10 0.20 0.50 1.00 2.00 5.00 10.00 20.00
0
100
200
300
400
500
600
700
Isatis tinctoria
0.01 0.02 0.05 0.10 0.20 0.50 1.00 2.00 5.00 10.00 20.00
0
20
40
60
80 Pringlea antiscorbutica
0.01 0.02 0.05 0.10 0.20 0.50 1.00 2.00 5.00 10.00 20.00
0
10
20
30
40 Schrenkiella parvula
0.01 0.02 0.05 0.10 0.20 0.50 1.00 2.00 5.00 10.00 20.00
0
100
200
300
400
500
600 Sisymbrium officinale
0.01 0.02 0.05 0.10 0.20 0.50 1.00 2.00 5.00 10.00 20.00
0
20
40
60
80
100
Stanleya pinnata
0.01 0.02 0.05 0.10 0.20 0.50 1.00 2.00 5.00 10.00 20.00
0
50
100
150
200
250
Hesperis matronalis
0.01 0.02 0.05 0.10 0.20 0.50 1.00 2.00 5.00 10.00 20.00
0
20
40
60
80
100
120 Aethionema arabicum
0.01 0.02 0.05 0.10 0.20 0.50 1.00 2.00 5.00 10.00 20.00
0
100
200
300
400
500
600
700
Supplemental Figure 1. Histograms of frequency distributions of Ks values obtained by comparing pairs of paralogous genes of 23 Brassicaceae species. Values on the X- and Y-axes represent synonymous distance (Ks) and number of duplicates, respectively. The red line in each histogram represents mixture model fitted with normal distribution components. The dotted lines represent the individual Gaussian components. The complete list of mixture model Gaussian components is provided in Supplemental Dataset 1. Major polyploidy events inferred from each distribution and their estimated ages are listed in Supplemental Table 4.
Supplemental Data. Kagale et al. Plant Cell (2014) 10.1105/tpc.114.126391

Supplemental Figure 2. Age distributions of duplicated genes in Cleomaceae and CaricaceaespeciesHistograms of frequency distributions of Ks values comparing pairs of paralogous genes of Cleomespecies and Carica papaya are shown. Values on the X- and Y-axes represent synonymous distance(Ks) and number of duplicates, respectively. The red line in each histogram represents mixturemodel fitted with normal distribution components and the dotted lines represent the individualGaussian components.
Supplemental Data. Kagale et al. Plant Cell (2014) 10.1105/tpc.114.126391
Supplemental Figure 3. Combined Ks distribution plot of Brassicacaeae vs Cleomaceaespecies.Ks distributions of each Brassicaceae species vs. Cleome spinosa were compared pairwise bythe Kolmogorov Smirnov tests. The array of p-values from each comparison is provided inSupplemental Table 5.
Supplemental Data. Kagale et al. Plant Cell (2014) 10.1105/tpc.114.126391
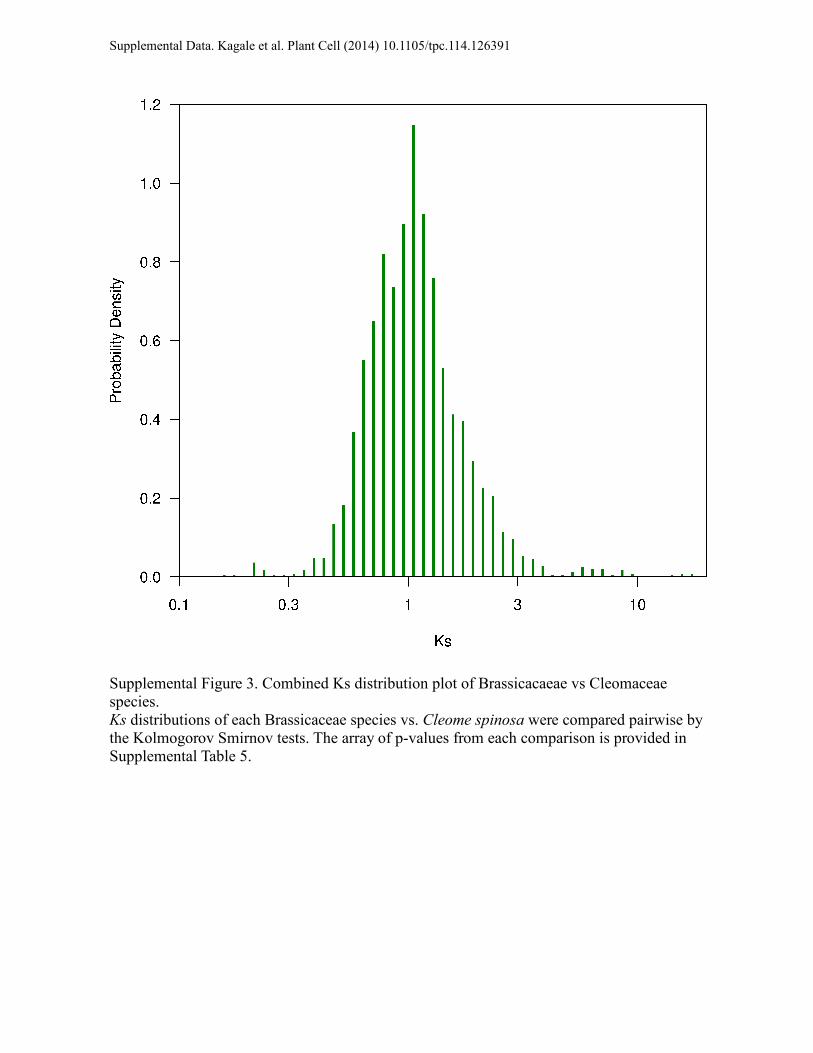
Supplemental Figure 4. Age distribution of homeologous genes in Brassica napus.Histogram of frequency distributions of Ks values obtained by comparing pairs of homeologousgenes from B. napus is shown. The red line in the histogram represents mixture model fitted withnormal distribution components. The dotted lines represent the individual Gaussian components.
Supplemental Data. Kagale et al. Plant Cell (2014) 10.1105/tpc.114.126391
Supplemental Data. Kagale et al. Plant Cell (2014) 10.1105/tpc.114.126391!!
1!!
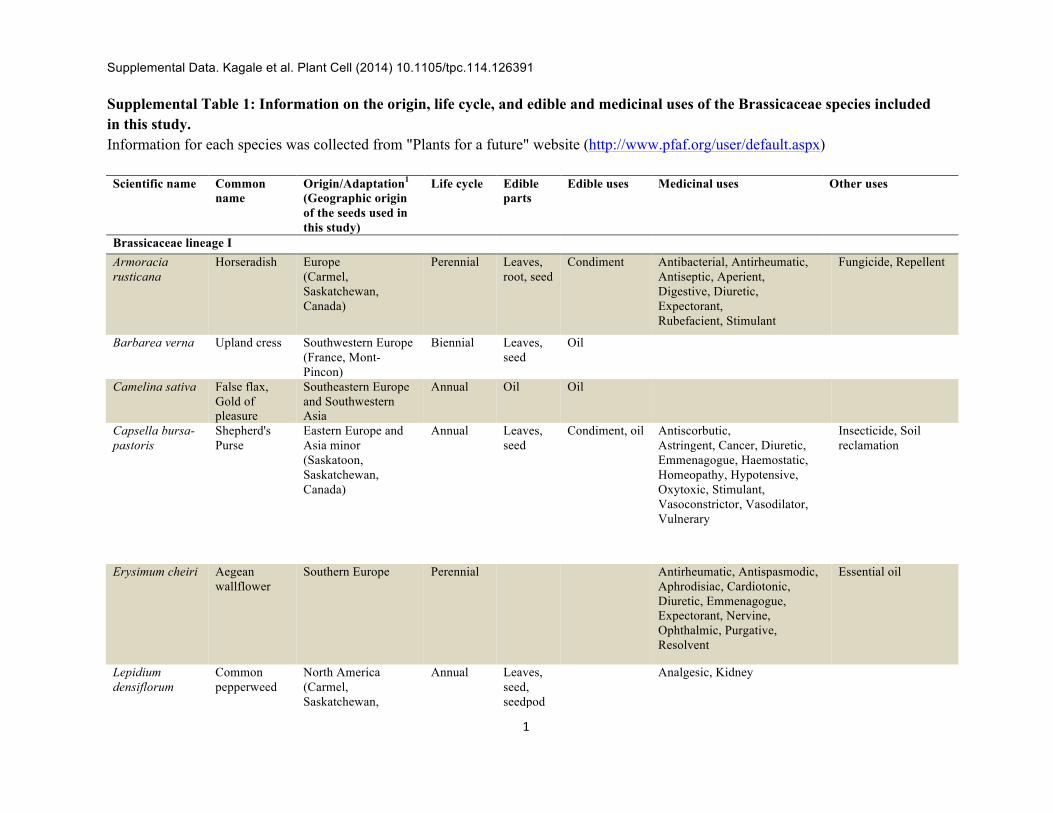
Supplemental Table 1: Information on the origin, life cycle, and edible and medicinal uses of the Brassicaceae species included in this study. Information for each species was collected from "Plants for a future" website (http://www.pfaf.org/user/default.aspx) !Scientific name Common
name Origin/Adaptation1 (Geographic origin of the seeds used in this study)
Life cycle Edible parts
Edible uses Medicinal uses Other uses
Brassicaceae lineage I Armoracia rusticana
Horseradish Europe (Carmel, Saskatchewan, Canada)
Perennial Leaves, root, seed
Condiment Antibacterial, Antirheumatic, Antiseptic, Aperient, Digestive, Diuretic, Expectorant, Rubefacient, Stimulant
Fungicide, Repellent
Barbarea verna Upland cress Southwestern Europe (France, Mont-Pincon)
Biennial Leaves, seed
Oil
Camelina sativa False flax, Gold of pleasure
Southeastern Europe and Southwestern Asia
Annual Oil Oil
Capsella bursa-pastoris
Shepherd's Purse
Eastern Europe and Asia minor (Saskatoon, Saskatchewan, Canada)
Annual Leaves, seed
Condiment, oil Antiscorbutic, Astringent, Cancer, Diuretic, Emmenagogue, Haemostatic, Homeopathy, Hypotensive, Oxytoxic, Stimulant, Vasoconstrictor, Vasodilator, Vulnerary
Insecticide, Soil reclamation
Erysimum cheiri Aegean wallflower
Southern Europe Perennial Antirheumatic, Antispasmodic, Aphrodisiac, Cardiotonic, Diuretic, Emmenagogue, Expectorant, Nervine, Ophthalmic, Purgative, Resolvent
Essential oil
Lepidium densiflorum
Common pepperweed
North America (Carmel, Saskatchewan,
Annual Leaves, seed, seedpod
Analgesic, Kidney
Supplemental Data. Kagale et al. Plant Cell (2014) 10.1105/tpc.114.126391!!
2!!
Canada)
Lepidium meyenii
Maca Southern America (Between Junin and Cerro de Pasco, Peru)
Perennial Leaves, root, seed
Adaptogen, Aphrodisiac, Cancer, Infertility, Nutritive, Tonic.
Lepidium sativum
Pepper cress Possibly Iran (Flensburg, Germany)
Annual Leaves, seed
Condiment, oil Antiasthmatic, Antiscorbutic, Aperient, Diuretic, Galactogogue, Poultice, Stimulant, Vitamin C
Oil for lighting
Brassicaceae lineage II
Cochlearia officinalis
Scurvy grass Coastal and mountainous regions of western, northern and central Europe (Finmark, Norway)
Biennial Leaves Salad Antirheumatic, Antiscorbutic, Aperient, Disinfectant, Diuretic, Stimulant, Vitamin C
Disinfectant
Draba lactea Lapland whitlow-grass
(Kangiqsujuaq, Quebec, Canada)
Perennial
Isatis tinctoria Woad Central and Southern Europe (Zafferana Etnea, Sicily, Italy)
Biennial Leaves Antibacterial, Antiviral, Astringent, Cancer
Dye, Preservative
Pringlea antiscorbutica
Kerguelen cabbage
Antarctic regions Perennial Leaves Condiment Antiscorbutic
Stanleya pinnata Desert's Prince's plume
South-Western North America
Perennial Leaves, seed
Antipruritic, Odontalgic, Poultice, Tonic, Venereal disease
Sisymbrium officinale
Hedge mustard
Europe (Madrid, Spain)
Annual Leaves, seed
Condiment Antiaphonic, Diuretic, Expectorant, Laxative, Stomachic
Soil conditioner
Brassicaceae lineage III
Hesperis matronalis
Dame's Rocket
Southern Europe to Siberia
Perennial Leaves, seed
Oil Diaphoretic, Diuretic Essential oil
1Origin/Adaptation indicates the suggested centre of origin for the species; in parentheses we have indicated where available the geographic region from which the seed used in this study was collected.

Supplemental Data. Kagale et al. Plant Cell (2014) 10.1105/tpc.114.126391!!
3!!
Supplemental Table 2: Completely sequenced Brassicaceae genomes included in this study
Species Genome version
Download link Chromosome number (2n)
Genome size (Mb)
Reference
Aethionema Arabicum
v1 http://mustang.biol.mcgill.ca:8885! 22 249 Haudry et al., 2013
Arabidopsis thaliana
TAIR10 ftp://ftp.arabidopsis.org/home/tair/Sequences/blast_datasets/
10 157 AGI, 2000
Arabidopsis lyrata
v1.0 http://bioinformatics.psb.ugent.be/plaza/download/index
16 230 Hu et al., 2011
Brassica rapa v1.2 http://brassicadb.org/brad/downloadOverview.php
20 529 Wang et al., 2011
Camelina sativa
v1.0 http://camelinadb.ca/
40 785 Kagale et al, 2014
Capsella rubella
183 ftp://ftp.jgi-psf.org/pub/compgen/phytozome/v9.0/Crubella/
16 216 Slotte et al., 2013
Leavenworthia alabamica
v1 http://mustang.biol.mcgill.ca:8885 22 316 Haudry et al., 2013
Eutrema salsugineum
173 ftp://ftp.jgi-psf.org/pub/compgen/phytozome/v9.0/Thalophila/
14 260 Yang et al., 2013
Schrenkiella parvula
v1.0 http://thellungiella.org/data/
14 140 Dassanayake et al., 2011
!

Supplemental Data. Kagale et al. Plant Cell (2014) 10.1105/tpc.114.126391!!
4!!
Supplemental Table 3: Roche 454 pyrosequencing, read filtering and assembly statistics for crucifer transcriptomes
Species Total reads
Total data (bp)
Filtered reads
rRNA reads
High quality reads
Clean data (bp)
Number of
isogroups
Number of isotigs
Number of unigenes*
Mean length of ESTs (bp)
Datasets generated in this study Brassicaceae lineage I
Armoracia rusticana 318,249 104,158,153 22,731 1,058 294,460 99,442,871 32531 34,207 32531 453
Barbarea verna 509,825 183,003,782 52,262 914 456,649 174,042,917 46149 48,528 46149 545
Camelina sativa 654,329 184,060,228 565,794 8,556 512,219 165,779,738 24,679 41,439 24,679 600 Capsella bursa-pastoris 636,610 220,415,923 109,385 1,527 525,698 196,538,174 29299 43,787 29299 632
Erysimum cheiri 728,351 260,045,141 153,434 192,842 382,075 137,476,277 20776 21,464 20776 691 Lepidium densiflorum 698,260 284,386,448 132,104 162,879 403,277 162,145,782 24433 27,944 24433 749
Lepidium meyenii 317,304 102,937,822 24,252 682 292,370 99,008,125 28872 33,153 28872 505
Lepidium sativum 710,869 299,571,617 198,476 291,563 220,830 91,156,777 14372 16,021 14372 661 Brassicaceae lineage II
Cochlearia officinalis 459,753 156,072,854 36,870 1,888 420,995 146,823,218 26839 28,798 26839 570
Draba lactea 657,265 268,755,563 69,411 26,470 561,384 236,452,279 33575 53,470 33575 712
Isatis tinctoria 405,425 129,872,098 29,526 1,180 374,719 123,431,242 30803 32,534 30803 510 Pringlea antiscorbutica 582,473 151,334,384 151,097 22,826 408,550 130,506,889 27788 50,539 27788 384 Sisymbrium officinale 499,983 198,655,081 48,334 1,785 449,864 183,634,013 38819 41,307 38819 603
Stanleya pinnata 695,764 264,587,372 87,488 74,359 533,917 205,625,358 32009 43,785 32009 564 Brassicaceae lineage III
Hesperis matronalis 735,348 307,895,442 181,784 275,439 278,125 114,214,311 16251 17,230 16251 737 Datasets downloaded from NCBI short read archive
Cleome spinosa 313,805 70,564,588 67,509 781 245,515 58,658,138 19,328 19,406 19,328 343
Cleome gynandra 402,668 91,851,141 76,809 277 325,582 78,432,152 20,543 20,705 20,543 369 *Non-redundant ESTs
Supplemental Data. Kagale et al. Plant Cell (2014) 10.1105/tpc.114.126391!!
5!!
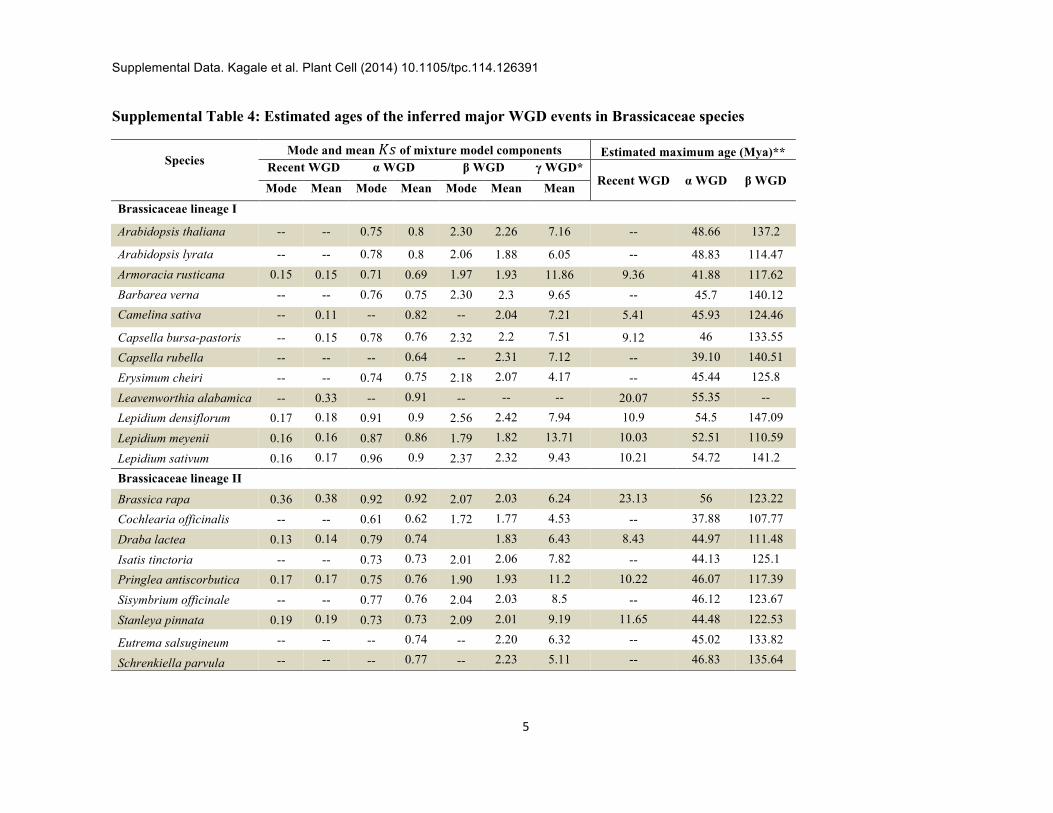
Supplemental Table 4: Estimated ages of the inferred major WGD events in Brassicaceae species
Species Mode and mean !" of mixture model components Estimated maximum age (Mya)**
Recent WGD α WGD β WGD γ WGD* Recent WGD α WGD β WGD
Mode Mean Mode Mean Mode Mean Mean
Brassicaceae lineage I
Arabidopsis thaliana -- -- 0.75 0.8 2.30 2.26 7.16 -- 48.66 137.2
Arabidopsis lyrata -- -- 0.78 0.8 2.06 1.88 6.05 -- 48.83 114.47 Armoracia rusticana 0.15 0.15 0.71 0.69 1.97 1.93 11.86 9.36 41.88 117.62 Barbarea verna -- -- 0.76 0.75 2.30 2.3 9.65 -- 45.7 140.12 Camelina sativa -- 0.11 -- 0.82 -- 2.04 7.21 5.41 45.93 124.46
Capsella bursa-pastoris -- 0.15 0.78 0.76 2.32 2.2 7.51 9.12 46 133.55
Capsella rubella -- -- -- 0.64 -- 2.31 7.12 -- 39.10 140.51
Erysimum cheiri -- -- 0.74 0.75 2.18 2.07 4.17 -- 45.44 125.8
Leavenworthia alabamica -- 0.33 -- 0.91 -- -- -- 20.07 55.35 --
Lepidium densiflorum 0.17 0.18 0.91 0.9 2.56 2.42 7.94 10.9 54.5 147.09
Lepidium meyenii 0.16 0.16 0.87 0.86 1.79 1.82 13.71 10.03 52.51 110.59
Lepidium sativum 0.16 0.17 0.96 0.9 2.37 2.32 9.43 10.21 54.72 141.2
Brassicaceae lineage II
Brassica rapa 0.36 0.38 0.92 0.92 2.07 2.03 6.24 23.13 56 123.22
Cochlearia officinalis -- -- 0.61 0.62 1.72 1.77 4.53 -- 37.88 107.77
Draba lactea 0.13 0.14 0.79 0.74 1.83 6.43 8.43 44.97 111.48
Isatis tinctoria -- -- 0.73 0.73 2.01 2.06 7.82 -- 44.13 125.1
Pringlea antiscorbutica 0.17 0.17 0.75 0.76 1.90 1.93 11.2 10.22 46.07 117.39
Sisymbrium officinale -- -- 0.77 0.76 2.04 2.03 8.5 -- 46.12 123.67
Stanleya pinnata 0.19 0.19 0.73 0.73 2.09 2.01 9.19 11.65 44.48 122.53
Eutrema salsugineum -- -- -- 0.74 -- 2.20 6.32 -- 45.02 133.82
Schrenkiella parvula -- -- -- 0.77 -- 2.23 5.11 -- 46.83 135.64

Supplemental Data. Kagale et al. Plant Cell (2014) 10.1105/tpc.114.126391!!
6!!
Brassicaceae lineage III
Hesperis matronalis -- -- 0.72 0.72 2.33 2.23 7.02 -- 44.07 135.54
BasalGroup
Aethionema arabicum -- -- -- 0.77 -- 2.39 5.75 -- 46.83 145.37
Cleomaceae
Cleome spinosa 0.41 0.4 0.67 1.95 1.95 3.77 24.05 40.75 118.56
Caricaceae
Carica papaya 0.17 0.15 -- 2.01 1.96 4.58 -- -- 119.41 *Peak associated with γ WGD was not visible and hence no mode values were calculated **Calculated based on mixture model mean ln(Ks) values

Supplemental Data. Kagale et al. Plant Cell (2014) 10.1105/tpc.114.126391!!
7!!
Supplemental Table 5: Significance of pairwise comparison of orthologous Ks distributions between Cleome spinosa and diverse Brassicaceae species Orthologous Ks distributions of each Brassicaceae species vs. Cleome spinosa were compared in pairwise manner by the Kolmogorov Smirnov tests. The array of p-values from each comparison is provided.
A. thaliana
P. antiscorbutica
C. bursa-pastoris D. lactea I. tinctoria
C. officinalis
A. rusticana
L. meyenii
L. densiflorum
H. matronalis
S. pinnata
L. sativum
S. officinale
B. verna
A. thaliana P.
antiscorbutica 0.0898 C. bursa-
pastoris 0.8107 0.0518
D. lactea 0.3529 0.0268 0.9680
I. tinctoria 0.2364 0.6988 0.2962 0.1646
C. officinalis 0.0015 2.41E-06 0.0011 0.0084 6.31E-06
A. rusticana 0.2596 0.5135 0.2596 0.2387 0.7623 1.66E-05
L. meyenii 0.4543 0.0446 0.8395 0.5807 0.0537 0.02530 0.1493 L.
densiflorum 0.3231 0.0047 0.4010 0.6193 0.0083 0.10800 0.0624 0.7760
H. matronalis 0.2993 0.3390 0.3483 0.2251 0.7673 1.33E-05 0.7119 0.1509 0.0201
S. pinnata 0.3232 0.7882 0.3004 0.1648 0.9361 1.92E-05 0.7341 0.09019 0.0081 0.9116
L. sativum 0.3967 0.0232 0.4328 0.8848 0.0278 0.06504 0.06905 0.9649 0.9873 0.0471 0.0657
S. officinale 0.8896 0.1390 0.9609 0.6866 0.4798 0.001887 0.7982 0.6210 0.1490 0.5412 0.4874 0.3232
B. verna 0.5173 0.0830 0.6872 0.3391 0.4295 6.45E-05 0.6912 0.3226 0.0765 0.9617 0.5233 0.1733 0.867
E. cheiri 0.7690 0.2566 0.7023 0.2060 0.2350 0.001178 0.4350 0.4404 0.2694 0.2205 0.4320 0.3160 0.811 0.4281