(WT) PC V SC SC - The Plant Cell · 1 Supplemental Data. Huang et al. Plant Cell (2015)...
17
Supplemental Figure 1. The Phenotypes of Rice GA-Related Mutants. (A) to (C) Appearance of the GA-related mutants and the corresponding wild-type plants. Bar = 10 cm. (D) to (F) Anatomical analysis of the cross-sections of internodes (D) and (E) and leaf sheaths (F) from GA-related mutants and the corresponding wild-type plants, to show the distribution patterns of sclerenchyma cells. SC, sclerenchyma cells; PC, parenchyma cells; V, vascular bundles. Arrows indicate the altered sclerenchyma cells. Bar = 0.5 cm. Nanjing6 (WT) sd1-8 gid1-20 slr1-6 Zhonghua11 (WT) d18-AD Akibare (WT) D Nanjing6 (WT) sd1-8 gid1-20 A Akibare (WT) d18-AD C E F B Zhonghua11 (WT) slr1-6 SC V PC SC SC SC SC SC V PC V PC PC PC V V SC SC Supplemental Data. Huang et al. Plant Cell (2015) 10.1105/tpc.15.00015
Transcript of (WT) PC V SC SC - The Plant Cell · 1 Supplemental Data. Huang et al. Plant Cell (2015)...
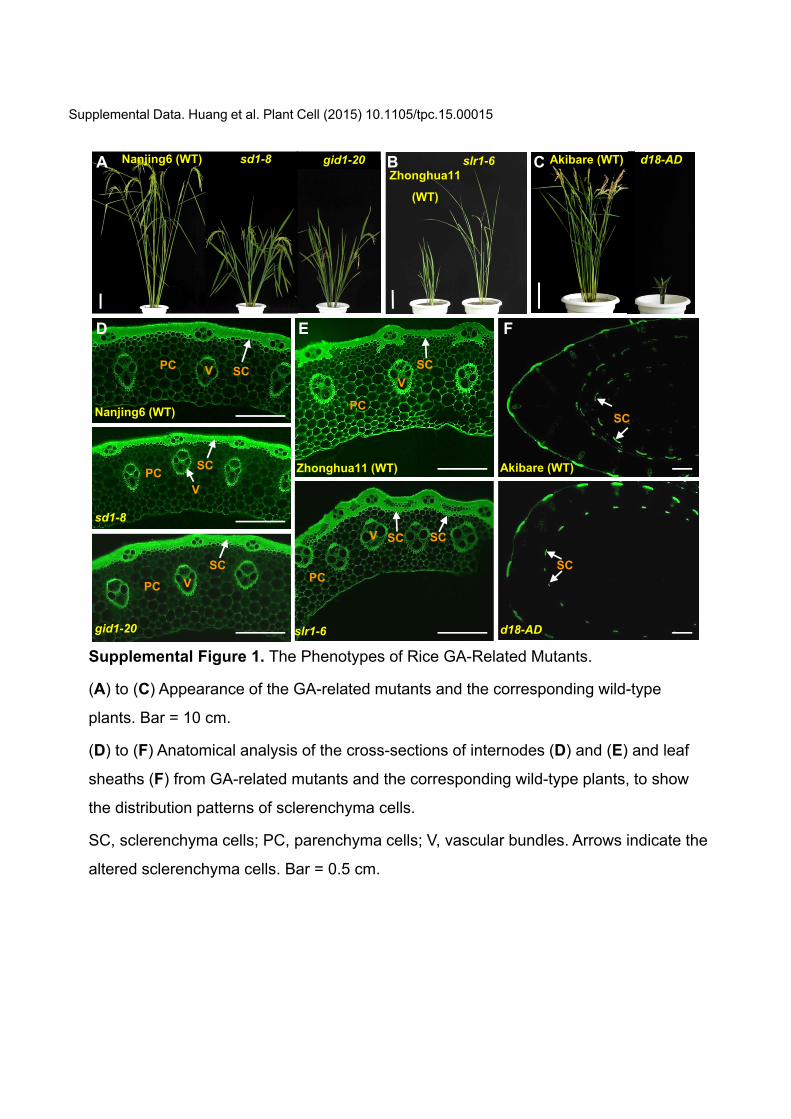
Supplemental Figure 1. The Phenotypes of Rice GA-Related Mutants.
(A) to (C) Appearance of the GA-related mutants and the corresponding wild-type
plants. Bar = 10 cm.
(D) to (F) Anatomical analysis of the cross-sections of internodes (D) and (E) and leaf
sheaths (F) from GA-related mutants and the corresponding wild-type plants, to show
the distribution patterns of sclerenchyma cells.
SC, sclerenchyma cells; PC, parenchyma cells; V, vascular bundles. Arrows indicate the
altered sclerenchyma cells. Bar = 0.5 cm.
Nanjing6 (WT)
sd1-8
gid1-20 slr1-6
Zhonghua11 (WT)
d18-AD
Akibare (WT)
D
Nanjing6 (WT) sd1-8 gid1-20A Akibare (WT) d18-ADC
E F
BZhonghua11
(WT)
slr1-6
SCVPC
SC
SC
SC SC
SCV
PC
V
PC
PC
PC
V
V
SC
SC
Supplemental Data. Huang et al. Plant Cell (2015) 10.1105/tpc.15.00015

Supplemental Figure 2. Phylogenetic Analysis of the Secondary Wall NACs in Rice and
Arabidopsis.
In Arabidopsis, SND1 and NST1are key regulators for secondary wall biosynthesis in fibers;
VNDs are key regulators for secondary wall biosynthesis in vessels; SND2/3 functions
downstream of SND1 (Demura and Ye, 2010; Zhao and Dixon, 2011; Zhong and Ye, 2007).
The numbers at each node represent the bootstrap support (percentage). The scale bar is an
indicator of genetic distance based on branch length.
VND like
SND1 like
SND2/3 like
Os-NAC29
Os-NAC7
NST2
NST1
SND1
VND6
Os-NAC90
VND7
Os-NAC31
SND3
Os-NAC3
SND2
Os-NAC62
Os-NAC7399
77
97
100
100
97
96
99
57
77
100
0.2
Supplemental Data. Huang et al. Plant Cell (2015) 10.1105/tpc.15.00015

Supplemental Figure 3. NAC29 and NAC31 Are Functional TFs That Regulate Cellulose
Synthesis.
(A) The four month-old wild type and NAC29- and NAC31- overexpressing (Ox) plants. Bar
= 10 cm.
(B) qRT-PCR examination of the NAC29 and NAC31 transcripts in the transgenic plants.
Rice TP1 was used as an internal control.
(C) Diagrams of the constructs used for transactivation assay.
(D) Luciferase activities in the rice protoplasts cotransfected with the constructs shown in (C).
(E) and (F) Subcellular localization pattern of NACs by transfecting the rice protoplasts with
GFP tagged TFs. The nuclei were counterstained with DAPI. Merge, merged images of GFP
and DAPI. Bars = 5 μm.
Error bars in this figure indicate the SD of three biological repeats.
Reporter
NAC29-GFP DAPI Merge DIC
NAC31-GFP DAPI Merge DIC
E
F
Rel
ativ
e ex
pres
sion
leve
l
WT0123456789B
WT NAC29 Ox NAC31 Ox
A
Rel
ativ
e lu
cife
rase
act
ivity
Mock NAC29 NAC3101
2
3
4
5
6
7D
CEffector
NOS ter35S mini proGal4BD NAC29/31
CaMV 35S proLUC
NOS ter35S mini pro5X GAL4 UAS
Supplemental Data. Huang et al. Plant Cell (2015) 10.1105/tpc.15.00015

Supplemental Figure 4. MYB61 Is Required for Cellulose Synthesis.
(A) qRT-PCR analysis of the expression levels of R2R3-type MYBs in the internodes from
the control (–GA) and 6-hrs10 μM GA3 treated (+GA) wild-type plants.
(B) The three month-old wild type and MYB61 overexpressing (MYB61 Ox) plants. The
images inserted at the right bottom show an upward curved leaf. Bar = 15 cm.
(C) qRT-PCR examination of the expression of MYB61 and MYB61-like (MYB61L) gene in
MYB61 Ox. TP1 was used as the internal control in (A) and (C). Error bars in (A) and (C)
indicate the SD of three biological repeats.
(D) Observation of sclerenchyma cell walls in the internodes from the three month-old wild-
type and MYB61 Ox plants via transmission electron microscope. Bar = 2 μm.
(E) and (F) Enlargement and quantification of thickness of sclerenchyma cell wall examined
in (D). Error bars, SE (n = 30). *p < 0.01 determined by Student's t test. Bar = 1μm.
(G) Western blot of three secondary wall CESAs in wild type and MYB61 Ox with their
specific antibodies. ARF1 probed with anti-ARF1 antibody was used as a loading control.
A
G
Rel
ativ
e ex
pres
sion
leve
l
02468
101214161820
WT L1 L2
MYB61MYB61L
MYB61 Ox
WT MYB61 Ox
MYB61 OxWT
Anti-CESA4
Anti-CESA7
Anti-CESA9
Anti-ARF1
L1 L2
Rel
ativ
e ex
pres
sion
leve
l
0
1
2
3
4
5
6
–GA +GA
MYB61
MYB61L
MYB58
MYB103
CB
E F
0
0.2
0.4
0.6
0.8
1.0
1.2
1.4
WT MYB61Ox
Thic
knes
s of
SC
wal
l (µm
)
**
MYB61 Ox
WT
D
MYB61 Ox
WT
Supplemental Data. Huang et al. Plant Cell (2015) 10.1105/tpc.15.00015

Supplemental Figure 5. NAC29 and NAC31 Bind to the SNBE Motif in the MYB61 Promoter.
(A) Diagram of MYB61 showing two SNBE elements within the 2-kb MYB61 promoter region.
Blue boxes indicate the SNBE elements. The DNA sequences containing a core motif of
SNBEs (the underlined green bases) were subjected to the EMSA assay. Red letters indicate
the mutated bases.
(B) and (C) EMSA assay showing that the recombinant NAC29 and NAC31 proteins directly
bound to the biotin-labeled SNBE2; but did not bind to SNBE1 (B) and point-mutated SNBE2
(C).
SNBE1–– –
++ –
SNBE2–– –
++–
SNBE1GST
TF–– –
++ –
SNBE2–– –
++–
probe
GST-NAC29 GST-NAC31
Free probes
TF
GSTTF
probeTF
Free probes
B
A
5'-TCCTTTACTTTTAACTGGCTTGTGCAAAAAGTAACATACCTGATATGTA-3'SNBE2
MYB61
-1000-2000 ATG
SNBE 1SNBE 25'-TTACCTGTGTAGGTGTTGTGTGCTGTGGAAGTTTCTTGGGAGGGCAAGC-3'SNBE1
5’-TCCTTTACTTTTAACTGGCTCGTGCAAAAAGTAACATACCTGATATGTA-3’
5’-TCCTTTACTTTTAACTGGCTTGTGCAAAGAGTAACATACCTGATATGTA-3’
SNBE2m1
SNBE2m2
C
SNBE2
GST-NAC29
m1 m2 +
GST-NAC31
m1 m2++TF
+– – + + ++++
Free probes
Supplemental Data. Huang et al. Plant Cell (2015) 10.1105/tpc.15.00015
5’-CCTCACCTCGCGCACGAACCGCCCGTTCGCTAGT-3’
CESA7p P1
MBPCompetitor
MBP-MYB61 + + +– –– – – –+– – – + ++
+ +– –– – – –– – – + ++
CESA9p P1+
+
P1
-1500 0-1000CESA7 promoter
P2
-1000-1500 0
P2 P1
CESA9 promoter
Effector
Reporter
F
D
0
10
CESA4 CESA7 CESA9
MockMYB61
Rel
ativ
e lu
cife
rase
act
ivity
5
15
E
G
MBP-MYB61P1 P2 P3 P4
5’-CCTCACCTCGCGCACCAACCGCCCGTTCGCTAGT-3’GAMYB
GAMYBm
– + – + – + – +
CESA4 promoter-1000
P1P2P3P4
0
A
B
Rel
ativ
e lu
cife
rase
ac
tivity
01
2
3
4
Mock MYB61MYB61-GFP DAPI Merge DIC
C
ReporterEffector
CESA4p P4
++
MBP-MYB61MBP
–+ –
–
–
–––
+ –+
+ –+
Free probes
Competitor
NOS ter35S mini proGal4BD MYB61
CaMV 35S proLUC
NOS ter35S mini pro5X GAL4 UAS
LUC
CESA4/7/9 pro NOS ter35S mini pro
NOS ter
MYB61
CaMV 35S pro 35S mini pro
Supplemental Data. Huang et al. Plant Cell (2015) 10.1105/tpc.15.00015

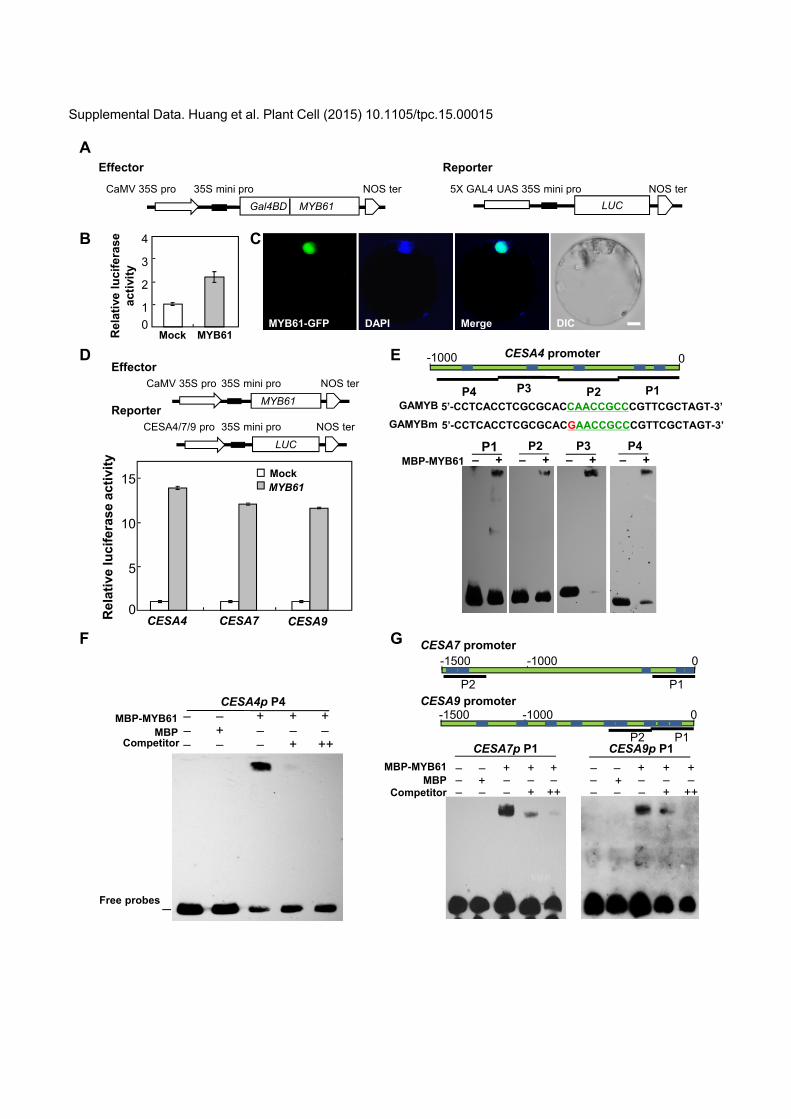
Supplemental Figure 6. MYB61 Regulates Secondary Wall CESA Transcription.
(A) Diagrams of the constructs used for transactivation assay.
(B) Luciferase activities in the rice protoplasts cotransfected with the constructs in (A).
(C) Subcellular localization pattern of MYB61 by transfecting the rice protoplasts with
GFP tagged MYB61. The nuclei were counterstained with DAPI. Merge, merged images
of GFP and DAPI. Bars = 5 μm.
(D) Luciferase activities in the protoplasts cotransfected with constructs shown above.
The transactivation activity was monitored by assaying the luciferase activity in the
protoplasts, with those transfected with an empty effector construct defined as 1.
(E) The 1-kb CESA4 promoter was divided into four fragments and subjected to EMSA
showing that all the four fragments were bound by MBP-MYB61.
(F) EMSA assay showing the direct binding between MYB61 and the biotin-labelled P4
fragment of CESA4. Unlabeled P4 fragments ([10 (+) and 50 (++) fold]) was applied for
binding competition.
(G) The 1.5-kb CESA7 and CESA9 promoter fragments (P1 and P2) were subjected to
EMSA, showing that the increasing unlabeled DNA fragments ([10 (+) and 50 (++) fold])
competed for the binding to fragment P1of CESA7 and CESA9. Blue boxes in (E) and
(G) indicate the GAMYB elements (the underlined green bases). The mutated base in
GAMYB (GAMYBm) is indicated by a red letter.
Error bars in this figure indicate the SD of three biological repeats.
Supplemental Data. Huang et al. Plant Cell (2015) 10.1105/tpc.15.00015

Supplemental Figure 7. Development of Rice Internodes Involves Secondary Wall Accumulation.
(A) A nine-centimetre internode was evenly divided into nine sections. Bar = 1 cm.
(B) Fresh hand cut cross-sections of the segments circled in (A). Bars = 0.1 cm.
1 2 3
4 5 6
7 8 9A
1
B
2
3
4
5
6
7
9
8
Supplemental Data. Huang et al. Plant Cell (2015) 10.1105/tpc.15.00015

Supplemental Figure 8. Impacts of GA on Cellulose Biosynthesis in Arabidopsis and
Poplar and Saccharification Assay of Cell Wall Residues of Transgenic Rice Plants.
(A) and (B) qRT-PCR analyses of the expression levels of secondary wall hierarchical TFs
in the control (–GA) and 6-hrs GA-treated (+GA) Arabidopsis, including R2R3-type MYBs
and NACs (A), and the secondary wall CESAs in the 9-hrs GA-treated poplar (B). Error
bars, the SD of three biological replicates. At-UBQ10 and Pto-Actin were used as internal
controls, respectively.
(C) Saccharification of destarched AIR from the internodes of wild type and transgenic rice
plants using an enzyme cocktail of cellulase and β-glucosidase, revealing releasing more
sugars from the internodes of TF-overexpression plants; but releasing fewer sugars from
the internodes of plants overexpressing MYB61-SRDX. Error bars, the SD of four biological
replicates. *, Significant difference between the wild-type and transgenic plants (p < 0.01).
C
Free
sug
ar y
ield
(%A
IR)
0
10
20
30
40
50
60
70
0 3 12 24Enzyme treatment (h)
WT (Zhonghua-11)NAC29 Ox L1NAC29 Ox L2NAC31 Ox L1NAC31 Ox L2MYB61 Ox L1MYB61 Ox L2WT (Nipponbare)MYB61-SRDX L1MYB61-SRDX L2MYB61-SRDX L3
Enzyme treatment (h)
Free
sug
ar y
ield
(%A
IR)
* *
0102030405060708090
0 3 12 24
* **
80
A
Rel
ativ
e ex
pres
sion
leve
l
0
1
2
3
4
5
6
7
8
–GA +GA
SND1VND7At-MYB46
At-MYB83At-MYB61
B
Rel
ativ
e ex
pres
sion
leve
l
0
1
2
3
4
5
6
–GA +GA
Pto-CESA1Pto-CESA2Pto-CESA17
Supplemental Data. Huang et al. Plant Cell (2015) 10.1105/tpc.15.00015

1
Supplemental Data. Huang et al. Plant Cell (2015) 10.1105/tpc.15.00015
Supplemental Table 1. List of the TFs Coexpressed with Secondary Wall CESAs in Rice.
TF type Gene Gene ID OsCESA41 OsCESA71 OsCESA91
R2R3-
type
MYBs
MYB61 Os01g18240 0.7605 0.7778 0.7169
MYB103 Os08g05520 0.7327 0.7142 0.7633
MYB86L Os01g36460 0.7337 0.7192 0.7010
MYB61L Os05g04820 0.7023 0.7153 0.6624
MYB58 Os02g46780 0.6695 0.6947 0.6691
SW
NACs
NAC62 Os05g48850 0.8475 0.8292 0.8404
NAC73 Os01g48130 0.7583 0.7616 0.7773
NAC7 Os06g04090 0.7583 0.7368 0.7482
NAC29 Os08g02300 0.6208 0.6169 0.6054
NAC3 Os01g09550 0.6172 0.6319 0.6537
Co-expression analysis of secondary wall CESAs with TF candidates in cell wall synthesis was
performed using the expressing database at http://www.ricearray.org and http://genecat.mpg.de/.
1, The Pearson correlation coefficient (PCC). The PCC of coexpressed R2R3-type MYBs and
NACs was set above 0.65 and 0.60, respectively.

2
Supplemental Data. Huang et al. Plant Cell (2015) 10.1105/tpc.15.00015
Supplemental Table 2. Composition Analysis of Sugar and Lignin Content of Wall Residues
of the Internodes from Wild Type and Transgenic Rice Plants.
Residues Rhamnose Fucose Arabinose Xylose Mannose Galactose Glucose Lignin
Wild type (Zhonghua11)
0.8±0.1 0.8±0.0 24.2±0.7 240.2±4.4 1.2±0.1 8.5±0.1 65.1±1.1 131.0±2.3
NAC29 Ox-L1 1.6±0.0 0.8±0.0 28.6±0.7 222.3±2.9 1.1±0.1 11.1±0.3* 71.3±1.0 122.3±1.1
NAC29 Ox-L2 1.4±0.1 0.8±0.0 27.6±0.7 228.1±1.2 1.2±0.1 10.7±0.2* 65.1±1.4 131.1±4.5
NAC31 Ox-L1 1.5±0.0 0.7±0.0 26.4±0.6 268.4±4.4 1.0±0.1 10.6±0.2* 55.2±1.3 130.6±3.8
NAC31 Ox-L2 1.6±0.0 0.8±0.0 27.1±0.8 244.4±5.1 1.1±0.1 11.9±0.5* 62.0±2.2 125.2±3.7
MYB61 Ox-L1 2.3±0.0 0.9±0.0 34.3±2.9* 226.0±2.9 1.4±0.1 17.0±0.9* 70.1±4.8 132.6±8.9
MYB61 Ox-L2 3.2±0.8 1.1±0.2 38.7±5.9* 224.7±7.8 1.8±0.3 22.5±0.4* 70.7±6.4 124.6±5.1
Wild type (Nipponbare)
2.4±0.0 1.0±0.0 42.9±1.6 319.9±10.8 1.4±0.0 15.5±0.6 71.8±5.7 122.7±1.9
MYB61-SRDX-L1 2.4±0.0 1.0±0.0 32.2±2.0* 293.3±20.2 2.5±0.1 9.9±0.4* 69.6±1.3 124.7±4.8
MYB61-SRDX-L2 2.2±0.0 1.0±0.0 34.9±2.9* 302.1±14.9 2.0±0.1 10.5±0.7* 66.2±3.4 125.6±3.7
The alcohol insoluble residues (AIRs) were obtained as described in Methods. The amounts of sugars were
determined by GC-MS analysis of alditol acetate derivatives and are shown as the mean value ± SD (μg mg-1 AIR).
*Significant difference (t test at P < 0.05) with respect to wild-type plants (n=4) ± SD.

3
Supplemental Data. Huang et al. Plant Cell (2015) 10.1105/tpc.15.00015
Supplemental Table 3. Identifying GAMYB Motif in the Promoter Region of CESA Genes
in the Rice, Arabidopsis, and Poplar Genomes.
Gene Locus Type Number Sequence Position1 Os-CESA4 LOC_Os01g54620.1 SCW 7 CAACCAAT; CAACCGCC;
CAACCTTG; CAACCCCA; CAACCTCC; CAACCAAA; CAACCATA
-142; -214; -269; -484; -753; -1094; -1379
Os-CESA7 LOC_Os10g32980.1 SCW 6 CAACCATC; CAACCATA; CAACCCAC; CAACCAGC; CAACCATC; CAACCGTG
-69; -131; -377; -1350; -1478; -1663
Os-CESA9 LOC_Os09g25490.1 SCW 11 CAACCTAC, CAACCATG, CAACCCCT, CAACCAAC, CAACCCGC, CAACCACT, CAACCACA, CAACCGAA, CAACCACT, CAACCGAT, CAACCCGC
-239; -243; -285; -432; -452; -604; -854; -1018; -1046; -1245; -1875
Os-CESA1 LOC_Os05g08370.1 PCW 3 CAACCGCC, CAACCTTG, CAACCCGA
-234; -1006; -1726
Os-CESA2 LOC_Os03g59340.1 PCW 7 CAACCGCG, CAACCCAA, CAACCTCA, CAACCCAA, CAACCATC, CAACCGCT, CAACCAAG
-348; -412; -417; -633; -1135; -1371; -1827
Os-CESA3 LOC_Os07g24190.1 PCW 6 CAACCGAT, CAACCCTG, CAACCCTA, CAACCGTT, CAACCAGA, CAACCACG
-30; -96; -452; -704; -1878; -1923
Os-CESA5 LOC_Os03g62090.1 PCW 2 CAACCTTT, CAACCAAA -1045; -1202Os-CESA6 LOC_Os07g14850.1 PCW 5 CAACCCCT, CAACCTTT,
CAACCCCC, CAACCCCC, CAACCACC
-125; -286; -360; -448; -1359
Os-CESA8 LOC_Os07g10770.1 PCW 1 CAACCACT -1698 Os-CESA10 LOC_Os12g29300.1 PCW 5 CAACCTTG, CAACCTAA,
CAACCATG, CAACCACT, CAACCAGT
-381; -1249; -1349; -1385; -1536
At-CESA4 AT5G44030.1 SCW 6 CAACCATT, CAACCTCA, CAACCGTT, CAACCATA, CAACCAAC, CAACCAGA
-136; -723; -1065; -1124; -1857; -1880
At-CESA7 AT5G17420.1 SCW 2 CAACCATG, CAACCGCT -792; -1631 At-CESA8 AT4G18780.1 SCW 1 CAACCCTT -1035 At-CESA1 AT4G32410.1 PCW 1 CAACCGGC -1413 At-CESA2 AT4G39350.1 PCW 2 CAACCAAA, CAACCAAA -1122; -1320At-CESA3 AT5G05170.1 PCW 4 CAACCAAA, CAACCCTA,
CAACCACC, CAACCAAG -374; -385; -1466; -1937
At-CESA5 AT5G09870.1 PCW 4 CAACCGAG, CAACCTGT, CAACCCAA, CAACCGGG
-73; -87; -94; -1837

4
At-CESA6 AT5G64740.1 PCW 1 CAACCTTT -281 At-CESA9 AT2G21770.1 PCW 3 CAACCGTA, CAACCGTC,
CAACCTAA -112; -1310; -1714
At-CESA10 AT2G25540.1 PCW 1 CAACCCAT -902 Pto-CESA1 Potri.002G257900.1 SCW 5 CAACCCCT, CAACCACT,
CAACCACC, CAACCAAG, CAACCCCA
-92; -790; -991; -1829; -1966
Pto-CESA2 Potri.018G103900.1 SCW 7 CAACCAAC, CAACCGCC, CAACCTCT, CAACCGGT, CAACCCCT, CAACCCTT, CAACCACC
-34; -152; -200; -941; -1045; -1746; -1818
Pto-CESA3 Potri.011G069600.1 SCW 6 CAACCAGA, CAACCGCC, CAACCTCA, CAACCCTC, CAACCAAG, CAACCTGT
-134; -182; -188; -205; -573; -1208
Pto-CESA10 Potri.006G181900.1 SCW 3 CAACCAAC, CAACCCAG, CAACCGGT
-31; -147; -1654
Pto-CESA17 Potri.004G059600.1 SCW 7 CAACCCAC, CAACCAGA, CAACCGCC, CAACCCAC, CAACCTTC, CAACCTTT, CAACCTTA
-185; -199; -216; -590; -1303; -1899; -1975
Pto-CESA4 Potri.005G087500.1 PCW 2 CAACCTGA, CAACCTTT -1651; -1886Pto-CESA5 Potri.001G266400.1 PCW 3 CAACCATA,
CAACCCGA,CAACCTCT -136; -1222; -1951
Pto-CESA6 Potri.013G019800.1 PCW 4 CAACCTCT, CAACCACA, CAACCACT, CAACCAAA
-54; -936; -989; -1867
Pto-CESA7 Potri.006G251900.1 PCW 1 CAACCATA -1751 Pto-CESA8 Potri.009G060800.1 PCW 5 CAACCACA, CAACCGTG,
CAACCGTC, CAACCTCT, CAACCTCA
-122; -134; -1018; -1481; -1719
Pto-CESA9 Potri.018G029400.1 PCW 2 CAACCAAT, CAACCGGT -341; -684 Pto-CESA11 Potri.002G066600.1 PCW 3 CAACCAGA, CAACCAGC,
CAACCACT -1172; -1719; -1770
Pto-CESA12 Potri.005G194200.1 PCW 5 CAACCACA, CAACCGAC, CAACCAGT, CAACCAGC, CAACCCAT
-331; -382; -599; -1518; -1613
Pto-CESA13 Potri.007G076500.1 PCW 1 CAACCACA -1936 Pto-CESA14 Potri.005G027600.1 PCW 1 CAACCTAG -717 Pto-CESA15 Potri.006G052600.1 PCW 1 CAACCCTC -76 Pto-CESA16 Potri.016G054900.1 PCW 4 CAACCTTG, CAACCAAT,
CAACCATG, CAACCAAA -265; -448; -556; -972
Two-kb promoter of CESAs from rice, Arabidopsis, and polar were used for identifying GAMYB
motif (CAACCNNN). PCW, primary cell wall; SCW, secondary cell wall. 1 The position of GAMYB motifs, which is not one-to-one correspondence with the order of motifs
shown in the sequence column.

5
Supplemental Data. Huang et al. Plant Cell (2015) 10.1105/tpc.15.00015
Supplemental Table 4. The Primers Used for Generation of Transgenic Rice Plants and
Relevant Analyses in This Study.
Construct Primer sequence (5’-3’)
NAC29 Ox Forward CGGGATCCGCCACCATGAGCATCTCGGTGAA
Reverse GACTAGTCTTACAGTGCCACGTGGCT
NAC31 Ox Forward CGGGATCCGCCACCATGGATCGGCATGAGGAGGA
Reverse GGGGTACCCTCAGTCTCGGTCATCGATGAA
MYB61 Ox Forward CGGGATCCGCCACCATGGGGAGACATTCCTGCTGCTACA
Reverse GGGGTACCCCTAGATATTCTCAAAAGACAAGGACA
MYB61-SRDX Forward TCGACGGGCCCCTCGATCTGGATCTAGAACTCCGTTTGGGTTTCGCTTAAGGTAC
Reverse CTTAAGCGAAACCCAAACGGAGTTCTAGATCCAGATCGAGGGGCCCG
GST-NAC29 Forward GGGGACAAGTTTGTACAAAAAAGCAGGCTTAATGAGCATCTCGGTGAAC
Reverse GGGGACCACTTTGTACAAGAAAGCTGGGTACAGTGCCACGTGGCTGAGACGCTC
GST-NAC31 Forward GGGGACAAGTTTGTACAAAAAAGCAGGCTTAATGGATCGGCATGAGGAG
Reverse GGGGACCACTTTGTACAAGAAAGCTGGGTAGTCTCGGTCATCGATGAA
MBP-MYB61 Forward GGGGACAAGTTTGTACAAAAAAGCAGGCTTAATGGGGAGACATTCCTGC
Reverse GGGGACCACTTTGTACAAGAAAGCTGGGTAGATATTCTCAAAAGACAA
FLAG-SLR1 Forward GGGGACAAGTTTGTACAAAAAAGCAGGCTTAATGAAGCGCGAGTACCAA
Reverse GGGGACCACTTTGTACAAGAAAGCTGGGTACGCCGCGGCGACGCGCCATG
NAC29-BD Forward GGGGACAAGTTTGTACAAAAAAGCAGGCTTAATGAGCATCTCGGTGAAC Reverse GGGGACCACTTTGTACAAGAAAGCTGGGTAGAGGCGGTACTCGTGCAT
NAC31-BD Forward GGGGACAAGTTTGTACAAAAAAGCAGGCTTAATGGATCGGCATGAGGAG
Reverse GGGGACCACTTTGTACAAGAAAGCTGGGTAGAGGCGGTACTCGTGGAT
SLR1-N Forward GGGGACAAGTTTGTACAAAAAAGCAGGCTTAATGAAGCGCGAGTACCAA
Reverse GGGGACCACTTTGTACAAGAAAGCTGGGTACTCCTGCGTGTCAACCAC
SLR1-C Forward GGGGACAAGTTTGTACAAAAAAGCAGGCTTAGCTGGGATCCGGCTGGTG
Reverse GGGGACCACTTTGTACAAGAAAGCTGGGTACGCCGCGGCGACGCGCCATG
RGA-Luc Forward GGGGACAAGTTTGTACAAAAAAGCAGGCTTAATGAAGAGAGATCATCACC
Reverse GGGGACCACTTTGTACAAGAAAGCTGGGTAGTACGCCGCCGTCGAGAGTTTC
SND1-Luc Forward GGGGACAAGTTTGTACAAAAAAGCAGGCTTAATGGCTGATAATAAGGTCAAT
Reverse GGGGACCACTTTGTACAAGAAAGCTGGGTATACAGATAAATGAAGAAGTGG
CESA4-promoter Forward CCCAAGCTTAATACACAGCAAAATCGGCA
Reverse GGGGTACCGGCTCACCCCCCTCTCCTCTCC
CESA7-promoter Forward CCCAAGCTTGAGCTCTCTGTTCATCAAATTTGTCCA
Reverse GGGGTACCGGTGAGGTGCCGGGGAAGCGA

6
CESA9-promoter Forward CGAGCTCGACGCTTATACAATGCGCAT
Reverse GGGGTACCGGCCGCGCAACAACGGCCGG
MYB61-promoter Forward CGAGCTCCGCTCGAGTAAAGAAAAACA
Reverse GGGGTACCTGAATCAATGCAGAAACTGAA

7
Supplemental Data. Huang et al. Plant Cell (2015) 10.1105/tpc.15.00015
Supplemental Table 5. qRT-PCR and ChIP-PCR Primers Used in This Study.
Genes Forward primer sequence (5’-3’) Reverse primer sequence (5’-3’)
Os-CESA4 CTCCGAGACCACCACCACCAAC ACCCATCGTCTTCGTCGCATTAG
Os-CESA7 AAGCCATGCGGGGTCTCGTG CATCCATCCGGTCATCCCTCTTG
Os-CESA9 AGCGATTTCTGAAGATTTGT AACATAGCACGAACTCAAC
Os-XTH8 CTCCTTCTACCTCTCCTC GGATTCCAGATGATCTTGTA
Os-PIL1 AAGGCAGAGAAGATTCAG GCAATGAGGTATGAGTTCT
Os-MYB61 ATATCTTGAGCCACTTGT ATCCTCTTGGTGATTCAG
Os-MYB61L AGACAGCACAATCATCAA GGTCAAGAAACAACTCCT
Os-MYB103 CAAAGTGGTGCTCATTCC CAAGATCAGATCAGAGATGG
Os-MYB58 GTAGTAGAGACACAACAC ATATAGCACTTCTCATTGG
Os-NAC29 GCTGCTCCACCACCACCAC GAGTAGTAGGCGAGGCCGT
Os-NAC31 CTGAGTTCAGAGTCCAAG TGACGAAGAAATGTTGTTG
SLR1 GACGTCAACGAACGCTCAATT CGGAGTCCAGTCGTCGATCT
Os-TP1 TAACTGGTGCGAACTGCAAG CGGAGTTGATGATGTCGATG
Os-HNR GGCAGGTTCTGCAGTGGTAT TAAGGTCGGTATCGCCAATC
Os-Actin1 CTTCATAGGAATGGAAGCTGCGGGTA CGACCACCTTGATCTTCATGCTGCTA
Os-eEF1a TTTCACTCTTGGTGTGAAGCAGAT GACTTCCTTCACGATTTCATCGTAA
At-CESA4 GAGTGATGATAAAACGATGAGCAG TCTCAAAATTCTTCTGCGACATTA
At-CESA7 ATGGGTAGACAGAACAGAACACCAA CTTCAGCAGTTGATGCCACACTT
At-CESA8 CACTTCTTTGCCTCTTGTTGCTTAC GAAGCTCGAGGACACTCGTTAAGAT
At-MYB46 GAATGTGAAGAAGGTGATTGGTACA CGAAGGAACCTCAGTGTTCATCA
At-MYB83 CGCTTCTTCAATGTCGAGTTCCA CCATTCTTGGTAACAGGTGGTCTC
At-MYB61 TGTGTTTGGGTCAATGCCTCTTT TCCTTGGAAACAGATGGTCACAG
VND7 GGACGAATAAAGATCAGAACGA ATGCGGATGTATGACTTGTGTC
SND1 TCCTCTTGAATATCCCAAGGCTCA CCCACCGAAGAAGAACTTCTCCAT
At-UBQ10 AACTTTGGTGGTTTGTGTTTTGG TCGACTTGTCATTAGAAAGAAAGAGATAA
Pto-Actin AAACTGTAATGGTCCTCCCTCCG GCATCATCACAATCACTCTCCGA
Pto-CESA1 GAGTTGGAGAAATCATCA GAGAGTTAGTTCCTTCAG
Pto-CESA2 AACCACTGCAACCATCTCA ATGTTCCATGACAGCTCAGG
Pto-CESA17 AAGGACCAAGCAAACATT AAGTGGATGTAACGGTAAG
Os-Actin1(intron) TGGCATCTCTCAGCACATTC GGCAAGCAACATTGTAAGCA

8
Os-CESA4 ChIP CTTCCATTCTTTCCATCC TGGTGATATAGCCATAGC
Os-CESA7 ChIP TTGAGATTTGAGCATTACCT ATTTCTTGCCAATGTTTACC
Os-CESA9 ChIP ATCAACTGGAGAGGACTT TTGGTGAGTGGTAGTAGT