
Strategic%20 innovation%20new%20game%20strategies%20for%20competitive%20advantage
503
-
Upload
mitesh-take -
Category
Design
-
view
77 -
download
0
Transcript of Strategic%20 innovation%20new%20game%20strategies%20for%20competitive%20advantage

Strategic Innovation
In today’s fast-changing business environment, those firms that want to remaincompetitive must also be innovative. Innovation is not simply developing newtechnologies into new products or services, but in many cases finding newmodels for doing business in the face of change. It often entails changing therules of the game.
From the late 1990s to today, the dominant themes in the strategy literaturehave been strategic innovation, the impact of information and communicationstechnologies on commerce, and globalization. The primary issues have beenand continue to be how to gain a competitive advantage through strategicinnovation using new game strategies, and how to compete in a world withrapid technological change and increasing globalization. Strategic Innovationdemonstrates to students how to create and appropriate value using these “newgame” strategies. Beginning with a summary of the major strategic frameworksshowing the origins of strategic innovation, Afuah gives a thorough examin-ation of contemporary strategy from an innovation standpoint with several keyadvantages:
• Focus on developing strategy in the face of change.• A wealth of quantitative examples of successful strategies, as well as
descriptive cases.• Emphasis on the analysis of strategy, not just descriptions of strategies.• A detailed, change-inclusive framework for assessing the profitability
potential of a strategy or product, the AVAC (activities, value, appropri-ability, and change) model.
• Emphasis on the aspects of strategy that can be linked to the determinantsof profitability.
• Consideration of how both for-profit and non-profit organizations canbenefit from new game strategies.
Allan Afuah is Associate Professor of Strategy and International Business at theStephen M. Ross School of Business, University of Michigan.


Strategic Innovation
New Game Strategies forCompetitive Advantage
Allan Afuah
Stephen M. Ross School of Business
University of Michigan

First published 2009by Routledge270 Madison Ave, New York, NY 10016
Simultaneously published in the UKby Routledge2 Park Square, Milton Park, Abingdon, Oxon OX14 4RN
Routledge is an imprint of the Taylor & Francis Group,an informa business
© 2009 Allan Afuah
All rights reserved. No part of this book may be reprinted orreproduced or utilized in any form or by any electronic, mechanicalor other means, now known or hereafter invented, includingphotocopying and recording, or in any information storage orretrieval system, without permission in writing from the publishers.
Trademark Notice: Product or corporate names may betrademarks or registered trademarks, and are used only foridentification and explanation without intent to infringe.
Library of Congress Cataloging-in-Publication DataAfuah, Allan.Strategic innovation: new game strategies for competitiveadvantage / by Allan Afuah.
p. cm.Includes index.1. Strategic planning. 2. Originality. 3. Resourcefulness.4. Technological innovations. 5. Competition. I. Title.HD30.28.A3473 2009658.4′063—dc222008034812
ISBN10: 0–415–99781–X (hbk)ISBN10: 0–415–99782–8 (pbk)ISBN10: 0–203–88324–1 (ebk)
ISBN13: 978–0–415–99781–2 (hbk)ISBN13: 978–0–415–99782–9 (pbk)ISBN13: 978–0–203–88324–2 (ebk)
This edition published in the Taylor & Francis e-Library, 2009.
“To purchase your own copy of this or any of Taylor & Francis or Routledge’scollection of thousands of eBooks please go to www.eBookstore.tandf.co.uk.”
ISBN 0-203-88324-1 Master e-book ISBN

To my grandmother, Veronica Masang-Namang Nkweta, and theBamboutos highlands which she tilled to feed me.
To every family that has been kind enough to welcome a foreignstudent to its home.


Contents
List of Figures ixList of Tables xiList of Exhibits for Cases xiiiPreface xvAcknowledgments xix
PART IIntroduction 1
1 Introduction and Overview 3
2 Assessing the Profitability Potential of a Strategy 35
3 The Long Tail and New Games 67
PART IIStrengths and Weaknesses 89
4 Creating and Appropriating Value Using New GameStrategies 91
5 Resources and Capabilities in the Face of New Games 117
6 First-mover Advantages/Disadvantages andCompetitors’ Handicaps 145
7 Implementing New Game Strategies 178
PART IIIOpportunities and Threats 197
8 Disruptive Technologies as New Games 199
9 Globalization and New Games 223
10 New Game Environments and the Role of Governments 252
11 Coopetition and Game Theory 275

PART IVApplications 301
12 Entering a New Business Using New Games 303
13 Strategy Frameworks and Measures 323
PART VCases 371
Case 1 The New World Invades France’s Terroir 373
Case 2 Sephora Takes on America 377
Case 3 Netflix: Responding to Blockbuster, Again 383
Case 4 Threadless in Chicago 391
Case 5 Pixar Changes the Rules of the Game 393
Case 6 Lipitor: The World’s Best-selling Drug (2008) 401
Case 7 New Belgium: Brewing a New Game 405
Case 8 Botox: How Long Would the Smile Last? 411
Case 9 IKEA Lands in the New World 417
Case 10 Esperion: Drano for Your Arteries? 422
Case 11 Xbox 360: Will the Second Time be Better? 434
Case 12 Nintendo Wii: A Game-changing Move 442
Notes 447Author Index 469Subject Index 473
viii Contents

Figures
1.1 Business System and Options for New Games 81.2 Components of a New Game Strategy 181.3 Types of New Game 241.4 Flow of the Book 302.1 Components of an AVAC Analysis 392.2 Drivers of the Components of an AVAC Analysis 413.1 A Long Tail Distribution 683.2 Impact of the Internet on a Long Tail Distribution 713.3 Value System of Long Tail Potential Coopetitors 714.1 Value Creation and Appropriation 924.2 A Book Value Chain 984.3 New Game Activities and Value Creation and Capture 1105.1 The Role of Complementary Assets 1255.2 Strategies for Exploiting Complementary Assets 1266.1 Types of Player 1636.2 Different New Game Product Strategies 1676.3 Player Types in Different Countries 1676.4 A Firm’s Evolution from Explorer to Exploiter 1687.1 Strategy, Structure, Systems, People, and
Environment (S3PE) Framework 1797.2 What Should a Firm Do? 1868.1 S-curves Showing Physical Limits of Technologies 2018.2 PC versus Mainframes and Minicomputers 2048.3 Disruptive Technologies and Value Creation and
Appropriation 2118.4 Disruptiveness of Disruptive Technologies 2198.5 Examples of Degrees of Disruptiveness 2199.1 Who Appropriates How Much from Nigerian Oil? 2289.2 Effect of Taxes on Value Appropriation 2299.3 Effect of Subsidies on Value Appropriation 2309.4 Who Appropriates More Value than It Creates? 2319.5 Types of Multinational 2339.6 Different Global Strategies 239
10.1 The Macroenvironment 25310.2 Determinants of Environments that are Conducive to
Profitable New Games 25710.3 A PESTN Analysis 271

11.1 A Payoff Matrix 27711.2 Dominant Strategy 27811.3 Nash Equilibrium 27911.4 Prisoner’s Dilemma 28111.5 A Sequential Game 28211.6 Players in a Value Creation and Appropriation Game 29011.7 For Question 1 30013.1 SWOT Framework 32613.2 Elements of a PESTN Framework 32913.3 BCG’s Growth/Share Matrix 33113.4 Illustration of Growth/Share Matrix 33313.5 GE/McKinsey Matrix 33513.6 Porter’s Five Competitive Forces 33713.7 Components of Porter’s Five Forces 33913.8 Business System for a Technology Firm 34413.9 An Automobile Maker’s Business System 34513.10 A Generic Value Chain 34613.11 A Value System 34713.12 A Value Network 34913.13 A Value Shop 35013.14 Elements of the Balanced Scorecard 35113.15 Elements of the S3PE 35813.16 Elements of the 4Ps 35913.17 Components of an AVAC Framework 362
x Figures

Tables
1.1 Competitive Consequences of New Game Strategy 191.2 Costs, Retail, and Wholesale Prices 211.3 Forecasted Console and Games Sales 211.4 Estimates of the Profitability of Three Different Strategies 222.1 Applications of AVAC Analysis 522.2 Selected Financials 542.3 Customer Service for Year Ending March 2005 552.4 Industry Leading Margins for Year Ending March 2005 552.5 Back-of-the-envelope Estimates of the Contribution
of Some Activities to Low Cost and Revenues 583.1 The Activities Component of an iTunes AVAC Analysis 813.2 The Value Component of an iTunes AVAC Analysis 823.3 The Appropriability Component of an iTunes AVAC
Analysis 833.4 The Change Component of an iTunes AVAC Analysis 853.5 Strategic Consequences of an AVAC analysis of
Apple’s iTunes Activities 864.1 Some Estimated Costs for the iPhone in 2007 994.2 October 2005 Top 8 Most Expensive Components/
Inputs of a 30GB iPod 1165.1 Rank Ordering Resources/Capabilities by
Competitive Consequence 1295.2 Strategic Consequence for Google’s Search Engine
Capabilities 1355.3 Rank Ordering Complementary Assets 1365.4 Is a Strength from a Previous Game a Strength or
Handicap in a New Game? 1375.5 Sample Values of Intangible Resources (all numbers,
except rations, in $ billion) 1406.1 First-mover Advantages (FMAs) 1466.2 Rank Ordering First-mover Advantages 1586.3 Lipitor’s Projected Sales 1736.4 NPVs for the Different Revenue Flows 1737.1 Is an S2P Component from a Previous Game a
Strength or Handicap in a New Game? 1918.1 The New Replacing the Old: A Partial List 2008.2 The Disrupted and Disruptors? 205

8.3 To What Extent is Technological Change Disruptiveto an Established Technology? 207
8.4 Are Previous Strengths Still Strengths or Have theyBecome Handicaps in the Face of a Disruptive Technology? 211
9.1 June 2007 OECD Gasoline Prices and Taxes 2259.2 Oil Joint Ventures in Nigeria 2259.3 What Each Player Gets 2269.4 How Much Does each OECD Member Appropriate
from a Gallon of Gasoline? 2279.5 What Each Player Appropriates 251
11.1 A Mapping of Coalitions into Value Created 28811.2 Coalitions (submarkets) and Value Created 29211.3 Value Added and Guaranteed Minimum 29312.1 Type of New Game to Pursue When Entering a New
Business 31913.1 Elements of a VIDE Analysis 35513.2 Strategic Management Frameworks: A Comparison 36513.3 Summary of Some Financial Measures 368
xii Tables

Exhibits for Cases
1.1 Hierarchy of French Wines 3741.2 World Wine Exports in 1999 and 2007 3762.1 Comparison of Industry Competitors in 2007 3813.1 Summary of Netflix’s Income Statements
($US millions, except where indicated) 3853.2 Summary of Netflix’s Movie Rental Plans 3863.3 Summary of Blockbuster’s Income Statements
($US millions, except where indicated) 3883.4 Summary of Blockbuster Total Access Movie Rental Plans 3885.1 An Animation Movie Value Chain 3955.2 Pixar Full-length Animation Movies 3995.3 Top 12 Grossing Animation Movies 4005.4 Competing Animation Movies 4006.1 US Market Shares of Cholesterol-lowering Drugs,
January 1997 4026.2 The Drug Development Process in the USA 4036.3 Statin Average Prescription Pricing Structure 4046.4 1997 Lipitor Worldwide Sales Projections 4047.1 Average Cost of Goods Sold for United States Brewery 4057.2 Cost Implications of Generator Purchase 4088.1 2008 Plastic Surgery Fees 4138.2 Allergan’s Product Areas 4158.3 Allergan’s Products in 2008 4159.1 IKEA Sales 4179.2 Purchasing 4199.3 Top Sales Countries in 2007 4199.4 Where the Money Goes 421
10.1 Selected Disease Statistics—USA 2003 42310.2 Drug Development Process 42510.3 Drug Trial Expenses per Approved Compound 42610.4 Total Hypolipemic Market Sales and Expectations 42610.5 2002 Select Pharmaceutical Company Financial
Information ($000s) 42710.6 Nominal and Real Cost-of-Capital (COC) for the
Pharmaceutical Industry, 1985–2000 42711.1 Microsoft’s Financials
($US millions, except where indicated) 438
11.2 Xbox 360 Sales Projections 43811.3 Playstation 3 Sales Projections 43911.4 Sony’s Summary Financials
($US millions, except where indicated) 44011.5 Game Sales Information 44112.1 Xbox 2001 Forecast Sales, Costs, and Prices 44312.2 Costs, Retail, and Wholesale Prices 44512.3 Forecasted Console and Games Sales 446
xiv Exhibits for Cases
Preface
The first question that potential readers might be tempted to ask is, whyanother book on strategy? Strategic Innovation: New Game Strategies forCompetitive Advantage has many of the same features that existing textbookshave. It draws on the latest research in strategic management and innovation, itis peppered with the latest examples from key business cases, it is easy to read,and so on. However, it has six distinctive features that give it a unique positionvis-à-vis existing strategy and innovation books.
Distinctive FeaturesFirst, Strategic Innovation: New Game Strategies for Competitive Advantage isabout change. While existing textbooks acknowledge the importance ofchange, especially in an ever-changing world, they devote very little or no atten-tion to the subject of change. All the chapters in New Game Strategies are aboutchange and strategic management—about how to create and appropriate valuein the face of new games. Second, existing strategic management texts tend tohave very few or no numerical examples. This lack of numerical examples doeslittle to reinforce the growing consensus that strategy is about winning butrather, it might be promoting the “anything goes in strategy” attitude that is notuncommon to students who are new to the field of strategic management. Nineof the thirteen chapters in the book have numerical examples that link elementsof the balance sheet to components of the income statement. Of course, thebook is also full of case examples. Third, while other texts are more descriptivethan analytical, this book is more analytical than descriptive. It is largely aboutthe why and how of things, and less about the what of things. Fourth, the bookincludes a detailed framework for assessing the profitability potential of a strat-egy, resource, business unit, brand, product, etc. Called the AVAC (activities,value, appropriability, and change), the framework is distinctive in that itincludes not only both firm-specific and industry-specific factors that impactfirm profitability, but also a change component. Fifth, the book’s emphasis is onthose activities that can be linked to the determinants of profitability; that is, thebook focuses on those aspects of strategy that can be logically linked to elem-ents of the balance sheet and income statement. Sixth, the book summarizes themajor strategic management frameworks that are otherwise scattered in othertexts. This is a useful one-stop reference for many students.

The Dawn of Strategic InnovationTo understand why a book with these six features is needed today in the field ofstrategic management, it is important to take a quick look at the evolution ofthe field. In the 1960s, the dominant theme in the field of strategic managementwas corporate planning and managers were largely concerned with planning forthe growth that had been spurred by reconstruction of Europe and Japan, andthe Cold War, following World War II. The SWOT (Strength, Weaknesses,Opportunities, and Threats) framework became popular as the tool of choicefor identifying and analyzing those internal and external factors that werefavorable or unfavorable to achieving firm objectives. In the late 1960s andearly 1970s, the primary theme had shifted to corporate strategy and the issuesof the day were dominated by diversification and portfolio planning. Tools suchas BCG’s Growth/Share matrix, and the McKinsey/GE matrix enjoyed a lot ofpopularity as analysis tools. In the late 1970s and early 1980s, the theme shiftedto industry and competitive analysis, and the primary issues became the choiceof which industries, markets, and market segments in which to compete, andwhere within each industry or market to position oneself. Porter’s Five Forcesand business system (value chain) were the analytical tools of the day. In the late1980s and early 1990s, the theme had evolved into the pursuit of competitiveadvantage and its sources within a firm. Professors C.K. Prahalad and GaryHamel’s core competence of the firm and the resource-based view of the firmemerged as the dominant themes.
From the late 1990s to today, the dominant themes have been strategicinnovation, globalization, and the impact of information and communicationstechnologies on value-adding activities. The primary issues have been and con-tinue to be how to gain a competitive advantage through strategic innovationusing new game strategies, and how to compete in a world with rapid techno-logical change and increasing globalization. A strategic innovation is a game-changing innovation in products/services, business models, business processes,and/or positioning vis-à-vis coopetitors to improve performance. A firm’s newgame strategy is what enables it to perform well or not so well in the face of astrategic innovation. Thus, to perform better than its competitors in the face ofa new game, a firm needs to have the right new game strategies. This book isabout the new game strategies that firms use to exploit strategic innovations. Itis about change. It is about how to create and appropriate value using new gamestrategies. These new game strategies can be revolutionary or incremental, orsomewhere in-between. This book is not only about a firm using new gameactivities to offer customers new value (from new products/services) that theyprefer to that from competitors, but also about how the firm can better positionitself to appropriate the value created in the face of change or no change, and totranslate the value and position to money. It is also about some of the morerecent issues about the digital economy such as the Long Tail, and the not-so-recent issues such as disruptive technologies. Firms that initiate new games, andare therefore first movers, can make a lot of money; but so can firms that followthe first movers. It all depends on the new game strategy that each firm pursues.
xvi Preface

Some Strategic Innovation QuestionsNew game strategies often overturn the way value is created and appropri-ated. They can create new markets and industries, destroy or reinforce exist-ing product-market positions, and most important of all, they can be veryprofitable for some firms. This raises some very interesting questions. Whatexactly are new game strategies? What do we mean by creation and appropri-ation of value? Which new game strategies are likely to be most profitable fora firm—to give a firm a competitive advantage? If resources are really thecornerstones of competitive advantage, what is the role of resources duringnew games? Since, in playing new games, firms often move first, what reallyare first-mover advantages and disadvantages, and how can one take advan-tage of them? What are competitor’s handicaps and how can a first movertake advantage of them? How can the profitability potential of a strategy—new game or non-new game—be analyzed? Is entering a new business usingnew game strategies any better than entering using non-new game strategies?Does game theory have anything to do with new game strategies? What islikely to be the reaction of competitors when a firm pursues a new gamestrategy? Given competitors’ likely reaction, what should a firm do in pursu-ing new game strategies? Does implementing new game strategies requiremore precaution than implementing any other strategy? What are the sourcesof new game strategies? What is the role of globalization and a firm’smacroenvironment in its ability to create and appropriate value using new gamestrategies? Are some environments more conducive to new game strategiesthan others? What is the role of government in new games? How many ofthe new game concepts and tools detailed for for-profit firms applicable tononprofit organizations?
This book explores these questions, or provides the concepts and tools toexplore them. The book takes the perspective of a general manager who hasoverall responsibility for the performance of his or her firm, for a business unitwithin the firm, or for any organization for which performance is important.Such a manager needs to understand the basis for the firm’s performance in theface of change. The manager needs to know what determines the performance,what other change might erode that performance, and when and what the firmcould do to gain and maintain a competitive advantage. The manager must thenuse the firm’s resources to formulate and implement a strategy that will give it acompetitive advantage. Thus, the book should be useful in courses whose goalis to challenge students to think strategically when confronting day-to-dayactivities. It should also be useful to managers who want to challenge them-selves to think strategically, irrespective of their functional role within theirorganization.
The seeds of the book were sowed in the period from 1997 to 2006 when Itaught the Strategy Core Course at the Stephen M. Ross School of Business atthe University of Michigan. During that time, I also taught an elective in Innov-ation Management. In 2003/2004 when I was on academic sabbatical leavefrom Michigan, I also taught the core course in strategy at The Wharton Schoolof the University of Pennsylvania in the USA, and at INSEAD, in Fontainebleau,France. The ideas that most of my students in these schools found fascinatinghad a common theme—changing the rules of the game. Students could not have
Preface xvii

enough of the concepts and cases about strategic innovation, and the associatednew game strategies for a competitive advantage.
Intended AudienceThe book is written for courses in strategic management, entrepreneurship, ormarketing that emphasize strategic innovation or change in a graduate orundergraduate curriculum. It should also be useful to managers who want tochallenge themselves to think strategically, irrespective of their functional rolewithin their organization. Managers and scholars who are interested in explor-ing any of the questions raised above would also find the book useful; so shouldthose managers who are in positions that have a direct impact on firm profit-ability, or who are in consulting, entrepreneurship, or venture capital. It shouldalso be of interest to those functional specialists (finance, marketing, HRM,engineering) who must participate in game-changing activities.
xviii Preface

Acknowledgments
I continue to owe a huge debt of gratitude to my Professors and mentors at theMassachusetts Institute of Technology (MIT); in particular, Professors RebeccaHenderson, James M. Utterback, and Thomas Allen. They introduced me to thesubject of strategic innovation, and to the virtues of patience and tolerance.When I arrived at the University of Michigan from MIT, I was lucky that theDean of the Business School at the time, B. Joseph White (now the President ofthe University of Illinois) had created an environment in which we could thriveas researchers and teachers. That meant a lot to me and I am forever grateful! Iwould also like to thank three anonymous reviewers for their suggestions andhelp in reshaping this book. Some of my students at the Stephen M. Ross Schoolof Business at the University of Michigan gave me very useful feedback when Ipre-tested the concepts of the book, at the formative stage. Some of the cases inPart V of the book were written by some of these students under my super-vision. I am grateful to all of them. I would also like to thank Joseph Lui, whoread through some of the chapters and gave me useful feedback. Katie Changprovided me with dependable research assistance. Finally, I would like to thankMichael and Mary Kay Hallman for the funding that enabled me to explore thetopic of strategic innovation with a little more freedom.
I would like to thank Nancy Hale, Routledge editor for business books,whose professionalism convinced me to work with Routledge.
Allan AfuahAnn Arbor, MichiganJuly 29, 2008

Introduction
Chapter 1: Introduction and Overview
Chapter 2: Assessing the Profitability Potential of aStrategy
Chapter 3: The Long Tail and New Games
Part I

Introduction and Overview
Reading this chapter should provide you with the conceptual and analyticaltools to:
• Define strategy, new games, new game strategies, value creation and valueappropriation, and strategic innovation.
• Understand the characteristics of new games and how a firm can exploitthem to gain and prolong a competitive advantage.
• Begin to understand how to use an AVAC analysis to evaluate the profit-ability potential of a new game strategy.
• Describe types of new game (regular, resource-building, position-building,and revolutionary).
IntroductionConsider the following business performances:
With a market value of over $160 billion for most of 2008, Google was oneof the most valuable companies in the world. Its net income in 2007 was$4.2 billion on sales of $16.6 billion, giving it a net profit margin of 25.4%,one of the highest of any company of its size. This was a remarkable per-formance for a company that only four years earlier, in 2002, had revenuesof $439 million and a net income of $99 million in a struggling dotcomindustry.
In 2006, Threadless, an online T-shirt company founded in 2000, hadprofits of $6 million on revenues of $18 million, from T-shirts that had beendesigned, marketed, and bought by members of the public.1 This made thefirm one of the most profitable in the clothing retail business.
In 2007, Pfizer’s Lipitor was the world’s best-selling drug with sales of$12.7 billion, more than twice its nearest competitor’s sales (Plavix, with$5.9 billion). This was the third year in a row that Lipitor had topped thebest-seller list. One of the most remarkable things about Lipitor is that itwas the fifth cholesterol drug in its category (statins) in a pharmaceuticalsindustry where the third or fourth product in a category usually has littlechance of surviving, let alone of becoming the best seller in the industry.
During the 2007 Christmas season, demand for the Nintendo Wii was sostrong that Nintendo was forced to issue rain checks to customers. On eBay,bids for the $249 machine were in the thousands of dollars. What was even
Chapter 1

more remarkable was that each Wii console was sold at a profit, unlikecompeting consoles from Microsoft and Sony that were being sold at a loss.
Goldcorp, a Canadian gold mining company, offered prizes totalling$575,000 to anyone who would analyze its banks of geological survey dataand suggest where, in its Red Lake, Canada, property gold could be found.2
Fractal Graphics, an Australian company, won the top prize of $105,000.More importantly, the contest yielded targets that were so productive thatGoldcorp was said to have mined eight million ounces of gold worth morethan $3 billion in the six years following the launch.3
Between 1994 and 1998, Dell’s sales increased by five times, its profitsincreased by ten times, its stock shot up by 5,600%, its revenue growth wastwice as fast as that of its rivals while its operating earnings were greaterthan the combined operating earnings of all of its major rivals.4
From 2000 to 2005, Ryanair posted after-tax profit margins of 20–28%in an airline industry where most firms were losing hundreds of millions ofdollars. These record high after-tax profit margins made Ryanair not onlythe most profitable major airline company in the world over that period, butalso one of the most profitable European companies!
Definitions
New Game Strategies
At the core of each of these remarkable performances are strategic innovations,and new game strategies. A strategic innovation is a game-changing innovationin products/services, business models, business processes, and/or positioningvis-à-vis coopetitors to improve performance. A new game strategy is a set ofactivities that creates and/or appropriates value in new ways.5 It is what deter-mines a firm’s performance in the face of a strategic innovation. It entails per-forming new value chain activities or existing ones differently from the waythey have been performed in the past, to create value and/or position a firm toappropriate (capture) value.6 It is about not only creating value in differentways, but also about putting a firm in a position to profit from the value cre-ated. It is often about rewriting the rules of the game, overturning existing waysof creating and appropriating value. For example, rather than keep its data-banks of geological survey data on its Red Lake, Ontario property secret, andstruggle to find where gold might be located, Goldcorp made the data availableto the public and challenged it to locate the gold. Goldcorp was looking to thepublic, rather than to its employees or a contractor, to solve its problem. Onlythe winners, those who produced desirable results, would be paid. Contrast thiswith employees who would be paid whether or not they succeeded in locatinggold. Rather than design and market its own T-shirts, Threadless had membersof its registered users design and submit designs to the firm each week. Mem-bers of the community then voted for the best design, and winners wereawarded prizes. The winning design was then produced and sold to members ofthe community. Effectively, the firm did not perform many of the activities thatT-shirt companies traditionally performed, or did so differently.
The winner of a new game can be a first mover or follower; that is, the winnerof a new game can be the firm that moved first to change the rules of the game,
4 Introduction
or a firm that came in later and played the game better. The important thing isthat a firm pursues the right new game strategy to create and capture value.Google was not the first to introduce search engines but it played the new gamevery well—it was better at monetizing search engines. Its new game strategy inthe early 2000s included undertaking paid listings rather than pop-ups orbanner advertising for monetizing searches, developing those algorithmsthat delivered more relevant searches to its customers than competitors’search engines, and placing the paid-listing ads on its website as well as onthird-party sites.
New games are not always about product innovation. In fact, some of themore interesting cases of new games have nothing to do with new products orservices. Rather, they have been about changing the rules of the game in gettingan existing product to customers or in positioning a firm to appropriate existingvalue better. Take the case of Dell. It introduced direct sales to end-customers,bypassing distributors. It also established build-to-order manufacturing andbusiness processes in which each customer’s computer was built to the cus-tomer’s specification and only after the customer had ordered and paid for thecomputer. Both activities gave Dell some advantages over its competitors. Bybypassing distributors, for example, it was moving away from having to con-front the more concentrated and powerful distributors to dealing directly withthe more fragmented end-customers where it could build switching costs, brandidentity, and identify other sources of revenue such as services.
New games do not always have to be about leapfrogging competitors withproducts that have better product characteristics than competitors’. In fact,some of the more interesting new game strategies are those in which firms cutback some product/service characteristics that had come to be considered sac-red cows, but at the same time, they add a few new features. For example, whenNintendo offered its Wii, it deliberately used much cheaper three-year-oldmicroprocessor and graphics technologies, rather than trying to outmuscleMicrosoft and Sony, which used the latest and fastest but much more expensivetechnologies which many avid gamers had come to expect in each new gener-ation of game consoles. The Wii had other features that appealed more tononavid gamers, such as the ability to play games that enabled people also to getsome physical exercise.
Both first movers and followers can also make money during new games. Forexample, Merck revolutionized the cholesterol-lowering drug market when itpioneered the statin cholesterol drug category, and made lots of money. WarnerLambert, which came into the new game late when it introduced Lipitor (astatin), was able to make even more money using its own new game strategies. Itentered an alliance with Pfizer to gain access to Pfizer’s large sales force andmarketing might, to sell the drug to doctors and conduct direct-to-consumer(DTC) marketing.
Finally, what is a new game in one industry or country, may not be a newgame in another. Take the case of Ryanair. In addition to performing some ofthe activities that had set Southwest Airlines apart from its US competitors—such as flying only one type of airplane model (Boeing 737s for Southwest andA320s for Ryanair) and operating largely out of secondary airports—Ryanairwent further. It sold snacks, advertised inside as well as on its planes, andcollected commissions on the proceeds made from hotel and car rental sales
Introduction and Overview 5

made through its website. It also forged lucrative relationships with localauthorities of the secondary airports where it established operations.
Usually, a new game strategy entails some type of commitment that is madeby the firm pursuing the strategy.7 It also involves tradeoffs.8 For example,Google invested a lot of money in research and development (R&D) to keepimproving the relevance of its searches; and by committing to paid listing ads, itwas foregoing banner and pop-up ads and associated benefits and costs.
Value Creation and Appropriation
Since we have defined a new game strategy as the set of activities that createsand/or captures value in new ways, it is only appropriate that we define valuecreation and value appropriation. A firm creates value when it offers customersproducts or services whose perceived benefits to customers exceed the cost ofproviding the benefits.9 A firm appropriates (captures) value when it profitsfrom it. For example, if a musician writes, composes, and produces a song thatcustomers want, the musician has created value, provided that the cost of offer-ing the music does not exceed the benefits perceived by customers. The profitsthat the musician receives from his or her music are the value that he or shecaptures. As the case of many a musician would suggest, value captured isnot always equal to the value created. Before the Internet, recording studiomanagers and distribution channels usually had the bargaining power overmusicians and therefore captured more value from each record sold than theycreated. Musicians usually appropriated less value than they created, ten centsof every dollar.
Cooperating to Create Value and Competing toAppropriate it
When a customer buys a product, the value that it perceives in the product is notonly a function of the value created by the maker of the product, it is also afunction of the components that go into the product, the complements thatwork with the product, and of what the customer puts into using the product.Effectively, the value that a customer perceives in a product is a function of thecontribution of coopetitors—of the suppliers, customers, rivals, complemen-tors, and other actors with whom a firm cooperates and competes to create andappropriate value. For example, the value that a customer perceives in aniPhone is not only a function of what Apple puts into designing and getting theproduct produced, but also a function of the contribution of the suppliers ofthe chips, LCDs, and other components that go into the product. It is also afunction of the quality and availability of the type of phone service on it, of themusic and other content that can be played on the machine, and of how wellthe user can use the product.
Thus, firms cooperate with suppliers, customers, complementors, and some-times rivals to create value and compete with them to capture the value.Cooperation can be direct as is the case with strategic alliances, joint ventures,and long-term contracts; but often, “cooperation” is indirect as in supplierscontracting with firms to supply products to a firm’s specifications. “Competi-tion” exists not only when a firm has to select a supplier and bargain with the
6 Introduction
supplier but also when the firm has to bargain with buyers over the price of itsproducts. More importantly, competition also exists in an indirect way duringdirect cooperation. When firms are in an alliance or joint venture to coopera-tively create value, they also have to compete to determine who incurs whatcosts and who will capture what fraction of the value created. Thus, wherethere is cooperation to create value, there is nearly always competition toappropriate the value; and where there is competition to capture value, there isprobably some cooperation to create the value. Even competition among rivalsoften has elements that could benefit from cooperation. For example, rivalsstand to benefit when their market grows and therefore can cooperate to growthe market where such cooperation is legal. They also stand to profit whenthey do not get into unnecessary price wars, or get entangled in governmentoverregulation or taxation.
New Games
New Game Activities
Recall that a new game strategy is the set of activities that creates and/or cap-tures value in new ways. The cornerstones of this set are new game activities. Anew game activity is an activity that is performed differently from the wayexisting industry value chain activities have been performed to create or capturevalue.10 The activity can be completely new or it can be an existing activity thatis being performed differently. The important thing is that, (1) the way theactivity is performed is different from the way existing value chain activitieshave been performed, and (2) the activity contributes to creating or capturingvalue. For example, recall that Google’s new game strategy in the early 2000sincluded undertaking paid listings rather than pop-ups or banner advertisingfor monetizing searches, developing those algorithms that delivered morerelevant searches to its customers, and placing the paid-listing ads on its websiteas well as on third-party sites. Undertaking paid listings was a new gameactivity to firms in the search engine industry. So was developing thealgorithms to deliver more relevant searches to customers; and so was placingpaid listing adds on third-party sites. Because a set can have only one member,there will be times when a firm’s new game strategy consists of one new gameactivity, thereby making the activity a strategy. In fact, very often people refer toa new game activity as a new game strategy. Finally, strategic innovations arenew games.
Value Systems and Options for New Game Strategies—Which, Where, When, What, and How?
To understand the options that each firm has for pursuing new game strategies,consider the business system (value chain) of Figure 1.1. At each stage of thechain, a firm has many options for performing the activities needed to add valueat that stage to create and deliver products to end-customers.11 For example, atthe technology stage, a firm has many options for sourcing the technology. Itcan develop the technology internally using its own R&D resources, license thetechnology from another firm, form a strategic alliance with partners to develop
Introduction and Overview 7

the technology, or decide to wait for the next-generation technology. If itdecides to develop the technology, the firm can patent aggressively to protect itstechnology, or give away the technology. Suppose firms in an industry developtheir technologies internally and keep them proprietary; then a firm that givesaway its own technology to anyone who wants it is pursuing a new gamestrategy. That is what Sun Microsystems did when it gave away its SPARCworkstation computer technology in the early 1990s. Of course, a firm isalso pursuing a new game strategy if it decides to use a radically differenttechnology.
At the distribution level, a firm also has many choices. It can use all thechannels available to it for distribution, or use only a few. It can also decide tosell directly to customers or depend completely on distributors. It can decide tobuild products and warehouse lots of finished goods inventory, or have a build-to-order system with little or no finished goods inventory. Again, suppose firmsin a market all depend on distributors to deliver products to end-customers. Afirm that decides to sell directly to end-customers is effectively performing anew game activity. This is what Dell did when it decided to start selling directlyto end-customers. At the manufacturing level, a firm can be vertically integratedinto producing its components or buy the components; it can produce thecomponents at home or in foreign countries; it can locate all its plants in onecountry or in different countries; it can perform its own purchasing or have anagent do it, etc.
Effectively, since there are many options for performing value chain activitiesat every stage of the value chain, there also exist options for performing newgame activities at all stages of a value chain. Thus, the opportunity to gain astrategic advantage is not limited to product innovation (new game strategiesat the technology and product design stages). Opportunities for a strategicadvantage through new game strategies exist at all the stages of a value chain—manufacturing, marketing, distribution, and service included. They also exist invertically integrating backwards to supply one’s inputs, integrating verticallyforwards to dispose of one’s outputs, and integrating horizontally into com-plements or other related segments.
Moreover, options also exist as to which activities to perform, when to per-form them, how to perform them, where to perform them, and what to expectas the output. At the R&D stage, for example, a firm may decide to performbasic R&D and not applied R&D while its competitors perform both. It might
Figure 1.1 Business System and Options for New Games.
8 Introduction

decide to perform that R&D in the USA, China, and South Africa while itscompetitors do so only in Europe. It might decide to be the first mover ratherthan a follower in the R&D activities that it performs. It might also decide topatent religiously while its competitors depend on trade secrets.
In any case, new game activities can create new customer value for existing ornew customers, address newer and more valuable market segments, better pos-ition a firm to capture value created in its value system, or generate new rev-enues from existing or new revenue sources. They constitute the cornerstones ofnew game strategies.
Finally, note that although new game activities are the cornerstones of newgame strategies, the latter often contain some non-new game activities. Forexample, not all the activities that Google performed to be profitable were newgame; but the cornerstones of its new game strategy are new game activities.
From Activities to ProfitsHow do activities become profits? When a firm performs business systems activ-ities, (1) it produces a product with benefits that customers value, (2) it betterpositions itself vis-à-vis its coopetitors, or (3) it does both. The product, or theposition attained then has to be converted to profits. Although each category ofactivities sometimes takes a different path to profits, activities often comple-ment each other. Let us examine both.
Product with Benefits that Customers Value
Many firms perform activities to offer products that customers want. R&D,product development, purchasing, and manufacturing are examples of activi-ties that are designed largely to add value along a value chain so as to offercustomers products that they value. If a firm’s product offers benefits that cus-tomers perceive as unique—e.g. low-cost or differentiated products—customersare more likely to gravitate towards the firm rather than its competitors. Offer-ing customers low-cost or differentiated products is just one step, albeit a veryimportant one, for a firm to profit from performing value-adding activities. Thefirm must also price the product well since too high a price drives away somecustomers while too low a price leaves money on the table. It must seek out asmany customers as possible, since customers usually do not come knocking ata firm’s door. It could also seek different profitable sources of revenue thatexploit the product. For example, many US car dealers make more money fromservicing cars than from selling new ones. A firm could also locate its product ina market with few or no competitors such as a new market segment, a differentregion of a country, or another country.
Effectively, when value-adding activities produce low-cost or differentiatedproducts, the products must still be translated into money—they still have to bepriced well, the number of customers that perceive value in the productsincreased, profitable sources of revenues sought, and the product also posi-tioned in the right market spaces to profit more fully from it.
Introduction and Overview 9

Better Positioning vis-à-vis Coopetitors
A firm can also perform activities to position itself better vis-à-vis its coopetitorsin order to profit from the value that the firm or its coopetitors have created. Afirm has a superior position vis-à-vis a coopetitor if the coopetitor needs thefirm more than the firm needs the coopetitor. For example, when a firm pur-chases its rivals, it increases its power over customers since there are now fewerfirms (competitors) for a customer to play against each other. Buyers now needthe firm more than they did before the firm purchased its rivals. Such a firm canuse its increased power to raise its prices, or extract other concessions fromcustomers. This is a practice that Tyco International pursued profitably formany years. If a firm integrates vertically forwards to sell directly to consumers,it is bypassing the more concentrated distributors to deal directly with the morefragmented consumers. In addition to saving on the sales commissions that areusually paid to distributors, such a firm can also build switching costs at cus-tomers (see Chapters 4 and 6) and seek other sources of revenues. It also has thefreedom and flexibility to introduce more innovative products to customers. If afirm instead integrates vertically backwards to produce its own critical inputs, itincreases its bargaining power over suppliers. The firm can use such power toencourage suppliers to provide second sources for its inputs. Doing so can allowa firm to extract concessions from suppliers, including lower prices and higherquality, both of which can increase the firm’s profits.
Value Creation and Better Positioning
Some activities result in value creation and better positioning vis-à-vis coopeti-tors. For example, by offering a differentiated product, a firm is not onlycreating value but also positioning better itself vis-à-vis customers, rivals, andpotential new entrants since differentiation reduces rivalry, power of suppliers,and the threat of new entry.12 By marketing a product in a location with nocompetition, one is introducing value to customers in the location. At the sametime, since there are no competitors, the firm has a monopolistic position in thespace and is therefore well-positioned vis-à-vis some coopetitors.
In any case, when a firm performs a value-adding activity, the activity con-tributes to value creation and capture in one or more of the following ways. Theactivity:
a Lowers the cost of, or adds to the differentiation of a product—it contrib-utes to value creation, and customer benefits.
b Positions the firm better vis-à-vis its coopetitors.c Transforms the value created into profits.d Exploits the position vis-à-vis coopetitors to profit from the value created
by the firm and that created by its coopetitors.
Characteristics of New GamesWhen firms perform new value chain activities, or existing ones differently, theyare playing new games. (Each firm’s strategy is then the set of activities, includ-ing non-new game activities, that it pursues to create and appropriate value in
10 Introduction
the face of the new game.) Since the activities that underpin new games are newor existing ones that are performed differently, new games create new value orgenerate new ways of capturing value; and since performing activities requiresresources/capabilities, performing new game activities may require newresources/capabilities that build on a firm’s existing resources/capabilities orrequire very different ones. Because, in pursuing a new game, a firm may bemoving first, such a firm has an opportunity to build and take advantage of first-mover advantages. Moreover, when a firm pursues a new game strategy, itscompetitors are likely to react to the strategy. Therefore a firm is better offanticipating and taking into consideration the likely reaction of competitorswhen it pursues a new game strategy; and since firms usually pursue new gamestrategies within the context of their industry, macro, or global environments, afirm is also better off identifying and responding to the opportunities andthreats of these environments. Effectively, new games exhibit several character-istics of which firms can take advantage. New games:
1 Generate new ways of creating and appropriating new value.2 Offer opportunity to build new resources/capabilities or translate existing
ones in new ways into value.3 Create the potential to build and exploit first-mover advantages and
disadvantages.4 Attract reactions from new and existing competitors.5 Have their roots in the opportunities and threats of the firm’s environments.
The first three characteristics are about a firm’s internal environment—theactivities, resources, and capabilities that it can use to exploit the opportunitiesand threats of its external environment. The fourth and fifth characteristics areabout the external threats and opportunities. We explore each of these charac-teristics of new games.
Generate New Ways of Creating and Appropriating Value
As we have seen above, a firm creates value when it offers customers benefitsthat they perceive as being valuable to them and the firm’s cost of providingthe benefits does not exceed the benefits. Innovation (product or businessprocess) is a good example of value creation by new games, since it entailsdoing things differently and results in differentiated and/or low-cost newproducts.
New games give a firm an opportunity to create unique benefits for a valuableset of customers, and/or uniquely position the firm vis-à-vis its coopetitors toappropriate the value created. In choosing which new game strategy to pursue,a firm can opt for those activities that enable it to offer unique benefits that meetthe needs of customers with a high willingness to pay. In so doing, the firm isavoiding head-on competition, thereby keeping down the profit-sapping effectsof rivalry. For example, when Ryanair decided to expand its activities intosouthern Europe, it did not try to fight established airlines head-on at largercongested airports and try to outdo them at what they had been doing fordecades. Rather, it went for the less congested secondary airports where it didnot have to compete head-on with incumbent big airlines. Because the value is
Introduction and Overview 11

unique, a firm also has more power over its customers than it would have if thebenefits were not unique; and if customers have a high willingness to pay, a firmcan afford to set its prices closer to customers’ reservation prices without driv-ing the customers away, since the customers need the unique benefits from thefirm’s products. (A customer’s reservation price for a product is the highestprice that the customer is willing to pay for the product.) A firm can offerunique benefits to such valuable customers by working with them to help themdiscover their latent needs for a new product that it has invented or discovered,leapfrogging existing needs through innovation, reaching out for a market seg-ment that had never been served with the benefits in question, or following so-called reverse positioning in which the firm strips some of the benefits that somecustomers have come to expect but which other customers have no need forwhile adding some new ones.13
Offering a select group of customers unique benefits can dampen the powerof the customers and the effects of rivalry as well as the threat of substitutes andpotential new entries, but it may not do much about suppliers and some com-plementors. Thus, beyond pursuing activities that offer unique customer bene-fits, a firm may also want to pursue the kinds of activity that dampen or reversethe power of its suppliers. For example, by making sure that there are secondsources for all its key components, a firm can considerably dampen the powerof suppliers for the particular component. Cooperation with other coopetitors,not just suppliers, can also dampen their power vis-à-vis a firm. Effectively, anew game offers a firm an opportunity to build a system of activities that isdifficult to imitate and that enables the firm to create unique benefits for valu-able customers and uniquely position it vis-à-vis its coopetitors to appropriatethe value.14
The change element side of new game activities suggests that the new ways ofcreating and capturing value can render existing ways obsolete or can build onthem. It also suggests that the value created or the new position attained can beso superior to existing ones that the products that embody them render existingproducts noncompetitive or can be moderate enough to allow existing productsto remain in the market. For example, the activities that are performed to createand appropriate value in online auctions are so different from those for offlineauctions that the latter are largely obsolete as far as online auctions are con-cerned. The value created is also so superior that for most items, offline auctionshave been completely displaced by online auctions.
The change element also suggests that new games may result in an industrythat is more or less attractive than before the games. An industry is more attract-ive after change if the competitive forces that impinge on industry firms aremore friendly than before—that is, if rivalry, the bargaining power of suppliers,the bargaining power of customers, the threat of potential new entry and ofsubstitutes are low. If the industry is more attractive, industry firms are, onaverage, more profitable. As we will see when we explore disruptive technolo-gies, many new games increase the competitive forces on incumbents as barriersto entry drop, and rivalry increases.
12 Introduction

Offer Opportunity to Build New Resources/Capabilities orTranslate Existing Ones in New Ways
New games also offer a firm an opportunity to build scarce distinctiveresources/capabilities for use in creating and appropriating value, or to useexisting resources/capabilities in new ways to create and appropriate value. Toperform the activities that enable a firm to create and/or appropriate value, afirm needs resources (assets). These can be tangible (physical assets such asplants, equipment, patents, and cash), intangible (the nonphysical ones such asbrand-name reputation, technological know-how, and client relations), ororganizational (routines, processes, structure, systems, and culture).15 A firm’scapabilities or competences are its ability to integrate resources and/or translatethem into products.16 New game strategies can be used to build resources/cap-abilities and/or translate existing ones into value that customers want. The caseof eBay serves as a good example. By taking a series of measures to make itsonline auction market feel safe, building a brand, and increasing the number ofmembers in its community of registered users, eBay was able to build a largeand safe community—a critical resource—that attracted even more membersevery year. It was then able to use this large base of buyers and sellers to movefrom an auctions format into a multiformat that included fixed pricing andauction formats, and from collectibles to many other categories.
Again, the change side of new games suggests that the resources/capabilitiesthat are needed to perform new game activities can build on existing resources/capabilities or be so different that existing resources/capabilities are renderedobsolete. For example, the resources/capabilities needed by eBay are so differentfrom those needed for an offline auction that offline resources such as offlinephysical locations, bidding systems, etc., are obsolete as far as online auctionsare concerned. This has strategic implications that we will explore in laterchapters.
Create the Potential to Build and Exploit First-moverAdvantages and Disadvantages
A first-mover advantage is an advantage that a firm gains by being the first tocarry out a value creation and/or value appropriation activity or strategy.17
Since, in pursuing a new game, a firm may be effectively moving first, such afirm has an opportunity to earn first-mover advantages. If a firm performs theright activities to enable it to attain first-mover advantages, it can take advan-tage of them to build or consolidate its competitive advantage. For example,when a firm introduces a new product, moves into a new market, or performsany other new game activity that can allow it to create or appropriate value innew ways, the firm has an opportunity to build and exploit first-mover advan-tages. For example, a firm that introduces a new product first can build switch-ing costs or establish a large installed customer base before its competitorsintroduce competing products. In such a case, the switching costs or installedbase is said to be the firm’s first-mover advantage. Perhaps one of the mostpopular examples of a firm that built and exploited first-mover advantages isWal-Mart. When it first started building its stores in the Southwestern USA,large powerful suppliers refused to give it goods on consignment. Wal-Mart
Introduction and Overview 13

turned things around in its favor when it grew big by pursuing the right activ-ities: it saturated contiguous towns with stores and built associated distributioncenters, logistics, information technology infrastructure, and relevant “Wal-Mart culture.” By scaling up its efficient activities, Wal-Mart became very largeand effectively reversed the direction of power between it and its supplier—withWal-Mart now having the power over suppliers. Effectively, a firm that usesnew games to offer unique value to customers and uniquely position itself toappropriate the value, can use first-mover advantages to solidify its advantagein value creation and appropriation.
The more counterintuitive a new game strategy, the more opportunities thatthe first-mover has to build advantages before followers move in. As we willargue in Chapter 6, first-mover advantages are usually not automaticallyendowed on whoever moves first. They have to be earned. Of course, whereverthere are first-mover advantages, there are usually also first-mover disadvan-tages that can give followers an advantage. Competitors that follow, rather thanmove first, can take advantage of first-mover disadvantages (also called follow-er’s advantages). For example, when a firm is the first to pursue a new game, it islikely to incur the cost of resolving technological and marketing uncertaintiessuch as proving that the product works and that there is a market for it. Follow-ers can free-ride on first movers’ investments to resolve these uncertainties andbe spared these extra expenses. If the technology and market are changing, thefirst mover may make commitments in the early stages of the technology andmarket that reduce its flexibility in some later decisions. This again opens upopportunities for followers. We will also explore first-mover disadvantages inmore detail in Chapter 6.
Attract Reactions from New and Existing Competitors
If a firm pursues a new game first, the chances are that competitors are not likelyto sit by and watch the firm make money alone. They are likely to react to thefirm’s actions. Thus, it is important to try to anticipate competitors’ likelyreactions to one’s actions. In fact, business history suggests that many firms thatultimately made the most money from innovations were not the first to intro-duce the innovations. So-called followers, not first movers, won. One reason isbecause followers often can exploit first-mover’s disadvantages (also called fol-lowers’ advantages). However, a first mover can have three things going for it.First, it can build and exploit first-mover advantages. Second, it can take advan-tage of the fact that new games are often counterintuitive, making it difficult forfollowers to understand the rationale behind the utility of the new games. Themore that the idea behind a new game strategy is counter to the prevailingdominant industry logic about how to perform activities to make money in theindustry, the more that a first mover will not be followed immediately by poten-tial competitors; and if a firm follows a first mover, its dominant logic mayhandicap it from effectively replicating the first mover’s activities. While poten-tial followers are still getting over their industry’s dominant logic to understandthe potential of the new game, a first mover can preemptively accumulate valu-able important resources/capabilities that are needed to profit from theactivities.
Third, a firm that pursues a new game strategy can take advantage of the fact
14 Introduction

that when a pioneer pursues a new game strategy, some of its competitors mayhave prior commitments or other inseparabilities that handicap them when theytry to react to the pioneer’s actions. The role of prior commitments is bestillustrated by the case of Compaq when it tried to react to Dell’s direct sales andbuild-to-order new game strategy. Compaq decided to incorporate the sametwo activities into its business model. Citing previous contracts, Compaq’s dis-tributors refused Compaq from selling directly to end-customers and the firmhad to abandon its proposed new business model. Some firms may decide not tofollow a first mover for fear of cannibalizing their existing products. In somecases, the inertia of large firms may prevent them from moving to compete withfirst movers.
In any case, an important part of profiting from a new game is in anticipatingand proactively trying to respond to the likely reaction of competitors. Thisentails asking questions such as: if I offer that new product, raise my prices,invest more in R&D, adopt that new technology, advertise more, launch thatproduct promotion, form the strategic alliance, etc., what is likely to be thereaction of my competitors? This also entails obtaining competitive intelligencenot only on competitors’ handicaps but also on their goals, resources/capabil-ities and past behavior to help in making judgments about competitors’ likelyreactions. With such information, a firm can better anticipate competitors’likely reactions and incorporate counter-measures in formulating and executingnew game strategies. Of course, the likely reaction of suppliers, complementors,and customers should also be taken into consideration.
Have their Roots in the Opportunities and Threats of aFirm’s Environments
Firms that pursue new games do not do so in a vacuum. They operate in theirindustry, macro, and global environments. In fact, many of the new game activ-ities that are performed to create value or improve a firm’s ability to appropri-ate value are triggered by opportunities or threats from both their industry,macro, and global environments. An industry environment consists of the act-ors and activities such as supply and demand that take place among suppliers,rivals, complementors, substitutes, and buyers. A firm may offer a new productbecause it wants to occupy some white space that it has identified in the marketsthat it serves. Airbus’ offering of the A380 super jumbo plane falls in thiscategory. Sometimes, new games can be a result of a hostile competitiveenvironment. Dell’s decision to sell directly to customers rather than passthrough distributors was actually because the distributors would not carry itsproducts at the time. It was a fledgling startup and many distributors were busyselling products for the IBMs and the Compaqs. The macroenvironment ismade up of the political-legal, economic, socio-cultural, technological, and nat-ural environments (PESTN) in which firms and industries operate. A firm mayenter a market because it fears that a disruptive technology will erode its com-petitive advantage. Another may use the same disruptive technology to attackincumbents that have been successful at using an existing technology. Yetanother firm may be responding to opportunities in its political-legal environ-ment. For example, Ryanair’s expansion into secondary airports in the Euro-pean Union followed the union’s deregulation of the airline industry. The drop
Introduction and Overview 15

in its profits in 2008 was largely attributable to the sharp rise in the cost of oil tomore than three times what it had been paying for in earlier years.
The global environment consists of a world in which countries and theirindustries and firms are increasingly interconnected, interdependent, and moreintegrated, thereby moving towards having similar political-legal, economic,socio-cultural, technological, and natural environments (PESTN). Theopportunities and threats of the global environment are exhibited throughglobalization. Globalization is the interdependence and integration of people,firms, and governments to produce and exchange products and services.18
Globalization creates opportunities for some firms and individuals but createsthreats for others. There are opportunities to market products to, outsourcework to export to, or import from foreign countries in new ways.
In any case, external environments differ from one industry to the other, andfrom one country or region to another. In the carbonated soft drinks industry,for example, regular and diet colas have been the major sellers for decades. Infact, when coke tried to change the formula for its regular coke, customers didnot like it and the company had to revert to the old product. Other industriesare relatively less stable. Rapid technological change, globalization, changingcustomer tastes, and more availability of skilled human resources in differentcountries make some industries very turbulent. In such industries, firms oftenhave to cannibalize their own products before someone else does. Effectively,how firms need to interact with or react to environments can differ considerablyfrom one industry to the other, or from one country to the other, and canconstitute opportunities and threats that firms can exploit through new games.
Concern for the natural environment also creates many opportunities to useinnovation to build better cars, build better power plants, better dispose ofwaste, and reduce carbon emissions. Understanding these opportunities andthreats not only helps a firm to make better choices about which activities toperform, but when to perform them and how to perform them.
Multigames and DynamicsA new game usually does not take place in isolation. It usually takes place in thecontext of other games and is usually preceded by, followed by, or played inparallel with other games. When a firm introduces a new game, it often does soin response to another game. For example, when Dell decided to sell its built-to-order PCs directly to businesses and consumers, it did so in the context of alarger new game—the introduction of PCs that were disrupting minicomputers.When Google developed its search engine and pursued paid listings to monetizethe engine, it was doing so in the context of the Internet, a much larger newgame. When Wal-Mart initially located its stores in small towns in parts of theSouthwestern USA, it was doing so in the context of the larger game of discountretailing that was challenging the standard department store. Each firm usuallyplays multigames over a period. For example, Wal-Mart started out selling onlygoods at discount prices in its discount stores but in 1988, it introduced itsversion of superstores, selling both food and goods in its Wal-Mart Supercent-ers. This multigame and dynamic nature of new games has implications that wewill encounter when we explore first-mover advantages and disadvantages, andcompetitors’ handicaps in Chapter 6.
16 Introduction

Competitive Advantage from New GamesMany firms pursue new game strategies in search of a competitive advantage,or just to make money. A firm’s competitive advantage is its ability to earn ahigher rate of profits than the average rate of profits of the market in which itcompetes. Since revenues come from customers, any firm that wants to makemoney must offer customers benefits that they perceive as valuable comparedto what competitors offer. Thus, an important step in gaining a competitiveadvantage is to create unique benefits for customers without exceeding thecost of the benefits—creating unique value; but to create value, a firm has toperform the relevant value-adding activities; and for a firm to perform value-adding activities effectively, it needs to have the relevant resources and cap-abilities. Since, as we saw earlier, not even unique value can guarantee thatone will profit from it, the activities that a firm performs should also positionit to appropriate the value created. If the activities are a new game, then thereis a change element in the creation and appropriation of value since newgames generate new ways of creating and appropriating value, offer opportun-ities to build new resources or translate existing ones in new ways, create thepotential to build and exploit first-mover advantages, attract reactions fromcoopetitors, or identify and respond to the opportunities and threats of theenvironment. Effectively, competitive advantage is about creating andappropriating value better than competitors; but creating and appropriatingvalue requires the right activities and the underpinning of resources andcapabilities. Moreover, there is always the element of change from the newgame component of activities—either from a firm or from the actors in itsexternal environment.
Components of a New Game Strategy
In effect, when a firm pursues a new game strategy, the extent to which thestrategy can give the firm a competitive advantage is a function of the activitiesthat the firm performs, the value that it creates, how much value it captures, andhow much it is able to take advantage of change. It is a function of the fourcomponents: Activities, Value, Appropriability, and Change (AVAC) (Figure1.2). Thus, one can estimate the extent to which a new game strategy stands togive a firm a competitive advantage by answering the following four questions:
1 Activities: is the firm performing the right activities? Does it have what ittakes to perform them?
2 Value: do customers perceive the value created by the strategy as unique?3 Appropriability: does the firm make money from the value created?4 Change: does the strategy take advantage of change (present or future) to
create unique value and/or position itself to appropriate the value?
Answering these four questions constitutes an AVAC analysis. The AVAC analy-sis can be used to estimate the profitability potential of a strategy or the extentto which a strategy is likely to give a firm a competitive advantage. The morethat the answers to these question are Yes rather than No, the more that thestrategy is likely to give the firm a competitive advantage. Although a detailed
Introduction and Overview 17

exploration of the AVAC analysis is postponed until Chapter 2, the analysis issimple and fundamental enough for us to start using it below.
Competitive Consequences of Strategies
Each strategy—new game or otherwise—has competitive consequences.Depending on the strategy that a firm pursues, the firm may have a sustainablecompetitive advantage, temporary competitive advantage, competitive parity,or competitive disadvantage (Table 1.1). An AVAC analysis enables a firm toidentify and rank strategies by their competitive consequences. Table 1.1 showssix different strategies and the competitive consequence for each. In Strategy 1,the set of activities that the firm performs creates value that customers perceiveas unique and the firm is able to appropriate the value so created. The firm alsohas the resources and capabilities needed to perform the activities. Moreover,the strategy takes advantage of change (present or future) to create and/orappropriate value better. All the answers to the questions are Yes, and the firm isthus said to have a sustainable competitive advantage.
In many industries, however, the more common cases are Strategy 2 andStrategy 3, which give a firm a temporary competitive advantage. In Strategy 2,the firm has a set of activities that enables it to create value that customersperceive as unique, and put it in a position to appropriate the value. It also haswhat it takes to perform the activities; but the strategy is such that the firmcannot take advantage of change. During the period before the change, the firmhas a temporary competitive advantage. In Strategy 3, the set of activities thatthe firm performs enables it to create value and take advantage of change, butcan appropriate the value created only for the short period that it takes com-petitors to imitate it. It has the resources and capabilities to perform the value-creating activities. Thus, the firm also has a temporary competitive advantage.In pharmaceuticals, for example, strategies are often anchored on patents whichusually give their owners a competitive advantage for the duration of thepatent. When a patent expires, however, many imitators produce generic ver-sions of the drug, eroding the advantage of the original patent owners. In Strat-egy 4, the firm can neither appropriate the value created nor take advantage ofchange, even though it creates value and has what it takes to perform the
Figure 1.2 Components of a New Game Strategy.
18 Introduction

activities. Such a strategy is also said to give the firm competitive parity. Mostproducers of commodity products have comparative parity. In Strategy 5, thefirm has what it takes to perform some activities but not others. It can appropri-ate some of the value created, even though the value is not unique. It is vulner-able to change. A firm that pursues such a strategy also has competitive paritywith competitors. In Strategy 6, the set of activities that a firm performs neithercreates unique value nor puts the firm in a position to appropriate value createdby others; nor does the firm have what it takes to perform the activities. Thefirm is said to have a competitive disadvantage.
Thus, the more that the answers to these question are Yes rather than No, themore that the strategy is likely to give the firm a competitive advantage. Whatshould a firm do if an AVAC analysis shows that it has a temporary competitiveadvantage, competitive parity, or a competitive disadvantage? Such a firm candecide whether to perform the types of activity that will enable it to turn theNoes to Yesses or at least dampen them, thereby giving it a more sustainablecompetitive advantage or something closer to it. It may also decide to abandonthe strategy.
Table 1.1 Competitive Consequences of New Game Strategy
First-moveradvantage
Activities: Is thefirm performingthe right activities?Does it have whatit takes (resourcesand capabilities) toperform theactivities?
Value: Is the valuecreated by thestrategy unique, asperceived bycustomers,compared to thatfrom competitors?
Appropriability:Does the firmmake money fromthe value created?
Change: Doesthe strategy takeadvantage ofchange (present orfuture) to createunique value and/or position itself toappropriate thevalue?
Competitiveconsequence
Strategy 1 Yes Yes Yes Yes Sustainablecompetitiveadvantage
Strategy 2 Yes Yes Yes No Temporarycompetitiveadvantage
Strategy 3 Yes Yes Yes/No Yes Temporarycompetitiveadvantage
Strategy 4 Yes Yes No No Competitiveparity
Strategy 5 No/Yes No Yes No Competitiveparity
Strategy 6 No No No No Competitivedisadvantage
Strategicaction
What can a firm do to reinforce the Yesses and reverse or dampen theNoes, and what is the impact of doing so?
Introduction and Overview 19

Illustrative ExampleWe illustrate the significance of a good new game strategy using the example ofNintendo’s introduction of its Wii video game console.
Estimating the Value of a New Game Strategy: The Case ofVideo Consoles
Nintendo introduced its Wii video console in the Americas on November 19,2006, only about a week after Sony had introduced its PS3 console on Novem-ber 11. Microsoft’s Xbox had been available for purchase about a year earlieron November 22, 2005. Game developers, such as Electronic Arts, developedthe video games that customers bought to play on their consoles. For everyvideo game that a game developer sold to be played on a particular console, thegame developer paid the console-maker a royalty. This aspect of the gameconsole business model differed from the PC business model where softwaredevelopers did not pay any royalties to PC makers. Console-makers alsodeveloped some games in-house. Each console-maker, on average, collected0.415 of every game sold.19 The average wholesale price of Xbox 360/PS3-generation games was about $43.20
The Xbox 360 and the PS3 used ever more powerful computing and graphicschips to offer customers more lifelike images than those from their predeces-sors. They also focused on advanced and experienced gamers, neglecting nov-ices and casual games, many of whom were scared by the complexity of thegames, some of which took hours or days to play.21 These faster chips and morelifelike images enabled game developers to develop even more complex gamesfor avid gamers. The Nintendo Wii differed from the PS3 and the Xbox 360 inseveral ways. It went after the less experienced, new, or lapsed potential gamersthat Sony and Microsoft had neglected. The Wii used less complex and cheapercomponents than the PS3 and Xbox. The games were simpler to play and couldlast a few minutes rather than the dozens of hours or days that it took to playsome Xbox 360/PS3 games. Rather than use the complicated joypad of the PS3and Xbox that was full of buttons, the Nintendo Wii had simpler controls thatwere easier to use and a wandlike controller that looked more like a simplifiedTV remote-control.22 When connected to the Internet, the Wii could displayweather and news.
The estimated costs, wholesale prices, and suggested retail prices for the threeproducts are shown in Table 1.2, while the forecasted number of units areshown in Table 1.3.
Question: What is the financial impact of the difference between the NintendoWii business model and the PS3 and Xbox 360 business models?
Answer: The calculations that are summarized in Table 1.4 demonstrate howmuch a good new game strategy can contribute to the bottom line of acompany. The forecasted profits from each product are also shown in Table1.4. Over the three-year period from 2007 to 2009:
• The Xbox 360 was projected to bring in profits of $105 + 105 + 53 =$263 million.
20 Introduction

• The PS3 was projected (not) to bring in − $478 − 565 − 565 = − 1,608million = $(1,608 million).
• The Wii was projected to pull in profits of $749 + 1,535 + 2,457 =$4,741 million.
Effectively, Nintendo’s new game strategy for its Wii enabled it to expect profitsof $4.741 million over the three-year period while Microsoft could only expectprofits of $0.263 million from its Xbox 360 while Sony stood to lose largeamounts, to the tune of $1.608 million. Why? The primary reason was thatNintendo’s reverse-positioning strategy enabled it not only to attract more cus-tomers but also to keep its cost so low that it could sell each of its consoles at aprofit, while Microsoft and Sony sold their consoles at a loss, hoping to makeup the losses by selling more games.
Types of New GameNot all new games exhibit the same degree of new gameness. For example, thechange from horse-driven carts to the internal combustion engine automobilewas a new game; but so was the decision of Japanese automobile makersHonda, Nissan, and Toyota to offer the luxury brands Acura, Infiniti, andLexus, respectively. So was Dell’s decision to sell directly to end-customers.This raises an interesting question: how new game is a new game? What is thenew gameness of a new game? In this section, we explore this question.
Table 1.2 Costs, Retail, and Wholesale Prices
First year After first year
Product Yearintroduced
Cost ($) Suggestedretail price ($)
Wholesaleprice ($)
Cost Suggestedretail price ($)
Wholesaleprice ($)
Xbox 360 2005 525 399 280 323 399 280Sony PS3 2006 806 499 349 496 399 280Nintendo Wii Late 2006 158.30 249 199 126 200 150
Sources: Company and analysts’ forecasts. Author’s estimates.
Table 1.3 Forecasted Console and Games Sales
2005 2006 2007 2008 2009 2010
ConsoleXbox 360 1.5 8.5 10 10 5Sony PS3 2 11 13 13 7Nintendo Wii 5.8 14.5 17.4 18.3
GamesXbox 360 4.5 25.5 30 30 15Sony PS3 6 33 39 39 21Nintendo Wii 28.8 66.5 114.3 128.8
Sources: Company and analysts’ reports. Author’s estimates.
Introduction and Overview 21

Table 1.4 Estimates of the Profitability of Three Different Strategies
Microsoft 2005 2006 2007 2008 2009 2010
Xbox 360 units(million units)
A 1.5 8.5 10 10 5
Wholesale price B 399 280 280 280 280Console productioncosts
C 525 323 323 323 323
Profits from Console($ million)
D A*(B − C) (189) (366) (430) (430) (215)
Software units (usingattach rate of 3.0)(million)
E 3*A 4.5 25.5 30 30 15
Profits from games ($million)
F 0.415*43*E 80 455 535 535 268
Total profits ($ million) G D + F (109) 90 105 105 53
Sony 2005 2006 2007 2008 2009 2010
Console sales (millionunits)
H 2 11 13 13 7
Wholesale price I 499 399 399 399 399Console productioncosts
J 806 496 496 496 496
Profits from Console($ million)
K H*(I − J) (614) (1,067) (1,261) (1,261) (679)
Software units (usingattach rate of 3.0)(million)
L 3*H 6 33 39 39 21
Profits from games ($million)
M 0.415*43*L 107 589 696 696 375
Total profits ($ million) N K + M (507) (478) (565) (565) (304)
Nintendo Wii 2005 2006 2007 2008 2009 2010
Console sales (millionunits)
O 6 14.5 17.4 18.3
Wholesale price P 199 150 150 150Console productioncosts
Q 158 126 126 126
Profits from Console($ million)
R O*(P − Q) 246 348 418 439
Software units (games)(million)
S 28.2 66.5 114.3 128.8
Profits from games ($million)
T 0.415*43*S 503 1,187 2,040 2,298
Total profits ($ million) U R + T 749 1,535 2,457 2,738
22 Introduction

The Classification
How new game is a new game? We start answering this question by classifyingnew games as a function of their new gameness. Since the ultimate goal of manyfirms is to gain a sustainable competitive advantage, one way to classify newgames is by how much they impact a firm’s (1) product space, and (2) resources/capabilities. Why these two variables? Because they are key determinants ofcompetitive advantage. According to the product-market-position (PMP) viewof strategic management, the extent to which a firm can earn a higher rate ofreturns than its rivals is a function of the benefits (low cost or differentiatedproducts, or both) that the firm offers its customers, and its position vis-à-viscoopetitors (bargaining power over suppliers and customers, power of substi-tutes, threat of potential new entry, rivalry) that help the firm capture the valuethat customers see in the benefits.23 The more that customers perceive the bene-fits from a firm as unique and superior to those from competitors, the better thechances of the firm capturing the value from the benefits and having a higherrate of return. The better a firm’s position vis-à-vis its coopetitors—that is, themore that the firm has bargaining power over its suppliers and customers, andthe more that rivalry, the threat of substitutes, and of new entry are low—thebetter the firm’s chances of having a higher rate of return. For want of a betterphrase, we will call the product (with associated benefits) that a firm offerscustomers, and its position vis-à-vis coopetitors the firm’s product position.
According to the resource-based view (RBV), a firm that has valuable, scarce,and difficult-to-imitate-or-substitute resources/capabilities is more likely tocreate and offer unique benefits to customers and/or to position itself to capturethe value created than its competitors.24 A firm’s resources/capabilities arevaluable if they can be translated into benefits that customers like. They arescarce if the firm is the only one that owns them or if its level of the resources issuperior to that of competitors. They are difficult-to-imitate if there is some-thing about the resources that makes it difficult for competitors to replicate orleapfrog them.
From these two views of strategic management, a firm’s product position andits resources are key determinants of its competitive advantage. Thus, in thetwo-by-two matrix of Figure 1.3, we can classify new games along these twovariables. The vertical dimension captures a new game’s impact on a firm’sproduct position. In particular, it captures the extent to which a game is so newgame as to render existing products and/or positions vis-à-vis coopetitors non-competitive. The horizontal axis captures a new game’s impact on resources/capabilities. It captures the extent to which the resources/capabilities needed toplay the new game are so different from existing ones that the latter are ren-dered obsolete. These are the resources/capabilities that go into offering a prod-uct to customers—resources/capabilities such as the equipment, locations,skills, knowledge, intellectual property, relationships with coopetitors, andknow-how that underpin value chain activities such as R&D, design, manu-facturing, operations, marketing, sales, distribution, human resources/capabil-ities, purchasing, and logistics. The resulting four quadrants of the two-by-twomatrix represent different types of new games (Figure 1.3). New gamenessincreases as one moves from the origin of the matrix of Figure 1.3 to the topright corner, with the regular new game being the least new game while the
Introduction and Overview 23

revolutionary game is the most new game. We now explore each of the fourtypes of new games.25
Regular
In a regular new game, a firm uses existing value chain resources/capabilities orbuilds on them to (1) offer a new product that customers value but the newproduct is such that existing products in the market are still very competitive,and/or (2) improve its position vis-à-vis coopetitors but the new position doesnot render existing ones noncompetitive.
New Product
If a regular new game offers a new product, the product may take some marketshare from existing products, but the latter remain profitable enough to be acompetitive force in the market. The new games pursued by Coke and Pepsi inintroducing products such as diet or caffeine-free colas were regular new games.Both firms did some things differently but the resources/capabilities that theyused built on existing ones and the resulting products allowed their regularcolas to remain competitive. Gillette also played a regular new game when itintroduced most of its razors. For example, the Mach3 razor with three blades,introduced in 1998, allowed the twin-blade Sensor and competing products toremain in the market.26 The five-blade Fusion, introduced in 2006, allowed the
Figure 1.3 Types of New Game.
24 Introduction

three-blade razor to remain competitive. All razors used different extensions ofGillette’s mechanical blade technology to offer each new product, and eachproduct, despite being well received by customers, allowed previous products toremain a competitive force in the market. Marketing was also designed to makeimprovements to the firm’s positioning vis-à-vis its coopetitors. Effectively, in aregular new game, a firm builds on existing resources/capabilities to deliver newproducts that are valued by customers but the new products are positioned sothat existing products remain competitive forces in the market.
Rather than introduce a brand new product, a regular new game can insteadmake refinements to an existing product and/or to the firm’s position vis-à-visits coopetitors through extensions of its resources/capabilities. The offering ofmany so-called new car models that are introduced every year are a goodexample. When this year’s model car is introduced, last year’s model is still acompetitive force to be aware of. Effectively, in a regular new game, what isdifferent about the activities being performed and therefore what qualifies themas new game is the fact that some of them are performed differently to improveproducts and the underpinning skills, knowledge, and know-how, or to positiona firm better vis-à-vis coopetitors. Offering a diet drink, for example, requireskeeping sugar out, adding an artificial sweetener, and convincing people that thenew drink tastes good and is good for them.
Position vis-à-vis Coopetitors
A regular new game can also better position a firm vis-à-vis coopetitors. Forexample, if a firm successfully convinces its suppliers to create a second sourcefor the components that it buys from the suppliers, it is effectively improving itsposition vis-à-vis suppliers using its existing resources/capabilities and withoutrendering existing positions noncompetitive.
A firm with an attractive PMP or valuable distinctive difficult-to-imitate-or-substitute resources/capabilities is the most likely to profit from a regular newgame. So-called strategic moves such as product preannouncement or howmuch to spend on R&D may be able to give a firm a temporary advantage; butlong-term competitive advantage depends on the existing resources/capabilitiesand product-market position.
Resource-building
In a resource-building new game, the resources/capabilities that are needed tomake the new product are so different from those that are used to make existingproducts that these existing resources/capabilities are largely useless for per-forming the new activities; that is, the degree to which existing resources arerendered obsolete is high (Figure 1.3). However, the resulting (1) new product issuch that existing products remain largely competitive in the market, and/or (2)new position vis-à-vis coopetitors is such that existing positions remain largelycompetitive. Changes in the rules of the game are largely resource/capabilities-related.
Introduction and Overview 25

New Product
The pursuit of ethanol as a fuel for cars is a good example of a resource-buildingnew game. Making ethanol—especially from cane sugar, sugar beat, corn, orsweet potatoes—requires very different capabilities from those used to drill,pump out, transport, and refine petrol to get gasoline for use in cars; but bothfuels coexist in the market. The strategies for pursuing the electric razor werealso resource-building but position-reinforcing. The electric razor uses a radic-ally different technology (combination of battery, electric motor, and movingparts) from the mechanical razor, which has only mechanical parts. Thus, theengineering capabilities needed for one can be very different from those neededfor the other. However, the electric razor and the manual mechanical razorcoexist in the market for shavers. Another example is the use of synthetic rub-ber (made from oil) and natural rubber from trees to make tires and otherrubber products. Making synthetic rubber from petroleum is very differentfrom tapping sap from trees and turning it into rubber, but the rubber from bothsources remains competitive.
Position vis-à-vis Coopetitors
From a positioning vis-à-vis the coopetitor’s point of view, a new game isresource-building if the resulting new position allows existing positions toremain competitive but the resources/capabilities needed are radically differentfrom existing resources/capabilities. A good example is Dell’s direct sales,which improved its power vis-à-vis buyers by bypassing the more powerfuldistributors to deal directly with the more fragmented end-customers. Distribu-tors still remained a viable sales avenue for Dell’s competitors. Dell needed verydifferent manufacturing, business processes, and relationships to support thenew game.
Position-building
In a position-building new game, the resulting new PMP is so superior toexisting PMPs that (1) new products introduced render existing ones largelynoncompetitive, and/or (2) the new positions, vis-à-vis coopetitors, renderexisting ones primarily noncompetitive; that is, the degree to which the newgame renders existing products and/or positions vis-à-vis coopetitors noncom-petitive is high (Figure 1.3). However, the resources/capabilities needed to makenew products are the same as existing resources/capabilities or build on them.Changes in the rules of the game are largely PMP-related.
New Product
The new games pursued by Intel over the years in introducing different gener-ations of its microprocessors fall into this category. The P6 (Pentium Pro intro-duced in 1995 and Pentium II introduced in 1997) replaced the P5 (Pentium),which had been introduced in 1993. The Pentium replaced the 486 whichreplaced the 386 which had replaced the 286. Each new product met the newneeds of customers. Throughout, Intel built on its core X86 processor and
26 Introduction

semiconductor technologies as well as on its distribution capabilities to intro-duce each new product. This is not to say that the semiconductor technologywas not advancing. It did advance at tremendous rates, especially if measuredby the benefits perceived by customers; but each generation of the technologybuilt on the previous generation while introducing things that were new anddifferent. Existing core capabilities were not rendered obsolete.
Some of the new games used to exploit disruptive technologies fall into thiscategory. For example, the strategies pursued by the firms that used the PC todisplace minicomputers were position-building, since PC technology built onminicomputer technology but minicomputers were rendered noncompetitive byPCs. Other examples include the strategies for the mini-mills used to make steelversus integrated steel mills.
Position vis-à-vis Coopetitors
There are also position-building strategies that have little to do with offering anew product. For example, software firms can sell their software directly tocustomers who can download the software directly from the firms’ sites. Bydealing directly with the more fragmented end-customer rather than the moreconcentrated distributors, software firms are effectively better positioned vis-à-vis their customers than before the days of the Internet. Another example of aposition-building new game would be to eliminate competitors, where legal, toa point where one becomes a monopoly and the resources/capabilities neededto exploit the monopoly position build on existing resources/capabilities. Thiscan be done through acquisition of competitors or predatory activities such aspricing, where legal.
Revolutionary
In a revolutionary new game, the organizational resources/capabilities neededto build new products are so different from those used to make existing prod-ucts that these existing resources/capabilities are largely useless for performingthe new activities. At the same time, the new PMP is so different from existingones that (1) new products render existing ones largely noncompetitive, and/or(2) any new positions vis-à-vis coopetitors created render existing ones non-competitive. A revolutionary new game redefines what creating and capturingvalue is all about while overturning the way value chain activities have beenperformed before. The rules of the game are changed both resource/capabilities-wise and PMP-wise. It is the most new game of all the new games. Examples,from a new products point of view, include the new games pursued by makersof refrigerators which replaced harvested ice as a cooling device, automobileswhich displaced horse-driven carts, online auctions which replaced offline auc-tions, electronic point of sales registers that replaced mechanical cash registers,and iPods which have displaced Walkmans. In each case, the technologicalresources/capabilities needed to offer the new product were radically differentfrom those that underpinned the displaced product. Moreover, the new productdisplaced existing products from the market. The new games played in the faceof most disruptive technologies also fall into this category.
Introduction and Overview 27

What is Strategy?In defining a new game strategy as a set of activities that creates and/orappropriates value in new ways, we are implying that a firm’s strategy is the setof activities that the firm performs to create and appropriate value. The ques-tion is, how does this definition of strategy compare to other definitions in thestrategic management literature? The problem with this question is that strategyhas too many definitions. One reason for the multitude of definitions is thatstrategy is about winning, and since what it takes to win in business has evolvedover the years, the definition of strategy has also evolved. For example, in the1960s, when most reconstruction, following World War II, had already takenplace and there was a lot of demand for goods in the growing economies of thecapitalist world, the biggest challenge for managers was to plan for this growthand keep up with demand. Thus, the dominant theme in the field of strategicmanagement at the time was corporate planning, and managers were largelyconcerned with planning growth—how to allocate resources/capabilities tomeet demand. The following two definitions of strategy fit the context atthe time:
the determination of the basic long-term goals and objectives of an enter-prise, and the adoption of courses of action and the allocation of resourcesnecessary for carrying out these goals.
(Alfred Chandler in 1962)27
the pattern of objectives, purposes, or goals and major policies and plans forachieving these goals, stated in such a way as to define what business thecompany is in or is to be in and the kind of company it is or is to be.
(Kenneth Andrews in 1971)28
In the late 1970s and early 1980s, emphasis moved to strategy as position, in alarge measure because of Professor Michael Porter’s influential work.29 In thelate 1980s and early 1990s, emphasis changed to include resources, capabilities,and core competences, following Professors C.K. Prahalad’s and Gary Hamel’sinfluential work on the core competence of the firm and the increasing popular-ity of the resource-based view of the firm.30 These changes would lead to def-initions such as:
Strategy is the creation of a unique and valuable position, involving a differ-ent set of activities.
(Michael Porter in 1996)31
A strategy is a commitment to undertake one set of actions rather thananother and this commitment necessarily describes allocation of resources.
(Sharon Oster in 1999)32
Strategy is an overall plan for deploying resources to establish a favorableposition vis-à-vis competitors.
(Robert Grant in 2002)33
28 Introduction

A strategy is an integrated and coordinated set of commitments and actionsdesigned to exploit core competences and gain a competitive advantage.
(Hitt, Ireland and Hoskisson, 2007)34
Mintzberg’s classification of strategies using his 5Ps captured this diversity ofdefinitions. He argued that strategy can be a:
Plan—“some sort of consciously intended course of action, a guideline (orset of guidelines) to deal with a situation.”35
Ploy—“specific ‘maneuver’ intended to outwit an opponent orcompetitor.”36
Pattern—“specifically, a pattern in a stream of actions . . . consistency inbehavior, whether or not intended.”37
Position—“a means of locating an organization in its ‘environment’ . . .usually identified with competitors.”38
Perspective—“the ingrained way of perceiving the world.”39
More lately, Professors Hambrick and Frederickson have argued that a firm’smission drives its objectives, which drive its strategy.40 This strategy has fiveelements:
Arenas: Where will the firm be active?Vehicles: How will the firm get there?Staging: What will be the firm’s speed and sequence of the moves to getthere?Differentiators: How will the firm set itself apart so as to win?Economic logic: How will the firm generate returns on its investment?
Whatever the definition of strategy, the bottom line is that firms have to makemoney if they are going to stay in business for long—they have to create eco-nomic value; and revenues come from customers who pay for what they per-ceive as valuable to them. If these customers are to keep going to a firm ratherthan to its competitors, the firm must offer these customers unique benefits thatcompetitors do not. The firm has to create unique value for these customers—value that is difficult for competitors to replicate, leapfrog, or substitute. How-ever, creating value—even unique value—does not always mean that one canappropriate it. Thus, a firm should also be well positioned—vis-à-vis its coo-petitors—to appropriate the value that it creates. Effectively, then, winning ormaking money in business is about creating and appropriating value; and sincestrategy is about winning, we can define business strategy as the set of activitiesthat a firm performs to create and appropriate value.
Flow of the BookThis book is about value creation and appropriation, and the underpinningactivities and resources/capabilities in the face of new games. It is about stra-tegic innovation. Thus all the chapters of the book are about some element ofactivities, value, appropriation, and change. The book is divided into fourparts (Figure 1.4). Part I is made up of Chapters 1, 2, and 3. Chapter 1 is the
Introduction and Overview 29
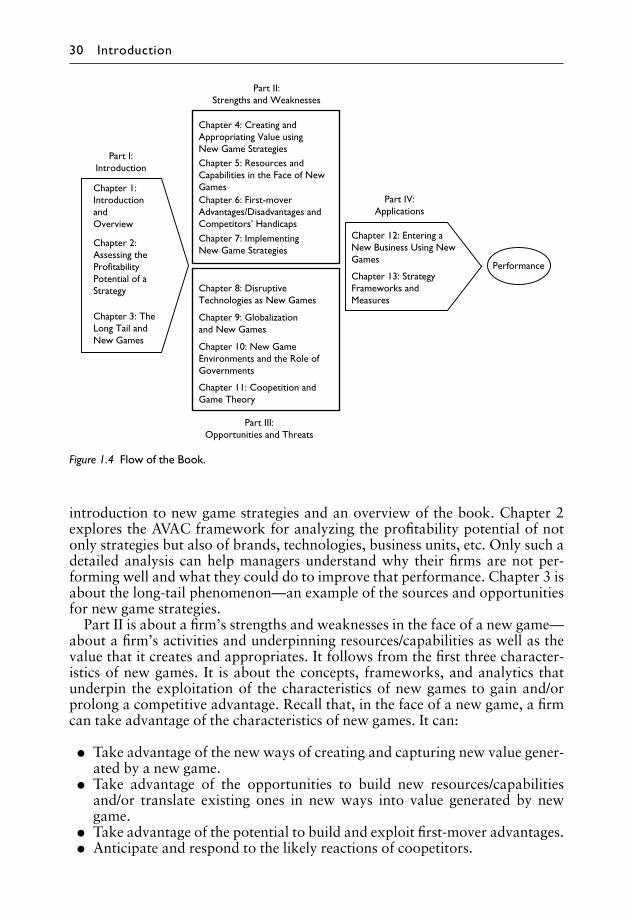
introduction to new game strategies and an overview of the book. Chapter 2explores the AVAC framework for analyzing the profitability potential of notonly strategies but also of brands, technologies, business units, etc. Only such adetailed analysis can help managers understand why their firms are not per-forming well and what they could do to improve that performance. Chapter 3 isabout the long-tail phenomenon—an example of the sources and opportunitiesfor new game strategies.
Part II is about a firm’s strengths and weaknesses in the face of a new game—about a firm’s activities and underpinning resources/capabilities as well as thevalue that it creates and appropriates. It follows from the first three character-istics of new games. It is about the concepts, frameworks, and analytics thatunderpin the exploitation of the characteristics of new games to gain and/orprolong a competitive advantage. Recall that, in the face of a new game, a firmcan take advantage of the characteristics of new games. It can:
• Take advantage of the new ways of creating and capturing new value gener-ated by a new game.
• Take advantage of the opportunities to build new resources/capabilitiesand/or translate existing ones in new ways into value generated by newgame.
• Take advantage of the potential to build and exploit first-mover advantages.• Anticipate and respond to the likely reactions of coopetitors.
Figure 1.4 Flow of the Book.
30 Introduction

• Identify and exploit the opportunities and threats from the industry, macro,or global environment.
Since strategy is about creating and appropriating value, taking advantage ofthe new ways of creating and capturing value generated by a new game iscritical to profiting from a new game. Thus, Chapter 4 is about value creationand appropriation in the face of new games; and since resources/capabilities area cornerstone of value creation and appropriation, taking advantage of theopportunity to build new resources/capabilities and/or translate existing ones innew ways into value can play a significant role during new games. Thus, inChapter 5, we explore the role of resources and capabilities in the face of newgame strategies. Since a firm can build and exploit first-mover advantages toattain or solidify its competitive advantage, we explore first-mover advantagesand disadvantages as well as competitors’ handicaps in Chapter 6. Since astrategy is often only as good as its implementation, we dedicate Chapter 7 tothe implementation of new game strategies; we explore more about resources/capabilities, this time focusing on implementation resources/capabilities—thoseresources and capabilities that are used to execute a strategy.
Part III is about the opportunities and threats that a firm faces when it pur-sues a new game strategy, and follows from the last two characteristics of newgames—the fact that (1) new games attract reactions from new and existingcompetitors, and (2) have their roots in the opportunities and threats of a firm’senvironments. Disruptive technologies are a very good example of opportun-ities or threats from new games. Thus, we start Part III with an exposition ofdisruptive technologies in Chapter 8. In particular, we explore how one can usethe concept of disruptive technologies to detect opportunities and threats fromnew games. This is followed by an exploration of globalization through newgames and value appropriation by global players in Chapter 9. In Chapter 10,we briefly explore the environments in which new games take place. In particu-lar, we explore which environments are conducive to new game activities andthe role that governments can play in shaping such environments. We concludePart III by exploring how and why a firm should take the likely reaction ofcoopetitors into consideration when it takes a decision. Although game theoryis not the theory of strategy, it can be very useful in exploring how a firm cantake the likely reaction of its coopetitors into consideration when making itsdecisions. In Chapter 11, we summarize the relevant cooperative and non-cooperative game theory, and start applying it to coopetition and competitionin the face of new games.
In Part IV, we explore the application of the concepts and tools of Parts II andIII to strategy and business model questions. Chapter 12 is about entering a newbusiness using new games. For entrepreneurs or any new entrant, the chaptersuggests that a firm is much better off entering a new business using new gamesrather than trying to beat incumbents at their game. Although strategy litera-ture usually does not encourage entering unrelated businesses, using new gamesto enter new businesses can reduce some of the pitfalls of entering unrelatedbusinesses. Chapter 13 presents a summary of key strategy frameworks. This isa good and popular reference for students, professors, and managers alike.
Part V consists of twelve cases of firms and products in game-changing situ-ations. These include New World wine makers, Sephora, Netflix, Threadless,
Introduction and Overview 31

Pixar, Lipitor, New Belgium Brewery, Botox, IKEA, Esperion, Xbox 360,and the Nintendo Wii. These cases are meant to illustrate the concepts ofthe book.
More chapters, cases, and potential additions to the book can be found atacateh.com:
Key Takeaways
• Strategy is about winning. It is about creating value and putting a firm in aposition to appropriate the value. It is about not only creating benefits forcustomers but also putting a firm in a position, vis-à-vis coopetitors, toprofit from the value created.
• A new game strategy is a set of activities that creates and/or captures valuein new ways. New game strategies often overturn the way value has beencreated and/or appropriated—they often redefine the rules of the game.New game strategies are an excellent way to create and appropriate value.They can be very profitable if well pursued.
• A firm creates value when it offers customers something that they perceiveas valuable (beneficial) to them and the benefits that these customers per-ceive exceed the cost of providing them. The value appropriated (captured)is the profit that a firm receives from the value it created.
• New games go beyond product innovation; they are often about deliveringexisting products to customers in new ways, or better positioning a firm tocapture existing value.
• First movers, in defining new rules of the game, often make money; but sodo followers. The important thing is to pursue the right new gamestrategy.
• Firms often must cooperate to create value and compete to appropriate it.• The cornerstones of new game strategies are new game activities. A new
game activity is a new value chain activity or an existing activity that isperformed differently from the way existing industry value chain activitieshave been performed to create and/or appropriate value. Because a set canhave only one member, a new game activity can be a new game strategy.
• New game activities are of interest not only because they are the corner-stones of new game strategies, but also because many strategy decisions aretaken one action at a time.
• When a firm performs activities, it can (1) produce a product with benefitsthat customers value, (2) better position itself vis-à-vis its coopetitors, or (3)do both.
• To profit fully from the product, the firm must price it well, seek relevantsources of revenue, seek out customers for the product, and position it inproduct spaces with little competition.
• To profit from the better position vis-à-vis coopetitors, a firm must exploitthe position to capture the value that it has created, or capture the value thatits coopetitors have created.
• When firms perform new value chain activities or perform existing activitiesdifferently, they are effectively playing new games. New games posses thefollowing characteristics. They:
32 Introduction

� Generate new ways of creating and capturing new value.� Offer opportunities to build new resources/capabilities and/or translate
existing ones in new ways into value.� Create the potential to build and exploit first-mover advantages and
disadvantages.� Potentially attract reactions from new and existing competitors.� Often have their roots in the opportunities and threats of a firm’s
environments.
• A firm that uses new games to offer unique value to customers and uniquelyposition itself to appropriate the value, can use first-mover advantages tosolidify its advantage in value creation and appropriation. The firm canfurther solidify the advantage by anticipating and responding appropriatelyto coopetitors’ likely reactions, and identifying and taking advantage of theopportunities and threats of its environment.
• A new game usually does not take place in isolation. It is usually preceded,followed or played in parallel with other games.
• Strategic management has been evolving. And so has the definition of strat-egy from one that had more to do with long-term plans, objectives, andallocation of resources to one that is now more about creating andappropriating value.
• New games can be grouped by their new gameness. In particular, they canbe grouped by the extent to which they impact two determinants of com-petitive advantage: (1) product-market position (PMP) and (2) distinctivedifficult-to-imitate resources/capabilities. Such a grouping results in fourtypes of new games—regular, resource-building, position-building, andrevolutionary—with the regular new game being the least new game, andrevolutionary being the most new game.
• Regular new games are about making improvements and refinements toboth existing resources/capabilities and product-market positions. They arethe least new game of the four types. Capabilities needed are the same asexisting ones or build on them. The resulting product or position allowsexisting products to still be competitive in the market.
• In resource-building games existing products or positions remain competi-tive but the resources/capabilities needed are radically different from exist-ing ones. Changes in the rules of the game are largely resource/capabilities-related.
• In position-building games, the resources/capabilities needed are existingones or build on them but the new product-market positions are radicallydifferent. Changes in the rules of the game are largely PMP-related.
• In revolutionary games, the resources/capabilities needed and the product-market-positions pursued are radically different from existing ones. Theyare the most new game of the four new game strategies. Changes in the rulesof the game are both PMP and resource/capabilities-related.
Key Terms
ActivitiesAppropriability
Introduction and Overview 33

ChangeCompetitive advantageCoopetitorsHandicapsNew game activitiesNew game strategiesPosition vis-à-vis coopetitorsPosition-building new gameRegular new gameResource-building new gameRevolutionary new gameStrategic innovationStrategyValueValue appropriationValue creation
34 Introduction

Assessing the ProfitabilityPotential of a Strategy
Reading this chapter should provide you with the conceptual and analyticaltools to:
• Go beneath a firm’s financial performance to understand the profitabilitypotential of the firm’s strategy.
• Use the Activities, Value, Appropriability, and Change (AVAC) frameworkto explore the profitability potential of products, resources, brands, busi-ness units, etc.
• Question the use of P/E financial ratios to determine whether or not a stockis overvalued.
IntroductionHow can a firm or an investor tell if one strategy is better than others? Sincebusiness strategies are usually about performance, a trivial answer to this ques-tion is to compare the profitability of each business and the one with the highestprofitability is judged to have the best strategy. But suppose one of the busi-nesses is a startup that is not yet profitable but has the potential to be profitablein the future. Better still, suppose one wants to find out what can be done toimprove the profitability of a strategy. Only a detailed analysis of the underpin-nings of profitability can unearth any hidden potential or faults that a strategymight have. Even better still, if an investor wants to invest in a startup that doesnot have a long history of steady earnings, profitability numbers are not likelyto tell a good enough story. Existing frameworks such as the Balanced Score-card, Porter’s Five Forces, Growth/Share matrix, SWOT analysis, the 7Cs, andother frameworks are useful in exploring different aspects of firm profitability.However, they are not integrative enough and therefore leave out importantdeterminants of profitability potential.
In this chapter we explore a framework for assessing not only why a firm isperforming well or not so well, but also for assessing the profitability potentialof a strategy or business model, and strategic actions. Called the AVAC frame-work, it is predicated on the argument that strategy is about value creation andappropriation.1 A related framework, called the 7Cs, also adequately exploreswhy a firm is performing well or not so well but the AVAC is better for explor-ing new game strategies. The AVAC framework is about understanding how afirm creates value and positions itself to appropriate the value, and about whatelse it could do to perform even better. It can therefore be used not only to
Chapter 2

analyze the profitability potential of a firm’s strategy but also to analyze theprofitability potential of business models, business units, products, technolo-gies, brands, market segments, acquisitions, investment opportunities, partner-ships such as alliances, different departments such as an R&D group, and cor-porate strategies, and make recommendations as to what needs to be done toimprove the profitability potential of the target. We start the chapter by brieflyexploring two financial measures that are sometimes used to estimate the prof-itability potential of strategies. We will then lay out the key elements of theAVAC framework, and follow that with an example to illustrate the use ofthe model.
Financial MeasuresFinancial measures are sometimes used to measure the extent to which onestrategy is better than another. We consider two of them: historical earnings andmarket value.
Historical Earnings
A firm’s historical earnings are sometimes used to measure the profitabilitypotential of the firm’s strategy. Actual earnings-before-interest-depreciation-and-tax (EBIDT), net income, income per sales, etc. over a period are used topredict future earnings and therefore the effectiveness of a strategy. These esti-mates provide some idea of how profitable a firm’s strategy has been and mightbe in the future. This approach has many shortcomings. First, it assumesthat historical earnings are a predictor of future earnings. Such an assump-tion undermines the fact that a firm’s strategy might change, competitorsmight change their own strategies, or the environment in which the firm oper-ates might change. Earnings are not always a good predictor of futureearnings, let alone a good indicator of the profitability potential of a strategy.Second, earnings say nothing about the scale, difficulty, and shortcomings ofactivities that were performed to earn the profits and that might have to beperformed to earn future income. They say nothing about what is being done inthe trenches to create and appropriate value; that is, there is little about thecornerstones of profits—the resources and activities that go into creating andappropriating value.
Market Value
Another measure of a firm’s strategy’s profitability potential is the firm’s marketvalue. Recall that the value of a stock or business is determined by the cashinflows and outflows—discounted at the appropriate interest rate—that can beexpected to accrue from the stock or business. Thus, since strategy drives profitsand cash flows, a firm’s market value can be used to estimate the profitabilitypotential of the underpinning strategy. The value of a business or firm is thepresent value of its future free cash flows discounted at its cost of capital, and isgiven by:2
36 Introduction

V = C0 +C1
(1 + rk)+
C2
(1 + rk)2 +
C3
(1 + rk)3 + . . .
Cn
(1 + rk)n
= �t = n
t = 0
Ct
(1 + rk)t
(1)
where Ct is the free cash flow at time t. This is the cash from operations that isavailable for distribution to claimholders—equity investors and debtors—whoprovide capital. It is the difference between cash earnings and cash investments;rk is the firm’s discount rate.
An important assumption in using a firm’s market value as a measure of itsstrategy’s profitability potential is that the future cash flows from the strategycan be forecasted. The problem with this assumption is that forecasting futurecash flows accurately is extremely difficult. To determine the market value attime t, for example, we need to estimate the cash flows for all the years beyond t(see equation (1)). This can be difficult when t > 5. However, equation (1) can befurther simplified by assuming that the free cash flows generated by the firmbeing valued will reach a constant amount (an annuity) of Cf , after n years.Doing so, equation (1) reduces to:
V =Cf
rk (1 + rk)n
(2)
If we further assume that the constant free cash flows start in the present year,then n = 0, and equation (2) reduces to:
V =Cf
rk
(3)
Another way to simplify equation (1) is to assume that today’s free cash flows,C0, which we know, will grow at a constant rate g forever. If we do so, equation(1) reduces to:
V =C0
rk − g(4)
Equations (2), (3), and (4) have an advantage over equation (1) in that only onecash flow value has to be estimated rather than many difficult-to-forecastvalues. However, there may be more room to make mistakes when one dependson only one value.
Example
On March 15, 2000, Cisco’s market valuation was $453.88 billion. Its profitsin 1999 were $2.10 billion.3 Was Cisco overvalued? We can explore this ques-tion using equations (2), (3), or (4). From equation (3):
Assessing the Profitability Potential of a Strategy 37

453.88 =Cf
rk
From whence, Cf = $453.88 × rk billion; that is, the free cash flows that Ciscowould have to generate every year, forever, to justify its $453.88 billion valu-ation are Cf = $453.88 × rk billion. If we assume a discount rate of 15%, thenCisco would have to generate $68.8 (that is, $453.88 × 15) billion in free cashflows every year to infinity. Since free cash flows are usually less than profitsafter tax, Cisco would have to make annual profits of more than $68 billion tojustify this valuation. Its profits in 1999 were $2 billion. How can any companygenerate after-tax profits of more than $68 billion a year, forever? In particular,what is it about Cisco’s business model, its industry and competitors that wouldmake one believe that the company could quickly ramp its profits from $2billion to more than $68 billion and maintain that advantage forever? Only adetailed analysis of the company’s underpinning strategy can help us under-stand what it is about a company such as Cisco that would make it possible forthe firm to earn this much cash.
Beneath the Numbers
The AVAC analysis goes beyond profitability or market value numbers and digsdeeper into what drives the numbers; so do some previous strategy frameworks;but, as we will see later, AVAC does more. A. Porter’s Five Forces framework,for example, was designed to analyze the average profitability of industries buthas been used to evaluate the extent to which a firm’s strategy dampens orreinforces the competitive forces that impinge on a firm and its profitability.However, the Five Forces framework leaves out important aspects of valuecreation and appropriation that can be critical to the profitability of a strategy.It neglects the role of (1) change (the new game factor), (2) resources/capabil-ities/competences (including complementary assets), (3) industry value drivers,(4) pricing, (5) the number and quality of customers, and (6) market segmentsand sources of revenue. In the Balanced Scorecard, a firm is viewed from fourperspectives in developing metrics, collecting and analyzing data: learning andgrowth, internal business processes, customer, and financial.4 The Scorecardincorporates some aspects of value creation such as learning but falls short ofincorporating appropriation activities. It also has little or nothing about themacro and competitive forces that impact a firm as it creates value and positionsitself to appropriate value. The 7Cs framework goes beneath profitabilitynumbers and explores why some strategies are more profitable than others.5
However, it does not adequately get into what can be done to improve theprofitability of a new game strategy. The player-type framework that we willsee in Chapter 6 is good when a top-level manager wants to cut through lots ofdetailed information and get a feel for where his or her firm stands as far asbeing a superstar, adventurer, exploiter, or me-too; but it does not dig deep intothe activities that a firm performs to create and appropriate value. Popularstrategy frameworks such as the Growth/Share matrix and SWOT analysis donot explicitly evaluate the profitability of a strategy. The AVAC frameworkovercomes these shortcomings.
38 Introduction

The AVAC FrameworkThe AVAC framework gets its name from the first letter of each of its fourcomponents (Activities, Value, Appropriability, and Change). These com-ponents are displayed in Figure 2.1.6
Brief Logic of the Framework
Before describing the components of the framework in detail, let us brieflyexplore the rationale behind them. The framework has its roots in the definitionof strategy. Since we have defined a firm’s strategy as the set of activities that itperforms to create and appropriate value, we can assess a strategy by examininghow and the extent to which these activities contribute to value creation andappropriation. Since not all activities contribute equally to value creation, thetypes of activity which a firm chooses to perform, when it chooses to performthem, where it performs them, and how it performs them are important—thatis, a firm has to choose the right set of activities to perform to increase itschances of creating the most value possible and capturing as much value fromits value system as possible. Thus, the Activities component of the AVACframework is about determining whether the right set of activities has beenchosen. For a firm to keep making money from the value that it has created,there must be something about the value that makes customers prefer to buyfrom the firm rather than from its competitors—the value should be unique.
Figure 2.1 Components of an AVAC Analysis.
Assessing the Profitability Potential of a Strategy 39

Hence the Value component, which is about whether the activities, collect-ively, contribute enough to value creation for customers to prefer the perceivedbenefits in the value as better than those from competitors. Since not evenunique value can always guarantee profits, it is also important that the firmtranslates the value into money—that the firm finds a way to appropriate thevalue. The firm should be positioned well enough vis-à-vis its coopetitors tomake sure that the coopetitors do not capture the value that it has created. Infact, if it positions itself well, it can capture not only the value that it hascreated but also the value created by its coopetitors. Hence the Appropriabilitycomponent, which is about whether the activities performed are such that thefirm makes money. Finally, a firm will continue to create and capture valueusing the same activities and underpinning resources only if there is no majorchange, or when there is change, the change reinforces what the firm is doing,or the firm can react well to it. Hence the Change component that is behind thequestion: does or will the firm take advantage of change in value creation andappropriation?
Effectively, the activities component of the analysis tells us which activitiesmake up the strategy, what and how each activity contributes to value creationand appropriation, and where or when the contribution is made. The valuecomponent explores the extent to which the contributions made by the activ-ities are unique enough for customers to prefer the firm’s products to com-petitors’ products. The appropriability component explores whether thecontributions made by the activities are large enough to put the firm in asuperior position vis-à-vis its coopetitors and for the firm to profit from theposition and the value created. The change component is about whether thefirm is doing what it can to exploit existing change or future change. We nowexplore each of these components in detail (Figure 2.2).
Activities (Is the Firm Performing the Right Activities?)
The activities which a firm performs, when it performs them, where it per-forms them, and how it performs them determine the extent to which thefirm creates and appropriates value and the level of competitive advantagethat it can have. Therefore the central question for this component iswhether the firm is performing the activities which it should be performing,when it should be performing, where it should be performing, and how itshould be performing them to give it a competitive advantage? We answerthis question indirectly by exploring whether or not each activity contributesto value creation and appropriation. In Chapter 1, we saw that when a firmperforms an activity, the activity can contribute to lowering the cost of itsproducts, differentiating the product, moving its price towards the reserva-tion price of customers, increasing the number of customers, or finding prof-itable sources of revenue. We also saw that an activity can also contribute toimproving the firm’s position vis-à-vis its coopetitors by, for example, damp-ening or reversing repressive competitive forces while reinforcing favorableones, or improving relationships from adversarial to friendly. Thus, twoquestions that can give us a good idea of whether a firm is performing theright activity are, if the activity contributes, (1) to low cost, differentiation,better pricing, reaching more customers, and better sources of revenues, and
40 Introduction

Figu
re2.
2D
rive
rs o
f the
Com
pone
nts
of a
n A
VAC
Ana
lysi
s.

(2) to improving the firm’s position vis-à-vis coopetitors—for example,dampening repressive competitive and macroenvironmental forces whilereinforcing friendly ones.
However, in each industry, there are usually some industry-specific factorsthat stand to have a substantial impact on cost, differentiation, or other driversof profitability such as the number of customers. Thus, activities that takeadvantage of these industry value drivers make a larger contribution to valuecreation and appropriation than those that do not. For example, in offlineretailing, location is an industry value driver since it determines the type andnumber of customers who can shop there, the cost of operations, the cost ofretail space, and the number and types of competitor, and so on. A firm thatchooses the right location is taking advantage of industry value drivers. Thus, athird important question that helps us determine if an activity is the right one isif the activity takes advantage of industry value drivers.
Moreover, resources and capabilities play two crucial roles in creating andappropriating value. First, they are at the root of all activities and can be asource of competitive advantage. For example, Toyota’s ability to develop andmanufacture dependable cars, using its lean manufacturing processes, is ascarce resource/capability that enables it to create value that is difficult to repli-cate. Second, resources act as differentiators. For example, a firm’s brand orreputation can be the reason why customers buy the firm’s products rather thancompetitors’ products. Thus, a firm’s activities can contribute to value creationand appropriation when they contribute either to building valuable resourcesand capabilities, or to translating existing ones into unique customer benefits, tobetter position a firm vis-à-vis its coopetitors, or to translate customer benefitsand position into profits. Therefore, a fourth question the answer to which cantell us if an activity is the right one is—does the activity contribute to buildingnew distinctive resources/capabilities, or to translating existing ones intounique positions and profits?
Finally, in choosing how many activities to perform, a firm is guided by tworather opposing forces. On the one hand, a firm does not want to leave out someactivity that could have made a significant contribution to value creation andappropriation. It wants its set of activities to be as comprehensive as possible—to include as many relevant activities as possible. On the other hand, having toomany activities, especially low value-adding activities, can be costly. A firmwants to be parsimonious—perform as few activities as possible without leav-ing out key activities. Thus, a firm not only has to perform the right types ofactivities, it also has to perform the right number of activities. Therefore, thefinal question that a firm ought to ask in assessing its strategy is—is it perform-ing superfluous activities, or are there some activities that it should beperforming?
Effectively, analyzing the Activities component of an AVAC consists ofdetermining the extent to which each activity:7
1 Contributes to low cost, differentiation, better pricing, reaching morecustomers, and better sources of revenues.
2 Contributes to improving its position vis-à-vis coopetitors.3 Takes advantage of industry value drivers.4 Contributes to building new distinctive resources/capabilities or translating
42 Introduction

existing ones into unique positions and profits (including complementaryassets).
5 Fits the comprehensiveness and parsimony criteria.
We now explore all five questions.
Contribute to Low Cost, Differentiation, or other Drivers ofProfitability?
The idea is to determine whether each activity which a firm performs, when itperforms it, how it performs it, and where it performs it contributes towardslowering its cost, differentiating its products, increasing the number of its cus-tomers, improving its pricing, or better identifying and serving profitablesources of revenues. If the activity does, the answer to the question is Yes. If itdoes not, the answer is No. For example, when a luxury goods maker advertisesto the affluent, the activity may be contributing to differentiating its products,and therefore contributing to value creation. Thus the answer to this questionwould be Yes. If a firm obtains a second source for a critical input, it may beable to extract lower prices from its suppliers, thereby lowering its cost, andcontributing to the value that it creates and appropriates. Activities that con-tribute to increasing the number of customers that buy a product, getting theprice right, and pursuing the right sources of revenue also make a contributionto the revenue earned.
Contribute to Improving a Firm’s Position vis-à-vis Coopetitors?
An activity contributes to improving a firm’s position vis-à-vis its coopetitors ifit improves the extent to which coopetitors need the firm more than it needsthem. For example, if a firm convinces its suppliers of a key component to havesecond sources for the component, the firm now needs the supplier less and thisincreases the firm’s position vis-à-vis the supplier. A classic example of a firmimproving its position vis-à-vis coopetitors is that of Wal-Mart. When the com-pany started out, it had very little influence over major suppliers such as Procter& Gamble, who dictated the terms of exchange. As Wal-Mart scaled up itsactivities by saturating contiguous small towns with discount stores and build-ing appropriate distribution centers, using information technology extensively,and establishing the Wal-Mart culture, it chipped away at the balance of whoneeded whom more. The firm would grow to become the world’s largest retailerat some point. Many of Wal-Mart’s activities were new game activities in theretail industry at the time and helped the company to reverse the balance of whoneeded whom more in Wal-Mart’s favor.
When we talk of improving a firm’s position, it does not necessarily meanthat the firm is starting from a bad situation. A firm can already be in a goodposition and perform an activity that improves the situation, putting it in aneven better position vis-à-vis its coopetitors. For example, if industry firms arein a superior position vis-à-vis buyers and one of the firms buys some of itscompetitors, it improves its position vis-à-vis buyers since there are now fewerfirms. This is likely to increase the amount of value that the firm appropriates.
Assessing the Profitability Potential of a Strategy 43

Take Advantage of Industry Value Drivers?
The next question is, whether, in performing an activity, a firm has taken advan-tage of industry value drivers. A firm takes advantage of industry value driversif the activity exploits an industry-specific factor to reduce cost, further differen-tiate its products, or improve other profit drivers such as the number of itscustomers. Answering this question entails listing the industry value drivers inthe industry and identifying which activities take advantage of them. Theanswer to the question is Yes, if the firm’s activities take advantage of theindustry value drivers identified.
Contribute to Building New Distinctive Resources/Capabilities orTranslating Existing Ones into Unique Value?
Each activity that a firm performs exploits some of its resources and capabil-ities, or contributes to building new resources/capabilities. Thus, one of thequestions that a firm should ask about each activity that it performs is whetherthe activity contributes to exploiting its existing resources/capabilities better, orto building distinctive resources/capabilities (new or old). By identifying theresources/capabilities that are valuable to a firm, one can determine which ofthem are being exploited by existing activities or are being built by theseactivities.
Are Comprehensive and Parsimonious?
Whereas the other questions are about each individual activity, the com-prehensiveness and parsimony question is about the whole set of activities thatconstitutes the firm’s strategy. After laying out the set of activities, a firm shouldcarefully explore what other activities it should be performing, that it is notpresently performing. It should also think about dropping some of the activitiesthat make the least contribution towards value creation and appropriation. Ifthere are no activities that it should be performing, or that it should drop, theanswer is Yes, since the strategy is comprehensive and parsimonious.
Effectively, the Activities component of the AVAC analysis starts out by iden-tifying all the key activities that make up the strategy. Then, for each question,see if any of the identified activities make the contribution called for in thequestion. If the answer to a question is a No, the firm may need to take anotherlook at the particular factor and find ways to reverse things. When the answer isa Yes, there is still always room for improvement. For example, if the answer isYes, the firm still has to think of ways to reinforce the Yes. Note that wherethere are multiple answers to a question, it only takes one positive for thequestion to get a Yes. Take Question 1, for example. If an activity contributes tolow costs but does not contribute to differentiation, etc., Question 1 still gets aYes. However, the analyst now knows that something could be done to improvedifferentiation, increase number of customers, etc. One of the most usefulapplications of an AVAC analysis is in identifying possible areas for improve-ment; and these areas of improvement come out clearly when a questionscores a No.
44 Introduction
Value (Is the Value Created by the Strategy Preferred byMany Customers? Yes/No)
The Activities component tells us whether or not each activity contributes tovalue creation, but it does not tell us whether the contributions are enough tomake a difference with customers. It does not tell us if the contributions of allthe activities, when added together, are unique enough to make customers pre-fer the firm’s products to competitors’ products. The Values component allowsone to explore whether the set of activities that is a firm’s strategy creates valuethat is unique enough for customers to prefer it to competing value. If customersare going to keep buying from a firm, its strategy needs to create benefits thatthey perceive as being unique compared to competitors’ offerings. Thus, thefirst question in the Value component is whether the value created is uniqueenough, as perceived by customers, for them to prefer it to competing value.Since the number of customers that perceive value as unique is also important,the next question is, do many customers perceive the value as unique? The morecustomers that perceive the benefits created, the higher the revenue potential islikely to be and the better the chances of having economies of scale and ofreducing the per unit costs; also, the more valuable a customer, the better theprofitability potential of the firm is likely to be in selling to the customer. Acustomer is valuable if it has a high willingness to pay, represents a decent shareof revenues, and does not cost much (relative to the revenues from the cus-tomer) to acquire and maintain. Finally, nearby white spaces into which a firmcan easily move, can also increase the profitability potential of a firm. A whitespace is a market segment that is not being served—it has potential customers.
Effectively, an analysis of the Value component is about determining theextent to which a firm’s strategy results in differentiated or low-cost productsthat are targeted at many valuable customers. Such an analysis is done byanswering the following simple questions with a Yes or No (Figure 2.2):
1 Do customers perceive the value created by the strategy as unique?2 Do many customers perceive this value?3 Are these customers valuable?4 Are there any nearby white spaces?
If the answer to the first three questions is Yes, the strategy is OK as far as theValue component is concerned. The firm can then work on reinforcing theYesses. If any of the answers are No, the firm may need to take another look atits strategy by asking the following questions: how can the value be improved?How can the firm gain new valuable customers or enter new market segments?If the answer to the fourth question is Yes, the firm may want to explore thepossibilities of getting into the white space. Finally, any opportunities andthreats to value, such as shifts in customer tastes or demographics, or a techno-logical change that can influence expected customer benefits, are also examined.
Appropriability
The Activities component tells us whether the activities which a firm performscontribute to better positioning it vis-à-vis its coopetitors, but it does not tell us
Assessing the Profitability Potential of a Strategy 45

if the contributions are enough to put the firm in a superior position relative toits coopetitors. Neither does it tell us if a firm that has a superior position vis-à-vis coopetitors exploits that position by, for example, setting its prices as closeas possible to the reservation prices of customers, or obtaining other conces-sions from customers. The Apropriability component tells us whether a firm hasa superior position vis-à-vis coopetitors, and whether the firm translates thecustomer benefits created and its position vis-à-vis coopetitors into money. Theanalysis consists of asking whether:
1 The firm has a superior position vis-à-vis its coopetitors.2 The firm exploits its position vis-à-vis its coopetitors and customer benefits.3 It is difficult to imitate the firm.4 There are few viable substitutes but many complements.
Does the Firm Have a Superior Position vis-à-vis Coopetitors?
A firm has a superior position vis-à-vis its coopetitors if it needs the coopetitorsless than they need it. Two factors determine whether a firm needs a coopetitormore, or vice versa: industry factors, and firm-specific factors. Take a firm andits suppliers, for example. Suppliers need a firm more than the firm needs them,if there are more suppliers than there are firms; that is because there are moresuppliers competing for the firm’s business. Effectively, the concentration ofboth the coopetitor’s and firm’s industries matter. Firm-specific factors are thosethings about firms that differ from one firm to the other, even within the sameindustry, and that often distinguish one firm from others. A firm’s valuable,scarce, difficult-to-imitate resources, such as its brand, are firm-specific factors.Such distinctive factors increase the likelihood of a firm being better positionedvis-à-vis coopetitors. For example, Coke’s brand pulls customers into stores andthat pull makes even large firms such as Wal-Mart carry Coke drinks eventhough there are many competing drinks. Coke’s brand makes Wal-Mart needCoke more than they would have without the brand.
Effectively, one can determine if a firm has a superior position vis-à-vis itscoopetitors by determining if the firm needs the coopetitor more, or the otherway around. The firm has a superior position vis-à-vis its coopetitors if the firmneeds them less.
Does the Firm Exploit its Position vis-à-vis Coopetitors, and Profit fromCustomer Benefits?
The next question is whether a firm exploits its position vis-à-vis coopetitorsand whether it profits from the benefits that customers perceive in the firm’sproducts. The value that a firm captures is a function of how well it exploits itsposition. For example, if a firm has a superior position vis-à-vis its suppliers, itcan extract lower input prices from them, thereby lowering its costs and increas-ing the value that it captures. (Recall that value captured equals price paid bycustomers less the cost of providing the customer with the product.) If a firm hasa superior position vis-à-vis its complementors, it can more easily convincethem to sell complements at lower prices, which will increase its own sales. Iteffectively captures some of the value created by complementors. For example,
46 Introduction

Microsoft is very powerful in the PC world and therefore, compared to PCmakers, appropriates a lot of the value created. A firm’s appropriation of valuecreated also depends on its position vis-à-vis coopetitors’ customers. If cus-tomers have a superior position, they are likely to extract low prices from thefirm, diminishing its share of the pie (share of the value created that itappropriates).
The value that a firm captures is also a very strong function of the firm’spricing strategy. Developing low-cost or differentiated products is great; but theproducts must be priced carefully so as not to drive customers away or leavemoney on the table. The closer that a firm can set its prices to each customer’sreservation price without driving customers away, the more money that a firmis likely to make. Recall that a customer’s reservation price for a product is themaximum price that the customer is willing to pay for the product. If the price ishigher than the reservation price, the customer may be lost. If the price is belowthe customer’s reservation price, the customer pockets the difference as con-sumer surplus. Back to the question, does the firm exploit its position vis-à-viscoopetitors, and profit from customer benefits? The answer is Yes, if either thefirm sets its prices as close as possible to the reservation prices of customers, orif it exercises its superior position in some other way.
Is it Difficult to Imitate the Firm?
If the value that a firm creates can be easily imitated, it will be difficult for thefirm to make money. Thus, an important question for a firm that creates value iswhether it is easy for existing rivals and potential competitors to imitate orleapfrog the firm’s set of activities. Two factors determine the extent to which afirm’s activities can be imitated. First, it depends on the firm and its set ofactivities. A firm can reduce imitability of its activities or resources/capabilities,for example, by acquiring and defending any intellectual property that under-pins such activities or resources. It can also establish a history of retaliatingagainst any firms that attempt to imitate its activities by seeking legal action,lowering its prices, introducing competitive products, or making early productannouncements. The complexity of the system of activities that a firm performscan also prevent competitors from imitating its set of activities. Imitating oneactivity may be easy; but imitating a system of activities is a lot more difficultsince one has to imitate not only the many activities that form the system butalso the interactions among the components. Resources and capabilities canalso be difficult to imitate when they are protected by law, are rooted in ahistory that cannot be re-enacted, are scarce and cannot be recreated, or requirea critical mass to be effective.
Second, whether a firm’s set of activities can be imitated is also a function ofthe potential imitators. Sometimes, potential imitators are unable to imitate afirm not so much because of the firm and its system of activities and resourcesbut because of the potential competitors’ prior commitments and lack of what ittakes to imitate. Prior commitments include union contracts, and agreementswith suppliers, distributors, governments, shareholders, employers, or otherstakeholders. When Ryanair started moving into secondary airports in Europe,it was difficult for established airlines such as Air France to abandon the majorairports such as General de Gaulle in Paris for secondary airports if they wanted
Assessing the Profitability Potential of a Strategy 47

to replicate Ryanair’s strategy. Performing activities requires resources andwhen such resources are scarce, a potential imitator might not be able to findthe resources that it needs to compete. For example, a firm may want to startproducing new cars but may not have what it takes to do so. Thus, in exploringappropriability, it is important to ask the following two questions: is theresomething about the firm and its set of activities and resources that makesit difficult for competitors to imitate its strategy? Is there something aboutcompetitors that impedes them from imitating the firm?
Are There Few Substitutes but Many Complements?
If a firm offers rare value that is difficult to imitate, it may still not be able toprofit enough from the value if there are products that can act as substitutes forthe value that customers derive from the firm’s products. Thus, a firm may bebetter off understanding the extent to which substitutes can take away thefirm’s customers. Complements have the opposite effect (compared to substi-tutes) on a firm’s products. Availability of complements tends to boost a prod-uct’s sales. Thus, customers would perceive a firm’s products as being morevaluable if such a product required complements and there were many suchcomplements available at good prices. For example, availability of software atlow prices boosted the sale of PCs. Two important questions for a firm, then,are: is the value that it creates nonsubstitutable? Do complements (if relevant)play a good enough role to boost the benefits that customers perceive fromthe firm?
Change: The New Game Factor
Change can have a profound effect on a firm’s ability to create and appropriatevalue. Change can originate from a firm’s environment, or from its new gamestrategies. It can come from a firm’s industry or macroenvironment. Forexample, government laws can raise or lower barriers to entry or exit, introduceprice limits, put limitations on the type of cooperation that firms can have, orimpose import quotas or tariffs, forcing them to change. Consumer tastes canchange, and changes in demographics can alter the willingness to pay of amarket segment. Technological change can result in new markets or industries,the disruption of existing ways of doing things, and the erosion of existingindustries and competitive advantages. Witness the case of the Internet. Inresponding to these changes from their environments, firms often introducechange in the way they create and appropriate value.
Change is often initiated by entrepreneurs or firms, through new game activ-ities. Firms invent new products that create new markets or new industries, and/or overturn the way value is created and appropriated in existing industries.Witness Intel’s invention of the microprocessor and its revolution of computing,or Wal-Mart’s reinnovation of discount retailing. Firms can also introducechange when they move into a new market or business, reposition themselvesvis-à-vis coopetitors, develop a new product, or restructure their internalactivities.
In any case, a firm has to deal with existing change and potential futurechanges. It has to create and appropriate value in the face of existing change but
48 Introduction

must also anticipate and prepare for future changes. Without constantly antici-pating and preparing for future change, a firm’s existing competitive advantagecan easily be undermined by events such as disruptive technologies.
The role of change and the extent to which a firm can take advantage of it areanalyzed in two parts: determination of strengths and handicaps, and theexploration of some key change questions.
Determination of Strengths and Handicaps
As we will detail in Chapter 5, when a firm faces a new game, some of its pre-new game strengths remain strengths while others become handicaps. Thesestrengths and handicaps play a key role in determining the extent to which thefirm can perform value chain activities to create and appropriate value, in theface of the change. Strengths and handicaps can be resources (distributionchannels, shelf space, plants, equipment, manufacturing know-how, marketingknow-how, R&D skills, patents, cash, brand-name reputations, technologicalknow-how, client or supplier relationships, dominant managerial logic, rou-tines, processes, culture, and so on), or product positions (low-cost, differen-tiation, or positioning vis-à-vis coopetitors). A classic example of a strength thatbecame a handicap is that of Compaq, which wanted to participate in the newgame created by Dell when the latter introduced the direct-sales and build-to-order business model. Prior to this new game, Compaq’s relationships withdistributors were a strength; but when the company decided to sell directly toend-customers, bypassing distributors, the distributors would not let Compaqdump them that easily. Compaq had to abandon its new business model. Effect-ively, Compaq’s pre-new game strength had become a handicap in the face ofthe new game. Of course, many pregame strengths, such as brands, usuallyremain strengths in the face of a new game. Thus, the first step in a Changeanalysis is to determine which of a firm’s prechange strengths remain strengthsand which ones become handicaps in the face of the change. (In Chapter 5, wewill see how a firm can determine its strengths and handicaps in the face of anew game.)
The Questions
Having determined a firm’s strengths and handicaps, the next step is to deter-mine how the firm can take or is taking advantage of the change by asking thefollowing questions: Given its strengths and handicaps in creating andappropriating value in the face of the change, does or will the firm take advan-tage of:
1 The new ways of creating and capturing new value generated by thechange?
2 The opportunities generated by change to build new resources or translateexisting ones in new ways?
3 First mover’s advantages and disadvantages, and competitors’ handicapsthat result from change?
4 Coopetitors’ potential reactions to its actions?5 Opportunities and threats of environment? Are there no better alternatives?
Assessing the Profitability Potential of a Strategy 49
These factors are a direct outcome of the characteristics of new games that weexplored in Chapter 1. Effectively, the change component is about the newgame factors of activities.
Does the Firm Take Advantage of the New Ways of Creating andCapturing Value Generated by Change?
A firm takes advantage of new ways of creating and appropriating value gener-ated by a change if, given the change and the firm’s associated strengths andhandicaps, it can still offer customers the benefits that they prefer, position itselfwell vis-à-vis coopetitors, and profit from the benefits and position. Identifyingthe new ways of creating and capturing value generated by change consists ofpicking those activities that are being performed differently—or should be per-formed differently—in the face of the change, and verifying that these new gameactivities have made (or will make) a significant contribution towards valuecreation and appropriation. The activities make a significant contribution ifcustomers prefer the value from them, or the firm profits from them. Thus, thequestion here is, do the new game activities (1) create value that customersprefer over value from competitors, and (2) enable the firm to make money? Ifthe answer to any of these questions is Yes, the answer to the question, does thefirm take advantage of the new ways of creating and capturing value generatedby change? is Yes.
Does the Firm Take Advantage of Opportunities Generated by Changeto Build New Resources, or Translate Existing Ones in New Ways?
In the face of change, firms usually require both new and old resources toperform the new game activities. The first step towards seeing whether a firmhas taken advantage of these resources, is to identify them. To identify them,construct the value chain, and pinpoint the activities that are being performeddifferently or should be performed differently as a result of the change. Therelevant resources are those that are needed to perform the new activities. Thenext step is to answer the question, do the identified resources make a signifi-cant contribution towards (1) creating value that customers prefer over valuefrom competitors, (2) enabling the firm to make money? If the answer to eitherquestion is Yes, then the firm takes advantage of the opportunities generated bychange to build new resources, or translate existing ones in new ways.
Does the Firm Take Advantage of First-mover’s Advantages andDisadvantages, and Competitors’ Handicaps?
If a firm initiates change, or is the first to take advantage of change, it has anopportunity to build and take advantage of first-mover advantages. A first-mover advantage is a resource, capability, or product position that (1) a firmacquires by being the first to carry out an activity, and (2) gives the firm anadvantage in creating and appropriating value. These include preemption ofscarce resources such as gates and landing slots at an airport such as Heath-row’s London Airport. The first step towards seeing whether a firm has takenadvantage of first-mover advantages is to identify them. Chapter 6 contains a
50 Introduction

complete list of first-mover advantages. The next step is to establish whetherthe advantages make a significant contribution to the benefits that customersperceive, or to the profits that the firm makes.
First-mover disadvantages are those shortcomings that a firm has by beingthe first to pursue a particular activity. For example, a firm that moves first intoa virgin market spends a great deal to establish the market. Followers that moveinto the established market are effectively free-riding on the investments thatthe first mover made to establish the market. A first mover would rather thefollower did not get so much free. Interestingly, the cure to first-mover dis-advantages can be better first-mover advantages. For example, by seeking intel-lectual property protection, a first mover can reduce the extent to which follow-ers free-ride on its investments. Of course, if a firm is a following, it can takeadvantage of first-mover disadvantages. A firm can also take advantage of com-petitor’s handicaps. Thus, the answer to this question is Yes, if a firm takesadvantage of first-mover advantages and disadvantages, OR of competitors’handicaps in performing its activities.
Does the Firm Anticipate and Respond to Coopetitors’ Reactions to itsActions?
A firm is better able to perform the activities that allow it to create andappropriate value in the face of change if the firm anticipates and responds to itscoopetitor’s actions and reactions to the change. To determine if a firm’s strat-egy anticipates and responds to coopetitors’ reactions, we list the activities thatthe firm performs as a result of the change and ask whether, for each of the keyactivities, the firm took the actions and reactions of the relevant coopetitor intoconsideration.
Identify and Take Advantage of Opportunities and Threats from theMacroenvironment? Are there no Better Alternatives?
In taking advantage of change, it is critical for a firm to identify and takeadvantage of opportunities and threats, beyond the change, from its environ-ment. For example, most new pharmaceutical products in the USA needapproval from the Food and Drug Administration (FDA) and therefore firmsthat pursue new game activities in pharmaceuticals are better off exploring howthey can take advantage of the FDA’s approval processes. For example, indeveloping Lipitor, Warner Lambert took advantage of an FDA law that givesfast-track reviews to drugs that treat special conditions. Doing so shortened theFDA approval of Lipitor by six months, saving the firm billions of dollars inrevenues. Sometimes, the opportunities are complementary technologies thatenhance the effectiveness of the new game. For example, Dell’s direct sales andbuild-to-order model were more effective because Dell used the available tech-nologies to reach customers directly. It started out using telephone banks toreach customers and when the Internet emerged, Dell used it.
The benefits of changes are often ended by other changes. For example, manyinnovations are usually displaced by so-called disruptive technologies. Thus,paying attention to one’s environment can enable a firm to be better preparedfor disruption. Sometimes, by looking into its environment, a firm may find
Assessing the Profitability Potential of a Strategy 51

better alternatives to its new game. After developing its search engine, Googlefound an alternative monetization model in paid listings that was much betterthan pop-up ads.
Applications of the AVAC Framework
What Can be Analyzed Using the AVAC?
Since the AVAC can be used to analyze the profitability potential of a firm’sstrategy, it can also be used to analyze the profitability potential of most thingswhose profitability rests on performing a set of activities. (Recall that wedefined a strategy as a set of activities for creating and appropriating value.)Thus, the AVAC can be used to analyze business models, business units, prod-ucts, technologies, brands, market segments, acquisitions, investmentopportunities, partnerships such as alliances, an R&D group, corporate strat-egies, and so on. The different main questions that a firm may want to ask in ananalysis are shown in Table 2.1 below. The subquestions remain primarily the
Table 2.1 Applications of AVAC Analysis
Activities Value Appropriability Change(new gamefactor)
Acquisition In making and exploitingthe acquisition, is the firmperforming the right setof activities?
Do customers prefer thevalue from theacquisition, compared tothat from competitors?
Does the firmprofit fromthe activities?
Does theset ofactivitiestakeadvantageof change(present orfuture) tocreate andappropri-ate value?
Brand Does the firm performthe right activities, inbuilding and exploitingthe brand?
Do customers prefer thevalue from the brand,compared to that fromcompetitors?
Ditto Ditto
Business model Does the firm performthe right business modelactivities?
Do customers prefer thevalue from the businessmodel activities,compared to that fromcompetitors?
Ditto Ditto
Business unit Does the firm performthe right business unitactivities?
Do customers prefer thevalue from the businessunit, compared to thatfrom competitors?
Ditto Ditto
Corporatestrategy
Does the firm performthe right corporate levelactivities?
Do customers prefer thevalue from thecorporate-level activities,compared to that fromcompetitors?
Ditto Ditto
52 Introduction

same as those explored above. Take brand, for example. The first question is,does the firm perform the right activities for building and exploiting the brand?Is the value created using the brand preferred by customers compared to thevalue from competitors. Does the firm make money from the brand? Andfinally, in building and exploiting the brand, does the firm take advantage ofchange or expect to take advantage of it?
When Should Such an Analysis be Undertaken?
The question is, when would one want to analyze the profitability potential of abusiness unit, brand, product, etc. and therefore need to use the AVAC?
Compare Outcomes
AVAC can be used to compare the profitability potential of different businessstrategies, business units, brands, products, corporate strategies, technologies,R&G strategies, partnerships, acquisitions, market segments, etc. The AVACanalysis is particularly suitable for such comparisons because it pinpoints thelikely weaknesses and strengths of each activity and shows (via the associatedquestions) what questions need to be asked to remedy the weaknesses andreinforce the strengths.
Organizing Platform for Data
Like most frameworks, from the Growth/Share matrix to a Porter’s Five Forces,AVAC can be an excellent organizing stage for displaying data in some mean-ingful way for discussions before a decision is taken. For example, before takinga major strategic decision, managers may want to discuss the profitability of thefirm before the decision and compare it to the projected profitability after the
Market segment Does the firm performthe right market segmentactivities?
Do customers prefer thevalue from the marketsegment, compared tothat from competitors?
Ditto Ditto
Partnership Does the firm performthe right activities tosupport and exploit thepartnership?
Do customers prefer thevalue from thepartnership, compared tothat from competitors?
Ditto Ditto
Product Does the firm performthe right activities tooffer the product?
Do customers prefer thevalue from the product,compared to that fromcompetitors?
Ditto Ditto
R&D group Does the group performthe right R&D activities?
Do customers prefer thevalue from the R&D,compared to that fromcompetitors?
Ditto Ditto
Technology Does the firm performthe right activities, as faras the technology isconcerned?
Do customers prefer thevalue from thetechnology, compared tothat from competitors?
Ditto Ditto
Assessing the Profitability Potential of a Strategy 53

decision. An AVAC enables managers to see the before and potential after. Itprovides a common platform and language to start off discussions.
Strategic Planning
Strategic planning builds on strategic analysis; that is, before performingstrategic planning, a firm needs first to understand its existing strategy andprofitability potential. Strategic planning then follows. This process consists ofpinpointing a firm’s strengths and weaknesses as well as the opportunities andthreats that the firm faces as far as each component of AVAC is concerned.
Example 2.1: AVAC Analysis of a Strategy
To illustrate the AVAC analysis, we now analyze Ryanair’s strategy.
Ryanair 2008
To customers, a visit to Ryanair’s website (www.ryanair.com) in 2008 showedsome remarkable things: one could fly from a number of airports in the UnitedKingdom (UK) to towns in southern Europe for as little as £10, make hotelreservations, find apartments, rent a car, or find out about important eventsgoing on in many cities in Europe.8 There were even buttons for “RyanairCasino,” “Airport transfers,” “Money” and “Ski.” To investors, Ryanair’sfinancial performance was remarkable: from 2000 to 2007, the company’safter-tax profit margins were some of the highest of any company in Europe,ranging from 20–26%, slowing down to 18% because of higher per barrel oilprices. In 2007, Ryanair’s Chief Executive Officer (CEO), Mr Michael O’Leary,was estimated to be worth over US$ 800 million.9
Ryanair was founded in Ireland in 1985 by Tom Ryan, made its first profits in1991, and by 2000 had become one of the most profitable airlines in the world(Tables 2.2 to 2.4).10 After almost going bankrupt in 1990, O’Leary had visitedSouthwest Airlines in the USA to see why the latter had been profitable sinceincorporation, compared to other US airlines.11 Deregulation of the airlineindustry by the European Union (EU) in 1997 allowed any airline from any EU
Table 2.2 Selected Financials
Year ended 2000 2001 2002 2003 2004 2005 2006 2007
Passengers flown(million)
6.1 8.1 11.1 15.7 23.1 27.6 34.8 42.5
Load factor (%) 85 81 84 83 82Revenues (in � million) 370.1 487.4 624.1 842.5 1,074 1,337 1,693 2,237Profit after Tax (in �
million)72.5 104.5 150.4 239.4 227 269 302 401
Net margin (%) 20 21 24 28 21 20 18 18EBITFAR (%) 36 37 36 41 36 34 31 30Cash earnings (%) 31 34 34 38 30 27 25 26
Sources: Ryanair’s investor relationships. Retrieved August 27, 2007, from http://www.ryanair.com/site/about/invest/docs/present/quarter4_2007.pdf
54 Introduction
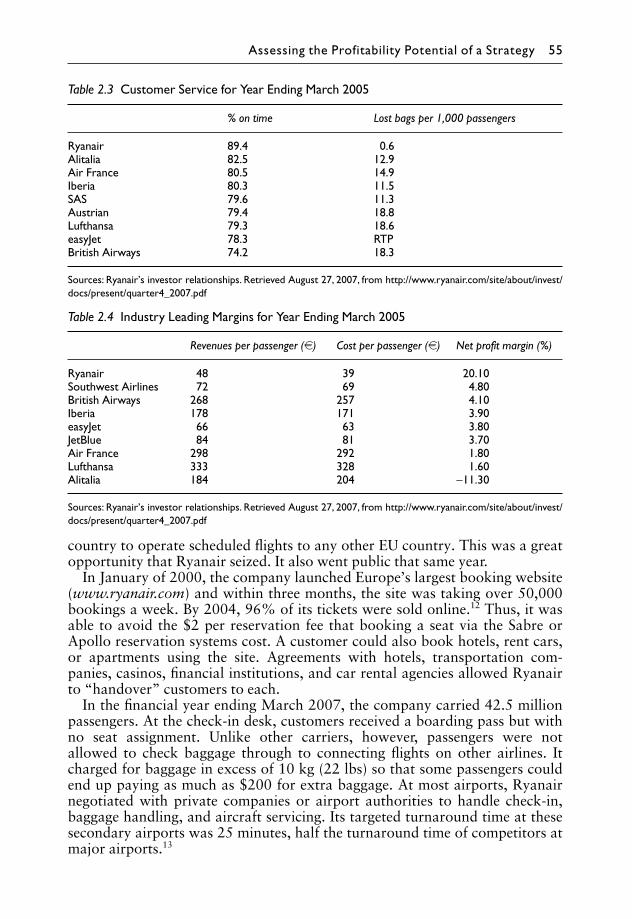
country to operate scheduled flights to any other EU country. This was a greatopportunity that Ryanair seized. It also went public that same year.
In January of 2000, the company launched Europe’s largest booking website(www.ryanair.com) and within three months, the site was taking over 50,000bookings a week. By 2004, 96% of its tickets were sold online.12 Thus, it wasable to avoid the $2 per reservation fee that booking a seat via the Sabre orApollo reservation systems cost. A customer could also book hotels, rent cars,or apartments using the site. Agreements with hotels, transportation com-panies, casinos, financial institutions, and car rental agencies allowed Ryanairto “handover” customers to each.
In the financial year ending March 2007, the company carried 42.5 millionpassengers. At the check-in desk, customers received a boarding pass but withno seat assignment. Unlike other carriers, however, passengers were notallowed to check baggage through to connecting flights on other airlines. Itcharged for baggage in excess of 10 kg (22 lbs) so that some passengers couldend up paying as much as $200 for extra baggage. At most airports, Ryanairnegotiated with private companies or airport authorities to handle check-in,baggage handling, and aircraft servicing. Its targeted turnaround time at thesesecondary airports was 25 minutes, half the turnaround time of competitors atmajor airports.13
Table 2.3 Customer Service for Year Ending March 2005
% on time Lost bags per 1,000 passengers
Ryanair 89.4 0.6Alitalia 82.5 12.9Air France 80.5 14.9Iberia 80.3 11.5SAS 79.6 11.3Austrian 79.4 18.8Lufthansa 79.3 18.6easyJet 78.3 RTPBritish Airways 74.2 18.3
Sources: Ryanair’s investor relationships. Retrieved August 27, 2007, from http://www.ryanair.com/site/about/invest/docs/present/quarter4_2007.pdf
Table 2.4 Industry Leading Margins for Year Ending March 2005
Revenues per passenger (�) Cost per passenger (�) Net profit margin (%)
Ryanair 48 39 20.10Southwest Airlines 72 69 4.80British Airways 268 257 4.10Iberia 178 171 3.90easyJet 66 63 3.80JetBlue 84 81 3.70Air France 298 292 1.80Lufthansa 333 328 1.60Alitalia 184 204 −11.30
Sources: Ryanair’s investor relationships. Retrieved August 27, 2007, from http://www.ryanair.com/site/about/invest/docs/present/quarter4_2007.pdf
Assessing the Profitability Potential of a Strategy 55

In 1994, the company had decided to fly only Boeing 737 aircraft, takingdelivery of its first eight Boeing 737s that year to replace its fleet of BAC 1–11jets. By 2007, the fleet had grown to over 120 737–800s, giving Ryanair theyoungest fleet of any airline. The list price of a 737 in 2007 ranged from $50–85million depending on the options, with each plane estimated to have a lifespanof over 20 years. In 2004, a typical Ryanair flight lasted over an hour (1.2 h)and covered about 491 miles. By 2005, partly because of the frequent flightsand short distances flown, more passengers flew on Ryanair per year than onany other European airline. In-flight, three or four flight attendants sold drinks,snacks, and other merchandise that together accounted for 5–7% of Ryanair’srevenues.
Whenever possible, it served only secondary airports such as Beauvais in theParis region and Charleroi near Brussels. When it sought airports in cities thathad been declining, it usually received concessions and cash in exchange forpromotion and injection of “life” into the area. Passenger traffic on a routeusually skyrocketed after Ryanair initiated service on the route, leading to whathas come to be called the “Ryanair effect” in Europe. At these secondary air-ports, gate fees per passenger could be as low as $3 below rates at the moreprestigious but more congested airports.
The spaces behind seat-back trays and on headrests were sold to advertisers.For a fee of �150,000–200,000 per year, an advertiser could splash the exteriorof a Ryanair plane with its logo. In-flight magazines were made up entirely ofadvertising so that while other in-flight magazines struggled to break even,Ryanair’s were profitable. The company also collected fees from car rental andhotel referrals. All ancillary services accounted for 13.9% of operating revenuesin 2004.
Employees were paid according to their productivity. For example, flightattendants received a fixed salary, a payment based on how many sectors orflights they flew, and a commission on in-flight sales. On average, Ryanair flightattendants earned more money than their counterparts at other airlines. Theirpilots earned a fixed salary and a payment per sector flown. These pilots earned10% more than the typical pilot in the industry and flew 50% more sectors.Unlike other European airlines, Ryanair did not pay employees based on thelength of their tenure with the airline. Only engineers and maintenance personalwere paid on the basis of their qualifications. For the year ended March 31,2004, Ryanair’s average pay of �50,582 looked good compared to �42,077 forIberia, �41,384 for easyJet, �41,377 for Lufthansa, �38,329 for Aer Lingus,and �37,602 for British Airways.14
Ryanair also had its share of criticism ranging from false advertising to anti-unionism to not treating customers well.
An AVAC Analysis of Ryanair’s Strategy in 2007We explore each of the components of the AVAC analysis separately.
Activities
The question here is, is Ryanair performing the right activities? There are twoparts to this component. In the first part, we answer the questions: what is theset of activities that constitutes the firm’s strategy? Does Ryanair have the
56 Introduction

resources and capabilities to perform the activities? Here is Ryanair’s set ofactivities. The firm:
1 Operated largely out of secondary airports, preemptively acquiring as manygates and landing slots as possible at each airport.
2 Operated only Boeing 737s.3 Instituted onboard sales and advertising.4 Built and tried to maintain a low-cost culture.5 Established relationships and links with local airport authorities, hotels,
transportation, and events.
Do the Activities Contribute to Low Cost, Differentiation, etc?
By operating largely out of secondary airports, Ryanair reduced takeoff andlanding delays, thereby reducing its turnaround time (and increasing aircraftutilization). It was also keeping its landing and gate fees low, accessing a low-cost labor force for its operations, and had an opportunity preemptively toacquire gates, landing slots, and other access rights when it moved into theseairports and had little or no competition. It also had an opportunity to expandits activities to increase the number of passengers that it carried. Because someof these airports were in economically depressed zones, local officials wereeager to work with Ryanair to bring in business in an effort to jumpstart theirlocal economies. Effectively, moving into secondary airports was consistentwith keeping its costs low so that it could pass on costs savings to customers inthe form of low prices. It was also consistent with offering frequent flights, andattracting and keeping many valuable customers—differentiation.
By advertising to its passengers, its cost of advertising was lower than thoseof media such as TV and newspapers, which had to pay for programming ornews to attract eyeballs. Ryanair did not have to pay for its eyeballs—that is,the number of people that were likely to see an advertisement; the eyeballs paidRyanair. Thus, Ryanair could pass on some of its costs savings to advertisers inthe form of lower advertising prices. It could also pass on some of the costssavings from advertising to passengers in the form of lower ticket prices. LikeSouthwest Airlines, whose business model Ryanair had copied, Ryanair did notoffer free meals on its flights; but Ryanair went even further: it sold the snacksthat Southwest Airlines gave away. It also sold duty-free goods. By selling itsown tickets using its own website, the airline avoided the fees charged by travelagents and reservation systems. Direct contact with customers also helped thecompany build relationships with customers that could not be built throughtravel agents. Moreover, Ryanair was effectively doing what travel agentswould do by providing links to hotels, car rental, and local events. By flyingonly Boeing 737s, the company potentially kept its maintenance costs low andreduced downtime since any mechanic could repair any plane and Ryanair didnot have to track many different types of spare part for different planes. Thisalso meant that any of the company’s 737-certified pilots could fly any of itsplanes, and any plane could pull up to any gate. Effectively, flying only 737s notonly reduced costs but also reduced turnaround time, thereby increasing theutilization of planes. These activities were consistent with attracting and keep-ing many valuable customers. By offering no baggage transfers, the firm kept its
Assessing the Profitability Potential of a Strategy 57
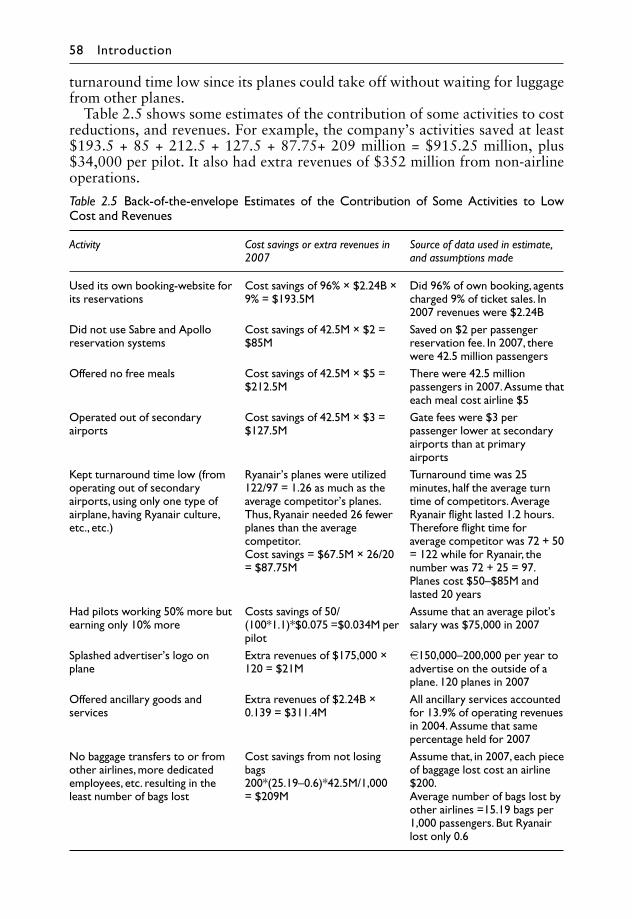
turnaround time low since its planes could take off without waiting for luggagefrom other planes.
Table 2.5 shows some estimates of the contribution of some activities to costreductions, and revenues. For example, the company’s activities saved at least$193.5 + 85 + 212.5 + 127.5 + 87.75+ 209 million = $915.25 million, plus$34,000 per pilot. It also had extra revenues of $352 million from non-airlineoperations.
Table 2.5 Back-of-the-envelope Estimates of the Contribution of Some Activities to LowCost and Revenues
Activity Cost savings or extra revenues in2007
Source of data used in estimate,and assumptions made
Used its own booking-website forits reservations
Cost savings of 96% × $2.24B ×9% = $193.5M
Did 96% of own booking, agentscharged 9% of ticket sales. In2007 revenues were $2.24B
Did not use Sabre and Apolloreservation systems
Cost savings of 42.5M × $2 =$85M
Saved on $2 per passengerreservation fee. In 2007, therewere 42.5 million passengers
Offered no free meals Cost savings of 42.5M × $5 =$212.5M
There were 42.5 millionpassengers in 2007. Assume thateach meal cost airline $5
Operated out of secondaryairports
Cost savings of 42.5M × $3 =$127.5M
Gate fees were $3 perpassenger lower at secondaryairports than at primaryairports
Kept turnaround time low (fromoperating out of secondaryairports, using only one type ofairplane, having Ryanair culture,etc., etc.)
Ryanair’s planes were utilized122/97 = 1.26 as much as theaverage competitor’s planes.Thus, Ryanair needed 26 fewerplanes than the averagecompetitor.Cost savings = $67.5M × 26/20= $87.75M
Turnaround time was 25minutes, half the average turntime of competitors. AverageRyanair flight lasted 1.2 hours.Therefore flight time foraverage competitor was 72 + 50= 122 while for Ryanair, thenumber was 72 + 25 = 97.Planes cost $50–$85M andlasted 20 years
Had pilots working 50% more butearning only 10% more
Costs savings of 50/(100*1.1)*$0.075 =$0.034M perpilot
Assume that an average pilot’ssalary was $75,000 in 2007
Splashed advertiser’s logo onplane
Extra revenues of $175,000 ×120 = $21M
�150,000–200,000 per year toadvertise on the outside of aplane. 120 planes in 2007
Offered ancillary goods andservices
Extra revenues of $2.24B ×0.139 = $311.4M
All ancillary services accountedfor 13.9% of operating revenuesin 2004. Assume that samepercentage held for 2007
No baggage transfers to or fromother airlines, more dedicatedemployees, etc. resulting in theleast number of bags lost
Cost savings from not losingbags200*(25.19–0.6)*42.5M/1,000= $209M
Assume that, in 2007, each pieceof baggage lost cost an airline$200.Average number of bags lost byother airlines =15.19 bags per1,000 passengers. But Ryanairlost only 0.6
58 Introduction

Do Activities Contribute to Improving Its Position vis-à-vis itsCoopetitors?
By flying only 737s and ramping up its activities to a point where it bought verymany of these planes, Ryanair was increasing its bargaining power over Boeing.It was also making itself more dependent on just one aircraft maker, settingitself up for opportunistic behavior from the maker. It often cooperated withlocal authorities in order to start up operations in a secondary airport. Localauthorities in southern Europe wanted tourists and jobs for their towns whileRyanair wanted the airports to bring in the tourists. Both parties worked tostart operations at these local airports. Contrast this with starting operations atthe larger and busier airports where local authorities were not as hungry formore traffic. Ryanair also worked with local hotels and transporters to providethem with tourists.
Do Activities Take Advantage of Industry Value Drivers?
Recall that industry value drivers are those characteristics of an industry thatstand to have the most impact on cost, differentiation, and other drivers ofprofits such as the number of customers. Thus, a firm that takes advantage ofthese factors in formulating and executing its strategy stands to have the mostimpact on customer value and the profits that the firm can make. In the airlineindustry, utilization of airplanes is an industry value driver. Utilization hereincludes two things: (1) higher load factor (filling up planes with passengers) sothat planes do not fly around empty, and (2) reducing the turnaround time ofthe plane so that planes are busy flying people to their destinations instead ofsitting around at terminals or under repair. The idea here is that airplanes makemoney when flying full, not while sitting on the ground or flying empty. Manyof the activities that Ryanair performed increased utilization. For example, aswe pointed out earlier, operating out of secondary airports reduced the turn-around time since planes did not have to queue for takeoff or landing.
The firm’s other source of revenues was advertising; and in advertising acritical industry value driver was the number of eyeballs. Firms with advertisingbusiness models spent lots of money generating eyeballs. For example, TV sta-tions spent money on programming while online advertisers such as Googlespent on expensive R&D to develop search engines and other software toattract viewers. An airline had a captive audience in passengers and it cost theairline relatively little or nothing to advertise to them. By advertising to itspassengers, Ryanair was taking advantage of the eyeballs that it already had.Because it did not have to spend on acquiring these eyeballs, Ryanair couldcharge less for some of its tickets than competing airlines that did not advertise.Of course, there was the chance that the airline lost some passengers who didnot like advertising.
Finally, the cost of labor in an airline constituted a high percentage of itsoverall cost. By building a workforce that worked 150% more hours for only110% more in pay, Ryanair was taking advantage of this driver of costs to keepits overall costs low.
Assessing the Profitability Potential of a Strategy 59
Do Activities Build or Translate Distinctive Resources/Capabilities intoUnique Positions?
A key distinctive resource for Ryanair was its network of secondary airportsand the associated gates, landing slots, and contracts with local authorities,hotels, and transportation providers. By moving into these airports (sometimesbeing the first), securing the gates and agreements, and ramping up its activitiesthere, Ryanair was able to build its network system. Each time that it occupiedone airport, it used it as a starting point to move to adjoining locations, offeringlow-cost frequent flights; and each time it took up gates and landing slots, orbuilt relationships with local authorities, it was preempting some potential newentrants to these airports. Its low-cost culture, airplanes, relationships withlocal authorities, and its brand also contributed to keeping its costs low ordifferentiated it. These are important resources/capabilities.
Are the Activities Comprehensive and Parsimonious?
One signal that Ryanair’s activities were parsimonious was the fact that itsemployees worked 150% more for only 110% the pay of the average Europeanairline.
Value
Ryanair had many types of customers. These included flying passengers, advert-isers, hotels, car rental companies, and local authorities of the secondaryairports in which the company operated. To passengers, the company offeredlow-cost, frequent flights, access to hotels, cars, apartments, and other com-ponents of a vacation package. To what extent was the value that Ryanairoffered its customers unique compared to that offered by its competitors? Itoffered very low prices compared to other European airlines. It also offeredadvertising, onboard sales, links to hotels, apartments and ground transporta-tion that most of its competitors did not. Passengers were valuable in that, inaddition to paying for the flight, they also constituted “eyeballs” that the firmcould use as “value” to advertisers. (We cannot tell from the case whether ornot they had a high willingness to pay.) The eyeballs came cheap compared towhat TV and other media had to spend for eyeballs. In fact, most of Ryanair’seyeballs paid to be on the plane. In the year 2008, Ryanair flew over 42 millionpassengers, all of them potential eyeballs for advertising revenues. In additionto paying for seats and providing eyeballs, passengers also provided anothersource of revenues: they purchased snacks and duty-free goods. To advertisers,the company offered eyeballs not only to its own passengers but potentiallythose of its competitors, who could see the advertisements on the outside ofRyanair’s airplanes. To hotels, car rental companies, and local authorities of thesecondary airports, Ryanair provided traffic. As far as white spaces were con-cerned, there were many other cities in Europe and the rest of the world withsecondary airports into which Ryanair could fly. There could also be whitespaces in what it could advertise or sell to passengers.
60 Introduction

Appropriability
Did Ryanair make money from the value that it created? Yes. From 2000–8, thecompany recorded after-tax profit margins of 18–28%, making Ryanair one ofthe most profitable companies in Europe.
Does Ryanair Have a Superior Position vis-à-vis Coopetitors?
European airlines did not have a superior position vis-à-vis suppliers and cus-tomers but, as we saw above, Ryanair managed to position itself well relative toits suppliers and customers than its rivals. Moreover, switching costs were lowfor customers. Ryanair may have extracted low prices for the airplanes that itbought from Boeing, given the relatively large number of 737s that it pur-chased, but we are not told whether this is the case. Because Ryanair’s costswere very low compared to those of its rivals, and it also offered advertising andsales, the effects of rivalry and substitutes on it was not as large as it was oncompetitors.
Did Ryanair Exploit its Position vis-à-vis Coopetitors?
Like many airlines, Ryanair practiced price discrimination, charging differentprices for different types of customer. This got the company closer to the aver-age reservation price of each group of customers. Additionally, Ryanair alsocharged for extra baggage. Some of the company’s very low prices were meantto attract passengers who would otherwise not travel but who then contributedto the number of eyeballs, buying products in the plane, staying in hotels,renting cars, or attending local events, thereby contributing to its revenues.
Did Ryanair Have the Right Resources/Capabilities, IncludingComplementary Assets?
Ryanair had the resources, including its brand, low-cost culture, and the net-work of secondary airports that it built (see below). It also had the comple-mentary assets to profit from its advertising and on-board sales activities, bothof them new game activities since they had not been offered in the Europeanairline industry before. It had the eyeballs and passengers to whom sales couldbe made.
Imitability
Although it was easy for some airlines to imitate some of what Ryanair did, itwas difficult to imitate the whole system of activities that it performed. Itssystem of activities—operating out of a network of secondary airports, advertis-ing, onboard sales, offering no meals, a culture that made people work 50%more than their competitors while paid only 10% more, operating only Boeing737s, offering no baggage transfers, with their own website for ticketing andhotel and car rental booking—was difficult to replicate. Existing rivals orpotential new entrants might have been able to replicate some of these activitiesbut replicating the whole system was difficult. Moreover, Ryanair was up the
Assessing the Profitability Potential of a Strategy 61

learning curve for most of these activities and was already carrying many pas-sengers. Moreover, resources such as the network of secondary airports withassociated landing slots and gates were scarce valuable resources and oncetaken by an airline such as Ryanair, were gone.
Existing rivals such as Air France or Lufthansa may also have been handi-capped by prior commitments. For example, switching to operate only out ofsecondary airports would have meant having to give up their existing space,landing slots, and gates at existing primary airports. Doing so may have meantreneging on existing contracts with the local municipalities that owned or oper-ated the airports, unions, and some employees. Switching to flying only onetype of plane such as the Boeing 737 or the Airbus 320 may have meant havingto get rid of all the Boeing 777s, 757s, 767s, 747s, A330s, A300s, A340s, andother airplanes that the airline had been flying for decades. Contracts withsuppliers, pilots, and unions may have made such a switch difficult. Gettingemployees to work 50% more than they had in the past and for only 10% morewould be very difficult in some European countries. Of course, imitability wasdifficult but not impossible. One thing that a firm such as Ryanair, which didmore than one thing, had to watch out for was so-called category killers. Forexample, some airlines may have decided to take the advertising on airplaneseven further, stealing customers from Ryanair.
Substitutability and Complementarity
Cars and trains were good substitutes for those travelers who had time as far asair transportation was concerned. The lower that Ryanair’s prices were, the lessof a problem that these substitutes may have been. Advertisers could also adver-tise elsewhere other than on airplanes; but the more eyeballs and the moreeffective the advertising was with Ryanair, the more that advertisers were likelyto stay with Ryanair rather than seek substitutes. Passengers could buy snacksand goods elsewhere. Important complements in air travel included security andair traffic control over which Ryanair had little control. Business was affectedby government security-related decisions. For example, security concerns oftencut into turnaround time.
By having a low-cost structure that allowed it to keep its prices low, offeringfrequent flights, and providing connections to hotels, cars, and local events,Ryanair was effectively reducing the power of substitutes, since travelers weremore likely to find it more convenient and inexpensive flying Ryanair thandriving or taking a train.
Change: The New Game Factors
We first explore the change with which the firm was dealing. Change camefrom two major sources: from its environment and from its new game activ-ities. The EU deregulated the airline industry in Europe, and Ryanair tookadvantage of the changes to pursue new game activities that allowed it to createand appropriate value. When the EU deregulated air travel Ryanair already hadthe beginnings of a low-cost culture in place as well as an operating base inDublin. These were strengths that would continue to be strengths in the newgame. It was not bound by major contracts that could have become handicaps.
62 Introduction

In 2008, the biggest threat that Ryanair faced was the rapidly increasing priceof oil.
Take Advantage of the New Ways of Creating and Capturing NewValue Generated by Change?
Yes. In deregulating the airline industry in Europe, the EU created an opportun-ity for Ryanair to keep offering low-cost service to customers in more ofEurope. The company took advantage of the deregulation to extend its activ-ities to a lot more of the EU. The firm was able to build on its low-cost cultureand extend its network of secondary airports beyond the UK and Ireland. Itslow-cost system of activities resulted in a low-cost structure that allowed thefirm to pass on some of its costs savings to customers in the form of low prices.Many of the firm’s new activities to exploit these changes built on its prechangesystem of activities and product-market position. Deregulation of the industryincreased the competitive forces in it; but Ryanair’s system of activities allowedit to dampen the repressive forces and reinforce the favorable ones. Effectively,Ryanair took advantage of the new ways of creating and appropriating valuecreated by deregulation and Ryanair’s new game activities. Its new game activ-ities enabled Ryanair better to create value and position itself rather than itsrivals to appropriate it.
The other change with which Ryanair had to deal was the Internet. It tooreinforced Ryanair’s position vis-à-vis customers. Ryanair had performed mostof its own bookings rather than go through travel agents. The advent of theInternet enabled the firm to create a website that allowed customers to booktheir own flights, finalizing the bypassing of travel agents.
Take Advantage of Opportunities Generated by Change to Build NewResources or Translate Existing Ones in New Ways?
Yes. Ryanair took advantage of opportunities generated by change to build newresources and translate new ones into unique value. It was fast to take up spaceat airports in southern Europe. Its resulting network of secondary airports andlow-cost cultures built on its prechange culture and hubs in Ireland and Eng-land. It also built valuable relationships with authorities at airports. Moreimportantly, the Internet allowed the firm to build its brand with customers viaits website.
Does the Firm Take Advantage of First-mover’s Advantages andDisadvantages, and Competitors’ Handicaps?
Ryanair took advantage of first-mover advantages by quickly ramping up itsactivities at secondary airports and taking up gates and landing slots at theairports. It quickly built up a network of secondary airports in each of which ithad a large number of gates, landing slots, and relationships with local officials.By preemptively taking up these resources, Ryanair was also raising barriers toentry for potential new entrants into its secondary airports. By establishinggood relationships with authorities at secondary airports, it was preemptivelyacquiring a valuable scarce resource. By quickly setting up a website to reach its
Assessing the Profitability Potential of a Strategy 63
customers, it was preemptively taking up customer perceptual space. In theprocess, it built a reputation and brand as a low-cost carrier. By being the first toaccumulate scarce resources such as gates and landing slots at the secondaryairports that it used, to build relationships with local officials, and to establish abrand name reputation as the low-cost airline for its routes, Ryanair was effect-ively taking advantage of first-mover advantages.
Does the Firm Anticipate and Respond to Coopetitors’ Reactions to itsActions?
One can argue that, in preemptively taking up gates and landing slots at air-ports, Ryanair was anticipating its competitors’ likely reaction. Competitorswould like to get into the same airports from which it was operating butRyanair responded to this anticipated entry by preemptively capturing many ofthe valuable scarce resources that were critical to operating profitably out of thesecondary airports.
Identify and Take Advantage of Opportunities and Threats ofEnvironment? Are There no Better Alternatives?
The firm took advantage of opportunities from its environment when itexpanded its activities following EU deregulation of the airline industry. It wasalso one of the first to take advantage of the Internet to build a website toenhance its decision to undertake its own reservations. Opportunities alsoexisted for low-cost transatlantic flights and short-hall flights in the formereastern European economies.
The firm had alternative airline market segments, but these were not veryattractive ones for Ryanair. It could have tried to compete head-on with themajor European airlines such as Air France—a mistake. It could have alsoinvested its money in other firms, diversified into other businesses; but the factthat it had one of the highest profit rates of any major European companysuggested that it was not likely to have done much better investing in these othercompanies that were not as profitable as Ryanair.In 2008, the price of oil hit many airlines hard. Traditionally, the cost of fuelwas second only to employee wages in the hierarchy of airline costs; but in2008, the price of oil had become the biggest cost item for many airlines. Theprice of oil was one of those macroeconomic threats over which airlines hadlittle control. Although many airlines stood to lose money as a result of the highoil prices, those with good strategies stood to lose less money than those with-out good strategies. The case says very little about other future changes. It wasnot clear what the EU was likely to do about air traffic in the future; nor is itclear about what Ryanair’s next steps or its competitors’ moves might be.
Key Takeaways
• Although profitability numbers can tell us something about the success ofan underpinning strategy, they say very little about what drives the num-bers. They say little about the value creation and appropriation that under-pin the numbers. Without an understanding of the underpinning strategy
64 Introduction
and its profitability potential, it is difficult for managers to know how toimprove or maintain present performance. Strategy frameworks can be usedto analyze firm strategies and understand their profitability potential.
• The AVAC framework can be used not only to explore the profitabilitypotential of a firm’s strategy and make recommendations on what the firmcould do to improve the strategy and its performance, but also to explorethe profitability potential of business models, business units, products,technologies, brands, market segments, acquisitions, investment opportun-ities, partnerships such as alliances, an R&D group, corporate strategies,and more (Table 2.1).
• Each of the four components explores critical questions that are meant tobring out the extent to which the profitability potential of a strategy hasbeen reached and what can be done to improve or sustain profitability.
• Activities. The main question here is whether a firm is performing the rightactivities—activities that contribute to value creation and appropriation.This larger question is explored via the following subquestions. Do theactivities:
� Contribute to low cost, differentiation, number and type of customers,better pricing, better sources of revenues?
� Contribute to improving a firm’s position vis-à-vis coopetitors?� Take advantage of industry value drivers?� Contribute to building new distinctive resources/capabilities or trans-
late existing ones into unique value and positions?� Conform to parsimony and comprehensiveness criteria?
• Value. The primary question here is whether the value created is preferredby customers over competitor’s offerings: how unique is the value created,as perceived by customers, compared to that from competitors? This ques-tion is explored via the following subquestions:
� Do customers perceive the value created by the strategy as unique?� Do many customers perceive this value?� Are these customers precious (valuable)? What are the market segments
and sources of revenues?� Are there any white spaces nearby?
• Appropriability. The primary question here is whether the firm makesmoney from the value created? (How much money and why?) This questionis answered using the following more detailed questions:
� Does the firm have a superior position vis-à-vis its coopetitors (buyers,suppliers, rivals, partners, etc.)?
� Does the firm profit from customer benefits and its position vis-à-viscoopetitors?
� Is there something about the firm and its set of activities and resourcesthat makes it difficult for competitors to imitate its strategy? Is theresomething about competitors that impedes them from imitating thefirm?
� Is the value nonsubstitutable? If there are complements, are they beingstrategically used?
Assessing the Profitability Potential of a Strategy 65

• Change. The overarching question here is whether the strategy takes advan-tage of change (present or future). This larger question is explored via thefollowing questions: does or will the firm take advantage of:
� The new ways of creating and appropriating value generated by change?� New ways of building new distinctive resources or translating existing
ones into unique value?� First-mover’s advantages and disadvantages, and competitors’
handicaps?� Coopetitors’ reactions to its actions?� Opportunities and threats of environment? Are there no better
alternatives?
• The AVAC framework is more comprehensive than existing models. Com-pared to Porter’s Five Forces, for example, it includes the role of (1) change(the new game factor), (2) resources/capabilities/competences (includingcomplementary assets), (3) industry value drivers, (4) pricing, (5) the num-ber and quality of customers, and (6) market segments and sources ofrevenue.
• AVAC Applications. It:
� Serves as an organizing platform for displaying information and data ina common business language that managers can use as a starting pointfor exploring strategic management questions.
� Can be used to compare different strategy outcomes.� Constitutes a parsimonious and comprehensive checklist.� Can be used as a platform for business model or strategy planning.
• More than anything else, the AVAC is an organizing framework for display-ing information in a common business language that managers can use as astarting point for exploring strategic management questions to help themtake decisions.
66 Introduction

The Long Tail and New Games
Reading this chapter should provide you with the conceptual and analyticaltools to:
• Understand the long tail concept.• Understand that the long tail is not limited to the Internet and products.• Explore how a firm can make money from a long tail.• Begin to understand how all members of the value system—aggregators,
producers; and suppliers—can benefit from the long tail.• Begin to understand the strategic impact of the long tail.
IntroductionEvery year, hundreds of movies are released, but only a few of them become boxoffice hits or blockbusters. Each of the hits accounts for hundreds of millions ofdollars in revenues while many of the nonhits each account for a lot less. Everyyear, hundreds of thousands of books are published, but only a select few makethe best-seller list. In the music industry, only a few songs go on to become hits.In all three cases, a few “blockbuster” products or best-sellers are each respon-sible for millions of dollars in sales while the great majority of the products eachaccount for only thousands or fewer dollars. This behavior can be captured bythe graph of Figure 3.1 in which the vertical axis represents the sales while thehorizontal axis captures the products (movies, books, songs) that bring in therevenues. As one progresses along the horizontal axis away from the origin tothe right, sales start out high but tail off as one moves further away from theorigin. Effectively, the graph has a long tail to the right and a short head to theleft. This phenomenon in which a few get most of the action while many getvery little is not limited to product sales. In the Internet, a few blogs each getthousands of visitors while thousands of other blogs get a few hits each. In abook such as this one, a few words like “the” are used frequently while manyothers such as “consequently” are used less frequently. In some countries, 80%of the wealth is owned by less than 10% of the population.
Although the long tail phenomenon has been described by statisticians usingthe graph of Figure 3.1 and given names such as Pareto Law, Pareto Principle,80/20 rule, heavy tail, power-law tail, Pareto tails, and so on, it was ChrisAnderson, Editor-in-Chief of Wired magazine and former correspondent forThe Economist, who used the term long tail specifically to refer to this often-neglected group of products and developed the argument for why, in the face of
Chapter 3

the Internet, firms can make money by selling products that had languishedin the long tail.1 He argued that if a store or distribution channel is largeenough, the many products in the long tail can jointly make up a market sharethat is as high as, if not higher than, that of the relatively fewer hits and block-busters in the short head.2 Thus, by focusing on the long tail of the distributionwhere there are many products, each of which sells a few units, one can bring inas much in revenues (if not more) as a firm that focuses on a few blockbusterproducts, by taking advantage of the Internet’s properties such as its near infin-ite shelf space. eBay’s business model was originally based largely on productsthat are in the long tail—that is, many one-of-a-kind products such as antiquesand collectibles, few units of which are sold; but by selling very many sucharticles, the firm was able to bring in lots of revenues. Although Amazon sellsmany best-seller books, it also carries very many titles each of which sells a fewunits. Since there are many such books (from the long tail), the total revenuesfrom selling the many books can be large enough to parallel the revenues fromthe best-sellers. Many of Google’s advertisers are very small firms that ordinar-ily would not advertise in an offline world. By aggregating the revenues fromthese small but many customers, the company can make as much money as, ifnot more than, it would make from a few big customers. To understand whyand when the long tail may offer an opportunity for profitable new game busi-ness models, let us explore the rationale behind blockbuster products, the so-called hits that form the short head, and the laggards that form the tail of thelong-tail distribution.
Figure 3.1 A Long Tail Distribution.
68 Introduction
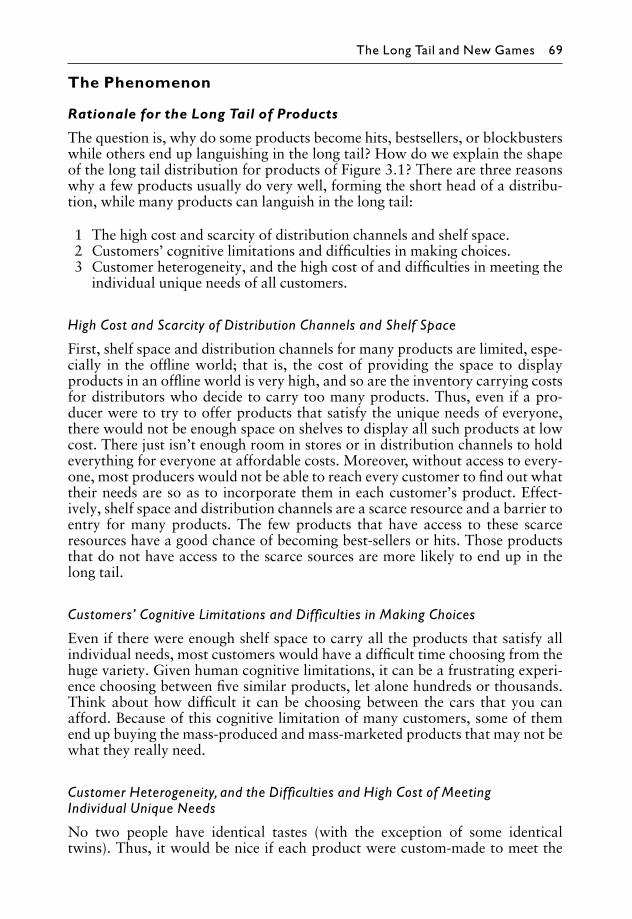
The Phenomenon
Rationale for the Long Tail of Products
The question is, why do some products become hits, bestsellers, or blockbusterswhile others end up languishing in the long tail? How do we explain the shapeof the long tail distribution for products of Figure 3.1? There are three reasonswhy a few products usually do very well, forming the short head of a distribu-tion, while many products can languish in the long tail:
1 The high cost and scarcity of distribution channels and shelf space.2 Customers’ cognitive limitations and difficulties in making choices.3 Customer heterogeneity, and the high cost of and difficulties in meeting the
individual unique needs of all customers.
High Cost and Scarcity of Distribution Channels and Shelf Space
First, shelf space and distribution channels for many products are limited, espe-cially in the offline world; that is, the cost of providing the space to displayproducts in an offline world is very high, and so are the inventory carrying costsfor distributors who decide to carry too many products. Thus, even if a pro-ducer were to try to offer products that satisfy the unique needs of everyone,there would not be enough space on shelves to display all such products at lowcost. There just isn’t enough room in stores or in distribution channels to holdeverything for everyone at affordable costs. Moreover, without access to every-one, most producers would not be able to reach every customer to find out whattheir needs are so as to incorporate them in each customer’s product. Effect-ively, shelf space and distribution channels are a scarce resource and a barrier toentry for many products. The few products that have access to these scarceresources have a good chance of becoming best-sellers or hits. Those productsthat do not have access to the scarce sources are more likely to end up in thelong tail.
Customers’ Cognitive Limitations and Difficulties in Making Choices
Even if there were enough shelf space to carry all the products that satisfy allindividual needs, most customers would have a difficult time choosing from thehuge variety. Given human cognitive limitations, it can be a frustrating experi-ence choosing between five similar products, let alone hundreds or thousands.Think about how difficult it can be choosing between the cars that you canafford. Because of this cognitive limitation of many customers, some of themend up buying the mass-produced and mass-marketed products that may not bewhat they really need.
Customer Heterogeneity, and the Difficulties and High Cost of MeetingIndividual Unique Needs
No two people have identical tastes (with the exception of some identicaltwins). Thus, it would be nice if each product were custom-made to meet the
The Long Tail and New Games 69
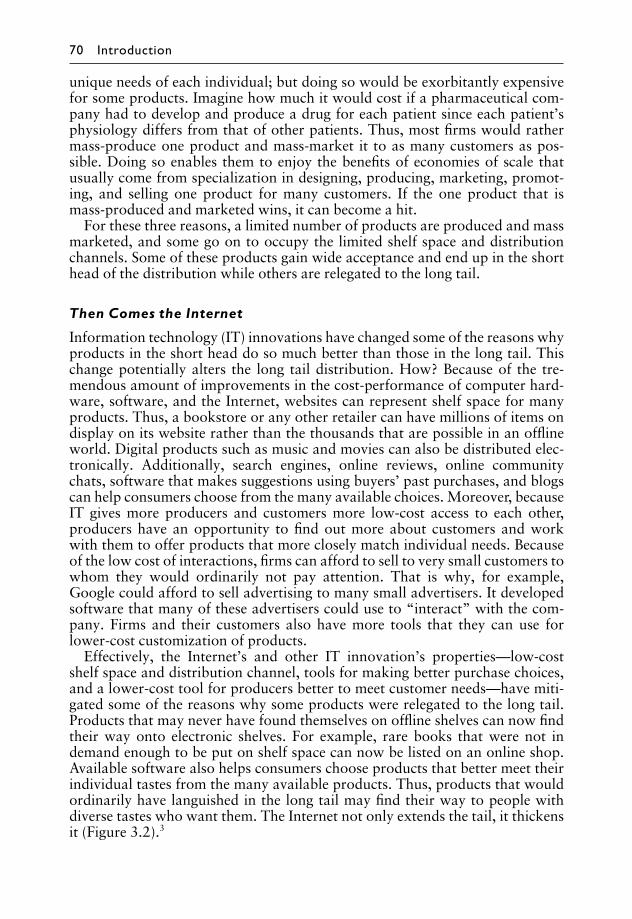
unique needs of each individual; but doing so would be exorbitantly expensivefor some products. Imagine how much it would cost if a pharmaceutical com-pany had to develop and produce a drug for each patient since each patient’sphysiology differs from that of other patients. Thus, most firms would rathermass-produce one product and mass-market it to as many customers as pos-sible. Doing so enables them to enjoy the benefits of economies of scale thatusually come from specialization in designing, producing, marketing, promot-ing, and selling one product for many customers. If the one product that ismass-produced and marketed wins, it can become a hit.
For these three reasons, a limited number of products are produced and massmarketed, and some go on to occupy the limited shelf space and distributionchannels. Some of these products gain wide acceptance and end up in the shorthead of the distribution while others are relegated to the long tail.
Then Comes the Internet
Information technology (IT) innovations have changed some of the reasons whyproducts in the short head do so much better than those in the long tail. Thischange potentially alters the long tail distribution. How? Because of the tre-mendous amount of improvements in the cost-performance of computer hard-ware, software, and the Internet, websites can represent shelf space for manyproducts. Thus, a bookstore or any other retailer can have millions of items ondisplay on its website rather than the thousands that are possible in an offlineworld. Digital products such as music and movies can also be distributed elec-tronically. Additionally, search engines, online reviews, online communitychats, software that makes suggestions using buyers’ past purchases, and blogscan help consumers choose from the many available choices. Moreover, becauseIT gives more producers and customers more low-cost access to each other,producers have an opportunity to find out more about customers and workwith them to offer products that more closely match individual needs. Becauseof the low cost of interactions, firms can afford to sell to very small customers towhom they would ordinarily not pay attention. That is why, for example,Google could afford to sell advertising to many small advertisers. It developedsoftware that many of these advertisers could use to “interact” with the com-pany. Firms and their customers also have more tools that they can use forlower-cost customization of products.
Effectively, the Internet’s and other IT innovation’s properties—low-costshelf space and distribution channel, tools for making better purchase choices,and a lower-cost tool for producers better to meet customer needs—have miti-gated some of the reasons why some products were relegated to the long tail.Products that may never have found themselves on offline shelves can now findtheir way onto electronic shelves. For example, rare books that were not indemand enough to be put on shelf space can now be listed on an online shop.Available software also helps consumers choose products that better meet theirindividual tastes from the many available products. Thus, products that wouldordinarily have languished in the long tail may find their way to people withdiverse tastes who want them. The Internet not only extends the tail, it thickensit (Figure 3.2).3
70 Introduction
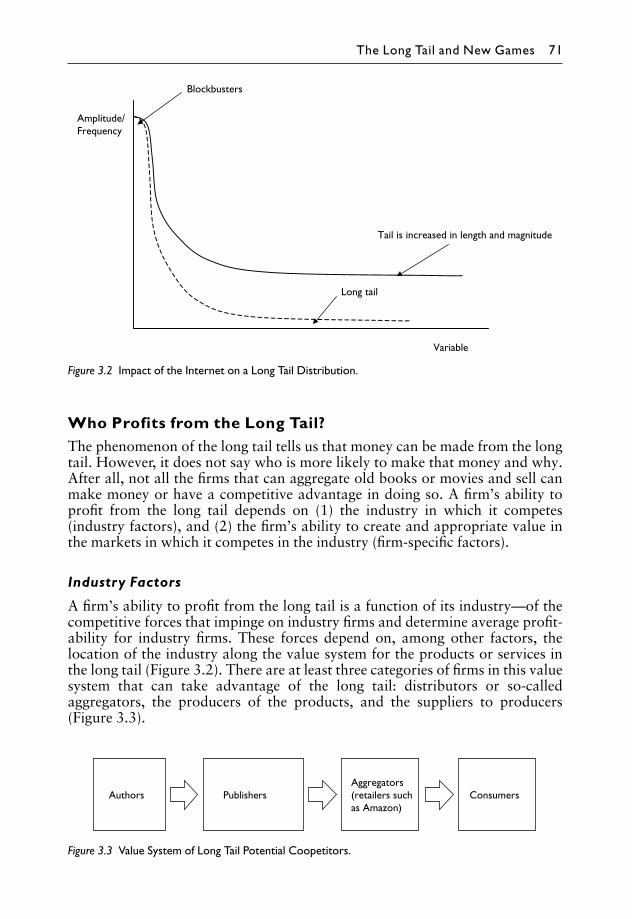
Who Profits from the Long Tail?The phenomenon of the long tail tells us that money can be made from the longtail. However, it does not say who is more likely to make that money and why.After all, not all the firms that can aggregate old books or movies and sell canmake money or have a competitive advantage in doing so. A firm’s ability toprofit from the long tail depends on (1) the industry in which it competes(industry factors), and (2) the firm’s ability to create and appropriate value inthe markets in which it competes in the industry (firm-specific factors).
Industry Factors
A firm’s ability to profit from the long tail is a function of its industry—of thecompetitive forces that impinge on industry firms and determine average profit-ability for industry firms. These forces depend on, among other factors, thelocation of the industry along the value system for the products or services inthe long tail (Figure 3.2). There are at least three categories of firms in this valuesystem that can take advantage of the long tail: distributors or so-calledaggregators, the producers of the products, and the suppliers to producers(Figure 3.3).
Figure 3.2 Impact of the Internet on a Long Tail Distribution.
Figure 3.3 Value System of Long Tail Potential Coopetitors.
The Long Tail and New Games 71

Distributors and Aggregators
Firms such as Amazon.com and Wal-Mart that buy books, movies, DVDs, etc.and sell them over the Internet stand to benefit from the long tail since they canreach out to the long tail of nonbest-seller books, nonhit music DVDs, andnonblockbuster movies, and sell them to their customers by taking advantage ofthe low-cost almost-limitless shelf space of the Internet, better interaction withcustomers, and lower-cost information technologies for consumers to makebetter choices. For example, when Blockbuster Inc. first started renting moviesin its brick-and-mortar stores, 90% of the movies rented from them were newreleases;4 but when Netflix first started using the Internet to rent out movies,70% were new releases while 30% were back catalog. According to ChrisAnderson, 25% of Amazon’s book sales are from outside its website’s top100,000 best-sellers, about 3.6 million of them.5
However, as we will see below, the same technologies that create theseopportunities for aggregators also create a threat of forward vertical integrationfrom producers (book publishers, record labels, movie firms, etc.). Moreover,depending on the power of producers, they can also capture most of the valuecreated by aggregators.
Producers (Manufacturers)
Although the literature on the long tail so far has focused largely on howaggregators can make money reselling what they bought from producers, pro-ducers also stand to make money from the long tail if they are well-positionedvisa-vis their coopetitors and have the right strategies to boot. Every old bookthat Amazon sells means some money for its publisher and author. Every classicmovie that Netflix can rent means a royalty for its producers. Moreover,makers of products or content can also use the Internet to sell their productsdirectly to end-customers or find out what their customers want in the prod-ucts. Dell used the Internet to sell more varieties (as perceived by customers) ofits build-to-order PCs directly to end-customers than it would have been able tosell through distributors. If a product is digital, producers can deliver it directlyto consumers using the Internet. For example, consumers can download moviesdirectly from the movie maker’s site, bypassing aggregators such as Block-buster and Netflix. Customers can buy books directly from the publisher’ssite. Effectively, makers of content and other products can also profit from thelong tail.
However, the competitive advantage of some producers may be eroded. Ifsales of products from the long tail are at the expense of blockbusters from theshort head, the makers of these blockbusters may lose sales. If content providersand other producers bypass publishers and aggregators, the latter may losesome of their competitive advantage.
Suppliers
If suppliers are well-positioned vis-à-vis producers, they can capture more of thevalue that producers create in exploiting the long tail than they did prior to thetechnological change. Suppliers, such as authors and musicians, who usually
72 Introduction

depend on publishers and record labels, respectively, can produce and sell theirproducts directly to customers, bypassing producers and aggregators.
Firm-specific Factors: Ability to Create and AppropriateValue
How well a firm performs in its industry, relative to its competitors, is a func-tion of firm-specific factors. It is a function of how well the firm is able to createvalue and appropriate value. And as we saw in Chapter 2, it is a function of:
1 Whether the firm is performing the right set of activities—activities thatcontribute to creating value, better positioning the firm vis-à-vis coopeti-tors, and to the firm’s exploitation of the value and position.
2 The extent to which the value created is preferred by customers over valuefrom competitors.
3 The extent to which the firm makes money from the value created and itsposition vis-à-vis coopetitors.
4 The extent to which the firm can take advantage of the innovation that ischanging the status quo of the long tail, and any future change.
Effectively, a firm’s ability to create and appropriate value in a long tail can beexplored using the AVAC analysis. We will return to this shortly with anexample.
Beyond the Internet: Some Long Tail CasesAlthough we have limited our discussion of the long tail phenomenon to thecontext of the Internet, the phenomenon exists in many other contexts. As thefollowing cases illustrate, there is an opportunity to take advantage of the longtail in the face of many innovations—technological and nontechnological.
Botox and Cosmetic Surgery
Cosmetic surgery is the use of surgical or medical procedures to enhance theappearance of a person. Until the introduction of Botox, cosmetic procedureswere performed by surgeons. In the USA, the best surgeons performed the mostsurgeries and made the most money while the not-so-good surgeons and gener-alist doctors made very little money from surgery. Thus, great surgeons were inthe short head while not-so-good surgeons and general practitioners were in thelong tail of the cosmetic surgery Pareto distribution. The FDA approval ofBotox in April 2002 for use in cosmetic procedures promised to change all ofthat.6 A Botox procedure involved injecting the substance into the wrinkle,frowning line, or targeted area using a fine gauge needle. The procedure lasted afew minutes, there was no surgery or anesthesia needed, and the patient couldreturn to work the same day. More importantly, any doctor could apply it—that is, the procedure was not limited to surgeons. Thus, the not-so-good sur-geons and general practitioners who were in the long tail of the cosmetic sur-gery distribution could now earn more money from the cosmetic proceduresusing Botox than they did before Botox.
The Long Tail and New Games 73

Cell Phones in Developing Countries
Before wireless cell phones, most villages and small towns in developing coun-tries had little or no phone services. Only fixed-line telephones were availableand because it was very costly to lay the wires (cabling) and exchanges to lowpopulation centers, it was very uneconomical to offer phone services to ruralareas. (Government-mandated monopoly phone companies were also veryinefficient.) Thus, many communities had no phone service. If a person in one ofthese underserved areas wanted to make a phone call, he or she would go to asmall town and make the phone call there. Thus, the number of phone callsmade by people in cities was very large relative to that made by people fromvillages or small towns. Effectively phone service for villagers was in the longtail of each country’s phone system. Cell phone service changed all of that.Because wireless phone services did not require wires, the cost of cabling was nolonger a large constraint. Moreover, government monopolies were eliminatedand competition was introduced in many countries. Suddenly, not only didphone service in rural areas increase considerably, but that in cities alsoincreased. Thus, both the short head and long tail phone service increased.
Discount Retailing in Rural Areas
Before Wal-Mart moved into rural areas of the Southwestern USA, sales of mostproducts in rural areas were at the long tail of discount retailing. Most discountretailing sales were at large discount stores built in large cities. Occasionally,people from the rural areas would drive the long distance to cities to buy someof what they needed or use catalogs from the likes of Sears to order products.Wal-Mart’s strategy was to saturate contiguous small towns with small stores.Thus, by aggregating the sales in many small stores, Wal-Mart was able togenerate the volumes that its competitors generated by building large stores inbig cities, and more. It also adopted the latest in information technology at thetime, built a first-class logistics system, established the Wal-Mart low-cost cul-ture, grew in size, and so on. Wal-Mart performed the right set of activities tocreate value in rural areas and appropriate much of the value created.
Internet and Political Contributions in the USA
Prior to the Internet, most political contributions, especially those to presiden-tial candidates, were made by a few influential donors who made large contri-butions at fundraising dinners, dances, or other gatherings. Organizations suchas unions could also raise money for candidates using their mailing lists ormeetings. Many small donors who could have contributed were largely in thelong tail of donations since each of them donated little or nothing. The adventof the Internet not only increased the amplitude of the tail but extended it, sincemany more small donors made more contributions. By appealing to these smalldonors, candidates such as would-be President Barack Obama, were able toraise huge amounts of donations from ordinary Americans.
74 Introduction

Internet and User Innovation
For years now, Professor Eric von Hippel of the Massachusetts Institute ofTechnology (MIT) has argued that users and suppliers can be as good a sourceof product innovations as manufacturers of products. Each user, for example,can make improvements to a product that other users and the manufacturerhave not or cannot. Technologies such as the Internet enable manufacturers toaggregate these innovations and come up with a greatly improved product.
Microfinancing
In many developing countries, a few rich people or businesses get most of theloans from banks, credit unions, and other major lenders. The large majorityhas no access to financing and when it does, interest rates are extremely high.This large majority can be said to be in the long tail of loans. Very small poten-tial lenders can also be said to be in the long tail of lenders too, since they do nothave enough money to lend to large borrowers. Microfinancing is an innovationthat tackles these two long tails. It makes small loans available to poor people indeveloping countries at reasonable interest rates in an attempt to enable them todig themselves out of poverty. When aggregated, these microloans can be largeenough for big lenders to enter the business. Also, small lenders can also get intothe business of lending since they are people who want small loans. Effectively,we get more borrowers and more lenders borrowing and lending more money.
Organic Foods at the Long Tail of Foods
For a long time in developed countries, conventional foods (crops and animals)have been at the short head of foods while organic foods have been at the longtail. Organic crops are grown without using artificial fertilizers, conventionalpesticides, human waste, or sewage sludge, while organic animals are grownwithout the use of growth hormones and routine use of antibiotics. Neitherfood is processed with ionizing radiation or food additives, and in some coun-tries, they cannot be genetically altered. Producers of organic foods emphasizethe conservation of soil and water as well as the use of renewable resources.Because conventional foods did not have these constraints, and the benefits oforganic foods were not widely understood, most of the foods grown were con-ventional. Availability of organic foods tended to be limited to what local farm-ers could grow and sell in their local farmers’ market or cooperative. They didnot enjoy the economies of scale of conventional foods.
In 1978, Whole Foods Markets was founded to sell organic foods. It tookadvantage of the growing awareness of the health and environmental benefits oforganic foods, and built many organic and natural foods stores in the USA.Whole Foods and its competitors increased the share of organic foods in thecommunities in which they built stores. Effectively, they increased the sales oforganic foods—the products that had languished in the long tail of groceries.
The Long Tail and New Games 75
Printing and the Written Word
Before printing, all works were handwritten and duplicating such works wasmanual and therefore very expensive and time-consuming. Thus, only a selectfew rich people or religious figures such as kings, monks, and priests had accessto written information. Ordinary people were in the long tail of the writtenword since they had little or no access to it. The library helped people to thewritten word; but it was the invention of the printing press that changed allthat. It made a lot of the written word available to the masses. Thus the amountof learning from books by ordinary people, when added, may have rivaled orsurpassed that by kings, priests, and other well-placed people.
Radio and TV Broadcasting
Before radio and TV, news reception was available largely to people in citieswho were close enough to each other to spread it by word of mouth, or get itfrom city theatres. Some of the news also spread via newspapers. Many villagesand small cities were in the long tail of news. TV and radio changed all that,since people in these small villages and towns with TV could now have access tonews before it had become history.
Video Tape Recorders and Blockbuster
Although Netflix’s use of the Internet to erode Blockbuster Inc.’s competitiveadvantage is a classic example of a firm exploiting the long tail to displace anincumbent, Blockbuster actually attained its own competitive advantage bytaking advantage of a new technology to exploit the long tail. The new technol-ogy at the time was the home videotape recorder. Before home videotaperecorders, people had to go to theatres to see movies or hope that the moviewould appear on TV some day. (A select few people had their own projectors athome.) Moreover, when a movie was released, it had a few days to prove itself.After a few weeks in theatres, movies would be relegated to storage, unless a TVstation came calling.
Sony introduced the home videotape recorder (Betamax format) in 1975 andin 1977 George Atkinson launched the first video rental store called VideoStation, in Los Angeles.7 Blockbuster Video was founded in 1985 to also rentout videocassettes for people to play in the comfort of their own homes. Sud-denly each person with a videotape recorder who lived near a video rental storecould turn his or her house into a theatre. The choices for each customerincreased considerably from the ten or so movies that were available in one’slocal theatre, to the thousands of movies that were available in a rental store.The result was that sales of both the hits in the short head and the nonhits in thelong tail increased. How? First, people who wanted to watch hits after theywere out of theatres could now watch them again, at home, thereby increasingthe sales of hits. Second, nonhits that did not do well in theatres or never evenentered theatres could also be watched at home. This increased sales of the longtail. Third, some movies, such as adult entertainment movies, that would neverhave been allowed in some theatres, could now be played at home. This alsoincreased sales of stuff from the long tail. There were also some changes in the
76 Introduction

vertical chain. First, some moviemakers bypassed the theatres and went straightto the video store or to end-customers. Many makers of adult movies could nowsell their movies directly to consumers with video recorders. At a later time,DVDs, the Internet, and movies on demand also offered opportunities toexploit long tail effects.
Effectively, for a firm to exploit the long tail effect, an innovation with one ormore of the following properties should impact the relevant value system. Theinnovation should:
1 Reduce the high cost and scarcity of distribution channels and shelf space.2 Help cognitively limited customers better make product choices.3 Help firms better to meet the individual needs of heterogeneous cus-
tomers—lower cost of product being one of them.
Take the case of movies. Videotape recorders, DVDs, and computers becameindividual screening theatres for movies, giving moviemakers the option tobypass theatres. Consumers did not have to go to theaters to see a movie.Effectively, the cost of distribution per movie seen by consumers dropped.Movie-rental stores could help customers with some of their movie choices.Moreover, customers could now watch movies that were not allowed in localtheatres. Thus, all three conditions were met. In the case of organic foods,Whole Foods brought different organic foods to populations, thereby decreas-ing the cost that each grower would have to bear if he or she had to take his orher own produce to each individual market and sell it. By aggregating thedifferent products and providing information on them, Whole Foods alsohelped consumers better to make their choices of organic products to buy.Whole Foods was also meeting the individual needs of people who believed inorganic foods but could not find enough of them in their local grocery stores.The case of Wal-Mart in rural areas is similar to that of Whole Foods in organicfoods. In the case of cell phones in developing countries, the cost of distributingphone services to villages using cell phones was a lot lower than that of distrib-uting fixed-line phone services. Elimination of monopolies gave consumerschoices that they never had before; but not too many choices. Cell phones alsosatisfied the needs of people who were on the move, people who did not want towait at a particular place to receive a phone call, or go there to make one.Because Botox could be administered by any doctor, compared to cosmeticsurgery that could be performed only by surgeons, Botox-based cosmetic pro-cedures were available to more people in more places. This effectively reduceddistribution costs of cosmetic procedures. Moreover, cosmetic procedures werenow available to people who hated going under the knife, being put underanesthetic, or missing work for days. The product also created an opportunityfor general practitioners who wanted to be in the cosmetic medicine businessbut could not become good surgeons.
Implications for ManagersSo what does all of this mean to a manager? Before answering this question, letus recap the short version of the long tail story so far. In many games, thereare likely to be a few hits, blockbusters, high frequency, or high amplitude
The Long Tail and New Games 77

occurrences that occupy the short head of a distribution—the so-called 20%that get 80% of the action of the Pareto 20/80 rule. The nonhits, nonblock-buster, low-amplitude, or low frequency occurrences occupy the long tail—theso-called 80% that see only 20% of the action. Innovations usually shake upthe distribution, enabling more of the 20% to see more action. Thus, a firm thatexploits such an innovation, in creating and appropriating value, increases itschances of profiting from the long tail. The question is, how can you, as amanager, help your firm exploit the long tail effect? You can improve yourfirm’s chances by going through the following four steps:
1 Identify the long tail distributions in your markets or any markets that youmight like to attack, and their drivers.
2 Identify those new game ideas or innovations that can eliminate or takeadvantage of those conditions that make some products languish in eachlong tail.
3 Perform an AVAC analysis to determine which activities stand to give yourfirm a competitive advantage as it uses new games to create and appropriatevalue in the long tail.
4 Decide on which activities to focus, and how to execute the strategy.
Identify the Long Tail Distributions in your Markets and theirDrivers
As a manager, the first thing to do is identify the long tails (niches) in theindustries in which your firm competes or would like to compete. For each ofthese niches, determine which of the three factors that drive long tail distribu-tions are responsible for the long tails that you would like to exploit; that is,determine the extent to which the high cost and scarcity of distributionchannels, difficulties in customers making product choices, and difficulties inproducers meeting the unique needs of heterogeneous customers are responsiblefor products/services languishing in the long tail rather than thriving in theshort head.
Identify New Game Ideas or Innovations that Eliminate orTake Advantage of Long Tail Factors
Next, scan within your firm and its environment for those new game ideas orinnovations that the firm can use to exploit the identified long tail. That is,search for those new game ideas or innovations that can overcome those factorsthat have been identified as being responsible for relegating products/services tothe long tail. The environment can be internal to the firm or external. Scanningthe internal environment involves combing through a firm’s resources/capabil-ities to see if any of them can be used to pursue the sort of new game that canovercome or take advantage of those factors that relegate products to the longtail. Scanning the external environment entails searching for those new gameideas, knowledge, and capabilities from coopetitors, other industries, and othercountries that can be used to exploit the long tail. Note that the new game ideasand innovations can be technological or nontechnological.
78 Introduction

Perform an AVAC Analysis to Determine How Best toExploit Tail
Having determined what new game ideas or innovations can be used to exploitthe long tail, the next step is to perform a detailed AVAC analysis to understandthose activities that must be performed to create and appropriate value inexploiting the long tail in such a way that your firm has a competitive advan-tage. There are two kinds of analysis that can be performed here. If the firmalready offers some of the products in the long tail, the analysis is very similar tothe one that we perform next for iTunes Music Store, except that the changecomponent will be about the new game or innovation that was identified in Step2 above as the key to overcoming or taking advantage of the factors that rele-gated products to the long tail. If a firm does not offer any products in the longtail, the analysis starts with the type of value that the firm would like to offerand how much of the value the firm would like to appropriate, given the newgame. From there, the firm can work backwards to the types of activities that itneeds to perform to create and appropriate the value needed to have a competi-tive advantage in exploiting the long tail. Note that when a firm chooses whichactivities to perform, it is also choosing the industry in the value system inwhich it wants to locate.
Decide Which Activities to Focus on and How to Execute theStrategy
From the AVAC analysis, the firm can zoom in on those activities that must bereinforced or reversed to enable it to have a competitive advantage. It must thenhire the right people and build the right organizational structure and systems toexecute the strategy, given its environment.
Effectively, the long tail concept offers managers one way to identify whitespace. You would recall that when a firm introduces a new product or service, itusually chooses between entering a battlefield with many existing competitors,or pursuing white space where there is little or no existing competition. Thelong tail concept offers one method for locating such white space. The shorthead has the established providers of the hits who are likely to be strong com-petitors. The long tail is where there is more room to enter, using the innov-ation. Thus, by identifying the reasons why a long tail exists, one can innovatearound these reasons and improve one’s chances of having a competitive advan-tage. Many disruptive technologies actually start by addressing long tail needsbefore moving on to attack the hits of the short head.
Example 3.1
When a firm takes advantage of the Internet’s properties—low-cost shelf spaceand distribution channel, a tool for making better purchase choices, and alower-cost tool for producers to meet customer needs better—to pursue a strat-egy to profit from a long tail, the firm is playing a new game. It must cooperatewith its coopetitors to create value and compete with them to appropriate thevalue in the face of the changes brought about by the Internet. As we detailed inChapter 2, an AVAC analysis can be used to not only explore the profitability
The Long Tail and New Games 79

potential of a strategy but also to develop a business plan or strategic plan. Weuse the case of the iTunes Music Store (iTMS) to illustrate how the AVAC can beused to explore what a firm is doing or should be doing to exploit a long tail.
The Case of iTunes Music Store in 2007
iTunes Music Store was launched on the Mac on April 28, 2003, and in sevendays, customers bought one million songs. In October 2003, a Windows ver-sion of the software was launched and in just three and a half days, over onemillion copies of it were downloaded and over one million songs purchasedthrough the store.8 Later that year, Time Magazine declared iTunes Music Store“the coolest invention of 2003.”9 Music from the store could be played withoutdifficulty only in iTunes or on Apple’s iPods. However the songs could be burntonto a CD and then played on another digital audio player. Apple alsodeveloped its FairPlay digital rights management (DRM) system that protectedsongs from piracy. When protected songs were purchased from the iTunesStore, they were encoded with Fairplay which digitally prevented users fromplaying the files on unauthorized computers. By December 2005, more than onebillion songs had been sold through iTunes Music Store. In 2007, iTunes hadtwo primary functions: It was used for organizing and playing music and videofiles, for interfacing with the iTunes Music Store (iTMS) to purchase digitalmusic and movie files, and for interfacing with the iPod to record and playmusic and video.10 Effectively, iTunes, in conjuction with iPod and iTunesMusic Stores enabled users to access millions of songs, make a choice of what topurchase, backup songs onto DVDs and CDs, copy files to a digital audioplayer, download and play podcasts, organize music into playlists, and so on.
Customers paid $0.99 for each song purchased in the iTunes store, of which$0.65 went to the record label while distribution collected $0.25.11 Apple wastherefore left with about 10 cents. Question: to what extent was Apple exploit-ing the long tail effect?
An Analysis of Apple’s Exploitation of the Long Tail Effect Using iTunes: TheAVAC Analysis
The products in the case were songs, some of which were hits at one time or theother but most of which were nonhits or old hits (oldies) that languished in thelong tail. The combination of the Internet, MP3 technology, and other informa-tion technologies constituted the innovation that made exploitation of the longtail possible. The combination (1) made more shelf space and distributionchannels available for music at much lower costs, (2) enabled more low-costand effective access between producers and customers since offline record storescould be bypassed, and (3) offered customers better ways of choosing betweenthe many songs available. For Apple to have a competitive advantage in exploit-ing the long tail, it had to create and appropriate value better than its competi-tors. We use an AVAC analysis to examine the extent to which Apple wasable to take advantage of the changes introduced by the Internet and othertechnologies to exploit the long tail.
80 Introduction

Activities
Recall that the Activities component of an AVAC framework is about exploringthe extent to which the firm is performing the right set of activities—activitiesthat contribute to creating value, better positioning the firm vis-à-vis coopeti-tors, and to the firm’s exploitation of the value and position. The AVAC questionsthat are explored to understand the role of activities are shown in Table 3.1:
Apple performed the following iTunes-associated activities. It:
• Introduced iTunes on both the Mac and Windows platforms.• Offered a complementary product, iPod, to match.• Developed the FairPlay digital rights management (DRM) system.• Entered into agreements with content providers to provide music.• Priced the music at 99 cents a song.
In performing these activities, the firm contributed to differentiating Apple’sofferings in several ways. By offering iTunes on both the Mac and Windowscomputers, Apple made it accessible not only to its Mac users but also to themuch larger installed base of Windows users and machines. This was the first
Table 3.1 The Activities Component of an iTunes AVAC Analysis
Questions Answers
A. Was Apple performing the right activities?What was the set of activities (andassociated resources) that constitutedApple’s strategy for iTunes?
Did the activities and/or resources/capabilities:1. contribute to low cost, differentiation,
and other drivers of profitability?2. contribute to better position Apple vis-
à-vis coopetitors?3. take advantage of industry value drivers?4. build new distinctive resources/
capabilities or translate existing onesinto unique positions?
5. maintain parsimony andcomprehensiveness?
A: What• Introduced iTunes on both the Mac and Windowsplatforms
• Offered a complementary product, iPod, to match• Developed the FairPlay digital rights management(DRM) system
• Entered into agreements with content providers toprovide music
• Priced the music at 99 cents a song
B: How1. YES. NO. Availability of iTunes on both the Mac and
PC, together with the Apple brand, DRM and iPodcontributed to differentiation. Two sources ofrevenue: songs and iPod. Not clear if customersstayed.
2. YES. NO. DRM better positioned Apple vis-à-viscontent suppliers.
3. YES. Took advantage of two key industry valuedrivers: intellectual property protection of songs,and network externalities effects of Windows andMac installed base.
4. YES. Built iPod brand, installed base in Windows,relationships with coopetitors, and DRM system.Exploited the Apple brand.
5. NO. No mention of superfluous activities beingperformed by Apple; but it appears there are otheractivities that it could perform to create andappropriate value better.
The Long Tail and New Games 81

product that Apple had offered on both its Mac and the competing Windowsplatforms. By making sure that music from the store could be played withoutdifficulty only in iTunes or on iPods, Apple may have been slowing access to itsmusic store but limiting the competition faced by its iPod—a much highermargin product for Apple than songs. By developing the FairPlay digital rightsmanagement (DRM) system that protected songs from piracy, Apple reducedthe fear of piracy by record labels and musicians. Thus, Apple could enteragreements with these record companies, giving it the right to sell their songsonline. By demonstrating to the recording companies that it could protect theirintellectual property from online piracy and cooperating with them, Apple wasalso effectively dampening their bargaining power. The agreements alsoreduced the amount of rivalry that Apple ordinarily faced. By developing Fair-Play, Apple was also taking advantage of a key industry value driver in themusic industry: intellectual property protection. By porting its iTunes softwareto the Windows camp, continuing to build the iPod brand, and offering attract-ive iPod models, Apple was able to build a loyal audience within the Windowscamp. This Windows-installed base was a valuable resource. The Apple brandand Steve Jobs were also valuable resources. None of the activities that Apple isperforming appear to be superfluous. There is limited information in the case,but it would appear that there is more that Apple can perform to improve valuecreation and appropriation.
Value
The Activities component above tells us how the activities contributed to thevalue created and appropriated. The Value component is about the uniquenessof the value created and who perceived it—whether the contributions made tovalue creation were enough. The questions for exploring the Value componentare shown in Table 3.2.
Music customers perceived the value from iTunes Music Store as being
Table 3.2 The Value Component of an iTunes AVAC Analysis
Questions Answers
How unique was the value created by Apple’sstrategy for iTunes, as perceived by customers,compared to that from competitors?
1. Did customers perceive value created byApple as unique relative to what competitorsoffered?
2. Did many customers perceive this value?3. Were these customers precious (valuable)?
What are the market segments and sourcesof revenue?
4. Were there any white spaces nearby?
When iTunes, the music store, and associatedDRM were introduced, they were the onlyones on both the Mac and Windows.
1. YES. Features of iTunes, the Apple brand, andiTunes availability on Macs and PCs wereperceived as unique.
2. YES. Millions of customers downloaded thesoftware and a billion songs were bought in avery short time.
3. YES. NO. There were some valuablecustomers in the large base of Mac andWindows users but it was difficult to tellwhich ones were valuable.
4. There were white spaces in phones, andother handhelds. Apple offered an iPhone.
82 Introduction

unique. Through the store and associated information technologies, customershad access to millions of songs. They also had the means to choose from themillions of songs. Customers did not have to buy an album because of one goodsong on it. They could also see the rating of the popularity of a song to helpthem make their choices. They could shop 24 hours a day, seven days a week,from anywhere in the world, and could test-play portions of any song oniTunes. Because Apple made iTunes available on Windows, it had a lot morevaluable customers than it may have had, had it limited iTunes to the Macplatform. As of 2007, customers with the Apple or Microsoft operating systemson their computers and access to the Internet could shop at the music store.However, computers with the Linux operating system could not. Many cus-tomers with PCs and access to the Internet were probably more willing to paythe $0.99 per song that they liked than the average music offline customer. Asfar as white spaces were concerned, there were lots of handheld devices, outsideof MP3 devices, that did not have access to iTunes when Apple introducediTunes on Windows. One of these white spaces was the phone, which Applewould later occupy by introducing the iPhone.
Appropriability
The Activities component tells us how a firm’s activities contribute to valueappropriation but does not tell us the extent to which the activities actuallyresult in value appropriation. The Appropriability component tells us the extentto which value was appropriated by the activities performed by Apple. Thequestions for exploring the appropriability component are shown in Table 3.3.
Table 3.3 The Appropriability Component of an iTunes AVAC Analysis
Questions Answers
Did Apple’s strategy for iTunes (set of activities)enable the firm to make money from the valuecreated? (How much money?)
1. Did Apple have a superior position vis-à-visits coopetitors?
2. Did Apple exploit its position vis-à-viscoopetitors and take advantage of the valueperceived by customers?
3. Was Apple’s iTunes strategy difficult toimitate? (a) Was there something aboutApple and its set of activities and resourcesthat made it difficult for competitors toimitate its strategy? (b) Was there somethingabout competitors that impeded them fromimitating Apple?
4. (a) Was the value non-substitutable? (b)Were complements being strategically wellused?
Apple did not make much money directly fromsongs. It made money indirectly from iPods andiPhones.
1. NO. Although its activities improved itsposition vis-à-vis coopetitors, Apple still didnot have a superior position vis-à-vis itssuppliers and customers.
2. YES. NO. Was able to get content providersto agree on something. Possible that by fixingits price at $0.99 per song, Apple’s price forsongs was not close enough to customers’reservation prices.
3. YES. NO. Apple’s brand, DRM, and system ofactivities were not easy to imitate; but therewas nothing about competitors thatprevented them from offering similarproducts or performing similar activities.
4. NO. YES. In 2007, offline music stores werestill viable substitutes. Apple used the iPodand iPhones strategically. These were pricedto give Apple better margins than songs.
The Long Tail and New Games 83

Although Apple did not make much money directly from sales of songs in theiTunes digital music store, it may have been making money from sales of itsiPods and iPhones. Content providers still had lots of bargaining power overApple since other channels for selling their content to end-customers existed.Thus, Apple made only 10 cents out of every 99 cents collected for each songsold, while the record labels made 65 cents and distribution the remaining 24%.This constituted a very low profit margin for Apple, but the margins on iPodswere a lot larger; and without the iTunes music store, the iPod would not havehad access to many songs, reducing its value to customers. Having access toboth Windows and Mac users gave access to many valuable customers; but witha fixed price of $0.99 per song, there was little attempt to get closer to cus-tomers’ reservation prices. Apple’s brand and the iPod constituted importantcomplementary assets. There was little about Apple and its competitors to showthat iTunes would not be imitated. In fact, because iTunes worked only withiPods, many competitors who wanted a piece of the action were more likely totry to build their own online music stores. Substitutes for iTunes were the otherchannels that artists and record labels could use to sell their music. Comple-ments were all compatible MP3 players.
Change: New Game
The primary change in this case was the Internet—the innovation that createdthe opportunity to exploit the long tail of music. When a firm took advantage ofthe Internet’s properties—low-cost shelf space and distribution channel, a toolfor making better purchase choices, and a lower-cost tool for producers to meetcustomer needs better—the firm was playing a new game. Apple was takingadvantage of the change brought about by the Internet to exploit the long tail ofmusic, and we can explore the extent to which Apple succeeded in doing sousing the questions of Table 3.4.
Apple’s primary strength in the pre-iTunes era was its brand name reputationas well as its installed base of Mac users. These strengths continued to bestrengths in the iTunes era. Its biggest weakness in the pre-iTunes era had beenits rather small installed base of Macs (4%) compared to the much larger (94%)installed base of Windows. In making software available on both the Mac andWindows, Apple has eliminated this weakness. In offering iTunes, Apple tookadvantage of the Internet in several ways. It utilized the Internet’s huge low-costvirtual shelf space to offer millions of song titles to customers who could accessthe store from anywhere in the world with a Mac or a PC. Complemented bythe FairPlay DRM system that protected songs from piracy, iTunes was uniqueon the web when it was introduced. Effectively, Apple was offering uniquevalue. By offering the iPod and later, the iPhone, Apple was making sure thatcustomers not only had access to songs, but that they also had access to moreplatforms to play them. Apple used iTunes and iPod not only to reinforce itsbrand name reputation but also to establish new Internet-based brands in iPodand iTunes. We now have podcast as a verb, thanks to Apple and its iPod/iTunes.
Apple took advantage of some opportunities for first-mover advantages. Bybeing the first with a system that could protect songs from piracy—its FairPlayDRM system—Apple demonstrated to record labels and musicians that their
84 Introduction

songs would not be pirated away. The timing was right given the amount ofmusic piracy that was taking place on the Internet. This enabled the firm toestablish relationships with content providers. It was not the first to offer anMP3 player, and therefore took advantage of MP3 first-mover disadvantages—the fact that the technology and market for MP3s had already been establishedby first movers—when Apple offered its own MP3—the iPod.
One can argue that, in porting iTunes to Windows, Apple was anticipatingthe likely reaction of Windows-based competitors who could have offered aniTunes equivalent for Windows. By offering iTunes on Windows first, Applewas effectively preempting potential competitors. By the time other firmsoffered competing online music stores on Windows, Apple had built switchingcosts and other first-mover advantages at many customers.
The Internet offered both opportunities and threats. The same properties ofthe Internet that Apple took advantage of could also be threats to it later sincecompetitors could take advantage of them to attack Apple.
Table 3.4 The Change Component of an iTunes AVAC Analysis
Change
Did the strategy take advantage of change (presentor future) to create unique value and/or positionApple to appropriate the value? In creating andappropriating value in the face of the change,given its strengths and handicaps, did the firm:
1. Take advantage of the new ways of creatingand capturing new value generated bychange?
2. Take advantage of opportunities generatedby change to build new resources ortranslate existing ones in new ways?
3. Take advantage of first-mover’s advantagesand disadvantages, and competitors’handicaps that result from change?
4. Anticipate and respond to coopetitors’reactions to its actions?
5. Identify and take advantage of theopportunities and threats of theenvironment? Were there no betteralternatives?
The strategy took advantage of change. Apple’sbrand was a strength.
1. YES. Apple took advantage of the new waysof creating and capturing value created bythe Internet. It offered unique value in iTunes,iPod and its brand.
2. YES. It built new resources: Windowsinstalled base, iPod/iTunes brand, andrelationships with record labels.
3. YES. Apple built and took advantage of somefirst-mover advantages. Its DRM systemallowed it to convince record labels thattheir music would not be pirated. It alsomoved on to build an Internet music brand.It took advantage of an established marketand technology for MP3 players.
4. YES. In porting iTunes to Windows, Applewas anticipating the likely reaction ofWindows-based competitors such as mightyMicrosoft. It was expected that manycompetitors would still enter.
5. YES. NO. In creating and appropriating valuethe way it did, Apple was taking advantage ofopportunities and threats of environment.Musicians, record labels, and competitorscould also build their own online musicstores, thanks to change (the Internet).
The Long Tail and New Games 85

Strategic Consequence of the iTunes AVAC Analysis
Apple’s strategy for iTunes in 2007 is compared to alternate strategies in Table3.5. The strategy compares well vis-à-vis alternatives. The competitive paritydesignation reflects the fact that Apple did not make much money directly fromiTunes. The record labels make most of the money. However Apple makesmoney indirectly from its iPods and iPhones. It also reflects the fact thatalthough Apple took advantage of the Internet, it was not clear that it would beable to take advantage of future change.
As we saw in Chapter 2, the most important thing about an AVAC analysismay not be so much that we can classify a strategy as having a sustainablecompetitive advantage, temporary competitive advantage, competitive parity,or competitive disadvantage. The important thing is what the firm can do toreverse the Noes or reinforce the Yesses and in the process, get ever so closer tohaving a sustainable competitive advantage. The question for Apple was, whatcould it do to have a competitive advantage rather than competitive parity?Apple was taking some steps in the right direction. Introduction of the iPhone,patenting its DRM, etc. were all good steps.
Table 3.5 Strategic Consequences of an AVAC analysis of Apple’s iTunes Activities
Activities: Is Appleperforming theright activities?
Value: Is thevalue created byApple’s iTunesstrategy unique,as perceived bycustomers,compared tothat fromcompetitors?
Appropriability:Does Applemake moneyfrom the valuecreated?
Change: Does thestrategy takeadvantage ofchange (presentor future) tocreate uniquevalue and/orposition itself toappropriate thevalue?
Strategicconsequence
Strategy 1 Yes Yes Yes Yes Sustainablecompetitiveadvantage
Strategy 2 Yes Yes Yes No Temporarycompetitiveadvantage
Apple’siTunesstrategy in2007
Yes Yes No/Yes Yes/No Competitiveparity
Strategy 4 Yes Yes No No Competitiveparity
Strategy 5 No No No No Competitivedisadvantage
Strategicaction
What can Apple do to reinforce the YESes andreverse or dampen the NOes
86 Introduction
AVAC for Record Labels and Musicians
Note that the analysis that we have just completed is for an aggregator, Apple,which exploited the long tail by aggregating songs from different record labelsand musicians and selling them; but as we saw earlier, aggregators were not theonly ones that could exploit the long tail. Record labels (producers), andmusicians (suppliers) could also exploit the long tail effect. Thus, an AVACanalysis could be conducted for each of them to explore the extent to whicheach takes advantage of the characteristics of the Internet to make money fromthe long tail.
Key Takeaways
• In many markets, there are likely to be a few hit or blockbuster products/services, and many nonhits. The hits occupy the so-called short head whilethe nonhits occupy the long tail of a distribution that has been called namessuch as Pareto Law, Pareto Principle, 80/20 rule, heavy tail, power-law tail,Pareto tails, and long tail.
• Chris Anderson was the first to use the name long tail to describe the non-hits that end up in the long tail (niches) of each distribution. He argued thatin the face of the internet, the combined sales of the many products in thelong tail can be equal to, if not more than, sales of the relatively fewer hits inthe short head. Thus, by aggregating these nonhits, a firm may be able tomake as much money from them as it could from hits.
• In general, distributions in which there are a few product hits and manynonhits are a result of:
1 The high cost and scarcity of distribution channels and shelf space.2 Customers’ cognitive limitations and difficulties in making product/ser-
vice choices.3 Customer heterogeneity and the high cost of and difficulties in meeting
individual unique needs of all customers.
• Any new games or innovations that alleviate the above three factors canalter the shape of the long tail distribution.
• The Internet, for example, drastically reduces the cost of distribution andshelf space for some products, facilitates consumer choices, and makes itpossible to better meet more varied kinds of consumer taste. Thus, firms canuse the Internet to improve sales of products that once languished in thelong tail. The question is, which firm is likely to have a competitive advan-tage in exploiting the long tail?
• The Internet is not the only innovation that drives or drove the long tailphenomenon. Many others did and continue to do so:
� Botox and cosmetic surgery� Cell phones� Discount retailing in rural areas� Internet and political contributions� Internet and user innovations� Microfinancing� Organic food stores
The Long Tail and New Games 87
� Printing press� Radio and TV broadcasting� Video tape recorders.
• To have a competitive advantage in exploiting the long tail, a firm has tocreate and appropriate value in the face of the innovation that makesexploitation of the long tail possible.
• An AVAC analysis is a good tool for exploring which activities are best forcreating and appropriating value in a long tail.
• To take advantage of what we know about the long tail, you, as a manager,should:
1 Identify the long tail distributions in your markets, or the markets thatyou want to attack, and their drivers.
2 Identify those new game ideas or innovations that can eliminate or takeadvantage of those conditions that make some products languish ineach long tail.
3 Perform an AVAC analysis to determine which activities stand to give afirm a competitive advantage as it uses new games to create andappropriate value in the long tail.
4 Decide which activities to focus on, and how to execute the strategy.
Key Terms
Long tailShort head
88 Introduction

Strengths andWeaknesses
Chapter 4: Creating and Appropriating Value UsingNew Game Strategies
Chapter 5: Resources and Capabilities in the Face ofNew Games
Chapter 6: First-mover Advantages/Disadvantagesand Competitors’ Handicaps
Chapter 7: Implementing New Game Strategies
Part II


Creating and Appropriating ValueUsing New Game Strategies
Reading this chapter should provide you with the conceptual and analyticaltools to:
• Increase your understanding of the determinants of value creation andappropriation.
• Analyze how much value each member of a value system captures and why.• Understand the contribution of new game and value chain factors to a
firm’s competitive advantage.• Strengthen your ability to think strategically.
IntroductionDo you own a PC, iPhone, car, airplane, shoes, or a watch? How much of whatyou value in each of these products do you think was created by the “maker” ofthe product? How much of the value does the “maker” appropriate? What is itsstrategy for creating and appropriating value? How many countries contributeto the benefits that you value in the product? Consider one of these products,the iPhone: Each owner of an iPhone perceives value in the device when he orshe navigates through the device by touching the screen, makes or receivesphone calls, surfs the Web, sends or receives e-mail, takes or views pictures, andso on. Apple conceived of and designed the iPhone but did not manufacture theproduct when it introduced it in 2007. The hundreds of components that wentinto the product came from numerous suppliers from the USA, Europe, andAsia, and were shipped to an Asian manufacturer who assembled and shippedthem to the USA for distribution. Many of the critical components, especiallythe microchips, were themselves systems that were designed and either manu-factured by the suppliers, or manufactured by their subcontractors before beingshipped to Apple’s own subcontractors for assembly. (Microchips, with theirrapidly increasing functionality but dropping prices, are what have madeinnovations such as the iPhone possible.) Infenion AG, a German company,supplied the digital baseband, radio-frequency transceiver, and power-management devices.1 Samsung, a Korean company, made the video processorchip, while Sharp and Sanyo, Japanese firms, supplied the LCD display. Thetouch-sensitive modules that were overlaid unto the phone’s LCD screen tomake the multitouch control possible were designed by Balda AG, a Germancompany and produced in its factories in China. Marvel Semiconductor ofthe US provided the WiFi chips. The Camera Lens was supplied by Largan
Chapter 4

Precision of Taiwan while the camera module was supplied by three Taiwanesecompanies: Altus-Tech, Primax, and Lite On. Delta Electronics supplied thebattery charger. Various other firms supplied other components. Apple alsosupplied the operating system and other software that manages the device.
The question is, how much value does Apple create and appropriate in offer-ing the iPhone? How much value is created and/or appropriated by each sup-plier? How much value is created by which country? We will return to thesequestions later in this chapter. We start the chapter with a very important dis-cussion of what creating and appropriating value is all about. We then explorethe impact of new game activities on the creation and appropriation of value. Inparticular, we argue that the contribution of a set of new game activities to valuecreation and appropriation has two components: a component that is due tothe fact that the activities are value chain activities and another that is due to thefact that they are new game. We conclude with the reminder that value creationcan be as important as value appropriation and focusing only on one and notthe other can make for bad strategy. One need only recall the example ofmusicians, who create lots of value but often do not appropriate all of it, to bereminded of the significance of value appropriation.
Creating and Appropriating ValueThe concepts of creating and appropriating value are central to strategy and oneway to understand them is through the illustration of Figure 4.1. Recall thatbusiness strategy is about making money and that revenues come from cus-tomers who buy products or services from firms. A customer buys a productfrom a firm because it perceives the product as providing it (the customer) withbenefits, B; but to provide the benefits, B, a firm has to perform value-addingactivities such as R&D, purchasing of equipment, components and materials,transformation of these components and materials into products or services,marketing these products and services to customers, and distributing theproducts to customers. These activities cost C. The economic value created, V,
Figure 4.1 Value Creation and Appropriation.
92 Strengths and Weaknesses
by the firm is the difference between the benefits, B, that a customer perceives tobe in the product and how much it costs the firm to provide the benefits;2 that is,V = B − C. The customer pays a price P for the benefits that it receives. Thisgives the firm a profit of P − C, and the customer gets to keep B − P; that is, thevalue captured (value appropriated) by the firm is the profit, P − C, from thevalue created. In economics, this profit is sometimes called the producer’s sur-plus while what the customer gets to keep, B − P, is called the consumer’s sur-plus. As an example, consider the value created when a firm builds and sells acar. Suppose a carmaker develops and markets a new car that customers love somuch that they would be willing to pay $30,000 for the benefits that theyperceive in owning the car. Also suppose that it costs the firm $15,000 to pro-duce the car (including R&D, marketing and manufacturing costs) whose pricethe firm sets at $20,000. From Figure 4.1, the value created is $15,000(30,000 − 15,000), the carmaker’s profit is $5,000 (20,000 − 15,000). The cus-tomer’s consumer surplus is $10,000 (30,000 − 20,000).
Note that although the value created by the firm is B − C, the firm onlycaptures a fraction of it in the form of profits (P − C). In other words, it onlyappropriates part of the value that is created, P − C. The other part of the valuecreated is captured by the customer in the form of consumer surplus. In otherwords, making money involves both creating value and appropriating the valuecreated. We now discuss both value creation and appropriation in detail.
Value Creation
Recall that the value created is the difference between the benefits that cus-tomers perceive and the cost of providing the benefits. Effectively, value cre-ation is about performing value chain activities so as to offer customerssomething that they perceive as beneficial to them, and insuring that the cost ofoffering the benefits does not exceed the benefits—it is about benefits and costs.The benefits that customers derive from a product can be from the product’sfeatures (performance, quality, aesthetics, durability, ease of use), the product’sor firm’s brand, location of the product, network effects associated with theproduct, or the service that comes with the product. Thus, designing a product,manufacturing and testing it all add value since they all contribute to the prod-uct’s features. Advertising a product also adds value when it improves cus-tomers’ perception of the product. Distributing a product adds value when itbrings the product closer to customers who would otherwise not have access toit. For products which exhibit network effects, performing activities that addmore customers constitutes value creation because the more people that use theproduct, the more valuable that it becomes to each user.
There are numerous things that a firm can do to keep its costs down whilecreating benefits for customers. It can innovate by using new knowledge or acombination of existing knowledge to drastically improve existing ways of per-forming activities, thereby drastically lowering its costs. It can take advantageof economies of scale, if its products are such that the higher its output, thelower the per unit costs of its products. It can take advantage of economies ofscope, if the different products that it sells are such that the per unit costs ofproducing these products together is less than the per unit cost of producingeach product alone. It can lower its costs by taking advantage of what it has
Creating and Appropriating Value Using New Game Strategies 93

learnt from its experiences in moving up different learning curves. It can alsotake advantage of any unique location that it may have such as being close to acheap source of labor. A firm can also take advantage of industry or macro-related factors. For example, if a firm has bargaining power over its suppliers, itcan negotiate to pay lower prices for its inputs, thereby keeping its costs lower.It can also use that power to work more closely with suppliers to keep compon-ent costs lower so that the supplier can pass on some of the costs savings to thefirm in the form of lower input costs. Finally, a firm can keep its costs low byputting in place the right incentives and monitoring systems to reduce agencycosts. Recall that agency costs are the costs that firms incur because employeesor other agents are not doing what they are supposed to be doing. Effectively,firms can create value by offering more benefits and keeping down the costs ofproviding the benefits. We will revisit some of these factors when we explore therole of new game activities.
Value Appropriation
Value appropriation is about who gets to profit from the value created. It isabout what slice of the pie one ends up getting. Referring to Figure 4.1, again,the producer firm only keeps a fraction of the value created (firm’s profit) whilethe customer or supplier keeps the rest (consumer profit). There are five reasonswhy a firm that creates new value using new game activities may not be able toappropriate all of the value created:
1 The firm may not have the complementary assets needed.2 The firm may not be well-positioned vis-à-vis its coopetitors.3 The firm may not have the right pricing strategy.4 The value that the firm offers may be easy to imitate or substitute.5 The firm may not have enough valuable customers that want the benefits
that it offers.
Complementary Assets
If the product that encapsulates the value created requires scarce and importantcomplementary assets to profit from it, the owner of the complementary assetsmay be the one that captures the value and not the firm that created the value.This is particularly true if the product is easy to imitate. Complementary assetsare all the other resources, beyond those that underpin the new game, that afirm needs to create and capture value. They include brands, distribution chan-nels, shelf space, manufacturing, relationships with coopetitors, comple-mentary technologies, access to complementary products, installed base, rela-tionships with governments, and so on. Therefore a firm that invents or dis-covers something (through its new game activities) may need to use other newgame activities to establish prior positions in complementary assets so as toprofit from the invention. In the music industry case, recording companiesand agents have complementary assets such as contacts, brands, and distribu-tion channels. We will explore complementary assets in much more detail inChapter 5.
94 Strengths and Weaknesses

Relationships with Coopetitors
Another reason why a firm that creates value may not be able to capture allof it is that the party with the most bargaining power is not always the onethat created the value or that makes the largest contribution towards valueco-creation. (In fact, the one with the most power might contribute the leastto value creation.) In the coopetition between Intel, Microsoft, and PCmakers that delivers value to PC users, Microsoft is the most profitable but itis doubtful that it creates the most value in that value system. (Creating valueis synonymous with working together to make a pie while appropriatingvalue is equivalent to dividing the pie.) The position vis-à-vis coopetitorsdetermines the share of the pie that each firm receives. If a firm’s suppliers orbuyers have bargaining power over the firm, it may have difficulties capturingthe value that it has created. For example, if a firm has only one supplier of acritical component, the supplier can charge so much for the component thatthe firm’s profit margins will be reduced to zero—the supplier effectivelycaptures most of the value that the firm has created. Buyers with power canalso extract low prices out of the firm, reducing the amount of value that itcan capture. Thus, pursuing new game activities that increase a firm’s bar-gaining power can better position the firm to appropriate the value created. Aclassic example is that of Dell which we saw in Chapter 1. By bypassingdistributors to sell directly to businesses and consumers, it was moving awayfrom having to confront the more concentrated and powerful distributors todealing directly with the more fragmented end-customers who had less powerthan distributors.
Good relationships with coopetitors can also help a firm to appropriate valuebetter. For example, as we saw earlier, if a firm works more closely with itscustomers to help them discover their latent needs for its products, the willing-ness to pay of these customers may go up, thereby increasing the firm’s chancesof appropriating more of the value it creates.
Pricing Strategy and Sources of Revenue
The third reason why a firm which creates new value may not be able to captureall of it has to do with pricing and sources of revenue. The closer that a firm setsits price to each customer’s reservation price, the more of the value created thatthe firm gets to keep, if the higher price does not drive the customer to competi-tors. Recall that a customer’s reservation price for a product is the maximumprice that it is willing to pay for the product. The higher a customer’s reserva-tion price, the higher the chances that the price demanded will fall enoughbelow the customer’s reservation price to leave it some consumer surplus. Also,the higher a customer’s reservation price, the better the chances that the pricedemanded by the firm will not drive the customer away. The price demanded, inturn, is a function of the relationship between the firm and the customer, espe-cially the bargaining power of one over the other, and the firm’s pricing strat-egy. The higher a firm’s bargaining power over its customer, the more that it canextract higher prices from the customer, thereby raising the fraction of the valuethat it keeps (profits). Also, a firm that has good relationships with its customerscan better work with such customers to discover and meet their needs, thereby
Creating and Appropriating Value Using New Game Strategies 95

increasing the customer’s reservation price and lowering costs, all of whichincrease the value created and appropriated.
Effectively, if a customer has a high reservation price but a firm sets its pricebelow the reservation price, the customer keeps the difference and walks awaywith a higher consumer surplus while the firm leaves with a lower profit. Pricingabove customers’ reservation prices drives them away. Thus, a firm is better offpursuing a pricing strategy that gets it as close as possible to a customer’sreservation price, without driving customers to competitors. A firm’s sources ofrevenue also determine the amount of revenues that it collects and in a way, thevalue that it captures. New game activities that create new sources of revenuecan increase the value that a firm can capture. Take the case of Ryanair. Inaddition to the revenues that it collects from airline tickets, it also receivesrevenues from advertising, sales of snacks and duty free goods, and commis-sions on hotel accommodation and car rental reservations made through itswebsite. Effectively, the primary value that Ryanair offers its passengers is fly-ing them from one place to the other. These other sources of revenue help itappropriate more of the value that it creates in an indirect way.
Imitability and Substitutability
Imitability and substitutability can also curb the extent to which a firm canappropriate all the value that it creates. If competitors are able to imitate thevalue that a firm creates, its prices and the quantity that it sells are likely todrop. If other firms can offer viable substitute products, customers can switch tothese substitutes if a firm’s prices are higher than they would like. This reducesthe value that the firm can appropriate.
Number of Valuable Customers
The number of valuable customers that a firm can attract with the value that itoffers also contributes towards how much value is captured. This depends onthe ratio of fixed costs relative to variable costs. The lower the variable costsrelative to fixed costs, the more that each extra unit sold is likely to bring inmore profits than earlier units. By definition, valuable customers have a highwillingness to pay and therefore are likely to have higher reservation prices andbe more likely to buy more than one unit. Effectively, the number of customersalso matters; and so does the market or market segment that a firm targets, sincenot all customers have the same willingness to pay for a given set of benefits orcost the same to acquire and keep. Moreover, customers have to have enoughinformation about the products that firms offer to be able to choose whichbenefits they want. Thus, it is also important to perform activities that identifyand target the right customers and that increase the number of customers wholike the benefits offered. One reason offered for Dell’s success in the mid to late1990s was the fact that over 70% of the firm’s customers were businesses withPC purchases of over $1 million. Such customers not only have higher reserva-tion prices; they may also make for better targets for building switching costs.Moreover, they are likely to cost less (per unit sold) to maintain than smaller lessdependable ones.
96 Strengths and Weaknesses

Coopetition and Value Creation
Since value created is the difference between the benefits that a customer per-ceives and the costs to a firm of providing these benefits, value creation can be asmuch a function of what the firm does as it is a function of what its coopeti-tors—the customers, complementors, rivals, and suppliers with whom a firmcooperates to create value and competes to capture it—do.3 The quality of theinputs from a firm’s suppliers impacts the quality of the benefits that the firmcan offer customers. For example, the benefits that a customer enjoys in a PCare as much a function of how the PC maker designs, manufactures, and mar-kets the product as they are a function of the quality of the microprocessor(from suppliers Intel or AMD), and of the software from complementors(Microsoft and others) as well as of how the customer uses the PC. The cost to afirm of providing benefits to its customers is also a function of its suppliers andthe relationship between the firm and these suppliers. Additionally, the extentto which a customer perceives a product as meeting his or her needs is a func-tion of the customer’s unique characteristics, including what the customerwants the product for. Moreover, the price that a customer gets to pay a firm is afunction of the relationship between the customer and the firm. In fact, some-times value is often created by coopetitors who cooperate through alliances,informal understandings, joint ventures, venture capital investments, etc.Effectively, a firm usually has to cooperate to create value and compete toappropriate the value. In a fair world, each firm would capture value equivalentto how much it created. (Your slice of the pie would be equivalent to yourcontribution.) But often, firms with power in their value system capture more ofthe value created in the system than their contribution would merit. Effectively,a very important part of strategy is positioning oneself to capture as much valuein one’s value system as possible.
Example 4.1: Who Appropriates What in a Book Value System
In 2000, it was estimated that for each dollar a customer paid for a book, theauthor received 10 cents, the publisher of the book got 32 cents, the printerreceived 8 cents, while the distributor and retailer received 20 cents and 30 centsrespectively.4 Profit margins for authors, publishers, printers, distributors, andretailers were −3.2%, 13.1%, 6.0%, 6.8%, and 17.3%, respectively.5 Howmuch value did each player in the value chain appropriate? Are the players whocapture the most value really the ones that create the most value?
Solution to Example 4.1
Consider publishers. They received 32 cents of each dollar of sales and hadprofit margins of 13.1%. The value appropriated by publishers is the profit thatthey make from the value created. Therefore:
Profit margin =Profit
Sales=
Profit
$0.32= 0.131 = 13.1%
Thus, Profit =$0.32 × 0.131 = $0.042. This is the value appropriated bypublishers. Publishers’ costs are $0.32 − 0.042 = 0.278.
Creating and Appropriating Value Using New Game Strategies 97

Similarly, we can calculate the amounts appropriated by each player and itscost. These numbers are shown in Figure 4.2. Also shown in the figure is thepercentage of value that each player appropriated. Retailers appropriated47.6% of the value created, the most of any player. Why did retailers appropri-ate so much value compared to other players? First, retailers controlled theshelf space in the offline world and therefore had bargaining power over theirsuppliers and buyers. They typically paid publishers only 50% of the suggestedretail price.6 At some locations, such as universities and retail malls, bookretailers constituted local monopolies. Effectively, retailers have comple-mentary assets and power over coopetitors, and good locations differentiatethem from rivals. Second, many retailers could resale old books, making goodprofits without lifting a finger. Publishers appropriated 38.5% of the valuecreated, second only to retailers. They had a great deal of power over theaverage author, although famous authors commanded a lot of power overpublishers because of the pull that famous-author names establish withconsumers.
Distributors (including wholesalers) were next with 12.5% of the valueappropriated. They transported the books and often stored them in warehousesuntil retailers needed them. The least value was appropriated by printers andauthors with 4.4% and −2.9% respectively. Printers were highly fragmentedwith little or no power over their suppliers or buyers. Authors were also highlyfragmented and therefore had little power over publishers (except famousauthors). Although famous authors commanded lots of money, the averageauthor lost money. He or she appropriated no value; rather, he or she had to“pay” other members of the value system to take the book from him or her. Heor she “paid” the equivalent of 2.9% of the price of a book. Effectively, theaverage author makes little or no money directly from books. Since most peoplewho buy books buy them for their content, it is doubtful that 47.6% of whatreaders get out of a book comes from retailers. Effectively, some players cap-tured more value than they created.
Figure 4.2 A Book Value Chain.
98 Strengths and Weaknesses

Example 4.2: Who Creates and Appropriates What Value in an iPhone
In 2007 when Apple shipped the first iPhones, some financial analysts estimatedthat the cost of the components and final manufacturing for the phone were$234.83 and $258.83 for the 4 GB and 8 GB versions, respectively (Table 4.1).7
The recommended retail prices for both versions (4 GB and 8 GB) were $499and $599. The wholesale discount for electronic products was estimated to be25%. The question is, how much of the value that customers saw in the iPhone
Table 4.1 Some Estimated Costs for the iPhone in 2007
Cost for 4GB iPhone(US$)
Cost for 8GB iPhone(US$)
Component Supplier US$ % US$ %
ARM RISC applicationprocessor
Samsung, Korea 14.25 6.07 14.25 5.51
NAND flash memory Samsung, Korea 24 10.22 48 18.54
SDRAM (1GB) Samsung, Korea 14 5.96 14 5.41
3 chips: digital base band LSI,transceiver LSI, and powermanagement unit
Infineon Technologies AG,Germany
15.25 6.49 15.25 5.89
Touch screen module Balda AG, German, andTpk Solutions, Taiwan
27 11.50 27 10.43
LCD module Epson Imaging DevicesCorp., Sharp Corp. andToshiba Matsushita DisplayTechnology Co.
24.5 10.43 24.5 9.47
Bluetooth chip CSR plc of the UK 1.9 0.81 1.9 0.73
Wi-Fi base band chip Marvel Semiconductor Inc,USA
6 2.56 6 2.32
802.11b/q 15.35 6.54 15.35 5.93
Accessories/packaging etc. 8.5 3.62 8.5 3.28
Final manufacturing Various contractors? 15.5 6.60 15.5 5.99
Royalties for EDGE 4.61 1.96 4.61 1.78
Operating system (OS X) Apple 7 2.98 7 2.70
Voice processing software 3 1.28 3 1.16
Camera module Altus-Tech, Primax, andLite on.
11 4.68 11 4.25
Battery 5.2 2.21 5.2 2.01
Mechanical components/enclosure
12 5.11 12 4.64
Other hardware/softwarecomponents
25.77 10.97 25.77 9.96
Total cost of inputs 234.83 100.00 258.83 100.00
Source: iSuppli Corporation: Applied Market Intelligence. Author’s estimates.
Creating and Appropriating Value Using New Game Strategies 99
did Apple and each of its suppliers capture? How much value was created byeach actor? How much of it was created in the US?
Solution to Example 4.2
Value Captured
Recall that value captured = price − cost of providing benefits. The retail pricefor the 4GB iPhone was $499. Therefore, the wholesale price = (1 − 0.25) ×$499 = 374.25. (Distributors and retailers received $124.75 of the $499—i.e.25% of the retail price). The cost of inputs for the 4 GB is $234.83 (from Table4.1). Therefore, the estimated value captured by Apple = Price − Cost = $374.25− 234.83 = 139.42.
How much value was captured by Apple’s suppliers? Consider Samsungwhich supplied at least three components. The problem here is that although weknow the prices of each component, we do not know Samsung’s cost for eachcomponent. Firms do not release details of individual product costs. However,they provide gross profit margins in their financial statements, which we willuse for our estimates. Samsung’s gross profit margin in 2006 was 18.6; that is:
P − C
P= 18.6%
Therefore P − C = P × 0.186 = value added.For NAND Flash memory (Table 4.1), the value captured by Samsung = $24
× 0.186 = $4.46.If the LCD module were provided by Sharp, we could also calculate the value
captured by Sharp using its 2006 gross profit margin of 22.6%. This value was$24.5 × 0.226 = 5.54. If we assume that the firms that did the final manufactur-ing (assembly) for Apple had profit margins of 15%, then each received $15.5 ×0.15 = 2.33 for every 4 GB iPhone that it manufactured.
Effectively, for each $499 that a customer paid for a 4GB iPhone, retailersand distributors took $124.75, Apple captured $139.42, Samsung captured$4.60 for the NAND flash memory alone, Sharp captured $5.54 for the LCDmodule when it was bought from Sharp, each final “manufacturer” (assembler)received $2.33, and so on. The value captured by any of the other suppliers canbe similarly calculated.
Value Added
Recall that
Value created = benefits perceived by customers—cost of providing thebenefits;
= customer’s willingness to pay—cost of providing thebenefits;
= customer’s reservation price—cost of providing thebenefits.
100 Strengths and Weaknesses
One problem here is that it is not always easy to determine a customer’s reserva-tion price or willingness to pay. In the case of Apple, for example, we know thatmany of the customers who bought the iPhone could have paid a lot more thanthe listed retail price; that is, their reservation prices for the product were higherthan the retail prices. However, we do not know exactly how much more eachone would have paid. What we can say is that the average reservation price ofcustomers was higher than the retail price that they ended up paying. Neitherdo we know what Apple’s reservation prices for each of the components were.The important thing for a strategist to remember is always to look for ways toget as close as possible to each customer’s reservation price so as to extract asmuch of the value created as possible, without driving the customer to competi-tors. At the same time, a firm also tries to do the best to extract a price from itssuppliers that is below its reservation price, without adversely affecting theability of the supplier to keep supplying high quality components.
International Component to Value Creation andAppropriation
One interesting thing to observe in the example above is that although eachcontract manufacturer that assembled the iPhone for Apple only captured$2.33 of every $499 that each customer paid for a 4GB iPhone, the manu-facturer’s home country was credited with exports of $234.83, the factor costof the product assembled in the country. This is unfortunate because eventhough the manufacturing country captured very little value, it was still seen asthe largest benefactor of the exports.
Consider the opposite example, where a large US exporter may be gettingmore credit for exports than the value-added approach would suggest. In the1980s, 1990s, and 2000s, Boeing Corporation was one of America’s largestexporters. How much of the value that airlines saw in a Boeing 787 in 2007, forexample, was created in the USA? Boeing designed the aircraft and performedthe R&D and rigorous testing that are critical to aircraft success. The aircraftwas being assembled in Everett, Washington, USA. However, almost all of themajor components (subassemblies) that were put together in Everett—all ofthem systems in themselves—were manufactured and tested in other countriesbefore being shipped to Everett for assembly.8 For example, the wings, centerwing box, main landing gear wheel well, and forward fuselage were manu-factured by Mitsubishi and Kawasaki Heavy Industries in Nagoya, Japan. Theother forward fuselage was produced in the US by Vought in South Carolina,the center fuselage in Italy by Alenia, while the aft fuselage was produced inWichita, Kansas, US, by Spirit AeroSystems.9 The horizontal stabilizers weremanufactured in Italy by Alenia Aeronautica. Passenger doors were made inFrance by Latecoere while the cargo doors, access doors, and crew escape doorwere made in Sweden by Saab. The ailerons and flaps were manufactured inAustralia by Boeing Australia, while the fairings were produced in Canada byBoeing Canada Technology. Finally, the 787 would be powered by the GeneralElectric (USA) GEnx and Rolls-Royce (UK) Trent 1000 engines.
Thus, although Boeing added value to the 787 by conceiving of and designingthe plane, integrating all the components, coordinating all the suppliers, andassembling the subassemblies, the critical components of the airplane—such as
Creating and Appropriating Value Using New Game Strategies 101

the engines, fuselage, landing gear systems, wings, tail, etc.—were designed,developed, tested and assembled by its suppliers. These firms added a hugeamount of the value that airlines and passengers saw in a 787. Moreover, indesigning the plane, Boeing also worked very closely with its customers—theairlines that would buy the planes. Also, many of these coopetitors were outsidethe USA. However, if a Japanese airline were to buy a 787, the full cost of theplane would be credited to US exports to Japan. We might have a better pictureof what is going on when we think in terms of value created and appropriatedrather than products exported or imported.
New Game Activities for Creating andAppropriating Value
New Game Activities and Value Creation
Recall that new game activities are activities that are performed differently fromthe way existing industry value chain activities have been performed to create orcapture value. Also recall that value creation is about providing unique benefitsto customers while keeping the cost of providing the benefits low. Therefore,value creation using new game activities is about performing value chain, valuenetwork, or value shop activities differently to offer customers something newthat they perceive as beneficial to them, and insuring that the cost of offering thebenefits does not exceed the benefits. The activities can be different with respectto which activities are performed, when they are performed, where, or how?(Note that where here can mean where along the value chain, where in geog-raphy, where in a product space, where in the resource space, and so on.) Thenew benefits can be new product features, a new brand image, better productlocation, a larger network for products that exhibit network externalities, orbetter product service. Such benefits can come from innovations in productdesign, R&D, manufacturing, advertising, and distribution that improve thebenefits perceived by customers. A firm can also offer new benefits by being thefirst in an industry to move to a particular market. This was the case with Wal-Mart when it moved into small towns in the Southwestern USA that otherdiscount retailers had neglected. It was also the case when Ryanair moved intosecondary airports in European cities to which major airlines had paid no atten-tion. New game activities can also create value by only reducing costs. Forexample, a firm can drastically reduce its costs by reorganizing its businessprocesses so as to perform tasks more efficiently. In some ways, this is whatbusiness process re-engineering has been all about—firms re-organizing theirbusiness processes to perform tasks more efficiently. Firms can also find newways to learn from their past experiences or other firms and apply the newknowledge to existing tasks to lower costs.
New game advertising activities can reveal the benefits of a product to morecustomers in new ways, or change customers’ perception of the benefits from afirm’s products. In either case, such activities are likely to increase customers’willingness to pay for a product and the number of such customers, therebyincreasing the total value created. Pfizer was one of the first in the cholesteroldrug market to conduct so-called direct-to-consumer (DTC) marketing ofits Lipitor cholesterol drug by advertising directly to patients, instead of to
102 Strengths and Weaknesses

doctors. This not only increased the number of people who knew somethingabout cholesterol and the benefits of cholesterol drugs; it may have alsochanged Pfizer’s drug’s image and customers’ willingness to pay for it.
Reverse Positioning: More Is Not Always Better
In using new game activities to create value for customers, a firm does notalways have to offer products with better attributes than those of competingproducts. A firm can strip off some of the attributes that have come to beconsidered as sacred cows by customers. In reverse positioning, a firm strips offsome of a product’s major attributes but at the same time, adds new attributesthat may not have been expected.10 For example, in offering its Wii, Nintendodid not try to outdo Microsoft’s Xbox 360 and Sony’s PS3 by offering a videogame console with the more computing power, graphical detail, and compli-cated controls that avid gamers had come to consider as sacred cows. Rather,Nintendo offered a product with less computing power, less graphical detail,and easy-to-use controls. However, the Wii had “channels” on which news andweather information could be displayed. In reverse positioning, some of thecustomers who cannot do without the sacred cows that have been stripped arelikely to stay away from the new product; but the new product, if well con-ceived, is likely to attract its own customers. There is self-selection in whichsome customers gravitate towards the new product, despite the fact that it doesnot have some of the sacred cows that some customers have come to expect. Forexample, although many avid gamers did not care much for the Nintendo Wii,many beginners, lapsed and casual gamers loved the machine. Effectively, moreis not always better. One does not have to outdo existing competitors on theirperformance curve.
New Game Activities and Value Appropriation
Recall that value appropriation is about how much a firm profits from the valuethat has been created, and that how much a firm appropriates is a function offive factors: availability and importance of complementary assets, the relation-ship between a firm and its coopetitors, pricing strategy, imitability and substi-tutability, and the number of valuable customers. Thus, any new game activitiesthat influence any of these factors can have an impact on appropriability. Taketechnological innovation activities, for example. A pharmaceutical firm thatpursues and obtains protection (patents, copyrights, or trade secrets) for theintellectual property that underpins its products may be effectively increasingbarriers to entry into its market space, reducing rivalry, and increasing switch-ing costs for customers. Increased barriers-to-entry and reduced rivalry meanthat the firm can keep its prices high, since there is less threat of potential newentry and less threat of price wars from rivals. Increasing switching costs forcustomers also means less bargaining power for customers, and some chance ofthe firm extracting higher prices from the customer. Defendable patents formany pharmaceutical products are partly responsible for the ability of pharma-ceutical firms to appropriate much of the value that they create.
eBay’s activities in online auctions also offer another example of how a firmcan use new game activities to create and appropriate value. The firm built a
Creating and Appropriating Value Using New Game Strategies 103

large and relatively safe community of registered users, and implemented auc-tion pricing. The larger the size of such a safe community for online auctions,the more valuable it is for each user, since each seller is more likely to find abuyer and each buyer is more likely to find a seller in a larger network than ina smaller one. Thus, users are less likely to switch to a smaller or less safenetwork, thereby giving eBay some bargaining power. When it uses an auctionformat, eBay gets closer to each buyer’s reservation price than it would if rivalshad networks with similar attributes or when it uses a fixed-pricing format.
New Game Activities, Value Creation, and Appropriation
Although we have described value creation and value appropriation separately,new game activities can and often result in both value creation and appropri-ation. For example, when a pharmaceutical company develops a new effectivedrug and obtains enforceable patents for it, the firm has effectively created valueand put itself in a position to appropriate the value. If the drug is very good atcuring the ailment for which it is earmarked, patients would prefer the drugover less effective ones, and the firm has bargaining power over patients and canobtain high prices where government regulations permit. Moreover, substituteshave less of an effect because of the drug’s effectiveness, and the threat ofpotential new entry and of rivalry have less of an effect on the firm because ofthe enforceable patents.
Shifts in the Locus of Value Creation and Appropriation
So far, we have focused on how and why value is created and appropriatedduring new games; but new games can also shift the locus of value creation andappropriation along a value system. For example, in the mainframe and mini-computer era, most of the value in the computer industry was created andappropriated by vertically integrated computer firms such as IBM and DEC thatproduced the microchips and software critical to their products. In the newgame ushered in by the PC, much of the value in the industry was appropriatedby Microsoft, a complementor and supplier, and Intel, a supplier. Effectively,value creation and appropriation shifted from computer makers to their sup-pliers and complementors. One of the more interesting examples of a shift invalue creation and appropriation during new games is that of Botox. BeforeBotox, cosmetic procedures were performed primarily by surgeons whocharged high specialist fees for the procedure and their suppliers obtained littleor nothing per procedure. Surgery could last hours and patients were put underanesthetic and after the surgery, it took weeks for the patient to recover fully.After the FDA approval of Botox in 2002, many cosmetic procedures could beperformed by any doctor using Botox. A vial of Botox cost its maker, Allergan,$40 and it sold it to doctors for $400, who marked it up to about $2,800.11
Each vial could be used to treat three to four patients. The Botox procedurelasted a few minutes and the patient could return to work or other normalactivity the same day. Effectively, the introduction of Botox substituted some ofa cosmetic surgeon’s skills with a product and shifted some of the value creationand appropriation from cosmetic surgeons to Allergan, their supplier.
104 Strengths and Weaknesses

Latent Link Between Cooperation and CompetitionOn the one hand, most strategy frameworks are either all about competition orall about cooperation. Porter’s Five Forces, for example, is all about competi-tive forces impinging on industry firms. Even the versions of the Five Forcesthat incorporate complementors say little or nothing about the cooperationthat may exist between industry firms and suppliers, buyers, rivals, and poten-tial new entrants. On the other hand, models of cooperation between firms sayvery little or nothing about the underlying implicit competition that existsbetween the cooperating firms. As we argued earlier, where there is cooperationthere is likely to be competition, and where there is competition, there areprobably opportunities for cooperation. For two reasons, these two statementsare even more apropos in the face of new game activities. First, new gameactivities, especially those that underpin revolutionary new games, usually havemore uncertainties to be resolved than non-new game activities. Suchuncertainties, especially when they are technological, are best resolved throughsome sort of cooperation.12 Thus, for example, a firm that is developing a newproduct whose components are also innovations is better off cooperating withsuppliers of such components to resolve product development uncertaintiesthat they face rather than seeing each supplier only as an adversary over whomthe firm wants to have bargaining power.13 Moreover, competitors in a rela-tively young market have an incentive to cooperate to grow in the market.Second, as we saw earlier in this chapter, profiting from new game activitiesoften requires complementary assets, many of which are often obtainedthrough some form of cooperation; and where there is cooperation to createvalue, there is also competition, even if only implicit, to share costs and thevalue created.
The Missed Opportunities During Cooperation andCompetition
Effectively then, each time firms miss out on an opportunity to cooperate duringcompetition, they may be missing out on making a larger pie; and each time afirm forgets about the implicit competition that is taking place during cooper-ation, it may be reducing its share of the pie. For example, rather than use itsbargaining power over suppliers and force them to take low prices, a firm canwork with the suppliers to reduce their costs and improve the functionality andquality of the components. In so doing, the firm may end up with better com-ponents that cost less than the previous inferior ones and a supplier that is evenmore profitable and happier than before.
The Whole Grape or a Slice of the Watermelon
One mistake that is easy for coopetitors to make in the face of the competitionthat often takes place during cooperation is to forget to think of one’s alterna-tives. In particular, before dumping your partner because your percentage of thepie is small relative to your partner’s share and your contribution, think verycarefully about who else is out there with whom you can create a pie. Will thevalue that you create with this new partner be as large as the one that you can
Creating and Appropriating Value Using New Game Strategies 105

create with your existing partner? In leaving your existing partner for an out-sider, you may be leaving 10% of a watermelon for 90% of a grape.14
Value Creation Using the Internet: CrowdsourcingAn innovating firm usually has to interact or collaborate with outside firms tobe successful. This process of interaction and collaboration is vastly facilitatedby the use of the Internet and its game-changing value-creation possibilities. Weexplore another example of how firms can take advantage of the game-changing nature of the Internet to create value. We start with the captivatingcase of Goldcorp Inc.
The Case of Goldcorp Inc.
Don Tapscott and Anthony Williams,15 and Linda Tischler16 offer a fascinatingaccount of how a firm can take advantage of a technological innovation such asthe Internet to pursue a revolutionary new game strategy. In 1999, things werenot going very well at Goldcorp Inc., a Toronto-based miner. Rob McEwen, thefirm’s CEO, believed that the high-grade gold ore that ran through neighboringmines had to run through his firm’s 55,000-acre Red Lake stake. However,Goldcorp’s geologists had difficulties providing an accurate estimate of thevalue and location of the gold. McEwen took time out from work, and while ata seminar for young presidents at the Massachusetts Institute of Technology(MIT) in 1999, he stumbled on a session about the story of Linux and the open-source phenomenon. He listened absorbedly to how Linus Torvalds and a groupof volunteers had built the Linux operating system over the Internet, revealingthe software’s code to the world and therefore allowing thousands of anonym-ous programmers to make valuable contributions to building and improving theoperating system. It suddenly dawned on McEwen what his firm ought to do. “Isaid, ‘Open-source code! That’s what I want!’,” McEwen would later recall.17
He wanted to open up the exploration process to the world the way the open-source team had opened up the operating system development process.
McEwen rushed back to Toronto and told his chief geologists his plan—toput all of their geological data, going back to 1948, on a databank and share itwith the world, and then ask the world to tell them where to find the gold. Theidea of putting their ultra-secret geological data out there, for the public to messwith, appalled the geologists whose mental logic was deeply rooted in the supersecrecy of this conservative industry. McEwen went ahead anyway and in 2000launched the “Goldcorp Challenge” with $575,000 in prize money for anyoneout there who could come up with the best estimates and methods for strikingthe gold at Goldcorp’s Red Lake property. All 400 megabytes of the firm’sgeological data were put on its website.
The response was instantaneous and impressive. More than 1,400 engineers,geologists, mathematicians, consultants, military officers, and scientists down-loaded the data and went to work. Yes, it wasn’t just select geologists. AsMcEwen would later recall, “We had applied math, advanced physics, intelli-gent systems, computer graphics, and organic solutions to inorganic problems.There were capabilities I had never seen before in the industry.”18
The five-judge panel was impressed by the ingenuity of the submissions. The
106 Strengths and Weaknesses

Top winner was a collaborative team of two groups from Australia: FractalGraphics of West Perth, and Taylor Wall & Associates of Queensland. They haddeveloped an impressive three-dimensional graphical model of the mine.“When I saw the computer graphics, I almost fell out of my chair,” McEwenwould later recall.19 The contestants identified 110 targets, of which 50% hadnot been previously identified. Substantial quantities of gold were found in over80% of the new targets that had been identified. What is more, McEwen esti-mated that using the crowd to solve the problem had taken two to three yearsoff the their normal exploration time, with substantial cost savings to boot.
The gold that Goldcorp had struck, together with its upgraded mines, nowenabled the firm to perform up to the potential for which McEwen had hopedwhen he bought a majority share in the mine in 1989. By 2001, the Red Lakemine was producing 504,000 ounces of gold per year, at a cost of $59 perounce.20 Contrast that with a pre-“Gold Challenge” 1996 annual rate of 53,000ounces at a cost of $360.
Looking to the future, McEwen saw more. “But what’s really important isthat from a remote site, the winners were able to analyze a database and gener-ate targets without ever visiting the property. It’s clear that this is part of thefuture,”21 he would say.
Crowdsourcing, Wikinomics, Mass Collaboration?
Goldcorp’s outsourcing of the task of analyzing data to estimate the value andlocation of gold on its site is a classic example of crowdsourcing. A firm is saidto be crowdsourcing if it outsources a task to the general public in the form ofan open call to anyone who can perform the task, rather than outsourcing it to aspecific firm, group, or individual. The task can be anywhere along any valuechain—from design to refining algorithms to marketing. Crowdsourcing hasalso been called wikinomics, mass collaboration, and open innovation. It wasfirst coined by Jeff Howe and Mark Robinson of Wired magazine.22 In 2008,there was still some disagreement as to what name to give to this phenomenonin which tasks are outsourced via open calls to anyone in the public who canperform the tasks. The important thing is that the phenomenon is real and canbe expected to become more and more the center of new games. There arenumerous other examples. Threadless, founded in 2000, depends on the publicto design, select designs, market, and buy its T-shirts. InnoCentive, founded in2002, acts as a B2B firm that outsources R&D for biomedical and pharma-ceutical companies to other firms in other industries and other countries.Examples of crowdsourcing are not limited to for-profit activities. Wikipedia,the free online encyclopedia, lets anyone provide input. In June 2008, Encyclo-pedia Britannica also decided to have the public edit its pages. The open sourceproject in which Linux was developed also falls into this category. Crowd-sourcing has several advantages:
Public May Be Better
If the best solution to the problem whose solution is being sought requiresradically different ways of doing things, there is a good chance that the publicmay hold a better solution than the firm seeking the solution. Why? The
Creating and Appropriating Value Using New Game Strategies 107
public is not handicapped by prior commitments, mental frames, and the not-invented-here syndrome of the outsourcing firm that might prevent it fromtaking the radical approach. The public is comprised of lots of people withdifferent backgrounds, mental models, and disciplines, and one of whom maybe the right one for the radical approach needed.
Solution May Already Exist
In some cases, the solution to a problem may already exist outside there, orsomeone is already very close to solving the problem. Thus, going outside notonly saves time and money, it can save the firm from reinventing the wheel.
Breadth and Depth of Talent
Depending on the task and industry, the breadth and depth of talent out there inthe public may be better than what is available within the outsourcing organiza-tion or within a specific entity chosen by a firm to solve the problem. Even thebest firms cannot hire everyone that they need. Some of the best talent mayprefer to live in another country, state, or city. Some people may thrive among adifferent set of people than that available at the firm. Some may prefer to workonly when there is a challenging and interesting problem to solve, and thereforefind the confines of the outsourcing firm inhospitable.
Better Incentive for Competitors
Someone or group in the public may have a better incentive than the firm tosolve the problem. Some people may thrive only when there is the possibly ofshowing off their skills in a contest. They want to be able to say, “I was the bestin the world.”
Cheaper and Faster
The firm gets to pay only for the best solutions. It is effectively paying only forresults. It does not have to pay for any deadwood. For this reason and the othersoutlined above, the firm’s cost of crowdsourcing is likely to be lower than thatof internal development or cooperation with a specific firm or individual. Thesolution is also likely to be arrived at in a much shorter time.
Signaling
By outsourcing a task to the public, a firm is signaling to its coopetitors that it isgoing to engage in some activities. For example, if a firm’s competitor intro-duces a new product and the firm wants its competitors to know that it has asimilar product on its way, it can crowdsource some of the activities or com-ponents that go into the upcoming product. In so doing, the firm is telling itsloyal customers not to switch to its competitors, since it has a newer and betterproduct around the corner.
108 Strengths and Weaknesses

Disadvantages of Crowdsourcing
Crowdsourcing also has disadvantages. First, it is more difficult to protect one’sintellectual property when one opens up to the public as much as one has towhen crowdsourcing. There are no written contracts or nondisclosure agree-ments. Second, crowdsourcing may not be suitable for tasks that require tacitknowledge since such knowledge cannot be encoded and sent over the Internet.Tacit knowledge is best transferred in-person through learning-by-doing.Crowdsourcing may not be ideal for long and complex tasks such as designingand building an airplane. Such tasks require monitoring, continuous motiv-ation, and other long-term commitments. Third, it may be difficult to integratethe outsourced solution into an organization that suffers from not-invented-here syndrome. Fourth, opportunistic competitors can target your calls withmalicious solutions that they know will not work, hoping that you will not beable to catch them. These disadvantages can be mitigated through the rightmanagement.
New Game Strategies for ProfitabilityHaving explored value creation and appropriation, the question now is: inpursuing a new game strategy, is there anything that a firm can do to increase itschances of contributing the most to value creation and appropriation and there-fore its profitability? After all, not all firms that pursue new game strategies dowell. Yes, it depends on (1) the firm’s strengths and handicaps, and (2) how itperforms its new value chain activities while taking advantage of the newgame’s characteristics (Figure 4.3).
Strengths and Handicaps
When a firm faces a new game, some of its pre-new game strengths remainstrengths while others become handicaps. These strengths and handicaps thendetermine the extent to which the firm can perform value chain activities tocreate and appropriate value, taking advantage of the characteristics of the newgame (Figure 4.3). Strengths and handicaps can be resources (distributionchannels, shelf space, plants, equipment, manufacturing know-how, marketingknow-how, R&D skills, patents, cash, brand-name reputations, technologicalknow-how, client or supplier relationships, dominant managerial logic, rou-tines, processes, culture and so on), or product-market positions (low-cost, dif-ferentiation, or positioning vis-à-vis coopetitors). A firm’s strengths and weak-nesses in the face of a new game can determine its failure or success. Forexample, even in the face of revolutionary technologies, some brands, distribu-tion channels, and relationships with customers often continue to be strengthsfor a firm.23 (In Chapter 5, we will see how a firm can determine its strengthsand handicaps in the face of a new game.)
Value Chain and New Game Factors
Given a firm’s strengths and handicaps, the question becomes, how can the firmcreate and appropriate the most value? To answer this question, recall from
Creating and Appropriating Value Using New Game Strategies 109

Chapter 2 that the extent to which activities—any value chain activities—arelikely to contribute optimally to value creation and appropriation is a functionof the extent to which the activities contribute to low cost, differentiation, morecustomers, and other drivers of profits; contribute to better position the firmvis-à-vis its coopetitors; take advantage of industry value drivers; build ortranslate distinctive resources/capabilities into new value; are parsimonious andcomprehensive. Let us call these factors on which value creation and appropri-ation depends value chain factors, given that they are about value chain activ-ities. Since the new game activities that are the cornerstones of any new gamestrategy are also value chain activities, their contribution to optimal value cre-ation and appropriation is also a function of these value chain factors. Add-itionally, however, the contribution of new game strategies to value creationand appropriation is also a function of new game factors—a function of the factthat, as we saw in Chapter 1, new games generate new ways of creating andappropriating new value; offer an opportunity to build new resources/capabil-ities or translate existing ones in new ways into value; create the potential tobuild and exploit first-mover advantages; attract reactions from new and exist-ing competitors; and have their roots in the opportunities and threats of anindustry or macroenvironment.
The contributions of a new game strategy’s value chain and new game factorsto value creation and appropriation are shown in Figure 4.3. The value chainfactor makes a direct contribution. However, the new game factor contributesto value creation and appropriation only indirectly—it contributes by moderat-
Figure 4.3 New Game Activities and Value Creation and Capture.
110 Strengths and Weaknesses

ing the contribution of the value chain component. A moderating variable playsthe role that stirring tea plays. Stirring tea without sugar does not make the teasweet. But stirring plays a critical role in the sweetness of the tea when there issugar present. Effectively, whether the effect of value chain factors on valuecreation and appropriation is large or small is a function of the new gamefactors. We now explore how each value chain factor, moderated by new gamefactors, impacts value creation and appropriation (Figure 4.3).
Contribute to Low Cost, Differentiation, More Customers, BetterPricing, and Sources of Revenues
A firm can use new game activities, just as it can use any other value chainactivities, to contribute to low cost, differentiation, attracting more customers,pricing better, and identifying or pursuing the right sources of revenues. How-ever, since new games generate new ways of creating and/or capturing newvalue, a firm can take advantage of these new ways by, for example, choosingthose activities that enable it to offer unique value to customers, or to positionitself better vis-à-vis its coopetitors. Doing so is tantamount to occupying aunique product space or so-called “sweet spot” or “white space” in which thereis little or no head-on competition and therefore less rivalry. This creates anopportunity for firms to better attract the right customers with the right valueand pursue the right pricing strategies and sources of revenue. Also, since newgames create opportunities for a firm to build and exploit first-mover advan-tages, a firm can build switching costs at customers if it is the first to move to thewhite space. For example, when Dell targeted volume-buying business cus-tomers as the primary focus for its direct-sales/build-to-order business model, itbuilt its brand at these customers and performed extra customization tasks forsuch firms—including the loading of firm-specific software—efforts that mayhave built some switching costs at these customers. Switching costs decrease theeffect of rivalry, the power of buyers, and the threat of potential new entry andsubstitutes. They can also increase a customer’s willingness to pay. Thus, build-ing switching costs as a result of moving first strengthens a firm’s position,thereby improving its ability to create and appropriate value. Switching costsare easier to build if the firm has strengths such as prior relationships with suchcustomers or a well-established brand.
In pursuing the right pricing strategy, a firm can also take advantage of first-mover advantages. For example, in pharmaceuticals, firms that are the first todiscover a new drug in a therapeutic category usually set the price of the drugvery high since there is no similar drug in the market and there is usually a highwillingness to pay in countries where pharmaceutical prices are not regulated.This practice is called skimming and is meant to allow a firm to collect as muchcash as possible before competitors move in with close substitutes. Effectively,in attracting the right customers using the right benefits and pursuing the rightpricing strategies and sources of revenue, a firm can build first-mover advan-tages that will help to amplify its ability to create and appropriate value.
Creating and Appropriating Value Using New Game Strategies 111

Improve its Position vis-à-vis Coopetitors
If a firm uses new game strategies to offer its customers unique benefits, forexample, it improves its position vis-à-vis coopetitors. Additionally, because theactivities are new game, there is the potential to take advantage of first-moveradvantages to further improve the position. For example, a firm can obtainprotection for its intellectual property (patents, copyrights, trade secrets). Suchprotection raises barriers to entry into the firm’s product-market-space. Also,because a firm’s strategy is new game, coopetitors are likely to react to it byfollowing or leapfrogging the firm, or pursuing any other activities that canenable them to outperform the firm. If, in performing new game activities, afirm anticipates and takes into consideration the likely reaction of coopetitors,the firm is more likely to cooperate better or compete with coopetitors. Inpursuing its regular new game strategies, Coke often anticipates what Pepsi’sreaction is likely to be, and vice versa. In pursuing their regular, position-building and resource-building new game strategies, Boeing and Airbus oftentake each other’s likely reaction into consideration.
As we saw in Chapter 1, prior commitments that competitors make canprevent them from performing new game activities. Thus, in creating andappropriating value using new game activities, a firm can take advantage of itscompetitors’ handicaps. For example, if the new game activity is counterintui-tive and competitors are prevented by their dominant managerial logic fromunderstanding the rational behind the activity, a firm may want to concentrateon convincing customers, not competitors, that the idea works. If competitorsare prevented by laws or regulation from performing any activities that wouldallow them to catch up with a first mover, the first mover may want to ensurethat such laws or regulations are enforced.
We will have more to say about anticipating and responding to competitors’likely reactions in Chapter 11 when we explore game theory, coopetition, andcompetition.
Take Advantage of Industry Value Drivers
If a firm uses new game activities to take advantage of industry value drivers,the new game factor can also amplify the impact of taking advantage of valuedrivers on value creation and appropriation. For example, network size is animportant industry value driver in markets for products/services that exhibitnetwork externalities. A firm that pursues the right new game activities can earna large network size by virtue of value chain factors. But because the activitiesare new game, the firm can take advantage of the opportunity to build newresources, or build and exploit first-mover advantages. The case of eBay is agood example. It established a large community of registered users, giving it alarge network size; and because it was the first in the online auctions business, itwas easier to build a brand that reinforced its large network size, making theeffects of its large network size even more valuable in creating and appropriat-ing value.
A firm’s strengths in the face of a new game can also facilitate its ability totake advantage of industry value drivers. For example, when IBM entered thePC market, its PC standard quickly became the industry standard, laying the
112 Strengths and Weaknesses

foundation for what would become the Wintel network. One reason why IBMwon the standard (creating a lot of value for the Wintel network) was because itbrought in some important strengths: its brand name reputation and relation-ships with customers and software developers. The fear of cannibalizing itsmainframe and minicomputer businesses may have negatively impacted IBM’sability to appropriate the value created in PCs.
Build and/or Translate Distinctive Resources/Capabilities into UniqueValue
Some of the best new game strategies have been those that were used to buildscarce resources for later use, taking advantage of the new gameness of thestrategies. For example, when Ryanair moved into secondary airports, it couldtake advantage of the fact that the operating costs at these airports were lowrelative to those at their primary counterparts; but because it was the first toramp up its activities at many of these airports, Ryanair was able to take upmost of the gates and landing slots at the airports, thereby preemptively lockingup important resources that would anchor its operations. Once the firm had anetwork of such airports, it became difficult for its competitors to replicate thenetwork. Because it was the first to pursue digital animation technology, Pixarhad a chance to cooperate with Disney and take advantage of its storytellingcapabilities and distribution channels to complement its digital animation tech-nology so as to create the likes of Toy Story and Finding Nemo.
Are Parsimonious and Comprehensive
It costs money to pursue a new game—to effect change. Therefore a firm shouldperform only the activities that are necessary—the activities that contributeenough towards value creation and appropriation, given their costs; that is, theactivities that a firm performs should be parsimonious. For example, Airbus’sdecision to build the A380 was to occupy the white space for long-range planesthat carry 500–800 passengers and operate at lower costs than existing planes(20% less cost per passenger). This was a good new game strategy. However,the company ended up performing some activities in a way that it should nothave performed them and that cost it dearly. For example, the firm ended upwith two incompatible computer-aided design (CAD) systems, one German andthe other French, that led to mistakes in the design of the A380’s wiring har-nesses.24 This necessitated redoing the CAD systems with their associated delaysand extra costs. Because of such activities, the firm was two years late in deliver-ing the first plane and racked up large cost overruns. Moreover, when wordof the mistake came out, the parent company’s stock (EADS’ stock) droppedby 26%.25
A firm must also make sure that it is performing the activities that it ought tobe performing. To determine which activities it ought to be performing, the firmcan perform an AVAC analysis and from it, perform the activities that reversethe Noes into Yesses, and reinforce the Yesses.
To summarize, a firm’s ability to create and appropriate value in the face of anew game depends on, (1) value chain factors that arise by virtue of the fact thatnew game activities are value chain activities, and (2) new game factors
Creating and Appropriating Value Using New Game Strategies 113
that arise by virtue of the fact that new game activities have a new game com-ponent. Value chain factors contribute directly to value creation and appropri-ation while new game factors moderate this contribution. Both components reston a firm’s pre-new game strengths that remain strengths or become handicapsin the face of the new game.
Key Takeaways
• Strategy is about creating and appropriating value.• A firm creates value when it offers customers something that they perceive
as valuable (beneficial) to them and the cost of offering the benefits does notexceed them. The value appropriated (captured) is the profit that a firmreceives from the value it created.
• As the case of many authors and musicians suggests, many firms or indi-viduals that create lots of value get to appropriate only a small fraction of it.A firm may not be able to appropriate all the value that it creates because: itlacks complementary assets, does not have bargaining power over itscoopetitors, the value is easy to imitate, it has the wrong pricing strategy, orit does not have enough valuable customers that want the benefits it offers.
• Value creation is often undertaken by coopetitors, not one firm. Thus, firmsoften have to cooperate to create value and compete to appropriate it.Where there is cooperation, there is likely to be competition; and wherethere is competition, there are opportunities to cooperate.
• The value added by many exporting countries is often a lot less or morethan the export value attributed to them.
• In the face of new game activities, there are likely to be opportunities forcooperation during competition; and during cooperation, there is alwaysimplied competition.
• In the competition to appropriate value that takes place during cooperation,it is important not to forget to think of what one’s alternatives are; that is,before dumping your partner because your percentage of the pie is small,think very carefully about who else is out there that you can create a piewith. How much more pie will cooperation with your new partner createand how much of it will you get? In leaving your existing partner for anoutsider, you may be leaving 10% of a watermelon for 90% of a grape.
• A new game can shift value creation and appropriability along a valuesystem.
• Firms usually have pre-new game strengths that can remain strengths orbecome handicaps in the face of a new game.
• Creating new value does not always mean outdoing competitors with prod-ucts that have superior attributes. A firm can also locate in a unique marketposition through reverse positioning. In reverse positioning, a firm stripsoff some of a product’s major attributes but at the same time, adds newattributes that may not have been expected.
• The contribution of new game activities to a firm’s value creation andappropriation depends on its strengths and handicaps in the new game, andboth the value chain factors and the new game factors of the new gameactivities. The effect of the new game factor is a moderating one.
• By virtue of being value chain activities, new game activities can:
114 Strengths and Weaknesses
1 Contribute to low cost, differentiation, and other drivers ofprofitability.
2 Improve position vis-à-vis coopetitors.3 Take advantage of industry value drivers.4 Build and translate distinctive resources/capabilities into new value.5 Be parsimonious and comprehensive.
• The impact of each value chain factor on value creation and appropriationis moderated by each new game factor. That is, the magnitude and directionof the impact of each value chain factor on a firm’s ability to create andappropriate value is a function of whether the firm:
� Takes advantage of the new ways of creating and capturing new valuegenerated by change.
� Takes advantage of opportunities generated by change to build newresources or translates existing ones in new ways.
� Takes advantage of first-mover’s advantages and disadvantages, andcompetitors’ handicaps that result from change.
� Anticipates and responds to coopetitors’ reactions to its actions.� Identifies and takes advantage of opportunities and threats from com-
petitive, macro and global environments.
Key Terms
CoopetitionCrowdsourcingCustomer’s reservation priceIndustry value driverNew game factorsReverse positioningSkimmingValue appropriatedValue chain factorsValue created
Questions
1 Table 4.2 overleaf shows the eight most expensive components/inputs of the30 GB Video iPod that Apple introduced in October of 2005. According toPortelligent Inc, the product had 451 components, with a total cost of$144.40.26 The iPod retailed for $299. Assuming a wholesale discount of25%, what is the value appropriated by Apple and each of the suppliers.How much value is captured by each country? How much of that value isadded by each actor?
2 How can a firm take advantage of first-mover disadvantages?
Creating and Appropriating Value Using New Game Strategies 115

Table 4.2 October 2005 Top 8 Most Expensive Components/Inputs of a 30GB iPod
Component/Input Supplier Firm’s country HQ Manufacturinglocation
Price (US$)
Hard drive Toshiba Japan China 73.39
Display module Toshiba-Matsushita
Japan Japan 20.39
Video/multimedia processor Broadcom USA Taiwan orSingapore
8.36
Portal player CPU PortalPlayer USA US or Taiwan 4.94
Insertion, test, and assembly Inventec Taiwan China 3.70
Battery pack Unknown 2.89
Display driver Renesas Japan Japan 2.88
Mobile SDRAM 32 MBmemory
Samsung Korea Korea 2.37
Source: Linden, G., Kraemer, K.L., & Dedrick, J. (2007). Who captures value in a global innovation system? The case ofApple’s iPod. Retrieved July 10, 2007, from http://www.teardown.com/AllReports/product.aspx?reportid=8.
116 Strengths and Weaknesses

Resources and Capabilities in theFace of New Games
Reading this chapter should provide you with the conceptual and analyticaltools to:
• Define tangible, intangible, and organizational resources as well as capabil-ities and core competences.
• Begin to understand the strategic significance of network externalities.• Understand the significance of complementary assets in the face of new
games.• Use the AVAC (Activities, Value, Appropriability, and Change) framework
for exploring the profitability potential of resources/capabilities.• Understand how to narrow down the list of complementary assets, capabil-
ities, core competences, or any other resource to important ones.• Understand the basic role of resources as a cornerstone of competitive
advantage.
IntroductionTo create value and position itself to appropriate the value, a firm needsresources. For example, behind the Google search engines that some surfersperceive as giving them more relevant search results than competitors’ enginesare skills and know-how in software and computer engineering, patents, trade-marks, trade secrets, banks of servers, the Google brand, equipment, and otherresources without which the relevant searches and the firm’s ability to monetizethe searches would not be possible. To operate out of secondary uncongestedairports in the European Union (EU), Ryanair had to acquire the gates andlanding rights at these airports, build relationships with local officials, obtainthe airplanes, and build the right low-cost culture. A pharmaceutical companysuch as Merck or Elli Lilly needs well-equipped R&D laboratories, scientists,and patents to be able to produce blockbuster drugs such as Zocor or Prozacthat customers find valuable. To make its cola drinks readily available to cus-tomers whenever they want them, Coca Cola needs shelf space at its distribu-tors and contracts with its bottlers. However, resources in and of themselves donot customer benefits and profits make. Firms must also have the capabilities orability to turn resources into customer value and profits. For ExxonMobil tomake money, it needs resources such as exploration rights, sophisticatedexploration equipment, geologists as well as an ability to find oil and turn it intosomething that its customers want. In the face of new games, firms have an
Chapter 5

opportunity to build new valuable resources or translate existing ones in newways into new unique value.
In this chapter, we explore the critical role that resources and capabilities canplay in a firm’s value creation and appropriation. In particular, we explore therole of resources in the face of new games. We start the chapter by definingresources and capabilities, and by exploring what makes one resource moreprofitable than others. We then examine the role of resources in the face of newgames. In particular, we explore the role of complementary assets as a driver ofprofitability during new games.
Resources and Capabilities
Resources
Creating and appropriating value requires resources (or assets) such as plants,equipment, patents, skilled scientists, brand name reputation, supplier rela-tions, geographic location, client relations, distribution channels, trade secrets,and so on. Resources can be classified as tangible, intangible, or organiza-tional.1 Tangible resources are the resources that are usually identified andaccounted for in financial statements under the category “assets.” They can bephysical, such as plants and equipment or financial such as cash. Intangibleresources are the nonphysical and nonfinancial assets such as patents, copy-rights, brand name reputation, trade secrets, research findings, relationshipswith customers, shelf space, and relationships with vendors that are notaccounted for in financial statements and cannot be physically touched.2
Intangible resources are usually not identified in financial statements but can beexcellent sources of profits. For example, a patent or trade secret that enables afirm to occupy a unique product space and therefore earn monopoly rents is notlisted as an asset in financial statements. That is usually the case with importantdrug discoveries in pharmaceuticals in the USA where patented drugs enjoyintellectual property protection and can earn companies billions of dollars.Intangible resources are also referred to as intangible assets or just intangibles.Organizational resources consist of the know-how and knowledge embodied inemployees as well as the routines, processes, and culture that are embeddedin the organization.
Capabilities
Although resources are critical to value creation and appropriation, resources inand of themselves are not enough to make money. A firm also needs to have theability to transform resources into customer benefits. Customers are not likelyto scramble to a firm’s doors because the firm has modern plants, geniuses, andpatents. The firm has to use the plants, geniuses, and the knowledge and protec-tions embodied in its patents to offer customers something that they value.Patients do not buy patents or skilled scientists from pharmaceutical com-panies; they buy medicines that have been developed by skilled scientists usingknowledge embodied in patents and the patents help to give firms monopolyrights over the patent life of the drug. Effectively, resources usually have to beconverted into benefits that customers want. A firm’s ability to transform its
118 Strengths and Weaknesses

resources into customer benefits and profits is usually called a capability. Forexample, a pharmaceutical company’s ability to turn patents and relationshipswith doctors into blockbuster drugs and profits is a capability. Capabilitiesoften involve the use or integration of more than one resource.3 In the literaturein strategic management, there is some disagreement as to how to defineresources, capabilities, and competences.4 Some scholars define them the waywe have here. Others argue that resources include assets, capabilities, and com-petences. The central theme remains the same: that performing activities tocreate value and position a firm to appropriate the value requires resources andsome ability to translate them into customer benefits. The names given to theresources and their transformation should not matter that much.
Core Competences
The phrase “core competence” was coined by Professors C.K. Prahalad of theUniversity of Michigan and Gary Hamel of Strategos and the London BusinessSchool to designate a resource or capability that meets the following threecriteria.5 The resource or capability:
1 Makes a significant contribution to the benefits that customers perceive in aproduct or service.
2 Is difficult for competitors to imitate.3 Is extendable to other products in different markets.
Core competences include technological know-how, relationships with coopeti-tors, and an ability to integrate different activities or translate resources intoproducts. A popular example of core competence is Honda’s ability to builddependable smooth-running internal combustion engines. It meets all three cri-teria. First, each Honda engine makes a significant contribution to the benefitsthat customers perceive in the Honda product. Second, although other firmshave internal combustion engine capabilities, it is difficult to replicate the levelof Honda’s engine capabilities. Third, Honda has been able to use its enginecapabilities to offer motorcycles, cars, lawnmowers, marine vehicles, electricalgenerators, and small jets. The phrase “core competence” is often used byindividuals and firms to refer to what one does very well. One implication of theconcept of core competence is that competition is not only important in theproduct market that a firm occupies but also in the factor markets for com-petences that a firm can build and leverage in many markets.
Network Externalities EffectsWith the growing importance of technologies such as the Internet, computers,cell phones, video games, and so on, resources that are associated with networkexternalities effects have become increasingly important. In this section, weexplore network externalities.
Resources and Capabilities in the Face of New Games 119
Definition and Role of Size
The value of a product to customers usually depends on the attributes of theproduct in question.6 However, for some products, customer value depends notonly on product attributes but also on the network of consumers that use theproduct or a compatible one; that is, a technology or product exhibits networkexternalities effects if the more people that use it, the more valuable it becomesto each user.7 Telephones exhibit network externalities since their value to eachuser increases with the number of people that are on the network. Applicationssoftware products such as Adobe’s Acrobat (for creating and reading pdf files)exhibit network externalities because the more people that own the softwarethat can read pdf files, the more useful is each user’s software for creating andmailing pdf files. In an auction network, the more sellers that are in the net-work, the more valuable that the network is to each buyer. Such networkexternalities effects are called direct effects because the benefits that each user ofa product derives from the network of other users come directly from the net-work—from interacting (economically or socially) with other actors within thenetwork.
Products that need complements also exhibit network externalities. Takecomputers, for example. The more people that own computers of a particularstandard such as the Wintel standard, the more software that is likely to bedeveloped for them, since developers want to sell to the large number of users;and the more software that is available for a computer standard, the morevaluable the computers are to users, since software is critical to computers. Suchexternalities are called indirect externalities because the increased value experi-enced by each user is indirect, through increased availability of complements.
How valuable is size to a network? Theoretical estimates of the value ofnetwork size have been as high as N2and NN (where N is the number of users inthe network).8 However, a larger network size does not always mean morevalue for customers. For example, a network in which there is only one sellerand the rest are buyers (e.g. Amazon books) is not as valuable to each user asone in which there are many sellers and many buyers (e.g. eBay). The value of anetwork to each member may actually decrease with increasing size if each newmember is dishonest. In general, the structure and nature of a network may bejust as important as its size.9
Structure
The structure of a network is the pattern of relationships between the players inthe network. In a consumer-to-consumer (C2C) auction network, any con-sumer can be a seller or buyer. This structure contrasts with that of a business-to-consumer (B2C) online retail network in which one seller sells to manybuyers. Thus, while both types of network are valuable to customers, the C2Cnetwork is more valuable to each buyer than the B2C one, since buyers in thelatter network only have one seller from whom to buy while those in the formerhave many sellers from whom to choose. A network with both sellers andbuyers belongs to a group of networks called two-sided networks. A two-sidednetwork has two distinct user groups that provide each other with benefits.10
There are numerous other examples of two-sided networks. A credit card net-
120 Strengths and Weaknesses

work has two groups: cardholders and merchants. A video game network hastwo groups: gamers and game developers. Users of pdf files consist of creatorsof pdf files and readers of pdf files. In a single-sided network, there is only onetype of user. Examples include telephone networks, e-mail, and Faxes.
Nature of Network
The value of a network also depends on the conduct of the players within thenetwork. For example, the reputation of a network also matters. Althoughthe size of eBay’s network is large, one reason why some customers may find thenetwork more valuable than another network of equal size is its reputation forsafety and its brand as the place for auctions. The company built the reputationpartly by rating sellers and buyers, a practice that may have selectively kept outsome potential opportunistic members and discouraged some members frombehaving opportunistically.
Exploiting Network Externalities
What if a technology or product exhibits network externalities? Although thevalue of a network to users increases with the number of other users, it isusually the provider of the network that makes most of the money from thenetwork. Google is the provider of its two-sided network of surfers who use itssearch engine and advertisers who value the surfers’ eyeballs. Banks profit fromtheir networks of borrowers and depositors. The question is: what can a pro-vider of the network infrastructure and service do to have a network thatincreases its chances of profiting from the network? Firms can (1) exploit directnetwork effects by building an early lead in network size and reputation, (2)price strategically, and (3) take advantage of indirect network effects by boost-ing complements.
Exploit Direct Network Effects by Building an Early Lead in Size andReputation
The idea here is simple. Since an early lead in a network market share canescalate into a dominant market position, a firm may want to pursue the kindsof actions that would give its products/service a critical market share orinstalled base lead. One such action is to team up with other firms to flood themarket with one’s version of the product/technology. A classic example is thatof Matsushita, which freely licensed its VHS video cassette recording technol-ogy, while competitor Sony kept its Beta technology proprietary. Effectively,Matsushita flooded the market with VHS sets and may have tipped the scalesaway from Sony’s Betamax, in favor of VHS.11 Another tactic is to build anearly reputation as the safe place to sell or buy as eBay did.
Price Strategically
A firm’s pricing strategy can also play an important role in increasing the size ofits network. In one-sided networks, a supplying firm (provider of network) canpursue penetration pricing in which it initially sells its network product/services
Resources and Capabilities in the Face of New Games 121

at very low prices and makes money by raising prices later or offering relatedproducts for which customers have a higher willingness to pay. In two-sidednetworks, the platform provider can set the price of the service/product low forthe group with a lower willingness to pay but with the potential to increase thenumber of users on the other side. It can then charge the side with a higherwillingness to pay.12 For example, surfers who conduct Web searches on Googlehave a lower willingness to pay for the searches than advertisers’ willingness topay for searchers’ “eye balls.” Thus, searches on Google are free but advertisersare charged. Adobe gave away its reader software to anyone who wanted to beable to read pdf files, but charged anyone who wanted to create pdf files.
Exploit Indirect Network Effects by Boosting Complements
Since, early in the life of a network technology, there potentially exists achicken-and-egg cycle in which complementors prefer to develop complementsfor the product with many users, and users want the product with many com-plements, the cycle can be jumpstarted by boosting the number of complements.Thus, for example, a supplier of the network product might produce some ofthe complements itself, help the complementor distribute complements, co-develop complements with complementors, or finance the activities of startupcomplementors.
Example: Social Networking Websites
A social network is made up of individuals or organizations that are linked byone or more factors such as values, types of economic exchange, friendship,political orientation, social views, profession, likes and dislikes, and so on. In2008, there were numerous social networking websites: Myspace, Facebook,classmates.com, broadcaster.com, Mixi, Cyworld, Reunion, Tagged.com, andOrkut, to name a few. One of the questions asked in 2008 was, how valuablewere these networks to users and to the owners of the websites?
Answer to Social Network Question
The size of each social network is important to each member. The question is,how much? Each of these websites enables different groups of people within thenetwork to have their own subnetworks within the larger network. Each sub-network can be made up of college friends, members of a certain church, peopleliving in the same area, etc. Once a subnetwork is formed, additional membersto the larger network do not necessarily increase the value of the network toevery subnetwork member. For example, a new member who joins the networkbecause of religious interests may not necessarily add value to members whoseprimary affiliation is the college they attended. Contrast that with a C2C net-work where the addition of each new member increases the value to eachmember.
However, for several reasons, a social network may be very valuable toadvertisers and therefore to the owner of the website. First, because a sub-network within a social network is usually made up of members with the samevalues, interests, etc., they are likely to be a better subgrouping for marketers
122 Strengths and Weaknesses

than age groups. For example, there are likely to be more similarities amongdoctors to whom one wants to market a health product than among the much-coveted 18–34-year age group. Second, although members of a social networkmay not be willing to watch ads, the effect of marketing on them can still behigh. Why? People are more likely to believe product recommendations fromfriends, colleagues, and other people whom they trust and respect than they areto believe advertisements. This is particularly true for experience goods—goodswhose characteristics are ascertained only after consumption since it is difficultto observe their characteristics in advance. Thus, all that it takes is an ad thatwill convince a few members of the subnetwork and the members can spreadthe idea themselves. For example, doctors often depend more on opinion lead-ers for prescription information than they do on direct advertising to them.13
Thus, in marketing to a social network of physicians, one can focus on theopinion leaders and they can recommend the product to the rest of theirnetwork.
Effectively, since people are more likely to believe someone whom they trustand respect than an ad from a firm, well-targeted social networks can be muchbetter places to pitch an idea than nonsocial networks. If someone who knowsyour interests and whom you trust recommends a product to you, you are morelikely to believe the person than an advertiser. Third, each member of a socialnetwork provides information about his/her interests and so on. This is infor-mation that firms usually spend lots of money trying to collect. Thus, ratherthan pay for keywords associated with products, as is the case with paid-listings, an advertiser may be able to pay for key words related to customers’interests and the characteristics of its subnetwork.
Role of Resources in the Face of New GamesHaving defined resources and capabilities, we now turn to a basic question:What is the role of resources and capabilities during value creation andappropriation in the face of new games? Recall that new games are aboutperforming new value chain activities, or performing existing value chain activ-ities differently. We can group the resources that a firm needs to pursue a newgame strategy into two categories: (1) The first category is made up of theresources that underpin the new activities or the ability to perform existingactivities differently. Since performing new activities or existing ones differentlyusually results in an invention or discovery, or something new, we will call theresources that underpin such activities invention resources. The resources thatGoogle used to develop the search engines that deliver more relevant searchesthan competitors’ search engines fall into this invention resources category. (2)The second category consists of complementary assets—all the other resources,beyond invention resources, that a firm needs to create value and position itselfto appropriate the value in the face of the new game. Complementary assetsinclude brands, distribution channels, shelf space, manufacturing, relationshipswith coopetitors, complementary technologies, installed base, relationshipswith governments, and so on. Effectively, both invention resources and com-plementary assets play important roles in a firm’s ability to profit from aninvention.
Resources and Capabilities in the Face of New Games 123

Complementary Assets
Professor David Teece of the University of California at Berkeley was one of thefirst business scholars to explore the role of complementary assets in profitingfrom inventions or discoveries.14 He was puzzled as to why EMI invented theCAT scan—an invention that was so important that Sir Godfrey Hounsfieldwon the 1979 Nobel Prize in Medicine for its invention—and yet, GE andSiemens, not EMI, the inventor, made most of the profits from the invention. Hewas also puzzled as to why R.C. Cola had invented diet and caffeine-free colas,and yet Coke and Pepsi made most of the profits from the two inventions.Professor Teece argued that to make money from an invention or discovery, twofactors are important: complementary assets and imitability. Complementaryassets, as defined above, are all the other resources, beyond those that underpinthe invention or discovery, that a firm needs to create value and position itself toappropriate the value in the face of the new game. For example, in pursuing itsdirect-sales and build-to-order new game activities, Dell needed manufacturingprocesses that would enable it to manufacture a customer’s computer in lessthan two hours once the order had been received. It also needed good relation-ships with suppliers who supplied components just-on-time, for example,delivering monitors directly to customers. Later, Dell also needed a brand. Inpursuing DTC marketing for its Lipitor, Pfizer also needed a sales force to callon doctors, and manufacturing to produce the drug once doctors started pre-scribing it. Dell’s manufacturing processes, brand, and its supplier relationshipsare complementary assets. So are Pfizer’s manufacturing capabilities and salesforce. Imitability comes into the profitability picture for the following reason. Ifthe invention or discovery from a firm’s new game activities can be imitated bycompetitors, customers may go to competitors rather than the firm, therebyreducing the ability of the firm to appropriate the value that it creates. Thesetwo variables—complementary assets and imitability—form the basis for theTeece Model, which we now explore.
The Teece Model: The Role of Complementary Assets andImitability15
The elements of the Teece Model are shown in Figure 5.1. The vertical axiscaptures the extent to which an invention or discovery can be imitated while thehorizontal axis captures the extent to which complementary assets are scarceand important. When imitability of an invention or discovery is high and com-plementary assets are easily available or unimportant, it is difficult for theinventor (first mover) to make money for a long time (Cell I in Figure 5.1). Thatis because any potential competitors that want to offer the same customerbenefits that the firm offers can easily imitate the invention and find the com-plementary assets needed. A new style of jeans for sale on the Internet is a goodexample. It is easy to imitate new jeans styles and selling them on the Internet isnot unique or distinctive to any one firm. Thus, it is difficult to make money fora long time selling a particular style of jeans on the Internet. Effectively, it isdifficult to make money in situations such as Cell I.
If, as in Cell II, the invention is easy to imitate but complementary assets arescarce and important, the owner of the complementary assets makes money.
124 Strengths and Weaknesses

That is because even though competitors can imitate the invention, they cannoteasily replicate the complementary assets. More importantly, the owner of theimportant complementary assets can easily imitate the invention but its com-plementary assets are difficult to imitate. The invention of CAT scans by EMIfalls into this category. The invention was easy to imitate but complementaryassets such as relationships with hospitals, sales forces, brands, and manu-facturing were scarce and important to selling the machines to hospitals. Theinventions of diet and caffeine-free colas by R.C. Cola also fall into this cat-egory. Both inventions required brand name reputations, shelf space, market-ing, and distribution channels which are important to making money from softdrinks but are tightly held by Coca-Cola and Pepsi. Thus, Coke and Pepsi haveprofited the most from diet and caffeine-free colas. Light beer offers anothergood example. The Miller Brewing Company and Budweiser did not inventlight beer even though they make the most money from it. It was invented by DrJoseph Owades at Rheingold Breweries. But because Miller and Budweiser hadthe complementary assets, they ended up making more money from it thanRheingold.
If imitability of an invention is low and complementary assets are importantand scarce, one of two things could happen (Cell III). If the inventor also has thecomplementary assets, then it stands to make lots of money from its invention.Patented pharmaceutical products in the USA are a good example because theirintellectual property protection keeps imitability low, and good sales forces,ability to run clinical tests, and other complementary assets are important todelivering value to customers are scarce. If the firm that has the scarce comple-mentary assets is different from the inventor, both firms will make money if theycooperate. If they do not cooperate, their lawyers could make all the money.
Finally, as in Cell IV, if imitability of the invention is low but complementaryassets are freely available or unimportant, the inventor stands to make money(Cell IV). Popular copyrighted software that is offered over the Internet would
Figure 5.1 The Role of Complementary Assets.
Resources and Capabilities in the Face of New Games 125

fall into this category since its copyright protects it from imitation and theInternet, as a distribution channel for software, is readily available to softwaredevelopers and other complementary assets are either not scarce or areunimportant.
Effectively, firms with scarce and important complementary assets are oftenthe ones that profit the most from new game activities, whether they moved firstin performing the new game activities or were followers. Having importantscarce complementary assets is one of the hallmarks of exploiters. Microsoft didnot invent word processing, spreadsheets, presentation software, windowingoperating systems, etc., even though it makes a lot of money from them. Itscomplementary assets, especially its installed base of compatible software, havebeen a primary driver of its success.
Strategic Consequences
An important strategy question is, what should a firm do if it found itself in oneof the situations depicted in Figure 5.1. For example, what should R.C. Colahave done to profit better from its invention of diet cola, given that the inven-tion was easy to imitate and complementary assets were scarce and important?In that case (Figure 5.2, quadrant II), the firm may have been better off teamingup with a partner that had the complementary assets. Teaming up can bethrough a joint venture, strategic alliance, or a merger through acquisition. If aninventor decides to team up, it may want to do so early before the potentialpartner with complementary assets has had a chance to imitate the invention orcome up with something even better. The question is, why would a firm withcomplementary assets want to team up with an inventor if it knows that it canimitate the invention later? The inventor has to show the owner of the comple-mentary assets why it is in their joint interest to team up. For example, R.C.Cola could have gone to Pepsi and explained that teaming up with it (R.C.
Figure 5.2 Strategies for Exploiting Complementary Assets.
126 Strengths and Weaknesses
Cola) would allow Pepsi to have a first-mover advantage in diet drinks beforeCoke and therefore give Pepsi a chance at beating Coke.
Effectively, in Cell II where an invention (from new game activities) is easyto imitate and complementary assets are important and scarce, the inventoris better off teaming up with the owner of complementary assets throughstrategic alliances, joint ventures, acquisitions, or other teaming-up mechanisms(Figure 5.2).
If an invention is difficult to imitate and complementary assets are scarce butimportant (Cell III of Figure 5.2), the inventor can pursue one of two strategies:block or team-up. If the inventor also owns the scarce complementary assets, itcan block rivals and potential new entrants from having access to either. In ablock strategy, a firm defends its turf by taking actions to preserve the inimit-ability of its invention or valuable resources. If another firm (other than theinventor) has the complementary assets, both firms can team up using strategicalliances, joint ventures, acquisitions, or other teaming-up mechanisms. In thepharmaceutical industry, for example, many biotechnology startups usuallydevelop new drugs whose patents limit imitability. However, many of thesestartups do not have complementary assets such as sales/marketing, and theresources needed to carry out the clinical testing that is critical to getting a newdrug approved for marketing in the USA. Consequently, there is a considerableamount of teaming up between biotech startups and the established largepharmaceutical firms that have the complementary assets. Many startups offerthemselves to be bought. If the inventor of a difficult-to-imitate invention andthe owner of scarce and important complementary assets decide not to cooper-ate and instead fight, there is a good chance that they will make their lawyersrich—they dissipate rather than create value.
If an invention is difficult to imitate but complementary assets are abundantor unimportant (Cell IV), a firm may be better off pursuing a block strategy inwhich it tries to prevent potential competitors from imitating its invention orstrategy. If the invention is easy to imitate and complementary assets are abun-dant or unimportant (Cell 1), a firm can pursue a so-called run strategy. In a runstrategy, the inventor or first mover constantly innovates and moves on to thenext invention or new game activity before competitors imitate its existinginvention or new game activity.
Dynamics
There are two things to note about the strategies of Figure 5.2. First, in practice,many firms pursue at least two of these strategies at any one time. For example,many firms pursue both block and run strategies at any one time—they defendtheir intellectual property for an existing product while forging ahead with thenext invention to replace the existing product being protected. Second, a firmcan sometimes go contrary to what Figure 5.2 suggests to lay a foundation forfuture gains. For example, an inventor may decide to team-up in Cell IV, ratherthan block as suggested by the framework, so as to win a standard and blockafter winning the standard. Intel’s case offers a good example of both instances.In the late 1970s and early 1980s, it encouraged other microprocessor makersto copy its microprocessor architecture. When its architecture emerged as thestandard, Intel started blocking—it decided not to let anyone imitate its
Resources and Capabilities in the Face of New Games 127

technology again and sued anyone who tried to.16 It also practiced the runstrategy by introducing a new microprocessor generation before unit sales of anexisting generation peaked. Effectively, Intel teamed up early in the life of itsmicroprocessor to win a standard. After winning the standard, it started block-ing and running.
Limitations of the Teece Model
It is important to note that although the Complementary Assets/Imitabilitymodel can be very useful, it has limitations. Like any model, it makes somesimplifying assumptions that may not apply to all contexts all the time. Forexample, it assumes that the only two variables that underpin appropriabilityare complementary assets and imitability. It leaves out the other determinantsof appropriability that we explored in Chapter 4 such as a firm’s position vis-à-vis coopetitors, pricing strategy, and the activities to increase the number ofcustomers that buy a particular product. It is true that an inimitable productand scarce important complementary assets can give their owner some bargain-ing power over customers; but they may not give the firm bargaining powerover suppliers, complementors, or customers with monopoly power in theirindustry. Moreover, even where a firm has unchallenged power over its coopeti-tors, it may still leave money on the table if it has the wrong pricing strategy.
Profitability Potential of Resources and CapabilitiesFrom what we have seen so far, resources and capabilities—be they inventionresources or complementary assets—are critical to creating and appropriatingvalue in the face of new games; but if you were to ask a firm to give you a list ofits resources, you would probably be handed a very long list. Thus, an import-ant question is, how can a firm narrow down the list of resources to those thathave the most potential for profitability? How can a firm narrow its catalog ofcompetences to only those that are truly core? We need some way to narrowdown the list of potentially profitable resources/capabilities. The AVAC frame-work that we saw in Chapter 2 can be used to rank-order resources/capabilitiesas a function of their potential to contribute to value creation and appropri-ation. The idea is to evaluate the potential of each resource to contribute to afirm’s competitive advantage and rank it accordingly. Each resource is rankedby answering the following questions and determining the strategic con-sequence of having the resource (Table 5.1):
a Activities: does the firm have what it takes to efficiently perform the activ-ities for building and/or translating the resource/capabilities into customerbenefits and/or positioning the firm to appropriate value? Is the firm per-forming the right activities?
b Value: does the resource/capability make a significant contribution towardsthe benefits that customers perceive as valuable to them?
c Appropriability: does the firm make money from the value that customersperceive in the benefits from the resource?
d Change: do the activities for building and exploiting the resource takeadvantage of change (present or future) to create and appropriate value?
128 Strengths and Weaknesses

Activities
In assessing the profitability potential of a resource/capability, the first ques-tion is, does the firm have what it takes to efficiently perform the activities forbuilding and/or translating the resource/capabilities into customer benefits and/or positioning the firm to appropriate value; that is, is the firm performing theright activities? The idea here is (1) to identify the activities that the firm uses tobuild or translate the resource into customer benefits and/or better position thefirm to appropriate value, and (2) to examine the firm’s ability to perform theseactivities by determining the extent to which each activity:
• Contributes to low cost, differentiation, better pricing, reaching more cus-tomers, and better sources of revenue.
• Contributes to improving its position vis-à-vis coopetitors.• Takes advantage of industry value drivers.• Contributes to building new distinctive resources/capabilities or translating
existing ones into unique positions and profits (including complementaryassets).
• Fits the comprehensiveness and parsimony criteria.
Table 5.1 Rank Ordering Resources/Capabilities by Competitive Consequence
Resource/Capability
Activities: Does thefirm have what it takesto efficiently performthe activities forbuilding and/ortranslating its searchengine capabilities intocustomer benefitsand/or positioning thefirm to appropriatevalue?
Value: Doesthe resourcemake asignificantcontributiontowards thebenefits thatcustomersperceive asvaluable tothem?
Appropriability:Does the firmmake moneyfrom the valuethat customersperceive in thebenefits fromthe resource?
Change: Dothe activitiesfor buildingand exploitingthe resourcetakeadvantage ofchange tocreate andappropriatevalue?
Strategicconsequence
Resource/cap-ability 1
Yes Yes Yes Yes Sustainablecompetitiveadvantage
Resource/cap-ability 2
Yes Yes Yes No Temporarycompetitiveadvantage
Resource/cap-ability 3
Yes Yes No Yes Competitiveparity
Resource/cap-ability 4
Yes Yes No No Competitiveparity
Resource/cap-ability 5
No/Yes No Yes No Competitiveparity
Resource/cap-ability 6
No No No No Competitivedisadvantage
Strategicaction
What can a firm do to reinforce the Yesses and reverse or dampenthe Noes, and what is the impact of doing so?
Resources and Capabilities in the Face of New Games 129

These are the Activities questions of an AVAC analysis.
Value
The next question is, does the resource make a significant contribution towardsthe benefits that customers perceive as valuable to them, relative to value fromcompetitors? This question is answered by exploring the Value component ofthe AVAC framework. This means exploring the following questions:
• Do customers perceive the value created by the strategy as unique?• Do many customers perceive this value?• Are these customers valuable?• Are there any nearby white spaces?
Appropriability
The next question is, does the firm make money from the value that customersperceive in the benefits from the resource? Making a significant contribution tothe value that customers perceive, relative to the value from competitors, is anecessary condition for a resource to earn its owner profits; but it is not asufficient condition for making money. From the Appropriability component ofan AVAC framework, a firm will appropriate value if:
• The firm has superior position vis-à-vis its coopetitors.• The firm exploits its position vis-à-vis its coopetitors and customer benefits.• It is difficult to imitate the firm.• There are few viable substitutes but many complements.
Change
The question here is, do the activities for building and exploiting the resourcetake advantage of change to create and appropriate value? This question isanswered by exploring the following questions from the AVAC framework.Do the activities for building and exploiting the resource:
• Take advantage of new ways of creating and capturing new value?• Take advantage of opportunities to build new resources/capabilities and/or
translate existing ones in new ways into value?• Take advantage of the potential to build and exploit first-mover
advantages?• Anticipate and respond to potential reactions from new and existing
competitors?• Take advantage of the opportunities and threats of an industry or
macroenvironment?
Competitive Consequence
An AVAC analysis enables a firm to identify and rank its resources by theircompetitive consequences—by the extent to which each resource stands to give
130 Strengths and Weaknesses

the firm a competitive advantage. (To avoid repetition, we use the wordresource to mean resource/capability.) Table 5.1 shows six different resourcesand the competitive consequence for a firm using each. Resource 1 is valuable tocustomers, and the firm can appropriate the value from it. Moreover, the firmhas what it takes to perform the activities to build and exploit the resourceefficiently. The resource can also be used to take advantage of change (presentor future) to better create and/or appropriate value. The resource is thus said togive the firm a sustainable competitive advantage. The more common case isthat of Resources 2, which gives a firm a temporary competitive advantage. Theresource is valuable to customers, and the firm has what it takes to efficientlyperform the activities to build and exploit the resource; but the resource isvulnerable to change. During the period before the change, the firm has atemporary competitive advantage.
Resource 3 is valuable to customers, the firm has what it takes to performefficiently the activities to build and exploit the resource, and it can take advan-tage of change. The only problem with the resource is that there are other thingsthat make it difficult to appropriate the value from it. For example, the firmusing the resource may not have bargaining power over its suppliers and buyers,or the firm’s pricing strategy may be leaving money on the table or drivingcustomers away. Therefore the firm cannot appropriate all the value that itcreates using the resource. The firm has competitive parity using the resource.Resource 4 is valuable to customers, but the value is difficult to appropriate andthe resource is vulnerable to change. Thus, the best that Resource 4 can do forits owner is to give it competitive parity. Resource 5 is neither valuable, norappropriable, nor can it withstand change. Moreover, the firm does not have theability to perform efficiently the activities for building and exploiting theresource. Such a resource puts its owner at a competitive disadvantage since itscompetitors can do better.
Strategic Action
The next step after an AVAC analysis is to identify what it is that a firm can doto reinforce the Yesses and either dampen or reverse the Noes. The goal is tomove things towards a sustainable competitive advantage. For example, if afirm finds out that it cannot appropriate most of the value that it creates becauseit has a bad pricing strategy, it can change the strategy. If a resource puts a firmat a competitive disadvantage and the firm cannot reverse or dampen the Noes,it may be better off getting rid of the resource. Effectively, an AVAC analysisshould help a firm decide which Yesses to reinforce, which Noes to dampen orreverse, and which resources to dump so as to improve its ability to create andappropriate value.
Example 5.1: Google’s Search Engine Capabilities in 2007
To illustrate the use of an AVAC analysis to assess the profitability potential of aresource, we go through an example using Google’s search engine capabilities.
Resources and Capabilities in the Face of New Games 131

Activities
Does Google Have What it Takes to Perform Efficiently the Activities forBuilding and/or Translating the Resource/capabilities into Customer Benefitsand/or Positioning the Firm to Appropriate Value?
Google performed the following activities in building and translating its searchcapabilities into unique value. It developed and incorporated its PageRankalgorithm into its search engine and continued to improve the algorithm. It builta brand from its relevant searches. It emphasized innovative management oftechnology concepts such as encouraging its engineers to use 20% of their timeto work on projects of their own choosing (why not marketing?). It introducedAdWords paid listings to monetize search engines. It teamed up with networkaffiliates and provided them with search-engine technology in return for shareof profits from advertising on the sites. These activities differentiated Googlefrom its competitors. For example, Google’s brand and customers’ perceptionthat its searches were more relevant than competitors’ searches differentiatedthe value from its search engine. This differentiation also improved Google’sposition vis-à-vis some coopetitors. For example, some customers might believethat switching to competitors would not give them the benefits that they per-ceived as coming only from Google. The differentiation also reduced the poten-tial threat of substitutes and made it even more difficult for any potential newentrants who had dreams of entering the market and taking Google head on.
The industry value drivers for the search engine market are: the speed, rele-vance, and comprehensiveness of searches as well as the R&D that goes intothem. By developing its PageRank algorithm that produced most relevantsearches, Google took advantage of the “search relevance” industry valuedriver. Because of its brand, some customers perceived data from its engines asbeing the most reliable. In addition to the intellectual property (patents, copy-rights, and trade secrets) that underpinned its search engines, the firm alsocultivated one of the most recognizable brands in the world, earning it a verb insome dictionaries—to google.
Google also did some cool things to keep the cost of its activities low. It usedIntel microprocessor-based commodity servers rather than the much moreexpensive proprietary servers from IBM, Sun Microsystems, and others. Sincethese servers consumed lots of electricity and generated a lot of heat, it alsolocated them near cheap sources of electricity in cold places. The firm is there-fore able to deliver searches at lower cost that it would have been able to.
Value
Does the Resource Make a Significant Contribution Towards the Benefits thatCustomers Perceive as Valuable to Them?
Google had two sets of customers: Internet users who performed searches, andadvertisers who advertised online. Users (surfers) valued the speed, relevance,and comprehensiveness of searches made using Google’s search engine. In Feb-ruary 2007, for example, 48.1% of the 6.9 billion monthly online searchesconducted by surfers used Google’s search engine, compared to 28.1% for
132 Strengths and Weaknesses

Yahoo, 10.5% for Microsoft, 5.0% for Ask.com and 4.9% for Time Warner.17
Advertisers valued the billions of eyeballs that Google’s website received everymonth. This amounted to many users to whom these advertisers could adver-tise. While other factors such as Google’s brand may have had an effect on thenumber of visitors to its search site, its search engine, especially its ability todeliver relevant searches appears to have played a major role. Since Google’susers cut across all demographics, it was difficult to say how valuable the userswere. However, its advertisers included very small firms who would ordinarilynot advertise in the offline world but who could advertise on Google’s sites orthird-party affiliates because of the low cost of servicing such small customers.Potentially, there was some white space for search engines that answered ques-tions rather than use key words to perform searches—something with moreintelligence.
Appropriability
Does the Firm Make Money from the Value that Customers Perceive in theBenefits from the Resource?
Yes. Google’s search engine capabilities and associated complementary assetsmade lots of money for Google in 2007. Google was one of the most profitableand most valuable (from a market capital point of view) companies in theworld. Things were not always that way. Even after its search engine becamethe most popular, it still was not very profitable. It was after it introduced paidlistings, an idea pioneered by Overture.com, that Google started to makemoney. In paid listings, advertisers’ links are displayed above or alongsidesearch results.
There are several reasons why Google was able to appropriate the valuecreated by its search engine capabilities. First, Google had the complementaryassets to help it appropriate the value created by its search engine capabilities.However, it is difficult to say exactly how much of that money came from itssearch engine capabilities and how much from complementary assets such as itsbrand, paid listings technology, relationships with affiliates, etc.
Second, although it was easy to develop a search engine that was comparableto Google’s in performance, replicating the combination of the search engine,the Google brand, video, images, and news services that it offered made itdifficult for rivals to duplicate all of what Google offered. As the Internetevolves, the possibility that some firm can leapfrog Google is always going to bethere. It had no established record of retaliating against competitors althoughsome may view its introduction of free word-processing software as retaliatingagainst Microsoft for offering search engine services. Competitors did not haveany clear handicaps such as prior commitments or dominant managerial logicto handicap their efforts to imitate Google. In the late 1990s, when the Web wasnot overcrowded, companies could catalog and compile Web content withoutthe aid of search engines. With the proliferation of Web content, it was verydifficult to find stuff on the Internet without a search engine in 2007. Hence,there were no substitutes for search engines. Complements were things such ascomputers and handheld devices that enabled individuals to search the Web.
Third, the relevance of searches from its search engine, coupled with Google’s
Resources and Capabilities in the Face of New Games 133

brand and other activities, also gave the firm power over many of itscoopetitors. For example, its brand and relevant searches attract surfers, whoselarge numbers attract many advertisers. This gives Google more power over itsadvertisers than would be expected in a market with four other competitors.
Fourth, in its paid listings business model, Google had customers (advert-isers) bid for key words in an auction. Since auction pricing is one of the bestways to get as close as possible to customers’ reservation prices, Google wasprobably getting very close to customers’ reservation prices. The firm also had alot of information about its customers and could therefore price discriminateusing the information if it wanted to.
Change
Do the Activities for Building and Exploiting the Resource Take Advantage ofChange (Present or Future) to Create and Appropriate Value?
Existing Change came from the Internet and Google’s actions to take advantageof the new technology.
The Internet and the growing Web traffic on it made it increasingly difficult tofind things on it, thereby creating an opportunity to develop dependable searchengines that provided users with relevant search results. Google provided suchan engine. So did its competitors, resulting in a relatively unattractive market(using Porter’s Five Forces analysis) in 2007. However, Google found a way tomake the market more attractive for itself and was therefore better able tocreate and capture more value than its competitors. It monetized the engineusing paid listings and other complementary assets such as its brand.
Google was not the first to develop search engines. It took advantage ofreduced marketing and technological uncertainty to, for example, use paid list-ings to monetize its search engine. The intellectual property (patents, copy-rights, and trade secrets) that Google built in developing its search engine, andthe preemption of perceptual space at the many surfers who preferred to useGoogle’s search engine could be regarded as first-mover advantages for theactivities that it was the first to perform. So were the relationships that it built atthe affiliates whose sites used the Google search engine.
In offering complementary products, such as Gmail and GoogleMap, Googlemay be anticipating the likely reaction of its competitors. Looking to the future,as the Web evolves, there are likely to be many changes. For example, Google’sadvantage could be eroded by so-called specialist or vertical search engines.Vertical engines address the specialized needs of niches or professionals ratherthan the general broad-based needs of consumers as do the generalist enginesfrom Google and Yahoo do. For example, GlobalSpec.com is a profitable spe-cialist engine for engineers. A specialized engine for the pharmaceuticals indus-try could target pharmaceutical advertising.18 Table 5.2 provides a summary ofthe strategic consequence of Google’s search engines capabilities.
134 Strengths and Weaknesses

Identifying the Right Complementary Assets
Since we have defined complementary assets as all other resources apart froman invention or discovery that a firm needs to create and appropriate value, thelist of potential complementary assets for any particular invention or discoverycan be huge. Thus, we need some way to narrow down the list of potentialcomplementary assets. An AVAC analysis can also be used to rank order com-plementary assets by their potential to contribute to value creation andappropriation. The idea is to evaluate the potential of each complementaryasset to contribute to a firm’s competitive advantage and rank it accordingly. Asshown in Table 5.3, each complementary asset is ranked by answering thefollowing questions and determining the competitive consequence of having theasset:
1 Activities: does the firm have what it takes to efficiently perform the activ-ities for building and/or translating the complementary asset into customerbenefits and/or positioning the firm to appropriate value? What are theactivities?
2 Value: does the complementary asset make a significant contributiontowards the benefits that customers perceive as valuable to them?
3 Appropriability: does the firm make money from the value that customersperceive in the benefits from the complementary asset?
4 Change: do the activities for building and exploiting the complementaryasset take advantage of change (present or future) to create and appropriatevalue?
Table 5.2 Strategic Consequence for Google’s Search Engine Capabilities
Activities: DoesGoogle have what ittakes to efficientlyperform theactivities for buildingand/or translatingthe resource/capabilities intocustomer benefitsand/or positioningthe firm toappropriate value?
Value: DoesGoogle’ssearch enginecapabilitymake asignificantcontributiontowards thebenefits thatcustomersperceive asvaluable tothem?
Appropriability:Does Googlemake moneyfrom the valuethat customersperceive in thebenefits fromits searchenginecapabilities?
Change: Do theactivities forbuilding andexploitingsearch enginecapabilities takeadvantage ofchange (presentor future) tocreate andappropriatevalue?
Competitiveconsequence
Searchenginecapabilities
Yes Yes Yes Yes/No Sustainable/temporarycompetitiveadvantage
Strategicaction
In the 2000s Google took advantage of the changes from the evolvingInternet. It could:
1. do more to monetize searches on “partner” websites;2. pay more attention to category killers;3. do more to exploit the exploding Web traffic, especially from
video images which take up lots of bandwidth.
Resources and Capabilities in the Face of New Games 135

Each complementary asset is classified by the potential competitive consequenceof building and exploiting the asset, from “sustainable competitive advantage”down to “competitive disadvantage.” The more that the strategic consequencefrom a complementary asset is a sustainable strategic advantage rather than astrategic disadvantage, the more that a firm may want to pursue the comple-mentary asset. In addition to telling a firm which complementary assets topursue, the analysis can also point out which Noes could be reversed to Yessesor dampened, and which Yesses could be reinforced.
Strengths and Handicaps in the Face of New Games
Every firm brings to a new game some resources from its pre-new gameactivities. Some of these resources, including complementary assets, continue tobe useful during the new game but others may not only be useless, they canbecome handicaps. Identifying which resources might become handicaps can,
Table 5.3 Rank Ordering Complementary Assets
Complementaryasset
Activities: Doesthe firm havewhat it takes toefficientlyperform theactivities forbuilding and/ortranslating thecomplementaryasset intocustomerbenefits and/orpositioning thefirm toappropriatevalue?
Value: Does thecomple-mentary assetmake asignificantcontributiontowards thebenefits thatcustomersperceive asvaluable tothem?
Appropriability:Does the firmmake moneyfrom the valuethat customersperceive in thebenefits fromthecomplementaryasset?
Change: Do theactivities forbuilding andexploiting thecomple-mentary assettake advantageof change(present orfuture) tocreate andappropriatevalue?
Competitiveconsequence
Complementaryassets 1
Yes Yes Yes Yes Sustainablecompetitiveadvantage
Complementaryassets 2
Yes Yes Yes No Temporarycompetitiveadvantage
Complementaryassets 3
Yes Yes No Yes Competitiveparity
Complementaryassets 4
Yes Yes No No Competitiveparity
Complementaryassets 5
No/Yes No Yes No Competitiveparity
Complementaryassets 6
No No No No Competitivedisadvantage
Strategic action What can firm do to reinforce the Yesses and reverse or dampenthe effect of the Noes
136 Strengths and Weaknesses

depending on the type of new game, be critical to winning. Identifying whichscarce valuable resource is likely still to remain valuable for the firm and whichone is likely to become a handicap consists of answering the two simple ques-tions shown in Table 5.4:
1 Is the resource vital in the new game?2 Is separability possible?
There are two primary determinants of which resource becomes a handicap orstrength: whether the resource is vital to the new game, and whether theresource is separable. A resource is vital to a new game if it contributes signifi-cantly to value creation and appropriability. It is separable if the firm has noproblems taking the resource away from the old game for use in the new game,or leaving the resource behind when it is more likely to hurt in the new gamethan help. A firm may be prevented from using a resource in a new gamebecause of prior commitments, contracts, agreements, understandings, emo-tional attachments, or simply because the resource/asset cannot be moved fromthe location of the old game to the location of the new one. In that case theresource is inseparable from the old context. A firm may also want to separateitself from a resource from its past, so as to move on but cannot because theresource is inseparable.
To understand these arguments better, consider Resource 1 in Table 5.4. It isvital in the new game and the firm can use it in the new game because there areno prior contracts, agreements, understandings, or anything else that preventsthe firm from using the important resource in the new game. Thus the resourceis a strength for the firm. Most brands, advertising skills, and shelf space con-tinue to be strengths for many firms even in the face of revolutionary new gamesin which technologically radical new products are introduced. In pharma-ceuticals, for example, a firm’s drug approval capabilities, sales force, andbrand usually continue to be strengths from one revolutionary drug to another.
Resource 4 is the exact opposite of Resource 1. The resource is useless to thefirm in pursuing the new game but unfortunately for the firm, it cannot separateitself from the resource and move on. Resource 4 is therefore a handicap. TheCompaq example which we saw earlier in this book illustrates instances of bothResources 1 and 4. Compaq wanted to participate in the new game created byDell when the latter introduced the direct sales and build-to-order businessmodel, bypassing distributors. Compaq’s brand name reputation was a strengthin the new game since it could still be used in direct sales. The skills used to
Table 5.4 Is a Strength from a Previous Game a Strength or Handicap in a New Game?
Resource Is the resource vital inthe new game?
Is separability possible? In the new game, theresource is a:
Resource 1 Y Y strength
Resource 2 Y N potential strength
Resource 3 N Y question mark
Resource 4 N N handicap
Resources and Capabilities in the Face of New Games 137

interact with distributors and old agreements with distributors were no longerneeded in the new game. However, Compaq could not get out of the agreementswith distributors. The agreements with distributors effectively became a handi-cap to the firm’s efforts to follow Dell and sell directly to end-customers.
A firm’s dominant managerial logic is another example. It is usually a goodthing since dominant managerial logic makes what managers are supposed todo become second nature to them; but in the face of some types of change, it canbecome a problem. Take discount retailing, for example. Part of the dominantmanagerial logic in the USA in the 1970s and early 1980s was that firms mademoney in discount retailing by building large stores in big cities, so when Wal-Mart was building small stores in rural areas of the Southwestern USA, K-Martand other competitors did not think much about Wal-Mart and continued tobelieve in making money by building large stores in large cities. Wal-Martwould go on to become the world’s largest company while K-Mart had to filefor bankruptcy. Another example is that of the French wine industry that dom-inated the world market for centuries with wines that were made using no newtechnologies and no sugar, and were classified and named by French locationssuch as Bordeaux, Champagne, Cote du Rhone, etc.19 New entrants from SouthAfrica, Australia, and the USA entered some wine markets with wines that weremade using new technologies such as drip irrigation, reverse osmosis, computer-ized aging, and oak chip flavoring, and classified their wines using grape typesuch as merlot or chardonnay rather than location. The dominant thinking inthe French wine industry still continues to be that fine wines are made the old-fashioned French way using no new technologies, even as French wine con-tinues to lose market share in some markets to South African, Australian, andUS wine sellers. Another way to think of how inseparability can lead to handi-caps is to think of personal relationships. When a person moves from animportant relationship to another, there may be things about the old relation-ship that he or she would rather leave behind but that just hang around. Thatmight not help the new relationship.
There are two other cases in Table 5.4. Resource 2 is important in the newgame but because of prior commitments, agreements, or other inseparability,the firm cannot use it in the new game. The resource is then a potential strengthsince, with work, it could become separable. For example, a noncompete clausein an important employee’s contract with a previous employer may prevent afirm from using the employee on some projects for some time. Resource 3 is notimportant in the new game and the firm can get away from it. It is therefore,neither a strength nor a handicap. It is a question mark.
A similar analysis can be performed for the product-market position (PMP)that a firm brings to a new game. Here, the question is whether strengths in afirm’s previous product (low-cost, differentiated products, or both), and thefirm’s position vis-à-vis its coopetitors—that a firm brings to a new game—remain strengths or become handicaps. A firm’s PMP from a previous gamebecomes a handicap in a new game if products from the new game potentiallycan cannibalize the firm’s existing products from the previous game. If that isthe case, the firm may not invest in the new game for fear of cannibalizing itsexisting products. A previous PMP can also become a handicap if the new gameis about luxury products while the previous PMP was about low-cost products,since customers’ perception of the old product may negatively bias their
138 Strengths and Weaknesses
perception of the new one. On the other hand, the seller of a luxury productthat decides to sell a low-cost version in a new game may find its old position astrength in selling the new product. Since a firm’s position vis-à-vis coopetitorsis partially determined by its resources/capabilities, the analyses above forresources can be used to analyze whether such positions become handicaps orremain strengths.
Valuing Intangible Resources/Capabilities from NewGamesSuppose a firm builds new resources in the face of a new game and wantsquantitatively to estimate their value; how should the firm go about it? Adetailed AVAC analysis can tell a firm a lot about the profitability potential of itsresources but it does not quantify intangible resources (assets). Financial state-ments only state the value of tangible assets such as plants, equipment, cash,marketable securities, and inventories but say nothing about intangible assetssuch as brands, patents, copyrights, trade secrets, installed base, client relations,government relations, and so on. We explore two methods for getting a quickfeel for the value of such intangibles.
Assigning Numbers to Intangibles
Consider the simple but important balance sheet relationship of equation (1).
Assets = liabilities + shareholder equity (1)
An elementary manipulation of equation (1) gives
Assets − liabilities = shareholder equity (2)
The relationship shown in equation (2) suggests that at any one time, the mar-ket value of a firm (shares outstanding multiplied by share price) should beequal to the firm’s assets minus its liabilities (equation (2)). The quantity“Assets − Liabilities” is also called the book value of the firm. Book value iswhat would be left over for shareholders if a firm were to sell its assets and payits creditors. Therefore, according to equation (1), at any one time, a firm’sbook value should be equal to its shareholder equity or market value. As Table5.5 shows, that is not always the case. Differences between book value andmarket value range from Comcast’s $9.18 billion to ExxonMobil’s $354.65billion. The difference between book value and market value for each firmsuggests two things: (1) that there is something else about the firm, somethingother than the assets on its books, that makes investors believe that the firm willkeep generating free cash flows or earnings; and (2) that the stock marketovervalues the firm’s stock. If we assume that the market does not overvalue thefirm’s stock, the difference between book value and market value is a measureof intangible assets, since they are not captured in the book value relationship.The ratio of market value to book value is also a measure of intangibles. In theexamples of Table 5.5, Microsoft’s intangibles in August of 2007 were a lotmore valuable than General Motors’ intangibles, since Microsoft’s marketvalue to book value was 8.5 while General Motors’ was −5.1.
Resources and Capabilities in the Face of New Games 139

Using the difference between book value and market value to measureintellectual capital has several shortcomings. First, firms that have not gonepublic and business units cannot use the measure, since they have no marketvalue. Second, it is an aggregate measure since it estimates a value for all of afirm’s intangible resources. While it highlights the extent to which a firm’s valuedepends on its intangible resources, it does not tell us much about the differentcomponents of the capital and their relative contribution to the value. Thus,while the measure can tell us whether Pfizer depends more on intangible assetsthan its competitors, it does not tell us how much of Pfizer’s value is from itscholesterol or hypertension technologies.
Numerical Example: Leveraging Effect of IntangibleResources
We explore one more way of indirectly valuing intangible resources by con-sidering a numerical example from personal computers.
Example 5.2
At an estimated development cost of $1 billion, Microsoft’s Windows XP oper-ating system was released on October 25, 2001 and earned Microsoft an esti-mated $55 to $60 per copy sold.20 An operating system is a computer softwareprogram that manages the activities of different components (software andhardware) of a computer. From 1996 to 2001, Apple’s market share dropped
Table 5.5 Sample Values of Intangible Resources (all numbers, except rations, in $ billion)
S T W X Y Z
Company Market value onAugust 22, 2007
Assets Liabilities Book value =T − W (Assetsliabilities)
S − X =Market value −book value
Market valueBook value
Intel 141.00 50.29 10.60 39.70 101.30 3.6Microsoft 263.00 63.17 32.07 31.10 231.90 8.5General
Electric(GE)
397.00 738.53 621.51 117.02 279.98 3.4
Google 157.00 21.42 1.76 19.66 137.34 8.0Wal-Mart 180.00 155.42 95.51 59.91 120.09 3.0Pfizer 167.00 110.40 42.31 68.09 98.91 2.5General
Motors(GM)
18.00 186.53 190.09 −3.56 21.56 −5.1
JP MorganChase
153.00 1,458.04 1,338.83 119.21 33.79 1.3
Cisco 182.00 53.34 21.86 31.48 150.52 5.8ExxonMobil 462.00 228.32 111.97 116.35 345.65 4.0Citicorp 237.00 2,220.87 2,093.11 127.75 109.25 1.9Merck 109.00 44.18 24.71 19.47 89.53 5.6Comcast 51.00 110.76 68.93 41.83 9.18 1.2
140 Strengths and Weaknesses

from 5.2% to 3.0%.21 In 2001, 133.5 million desktops, notebooks, and PC-based servers were shipped worldwide.22 One estimate in 2007 had Apple’sinstalled base of Macs at 4.5% of total PC-installed base.23 For many busi-nesses, the active PC life cycle was three years. Given this information, what isthe value of installed base to Microsoft and Apple? (Installed base is anintangible resource.)
Answer: One way to get a feel for the value of installed base for each firm is toperform a breakeven analysis. Let us start by making the calculations forMicrosoft.
Microsoft
Contribution margin per unit = P − Vc = ($57.50) (average of $55 and $60)
Breakeven quantity =Fixed Cost
Contribution Margin=
$1B
$57.5= 17.39 million units (3)
Of the 133.5 million PCs that were sold in 2001, 3% or 4 million were Applemachines. The remaining 97% or 129.5 million (10.8 million per month) wereWindows machines that use the Microsoft operating system; that is, 10.8 mil-lion units of Microsoft’s operating system were sold each month for the remain-ing two months of 2001 and beyond if we assume that sales of PCs remained atabout their 2001 levels for the coming years. Since Microsoft needed to sell17.39 million units of the operating system to break even and it sold 10.8million units a month, it would have taken the company 17.39M
10.8M months = 1.6months to break even; that is, it would have taken Microsoft 1.6 months torecover the $1 billion that it spent on R&D to develop the operating system.After the 1.6 months, the money coming in was largely profits. Note that equa-tion (4) could be used to calculate the breakeven time where breakeven quantityis 17.39 million while the sales rate is 10.8 million per month.
Breakeven time = Breakeven Quantity
Sales Rate(4)
Apple
Suppose Apple developed an operating system at the same cost as Microsoftand sold it at the same price. It too (Apple) would need to sell 17.39 millionunits to break even. However, because Apple sold only 4 million units a year or0.333 million per month, its breakeven time would be 17.39M
0.333M months = 52.22months. If Apple wanted to breakeven in the same 1.6 months as Microsoft, itwould have to sell each copy of its operating system at $1,856.76 or52.221.6 ($57.25).
The Microsoft advantage is largely because of its installed base—that is, themillions of Windows PCs and their owners (businesses and consumers) whohave learned how to use the Microsoft operating system, bought software thatruns on it, are comfortable with the operating system and applications, andprefer to stay with the Windows PCs rather than change to Apple. For similar
Resources and Capabilities in the Face of New Games 141

reasons, many Apple users do not want to switch from Apple to the Windowscamp either. Thus, after the PC active life of three years, many customers whohad Windows PCs buy new Windows PCs while many customers who hadApple machines buy new Apple machines. Each new Windows machine meansa sale of a Windows operating system for Microsoft. Effectively, the installedbase of Windows machines is an intangible asset for Microsoft that is a keydriver of how many copies of its operating system it can sell, while the installedbase of Apple machines is an asset for Apple and a major driver of how manyMacs Apple can sell.
The importance of intangibles is also seen in Apple’s iTunes for iPod. Applelaunched a Windows version of its iTunes in October 2003. In just three and ahalf days, over one million copies of the iTunes software for Windows had beendownloaded, and over one million songs purchased using the software.24 InApril 2003, it had taken seven days for Apple to sell one million songs when itlaunched iTunes on Apple machines. Effectively, even Apple stood to benefitfrom the Windows installed base.
Key Takeaways
• Resources play a critical role in the creation and appropriation of value.There are three types of resource: tangible, intangible, and human. Tangibleresources are the resources that are usually identified and accounted for infinancial statements under the category, “assets.” Intangible resources arethe nonphysical and nonfinancial assets such as patents, copyrights, brandname reputation, trade secrets, research findings, relationships with cus-tomers, shelf space, and relationships with vendors that cannot be touchedand are usually not accounted for in financial statements. Organizationalresources consist of the know-how and knowledge embodied in employeesas well as the routines, processes, and culture that are embedded in theorganization. A firm’s capabilities are its ability to turn resources into cus-tomer benefits and profits.
• A core competence is a resource or capability that:
� Makes a significant contribution to the benefits that customers perceivein a product or service.
� Is difficult for competitors to imitate.� Is extendable to other products in different markets.
• A technology or product exhibits network externalities if the more peoplethat use it, the more valuable it becomes to each user. Network externalitieseffects can be direct or indirect.
• Although the size of a network is important, size is not everything. Thestructure of a network and the conduct of firms within the network alsocontribute to the value that each user enjoys in a network.
• Complementary assets can be critical to creating and appropriating valueusing new game activities. Complementary assets are all the other resources,beyond those that underpin a new game (an invention or discovery), that afirm needs to create value and position itself to appropriate the value.
• The Teece model helps us to understand better why it is that many inventorsdo not profit from their inventions. In the model, appropriating value from
142 Strengths and Weaknesses

an invention depends on (1) the extent to which the value can be imitated,and (2) the extent to which complementary assets are important and scarce.Inventors whose inventions are easy to imitate and require important andscarce complementary assets do not make money from the inventions.Rather, the owners of the complementary assets make the money. Depend-ing on the level of imitability and the need and importance of comple-mentary assets, a firm can use a run, block, and team up strategy to help itsefforts to profit from a new game. This model, while very useful, has somelimitations. For example, it leaves out the other factors that impactappropriability: position vis-à-vis coopetitors, pricing strategy, number ofcustomers, etc.
• Since each new game usually requires many complementary assets, it isimportant to narrow down the list of the assets to those that are critical to afirm’s value creation and appropriation activities. An AVAC analysis can beused for the narrowing-down exercise.
• Intangible resources are usually not quantified in financial statements. Oneway to get a feel for the value of a firm’s intangible resources is to estimatethe difference between the firm’s market capitalization and book value.Another way is to zoom down on intangible resources that can be measuredand try to estimate their significance to a firm.
• An AVAC analysis can be used to assess the profitability potential ofresources. This analysis consists of answering the following questions:
� Activities: Does the firm have what it takes to perform efficiently theactivities for building and/or translating the resource/capabilities intocustomer benefits and/or positioning the firm to appropriate value?
� Value: Does the resource make a significant contribution towards thebenefits that customers perceive as valuable to them?
� Appropriability: Does the firm make money from the value that cus-tomers perceive in the benefits from the resource?
� Change: Do the activities for building and exploiting the resource takeadvantage of change (present or future) to create and appropriate value?
• An AVAC analysis enables a firm to identify and rank its resources by theircompetitive consequences—by the extent to which each resource stands togive the firm a competitive advantage. A resource can give a firm a sustain-able competitive advantage, temporary competitive advantage, competitiveparity, or competitive disadvantage.
• An AVAC analysis helps a firm decide what to do to reinforce a sustainableadvantage, turn a temporary advantage into a sustainable advantage or turncompetitive parity into competitive advantage.
Key Terms
CapabilitiesComplementary assetsCore competencesIntangible resourcesNetwork externalitiesProfitability potential of resources/capabilities
Resources and Capabilities in the Face of New Games 143

ResourcesSingle-sided networksStructure of a networkTangible resourcesTeece ModelTwo-sided networkValuing intangible resources
144 Strengths and Weaknesses

First-mover Advantages/Disadvantages and Competitors’Handicaps
Reading this chapter should provide you with the information to:
• Explain the advantages and disadvantages of moving first.• Understand how to narrow down the list of potential first-mover
advantages.• Understand that first-mover advantages are usually not endowed on every-
one who moves first; rather, they have to be earned.• Understand competitors’ potential handicaps.• Understand why first movers sometimes win and why, sometimes, followers
win.• Understand the roles player by explorers, superstars, exploiters, and me-
toos in the face of new games.
IntroductionConsider the following. eBay was the first online auction firm and went on todominate its industry. However, Google was not the first search engine com-pany but went on also to dominate its own industry. Coca Cola invented theclassic coke and went on to dominate the market for colas, with some help andchallenges from Pepsi. However, neither Coke nor Pepsi invented diet cola, eventhough they dominate that market. Apple did not invent the MP3 player and yetits iPod went on to dominate the market for MP3 players. The question is, whyis it that sometimes first movers go on to dominate their markets but at othertimes, followers (second movers) are the ones that go on to dominate theirmarkets? As we indicated in Chapter 1, whether a first mover or follower winsis also a function of whether it has the right strategy. In Chapters 4 and 5, westarted to explore what the right strategy is and is not, and will continue to doso throughout this book. In this chapter, we look deeper into the advantagesand disadvantages of moving first. We start the chapter by exploring what first-mover advantages are all about. Next, we explore first-mover disadvantage—also known as followers’ or second-mover advantages. In doing so, we arereminded that first-mover advantages and disadvantages are not automaticallybestowed on any first mover. Rather, first-mover advantages have to be earnedand disadvantages can be minimized. We conclude the chapter by exploringwhy it is that sometimes first movers win and sometimes, followers win.
Chapter 6

First-mover AdvantagesA first-mover advantage is a resource, capability, or product-market positionthat (1) a firm acquires by being the first to carry out an activity, and (2) givesthe firm an advantage in creating and appropriating value. A firm has anopportunity to acquire first-mover advantages when it is the first to introduce anew product in an existing market, create a new market, invest in an activityfirst, or perform any other value chain, value network, or value shop activityfirst, such as bypassing distributors and selling directly to end-customers.1 First-mover advantages come from six major sources (Table 6.1):
1 Total available market preemption.2 Lead in technology, innovation, and business processes.3 Preemption of scarce resources.4 First-at-buyers.5 First to establish a system of activities.6 First to make irreversible commitments.
Total Available Market Preemption
If, in moving first, a firm introduces a new product, it has a chance to do theright things and capture as much of the total available market as possible beforefollowers start to move in. Since such a firm is the only one in the market, it hasa 100% share of the new product, no matter how many units it sells. Thus, theemphasis here is in capturing as much of the total available market as possibleand selling as many units as possible before followers move in—that is,
Table 6.1 First-mover Advantages (FMAs)
Source of first-mover advantage FMA mechanism
Total available market preemption Economies of scaleSize (beyond economies of scale)Economic rents and equityNetwork externalitiesRelationships with coopetitors
Lead in technology, innovation,and business processes
Intellectual property (patents, copyrights, trade secrets)LearningOrganizational culture
Preemption of scarce resources Complementary assetsLocationInput factorsPlant and equipment
First-at-buyers Buyer switching costBuyer choice under uncertaintyBrand (preemption of consumer perceptual space or mindshare)
First to establish a system ofactivities
Difficult-to-imitate system of activities
First to make irreversiblecommitments
Reputation and signals
146 Strengths and Weaknesses

emphasis is on preemption of total available market. Having captured as muchof the total available market as possible, the firm potentially enjoys five advan-tages: scale economies, size effects (beyond economies of scale), economic rentsand equity, network effects, and relations with coopetitors.
Scale Economies
There are economies of scale in production if the more of a product that isproduced, the lower the per unit cost of production. There can also be econ-omies of scale in R&D, advertising, distribution, marketing, sales, and service ifthe more units that are sold, the less the per unit cost of each activity. Thisadvantage derives largely from the fact that the (total) fixed cost of each activitycan be spread over the larger number of units. For example, an ad slot on TVcosts the same for Coca Cola’s diet cola as it does for Shasta’s diet cola. SinceCoca Cola sells hundreds of millions of cans of its diet cola compared to a fewmillion cans for Shasta, Coke has lower per unit advertising costs compared toShasta. If a firm moves first and performs the right activities, it can pre-preemptively capture as much of the total available market as possible; and ifthe firm’s industry and market are such that there are economies of scale, its perunit cost of R&D, advertising, distribution, marketing, sales, service, etc. can belower. This lower per unit cost from economies of scale has several implicationsfor the different components of its ability to create and appropriate value.
If a firm that moved first has captured as much of the total available marketas possible, and enjoys scale economies, rational potential new entrants knowthat if they were to enter the market to compete head-on with the first mover,they would have to capture the same market share (as the first mover) so as toattain the same per unit costs as the first mover. However, to do so would meanto bring in the same capacity as the first mover to the same market, therebydoubling the capacity. This might result in a price war that lowers profits for thenew entrant. Thus, rational potential new entrants might refrain from entering.Effectively, if a first mover can capture as much of the total available market aspossible, it can attain scale economies thereby creating barriers to entry forsome potential followers. These barriers to entry are more difficult to surmountif the minimum efficient scale is large relative to the total available market and ifthe first mover has a system of activities or distinctive resources and capabilitiesthat are difficult to imitate. When we say that a first movers’ preemption of totalavailable market raises barriers to entry, we do not mean that it is impossiblefor new entrants to enter. New entrants do enter sometimes but pursue nichemarkets. They would have a much more difficult time competing head-on witha first mover that has captured most of the total available market where econ-omies of scale exist. Another exception is when a firm pursues a revolutionarystrategy and takes advantage of a technological innovation to move in, leap-frogging the first mover.
Size Effects Beyond Economies of Scale
A first mover that pursues the right strategies and captures as much of the totalavailable market as possible has another advantage beyond economies ofscale—size. A large firm buys more from its suppliers than its competitors and
First-mover Advantages/Disadvantages and Competitors’ Handicaps 147

in some cases, can command considerable bargaining power over its suppliers.For example, Wal-Mart’s size gave it a tremendous amount of power over itssuppliers in the mid-2000s.2 Power play or none, it is also easier for suppliers tocooperate with larger firms. For example, to have suppliers locate near a firm,the firm needs to buy large enough output from the supplier to make it worththe supplier’s investment in plants, equipment, and people to serve a customerat a particular location. A large firm can also afford to undertake more inno-vation projects, since it can spread its risk over more stable and less risky pro-jects. Such innovations can allow a first mover to keep any lead that it may haveattained.
Economic Rents and Equity
Before competitors move in, a first mover is effectively a monopolist and cancollect economic rents if it formulates and executes a profitable business model.If it captures most of the total available market and keeps growing fast, that firstmover’s market valuation (capitalization) may go up as investors anticipatepositive future cash flows from economic rents. Such money can serve the firstmover well, especially in cases where capital markets are not efficient enoughand therefore financing is not readily available to anyone who needs it. The firstmover can use the money to buy fledgling new entrants, make venture capitalinvestments, invest in more R&D, or acquire important complementary assets.If a first mover accumulates cash, a small new entrant is less likely to be temptedto start a price war, since the first mover has more cash to sustain losses.
The other side to a first mover earning economic rents is that these rents arelikely to attract potential new entrants who want a share of these profits. If thefirst mover has accumulated enough cash or has enough equity, it can establisha reputation for fighting or can take other measures such as forming alliances,joint ventures, and so on, to fend off attacks.
Network Externalities
As we saw in Chapter 5, a product (or technology) exhibits network external-ities if the more people that use the product or a compatible one, the moreuseful the product becomes to users. An example is an auction network such aseBay’s. The more registered users that eBay has in its community of registeredusers, the more valuable that the network becomes to each user. That is because,for example, the larger the network, the more that a potential buyer of anantique is likely to find the antique in the network, and the more that the sellerof an antique is likely to find a buyer in the network. More people wouldtherefore tend to gravitate towards larger networks rather than smaller ones.Therefore, if a first mover has preemptively captured much of the availablemarket for a product or technology that exhibits network externalities, cus-tomers are likely to gravitate towards its network or products, further increas-ing the number of users of its network or products. Thus a first mover that hasan initial lead can see that lead grow to an even larger lead. Products thatrequire complements such as computers also exhibit network externalitieseffects. That is because the more users who own a particular computer orcompatible one, the more software that will be developed for it. The more
148 Strengths and Weaknesses

software that there is for the particular computer or compatible one, the moreusers who will want the computer. Thus, a first mover that has a large installedbase of products that require complements is likely to see more users gravitatetowards its products, further increasing its installed base and attracting yetmore customers.
A large network size or installed base has several implications for the differ-ent components of a firm’s business model. First, since the larger a network, themore valuable it is to customers, a large proprietary network can be a differen-tiating factor for first movers. Second, rational potential new entrants knowthat if they were to enter, they would need a network as large as the first mover’sif they wanted to offer the same value to customers as the first mover. However,new customers tend to gravitate towards the larger network. Thus, a largeproprietary network acts as a barrier to entry for some potential new entrants.Again, this does not mean that no firms enter the industry. Some usually enterbut compete in niche markets or use technological changes and innovation tocompete against the first mover with the large network.3 Also, a large networkacts as a barrier to entry only when it is proprietary. If it is open, as was the casewith Wintel PC, barriers to entry are lower. Third, since, all else equal, cus-tomers would prefer a large network over a smaller one, customers within a firstmover’s network would prefer to stay within the larger network than move.Effectively, a large network constitutes switching costs for customers. Thus, afirst mover can dampen customer bargaining power by building in switchingcosts for customers in the form of a large proprietary network. Fourth, a largeproprietary network also reduces rivalry between the owner of the network andthose of smaller networks. That is because its larger network differentiates itfrom the smaller rivals. As we will see later in this book, other factors beyondsize sometimes also impact the value that customers perceive in a network.
Relationships with Coopetitors
In our discussion about first-mover advantages so far, we have treated suppliers,customers, buyers, rivals, and potential new entrants as competitors whose goalis to sap profits out of the first mover. Often, as we saw in Chapter 4, theseactors are more than just competitors. They are coopetitors—the firms withwhich one has to cooperate to create value and compete to appropriate it—andrelationships with them can be critical. A first mover has an opportunity tobuild relationships not only with coopetitors but also with institutions such asgovernment agencies or universities. Such relations can, among other things,help the collaborators to win a standard or dominant design.
Lead in Technology, Innovation, and Business Processes
A first mover often has an opportunity to establish leadership positions in busi-ness processes, technology, and organizational innovation. These leadershippositions can be manifested in the quality and levels of intellectual property,learning and culture that firms can integrate into their business models.
First-mover Advantages/Disadvantages and Competitors’ Handicaps 149

Intellectual Property
Innovations in business processes, technology and organizational processes canbe a source of advantage to firms and consequently, some firms try to protectthem using patents, copyrights, trademarks, or trade secrets. For many prod-ucts, patents do not offer their owners enough protection from imitation, sincethey can be circumvented. Copyrights and trademarks are not protected by thelaws of many countries and when they are protected by law, there is often littlemonitoring and enforcement of the law. Trade secrets often are revealedthrough employees who move to other firms or through reverse engineering ofproducts. Despite these often-cited shortcomings of intellectual property pro-tection, intellectual property often serves a useful purpose in the profitability ofa first mover’s business model. First, in some industries and countries, patentsand copyrights give their owners reasonable protection for a period of timeduring which they can collect monopoly rents from their invention or discovery.For example, one reason why many so-called blockbuster pharmaceutical drugssuch as Lipitor bring in such high amounts of revenues is because they enjoypatent protection during their patent lives. Once a drug’s patent protection runsout and generics can be introduced, revenues from such drugs can drop by asmuch as 86%.
Second, although many patents, copyrights, trademarks, and trade secretsmay not prevent entry, they can slow it down. Circumventing a patent, thoughless costly than developing an original patent, can still be costly to get it right, ifone ever does. Third, even when intellectual property protection does not pre-vent entry or slow it down, it can still be the source of revenues and profits. Thecase of Google and Overture is very illustrative of how intellectual property canbe used. Google developed a search engine that, using its PageRank algorithm,delivered some of the most relevant search results. To more optimally makemoney from its search capabilities, the company needed a better advertisingrevenue model than pop-up ads. Overture, formerly known as Goto.com, hadinvented and in July 2001, received a patent for a bid-for-placement mechan-ism—an ad-placement mechanism that allows advertisers to bid for the place-ment of ads next to or above search results.4 In August of 2004, Google andYahoo (which had bought Overture in July of 2003) settled the lawsuit for 2.7million shares of Google class A common shares.5 On June 28, 2006 the 2.7million shares were worth just over one billion dollars. Qualcomm’s case offersanother example. Most of the company’s profits come from the royalties on itspatents. Effectively, first movers can make money from their intellectual proper-ties even when followers enter their market spaces. Third, a first mover can useits intellectual property as bargaining chips for other important resources that itmay need to profit from its inventions or discoveries. For example, a startupthat invents a new product needs marketing, manufacturing, distribution, shelfspace, and other complementary assets so as to profit from the invention. It canuse its intellectual property as a bargaining chip to gain access to such comple-mentary assets. That is just what many biotech firms do.
150 Strengths and Weaknesses

Learning
In performing R&D, manufacturing, marketing, and other value-adding activ-ities, a first mover accumulates know-how and other knowledge. Althoughsome of this knowledge can spill over to potential competitors throughemployee mobility, informal know-how trading, reverse engineering, planttours, and research publication, first movers still do benefit from their accumu-lated learning in several ways. First, as suggested by the standard learning orexperience curve model, a firm’s production cost for a particular product dropsas a function of the cumulative number of units that the firm has produced sinceit started producing the product. Thus, to the extent that the knowledge isdifficult to diffuse or the firm can keep it proprietary, the firm can have a costadvantage over followers. This can reduce potential new entries since any newentrant would have to accumulate as much knowledge in order to bring its costsdown to those of the first mover. A firm can also use its accumulated knowledgeas a bargaining chip for complementary assets. The case of Pixar and Disneyillustrates this. Pixar was the first to move into the digital animation movietechnology and used its know-how to gain access to Disney’s brand name repu-tation in animation, storytelling, merchandising might, and its distributionchannels through an alliance that was beneficial to both firms.
Organizational Culture
An organization’s culture is the set of values, beliefs, and norms that are sharedby employees.6 Since a culture is embedded in a firm’s routines, actions, andhistory, it is often difficult to imitate and takes time to cultivate. Moving firstcan give a firm the valuable time that it needs to build the culture. Where cultureis valuable, difficult to imitate, and rare, it can be a source of competitiveadvantage.7 It can lower costs or allow a firm to be more innovative than itscompetitors, thereby differentiating its products. Southwest Airline’s culturewas often associated with its being the most profitable airline in the USA in the1990s and well into the 2000s. The company’s employees cared about eachother, were flexible in the types of job that they were willing to perform, andwere happy to work harder for longer hours than employees at competingairlines.
Preemption of Scarce Resources
A first mover often has the opportunity to acquire important scarce resources,thereby preempting rivals.
Complementary Assets
For many firms, moving first usually means the invention of a new product orthe introduction of a new technology. To profit from such an invention or newtechnology, a firm usually also needs complementary assets—all other assets,apart from those that underpin the invention or discovery, that the firm needs tooffer customers superior value and be in a position to appropriate the value.8
Recall that complementary assets include brand name reputation, distribution
First-mover Advantages/Disadvantages and Competitors’ Handicaps 151

channels, shelf space, manufacturing, marketing, relationships with coopeti-tors, complementary technologies, and so on. Thus, a firm that moves first hasthe opportunity to preempt rivals and acquire complementary assets. Once suchcritical resources are gone, there is not much that potential new entrants can do.For example, first movers Coke and Pepsi preempted most potential newentrants in the soda business by taking up most of the shelf space in stores forsodas. Preemption of complementary assets can constitute an important barrierto entry. Since complementary assets are critical to profiting from inventionsand new technologies, rational potential new entrants who know that theycannot obtain the necessary complementary assets are less likely to enter, orwhen they enter, they are likely to seek alliances with those that have the assets.Complementary assets such as brands can also differentiate a first mover’sproducts from those of followers.
Location
In many arenas, there is only so much room for so many competitors. Thus afirst mover that pursues the right strategies can preempt rivals by leaving littleroom for followers. Take geographic space, for example. At airports, there isusually a limited number of gates and landing slots. An airline that moves intoan airport early and introduces many flights can take up most of the gates andlanding slots, leaving followers to the airport with few gates and landing slots.When Wal-Mart entered the market in the Southwestern USA, it saturated con-tiguous towns with stores, leaving followers with very little space to build simi-lar stores.9 Effectively, it erected a barrier to entry since any potential newentrant who expected to enjoy the same costs benefits from economies of scaleas Wal-Mart would have to build as many stores and distribution centers; butdoing so would result in overcapacity and the threat of a price war. Such apotential threat of price wars would prevent rational potential new entrantsfrom entering. Establishing positions in geographic space does not have to bethrough saturation of contiguous locations, as Wal-Mart did. The first movercan establish the positions in such a way that occupying the interstices will beunprofitable for a follower.10 For example, good market research might allowthe first mover to pick out the more lucrative locations to occupy, leaving outthe less profitable ones for followers.
Location preemption can also take place in product space. First movers canintroduce many products with enough variation in attributes to cover thepotentially profitable product-attribute spaces, leaving very little or no so-called“white space”—potentially lucrative product space that others can occupy.Such a lack of white space can deter entry.
Input Factors
In some industries, first movers may be able to attract talented employees andwith the right incentives, retain them when followers enter. In some situations,moving first and performing the right research can provide superior informa-tion about resource needs and availability. Such information can enable a firstmover to purchase assets at market prices below those that will prevail asfollowers move in. (Note that the first mover can also profit from such superior
152 Strengths and Weaknesses

information by buying options for the assets where such markets exist.) Forexample, a mineral or oil company that goes to a developing country andexplores for mineral or oil deposits has superior information about the poten-tial of the country, compared to local officials or competitors that have not yetventured into the country. Such a firm can secure access to such deposits bysigning contracts with local officials. Access to superior information can alsohelp firms in structuring contracts with employees.
Plant and Equipment
If a firm builds a plant to produce a particular product and the plant cannot beprofitably used for any other purpose, the firm is said to have made an irrevers-ible investment in the plant. First movers who make irreversible investments inequipment, plants, or any other major asset, signal to potential followers thatthey are committed to maintaining higher output levels following entry by fol-lowers. That is because their plants and equipment cannot be profitably usedelsewhere and therefore managers are likely to keep producing so long as theprices that they charge are high enough to cover their variable costs. If followerswere to enter, such first movers could engage in price wars so long as their pricesare high enough to cover their variable costs. Effectively, irreversible invest-ments in plants and equipment can deter entry and can be a first-moveradvantage.
First-at-customers
Customers play a critical role in the profitability of a business model and beingthe first to reach customers can give a firm opportunities to attain first-moveradvantages. We explore three such potential advantages:
Switching Cost
A buyer’s switching costs are the costs that it incurs when it switches from onesupplier (firm) to another. These include the costs of training employees to dealwith the new supplier; the time and resources for locating, screening, and quali-fying new suppliers; and the cost of new equipment such as software to complywith the supplier. Switching costs can also arise from incompatibility of abuyer’s assets with the new supplier. For example, frequent flyer miles accumu-lated on one airline may not work on some other airlines. If buyers’ switchingcosts for a firm’s products are high, the buyers are less likely to switch toanother firm’s products. Potential new entrants who know that buyers will notswitch are less likely to try to enter. Rivals who know that buyers are less likelyto switch are less likely to try to win customers using lower prices. Thus, if afirst mover can build switching costs at buyers before followers move in, it canhave an advantage. It is important to note that while switching costs can pre-vent existing customers from switching to new firms, they usually have littleeffect on new customers who have no switching costs to worry about. Thus, ina growing market, followers can focus on new customers to increase theirmarket share.
First-mover Advantages/Disadvantages and Competitors’ Handicaps 153
Buyer Choice Under Uncertainty
The information that customers have about the benefits from some products isimperfect. Buyers of such products may therefore stay with the first brand thatmeets their needs satisfactorily.11 This is particularly true for experiencegoods—products or services whose characteristics are ascertained only afterconsumption, since it is difficult to observe the characteristics in advance. Forexample, because a drug’s efficacy and side effects can vary from patient topatient and cannot be determined in advance, doctors tend to stick with the firstdrug that works for their patients and will not change to a follower’s drugsunless there are compelling reasons. Such brand loyalty can be particularlystrong for low-cost convenience goods, where the search costs of findinganother product that meets a customer’s taste often exceed the benefits of chan-ging brands. (Convenience goods are products such as soaps and pasta that onepurchases frequently and with minimum effort.) The effect is less strong forsearch goods—products or services such as airplanes whose characteristics areeasy to evaluate objectively before purchase.
Brand Mindshare: Preemption of Consumer Perceptual Space
Research also suggests that pioneering brands can have a strong influence onconsumer preferences.12 In some cases, the first product introduced may actu-ally receive disproportionate attention in the press and in consumer’s minds. Acase in question is Viagra, which received lots of free press from unlikelysources such as TV comedians. A follower must have a superior product or haveto spend a lot more on building its brand to dislodge the first product.
First To Establish a System of Activities
One of the more durable first-mover advantages that a firm can have is adifficult-to-replicate system of activities. Why is a system of activities difficult toimitate? Although imitating some individual activities in such a system of activ-ities may be easy, imitating a whole system can be difficult, since it entailsimitating not only the components of the system but the interactions betweenthe components. The extent to which it can be difficult to imitate a system ofnew game activities is illustrated by the now familiar Dell example. Dell was thefirst major PC maker to pursue direct sales and build-to-order. It established asystem of activities to support this strategy that followers found difficult toimitate. In 1999, its CEO at the time, Kevin Rollins, was asked, “What is itabout the direct sales model and mass customization that has been difficult forcompetitors to replicate?”13 His response was:
It’s not as simple as having a direct sales force. It’s not as simple as justhaving mass customization in plant or manufacturing methodology. It’s awhole series of things in the value chain from the way we procure, the waywe develop product, the way we order and have inventory levels, and manu-facturer and service support. The entire value chain has to work together tomake it efficient and effective.
154 Strengths and Weaknesses

Those complex systems of activities can pose problems for potential imitators.As Rollins pointed out,
What is the competition looking at? So many of our competitors are reallylooking at our business and saying, “Oh, it’s the asset management model—seven days of inventory. That’s what we’re going to do,” rather than look-ing at every one of 10 things and replicating them.
And we may add that replicating the interactions between the ten things canalso be difficult to replicate.
First to Make Irreversible Commitments
First-mover advantages can change not only the likely expectations of follow-ers, they can also change their behavior. One goal of making irreversibleinvestments is to deter or slow down followers; but to have such an effect, theremust be something about the first mover that suggests that it is committed tothat particular first-mover advantage. For example, a first mover can establish areputation for retaliating against any firm that infringes on its intellectual prop-erty by suing anyone who attempts to violate its patents or copyrights. For acommitment to be effective in deterring or slowing down competitors, it mustbe credible, visible to competitors, and understandable.14 A commitment iscredible if there is something about it that makes competitors believe in it andthe options that it creates or limits. The primary drivers of credibility are repu-tation and irreversibility of the commitment. If a firm has a reputation forfighting the first set of followers that ventures into its product market space, it islikely to do so with the next set. Such a reputation for retaliation can deter likelyentrants. A commitment is irreversible if it is costly or difficult to walk awayfrom or undo. That would be the case, for example, if the assets that underpinthe commitment cannot be profitably redeployed elsewhere. The idea here isthat if a first mover’s commitment is irreversible, it is more likely to stay andfight followers rather than accommodate them or exit. Commitments such asphysical plants are visible to many people but others such as commitment to aculture are more difficult to observe. When commitments are not very visible,signals can be used to indicate their presence. Signals can also be used to helpcompetitors understand the nature of a firm’s commitments. Effectively, a firmthat moves first has the opportunity to make commitments that are credible,visible, and understandable. Doing so can deter or slow down followers.
It is important to emphasize the fact that first-mover advantages are notautomatically endowed on firms that move first. First-mover advantages are notthe birthright of firms that move first. They have to be earned.
Earning and Maintaining First-mover Advantages
Earning First-mover Advantages
A firm that performs an activity first is not automatically bestowed with first-mover advantages just because it was the first to perform the activity. Firmsusually have to earn first-mover advantages. In other words, the fact that a firm
First-mover Advantages/Disadvantages and Competitors’ Handicaps 155

is the first to introduce a new product does not mean that, for example, itautomatically captures most of the total available market thereby enabling it tobenefit from economies of scale, get large enough to take advantage of its size,earn profits from its pioneering activities, build and exploit a large installedbase, or cultivate important and useful relationships with coopetitors. Neitherdoes moving first mean that a firm automatically preempts the right resources/capabilities and builds switching costs at customers. Attaining these advantagesentails performing the value chain activities with the effectiveness and efficiencythat it takes to increase one’s chances of creating and capturing the most value.A firm also has to focus on the first-mover advantages that it wants, anticipateand respond to the reaction of followers, and pay attention to any opportunitiesand threats of its environment. In other words, attaining first-mover advantagesrequires good strategies. It may be easier to perform some of these activitiesbecause one has moved first, but one still has to perform them well.
Total Available Market Preemption
When a firm moves into a market first, the chances are that not all potentialcustomers are going to flock to its doors asking for its products. If the firmwants to capture as much of the total available market as possible, it has toperform the types of activities that locate as many customers as possible thathave a high willingness to pay, and whose acquisition and maintenance costsare low, and provide these customers with the types of benefits that they want.If customers do not get the benefits that they want, they may decide to waitfor followers or integrate vertically backward to provide their own needs. Afirst mover will maintain its market lead only if it has built a system of activ-ities to create and capture value, that is difficult to imitate, or has built valu-able scarce difficult-to-imitate resources/capabilities that followers cannotreplicate.
Lead in Technology and Innovation.
Being the first to introduce a new technology does not automatically endow afirm with intellectual property rights, stocks of knowledge, and the right organ-izational culture. These advantages have to be pursued correctly. A firm thatwants the advantages of intellectual property protection has not only actively topursue the intellectual property first, but also actively defend its property rightswhen attempts are made to violate them. One reason why it took AMD a longtime to catch up with Intel was because Intel was also good at defending thecopyrights for the microcode of its microprocessors.15 Learning is not automaticeither. A firm has to have the right structure, incentive systems, and processes tolearn well. Building a culture that is conducive to innovation also takes meticu-lous work that is not guaranteed just because one moved first.
Preemption of Scarce Resources
First movers are not automatically endowed with scarce resources. Wal-Martwas able to preempt much of the discount retail space in the SouthwesternUSA because of all the activities that it performed. If it had not saturated
156 Strengths and Weaknesses

contiguous small towns with discount stores, built matching distribution cen-ters, and established a Wal-Mart culture, it may have been easier for competi-tors to move in. If Ryanair had not ramped up flights to each of the secondaryairports into which it moved, established good relationships with local officials,and obtained as many gates and landing slots as possible, it might have beeneasier for other airlines to move into the same airports that it flew into. Topreempt scarce resources, a firm has to pursue them diligently.
First-at-Customers
The fact that a firm was the first to introduce a product does not mean that thefirm will reach all the right customers and build all the switching costs possible.The right customers have to be pursued with the right switching costs. Firmshave to pursue the right branding messages and so on.
First to Establish a System of Activities
The fact that a firm is first to perform a series of activities does not mean that thefirm will automatically be endowed with a system of activities that is difficult-to-imitate and that gives it a competitive advantage. The activities in the systemhave to be consistent with the positions that they underpin.16 For example, if afirm is a low-cost competitor, it cannot pursue the type of high-cost activitiesthat are usually pursued by firms that offer luxury goods. The activities shouldalso reinforce rather than neutralize each other’s effect. For example, if a firmtries to build a luxury brand through advertising but offers products that do notmatch the image that it is trying to create, it has a problem. The activities shouldbe consistent with the firm’s existing distinctive resources or those that it wantsto build. It would not make sense for Toyota to try to produce a new car thatdoes not use its lean manufacturing practices, unless it were experimenting withnewer and better processes. Finally, establishing the right system of activitiesmay also require that one takes advantage of industry value drivers. Recall thatindustry value drivers are those industry factors that stand to have a substantialimpact on the benefits (low-cost or differentiation) that customers want, andthe quality and number of such customers.
Which First-mover Advantages Should One Pursue?
The list of first-mover advantages that we have outlined is rather long. Thequestion is, which of them should a firm pursue? After all, not all first-moveradvantages are important to every firm. One way to narrow down the list tothose that make a significant contribution to value creation and appropriationis to use an AVAC analysis to rank order the advantages by the extent to whichthey contribute to value creation and appropriation. As shown in Table 6.2,each advantage is classified by answering the following questions:
1 Activities: Does the firm have what it takes to perform the activities to buildand exploit the first-mover advantage? What are these activities and how dothey contribute to value creation and capture?
2 Value: Does the first-mover advantage make a significant contribution
First-mover Advantages/Disadvantages and Competitors’ Handicaps 157

towards the value that customers perceive as unique compared to whatcompetitors offer?
3 Appropriability: Does the first-mover advantage make a significant contri-bution to profits?
4 Change: Does the first mover advantage take advantage of change to createand appropriate value?
As shown in Table 6.2, each first-mover advantage is classified by the potentialcompetitive consequence of pursuing the particular first-mover advantage, from“sustainable competitive advantage” down to “competitive disadvantage.” Themore that the strategic consequence from a first-mover advantage is a sustain-able strategic advantage rather than a strategic disadvantage, the more that afirm may want to pursue the first-mover advantage. In addition to telling a firmwhich first-mover advantage to pursue, the analysis can also point out whichNoes could be reversed to Yesses or dampened, and which Yesses should bestrengthened.
First-mover DisadvantagesThere are also disadvantages to moving first. These first-mover disadvantagesare also called follower advantages.17 Followers sometimes stand to benefitfrom free-riding on the spillovers from first movers’ investments, resolution of
Table 6.2 Rank Ordering First-mover Advantages
First-moveradvantage
Activities: Doesthe firm havewhat it takes toperform theactivities to buildand exploit thefirst-moveradvantage?
Value: Does the first-mover advantage makea significantcontribution towardsthe value thatcustomers perceive asunique compared towhat competitors offer?
Appropriability:Does the first-mover advantagemake a significantcontribution toprofits?
Change: Doesthe first-moveradvantage takeadvantage ofchange tocreate andappropriatevalue?
Strategicconsequence
Advantage 1 Yes Yes Yes Yes Sustainablecompetitiveadvantage
Advantage 2 Yes Yes Yes No Temporarycompetitiveadvantage
Advantage 3 Yes Yes No Yes Temporarycompetitiveadvantage
Advantage 4 Yes Yes No No Competitiveparity
Advantage 5 No/Yes No Yes No Competitiveparity
Advantage 6 No No No No Competitivedisadvantage
Strategicaction
What can a firm do to reinforce the Yesses and reverse or dampen the Noes, and what isthe impact of doing so?
158 Strengths and Weaknesses

technological and marketing uncertainty, changes in technology or customerneeds, and first-mover inertia.
Free-riding on First-mover’s Investments
First movers, especially those that pioneer new products, sometimes have toinvest heavily in R&D to develop the new product, in training employees forwhom the technology and market are new, in helping suppliers better under-stand what they should be supplying, in developing distribution channels, andin working with customers to help them discover their latent needs. Followerscan take advantage of the now available knowledge from first movers’ R&D,hire away some of the employees that the first mover trained, buy from sup-pliers who have a better idea about what it is that they should be supplying, useproven distribution channels and go after customers who may be willing toswitch or new ones who are waiting for a different version of the pioneer’sproduct. Effectively, a follower’s costs can be considerably lower than those ofthe first mover on whose investments the follower free rides. The fact that thesefree-riding opportunities exist does not mean that every follower can takeadvantage of them. Whether a follower is able to take advantage of theseopportunities is a function of the imitability of the first mover’s product and theextent to which the follower has the complementary assets for the product.18 Itis also a function of the business models that the first mover and followerpursue.
Resolution of Technological and Marketing Uncertainty
In some cases, first movers face lots of technological and marketing uncertaintythat must be resolved. This uncertainty is gradually resolved as the first moverworks with suppliers, customers, and complementors to better deliver whatcustomers want. For example, the emergence of a standard or dominant designcan drastically reduce the amount of uncertainty since firms do not have tomake major costly design changes and suppliers know better what to supply.Followers who enter after the emergence of a standard or dominant design, forexample, do not have to worry as much about what design to pursue or whethera market exists or not, as the pioneer did. Many PC makers such as Dell movedinto the PC business only after it had been proven that the technology andmarket were viable. Thus, when Dell entered the PC market, it had already beenproven that there was a market for business customers. All Dell had to do wasdecide to focus on the business customers. Whether followers can erode a firstmover’s competitive advantage depends on what the pioneer did when it movedfirst. A first mover that pursues the right strategies can win the standard ordominant design, and therefore have a say as to the extent to which followerscan profit from the standard or dominant design.
Changes in Technology or Customer Needs and First-moverInertia
Technological change or a shift in customer needs that requires a first mover tochange can give a follower an opening if the first mover’s inertia prevents it
First-mover Advantages/Disadvantages and Competitors’ Handicaps 159
from changing. For example, if a technological change makes it possible tointroduce a new product that potentially replaces a first mover’s product, thefirst mover is not likely to be in a rush to introduce the new product for fear ofcannibalizing its existing product.
Competitors’ HandicapsWhen a firm moves first and enjoys first mover advantages, it is because itscompetitors (present and potential) decided not to move first or to followimmediately. The question is, what is it about some firms that would make themnot move first or not move at all despite the potential first-mover advantages?Put differently, if there are so many advantages to moving first, the questions is,what is it about a first mover’s competitors that prevents them from movingfirst? We explore five factors that can prevent competitors from moving first orfollowing: competitors’ dominant logic, lack of strategic fit, prior commit-ments, resources and capabilities (or lack of them) (strengths and weaknesses),and the fear of cannibalization.
Dominant logic
Every manager has a set of beliefs, biases, and assumptions about the structureand conduct of the industry in which his or her firm operates, what markets herfirm should focus on, what the firm’s business model should be, whom to hire,who the firm’s competitors are, what technologies are best for the firm, and soon.19 This set of beliefs, biases, and assumptions is a manager’s managerial logicand defines the frame within which a manager is likely to approach manage-ment decisions. Managerial logic is at the core of a manager’s ability to search,filter, collect, evaluate, assimilate new information, and take decisions using thenewly acquired information.20 Depending on organizational values, norms, cul-ture, structure, systems, processes, business model, environment (industry andmacro), and how successful the firm has been, there usually emerges a dominantmanagerial logic—a common way of viewing how best to do business in thefirm. Also called mental map, managerial frame, genetic code, corporate genet-ics, and corporate mindset, dominant logic is very good for a firm that has beenperforming well so long as there are no major changes; that is, dominant man-agerial logic is usually a strength. In the face of an opportunity to take advan-tage of new information by pursuing a new game activity and thereby movingfirst to, say, offer a new product, a firm is likely to pass over such an opportun-ity if it lies outside its managers’ dominant logic—outside manager’s beliefs,biases, and assumptions about how best to do business. Thus, competitors’dominant logic may be one reason why a first mover and not its competitors isthe one that moves first. Competitors’ logic may prevent them from seeing thefirst-mover advantages and moving effectively to exploit them.
Strategic Fit
Competitors’ dominant logic may be such that they can understand the benefitsof moving first but management might still decide not to move first. That wouldbe the case, for example, if moving first does not fit the firm’s strategy. Exploit-
160 Strengths and Weaknesses

ers with valuable scarce complementary assets often pursue a so-called followerstrategy and wait for others to introduce a new product first. They then quicklyimitate the product and use their scarce complementary assets to overcome thefirst mover and profit from the first mover’s inventions. IBM pursued such afollower strategy in the 1970s, 1980s, and 1990s. It did not invent the personalcomputer but used its brand name reputation and installed base of customersand software developers to gain temporarily about 60% of the PC market sharebefore seeing that share drop dramatically and eventually getting out of themarket. It also waited until Apollo Computers and Sun Microsystems haddeveloped the computer workstation business before it entered and used itsinstalled base of customers and brand to quickly attain an important marketshare. As we saw in Chapter 5, the British music record company invented CATscans but GE and Siemens used their complementary assets to make most of theprofits from the invention.
Prior Commitments
Even if it is in the interest of a competitor to move first in performing the newgame activity or follow a first mover, the competitor may still be prevented fromtaking action because of prior commitments that it made in its earlier activities.We examine two types of commitment: relationship-related and sunk cost-related.
Relationship-related Commitments
Relationship-related commitments are commitments such as contracts, net-work relationships, alliances, joint ventures, agreements, understandings withinpolitical coalitions, and venture capital investments that involve more than oneparty. Sometimes, performing a new game activity requires a firm to get out ofor modify the terms of prior relationship-related commitments. If the new gameis not in the interest of the other party, the party might refuse to cooperate.Compaq’s case offers an interesting example. To follow Dell’s direct sales andbuild-to-order new game strategy, Compaq wanted to adopt a build-to-ordermodel and sell directly to customers, bypassing distributors. Citing previousagreements, distributors refused to cooperate and Compaq had drastically tomodify its proposed new business model.
Sunk Cost-related Commitments
In sunk cost-related commitments, a firm makes irreversible investments inplants, equipment, capacity, or other resources, sometimes to signal its com-mitment to stay in a market or a particular business. Irreversible investmentsare those investments whose costs are sunk, that is, investments whose costshave already been incurred and cannot be recovered.21 If performing a newgame activity requires resources that are different from a firm’s irreversibleinvestments but existing PMPs remain competitive, staying with one’s irrevers-ible investments, rather than investing in the new game activities, may appearto be the profitable thing to do. Why? For the incumbent, investing in thenew game activity requires new investments and this money must come from
First-mover Advantages/Disadvantages and Competitors’ Handicaps 161

somewhere else, since the firm’s existing investments are sunk and thereforetheir costs cannot be recovered and reinvested in the new game activity. Thus, ifthe firm pursues the new game activity, it must incur all the new costs. If it stayswith its existing activities, it does not have to spend any new money, since itsproducts from the sunk investments are still competitive. If products from thenew game activities improve at a faster rate than those from existing activities,there may come a time when customers start migrating to new game productsand the firm that stuck with the sunk investments will see its market shareeroded.
Resources and Capabilities
In some industries, performing a new game activity often requires distinctiveresources that competitors may not have. Developing a new microprocessor oroperating system can require billions of dollars and many very skilled engineers.These are scarce resources and capabilities that few firms have. Thus, competi-tors may not be able to compete with a first mover because they do not have theresources or capabilities needed to compete. For example, many countries can-not afford a car industry because they do not have what it takes to build and runone profitably. This is the old barriers to entry story.
Fear of Cannibalization
Firms are not likely to pursue a new game activity if to do so cannibalizes theirexisting products, especially if the new products have to be priced lower thanthe ones that they are cannibalizing. For a while, Sun Microsystems was noteager to introduce Linux Intel-based servers, since the latter costs less to buy,use, and service than Sun’s UNIX-based servers. Intel-based servers eventuallywon the battle.
MultigamesAs we first suggested in Chapter 1, a new game does not take place in isolation.Rather, each new game is usually preceded by, followed by, or is concurrentwith another game. Thus, a firm that wants to play a current game well mayhave to take into consideration the likely reaction of firms from the preceding,following, and concurrent games. Depending on the differences between thecurrent and preceding games, firms from a preceding game may find out thatsome of their strengths in the preceding game have become handicaps in thecurrent game. Firms that were not in the preceding game can take advantage ofsuch handicaps. However, many strengths from preceding games often remainstrengths. This is the case with many complementary assets. Firms that movefirst in the current game can build and take advantage of first-mover advan-tages. At the same time, these firms have to be aware of the fact that in thefollowing game some of their first-mover advantages as well as disadvantagesmay become handicaps. Thus, these firms may be better off anticipating thelikely reaction of players in the following game and responding accordinglyto them.
162 Strengths and Weaknesses

Types of Player: A FrameworkNot all the firms that pursue new games in any particular market move at thesame time. Nor do all players pursue the right new game strategies. Thus, wecan categorize players as a function of when they pursue new game strategiesand the extent to which they pursue the right strategies. Such a classification canhelp a firm understand where it stands strategically, relative to its competitorsin the face of a new game, as a first step towards understanding what it needs todo next. It can help an entrepreneur understand what strategic spaces might begood ones to pursue. The classification results in four types of player: explorers,superstars, exploiters, and me-toos (Figure 6.1).
Explorers
An explorer is a firm that moves first in performing a set of new game activitiesbut does so largely for the fun of it. It is more of an explorer than an exploiter.Its activities are driven, not so much by a clear strategy for creating andappropriating value, but by what it just happens to find itself doing or enjoysdoing. Explorers may pursue the activities more to make a difference than tomake money. They may also pursue the activity for knowledge’s own sake.They often create value or establish a foundation for creating value but do notappropriate it. They help reduce technological and market uncertainty and pavethe way for exploiters (see below) to come in and take advantage of the founda-tion for value creation and make money. Many inventors (firms and indi-viduals) fall into this category. AT&T which invented the transistor and inven-tors such as Tesla, are good examples. Another example is Xerox, which,through its Xerox Palo Alto Research Center, invented, among other things,
Figure 6.1 Types of Player.
First-mover Advantages/Disadvantages and Competitors’ Handicaps 163

laser printing, Ethernet, the personal computer graphical user interface (GUI)paradigm (or windows), and object-oriented programming, but never mademuch money from them. This is not to say that some explorers do not appropri-ate the value that they have created. Some do make money but the money doesnot come through a deliberate attempt to create and appropriate value.
Superstars
A superstar is a firm that moves first in pursuing a new game strategy anddiligently performs those activities that substantially improve its chances ofbuilding and exploiting first-mover advantages, countering first-mover dis-advantages, and taking advantage of competitors’ handicaps. Usually, a super-star has a clear strategy for how to create and appropriate value when it movesfirst. Like explorers, a superstar is interested in exploring new ways of creatingvalue; but unlike explorers, superstars are also genuinely and purposefullyinterested in exploitation—in creating and appropriating value. A superstarworks hard at performing new game activities and taking advantage of both thevalue chain and new game factors of its new game activities. It does the rightthings and does them right. With some luck, such a firm can not only gain acompetitive advantage, it can also change the structure of its industry to itsadvantage. It can become the superstar of its industry. Largely because thesuperstar has built the right first-mover advantages and is taking advantage ofthem, followers usually have a difficult time catching up with or leapfroggingthe superstar. Moreover, a superstar may also have countered potential first-mover disadvantages, and taken advantage of potential competitors’ handicaps.This does not mean that a superstar’s competitive advantage is forever. Merckwas a superstar when it performed the relevant R&D to discover and exploitMevacor, the first cholesterol drug from the group of cholesterol drugs calledstatins that would revolutionize cholesterol therapy. Wal-Mart was a superstarwhen it established its discount retailing operations in rural southwestern USA.Dell was a superstar when it established direct sales and build-to-order in thePC market. Ryanair was a superstar when it established its low-cost airlineactivities in the EU. Superstars usually make money, but not necessarily all thetime. Their deliberate pursuit of value creation and appropriation increasestheir chances compared to those of an explorer. However, because superstarsoften face the huge technological and marketing uncertainties associated withmoving first, they are not always likely to appropriate most of the value thatthey have created.
Exploiters
An exploiter is a follower that waits for explorers and superstars to move firstand reduce technological and market uncertainty, and then enters. An exploiterusually has or can quickly develop the ability to take advantage of first-moverdisadvantages better to create and/or appropriate value than first movers.Exploiters usually do not invent or discover anything but can make most of themoney from inventions or discoveries. They usually have complementaryassets—all the other assets, apart from those that underpin the inventions ordiscoveries, that firms need to create and appropriate value. Examples of
164 Strengths and Weaknesses

exploiters abound. General Electric and Siemens did not invent the CAT scanbut made most of the money from it. Coke and Pepsi did not invent diet orcaffeine-free cola but made most of the money from them. Microsoft did notinvent many of the products from which it makes money. iPod was not the firstMP3 player but dominated the market in 2007. Like superstars, exploiters haveclear strategies for creating and appropriating value. In doing so, however, theytake advantage of their complementary assets and ability to exploit first-moverdisadvantages. They usually know when to enter and what to do when theyenter. Some entrepreneurs see exploiters as an important part of their exit strat-egies, since they can sell themselves (and their technologies and ideas) to theexploiters for good money. Others see exploiters more as piranha.
Me-too
Me-too players are followers who have no clear strategy for taking advantageof first-mover disadvantages better to create and appropriate value than firstmovers. Many of them are incumbents who are forced to defend their competi-tive advantages from attacking first movers or exploiters but do not quite knowhow. Some are firms that take advantage of first-mover disadvantages to createor enter niche markets. In that case, they may have clear strategies for attackingthe niche in question but not for toppling first movers or exploiters. Manysuppliers of generic pharmaceuticals are me-too players.
Competition and Coopetition
It is important to note that the success of each player type depends on thecompetition that it faces. Superstars are less likely to shine brightly if they startexecuting their strategies at about the same time that other firms with morevaluable and scarce complementary assets enter the market. They are also lesslikely to do well if exploiters enter the market before the superstars have had achance to build first-mover advantages. If explorers are never challenged byexploiters or superstars, they may make money simply because they do not havestrong competitors. Exploiters are less likely to make money if they enter themarket at about the same time that other exploiters enter or enter after super-stars have had a chance to build first-mover advantages. Me-toos can do well ifthey enter niche markets and neither superstars nor exploiters bother to chal-lenge them. Effectively, the competition that a player faces plays an importantrole in the extent to which the player can make money.
A player’s performance may also depend on the extent to which it is betterable to cooperate with other players in creating and appropriating value. Anexplorer that is more capable of invention may team up with an exploiter thathas complementary assets in order to form a team with a better chance ofwinning than either player alone. Exploiters and superstars can also team up toexploit their complementary assets, especially if each player comes from a dif-ferent country that has something unique to offer.
First-mover Advantages/Disadvantages and Competitors’ Handicaps 165

Applications of the player-type framework
Although the player-type framework is very simple, it has some potentiallypowerful applications. It is versatile, and can be used to provide an elementarybut useful look at a firm’s new game strategies (1) for different products, (2) indifferent countries, and (3) over a time period.
Explore Different New Game Product Strategies
It is not unusual that, at any one time, one firm can be an exploiter for oneproduct, an explorer for another product, and a superstar or me-too for yetanother. Managers can use the player-type framework to explore the differentstrategies that underpin each of these products and make some decisions onwhat to improve. Figure 6.2 offers an example of how the framework can beapplied to a computer maker. In the year 2000, the company offered threeproducts: Laptops, servers, and MP3 players. Each circle in Figure 6.2 is pro-portional to sales revenues or profits at 2000 prices. The earlier a firm intro-duced a product before its next major competitor, the higher the circle. Themore that the firm was seen as having gotten the new game strategy for theproduct right, the more the circle would lie to the right. Thus, in both 2000 and2007, the firm was an explorer when it came to strategies for its laptops; but in2007, it behaved a little more like a superstar, since the laptop circle moved tothe right, (the firm was still an explorer). The strategy also appears to have paidoff since its 2007 revenues were higher than 2000 revenues. As far as serverswere concerned, the firm behaved as a superstar. Its revenues increased from2000 to 2007 as the firm appeared to have fine-tuned its strategy. Finally, thefirm appeared to have improved its strategy for MP3s from 2000 to 2007 as anexploiter but its revenues dropped. Why the drop? It is possible that competi-tion increased even as the firm improved its strategy. While very simple, thisanalysis is still a good starting point for a management discussion aboutwhether to continue offering all three products, focus on one or two, and if so,whether to still do so as a superstar, exploiter, or explorer, or maybe even as ame-too.
Performance of Different New Game Strategies in Different Countries
The framework can also be used to examine a multiproduct/service firm’s strat-egies in different countries or regions. Consider a firm that pursues differentstrategies in the EU, China, and the USA (Figure 6.3). Again, the area of thecircle is proportional to the revenues or profits that the firm earns in each regionin the period being explored. In the EU, the firm does well as an explorer and anexploiter, somewhat well as a me-too, but not so well as a superstar. Such a firmcould be a fast-food company such as McDonald’s or Kentucky Fried Chickenthat operates as an explorer in some countries where it is usually the first fast-food company in each of the locations where it opens its stores, an exploiter inothers, and so on. In China, the company acts as a superstar, exploiter, and me-too. It is more successful as an exploiter and me-too than as a superstar (eachhas a larger circle area than the me-too). The firm could also be a fast-foodcompany or a retailer that has different strategies for different regions of China.
166 Strengths and Weaknesses

Figure 6.2 Different New Game Product Strategies.
Figure 6.3 Player Types in Different Countries.
First-mover Advantages/Disadvantages and Competitors’ Handicaps 167

In the USA, the firm offers four different products, with each one reflecting adifferent player type. The firm does best as a superstar, followed by being anexploiter and then an explorer. Being me-too works the least. Such an analysiscan be a good starting point for whether to continue trying to be all things toeach country/region or focus on only being a superstar, explorer, exploiter, orme-too.
History of Firm’s New Game Strategies
In the third example, a firm can use the framework to explore where it has beenand how well it has performed as a superstar, explorer, exploiter, and me-too(Figure 6.4). Such a firm could be a pharmaceutical company that introduceddifferent drugs using different strategies. In the example, the firm started out inthe 1980s as an explorer and offered two products that did relatively well; butthe product for which the firm had more of a strategy than the other (the one tothe right in the explorer quadrant) had more revenues. In the 1990s, the firmdecided to try being a superstar and me-too in addition to being an explorer. Itsrevenues as a superstar were much higher than those as an explorer and me-too. In the 2000s, the firm had become an exploiter and was doing very well.This analysis is also a good starting point for managers to discuss what next forthe company. It suggests, for example, that the firm might want to continuebeing an exploiter, assuming that everything else—e.g. competition—remainsthe same. One other thing that the results suggest is that the firm mayhave been riding a technology life cycle. At the onset of such a cycle, the
Figure 6.4 A Firm’s Evolution from Explorer to Exploiter.
168 Strengths and Weaknesses

environment is usually more conducive to explorers and superstars. Asuncertainty unravels, exploiters and me-toos move in. We will have more to sayabout technology life cycles in a later chapter when we explore disruptivetechnologies.
First Movers Versus Followers: Some ConclusionsTo conclude this chapter, we return to the question that was posed at the begin-ning of the chapter: why is it that first movers sometimes go on to dominatetheir markets and at other times, followers are the ones that go on to dominatetheir markets? The answer to this question is a combination of the followingfive reasons:
1 First-mover advantages have to be earned and exploited diligently.2 The owner of scarce important complementary assets usually has an edge.3 First-mover disadvantages can be minimized.4 Competitive, macro, and global environments.5 Type of player and its business strategy.
First-mover Advantages have to be Earned and ExploitedDiligently
As we saw earlier, first-mover advantages are not automatically bestowed onwhoever moves first. They have not only to be built by pursuing the right newgame activities, they also have to be exploited by pursuing the right activities.If first movers do not diligently pursue and exploit first mover advantages, theyleave room for followers, especially exploiters, to come in and possibly domin-ate. For example, if a pharmaceutical company wants the benefits of patentprotection, it has to pursue the types of activity that will not only allow it todiscover something worth patenting but also to apply for and obtain thepatent in the right countries. Moreover, the firm also has to turn its patentsinto medicine that patients can take, since patents do not cure illnesses. Per-haps more importantly, to perform these activities effectively and efficientlyoften requires distinctive resource/capabilities that not all first movershave. For example, not all pharmaceutical companies have the R&D skills,knowledge base, and know-how to discover the types of compound that canbe patented.
Effectively, if a first mover cannot earn and exploit first-mover advantages—either because it did not know which activities to pursue or did not have orcould not build the necessary distinctive resources/capabilities—there is roomfor followers to come in and do well, especially followers that already have theright complementary assets or can build them quickly.
Owner of Scarce Important Complementary Assets has anEdge
To profit from a new game, a firm usually needs complementary assets. Thus, ifa firm moves first to invent or discover something, other firms that enter themarket later can make most of the profits from the invention or discovery if they
First-mover Advantages/Disadvantages and Competitors’ Handicaps 169

have scarce important complementary assets that the first mover does nothave. Effectively, whoever has scarce important complementary assets, be it afirst mover or follower, has a better chance of being the one to profit from anew game.
Can Minimize or Exploit First-mover Disadvantages
If a first mover is able to minimize the effects of first-mover disadvantages, it hasa better chance of doing well. If it does not, it leaves room for followers to takeadvantage of them. Take, for example, the fact that followers often can free rideon the first mover’s investments by taking advantage of the R&D knowledgegenerated by the first mover, hiring from the first mover, going after its cus-tomers, and so on. The first mover can reduce these negative effects by betterprotection of its intellectual property or by entering into the right agreementswith employees or customers. Such measures, coupled with first-mover advan-tages, may be able to give the first mover a better chance. If this is not possible, afollower can take advantage of first mover disadvantages. A follower can notonly free ride on first movers’ R&D, it can also take advantage of the reducedtechnological and marketing uncertainty as well as any changes in technologicalchange or customer needs that may have occurred since the first mover madecommitments as to which activities to perform.
The Competitive, Macro, and Global Environments
Whether the firm that goes on to dominate a market is a first mover or followeris also a function of its competitive environment—of its rivals, suppliers, cus-tomers, potential new entrants, and substitutes. For example, if the first moveris a new entrant that uses a disruptive technology to attack incumbents, there isa good chance that it will defeat incumbents. If the industry has plenty of whitespace in the market, first movers have more opportunities to create unique valuefor customers and build first-mover advantages than if they were in a morecrowded market space. A dominant buyer can force a firm to find secondsources for the products that the buyer buys, effectively neutralizing some of thefirm’s first-mover advantages. For example, in the 1970s and 1980s, IBM usu-ally required that chipmakers who supplied it with chips had to cooperate withat least one other chipmaker to help it also supply the same chips.
The extent to which some first-mover advantages amount to somethingdepends on the macroenvironment—on the political, economic, technological,social, and natural environments. For example, if the political/legal environ-ment in a country is such that there is no respect for intellectual property protec-tions, a first mover cannot rely on patents or copyrights as a first-mover advan-tage. This increases the chances that a follower can free ride on first movers’investments in R&D, manufacturing, and marketing. If the rate of techno-logical change is high, first movers’ commitments are more likely to make itdifficult for them to adjust to technological changes, allowing followers to havea better chance. In some countries, there are restrictions on how many firms canenter some industries. First movers in such industries are therefore more likelyto do well than very late followers.
170 Strengths and Weaknesses
Type of Player and Business Strategy
Whether a first mover or follower wins in the face of a new game is also afunction of whether the firm is pursuing the game as an explorer, superstar,exploiter, or me-too. Many exploiters prefer to wait until some other firms havemoved first and both technological and marketing uncertainties have been dras-tically reduced before they enter. Recall that an exploiter is a follower that waitsfor first movers to reduce technological and market uncertainty, and thenenters. Even if exploiters accidentally discover or invent something, they usuallystill wait until someone else has developed the invention further and tried tocommercialize it, thereby proving that there is a market for it. IBM and Micro-soft are good examples. Such firms usually have the right distinctive difficult-to-imitate complementary assets. They usually also develop the skills and know-how to quickly develop and commercialize a product once they decide thattechnological and market uncertainty have dropped enough for them to enter.And after pursuing such strategies for a long time, they may develop com-petences in excelling as followers. Thus, when exploiters face explorers, espe-cially in the face of changing technologies or consumer tastes, the former aremore likely to win than the first movers.
Similarly, superstars are usually at the forefront of inventions and pursuingthe right strategies to allow them to create and appropriate value. Recall that asuperstar is a firm that moves first in pursuing a new game and diligently per-forms those activities that substantially improve its chances of building andexploiting first-mover advantages, countering first-mover disadvantages, andtaking advantage of competitors’ handicaps. Superstars usually develop com-petences for moving first and pursing the types of strategy that give them a goodchance of doing well. Intel was a superstar when it invented the microprocessor,the EPROM memory device, and advanced its microprocessor technology at apioneering rate by introducing a newer generation of its microprocessors beforeunit sales of an older one had peaked. Superstars are particularly likely to dowell if they face only explorers or me-toos. One of the biggest problems forsuperstars is that they usually face huge technological and marketinguncertainty alone, while exploiters are waiting in the wings.
Explorers are also likely to have developed competences for creating value(e.g. inventing or discovering things) but not for appropriating it. Recall that anexplorer is a firm that moves first in performing a set of new game activities butdoes so largely for the fun of it, or because that’s what it just happens to bedoing. It is more of an explorer than an exploiter and therefore has no purpose-ful plan for building and exploiting first-mover advantages. That is not to saythat explorers do not have first-mover advantages. They sometimes stumble onfirst-mover advantages but miss out on many others that they could have builtand exploited. If there are many exploiters or superstars around, then anexplorer’s chances of doing well are decreased. Me-toos develop competencesfor pursuing niches and can do well if exploiters and superstars decide to leavesuch niches alone.
Effectively, if a firm’s strategy is predicated on its moving first and it hasdeveloped underpinning resources/capabilities to back it, it is likely to movefirst and go on to dominate its market. If its strategy is to be a follower and ithas the resources/capabilities to back it, it is likely to do well as a follower.
First-mover Advantages/Disadvantages and Competitors’ Handicaps 171

What Does this Mean for Managers?
In the face of a new game, a firm that moves first may want to:
1 Go through the list of first-mover advantages and disadvantages that weresummarized in Table 6.1, and note (catalog) the ones that are relevant forthe industry and markets in which the firm competes or intends to compete.
2 Screen the advantages to those that make (1) a significant contribution tovalue creation and appropriation, and (2) the firm is capable of efficientlyperforming the activities to build and exploit the advantage. An AVACanalysis can be used for this step.
3 Build and exploit the chosen first-mover advantages while anticipating andcountering any first-mover disadvantages.
A follower may want to:
1 Catalog the first-mover disadvantages and determine the extent to which ithas what it takes to exploit them.
2 Find out where the first mover was not able to build first-mover advantagesand take advantage of the holes left.
3 Look for where first-mover advantages may have become handicaps andexploit that. For example, a first mover may have made commitments tocoopetitors that it cannot get away from. Recall the case of Compaq andDell. Compaq was one of the first to preemptively take up positions with PCdistributors. When Dell (a follower) came along, distributors did not haveany more capacity to take on another PC maker. When Dell went direct, andCompaq wanted to follow suit, distributors would not let the latter get offthat easily.
Example 6.1: The Value of Efficient Exploitation of First-moverAdvantages
In 1997, the cholesterol drug Lipitor was granted FDA approval. This was oneyear earlier than expected, because of several measures that Warner Lambert, itsinventor, had taken. Table 6.3 shows a forecast of sales up to the expiration ofthe patent life of the drug in 2011. When a drug’s patent expires, the price of thedrug can drop by as much as 86% as a result of the introduction of genericversions. The number in parentheses in 2010 is the projected sales if the patentdid not expire. How much money did the firm save by obtaining FDA approvalone year earlier?
Solution to Example:
When a US firm obtains a patent for a drug, it is gaining a first-mover advan-tage, since the patent gives it intellectual property protection. However, theclock for the patent life starts running from the time the firm files for the patent.Thus, if a firm does not pursue the right activities for turning the discovery (forwhich the patent is granted) into an approved drug that customers want, thepatent life could expire without it making money. The more quickly a firm can
172 Strengths and Weaknesses

Tabl
e 6.
3Li
pito
r’s
Proj
ecte
d Sa
les
Year
1997
1998
1999
2000
2001
2002
2003
2004
2005
2006
2007
2008
2009
2010
Rev
enue
s ($
B) (1
997
FDA
)0.
92.
23.
44.
65.
66.
77.
78.
79.
710
.711
.712
.713
.72.
06(1
4.7)
Tabl
e 6.
4N
PVs
for
the
Diff
eren
t R
even
ue F
low
s
Year
1997
1998
1999
2000
2001
2002
2003
2004
2005
2006
2007
2008
2009
2010
Rev
enue
s (1
997
FDA
)0.
92.
23.
44.
65.
66.
77.
78.
79.
710
.711
.712
.713
.72.
06(1
4.7)
Rev
enue
s (1
998
FDA
)0.
92.
23.
44.
65.
66.
77.
78.
79.
710
.711
.712
.71.
92(1
3.7)
NPV
Rev
enue
s (1
997
FDA
) = $
44.5
bill
ion
NPV
Rev
enue
s (1
998
FDA
) = $
36.8
6

get the drug approved and to doctors and patients, the more time that it has toexercise its monopoly power before the patent life expires and generics move in.This example illustrates how much money can be at stake. In Table 6.4, two setsof sales numbers have been shown: sales generated when FDA approval wasgranted in 1997 and those generated if FDA approval had been one year laterin 1998.
The NPV of revenues in 1997, given that FDA approval was in 1997 is $44.5billion (Table 6.4). The NPV of revenues in 1997 dollars if the drug had beenapproved one year later is $36.86 (Table 6.4). Therefore, extra revenues earnedas a result of getting FDA approval one year earlier (in 1997 dollars) are $44.50billion − $36.86 billion = $7.64 billion. Thus, by performing the type of activ-ities that allowed Lipitor to be approved one year earlier, Warner Lambert stoodto make an extra $7.64 billion, in 1997 dollars, over the life of its patent.Effectively, Warner Lambert was better able to exploit its first-mover advan-tages as far as Lipitor was concerned.
Key Takeaways
• A first-mover advantage is a resource, capability, or product-market pos-ition that (1) a firm acquires by being the first to carry out an activity, and(2) gives the firm an advantage in creating and appropriating value. Inmoving first to pursue a new game strategy, a firm usually has an opportun-ity to build and take advantage of first-mover advantages.
First-mover Advantages include:
• Total available market preemption:
� Economies of scale� Size (beyond economies of scale) advantages� Economic rents and equity� Network externalities (installed base)� Relationships with coopetitors
• Lead in technology and innovation
� Intellectual property (patents, copyrights, trade secrets)� Learning� Organizational culture
• Preemption of scarce resources
� Complementary assets� Location� Input factors� Plant and equipment
• First-at-Buyers
� Buyer switching cost� Buyer choice under uncertainty� Brand (preemption of consumer perceptual space)
174 Strengths and Weaknesses

• First to establish system of activities
� Difficult-to-imitate or substitute system of activities
• First-to make irreversible commitments
Earning First-mover Advantages
• First-mover advantages are not automatically endowed on whoever movesfirst. They have to be earned, often by performing value creation andappropriation activities effectively and efficiently.
• Can use an AVAC analysis to narrow down the number of first-moveradvantages to the few that stand to make a significant contribution to thefirm’s competitive advantage.
• Moreover, first-mover advantages also have to be exploited to bemeaningful.
First-mover Disadvantages (followers’ advantages) include:
• Followers can free ride on first-mover’s investments.• Followers enter a market when technological and marketing uncertainties
have been considerably resolved.• Followers can also take advantage of changes in technology or customer
needs that have occurred since first movers moved. First movers may alsoface inertia.
Competitors’ Handicaps include:
• Competitors may have developed dominant managerial logics in the oldgame.
• The new game may not fit a competitor’s strategy.• It may be difficult for competitors to get away from prior commitments
made in the old game.• Competitors may not have the types of resources that are needed to play the
new game.• The fear of cannibalizing their existing products may prevent some firms
from moving first or from following a first mover.
Why is it that First Movers Sometimes Go On to Dominate their Markets and atOther Times, Followers are the Ones that Go On to Dominate their Markets?
Because of one or more of the following reasons:
• First-mover advantages have to be earned and exploited well. Thus, whenfirst movers (superstars and explorers) do not perform the types of activitythat will enable them to earn and exploit first-mover advantages, followers(exploiters and me-toos) have a chance to move in and do well.
• Followers may have critical complementary assets that first movers do not.• First-mover disadvantages can be minimized. Therefore, when first movers
(superstars and explorers) do not minimize first-mover disadvantages, fol-lowers have a chance to exploit them.
First-mover Advantages/Disadvantages and Competitors’ Handicaps 175

• Industry factors, such as the number of competitors in a market, may favorone type of firm over another. Whoever is favored—first mover or fol-lower—is likely to win.
• Macroenvironmental and global factors such as government regulationsmay favor first movers over followers, or followers over first movers.
• The type of player and business strategy of the player can also determinewhether a first mover or follower wins. In industries with very good exploit-ers, first movers’ chances are usually considerably reduced.
What Does All This Mean to Managers?
• In the face of a new game, a firm that moves first may want to:
� Catalog potential first-mover advantages and disadvantages, and notethe ones that are relevant for the industry and markets in which the firmcompetes or intends to compete.
� Screen the advantages to those that make (1) a significant contributionto value creation and appropriation, and (2) the firm is capable of effi-ciently performing the activities to build and exploit the advantage. AnAVAC analysis can be used for this step.
� Build and exploit the chosen first-mover advantages while anticipatingand countering any first-mover disadvantages.
• A follower may want to:
� Catalog the first-mover disadvantages and determine the extent towhich it has what it takes to exploit them.
� Find out where the first mover was not able to build first-mover advan-tages and take advantage of the holes left. Use AVAC.
� Look for where first-mover advantages may have become handicapsand exploit them.
Explorers, Superstars, Exploiters, and Me-toos
• Firms can be grouped as a function of when they pursue new game strat-egies and whether they pursue the right strategy or not:
� Explorers: move first but have no clear strategy for creating andappropriating value, for building and taking advantage of first-moveradvantages and disadvantages, and for exploiting competitors’handicaps.
� Superstars: move first and have a clear strategy for creating andappropriating value, for building and taking advantage of first-moveradvantages and disadvantages, and for exploiting competitors’handicaps.
� Exploiters: followers that use their complementary assets and otherresources/capabilities to take advantage of first movers’ disadvantagesand other opportunities to better create and appropriate value than firstmovers.
� Me-Toos: followers that, unlike exploiters, have no clear strategy forbeating first movers at their game. Are sometimes niche players.
176 Strengths and Weaknesses

Key Terms
Competitors’ handicapsDominant logicExploitersExplorersFirst-mover advantagesFirst-mover disadvantagesFollower’s advantageIrreversible commitmentsMe-toosSecond-mover advantagesSuperstarsSwitching costs
First-mover Advantages/Disadvantages and Competitors’ Handicaps 177

Implementing New GameStrategies
Reading this chapter should provide you with the conceptual and analyticaltools to:
• Understand the significance of new game strategy implementation.• Get introduced to the relationship between strategy, structure, systems,
people and environment (S3PE).• Understand some of the different roles that individuals can play during new
games.• Recall the definitions of functional, matrix, network and M-Form organiza-
tional structures.• Explore what structure, systems and people a firm may need in the face of a
regular, position-building, resource-building or revolutionary strategy.
IntroductionEvery new game strategy has to be executed well if its full potential is going tobe realized. Executing a new game strategy involves organizing people to carryout the set of new game activities—it is about who works for whom, how tomeasure and reward performance, how information should flow in the organ-ization, who to hire, what culture one would like to see develop and so on. Forexample, when Dell decided to pursue a build-to-order and direct sales strategy,it had to structure its organization to fit the new strategy, put in the rightsystems to measure and reward performance, hire the right people, and try tobuild the right culture. To perform all the activities that enabled it to providerelevant searches, and monetize them using a paid-listing revenue model,Google used an organizational structure that fit its informal tech culture,developed its own incentive systems, and hired the right type of technical andother personnel. Effectively, to execute its new game strategy successfully, afirm needs an organizational structure, systems, and people that reflect not onlythe strategy but also the environment in which it is being pursued. Strategyimplementation is about the relationships among the strategy, the structure ofthe organization that must execute the strategy, the systems and processes thatcomplement the structure, and the people that must carry out the tasks in thegiven environment. We explore some of these relationships using a strategy,structure, systems, people, and environment (S3PE) framework (Figure 7.1).1
Chapter 7

The S3PE FrameworkThe idea behind the S3PE framework is simple. Strategies are formulated andcarried out by people; and people do differ. Moreover, the tasks that peoplemust perform to execute a new game strategy vary from strategy to strategy.Therefore, not only do individuals need to perform different roles in the face ofa new game strategy; what they need to motivate them to be effective at per-forming the tasks differs from task to task, from individual to individual, indus-try to industry, and country to country. Therefore, the type of people that a firmhires, who reports to whom, how performance is measured and rewarded, andinformation systems needed, depend on the type of new game strategy andenvironment in which the firm operates.2 Effectively, some organizational struc-tures, systems/processes and people would be more suitable for some strategiesthan others, given the environments in which the strategies must be executed.The objective, in executing a new game strategy in a given environment, istherefore to find those structures, systems, and people that best fit the set ofactivities that a firm chooses to perform, how, where, and when it performsthem. We quickly explore each component of the S3PE framework before turn-ing to the impact of new games on them.
Figure 7.1 Strategy, Structure, Systems, People, and Environment (S3PE) Framework.
Implementing New Game Strategies 179

Strategy
Recall that a firm’s strategy is the set of activities that it performs to create andappropriate value. A firm’s structure, systems and people usually follow itsstrategy, although there may be cases where structure, systems and people drivestrategy; that is, the structure, systems, and people (S2P) part of a firm areusually dictated by the firm’s strategy.
Structure
While a firm’s strategy is about the set of activities that the firm performs tocreate and appropriate value, a firm’s structure tells us who reports to whomand who is responsible for which activities.3 An organizational structure hasthree primary goals. First, the structure of an organization should facilitatetimely information flows to the right people for decision-making while pre-venting the wrong people from getting the information. Second, an effectivestructure requires the ability to be able to joggle differentiation (in the organ-izational structure sense) and integration. A firm’s manufacturing and market-ing units are maintained as separate functions because each one necessarily hasto specialize in what it does in order to be both efficient and effective in carryingout its activities. Giving each unit the opportunity to specialize in what it doesso as to be the best at it, is what differentiation is about. However, to efficientlyand effectively develop and offer customers unique benefits, a firm’s differentfunctions often have to interact across functions; that is, the value creation andappropriation activities of a firm’s different functions must be integrated if it isgoing to perform well.4 Third, a final goal of an organizational structure is tocoordinate interactions between units to effect integration. A new productlaunch would be more effective if the product development and marketinggroups coordinated their activities—telling each other what they are doing,when and using information from each other as inputs.
Firms use variants of the following four organizational structures to effectdifferentiation, integration, and coordination: functional, multidivisional(M-form), matrix, and networked.
Functional Structure
In a functional structure, employees are organized by the function that theyperform in the organization, with employees in marketing or sales reporting tosupervisors or managers who are also in marketing or sales functions,employees in engineering and manufacturing reporting to supervisors or man-agers who are also in engineering and manufacturing, and so on. Formal report-ing and communications is primarily within each functional unit, usually upand down the organizational hierarchy. Each functional unit gets its directionsfrom corporate headquarters via the functional head. The functional organiza-tion has several advantages. First, since employees are organized by function,there is de facto division of labor that enables employees to acquire in-depthfunction-specific knowledge, skills, and know-how—to specialize in the func-tional tasks that differentiate the group from other functions. Second, sinceeach functional unit has people with similar knowledge and know-how that are
180 Strengths and Weaknesses

grouped together and may be located in the same physical location, they cancommunicate more often and are therefore more likely to develop in-depthknowledge of their functional area. The functional structure also has somedisadvantages. First, when tasks entail considerable coordination with otherfunctional units, a functional unit is likely to have subpar performance becauseof its limited knowledge of and lack of direct communication lines with otherunits. Second, the more specialized each functional unit, the more difficult itbecomes for headquarter’s management to know what is going on within eachfunction. This is compounded by the fact that the different functional units donot communicate directly with each other. Third, because of the differences intheir skills, experiences, and capabilities, functional departments may havegoals that are not consistent with cooperating with other functions.
M-form or Divisional Structure
In an M-form or multidivisional structure, employees are organized by divi-sions or business units rather than by function, as is the case with the functionalstructure.5 The divisions can be organized by the type of product that eachdivision offers (product line), by the type of customer, by the geographic scopethat the firm covers, or by the brand name that the firm offers. Authority in theM-form structure is decentralized to the divisions in contrast to the functionalstructure where authority is centralized at corporate headquarters. Each unitusually has profit-and-loss responsibility. The multidivisional structure has twomajor advantages. First, since each division has profit-and-loss responsibility,there is better accountability for the firm’s performance. Second, since man-agement responsibility is not as centralized as in the functional structure, man-agers in the M-form only need focus their attention on their division. This is amore manageable task since each manager is more likely to have the type of in-depth knowledge of his/her product line, brand, customer, or geographic scopethat they need to manage the business better. The major disadvantage of thedivisional structure is that firms may not be able to build as much in-depthknowledge of functional areas such as R&D as they would in a functionalstructure.
Matrix Structure
The goal of a matrix structure is to capture some of the benefits of both thefunctional and divisional structure. It is a type of hybrid structure betweenfunction and divisional, and therefore comes in many different forms. In oneform, individuals from different functional areas are assigned to a project, butrather than report only to a project or functional manager, each employeereports to both a functional and a project manager. The idea is to (1) have cross-functional coordination that is needed to carry out projects that require skillsand knowledge from different functional areas, (2) maintain some performanceaccountability at the project level, and (3) allow project members to keep inclose touch with their functional areas so as to benefit from intra-functionallearning, especially in industries where deep functional knowledge is important.The matrix structure has three major advantages. First, the structure capturessome of the benefits of both the functional and divisional structures. Second,
Implementing New Game Strategies 181
since employees have one foot in their functional areas and the other in theirproject group, they can bring the latest thinking from their functional areas tothe project and vice versa. Third, since the rate of change of technological ormarket knowledge is likely to vary from one function to another, employees canspend time on project management commensurate with the rate of change ofthe knowledge in their functional area. This can lead to more efficient use ofpersonnel. Fourth, some employees may be able to work on more than oneproject, thereby helping cross-pollinate not only functional knowledge but alsoproject knowledge. The matrix structure has some disadvantages. First, sincephysical colocation with fellow project members can be critical to projectperformance, and physical colocation with functional colleagues can also becritical to functional learning, employees in a matrix structure may have tophysically colocate in both their project and functional areas. This can be costlyand inefficient, since an employee cannot be physically present in two differentplaces at the same time. Second, since project members in the matrix organiza-tion have to report to both a functional and project manager, they may have tomanage two bosses at the same time. When there is a conflict, employees mayhave difficulties deciding where their allegiance falls—whether to the projectmanager or functional manager. Third, the matrix structure can be more costlythan the functional one since the structure requires some duplication of effort.For example, having both a functional and a project manager means one toomany managers. Finally, the matrix structure is still much less accountable thanthe divisional organization.
Network or Vir tual Structure
In the network or virtual structure, firms outsource all the major value-addingactivities of their value chains and coordinate the activities of their contractors.6
The emergence of this organizational form has been facilitated by advances intechnological innovation such as the Internet. In such a structure, the coordinat-ing firm contracts a market research firm to perform market research for aparticular product or idea, finds a design firm to design the product, buys thecomponents from suppliers, and finds another firm to manufacture the product.The network structure has several advantages. First, a firm can avoid makingmajor investments in assets, since it outsources all the major value-adding activ-ities of its value chain. Second, in industries with a high rate of technologicalchange that often renders existing capabilities obsolete, having a virtual struc-ture means that a firm does not have to worry about important assets beingrendered obsolete since it has not invested in any.7 Such a firm has the flexibilityto switch suppliers, or manufacturers, or distributors whenever it finds one thatcan exploit the new technology better. The network structure has two majordisadvantages. First, it is difficult to have a competitive advantage when onedoes not perform major value-adding activities. However, whether this is adisadvantage depends on the firm’s core competence. If a firm has a strongbrand or architectural capabilities that are valuable, scarce, and difficult toimitate, the firm may still be able to make money since it can offer customerssomething that competitors cannot. Second, contracting out all major activitiesdeprives a firm of the ability to learn more about creating value along thevalue chain.
182 Strengths and Weaknesses

Systems
Organizational structures are about who reports to whom and what activitiesthey perform, but say very little about how to keep employees motivated as theycarry out their assigned tasks and responsibilities in executing a strategy.8 Sys-tems are about the incentives, performance requirements and measures, andinformation flow and accountability mechanisms that facilitate the efficient andeffective execution of strategies. We can group systems into two: organizationalsystems/processes and information systems.
Organizational Systems/Processes
Organizational systems are about how the performance of individuals, groups,functional units, divisions, and organizations is sought, monitored, measured,and compensated. They include financial measures such as profits, marketshare, cash flows, gross profit margins, stock market price, return on invest-ment, earnings per share, return on equity, and economic value added (EVA).Organizational systems also include reward systems such as pay scales, profit-sharing, employee stock option plans (EOPs), bonuses, and nonfinancialrewards such as recognition with certificates or having one’s name engravedsomewhere on a product that one helped develop. Systems also include so-called processes. A firm’s processes are the “patterns of interaction, coordin-ation, communication, and decision making [that] employees use to transformresources into products and services of greater worth.”9 These patterns ofcommunication, interaction, coordination, and decision-making are a functionof the type of strategy, organizational structure, and incentive system in place.For example, in a process it called chemicalization, Sharp Corporation com-pulsorily transferred the top 3% of the scientists from each of its divisionalR&D groups between laboratories every three years. This process forced topscientists to interact with scientists in other laboratories, exchanging knowledgethat may not be easily transferred through memos or scientific publications.Even if the information could be transferred through journals, it may get toother Sharp scientists too late to give the company a competitive advantage.Being transferred was also a signal that a scientist was good—an importantreward in some scientists’ books. Moreover, visiting other laboratories gave theSharp scientists an opportunity to build social networks that could come inhandy later. Another example is “Google’s 20% rule,” the fact that at Google,employees were encouraged to spend 20% of their time on innovative projectsthat had very little or nothing to do with their officially assigned projects.Benchmarking, total quality control (TQM), re-engineering, and x-engineeringare also processes that firms have used to implement a new game strategy moreeffectively and efficiently.
Information Systems
Although a good organizational structure, coupled with the right organiza-tional systems, can result in a reasonable amount of internal information flow,information systems can also be used to facilitate the efficient flow of informa-tion to the right targets at the right times for decision-making. For discussion
Implementing New Game Strategies 183

purposes, we can group information flow systems into two: (1) the informationand communication technologies that allow electronic information to beexchanged and (2) the physical building layouts that facilitate in-person, some-times unplanned, interaction. Digital networks such as the Internet make itpossible for anyone anywhere in an organization anywhere in the world to haveaccess to some types of information anywhere within the organization.10 Forexample, during product development, information on the status of products,ideas for better products, and so on, are available to anyone anywhere in theworld with permission and access to the company’s Intranet. Information sys-tems can be used to supplement or complement information flows that takeplace by virtue of the structure of the organization.
Although a great deal of information can be exchanged electronically overthe Internet, some types of information still need in-person, face-to-face inter-action. For example, it is difficult to feel the aura and smell of a new car orpainting via the Internet. Moreover, chanced physical encounters can lead toideas that planned electronic encounters might not. Professor Tom Allen’sresearch suggests that the physical layout of buildings can play a significant rolein the amount of communication that takes place between people and thereforecan have a significant impact on innovation.11 Buildings that are designed tofacilitate physical in-person interaction can facilitate the flow of new ideas. Ifdifferent organizational units of a firm—e.g. marketing, R&D, and oper-ations—are located in the same physical space, eat in the same cafeteria, sharethe same bathrooms, and bump into each other often, they are more likely toexchange new ideas than if they were located in different buildings orregions. Effectively, the way a building is designed can facilitate or augment theintegration of different units and ideas that a good organizational structure issupposed to.
People
People are central to any strategy since they conceive of, formulate, and executestrategies. The extent to which a firm’s employees can thrive within its organ-izational structure, are motivated by the performance and reward systems thatit has put in place, or effectively use the information systems that it established,is a function of the firm’s organizational culture, resources and capabilities, andthe types of employee.
Culture
What is culture? Uttal and Fierman defined organizational culture as:
“a system of shared values (what is important) and beliefs (how thingswork) that interact with the organization’s people, organizational struc-tures, and systems to produce behavioral norms (the way we do thingsaround here).”12
Professor Schein of MIT also defined culture as:
“the pattern of basic assumptions that a given group has invented, dis-
184 Strengths and Weaknesses

covered, or developed in learning to cope with its problems of externaladaptation and internal integration, and that have worked well enough tobe considered valid, and, therefore, to be taught to new members as thecorrect way to perceive, think, and feel in relation to these problems.”13
A firm’s culture is critical to its ability to create and appropriate value.14 Basic-ally, people within an organizational structure and associated systems, developshared values (what is important) and beliefs (how things work). These sharedvalues and beliefs then influence who else is hired or stays in the organization,how it is reorganized and how the systems change or do not change. The resultsof these interactions are behavioral norms (the way we do things) which thendetermine how well a strategy is implemented or formulated. If the structure,systems, and people are just right, the norms can lead to a system of activitiesthat is difficult to imitate. One reason why Ryanair’s employees work 50%more than employees at other airlines for only 10% more pay and still likeworking there may be because of its culture. If it is not right, culture can be acompetitive disadvantage.
Resources and Capabilities
In Chapter 5, we argued that a portion of a firm’s resources and capabilitiesresides in the people within the firm and those with whom it has to interact.Thus an important part of the “people” component of the S2P E are theresources and capabilities that are embodied in people.
Types of People
Quite simply, not everyone is meant for every job. Nor is every reward systemgoing to motivate every employee. Thus, in executing a strategy, it is importantto get the right people to perform the right tasks. In the mid-2000s, Google’sadvertisements for new hires reflected its overt focus on hiring largely the math-ematically and intellectually gifted.15 However, when Southwest Airlines hiredpeople, it was more interested in their attitude than in their skills.
Environment
For two reasons, a firm’s structure, systems, and people (S2P) are also a functionof its competitive and macroenvironments. First, as we have seen on severaloccasions, a firm’s strategy is a function of the competitive forces that impingeon it as well as of the macroenvironment in which it creates and appropriatesvalue; and since structure, systems, and people (S2P) follow strategy, it must bethe case that a firm’s S2P also depend on its competitive and macroenviron-ments. Second, each of structure, systems and people depends on the environ-ment in its own right. For example, in fast-paced industries where technologiesand markets change rapidly, a firm needs to be able to maintain deep know-ledge of the technologies that underpin its products and of the markets that itmust serve. One good choice of structure in such fast-paced environments is amatrix structure, since it allows employees who are working on a project tohave one foot in the project group and another in their functional groups. In
Implementing New Game Strategies 185

countries where people’s identities are closely tied to the firms that employthem, employees may be more willing to do whatever it takes for their companyto win. Countries with well-educated workforces offer firms more opportun-ities to hire the types of employee that they need for high value-adding jobs.
S3PE in the Face of New GamesNew games have an impact on structure, systems, and people. We explore thisimpact and what a firm can do to improve its chances of doing well in the faceof the impact.
Impact on Structure, Systems, and People (S2P)
The impact of a new game on a firm’s structure, systems, and people (S2P) is afunction of the type of new game—of whether the new game is regular,position-building, resource-building, or revolutionary (Figure 7.2).
Regular New Game
In a regular new game, only incremental changes are made to existing resources/capabilities and product-market positions (PMPs). Moreover, these incrementalchanges in resources and positions build on existing ones. Therefore, in the faceof a regular game, any changes that incumbents have to make to their pregameresources and positions in a regular game are incremental. Since structure, sys-tems, and people follow strategy, any changes that need to be made to an
Figure 7.2 What Should a Firm Do?
186 Strengths and Weaknesses

incumbent’s structure, systems, and people (S2P) are also incremental. Takeculture, for example. Those incumbent values (what is important) and beliefs(how things work) and behavioral norms (the way we do things around here)that worked prior to the new game still work during the game. Incumbents’“patterns of interaction, coordination, communication, and decision making”are likely to still work. The introduction of diet cola was a regular new gameand both Coke’s and Pepsi’s S2P did not change when they introduced theproduct.
Revolutionary New Game
A revolutionary new game is the exact opposite of a regular new game. Theresources needed and the resulting PMPs are radically different from whatincumbents had prior to the game. Thus, the strategies that firms pursue in theface of the new game are likely to be radically different from those that incum-bents pursued prior to the new game. Since structure, systems, and people (S2P)follow strategy, we can expect to see some big changes in S2P. For example,because the changes are radical, a firm with a functional structure (with itsvertical flow of information) may have to migrate to a matrix or network organ-ization to accommodate the large intra- and interorganizational horizontalinformation flows that take place in the face of a radical innovation. Incumbentvalues (what is important), beliefs (how things work), and behavioral norms(the way we do things around here) that worked prior to the new game are notlikely to work during the new game. In fact, as we show later, these values,beliefs, and norms may become handicaps. Pregame processes—“patterns ofinteraction, coordination, communication, and decision making”—are alsolikely to be rendered useless and may become handicaps. Consider the case ofonline auctions, a revolutionary new game compared to offline auctions. Offlineauctions take place at a particular place and time, for a certain duration, and thenumber of items and of attendees are usually limited. The number of people thatattend the auction is important and location is king. Those who attend canusually touch and feel the product being auctioned. Online auctions go on 24-hours a day and anyone from anywhere in the world can bid for objects whichcan be delivered after the sale is made. The size and character of the network ofsellers and buyers are king. An organizational structure for running an offlineauction company that operates various sites in a country is likely to have elem-ents of the M-form structure with units that focus on one or more locationswhere auctions take place. By contrast, location is not central to an onlineauction. Thus, an online auction firm may use the M-form organization butwith each unit focusing on a product or service category such as collectibles,antiques, and automobiles, rather than location. It may also use a networkorganization.
What is important to an offline auction firm revolves around the locationwhere the auctions take place while for an online auction firm, what is import-ant revolves around the number of users that can visit a website to buy or sell,and a reduction in the level of fraud. The norms (the way we do things aroundhere) that arise from interactions in an offline firm are likely to be very differentfrom those at its online counterpart; so are the processes—“patterns ofinteraction, coordination, communication, and decision making.” Effectively,
Implementing New Game Strategies 187

pregame S2Ps that are often rendered obsolete can become handicaps in the faceof some revolutionary games.
Position-building New Game
In a position-building new game, the new product replaces existing productsand/or the firm’s position vis-à-vis coopetitors is radically different from thepregame position. If the market addressed by the new game is the same as thepregame market, an incumbent’s S2P may not have to change that much. Forexample, when Intel introduced the Pentium that replaced the 486, it did nothave to restructure its organization to better address the PC market in which thePentium was replacing the 486s. However, if the market is different, someimportant elements of S2P may have to change. The PC used the same technol-ogy as minicomputers but in addition to addressing the minicomputer market,it also addressed the home computer market. The market for consumers wasvery different from the business market that minicomputers had addressedbefore the PC. Clearly, selling to this new market required something differentfrom incumbents’ sales norms. IBM created a separate unit to develop andsell the PC.
Resource-building New Game
In a resource-building new game, the resources/capabilities that a player needsto play the game are radically different from pregame resources/capabilities butexisting products can still compete in the new game. Thus, as far as the activitiesfor building products are concerned, S2P requirements should be similar tothose for revolutionary games—they are likely to require changes in structure,systems, and people. Take the example of an electric razor, which requires aradically different technology from that for mechanical razors. A firm that hasbeen supplying mechanical razors but wants to enter the electric razor marketmay need a unit or units that reflect the fact that the design, development, andmanufacturing for electric razors are very different from those for their mechan-ical counterparts.
Roles that People Play During Innovation
Given the impact of new games on a firm’s structure, systems, and people (S2P),the question becomes, what should a firm do in the face of new games as far asstructures, systems, and people are concerned? Before we explore this question,it is important to describe quickly what the literature on innovation says aboutthe roles that people can play in the face of an innovation to better exploit it.
Top Management Team and Dominant Managerial Logic
Each manager brings to every new game a set of beliefs, biases, and assumptionsabout the new game, the market that his/her firm serves, whom to hire, whattechnologies the game needs, who the other players in the game are, and what ittakes to create and appropriate value in the game.16 These beliefs, assumptions,and biases are a manager’s managerial logic. They define the mental frame or
188 Strengths and Weaknesses

model within which a manager is likely to approach decision-making.17
Depending on the new game, a firm’s strategy, structure, systems, processes,values, norms, and how successful it has been, there usually emerges a domin-ant managerial logic, a common way of viewing how best to create andappropriate value in the firm.18 Dominant managerial logic is usually good for afirm that has the right strategy and has taken the right measures to implement it.However, during new games in which a new strategy, structure, systems, pro-cesses, values, or norms are needed, pregame dominant managerial logic thathad worked so well can become a handicap. Managers may be stuck in the oldvalues (what was important), and old beliefs (how things worked), andbehavioral norms (the way we did things around here), and not be able to moveinto the new values (what is important in the new game), new beliefs (howthings should work in the new game), and behavioral norms (the way we shouldbe doing things around here now).
Champions
Formulating and implementing a strategy to win in a new game usually requiresa champion. A champion for a new game strategy is someone who articulates avision of what the strategy is all about, and what’s in it for the firm andemployees who are engaged in formulating and implementing the strategy.19 Byevangelically articulating a captivating vision of the potential of the strategy tothe different players, a champion can help other employees to understand therationale behind the strategy, especially how value will be created andappropriated, thereby motivating and inspiring the same employees who willimplement the strategy. A firm often has also to champion the strategy to itscoopetitors—the other players in the new game. In fact, in many revolutionaryand position-building games, a firm has to articulate a vision of a new productto customers and help them discover their latent need for the product. SteveJobs is usually a great champion for Apple’s products.
Sponsors
A sponsor of a new game strategy or innovation is a senior-level manager whoprovides behind-the-scenes support for it.20 This senior-level manager is like thegodfather who protects the new product or new game strategy from politicalenemies. By acting as a sponsor, the top manager is also sending a signal topolitical foes of the new game strategy or product, that they would face thewrath of a senior manager and sponsor. In so doing, a sponsor is also sending amessage to the champion and other key individuals who are working on thestrategy that they have the support of a senior manager. In some cases, thechampion is also the sponsor. Steve Jobs plays both the role of champion andsponsor for some key products.
Gatekeeper and Boundary Spanners
In many firms, especially those with functional organizational structures, eachemployee is likely to have deep knowledge of his/her unit and little or no know-ledge of the other units. Moreover, each unit may have its own culture,
Implementing New Game Strategies 189

language, needs, and history that have an effect on the information that the unitcan or cannot share. For example, an R&D department may have its ownacronyms, scientific jargon, and culture that marketing and manufacturing donot understand. Marketing and manufacturing may see R&D scientists assnobs that live in an ivory tower. Boundary spanners are individuals that spanthe “hole” between two units within a firm, acting as a transducer for informa-tion between units. They take information from one department and translate itinto what people in another department can understand.21 They understand theidiosyncrasies of their units and those of other units and can take unit-specificquestions, translate them into a language that other departments can under-stand, obtain answers, and translate them into something that their home unitscan understand. While boundary spanners span the holes between units withinthe same firm, gatekeepers span the holes between different companies.
Project Manager
If a new game strategy entails developing a new product, project managers canplay important roles. Project managers are responsible for plotting out whoshould do what and when so as to complete a project that meets or exceedsrequirements. A project manager is to meeting schedules what a champion is toarticulating a vision of the potential of a strategy. He or she is the centralnervous system of information that has to do with who is supposed to do whatand when and what has been done so far, its cost, and so on. Project managershave been classified as heavyweight or lightweight based on the managers’ spanof control.22 A heavyweight project manager is one with extensive authorityand responsibility for the project from concept creation through design tomanufacturing to marketing and making money, including the project’sbudget.23 A lightweight project manager’s authority and responsibilities are notas extensive as those of the heavyweight project manager—his or her authorityis usually limited largely to engineering functions with no authority orresponsibility over concept creation and other market-related aspects of theproduct such as budgeting. Professors Kim Clark and Takahira Fujimoto foundthat the use of heavyweight project managers helped to reduce product devel-opment lead times, total engineering hours (and therefore cost), and improveddesign quality for Japanese automobile companies.24
What Should Firms Do About Their Structures, Systems, andPeople?
Now we can return to our question: given the impact of new games on a firm’sstructure, systems, and people (S2P), what should a firm do in the face of newgames as far as structures, systems, and people are concerned? What a firm doesdepends on (1) which of the components of its pregame S2P are strengths orhandicaps in the face of the new game, (2) the type of new game—whether thenew game is regular, position-building, resource-building, or revolutionary.
190 Strengths and Weaknesses

Which PreGame S2P Components are Strengths or Handicaps?
Every player in a new game brings to the game some components of its S2P—values, beliefs, norms, information systems, performance measures, patterns ofinteraction, communications and coordination, and reward systems, and func-tional, matrix, network, or M-Form structure—from its pregame era that canbe strengths or handicaps in the new game. For example, a firm’s culture(values, beliefs, and norms) can be strengths in the face of certain new gamesbut become a handicap in the face of other games. To determine which com-ponents of a firm’s S2P become a handicap and which ones remain or becomestrengths, we use the same framework that we used in Chapter 5 to determinewhich of a firm’s pregame strengths become handicaps or remain strengths(Table 7.1). Whether a component of an S2P is a strength or handicap in a newgame depends on whether the component is vital to the new game, and whetherthe component is separable (Table 7.1). A component is vital to a new game if itcontributes significantly to value creation and appropriation. It is separable ifthe firm has no problems taking the component away from the old game for usein the new game, sharing the component, or leaving the component behindwhen it is more likely to hurt in the new game than help.
Consider Component 1 in Table 7.1. It is vital in the new game and the firmcan use it in the new game because nothing from its past prevents it from doingso. Thus the component is a strength for the firm in the face of the new game.For example, if a firm’s pregame norms (they way we did things around here)are the same kinds of norms that the new game requires, the norms are astrength. The way makers of diet cola advertised the drink when it was firstintroduced was very similar to the way regular cola had been advertised. Thus,when Coke introduced its diet cola, the advertising norms needed effectively toadvertise the drink used the same norms as before the introduction. Thus itspregame strengths constituted a new game strength for the firm.
Component 4 is the exact opposite of Component 1. The component is use-less to the firm in pursuing the new game but unfortunately for the firm, itcannot separate itself from the resource and move on. Component 4 is thereforea handicap. Again, take the example of a norm. If the new game calls for doingthings differently, but a firm is still stuck in its old norms (the way we used to dothings) and cannot move on to the new way of doing things, the old norms arelikely to become handicaps, since it is difficult for a firm quickly to get rid of itsnorms and acquire new ones. Handicaps can not only prevent a firm from
Table 7.1 Is an S2P Component from a Previous Game a Strength or Handicap in a NewGame?
S2P component Is the resource vital in thenew game?
Is separability possible? In the new game, thecomponent is a:
Component 1 Y Y strength
Component 2 Y N potential strength
Component 3 N Y question mark
Component 4 N N handicap
Implementing New Game Strategies 191

playing a new game well, they can prevent a firm from entering the game. As weargued in Chapter 6, a firm’s dominant managerial logic is a good example. Inthe face of some types of change, a firm’s dominant managerial logic canbecome a handicap. For example, some executives who had been hired from oldmedia such as TV and magazines to help with advertising on websites may havebeen prevented from understanding new business models, such as paid listings,because they were blinded by the old media logic of capturing the attention ofviewers and retaining it long enough to advertise to them. Such a logic wouldnot work when the activity being monetized is conducting a search on theInternet. Surfers usually want to perform a search quickly and move on. Paidlistings work very well for such surfers since they can quickly perform thesearch and move on, for example, to make purchases or do something thatmight interest advertisers. The belief that to advertise, one’s audience must beable to spend lots of time on one’s medium may have prevented some old mediaexecutives from inventing paid listings.
Component 2 is important in the new game but because of prior commit-ments, agreements, or other inseparability, the firm cannot use it in the newgame. The component is therefore a potential strength since, with work, itcould become separable. For example, a firm may have the right systems andprocesses to get a new product designed, built, and manufactured but the fear ofcannibalizing existing products may prevent the firm from using the systemsand processes. Component 3 is not important in the new game and the firm canget away from it. It is therefore neither a strength nor a handicap. It is a ques-tion mark.
Type of New Game
What a firm does in the face of a new game, as far as its S2P is concerned, alsodepends on the type of new game—it depends on whether the new game isregular, position-building, resource-building, or revolutionary (Figure 7.2).Since any changes that need to be made to an incumbent’s S2P in the face of aregular new game are incremental, incumbent firms can keep their pregame S2Por build on them. Effectively, pregame S2Ps are strengths in the face of a regularnew game. If the new game is revolutionary, a firm may want to use an autono-mous unit that has its own structure, systems, and people. Why an autonomousunit? As we saw above, pregame values (what was important before the newgame), beliefs (how things worked), and behavioral norms (the way we didthings around here) are not likely to work in the face of a revolutionary newgame; and since it takes time to change values, beliefs, and behavioral norms, ifthey can be changed at all, maintaining the same S2P is not likely to help. Anautonomous unit with its own structure, systems, and people can more quicklybuild the types of values, beliefs, and norms that are needed to successfullycreate and appropriate value in the face of a revolutionary game. Moreover,having an autonomous unit prevents elements of the pregame S2P from handi-capping the efforts of the unit. Effectively, pregame S2Ps can be handicaps in theface of revolutionary new games and should be avoided using an autonomousunit. In addition to creating an autonomous unit, a firm that is playing a revo-lutionary game may also want to use champions, sponsors, and gatekeepers.The existence of a sponsor reminds upper level management that the autono-
192 Strengths and Weaknesses

mous unit is important and no one should think of messing with it. Since thingsare usually in a state of flux early in the life of a revolutionary game, a championcan help articulate a vision of what the game is all about and what needs to bedone to win. Gatekeepers act as transducers between the autonomous unit andthe rest of the firm as well as outside organizations.
If the new game is a position-building game, a firm can use a market-targeting project unit whose primary responsibility is to make sure that theneeds of the market are incorporated into the new product on time. Such afocus on the market is particularly important if the market for the product isnew. Why not use an autonomous unit? Since the product in the new gamemust still be built using pregame technological resources/capabilities, using anautonomous unit would mean moving the resources//capabilities to the newunit or duplicating them, either one of which can be very costly. In otherwords, in the face of a position-building new game, resource-related S2Ps arestrengths that could be useful in the new game and forgoing such strengths canbe costly. The case of IBM and the PC illustrates this. When IBM decided toenter the PC market, it formed an autonomous group to design, manufacture,and market the product. Because the PC group was autonomous, it decided touse an Intel microprocessor and a Microsoft operating system when otherunits at IBM could have used their existing computer resources to quicklybuild the two components. Effectively, IBM missed out on the two com-ponents of the Wintel world that appropriate the most value created. However,by not using an autonomous unit, a firm runs the risk of being handicapped byold market-targeting values, beliefs, and norms. These handicaps can be iden-tified as we showed above, and avoided. To complement the project unit, afirm also needs sponsors, champions, and boundary spanners. A sponsorwould signal to all units that the program is important and therefore theproject unit can get the support that it needs. A champion would articulate thebenefits of the project for the different units that must corporate with theproject group. Boundary spanners would span the hole between the projectunit and other units.
If the new game is a resource-building game, a firm can use a product-targeting project unit whose activities are geared towards building the newresources/capabilities and using them to build the new product. As is the casewith position-building games, there are advantages and disadvantages to usinga project unit rather than an autonomous unit. By using a project unit, a firmcan more easily take advantage of marketing and other buyer-focused capabil-ities than using an autonomous unit since in a resource-building game, the PMPdoes not change much. At the same time, by not using an autonomous unit, afirm risks being handicapped by the values, beliefs, and norms from theresources that are being displaced. These handicaps can also be identified. Thetask could also be crowdsourced.
Key Takeaways
• A new game strategy is not likely to attain its full potential unless it iswell implemented. Implementing a new game strategy is about getting therelationships among strategy, structure, systems, people, and environ-ment right. To execute its new game strategy successfully, a firm needs an
Implementing New Game Strategies 193

organizational structure, systems, and people (S2P) that reflect not only thestrategy but also the environment in which the strategy is being pursued.
• An organizational structure is about who reports to whom and performswhat activities when. It has three primary goals:
� An organizational structure should facilitate timely information flowsto the right people for decision-making while preventing the wrongpeople from getting the information.
� An effective structure requires the ability to be able to joggle differen-tiation (in the organizational structure sense) and integration.
� An effective organization should help coordinate interactions betweenunits to effect integration.
• Firms use variants of the following four organizational structures to effectdifferentiation, integration, and coordination: functional, multidivisional(M-form), matrix, and networked structures.
• Systems are about the incentives, performance requirements and measures,and information flow and accountability mechanisms that facilitate the effi-cient and effective execution of strategies. They are about what it takes tomotivate employees.
• The extent to which a firm’s employees thrive within its organizationalstructure, is motivated by the performance and reward systems that it hasput in place, or effectively used the information systems that it established isa function of the firm’s organizational culture, and the types of employee.
• Culture is “a system of shared values (what is important) and beliefs (howthings work) that interact with the organization’s people, organizationalstructures, and systems to produce behavioral norms (the way we do thingsaround here).”25
• Since structure, systems, and people follow strategy, and strategy is a func-tion of the environment, it must be the case that structure, systems, andpeople are a function of the environment.
• The impact of a new game on a structure, systems, and people (S2P) is afunction of the type of new game—it is a function of whether the new gameis regular, position-building, resource-building, or revolutionary
� If the new game is regular, the S2P needed is about the same as the onebefore the game, or an enhanced version of it.
� If the new game is revolutionary, the S2P required is likely to be radicallydifferent from existing ones.
� If the new game is position-building, the market-targeting S2P of thenew game is likely to be radically different from the pregame one.
� If the new game is resource-building, the product-targeting S2P of thenew game is likely to be radically different from the pregame one.
• During innovation or a new game, people play different important roles.
� Top management plays the leadership role but the dominant manage-ment logic that is a strength when there is no major change can becomea handicap in the face of revolutionary, position-building, or resource-building new game.
� A champion for a new game strategy is someone who articulates a
194 Strengths and Weaknesses

vision of what the strategy is all about, what’s in it for the firm andemployees who are engaged in formulating and implementing thestrategy.
� A sponsor of a new game strategy or innovation is a senior-level man-ager or godfather who provides behind-the-scenes support for it.
� Boundary spanners are individuals who span the “hole” between twounits within a firm, acting as a transducer for information betweenunits.
� Gatekeepers span the holes between different companies.� Project managers are responsible for plotting out who should do what
and when so as to complete a project that meets or exceedsrequirements.
• What a firm does in the face of a new game as far as its structure, systemsand people (S2P) are concerned depends on (1) whether the firm’s pregameS2P is a strength or handicap in the face of the new game, (2) the type of newgame being pursued:
� In the face of a regular new game, an incumbent is better off keeping itspregame S2P.
� In the face of a revolutionary new game, a firm may be better off creat-ing an autonomous unit to be used to pursue the new game.
� If the new game is position-building, a firm may want to create amarket-targeting project unit.
� If the new game is resource-building, the firm may be better off creatinga product-targeting project unit.
Key Terms
ChampionsCoordinationCultureDifferentiation (in the organizational structure sense)Dominant managerial logicFunctional structureMatrix structureM-form structureMultidivisional structureNetwork structureOrganizational systemsProcessesProject managersS3PE frameworkSponsors
Implementing New Game Strategies 195


Opportunities andThreats
Chapter 8: Disruptive Technologies as New Games
Chapter 9: Globalization and New Games
Chapter 10: New Game Environments and the Roleof Governments
Chapter 11: Coopetition and Game Theory
Part III


Disruptive Technologies as NewGames
Reading this chapter should provide you with the conceptual and analyticaltools to:
• Explain what disruptive technologies are all about.• Understand what makes some technologies more disruptive than others and
why that matters.• Explain how incumbents can tell when to expect new technologies to erode
their competitive advantages.• Explain why incumbents, even very successful ones, often lose out to
attackers that use disruptive technologies.• Offer incumbents and new entrants advice on what to do in the face of
disruptive technologies.
IntroductionIn 2008, millions of people could make free high-quality international phonecalls, something that had been unheard of only a decade earlier. One majorreason for these free calls was voice over Internet protocol (VOIP) technology—a technology for routing phone calls over free Internet networks. VOIP threat-ened the very future of the telephone business as the traditional phone com-panies had come to know it. To many of these traditional phone companies,VOIP represented a threat. To new startups such as Skype, VOIP was a greatopportunity. This phenomenon in which existing business models are threat-ened and often rendered obsolete by a new technology is nothing new. Electricrefrigerators replaced kerosene refrigerators which had replaced hauled ice as ameans of keeping foods and medicines cold. PCs replaced mainframe and mini-computers. Internal combustion engine automobiles replaced horse-drivencarts. iPods and other MP3 players replaced Walkmans, flat-panel displays dis-placed cathode ray tube (CRT) displays, and online auctions replaced offlineauctions. In some instances, such as the case of contact lenses and eye glasses,the displacements were only partial. As the partial listing of Table 8.1 suggests,the list of such displacements is long.
Effectively, almost every product we use today is the result of technologicalinnovation, and each innovation has created opportunities for some companiesand threats for others. One of the first things that business scholars observedabout these technological changes in which new technologies displaced estab-lished ones was that many incumbent firms were displaced by new entrants.
Chapter 8
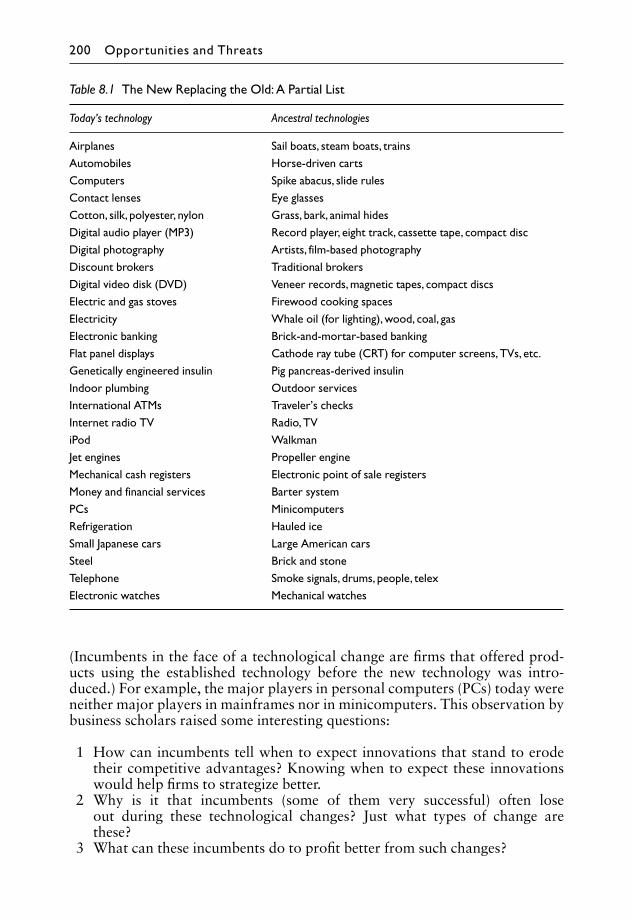
(Incumbents in the face of a technological change are firms that offered prod-ucts using the established technology before the new technology was intro-duced.) For example, the major players in personal computers (PCs) today wereneither major players in mainframes nor in minicomputers. This observation bybusiness scholars raised some interesting questions:
1 How can incumbents tell when to expect innovations that stand to erodetheir competitive advantages? Knowing when to expect these innovationswould help firms to strategize better.
2 Why is it that incumbents (some of them very successful) often loseout during these technological changes? Just what types of change arethese?
3 What can these incumbents do to profit better from such changes?
Table 8.1 The New Replacing the Old: A Partial List
Today’s technology Ancestral technologies
Airplanes Sail boats, steam boats, trainsAutomobiles Horse-driven cartsComputers Spike abacus, slide rulesContact lenses Eye glassesCotton, silk, polyester, nylon Grass, bark, animal hidesDigital audio player (MP3) Record player, eight track, cassette tape, compact discDigital photography Artists, film-based photographyDiscount brokers Traditional brokersDigital video disk (DVD) Veneer records, magnetic tapes, compact discsElectric and gas stoves Firewood cooking spacesElectricity Whale oil (for lighting), wood, coal, gasElectronic banking Brick-and-mortar-based bankingFlat panel displays Cathode ray tube (CRT) for computer screens, TVs, etc.Genetically engineered insulin Pig pancreas-derived insulinIndoor plumbing Outdoor servicesInternational ATMs Traveler’s checksInternet radio TV Radio, TViPod WalkmanJet engines Propeller engineMechanical cash registers Electronic point of sale registersMoney and financial services Barter systemPCs MinicomputersRefrigeration Hauled iceSmall Japanese cars Large American carsSteel Brick and stoneTelephone Smoke signals, drums, people, telexElectronic watches Mechanical watches
200 Opportunities and Threats

4 What should new entrants do to be successful? (After all, not all newentrants are successful.)
In this chapter, we explore these questions. In particular, we explore Foster’sS-curve and Christensen’s disruptive technologies models. We then integrate theresults from these models with the concepts of new game strategies that we haveseen so far to present more complete answers to the four questions raised above.Throughout this chapter, we will use the words “product” and “technology”interchangeably, although they are not always the same. For example, we willtalk of the PC as being a disruptive technology when we really mean the tech-nologies that go into making a PC.
Foster’s S-curveManagers were interested in the first question—how can incumbents tell whento expect innovations that stand to erode their competitive advantages—forobvious reasons. If they could tell, ex ante, when to expect these disruptivetechnologies, managers would be better prepared for them and might evenprevent new entrants from eroding their firm’s competitive advantages. One ofthe first business scholars to explore this question was Dr Richard Foster ofMcKinsey.1 He argued that a firm can predict when it has reached the limit of itstechnology life cycle (and therefore can expect a radical technological change)using knowledge of the technology’s physical limits.2 Effectively, by observingthe evolution of an established technology, a firm can tell when a new radicaltechnology is around the corner about to displace the established technology.One way to model this evolution is through what would later be known asFoster’s S-curve. In this S-curve, the vertical axis represents the rate of advanceof a technology while the horizontal axis captures the amount of effort put intodeveloping the technology (Figure 8.1). Technological progress starts offslowly, then increases very rapidly and then diminishes as the physical limits of
Figure 8.1 S-curves Showing Physical Limits of Technologies.
Disruptive Technologies as New Games 201

the technology are approached. Eventually, diminishing returns set in as thereturn on efforts becomes extremely small. A new technology whose underlyingphysical properties allow it to overcome the physical limit of the establishedtechnology must be used if one is to keep meeting the needs of customers.Effectively, when the returns on efforts become very small, that is a signal that anew technology is around the corner. This is especially the case when the rate ofprogress is not keeping up with demand. Consider, for example, the emissioncontrol technology in automobiles. Early in the life of pollution control tech-nologies, the reductions in emissions were substantial; but as time went on, theincreases in improvement relative to the amount of effort put into developmentbecame smaller. According to Foster’s S-curve model of predicting the arrival ofnew technologies, this low rate of increase in reductions in emission is a signalthat other technologies, such as hybrid or electric car technologies, are aroundthe corner as potential replacements for existing internal combustion enginetechnologies whose physical limits are being reached (Figure 8.1). By the way, atechnology S-curve is usually not the same thing as a product S-curve. Thevertical axis of the product S-curve is sales while the horizontal axis is time.Moreover, a technology S-curve usually has many product life cycles within it.
As a predictor of when to expect a radical innovation, the S-curve has somelimitations. It is difficult to tell exactly when to invest in the new technology andwhen to drop the established one. It is also difficult to tell just how much betterthe new technology will be. Moreover, the model does not say much about whatmanagers should do to be able to exploit the new technology when they eventu-ally face it. More importantly, the focus of Foster’s curve was on “more isbetter” in which firms pursued technologies to outdo existing product per-formance characteristics. However, many potentially advantage-eroding tech-nologies are not necessarily those that begin by outdoing existing productperformance characteristics. The disruptive technologies model and the con-cepts of this book address these shortcomings.
Disruptive Technologies: The PhenomenonThe disruptive technologies framework, developed by Professor Clayton Chris-tensen of the Harvard Business School, offered some answers to the first threequestions: how can incumbents tell when to expect technologies that stand toerode their competitive advantages? Why is it that incumbents often lose outduring these technological changes? What can these incumbents do to profitbetter from such changes?
Characteristics of Disruptive Technologies
Professor Christensen introduced the phrase disruptive technologies. These aretechnologies that exhibit the following three properties.3
1 They create new markets by introducing a new kind of product or service.(The dimensions of merit for products in the new market usually are differ-ent from those in the established market.)
2 The new product or service costs less than existing products or services, andtherefore is priced less.
202 Opportunities and Threats

3 Initially, the new product performs worse than existing products whenjudged by the performance metrics that mainstream existing customersvalue. Eventually, however, the performance catches up and addresses theneeds of mainstream customers.
Characteristics of Potentially Displaceable EstablishedTechnology
In addition to these characteristics of the disruptive technology, the establishedtechnology that potentially could be disrupted also has two importantproperties:
1 The performance of established product overshoots demand in establishedmarket. Product may have too many bells and whistles that customers donot need but are being forced to pay high prices for.
2 The cost of switching from the old product to the new one is low.
Rationale for Disruption
Why would a technology that exhibits the properties of disruptive technologiesoutlined above offer an opportunity for new entrants to attack and replaceincumbents who have been exploiting an established technology? First, becausethe technology creates a new market, incumbents who serve the old (main-stream) market are likely to pay attention to meeting the needs of their existingcustomers (in the old market) and therefore not give the new technology theattention that it deserves. After all, these mainstream customers are the sourceof the firm’s revenues and deserve attention. Moreover, because the perform-ance of products from the new technology is initially inferior to that of existingproducts and does not meet the needs of customers in the old market, incum-bents are even less likely to pay attention to the new technology. When dimen-sions of merit in the new market are different from those in the old market, it iseven more difficult to give the new technology the attention that it deserves.Sometimes, the “new market” means the least demanding customers of theexisting market who are only too happy to use the low-cost product that meetstheir needs but is perceived as inferior by the high-end segment. Second, becauseproducts from the new technology cost less than established ones and are pricedaccordingly, incumbents are less likely to pursue the new technology for fear oftaking the hit in reduced revenues. It is one thing to cannibalize one’s existingproducts with new ones that bring in about the same revenues, but it is quiteanother to cannibalize them with products that are priced a lot less. Financialmarkets do not like drops in revenues.
Third, because the performance of the new products keeps improving, therereaches a time when the new product has improved enough to start meeting theneeds of the mainstream customers that incumbents had been serving all along.Some of these customers—especially those that are paying too much for bellsand whistles or over-performance that they do not need—switch to the newlower-priced products made by the new entrants who have been serving the newmarket. Many incumbents who now want to start making the new product findout that new entrants are further up the learning curve and perhaps enjoying
Disruptive Technologies as New Games 203

other first-mover advantages associated with offering the disruptive technologyfirst. Moreover, incumbents’ dominant managerial logic in serving the old mar-ket, together with the old structures and systems that had been put in place toserve customers in the old market, can become a handicap. These factorsincrease a new entrant’s chances of exploiting the disruptive technology betterthan an incumbent.
To illustrate these points, consider the invasion of mainframe computers andminicomputers by PCs in the 1980s and 1990s (Figure 8.2). Mainframes andminicomputers were in the market long before PCs and satisfied the needs ofmany business customers as far as speed, software, and memory capacity wereconcerned (Figure 8.2). When PCs started out, they were used largely by com-puter enthusiasts and hobbyists, a new market compared to the business mar-kets served by mainframes and minicomputers. PCs also cost much less thanmainframes and minicomputers. PCs’ performance was also initially inferior tothat of mainframes and minicomputers but often more than met the needs ofmany computer enthusiasts and hobbyists. As the performance of PCsimproved, minicomputer makers kept listening to their customers and offeringthem the types of minicomputer that they wanted, and not paying enoughattention to PCs. Eventually, PC performance improved to a point where itstarted to meet the needs of some minicomputer customers, and at a muchlower price. Understandably, many minicomputer customers switched to PCs.Some minicomputer makers who tried to enter the PC market were handi-capped by their dominant managerial logic and the prospects of losing theirhigh-margin, high-revenue minicomputers. Moreover, some PC makers hadacquired PC brands and other first-mover advantages and were in a betterposition to profit from PCs than old minicomputer makers. The result was thatas PCs displaced minicomputers in most applications, new PC makers such asApple and Dell displaced many of the minicomputer and mainframe makers.
Effectively, in the Professor Christensen version of disruptive technology,incumbents are so busy listening to their customers that they do not pay enough
Figure 8.2 PC versus Mainframes and Minicomputers.
204 Opportunities and Threats

attention to the disruptive technology, which starts out serving the less-demanding needs of a new market. Moreover, since the new technology costsless than the established technology, incumbents may be reluctant to suffer therevenue drop that might come with switching to the lower-cost and lower-priced product. Even if incumbents want to switch to the new technology, theirestablished processes, dominant managerial logic, relationships with old main-stream customers and routines may make the transition difficult. Moreover,the new entrants who adopted the technology first may have established first-mover advantages. Table 8.2 provides a list of many technologies that fit theChristensen model of disruptive technologies.
Table 8.2 The Disrupted and Disruptors?
Disruptor Disrupted
Compact disc Cassettes and records
Desktop publishing Traditional publishing
Digital photography Chemical film-based photography
Distribution of software by Internet Distribution through distributors
e-mail Snail mail
High-speed CMOS video sensors Photographic film
Hydraulic excavators Cable-operated excavators
Internet Electronic data interchange (EDI)
Large-scale integration (LSI) Small-scale integration
Minicomputers Mainframes
Mini-mills for steel Integrated steel mills
Online auctions Offline auctions
PCs Minicomputers
PowerPoint-type software Drafting software
Small-scale integration Discrete components
Steam engine, electric motor, and internal-combustion engine automobiles
Horse-driven cart
Steamships Sailing ships
Table-top copiers Large Xerox-type copiers
Telephone (originally worked for only 3 miles,limited to local phone calls)
Telegraph (Western Union) long distance
Transistor radios Vacuum tube radio setsTransistors Vacuum tubesWal-Mart’s discount stores in small ruralsouthwestern towns
Discount retailing in cities
Wireless phone service Fixed-wire phone service
Disruptive Technologies as New Games 205

Sustaining Technologies
A sustaining technology has the opposite effect on incumbents compared to adisruptive technology in that, rather than displace established products, a sus-taining technology is an incremental improvement in established products thathelps them get even more entrenched. Sustaining technologies are usually initi-ated and pursued by incumbents who use them to reinforce their competitiveadvantages.
Usefulness of Disruptive Technologies Framework forCreating and Appropriating Value
The question is, of what use is the disruptive technologies model in creating andappropriating value? As we pointed out earlier, the model provides answers tothree of the questions that we stated at the beginning of this chapter, namely: (1)How can incumbents tell when to expect such innovations that stand to erodetheir competitive advantages? (2) Why is it that incumbents often lose out dur-ing these technological changes? (3) What can these incumbents do to betterprofit from such changes? Answering these questions exposes the role of disrup-tive technologies in creating and appropriating value.
How Can Incumbents Tell When to Expect Such Innovations that Standto Erode their Competitive Advantages?
The first thing about taking advantage of the opportunities and threats of anenvironment is to identify them. Because the disruptive technologies model laysout the characteristics of the type of technology that is likely to be disruptive toincumbents down the line, and which established technologies risk being dis-placed by firms can use these characteristics to identify disruptive technologies,ex ante; that is, firms can use these characteristics to identify disruptive tech-nologies before disruption has taken place. In so doing, incumbents can care-fully screen the different innovations that potentially represent a threat oropportunity to their core businesses. New entrants can identify which technolo-gies they can use to invade established or new markets. This can be done byasking the simple questions shown in Table 8.3.
If the answer to all five questions is YES, then the technology is potentiallydisruptive to incumbents of the established market and these incumbents arebetter off watching out for attackers. For attackers, it means that there is a goodchance for them to not only dominate the new market but to move into the oldmarket and erode the competitive advantages of incumbents there. To illustratethese two points, consider the example of VOIP, which we will call Internettelephony, versus fixed line and wireless telephony. The technology was origin-ally used by computer enthusiasts and college students who wanted to makecheap or free phone calls and did not mind the poor quality of the call. By 2007,the quality of Internet telephony calls had increased to a point where it wasdifficult to tell the difference between an Internet phone call and a wireless orfixed line call. As the quality of calls improved, the service moved to many othermarkets, well beyond college students and enthusiasts. The cost of switchingfrom the traditional phone to VOIP service was very low for customers. Thus,
206 Opportunities and Threats

the answer to all five questions in Table 8.3 is Yes. In the USA, new entrantssuch as Vonage and Skype were going after both markets. Incumbent telephonecompanies were at first not very receptive to Internet telephony.
Why is it that Incumbents Often Lose out in the Face of theseTechnological Changes?
Professor Christensen argued that two contributors to why incumbents oftenlose out to new entrants, in the face of a disruptive technology, are old valuesand processes. In exploiting an established technology, incumbents usuallybuild resources, processes and values. Processes are the “the patterns of inter-actions, coordination, communication, decision making employees use to trans-form resources into products and services of greater worth”4 while values are“the standards by which employees set priorities that enable them to judgewhether an order is attractive or unattractive, whether a customer is moreimportant or less important, whether an idea for a new product is attractive ormarginal and so on.”5 Over time, especially if a firm has been successful, thesevalues and processes become embedded in the firm’s routines. Managers alsodevelop a dominant logic.6 These values, processes and dominant logic arestrengths when it comes to exploiting established or sustaining technologies,but in the face of some new games such as disruptive technologies, they canbecome handicaps.
When a disruptive change or any other new game comes along and requiresdifferent values or processes, the tendency is for the employees to stick with theold routines that have worked before because routines, processes, and valuesare difficult to change quickly. For example, if employees of an incumbent firmhave focused their attention on their existing customers so as better to provide
Table 8.3 To What Extent is Technological Change Disruptive to an Established Technology?
Question Answer Example: VOIP versusold telephone service
Potentially disruptive technology
1. Does the innovation create a new market whoseperformance requirements are not as demanding as thoseof the old market?
Yes/No Yes
2. Does the innovation cost less than existing products? Yes/No Yes
3. Is the innovation inferior in performance but keepsimproving enough to be able to meet performance criteriaof the old market?
Yes/No Yes
Established technology
1. Does the established technology’s performance overshootdemand, or are there too many bells and whistles for whichcustomers are being forced to pay?
Yes/No Yes
2. Are there little or no switching costs to switching from anestablished technology to a disruptive one?
Yes/No Yes
Disruptive Technologies as New Games 207

these customers’ needs, their values and processes are likely to dictate that theykeep their attention on these customers, the sources of their revenues. In sodoing, they may miss out on the new market in which the disruptive technologystarted out; and while the technology is gradually improving, employees in theold market are still paying attention to their dominant customers. By the timethat these employees realize that the disruptive technology is now invading theirown market, it may be too late to quickly build the new values and processesthat are required to exploit the disruptive technology. Effectively, the old valuesand processes have become handicaps for incumbents. Thus, new entrants,without these old values, processes, and dominant managerial logic to handicapthem, have a better chance of exploiting the disruptive technology.
What Can these Incumbents do to Profit Better from Such Changes?
What should firms do in the face of disruptive innovations? It depends onwhether the firm is an incumbent or a new entrant. Professor Christensen sug-gests several things that incumbents can do to improve their chances.7
First, incumbents should convince upper-level management to see the disrup-tive innovation as a threat to existing core businesses. In so doing, manage-ment can commit the types of resources that are needed to tackle the innov-ation. Since management’s instincts are to protect the core businesses thatbring in revenues, management is more likely to pay attention to the disruptiveinnovation when it understands the enormity of the threat that the disrup-tive innovation poses to an existing core business.
Second, when funds have been allocated to the innovation, and developmentof products or services is ready to begin, the incumbent should turn overresponsibility to an autonomous unit within the firm that can frame the innov-ation as an opportunity and pursue it as such. By using an autonomous unit, theincumbent can (1) prevent the old processes and values from handicapping thebuilding of the new processes and values that are needed to exploit the innov-ation, and (2) avoid the dominant managerial logic of the old business, if theautonomous group is staffed with new employees who do not have the oldlogic. It is also more difficult for political foes to disrupt the activities of theautonomous unit.
Third, when a product is not yet good enough, the activities to develop theproduct should be internal and proprietary. When a product becomes goodenough and commoditization starts, the incumbent should outsource it.
Fourth, firms should organize their business units as a function of the prob-lems that customers want to solve (and associated solutions), rather than byhow easy it is to collect data for the company. Paying attention to customers’problems, solutions, and contexts, rather than to the customers themselves,enables a firm to see other customer’s needs better and to provide them.
The third and fourth items suggested for incumbents also apply to newentrants. In addition, new entrants should first go after markets that have beenignored by incumbents, and then methodically work their way to incumbents’existing markets.
208 Opportunities and Threats

Shortcomings of Disruptive Technologies Model
Like any framework, Christensen’s disruptive technologies model has its short-comings. We explore three of them here: limited coverage, lack of strategyfocus, and not enough about profitability.
Limited Coverage
The characteristics of disruptive innovations are important because understand-ing them enables firms to identify them and pay attention to the threats andopportunities of potential disruptors. However, some innovations that do notmeet all the three characteristics of disruptive innovations still displace existingproducts—that is, some innovations that are disruptive in outcome do not meetall the characteristics of disruptive technologies spelled out above. Consider thesecond property: innovation (new product) costs less than existing products.Some innovations that start out costing more than existing products displacethe latter. New pharmaceutical drugs that displace existing ones are a case inpoint—their initial costs are often higher than those of existing therapies. Next,consider the third property: innovation starts out with inferior quality (com-pared to existing products) but keeps improving enough eventually to meet theneeds of customers in the old market. Many innovations that start out withsuperior performance, relative to existing products, still displace the existingproducts. For example, many medications that initially outperform existingones, displace their predecessors. Electronic point of sale registers, which dis-placed mechanical cash registers, were superior in performance to the latterwhen they started out. Effectively, disruptive innovations, as defined by Chris-tensen’s three characteristics, are but a subset of innovations that can be disrup-tive. They are an even smaller subset of new games; but the Christensen defin-ition has the advantage that managers can use it to, ex ante, tell which innov-ation will be disruptive and to try to do something about it.
Lack of Focus on Strategy: Prescriptions for Managers Are Only aboutImplementation
The other shortcoming of the disruptive technologies model is that the prescrip-tions for managers are largely about implementation issues and say very littleabout the strategy that is being implemented. Recall that, according to Chris-tensen, an incumbent that has a good chance of doing well in the face of adisruptive technology is one that convinces upper-level management to see dis-ruptive technology as a problem, creates an autonomous unit to pursue disrup-tive technology, develops the product internally when it is still highly differenti-ated but outsources it when it becomes a commodity, and organizes businessunits as a function of the problems/solutions that customers want and not as afunction of how data is collected. These prescriptions are largely about theorganizational structure, systems, and people—the cornerstones of strategyimplementation. There is very little about the set of activities of the value chain,value network, or value shop that needs to be performed to create andappropriate value, and when and how these activities should be performed. Theprescriptions are also designed largely for incumbent firms, with very little
Disruptive Technologies as New Games 209

about what a new entrant could do to have a competitive advantage. After all,not all attackers win.
Not Enough about Profitability
The primary emphasis of the disruptive technology model is on using the tech-nology to develop products that customers find valuable. Emphasis is on creat-ing value and very little on appropriating the value; but as we saw in Chapter 4,appropriating value often takes more than getting the technology right. Notonly are complementary assets often critical to profiting from a new technology,a firm’s position vis-à-vis its coopetitors, its pricing strategy, the extent to whichthe technology can be imitated, the number and quality of customers, and thesources of revenue can also be critical. These shortcomings can be eliminated bylooking at disruptive technologies as the subset of the new games that they are.
Disruptive Technologies as New Games
What have disruptive technologies to do with new game strategies? Everything!Disruptive technologies are often new games or the source of new games andvice versa. On the one hand, for example, PC technology gave birth to all thenew game strategies that both new entrants and incumbents in the computerindustry pursued when they entered the PC submarket. The Internet is a disrup-tive technology that has been the source of many new game strategies such asthose pursued by Google, eBay, Amazon, to name a few. On the other hand, forexample, the many firms whose R&D labs toil every day to invent radicallyinnovative products or processes often produce inventions that go on to becomedisruptive technologies. For example, the microchip that would go on to replacediscrete transistor technology and make it possible to make everything from thePC to the iPhone, was invented by Robert Noyce of Intel Corporation and JackKilby of Texas Instruments.
Profiting from Disruptive Technologies: The NewGame Strategies ApproachA firm’s ability to profit from a disruptive technology starts with the firm’sstrengths and handicaps when it confronts the technology (Figure 8.3). Thesestrengths and handicaps influence how well the firm is able to take advantage ofthe value chain and new game factors associated with the disruptive technologyto create and appropriate value (Figure 8.3).
Strengths and Handicaps in the Face of a DisruptiveTechnology
As we saw in Chapter 5, every player in a new game brings some strengths fromits past resources/capabilities or product-market position (PMP) that can con-tinue to be strengths or become handicaps in the new game. Since disruptivetechnologies are new games, we can expect that both new entrants and incum-bents bring some strengths from their pasts that can continue to be strengths orbecome handicaps. Determining which former strengths can still be strengths
210 Opportunities and Threats

and which ones have become handicaps can be crucial in profiting from adisruptive technology. Table 8.4 can be used to help make such a determination.As we saw in Chapter 5, there are two primary determinants of which resourcebecomes a handicap or strength: whether the resource is vital to exploiting thedisruptive technology, and whether the resource is separable. A resource is vital
Figure 8.3 Disruptive Technologies and Value Creation and Appropriation.
Table 8.4 Are Previous Strengths Still Strengths or Have they Become Handicaps in the Faceof a Disruptive Technology?
Resource Is the resource/capability vitalto the disruptive technology?
Is separability costless? In exploiting the disruptivetechnology, the resource is a:
Resource 1 Y Y strength
Resource 2 Y N potential strength
Resource 3 N Y question mark
Resource 4 N N handicap
Disruptive Technologies as New Games 211

to a disruptive technology if it contributes substantially to value creation andappropriability. It is separable if the firm has no problems taking the resourceaway from a predisruptive technology application for use in a disruptive tech-nology, or leaving the resource behind when it is more likely to hurt in thedisruptive technology than help. A firm may be prevented from using a resourcein a disruptive technology because of prior commitments, contracts, agree-ments, understandings, emotional attachments, or simply because the resource/asset cannot be moved from the predisruptive technology game to the locationof the disruptive technology.
A resource such as Resource 1 (Table 8.4) is a strength because it is importantin exploiting the disruptive technology and the firm can use it because there areno prior commitments, agreements, understandings, or anything else thatprevents it from doing so. Many complementary assets such as brands anddistribution channels are usually strengths in the face of disruptive technologies.IBM used its brand, relationships with businesses, and software developers todominate the PC market in the 1980s and early 1990s. (Recall that the PC was adisruptive technology relative to minicomputers.)
A resource that was a strength in a predisruptive technology era becomes ahandicap if it is useless to the firm in exploiting the disruptive technology butthe firm cannot separate itself from the resource and move on. Separation maynot be possible because of prior commitments that the firm made in a predisrup-tive technology period, or because of a lack of strategic fit between the firm’scorporate strategy and the disruptive technology. As we saw in Chapter 5,Compaq’s relationships with distributors served it well for a while; but when itdecided to sell directly to end-customers, distributors prevented it from doingso. Effectively, Compaq could not shake itself free of its prior commitments andtherefore could not pursue the proposed new business model. Often, a firm isstuck with resources that it does not need even as it pursues the disruptivetechnology. For example, since a disruptive technology usually starts outaddressing the needs of a new market with very low prices, incumbents mayhave to adopt a low cost mentality to be competitive in the new market. Such amentality may be difficult to adopt successfully, especially if the firm’s productsin the old market are differentiated and it has a high cost-structure. It is difficultto transform employees, with a high-cost culture born out of the high-coststructure usually associated with a differentiation strategy, into a low-cost one.
Professor Christensen provided another good example. He argued that sincedisruptive technologies usually first address the needs of a new market, incum-bents that were used to addressing the needs of the old market keep listening totheir customers—the primary source of their revenues—rather than customersin the new market. Effectively, relationships with customers that were critical togetting customers what they wanted prior to the disruptive change, now handi-cap the firm’s efforts to listen to and address the needs of the new market. Asanother example, take VOIP telephony. The old telephone company’s domin-ant logic about how to make money carried over to the late 2000s for many oldtelephone companies who could not understand how any firm would allowpeople to make free intercontinental phone calls and still make money.
There are also cases where a resource is vital to a firm’s success in the face of adisruptive technology but the firm cannot use the resource because of prioragreements that prevent it from doing so (Resource 2, Table 8.4). As we saw in
212 Opportunities and Threats

Chapter 5, a noncompete clause in an important employee’s contract with aprevious employer can prevent the present employer from using the employeeeffectively in exploiting a disruptive technology. Resource 3 is not importantin the new game and therefore of no significance, since the firm can get awayfrom it.
From a PMP point of view, the question is whether strengths in a firm’sprevious PMP—the product and the firm’s position vis-à-vis its coopetitors—that a firm brings to the disruptive technology remain strengths or becomehandicaps. Because the product starts out addressing the needs of a smallermarket whose performance requirements are initially inferior to those of theexisting market, the old market is a handicap. Why? The prices and possiblyprofit margins in the old market are higher than those in the new market. Notmany incumbents are likely to want to cannibalize their existing products, espe-cially with new products whose prices are so low that they will suffer revenuedrops and possibly profit drops. It may also be difficult to change an organiza-tion that has been built around a high-price high-cost structure and businesslogic, to a low-price low-cost one.
Value Chain Activities in the Face of Disruptive Technologies
To offer products/services in the face of a disruptive technology, firms—incum-bents and entrants alike—have to perform value chain activities. As we arguedin Chapter 4, to increase their chances of making the most contribution towardsvalue creation and appropriation, firms take advantage of so-called value chainfactors. They pursue the types of activities that:
1 Contribute to low cost, differentiation, number of customers and otherdrivers of profitability.
2 Contribute to position the firm better vis-à-vis its coopetitors.3 Take advantage of industry value drivers.4 Build distinctive resources/capabilities and/or translate existing ones into
unique value.5 Are comprehensive and parsimonious.
However, because disruptive technologies are new games, each firm can alsotake advantage of new game factors—of the fact that disruptive technologiesgenerate new ways of creating and appropriating new value; offer opportunitiesto build new resources/capabilities and/or translate existing ones in new waysinto value; create the potential to build and exploit first-mover advantages;attract reactions from new and existing competitors; and have their roots in theopportunities and threats of an industry or macroenvironment. As we argued inChapter 4, value chain factors have a direct impact on value creation andappropriation while new game factors have an indirect moderating effect. Asshown in Figure 8.3, the extent to which each value chain factor impacts valuecreation and appropriation is moderated (pushed up or down in magnitudeand direction) by new game factors. Both factors rest on the strengths andhandicaps that the firm has when it faces the disruptive technology. We nowexplore how.
Disruptive Technologies as New Games 213

Contribute to Low Cost, Differentiation, Number of Customers, andOther Drivers of Profitability
Any firm that wants to make money from a disruptive technology has to offercustomers benefits that they perceive as more valuable to them than anythingthat competitors can offer them; that is, irrespective of whether a firm is a newentrant or an incumbent, it has to offer customers something unique if the firmhopes to keep attracting customers. The firm also has to price the product welland pursue the right sources of revenue. To offer distinctive customer benefits,price them well, and pursue the right sources of revenue, a firm must performthe appropriate value chain activities. Because a disruptive technology is a newgame, the firm can take advantage of new game factors. For example, sincedisruptive technologies usually initially address a new market, they offeropportunities to work with so-called lead users—customers who face needs thatother customers will encounter later but face them months or years before thebulk of that marketplace does.8 Because of their knowledge of what customerswant in the new product and their willingness to work with firms, lead users canbe very helpful in a firm’s efforts to offer distinctive value to its customers. Thenew gameness of disruptive technologies also offers firms the opportunity tomove first to build and exploit first-mover advantages. For example, a firm canbuild switching costs at customers, increasing the uniqueness of its PMP.
However, offering customers something that they value implies that a firmhas gotten the technology or aspects of it right. One way to do this is, assuggested by Christensen, to convince upper-level management to see disruptivetechnology as a problem, create an autonomous unit to pursue disruptive tech-nology, develop a product internally when it is still highly differentiated butoutsource it when commoditized, and organize business units as a function ofthe problems/solutions that customers want. Getting the technology right is notalways a guarantee to make money, since coopetitors with power can extractmost of the value. Moreover, the technology can be imitated by a firm that hasdifficult-to-imitate but important complementary assets. Such an imitator willmake the money even though the firm being imitated got the technology right—hence, the need to look at other value chain factors apart from getting thedisruptive technology right and offering customers the right product features.
Improve the Position of a Firm vis-à-vis Coopetitors
Disruptive technologies also have an impact on industry factors and thereforean impact on a firm’s position vis-à-vis its coopetitors. Rivalry increases sinceboth new entrant attackers and incumbents are competing to exploit the newtechnology, often in both the new and old markets. Growth lessens the intensityof rivalry somewhat. The number of firms increases, thereby increasing thebargaining power of buyers. New entry is high as entrepreneurs enter to exploitthe new technology. Suppliers have more firms to sell to than before the disrup-tive technology. Effectively, the industry is not as attractive as it was before thedisruptive change, and appropriating value created depends on how firms takeadvantage of these forces that are reducing the attractiveness of the markets inperforming their activities.
A firm can take advantage of new game factors by improving its position vis-
214 Opportunities and Threats

à-vis coopetitors and in the process, dampen some of these repressive forces.First, if a firm bypasses powerful distributors and sells directly to more frag-mented end-customers, the firm is effectively increasing its bargaining powervis-à-vis buyers, and increasing its chances of working more closely with leadusers to get the technology right. Second, by integrating vertically backwards,early in the life of a disruptive technology, a firm may be able to improve itsposition vis-à-vis suppliers. It can use this improved position to, for example,convince sole suppliers of important components to find second sources forthese components, further improving its position vis-à-vis the suppliers. Finally,working cooperatively with coopetitors, rather than seeing them as antagonistsover whom one has to have power, often dampens competitive forces.
Take Advantage of Industry Value Drivers
Recall that industry value drivers are those industry factors that stand to have asubstantial impact on the benefits (low cost or differentiation) that customerswant, the quality and number of such customers, or any other driver of profit-ability. Disruptive technologies often change industry value drivers. Forexample, in offline auctions, the location of the auction was a critical industryvalue driver since it determined who would attend the auction and the morepeople at the auction, the better for sellers. In online auctions, the location is nolonger a value driver. Now it is the number of registered members that belong toa particular community or website. Consequently, emphasis in the face of theInternet is not on having the best location but on having the largest number ofregistered users. eBay seems to have understood this well. Another example isNintendo’s introduction of the Wii. One reason why Nintendo was able tomake money on each console sold while Sony and Microsoft lost money ontheir consoles (PS3 and Xbox 360, respectively) was because the video gameconsole industry was an industry in which the prices of the microchips used inconsoles dropped rapidly as older chips quickly became obsolete. Since Nin-tendo was pursuing a reverse positioning strategy, it used these old chips thatcost a lot less than the cutting-edge chips used by its competitors. Effectively,Nintendo was able to take advantage of the rapidly falling prices of chips andkeep its costs very low.
Build Distinctive Resources/Capabilities and/or Translate ExistingOnes into Unique Value
The resources that a firm needs in the face of a disruptive technology can begrouped into two: technology resources and complementary assets. Technologyresources are the resources that a firm needs to get the technology right. Com-plementary assets here are all the other resources, beyond those that underpinthe disruptive technology, that a firm needs to offer customers value and pos-ition itself to appropriate the value. They include distribution channels, brandname reputation, installed base, shelf space, and so on, and are often critical toprofiting from a disruptive technology. Although new technology resources areoften needed in the face of a disruptive technology, scarce important comple-mentary assets that were important in profiting from the established technologyusually remain useful and important. Firms with such complementary assets
Disruptive Technologies as New Games 215

often stand to do well. Because disruptive technologies initially address newmarkets, firms may have to build the complementary assets required to focus onthese new markets from scratch and new entrants may have an advantage build-ing the complementary assets for these new markets. Incumbents usually havethe complementary asset for the older market and these complementary assetscan help them fend off attacks by new entrants. Often, new entrants with thetechnology resources team up with incumbents that have the complementaryassets.
Because a disruptive technology costs less than the older one and is initiallyinferior in performance, incumbents and new entrants alike often need newtechnological resources to get the new technology right. By convincing upper-level management to see the disruptive technology as a problem, creating anautonomous unit to pursue the disruptive technology, and so on, an incumbentcan mitigate some of the problems of dominant managerial logic to build thetypes of resource that will enable it to get the new technology right. By movingfirst, the firm can also build and exploit first-mover advantages.
Conform to Parsimony and Comprehensiveness
In performing the activities that will enable it to create and capture value in theface of a disruptive technology, a firm has to be careful not to perform unneces-sary activities or leave out important activities. An AVAC analysis can help afirm sort out which activities contribute to value creation and capture, andwhich do not.
Implementation of New Game Strategies
As we saw in Chapter 7, the strategy that a firm pursues also has to be imple-mented well if its full potential is to be realized. A structure, systems/processes,and people that fit the strategy has to be pursued if a firm is going to realize thefull potential of its new game strategy. Having the right values and processesare part of the implementation. The four measures advocated by ProfessorChristensen—convincing upper-level management to see the disruptivetechnology as a problem, creating an autonomous unit to pursue disruptivetechnology, developing product internally when it is still highly differentiatedbut outsource it when commoditized, organizing business units as a function ofthe problems/solutions that customers want—are a subset of implementing anew game strategy.
Revisiting the QuestionsOne way to summarize what we have explored in this chapter is to revisit thequestions that we raised at the beginning of the chapter.
How Can Incumbents Tell When to Expect Innovations thatStand to Erode their Competitive Advantages?
As part of monitoring the opportunities and threats of its political, economic,social, technological, and natural (PESTN) environments via, for example, a
216 Opportunities and Threats
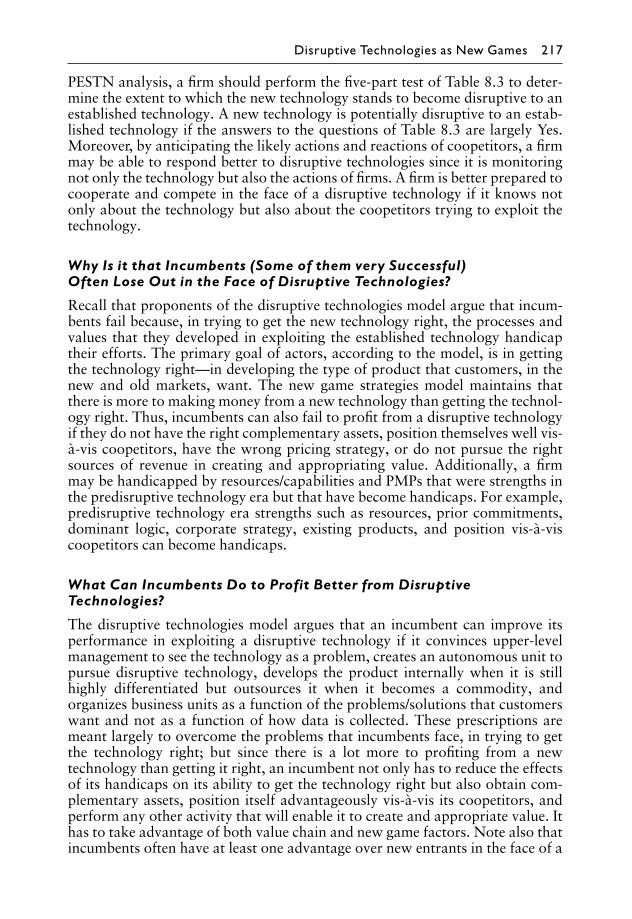
PESTN analysis, a firm should perform the five-part test of Table 8.3 to deter-mine the extent to which the new technology stands to become disruptive to anestablished technology. A new technology is potentially disruptive to an estab-lished technology if the answers to the questions of Table 8.3 are largely Yes.Moreover, by anticipating the likely actions and reactions of coopetitors, a firmmay be able to respond better to disruptive technologies since it is monitoringnot only the technology but also the actions of firms. A firm is better prepared tocooperate and compete in the face of a disruptive technology if it knows notonly about the technology but also about the coopetitors trying to exploit thetechnology.
Why Is it that Incumbents (Some of them very Successful)Often Lose Out in the Face of Disruptive Technologies?
Recall that proponents of the disruptive technologies model argue that incum-bents fail because, in trying to get the new technology right, the processes andvalues that they developed in exploiting the established technology handicaptheir efforts. The primary goal of actors, according to the model, is in gettingthe technology right—in developing the type of product that customers, in thenew and old markets, want. The new game strategies model maintains thatthere is more to making money from a new technology than getting the technol-ogy right. Thus, incumbents can also fail to profit from a disruptive technologyif they do not have the right complementary assets, position themselves well vis-à-vis coopetitors, have the wrong pricing strategy, or do not pursue the rightsources of revenue in creating and appropriating value. Additionally, a firmmay be handicapped by resources/capabilities and PMPs that were strengths inthe predisruptive technology era but that have become handicaps. For example,predisruptive technology era strengths such as resources, prior commitments,dominant logic, corporate strategy, existing products, and position vis-à-viscoopetitors can become handicaps.
What Can Incumbents Do to Profit Better from DisruptiveTechnologies?
The disruptive technologies model argues that an incumbent can improve itsperformance in exploiting a disruptive technology if it convinces upper-levelmanagement to see the technology as a problem, creates an autonomous unit topursue disruptive technology, develops the product internally when it is stillhighly differentiated but outsources it when it becomes a commodity, andorganizes business units as a function of the problems/solutions that customerswant and not as a function of how data is collected. These prescriptions aremeant largely to overcome the problems that incumbents face, in trying to getthe technology right; but since there is a lot more to profiting from a newtechnology than getting it right, an incumbent not only has to reduce the effectsof its handicaps on its ability to get the technology right but also obtain com-plementary assets, position itself advantageously vis-à-vis its coopetitors, andperform any other activity that will enable it to create and appropriate value. Ithas to take advantage of both value chain and new game factors. Note also thatincumbents often have at least one advantage over new entrants in the face of a
Disruptive Technologies as New Games 217

disruptive technology—they usually have complementary assets such as distri-bution channels, and brands that can be used in exploiting the disruptive tech-nology, especially in the established market. These complementary assets can beused to, among other things, convince a new entrant that has the technology butno complementary assets to team up with the incumbent.
What Should New Entrants Do?
The disruptive technology model suggests that new entrants should start out byattacking the new market first, reserving entry into the old market for later.Given their strengths and handicaps, new entrants should take advantage ofboth value chain and new game factors to create and appropriate value. Add-itionally, they can also exploit the fact that incumbents have handicaps thatthey do not.
Disruptiveness of New GamesIn the disruptive technologies framework that we have explored, there are twotypes of technology: disruptive and sustaining. One implicit assumption is thatwithin each of these groups, there is homogeneity—that is, all disruptive tech-nologies have the same level of disruptiveness while all sustainable technologieshave the same level of sustainability. However, since not all technologies havethe same characteristics, we can expect disruptive technologies to differ in theirlevel of disruptiveness. Thus, an interesting question is, how disruptive is adisruptive technology? Since disruptive technologies are a subset of new games,we can understand the extent to which some disruptive technologies are moredisruptive than others by exploring the new gameness (disruptiveness) of newgames. In Chapter 1, we started exploring the new gameness of new gamesusing the framework that has been summarized in Figure 8.4. In the framework,the vertical axis captures the impact of a new game on the competitiveness ofexisting products—that is, it captures the extent to which a new game rendersexisting products noncompetitive. The horizontal axis captures the impact ofthe new game on existing resources/capabilities (technological and market-ing)—that is, it captures the extent to which the technological and marketingresources/capabilities that are required to pursue the new game build on exist-ing resources/capabilities or render them obsolete.9 In the framework, there arefour types of new games: regular, position-building, resource-building, andrevolutionary.10 New gameness and disruptiveness increase as one moves fromthe origin of the matrix to the top right corner, with the regular new gamebeing the least disruptive while the revolutionary new game is the mostdisruptive.
By definition, disruptive technologies drastically reduce the competitivenessof existing products. Thus, we can expect disruptive technologies to be locatedin the upper half of the matrix of Figure 8.5. Take PCs, for example. Thetechnology and other resources needed to make PCs built on the existingresources needed to build minicomputers and PCs eventually rendered mini-computers noncompetitive. Thus, in the matrix of Figure 8.5, PCs would belocated in the upper-left quadrant. Other examples that fall into this quadrantinclude mini-mills and different generations of disk drives. However, digital
218 Opportunities and Threats
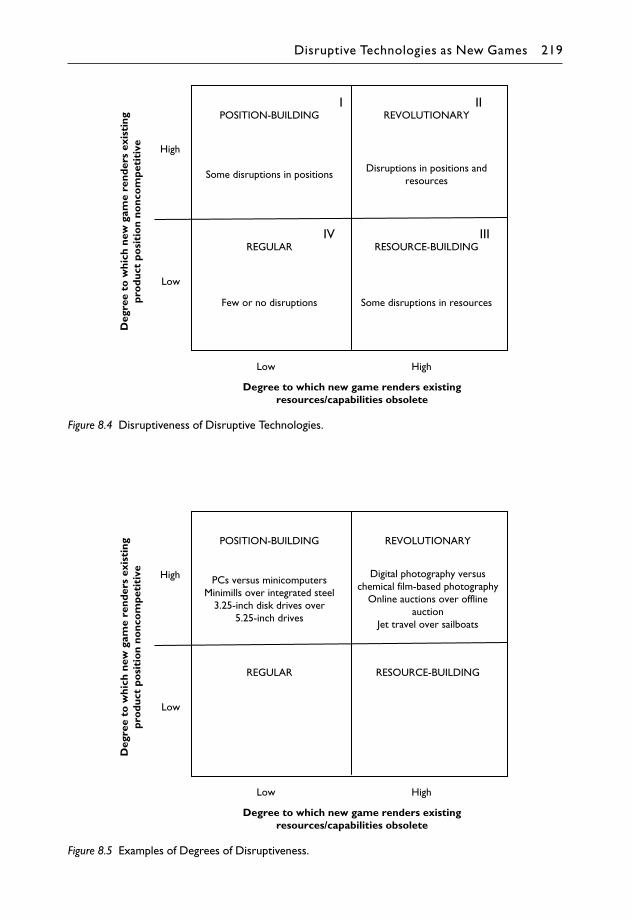
Figure 8.4 Disruptiveness of Disruptive Technologies.
Figure 8.5 Examples of Degrees of Disruptiveness.
Disruptive Technologies as New Games 219

photography falls in the upper-right quadrant because the technology is radic-ally different from chemical film-based photography technology. And the qual-ity of digital technology has improved to a point where chemical film-basedtechnology is being phased out. Like PCs, it is a disruptive technology but arevolutionary new game rather than a position-building new game.
Key Takeaways
• Over the years, many new technologies have replaced older ones and in theprocess, incumbent firms have been replaced. This has raised fourquestions:
1 How can incumbents tell when to expect such innovations that stand toerode their competitive advantages?
2 Why is it that incumbents (some of them very successful) often lose outduring these technological changes?
3 What can these incumbents do to profit better from such changes?4 What should new entrants do to be successful? After all, not all new
entrants do well.
• Foster’s S-curve was one of the first models to explore the first question. Heargued that a firm can tell that a new technology is about to displace anexisting one when the physical limits of the existing technology have beenreached—when the returns on efforts become very small.
• According to Professor Clayton Christensen, disruptive technologiesexhibit the following three characteristics:
1 They create new markets by introducing a new kind of product orservice.
2 The new product or service costs less than existing products or services,and therefore is priced less.
3 Initially, the new product performs worse than existing products whenjudged by the performance metrics that mainstream existing customersvalue. Eventually, however, the performance catches up and addressesthe needs of mainstream customers.
• Contrast this with a sustaining technology which is an incrementalimprovement in established products and is often used by incumbents toreinforce their competitive advantages.
• Meanwhile, those established technologies that are prime candidates fordisruption usually have products:
1 Whose performance overshoots demand, with too many bells andwhistles for which customers are being forced to pay.
2 With little or no switching costs for customers.
• The disruptive technologies model was developed by Professor Christensenand provides some answers to three of the four questions raised:
1 How can incumbents tell when to expect innovations that stand toerode their competitive advantages? Using the following checklist, afirm can determine, ex ante, which technology potentially is likely todisruptive its business models:
220 Opportunities and Threats

� Does the new technology create a new market whose performancerequirements are not as demanding as those of the old market?
� Does the new technology cost less than existing products?� Is the new technology inferior in performance (compared to that of
established technology) but keeps improving enough to be able tomeet performance criteria of the old market?
� Does the performance of the established technology overshootdemand?
� Are the costs of switching from the established technology to thenew one low?
2 Why is it that incumbents (some of them very successful) often lose outin the face of a disruptive technology? Incumbents fail to exploit disrup-tive technologies because they are handicapped by:
� Processes developed in exploiting established technology.� Values developed in exploiting established technology.
3 What can incumbents do to profit better from disruptive technologies?Incumbents can overcome these handicaps by:
� Convincing upper-level management to see disruptive technology asa problem.
� Creating an autonomous unit to pursue disruptive technology.� Developing a product internally when it is still highly differentiated
but outsourcing it when it is commoditized.� Organizing business units as a function of the problems/solutions
that customers want.
• The new game strategies framework encompasses the disruptive technolo-gies model, since disruptive technologies are new games. It answers all fourquestions:
1 How can incumbents tell when to expect innovations that stand toerode their competitive advantages?
� When a PEST analysis suggests that the political, economic, social,or technological components of the environment are a threat or anopportunity. This includes the five-question test of disruptivetechnologies.
� When, by monitoring the likely reaction of coopetitors, incumbentsfind that coopetitors are likely to adopt the new technology.
2 Why is it that incumbents (some of them very successful) often lose outin the face of disruptive technologies? In creating and appropriatingvalue, incumbents are handicapped by:
� Strengths from predisruptive technology era that have becomehandicaps: resources, prior commitments, dominant manageriallogic, corporate strategy, existing products, position vis-à-viscoopetitors, values, systems, and processes.
� Not enough strengths or ability to build them, to exploit value chainand new game factors.
Disruptive Technologies as New Games 221

3 What can incumbents do to profit better from disruptive technologies?
� Not only reduce the effects of handicaps, but also take advantage ofstrengths (e.g. complementary assets), in creating and appropriatingvalue. This includes not only getting the technology right, but alsodoing other things to create value and better position the firm toappropriate the value. It entails taking advantage of both valuechain and new game factors. Given its strengths and handicaps, thefirm should perform activities that:
� Contribute to low cost, differentiation, or other drivers ofprofitability.
� Contribute to position the firm better vis-à-vis its coopetitors.� Take advantage of industry value drivers.� Build and translate distinctive resources/capabilities.� Are parsimonious and comprehensive.
� While:
� Taking advantage of the new ways of creating and capturing thenew value generated by the new game.
� Taking advantage of opportunities generated by the new gameto build new resources or translating existing ones into uniquevalue.
� Taking advantage of first-mover advantages and disadvantages.� Anticipating and responding to coopetitors’ reactions to its
actions.� Identifying and taking advantage of opportunities and threats
from the macroenvironment.
� The strategy must then be properly implemented by:
� Convincing upper-level management to see disruptive tech-nology as a problem.
� Creating autonomous unit to pursue disruptive technology.� Developing product internally when it is still highly differ-
entiated but outsourcing it when commoditized.� Organizing business units as a function of the problems/
solutions that customers want.4 What should new entrants do to be successful?
� The same things that incumbents do but without the handicaps andstrengths of incumbents.
• Some disruptive technologies are more disruptive than others. Revolution-ary disruptive technologies are the most disruptive.
Key Terms
Disruptive technologyFoster’s S-curveS-curveSustaining technology
222 Opportunities and Threats

Globalization and New Games
Reading this chapter should provide you with the conceptual and analyticaltools to:
• Define globalization, and the different strategies that firms can pursue ingoing international.
• Analyze who appropriates how much value from products that aredeveloped and sold globally.
• Be introduced to the strategies that firms pursue when going global.• Understand the drivers of globalization and why firms go international.• Begin to understand the critical role that governments can play in value
appropriation.
IntroductionOil is arguably the most global of all global products. It is explored andextracted from countries in all six continents, by people and equipment from allover the world. It is refined, transported, sold, and used in all corners of theearth. All countries need it and depend on each other for it, and for the tech-nologies that go into finding, transporting, and processing it. The list of prod-ucts that are produced using oil is endless. Towards the middle of 2008, theprice of a liter of gasoline at the pump reached record highs in many countrieseven as the price of oil futures flirted with the $150 per barrel record price. Oilcompanies recorded very high profits and some analysts wondered what thehigh prices would do to the world economy.1 Some consumers wondered if theoil companies deserved the high profits. Using our terminology, people won-dered if the oil companies created all the value that they were appropriating. Ifthat were not the case, who was creating the value that the oil companies werecapturing? If they deserved the high profits, who was capturing most of thevalue perceived by customers? How about the oil-exporting or importing coun-tries? How much of what consumers paid for oil from each of these countriesactually went to the countries? We will explore these questions in this chapter.We start the chapter with an example on how to calculate the value that isappropriated by different players along an international oil value chain. Wethen briefly discuss globalization and its drivers. This is followed by a discus-sion of new game strategies that firms use when they go global.
Chapter 9

Introductory Example: Appropriating Value inGlobalizationSuppose a firm pursues the right global new game strategy (given its strengthsand handicaps) to create value; how much of the value can it appropriate? Itdepends on how much of the value created the other players in the internationalvalue system, especially governments, appropriate. Governments have infinitepower and can use it to appropriate most of the value created in a value chain,leaving the creators of such value with very little to show for their efforts. Toillustrate what can happen in a value chain, let us explore a very short minicase.We use the oil industry because it is one of the most global industries in theworld. Directly or indirectly, oil touches almost every life on earth. Firms andgovernments benefit from oil.
Example 9.1. Minicase: Who Creates and Who Appropriates Value in theOil Industry?
In the 2000s, Nigeria was Africa’s largest exporter of oil and exported some ofits oil to many countries including the USA, India, France, Italy, Spain, Canada,and the Netherlands.2 Finding costs for Africa had jumped from $7.55 perbarrel in 2002–3 to $15.25 in 2003–5.3 In 2003, lifting costs and productiontaxes were $3.57 and $1.00 per barrel respectively. Table 9.1 shows the June2007 gasoline prices, taxes, cost per barrel of oil, and currency exchange ratesfor the Organization for Economic Cooperation and Development (OECD)countries as reported by the International Energy Agency (Agence Internation-ale de L’energie), an OECD agency.4 There are 158.98 liters to the barrel. Thejoint ventures that produced oil in Nigeria are shown in Table 9.2.5 The pricethat consumers paid for gasoline reflected the cost of crude oil to refiners,refinery processing costs, marketing and distribution costs, the retail stationcosts, and taxes. Crude oil costs, in turn, included the cost of exploring andfinding oil, drilling for it, pumping it out, transporting it to refiners, and exporttaxes paid to the exporting country.
Question 1: How much of the value in a liter of gasoline using crude fromNigeria was captured (1) by each OECD country, (2) by the oil com-panies, and (3) by Nigeria? How much of the value was created bygovernments?
Question 2: Can you explain the difference between the amount appropriatedby Nigeria and that appropriated by each OECD country?
Answer
We perform the calculations for France first, and simply state the results for theother countries. All calculations are in US dollars and liters.
Of the $1.771 paid by customers in France for a liter of gasoline (Table 9.1),France captured $1.101 (62.17%). Therefore, the amount left to be shared byother players in the value chain is $0.670 ($1.771 − 1.101); that is, $0.670 ofthe $1.771 has to be shared by (a) the oil companies that explore for crude oil,drill, pump, and transport it to refineries; (b) the refiners (often oil companies)
224 Opportunities and Threats

who refine, market, and transport to gas stations for sale to customers, and thegas station’s take; and (c) the exporting country, Nigeria in our case.
We are told that the average crude price in France in April 2007 was $65.72/barrel = ($65.72/158.98) per liter = $0.4134/liter. Therefore distribution andmarketing, and refining and profits account for $0.2566 ($0.670 − $0.4134) or
Table 9.1 June 2007 OECD Gasoline Prices and Taxes
Country Price (incountry’scurrency)
Tax (incountry’scurrency)
Exchangerate for adollar
Price(US$)
Tax(US$)
April crude oilprices (US$/barrel)
France (�) 1.316 0.818 0.743 1.771 1.101 65.72
Germany (�) 1.393 0.877 0.743 1.875 1.180 65.67
Italy (�) 1.348 0.789 0.743 1.815 1.063 64.51
Spain (�) 1.079 0.545 0.743 1.452 0.733 63.73
UK (£) 0.966 0.628 0.504 1.917 1.246 67.73
Japan (Yen) 139.000 60.400 121.610 1.143 0.497 62.38
Canada (C$) 1.066 0.312 1.061 1.005 0.294 65.96
USA (US$) 0.808 0.105 1.000 0.808 0.105 59.64
Source: International Energy Agency (Agence Internationale de l’Energie), OECD/IEA (2007). End-user petroleumproduct prices and average crude oil import costs. Retrieved August 9, 2007, from http://www.iea.org/Textbase/stats/surveys/mps.pdf.
Table 9.2 Oil Joint Ventures in Nigeria
Joint venture operated by: Estimated productionin 2003 (barrels perday)
% of Nigerianproduction in 2003
Partners in jointventure (share inpartnership)
Shell Petroleum DevelopmentCompany of Nigeria Limited (SPDC)operated by Royal Dutch Shell, aBritish/Dutch company
950,000 42.51 NNPC (55%)Shell (30%)TotalFinaElf (10%)Agip (5%)
Chevron/Texaco Nigeria Limited(CNL), operated by Chevron/Texacoof USA
485,000 21.70 NNPC (60%)Chevron (40%)
Mobil Producing Nigeria Unlimited(MPNU), operated by Exxon-Mobilof USA
500,000 22.37 NNPC (60%)Exxon-Mobil (40%)
Nigerian Agip Oil Company Limited(NAOC), operated by Agip of Italy
150,000 6.71 NNPC (60%)Agip (20%)ConocoPhillips(20%)
Total Petroleum Nigeria Limited(TPNL), operated by Total of France
150,000 6.71 NNPC (60%)Elf (now Total)(40%)
Source: Energy Information Administration of the US Department of Energy (2003), Nigeria. Retrieved July 30, 2007,from http://www.eia.doe.gov/emeu/cabs/ngia_jv.html.
Globalization and New Games 225

14.49% of the $1.771. The crude price of $0.4134/liter includes finding costs,lifting costs, production taxes, and “profits” for exporting country and oilcompany partners.
The question now is, what fraction of the $0.4134/liter goes to Nigeria. Toestimate Nigeria’s share, we first estimate the finding and lifting costs, andproduction taxes as follows:
the cost of oil extraction is $19.83 ($15.25 finding costs + $3.57 lifting costs+ $1.00 production taxes) per barrel = ($19.83/158.97) per liter = $0.1247per liter.
Thus, finding costs, lifting costs, and production taxes account for $0.1247or 7.04% of the $1.771 price per liter. Therefore Nigeria and its venture part-ners (Shell, Chevron/Texaco, Agip, Total, Mobil) are left with $0.2887($0.4134 − 0.1247) to share. To estimate Nigeria’s share of the oil ventures, wefirst estimate what share of the oil shipped belongs to it. The weighted averageof Nigeria’s share is 57.87% (from Table 9.2, the sum of Nigeria’s percentownership in each venture multiplied by the number of barrels produced perday by the venture, all divided by the total number of barrels per day from allventures). Therefore, of the $0.2887 amount, Nigeria appropriates $0.1671(0.5787 × 0.2887) or 9.43% of the $1.771 that the customer pays per liter whileits partners appropriate the remaining $0.1216 ($0.2887 − 0.1671) or 6.87%of the $1.771. The results are summarized in Table 9.3.
This calculation can be repeated for each OECD country. The results fromthese calculations are summarized in Table 9.4, and displayed in Figure 9.1.France appropriates more than six times the value that Nigeria appropriatesfrom Nigerian oil and more than eight times the value that Nigeria’s oil com-pany partners appropriate. By oil companies, we mean the companies thatexplore for and find oil, drill for it, lift it (pump it into tankers), transport it torefineries, refine it, distribute it, and sell it—the companies that create most ofthe value that customers pay for. Germany appropriates a little more thanFrance while Italy and Spain appropriate slightly less than France but still a lot
Table 9.3 What Each Player Gets
Player(s) Amountappropriatedper liter ($)
Percentageappropriated
Comment
The French Government 1.1010 62.17
Distribution and marketing, and Refining andprofits
0.2566 14.49
Crude oilFinding costs, lifting costs and production taxes 0.1247 7.04
Nigeria 0.1671 9.43 $0.4134 (23.34%)
Venture partners (Shell, Chevron/Texaco, etc)combined
0.1216 6.87
Total (per liter French price) 1.7710 100.00
226 Opportunities and Threats
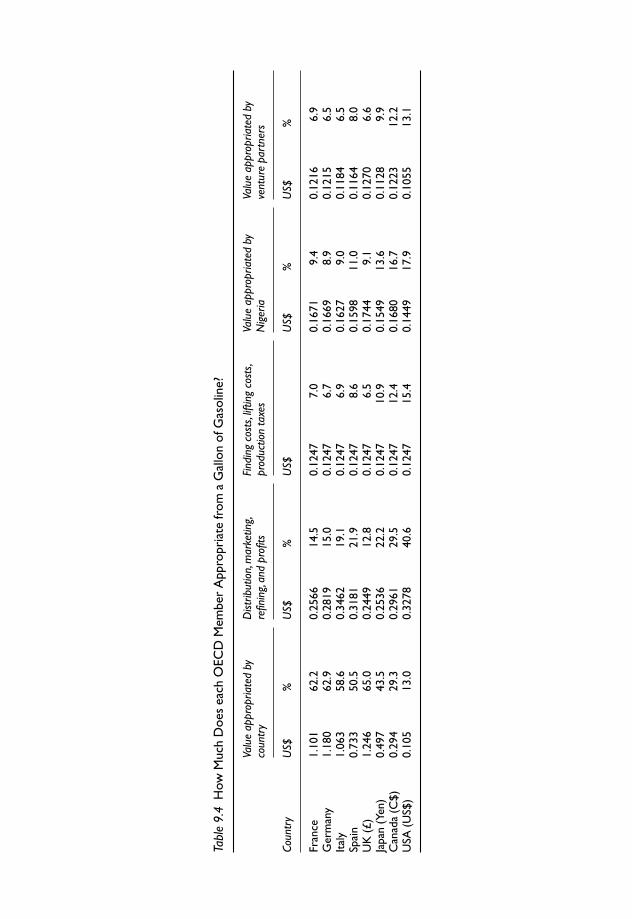
Tabl
e 9.
4H
ow M
uch
Doe
s ea
ch O
ECD
Mem
ber
App
ropr
iate
from
a G
allo
n of
Gas
olin
e?
Valu
e ap
prop
riate
d by
coun
try
Dist
ribut
ion,
mar
ketin
g,re
finin
g, an
d pr
ofits
Find
ing
cost
s, lif
ting
cost
s,pr
oduc
tion
taxe
sVa
lue
appr
opria
ted
byN
iger
iaVa
lue
appr
opria
ted
byve
ntur
e pa
rtne
rs
Coun
try
US$
%U
S$%
US$
US$
%U
S$%
Fran
ce1.
101
62.2
0.25
6614
.50.
1247
7.0
0.16
719.
40.
1216
6.9
Ger
man
y1.
180
62.9
0.28
1915
.00.
1247
6.7
0.16
698.
90.
1215
6.5
Ital
y1.
063
58.6
0.34
6219
.10.
1247
6.9
0.16
279.
00.
1184
6.5
Spai
n0.
733
50.5
0.31
8121
.90.
1247
8.6
0.15
9811
.00.
1164
8.0
UK
(£)
1.24
665
.00.
2449
12.8
0.12
476.
50.
1744
9.1
0.12
706.
6Ja
pan
(Yen
)0.
497
43.5
0.25
3622
.20.
1247
10.9
0.15
4913
.60.
1128
9.9
Can
ada
(C$)
0.29
429
.30.
2961
29.5
0.12
4712
.40.
1680
16.7
0.12
2312
.2U
SA (U
S$)
0.10
513
.00.
3278
40.6
0.12
4715
.40.
1449
17.9
0.10
5513
.1

more than Nigeria, the oil exporting country. It should be noted that only USfederal taxes are included. Including US State taxes could alter the numbers forthe USA.
Implications of Government’s Insertion into a Value Chain
By imposing a tax on an import or a subsidy on an export, a government isinserting itself into the product’s international value chain and influencing theway value is created and appropriated by each player. This can have hugeconsequences on globalization. We consider the effects of taxes and subsidiesseparately.
Effect of Import Duties and Taxes
By appropriating 62% of the value in a liter of gasoline, the French governmentis extracting some consumer surplus from customers as well as some suppliersurplus from the oil companies and exporting countries such as Nigeria. (Con-sumer surplus is the benefit perceived by customers minus the price paid bycustomers.) How much of the value extracted is supplier surplus and how muchis consumer surplus depends on the price elasticity of demand for oil. The priceelasticity of demand of a product is the change in quantity demanded that
Figure 9.1 Who Appropriates How Much from Nigerian Oil?
228 Opportunities and Threats
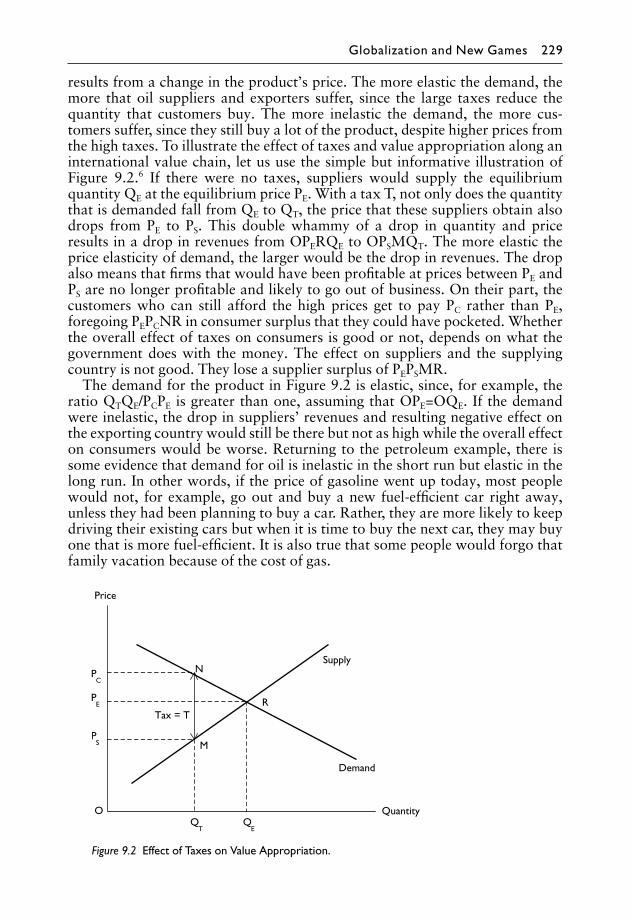
results from a change in the product’s price. The more elastic the demand, themore that oil suppliers and exporters suffer, since the large taxes reduce thequantity that customers buy. The more inelastic the demand, the more cus-tomers suffer, since they still buy a lot of the product, despite higher prices fromthe high taxes. To illustrate the effect of taxes and value appropriation along aninternational value chain, let us use the simple but informative illustration ofFigure 9.2.6 If there were no taxes, suppliers would supply the equilibriumquantity QE at the equilibrium price PE. With a tax T, not only does the quantitythat is demanded fall from QE to QT, the price that these suppliers obtain alsodrops from PE to PS. This double whammy of a drop in quantity and priceresults in a drop in revenues from OPERQE to OPSMQT. The more elastic theprice elasticity of demand, the larger would be the drop in revenues. The dropalso means that firms that would have been profitable at prices between PE andPS are no longer profitable and likely to go out of business. On their part, thecustomers who can still afford the high prices get to pay PC rather than PE,foregoing PEPCNR in consumer surplus that they could have pocketed. Whetherthe overall effect of taxes on consumers is good or not, depends on what thegovernment does with the money. The effect on suppliers and the supplyingcountry is not good. They lose a supplier surplus of PEPSMR.
The demand for the product in Figure 9.2 is elastic, since, for example, theratio QTQE/PCPE is greater than one, assuming that OPE=OQE. If the demandwere inelastic, the drop in suppliers’ revenues and resulting negative effect onthe exporting country would still be there but not as high while the overall effecton consumers would be worse. Returning to the petroleum example, there issome evidence that demand for oil is inelastic in the short run but elastic in thelong run. In other words, if the price of gasoline went up today, most peoplewould not, for example, go out and buy a new fuel-efficient car right away,unless they had been planning to buy a car. Rather, they are more likely to keepdriving their existing cars but when it is time to buy the next car, they may buyone that is more fuel-efficient. It is also true that some people would forgo thatfamily vacation because of the cost of gas.
Figure 9.2 Effect of Taxes on Value Appropriation.
Globalization and New Games 229

Effect of Export Subsidies
A government can also influence globalization activities in an industry by sub-sidizing exports. An export subsidy is an amount that each supplier (exporter)is paid for a certain quantity that it exports. The subsidy can be in the form of acash payment, a tax break, or the free use of government assets such as land.Subsidies are usually good for the exporters but not for the competitors that thesubsidized firms face in the global market. To understand what the impact ofexport subsidies can be on competitors and the importing country, considerFigure 9.3.7 Without subsidies, all exporters can sell a quantity QE at a price PE.Suppose a government decides to subsidize its exporters with a subsidy d. Withthe subsidy, suppliers who would have exported their products at a loss becauseof their high cost structures can remain in the market because they are now,given the subsidies, getting an effective price of PS instead of PE. Because of thesubsidy, the price that subsidized exporters charge customers is actually PC. Theoverall effect is that more of the product is sold at lower prices than before thesubsidy. Customers get lower prices, thanks to the subsidies. However, for sup-pliers that do not have the subsidies and whose costs are higher than the newsubsidized price, subsidies can spell disaster. An example that has been used toillustrate the bad effects of subsidies is that of cotton farmers in Niger andMali.8 Many farmers in these countries, most of whom lived on less than adollar a day, took loans from the World Bank to grow cotton. Because UScotton farmers were subsidized by the US government, they were able to sellcotton in the world market at prices that were well below those of the unsubsid-ized farmers in Niger and Mali, for example. The result was that farmers fromNiger and Mali sold their cotton at a loss and many of them went out ofbusiness.
Figure 9.3 Effect of Subsidies on Value Appropriation.
230 Opportunities and Threats

Classifying Value Creators and AppropriatorsWe can classify members of a value chain as a function of whether they capturemore value than they create or create more value than they capture. This clas-sification is shown in Figure 9.4. The vertical axis of the figure captures theextent to which a firm’s contribution to value creation is high or low, while thehorizontal axis captures the extent to which a firm’s value appropriation is lowor high. We use animals and insects to represent the different types of player.
Bees
In every value chain, there are usually some firms or individuals who create lotsof value but do not get to appropriate a lot of it. Like bees, these firms orindividuals work very hard all the time to create value but other players capturemore it than they deserve, leaving these bees with less than they created (otherplayers take away their honey). From our example above, the companies thatfind, drill, and pump oil would fall into this category. They capture value, allright; but not as much as they create compared to the exporting and importinggovernments. As we saw in Chapter 4, there are several reasons why a firm maynot be able to capture all the value that it creates. One of these reasons is thatthe player with more power may capture more value than it creates. In the oilindustry case, governments have more power than the oil companies and cantherefore appropriate more value than the creators of the value. In countrieswhere governments regulate drug prices, it is possible that pharmaceuticalcompanies appropriate less value than they create when they sell drugs at lowerprices than patients or insurance companies and governments may be willing topay. Where drug prices are not regulated, it is also possible that firms extract
Figure 9.4 Who Appropriates More Value than It Creates?
Globalization and New Games 231

more from desperate patients than the drugs are worth. It is possible that coffeegrowers capture very little of the value that coffee drinkers perceive in a cup ofcoffee. It is also possible that cocoa growers capture only a very small fractionof the value that chocolate lovers perceive in a bar of chocolate.
Beavers (Ants)
In some value chains, the firms that work hard to create value get to appropriateall of it. We liken such firms to beavers who work very hard to create value andoften derive lots of benefits from their hard work.
Foxes (Piranha, Vulture, Crocodile)
As we saw in the oil industry example, some firms or governments appropriatea lot more value than they create. In some cases, they do not even create valuebut get to appropriate a lot of it. They reap a lot more than they sowed. Suchplayers are more like foxes since they do very little but capture a lot of value.They have been called piranhas, and vultures.
Bears
In their value chains, some firms play niche roles in which they do not caremuch about having a competitive advantage. They do enough just to get by.They are the opposite of beavers who work all the time. They are more likebears. They create very little value and do not appropriate much of it either.
GlobalizationGlobalization is the interdependence and integration of people, firms, and gov-ernments to produce and exchange products and services.9 It creates opportun-ities for new jobs, learning, new and improved products/services, increasedtrade, financial flows, and enhanced standards of living. However, globalizationalso poses a threat to some businesses, jobs, and ways of living. That is particu-larly true when globalization is not pursued correctly. If pursued well, global-ization can result in improvements in the standard of living of participants—itcan be a positive-sum game, that is, if globalization is pursued well, everyoneshould be better off. If not pursued well, it becomes a zero-sum or even anegative-sum game. That may be one reason why to some people, globalizationmeans the dominance of the rest of the world by a few countries and powerfulfirms at the expense of local jobs and cultures. And to others, it means exploit-ation of the poor in developing countries, the destruction of the environment,and the violation of human rights. To advocates of globalization, however, it isa powerful tool for reducing poverty as the world’s economies and societies getmore and more integrated. Each player has a better chance of creating or addingvalue to something that someone somewhere in the world values. Each playeralso has a better chance of finding something that he or she likes.
For a firm, globalization is about asking and answering questions such as:what is the right product space and system of activities—what set of activitiesmeets the need for local responsiveness and exploits the benefits of global inte-
232 Opportunities and Threats

gration? How does a firm build the right resources/capabilities from the rightcountries? How does a firm deal with each country’s macroenvironment, espe-cially with the different governments? For an oil firm, for example, decidingwhich country to explore for oil, working with government officials of thecountry, investing in the oil fields, locating the right people and equipment,finding the oil, pumping it out, transporting it, dealing with governments ofimporting countries, and refining and distributing the oil are all globalizationissues with which it has to deal.
The Multinational Corporation
A major player in globalization is the multinational corporation. A multi-national corporation (MNC) is a firm that has market positions and/orresources/capabilities in at least two countries. (From now on, we will use theword “resources” when we really mean “resources/capabilities.” We will alsouse “products” when we really mean “products and services.”) MNCs increas-ingly depend on sales and resources from outside of their home countries. Theycan be grouped as a function of where they choose to sell their products, and ofthe resources that they need. This classification is shown in Figure 9.5. In thefigure, the vertical axis captures the effect of a firm’s market-position. In par-ticular, it captures whether a firm’s products and services are sold domesticallyonly or in other countries as well. The horizontal axis captures the extent towhich the valuable resources/capabilities that a firm needs to make (conceive,design, develop, and manufacture) the product are domestic only or are also
Figure 9.5 Types of Multinational.
Globalization and New Games 233

foreign. If the resources that a firm needs to make its products are all from itshome country and the firm sells all its products within its home country, we callit a domestic corporation (Figure 9.5). Many small businesses fall into thiscategory. If a firm designs, develops, and produces its products at home, butsells them in two or more countries, we say the firm is a position multinationalsince it has product-market positions in countries other than its home country.Japanese car companies in the 1960s and 1970s were largely position multi-nationals. All their cars were designed, developed, and manufactured in Japanand shipped to the US and other countries for sale. When a firm’s design,development, and production of a product is done in many countries but theproduct is sold in only one country, the firm is said to be a resource multi-national since it depends on more than the home country for its capabilities.Early in the life of US tire companies, they established rubber plantations indifferent developing countries and shipped the rubber to the USA to be used tomake tires that were sold only to domestic car companies. If a firm sells itsproducts in two or more countries and the resources that it needs come fromtwo or more countries, the firm is classified as a global multinational. Most oftoday’s major companies fall into this category. Intel’s microprocessors aresold all over the world and the company has design centers and microchipfabrication and assembly plants in many countries.
Drivers of Globalization
What makes globalization more likely to take place than not? What drivesmore cross-border utilization of labor and know-how, exchange ofknowledge, movement of capital, trade, human migration, and integration offinancial markets and other activities? Four factors influence the process ofglobalization:
1 Technological innovation2 Consumer tastes3 Government policies4 Firm strategies.
Technological Innovation
One of the largest drivers of globalization has been technological innovation.First, technological innovation has made it possible to develop products thatmore and more people all over the world like, thereby facilitating trade in theseproducts and the integration of the activities that underpin the products. Forexample, the cell phone—a technological innovation that is itself a product ofmany technological innovations—is a product that most people in the worldwant. The microchips, LCD screen, battery and many components that go intoa cell phone are complex systems that require different skills and know-howthat many different countries possess. Designing, developing, marketing, sell-ing, and delivering this global product requires the integration of ideas, skills,products, and people from different countries. The same can be said of jetengines, the Internet, jet planes, computers, drugs such as Viagra, Prozac, andLipitor, and so on.
234 Opportunities and Threats

Second, technological innovation has facilitated communications, capitalflows, exchange of know-how, interaction between people and firms, andreduced transportation time and costs. Because of the Internet, designers for amajor company in Japan can work on a design, hand it over to fellow designersin Europe before leaving for the day. Before the engineers in Europe go homefor the day, they can also hand over the design to engineers in California, whohand over to their Japanese counterparts before going home for the day. Theengineers in each of these countries can be of different nationalities who justhappen to want to live in the countries. Financial institutions use the Internetand other communications and computer systems to route funds all over theworld. These funds can finance international projects from major chip fabrica-tion plants in Silicon Valley or Asia to micro-projects in southern Africa. Avail-ability of the Internet also means that people can compare prices of productsand labor from all over the world, often instantaneously. Worldwide telecom-munications systems also mean that firms can advertise better and try to har-monize consumer tastes. Lower communications and transportation costsmean that consumers are more exposed to lower-cost products that theymay like.
Some of the first innovations to have a huge impact on globalization were intransportation. Motorized ships that ran across the Atlantic Ocean played amajor role in the transatlantic migration and trade that were critical to buildingthe American economy. Later, the jet airplane would change world travel notonly by transporting people worldwide but also by transporting importantbusiness documents in much shorter times. More importantly, ocean trans-portation has become so cost-effective that steel, as heavy as it is, can be madein Korea and still be cost-competitive in California. Effectively, technologicalprogress moves the vertical line AB in Figure 9.5 leftwards, increasing the zonein which global and resource multinational activities can take place. It alsomoves the line CD downwards, thereby increasing the zone in which positionand global multinational activities can take place.
Consumer Tastes and Needs
Consumer tastes and needs have always been a major driver of globalization.Europeans’ taste for spices, for example, was an important reason for theirtrading with India and why Columbia ended up in the Americas. Diseases inmany countries can be cured by medications developed in others. Some of thesetastes or needs are dormant until awakened by firms through advertising or theintroduction of a new product. Very few people in the world knew that theyneeded the Internet or cell phones until the products were introduced. Lowercommunications and transportation costs often mean more availability of low-cost products that can influence consumers’ taste. Consumers’ tastes can also beinfluenced by the experiences that they had as a result of innovations in com-munications and transportation that made it possible for them to travel to otherlands, or find out about them via, for example, the Internet.
Globalization and New Games 235

Government Policies
Government policies play one of the most significant roles of all the drivers ofglobalization. Governments can use quotas, tariffs, taxes, subsidies, and importduties to stifle or greatly facilitate imports or production. In addition to havingan influence on what gets imported, governments can have great influence overwhat is produced and exported. In some sectors such as healthcare, some gov-ernments control prices, and what can or cannot be sold. Governments alsoinfluence the other drivers of globalization such as technological innovations intransportation and communications. A country can decide to enforce or notenforce intellectual property protection laws. Governments control the flow ofcurrency and therefore investment capital. A country’s ability to protect foreigninvestments from vandalism or nationalistic activities also plays a role in whoinvests in the country.
Multinationals’ Strategies
Globalization is also driven by the extent to which firms want to take advantageof the other drivers of globalization to create and appropriate value. Forexample, if a firm’s strategy rests on extending its existing core competences tomany markets, using worldwide labor, taking advantage of economies of scale,or learning from abroad, the firm may decide to push for globalization. As partof its strategy, a firm may advertise to influence consumer tastes in differentcountries, or work with policy makers in different countries to obtain legisla-tion that favors globalization. Many multinational corporations have largerbudgets than most poor countries and can be very influential when it comes toglobalization legislation. They can also innovate to offer the kinds of productthat will help consumers discover their latent needs. They can not only influencethe flow of capital to their worldwide investment sites but also help bring downtrade barriers by influencing policy makers.
Why Firms Go International (Global)
The question is, why would any firm want to enter global markets or expand itsexisting global activities rather than focus on its home market? Why would anydomestic company want to become a multinational? There are several reasonsfor going global, or expanding globally:
• Search for growth• Opportunity to stabilize earnings• High cost of production at home• Following a buyer• Offensive move• Opportunity to take advantage of scale economies• Easier regulations overseas• Larger market abroad• Chance to learn from abroad.
236 Opportunities and Threats

In Search of Growth
If a firm’s domestic market is stagnant, declining, too competitive, mature, ornot growing fast enough, the firm may see foreign markets as places where itcould find the growth that it does not have at home. This is particularly true ifthe firm’s market valuation has factored in growth, and capital markets expectthe firm to continue to grow at a rate that the home market cannot support.One of many alternatives is for the firm to diversify into other markets within itshome country, unless there are other compelling reasons to go global.
Opportunity to Stabilize Earnings
Since a firm’s profits often depend on domestic economic factors, its profits arelikely to rise and fall with domestic economic cycles. By going international, afirm may be able to reduce this cyclicality if it can successfully enter a countrywith the right cyclicality.
High Cost of Production at Home
One of the most common reasons for firms to go international is the highdomestic cost of factors of production. For example, the cost of labor for low-tech manufacturing in many western countries and Japan has become so highthat many firms in the West move some of their manufacturing activities toChina, Taiwan, Korea or India.
Firm May Be Following Buyer
Very often, a firm goes international because its key buyer is going inter-national. Some Japanese auto suppliers moved with the automobile makerswhen the latter decided to start assembling cars in the USA. When McDonald’sentered the Russian market, the J.R. Simplot Company went along to producepotatoes for McDonald’s french fries.
Offensive Move
A firm can also start operating in a foreign country to preempt competitors thatit believes are likely to enter the foreign country. This is particularly true if thereare first-mover advantages to be had in the foreign country.
Economies of Scale and Extension of Capabilities
When a firm offers a product with very high fixed (upfront) costs and very littleor no variable costs, every unit sold after the breakeven volume is profit. Goingglobal increases a firm’s chances of selling even more units and making evenmore money. This is particularly true for products such as software that do notneed major modifications to suit local tastes and therefore can be sold anywherein the world at little extra cost. This is also particularly true if the home marketis very small relative to the minimum efficient scale of the firm’s technology.One reason why many Swiss firms such as Nestlé went international very early
Globalization and New Games 237

was because their home market was too small for the kinds of volume that theyneeded in order to compete with foreign firms that had larger home markets.
Regulations Overseas May be Easier than at Home
It is not unusual for developing economies to have little or no regulations onsafety and environmental pollution, and no anticompetition laws. Some firmsmay move to these countries to take advantage of these laws.
Larger Market and Free Market Principles
Some markets are simply larger and more free market than others. Thus, firmsmay enter such markets to take advantage of the large size and free-marketatmosphere. The USA is one such country.
Learn from Abroad (Market Idea, Acquire New Skills, etc.)
Although it has traditionally been thought that knowledge flow is one way—from the home country to the host country into which the firm is moving—thereis growing recognition that firms can also learn from their host countries andtake the knowledge home or to other markets.
Globalization for a Competitive AdvantageSuppose a firm wants to sell its products to a foreign country or take advantageof the resources in the foreign country to produce new products. Is there any-thing that it can do to increase its chances of having a competitive advantage asa result of the move? A framework for exploring this question is shown inFigure 9.6. As we saw in Chapter 1, a firm’s profitability in a market is afunction of its PMP and the resources that underpin the position. Recall that afirm’s product-market position consists of the benefits (low-cost or differenti-ated products) that the firm offers and its position vis-à-vis coopetitors. Tooccupy such a position and perform the relevant activities, a firm needsresources. Thus, we can explore the profitability of a firm’s entry into a foreigncountry as a function of its PMP in the new country and the resources that ituses to create and/or appropriate value in the country (Figure 9.6).
Unique Product-Market Position (PMP)
The vertical axis captures the PMP that the firm occupies—whether the positionis unique (white space, sweet spot) or a battlefield. Occupying a unique PMPmeans that a firm (1) offers a product with benefits that no one else in themarket segment or country does, and/or (2) performs a distinctive system ofactivities that underpins the benefits. The benefits can be product features, loca-tion, lower cost, or better bang for the buck. The PMP can be unique because ofthe perceived uniqueness of product features. It can also be unique because ofthe location or region of the country that the firm serves. The unique positioncan be in one country or in many countries. Since the benefits that the firmoffers its customers are unique, the effect of rivalry on the firm is low, the threat
238 Opportunities and Threats

of substitutes is low, and the firm has more power over buyers than it wouldhave if it were in a battlefield. The fact that a firm moves into a unique positiondoes not tell us much about barriers to entry or its position vis-à-vis suppliersbut there are things that the firm can do to raise barriers to entry into its uniquespace and increase its power over coopetitors. For example, it can pursue first-mover advantages such as building switching costs at customers. Building abrand that is associated with the unique space can also raise barriers to entry.
A battlefield is a product-market space that already has players. Such playershave usually been in the market long enough to have developed rivalries, under-standings, cooperative relationships and other capabilities to create andappropriate value in the market. Why would anyone enter a battlefield?Although battlefields can be rife with competition, they have some advantages.Technological and marketing uncertainties are usually reduced and a newentrant with important complementary assets may be able to do well. A firmmay also enter because it has distinctive resources that it uses to give it anadvantage in the foreign country. Many firms do enter battlefields. Some do sobecause they believe that there is something distinctive about them that willallow them to win when they come in. Others do so because of other strategicreasons. In any case, a firm is usually better off pursuing a unique PMP.
Valuable Global Resources/Capabilities
The horizontal axis of Figure 9.6 captures the type of major global resources/capabilities that a firm utilizes to conceive of, design, manufacture, market theproduct, and position itself to make money—whether the resources are scarce
Figure 9.6 Different Global Strategies.
Globalization and New Games 239

and important, or easily available or unimportant. Resources are scarce andimportant if they are difficult to imitate or substitute, and make a significantcontribution towards value creation or appropriation. These resources can be ina firm’s home country, in the foreign country that the firm is entering, orworldwide. Examples of scarce and important resources include exclusiverights to explore oil in oil-producing countries, relationships with governmentofficials in foreign countries, patents in pharmaceuticals, shelf space in offlinestores, some major brands, a large network in an industry that exhibits networkexternalities, etc. Such resources therefore stand to give a firm a competitiveadvantage. If the resources are important but easy to imitate, their ownersquickly lose any advantage that they may have had as competitors swoop in,making it difficult to appropriate any value that a firm may have created usingthe important resources. An example of resources that are important but easy toimitate is low-tech manufacturing capabilities. They are important but becausethey are usually easy to imitate and therefore easily available, we classify themas “easily available or unimportant” in Figure 9.6.
Global Strategy Types
Depending on whether a firm decides to pursue a unique PMP or enter a battle-field, has scarce difficult-to-imitate resources or can build them, a firm’s strategyfalls into one of the following four categories: global adventurer, global star,global heavyweight, and global generic (Figure 9.6).
Global Adventurer
In a global adventurer strategy, a firm enters a country or countries by occupy-ing a unique PMP, but the major resources/capabilities that it uses to create andappropriate value are easily available or unimportant. The product thatembodies the unique value can target one country or many countries. Theproduct can be made in the foreign country or in the home country andexported to the foreign country. Many exports that target an unmet need in acountry fall into this category. Japanese automobile makers were utilizing aglobal adventurer strategy when they exported fuel-efficient dependable cars tothe USA during the 1970s when US automakers GM, Ford, American Motors,and Chrysler focused on making larger and less fuel-efficient cars. All the majorresources for the cars were Japanese and although it may not feel that waytoday, selling small Japanese cars in the USA in the late 1960s through the1970s was an adventure.
A retailer that builds the first retail store in a region of a foreign country ispursuing an adventurer strategy. Whether the global adventurer strategy worksfor a firm is a function of the drivers of globalization—a function of techno-logical developments, consumer tastes, government policies, firm’s corporatestrategy, and the type of product in question. Take the example of Japanese carsin the USA in the 1970s. Shipping technology had improved to a point wherecars could be shipped cost-efficiently from Japan to California, 5,500 milesaway. Because of the oil crises in the USA in the 1970s, some consumers wereinterested in looking at fuel-efficient dependable cars. US government policieswere less protective at the time, compared to those of the governments of other
240 Opportunities and Threats

rich countries; that is, until the US government imposed a quota on Japanesecars. There had also been attempts by Japan’s powerful Ministry of Inter-national Trade and Industry (MITI) to prevent Honda from entering the carproduction business at home. An important part of Honda’s strategy was toexpand abroad and the large US market, where it had been selling motorcycles,presented some good opportunities. Its chances of growing profitably were bet-ter in the USA than in Japan.
A unique PMP gives a global adventurer some opportunities to take advan-tage of the new gameness of the position, including first-mover advantages.Honda went on to build a brand that associated the company with zippyengines and dependable reliable low-cost cars. It then, together with Toyota andNissan, introduced luxury cars to compete with BMW, Mercedes, and otherluxury imports to the USA. Honda introduced the Acura, Nissan the Infiniti,and Toyota the Lexus.
The primary advantage to the global adventurer strategy is the fact that itidentifies and focuses on a unique PMP with its associated benefits and short-comings. There is one major drawback to the strategy. Since the resources that aglobal adventurer uses are easily available or unimportant, the unique PMP canbe easily imitated unless the firm takes steps to build first-mover advantagesthat raise barriers to entry.
Global Star
In a global star strategy, a firm enters a country or countries by occupying aunique product-market space, and the global resources/capabilities that it usesto create and appropriate value are scarce and important. Thus, pursuing a starstrategy gives a firm both the advantages of having a unique PMP and scarceimportant resources. Ikea’s strategy for entering the US market in the 2000s isan example. It occupied a unique position, relative to its competitors (fun shop-ping experience, low-cost but fashionable furniture, no delivery, little in-storeservice, and furniture that was not guaranteed to last forever), and had a scarceand important worldwide network of experienced designers, and an ability tocoordinate and integrate the activities of its suppliers of materials and manu-facturers worldwide.10 Strategies for both the Airbus A380 and the Boeing 787also fall into this category. Each occupies a unique spot on the PMP maps forairplanes and the resources needed to offer the plans are scarce and important.Often, one of the important capabilities of a global star is its ability to coordin-ate and integrate resources and know-how from different countries and differ-ing cultures. Making both the A380 and Boeing 787 required coordination ofmany different resources and capabilities from different countries. Thiscoordination and integration is facilitated by technological innovation.
Global Heavyweight
In a global heavyweight strategy, a firm enters a country or countries by con-fronting existing competitors, but has scarce and important resources/capabil-ities that it uses to create and appropriate value. The resources can be from onecountry or many countries. Such a firm is effectively in a battlefield where itconfronts existing industry firms in creating and appropriating value, using its
Globalization and New Games 241

scarce resources. When an oil company goes into a country where other com-panies are already exploiting for oil and obtains exploration rights to find andsell oil to the world, it is employing a global heavyweight strategy. Airbuspursued a global heavyweight strategy when it introduced its A320 airplanes.The plane was designed to compete directly with the Boeing 737 and theMcDonnell Douglas DC 9 and MD-80. While some of the technological know-how to build the plane may have been easily available, the A320 fly-by-wiretechnology was the first in the category of planes. Moreover, coordinatingthe activities of the makers of major airplane components from French,German, and British companies was no easy task. Many of the ideas utilized inMcDonald’s restaurants in each European country came not only from thecountry and the USA, but also from other European countries.11
Global Generic
In a global generic strategy, a firm enters a country or countries by confrontingexisting competitors, and the major resources/capabilities that it uses are easilyavailable or unimportant. Firms that produce commodity products in low-costlabor nations and export them to other countries to compete with other com-modity products from other countries are pursuing this strategy. Many produ-cers of generic drugs for export usually have generic strategies; so do makers oftextiles. Many products are usually introduced to a foreign country throughexports that were designed, developed, and produced at the home country andexported to the foreign country. As the product gains acceptance, localresources are built to respond better to local differences.
Using New Games to Gain a Competitive AdvantageIf a firm’s chances of having a sustainable competitive advantage are best whenit pursues a global star strategy rather than the other three strategies, why can’tall firms pursue the same global star strategy? One reason is that not every firmhas the two drivers of success in pursuing each of these strategies: (1) the firm’sstrengths and handicaps in the face of the new game, (2) its ability to takeadvantage of the characteristics of new games to create and appropriate value.
Strengths and Handicaps
Recall from Chapter 5 that when a firm faces a new game, it usually has prenewgame strengths that can continue to be strengths in the face of the new game orbecome handicaps. For a domestic company that is going multinational byoffering the same products that it offered at home to other countries, twoobvious strengths are the firm’s domestic PMP and resources. If a firm offers alow-cost product domestically, it can usually take the resources that enabled itto produce the low-cost products to the foreign country or sell a version of thelow cost product in the foreign country. Effectively, if a firm’s domesticresources are scarce and important in the foreign market, they can become thebases for the firm to pursue a global star or heavyweight strategy. If thedomestic PMP is the basis for occupying a unique market segment or position inthe foreign country, the firm can pursue a global adventurer or star strategy.
242 Opportunities and Threats

When Toyota and Honda decided to enter the US automobile market, they usedboth their domestic resources and products to enter. When McDonald’s enteredforeign countries, many potential customers in the foreign countries hadalready visited the firm’s stores in the USA or were Americans visiting theforeign country or moving there to work. Intel’s domestic capabilities in micro-processors and worldwide acceptance of its PC enabled it to establish chipdesign centers, fabrication and assembly in countries outside the USA to makeand sell its products to anyone anywhere in the world. Effectively, if a domesticcompany has distinctive domestic products and resources, it can build on themto become a multinational.
A firm’s strengths at home can also turn out to be handicaps in foreigncountries. McDonald’s all-American image, which is a strength in the USA, didnot play well at first in France.12
Ability to Take Advantage of New Game Characteristics
The extent to which a firm can gain a competitive advantage in going inter-national is also a function of the extent to which it takes advantage of the newgame characteristics of going international. Recall that new games present afirm with an opportunity to:
• Take advantage of the new ways of creating and capturing new value gener-ated by the new game.
• Take advantage of opportunities generated by the new game to build newresources or translate existing ones in new ways.
• Take advantage of first-mover’s advantages and disadvantages, and com-petitors’ handicaps that result from the new game.
• Anticipate and respond to coopetitors’ reactions to its actions.• Identify and take advantage of opportunities and threats from the
macroenvironment.
Take Advantage of the New Ways of Creating and Capturing NewValue
When a firm decides to go international, it has to locate customers, offer thembenefits, and position itself to appropriate the value so created. In doing so, ithas the option to occupy a unique product-market space or challenge existingcompetitors in the country. As we saw above, a unique PMP has the advantagethat it is, on average, more attractive than a battlefield—the competitive forcesin a unique position are more friendly compared to those in a battlefield withseasoned competitors. However, a firm with distinctive domestic resources thatcan be transferred to the foreign country to address the needs of customers inthe battlefield may be able to enter the battlefield and do well. For example, upto the late 1980s, the US luxury car market had been dominated by BMW,Mercedes, Audi, and Cadillac. Toyota, Nissan, and Honda challenged theseincumbents using capabilities that they had built serving the low-end market.Toyota introduced its Lexus line of products in 1989 and using its design,lean manufacturing know-how, relationships with suppliers, and marketing,it won many awards. A firm may also choose to enter a battlefield by using
Globalization and New Games 243

technological innovations that render existing products in the market noncom-petitive, or render existing resources obsolete. For example, cell phone technol-ogy allowed many firms all over the world to compete successfully head-on withincumbent fixed-line telephone companies and win.
Take Advantage of Opportunities to Build New Resources or TranslateExisting Ones in New Ways
Different countries are endowed with different resources or levels of resources.Some countries have oil, others have gold, some have low-cost labor, othershigh-tech know-how, and so on. The level of the resource varies from onecountry to the other. For example, the level of high-tech know-how varies evenwithin the group of so-called high-tech countries. Thus, when a firm goes inter-national, it has an opportunity to acquire new resources in the foreign countryor bring in resources from its home country. Sometimes, these new resourcesare distinctive, and a firm can use them to produce and market its products inmany countries. For example, oil companies can acquire the rights to explorefor oil in different oilfields in different countries. If they are successful, these oilcompanies own the wells (often in partnership with local governments) and canrefine, distribute, and sell the oil from the wells in any country. In going inter-national, a firm can also build strong relationships with government officials toinfluence legislation and public opinion about its products or presence in thecountry.
When a firm goes international, it can also use some of its domestic resourcesto create and appropriate value in the foreign country. Such a firm is effectivelytranslating its resources in new ways.
Take Advantage of First-mover’s Advantages and Disadvantages, andCompetitors’ Handicaps that Result from New Game
If a firm is the first to offer a particular product in a country, it has theopportunity to build and take advantage of first-mover advantages. Such first-mover advantages are particularly important when a finite resource is involved.For example, if a firm is the first to go to a foreign country and discover oil orany other precious material, it has the opportunity preemptively to secure rightsto the oil well and exploration rights to nearby properties. Such fields are usu-ally limited and once they have been taken, there may be few or none left. Thefirm also has an opportunity to form partnerships with government-ownedcompanies such as the “national oil companies” of oil-exporting countries.Moreover, a firm that discovers minerals in a country first and forms partner-ships with the government is ahead of the learning curve for exploration in theparticular geology and in working with local officials. The firm also has anopportunity to shape regulation, and even the educational system as far as theparticular industry is concerned.
In industries where network effects are important, a first mover into a coun-try has an opportunity to build a large network with the right properties, anduse the network to its advantage. In online auctions, for example, the morepeople that belong to an online auction community such as eBay’s, the morevaluable it is to each member and the more that new potential members are
244 Opportunities and Threats

likely to gravitate towards the community. In the countries where eBay was thefirst to establish an online auction community, it did very well. In the onecountry where it was not the first—Japan—it did not do as well. Yahoo was thefirst to move to Japan in the auctions category and did very well.
In retail, for example, when a firm is the first to enter a country or region,it has an opportunity preemptively to take up the good retail locations. If thefirst mover builds the right number of stores and provides the right service,rational potential second movers would think twice before trying to build inthese locations, if to do so would result in price wars and unhealthy rivalry. Insome cases, the opposite may happen. Burger King usually locates nearMcDonalds.
Finally, if a firm moves into a country first, it has an opportunity to hire thebest employees first and work with them to build the type of culture that willkeep them at the firm, depriving followers of one of the cornerstones of thesuccess of any company.
Anticipate and Respond to Coopetitors’ Reactions to its Actions
In going international, it is also important for a firm to anticipate the likelyreaction of competitors. If the firm chooses to enter a unique PMP, it is import-ant to think of what competitors are likely to do when they find out that thefirm is making money in the unique space. If competing oil companies find outthat an oil company has found oil somewhere, they are likely to want to comein. Anticipation of such reactions by competitors is one reason why a firm maywant to intensify its efforts to build and take advantage of first-mover advan-tages since they increase barriers to entry. McDonalds should know that BurgerKing will be coming and should prepare accordingly.
If a firm chooses to enter a battlefield, incumbents in the field will either fightthe entry, forget about it, or cooperate. If the firm believes that incumbents willfight its entry, it can pursue one of several options. First, it can enter and fight ifit has the scarce resources that will give it an advantage over incumbents. It canalso enter and fight if it is using a disruptive technology or any other innovationthat stands to render incumbents’ existing products noncompetitive or theirresources obsolete. Second, the firm can decide to move into a unique spacerather than take on the fight. If the firm believes that incumbents will leave italone when it enters, it may want to enter but only after assuring itself that themarket will be large enough to support its entry and that incumbents might notchange their minds and become hostile. If incumbents want to cooperate, thefirm may want to enter. The question is, why would incumbents want tocooperate? They may be forced by government regulations to allow entry. Inthat case, the firm can enter but understand that the competitive forces fromrivalry, potential new entry, etc. may still be higher than being in a uniqueproduct space. Firms in a market may also welcome entry if they are forced by apowerful buyer to have second sources.
Globalization and New Games 245

Identify and Take Advantage of Opportunities and Threats ofMacroEnvironment
When going international, a firm is moving from one country’s political, eco-nomic, social, and technological system to another. Differences between homecountry macroenvironment and foreign macroenvironments can be consider-able. In some countries, governments can shut down businesses or nationalizethem for no good reason and the businesses have no legal recourse, while inother countries government actions against businesses have to have a legal basisand the firms have the right to challenge the government in a fair court system.In some countries, copyrights, patents, trademarks, and other intellectualproperty are respected and their protection monitored and enforced by thegovernment. In other countries there is very little or no intellectual propertyprotection. In some countries, governments have extra entry and exit barriersbeyond those dictated by the type of industry. In many countries, governmentsplay some role in the merger and acquisition of firms but in others, some gov-ernments may take a more nationalistic than economic approach.13 Somegovernments pay attention to the natural environment and corporate socialresponsibility while others do not. The list of differences goes on and on. In anycase, a firm that is going international may want to pay attention to the polit-ical, economic, social, and technological environment of the foreign countryinto which it is moving for any opportunities and threats of which it may wantto take advantage. For example, if a firm depends on its intellectual propertyprotection to give it a sustainable competitive advantage at home where viola-tion of such protections are prosecuted, the firm may have to find anothercornerstone for its competitive advantage or lobby the foreign government forchanges in its laws. The other side of the coin is that a firm that always wantedto enter an industry but could not because of intellectual property protection athome can move to a country where such protections are less restrictive.Some generic manufacturers of pharmaceuticals locate where patent protectionfor some drugs is, for national security and other reasons, not as strong as inthe USA.
Privatization and deregulation in foreign countries, and technological changein general often pose opportunities and threats for a firm that is going inter-national. In privatization, businesses that were owned by a government are soldto the private sector (individuals or businesses). Privatization presents anopportunity for a firm to enter a country and take over existing assets andproducts. Because government-owned businesses are often state monopolies,buying them gives a firm a chance to operate as a near monopoly or as part of aduopoly. The disadvantage is that the culture at government-owned firms maynot be conducive to competing for profits, and changing such a culture can bevery difficult. In deregulation, governments simplify, reduce, or eliminaterestrictions on the way firms conduct business to increase efficiency and tolower prices for consumers. The easing or elimination of restrictions can createan opportunity for a firm to move into the deregulating country in a profitableway. For example, as we saw in Chapter 2, Ryanair took advantage of Euro-pean Union deregulation of the airline industry in the Union to build aprofitable business. Technological innovation also presents opportunities forfirms that are going international. The case of cell phones in countries where
246 Opportunities and Threats

fixed-line telephones, run by government monopolies, had failed illustrates howthe combination of privatization, deregulation, and technological innovationcan make a big difference in a foreign country. For example, in Nigeria, Gabon,Kenya, and Cameroon where governments deregulated and privatized tele-coms, foreign companies entered with cell phone businesses in each country anddid very well.
Key Takeaways
• At the international level, governments can capture a lot of the value thatfirms create.
• Actors (firms and governments) can be classified as a function of whetherthey create the value that they capture: bees create lots of value but otherscapture most of what they create. Beavers create lots of value and capturemost of it. Foxes create little or no value but capture a lot of the valuecreated by others. Bears create little value and capture little too.
• Government-imposed taxes and subsidies can result in value destruction.• Globalization is the interdependence and integration of people, firms, and
governments to produce and exchange products and services.• A key character in globalization is the MNC. This is a firm that has estab-
lished PMPs and/or resources/capabilities in at least two countries. A firm isa position multinational if it designs, develops, and produces its products athome, but sells them in two or more countries. If a firm’s design, develop-ment, and production of a product is done in many countries but the prod-uct is sold in only one country, the firm is said to be a resource multi-national. If a firm has market positions in two or more companies and theresources that it needs come from two or more countries, the firm isclassified as a global multinational.
• The extent to which globalization takes place in an industry is a function of:
� Technological innovation� Consumer tastes and needs� Government policies� Multinationals’ strategies.
• Some reasons for firms going global or expanding globally include:
� The search for growth� Opportunity to stabilize earnings� High cost of production at home� Following a buyer� Offensive move� Opportunity to take advantage of scale economies� Easier regulations overseas� Larger market abroad� Chance to learn from abroad.
• In using new games to go international, a firm can locate in a uniqueproduct-market space where it offers unique value to customers and has fewcompetitors, or can enter a battlefield where there are already competitors.The resources that a firm uses to create and appropriate value in a unique
Globalization and New Games 247

product space or battlefield can be either scarce and important resources, oreasily available or unimportant. In going international, four strategies arepossible:
� In a global adventurer strategy, a firm enters a country or countries byoccupying a unique product-market space, but the major resources/cap-abilities that it uses to create and appropriate value are easily availableor unimportant.
� In a global star strategy, a firm enters a country or countries by occupy-ing a unique product-market space, and the global resources/capabil-ities that it uses to create and appropriate value are scarce andimportant.
� In a global heavyweight strategy, a firm enters a country or countries byconfronting existing competitors, but has scarce and importantresources/ capabilities that it uses to create and appropriate value.
� In a global generic strategy, a firm enters a country or countries byconfronting existing competitors, and the major resources/capabilitiesthat it uses are easily available or unimportant.
• If a firm’s chances of having a sustainable competitive advantage are bestwhen it pursues a global star strategy rather than the other three strategies,why can’t all firms pursue the same global star strategy? One reason is thatnot every firm has the two drivers of success in pursuing these new gamestrategies:
1 A firm may not have the right strengths and handicaps—from its exist-ing PMP and resources/capabilities—in the face of the new game.
2 A firm may not have the ability to take advantage of the characteristicsof new games to create and appropriate value. It may not be able to:
� Take advantage of the new ways of creating and capturing newvalue generated by the new game.
� Take advantage of opportunities generated by the new game tobuild new resources or translate existing ones in new ways.
� Take advantage of first-mover’s advantages and disadvantages, andcompetitors’ handicaps that result from the new game.
� Anticipate and respond to coopetitors’ reactions to its actions.� Identify and take advantage of opportunities and threats from the
macroenvironment.
Key Terms
BearsBeaversBeesDrivers of globalizationFoxesGlobal adventurerGlobal genericGlobal heavyweightGlobal multinational
248 Opportunities and Threats

Global starMultinationalPosition multinationalResource multinational
Appendix: Value Appropriation of Oil by the UKSuppose you did not have the OECD data and wanted to calculate how muchthe UK appropriated from each liter of gasoline bought there. The UK had avalue added tax (VAT) of 17.5% on all imported oil. It also had a tax (duty) of47.1 pence (US$0.942) per liter of gasoline (petrol) that went in force in Octo-ber 2003 and was expected to go up.14 In June 2007, the price of a liter ofgasoline in the UK averaged 96.38 pence (US$1.9276).15 A 2006 US Depart-ment of Energy report had shown that distribution and marketing accountedfor 9% of the $2.27/gallon gasoline in the USA in 2005, state and federal taxesfor 19%, crude oil for 53%, while refining costs and profits accounted for19%.16
(Additional data: in June 2007, the British pound was worth $2 and there are0.2642 US gallons to the liter. There are 158.97 liters to the barrel or 42 USgallons to the barrel.)
Question
How much of the value in a liter of petrol (gasoline) sold in the UK was cap-tured (1) by the UK Government, (2) by the oil companies.
Solution
An oil value chain consists of four major stages: exploration (and associatedfinding costs), extraction and shipping (and associated lifting costs, productiontaxes, and transportation costs), refining (refining costs), and marketing anddistribution (marketing and distribution costs, taxes).
For simplicity, we perform all the calculations in US dollars.In 2007 customers in the UK paid $1.9276 for a liter of gasoline. The UK
government’s share of the $1.9276 per liter was:
1 US$0.942 duty tax (from UK tax of 47.1 pence per liter ($0.942 per liter,since £1 = $2)).
2 $0.287089 VAT (from 1.9276 − (1.9276/1.175)). This reflects the fact thatthe $1.9276 price of a gallon is 117.5%, not 100%, since VAT is 17.5%.
3 Therefore, for each US$1.9276 liter of gasoline sold in the UK in 2007, theUK government appropriated 0.942 + 0.287089 = $1.229089.
4 Percentage of value appropriated by UK government = (1.229089/1.9276)= 63.76%.
The remaining $0.698511 per liter ($1.9276 − $1.229089) or 36% has to beshared by (a) the oil companies that explore for crude oil, drill, pump andtransport it to refineries (b) the refiners (often oil companies) where it is refined,marketed, and transported to gas stations for sale to customers, and the gas
Globalization and New Games 249

station’s take, and (c) the exporting country. Since there is no UK data on whatfraction of the remaining 36% (after UK Taxes) goes for crude, refining, export-ing country taxes, etc., we will use the US fractions. From the 2006 US dataprovided, distribution and marketing accounted for 9% of the cost of gasoline,state and federal taxes for 19%, crude oil for 53%, while refining costs andprofits accounted for 19%. What we need here to help us with our estimates forthe UK, are the ratios of distribution and marketing crude oil, and refining costsand profits without US state and federal taxes. Without taxes, these three are81% of the cost of gasoline. There:
1 Distribution and marketing represent 11.11% (0.09/0.81).2 Crude oil represents 65.43% (0.53/0.81).3 Refining costs and profits represents 23.46% (0.19/0.81).
Recall that $0.698511 per liter ($1.9276 − $1.229089) or 36% represents dis-tribution and marketing (including gas station costs and profits), crude oil costs,and refining and profits. Of the $0.698511 per liter,
a Distribution and marketing = $0.0776 ($0.698511 × 0.1111) which is4.03% of the $1.9276 per liter cost (0.0776/1.9276).
b Crude oil = $0.4571 ($0.698511 × 0.6543) which is 23.71% of the $1.9276per liter cost (0.4571/1.9276).
c Refining costs and profits = $0.1638 ($0.698511 × 0.2346) which is 8.50%of the $1.9276 per liter cost (0.1638/1.9276).
In other words, of the $1.9276 that customers in the UK paid for a liter ofgasoline in 2007, the government appropriated $1.229089 (63.76%), distribu-tion and marketing captured $0.0776 (4.03%), crude oil took $0.4571(23.71%), and refining and profits were $0.1638 (8.50%).
Now that we know what fraction of the $1.9276 per liter goes to crudeproduction and transportation, we can determine the exporting country’sshare.
Per barrel calculations:
Cost of oil extraction = $19.83 ($15.25 finding costs + $3.57 lifting costs +$1.00 production taxes) per barrel = ($19.83/158.97) per liter = $0.1247per liter.
The amount left for oil companies for their profits, other costs, and royalties forthe UK government is $0.4571 − $0.1247 = $0.3323 per liter. These numbersare summarized in Table 9.5.
250 Opportunities and Threats

Table 9.5 What Each Player Appropriates
Player(s) Amountappropriated perliter ($)
Percentageappropriated
Comment
The UK Government (Duty and VAT) 1.229089 63.76Distribution and marketing 0.077600 4.03Refining and profits 0.163800 8.50
Crude oilFinding costs, lifting costs, and production taxes 0.124700 6.47Oil company profits, UK royalties, other costs 0.332400 17.24 $0.4571
(23.71%)
Total (per liter UK price) 1.927600 100.00
Globalization and New Games 251

New Game Environments and theRole of Governments
Reading this chapter should provide you with the conceptual and analyticaltools to:
• Understand how macroenvironments can be the source of opportunitiesand threats for new games.
• Understand what makes some environments more conducive to innovationand wealth creation than others.
• Understand why governments have a role to play in business and what thatrole is.
• Appreciate the role that governments must play in creating new-gamefriendly environments.
IntroductionFirms and the industries in which they create and appropriate value do notfunction in a vacuum. They are influenced by their macroenvironments—thetechnological, political-legal, demographic, sociocultural, economic, and nat-ural environments (PESTN) in which firms and industries operate (Figure 10.1).Macroenvironments are often the source of opportunities and threats to firmsand their industries. For example, regulation and deregulation both increase ordecrease barriers to entry and therefore influence industry dynamics andopportunities to make money. Witness deregulation of the airline industry inthe European Union which gave rise to many low-cost startup airlines. Alsowitness the deregulation and privatization of phone services in developingcountries such as Cameroon and Kenya that have allowed wireless phone ser-vice businesses to thrive in these countries. National and international eco-nomic factors such as interest rates, exchange rates, employment, income, andproductivity also impact industry competitiveness and therefore the types ofnew game activities that can be performed. For example, income growth mayincrease some customers’ willingness to pay for certain products, making thesecustomers more precious to firms that are able to offer them the type of valuethat they want. As globalization increases, the opportunities to pursue newgame strategies and the threat to existing business models increase. In this chap-ter, we explore the role of macroenvironments as sources of opportunity andthreats for new games, and examine the role that governments can play to helpfirms create and appropriate value. We start the chapter with a description ofmacroenvironments and their role as a source of opportunities and threats to
Chapter 10

new games. We then explore those characteristics of some environments thatmake them more conducive to innovation than others. Next, we explore therationale for why governments have a role to play, and examine what that roleis in the face of new games.
Macroenvironments as Sources of Opportunity andThreatThe macroenvironment—made up of the technological, political-legal, socio-demographic, economic, and natural environments—is a source of opportun-ities and threats that firms can exploit using new game activities.
Technological Environment
Some of the best opportunities to perform new game activities have beendriven by technological change. The change from mainframe computers to per-sonal computers gave many firms the opportunity to overturn the way valuehad been created and appropriated in the computer industry. For example,startup software developers such as Microsoft pursued new business models inwhich they focused on software alone rather than software and hardware, ashad been the practice in the computer industry. Hardware and software makersalso sold their products rather than lease them as had been practiced by manyfirms. The discovery of DNA laid the foundation for the creation of manybiotech firms and is fundamentally changing many activities, from the waypharmaceutical firms pursue cures for different ailments to how crimes are
Figure 10.1 The Macroenvironment.
New Game Environments and the Role of Governments 253

solved. The invention of the Internet spurred the creation of many firms,changed the way many so-called offline firms perform their activities, and had abig influence on the lifestyles of many consumers.
The invention of railways, steamships, airplanes, steel, cement, transistors,microchips, alternating current, and numerous other inventions also presentedopportunities for new firms to be created and for new ways of creating andappropriating value. At the same time, however, these opportunities werethreats to existing technologies and the incumbent firms whose competitiveadvantages were rooted in the older technologies. Railroads were a threat to thehorse-driven carts, the transistor was a threat to the vacuum tube and associ-ated businesses, the Internet is a threat to some bricks-and-mortar businesses,and so on. In many cases, the technological change was at the periphery of valuecreation but played a role in positioning a firm. For example, one reason for thesuccess of Dell’s build-to-order business model was the Internet.
Political-legal Environment
The political-legal environment includes antitrust regulation, tax laws, foreigntrade regulation, and employee protection laws. The political-legal environ-ment can have tremendous influence on the way new value is created. Considerthe case of the Bayh–Dole Act in the USA. Before 1980, the intellectual propertyrights to any discoveries or inventions that universities and other nonprofitorganizations made while performing federally-sponsored research belonged tothe US Federal government. The government effectively appropriated most ofthe value created. On December 12, 1980, the Bayh–Dole Act or Patent andTrademark Law Amendments Act, sponsored by Senators Birch Bayh of Indi-ana and Robert Dole of Kansas was passed.1 Among other things, the Bayh–Dole act, which was amended in 1984 and 1986, gave US small businesses,universities, and nonprofit organizations intellectual property rights to anydiscoveries and inventions made using federal funds. The idea was to give aca-demic researchers an incentive to commercialize and profit from their inven-tions and discoveries. The Act effectively transferred ownership of discoveriesand inventions from the government that sponsored them to the firms thatperformed the R&D. It also insured that individual researchers who did thework benefited. Prior to Bayh–Dole, only about 5% of the patents accumulatedto the government were commercialized. In December 2005, over 4,500 firms,with roots at universities and other nonprofit organizations, had been foundedbased on patents generated as a result of Bayh–Dole.2 In 2004 alone, Americanuniversities and institutes received $1.39 billion in licensing-fee revenues. Theyalso applied for over 10,000 new patents. Other developed countries, includingGermany and Japan, adopted similar acts. This apparent success has had somecosts to universities and the spread of knowledge. Many academics now hesi-tate to reveal all the results of their research while others have been accused ofpaying too much attention to commercial ends rather than the knowledge forknowledge’s own sake that universities are supposed to be all about. Given howmuch money some universities now make from their research, there now aresome questions as to whether such universities should still hold onto their non-commercial research tax exemption status.
254 Opportunities and Threats

Economic Environment
Economic variables such as aggregate demand and supply for key commoditiessuch as oil, currency movements, stock market performance, disposableincomes, interest rates, money supply, inflation, and unemployment can alsorepresent opportunities and threats for firms. For example, when housingvalues in a country appreciate, as was the case in the early 2000s in the USA andEurope, house owners feel richer and spend more. An appreciation in the valueof shareholders’ stocks also makes them feel richer and increases their willing-ness to pay.3 One estimate is that an increase in housing values of $100 canincrease spending by as much as $9 while an increase of $100 in stock marketvalues increases spending by $4.4 Increased stock market or housing wealth canalso mean more money for financing new ventures. Of course, a burst in abubble spells trouble; that is, decreases in housing values are also likely todecrease spending.
The petroleum crisis of the 1970s resulted in more demand for vehicles withhigher gas mileage than US automakers could build. This opened up anopportunity for Japanese carmakers with more fuel-efficient cars than theirAmerican competitors to gain market share. Sometimes, the opportunity is cre-ated by an innovation that takes advantage of existing macroeconomic condi-tions. For example, Professor C.K. Prahalad of the University of Michigan hasargued that although billions of people in the world earn very little money, theyconstitute a large market that can be tapped through innovation of new prod-ucts that can meet the needs of this group of innovations in how to get theproducts to them.
Sociocultural and Demographic Environments
Demographic variables include shifts in populations, age distributions, ethnicmixes, educational levels, lifestyle changes, consumer activism, birthrates, lifeexpectancies, and household patterns in cities, regions, and countries. A changein any of these variables can be an opportunity or threat to performing newgame activities. For example, as many people who started using the Internet aschildren grow older, firms will have to deal with many consumers who do notthink much about shopping online or telecommuting.
Sociocultural variables include the beliefs, norms, and values of consumers,countries, communities, or employees. Because beliefs, norms, and values aredifficult to detect, opportunities and threats that come from changes in socio-cultural variables are usually some of the most difficult to detect.
Natural Environment
The natural environment consists of the air that we breathe, the water thatsustains all life, climate, landscapes, grasslands, forests, wildlife, animals,oceans, mineral resources, and any other living or nonliving things that occurnaturally on earth and its surroundings. When firms perform business activities,the activities often have an impact on the natural environment. For example,some activities result in the pollution of air, water, or soil. Such pollution canhave major effects on climate, other resources, and ultimately the quality of life
New Game Environments and the Role of Governments 255
or survival of living things. Other activities use up nonrenewable or scarceresources. Consequently, businesses often face pressure from environmentalistgroups or laws from governments to limit the adverse effects that businessactivities have on the environment. Moreover, the natural environment shouldhave an effect on how firms conduct business. While some firms might view, forexample, pressure to reduce pollution as a threat, others might see it as anopportunity to use new game activities to offer products whose development,production, and use pollute less than existing ones.
Conducive Environments to Value Creation andAppropriationIn playing its role to improve the ability of its firms to create and appropriatevalue, it would be nice if governments knew what makes some environmentsmore conducive to creating wealth from new games than others. That way,these governments could tailor their activities towards building such environ-ments. In the 1990s and 2000s, many countries poured billions of dollars intoso-called high technology clusters, trying to replicate the success of the USA’sSilicon Valley. In 2005, for example, the French government planned to pour�500 million per year, from 2006 to 2008, into its sixteen clusters, from aero-space to biotechnology, collectively called the poles de compétitivité.5 Most ofthe �500 million was spent on industry R&D. By the late 2000s, however,many countries were finding out that although they invested a lot in theseclusters and produced lots of patents and academic papers, they were not creat-ing as much wealth as the Silicon Valley.6 They had no Intels, Apples, Genen-techs, Ciscos, Yahoos, Googles, eBays, etc. etc. to show for their efforts. As weargued in Chapters 4 and 5, when a cluster invents or discovers something, theinvention or discovery is only the first step in creating and appropriating value.The invention or discovery still has to be converted into something that cus-tomers perceive as valuable to them, and the inventor or followers (from thecluster) must also be positioned to appropriate the value. Clusters also needcomplementary assets and good business models to create wealth for clustermembers; otherwise, their inventions would be appropriated by firms fromother countries that have the right complementary assets and business models.In general, environments that are conducive not only to invention but also tothe right business models, and have the right complementary assets possess thefollowing attributes (Figure 10.2):
1 High financial rewards for successful new games.2 Financial support for entrepreneurial activities.3 A culture that tolerates failure.4 The right coopetitors.5 A procreative destruction environment.
High Financial Rewards For Successful New Games
New game activities are risky and therefore the payoff for investing in them hasto be high for firms to invest. For most firms, this payoff is financial. Yes, thereare some individuals and organizations that pursue new game activities for
256 Opportunities and Threats

socially responsible nonfinancial reasons; but most players prefer to makemoney, even if in the end, they give the money that they earned to charities.Thus, an environment with good financial payoffs for new games is more likelyto attract investors than one without. In the USA, the rewards for successfulnew game activities can be astronomical. A look at the Forbes list of 500 bil-lionaires shows that by far the largest number of self-made billionaires is in theUSA. In fact, there are more such billionaires in the USA than in all the othercountries of the world combined. These payoffs come in different forms. First,there is the initial public offering (IPO) in which firms offer some of their sharesto the public for the first time. The founders of Google, for example, werebillionaires a few days after the company went public. A firm can also push upits net worth by spinning out an entrepreneurial unit and issuing an IPO for theunit. Expectation of such rewards can be a very good incentive for the kind ofeffort and dedication that it takes to pursue many innovations. Dr James H.Clark, founder of Silicon Graphics Inc (SGI) and Netscape, put it best, “With-out IPOs, you would not have any startups. IPOs supply the fuel that makesthese dreams go. Without it, you die.”7 Second, the rewards can also come whena venture is bought, usually by a more established firm with complementaryassets. Such an acquisition can give the investors cash, shares in the establishedfirm, or high-level positions in the established firm. In fact, many venture capit-alists invest in startups largely because they expect to cash out at the IPO orwhen a more established company buys the venture.
Financial Support for Entrepreneurial Activities
Availability of venture capital is critical to engaging in new game activities,especially entrepreneurial ones. By making money available for projects thatwould normally be considered too risky by incumbent firms, venture capitalistsenable entrepreneurs to be more daring in their pursuit of new games. Someentrepreneurs use personal or family savings, or loans from friends to finance
Figure 10.2 Determinants of Environments that are Conducive to Profitable New Games.
New Game Environments and the Role of Governments 257

their ventures, in anticipation of the potential high financial rewards. Anticipa-tion of such rewards, coupled with readily available venture capital, allowsmore people to search for more ideas in more places with more combineddetermination. Many of those whose ventures are successful usually reinvesttheir earnings in new ventures. Clark reinvested some of the money that he hadmade at SGI in Netscape. Kleiner and Perkins reinvested some of what theymade in Genentech and Tadem Computers into later ventures such as AOL,Amazon.com, Netscape, and Google.
As we saw earlier, there may be times when a government is better off spon-soring R&D activities. For example, if a project is too complex and entails toomuch uncertainty, and the output is knowledge with public properties, firms arelikely to shy away from investing in the project and government is better offinvesting in it. Thus, countries in which governments invest in R&D for gener-ating new game ideas, without too many strings attached to the results, may bemore likely to be more conducive to new games than those that do not.
Culture that Tolerates Failure
Many ventures never make it to the payoff at the IPO, acquisition, or successfulproduct. They simply fail. In some environments, such failures are fatal. Insome countries, someone who is associated with a failed company may bedoomed. The fear of such repercussions prevents many investors in suchenvironments from investing in ventures. In other environments, such failuresstop neither the entrepreneurs nor their financial backers. Why? First, players insuch environments understand that most new games require experimentation,trial, error, and correction. Failure is therefore part of the learning that goes on.Thus, those who fail learn in the process and this can improve their chances ofdoing well the next time around. Second, many of the complementary players,especially venture capital firms, have seen many failures before and still comeout ahead. Moreover, some of the players are serial entrepreneurs who haveexperienced both success and failure several times before. The culture in suchenvironments tolerates failure. Whereas bankruptcy laws are harsh in Europeand entrepreneurs who fail are stigmatized, in the Silicon Valley, “bankruptcy isseen almost as a sign of prowess—a dueling scar if you will.”8
Presence of Coopetitors and Factor Conditions
Recall that in performing new game activities, a firm usually needs to interactwith coopetitors to obtain some of the information and other resources that itneeds to create and appropriate value. Since some of the knowledge needed istacit, having these coopetitors in close enough proximity to allow for in-personinteractions can facilitate the process of knowledge identification, exchange,recombination, and transformation. Take the presence of suppliers. Being closeto suppliers gives a firm the opportunity to interact with component developersand work more closely with them as both supplier and firm go through theirexperimentation, trial, error, and correction process. They are able to provideeach other with the type of quick feedback that, in some industries, can bethe difference between success and failure. Such close interaction can enable afirm to be more effective in creating and appropriating value. Having very
258 Opportunities and Threats

demanding customers can also force firms into pursuing new games more dili-gently so as to meet the needs of these demanding customers.9 The presence ofthe right inputs can also contribute to the conduciveness of an environment tonew games. For example, without the availability of electrical engineering andcomputer science graduates in the USA, the Internet revolution may never havetaken off in the USA when it did. Finally, the presence of venture capital firmscan also be crucial.
A Procreative Destruction Environment
A system that encourages competition—especially between incumbents andnew entrants—can be critical to creating value. Major innovations usuallyresult in so-called creative destruction in which new firms replace some incum-bents. A system that unduly protects incumbents can impede progress. Forexample, those developing African countries that continued to protect theirfixed-line phone companies missed out on one of the biggest business successstories in Africa—the cell phone communications business. If a country’s clusterinvents something but cannot commercialize it because the home country isoverprotective of its incumbent firms and old jobs, an entrepreneur in anothercountry is likely to pick up the invention and commercialize it. If the idea is asuccess abroad, incumbents everywhere will eventually be displaced. Effect-ively, the home country can have one of its own startups displace its incumbentsor someone else from the outside will do it. Moreover, if incumbents are over-protected, entrepreneurs and venture capitalists can take their ideas andinvestment to another country where they can commercialize the ideas andprofit from them. Government policies that make life difficult for startups cancurb entrepreneurial activity in their countries. In some countries, revenues aretaxed regardless of whether or not a firm makes money. This can be difficult forstartups that usually need cash early in their life cycles. In some countries, itcan take as many as 23 days to start a business while in others, it takes onlythree days.
What Should Governments Do?
A lot of what governments can do to create environments that are conducive tonew games follows directly from our discussion of what makes for conduciveenvironments.
Foster a Culture that Encourages Financial Rewards for SuccessfulNew Games
Laws in some countries prevent a firm from issuing an IPO until it has shownseveral years of profits. Such laws are meant to protect investors fromunscrupulous firms and their investment bankers; but they also keep out inves-tors who can better decide the level of risk that they can handle and when theyshould invest in a firm. Individuals know better than their governments whichcompanies are good investment issues. Again, investors can take their money tothose countries which do not unduly restrict when a firm can go public.
In some countries, billionaires are frowned at while in others they are
New Game Environments and the Role of Governments 259

admired for the hard work that enabled them to earn the money, unless it wasinherited. Yes, disparities in wealth can be a problem; but for every billionairethat is created during an IPO, there are thousands of employees and otherstakeholders that become millionaires. If you aspire to work hard and become abillionaire (and use the money to help refugees, etc.), would you stay wherebillionaires are frowned upon or go where you are admired?
Encourage Financial Support for New Games
Some governments tax the revenues that startups receive, leaving cash-strappedstartups even more cash-strapped. This is in contrast to other countries in whichfirms pay taxes only on income and get to deduct losses in their tax returns. Ifyou were a venture capitalist, would you rather invest in a country with high taxrates on revenues and where billionaires are frowned upon, or in one whereincome, not revenues, is taxed at low rates and billionaires are admired aswealth creators? If you wanted to work for a startup, would you want to workfor the former or the latter? Taxing revenues may be equivalent to a farmereating most of his/her young sheep and being left with little to maintain his/herflock. Successful startups create more jobs and wealth for their employees,increasing the tax revenues for countries. With increasing globalization, venturecapitalists can move their capital to the country that they believe is more hos-pitable to startups. Entrepreneurial employees can also move to those countrieswhere they believe they can pursue their dreams better. It is interesting thatventure capital was invented by a Frenchman while teaching in the USA, andFrance has little or no wealth creation by venture capitalists.
Encourage Competition and Get out of the Way
Laws that protect incumbents in the face of revolutionary new games can back-fire. That is because creative destruction eventually takes hold. Thus, protectingincumbents from disruptive technologies by slowing down attackers onlydelays the inevitable. Moreover, if a government slows down attackers in itscountry, other countries may not. The more restrictive country may thereforefind itself falling behind as far as the disruptive technology is concerned, andwhen its incumbents fall, they may be falling into the hands of foreign attackers.Thus, a country may be better off encouraging competition between incum-bents and new entrants, and getting out of the way.
Build a Culture that Tolerates Failure
While it is not very clear what a government can do to build a culture thattolerates failure, a relaxation of bankruptcy laws can help. In some countries,bankruptcy laws are so strict that some failed entrepreneurs can be bannedfrom running another company for many years. Such laws may be contributingto stigmatizing failed firms. In the USA, Chapter 11 bankruptcy proceedingsallow the bankrupt firm’s employees to move on to another firm, and the assetsto be redeployed.10 Relaxing these other countries’ bankruptcy laws may help.
260 Opportunities and Threats

Keep Investing in Public Knowledge and Public Complementary Assets
Of course, governments need to continue to invest in R&D projects thatgenerate knowledge with public properties, since firms are not likely to investin such projects; but they should attach few strings to the results of theR&D, encouraging competition whenever possible. Governments are terribleat making products and therefore should not try to get too far into product-making. The job of governments is to make it easier for firms to make safeand good products. If a government stands in the way of an innovation,another government will find a way to get its firms to profit from theinnovation.
Rationale for the Role of Government11
In describing what governments should do to create environments that areconducive to innovation, we did not explain why a government needs to play arole. In this section, we explore the rationale for why governments have a roleto play in the face of new games. Because of the nature of people and theknowledge that they must turn into customer value during new games, theremay be times when governments must intervene to facilitate more optimal valuecreation and appropriation. Whether government intervention is needed is afunction of the:
1 Complementary assets needed.2 Characteristics of the knowledge that must be transformed.3 Amount of uncertainty and complexity involved.4 Characteristics of the people that take the decisions and transform the
knowledge.5 Type of industry in which the firm operates.6 Extent to which there are negative or positive externalities involved.
Public Goods as Complementary Assets
Some of the complementary assets that a firm needs to create and appropriatevalue are so-called public goods. A public good is a good that is nonrivalrousand nonexcludable. A good is nonrivalrous if consumption of the good by anindividual does not reduce the amount of the good that is available for con-sumption by others. A good is nonexcludable if it is difficult to prevent somepeople from using it. An example of a public good is air. When one personbreathes air, he or she does not reduce the amount of air that is available forothers to breathe. Moreover, it is difficult to exclude some people from breath-ing air. Consequently, it is difficult for an individual to clean only the air that heor she wants to breathe. Another example of a public good is national defense.Because of their nonrivalrous and nonexcludable properties, public goods maybe better provided by governments. It is difficult for each individual to defendhimself or herself from a foreign bomb. A safe country, good roads, steadysupply of energy, transportation systems, and a clean sustainable naturalenvironment are public complementary assets that can be critical to the typeof economy in which firms create and appropriate value. Because of the
New Game Environments and the Role of Governments 261

public nature of these assets, governments may need to play a major role inproviding them.
Paradoxical, Public, and Leaky Nature of Knowledge
The knowledge that underpins new game ideas has certain characteristics thatcan make it difficult for a firm to appropriate the value from knowledge that itgenerates.12 First, suppose a firm wants to sell a new game idea. A potentialbuyer cannot determine the value of the idea until it knows what the idea is allabout; but once it knows the idea, the potential buyer may no longer have anincentive to pay for it, especially if the buyer is opportunistic. It already has theidea and can shirk. Such a situation may discourage potential suppliers ofknowledge for new game ideas from investing in its generation. This situation issometimes referred to as the knowledge paradox.13 Second, another character-istic of knowledge is that of nonrivalry. If A sells some knowledge to B, doing sodoes not reduce the amount of knowledge that A has. What is more is that B,the buyer, will always have the knowledge and can keep reselling it. Unlikeproducts or services that are used up, and the producer can sell more of them,knowledge remains in circulation no matter how many people consume it. Thismay also discourage potential suppliers from investing in knowledge gener-ation, since they may end up selling only one or a few copies.
Third, if a seller of a new game idea found a buyer, the idea may leak duringthe process of transfer. Or, once the buyer starts to make money from it, it canbe quickly copied. In either case, appropriability of the knowledge is reduced.This leakage is a function of the explicitness or tacitness of the knowledge. If itis tacit and therefore requires learning by doing, experiencing, and interactingover time with the generator of the knowledge, the risk of leakage may bereduced. In any case, this leakiness property may also reduce the incentive toinvest in the production of new ideas for new games. It is important to point outthat leakage of knowledge, also called spillovers, may not always be bad, from asocietal point of view. It allows firms not to duplicate each other’s past researchefforts and waste money that could be used to extend the technology and offersociety better value.
There are several things that could be done to alleviate these knowledgeproblems. The first is for the government to grant and protect intellectual prop-erty rights to producers of knowledge. That is what the governments of manydeveloped countries have already done by enacting and enforcing laws thatgrant patents, copyrights, trade marks, trade secrets, and so on. If a firm isawarded a patent on something, it can freely discuss it with potential buyerswithout fear of an opportunistic buyer running away with the idea. Second, thegovernment can engage directly in idea generation itself and give the outputfreely to its firms and entrepreneurs—that is, governments can generate know-ledge and encourage spillover of the knowledge. By “engage” in idea gener-ation, we mean that the government can have its own laboratories that engagein the research, or award grants to universities and other institutions to performthe research. Third, a government can provide subsidies for firms and indi-viduals alike to encourage private production of knowledge. We will have moreto say about these three remedies later in this chapter.
262 Opportunities and Threats

Uncertainty and Complexity of Value Creation andAppropriation
The uncertainty associated with the generation and application of some break-through ideas is so large that very few firms are likely to invest in the generationof such ideas. No firm could have foreseen the potential applications of thestructure of the DNA before its discovery. Nobody could have forseen how far-reaching its applications would be. Thus, many profit-seeking firms are notlikely to have invested in the activities that led to the discovery of the structureof the DNA. Complex projects that involve very many firms, individuals, andgovernments are also difficult for individual profit-seeking firms to pursuealone. Take the Internet, for example. What type of firm could have planned,discovered, and implemented the Internet?
Effectively, if the uncertainties inherent in ideas for new games are very large,firms may not be willing to take the risk of investing in their generation. Onesolution is to shift the risk of failure to insurers; but shifting risk to an insurerhas some problems. The insured has more information about the new gamethan the insurer. An opportunistic insured may decide not to give the insurer allthe information that is needed to write a good policy. Even if the insured werenot opportunistic and honestly wanted to give the insurer all the needed infor-mation, it may not be able to articulate all of the information, given theuncertainty and complexity of the project and the fact that the insured is cogni-tively limited. Moreover, even if the insured could articulate all the information,the insurer may not be able to absorb and process all of the information either.This information asymmetry between the insured and insurer leads to the twopotential classic problems of adverse selection and moral hazard. A largemajority of firms that seek insurance for idea generation may be firms that havesomething to hide. Since the insurer does not have all the information that itneeds to differentiate between those that are opportunistic and those that arenot, it may end up getting only the opportunistic ones. This is the adverseselection problem. It is also possible that the insurer succeeds in selecting theright insureds. Once the contract has been signed, the insureds may becomecomplacent and not work as hard as they would if they were not insured. Giventhe complexity and uncertainty associated with the innovation, it is difficult totell when the innovator is shirking or being a bum. The problem that arises fromfirms behaving opportunistically once they have signed a contract is the moralhazard problem.
Effectively, if the uncertainty and complexity of idea generation is too high,firms may not want to invest in it; and because of the adverse selection andmoral hazard problems associated with complex and uncertain projects, insur-ance companies may not be willing to insure the idea generation. A governmentcan do several things to insure such idea generation. First, a government canundertake some of the risky idea generation itself. Second, a government canallow firms to cooperate in the idea generation while making sure that the firmsare not colluding. Third, a government can subsidize R&D spending. Fourth, agovernment can extend the protection life of the intellectual property thatcomes from the projects. Again, we will discuss these measures below.
New Game Environments and the Role of Governments 263

Heterogeneity, Self-interest, and Cognitive Limitation ofPeople
Firms and the individuals that work for them are usually not the rational profit-maximizing players that neoclassical economics often assumes. Rather, thepeople who work for firms do the best they can to make sure that their firms areprofitable and that their own interests are met. The satisfaction or utility thatpeople derive from performing a particular activity varies from individual toindividual and from context to context. While the Nelson Mandelas of theworld derive a lot of satisfaction from working hard to give other people achance to work hard and improve their own lives, other people work hardbecause they want to keep their immediate families happy. Yet others workhard to make a lot of money and then give it away to charity. Others work hardto generate ideas so that they can be recognized as the best at what they do bytheir professional colleagues or the Nobel committee. Thus, a government’s roleought to take into consideration the fact that people are very diverse as far astheir incentives to generate new game ideas are concerned.
People are also cognitively limited. Their information collection, processing,and expression abilities are limited and therefore, there is only so much thatmost people can learn or process at any one time. Firms are also cognitivelylimited. Thus, some projects may be too knowledge-intensive for such firms.Governments can facilitate cooperation between firms that want to developsuch projects.
Minimum Efficient Scale Requirements of Industry
Whether or not a government should play a role in value creation andappropriation is also a function of the minimum efficient scale involved. Min-imum efficient scale (MES) is the smallest output that minimizes unit costs.14 Insome industries or markets, the MES is equal to or larger than the market. Suchan industry is said to be a natural monopoly because one firm can produce atlower cost than two or more firms. The natural monopoly concept was used tojustify monopolies in telecommunications, railways, electricity, water services,and mail delivery. Since changes in technology usually result in reductions inMES, it may be difficult to justify the presence of natural monopolies in some ofthese industries today. For example, because of the nature of cell-phone tech-nology (compared to fixed-line telephony) the introduction of competition inthe telecommunications industries of many developing countries has resulted inmuch better customer service and profits for the providers.
Negative and Positive Network Externalities of SomeActivities
In Chapter 5, we said that a product or technology exhibits network external-ities if the more people that use the product or technology, the more valuablethat it becomes to each user. There is another type of network externality that isdefined as the cost or benefit imposed by the actions of two transacting partieson a third party.15 It is called a negative externality if a cost is imposed on thethird party, and a positive externality if a benefit is imposed on a third party. A
264 Opportunities and Threats
classic example of a negative network externality is that of a power plant thatburns coal to produce electricity but, in doing so, also produces sulfur dioxidethat rises into the air and eventually falls as acid rain. The acid rain is a negativeexternality since, in calculating the cost of the electricity that it sells, the electriccompany does not factor in the cost of the acid to the people on whose propertyor bodies the acid rain falls. By regulating the amount of sulfur dioxide that apower plant can emit into the air, a government can reduce the amount of thisnegative externality. Pollution from cars is also a negative externality. A classicexample of positive externality is that of a bee that, in searching for food,pollinates the plants that it visits. If a farmer breeds bees, it cannot tell themwhich crops to pollinate and which ones not to. Therefore, a governmentdepartment of agriculture may be better off breeding the bees and letting thempollinate crops for everyone.
The Role of Government During New GamesIn exploring the rationale for a government role in the face of new games, wehinted at some of the things that governments could do to help firms create andappropriate value better. In this section, we go into more detail of what gov-ernments could do. In particular, we explore seven government roles that canhelp firms in the face of new games. A government can serve as:16
• R&D financier• Leader user• Provider of public complementary assets• Regulator/deregulator• Facilitator of macroeconomic fundamentals• Educator, information center, and provider of political stability.
R&D Financier
Recall that the “public good” nature of knowledge can make it difficult forfirms to appropriate their inventions, thereby discouraging firms from investingin some knowledge-generation activities. Also recall that the complexity anduncertainty associated with certain knowledge-generation activities can dis-courage firms from investing in R&D. One solution to these two problems is tohave the government perform the research and make the results available to thepublic. Governments spend on two kinds of R&D: basic research, and appliedresearch. Basic research is about the search for knowledge for knowledge’s ownsake, with little attention given to if, whether, or how research findings could beconverted into products. Applied research is research that is targeted towards aparticular application. Government research is conducted largely in govern-ment laboratories, universities, within some firms, or at joint endeavors madeup of some combination of the three. In 2007 alone, the US Governmentplanned to spend over $130 billion on R&D.
Government-sponsored R&D has played a major role in the creation of newindustries, or has been a key driver for many innovations within existing indus-tries. Two examples are the Internet and the structure of the DNA. The Internetgrew out of the US Defense Department’s Advance Research Projects Agency
New Game Environments and the Role of Governments 265

(DARPA) in which research on computer networks was sponsored by DARPA.Firms eventually joined in to help build the Internet to the phenomenon that ithas become. Without the US Government’s R&D funding, there would be noInternet today! The double-helix structure of genes or DNA also has its roots ingovernment-sponsored research conducted at Cambridge University to thankfor its discovery. Both these discoveries went on to become the sources ofnumerous new games.
Financing R&D has other benefits beyond solving the problems of the “pub-lic” properties of knowledge and of the complexity and uncertainty associatedwith some projects. First, in financing R&D, the government is also educatingits workforce with the knowledge and skills that firms need to create andappropriate value. Once the Web took off, for example, it was easier to findemployees with computer science and other information technology skills,partly because of the many students trained with DARPA and National ScienceFoundation (NSF) funds in the computer Science and Electrical Engineeringdepartments of many universities. Second, government R&D spending alsospurs private firms to invest in related invention or commercialization activities.Third, by focusing attention on specific areas, government R&D projects canenjoy the economies of scale that come with large R&D projects.
Although government intentions may be good, the results of their actions arenot always positive. Stories of failed projects also abound and questions aboutjust how much R&D the government should undertake haunt policy makers.
Government as Lead User
In the face of a new game or an innovation, interaction with customers can becritical to understanding the benefits that they want and to being better able toprovide the benefits. Professor Eric von Hippel of the Massachusetts Institute ofTechnology (MIT) has argued that lead users can be critical to the process ofinnovation.17 Lead users are customers whose needs are similar to those of othercustomers except that they have these needs months or years before the bulk ofthe marketplace does, and stand to benefit significantly by fulfilling these needsearlier than the rest of the customers. The US government was an importantlead user in some critical products. For example, the US defense departmentsaw many benefits in the transistor replacing the bulky vacuum tube when itpursued it well before most would-be users of the transistor. Since transistorswere much smaller and consumed less power than vacuum tubes, electronicsystems built from it would not only be lighter and provide more functionality,they would require smaller power supplies, further reducing the weight of thewhole system. This made the transistor and subsequent integrated circuits par-ticularly attractive to the Defense Department and the US National Aeronauticsand Space Administration (NASA). The US government’s willingness to awardcontracts to both incumbents and new entrants, and to work closely with themmay have helped US semiconductor firms into the early industry leadershipposition that they occupied for a long time.18 The US role as lead user wasnot isolated to semiconductors. Jet engines, airplanes, and computers have allbenefited from this shepherding by governments. This role is not limited to theUSA. Rothwell and Zegveld found that purchases by European and Japanesegovernments played a significant role in innovation.19
266 Opportunities and Threats

Provider of Public Complementary Assets
A country’s infrastructure is critical to any new game activities that firms withinthe country decide to pursue. For example, without a transportation systemthat enables goods to be delivered to customers reliably and at reasonable costs,online firms such as eBay and Amazon would not be as successful as they havebeen. An information superhighway facilitates communications not onlybetween different business units of a firm; it also facilitates interaction betweencoopetitors. Chip design can now take place 24 hours a day with people inIsrael, Japan, and the Silicon Valley taking turns to work on the same project.Thus, by providing the infrastructure that its firms need, a country is helping itsfirms create and appropriate value better than countries that do not.
Government as Regulator/Deregulator
Another way to deal with the “public” nature of knowledge that can preventfirms from investing in knowledge generation is to grant inventors some mon-opoly privileges over their inventions. In the USA, for example, the need forsuch a privilege is written in Article 1, Section 8 of the constitution: Congressshall have power “To promote the progress of science and useful arts, by secur-ing for limited times to authors and inventors the exclusive right to theirrespective writings and discoveries.” Firms can take advantage of this privilegeby seeking intellectual property protection via patents, copyrights, trademarks,and trade secrets. If a firm has patented its invention, it can reveal it to apotential buyer without being afraid of it being stolen since the patent is proofof ownership. The market power that intellectual property protection canbestow on a firm can be an incentive for firms to invest in inventions or dis-coveries. Patenting is not limited to technologies; business models can bepatented too. For example, Netflix was awarded a patent for its Internet-basedapproach for renting videos to customers.
Ironically, a government is also responsible for preventing monopolies, sincethey can result in under-innovation. For example, antitrust legislation in theUSA seeks to prevent any mergers that can unduly increase the market power ofone organization, since such market power can result in the emerging organiza-tion keeping prices artificially high, or a lack of incentive to innovate. Otheractivities, such as collusion and predatory pricing, that can result in artificiallyhigh prices, are also illegal in some countries. In the USA, for example, theSherman Act makes illegal any agreements among competitors that enable themto keep their prices artificially at some level by fixing the prices or coordinatingtheir outputs. Tacit collusion is also illegal. In tacit collusion, rather than useexplicit formal agreements, firms can, for example, send signals as to what theiractions are going to be, inviting competitors to follow suit. In predatory pricing,a firm lowers its prices (below its cost) so as to drive out competitors and thenraises them when the prey is out of the market. This is difficult to prove, espe-cially early in the life of an innovation, because innovators can claim that theyare lowering their prices to attain the kinds of volume that can take them downthe learning curve (up the S-curve) rapidly, resulting in such lower cost, onaverage, that they can afford to sell at a loss at the beginning.
Other public goods, such as the air that we breathe and the natural environ-
New Game Environments and the Role of Governments 267
ment, also have to be protected by governments. For a passenger that drives10,000 miles a year, a 10 mpg improvement in a car’s gas mileage reducesemissions to the atmosphere by 2.4 million pounds of CO2 (for a person whodrives 10,000 miles per year, every 1 mpg improvement saves 24 pounds of CO2
each year). Governments can also deregulate. Such deregulations can radicallychange the nature of competition in an industry. Deregulation and privatizationof the telecommunications sectors of many developing countries have resultedin competition and some profitable business with happy customers.
Facilitator of Macroeconomic Fundamentals
New games are also economic activities and therefore their health depends asmuch on how firms play the game as it does on the macroeconomic funda-mentals of the countries in which they operate. Economic policies that spawnexpectations of low inflation, low interest rates, growth, and profits encouragefirms to invest more in R&D and associated complementary assets. Expect-ations of such profits can encourage more entrepreneurs to engage in new gameactivities. Expected low interest rates make it easier for projects to make firmhurdle rates. New game activities may be the engine of economic progress; but itis also true that economic processes can feed that engine.
Educator, Information Center, and Provider of PoliticalStability
In most countries, governments are responsible for most of the general educa-tion of its young. In the face of new games such as the Internet and biotechnol-ogy, having the trained personnel can be the difference between firms in onecountry performing better than those in other countries. As we stated earlier,the introduction of computer science departments in many universities in theUSA and grants from the NSF may have been instrumental to the success of USfirms’ ability to exploit the computer revolution. The country’s ability to attractsmart people from all over the world may have helped not only the country’scomputer industry but also other industries such as biotechnology.
Alternate Explanations: Porter’s DiamondIn his diamond model, Professor Michael Porter of the Harvard Business Schooloffered an alternate explanation for why some regions or countries are moreinnovative than others. He argued that a firm’s ability to gain a competitiveadvantage is a function of four factors:20
1 Factor conditions2 Demand conditions3 Related and supporting industries4 Firm strategy, structure, and rivalry.
268 Opportunities and Threats

Factor Conditions
Factor conditions are inputs such as labor, capital, land, natural resources, andinfrastructure that firms need to create and appropriate value. These factors ofproduction can be divided into two: key or specialized factors, and non-key orgeneric factors. Specialized factors are inputs such as skilled labor, capital, andinfrastructure that are usually created, not inherited. These specialized factorsare likely to give a firm a sustainable competitive advantage, since they are moredifficult to replicate. Non-key factors are inputs such as unskilled labor and rawmaterials that are easy to replicate or acquire. Non-key factors are unlikely togive a firm a sustainable competitive advantage, since they are easy to replicateor acquire. Professor Porter argued that scarcity of factors of production in acountry often helps, rather than hurts, the country because scarcity generates aninnovative mentality while abundance often results in waste. For example, landprices in Japan were very high and therefore factory space was very expensive.Thus, to cope better with the scarcity of space, the Japanese invented just-in-time inventory and other techniques that reduced inventory in factories.
Demand Conditions
Demand conditions in a region or country can also have an impact on the abilityof local firms to have a competitive advantage. If local customers have sophisti-cated demands, local firms are more likely to find new ways to meet thesesophisticated needs. If firms can meet the very sophisticated demands of localcustomers, they will find it easier to meet the relatively less sophisticateddemands of other markets. If the sophisticated demand becomes global, thelocal firms are better positioned to exploit the demand since their competitors(from abroad) have not yet developed the skills to meet such sophisticateddemand. For example, demanding French wine consumers pushed French winesuppliers to develop skills and other resources for producing some of the bestwines in the world.
Related and Supporting Industries
Having suppliers, complementors, buyers, and competitors located in the sameregion can also help local firms to innovate better. A firm that is developing aproduct can have an advantage if its suppliers and buyers are located nearby,since they can all exchange critical information more easily during theexperimentation, trial, and error that takes place during innovation. Supplierscan more easily find out what firms want and supply it. Firms can more easilywork with buyers to find out what they want.
Firm Strategy, Structure, and Rivalry
The competitive advantage of firms in a country also depends on their domesticstrategies and structure. For example, competition in domestic markets can befierce, since firms know a lot about what their local rivals are doing. What isinteresting is that such fierce rivalry can be good in the long run because com-petition can force firms to be more efficient or to innovate to survive. They also
New Game Environments and the Role of Governments 269

develop tactical skills for dealing with competitors. With the more efficient andinnovative ways honed at home, such firms can have a competitive advantagewhen they face global markets with competitors without such capabilities.
PESTN AnalysisRecall that a firm’s macroenvironment is a major source of opportunities andthreats. One way to identify these threats and opportunities from a macro-environment is to use a PESTN (pronounced as PEST N) analysis. PESTNstands for Political, Economic, Social, Technological, and Natural environment.Most readers may be familiar with the PEST part of the analysis. In this book,however, we add the N. The factors that make up each component of thePESTN analysis are shown in Figure 10.3. Each of these components wasdescribed in detail at the beginning of this chapter. The extent to which any ofthese factors constitutes a threat or opportunity for a firm is a function of theindustry in which the firm operates and the firm’s strategy. For example, whilein pharmaceuticals, “intellectual property protection” is important, it is usuallynot the case in retail. Thus, what a government does about intellectual propertyprotection may not be of too much interest to many retail firms—unless, ofcourse, they want to pursue some sort of new game in this area. Effectively, thenumber of factors that matter for any particular PESTN analysis will always beonly a subset of those shown in Figure 10.3.21 As can be expected, some of thefactors are interrelated. For example, “physical and monetary policy” are partof the Political component as well as of the Economic component. It is notunusual for a PEST analysis of an industry to provide a laundry list of thethreats and opportunities that can impact an industry. However, since we areinterested in how these opportunities and threats can be exploited by a firmto create and appropriate value, we focus on how each of the factorsimpacts industry competitive forces, industry value drivers, and the system ofactivities (and associated resources) that a firm performs. Given the vast num-ber of factors that drive each component, we will explore only one factor percomponent.
Political
In a PESTN analysis, one determines the extent to which the factors listed inFigure 10.3 are opportunities or threats, given the objectives of the firm inquestion. Take the first political factor—consumer protection laws—shown inFigure 10.3. Strict consumer protection laws are a threat to firms that do nothave the capabilities to offer customers the right products. They can also be anopportunity for a firm with the right capabilities. Strict consumer protectionlaws can be good for local firms that want to compete globally. That is because,once a firm satisfies these strict local consumer protection laws, it can use thecapabilities developed to satisfy the laws of any other country whose laws areequally strict or less. For example, once a firm meets the strict US Food andDrug Administration (FDA) requirements for approving a new drug, the firmcan very easily meet the requirements for any other country. The FDA laws aremeant to protect patients.
270 Opportunities and Threats

Economic
Availability of a trained and low-cost workforce is an opportunity for a firmthat wants to produce locally. The only caution for managers is that suchopportunities do not last too long because many other firms are likely to locatethere and before long, the workforce will become high-cost.
Social
If differences between classes in a country are strong, it can be difficult to getthem to work together. That would make it difficult for an innovative firm thatthrives on diverse inputs. Firms are also less likely to enjoy the kinds of econ-omy of scale that can be enjoyed in environments where the lines betweenclasses are not as strong. Customers are also less likely to enjoy fully the sizebenefits of network externalities. However, strong divisions between classesmake it easier to segment markets into niches and to price discriminate better.
Figure 10.3 A PESTN Analysis.
New Game Environments and the Role of Governments 271

Technological
New potentially disruptive technologies can be a threat to incumbents but anopportunity for new entrants who use the new technology to attack incum-bents. They can also be an opportunity for incumbents that act preemptively toadopt the technology before attackers move in.
Natural
If environmental consciousness is high, governments, firms, and consumers willsee its importance better, and what it takes to act in a way that is more environ-mentally sustainable. Thus a high environmental consciousness is an opportun-ity for businesses that want to offer more environmentally sustainable productsand a threat to incumbent businesses that do not want to change.
Advantages and Disadvantage of a PEST Analysis
A PESTN analysis offers one way to have a big picture of the opportunities andthreats from a firm’s political, economic, social, technological, and naturalenvironments. Exploring these components together provides an opportunity tosee some of the relationships among the components. It can be used to identifysources of potential new games. The PEST has several disadvantages. The list ofdrivers of each component can be very long. For example, the “political” com-ponent in Figure 10.3 has 14 factors, and many more could be added. More-over, there is no way of determining which of these factors is more importantthan the other. The analysis says very little about the link between each of thefactors and a firm’s profitability.
Key Takeaways
• Firms and the industries in which they operate do not exist in a vacuum;they are surrounded by their macroenvironments of political, economic,social-demographic technological, and natural. These environments areprimary sources of the threats and opportunities that firms often face.
� The political environment includes antitrust regulation, tax laws,foreign trade regulation, and employee protection laws.
� The economic environment includes stock performance, disposalincomes, interest rates, currency movements, economic growth,exchange rates, and inflation rate.
� Sociocultural variables include the beliefs, norms, and values ofconsumers, countries, communities, and employees. Demographicvariables include shifts in populations, age distributions, ethnic mixes,educational levels, lifestyle changes, consumer activism, birthrates,life expectancies, and household patterns in cities, regions, andcountries.
� The technological environments have to do with the changes in thetechnologies that go into products, their distribution, marketing,service, and usage.
272 Opportunities and Threats
� The natural environment consists of the air that we breathe, the waterthat sustains all life, climate, landscapes, grasslands, forests, wildlife,animals, oceans, mineral resources, and any other living or nonlivingthings that occur naturally on earth and its surroundings.
• Environments that are conducive to profitable new games (innovation) pos-sess the following characteristics:
� High financial rewards for successful new games.� Financial support for entrepreneurial activities.� A culture that tolerates failure.� The right coopetitors.� A procreative destruction environment.
• What should governments do to foster environments that are conducive toinnovation? Governments can:
� Foster a culture that encourages financial rewards for successful newgames.
� Encourage financial support for new games and other entrepreneurialactivities.
� Encourage competition and get out of the way.� Build a culture that tolerates failure.� Keep investing in public knowledge and public complementary assets.
• For the following six reasons, governments may have to intervene in opti-mal value creation and appropriation:
� The nonrivalrous and nonexcludable properties of public comple-mentary assets make it less likely that for-profit firms will invest in suchassets without help from their governments.
� The paradoxical, public, and leaky nature of knowledge make it lesslikely that for-profit firms will invest in generating such knowledgewithout help from their governments.
� The uncertainty and complexity of some projects make it less likely thatfor-profit firms will invest in them without help.
� The heterogeneity, self-interest, and cognitive limitation of people sug-gests that employees may need different types of motivation; some ofwhich can only come from the government.
� If an industry’s MES is so large that it is inefficient to have more thanone firm in the industry.
� If industry’s activities, products, or technology exhibit negative or posi-tive externalities.
• A government can serve as:
� R&D financier� Leader user� Provider of public complementary assets� Regulator/deregulator� Facilitator of macroeconomic fundamentals� Educator, information center, and provider of political stability.
New Game Environments and the Role of Governments 273

• Porter’s Diamond model suggests that the ability of firms in a region orcountry to gain a competitive advantage depends on the region’s orcountry’s:
� Factor conditions.� Demand conditions.� Related and supporting industries.� Firm strategy, structure, and rivalry.
• A PESTN (political, economic, social, technological, and natural environ-ments) analysis can be used to explore the opportunities and threats of amacroenvironment.
Key Terms
Adverse selectionMinimum efficient scaleMoral hazardNatural monopolyNegative externalityNonrivalrous goodPESTNPositive externalityPublic good
274 Opportunities and Threats
Coopetition and Game Theory
Reading this chapter should provide you with the conceptual and analyticaltools to:
• Further appreciate the significance of always taking the likely reaction ofyour coopetitors into consideration when deciding on whether or not topursue a new game activity.
• Understand the differences between cooperative and noncooperative gametheory that can be applied to the concepts and tools of this book.
• Appreciate the usefulness and limitations of game theory as a tool or theoryfor strategic management.
• Understand why one needs both cooperative and noncoperative gametheory if one decides to use game theory to explore new game strategicaction.
IntroductionWhen a firm performs a new game activity or any other activity, its competitorsare likely to react to the activity. For example, if a firm introduces a new prod-uct, lowers or raises its prices, launches a new ad campaign, increases R&D ormarketing spending, enters a new business, boosts manufacturing capacity,builds a new brand, or performs any other activity, its rivals are likely torespond sooner or later. Thus, how successful the firm is with the new activity isa function not only of how the firm performs the activity but also of competi-tors’ reaction. Thus, before taking a decision, a firm may want to consider itscompetitors’ likely actions and reactions. In particular, the firm may be betteroff asking itself questions such as: How are my rivals acting? How will theyreact to my actions? How best should I react to my rival’s reaction to myactions? If the rival moves first, what should I do? A useful tool for exploringsome of these questions is game theory. Game theory enables firms not only toask what their competitors are planning to do but also to ask what is in the bestinterests of these competitors. In this chapter, we explore how game theory canbe used to explore some of these questions. Because this book assumes no priorknowledge of game theory, most of this chapter is dedicated to reviewing someof the key concepts of both cooperative and noncooperative game theory thatare important to understanding value creation and appropriation.
Chapter 11

The Role of Game Theory in Strategic Innovation
Recall that to create and appropriate value, a firm often has to cooperate andcompete with different members of its value system. For example, a firm cancooperate with its suppliers, complementors, or customers to create value, andcompete to appropriate the value. It can also cooperate with some rivals tocompete better against others, as is the case when firms enter co-marketingagreements or form strategic alliances to develop new products. Of course,firms compete against each other when they offer similar products, hire fromthe same pool of employees, bid for contracts, advertise, price their products,seek partners to cooperate with, or purchase components. Effectively, the for-tunes of a firm and those of its coopetitors—the rivals, suppliers, customers,and complementors with which it cooperates and competes—are often inter-dependent. Therefore, in deciding what to do, each firm is better off taking intoconsideration the actions and reactions of it coopetitors. This is where gametheory comes in. Game theory is a tool for formally analyzing competition andcooperation between firms as they create value and position themselves toappropriate the value.1 Rather than be content with asking what one’s coopeti-tor plans to do, game theory suggests that managers ask what is in one’s coo-petitor’s best interest and how one is likely to act or react in that best interestand one’s own interest.
Cooperative and Noncooperative Games
There are two major approaches to game theory: cooperative and noncoopera-tive. Noncooperative game theory has been more commonly utilized to explorestrategy questions than cooperative game theory. Both address different ques-tions in strategy.2 Noncooperative game theory is about how to better competeagainst rivals by taking their likely reactions into consideration when one per-forms activities. It has been used to analyze strategic moves whose outcomesdepend on one’s rivals’ likely actions and reactions, such as whether to intro-duce a new product, increase R&D or advertising spending, retaliate againstnew entrants, preannounce a new product introduction, increase manufactur-ing capacity, raise or lower prices, or emphasize a particular brand. Non-cooperative game theory is about individual rivals competing against eachother. It says little about the fact that during value creation and appropriation,firms must bargain or cooperate with suppliers, compete for buyers, interactwith complementors, and sometimes explicitly cooperate with rivals. It saysnothing about the bargaining power of suppliers, complementors, and buyers,and the threat from substitutes and potential new entrants that can be critical tovalue creation and appropriation. Nor does it say much about how an alliancesuch as Wintel would compete against another coalition such as Apple. This iswhere cooperative game theory comes in. Cooperative game theory is useful inexploring how much value can be created by cooperating with coopetitors, howmuch power each coopetitor has, and how much of the value created each actorcan be expected to appropriate.3
A cooperative game details the outcomes that occur when players (coopeti-tors) jointly plan their strategies and play as combinations of players, and notindividual players.4 The unit of analysis is a group or coalition of individual
276 Opportunities and Threats
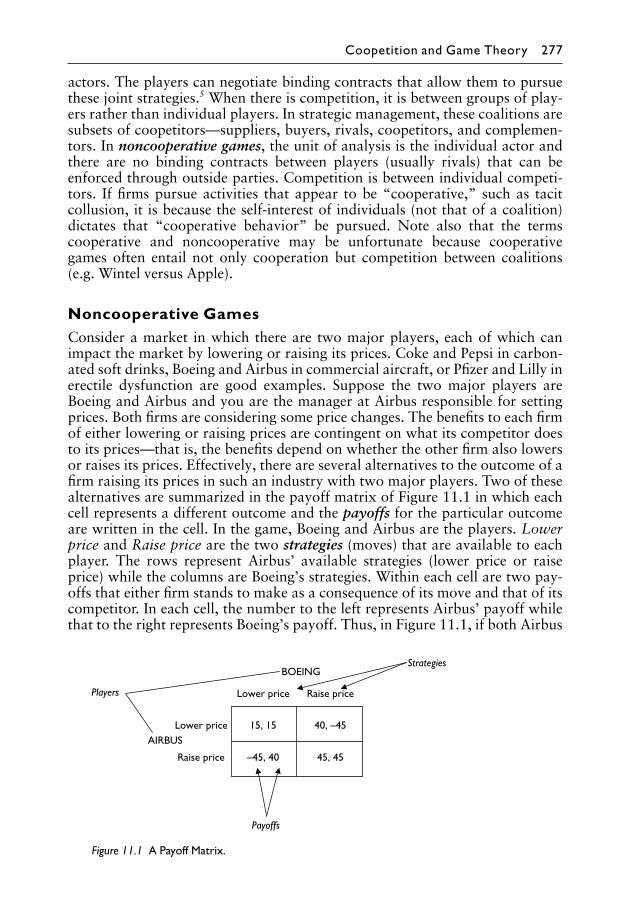
actors. The players can negotiate binding contracts that allow them to pursuethese joint strategies.5 When there is competition, it is between groups of play-ers rather than individual players. In strategic management, these coalitions aresubsets of coopetitors—suppliers, buyers, rivals, coopetitors, and complemen-tors. In noncooperative games, the unit of analysis is the individual actor andthere are no binding contracts between players (usually rivals) that can beenforced through outside parties. Competition is between individual competi-tors. If firms pursue activities that appear to be “cooperative,” such as tacitcollusion, it is because the self-interest of individuals (not that of a coalition)dictates that “cooperative behavior” be pursued. Note also that the termscooperative and noncooperative may be unfortunate because cooperativegames often entail not only cooperation but competition between coalitions(e.g. Wintel versus Apple).
Noncooperative GamesConsider a market in which there are two major players, each of which canimpact the market by lowering or raising its prices. Coke and Pepsi in carbon-ated soft drinks, Boeing and Airbus in commercial aircraft, or Pfizer and Lilly inerectile dysfunction are good examples. Suppose the two major players areBoeing and Airbus and you are the manager at Airbus responsible for settingprices. Both firms are considering some price changes. The benefits to each firmof either lowering or raising prices are contingent on what its competitor doesto its prices—that is, the benefits depend on whether the other firm also lowersor raises its prices. Effectively, there are several alternatives to the outcome of afirm raising its prices in such an industry with two major players. Two of thesealternatives are summarized in the payoff matrix of Figure 11.1 in which eachcell represents a different outcome and the payoffs for the particular outcomeare written in the cell. In the game, Boeing and Airbus are the players. Lowerprice and Raise price are the two strategies (moves) that are available to eachplayer. The rows represent Airbus’ available strategies (lower price or raiseprice) while the columns are Boeing’s strategies. Within each cell are two pay-offs that either firm stands to make as a consequence of its move and that of itscompetitor. In each cell, the number to the left represents Airbus’ payoff whilethat to the right represents Boeing’s payoff. Thus, in Figure 11.1, if both Airbus
Figure 11.1 A Payoff Matrix.
Coopetition and Game Theory 277

and Boeing lower their prices, they each make $15 million more. However, ifAirbus lowers its prices but Boeing raises its prices, Airbus’ payoff is 40 whileBoeing’s loses sales to Airbus and ends up with a negative payoff (–45). If bothfirms raise their prices, each has a payoff of 45. If Boeing lowers its prices butAirbus raises its prices, Boeing’s payoff is 40 while Airbus’s is –45. Effectively,in noncooperative game theory, a game is made up of a set of players, a set ofstrategies (moves) that each player can pursue, a specification of the payoffs foreach combination of strategies, and the timing of the moves. (We will return tothe timing element later.) Thus, the outcome of the game depends on the payoffsthat each player expects to receive. It also depends critically on what eachplayer believes that the other will do. If Airbus believes that Boeing will raise itsprices, it will raise its own prices and obtain the payoff of 45 instead of the 40that it would receive if it lowered its prices. If it believes that Boeing will lowerits prices, it will also lower its prices.
Simultaneous Games
In the game of Figure 11.1, each player takes its decision about whether tolower or raise its price without knowing which decision the other player hastaken. That is, each player selects its strategy without knowing which strategythe other player has selected. Such games are called simultaneous games, sinceeach player moves without knowing the other player’s move. Even if the playerstake their decisions at different points in time, the game is still a simultaneousgame so long as each player chooses its strategy without knowing the strategythat the other player has selected. The timing issue is not so much that bothplayers took their decisions at the same time but that each one took its decisionwithout knowing the decision that the other had taken. Each firm has its beliefsabout what the other player will do but does not know what it has done beforemoving.
Dominant Strategy
Consider another example, where two major firms in a market can either adver-tise or choose not to advertise (Figure 11.2). If both firms choose not to adver-tise, they save on advertising costs and their market shares stay about the same,giving each the same payoff of 40. If they both advertise, their payoff is 20 each.However, if one firm advertises and its competitor does not, it takes marketshare from the competitor and ends up with a much higher payoff of 50 while
Figure 11.2 Dominant Strategy.
278 Opportunities and Threats

the competitor receives 10. More importantly, note that if Firm X advertises, itspayoff is 20 when Firm Y advertises and 50 when Firm Y does not advertise; butif Firm X does not advertise, its payoff is 10 when Firm Y advertises and 40when Firm Y does not advertise. Thus, Firm X is better off advertising nomatter whether Firm Y advertises. Effectively, no matter what Firm Y does,Firm X is better off advertising. We say that to Advertise is a dominant strategyfor Firm X since, when it advertises, it is doing the best that it can, no matter thestrategy that Firm Y pursues. Another examination of Figure 11.2 shows that toAdvertise is also a dominant strategy for Firm Y since, no matter what Firm Xdoes, Firm Y is better off advertising. Thus, the two firms end up in the upper-left cell with a payoff of (20, 20). This cell is the only noncooperative equi-librium in the game and is called the dominant strategy equilibrium, since itresults from the fact that each player has a dominant strategy. In this cell, eachfirm is maximizing its payoff, given what it believes the other to be doing.
Nash Equilibrium
Two major commercial aircraft manufacturers want to introduce the next-generation commercial airplane. There is a market for a very large airplane, theso-called SuperJumbo, an aircraft that can carry up to 800 passengers com-pared to an existing maximum of about 500. Given the huge R&D, manu-facturing and marketing investment needed, the market might not be largeenough for each firm profitably to offer a SuperJumbo. There is also a marketfor a so-called SuperLiner, a smaller aircraft that has a longer flying range thanthe SuperJumbo and carries about 300 passengers, but this market might alsonot be large enough to support both firms. As Figure 11.3 shows, if both manu-facturers (Firm A and Firm B) offer the SuperJumbo, they stand to each lose $2billion. If they both offer the DreamLiner, they also stand to lose $2 billion each.However, if Firm A offers the SuperJumbo while Firm B offers the DreamLiner,Firm A’s payoff is $5 billion while Firm B’s $4 billion. If Firm A offers theSuperJumbo while Firm B offers the DreamLiner, both firms have Payoffs of $4billion and $5 billion respectively. So long as each firm does not offer the sameproduct that the other is offering, they will do just fine. These firms do not gettogether in meetings and decide who will offer what type of airplane, since to doso might be considered anticompetitive and therefore illegal in some countries.However, they can make their intentions known by the announcements thatthey make about future products. Suppose, for example, that Firm A announcesits plans to offer the SuperJumbo. Firm B, on reading this announcement in the
Figure 11.3 Nash Equilibrium.
Coopetition and Game Theory 279

press, announces that it will shelve any plans that it might have had to offer aSuperJumbo and concentrate on offering a DreamLiner. Given what Firm Bbelieves that Firm A will do (offer a SuperJumbo and not offer the DreamLiner),it has no incentive to deviate from its proposed action of offering the Dream-Liner. Similarly, given what Firm A believes Firm B will do (offer a DreamLinerand not offer the SuperJumbo), it has no incentive to deviate from its proposedaction of offering the SuperJumbo (Figure 11.3).6
Effectively, neither firm has an incentive to deviate from its proposed action,given what it believes the other firm will do. If either firm takes the proposedaction, its payoff is $5 billion. If it deviates and its opponent’s proposed actionremains unchanged, its payoff will be –$2 billion. Thus, the strategy set of thetop-right cell of Figure 11.3 is a Nash equilibrium. In a Nash equilibrium, eachfirm is doing the best that it can, given what the other is doing. No single playercan do better by unilaterally changing its move. In the strategy set of the top-right cell, Firm A is doing the best that it can (with a payoff of 5), given whatFirm B is doing, and Firm B is doing the best that it can, given what Firm A isdoing. Note that the strategy set given by the bottom-left cell is also a Nashequilibrium. A dominant strategy equilibrium is also a Nash equilibrium; butnot all Nash equilibria are dominant equilibria. For example, the dominantstrategy equilibrium of Figure 11.2 (top-left cell) is a Nash equilibrium; but theNash equilibrium of Figure 11.3 (top-right cell) is not a dominant strategyequilibrium.
Prisoners’ Dilemma
The example of Figure 11.2 belongs to a class of games known in game theoryas prisoner’s dilemma. In these games, the payoffs are such that each player hasan incentive to pursue a strategy that will result in a worse outcome than if bothplayers had simultaneously chosen the other strategy. In Figure 11.2, the strat-egy that will give both firms the highest payoff is Don’t advertise; but becauseeach has an incentive to advertise, they both miss out on the larger payoff. Infact, even if both players had a chance to come to some type of cooperativeagreement, the incentive to deviate from the agreement may still be too strongto resist. The name prisoners’ dilemma comes from a game in which twoprisoners who are alleged to have jointly committed a crime are separated andtold the following: if either one confesses to both of them having committed thecrime, both prisoners will be convicted but the confessor will receive a lightsentence while the other prisoner will receive a much heavier sentence. We haveshown the light sentence in Figure 11.4 as –1 (one year in prison) and the muchheavier sentence as –10 (ten years in prison). If neither prisoner confesses, bothprisoners will be convicted of a lesser crime and serve about two years (–2). Ifboth confess, they each receive a three-year sentence. As it can be seen in Figure11.4, the incentive is to confess. The dominant strategy for both prisoners is toconfess. Thus both players will end up with the top left payoff, which is lowerthan the payoff in the bottom right cell. Incentives could encourage players tochoose the preferred outcome of the lower right cell. For example, according tothe movies, the Mafia gave its members a very good incentive to not confess.
280 Opportunities and Threats

Repeated Simultaneous Games
In many competitive arenas, firms face each other repeatedly. For example,Coke and Pepsi have repeatedly introduced new products, set product prices,and launched new product promotions in the same markets. Intel and AMDhave had to negotiate prices of microprocessors with PC makers several timesover each product’s life cycle and each time each new product is introduced.However, the games we have explored so far have assumed that the players haveno history of performing the particular activity; the games are one-shot repre-sentations with no repetition. To model interactions such as repeated newproduct introductions, we use repeated games in which the same game is playedon many different occasions. In repeated games, a firm has a chance to establisha reputation about its behavior and learn about the behavior of its competitors.The question is, how would the outcome of a repeated game be any differentfrom that of the standard one-shot game? It depends on whether the end of thelast stage of the repeated game is specified and known or not.
By specified and known, we mean that the players, their strategies, andcorresponding payoffs for each set of strategies are given, such as in theexamples above. If the last stage of the game is not specified and known, andplayers know that they have to face each other again in the future, the fearof future retaliation may make each player behave in a more cooperativeway. Effectively, if players are going to encounter each other repeatedly, oneplayer can always punish the other player for something that he/she did inthe past. Each player may cooperate with the other because he or she knowsthat if he or she is cheated by the other player today, he or she can punishthe cheat tomorrow. Thus, the prospect of future vengeful retaliation mayforce players to do the right thing. Consider the prisoner’s dilemma case ofFigure 11.1. If the firms that price the products have to face each otherrepeatedly in the same market, they will find a way to “cooperate” and raisetheir prices. Tacit collusion, which we will explore later, is a good vehicle forsuch cooperation.
If the last stage is specified and known, then the repeated game can be
Figure 11.4 Prisoner’s Dilemma.
Coopetition and Game Theory 281

analyzed by starting from the last stage and working one’s way backwards tothe first stage. Suppose, for example, that there is no incentive to cooperate inthe last stage. Then, since it is the last stage, there is no prospect of futurevengeful retaliation and therefore nothing to force players to behave morecooperatively in that final stage. If there is nothing to force players to behavemore cooperatively in that last stage, there is probably no reason why theyshould cooperate in the last-but-one stage, last-but-two stage, and so on.
Firms can also learn from their actions. If two firms make the mistake ofintroducing very similar products in the same white space today when there isextra white space that they could each occupy, they will be wiser tomorrow.If firms lose a lot of money by lowering their prices when they shouldnot (Figure 11.1), they will learn and think twice when they have to play thesame game.
Sequential Games
All the games we have discussed so far are simultaneous games, since eachplayer selects its strategy without knowing which strategy the other player hasselected. These games apply in those cases where firms take their decisionswithout each firm knowing the decision that the other firm has taken. In manyother circumstances, however, firms move sequentially, not simultaneously. Infact, in most new game strategies, firms move in turns: first movers, then fol-lowers. In sequential games, one player moves before the other. Figure 11.5 is asequential game representation of the simultaneous game of Figure 11.3 inwhich Firm A moves first. The decision tree of Figure 11.5 is called the extensiveform of the game (compared to the form of Figure 11.3 which is called thenormal form). It captures the possibilities and sequence of events. Firm A hasthe first move. It must decide whether to offer the SuperJumbo or DreamLinerfirst. To take this decision, it must anticipate what Firm B is likely to do. Effect-ively, deciding what Firm A should do consists of starting from what it believesthat Firm B will do and working backwards. If Firm A were to offer the Super-Jumbo, Firm B will offer the DreamLiner for the payoff of (5, 4) rather than the(−2,−2) that goes with offering the SuperJumbo; but if Firm A offers theDreamLiner, Firm B will offer the SuperJumbo for the (4,5) payoff. In thissecond option, Firm A’s payoff is 4 rather than 5 from the first option. Thus, a
Figure 11.5 A Sequential Game.
282 Opportunities and Threats
rational Firm A will go for the first option and offer the SuperJumbo first,believing that Firm B will offer the DreamLiner. By moving first, Firm A has achance to earn some first-mover advantages.
If a firm moves first in a sequential game, it can either try to deter entry bycompetitors or encourage it. If it tries to deter entry but competitors still enter, itcan fight the entry, accommodate it, or change the rules of the game. We exam-ine these cases next.
Deterrence and Sequential Games
If a player who moves first can deter entry, it is virtually a monopoly in itsproduct-market space and stands to enjoy some monopoly benefits, includingincreased profitability. There are several steps that a firm can take to deter entryand therefore maintain its profitability chances.
Evoke Barriers to Entry
If an incumbent has built first-mover advantages, it can use them to deter entry.For example, an incumbent can threaten to sue any new entrants that, in enter-ing, violate its protected intellectual property. Whether such a threat works is afunction of whether the firm has a reputation for suing any firms that haveviolated its intellectual property protection. If an incumbent has accumulated alot of cash, it can use it to accelerate the rate at which it preemptively acquiresscarce resources to demonstrate to potential new entrants that critical resourceswill be more scarce and costly if they were to enter. If an incumbent has a largemarket share and its products enjoy economies of scale (e.g. in R&D, advertis-ing, and manufacturing), it can use its low-cost position to threaten the newentrants with a price war if they were to enter. It can also sign agreements withsuppliers, distributors, complementors, and buyers to lock up critical inputsand complements.
Limit Pricing
An incumbent can also use limit pricing to deter entry. In limit pricing, a firmkeeps its prices low, hoping that the low prices will discourage profit-motivatedrational new entrants who want large profits from entering. The assumption isthat the prices will remain low or even drop if the potential new entrant were toenter. Limit pricing will work only if there is something about the incumbentthat allows it to keep its cost lower and can therefore pass on some of its costssavings to customers in the form of low prices. That would be possible, forexample, if the first mover has established a system of activities that allows it tohave a low-cost structure, enjoys economies of scale, has gone up the learningcurve, or enjoys any other first-mover advantage that allows it to keep its costslow relative to those of potential new entrants. One important thing about limitpricing is that, like any other deterrent measure, there should be somethingabout the firm that makes its “threat” of limit pricing credible. For example, if afirm can demonstrate that it has a low-cost structure that is difficult to replicate,potential new entrants are more likely to take it seriously when it threatens limitpricing or starts practicing it. As we will see below, irreversible investments in
Coopetition and Game Theory 283

assets or activities that underpin the type of first-mover advantages that canallow a firm to keep its costs low can also lend credibility to a firm’s decision topractice limit pricing.
Commitment and First-mover Advantages
In sequential games, the player that moves first has the potential to earn first-mover advantages. One way to demonstrate to potential followers that one hasthese first-mover advantages or is in the process of earning them, is to make theright commitments. The right commitments can deter or slow down entry byfollowers. For example, heavy investments in R&D and intellectual propertyprotection capabilities (including lawyers) by a first mover tells potential fol-lowers that it is committed to acquiring and protecting its intellectual property.
For a commitment to be effective in deterring or slowing down competitors,it must be credible, visible to competitors, and understandable.7 A commitmentis credible if there is something about it that makes competitors believe in it andthe options that it creates or limits. The primary driver of credibility is irreversi-bility of the commitment. A commitment is irreversible if it is costly or difficultto walk away from or undo. That would be the case, for example, if the assetsthat underpin the commitment cannot be profitably redeployed elsewhere. Theidea here is that if a player’s commitment is irreversible, the player is more likelyto stay and fight followers rather than accommodate them or exit. Rationalfollowers, knowing that the player is not likely to welcome entry, are likely torefrain from entering. Wal-Mart’s saturation of neighboring small towns in theSouthwestern USA with retail stores and matching distribution centers andlogistics are another example of commitment. Since, for example, it would bedifficult or costly to use Wal-Mart’s thousands of stores and distribution centersin contiguous small towns for something other than retail, rational potentialnew entrants are less likely to try to enter these towns. Credibility of commit-ments also depends on the options that are eliminated when a firm makes thecommitments. If, for example, in making the commitments, a player eliminatesall its options, it is more likely to stick with the commitment and fight. Inchoosing to operate only out of secondary airports, for example, Ryanair isgiving up the option to operate out of the larger more congested primary air-ports. Thus, anyone that wants to fight Ryanair in one of the secondary airportsthat it occupies should expect the airline to fight harder than it would fight if itcould just pick up and move to a larger primary airport.
Of course, for a commitment to have the right effect on competitors, theymust understand the commitment and its implications. In the fluid phase of atechnological change, for example, there is so much market and technologicaluncertainty that it is difficult to tell what commitments and their likely out-comes are all about. A firm can make parts of its plants available for tours todemonstrate that it has investment in the right equipment and personnel. Manyother commitments, such as investments in intangible assets or a commitmentto keep prices high, are more difficult to see and understand. This is wheresignaling comes in.
284 Opportunities and Threats
Signaling and Reputation
If a player conveys meaningful information about itself to other players, it issaid to be signaling.8 Signals from a firm are usually designed to influence theperceptions of coopetitors’ and their actions or reactions. Whether the signal issuccessful in conveying the right message is a function of the coopetitor’s per-ception of the signal. Thus, the reputation of the firm that sends signals plays amajor role in the effectiveness of the signal. An extended warrantee, forexample, can be a signal of good quality and reliability. If the warrantee comesfrom a firm with a reputation for reliability, coopetitors are more likely tobelieve that the products are reliable. Brand names, packaging, advertising, andeven prices can be signals of quality. A firm might publish the number of patentsthat it receives in a particular area every year to signal to competitors that it hasthe capabilities to maintain its first-mover advantage in intellectual property.Effectively, firms can use signals to influence the actions and reactions of coo-petitors. The signals can sometimes be designed to confuse or fool competitors.
Encourage Entry
Sometimes, rather than try to deter firms from entering, a first mover is betteroff encouraging entry. That would be the case, for example, with a new marketor product that needs a certain number of firms or complementors to give thenew product credibility. For example, in the late 1970s, many businesses hesi-tated from buying PCs because they were being offered by many startups with-out credibility as business customers. IBM changed all that when it entered themarket in 1981. It brought in a lot of customers and grew the market foreveryone. We will return to encouraging entry when we explore cooperativegame theory below.
Suppose a firm’s efforts to prevent entry fail and a new entrant comes into themarket; what should the incumbent do? The incumbent can either fight the newentrant, accommodate it, or change the rules of the game to make the marketmore attractive for the incumbent despite the entry.
Fight or Change the Rules of the Game
An incumbent can fight a new entrant using predatory actions such as predatorypricing, changing the rules of the game, or taking other measures such asincreasing its capacity.
Predatory Activities
An incumbent’s activities are predatory if they eliminate or discipline a rival, orinhibit a current or potential rival’s competitive conduct.9 One of the moststudied such activities is predatory pricing. In predatory pricing, a firm lowersthe price of its product with the intention of driving out or punishing rivals, orscaring off potential new entrants who see the low prices as a signal that post-entry prices will be low. During the period when prices are low, the firm and itsrivals lose money. If these rivals are unable to sustain the losses, they go out ofbusiness or start behaving properly. The firm is then left with fewer or no rivals,
Coopetition and Game Theory 285

or with well-behaved rivals. The firm can then raise its prices and start making aprofit again, hopefully enough for it to recover the amounts lost. Predatorypricing can also be designed to depress the market value of a competitor so thatthe predator can buy the competitor or parts of it at below market prices, or toestablish a reputation as a firm that tolerates neither entry nor behavior that itdoes not consider proper.
Predatory pricing is considered to be anticompetitive and illegal in manycountries, including the USA. In these countries, predatory pricing cases areusually brought by firms (presumed preys), not by governments. In any case, itis difficult to prove predatory pricing. To prove it in the USA, for example, theplaintiff has to show that the lower price was temporary; that the intentionof the accused predator, in lowering the price, was to drive out the rival; thatby raising its prices again the accused predator could recoup the losses thatit incurred from the price cuts; and that the low price is below the accusedpredator’s average cost.
Change the Rules of the Game
Rather than use predatory pricing to fight new entrants, an incumbent canchange the rules of the game in its favor. Although, as we will see later in thisbook, management literature is full of good examples of new entrants whoattacked an industry by changing the rules of the game, incumbents can alsochange the rules of the game in the face of new entrants. One of the best ways tochange the rules of the game is to change the payoffs not only for new entrantsbut also for incumbents. The case of Sun Microsystems provides a goodexample. In the late 1980s, Sun was an incumbent in the computer workstationindustry and its workstations, like those of incumbents in the industry at thetime, used a technology called CISC. Some new entrants started entering theindustry using a new technology called RISC. In response to the entrants, Sunalso introduced the new technology but rather than keep its version of thetechnology proprietary, Sun opened it up to anyone who wanted it.10 Thiscontrasted with its old CISC strategy and with the RISC strategies of its com-petitors. By making its RISC architecture open, Sun attracted many workstationmakers that would not have entered the industry or that would have adoptedincompatible RISC technologies. And the more workstation makers thatadopted the technology, the more software that was developed for that particu-lar technology. The more software that was developed for a technology, themore customers that wanted workstations from the technology. Sun’s RISCtechnology ended up winning the RISC technology standard for workstationsagainst other RISC technologies. Sun used its complementary assets—installedbase, brand, distribution channels, and relationships with software develop-ers—to exploit its open RISC architecture and was profitable for most ofthe 1990s.
Accommodate, Merge, or Exit
Rather than fight new entrants, an incumbent may decide to concede some of itsmarket share. The decision not to fight may be because the incumbent does nothave what it takes to fight. It may also be because the incumbent is smart
286 Opportunities and Threats

enough to realize that wars—especially price wars—produce no winner, exceptsome customers. The incumbent may welcome the new entrant and engage intacit collusion. Tacit collusion is said to take place when rivals coordinate theiractivities and know that they are cooperating but there is no agreement, verbalor written. When the activity in question is pricing, it is also called price leader-ship or cooperative pricing. In fact, when many people talk of tacit collusion,they are talking about price leadership (cooperative pricing) although firms canalso collude on when to introduce products, how much to spend on R&D, etc.Tacit collusion between firms can be facilitated by so-called meeting the com-petition or most-favored customer clauses, which at first may appear to be goodfor customers. Consider two such phrases: “We will not be undersold” or “Wewill match our competitors’ prices, no matter how low.” When a firm issuessuch clauses, it is telling its rivals to keep their prices at the high level. If forsome reason the rivals lower their prices, the firm will lower its prices too andeveryone will lose money. For fear of everyone losing money when they lowertheir prices, rivals may decide to keep their prices high. Tacit collusion is morelikely to take place in a market where (1) the number of firms in the market issmall, (2) firms in the market face each other repeatedly in some sort of a“repeated game” without knowing what the end game will be, (3) profits perfirm in the market are higher under collusion than when there is no collusion,(4) the discount rate is low, or (5) the incremental profits for deviating firmsare high.11
An incumbent may also be better off merging with a new entrant rather thanfighting the entrant. That would be the case, for example, if the new entrantentered using a radical technological change that renders incumbents’ techno-logical capabilities noncompetitive but an incumbent has important scarcecomplementary assets that are needed to profit from the new technology. Newentrants, using new games, can also change the structure of an industry so muchthat incumbents can no longer compete. In that case, an incumbent may bebetter off exiting the industry when it finds out that it no longer has what ittakes to compete in the industry.
Cooperative GamesRecall that in noncooperative games, the unit of analysis is a player, usually arival that is competing against another rival. Each player seeks to maximize itspayoff no matter what the other player does. Thus, noncooperative game the-ory can, for example, help a firm analyze its decision to raise or lower its prices,taking the likely reaction of its rivals into consideration. However, noncoopera-tive game theory tells us little about the bargaining power of suppliers, thepower of complementors, or the bargaining power of buyers and their reserva-tion prices. Nor does it say much about the role of complements and substitutesin the pricing decision. Apart from tacit collusion, noncooperative game theorydoes not say much else about explicit cooperation. Cooperative game theorydoes all these things that noncooperative game theory does not. This is fortu-nate because, as we have seen throughout this book, the positioning of a firmrelative to its coopetitors, cooperation between coopetitors, reservation prices,and so on all play critical roles in value creation and appropriation. In coopera-tive games, the unit of analysis is a coalition of players. Each coalition is made
Coopetition and Game Theory 287

up of a subset of coopetitors. Players’ strategies are coordinated so as to maxi-mize the payoff for the coalitions in the game.
Elements of a Cooperative Game
A cooperative game has two major elements: a set (coalition) of players and acharacteristic function. Usually, the players are some subset of coopetitors—asubset of suppliers, rivals, complementors, and buyers. The characteristic func-tion specifies the value created by different coalitions of players. To illustratethese elements, consider the following example.
Example 11.1
A biotech startup (S) has discovered a new drug and has three options to get itapproved by the FDA and bring it to market. It can go it alone, form an alliancewith either Firm A or Firm B, or form an alliance with both. If the startup (S)goes it alone, it earns $100 million from the drug. If it forms an alliance with A,the coalition earns $150 million since A has the marketing and clinical testingassets. If S forms the alliance with B, the team earns $200 million because B notonly has marketing and clinical testing capabilities, it also has a strong salesforce that already sells B’s drugs.
The different coalitions and the value created by each are shown in Table11.1. If the drug is not marketed at all, no value is created. If S markets theproduct alone, the value created is 100. Either A or B, without S has no productto sell and therefore the value created by each is zero. The value created by theAB coalition is also zero. The value created by the SA, the coalition of S and A,is 150 while the value created by SB, the coalition of S and B is 200. Note, inparticular, that SAB, the coalition of all three firms, results in the same value asthe coalition of S and B. That is because SA is dominated by SB; that is, B doeseverything that A would be needed for. The mapping of the coalitions into valuecreated is the characteristic function. Effectively, the characteristic function canalso be described as the collective payoff that players can gain by formingcoalitions.
Let us introduce some terminology to make things more concise. Let N be theset of players in a game, and C be any subset of the N players that can form acoalition. We say that v(C) is the value created when the subset C forms acoalition. And v(C{p}) is the value created when play p is excluded from coali-tion (group) C. In our biotech example, N = {S, A, B} since there is a total ofthree players; v(S) = 100 since the value of S going it alone is $100 million; v(A)= 0, v(B) = 0, and v(AB) = 0 since neither each of A or B working alone nor as acoalition creates value; v(SA) = 150 since a coalition of S and A nets $150million; and v(SAB) = 200 since a coalition of all three nets $200 million.
Table 11.1 A Mapping of Coalitions into Value Created
Coalition O S A B AB SA SB AB SAB
Value created or collectivepayoff (numbers in $M)
0 100 0 0 0 150 200 0 200
288 Opportunities and Threats
Also, the value created when player S is not in the coalition is 0; that is,v(C{S}) = 0; Also, v(C{A}) = 200; v(C{B}) = 150.
Marginal Contribution and Appropriation of Value Co-created
So far, we have discussed how different players come together to co-create valuefor their coalitions. The question remains, how do members of each coalitionshare in the appropriation of the value co-created? Of course, the amount thateach player appropriates depends on many factors, including its bargainingpower vis-à-vis the other co-creators of the value. The amount also depends, inpart, on how much each player contributed to the value creation. It depends oneach player’s marginal contribution or added value. (A firm’s contribution tovalue creation also contributes to its bargaining power.) A firm’s marginal con-tribution or added value (to coalition) is the amount by which the total valuecreated would shrink if the firm left the game.12 Thus, to determine the addedvalue of a firm, we calculate the total value with the firm in the game and thetotal value without the firm. The difference between the two numbers is thefirm’s added value or marginal contribution. In the biotech example:
The marginal contribution of the startup S is:
v(SAB) − v(C{S}) = v(SAB) − v(AB) = 200 − 0 = 200.
The marginal contribution of A is:
v(SAB) − v(C{A}) = 200−200 = 0.
That for B is:
v(SAB) − v(C{B}) = 200 − 150 = 50.
If we assume that the value appropriated (captured) by each actor is pro-portional to the value created by the actor and that no firm can appropriatemore value than it has created, then we can expect A to appropriate none of the$200 million, since its contribution to the value created is zero. B, on the otherhand, can appropriate up to $50 million while S can appropriate a minimum of$150 million (200–50) but not more than $200 million. Effectively, of the $200million created, the value appropriated by S ranges from 150 to 200 while thatcaptured by B ranges from 50 and 0. Just where in this range S and B make thesplit depends on those aspects of their bargaining powers that have little to dowith value creation. We will return to another example a little later.
Changing the Game
Recall that a cooperative game has two major elements: a set (coalition) ofplayers and a characteristic function that is a function of the interactionsbetween the players. One depiction of the players that are typically involvedin value creation and appropriation, and the interdependencies among theseplayers, is shown in Figure 11.6. These players and their interdependencies
Coopetition and Game Theory 289

constitute what Professors Brandenburger and Nalebuff called the value net.13
Interactions in the value net during value creation and appropriation can bethought of as being in two dimensions. Along the horizontal dimension arethe now familiar suppliers and customers with whom the firm interacts andtransacts to create and appropriate value.14 Along the vertical dimension arethe complementors and substitutors with whom the firm interacts but notnecessarily transacts. Complementors are the players from whom customersbuy complements, or that buy complementary resources from suppliers.15
Substitutors are players (existing rivals, potential new entrants, providers ofsubstitutes) from whom customers may buy products or to whom supplierscan sell their resources. Note that in other strategy frameworks such asPorter’s Five Forces, substitutors are all seen as competitors that must befought and vanquished. In cooperative game theory, they are seen as potentialcollaborators with whom a firm can cooperate to create value and compete toappropriate it.
Changing the game entails changing one or more of its elements. Each changein any of the elements of a cooperative game that we have explored above iseffectively a new game strategy on the part of the player that initiates thechange. This has implications for value creation and appropriation.
Changing Players
A new game can arise from a firm changing one of the players, including itself.Through the right moves or set of activities, a firm can change the number ofplayers, types of player or the roles played by players. Such changes can have adirect impact on the value created and how much of it a firm can appropriate.The more customers, suppliers, complementors, and sometimes substitutorsthat a firm has in a game, the higher the value created and the better the chancesof the firm appropriating value created. Let us start with the most obvious. Themore customers that a firm can bring into the value net, the more valuable thevalue net becomes, since it has more players who can pay for the value created.The more suppliers that are in a coalition, the better the chances of finding onewith whom the firm can cooperate. The more suppliers, the better a firm’schances of having bargaining power over them. It is probably for these tworeasons that most major firms insist on having second sources for their key
Figure 11.6 Players in a Value Creation and Appropriation Game.
290 Opportunities and Threats

components; that is, such firms insist on having more than one supplier of thesame component. More complementors can mean more and better comple-ments. The more complements, the more valuable a product. Effectively, a firmcan change the game in its favor by changing the number of customers, sup-pliers, and complementors.
A firm can also change the game by changing the type of player in its valuenet. The classic example is that of Dell when it entered the PC market. Itbypassed distributors and started selling directly to end-customers whocould get computers customized just for them. This move had both valuecreation and appropriation effects for Dell. First, by dealing directly withend-customers, Dell could better co-create the type of value thatcustomers wanted through its build-to-order capabilities. It could also offerservice to some customers, making the value net more valuable to them.Second, by changing players from the more concentrated and powerfuldistributors to the more fragmented and less powerful end-customers, Dellincreased its bargaining power vis-à-vis customers. It also lowered its sales andmarketing costs.
Increasing substitutors—existing rivals, potential new entrants, and makersof substitute products—can sometimes be good for value creation. Early in thelife of a product or technology that exhibits network externalities, joiningforces with many competitors can increase the value of a firm’s value net. Thatis because the more customers that use such a product/technology or compat-ible one, the more valuable the product/technology becomes to each customer;and the more competitors that sell the product/technology or compatible one,the more customers that will use it. Having competitors join forces to push aproduct can help the product win a standard. The story of the PC is now aclassic example. By making it possible for new entrants and other rivals to cloneits version of the PC, IBM increased the number of PC manufacturers. The moresuch manufacturers, the more software developers that opted to write softwarefor PCs, thereby increasing the value of the PC value net. Increasing competi-tion, especially in fast-paced industries, can also force a firm to become a betterdeveloper of newer and better products.
Apart from these exceptions, the goal is to eliminate substitutors or greatly toreduce their number.
Changing Value Added and Interaction Between Players
Recall that a firm’s added value = total value created with the firm in the gameminus the total value created without the firm in the game. Therefore, when theright player joins a game, it increases the value of the game. Thus, one way toincrease added value is to add the right number of players of the right quality.The question here is, what can be done to create additional added value in avalue net, without adding players? Additional value can be created by perform-ing innovation activities that allow a firm to deliver better differentiated orlower-cost products than existing ones. Recall from Chapter 4 that value cre-ated is the difference between the benefits that customers perceive and the costof providing these benefits. Thus the activities that a firm can perform to createadditional value also include those activities that are designed to create cus-tomer benefits and influence customers’ perception as well as those that are
Coopetition and Game Theory 291

designed to keep overall costs down. (Chapter 4 was all about value creationand appropriation.)
Example 11.2
As another example, consider a market in which there are two suppliers, twofirms, and one buyer.16 The buyer is willing to pay $60 for Firm X’s product butonly $120 for Firm Y’s product. Each supplier’s cost of supplying the product is$5. We will call the suppliers S1 and S2, and the buyer, B.
The value created by the different groups or coalitions (submarkets) of play-ers is shown in Table 11.2. We start our discussion of the example with sup-pliers. Since suppliers are identical and only one of them is needed, a marketwith either one or both suppliers creates the same value. Therefore the valuecreated by S1S2XYB, S1XYB, or S2XYB is the same. Since the buyer is willing topay $120 for Firm Y’s product but only $60 for Firm X’s product, the valuecreated by a coalition of the buyer, Firm Y and any supplier nets $115 (i.e. $120minus the $5 cost of either supplier), with or without Firm X; that is,v(S1S2XYB) = v(S1XYB) = v(S2XYB) = v(S1S2YB) = 115. Note that without thebuyer, there is no value created as far as the market is concerned and thereforev(S1S2XY) = v(S1XY) = v(S2Y) = v(S1S2) = 0. Also note that with Firm X in thegame, without Firm Y, the value created is only $55 ($60 − $5) since the buyer iswilling to pay only $60 for Firm X’s product. Thus, v(S1S2XB) = v(S1XB) =v(S2XB) = 55.
The value added by each player and the information for calculating thesevalues are shown in Table 11.3. Column 2 shows the value created without theplayer in question. Column 3 shows the value created by a market (coalition) ofall the players. The value added by any player, as we saw earlier, is the valuecreated with the player in the market minus the value created by the marketwithout the player; that is, value added by coalition C = v(S1S2XYB) − v(C{p}).Recall that v(C{p}) is the value created when play p is excluded from coalitionC. Suppliers 1 and 2 do not add any value. That is because of the competitiveeffect that results from having two identical suppliers. When one is not in themarket, the other can do the job. Firm X does not add any value when Firm Y isin the market, since the buyer values Firm Y’s product more than Firm X’s.When Firm Y is not in the market, then Firm X adds value to the market.Because there is only one buyer, but two firms in the market, the buyer can playthe firms against each other.
If we assume that no firm can appropriate more value than it created, then theamounts in column 4 (value added column), are the maximum amounts thateach firm can expect to capture. These amounts of value added by each playeradd up to more than the value of $115 created by the market. The question is,how are the $115 shared between the buyer and Firm Y? (The suppliers and
Table 11.2 Coalitions (submarkets) and Value Created
Coalition(submarket)
S1S2XYB S2XYB S1XYB S1S2YB S1S2XB S1S2XY S1S2 S2Y XY
Value created 115 115 115 115 55 0 0 0 0
292 Opportunities and Threats

Firm X cannot capture more than $0.) Since Firm X provides competition forFirm Y, the maximum that Firm Y can hope to capture is $60, the value addedby Firm X. (If Firm Y were to ask for more than $60, the buyer would turn toFirm X, whose product it values at $60.) This means that the buyer is guaran-teed a minimum of $55 ($115 − 60). The remaining $60 can be divided betweenFirm Y and the buyer, as a function of each firm’s bargaining power.
Applying Game Theory to Value Creation andAppropriationNow that we have briefly explored game theory, the question is, of what use is itin a firm’s quest to create and appropriate value using new game strategies? Weanswer this question by first summarizing the usefulness of game theory inbusiness in general, and then by zooming in on its usefulness to value creationand appropriation in particular.
Usefulness and Limitations of Game Theory in Business
Recall that firms create and appropriate value by performing activities of theirvalue chain. At each stage of its value chain, a firm usually has options as towhich value chain activities to perform; how, where, and when to performthem. Game theory can help firms better choose which activities to perform,when, where, and how to perform them, since it explicitly takes the likelyactions and reactions of coopetitors into consideration. For example, to createvalue, an airplane maker has to perform R&D to develop its prototype, turn theprototype into an airplane that can be manufactured cost effectively, get itsafety certified by government agencies, establish relationships with suppliers ofcomponents, build inbound logistics for components, build manufacturing cap-abilities, manufacture, price the planes, sell, finance, and distribute the planes.Given that the aircraft maker’s competitors may be just as interested in per-forming these activities, game theory can help the firm to take the likely actionsand reactions of coopetitors into consideration when making decisions aboutwhich of these activities to perform, how to perform them, and when. Thequestion is, how?
Table 11.3 Value Added and Guaranteed Minimum
Player p Value created withoutplayer p v(C{p})
Value created by allplayers v(S1S2XYB)
Value addedv(S1S2XYB) −v(C{p})
Guaranteed minimumappropriation
Supplier 1 (S1) v(S2XYB) = 115 115 0 0Supplier 2 (S2) v(S1XYB) = 115 115 0 0Firm X v(S1S2YB) = 115 115 0 0Firm Y v(S1S2XB) = 55 115 60 0Buyer v(S1S2XY) = 0 115 115 55
Coopetition and Game Theory 293

Framing Strategic Questions
Game theory offers a language and structure for describing the interdependencebetween a firm and its coopetitors. By identifying the players, specifying eachplayer’s possible moves (strategies), the timing of the moves and payoffs, gametheory enables firms to frame strategy questions that anticipate coopetitors’likely actions and reactions better. This enhanced framing of questions can helpthe decision-making that underpins value creation and appropriation. Usingour aircraft maker example, simultaneous games can be used to explore whathappens if the firm were to offer the same plane as its major competitor, if itraised its price, etc. Sequential games can be used to explore what happens if theaircraft maker were to offer each type of airplane first or second, etc.
Insights, Possibilities, and Consequences
Game theory can also be used to understand the structure of the interactionbetween a firm and its coopetitors better. It can be used to understand theoptions for changing the rules of the game and the consequences. It enablesfirms to figure out what the right moves for the particular situation are. Thus,an aircraft maker can use game theory to help it explore the consequences ofoffering different types of aircraft on its suppliers, complementors, customers,and rivals. It would also help in understanding what would happen if the firmwere to form a coalition with one set of coopetitors rather than another.
Anticipating the Future
By using cooperative game theory questions, a firm can imagine how its rela-tionships and industry would evolve if it were not part of it.17 For example, afirm can ask how well-off its alliance is without it in the alliance, and how well-off it will be in the future without it. This is a powerful question because itreminds the firm not only of what it has to offer to the alliance relative to othercoopetitors in the alliance but also of the self-interest of the coopetitors thatmight be changing. For employees, it may also be a good idea to ask themselveshow much value is created without them working for their firm and with themworking for the firm.18
Limitations of Game Theory
Game theory models, like any other model, have their limitations. To see someof these limitations, let us go back to one of the examples that we saw earlier(Figure 11.3). By taking each other’s likely reaction into consideration, Firm Band Firm A can avoid building the same plane and finding themselves with toomany planes and not enough sales to break even. They also avoid competing forsuppliers of components and skilled employees. Thus, by helping firms to decidewhich planes to build, game theory helps them better to create and appropriatevalue. An underlying assumption in the argument of Figure 11.3 is that bothfirms have the resources and capabilities to develop, manufacture, certify, andperform every other activity that it takes to offer a plane that customers value,once each firm decides which plane to offer. The fact is that not every firm that
294 Opportunities and Threats

decides to build a plane can build it. Game theory says little about why somefirms have the resources and capabilities that it takes to create and appropriatevalue. Nor does it say much about the procedure for creating and appropriatingvalue.19 “In business, as in other games, firms can only do as well as the handthey have been dealt.”20
Game theory also assumes that actors select those actions that maximize theirpayoffs, where payoffs can be any measure of performance including profits orutility. However, firms and the managers that take decisions often havenonprofit-maximizing behaviors. For example, a firm may take a decision forpolitical reasons that has nothing to do with maximizing profits. Anotherassumption of game theory is that actors have no cognitive limitations and willbe able to obtain and process all the information needed to take the decisions,no matter how complex the information. Most human beings are cognitivelylimited. Finally, game theory models usually say nothing about the focal firm’slarger strategy. For example, in the case of Figure 11.3, we do not know if oneof these airplane makers also offers military planes to governments and cantherefore easily modify the plane that it chooses to offer to transport militarygear. These shortcomings notwithstanding, game theory is still a very good tool.Like any other tool, game theory has to be used with care, paying attention toits assumptions and the context in which it is used, if one expects to get muchout of it.
Game Theory and New Game Activities
With this summary of the usefulness and limitations of game theory, we returnto our earlier question: how useful is game theory in a firm’s quest to create andappropriate value using new game activities? One way to answer this questionis to explore the extent to which game theory can be used to explain the contri-bution of new game activities to value creation and appropriation. To do so, werecall from Chapter 4 that there are two components to the contribution of anew game activity to value creation and appropriation: (1) the value chainfactor and (2) the new game factor.
The Value Chain Factor and the Usefulness of Game Theory
As we saw in Chapter 4, new game activities, by virtue of being value chainactivities, are most likely to contribute to value creation and appropriation ifthey:
a Contribute to lower cost, differentiation, better pricing, more customers,and better sources of revenue.
b Contribute to improving the firm’s position vis-à-vis coopetitors.c Take advantage of industry value drivers.d Build and translate distinctive resources/capabilities.e Are comprehensive and parsimonious.
Coopetition and Game Theory 295

Contribute to Lower Cost, Differentiation, Better Pricing, MoreCustomers, and Better Sources of Revenues
A firm can use noncooperative game theory to explore which product to offer,which market segment to enter, whether to raise or lower one’s prices, whatbrand to build, which sources of revenue to target, and which customers totarget, given the likely reaction of the firm’s rivals. This, however, will not saymuch about the bargaining that may go on between the firm and its customer(especially in business-to-business transactions). Nor does it do much for anycooperation the firm and its customers may undertake to create better customervalue and possibly raise customer reservation prices. This is where cooperativegame theory comes in. It can help firms to understand better how much valuecan be created by which coalitions (of itself and its coopetitors). Cooperativegame theory helps in the analysis of the interdependencies between a firm andits coopetitors that can be critical to targeting the right customers with the rightvalue, and pursuing the right pricing strategies and sources of revenue.
However, while game theory can say something about which brand to build,given the brands being pursued by one’s rivals, it says little about cultivating theability to build brands. While it can help with analyzing whether and when tooffer a new product targeted at the right customers, it says little about theability to build new products. An implicit assumption in many game theorymodels is that firms will be able to offer the new product or brand that theydecide to build, given their rivals’ likely reaction. Many firms that invest in newproducts targeted at profitable product market positions have failed becausethey did not have what it takes to develop and commercialize the products.
Contribute to Improving the Firm’s Position vis-à-vis Coopetitors
In taking the likely actions and reactions of rivals into consideration, non-cooperative game theory can help a firm to avoid unnecessary competition. Forexample, in the game of Figure 11.3, both firms can avoid crashing with eachother in two markets, each of which cannot support both firms: if one firmoffers the SuperJumbo, the other firm should offer the DreamLiner. Thus, non-cooperative game theory can help a firm dampen or reverse the competitiveforce from rivalry that can impede the firm’s ability to create and appropriatevalue. Cooperative game theory can be used to explore the bargaining andcooperation that goes on between a firm and its coopetitors. For example, byworking with its customers to help them discover their latent needs in a newproduct, a firm can raise customer’s willingness to pay. By working with sup-pliers to help them reduce their costs, the suppliers are more likely to acceptlower prices from the firm.
Again, while game theory can help a firm to understand what activity topursue to improve its position vis-à-vis coopetitors, given rivals’ likely reaction,it says little about the ability of the firm to pursue the particular activity. Forexample, in Figure 11.3, while noncooperative game theory suggests that FirmA should offer the SuperJumbo, knowing that Firm B will offer the DreamLiner,it says little about how capable Firm A is at building the SuperJumbo; and whilecooperative game theory can help a firm to understand which suppliers it canwork with better to create value, it says little about why some firms are better at
296 Opportunities and Threats

such cooperation than others. In the automobile industry, for example, Toyotahas done an outstanding job working with its suppliers to innovate and keepcomponent costs down, compared to Ford and GM. Game theory tells us littleabout what the superior capabilities of Toyota are in working with suppliersand how one would go about building them.
Take Advantage of Industry Value Drivers
Recall that industry value drivers are those industry factors that stand to have asubstantial impact on the benefits (low-cost or differentiation) that customerswant, or the quality and number of such customers. For example, in offlineretailing, location is critical since it determines the types and numbers of cus-tomers who can shop there, the cost of operations, cost of real estate, and thenumber and types of competitor. A firm can use game theory better to takeadvantage of industry value drivers. For example, in choosing a retail location,a firm can use game theory to avoid head-on competition with other retailers.
Build and Translate Distinctive Resources/Capabilities
Decisions to increase or decrease R&D spending, whether or not to patent,where to build what plant, which brand to build, etc. are all decisions aboutbuilding resources/capabilities and as previous examples have shown, nonco-operative game theory can be used to enlighten such decisions. Cooperativegame theory can also help firms to understand the extent to which a firm cancooperate with its coopetitors in building such resources and capabilities. Whilegame theory can be used to understand whether to increase or decrease R&Dspending, for example, it says little about why some firms are better at R&Dthan others. Sound game theoretic analysis may suggest that, given what afirm’s competitors are doing, the firm should increase its R&D spending. Gametheory says little about why, even with the increased spending, the firm may stillnot be able to effectively and efficiently carry out the experimentation, trial,error, and correction that are critical to R&D.
Are Comprehensive and Parsimonious
The idea here is to make sure that a firm performs all the activities that make asignificant contribution towards value creation and appropriation while alsomaking sure that it does not perform activities that add little or no value relativeto their costs. Noncooperative game theory can help a firm to determine whichactivities yield the highest payoffs and keep or add them. Cooperative gametheory can be used to determine which actions result in coalitions with the mostvalue created. Effectively, game theory can be useful in determining which activ-ities to keep or add and which ones to jettison. However, game theory says verylittle about why one firm may be able to perform a particular activity moreeffectively or efficiently than its rivals.
Coopetition and Game Theory 297

The New Game Factor and the Usefulness of Game Theory
As we also saw in Chapter 4, new game activities, by virtue of being new game,are most likely to contribute to value creation and appropriation if they:
a Generate new ways of creating and capturing new value.b Offer opportunity to build new resources or translate existing ones in new
ways into value.c Build and take advantage of first-mover’s advantages and disadvantages,
and competitors’ handicaps.d Anticipate and respond to coopetitors reactions.e Identify and take advantage of the opportunities and threats of the competi-
tive and macroenvironment.
Generate New Ways of Creating and Capturing New Value
Cooperative game theory can help us to analyze how adding players or chan-ging the game can create or destroy value. It can tell us which coalitions willcreate what value. Noncooperative game theory can tell us which moves bywhich players can result in what payoffs. However, game theory cannot tell ushow each player actually improves its own products. It cannot help us under-stand the nuts and bolts of how Boeing actually designs and builds safe aircraft.
Build and Take Advantage of First-mover’s Advantages andDisadvantages, and Competitors’ Handicaps
Recall that sequential games are games in which some players move first. As wesaw earlier, the first mover can then decide whether to yield to entry, or workhard to deter it; and if it yields to entry, whether to accommodate, fight, or exit.For example, an incumbent can decide to increase entry costs by taking advan-tage of economies of scale in advertising and R&D, or its accumulated scarceresources. If there is entry, the firm can decide whether to fight the new entrantor accommodate the entry. Effectively, game theory can be used to explorewhether to deter entry or yield, accommodate new entrants or fight them, whichfirst-mover advantages to pursue or take advantage of, given rivals’ likelyactions and reactions. However, game theory does not help much with howefficiently and effectively one can build and take advantage of first-moveradvantages.
Anticipate and Respond to Coopetitors’ Reactions
Recall that game theory can be used to understand the interaction between afirm and its coopetitors and to understand the options for changing the rulesof the game and the consequences. Thus, one of the premier applications ofgame theory is to explore how best to perform new game activities, taking thelikely actions and reactions of coopetitors into consideration. In some ways,the primary advantage of game theory is in taking the likely reaction of one’scoopetitors into consideration when taking a decision.
298 Opportunities and Threats

Identify and Take Advantage of the Opportunities and Threats of TheCompetitive and Macroenvironment
When a firm identifies opportunities and threats in its environment, the chancesare that its rivals also see the same opportunities and threats and would like totake advantage of them too. Game theory helps firms to take into considerationthe likely actions and reactions of competitors in taking advantage of theopportunities and threats of their environments. Noncooperative game theorycan help a firm to explore questions such as whether to enter a new market (say,opened up by deregulation), where to position its products in the market (iden-tified white space), and how much money to spend on advertising or govern-ment regulations. Cooperative game theory helps firms to analyze the inter-action between a firm and its coopetitors as it creates and appropriates value.However, game theory does not say much about what types of resource a firmneeds so as to take best advantage of the opportunities and threats.
Summary and ConclusionsIf a firm views activities as potentially profitable, the chances are that its com-petitors would also find the same activities or related ones as profitable. There-fore, before pursuing any activities, a firm may be better off anticipating theactions and reactions of its coopetitors—be they rivals, suppliers, complemen-tors, buyers, or makers of substitute products. In an industry analysis tool suchas Porter’s Five Forces that explores the role of rivalry in profitability, emphasisis on factors such as the number of sellers in the market, whether the industry isgrowing or declining, differences in firms’ costs, excess capacity, level of prod-uct differentiation, history of cooperative pricing, observability of prices, andwhether there are strong exit barriers. Beyond these factors that impact over-arching rivalry in the industry, the interactions that take place among firms canalso have a huge impact on profitability. This is where game theory comes in.Game theory encourages managers to factor the likely reaction of coopetitorsinto their decisions; that is, it encourages managers to factor into their actions,not only what coopetitors are planning to do but also what is in the coopetitor’sbest interest.
Both noncooperative and cooperative game theory can be useful tools forexploring value creation and appropriation activities. The former enables firmsto ask questions such as, what should my actions be, given the likely actions andreactions of my rivals who are acting in their own individual self-interests? Itcan be used to explore elements of both value creation and appropriation.However, noncooperative game theory leaves a firm’s interaction with its coo-petitors—suppliers, customers, complementors, and rivals—largely explored.Cooperative game theory is about these interactions (bargaining, cooperating,etc.) between firms and their coopetitors. The payoffs are for different coali-tions and competition is between coalitions. As pointed out by Professor H. W.Stuart, cooperative game theory opens up even more interesting questions forfirms, such as: if a firm were not around, from whom would its buyers buy?Would its buyers have a lower willingness to pay for the alternatives? To whommight its suppliers sell? While cooperative game theory has both cooperativeand competitive elements, noncooperative game theory has largely competitive
Coopetition and Game Theory 299

elements and limited cooperative elements. Ultimately, competitive advantagecomes from a distinctive system of activities or distinctive resources. Gametheory does not say much about the sources of resources or systems of activities.It does not say much about the procedure for creating or appropriating value.
Exercises1 In the game of Figure 11.7:
a Would the threat of the incumbent to fight the entrant be credible?b If the $20 payoff were $26, would the threat to fight the new entrant be
credible?c What type of new game activity could the incumbent perform to
increase the payoff from $20 to $26?2 Consider a market in which there are two suppliers, three firms, and two
buyers. The buyers’ willingness to pay for each firm’s product is the same:$60. Each supplier’s cost of supplying the product is $5.
a What is the value added by each player?b How much value does each player appropriate?c Suppose there is only one firm. What would the value added for each
firm be?
3 Which one is a better tool for value appropriation: cooperative or noncoop-erative game theory? Why?
Key Terms
Characteristic functionCooperative gameCooperative game theoryDominant strategyDominant strategy equilibriumMarginal contributionNash equilibriumNoncooperative gameNoncooperative game theoryPrisoner’s dilemmaSimultaneous gamesStrategy (in game theory)Value net
Figure 11.7 For Question 1.
300 Opportunities and Threats
Applications
Chapter 12: Entering a New Business Using NewGames
Chapter 13: Strategy Frameworks and Measures
Part IV


Entering a New Business UsingNew Games
One of the most important decisions that a firm can take is to enter a newbusiness. If successful, entering a new business can contribute to a firm’s growthrate and profits. If unsuccessful, entering a new business can drain a firm ofimportant resources that could have been invested elsewhere and may damagethe reputation of the firm. In this chapter, we explore a framework that not onlycan be used to evaluate a firm’s entry into a new business but also can be used toaid a firm in taking the decision to enter a new business. Our definition of a newbusiness is very broad. Entering a new business can range anywhere from enter-ing a new market segment using one’s existing technologies, to adopting a newtechnology that takes one into a new market segment, to diversifying into atotally unrelated business using radically different technologies. We start off bylooking at some of the reasons that managers—rightfully or wrongfully—oftengive for entering a new business.
Why Firms Enter New BusinessesThere are several reasons why a firm would want to enter a new business: Weexplore seven of these reasons: growth, resources/capabilities, economies ofscale and scope, internal financial markets, market power, and personal.
Growth
One of the most popular reasons offered by firms when they decide to enter anew business is the pursuit of growth. A firm’s existing business may be in amature industry that is stagnant or slowly dying and the firm wants to enter anindustry with better growth perspectives to assure its long-term viability. Insome cases, a firm may find itself in a situation where it grew a lot for a fewyears and because of that growth, its stock is now very highly valued, where thehigh valuation has factored in the assumption that the firm will continue togrow at the existing rate. The firm may then be tempted to move into othermarkets to sustain that growth rate. As we will see later on, the fact that a newbusiness is fast-growing is neither a sufficient nor necessary condition to enterthe business.
Chapter 12

Resources/Capabilities
A firm may have distinctive resources/capabilities that can be extended profit-ably into different markets. Such a firm can use the resources/capabilities toenter new businesses. A popular example is that of Honda, which has used itsinternal combustion engine capabilities to enter different businesses thatinclude motorcycles, automobiles, lawnmowers, marine vehicles, electric gen-erators, and airplane engines. As another example, eBay built a brand namereputation and a large community of registered users that were originally usedby members to trade in antiques and collectibles. As the community grew largerand its brand became even more popular, eBay was able to use these resourcesto enter other categories such as automobiles. Sometimes, firms generate lots ofcash and may feel compelled to invest the cash in new businesses.
Economies of Scope and Scale
A firm enjoys economies of scope if its per unit costs of offering more than oneproduct are less than those of offering only one product. If a firm enters a newbusiness and can utilize some of its existing resources/capabilities to performactivities in the new as well as old business, the cost of each business may belower than if the firm operated each business without the other. For example,the more businesses in which Honda can use its engines, the smaller the cost ofsome of its R&D on a per unit basis. A firm can also enjoy economies of scale byentering a new business. For example, if the new business has common inputs, afirm may be able to combine its purchasing activities, thereby reducing its coststhrough increased bargaining power and other cost-saving activities.
Internal Financial Market
If a firm has more than one business, some of them may generate more cashthan others. The cash generated can be used to finance the activities of thebusinesses that are more cash-strapped. For example, a firm in a seasonal busi-ness may be out of cash during the off-season but full of cash during the on-season. Having another business that generates cash during the existing busi-ness’ off-season can smoothen the cash cycle. A firm can also buy a newbusiness that generates cash so that it can use the cash to feed fast-growingbusinesses that need lots of cash. By advocating the creation of a portfolio ofbusinesses in which cash from so-called cash cows can be used to finance theactivities of so-called stars that usually need lots of cash but do not generateenough, the BCG Growth/Share matrix framework epitomized this idea. Theargument against entering a new business so as to promote better internalfinancial management is that in a world of efficient capital markets, share-holders can take the cash from the existing business and invest in any otherbusiness that they want; that is, shareholders are better able to make decisionson which business to enter than managers. Moreover, if a business needs cash, itcan raise it from the financial markets. The problem with this argument is thatcapital markets, especially in developing economies, are not always efficient. Acapital market is efficient if information about alternate investment opportun-ities, the firms that want to borrow, what these firms want to do with the
304 Applications

money, their honest intentions, and so on is easily available to everyone at lowcost. When capital markets are not efficient, it may make sense to enter anotherbusiness so as to find cash or use existing cash to finance businesses internally.In fact, businesses often create financing units to provide financing to customersof their other business units. Some of these financing units are often veryprofitable.
Market Power
Consider two firms that have the potential to have a Coke and Pepsi-typecoexistence that allows them to thrive. If these two firms have multiple busi-nesses and encounter each other in more than one business, the chances of theircooperating tacitly are higher, since the benefits of cooperating are higher inmore businesses than in only one business. Put differently, the losses from notcooperating can be very large when firms encounter each other in many busi-nesses. For example, if firms engage in price wars in many businesses, they standto lose a lot more money than if they did so in just one business. Thus, a firmmay enter other businesses so as to better cooperate tacitly with a competitorthat it faces in other businesses. A firm with more than one business can also useits market power in one business to give it an advantage in other businesses.This may be illegal in some countries. For example, Microsoft was accused ofusing its power in operating systems to have an advantage in Web browsers.
Personal Managerial Reasons
Managers’ incentives for performing certain activities can sometimes divergefrom their firm’s interests. A manager might enter a new business not so muchbecause he/she believes that the new business will be profitable but because heor she wants to build an empire. That would be the case, especially if themanager’s compensation is tied to the growth rate of the company and to enternew businesses increases that growth rate.
Reduce Transaction Costs
If a firm’s critical input or complement comes from a competitor or potentialcompetitor and there are no reliable second sources for the input or comple-ment, the firm may want to start producing the input or complement. Why?Because the competitor, in looking after its own interests, may decide to use thecomponent or complement in ways that are not in the firm’s interests. Forexample, a maker of microchips that also uses the chips to make cameras maydecide to keep the latest and most critical information about upcoming chipsfor itself when such information can give it an advantage in cameras that morethan outweigh any advantage from selling the chips to competitors. The ques-tion becomes, why not enter into agreements that specify what each party issupposed to do? In cases where there are lots of contingencies to the contractand there is a lot of uncertainty, it is too costly to draft, monitor, and enforcesuch a contract. Thus, many contracts are necessarily incomplete and asuncertainty unfolds, a competitor who supplies a component or complementmay decide to be opportunistic. The fear of such opportunism can be enough to
Entering a New Business Using New Games 305

force a firm to enter the business of producing the component or complementfor its products rather than depending on suppliers and complementors. Thefear of opportunism from complementors may be one reason why Apple intro-duced Safari, its own Web browser.
Whatever a firm’s reasons for entering a new business, in the end the firm hasto be as profitable or more profitable when it enters the new business than it wasbefore entering. Whether a firm is profitable in a new business depends on howwell the firm is able to create and appropriate value, given the attractiveness ofthe business.
Managers may give all sorts of reasons for entering a new business. When allis said and done, the firm has to make profits either from the new business, orfrom the old business as a result of entering the new business. This entailscreating and appropriating value in the new business or as a result of the newbusiness.
Evaluating the New Business for Entry: The ThreeTestsSince firms are in business to make money, a firm that wants to enter a newbusiness ought to plan on being at least as profitable as it was before enteringthe new business. That will be the case if the firm makes money in the newbusiness or there is something about entering the new business that increasesthe profitability of the firm’s existing (old) business. Making money in the newbusiness entails creating value and appropriating it. Doing so entails competingwith rivals for resources and customers, cooperating and bargaining with sup-pliers and customers, and coping with the threat of substitutes and potentialnew entry. Therefore one of the first things to do in evaluating a new businessfor potential entry is to understand the nature of the competitive and macro-environmental forces that firms in the new business face. This appraisal ofindustry forces is called the attractiveness test since it explores the extent towhich competitive and macroenvironmental forces impact average profits in thenew business.1 The attractiveness tests tells us something about average profit-ability in the new business but says little about how much of these profits thefirm can make, relative to its rivals, when it enters the new business. This iswhere the second and third tests—the better-off and cost-of-entry tests—comein. The better-off test evaluates the extent to which a firm stands to profit byentering the new industry. Finally, since building entry capabilities cost money,it is also important to evaluate the cost of entry. This is about how much it coststo enter a business relative to the profits generated by virtue of entering thebusiness. We now explore all three tests in detail.
Attractiveness TestThe attractiveness test helps a firm that wants to enter a new business tounderstand better what it is getting itself into by entering the new business. Thetest examines the simple questions: what are the competitive and macro-environmental forces that the firm would face if it were to enter the new busi-ness? Who are the key competitors that the firm would have to worry about if itwere to enter the new business, and what is it about these competitors that the
306 Applications

firm should worry about? Which suppliers and customers dominate? Domakers of substitutes//complements or potential new entrants pose a threat?What is the profitability of the new business?
Competitive and Macroenvironmental Forces
A business is attractive if it is, on average, profitable to the firms in it. Recallthat a business’ profitability depends, in part, on the competitive forces in thebusiness—in particular, it depends on the rivalry in the business, the bargainingpower of suppliers and buyers, the threat of potential new entry and the powerof substitutes/complementors. If rivalry is high, buyers and suppliers have bar-gaining power, the threat of potential new entry, and of substitutes/complemen-tors is high, then the business is not profitable and therefore termed unattractiveto firms in it. This does not mean that a firm cannot make money in the busi-ness. Firms can and do make money in unattractive industries but doing so ismore difficult than in an attractive one. Effectively, a firm that plans to enter anunattractive business must be ready to deal with the repressive forces that exist-ing firms in it face. Such a firm should identify what the repressive forces are andfind ways to dampen their effect or eliminate them.
If rivalry in business is low, business firms have bargaining power over buyersand suppliers, and the threat of potential new entry and of substitutes/comple-mentors is low, the business is said to be attractive (to firms in it) since it is, onaverage, profitable. The fact that a business is growing does not necessarilymean that the business is attractive. High growth lowers only one of the com-petitive forces in an industry and little else. An attractive business is good forfirms that are already in the business but not necessarily for a firm that wants toenter the business. There are four reasons why an attractive business (for firmsalready in it) may not be attractive to an outsider. First, one reason why thebusiness is attractive may be because firms in the business have a history ofretaliating against new entrants, thereby decreasing new entry or keeping anyfirms that enter in check. This may be a warning shot to any firm that is con-templating entry. Second, if one reason for the attractiveness of the business ishigh barriers to entry, an outsider that wants to make money in the businessmust overcome the barriers to entry. Doing so can be very costly. Third, incum-bent firms in the business may have distinctive capabilities (including comple-mentary assets) that are difficult for new entrants to acquire. Fourth, if thebusiness is attractive, it is possible that many other firms want to enter andenjoy the profits. This desire to enter means that potential new entrants mayend up bidding up the prices of the resources/capabilities that are required to beprofitable in the business so high that whoever enters would have spent so muchthat any profits earned would go to pay for the high cost of entry.
A business’ macroenvironment can also have a large effect on its attractive-ness. For example, if a government keeps prices in a business artificially low orhigh, it impacts profitability directly. If a government imposes exit barriers, thebusiness loses some of its attractiveness since firms may be forced to sell theirproducts at very low prices so long as such prices cover their variable costs. Inany case, it is important for a firm that wants to enter a new business to under-stand carefully the environment in which it is going to compete if it enters thebusiness.
Entering a New Business Using New Games 307

Frameworks of Analysis
A framework for identifying and analyzing the competitive forces that impact abusiness and determine average profitability for the business is Porter’s FiveForces. The framework enables one to determine what underpins rivalry, poten-tial new entry, bargaining power of buyers and suppliers, and the threat ofsubstitutes. Another framework that can be useful in developing and under-standing the profitability potential of an industry is the Structure-Conduct-Performance (SCP) framework.2 In the SCP framework, performance (averageprofitability of the business) is determined by conduct. Conduct, which isdetermined by structure, is about the activities that firms, suppliers, and buyersin the business perform, such as R&D, advertising, strategic alliances, mergersand acquisitions, pricing, cost reductions, new product introductions, and cap-acity increases or decreases. Structure refers to the number of firms, suppliers,and buyers; the type of technology utilized; the degree of product differen-tiation; the degree of vertical integration; nature and level of competition(regional, domestic, or international), and the level of barriers to entry. By usingthe SCP to determine the nature and level of competition, what drives competi-tion, critical activities, and what drives value, a firm is in a better position toperform well if or when it enters the industry. For example, if industry firmshave a habit of retaliating against new entrants via activities such as pricing,R&D or new product introductions, the firm in question should better under-stand what it is getting into. The Five Forces are a rendition of SCP.
Key Players in the Business
A Five-Forces or SCP analysis tells one a lot about competition by providinginformation about the number of competitors, industry growth rate, presenceor lack of product differentiation, and so on. However, it is still important forthe firm that wants to enter the new business to find out as much as possibleabout the key players in the business. For example, if a firm wants to enter thecarbonated soft drinks industry, it may be better off finding out about howdominant players Coke and Pepsi compete against each other and against newentrants to their industry. If the new business is the main source of profits orcash for a major player in the business, the player is not likely to roll over whenanother firm enters the business. For example, Sony’s video game business wasone of its biggest sources of profit in 2001 when Microsoft entered the videogame business. Thus, one would expect Sony rigorously to fight back Micro-soft’s attempts to grab market share.
Better-off (and Alternatives) TestThe better-off tests can be thought of as consisting of three questions: what is itabout the firm that will enable it to be profitable in the new business? If there isnothing, would entering the new business increase the profitability of the firm’sexisting (old) business? What are the firm’s alternatives for making money orfor growth outside of entering the new business?
308 Applications

What is It About the Firm That Will Enable It to be Profitablein the New Business? Old Game
One way of asking this question is: does the firm bring something to the newbusiness that will allow it to create and appropriate value, thereby enabling it tomake money in the new business? If the firm is going to enter the new businessand be profitable, it has to create value for customers in the business and be in aposition to appropriate the value. (It can also make money by positioning itselfto appropriate value created by others.) Recall from Chapters 2 and 4 thatcreating and appropriating value entails performing activities that:
1 Contribute to low cost, differentiation, and other drivers of profitability.2 Improve position vis-à-vis coopetitors.3 Take advantage of industry value drivers.4 Build and translate distinctive resources/capabilities in new value.5 Are parsimonious and comprehensive.
The extent to which a firm’s activities have to meet these five objectives for it tobe better off is a function of how profitable its existing business is, how muchcompetition it is likely to face in the new business, and its goal in entering thebusiness. If a firm’s existing business is not very profitable and competitors inthe new business are accommodating, the firm can get away with partiallymeeting some of these objectives. If a firm’s goal in entering a new business is toexploit a niche market that does not mean much to the key competitors in themarket, the firm may be able to make some profits without attracting a lot ofattention and therefore does not have to worry as much about dampening orreversing competitive forces.
In performing activities to meet these five objectives, a firm can either pursuethe same old game in which it tries to outdo its competitors in the new businessby performing the same value chain activities that are presently being per-formed in the business, or pursue a new game strategy in which it changes someof or all the rules of the game for the new business. In this section, we exploreentry using old games, postponing new games for later in the chapter.
Contribute to Low Differentiation, and other Drivers of Profitability
A firm with scarce valuable resources/capabilities can use them to offer the rightvalue (low cost, differentiation) to the right customers in the right market seg-ments. For example, prior to entering the groceries business, Wal-Mart haddeveloped superior logistics and information technology capabilities. It usedthese capabilities to its advantage when it entered the groceries business, keep-ing its costs lower than those of competitors so that it could pass the costsavings to customers in the form of lower prices. Virgin used its brand in trans-atlantic airlines activities and music records to enter other businesses. In somecases, a scarce resource such as a luxury brand can allow a firm to charge morefor products in the new business.
Entering a New Business Using New Games 309

Improve Position vis-à-vis Coopetitors
The attractiveness test lets a potential new entrant into a new business knowwhich forces are repressive and which ones are friendly. A firm can improve itsposition vis-à-vis coopetitors by dampening some of the repressive forces orreinforcing existing ones using scarce capabilities from its existing business. Forexample, a firm can bring the power that it has over suppliers or customers in anexisting business into the new business, thereby allowing it to dampen repres-sive industry forces. For example, Wal-Mart already had a lot of purchasingknow-how and bargaining power over suppliers in its retail business when itentered the groceries business. It had also learnt how to work with suppliers toreduce costs. The firm was able to use these capabilities to have more powerover suppliers than other groceries suppliers, thereby keeping its costs lower. Afirm with good government relationships in a country where such relationshipsmatter can use them to its advantage to enter a new business where competitorsdo not have such relationships with the government.
Take Advantage of Industry Value Drivers
Recall that an industry value driver is a factor that has the most impact on cost,differentiation, or other driver of revenues or profit. In retail, location is anindustry value driver since it impacts not only the cost of operations but also theamount of customer traffic to the store as well as the image of the store, all ofthem key drivers of revenues and profits. By choosing to expand existing retailstores into superstores when it entered the groceries business, Wal-Mart wasable to take advantage of location—a critical industry value driver in retail.Taking advantage of industry value drivers can contribute to a firm’s profit-ability in a new business.
Build New Distinctive Resources/Capabilities or Translate ExistingOnes Into Superior Value
Many of the examples above are about translating existing capabilities in theold business into value for the new business. Some of the activities can alsobuild new resources/capabilities in the new business that the firm can use tocreate value and better position itself to appropriate the value. For example, inoffering groceries, Wal-Mart has also built capabilities in sourcing perishableitems—capabilities that it previously did not have when it offered onlyretail goods.
Are Parsimonious and Comprehensive
Recall that the parsimony and comprehensiveness criteria is about performingthe right number of the right kinds of activities. A firm that enters a new busi-ness by buying another firm which performs many superfluous activities, canlower its costs by eliminating such activities, thereby improving its chances ofbeing profitable in the new business. A firm can also enter a new business andperform critical activities that were not being performed before.
310 Applications

Would Entering the New Business Increase Profitability ofExisting Business?
A firm can also be better off entering a new business, not so much because of theprofits that come directly from the new business, but because of how enteringthe new business helps improve the profitability of the existing (old) business.We explore three cases: defending existing market position, vertical integration,and complementing a product line.
Defending an Existing Market Position
A firm can enter a new business to prevent competitors from using the newbusiness to erode the firm’s competitive advantage in its existing business. Forexample, when Microsoft entered the video game console business, it wasspeculated that the firm was doing so to prevent Sony from using the videogame console business to erode Microsoft’s competitive advantage in PC oper-ating systems. The problem with this claim is that it is very difficult to prove ordisprove it. This strategy is derived from warfare where by occupying an enemyin one battle, you prevent the enemy from fighting you in another battle. Theproblem with it is that one does not have to fight to win, and fighting oftenresults in no true winners.
Vertical Integration
A firm can integrate vertically backwards into the business of producing its owninputs or vertically forward into disposing of its outputs so as to improve itsprofitability. To assure the quality of the coffee that it sells, a retailer of coffee inthe USA may decide to integrate vertically backwards into growing its owncoffee in South America or Africa. A firm can also integrate vertically back-wards to prevent its suppliers from behaving opportunistically. As we sawearlier, for example, Apple Computers developed its own Web browser calledSafari so as to avoid depending on competitor Microsoft’s Internet Explorer. Byintegrating vertically forwards into bottling their colas in some parts of theworld, Coke and Pepsi are better able to assure profitability of theirconcentrate.
Complement Existing Product Line
It may be the case that a firm’s existing products will sell better if it were to entera new business and in the process complement existing products, thereby mak-ing them more valuable to customers. For example, in developing countrieswhere capital markets are not very efficient, a firm may enter the financialservices business so as to better finance purchases for the many customers whomay not have financing.
Alternatives Outside of Entering New Business
An obvious alternative to entering a new business is to not enter the businessat all. If a firm’s goal is to maximize shareholder value, the firm might be better
Entering a New Business Using New Games 311

off giving money back to shareholders in the form of dividends rather thanspending the money on an unprofitable new business. Thus, a firm may bemaking a mistake if it entered a new business only because it had a lot of cashthat it believes it has to invest. Shareholders may be better off reinvesting themoney themselves. More importantly, a firm may want to conduct the threetests on many businesses before deciding which one to enter, if at all.
Cost of EntryEntering a new business and performing the activities that enable a firm tocreate and appropriate value can be costly. These costs have to be weighedagainst the expected returns from entry. Effectively, cost-of-entry is a relativeterm in that costs have to be compared to the revenues that are generated as aresult of entry. The idea is to keep track of the extent to which a firm’s rate ofprofitability after entry is higher than that before. On the one hand, forexample, an attractive business may hold prospects for high margins but thecost of entry may be so high that any cash flows from the business will be morethan dissipated by the very high cost of entry. On the other hand, anunattractive business may have little prospect for high margins but cost verylittle to enter. In any case, such costs have to be carefully explored and com-pared to the cost of not entering prior to entry.
Drivers of Entry Costs
For several reasons, if an industry is attractive, the cost of entry is likely to behigh. First, as we saw earlier, if a business is attractive (to firms in the business)barriers to entry are likely to be high. If barriers to entry are high, it is likely tocost a lot to overcome these barriers to enter the business. For example, if abarrier to entry is the brand equity of incumbents (e.g. Coke’s brand), any newentrant that hopes to have a competitive advantage may have to build a com-parable brand equity. This can cost a lot and takes time. Second, as we also sawearlier, if a business is attractive (profitable), other profit-seeking firms are likelyto be interested in also entering. If enough such firms want to enter, they arelikely to bid up the cost of the resources that it takes to create and appropriatevalue in the business, thereby increasing costs for whoever ends up entering thebusiness. Third, if the business is attractive, leading firms with a competitiveadvantage are likely to be profitable. Such leaders are not likely to give up theirprofits to new entrants without a fight. In fact, if these leaders have been makinga lot of money, they are likely to have war chests to fight new entrants. Thus,new entrants may find themselves in costly fights. For these three reasons, it canbe so costly for a firm to enter an attractive business that even if it can create andappropriate value as a result of entering the new business, any potential profitsfrom the entry would be dissipated by the high entry costs.
In addition to depending on the type of business, entry costs also depend onthe type of firm that is entering. If a firm already has many of the resources thatare needed for the new business, it may be cheaper for the firm to enter. Thatwould be the case, for example, if the resources that the firm uses in its existingbusiness can be profitably extended to the new business. The Honda examplethat we used earlier comes into play here. Since the company already had engine
312 Applications

capabilities when it entered each new business, its cost of offering the productfor the new business were lower than those of other firms that had to developthe engine from scratch. Sony already had distribution channels in place when itentered the video game console business, making its cost of entry lower thanthose of a startup.
Finally, entry costs can also depend on how the entry process is implemented.When a firm enters a new business, it needs people to run the business. The firmalso needs to structure its organization to accommodate the new business, andestablish the systems, processes, and culture that are appropriate to running thenew business. The interaction of people, structure, systems, processes, and cul-ture cost money and keeping these costs to a minimum can go a long way tokeeping costs low.
Opportunity Cost of Not Entering
In addition to the cost of entry, there can also be “costs” to not entering, alsocalled the opportunity cost of not entering. That would be the case, forexample, if the new business is rooted in a disruptive technology that may laterinvade the existing business. In that case, if a firm in the existing business doesnot enter the new one, it may be too late when it finally has to do so. Forexample, the PC was a disruptive technology to minicomputers because it even-tually did a lot of what minicomputers used to do and therefore rendered themnoncompetitive in many markets. Those minicomputer makers who had nottaken the PC seriously saw their minicomputer businesses eroded by the PC.Disruptive technologies were explored in great detail in Chapter 8.
Estimating Relative Cost of Entry
We consider two ways of estimating the cost of entry: breakeven and cash flowanalyses.
Breakeven Analysis 3
A breakeven analysis offers an alternative and sometimes complementaryapproach to cash flow analysis. Before beginning the analysis, let us quicklyreview some basics.
Profits = revenues − variable costs − fixed costs
= PQ − VcQ − Fc = (P − Vc)Q − Fc
= Contribution margin − Fc
= (Contribution margin per unit)Q − Fc (1)
where P is the price per unit of the product, Vc is the per unit variable cost, Q isthe total number of units sold, and Fc is the up-front or fixed costs. The quantity“PQ − VcQ” or revenues minus variable costs, is called the contribution marginand represents the amount over variable costs that goes to contribute towardsrecovering fixed costs. The quantity “P − Vc,” the difference between price perunit, and per unit variable costs, is called the contribution margin per unit.
Entering a New Business Using New Games 313

We can now begin the breakeven analysis. If the contribution margin ispositive, then as the quantity sold goes up, there reaches a certain quantitywhere all the fixed costs have been recovered. This is the quantity at whichrevenues equal total costs and is called the breakeven point. It is the point wherethe firm has zero profits from the investment. Below the breakeven point, thefirm loses money. Above the breakeven point, the firm makes money. This pointcan be determined by equating equation (1) to zero since profits are zero. If wedo that, we obtain:
Profits = PQ − VcQ − Fc = (P − Vc)Q − Fc = 0
From this,
Q =Fc
(P − Vc). (2)
Recalling that P − Vc is the contribution margin per unit, breakeven quantitycan be computed as:
Breakeven quantity =Fixed Cost
Contribution Margin Per Unit(3)
For several reasons, breakeven time, the time that it takes a company to breakeven, is also important. First, the longer it takes to break even, the longerresources may have to be tied up performing unprofitable activities, therebyforgoing potentially profitable investment opportunities. Second, the longer ittakes a firm to break even, the more time competitors have to catch up or putmore distance between themselves and the firm if they are ahead. Breakeventime is obtained by dividing the breakeven quantity by sales rate; that is,breakeven time (in years) is the breakeven quantity divided by sales per year.Mathematically,
Breakeven time =Breakeven Quantity
Sales Rate(4)
=Fc
(P − Vc ) × (Sales Rate)
Example
A software company called PrintMoneySoft spent a total of $500 million inR&D, marketing, promotion, and other upfront fixed costs to offer a softwarepackage that it sells for $100 a copy. Since the company has posted the softwareon the Web for customers to download, each copy that it sells only costs thecompany $10 dollars to produce and sell. Because of its huge installed base ofcustomers, the company estimates that it can sell 25 million units a year. Whatis the breakeven quantity and how long will it take for the company tobreak even?
314 Applications
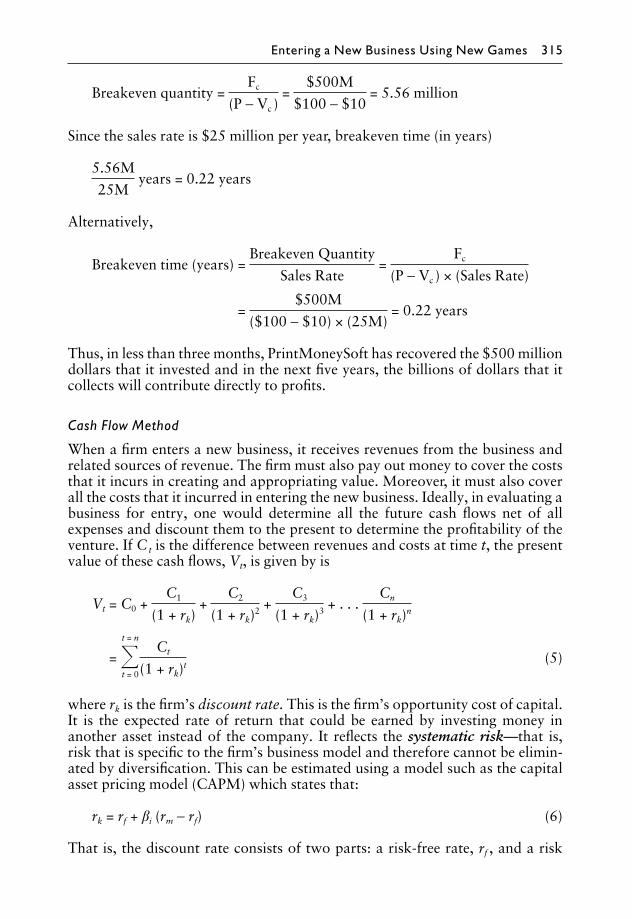
Breakeven quantity =Fc
(P − Vc )=
$500M
$100 − $10= 5.56 million
Since the sales rate is $25 million per year, breakeven time (in years)
5.56M
25Myears = 0.22 years
Alternatively,
Breakeven time (years) =Breakeven Quantity
Sales Rate=
Fc
(P − Vc ) × (Sales Rate)
=$500M
($100 − $10) × (25M)= 0.22 years
Thus, in less than three months, PrintMoneySoft has recovered the $500 milliondollars that it invested and in the next five years, the billions of dollars that itcollects will contribute directly to profits.
Cash Flow Method
When a firm enters a new business, it receives revenues from the business andrelated sources of revenue. The firm must also pay out money to cover the coststhat it incurs in creating and appropriating value. Moreover, it must also coverall the costs that it incurred in entering the new business. Ideally, in evaluating abusiness for entry, one would determine all the future cash flows net of allexpenses and discount them to the present to determine the profitability of theventure. If C t is the difference between revenues and costs at time t, the presentvalue of these cash flows, Vt, is given by is
Vt = C0 +C1
(1 + rk)+
C2
(1 + rk)2 +
C3
(1 + rk)3 + . . .
Cn
(1 + rk)n
= �t = n
t = 0
Ct
(1 + rk)t
(5)
where rk is the firm’s discount rate. This is the firm’s opportunity cost of capital.It is the expected rate of return that could be earned by investing money inanother asset instead of the company. It reflects the systematic risk—that is,risk that is specific to the firm’s business model and therefore cannot be elimin-ated by diversification. This can be estimated using a model such as the capitalasset pricing model (CAPM) which states that:
rk = rf + βi (rm − rf) (6)
That is, the discount rate consists of two parts: a risk-free rate, rf , and a risk
Entering a New Business Using New Games 315
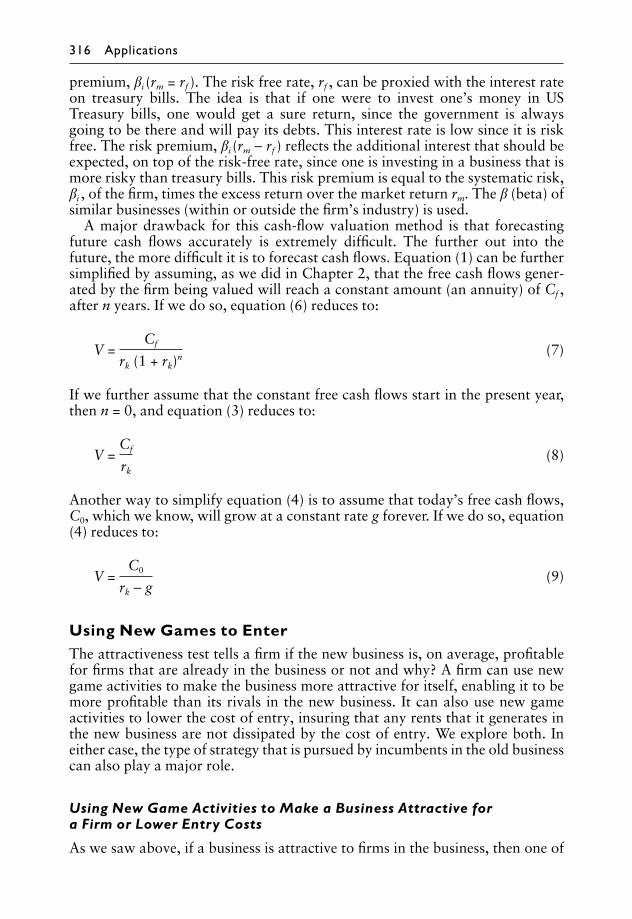
premium, βi (rm = rf ). The risk free rate, rf , can be proxied with the interest rateon treasury bills. The idea is that if one were to invest one’s money in USTreasury bills, one would get a sure return, since the government is alwaysgoing to be there and will pay its debts. This interest rate is low since it is riskfree. The risk premium, βi (rm − rf ) reflects the additional interest that should beexpected, on top of the risk-free rate, since one is investing in a business that ismore risky than treasury bills. This risk premium is equal to the systematic risk,βi , of the firm, times the excess return over the market return rm. The β (beta) ofsimilar businesses (within or outside the firm’s industry) is used.
A major drawback for this cash-flow valuation method is that forecastingfuture cash flows accurately is extremely difficult. The further out into thefuture, the more difficult it is to forecast cash flows. Equation (1) can be furthersimplified by assuming, as we did in Chapter 2, that the free cash flows gener-ated by the firm being valued will reach a constant amount (an annuity) of Cf ,after n years. If we do so, equation (6) reduces to:
V =Cf
rk (1 + rk)n
(7)
If we further assume that the constant free cash flows start in the present year,then n = 0, and equation (3) reduces to:
V =Cf
rk
(8)
Another way to simplify equation (4) is to assume that today’s free cash flows,C0, which we know, will grow at a constant rate g forever. If we do so, equation(4) reduces to:
V =C0
rk − g(9)
Using New Games to EnterThe attractiveness test tells a firm if the new business is, on average, profitablefor firms that are already in the business or not and why? A firm can use newgame activities to make the business more attractive for itself, enabling it to bemore profitable than its rivals in the new business. It can also use new gameactivities to lower the cost of entry, insuring that any rents that it generates inthe new business are not dissipated by the cost of entry. We explore both. Ineither case, the type of strategy that is pursued by incumbents in the old businesscan also play a major role.
Using New Game Activities to Make a Business Attractive fora Firm or Lower Entry Costs
As we saw above, if a business is attractive to firms in the business, then one of
316 Applications

several things may be happening: either barriers to entry are high, firms havepower over suppliers or buyers, the threat of substitutes is low, or rivalry is low.The question is, what type of new game activities can a firm use to enter such abusiness and make the business more attractive for itself than the incumbentswho have been in the business longer? Recall that new game activities can:
1 Generate new ways of creating and capturing new value.2 Build new resources or translate existing ones in new ways into value.3 Create the potential to build and exploit first-mover advantages.4 Attract reactions from new and existing competitors.5 Have their roots in the opportunities and threats of an industry or
macroenvironment.
We now explore how a firm can take advantage of each of these characteristicsof new game activities to make a new business attractive for itself.
Take Advantage of the New Ways of Creating and CapturingNew Value
A firm can enter a new business by identifying and meeting a need in the marketthat is presently not being met—by occupying so-called “white space” in themarket or what is considered at the time a niche.4 A classic example is that ofWal-Mart, which located its stores in small rural towns which discount retailersat the time shunted, preferring instead to locate their stores in large towns. Thisunmet need can also be in providing a product with attributes that other prod-ucts do not offer or it can be in providing products at a lower price point thanexisting products. Note that new value here does not necessarily mean that afirm has to outdo its rivals in offering products or services with more and betterattributes. New value can sometimes mean stripped down attributes or eveninferior product attributes. For example, when Ikea entered the US furnitureindustry, it did not try to outdo other furniture companies by offering better in-store service, better delivery, or more durable furniture.5 Rather, it offered littleor no in-store service compared to its high-end competitors, no delivery, andfurniture that was not as durable as competing furniture from incumbents.Most of the PC’s attributes were inferior to those of the minicomputer andmainframe that served the needs of most computer users when the PC wasintroduced.
By locating in white space and meeting the needs of customers that are notbeing met by firms in the business, a firm avoids immediate competition withrivals for customers and resources. This lowers the effect of rivalry on the firm.Moreover, because the firm is the first to offer the product to the market seg-ment, these customers are less likely to have as much power over the firm asthey would if it had more rivals in the market segment. In those cases where theproduct offered has stripped-down or inferior attributes, the cost of offeringthem may be lower and therefore somewhat reduces barriers to entry. If the firmrides a change such as a disruptive technological change, the cost of offering thenew value can also be lower. Most important of all, since the firm is the first inthe white space (market segment), it can build first-mover advantages. Forexample, it can build switching costs at customers, establish a brand-name
Entering a New Business Using New Games 317

reputation with these customers, or build relationships with customers andcomplementors. The firm can also preempt scarce important resources such aslocation, input factors, customer mental space, or complementary assets. Thefirm can go up the learning curve for providing products for the particularmarket segments and seek intellectual property protection for the patents orcopyrights acquired in doing so. New game activities can also be gearedtowards increasing the number of valuable customers that the firm can reachwith its products when it enters the new business.
Some new game activities can better position a firm to appropriate valuewithout necessarily creating any in a new business. A popular example that wesaw in Chapter 1 is that of Dell when it decided to bypass distributors and selldirectly to end-users. This was new game in the industry at the time and enabledDell to bypass the more concentrated and powerful distributors and sell directlyto the more fragmented and less powerful users. Decreased buyer power meanta more attractive business for Dell than competitors.
Take Advantage of Opportunity to Build New Resources or TranslateExisting Ones in New Ways Into Value
When a firm enters a new business, it can build some or all of the resources thatit needs. If the firm occupies white space or a niche, it can preemptively buildresources the way Wal-Mart did. The new business can also be a brand newindustry or market that is in the fluid stage and it is not clear what resources willbe needed. In that case, the firm can compete to build a competitive advantagein the new resources.
Take Advantage of the Opportunity to Build and Exploit First-moverAdvantages
If in entering the new business, a firm locates in “white space” or a niche, it iseffectively moving first as far as the new games are concerned. Thus, as we haveseen above, such a firm has an opportunity to take advantage of first-moveradvantages. Recall from Chapter 6 that first-mover advantages include:
• Preemption of total available market with associated economies of scale,size (beyond economies of scale), early collection of economic rents andequity, chance to build network externalities, and relationships withcoopetitors.
• Lead in technology and innovation with associated intellectual property(patents, copyrights, trade secrets), learning, organizational culture.
• Preemption of scarce resources such as complementary assets, location,input factors, parts, and equipment.
• First-at-buyers through building buyer switching cost, making smartchoices under and building a brand (preemption of consumer perceptualspace).
• First to establish a difficult-to-imitate system of activities for creating andappropriating value.
A firm that enters a new business using new games and builds first-mover
318 Applications

advantage can make the new business more attractive for itself. For example, afirm that enters a new business using new games and preemptively accumulatesscarce resources in the industry can make the industry more attractive for itself.
Anticipate and Respond to the Actions and Reactions of New andExisting Competitors
If a firm enters a new business using new game activities, some of the incum-bents in the business are likely to react to the entry. They can welcome the entry,fight it, or pursue some combination of both. In either case, how the newentrant behaves can be critical. It is better off taking into consideration thelikely reaction of its new rivals. Finding ways to cooperate with rivals, whenpermitted by government regulations, may be better than engaging in destruc-tive competition such as price wars. In markets that exhibit network external-ities, a firm may be better off cooperating to build a large network, since themore customers in any particular network, the more valuable the network is tocustomers. If a firm has to compete, it is better off going after firms whose priorcommitments, dominant managerial logics, and sunk investments prevent themfrom trying to replicate or leapfrog the firm. These incumbent handicaps givethe firm more degrees of freedom in building first-mover advantages and trans-lating them into superior value that the firm can appropriate.
Take Advantage of the Opportunities and Threats of the Environment
In entering a new business, a firm can take advantage of the opportunities andthreats of its environment to pursue new game activities that allow it to have acompetitive advantage in entering the new business. For example, eBay tookadvantage of the Internet, a disruptive technology, to enter the auction market.So did the numerous other firms that took advantage of the Internet to enternew businesses.
Type of New Game
The type of new game strategy that a firm uses to enter a new business as well asthe type of game being played by incumbents in the new business also play arole in making the industry attractive to the new entrant or lowering its entrycosts (Table 12.1).
Table 12.1 Type of New Game to Pursue when Entering a New Business
Existing game in new business Preferred entry new game
Regular Revolutionary, resource-building, position-buildingResource-building Position-building, revolutionaryPosition-building Revolutionary, resource-buildingRevolutionary Revolutionary
Entering a New Business Using New Games 319

Face Firms in Regular Game in New Business
If the dominant firms in a market pursue a regular game, trying to beat them attheir game is likely to be difficult. Recall that in a regular new game, a firmbuilds on the existing resources that underpin industry competitive advantageto offer a new product that customers value but the product does not totallyreplace existing products in the market. A new entrant to the business is betteroff pursuing either a revolutionary, resource-building, or position-building newgame (Table 12.1). The idea here is that it would be difficult for a new entrant tothe carbonated soft drinks industry to beat Coke and Pepsi by making incre-mental improvements to cola drinks or to the way the drinks are marketed. Onecannot beat Coke at being Coke. Rather, one has a chance if one pursues arevolutionary strategy in which the resources used and the product-market-position pursued are so different that existing resources cannot be used to offerthe new product and the resulting new product renders existing ones noncom-petitive. By pursuing a revolutionary strategy, a firm is in a better position tobuild and take advantage of first-mover advantages, making the new businessmore attractive for the new entrant firm. One can also take advantage of anyhandicaps that incumbents in the new business may have such as prior com-mitments from which they cannot separate themselves. If a firm has distinctiveresources that it can use to pursue a resource-building strategy in the newbusiness, the firm might be better off using such a strategy to enter a newbusiness where the major actors play regular games. Recall that in a resource-building game, a firm uses resources that are radically different from thosepresently used in the market to offer products but existing products remaincompetitive. A firm can also pursue a position-building game in which it usesresources that build on existing resources in the new business but offers a prod-uct that renders existing products noncompetitive. That would also make theentry more attractive for the firm.
Face Resource-building New Game in New Business
If the game pursued by dominant firms in the new business is resource-building,a potential new entrant into the business may be better off pursuing either aposition-building or revolutionary new game. The idea here is that if incum-bents in the business have been pursuing a resource-building game, some ofthem are likely to have built first-mover advantages in the new resources. Thus,trying to beat these incumbents at being them is likely to be difficult. Therefore,a new entrant may be better off using a revolutionary new game that rendersincumbents’ existing resource advantages obsolete and their existing productsnoncompetitive. A new entrant could also pursue a position-building new gameby identifying new needs and meeting the needs using resources that build onexisting resources. This is the new game that Sony played when it entered thevideo console business. Its 32-bit video game technology built on existing skills,knowledge, and know-how in video games to develop consoles that addressedthe needs of a new market segment: adults who wanted to play video games.The 32-bit games eventually rendered existing 16-bit machines noncompetitive.
320 Applications

Face Position-building New Game in New Business
If the game pursued by incumbents in the new business is predominantlyposition-building, these incumbents are likely to have developed competitiveadvantages in their PMPs. Thus a new entrant is better off pursuing a revo-lutionary or resource-building new game if it hopes to make the new marketmore attractive for itself. A revolutionary new game renders incumbent’s exist-ing products noncompetitive and the underpinning resources obsolete, and thenew entrant has an opportunity to build first-mover advantages in resourcesand product-market positions.
Face Revolutionary New Game in New Business
If the new game pursued by incumbents in the new business is revolutionary,new entrants can also pursue the revolutionary new game. By definition, thingsare in a state of flux in the market if incumbents are still pursuing a revolution-ary new game and no one has a competitive advantage, yet. Thus, new entrantsmay be better off also pursuing the same revolutionary new game until such atime as they can focus on their competitive advantages using either resource-building or position-building strategies.
When to Apply the FrameworkFrom the title of this chapter, it is clear that when entering a new business,especially when diversifying from one’s existing business, one is better offexploring the three tests. However, the tests could also be very useful whenmoving from one market segment to another, especially if the new segment hasdifferent coopetitors. Also, when a firm adopts a new technology, it is worth-while to explore the three tests because new technologies often result in newways of creating and appropriating value. Consequently, coopetitors and theirinteractions usually change, the industry becomes more or less attractive, andwhat it takes to have a competitive advantage also changes.
Key Takeaways
• A new business can be the source of profits and pride for a firm or the source oflosses and regret. Thus a firm should not take entering a new business lightly.
• However, it is not usual to find firms that enter new businesses solelybecause their existing businesses are mature and declining while the newbusiness is growing, or because the firms have lots of cash to invest. Thegrowth rate of an industry is only one driver of industry profitability orattractiveness. The attractiveness test explores the factors that determinethe extent to which the industry is profitable, on average, and helps firms tounderstand the competitive forces that they would face if they were to enterthe new industry. This test can be performed using a Porter’s Five Forces orthe Structure-Conductor-Performance framework.
• Even if an industry is, on average, profitable, a firm that enters the industrymay still not be profitable. Factors specific to the entering firm also play amajor role in determining its profitability; that is, there should be somethingabout the firm that will enable it to enter the new business and earn a higher
Entering a New Business Using New Games 321

rate of return in the new business than in the old, or there should be some-thing about entering the new business that will allow the firm to improvethe profitability of its old business. Effectively, a firm also needs to explorethe extent to which it is better off in the industry than other firms or thanbeing elsewhere. This exploration is the better-off test.
• In any case, it usually costs money—sometimes a lot—to enter a new busi-ness. Thus, a firm that wants to enter a new business may want to make surethat it does not spend so much in entering the new business that any profitsultimately generated go to cover entry costs. If barriers to entry are high, forexample, it can cost a lot to overcome them. If, for example, one reason whyan industry is attractive is the ability of firms to retaliate against newentrants or noncooperators, a firm that enters the business is likely to facehostility. Thus, the cost of entry relative to the profits from entry is also amajor factor in considering entry. This is the cost of entry test. Entry costsshould also be carefully weighed against the opportunity cost of not enter-ing the new business.
• Effectively, it is wise to explore the attractiveness, better-off, and cost-of-entry tests carefully before entering a new business. A firm can use thesetests to evaluate different businesses before making its choice. There isalways the alternative of investing in the old business or giving money backto shareholders.
• New game activities not only can enable a firm to make an industry moreattractive for itself, they can also lower entry costs. Because of their newvalue creation property, new games can enable a firm to lower its cost ordifferentiate its products, thereby reducing the effect of rivalry, and substi-tutes on the firm. Differentiated products from new game activities alsoreduce the power of buyers and the negative effects of potential new entry.
• The type of new game strategy that a firm uses to enter a new businessshould also be a function of the type of strategy that firms in the industry arepursuing at the time of anticipated entry.
• Managers may give all sorts of reasons for entering a new business. Butwhen it is all said and done, a firm has to make profits. This entails creatingand appropriating value. The three tests can be very helpful in evaluating,ex ante, one’s potential for doing well in a new business.
• The three-test framework applies not only to entering new businesses andnew market segments but also to adopting new technologies. This is par-ticularly true when the new technology generates new ways of creating and/or appropriating value, and the attractiveness of the market or industry haschanged.
Key Terms
Attractive businessAttractiveness testBetter-off testContribution marginContribution margin per unitCost of entry testSystematic risk
322 Applications

Strategy Frameworks andMeasures
Reading this chapter should provide you with an introduction to, or a recap ofthe following strategy frameworks:
• SWOT Analysis (early 1960s)1
• PEST (1967)• Growth/Share matrix (late 1960s)• GE/McKinsey matrix (late 1960s)• Porter’s Five Forces (1979/1980)• Business systems (1980)• Value chain (1985)• Value configurations (1998)• Balanced scorecard (1992)• VRIO (1997)• VIDE (1998)• S3PE Framework (1998)• 4Ps (marketing, 1960s)• AVAC (2008)
The chapter also summarizes some simple but useful accounting measures.
IntroductionWhen we explored the AVAC framework in Chapter 2, we noted that it hadsome advantages over existing strategy models for assessing the profitabilitypotential of a strategy, product, brand, resources, business units, and so on. Inthis Chapter, we briefly summarize thirteen strategy frameworks and one mar-keting framework that have been used to explore not only the profitabilitypotential of strategies but also strategy drivers and outputs. We also brieflysummarize some useful accounting measures that can come in handy whenquantifying a firm’s performance. These summaries are meant to be just that—summaries. They are meant to serve three purposes: (1) act as a quick referencefor the reader who has encountered them before and needs to be remindedabout where they fit in the overall picture of strategy frameworks, (2) act as amotivator to the reader who has not been exposed to them before to find outmore about them in the references provided, and (3) remind the reader of theadvantages and shortcomings of each framework.
The question is, why would anyone need to understand thirteen strategy
Chapter 13

frameworks? After all, some of them are either too old, have too many short-comings, or apply to questions that you do not care much about. There arethree reasons why students of strategic management need to understand thesemodels. First, one of the models—and God knows which one—may be the onlyone that your interviewer, employer, client, potential ally, competitor, acquirer,consultant, venture capitalist, or acquisition target understands. Although fan-cier models exist, most people stick with the model that has worked for them,despite the push from consulting firms to change to newer and better models.For example, although many strategy scholars regard the SWOT analysis asantiquated, it still plays an important role in the strategic planning processes ofsome major firms. Second, strategic management is a very complex subject andtherefore no one framework can apply to all questions. No one model fits allbills. Therefore, understanding as many models as possible gives the strategyscholar more options and flexibility in exploring different questions. Better still,it helps one understand where others may be coming from. Third, we explorethe frameworks chronologically, thereby providing a sense of the history ofstrategic management. This history can be important in understanding differentpoints of view, and in guessing where the field might be heading.
Advantages and Disadvantages of Using FrameworksWe start the chapter with an outline of the advantages and disadvantages ofusing frameworks in strategic management.
Advantages
Although each framework has some advantages that are specific to it, there aresome advantages that pertain to frameworks in general.
Simplicity
Frameworks are usually simple and easy for managers to get their mindsaround. Some of them take the form of a 2 × 2 matrix, which is easy to visualizeand understand. Such simplicity makes it easier for more people to understandand make contributions to the discussions and arguments that lead up to amanager’s final decision.
Common Language and Platform
Frameworks provide a common language and platform for framing questions,proposing different scenarios, and expressing alternate solutions to a problem.They provide common starting points for discussions. A framework may notprovide a final solution to a question, but can provide a starting point fromwhere managers can work their way to a final solution.
Parsimony and Comprehensiveness
A good framework is both comprehensive and parsimonious; that is, a goodframework has all that needs to be in it (comprehensive), but at the same time,
324 Applications

avoids not throwing everything in it (parsimonious). As such, users do not haveto reinvent the wheel and go through the exercise of deciding what should beincluded and what should not, again.
Starting Point for Collecting Data
One of the biggest problems with strategic analysis is to decide which data tocollect for an analysis. The cases that students are usually asked to analyzenormally have lots of tables of data and graphs attached to them, giving thestudents some hints as to what the solution to the case is all about. In real life,managers who face decisions usually do not have that much data and often haveno idea what variables they should be collecting the data for, and where to startlooking for the data. Having a framework considerably narrows down thescope and cost of data collection. One can simply collect data for the variablesthat are in the framework.
Disadvantages
Many of the qualities of frameworks that are advantages can also be disadvan-tages. Take simplicity, for example. Very simple frameworks, while easy to use,usually leave out important variables, making such frameworks less applicableto other contexts. That is one reason why strategy models should be used verycarefully. When a framework constitutes a language and platform, it necessarilylocks out some ideas that fall outside that language and framework. There isalso the danger that some students will understand one framework well and tryto apply it to any question that they are asked. These disadvantages are not abig issue if one understands the advantages and disadvantage of each frame-work well before applying it.
SWOTSWOT stands for Strengths, Weaknesses, Opportunities, and Threats. TheSWOT framework came out of research lead by Albert Humphrey at StanfordUniversity in the 1960s and 1970s. It was developed as a strategic planning toolto be used to evaluate a firm’s internal strengths and weakness as well as thoseexternal opportunities and threats that the firm faced and could exploit. TheSWOT analysis fits in very well with Professor Alfred Chandler’s 1962 populardefinition of strategy as the “determination of the basic long-term goals andobjectives of an enterprise, and the adoption of courses of action and the allo-cation of resources necessary for carrying out these goals.”2 The idea is thatfor a firm to meet its goals and objectives, it has to pursue certain courses ofaction using the appropriate resources. Depending on the goals and objectives,a firm’s courses of action and resources can be strengths or weaknesses. Bymatching these strengths and weaknesses to the opportunities and threats of itsenvironment, a firm could meet its goals and objectives, relative to itscompetitors.
Strategy Frameworks and Measures 325

Key Elements of SWOT Framework
The elements of a SWOT analysis are shown in Figure 13.1. Strengths andweaknesses are usually referred to as internal factors, since they are specific to afirm’s activities and resources, while opportunities and threats are referred to asexternal factors because they are exterior to a firm, in its competitive and macroenvironments.
Strengths
In a SWOT analysis, a firm’s strengths are those characteristics that make apositive contribution to the attainment of its goals and objectives. For example,if a firm’s goals and objectives are to have a competitive advantage, then itsstrengths are those characteristics that make a positive contribution to its abilityto earn a higher rate of profits than its competitors. Such strengths wouldinclude distinctive valuable resources and capabilities such as a brand, patents,copyrights, distribution channels, shelf space, relationships with customers, andso on. If the goal is to win a war, the strengths are those factors that make apositive contribution to winning the war.
Weaknesses
A firm’s weaknesses are those characteristics that handicap attainment of itsgoals and objectives. If a firm’s goals and objectives are to have a competitiveadvantage, then its weaknesses are those characteristics that handicap its abilityto earn a higher rate of profits than its competitors. A firm’s weaknesses toattaining a competitive advantage include a lack of distinctive resources andcapabilities as well as a bad reputation or bad relationships with coopetitors.Ford and GM’s weaknesses in the 2000s were that they did not have the abilityto produce cars with good gas mileage that enough customers wanted to buy.Location can also be a weakness. Being born in an underdeveloped country canbe a serious weakness.
Figure 13.1 SWOT Framework.
326 Applications

Opportunities
Opportunities for a firm are those external factors that make a positive contri-bution to the attainment of its goals and objectives. If a firm’s goals and object-ives are to perform better than its competitors, then opportunities are thoseexternal factors that make a positive contribution to the ability of the firm tocreate and appropriate value better than its competitors. Opportunities for afirm include customer needs that the firm can satisfy, a new technology that afirm can use to attack another firm’s competitive position, and so on.
Threats
Threats to a firm are those external factors that handicap its attainment of itsgoals and objectives. If a firm’s goals and objectives are to make more money,then the threats to the firm are those external factors that handicap its ability toearn a higher rate of profits than its competitors. The threats to a firm attaininga competitive advantage would include things such as changes in customertastes, and technological changes or hostile government regulations that reducethe firm’s ability to create and appropriate value.
Context Dependence of Elements
Whether a firm’s characteristic is a strength or weakness depends on the contextin which the characteristic is being used. For example, a video rental firm’slong-term lease contracts to video stores in good locations were a strength in abrick-and-mortar era; but in the face of the Internet, such contracts can beweaknesses if the firm cannot get out of them. An opportunity for one firm canbe a threat to another. For example, a disruptive technology is an opportunityfor startups that want to attack incumbents, but is a threat to the incumbents.
Application of SWOT
A SWOT analysis has been used as a tool to help formulate strategies, businessplans, etc. Whatever the application, the analysis starts with an establishment ofgoals and objectives. Once goals and objectives have been established, the fol-lowing questions can be explored.
• Strengths: what are the strengths for the goals and objectives in question?How can each strength be reinforced? Can each strength be utilized toachieve other goals and objectives? When might these strengths becomeweaknesses?
• Weaknesses: how can each weakness be dampened or eliminated? How caneach weakness be turned into a strength?
• Opportunities: how can each opportunity be exploited? What might turnthe opportunity into a threat?
• Threats: what can a firm do to dampen or eliminate the effect of threats?Can the firm turn threats into opportunities?
Strategy Frameworks and Measures 327

Advantages and Disadvantages of SWOT
Advantages
1 The framework is simple, easy to understand, and therefore many managerscan use it right away. Thus a firm has an opportunity to obtain feedbackfrom many employees.
2 It provides terminology for discussing the drivers of a firm’s ability to matchits internal environment to its external environment to attain its goals andobjectives.
Disadvantages
The SWOT framework has several disadvantages:
1 It is difficult to narrow down the list of strengths, weaknesses, opportun-ities, or threats to only the important ones. Firms risk generating a longlaundry list that is of little use.
2 The lists of strengths, weaknesses, opportunities, and threats generatedusually says little or nothing about how these elements are going to betranslated into goals and objectives. For example, a SWOT analysis thatlists a pharmaceutical company’s patents as its strengths says little abouthow patents are translated into medicines and profits.
3 The framework is static since it says little about what happens to eachelement of SWOT over time. Will strengths, weaknesses, opportunities, andthreats today be the same tomorrow?
4 It is difficult to tell strengths from weaknesses sometimes, or distinguishopportunities from threats. Is the Internet an opportunity or threat tobanks?
PESTIn a SWOT analysis, opportunities and threats usually come from the competi-tive or macro environment. A Political, Economic, Social, and Technological(PEST) analysis can be used to explore the threats and opportunities of themacroenvironments. The PEST analysis is usually attributed to Francis J. Agui-lar who, in his 1967 book, analyzed the environment using the four com-ponents: economic, technical, political, and social (ETPS).3 The assumptionhere is that the macroenvironment is limited to these five components; but as wesaw in Chapter 10, other components of the macroenvironment can also be asource of the opportunities and threats that firms face. For example, the naturalenvironment plays an important role. Thus, the version of PEST shown inFigure 13.2 is a modified version called PESTN, where N stands for naturalenvironment. As we argued in Chapter 10, the extent to which any of thefactors that determine each component constitutes a threat or opportunity for afirm is a function of the industry in which the firm operates and the firm’sstrategy. For example, while in pharmaceuticals, “intellectual property protec-tion” is important in the USA, it is usually not the case in retail and elsewhere inthe world. Moreover, technological factors that matter at one time may not be
328 Applications

that important at other times. Thus, the number of factors that matter for anyparticular analysis will always be only a subset of those shown in Figure 13.2.
Advantages and Disadvantages of a PEST analysis
Advantages
• A PESTN analysis enables firms to dig deeper into the sources of the threatsand opportunities that they face in their macroenvironments. For example,including the natural environment in the analysis forces firms to pay moreattention to it, increasing the chances that firms will find some opportunitiesin it or identify threats in it before it’s too late.
• It can be used as a starting point for generating new game ideas.
Disadvantages
• The framework does not provide a means to narrow down the list of factorsto the few that are really important. Thus, a PEST analysis usually runs the
Figure 13.2 Elements of a PESTN Framework.
Strategy Frameworks and Measures 329

risk of generating a laundry list with no way of determining which item onthe list is more important than the other.
• The PEST analysis, unlike a Five Forces and an AVAC framework, offers noconcrete way of linking the list of factors that impact each component toprofitability variables.
• A PEST analysis is a static model. It is usually performed at a point in timeand says very little about what happened in the past or will happen in thefuture.
BCG’s Growth/Share MatrixIn the late 1960s and the 1970s, more and more firms increasingly added newbusinesses to their portfolios and therefore found themselves managing multi-businesses. With more than one business to manage, these firms faced someimportant questions: how much of a firm’s scarce resources, such as capital,should be allocated to each unit? What businesses should a firm be in, to beginwith? Which ones should be disposed of? What should the performance targetsof each business be? The Growth-Share Matrix, developed by the Boston Con-sulting Group (BCG) in the early 1970s, could be used to explore these ques-tions. It grew out of work on “experience curve effects” done by Bruce Hender-son of BCG.4 The idea with the experience curve was that if a firm’s per unitcost fell as its cumulative output increased, the firm stood to have a cost advan-tage, considered by some at the time to be the advantage. The frameworkgained lots of acceptance at the time as firms used it to analyze business units,product lines, regional units, and international units of firms. It was popular notonly in strategic management but also in international management, brandmarketing, product management, and portfolio analysis. It would become a so-called portfolio analysis model since it could be used to explore different port-folios of businesses.
Elements of the Growth/Share Matrix
The key elements of the Growth/Share Matrix are shown in Figure 13.3. Thevertical axis captures the market growth rate while the horizontal axis capturesthe relative market share. Recall that a firm’s performance is driven by bothindustry as well as firm-specific factors. Thus, since market growth rate is afunction of industry factors, and relative market share is a function of firm-specific factors, the framework could give managers some information on theperformance of the different units. This was considered particularly true at thetime because BCG touted experience curve effects as a key driver of firm per-formance and therefore strategic success. The idea was that a firm’s per unit costfell as its cumulative output increased. Thus, a business or unit with a highrelative market share meant more cumulative units sold and therefore lowercost. Lower cost meant better financial performance; that is, the position of abusiness or unit on the matrix is a function of its performance. The matrix isdivided into four quadrants: cash cows, stars, dogs, and question marks.
330 Applications

Cash Cows
Cash cows represent units that have high market shares but are in industrieswith low market growth rates. Their large relative market shares mean that thecumulative number of units that they sell gives them lower unit costs. Becausethey are in industries with low market growth rates, they do not need to spend alot on new capital, and therefore a lot of the cash from the low-cost products isfree. Hence the name cash cow. BCG suggested that one strategy for such a unitwas to milk the cow by using some of the cash generated to invest in stars thatneeded cash. Industries with such cows were so-called mature industries thatdid not need the large amounts of cash needed in high growth industries.
Stars
Stars are units with high relative market shares in high growth industries. Thehigh market share means low per unit cost. However, because the industrygrowth rate is high, such a unit often must invest a lot to maintain its leadershipposition in the growing market and therefore is not likely to have a positive cashflow. The strategy suggested by BCG was to invest the cash from the cash cow inthe star and grow it into a future cash cow. If the right cash were not invested inthe star, it might be relegated to a future dog.
Dogs
Dogs are units with low market shares in low growth industries. They generatelittle or no cash and have little potential for future growth. The strategy is to
Figure 13.3 BCG’s Growth/Share Matrix.
Strategy Frameworks and Measures 331

divest of such a unit and focus attention on more viable units. These units maygenerate enough cash to break even and sustain themselves. Although such aunit may possess some synergies with other units and provide jobs foremployees, it is not very useful from an accounting point of view since it gener-ates no cash and depresses the firm’s return on assets ratio. Thus, a firm oughtto get rid of dogs.
Question Marks
Question marks are units in industries with high growth rates, but that havelow market shares relative to the leader in the market. The name question markcomes from the fact that it is not clear whether these units will become stars ordogs. Since they have very small market shares, their per unit costs are likely tobe high relative to those of their competitors with larger market shares. Becausethey are in fast-growing industries, they need lots of cash to gain large marketshares and become stars. The strategy is to take a deep look at the questionmarks and see whether they will become stars or dogs. If there is a good chancethat they will become stars, the cash can be invested in them. If they leantowards dogs, they may as well be divested of.
Application of Framework
The Growth/Share matrix framework is illustrated using the four units shownin Figure 13.4.5 The positions of the four units in 2006 and 2008 are shown bythe circles. Shaded circles show the position of each unit in 2006 while blankcircles show the positions of the units in 2008. The area of each circle is pro-portional to the revenues earned by the business. Thus, Unit 2 in 2008 had themost revenues while Unit 1 in 2006 had the least revenues. The horizontal axisof the matrix captures relative market share and represents a unit’s marketshare relative to the largest competitor in the market in which the unit com-petes. Thus, a relative market share of 0.5, such as Unit 3’s share in 2006,means that the unit has 50% of the market share of the largest competitor in themarket. However, a unit such as Unit 2 with a relative market share of 4.0 in2008, has four times the market share of its closest competitor and is clearly theleader in the market. The relative market shares of Units 1 and 2 increased from2006 to 2008 while that of Unit 3 decreased and that of Unit 4 changed veryslightly. Not only did Unit 3’s relative share decrease, its revenues also wentdown. In general, since the vertical line that divides the matrix into two crossesthe horizontal axis at 1.0, units that are located to the left of this line are marketleaders while those to the right of the line are not.
The vertical axis of the matrix captures the market growth rate and measuresthe rate at which the market is growing, adjusted for inflation. It is assumed thathigh, as far as market growth is concerned, means a growth rate of 10% orhigher and therefore the horizontal dividing line between high-growth and low-growth businesses is at 10%. High-growth units are above the line while low-growth units are below the line. Since a firm’s profitability depends on bothindustry and firm-specific factors, market growth rate proxies industry factorswhile relative market share proxies firm-specific factors.
332 Applications

Advantages and Disadvantages of Growth/Share MatrixFramework
The Growth/Share matrix framework has advantages and shortcomings thatshould be considered carefully before using it as an analysis tool.
Advantages
• The Growth/Share Matrix framework provides a common language, plat-form, and starting point for managers of multibusiness firms to explore thecritical questions of: how much of the firm’s scarce resources should beallocated to each unit? What businesses should the firm be in? Which onesshould be disposed of? What should the performance targets of each busi-ness be?
• It could be used to explore not only the performance of a business unit butalso to explore the performance of units in different countries or regions,different products, different technologies, brands, major customers, revenuemodels, and sources of revenue.
• The framework has only two simple variables: market growth rate andrelative market share. This simplicity makes it easier for managers to under-stand and participate in a discussion of “what next” questions.
Figure 13.4 Illustration of Growth/Share Matrix.
Strategy Frameworks and Measures 333

Disadvantages
• Although using only two variables makes it easier for people to understandand participate in decision-making debates, two simple variables do notcapture the drivers of a unit’s performance and therefore may be an over-simplification. It is worthwhile exploring other variables.
• The experience effects, which were a cornerstone of the model, turned outnot to be the key driver of performance in many industries. Experienceeffects were important only in semiconductors and aerospace. Even in thesetwo industries, the suspicion was that other factors were also critical.
• The framework assumes that an industry that is not growing today will notgrow tomorrow; that is, the model is static. Research in technologicalinnovation suggests that technological discontinuities can revive an indus-try, drastically increasing growth rates.
• Labeling a group as dogs or cows may not be a good idea. Who wants to becalled a dog or a cow?
• Divesting of a business just because it is a dog may be discounting anysynergies that may exist between the dog and stars or cash cows that haveallowed these other units to be high performance.
GE/McKinsey MatrixIn the 1960s, General Electric Company (GE) was one of those multibusinessfirms that faced the corporate level questions that we stated above, viz:
• How much of its scarce resources, such as capital, should be allocated toeach business?
• What businesses should it be in?• Which ones should be disposed of?• What should the performance targets of each business be?
In exploring these questions, GE worked with McKinsey as a consultant. Oneoutput of the work performed by both firms in the late 1960s and early 1970swas the GE/McKinsey matrix. Like the BCG Growth/Share matrix before it,the GE/McKinsey matrix is also a portfolio analysis model. It exploits the factthat firm performance is driven by both industry and firm-specific factors.In the model, industry factors are proxied by Industry Attractiveness whilefirm-specific factors are proxied by Business Strength/Competitive Position(Figure 13.5).
Elements of the Framework
The vertical axis of the matrix captures industry attractiveness while the hori-zontal axis captures business strength/competitive position.
Industry Attractiveness
The industry attractiveness of the GE/McKinsey matrix replaces the marketgrowth rate variable of the Growth/Share matrix. Moreover, industryattractiveness is a composite measure of the following:
334 Applications

• Barriers to entry and exit• Cyclicality• Emerging opportunities and threats• Industry profit margins• Intensity of competition• Macroenvironmental factors• Market growth rate• Market size• Seasonality• Technological and capital requirements.
The Business Strength/Competitive Position of the GE/McKinsey matrixreplaces the relative market share variable of the Growth/Share Matrix. Thiswas measured by a combination of the following:
• Ability to match or beat rivals on product quality and service• Knowledge of customers and markets• Management strength• Possession of desirable distinctive capabilities• Profit margins relative to competitors• Relative cost position• Relative market share• Technological capability.
In the GE/McKinsey matrix, the size of each circle represents the size of themarket for the unit in question while the shaded part of the circle represents theunit’s share in the market (Figure 13.5). (This contrasts with the Growth-Share
Figure 13.5 GE/McKinsey Matrix.
Strategy Frameworks and Measures 335

Matrix where the size of the circle represents the size of revenues, and its rela-tive market share is represented by where the circle is located.) In the 3 × 3matrix, units that fall into the quadrant where industry attractiveness is highand a firm’s business strength/competitive position is strong, are very profitableand a firm ought to invest in them and take other strategic steps to build them.A firm should also invest in and build (1) those units that are in industries whoseattractiveness is medium but the firm’s business strength/competitive position isstrong, or (2) those that are in industries whose attractiveness is high and thefirm’s business strength/competitive position is median (Figure 13.5). A unit inan industry whose attractiveness is low or medium and the unit’s strength/com-petitive position in the industry is weak, ought to be divested or harvested insome other way; so should units in industries whose attractiveness is low andthe unit’s business strength/competitive position is average. The units that fallinto the other quadrants should be held and different strategies explored tomake them more profitable.
Advantages and Disadvantages of the GE/McKinsey Matrix
The GE/McKinsey Matrix has some of the strengths and weaknesses of theBCG Growth/Share Matrix, with the important difference that the former hasmore complex measures.
Advantages
• Like the BCG Growth/Share matrix, the GE/McKinsey matrix frameworkprovided a common language, platform, and starting point for managers ofmultibusiness firms to explore the critical questions faced by multibusinessfirms.
• It could be used to explore not only the performance of a business unit butalso to explore the performance of units in different countries or regions,different products, different technologies, brands, major customers, revenuemodels, and sources of revenue.
• The more complex measures for industry attractiveness and businessstrength provided a more realistic measure of the industry and firm-specificfactors, two key determinants of firm performance.
Disadvantages
• By using a combination of many other variables to measure industryattractiveness, the GE/McKinsey matrix becomes very complex and difficultfor managers to understand. It makes the model more difficult for managersto put their minds around. The list of variables that constitute the combin-ation to measure either industry attractiveness or business strength canquickly become a laundry list.
• The framework is still a static model because it says nothing about how thevariables change with time.
• Divesting of a unit because the industry is not attractive today and the unit’sbusiness strength is low may be discounting synergies that may existbetween the unit and more profitable ones.
336 Applications

Porter’s Five ForcesAs its name suggests, Porter’s Five Forces framework was developed by Profes-sor Michael Porter of the Harvard Business School and introduced to the worldin his 1979 Harvard Business Review paper that was followed by his 1980book, Competitive Strategy.6 It is a framework for determining the averageprofitability of an industry. Although the SWOT analysis had allowed analyststo produce a list of factors that posed threats to a firm and another that offeredopportunities for a firm, there was no way of directly linking these factors toprofitability. Porter’s Five Forces enabled analysts to link the competitivethreats and opportunities of an industry to the profitability of the industry. Inthe framework, there are five competitive forces that act on industry firms anddetermine the average profitability of an industry (Figure 13.6). How do theseforces lower or raise industry profitability? Let’s consider each force, startingwith Barriers to Entry. If Barriers to Entry are high—that is, if the Threat ofPotential New Entry is low—industry firms can afford to keep their prices highwithout attracting many new entrants. That tends to increase industry profits.However, if Barriers to Entry are low, new entrants would enter the industry iffirms charge high prices for their outputs or sell lots of the output, therebyindicating to new entrants that there is a lot of money to be made in the indus-try. Rational industry firms, for fear of attracting many new entrants, are there-fore inclined to keep their prices low, thereby tending to reduce industry profits.
If the Bargaining Power of Suppliers is high—that is, if suppliers have bar-gaining power over industry firms—the suppliers are likely to demand highprices for the inputs that industry firms need to make and deliver products. If
Figure 13.6 Porter’s Five Competitive Forces.
Strategy Frameworks and Measures 337
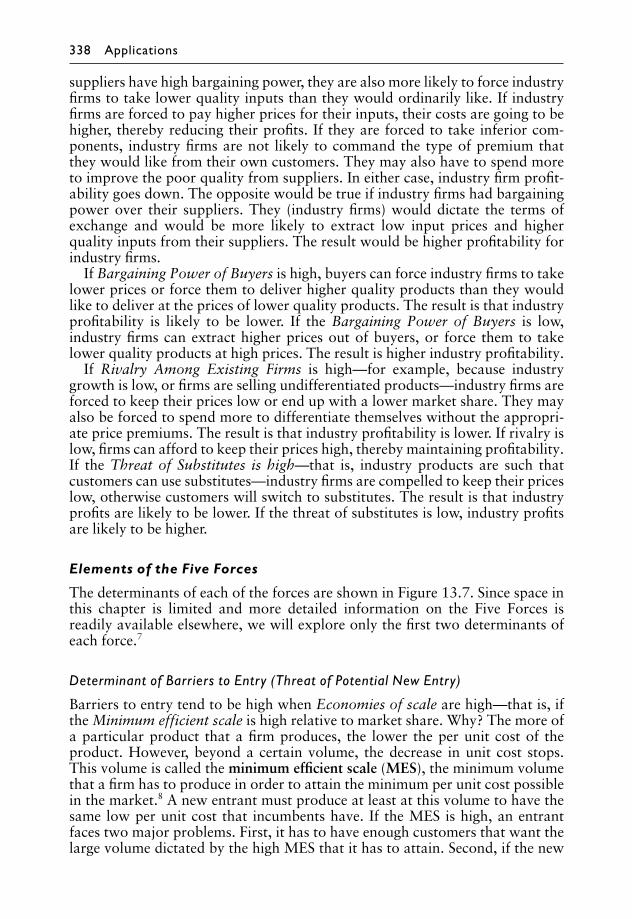
suppliers have high bargaining power, they are also more likely to force industryfirms to take lower quality inputs than they would ordinarily like. If industryfirms are forced to pay higher prices for their inputs, their costs are going to behigher, thereby reducing their profits. If they are forced to take inferior com-ponents, industry firms are not likely to command the type of premium thatthey would like from their own customers. They may also have to spend moreto improve the poor quality from suppliers. In either case, industry firm profit-ability goes down. The opposite would be true if industry firms had bargainingpower over their suppliers. They (industry firms) would dictate the terms ofexchange and would be more likely to extract low input prices and higherquality inputs from their suppliers. The result would be higher profitability forindustry firms.
If Bargaining Power of Buyers is high, buyers can force industry firms to takelower prices or force them to deliver higher quality products than they wouldlike to deliver at the prices of lower quality products. The result is that industryprofitability is likely to be lower. If the Bargaining Power of Buyers is low,industry firms can extract higher prices out of buyers, or force them to takelower quality products at high prices. The result is higher industry profitability.
If Rivalry Among Existing Firms is high—for example, because industrygrowth is low, or firms are selling undifferentiated products—industry firms areforced to keep their prices low or end up with a lower market share. They mayalso be forced to spend more to differentiate themselves without the appropri-ate price premiums. The result is that industry profitability is lower. If rivalry islow, firms can afford to keep their prices high, thereby maintaining profitability.If the Threat of Substitutes is high—that is, industry products are such thatcustomers can use substitutes—industry firms are compelled to keep their priceslow, otherwise customers will switch to substitutes. The result is that industryprofits are likely to be lower. If the threat of substitutes is low, industry profitsare likely to be higher.
Elements of the Five Forces
The determinants of each of the forces are shown in Figure 13.7. Since space inthis chapter is limited and more detailed information on the Five Forces isreadily available elsewhere, we will explore only the first two determinants ofeach force.7
Determinant of Barriers to Entry (Threat of Potential New Entry)
Barriers to entry tend to be high when Economies of scale are high—that is, ifthe Minimum efficient scale is high relative to market share. Why? The more ofa particular product that a firm produces, the lower the per unit cost of theproduct. However, beyond a certain volume, the decrease in unit cost stops.This volume is called the minimum efficient scale (MES), the minimum volumethat a firm has to produce in order to attain the minimum per unit cost possiblein the market.8 A new entrant must produce at least at this volume to have thesame low per unit cost that incumbents have. If the MES is high, an entrantfaces two major problems. First, it has to have enough customers that want thelarge volume dictated by the high MES that it has to attain. Second, if the new
338 Applications
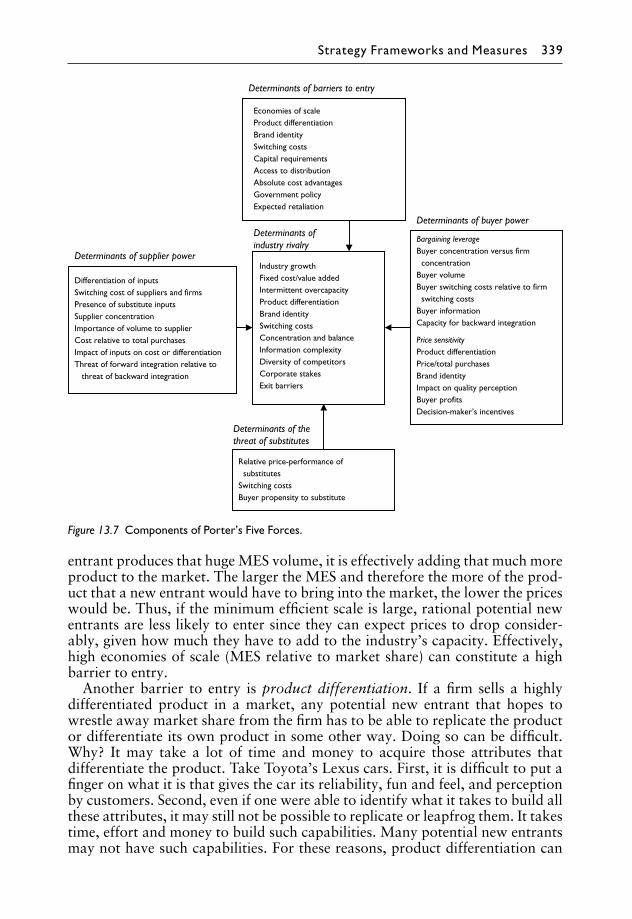
entrant produces that huge MES volume, it is effectively adding that much moreproduct to the market. The larger the MES and therefore the more of the prod-uct that a new entrant would have to bring into the market, the lower the priceswould be. Thus, if the minimum efficient scale is large, rational potential newentrants are less likely to enter since they can expect prices to drop consider-ably, given how much they have to add to the industry’s capacity. Effectively,high economies of scale (MES relative to market share) can constitute a highbarrier to entry.
Another barrier to entry is product differentiation. If a firm sells a highlydifferentiated product in a market, any potential new entrant that hopes towrestle away market share from the firm has to be able to replicate the productor differentiate its own product in some other way. Doing so can be difficult.Why? It may take a lot of time and money to acquire those attributes thatdifferentiate the product. Take Toyota’s Lexus cars. First, it is difficult to put afinger on what it is that gives the car its reliability, fun and feel, and perceptionby customers. Second, even if one were able to identify what it takes to build allthese attributes, it may still not be possible to replicate or leapfrog them. It takestime, effort and money to build such capabilities. Many potential new entrantsmay not have such capabilities. For these reasons, product differentiation can
Figure 13.7 Components of Porter’s Five Forces.
Strategy Frameworks and Measures 339

be a high barrier to entry. The other determinants of barriers to entry are brandidentity, switching costs, capital requirements, access to distribution, absolutecost advantages, government policy, and expected retaliation (Figure 13.7).
Determinants of the Bargaining Power of Suppliers
If the products that suppliers supply to firms are highly differentiated—that is, ifinputs are differentiated—firms are less likely to switch from the supplier toanother supplier. That is, differentiated inputs give the suppliers of such inputsbargaining power. Such a supplier can extract higher prices from industry firmsor force them to take inputs with inferior quality than would ordinarily beexpected. Firms are not likely to find another supply with the differentiatedquality of the input. For example, microprocessors are highly differentiatedinputs to PCs since they have unique features that PCs need. This gives makersof microprocessors more bargaining power over PC makers than one wouldordinarily expect suppliers to have over their buyers. Another determinant ofthe bargaining power of suppliers is the switching cost that firms incur if theywere to switch to another supplier. The higher these switching costs, the higherthe bargaining power that suppliers are likely to have. A firm’s switching costsare the costs that the firm incurs when it switches from one supplier to another.For example, people who learnt to drive using a car with an automatic trans-mission have high switching costs if they were to switch to a car with a manualtransmission. The other determinants of supplier bargaining power are shownin Figure 13.7.
Determinants of the Bargaining Power of Buyers
The bargaining power of buyers is a strong function of the concentration ofbuyers relative to that of firms. The more buyers that there are vying for firms’products, the better off firms are since they can play buyers against each other. Ifone buyer does not agree to their terms, firms can go to another buyer. There-fore, if buyers are in an industry that is concentrated relative to the firm’sindustry, buyers are likely to have bargaining power. In some cases, the buyerindustry may not be concentrated but may have one or more dominant buyerswho can wield a lot of power by virtue of the large quantities of products thatthey buy, and in that case, set the trend for prices. For example, the retailindustry is not concentrated relative to industries for suppliers of items such asdetergents, etc. Yet, the sheer volume of purchases that large companies such asWal-Mart makes gives them considerable bargaining power. Product differen-tiation also plays a part in the bargaining power of buyers. If the products thatbuyers purchase from firms are undifferentiated, buyers are more likely to playfirms against each other than would be the case when the products are differen-tiated. Buyers are even more likely to play firms against each other if the prod-uct has no switching costs; but if industry firms offer differentiated products,their chances of having bargaining power over buyers are increased.
The remaining determinants of the bargaining power of buyers are shown inFigure 13.7. These determinants are sometimes divided into those that have todo with Bargaining Leverage and those that have to do with Price Sensitivity.Bargaining leverage determinants are those determinants that depend more on
340 Applications

the firms themselves while price sensitivity determinants are those that have todo with the products and their attributes rather than firms.
Determinants of Industry Rivalry
Many firms are usually under pressure from investors to increase earnings. Ifindustry growth is high, firms can meet expectations of such earnings withouthaving to steal market share from each other. However, if industry growth isslow or declining, firms may be tempted to try to steal market share from theirrivals. In trying to steal market share, firms may resort to price wars, orunnecessary product promotion or introduction, which can sap industryprofits. Effectively, the lower the industry growth rate, the more likely thatindustry rivalry will be high. Also, high fixed costs, relative to variable costs,can increase industry rivalry. Why? Each time a firm sells a unit of a product,the revenues from the product go to cover variable cost, fixed costs, and profitmargin. In bad times, firms may be tempted to sell their products at a loss, solong as the prices cover their variable costs. The higher the fixed costs relative tovariable costs, the lower that the firm can set its prices (below profitable prices)and still cover variable costs. This can reduce industry profits considerably.Effectively, the higher the fixed costs, relative to variable costs, the higher wecan expect industry rivalry. The remaining determinants of industry rivalry areshown in Figure 13.7.
Determinants of the Threat of Substitutes
Substitutes are products from outside the industry or market that customers canbuy instead of industry products. Customers will turn to substitutes if the sub-stitutes perform the tasks that products usually perform for customers and doso at a good price; that is, substitutes can be a problem for industry products ifthe substitutes have the right relative price-performance. To start buying substi-tutes, existing customers have to switch from industry products to the substi-tutes. If the costs of switching from industry products to substitutes are high,substitutes are less likely to be a threat to industry firms. The remainingdeterminants of the threat of substitutes are shown in Figure 13.7.
Advantages: Applying Porter’s Five Forces
Industry Attractiveness
One of the primary applications of Porter’s Five Forces is to use it to analyze anindustry’s attractiveness—use it to explore the extent to which an industry is,on average, profitable. If the competitive forces acting on industry firms arelow—that is, the bargaining power of suppliers, threat of new entry, the bar-gaining power of buyers, the threat of substitutes, and rivalry among existingfirms are low—the industry is said to be attractive, since the forces suggest thatindustry firms are, on average, profitable. If the competitive forces that act onindustry firms are high, the industry is said to be unattractive, since industryfirms are, on average, unprofitable. It is important to understand that if a FiveForces analysis shows that an industry is, on average, unprofitable, it does not
Strategy Frameworks and Measures 341
mean that all the firms in the industry are unprofitable. A Five Forces analysisdetermines only the average profitability of the firms in an industry, not theprofitability of individual firms. A firm’s profitability is determined by bothindustry and firm-specific factors. A Five Forces analysis tells us somethingabout the industry factors component of performance but says very little ornothing about the firm-specific factors component. Firm-specific factors arethose things that enable a firm to outperform its rivals in the industry in whichthey all compete; that is, firm-specific factors are what enable a firm to have acompetitive advantage. For example, a Five Forces analysis of the PC industrywould indicate that it is not a very attractive industry. Yet, Dell was extremelyprofitable between 1994 and 1999. Several firm-specific factors contributed toDell’s strategy, to more than compensate for the industry unattractiveness andmake Dell a profit generator. One of them was the firm’s new game strategy ofselling directly to end-customers and focusing on those business customers thathad sales of over $1 million.
Determine Opportunities and Threats
In analyzing the determinants of each force, one is effectively identifying theopportunities (friendly forces) and threats (repressive forces) of the competitiveenvironment. A firm can then use its strengths to take advantage of theopportunities while trying to mute the threats. For example, if there is only onesupplier that supplies a critical input to several firms, a firm can work with thesupplier to create second sources for the component. Doing so effectivelydampens the power of suppliers. Consider another example. If firms are able todifferentiate their products using brand name reputations, such brands can bereinforced with the right marketing investments. For example, Coke and Pepsispend huge amounts of money advertising to maintain their brands. Effectively,a Five Forces analysis can be seen as a framework for identifying both friendlyand hostile forces so that managers can then formulate the right strategies tomute repressive forces and reinforce friendly ones. In this respect, the FiveForces model has a huge advantage over a SWOT analysis. A SWOT analysisgenerates a list that can quickly degenerate into a laundry list. More import-antly, a SWOT analysis does not link the weaknesses and threats generated toprofitability. A Five Forces analysis does.
Organizing Framework for Data
A Five Forces analysis can also be used as an organizing framework for discus-sions leading up to a decision. For example, in a strategic planning meeting,managers can use the framework to sketch out scenarios of what would happenif any of the determinants of each of the five forces were to change. The modelprovides a common language and understanding for exploring the industrycontext in which firms operate.
Disadvantages
Like any model, the Five Forces framework has some disadvantages.
342 Applications
No Mechanism for Narrowing Down
The framework has no mechanism for narrowing down the list of factors toimportant ones. Suppose three of the five forces are low while the other two arehigh. Is the industry attractive or unattractive? Now, take rivalry among exist-ing firms, which has eleven determinants (Figure 13.7). Suppose five of thedeterminants suggest that rivalry should be high while six suggest that rivalryshould be low. Should rivalry among existing firms be indicated as being lowor high?
Neglects the Role of Complementors
Complementors are the firms that make complements. In many industries, therole of complements is critical. For example, PCs would not be as valuable asthey are without software. Therefore neglecting the role of complementors, asthe Five Forces model does, may not be a good idea.
Framework is Static
Like most strategy frameworks, the Five Forces framework is a static model. Itis about the average profitability potential of an industry at a point in time. Itsays nothing about what the profitability potential of the industry was yester-day or what it will be tomorrow. The Five Forces takes a cross section of theaverage attractiveness of an industry, which is OK, so long as none of the keydeterminants of each of the forces changes over time. Effectively, the modelneglects the dynamic nature of most industries and one should use it carefullywhen dealing with fast-changing industries.
No Cooperation Included
The model says little or nothing about cooperation. The Five Forces introducedthe notion of extended competition—the notion that suppliers, customers, sub-stitutes, and potential new entrants should be viewed as competitors, the wayrivals are viewed. This is a great idea. But there is also a lot of cooperation thattakes place between firms and their suppliers, buyers, rivals, complementors,and makers of substitutes. As we argued in Chapter 4, firms often have tocooperate and compete with coopetitors to create and appropriate value. Seeingcoopetitors as competitors, the way a Five-Forces analysis does is incomplete.
Role of MacroEnvironment not Considered
The Five Forces framework does not explicitly consider the role of macroenvi-ronmental effects. The effects of the political, macroeconomic, sociological,technological, and natural environment are not directly considered.
Business SystemsThe concept of a business system was developed in work at McKinsey by CarterF. Bales, P. C. Chatterjee, Frederick W. Gluck, Donald Gogel, and Anupam
Strategy Frameworks and Measures 343

Puri.9 It was introduced to the outside world in Frederick Gluck’s and Buaron’s1980 articles in The McKinsey Quarterly.10 A business system consists of thedifferent elements of the system of activities which a firm uses to make anddeliver products or services to a market. One such system is shown in Figure13.8 for a technology-based manufacturing firm.11 At each stage of the system,the firm has different options for performing the activities at that stage. Forexample, take the activities at the technology stage. As we saw briefly in Chap-ter 1, the firm can choose to license the technology from another firm, developthe technology internally alone, form an alliance to develop the technology, oroutsource the whole product development and design process to someone. If itperforms its own R&D, it can choose to patent aggressively, decide not topatent and instead depend on keeping its technology secret, or open up thetechnology to any one who wants. And so on. At the distribution level, a firmcan choose to use all the distribution channels available to it, use only some ofthe channels, or bypass all of them and sell directly to end-customers. If the firmdecides to use distribution channels, it can own them or outsource the distribu-tion to someone else. It can build up inventories before and warehouse thecomponents or build the product only after a customer has ordered it. Again,the options abound.
All these options are opportunities for new games. For example, if firms in anindustry all use distributors to sell their products to end-customers, a firm canpursue a new game by selling directly to the end-customers. If firms in anindustry keep their technologies proprietary, a firm can pursue the new game ofopening up its technology to any firm that wants it; and so on.
Application of the Business Systems Approach
The business systems concept is about asking option-generating questions ateach stage of the system.12 These questions include:
• How is the firm performing the activities of the stage now?• How are competitors performing the activities of the stage?• What is better about competitors’ ways of performing the activities?• What is better about the firm’s ways?• How else might the activities be performed?• How would the options affect the firm’s competitive position?
Figure 13.8 Business System for a Technology Firm.
344 Applications

• If the firm were to change the way it performs activities at the stage inquestion, how would doing so impact the other stages of the businesssystem?
One of the primary lessons of the business systems concept is that there aremany other ways, beyond product innovation, to gain a strategic advantage.One can change the conventional system for getting an existing product tothe market.13 Using the Internet to sell old books or movies is a goodexample.
Value Chain AnalysisThe idea behind a value chain is that at each of the stages of a business system,something is done to the work-in-process to get it closer to the product thatcustomers value. To see how, consider the business system for a firm such as anautomobile maker shown in Figure 13.9. The product design unit adds valuewhen it designs a car. After the design, a customer, C, that looks at the designhas some idea about what the car will look like. The manufacturing unit addsvalue when it transforms the design into a car that has the features specified inthe design, getting the car closer to what customers want. Marketing adds valueby bringing information about the car to customers that makes customers per-ceive the car as being more valuable to them than they would have perceivedhad they not received the marketing messages. Distribution adds value by bring-ing the car to where customers can touch and feel, test-drive, kick the ties, orbuy and drive away. The service unit adds value be servicing or repairing thecar, or assuring the potential buyer that there will be service when he or sheneeds it.
The term value chain was coined by Professor Michael Porter of the HarvardBusiness School in his 1985 book, to designate the chain of activities that a firmperforms to add value—as it transforms its inputs into outputs.14 He dividedthe activities of a generic value chain into primary and supporting activities(Figure 13.10).
Elements of a Value Chain
Primary Activities
These consist of inbound logistics, operations, outbound logistics, marketingand sales, and service.
• Inbound logistics: these are the activities performed to receive, sort, store,retrieve, and distribute inputs to a product or service. Depending on theindustry, these activities can include scheduling, inventory control,
Figure 13.9 An Automobile Maker’s Business System.
Strategy Frameworks and Measures 345
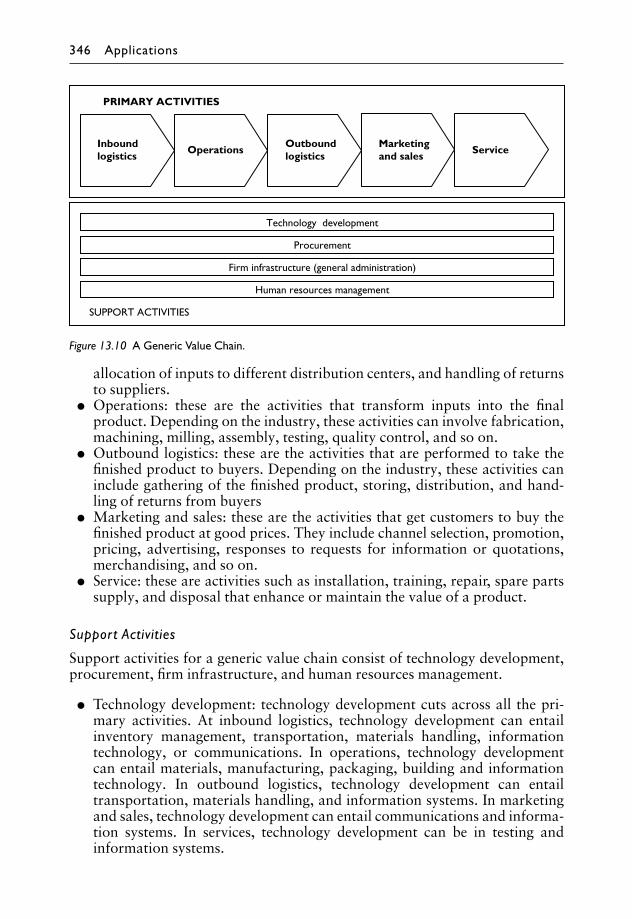
allocation of inputs to different distribution centers, and handling of returnsto suppliers.
• Operations: these are the activities that transform inputs into the finalproduct. Depending on the industry, these activities can involve fabrication,machining, milling, assembly, testing, quality control, and so on.
• Outbound logistics: these are the activities that are performed to take thefinished product to buyers. Depending on the industry, these activities caninclude gathering of the finished product, storing, distribution, and hand-ling of returns from buyers
• Marketing and sales: these are the activities that get customers to buy thefinished product at good prices. They include channel selection, promotion,pricing, advertising, responses to requests for information or quotations,merchandising, and so on.
• Service: these are activities such as installation, training, repair, spare partssupply, and disposal that enhance or maintain the value of a product.
Support Activities
Support activities for a generic value chain consist of technology development,procurement, firm infrastructure, and human resources management.
• Technology development: technology development cuts across all the pri-mary activities. At inbound logistics, technology development can entailinventory management, transportation, materials handling, informationtechnology, or communications. In operations, technology developmentcan entail materials, manufacturing, packaging, building and informationtechnology. In outbound logistics, technology development can entailtransportation, materials handling, and information systems. In marketingand sales, technology development can entail communications and informa-tion systems. In services, technology development can be in testing andinformation systems.
Figure 13.10 A Generic Value Chain.
346 Applications

• Procurement: these are the activities to purchase the inputs that are used inthe primary activities. They include sending out requests for information orquotations, bargaining with suppliers, etc. The purchases include materials,equipment, buildings, land, etc.
• Firm infrastructure: these are activities such as accounting, finance, generalmanagement, planning, legal and government services, information sys-tems, and quality management that complement the other activities.
• Human resource management: these are the activities to locate, recruit, hire,train, develop, and compensate employees.
Applying the Value Chain Analysis
The value chain analysis has several applications.
Estimating Firm-specific Effects (Estimating Value Created and Costs)
Just as Porter’s Five Forces analysis can be used to estimate industryattractiveness and therefore the industry factors that can impact a firm’s per-formance, a value chain analysis can be used to estimate the firm-specificfactors that contribute to the firm’s performance. By identifying the differentstages of a firm’s value chain, the value added at each stage, how much it coststo add the value, the capabilities needed, and the value drivers, a firm canisolate which stages of its value chain add the most value and why. Suchinformation can help a firm decide where to invest more so as to increase itschances of attaining or maintaining a competitive advantage in the markets inwhich it competes.
Organizing Framework for Data
Like a Five Forces analysis, a value chain analysis can also be used as an organ-izing framework for managers to guide them in their scenario analysis of whichactivities to perform. Firms can also compare their value chains to those of theircompetitors.
Value System
Although we have focused our attention on a focal firm’s value chain, suppliersand buyers also have value chains. The system that is made up of a supplier’svalue chain, the focal firm’s value chain, and buyer’s value chain is called avalue system (Figure 13.11). Effectively, each value chain is part of a largersystem of value chains called a value system. Unfortunately, however, mostpeople usually just call the value system a value chain, without making anydistinction between the two.
Figure 13.11 A Value System.
Strategy Frameworks and Measures 347

Shortcoming of a Generic Value Chain Analysis
The generic value chain of Figure 13.10 fairly represents the activities that areperformed to add value in many manufacturing industries. However, it does notrepresent the value-adding activities in many other industries. Consulting,financial services, insurance, software, hospitals, search engine companies, realestate, and numerous other service organizations do not have inbound andoutbound logistics. Moreover, the activities in these industries are not per-formed in chains as the value chain framework suggests. What is so value chainabout the activities at hospital or at a Google? We explore alternate businesssystems.
Value ConfigurationsProfessors Charles Stabell and Oystein Fjeldstad of the Norwegian School ofManagement argued that the value chain is but one of three configurations forconceptualizing the value created when firms perform value-adding activities.15
The other two are value network and value shop. In their work, published inthe Strategic Management Journal in 1998, Professors Stabell and Fjeldstadcalled the value chain, value shop, and value network value configurationssince they are about different arrangements for adding value.16 Recall that, inthe value chain, adding value is about bringing in the right inputs, transformingthem into the right outputs, and disposing of the outputs. In a value network,adding value is about building a network of customers and enabling direct andindirect exchanges among the customers. In a value shop, adding value is aboutresolving customer problems. Since we explored the value chain above, we nowfocus on value shop and value network.
Value Network
The value network is the configuration that firms, which mediate between otherfirms or between individuals, use to add value. Such firms include commercialbanks which mediate between borrowers and savers, auctioneers who mediatebetween sellers and buyers, credit card companies which mediate betweencardholders and merchants, and distributors which mediate between producersand end-customers. A bank adds value by building the right network of bor-rowers and savers and using savings to make loans. The more savers that a bankhas, the better off the depositors at the bank are likely to be and vice versa. Anauctioneer such as eBay adds value by creating a large network of sellers andbuyers, enabling exchanges between them. The more sellers that there are, thebetter off the buyers, and vice versa. A credit card company adds value bybuilding the right network of merchants and cardholders, and enabling card-holders to use their cards to make purchases from merchants. The more card-holders that use a particular card, the better off the merchants that accept thecard. The more merchants that accept the card, the better off each cardholder islikely to be. For these firms that mediate between different parties, adding valueis about building the network that the parties value, and performing the types ofactivities that enable direct or indirect exchanges between members of the net-work. Contrast this with a manufacturer with a value chain that must worry
348 Applications

about incoming and outgoing logistics, transformation of physical inputs intooutputs, and disposal of these outputs. Value network configurations get theirname from the fact that value addition is about building and exploiting anetwork.
The elements of a value network (a bank in this case) are shown in Figure13.12. Support activities are very similar to the support activities for a valuechain that we saw earlier. Therefore we focus on primary activities.
Primary Activities
• Network promotion and contract management: These are the activitiesto invite and select potential customers to join the network. They includeinitialization, management, and termination of contracts.
• Service provisioning: These are the activities to establish, maintain, andterminate links with customers. They also include activities to billcustomers.
• Network infrastructure operation: These are the activities to maintainfirm’s physical and information infrastructures.
Value Shop
Adding value in organizations such as hospitals, consulting firms, law firms,architecture firms, and engineering professional services such as petroleumexploration, has a lot more to do with solving problems than inbound andoutbound logistics, and therefore requires a different configuration from thevalue chain.17 It is about working with customers to identify their problems andsolve them. Consider the example of a hospital. When a patient walks into ahospital or is carried there, doctors have to find out what is wrong with thepatient. They examine the patient using their banks of knowledge, skills, know-how, and equipment. After the examination, they may decide that there is noth-ing wrong with the patient and send him or her home. They may also decidethat they need to conduct some laboratory tests or more diagnostics. Dependingon the result of the tests, more tests may be needed, the patient may be referredto an expert, admitted into the hospital, sent home, or sent for yet more tests.Effectively, hospitals are more about solving problems than about inbound
Figure 13.12 A Value Network.
Strategy Frameworks and Measures 349

logistics, transformation of physical inputs, and disposal of outputs. Hospitalemployees work with a patient to identify his or her illness and work to cure theillness. Patients are not input materials, all of whom are given the same treat-ment, and the same product expected at the end of some chain. The configur-ations in which problems are identified and solved are called value shop and arebetter conceptualizations for hospitals, consulting services, law firms, engineer-ing professional firms, and architecture firms than the value chain or valuenetwork. The elements of the value shop are shown in Figure 13.13.
Primary Activities
• Problem-finding and acquisition: working with customers to determine theexact nature of their problem or need. Activities include those to record,review, and formulate the problem. Choice of general approach to solve theproblem.
• Problem-solving: activities to generate and evaluate alternative solutions.• Choice: activities to choose among alternative solutions among alternative
problem solutions.• Execution: activities to communicate, organize, and implement the chosen
solution.• Control and evaluation: activities to measure and evaluate the extent to
which implementation of the solution has solved the problem targeted.
Balanced ScorecardThe balanced scorecard framework is a performance measurement system thatwas developed by Professor Robert Kaplan of the Harvard Business School andDr. David Norton.18 It takes four measurement perspectives—financial, cus-tomers, business processes, and learning and growth—that provide a snapshotof not only current operating performance but also the drivers of future per-formance. Traditional financial measures such as income, return on assets,
Figure 13.13 A Value Shop.
350 Applications

return on investments, economic value added, etc., usually reflect the results ofpast actions and say very little about what might drive future financial perform-ance. They also say little about the intellectual capital embedded in relation-ships with customers, suppliers, and employees. By including measures fromthe perspective of customers, business processes, and learning and growth,the balanced scorecard captures measures of some of the drivers of futureperformance.
Elements of the Balanced Scorecard
The key elements of the Balanced Scorecard are shown in Figure 13.14. A firm’svision and objectives are translated into measures that take customer, businessprocess, learning and growth, and financial perspectives. In each perspective, afirm asks a driving question and answers the question by outlining its object-ives, fleshing out measures of the objective from the perspective in question,stating the targets that the firm wants to meet as far as the perspective is con-cerned, and detailing the initiatives that the firm would need to meet the targets(Figure 13.14).
Figure 13.14 Elements of the Balanced Scorecard.
Strategy Frameworks and Measures 351

Customer Perspective
The primary question that a firm should ask itself is, how do customers see us?The idea here is for a firm to translate the customer-related aspects of its visionand objectives into measures that reflect those things that matter to customers.For example, measures such as delivery lead times, product quality, perform-ance and service, and costs are important to most customers and therefore makegood measures.
Internal Business Perspective
The primary question that a firm should ask itself as far as the internal businessperspective is concerned is, at what must we excel? The idea here is to identifythose things that a firm does well to meet customer needs, and then identifythose measures that enable the firm to track these things that it does so well.Some of these measures include cycle time, quality, employee skills, andproductivity.
Learning and Growth Perspective
Because of the rapid rate of change, especially technological change, it isimportant for a firm to be able to continue to do well in the face of change. Thusa firm needs to ask the question, how can we sustain our ability to change andimprove? This ability can be tracked using measures such as the ability tolaunch new products, create more value for customers, and improve operatingefficiencies.
Financial Perspective
The financial perspective measures whether a firm’s strategy and implementa-tion have been working for shareholders. Hence the question, how do we lookto shareholders? How a firm looks to shareholders can be tracked using meas-ures such as profitability, shareholder value, cash flow, operating income,return on equity, and so on.
Objectives, Measures, Targets, and Initiatives
Throughout our discussion of the balanced scorecard, we have focused onmeasures; but as indicated in Figure 13.14, each perspective has four parts:objectives, measures, targets, and initiatives. A firm’s objectives for each per-spective are where the firm would like to be as far as the perspective is con-cerned. For example, in the customer perspective, a firm’s objective may be toincrease customer satisfaction. A measure of customer satisfaction would be,for example, customer ratings of their satisfaction with the firm’s products orservice. A specific target for measuring customer satisfaction would be, forexample, a rating of 5 out of 5. Initiatives are action programs put in place tomeet the objective. Initiatives to increase customer satisfaction could includelistening to customers more, training customer service representatives, andbuilding a better product.
352 Applications

Advantages and Shortcoming of the Balanced Scorecard
Advantages
• Before the balanced scoreboard, one of the few ways to determine whetheror not a firm’s strategy was working was to use financial measures; butfinancial measures usually reflect the results of past actions and say verylittle about future performance. Moreover, it was not easy to link financialperformance to firm activities. By complementing these financial measureswith measures from the perspective of the customer, internal business, andlearning and growth, a firm can track its progress towards meeting itsobjectives and future performance goals better. If the adage that “You can’tmanage what you don’t measure” is true, these added measures of a bal-anced scorecard expand the scope of what managers can manage better.
• The balanced scorecard offers managers a common language, display for-mat, and starting point for management discussions on the extent to whicha firm’s strategy is meeting its objectives.
• The balanced scorecard also provides a common language for benchmark-ing the performance of competitors, acquisition targets, and potential alli-ance partners.
Disadvantages
• The balanced scorecard is a set of measures, not a strategy. While it enablesmanagers to track the performance of a strategy, it does not say what thestrategy is and how it could be improved. The framework says very littleabout the activities that are driving a firm’s performance and why theactivities are indeed responsible for the performance. This is where frame-works such as the AVAC that we saw in Chapter 2 and will touch on belowcome in.
• If the adage that “You can’t manage what you don’t measure” is true, thensettling on the wrong measures can mislead a firm into thinking that it is onthe right track.
VRIO FrameworkThe VRIO (Value, Rare, Imitate, Organized) framework was developed by Pro-fessor Jay Barney of the Fisher College of Business at the Ohio State Uni-versity.19 The framework is about exploring the extent to which a firm canexpect to have a sustainable competitive advantage from its resources. Thecentral argument of the framework is that, if a firm has resources that arevaluable, rare, costly to imitate, and the firm is organized to exploit theseresources, then the firm can expect to have a sustained competitive advantage. Itis rooted in the resource-based view of strategic management that we exploredin Chapter 5.
Elements of the Framework
The framework can be understood by exploring four questions.
Strategy Frameworks and Measures 353
The Question of Value
Value in this case is about the extent to which external opportunities can beexploited or external threats neutralized. Thus the question that a firm poses is,does the resource enable the firm to exploit external opportunities or neutralizean external threat? If the answer is Yes, the firm is likely to increase its revenues,decrease its costs, or both—it is likely to increase its profits using the resource.
The Question of Rarity
If the resource is not rare, many other firms will acquire it and be able to exploitthe same opportunities or neutralize the same threats, considerably reducingany profits that the firm would have made from the resource. Rarity does notnecessarily mean that the firm is the only one with the resource. A few firms canhave the resource, but just few enough for there still to be scarcity, enablingthem to make money from the resources.
The Question of Imitability
If a resource is valuable and rare, a firm can have a competitive advantage; butsuch an advantage is likely to be only temporary if the resource can be imitated.Effectively, the advantage is likely to be sustainable only if competitors face acost disadvantage in imitating the resource.
The Question of Organization
A valuable, rare, and inimitable resource still has to be exploited. Thus a firm’sstructure and control systems must be such that employees have the ability andincentive to exploit the firm’s resources.
Advantages and Disadvantages
Advantages
• Since a firm’s valuable, rare, and inimitable resources are its strengths, theVRIO framework provides the link between strengths and profitability thata SWOT analysis does not.
• It can be used to narrow down the list of a firm’s resources to only the veryrelevant ones, allowing a manager to make better choices on where toinvest. Managers can also use it to identify the areas in which they haveweaknesses (in resources), allowing them to plan better on how to reducethe weaknesses.
• A VRIO analysis can also be used to determine the quality of competitors’resources.
Disadvantages
• The VRIO framework says very little about coopetitors—the suppliers, cus-tomers, complementors, rivals, and other organizations with whom a firm
354 Applications

often has to cooperate to create value and compete to appropriate it; that is,the industry component of the determinants of a firm’s profitability islargely neglected.
• The framework says very little about change. In the face of some changes,valuable, rare, and inimitable resources can become a handicap.20
VIDEIn 1990s, following Professors C.K. Prahalad’s and Gary Hamel’s seminal art-icle on the core competence of the firm, and research by other scholars, manyfirms wanted to determine their core competences and nurture them.21 Some ofthe firms that tried this exercise ended up with an endless list of resources andcapabilities, with no way of determining which ones were really the critical onesthat deserved to be nurtured. The VIDE (Value, Imitability, Differentiability,and Extendability) analysis was one attempt to narrow down the list of corecompetences to the ones that really matter to a firm.22 It consists of providinganswers to four questions about resources/capabilities and classifying thembased on the answers. It was derived from the definition of a core competence.Recall from Chapter 5 that a core competence is a resource or capability thatmeets the following criteria:23 (1) makes a significant contribution to the bene-fits that customers perceive in a product or service, (2) is difficult for competi-tors to imitate, and (3) is extendable to other products in different markets.
Elements of the VIDE Analysis
The primary questions in a VIDE analysis are summarized in Table 13.1.
Value
Since money comes from customers, a core competence must be translated intosomething that they perceive as valuable to them. Hence the first question that afirm may want to ask, in determining the extent to which a resource/capabilityis likely to amount to a core competence, is to ask whether the resource/capabil-ity makes a significant contribution towards the Value that its customers per-ceive. The skills of a plastic surgeon who performs cosmetic face surgery addsvalue if his/her patients can look in a mirror and say, “I like my new face.” If theanswer is No, then there is little chance that the resource/capability is likely tobe a core competence, unless the firm finds a way to make it more valuable tocustomers.
Table 13.1 Elements of a VIDE Analysis
Element Question
Value Does the resource or capability make an unusually high contribution to the valuethat customers perceive in the firm’s products?
Imitability Is it difficult for other firms to duplicate or substitute the resource or capability?Differentiation Is the type or level of the resource or capability unique to the firm?Extendability Can the resource or capability be used in more than one product area?
Strategy Frameworks and Measures 355

Imitability
If a resource or capability makes a significant contribution to the value thatcustomers perceive, the firm may not be able to make money from it for a longtime if the skill can be duplicated or substituted by many competitors. Thus animportant question to ask is, is it difficult for other firms to duplicate or substi-tute the resource or capability?
Differentiation
If a resource or capability can be imitated, the question is, can a firm set itselfapart from imitators by differentiating the capability? For example, a firm candifferentiate itself by having a higher level of capability. Many cosmetic sur-geons can perform face surgery but some of them can do a much better job thanothers. Thus, an important question is determining whether a resource is acore competence is, is the type or level of the resource or capability unique tothe firm?
Extendability
If a resource or capability is valuable, difficult to imitate, and a firm has found away to differentiate the resource from copycats, the next big question is, can theresource or capability be used in more than one product area? For example,Honda’s ability to design reliable high-performing engines is extendablebecause its engines are used not only in cars but also in boats, lawnmowers,motorcycles, electric generators, and airplanes.
Effectively, by answering Yes or No to the questions of Table 13.1, a firm canrank its resources/capabilities with the ones with the most Yesses at the topsince they have the highest likelihood of being core competences.
Advantages and Disadvantages of VIDE
Advantages
• The VIDE analysis offered one of the first ways to determine the extent towhich a resource or capability was likely to be a core competence andtherefore presented firms with a method for narrowing down their lists ofresources to a more manageable few.
• A VIDE analysis can be used to analyze the resources/capabilities of com-petitors and potential targets for acquisition or cooperation.
Disadvantages
The VIDE analysis has some of the same disadvantages as the VRIO analysisdiscussed above.
• The only mention of coopetitors in the VIDE analysis is in the Extendabilitycomponent. That is because in moving to a different product area, a firm islikely to face competition; but like the VRIO, the VIDE says very little about
356 Applications

coopetitors—the suppliers, customers, complementors, rivals, and otherorganizations with whom a firm often has to cooperate to create value andcompete to appropriate it. The industry component of the determinants of afirm’s profitability is largely neglected.
• Like the other frameworks that we have explored, the VIDE says very littleabout change. In the face of radical changes, core competences can becomehandicaps.24
S3PEAs we saw in Chapter 7, S3PE stands for Strategy, Structure, Systems, People,and Environment. The rationale behind the S3PE framework is that strategiesare formulated and executed by people. Therefore, people are important to thesuccess of a strategy. They are more than just a part of a profit-maximizing firm.The structure of a firm—to which people report, and who is responsible forwhat activities—is important, as are the systems that the firm has in place fordetermining how performance is measured, how people are rewarded or pun-ished, what information goes to whom, and so on. Of course, whether a firm’sstrategy, structure, systems, and people enable the firm to perform well is also afunction of the environment in which the firm functions.
Elements of the S3PE
The components of the S3PE are shown in Figure 13.15. These are the samecomponents that we saw in Chapter 7 and therefore we will not spend any timeon them.
Advantages and Disadvantages of the S3PE
Advantages
• The S3PE framework goes beyond the underlying economic assumption thatemployees’ incentives are well aligned with those of their firm and areprofit-maximizing. It pays attention to the incentives of employees and tothe culture of organization.
• It brings in the implementation component of strategy analysis.
Disadvantages
• Like the SWOT and PEST analysis, the S3PE framework does not establish alink to profitability. As Figure 13.15 indicates, strategy, structure, systems,people and environment drive performance but it is difficult to tell the direc-tion of the performance based on the elements of the framework.
• One of the components, environment, is too broad.
The 4Ps of Marketing (The Marketing Mix)When a firm pursues a target market, it usually has marketing objectives for thetarget. To achieve these objectives, a firm needs marketing tools. The set of
Strategy Frameworks and Measures 357

marketing tools that a firm uses to pursue its marketing objectives in its chosentarget market is its marketing mix.25 These marketing tools can be grouped intofour groups called the 4Ps.26 In other words, the 4Ps have come to be synonym-ous with the marketing mix. The 4Ps were developed in the 1960s by ProfessorE. Jerome McCarthy of Michigan State University. They are the marketingvariables that managers can control to meet their marketing objectives in thetarget market.
Elements of the Model
The elements of the 4Ps are shown in Figure 13.16.
Product
These are the actual specifications of the goods or services being marketed andtheir relationship to customer’s needs and wants. These specifications includenot only the inherent characteristics of a product/service such as functionality,fit, quality, safety, packaging, and reliability, but also peripheral ones such aswarrantees, brand name, guarantees, repairs/support, accessories, and service(for products). A firm must choose from all these.
Figure 13.15 Elements of the S3PE.
358 Applications

Pricing
This is the process of setting a price for a product or service. The price iswhatever the product/service is exchanged for, including money, time, energy,attention, or psychology. Pricing decisions include the type of pricing (fixed,auction, bundling, etc.), pricing strategy (discriminate, skim, penetration,everyday-low-prices, etc.), discounts (volume, wholesale, cash, early payment,etc.), financing, allowances, credit terms, and leasing options.
Placement
Also commonly referred to as place, placement is about distribution, how theproduct reaches customers. It refers to the channel through which a product issold (retail, resellers, wholesalers, directly, online, mobile, etc.), the market
Figure 13.16 Elements of the 4Ps.
Strategy Frameworks and Measures 359
segment (business, consumer, government, upper class, families, college edu-cated, etc.), and geographic region or national market. Decisions involvedinclude which distribution channel to use (retail, resellers, wholesalers, directly,online, etc.), who should be within each channel, geographic location (whichcountry) what type of inventory management to use, how to process orders,what type of market coverage (exclusive or inclusive distribution), and whattype of warehousing and order processing.
Promotion
This is about the different ways that can be used to promote the product, brand,or firm. These include advertising, personal selling, promotional strategy, wordof mouth, and viral. They also include the type of promotion, publicity, andbudget. It is about communicating product/service, firm, and brand informa-tion to customers with the goal of improving the perception of the product,firm, or brand.
Applications of the 4Ps
As we stated above, the 4Ps are marketing tools that a firm uses to pursue itsmarketing objectives in the chosen target market.
Advantages and Disadvantages of 4Ps
Advantages
• It is simple, easy to remember, and a great starting point for students whoare being introduced to marketing.
• It provides a common language and platform for marketing discussionsabout how to attain objectives in a target market.
Disadvantages
• Like the SWOT analysis, the 4Ps consist of a list of factors—close to alaundry list—with no clear link to firm profitability. There is no way oftelling whether one set of 4Ps chosen by a firm will be more profitable thananother.
• The 4Ps are a static framework that says little about how the Ps change withtime.
• The model is primarily for consumer products, not industrial products.• It is more oriented towards products than towards services.• The 4Ps are not necessarily all that a firm may need to attain its objectives in
a target market. For example, it has been argued that a firm also needspeople to attain its objectives and therefore there should be a fifth P forpeople (see below).
4Ps and New Games
In using the 4Ps to pursue marketing objectives, a firm has many options fromwhich to choose. Take pricing, for example. In formulating its pricing strategy,
360 Applications

a firm can choose from skimming, pricing to penetrate, everyday-low-prices,and price discrimination. In choosing the type of pricing, the firm has the optionof fixed pricing, Dutch auction, or reverse auction. Each of the components ofthe other Ps offers similar options. Therefore, the 4Ps offer plenty of opportun-ities for new games. For example, if industry firms practice price skimming afirm may decide to pursue penetration pricing in its new game.
5Ps and 7Ps
Since people play such a critical role in using the 4Ps to meet a firm’s marketingobjectives for a target market, it has been suggested that People should be a fifthP. In service industries, for example, it is difficult to separate the person whodelivers a service from the service itself and customer experience. In fact, insome cases, customers also add to the experience that fellow customers obtainfrom a service. Thus, we have 5Ps (Product, Prices, Placement, Promotion, andPeople) where the choices that have to be made about People include training,motivation, fit, etc. Some marketers take it even further, suggesting that twomore Ps ought to be added to the five, especially when services are concerned.These are the Processes that are involved in offering service, and Physical evi-dence. The latter is about giving potential customers physical evidence for whatthe service will be like, for example, using case studies, testimonials, ordemonstrations.
AVACThe AVAC framework was the subject of all of Chapter 2. Therefore we willonly very briefly restate some of the points about the framework. It gets itsname from the first letter of each of its four components (Activities, Value,Appropriability, and Change), and can be used to explore the profitabilitypotential of a strategy and more. It can be used to analyze the extent to which astrategy creates value and/or positions a firm to appropriate value created in itsvalue system, and what else the firm could do to improve its performance.
Elements of the Framework
The drivers of the four components of the AVAC are shown in Figure 13.17.
Activities
Recall that a firm’s strategy is the set of activities that the firm performs tocreate value and/or position itself to capture any value created in its valuesystem. Each activity which a firm performs, when it performs it, where itperforms it, and how it performs it determine the extent to which the activitycontributes to value creation and appropriation, and to the level of competitiveadvantage that the firm can have. Therefore the first thing to do in assessing theprofitability potential of a strategy is to identify the set of activities that consti-tute the strategy and determine the extent to which each of the activities con-tributes to value creation and appropriation. This consists of determining theextent to which each activity:
Strategy Frameworks and Measures 361

Figu
re13
.17
Com
pone
nts
of a
n A
VAC
Fra
mew
ork.

1 Contributes to low cost, differentiation, better pricing, reaching more cus-tomers, and better sources of revenue.
2 Contributes to improving its position vis-à-vis coopetitors.3 Takes advantage of industry value drivers.4 Contributes to building new distinctive resources/capabilities or translating
existing ones into unique positions and profits (including complementaryassets).
5 Fits the comprehensiveness and parsimony criteria.
Value
Next, we determine if the contributions of all the activities, when addedtogether, are unique enough to make customers prefer the firm’s products tocompetitors’ products. This is done by answering the following simplequestions:
1 Do customers perceive the value created by the strategy as unique?2 Do many customers perceive this value?3 Are these customers valuable?4 Are there any nearby white spaces?
Appropriability
The fact that a firm offers unique value to customers does not always mean thatthe firm will capture the value that it creates. Firms do not always make profitscommensurate with the value that they have created. The Appropriability com-ponent tells us whether a firm has a superior position vis-à-vis coopetitors, andwhether the firm translates the customer benefits created and its position vis-à-vis coopetitors into money. The analysis consists of asking whether:
1 The firm has a superior position vis-à-vis its coopetitors.2 The firm exploits its position vis-à-vis its coopetitors and customer benefits.3 It is difficult to imitate the firm.4 There are few viable substitutes but many complements.
Change
Change can have a profound effect on a firm’s ability to create and appropriatevalue. The extent to which a firm can take advantage of it is explored in twoparts. First, the firm’s strengths prior to the change are sorted out and adetermination is made as to which of these strengths remain strengths andwhich ones become handicaps. Second, the extent to which a firm can takeadvantage of change is explored. This is done by exploring the extent to whichthe firm takes advantage of:
1 The new ways of creating and capturing new value generated by the change.2 The opportunities generated by change to build new resources or translate
existing ones in new ways.
Strategy Frameworks and Measures 363

3 First mover’s advantages and disadvantages, and competitors’ handicapsthat result from change.
4 Coopetitors’ potential reactions to its actions.5 Opportunities and threats of environment. Are there no better alternatives?
Using the AVAC: Advantages
• Can be used to explore not only the profitability potential of a strategy butalso that of business models, business units, products, technologies, brands,market segments, acquisitions, investment opportunities, partnerships suchas alliances, functional units, corporate strategies, and ventures.
• More importantly, the framework can be used to determine which com-ponents (activities, value, appropriability, or change) have the potential togive a firm a sustainable competitive advantage. The firm can then sort outwhich activities and resources it needs to reinforce a sustainable advantageor build on. Within each component, a firm can determine which driver ofthe component constitutes a strength or weakness. Such a firm can then findways to reinforce the strengths and reverse the weakness or dampen theireffects.
• Like most frameworks, the AVAC constitutes a language and platform forstrategy discussions. It can be used as the starting point for strategic plan-ning sessions, scenario planning, new strategic move, and so on.
• Like the Five Forces, the AVAC provides a link between components andprofitability.
• The AVAC is about a firm’s performance, and incorporates both industryand firm-specific factors.
• The AVAC incorporates change.
Summary StatementA comparison of the frameworks that we have explored is shown in Table 13.2.Since the ultimate goal of most firms is to have a sustainable competitive advan-tage, we use the drivers of sustainable competitive advantage as the basis forcomparison. These are (1) industry and macroenvironmental factors (externalfactors), (2) firm-specific factors, which include both resource-based factors andposition-based factors, (3) change, and (4) link to profitability. The rationalefor choosing these variables as the basis for comparison is as follows. Sincemost firms are in business to make money for their owners, and strategy isabout winning, a strategy framework ought to have some way of linking elem-ents of the framework to profits. Moreover, we know that a firm’s performanceis a function of both industry and macroenvironmental factors as well as firm-specific factors. Firm-specific factors can be resource-based or position-based.Finally, change plays a critical role in the inability of firms to sustain competi-tive advantages.
A SWOT analysis is clearly about industry and macroenvironmental factors(opportunities and threats), and resource-based and position-based factors. TheGrowth/Share Matrix proxies industry factors with market growth rate andfirm-specific factors with relative market share. Thus, it incorporates industryfactors and position-based factors. Relative market share provides a link to
364 Applications

Tabl
e 13
.2St
rate
gic
Man
agem
ent
Fram
ewor
ks: A
Com
pari
son
Fram
ewor
kFo
r:In
dust
ry a
nd m
acro
fact
ors
(ext
erna
lfa
ctor
s)
Firm
-spe
cific
fact
ors
(inte
rnal
fact
ors)
Chan
ge (n
ewga
mes
)Li
nk to
prof
itabi
lity
Reso
urce
-bas
edPo
sitio
n-ba
sed
SWO
T a
naly
sis
Eval
uatin
g th
e st
reng
ths
and
wea
knes
ses
of a
n en
tity
orin
divi
dual
, and
the
opp
ortu
nitie
s an
d th
reat
s th
at it
face
sgi
ven
its o
bjec
tives
.
HH
H
PEST
Prob
ing
deep
er in
to t
he o
ppor
tuni
ties
and
thre
ats
that
firm
s fa
ce in
a p
artic
ular
env
iron
men
t by
exp
lori
ng t
hepo
litic
al, e
cono
mic
, soc
ial a
nd t
echn
olog
ical
fact
ors
that
cont
ribu
te t
o th
reat
s an
d op
port
uniti
es.
H
Gro
wth
/sha
rem
atri
xA
naly
zing
and
man
agin
g po
rtfo
lios
of d
iffer
ent
units
,bu
sine
sses
, pro
ject
s, et
c. Pr
imar
y va
riab
les
are
Rela
tive
Mar
ket S
hare
and
Mar
ket G
row
th R
ate.
HH
H
GE/
McK
inse
ym
atri
xA
naly
zing
and
man
agin
g po
rtfo
lios
of d
iffer
ent
units
,bu
sine
sses
, pro
ject
s, et
c. Pr
imar
y va
riab
les
are
Indu
stry
Attra
ctive
ness
, and
Bus
ines
s St
reng
th/C
ompe
titive
Pos
ition
.
HH
H
Port
er’s
Fiv
eFo
rces
Expl
orin
g th
e co
mpe
titiv
e fo
rces
tha
t ac
t on
indu
stry
firm
s, th
ereb
y de
term
inin
g th
e av
erag
e pr
ofita
bilit
y of
an
indu
stry
or
a m
arke
t.
HH
Busi
ness
Syst
ems
Expl
orin
g di
ffere
nt o
ptio
ns fo
r cr
eatin
g va
lue
at e
ach
stag
e of
a b
usin
ess
syst
em.
HH
Valu
e C
hain
Expl
orin
g th
e va
lue-
addi
ng a
ctiv
ities
at
each
sta
ge o
f the
chai
n of
act
iviti
es t
hat
firm
s pe
rfor
m in
add
ing
and
appr
opri
atin
g va
lue.
HH
Valu
eC
onfig
urat
ions
Expl
orin
g th
e va
lue-
addi
ng a
ctiv
ities
of a
val
ue c
hain
,va
lue
shop
, and
val
ue n
etw
ork.
HH
Bala
nced
scor
ecar
dM
easu
ring
the
ext
ent
to w
hich
diff
eren
t ac
tiviti
es a
rem
eetin
g a
firm
’s o
bjec
tives
, fro
m fo
ur d
iffer
ent
pers
pect
ives
. Im
plem
entin
g an
d m
onito
ring
a s
trat
egy.
HH
H
(con
tinu
ed o
verl
eaf)

Tabl
e 13
.2C
ontin
ued
Fram
ewor
kFo
r:In
dust
ry a
nd m
acro
fact
ors
(ext
erna
lfa
ctor
s)
Firm
-spe
cific
fact
ors
(inte
rnal
fact
ors)
Chan
ge (n
ewga
mes
)Li
nk to
prof
itabi
lity
Reso
urce
-bas
edPo
sitio
n-ba
sed
VR
IOEx
plor
ing
the
exte
nt to
whi
ch a
firm
’s r
esou
rces
can
giv
eth
e fir
m a
sus
tain
able
com
petit
ive
adva
ntag
e.H
HH
VID
EN
arro
win
g do
wn
the
list
of p
oten
tial c
ore
com
pete
nces
to t
hose
tha
t ar
e lik
ely
to g
ive
a fir
m a
n ad
vant
age.
HH
S3 PE F
ram
ewor
kEx
plor
ing
thos
e or
gani
zatio
nal s
truc
ture
s, sy
stem
s, an
dpe
ople
tha
t ar
e cr
itica
l to
impl
emen
ting
a pa
rtic
ular
stra
tegy
in a
par
ticul
ar e
nvir
onm
ent.
HH
H
4Ps
Gro
upin
g, in
to fo
ur g
roup
s (p
rodu
ct, p
rici
ng, p
lace
men
t,an
d pr
omot
ion)
, the
mar
ketin
g to
ols
that
a fi
rm u
ses
topu
rsue
mar
ketin
g ob
ject
ives
for
a ta
rget
mar
ket.
H
AVA
CA
sses
sing
the
prof
itabi
lity
pote
ntia
l of a
str
ateg
y, bu
sine
ssun
it, b
rand
, tec
hnol
ogy,
and
so o
n, w
ith o
r w
ithou
tch
ange
.
HH
HH
H

profitability. The GE/McKinsey framework is also about industry factors andposition-based factors. The Five Forces framework is about industry factorsand clearly provides a link between each of the forces and industry profitability.Business systems, value chain, value network, and value shop are about firm-specific factors—both resource-based and position-based. The balanced score-card is about measures and really does not say much about the industry andfirm-specific factors that impact profitability. The VRIO and VIDE analyses aregrounded in the resource-based view of the firm and clearly provide links toprofitability. Since a PEST analysis is about digging deeper into macroenviron-mental factors, it tells us something about the macroenvironmental opportun-ities and threats that a firm must face. An S3PE framework is primarily aboutpeople, and the structure and systems in which they operate; but it is also aboutstrategy and the environment in which strategy is being formulated and oper-ated. Hence the S3PE framework is about both industry and firm-specific factorsbut provides no link to profitability. The 4Ps are about a firm’s position in amarket. The AVAC incorporates all four factors: industry and macroenviron-mental factors, firm-specific factors, which include both resource-based factorsand position-based factors, change, and link to profitability.
Some Financial Measures27
Since strategy case analysis often involves numbers, it is worthwhile reviewingsome elementary but useful financial measures (Table 13.3). A firm’s profits areits revenues minus costs. Managers and financial analysts regularly track theprofitability of firms. Sooner or later, most firms have to be profitable. Whatmanagers mean by profits often differs from what economists call profits.Economists’ definition of profits uses opportunity costs rather than straightaccounting costs. For economists, costs are not just straight accounting costsbut the cost of what is forgone by not using the inputs some place else wherethey could have fetched more money. Another measure which analysts andfirms track carefully is gross profit margin. This is a measure of the extent towhich a product’s revenues cover its variable costs and what is left over con-tributes towards covering fixed costs and generating a profit. The higher aproduct’s profit margin, the more of that product the firm would want to sell,since the product covers not only its variable cost but also contributes towardscovering fixed costs and generating a profit. Closely related to profit margins isthe breakeven point. The breakeven point is the quantity at which fixed andother upfront costs have been recovered. The breakeven time is the time that ittakes to reach the breakeven point.
When a firm makes payments for salaries, supplies inventories and otheraccounts payable, there should be cash available in deposits at a financial insti-tution somewhere to cover the payment made to these creditors. Thus, it isimportant to make sure that cash inflows exceed cash outflows. Cash flow is thedifference between cash inflows and cash outflows. Note that although profitsare highly correlated with cash flows, a firm can be profitable and still havenegative cash flows. Another measure of a firm’s performance is its stock price.This is the net present value of the firm’s expected future cash flows. It is areflection of how the market expects the firm to perform in the future. Anothermeasure is earnings per share. This is the after-tax profits that are available to
Strategy Frameworks and Measures 367
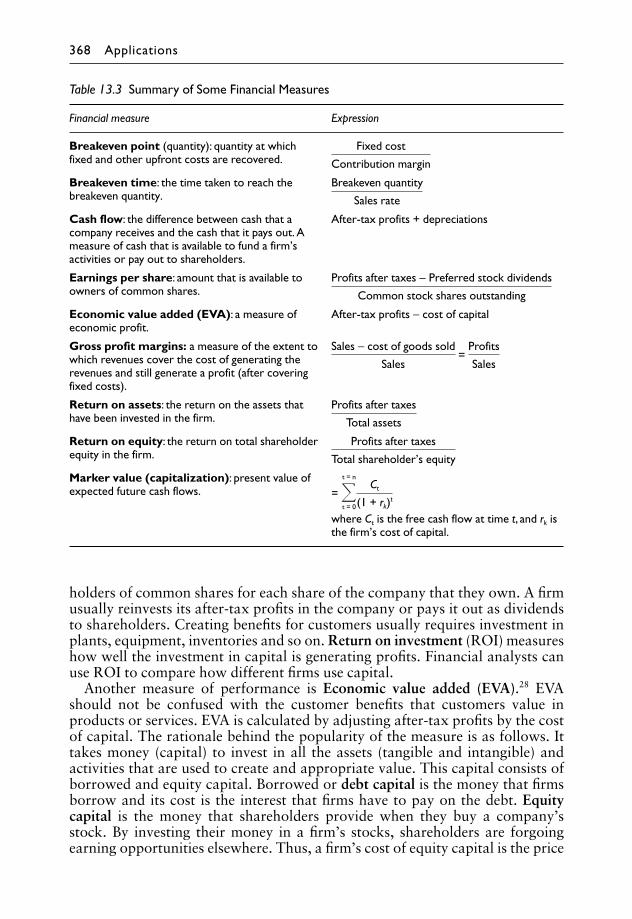
holders of common shares for each share of the company that they own. A firmusually reinvests its after-tax profits in the company or pays it out as dividendsto shareholders. Creating benefits for customers usually requires investment inplants, equipment, inventories and so on. Return on investment (ROI) measureshow well the investment in capital is generating profits. Financial analysts canuse ROI to compare how different firms use capital.
Another measure of performance is Economic value added (EVA).28 EVAshould not be confused with the customer benefits that customers value inproducts or services. EVA is calculated by adjusting after-tax profits by the costof capital. The rationale behind the popularity of the measure is as follows. Ittakes money (capital) to invest in all the assets (tangible and intangible) andactivities that are used to create and appropriate value. This capital consists ofborrowed and equity capital. Borrowed or debt capital is the money that firmsborrow and its cost is the interest that firms have to pay on the debt. Equitycapital is the money that shareholders provide when they buy a company’sstock. By investing their money in a firm’s stocks, shareholders are forgoingearning opportunities elsewhere. Thus, a firm’s cost of equity capital is the price
Table 13.3 Summary of Some Financial Measures
Financial measure Expression
Breakeven point (quantity): quantity at whichfixed and other upfront costs are recovered.
Fixed cost
Contribution margin
Breakeven time: the time taken to reach thebreakeven quantity.
Breakeven quantity
Sales rate
Cash flow: the difference between cash that acompany receives and the cash that it pays out. Ameasure of cash that is available to fund a firm’sactivities or pay out to shareholders.
After-tax profits + depreciations
Earnings per share: amount that is available toowners of common shares.
Profits after taxes − Preferred stock dividends
Common stock shares outstanding
Economic value added (EVA): a measure ofeconomic profit.
After-tax profits − cost of capital
Gross profit margins: a measure of the extent towhich revenues cover the cost of generating therevenues and still generate a profit (after coveringfixed costs).
Sales − cost of goods sold
Sales =
Profits
Sales
Return on assets: the return on the assets thathave been invested in the firm.
Profits after taxes
Total assets
Return on equity: the return on total shareholderequity in the firm.
Profits after taxes
Total shareholder’s equity
Marker value (capitalization): present value ofexpected future cash flows. = �
t = n
t = 0
Ct
(1 + rk)t
where Ct is the free cash flow at time t, and rk isthe firm’s cost of capital.
368 Applications

appreciation and dividends that shareholders could have earned if they hadinvested their money in another asset (for example, a portfolio of companies)that is as risky as the firm whose stocks they bought. Effectively, since capitalcosts money, this cost of capital should be taken into consideration when meas-uring how well a firm is performing as it uses capital to generate profits. EVA istherefore after-tax profits adjusted by the cost of capital that is used to generatethe profits.
Economic value added (EVA) = Operating profits − Taxes − Cost of capital
where
Cost of capital = total capital used × weighted average of cost of debt andcost of equity.
Strategy Frameworks and Measures 369


Cases
Case 1: The New World Invades France’s Terroir
Case 2: Sephora Takes on America
Case 3: Netflix: Responding to Blockbuster, Again
Case 4: Threadless in Chicago
Case 5: Pixar Changes the Rules of the Game
Case 6: Lipitor: The World’s Best-selling Drug (2008)
Case 7: New Belgium: Brewing a New Game
Case 8: Botox: How Long Would the Smile Last?
Case 9: IKEA Lands in the New World
Case 10: Esperion: Drano for Your Arteries?
Case 11: Xbox 360: Will the Second Time be Better?
Case 12: Nintendo Wii: A Game-changing Move
Part V


The New World Invades France’sTerroir
The French government official could not believe that there was talk of onemore threat to his country’s dominance of the global wine industry. First, it wasthe so-called invasion by New World wine producers. Now there was talk oftransgenic wine. Scientists had unraveled the genetic secrets of the pinot noirgrape that was used to produce the world’s finest wines, making it possible tonow produce the grape in places where cultivation had been inhospitable.1
What would be next? Should France be worried about the New World’sinvasion of this ancient European industry? How about transgenic grapes?What should the country do?
The Wine Industry in 2008In 1999, California’s E&J Gallo was the world’s largest producer by volumewith a 1% market share.2 The region of Bordeaux, France alone had over12,000 producers while Italy had over a million. But in the USA, the five largestfirms had a 62% share, in Australia the top four firms had an 80% share, whilein Chile the top five firms had a 50% share. In the USA, 45% of wine was soldin supermarkets while in the Netherlands, the number was over 60%.3 At thelow end of the market, many producing countries drank their own, and NewWorld producers were making inroads at large importers such as the UK. At themiddle of the market, Europeans were ceding dominance to New World produ-cers such as Australia (in Britain, for example). At the high end, Old Worldfirms still dominated.
The Rise and Dominance of French WineThe history of wine may go as far back as 6,500 years in Greece whereresearchers say wine was first produced.4 It would become such an integral partof life in the Mediterranean and early Europe that even monasteries grewgrapes, and made wine. In the nineteenth, twentieth, and early twenty-firstcenturies, France dominated the wine world. It had the largest market share ofany country, by value, and the words fine wine had come to be associatedwith France. This dominance is usually attributed to several factors. First,France had the terroir—that unique mix of natural factors such as the soil,rainfall, temperature, humidity, altitude, slope of terrain, and orientationtowards the sun—that held one of the secrets to producing the right grapes forfine wines. Second, there was a lot of local demand for wine. Whereas in the
Case 1

USA, prohibition made the sale of wine illegal, in Europe, it was just anotherbeverage that most people drank and that had become part of many liturgicalservices. Third, there was pasteurization of wine, invented by France’s ownLouis Pasteur, which enabled wine to last much longer. The Fourth factor wasthe series of innovations that led up to mass production of glass bottles and theintroduction of the cork stopper. Wine could be pasteurized, put in bottles, andcorked to last until someone wanted to drink it. The fifth factor was a series ofinnovations in transportation—canals, railways, steamers, horse-driven carts,and later, automobiles—which enabled wine produced in one region to betransported to other regions for consumption. Ironically, these transportationinnovations gave birth to fraud.5 Before the transportation innovations, winewas usually consumed locally and consumers had a better chance of knowingwho produced what; but with the innovations, opportunists could producewine anywhere and claim that it came from a more reputable region.
The Sixth factor was a different type of innovation. Because there were hun-dreds of thousands of producers, each with a different quality of wine, it wasdifficult for consumers to tell who was producing what, and which producerswere making the right claims. In preparation for the 1855 World Expositionof Paris that he had conceived, Emperor Napoleon III ordered a group ofwine producers in the Bordeaux region to classify vineyards in the areainto five groups, as a function of quality.6 They came up with the premiers crus(first growth), deuxièmes crus (second growth), trosièmes crus (third growth),quatrièmes crus (fourth growth), and cinquièmes crus (fifth growth). This sys-tem simplified customers’ choices, and both customers and producers liked it. In1935, the French government formalized most of it in the form of the Appella-tions d’Origine Contrôlée (AOC) laws which stipulated not only what crucould come from what region, but also what could be put into what wine, howit could be made and labeled, the alcohol content of different wines, what typesof grapes could be grown in what region, and what type of grape varieties couldgo into what wine category. Growers could not use irrigation systems since thatwould temper with the terroir. Only grapes from the region specified on a bottlecould be used to make the wine in the bottle. The idea was to protect the goodname of each region and assure customers that they were getting what theybelieved they were getting. Several European countries established similar laws.
Later, other wine regions of France were officially classified as the VinDélimité de Qualité Superieure (VDQS). Right below VDQS wines were the Vinde Pays, and Vin de Table. The hierarchy of wines is summarized in Exhibit 1.1.
Exhibit 1.1 Hierarchy of French Wines. (2005 market shares are shown in percentages.)
1. Appellation d’Origine Contrôlée (AOC, 53.4%): Wines that follow the strict AOC laws andclassifications. High end wines.
2. Vin Délimité de Qualité Superieure (VDQS, 0.9%). Do not conform to the AOC rules. Used to classifywines from smaller areas, or as a “waiting room” for potential promotion to AOCs. Middle wines.
3. Vin de Pays (33.9%). Subject to very few or none of the AOC restrictions. Lower quality too. Low-end wines. Region within France is specified.
4. Vin de Table (11.7%). Even fewer restrictions. Only has to show the producer and the designationthat it is from France. Lowest end wines.
Source: Retrieved June 21, 2008, from http://en.wikipedia.org/wiki/French_wine.
374 Cases

Many farmers grew and sold their grapes, by weight, to local winemakers orformed cooperatives to make the wine. Because some of the farms had beeninherited by more than one sibling from one generation to the other, manyfarms tended to be very small. Some large growers made their own wine. A lotof the wine was then sold to middle people who then resold it to consumers orother middle people.
The Rise of the New World WinemakersThe New World winemakers came from Argentina, Australia, Canada, Chile,New Zealand, South Africa, and the USA. Many of these players were vertic-ally integrated backwards into growing their own grapes, and because theircountries had inexpensive widely available land compared to the old continent,they could own large vineyards. Many of them used drip irrigation systems, notpermitted by France’s AOC rules, not only to bring more land into productionbut also to control the variability of grape quality and yield better.7 They alsoused mechanical harvesters and experimented with different kinds of fertilizer.In making wine, the New World winemakers used large steel tanks, controlledby computers, rather than the small oak barrels of the Old World. To obtain theoak taste of wine from oak barrels, they added oak chips to the steel tanks, apractice seen as repulsive by some French.8 Effectively, these new firms couldexperiment with lots of things that Old World firms were not allowed to pursue.They were constantly pursuing new ways of making and marketing wine. Forexample, around 1999, Australia produced 20% of the world’s scientific paperson viticulture and oenology.9
The biggest marketing innovation, pioneered in California, was puttingthe grape variety on the wine label.10 This was in contrast to the labeling speci-fied by the AOC and related laws in Europe. Customers could now worrywhether they were buying a chardonnay, pinot noir, Chablis blanc, cabernet, orsauvignon rather than worry about the rather intimidating regions in Franceand the different categories in each region. Moreover, the European Unionwould later find that it was illegal for New World firms to use the names ofregions in Europe, such as Champagne, to refer to wine from their own coun-tries. New World winemakers could also brand their products. A good brandgave consumers some type of guarantee that they would get what they paid for.It was also a good starting point for beginners. Although Old World Cham-pagne producers had some good brands, many winemakers did not have widelyrecognizable brands à la Coca Cola. New World winemakers were also verti-cally integrated into distribution, making it easier for them to experiment withnew brands, products, and labels.
The pièce de résistance of the New World marketing activities came in a 1976blind-tasting challenge set up by British wine merchant Steven Spurrier.11 In thischallenge, that would later be called “the Judgment of Paris,” 15 of the mostinfluential French wine critics were invited to a blind tasting of top wines fromFrance and California. They used white wines made from chardonnay grapesand red wines from cabernet sauvignon. The results of the taste astonishedeveryone including the tasters: California wines won in both white and redwines. The French protested, arguing that the event had been rigged. In arematch, two years later, California still won. In any case, France’s worldwide
The New World Invades France’s Terroir 375

market share had begun to drop. For example, from 1994 to 2003, the marketshare of French wine sold in the USA fell from 26% to 16% and from 37% to23% in Britain.12 See also, Exhibit 1.2.
Other Threats to France’s PositionBeyond the threat from New World winemakers, there were others. To reducealcohol consumption for health and public safety reasons, France had intro-duced a law in 1991 that forbade winemakers from sponsoring advertisementsthat used anything but the most basic characteristics of their products.13 From1999 to 2007, wine consumption in France fell from 32.2 million hectoliters to29.9, while the share of French people drinking wine each day had fallen from30% to 23% in the ten years to 2004.14 In the mid-1960s, the average French-man had drunk 130 bottles of wine but by the mid 2000s, the number haddropped to about 75 bottles.15
Only 5% of the wine consumed in France was imported. This led some tospeculate that other countries might want France to reciprocate and importmore. Then there was always the threat posed by China and even Africa. Ifindeed genetically engineered grapes could bring all sorts of land into produc-tion, and all the experimentation undertaken by New World winemakers foundcheaper and faster ways of making wine, then the old continent would have tocompete with more than just the New World. It might also be possible to raisethe levels of those ingredients in wine—such as resveratrol, quercetin, andellagic acid—by genetically inserting the right genes in the right grapes, takingwines to a different level. These grapes may even be grown in deserts.
Was the threat to the Old World wine industry anything to worry about?What should the French government do if anything? What would happen toFrance’s advantage from its terroir if, with transgenic grapes, just about any soilanywhere could be brought into cultivation? Was it time to scrap the AOCrules? France’s wine sales in China had been growing fast but the question was,for how long? Would France have to move from the traditional production pushto more marketing pull?
Exhibit 1.2 World Wine Exports in 1999 and 2007
Exporter 1999 2007
Million hectoliters (%) Million hectoliters (%)
European Union (EU) 10.9 51 18.4 39Argentina 1.0 5 3.5 8United States 2.8 13 4.1 9South Africa 1.3 6 5.0 11Chile 2.5 12 6.1 13Australia 2.6 12 7.8 17Others 0.3 1 1.6 3Total 21.0 100 47.0 100
Source: Kosko, S. (2008). World Markets and Trade: Wine. United States Department of Agriculture. Foreign AgriculturalService.
376 Cases

Sephora Takes on America*
David Suliteanu, CEO of Sephora USA, rubbed his temples as he contemplatedthe materials in front of him. All day long he had been reviewing the 2007performance of the US beauty industry and his company’s place in it becausesome executives from Sephora’s parent company, LVMH Moët Hennessy LouisVuitton, would be visiting the following week to discuss Sephora’s competitivestrategy. LVMH executives visited to discuss Sephora’s performance periodic-ally, but David felt added stress for this meeting because of rumors that hadbeen circulating recently speculating that LVMH viewed Sephora as a noncoreasset and was considering a sale.
Launched in the USA in 1998, Sephora took the US beauty industry by stormwith its unique retail concept that combined a wide assortment of brands andproducts with distinctive store designs and knowledgeable sales consultants in alow-pressure sales environment. Sephora offered customers a choice of morethan 250 brands as well as the company’s own private label across a range ofproduct categories that included skin care, make-up, fragrances, bath & body,and hair care. Most interesting, however, was the company’s model whichallowed customers to “try before they buy” in a hands-on, self-service shoppingenvironment.
Company HistorySephora was founded in France in 1969. In 1993, Dominique Mandonnaud, amajor shareholder in Altamir, the holding company for Shop 8, bought Sephorafrom the UK-based drugstore, Boots, for $61 million (360 million francs).Mandonnaud, who was also chairman and chief executive officer of the French-based Shop 8 beauty and cosmetic retailer, merged his 11 Shop 8 boutiqueswith the 38-store Sephora perfumery chain. The new entity was given themore recognizable Sephora name but kept the Shop 8 stores format. Thisformat consisted of having spacious shopping areas and self-service shoppingwith beauty products grouped by type rather than by brand.1 By the end of1996, Mandonnaud had opened a 16,200 square foot Sephora superstore atthe Champs-Elysees in Paris, France and given the brand major worldwide
* This case was written by Kathryn Morrison, Jason Paradowski, Stefan Pototschnik, MatthewSmucker, and Spiro Vamvaka, under the supervision of Professor Allan Afuah as a basis forclass discussion and is not intended to illustrate either effective or ineffective handling of abusiness situation.
Case 2

publicity. With over 100 employees and 10,000 visitors stopping by each day,Sephora aimed to create a total beauty experience featuring beauty-relatedadvertising, online information, literature, and exhibits.2
The company continued to expand throughout the mid-1990s, including inthe USA and in Europe. However, by 1997, Mandonnaud was ready to retirefrom the business and along with his partners decided to sell. Luxury retailerLVMH (Louis Vuitton, Moët, Hennessy) then entered the scene and acquiredSephora for �344 million. Under LVMH, the company quickly doubled itsnumber of stores, and by the end of 1997, Sephora’s sales had increased toFRF 2 billion.3
In 2000, Sephora hired David Suliteanu as the US CEO. With his experienceat Home Depot where he had been Group President/Diversified Businesses, hewas charged with the US market expansion. In 2008, Sephora was France’sleading chain of fragrance and cosmetics stores, as well as the second largestchain in Europe with a total of 420 stores located in nine countries. It operatedmore than 190 stores in North America, with annual sales in the US market ofover $750 million.4 Sephora also boasted the world’s “top beauty website,”Sephora.com.
Overview of the Beauty Products Industry“Personal care products” have long been a part of human civilizations withevidence of cosmetics dating back to as far as 4,000 BC in Egypt. Since thattime, the industry evolved with fashion trends and new consumer demands, butit wasn’t until the twentieth century that the cosmetics industry began to takeoff with the manufacture of lipstick in 1915.5 The 1920s brought the launch ofvarious dime and chain stores throughout the USA, which helped boost thedistribution and appeal of cosmetics. The economic boom following World WarII further stimulated growth in the cosmetics industry, which continued toevolve with a wide variety of new products. In the eleven years from 1988 to1999, US cosmetics and fragrance stores experienced strong growth averagingapproximately 5% per year.6 In particular, the US economic boom of the late1990s boosted the market with strong growth rates of 4.6% in 1998, 5.5% in1999, followed by 10.2% in 2000.7 Following this boom, growth droppedalong with the slowdown in the US economy. Between 2000 and 2003, thetroubles in the US economy had an adverse impact upon the industry as con-sumer spending declined.
Competition in the industry was based on image, price, range and quality ofproducts, level of service, and location. Products included mass market, privatelabel, professional and prestige brands which were sold everywhere from stand-alone boutiques and department stores to drug stores and mass retailers (i.e.WalMart).
Despite many changes in the industry, mass merchandisers remained the larg-est outlet for cosmetic and beauty products in the US with just under 30% of themarket, followed by food stores, drug stores, and department stores. Specialtybeauty, cosmetic and fragrance stores such as Sephora were estimated toaccount for 10% of all cosmetic and toiletry sales in the USA.8 Within thissubsegment, the top four participants held a market share of less than 40%,reflecting the generally fragmented nature of the industry.9
378 Cases
Cosmetics Retailing and Sephora’s New GameIn 2008, the overall value chain for beauty products consisted of four primaryactivities: design and development, manufacturing, distribution, and retailing.While Sephora sold and marketed its own line of cosmetics, it primarily per-formed the retail portion of the value chain.
Prior to the arrival of Sephora stores in the USA, there were two primarymeans for consumers to purchase beauty products, and specifically cosmetics.The first was through “low-end” purchasing at self-service retailers such aspharmacies, convenience stores, and mass retailers. Mass-marketed, typicallyinexpensive brands were displayed on a shelf, but customers were unable tosample products before purchasing them. Little or no customer assistancewas available, and selection was limited. The experience was primarily one ofconvenience and price.
Department stores sat on the opposite end of the retail spectrum as the otherprimary outlet for purchasing cosmetics in the USA. These stores, which weretypically located in shopping malls, maintained brand-specific cosmetics coun-ters staffed with sales personnel who provided individual attention to eachcustomer. Customers were typically unable to serve themselves or sample prod-ucts without the assistance of a salesperson, leading to a somewhat high-pressure sales environment. Each brand’s sales counter was often staffed withthe brand’s own employee. While each brand’s sales counter provided a widevariety of brand-specific cosmetics, there were a limited number of brandsavailable within each department store. In addition, the customer had to go to aseparate counter for each individual brand in order to purchase or try multiplebrands.
Sephora’s assisted self-service model fitted nicely between these two retailingmodels, combining the best of each extreme. Upon entering a Sephora outlet,customers would see a wide variety of more than 200 brands, openly displayedfor customer sampling and a well-trained sales staff standing ready to provideassistance with any product.
Like department stores, there was a knowledgeable and helpful sales forceavailable to provide assistance; but unlike department stores, Sephoraemployees did not promote one specific brand and were trained to make thesales experience welcoming and less aggressive. Perhaps most significantly, allproducts were openly displayed for sampling and testing, and make-up removerwas available throughout the store, encouraging customers to freely try mul-tiple products, further differentiating Sephora from other cosmetics purchasingenvironments.
Since cosmetics and perfumes were “experience” products, the Sephoramodel provided significant value to customers, and was a good fit for theproducts themselves. Stores even had specialized lighting meant to recreatenatural daylight inside the stores, further aiding and enabling customersampling.
Increased revenue came from multiple sources. First, customers were morelikely to try multiple brands, increasing the probability that they would find andpurchase a product that matched their needs. Additionally, customers mightpurchase more products since so many products (200+ brands) were availablein one location. Notably, product-sampling allowed for ease of comparison
Sephora Takes on America 379

shopping, which was unique to Sephora. The presence of a well-trained salesforce that was knowledgeable of all brands and products, rather than specific-ally focused on one brand, provided additional value by ensuring that cus-tomers saw all options available to them.
At convenience stores, comparison-shopping was limited to price compar-isons and brand advertising claims, since product sampling was not available.At department stores, a customer could not try products from multiple brandswithout waiting for assistance at each individual brand’s counter, which typic-ally restricted the customer’s ability to compare products.
In addition to the assisted-self service brick and mortar stores, Sephora hada significant online sales business. Through its online presence, Sephoraattempted to create an all-inclusive “beauty” world, with advertising, advice,and literature available to consumers. In-store customers were referred toSephora’s website, keeping them involved in the company well after leavingthe store.
In 2006, it was announced that Sephora would open a “store-within-a-store”concept within J.C. Penney department stores; and by mid-2007 it had storeswithin 39 J.C. Penney stores. It also became the exclusive seller of beauty prod-ucts for the chain, as well as for Penney’s website (JCP.com). Some analystsestimated that the move might benefit J.C. Penney, a mid-tier department storethat wanted to upgrade its image. In fact, “J.C. Penney’s new campaign, withthe slogan ‘Every Day Matters,’ built on the retailer’s efforts to convince shop-pers that it had shed its dowdy image and become a stylish retailer stocked withfashionable merchandise.”10
Competitors
Ulta Salon, Cosmetic & Fragrance, Inc.
Ulta Salon, Cosmetic & Fragrance, Inc. (Ulta) was founded in 1990 by DickGeorge, using $12 million of venture capital.11 George, a former president ofOsco Drug, had studied the shopping habits of women and realized that therewas a great opportunity in the beauty product market. Women, who used up to12 different beauty products each day, had to go to as many as three differentstores to buy prestige beauty products, mass-market products, and salon prod-ucts. George’s vision was that Ulta would make all of these products availablein one store, and offer salon and spa services as well. In this way, Ulta’s storeswould serve as relaxing retreats for the middle- to upper-class women who wereits target customers.
When Ulta opened its first location, its value consisted of offering the widestrange of beauty products and fragrances possible at a discounted price. It dis-counted items as much as 50% from suggested retail prices, and even offeredto match prices from other retailers, including low-cost competitors such asWal-Mart.12
In keeping with this strategy, Ulta avoided large shopping malls and insteadlocated its stores in strip malls with convenient parking. This strategy provedsuccessful, and by 1995 Ulta operated 50 stores employing 800 people.13 Salesfor that year had doubled from 1994 levels, and were expected to double againthe next year. Such success could not continue indefinitely, however, and by
380 Cases

1999, increased competition in the beauty industry motivated Ulta to change itsstrategy.
In 2000, Ulta’s new president, Lyn Kirby, started making moves to repositionUlta in the market and move away from the discount strategy. Stores wererenovated and redecorated to provide a more luxurious atmosphere, more pres-tigious product lines were added, and store employees were educated so thatthey could provide beauty expertise if a customer needed assistance. Thesechanges proved successful and Ulta kept growing, from 129 stores and sales of$423 million in 2003 to 249 stores and sales of $912 million in 2007 (Exhibit2.1).14 In October of 2007, Ulta went public in a well-received IPO that raisedmore than $153 million and is now traded on the NASDAQ.15
Macy’s, Inc.
Macy’s marketed most of its cosmetics using the standard department storemodel. However, in 1999 it tried to offer an alternative sales model whichcaused Sephora to file a lawsuit against it. Macy’s had opened a number of“Souson” cosmetics stores which utilized an “open-sell” model, and in prepar-ation to open these stores, Macy’s employees had gone so far as to visit Sephorastores with cameras and sketch pads in order to copy the store’s look.
Sephora’s lawsuit claimed that Macy’s had infringed on their distinctive tradedress and could make shoppers think that the Souson stores were owned oroperated by Sephora.16 A judge concluded that the lawsuit had enough merit toissue a preliminary injunction freezing the further expansion of Souson storesuntil the lawsuit was resolved.17 The lawsuit was eventually settled out of courtand terms were not disclosed.
Bath & Body Works, Inc.
Founded in 1990 in New Albany, OH, Bath & Body Works, Inc. (BBW)expanded rapidly throughout the 1990s, and by 2008 it had become the largestcompetitor that operated exclusively in the beauty, cosmetics, and fragrancestore industry.18 BBW offered a wide variety of natural skin, fragrance, aroma-therapy, and spa products. BBW did not offer brand-name designer products,but instead focused almost exclusively on private-label products offered underthe BBW name.
In 2003, BBW acquired the rights to the C.O. Bigelow name, an apothecary
Exhibit 2.1 Comparison of Industry Competitors in2007
Competitor Stores US sales ($million)
US Total
Sephora 177 756 825Ulta 249 249 912Bath & Body Works 1,592 1,592 2,494Macy’s 850 850 26,313
Sephora Takes on America 381

that had operated in New York’s Greenwich Village for over a century, andpositioned stores with this name to target the high-end market.19, 20 These storesfeatured an open-sell sales approach and even had sinks available where cus-tomers could wash off products before they try others. In 2008, BBW operatedover 1,500 stores in the USA, and planned to expand the C.O. Bigelow name to150 stores nationwide.
Where to Go from Here?David sat back, took a deep breath, and reflected on Sephora’s position in thebeauty products market. While Sephora changed the game when it created the“open-sell” approach to perfume and cosmetics, it was in danger of becoming avictim of its own success. Many other competitors had since entered the marketusing the same approach and selling similar products. In fact, Sephora’s closestcompetitor, Ulta Salon, went significantly beyond the products sold by Sephoraand offered salon and spa services to its customers. David was also concernedabout the company’s recent decision to partner with J.C. Penney. While thismove could rapidly and significantly increase Sephora’s potential customerbase, he worried that J.C. Penney’s value-based competitive position woulderode the luxury-based position of Sephora and could hurt business in the longrun. How could Sephora maintain its momentum in this highly competitiveindustry? Should it try to expand its services to match those of Ulta? Also, wasthe move into J.C. Penney stores a wise one or would it serve to distanceSephora from its core consumers? Then finally, and most importantly, wasthere a new game that Sephora could play that would change the industry againand allow the company to take control of the market?
382 Cases

Netflix: Responding to Blockbuster,Again*
Reed Hastings reflected on the first half of 2008 as he drove through Los Gatos,CA on his way to Netflix headquarters. Netflix was still a growing and profit-able company but several threats loomed on the horizon. Late in 2006, Block-buster Entertainment had revamped its online movie rental site, renaming itBlockbuster Total Access. The commercials for Blockbuster Total Access wereclearly aimed at stealing customers from Netflix.1 At the same time, new tech-nology offered the opportunity to have movies delivered to customers directlythrough their cable television provider or over their computer. Either Block-buster or this new technology could make the Netflix business model obsolete.Indeed, these new technologies led Business 2.0 to label Reed Hastings one of2006’s “10 People Who Don’t Matter,” citing the availability of moviesthrough cable or Internet as the future of movie rental.2
Reed wanted Netflix to be more than the midpoint between brick-and-mortarrental stores and downloaded movie rentals. He knew he would be spending alot of time in the near future reviewing and updating the Netflix strategy to dealwith these threats. They had several initiatives in place, but would these beenough to overcome the competition and continue the growth of the companyhe founded?
Movie Rental before NetflixIn 1977, the first brick-and-mortar video rental store opened in a 600 squarefoot storefront on Wilshire Boulevard in Los Angeles.3 At that time, only 50video titles from 20th Century Fox were available on Betamax and VHS forconsumers to rent. However, business was strong enough for the businessowner, George Atkinson, to add 42 affiliated stores within 20 months. Thebusiness was renamed The Video Station, and Atkinson announced that hewould start franchising the stores. The Video Station paved the way for thou-sands of other video rental stores, including Blockbuster Video, which openedits first store in Dallas, Texas in 1985. Within three years, Blockbuster Videocaptured the top video retailer spot in the USA with more than 500 stores andrevenues exceeding $200 million.4
Video rental stores quickly discovered that rental revenues roughly followed
* This case was written by Christian Chock, Tania Ganguly, Chad Greeno, Julie Knakal, andTony Knakal under the supervision of Professor Afuah as a basis for class discussion and is notintended to illustrate either effective or ineffective handling of a business situation.
Case 3

Pareto’s rule where 80% of the revenues were driven from 20% of the videotitles. Therefore, for the 4,000–5,000 titles in stock at a typical store, most shelfspace was dedicated to displaying multiple copies of new release, “hit” movies.5
The dynamics of the industry shifted significantly in the spring of 1997 withthe introduction of the DVD-video format. The DVD player passed the 10%adoption rate milestone by late 2000 making it one of the most rapidly adoptedconsumer electronics products in history. By 2005, the DVD format woulddominate the global recorded video sales and rental market with 91.8% marketshare.6
In 1999, while Netflix and movie rental through the Internet and snail mailwere still new, Blockbuster held a 24% market share in this $18.5 billionindustry.7
Blockbuster continued to lead the industry in market share in 2006 withapproximately 35% of the market.8
Netflix’s Entry into RentalsThe size and weight of the physical DVD facilitated shipping videos directly tocustomers’ homes, and a new branch of the video retailing industry began withthe founding of Netflix. Founded in 1997 by Marc Randolph and Reed Hast-ings, Netflix began offering DVD rentals requested over the Internet anddelivered through the mail in 1998. The initial business model charged a fee perrental, as was typical of brick-and-mortar stores at the time. By late 1999,Netflix had changed to a subscription fee that allowed subscribers to rent asmany videos as they wanted on a monthly basis.9 It made various subscriptionplans available to subscribers that allowed customers to determine how manymovies they wanted to have at their home at a time. This allowed Netflix todifferentiate customers by how often they watched rented movies. The subscrip-tion model eliminated aggravation related to due dates and late fees. Indeed,Reed Hastings cited the unlimited-use-for-one-fee model used by his health clubas one of the inspirations for Netflix’s subscription model.10 In February 2003,Netflix surpassed the one million subscriber mark, landing it firmly at the top ofthe online DVD rental industry.
Through Netflix’s website, subscribers could create a queue of movies thatthey wanted to rent. These movies could be prioritized to reflect when thesubscriber wanted to receive each film. Whenever a subscriber returned a movievia a prepaid mailer, the next movie in the queue was sent out. Users couldcreate a large rental queue and not be required to visit the website while theyviewed movies sent from their queue, or they could update their queue everytime a movie was returned.
The Netflix subscription-based service offered several advantages over thebrick-and-mortar rental store model that had been prevalent in the industry. Byhaving a few centralized shipping centers, rather than a large number of store-fronts, Netflix was able to pool resources and offer a wider range of titles thanpossible at a single rental store. Operating a few centralized shipping centersalso offered several cost advantages over operating stores in every neighbor-hood. Netflix was aggressive in recruiting new customers. It increased its mar-keting expenses every year and its number of customers increased every year(Exhibit 3.1).
384 Cases

Cinematch Recommendations System
To help customers identify which titles may interest them, Netflix used a rec-ommendation engine called Cinematch. Cinematch used customer movie rat-ings to predict what other movies customers might be interested in. About 60%of movies requested through Netflix were identified through this recommenda-tion system.11 The combination of a large movie selection and a recommenda-tion system to help customers find movies they might like appeared to increasethe number of movie titles that customers rented. In June of 2006, Netflix hadan inventory of 60,000 titles and on any given day 35,000 to 40,000 of thesetitles were rented by Netflix customers.12
Netflix even released some independent films that were not popular enoughfor a traditional distribution contract through its Red Envelope Entertainmentdivision. When video stores only stocked 4,000–5,000 titles, these movieswould not have been popular enough to justify the required shelf space. WithNetflix distribution centers that served a larger number of customers and arecommendation system to help those customers find titles that may interestthem, a market for these movies was created.13
In October 2006, it offered the “Netflix Prize” of up to one million dollars toanyone that could substantially improve its existing recommendation algo-rithm.14 Netflix had also rolled out a Netflix Friends feature that let users see
Exhibit 3.1 Summary of Netflix’s Income Statements ($US millions, except where indicated)
FY 2007 FY 2006 FY 2005 FY 2004 FY 2003 FY 2002
Total subscribers at end ofperiod (1,000 people)
7,479 6,316 4,179 2,610 1,487 857
Gross subscriber additionsduring period (1,000 people)
5,340 5,250 3,729 2,716 1,571 1,140
Subscriber acquisition cost ($/customer)
40.88 42.96 38.77 37.02 32.8 32.83
Total revenue 1,205.34 996.66 682.21 500.61 270.41 152.81Cost of revenue, total 785.74 626.06 464.55 331.71 179.01 97.5Gross profit 419.6 370.6 217.66 168.9 91.4 55.3
Total selling, general, andadmin. expenses
274.93 266.21 185.72 122.64 70.25 51.35
R&D 67.7 44.77 30.94 29.47 17.88 14.62Depreciation/amortizationTotal operating expense 1,114.18 932.25 679.22 481.26 265.94 163.48Operating income 91.16 64.41 2.99 19.35 4.47 −10.67Interest Income (expense), netnonoperating
20.34 15.9 5.35 2.42 2.04 −10.28
Income before tax 111.5 80.32 8.34 21.78 6.51 −20.95Income after tax 66.95 49.08 42.03 21.59 6.51 −20.95Net profit margin 4.90% 6.20% 4.30% 2.40%
Source: Netflix’s annual financial statements.
Netflix: Responding to Blockbuster, Again 385

what their friends were renting and how they rated different movies. This fea-ture enabled users to create communities of movie watchers through the NetflixWeb page. The friends feature utilized past user ratings of users on Netflix,taking advantage of its longer history in the online rental business.
Watch Now Feature
In June of 2007 Netflix added a “Watch Now” section to their website. This taballowed Netflix subscribers to have movies streamed to their computer to watchinstantly. Only about 2,000 nonrecent movie titles and some current televisionseries were available through this feature at launch, a much smaller selectionthan available for rental through the mail.15
Subscription Plans
In 2007, Netflix offered a range of subscription choices, each allowing thecustomer a different number of movies that could be simultaneously rented.These ranged from a basic plan allowing up to two rentals per month, rentedone at a time, to a plan allowing four rentals out at one time with unlimitedtotal monthly rentals. Each plan also included a varying amount of instantviewing hours that could be used to have movies streamed directly to the cus-tomer’s computer. The 2007 prices are summarized in Exhibit 3.2.
Early Competition with Netflix
Wal-Mart
The world’s largest retailer, Wal-Mart, entered the online DVD rental market in2002, with a catalog of over 12,000 titles from which customers could choose.The system was essentially the same as that offered by Netflix, with customerscreating a list of titles they wanted to see, and then ordering them online, withshipping by mail. Its subscription rates undercut Netflix by about $1, with athree movies rented at any one time DVD package costing $18.86.16 Executivesat Netflix predicted that Wal-Mart could only guarantee overnight deliverywithin a limited radius of its Georgia distribution center, and would have tosettle for three- to five-day delivery for the rest of the country.17 In June 2004,Wal-Mart opened three new distribution centers to support the online DVD
Exhibit 3.2 Summary of Netflix’s Movie Rental Plans
Plan Maximum rentalsper month
Price per month($)
Instant viewing hoursper month
4 DVDs at-a-time Unlimited 23.99 243 DVDs at-a-time Unlimited 17.99 182 DVDs at-a-time Unlimited 14.99 151 DVD at-a-time Unlimited 9.99 101 DVD at-a-time Limit 2 per month 4.99 5
Source: Retrieved June 10, 2007 from www.netflix.com.
386 Cases

rental business. Additionally, it expanded its rental catalog to 15,000 titles (atthe time, Netflix offered about 22,000 titles for rent). By mid-2005, however,Wal-Mart had given up on the online DVD rental business. In leaving, Wal-Mart directed its customers to Netflix, and established a deal whereby formerWal-Mart customers could get a discounted two-DVD rental plan if they signedup for a one-year Netflix subscription (regularly priced at $14.99, and dis-counted to $12.97).18 The reason for Wal-Mart’s exit was thought to be a lackof sufficient subscriber sign-up, an important figure in the online rentalbusiness.
Blockbuster
On August 11, 2004, Blockbuster announced its entry into the US online movierental business with the creation of Blockbuster Online, a move they had beendiscussing since that spring.19 Like Netflix and Wal-Mart, they had a tieredmonthly fee system based on the number of movies the consumer wanted tohave at a time. Initial pricing was positioned between Netflix and their low-price rival, Wal-Mart. Blockbuster subscribers chose from a catalog of 25,000titles, compared with 30,000 titles available from Netflix at that time. Part ofBlockbuster’s strategy was for the online service to encourage foot traffic in itsphysical stores, with two coupons for free rentals at the stores being sent to eachonline customer once a month.
Relying on its strong brand recognition among consumers and physical pres-ence with over 5,600 company-owned and franchised brick-and-mortar storesat the time of the launch, Blockbuster hoped to reach many of the over fourmillion estimated online renters that made up the market at the time of thelaunch.20 The market for online rentals was estimated at $8 million at the time,and Blockbuster saw it as a growing area within the overall rental business.While only 8% of industry revenue came from online rentals in 2005, growthwas strong, increasing from 5% in 2003, according to Adams MediaResearch.21
To accommodate the new online service, Blockbuster established a new dis-tribution system, separate from its existing network that handled its bricks-and-mortar stores. To handle the mailing of DVDs, Blockbuster had to establish aset of distribution centers, similar to Netflix’s, from which it could mail therented DVDs. The separate distribution was also put in place to accommodatethe different rental preferences of online subscribers as compared to in-storepatrons.22
The launch of Blockbuster Online was at an estimated initial cost of $50million, with additional losses in operating revenues for several quarters afterlaunch. These figures, combined with the loss of revenue from late fees (usuallya good source of income for Blockbuster that previously made up 13% ofrevenue), contributed to a difficult financial situation. Subscriber growth wasthought to be a key statistic, and subscriber acquisition was expensive. By thefourth quarter of 2005, Blockbuster Online had about one million subscribers,versus four million subscribers for Netflix. This was after a 39% increase inadvertising for the first three quarters of 2005.23
In 2005, Blockbuster’s stock had dropped 50% from its 52-week high.To stem the bleeding, it announced a cost-cutting program that included
Netflix: Responding to Blockbuster, Again 387

advertising reductions. These cuts were to take effect from the second quarter of2005 through the second quarter of 2006 (Exhibit 3.3). After the poor sub-scriber acquisition results, Blockbuster announced that it would increase adver-tising for its online service, despite the cost-cutting initiative.24
By 2005, price wars between the major online renters had broken out. Block-buster dropped its three-out DVD rental monthly subscription by $3 to under-cut Netflix (Exhibit 3.4). Also, it rolled out a trial program in Seattle whereonline customers had the option of returning DVDs to their local Blockbusterstore,25 foreshadowing the 2006 launch of Blockbuster Total Access.
Exhibit 3.3 Summary of Blockbuster’s Income Statements ($US millions, except whereindicated)
CY 2007 CY 2006 CY 2005 CY 2004 CY 2003 CY 2002
Total subscribers (1000people)
2,000 1,000
Total revenue 5,542.40 5,522.20 5,721.80 6,053.20 5,911.70 5,565.90
Cost of revenue, total 2,677.80 2,479.70 2,561.00 2,441.40 2,389.80 2,358.70
Gross profit 2,804.80 2,981.30 3,088.60 3,519.80 3,425.30 3,121.40
Total selling, general, andadmin. expenses
2,719.10 2,752.90 2,977.50 3,110.90 2,785.30 2,618.70
R&D
Depreciation/amortization 185.7 210.9 224.3 249.7 268.4 233.8
Unusual expense (Income) 2.2 5.1 341.9 1,504.40 1,304.90 0
Total operating expense 5,503.30 5,448.60 6,104.70 7,306.40 6,748.40 5,211.20
Operating Income 39.1 73.6 −382.9 −1,253.20 −836.7 354.7
Interest Income (Expense),net nonoperating
−82.2 −91.7 −94.6 −34.5 −30 −45.4
Income before tax −44.6 −12.7 −481.7 −1,286.10 −867.1 312.2
Income after tax −74.2 63.7 −544.1 −1,248.80 −973.6 205.1
Source: Blockbuster’s annual financial statements.
Exhibit 3.4 Summary of Blockbuster Total Access Movie Rental Plans
Plan Maximum rentalsper month
Price per month ($) Additional in-storemovie, or gamerentals per month
Mail only price (in-storerental or return) ($)
4 DVDs at-a-time Unlimited 23.99 1 22.993 DVDs at-a-time Unlimited 17.99 1 16.992 DVDs at-a-time Unlimited 14.99 1 13.991 DVD at-a-time Unlimited 9.99 1 8.991 DVD at-a-time Limit 3 7.99 1 6.991 DVD at-a-time Limit 2 5.99 1 4.99
Source: Retrieved June 10, 2007 from, www.blockbuster.com.
388 Cases

Other Competitors
Many other smaller competitors sprang up once the DVD format had takenhold. Some were forced to exit the market but a few remained, existing on thefringe, trailing far behind giants Netflix and Blockbuster. These included intel-liflix, DVD Overnight, DVD Barn, Rent My DVD, DVD Whiz, and Qwikfliks.
Blockbuster Total AccessIn November of 2006, Blockbuster launched an updated version of BlockbusterOnline, called Blockbuster Total Access. In addition to offering movie rentalsrequested over the Internet and delivered through the mail, as Netflix and theoriginal Blockbuster Online had, Total Access sought to utilize Blockbuster’sstores to offer additional benefits. Blockbuster Total Access’ customers couldreturn their movies rented through the mail through the mail service and havetheir next title shipped to them. Alternatively, customers could return movies toany Blockbuster location. When returning an online rental at a store, customersreceived a free in-store rental in addition to having their next online rentalshipped.26 Blockbuster promoted this advantage and the instant gratification itprovided using slogans such as “Never be without a movie.” Blockbuster TotalAccess subscriptions also gave customers a coupon for one free in-store rentaleach month. The coupon could be used for a movie or video game rental.27
On June 12, 2007 Blockbuster added Blockbuster by Mail as an option for itsonline service. Customers choosing this option would be permitted to returnmovies to blockbuster stores, but they would not receive a free rental inexchange. The return of their movie to the store would electronically stimulatethe next movie in their queue to be sent from the Blockbuster distributioncenter. These users also would not receive a free rental coupon each month. Inreturn for giving up these privileges, subscription fees were $1 less per monththan the full Blockbuster Total Access plan. The addition of Blockbuster byMail provided a more direct comparison with Netflix’s subscription plans anddrew attention to the added benefit of in-store rentals. Blockbuster promoted itsplan as a way to save money for customers who did not live near a Blockbusterlocation.28 While the Blockbuster by Mail service was less expensive thanNetflix, it did not offer the instant viewing option available from Netflix.
Movie DownloadsIn addition to threats from Blockbuster and other companies that potentiallycould imitate the Netflix model, there was also a rising trend in downloaded orstreaming movies, similar to the Netflix Watch Now feature. These servicesallowed customers to have a movie delivered to them through their cable televi-sion connection directly to their television, or through the Internet to theircomputer.
Comcast and other cable companies offered a range of on-demand enter-tainment as part of their cable service. These services charged a fee for viewingthe most popular movie titles and had a limited selection. Exclusive rights todigital distribution of many movies had already been sold for many years intothe future, typically to television stations. These deals excluded DVD rentals,
Netflix: Responding to Blockbuster, Again 389
but applied to movies delivered over cable or Internet. Online services such asCinemaNow, iTunes, and Amazon Unbox started offering movie downloads forrental and/or purchase. These companies offered downloads to computers thatmust be burned to a disc or watched through the computer. Most potentialcustomers preferred to watch movies on their television rather than their com-puter, and connecting one’s computer to the television was still a somewhatcumbersome process. Much like the cable companies, these services also offereda very limited selection compared to the Netflix rental library. If the technologyissues could be solved so that movies were easier to watch on televisions andif the selection improved, these companies could be serious competition forNetflix.29, 30 There was also ZML.com, the pirate site that had a selection ofover 1,700 films to burn to DVDs, or for download to personal computers orhandheld devices such as iPods.31
Netflix’s DecisionReed Hastings had several options for dealing with the threats posed by Block-buster Total Access and competitors offering downloadable movies on demand.First, if customers were not willing to pay for the added convenience of return-ing movies to Blockbuster stores, Netflix could push an aggressive price war totry to eliminate Blockbuster from online rentals. Second, it could continue tobring out innovations such as Netflix Prize crowdsourcing idea and Netflixfriends feature. Such innovations could help it fend off competitors. Third,exclusive rights agreements currently prevented many titles from being releasedthrough the Internet or by a cable provider, but as these agreements expired,movies streamed over the Internet might become the disruptive technology thatdisplaced rental of physical DVDs. Current drawbacks to watching movies on acomputer rather than on a television might be displaced by technology similarto AppleTV,32 making streaming downloads more attractive. Netflix had startedexploring this option with its Watch Now feature. The question was, how couldit insure that it was strategically positioned to take advantage of this technologyif its popularity increased?
Reed would have never thought that simply providing movie rentals wouldbe such a complex and technology driven business, but it was becoming obviousthat Netflix must be a constantly improving and evolving business if it wasgoing to have a long future.
390 Cases

Threadless in Chicago
In 2000, Jake Nickell, a multimedia and design student at the Illinois Instituteof Art, and Jacob DeHart, an engineering student at Purdue University, enteredan online T-shirt design contest, which Jake won. However, both of them wentaway with the idea that having someone else compete to design T-shirts forthem could lead to something interesting. They kept in touch and workedtogether on a few projects before starting their own T-shirt company in 2001,with $1,000.1 Their company, Threadless, would make and sell T-shirts withcolorful graphics.2 They were venturing into the colorful T-shirt—a so-calledhit-and-miss product. Traditionally, to be successful with such a product, a firmneeded to have the right distribution channels and its fingers on the pulse offast-changing trends.3 A firm needed to have the right market research andforecasting abilities to do well. The two founders added creative director JeffKalmikoff later. They also took venture capital money from Insight VenturePartners, not so much because they needed the money, but because they could,well, obtain some insights from the venture capitalist firm.
The Community Designs and MarketsThreadless had a community of registered members that in 2004 was 70,000strong and mushroomed to 700,000 by 2008. Anyone with a valid e-mailaddress could join free. Each week, members of the community—largely art-ists—uploaded hundreds of T-shirt designs to the community site. (In 2007, thefirm received 150 submissions per day.) Visitors to the site then voted for theirfavorite designs by scoring them on a scale of 0 to 5.4 Each design remainedavailable for voting for seven days. From the scoring, the best six designs werechosen from the hundreds of submissions. Creators of the winning designs wereawarded prizes. In 2007, these prizes were worth $2,000 per design: $1,500 incash, $300 in a gift certificate, and subscription to T-shirts.5 By 2008, the prizehad climbed to $2,500. To many artists, there was something bigger than thecash prize. “It was how cool it was to get your shirts printed,”6 remarked GlenJones, a 2004 winner. The name of the designer (winner) was put on the label ofthe T-shirt.7 Threadless retained the rights to the design.
To help the artists with the design process, Threadless sent digital submissionkits—complete with HTML code and graphics—to each potential submitter.With these kits, artists could create advertisements for their designs that lookedvery professional. The artists not only spent weeks seeking advice from othercommunity members and perfecting their designs, they posted links to their
Case 4

submissions to their personal websites, any online design forums that they fre-quented, MySpace pages, or blogs, asking their friends to vote for them and buyif and when they won.8 Effectively, the artists not only designed the shirts forThreadless, they also premarketed them, adding to the brand. Some of themembers who participated in voting for designs saw the process as one ofexploring the latest in designs and learning. In effect, the firm committed finan-cially only to T-shirt designs of which many of its customers approved.
Some ResultsThe company printed the winning designs and sold them to the very communitythat had competed to create the designs and voted to decide the winning design.By 2008, it had printed 1,000 designs9— all online. The T-shirts usually soldout. It had no professional designers, used no fashion photographers or model-ing agencies, had no sales force, did not advertise, and except for its retail storein Chicago, it had no distributors.10 Members of the community socialized,blogged, and chatted about designs. It even had an official fan site: http://www.lovesthreadless.com/. In 2007, its shirts cost about $4 each to make andsold for about $15.11 The company sold 80–90,000 shirts a week.12 Revenueswere growing at 500% a year; and the company was doing all this without thehelp of big retailers such as Target, who had come knocking but been turneddown by Threadless.
A Retail Store?Threadless opened its first offline retail store in September of 2007, in Chi-cago.13 Why would an online company build an offline store when it could keepits margins even higher by avoiding brick-and-mortar costs? Threadlessoffered several reasons.14 First, the firm wanted a building that reflected theThreadless culture in which design classes could be offered, galleries withThreadless artists’ work hosted, and real-world group interaction and criticsfacilitated. Second, the company’s products changed every week and mostretailers were not equipped to handle such changes. Third, there was a storybehind each of their T-shirts and the person who created it, how it was created,scored and selected for print that needed to be told. Such a story would be lostin a traditional retail outlet. With the retail store, they could tell the story theirown way. Of the 1,000 designs that had been created since its inception, about300 of them were still in stock. The firm only displayed 20 designs for sale. Therest could be obtained from its website. Designs were released in the offlineretail store before online.
Other HoldingsThreadless had a parent company called SkinnyCorp, also run by Nickell,DeHart and Kraikoff. In June 2008, the other units under the SkinnyCorpumbrella were Naked and Angry, Yay Hooray, and Extra Tasty.
392 Cases

Pixar Changes the Rules of theGame*
On June 29, 2008, on the first anniversary of the release of Ratatouille, a formerPixar Animation shareholder wondered if Pixar had done the right thing sellingitself to Disney. Ratatouille had grossed more than $600 million worldwidewith an undisclosed amount from merchandising. What was even more amaz-ing than the revenues was the fact that Ratatouille was the eighth straight hit forPixar, in an industry where every other movie risked crashing. Why had Pixarbeen so successful? Would the success continue under Disney? Should Pixarhave stayed as a separate company in a continued alliance with Disney orparted ways and found another partner? Eight straight hits with most of themgrossing more than half a billion dollars!
Pixar’s Digital Technology Roots
University of Utah Days
Pixar’s technical roots date back to 1970, when Ed Catmull joined the com-puter science program at the University of Utah as a doctoral student.1 Giventhe program’s notoriety and leadership in computer graphics, several youngstars were attracted, among them John Warnock. He would later found AdobeSystems and create a revolution in the publishing world with his PostScript pagedescription language. Jim Clark, another alumnus, would later start SiliconGraphics and then lead Netscape Communications.
During the 1970s, the program made significant headway into the develop-ment of computer graphics. Catmull himself made a significant advance incomputer graphics in his 1974 doctoral thesis, which focused on texture map-ping, z-buffer and rendering curved surfaces. In 1974, interest in the work ofthe Utah program came from an unexpected source, Alexander Schure, aneccentric millionaire and founder of the New York Institute of Technology(NYIT), who wanted to use the story from a children’s record album calledTubby the Tuba to develop an animated film. From the ranks at Utah, DrCatmull recruited a team of talented computer scientists and began experiment-ing with computer-generated animation.
* This case was written by Catherine Crane, Will Johnson, Kitty Neumark, and ChristopherPerrigo under the supervision of Professor Allan Afuah as a basis for class discussion and is notintended to illustrate either effective or ineffective handling of a business situation.
Case 5

The Lucasfilm Years: 1979–1986
While Catmull’s group struggled at NYIT, Hollywood was beginning to see thebenefits of computer graphics for production. One early Hollywood pioneerwas George Lucas, whose Star Wars had been a stunning special effectsachievement. With this blockbuster under his belt, Lucas became interested inusing computer graphics for image editing and producing special effects for hisnext movie, The Empire Strikes Back. Lucas worked with an outside computergraphics production house, Triple I, to create effects for Empire, but in the endthese were not used. However, the experience had proven that photorealisticcomputer imagery was possible, and Lucas decided to assemble his own com-puter graphics division within his special effects company, Lucasfilm.
In 1979, Lucas discovered Catmull’s group at NYIT. George Lucas extendedan offer to the team to come to Northern California to work as part of Lucas-film; the team was more than happy to accept. Dr Catmull was named VicePresident and over the next six years, the new computer graphics division ofLucasfilm would assemble one of the most talented teams of artists and pro-grammers in the computer graphics industry.
Pixar Is Born (1984–Present): Creative Development
Enter the Story Man: John Lasseter
Like Ed Catmull, John Lasseter had long envisioned the future of computergraphics animation. Lasseter had worked on Disney’s first major foray intocomputer-aided production—Tron (1981). Tron required nearly 30 minutes offilm quality computer graphics and was a daunting task for computer graphicsstudios at the time. The computer-generated imagery of Tron was technologic-ally dazzling, but the underlying story was an unappealing cyber-adventure.Disney sank about $20 million into the picture, but it bombed at the box office.The resultant financial loss alone served to all but kill Disney’s interest in thecomputer graphics medium.
Despite the commercial failure of Tron, the film was an epiphany for Lasseter.Watching what fellow animators were doing with computer graphics imagery,he started to see the possibilities of full-scale computer animation: “the minute Isaw the light-cycle sequence, which had such dimensionality and solidity,” Las-seter recalls, “it was like a little door in my head opening to a whole newworld.”2
Lasseter and fellow animator Glen Keane (who went on to make Beauty andthe Beast) tried to interest Disney in the medium by animating 30 seconds ofMaurice Sendak’s Where the Wild Things Are, using standard animation draw-ings in computer-generated settings. However, Disney, which was struggling torejuvenate itself after years of lackluster box office performance, was not inter-ested in further experimentation with untried computer animation. In 1984, adisappointed Lasseter left Disney. Ed Catmull, a friend of Lasseter, convincedhim to come to Lucasfilm to experiment for just a month. John Lasseter likedwhat he found and never left.
394 Cases

Born in the “Next” Generation: Steve Jobs
While the computer graphics division of Lucasfilm was strengthened with theaddition of Lasseter in 1984, George Lucas’ interest in the project waned.Although Catmull saw tremendous further potential in the technologies beingdeveloped, Lucas viewed the project as complete and began looking for a buyerof the computer division. An early potential buyer of the division was a partner-ship between the behemoth General Motors’ Electronic Data Systems (EDS)and a unit of the Dutch conglomerate Phillips NV. Much to Catmull’s relief, thesale fell through.
Steve Jobs, then CEO of Apple Computer, heard about Lucas’ intended saleof the computer division. Jobs thought the situation provided a strong acquisi-tion opportunity for Apple, but unfortunately, Apple’s Board disagreed. WhenJobs left Apple in 1985, Pixar remained a division of Lucasfilm.
Ironically, it was the ousting of Jobs that ultimately permitted the sale of thecomputer division. With a personal net worth of more than $100 million result-ing from his sale of Apple stock, Jobs approached Lucas and reiterated hisinterest in the division. In 1986, at a price of $10 million, Lucas sold the div-ision to Jobs. Steve Jobs considered the idea of absorbing the group into hisother firm, NeXT Computer, but instead decided to incorporate Pixar as anindependent company, installing himself as Chief Executive Officer and EdCatmull as Chief Technical Officer.
Along with Catmull and Lasseter, Jobs viewed the ultimate goal of the com-pany as producing computer-animated cartoons and full-length films. However,there were still several intermediate steps required to meet this objective. One ofthe most important of these hurdles was developing and refining software toolsthat would enable the creation of the films the team envisioned.
“Innovate or Not to Innovate?”—That is NOT theQuestion!Pixar developed groundbreaking software systems—Marionette, Ringmasterand RenderMan, and a laser recording system for film—Pixarvision. Mario-nette was an animation software system for modeling, animating, and lightingsimulation capabilities (see Exhibit 5.1 for an animation value chain).3 Ring-Master was a production management software system for scheduling,coordinating, and tracking computer animation projects. Pixarvision was a
Exhibit 5.1 An Animation Movie Value Chain
Financing, purchasing, human resources, etc.
CREATIVEDEVELOPMENTStory and charactersdevelopment
� PRODUCTIONModelingLayoutAnimationShadingLightingRenderingFilm recording
� POST-PRODUCTIONSound processPicture processSound effectsMusical scoreetc.
� MARKETING andMERCHANDISING
� DISTRIBUTION
Pixar Changes the Rules of the Game 395

laser recording system for converting digital computer data into images onmotion picture film stock with unprecedented quality. These three productshelped to provide a considerable competitive advantage to Pixar, as they werecritical to the production of high-quality three-dimensional graphics and com-parable tools were simply not available on the market.
Unlike these software systems which remained proprietary to Pixar, Ren-derMan software system was commercialized and quickly became a significantsource of revenue, so that in 2001 approximately 10% of Pixar’s total revenuecame from software licensing. Released for commercial use in 1989, Render-Man, a rendering software system for photorealistic image synthesis, enabledcomputer graphics artists to apply textures and colors to surfaces of three-dimensional images onscreen. Pixar licensed the tool to third parties and even-tually sold upwards of 100,000 copies. RenderMan quickly became an industrystandard and was used extensively to augment live action films. Over a 10-yearperiod, the software had been used to create eight out of the ten films that wonOscar for Best Visual Effects—The Matrix, What Dreams May Come, Titanic,Forrest Gump, Jurassic Park, Death Becomes Her, Terminator 2, and TheAbyss. However, the true testimonial to RenderMan and people who created itwas in 2001 when the Academy of Motion Picture Art & Science Board ofGovernors honored Ed Catmull, the President of Pixar, Loren Carpenter, SeniorScientist, and Rob Cook, Vice President of Software Engineering, with an Acad-emy Award of Merit (Oscar) “for significant advancement to the field of motionpicture rendering as exemplified in Pixar’s RenderMan.”
Developing the Creative Side of PixarIn early 1990s Steve Jobs realized that sales of RenderMan and other toolsalone would not be able to fund Pixar’s technology research and internal pro-jects, including film development. “The problem was, for many years, the costof computers to make animation we could sell was tremendously high.”4 Jobsput Pixar technology to use in developing TV commercial campaigns for avariety of clients. As the company evolved into a successful animation studioproducing TV ads for Listerine, Lifesavers, and others, John Lasseter, the dir-ector of the ads, became Pixar’s big breadwinner. The company won a GoldMedal Clio Award for its LifeSavers “Conga” commercial in 1993, and anotherGold Clio Award in 1994 for its Listerine “Arrows” commercial.
A second successful creative outlet for Pixar was short film. In 1986, Pixar’sfirst short movie, Luxo Jr., earned an Academy Award nomination for BestShort Film (Animated). In 1988, another of Pixar’s short films, Tin Toy, becamethe first computer-animated film to win an Academy Award for Best Short Film(Animated). John Lasseter, who had directed both films, had established a well-deserved reputation as one of the leading animators in the industry. Indeed, hisreputation set the creative foundation for Pixar. Meanwhile, Lasseter’s successdid not go unnoticed. Disney’s Michael Eisner and Jeffrey Katzenberg tried towoo the director back, but Lasseter declined. “I was having too much fun,” hesaid. “I felt I was on to something new—we were pioneers.”5
396 Cases

A Tale of Four Animated Films
Teaming Up to Break New Frontiers: Disney and Pixar
In 1991, John Lasseter reviewed Pixar’s work in short films and commercials,and was confident enough in the company’s progress to propose the idea ofproducing an hour-long animated TV special. He pitched the idea to his previ-ous studio, Disney, with the hope that the two companies could collaborate onthe project. He was also hoping that Disney would be able to provide part of themoney necessary to fund the idea.
The timing was just right. Unlike his pitch for Toaster in 1984, Disney in1991 was riding high on the phenomenal success of its animation department.With smashes in The Little Mermaid (1989) and Beauty and the Beast (1991)—both had utilized computer animation to some extent—Disney was ready toinvest in new technology. Although Disney CEO Michael Eisner and film chiefJeffrey Katzenberg rejected the TV project, they countered with a deal Lasseterand Pixar could hardly have hoped for: Disney proposed a full length movie,which it would fund and distribute.
In July 1991, Pixar signed a three-film deal. The deal stipulated that Disneywould fund the production and promotion costs and Pixar would earn a modestpercentage of box-office and video sales gross revenues. Pixar’s share in the dealwas estimated to amount to approximately 10–15% of the film’s profits,depending on the sales levels achieved. Pixar was required to pay a portion ofthe costs over specified budget levels, as well as provide the funding for thedevelopment of any animation tools and technologies necessary to completethe films.
In return for taking the lower cut of box office and video profits, Pixar gainedaccess to Disney’s marketing and distribution network, as well as creativeadvice from Disney’s veterans. However, a substantially higher share of rev-enues was not the only price Disney extracted from the deal. In addition, Disneyretained all ownership to the characters appearing in the films. Disney alsomaintained sole licensing rights to the films and characters, including verylucrative ancillary merchandise such as toys and clothing. Pixar was only ableto retain the rights to any direct-to-video sequels, as well as the data files andrendering technologies employed to develop the films.
When asked about the agreement signed, Steve Jobs remarked that if the firstmovie was
a modest hit—say $75 million at the box office—we’ll both break even. If itgets $100 million, we’ll both make money. But if it’s a real blockbuster andearns $200 million or so at the box office, we’ll make good money, andDisney will make a lot of money.6
1995—Film 1: Toy Story
With the deal signed, Pixar now had to prove it could deliver on its technologyand creativity. In 1991 with a staff of only a few dozen people, Pixar had toquickly gear up to begin design and production of the first of the three films. Bythe end of 1992 all of the key ingredients were in place—screenplay was
Pixar Changes the Rules of the Game 397
approved by Disney, character voices, led by Tom Hanks as Woody and TimAllen as Buzz Lightyear, were signed, and the staff of animators was ready toturn a tale about the rivalry between a toy cowboy, Woody, and a plasticspaceman named Buzz Lightyear, to life.
Pixar completed Toy Story with a staff of 110, roughly one-sixth of thenumber Disney and other studios typically use to make animated productions.7
Of the staff, 27 were animators, compared to the 75 or more animatorsrequired for previous animated Disney films. With animators earning $100,000or more each, the total cost savings amounted to more than $15,000,000 over athree-year production for the movie.
Toy Story opened in US theaters over the Thanksgiving weekend of 1995with great fanfare and extensive media publicity. During the five-day Thanks-giving weekend, Toy Story box office receipts totaled $39.1 million, a recorddebut for the weekend and by the end of 1995 it became the highest grossingfilm of the year, making over $192 million in domestic box office receipts and$358 million worldwide.
1998—A New Contract and A Bug’s Life
In December 1997, riding high on the success of Toy Story, but making onlyan estimated $45 million from the release of the film, Pixar renegotiated itscontract with Disney. Pixar agreed to produce five original computer-animated feature-length theatrical motion pictures for distribution by Disney.Pixar and Disney agreed to cofinance production, co-own, cobrand, and shareequally the profits from each picture, including revenues from all relatedmerchandise.
The first original picture released under the new agreement was A Bug’s Life,which opened in theaters in November of 1998. The story, derived from thefable “The Ant and the Grasshopper” revolved around an ant colony, led by arebel ant named Flick, and its quest to fight off the grasshoppers who stole theants’ food every winter. A Bug’s Life broke all previous US Thanksgiving week-end box-office records, becoming the highest grossing animated release in 1998and making over $163 million domestically in box office receipts and $362million worldwide. After only one week of international release A Bug’s Lifecaptured the #1 spot in six international markets, including Thailand, Argen-tina, and Australia.
Computer technology had advanced to a point where the computing powerused in A Bug’s Life was ten times the power used in Toy Story. The resultswere images that were more real-life than ever before. Additionally, Pixar usedPixarvision (its laser recording system) for the first time, to convert digitalcomputer data into images on motion picture film stock, achieving not onlyfaster recording time, but also higher quality color reproduction and sharperimages.
1999–2012: More Blockbuster Years
A Bug’s Life was followed by Toy Story 2, which was released on November 19,1999, and became the first film in history to be entirely mastered and exhibiteddigitally, and the first animated sequel to gross more than its original. It won a
398 Cases

Golden Globe award for the Best Picture, Musical, or Comedy. This wasfollowed by Monsters, Inc., Finding Nemo, The Incredibles, Cars, andRatatouille—all of them blockbusters (Exhibit 5.2). Planned for release thefollowing years were WALL-E (2008), Up (2009), Toy Story 3 (2010), Newt(2011), The Bear and the Bow (2011), and Cars 2 (2012).
CompetitorsPixar had competitors, chief among them, Disney, DreamWorks PDI/SKG, FoxStudio, and Lucasfilm. In fact, two of the top five spots on the all-time grossinganimation movies were occupied by PDI/DreamWorks, not Pixar (Exhibits 5.3and 5.4).
Pondering Pixar’s Future—Where to Next?In 2004, Steve Jobs and his team went to Disney for renegotiation of theiragreement, confident that their strong record of six blockbusters would beenough to seal a new deal; but Ed Eisner, Disney’s CEO did not see eye-to-eyewith Steve Jobs and no deal was reached.8 On October 1, 2005, however, BobIger was appointed CEO of Disney to replace Eisner. Iger reopened talks withPixar. On January 24, 2006 Disney announced that it had agreed to purchasePixar for $7.4 billion in an all-stock deal.9 The deal was completed on May 5,2006, after approval by Pixar shareholders.10 However, there were still somePixar shareholders and analysts who wondered if Pixar had done the rightthing. Should the firm have remained single?
Exhibit 5.2 Pixar Full-length Animation Movies
Movie Name Released 1st Weekend ($) US Gross ($) WorldwideGross ($)
Budget ($)
Toy Story 11/22/95 29,140,617 191,796,233 356,800,000 30,000,000A Bug’s Life 11/20/98 291,121 162,798,565 358,000,000 45,000,000Toy Story 2 11/19/99 300,163 245,852,179 485,828,782 90,000,000Monsters, Inc. 11/2/01 62,577,067 255,870,172 525,370,172 115,000,000Finding Nemo 5/30/03 70,251,710 339,714,978 864,614,978 94,000,000The Incredibles 11/5/04 70,467,623 261,437,578 631,437,578 92,000,000Cars 6/9/06 60,119,509 244,082,982 461,782,982 70,000,000Ratatouille 6/29/07 47,027,395 206,445,654 617,245,654 150,000,000Pixar Short FilmCollection—Volume 1
11/6/07
WALL-E 6/27/08 180,000,000Up 5/29/09Toy Story 3 6/18/10Newt 8/31/11The Bear and the Bow 12/31/11Cars 2 8/31/12
Totals 1,907,998,341 4,301,080,146 866,000,000Averages 238,499,793 537,635,018 96,222,220
Source: The Numbers. Retrieved June 21, 2008, from http://www.the numbers.com/movies/series/DigitalAnimation.php.
Pixar Changes the Rules of the Game 399

Exhibit 5.3 Top 12 Grossing Animation Movies
Animation movie Release date Firm Worldwide gross ($)
Shrek 2 2004 PDI/DreamWorks 920,665,658Finding Nemo 2003 Pixar 864,625,978Shrek the Third 2007 PDI/DreamWorks 798,957,081The Lion King** 1994 Walt Disney 783,841,776Ice Age: The Meltdown 2006 Fox 647,330,621The Incredibles 2004 Pixar 631,436,092Ratatouille 2007 Pixar 617,245,650Monsters Inc. 2001 Pixar 529,061,238Madagascar 2005 PDI/DreamWorks 527,890,631Aladdin 1992 Walt Disney 504,050,219Toy Story 2 1999 Pixar 485,015,179Shrek 2001 PDI 484,409,218Cars 2006 Pixar 461,782,982
Source: The Numbers. Retrieved June 21, 2008, from http://www.the-numbers.com/movies/series/DigitalAnimation.php.** The Lion King was also estimated to have brought in $1 billion in profits from merchandising, theme parkattractions, TV rights and videos.
Exhibit 5.4 Competing Animation Movies
Digital animated movie Date released Firm Worldwide gross ($)
Antz 1998 PDI 152,457,863Shrek 2001 PDI 484,409,218Shrek 2 2004 PDI/DreamWorks 920,665,658Madagascar 2005 PDI/DreamWorks 527,890,631Shrek the Third 2007 PDI/DreamWorks 798,957,081Ice Age 2002 Blue Sky Studios/Fox 382,387,405Robots 2005 Blue Sky Studios/Fox 260,700,012Ice Age: The Meltdown 2006 Blue Sky Studios/Fox 647,330,621Horton Hears a Whol 2008 Blue Sky Studios/Fox N/A
Source: The Numbers. Retrieved June 21, 2008, from http://www.the-numbers.com/movies/series/DigitalAnimation.php.
400 Cases
Lipitor: The World’s Best-sellingDrug1 (2008)
Jeff Kindler, CEO of Pfizer, pondered over sales of Lipitor. The drug hadbrought in $12.7 billion in revenues in 2007.2 This blockbuster belonged to agroup of drugs called statins that reduce the level of cholesterol in the body byinhibiting the process by which the body produces cholesterol. What was itabout Lipitor and Pfizer that had enabled the drug to do so well? Could Pfizer orany pharmaceutical company ever repeat such a feat?
Coronary Artery DiseaseIn 2008, it was believed that coronary artery disease was the leading cause ofdeath in the USA, where more than a million people suffered a heart attackevery year. A leading cause of coronary artery disease is the buildup of plaque inthe blood vessels, which can lead to blockage of these arteries, to heart attacksand strokes. Frequently, this plaque buildup results from excessive cholesterollevels, especially of the bad cholesterol called low-density lipoprotein (LDL).High levels of triglycerides also have the same negative effect. However, highlevels of so-called good cholesterol—high-density lipoprotein (HDL)—have theopposite effect as they return LDL to the liver for elimination, thereby reducingharm to people. Cholesterol is a natural substance in the body that is used in theformation of cell membranes, gastric juices, and some hormones; but like mostgood things, too much of it is bad. The liver makes most of the cholesterol thatthe body needs but cholesterol can also be ingested directly from food.
Role of StatinsBefore statins, high levels of cholesterol were treated with drugs that breakdown cholesterol or absorb it irrespective of whether it was naturally producedby the body or from ingested food. These therapies were somewhat effective butfor many patients, the reductions in LDL levels were just not good enough.Moreover, the therapies caused many side effects, including stomach pain andnausea. All that changed when Merck introduced Mevacor, a statin, in 1987.Statins work by inhibiting a key enzyme in the body from enabling the produc-tion of cholesterol. Rather than wait for cholesterol to be produced by the bodyand then try to eliminate it the way earlier drugs did, statins directly intervene inthe process that the body uses to produce cholesterol. Bristol Myers and Norva-tis soon joined Merck in offering statin cholesterol drugs. The market shares forthe statins available just prior to the launch of Lipitor are shown in Exhibit 6.1.
Case 6

Lipitor Research and DevelopmentThe decision by Warner-Lambert to go on with the development of Lipitor wasnot very popular because the drug was regarded as a me-too drug since it wasgoing to be the fifth drug in the statin family. However, a Phase I study con-ducted in 1992 showed that the drug reduced LDL levels much better thanexisting statins (see Exhibit 6.2 for the different phases through which a drughas to go before approval by the FDA). So Warner-Lambert decided to go aheadwith the development of Lipitor. To reduce the time that it takes to review thedata to approve or reject a new drug application (NDA) from the average of 12months at the time, Warner-Lambert ran trials for a fatal hereditary conditioncalled familial hypercholesterolemia that results in exceptionally high choles-terol levels. The idea was to take advantage of a law that encourages the FDA toexpedite new drug applications for any new drug that treats a serious or life-threatening condition or addresses an unmet medical need. This worked asLipitor was approved by the FDA six months after receiving Warner Lambert’sapplication for approval.
At the request of its marketing group, Warner-Lambert took the unusual stepof carrying out so-called head-to-head clinical trials in which clinical data arecollected on competing drugs and compared. Fortunately, the data showedLipitor to be superior to all the other statins. Lipitor reduced LDL levels by 40–60% and reduced triglycerides by 19–40%. Zocor, the best of the other statins,decreased LDL cholesterol by only about 40%.3, 4, 5
After arriving at Warner-Lambert in 1988, Ron Cresswell, head of R&D, hadincreased emphasis on biotechnology, integrated regulatory affairs, and clinicalresearch into the R&D unit, and sought to involve marketing earlier in the newdrug development process. He also sought to establish closer links tomanufacturing.
Warner-Lambert was granted FDA approval for Lipitor in December of1996, one year ahead of most analysts’ expectations.
Bringing Lipitor to MarketTo launch the drug, Warner-Lambert executives sought a partnership with acompany that had the marketing and sales resources. Pfizer, which had a largesales force but no cholesterol drug, was considered the best candidate. Pfizerliked the idea and promptly paid $205 million up front and future payments for
Exhibit 6.1 US Market Shares of Cholesterol-lowering Drugs, January 1997
Drug name Manufacturer Launch year Market share (%)
Mevacor Merck 1987 14Pravachol Bristol-Myers Squibb 1991 21Zocor Merck 1992 32Lescol Novartis 1994 14
Source: 1Seiden, C. (October 8, 1997). Pfizer, Inc. JP Morgan.
Note: Market shares are based on the entire cholesterol-lowering drug market (not only on statins).
402 Cases

the rights to sell Lipitor. Warner-Lambert positioned Lipitor as a therapeuticallysuperior drug but set its price lower than that of market leaders (Exhibit 6.3).
At the launch of Lipitor, the combined sales force from Warner-Lambert andPfizer numbered more than 2,200 sales representatives that called on about91,000 physicians made up of cardiologists, internists, and general and familypractitioners with a track record of prescribing cholesterol-lowering drugs.
Within one year of its launch in January 1997, Lipitor reached $1 billion indomestic sales, beating estimates of $900 million in worldwide sales (seeExhibit 6.4) for more estimates). On June 19, 2000, Pfizer bought Warner
Exhibit 6.2 The Drug Development Process in the USA.6
To insure the safety and efficacy of drugs sold in the USA, drugs have to go through Phases I, II, and III, andthe results of the testing scrutinized before the drug is approved by the Food and Drug Administration(FDA) for marketing. Phase IV studies are undertaken after FDA approval to further understand thelong-term effects of a drug.
Preclinical StudiesAs their name indicates, these are the studies that take place before a firm can start the actual clinicaltrials on a drug. Preclinical studies are undertaken in vitro (that is, in test tube or laboratory), and in vivo(in animal populations) to determine the effect that the drug in question has on living organisms. In thesestudies, scientists monitor the drug’s efficacy, toxicity, and pharmacokinetics (how well the drug isabsorbed, distributed, metabolized, and excreted) to determine whether or not to proceed with theclinical testing. Preclinical trials take 3–6 years.
Phase IThis is where the first testing on human beings starts. A small group of 20–80 healthy volunteers isselected to participate in the studies. These studies are conducted to determine the basic characteristicsof a potential new drug in humans—in particular, to determine its safety, safe dosage range, and toidentify side effects. Emphasis here is to make sure that the drug is safe before it can be tried on patientswith the target disease.
Phase IIIf the safety of the drug is confirmed in Phase I, Phase II trials are performed on larger groups (100–300)of volunteers who have the target disease. The idea here is to establish that the drug is effective and tofurther establish its safety. Thus, the testing tries to establish that the drug has a beneficial effect on thedisease that it targets, and to continue the proof of safety partially proven in Phase I. The drug fails PhaseII trials if it fails to work as expected or has toxic effects; that is, the drug fails when it does notdemonstrate efficacy and safety. Phase II studies take 6 months to a year to complete.
Phase IIIThese are multicenter, randomized controlled studies undertaken on large groups (1,000–3,000) ofpatients that have the disease that the drug is supposed to treat. The idea here is to establish statisticallysignificant proof that the potential new drug is effective in treating the disease for which it is earmarked.Patients are monitored at regular time intervals for progress in treatment and side effects. At the end ofPhase III trials, the pharmaceutical firm submits a New Drug Application (NDA) to the FDA for approval.If the FDA is satisfied with the application, the drug is granted approval to launch and market the drug.This approval is often referred to as conditional approval, since it can be withdrawn after Phase IV trials.
Phase IVAlso known as Post Marketing Surveillance Trial, Phase IV trials are designed to provide more data onsafety and to monitor technical support of a drug after its owner receives permission (through FDAapproval) to market and sell the drug. The studies offer more long-term data on the drug’s effects onlarger samples of patients, including the drug’s risks, benefits, and optimal use. The results of Phase IVtrials can result in the withdrawal of a drug from the market or its uses being restricted.
Sources: Understanding clinical trials. 2008. Retrieved July 22, 2008, from http://clinicaltrials.gov/ct2/info/understand.Clinical trials. 2008. Retrieved July 22, 2008, from http:/en.wikipedia.org/wiki/Clinical_trial.
Lipitor: The World’s Best-selling Drug 403

Lambert. Direct-to-consumer (DTC) marketing of statins by all competitorscontinued. In 2005 Bristol Myers Squibb conducted its own head-to-head test-ing to compare its Pravachol against Lipitor. The tests showed that Lipitor, notBristol’s Pravachol, was better. Poor Bristol!
CEO Kindler wondered what would become of Pfizer. Had he done the rightthing in closing down the R&D facility in which Lipitor had been developed?What would he have to do to get another Lipitor? At an American HeartAssociation scientific meeting in New Orleans in November 2008, it wasreported that Crestor, AstraZeneca’s statin, cut the risk of heart attacks notonly in patients with high cholesterol levels but also in those with low choles-terol levels.
Exhibit 6.3 Statin Average Prescription Pricing Structure
Drug name 1997 average prescription price ($) 1999 average prescription price ($)
Lescol 52 50Lipitor 84 91Pravachol 93 105Zocor 95 125Mevacor 125 137
Source: IMS. (January–December 1997). National Prescription Audit. Price Probe Pricing History Report, 1992–9.
Exhibit 6.4 1997 Lipitor Worldwide Sales Projections
Year 1997 1998 1999 2000 2001 2002 2003
Revenues ($B) 0.9 2.2 3.4 4.6 5.6 6.7 7.7
Source: ING Baring Furman Selz, LLC, April 12, 1999.
404 Cases

New Belgium: Brewing a NewGame*
On June 11, 2008, InBev—a Belgium-based Brazilian-run, and world’s secondlargest brewer—made a $46 billion bid for Anheuser-Busch (AB).1 While someAB managers wondered what would happen to them if their firm were bought,many New Belgium Brewery (NBB) employees knew how they would vote ifsuch a large brewer with an unknown environmental sustainability recordwanted to buy them—No! Kim Jordan and her husband Jeff founded NBB in1991 to turn their passion for good quality beer into a business they could workat and with which they could feel good about themselves at the end of the day.By 2008, it was not unusual for the firm to be mentioned as an example of afirm that did some socially responsible things that not only differentiated it butalso kept its costs low.
The US Beer IndustryIn 2008, AB alone held more than 50% of the US beer market share.2 The nextthree firms held about 40%. The remaining 8% was held by many smallbrewers, many of them so-called microbrewers. At 59%, input materials forproduction and packaging, such as barley, hops, bottles, and cans, were abrewer’s largest cost (Exhibit 7.1). Profit margins of 15% were not uncommon.
Exhibit 7.1 Average Cost of Goods Sold for United States Brewery
Item Cost (%)
Purchases 59.0
Wages 7.6
Depreciation 4.5
Utilities 1.5
Rent 0.4
Others 12.0
Profit 15.0
Source: IBS World.
* This case was written by Ali Dharamsey, Lei Duran, Claudia Joseph, Steve Krichbaum, andShama Zehra under the supervision of Professor Allan Afuah as a basis for class discussion andis not intended to illustrate either effective or ineffective handling of a business situation.
Case 7

In many states in the USA, the sale of beer was restricted to certain areas, days,and hours. The legal drinking age was 21. Brewers had to sell their beer todistributors who, in turn, sold it to consumers. Distributors often maintainedexclusive contracts with one of the major breweries, carrying only beer from thebrewer.
Craft Beers
Craft beers were high-end premium beers that were distinguished from otherbeers by their quality, price, and ingredients. In the early 2000s, Craft beerswere produced in small batches, allowing the brewers to produce what cus-tomers perceived as better-tasting beer, relative to the beers produced in a largerscale. Each brewer tried to market its beer as being distinct from the next, giventhe uniqueness of its own small batch process. For instance Pete’s Brewing(Pete’s Wicked Ale), one of the larger craft beer makers, sought to establish animage of hard, bold flavors for customers “with an edge.” This image washighlighted throughout its packaging, flavors, and website.
1991: Fort Collins, DenverJeff Jordan became passionate about brewing beer during their bicycle tripsthrough Europe. Back in Colorado, Jeff brewed some beer for their consump-tion, and his friends liked it. Kim became interested in commercializing Jeff’shome-brewed beer when she noticed that nothing that she tasted from outsidewas as good as Jeff’s. After brainstorming, they agreed that the name of theirventure would be New Belgium, since Jeff’s brewing process had been heavilyinfluenced by the Belgian style of brewing. They called their first commercialbeer “Fat Tire”.
Kim was the CEO. She and Jeff knew that above all else, they wanted to builda company whose values and products supported their own personal corevalues. After more brainstorming, they decided that their firm’s values would beanchored on three main tenets: philanthropy, ownership, and sustainability.She believed that these core values would attract new employees that sharedtheir goal of creating a business that left the world a better place. They couldthen make products that would set them apart from other brewers in the eyes ofcustomers. She would later be quoted as saying “The beautiful part of it is webelieve in what we’re doing.”3
SustainabilityNew Belgium designed its headquarters in 1995 with an emphasis on ecof-riendly practices. The headquarters housed two “Steinecker” brew houses, fourquality assurance labs, and a wastewater treatment facility that allowed them tocleanse their process waters and create their own energy. Additionally, theiroperations were also entirely wind powered, an option chosen in the wake of anemployee-owner vote (see Ownership section for more information). Kim andJeff constantly focused efforts on innovations that would help New Belgiumreduce its environmental footprint. New Belgium hired a sustainability directorHillary Mizia who noted, “We’re closing energy loops. That’s the principalbehind everything we do.”4
406 Cases

New Belgium was the first brewery, among both major players and Craft,within the US to become entirely wind-powered. In 2006, it was also still thebrewery with the largest wind consumption in the country.5 This use of windpower saved 3,000 tons of coal from being burned, thus reducing CO2 emis-sions by some 5,700 tons. This, however, is one of the few energy initiatives thatfailed to provide an economic return because of the premium of around 1 centper kilowatt (2006) that New Belgium paid for receiving wind-powered versusstandard power energy.6 “Our efficiency projects have to make good businesssense,” said Hillary Mizia, New Belgium’s sustainability outreach coordinator.“The social and environmental impacts are as important as the financial impact,but the financial impact is what keeps us in business.”7
New Belgium treated its windows with low-emission glaze that reflected heatrays from sunlight to reduce heat during the summer, thereby requiring less airconditioning. The windows were retrofitted with light shelves that were madeof perforated metal and painted white, similar to a window sill. The windowswere retrofitted on the south-facing side to provide up to 50% additional day-light into a space, thus reducing energy needs for lighting.8 Lastly, additionalmodifications were made to reduce energy costs further. This included windowsthat opened automatically to cool rooms, and motion-sensor lights to ensurethat lights were on only when a room was in use. Through these actions, NewBelgium reduced its energy consumption by 40% (compared to the averageAmerican brewer), per barrel of beer.9 New Belgium’s attempt to build a greenroof to reduce energy expenditures further was not as successful; but that madeKim even more determined. “It’s a gratifying way to use money, to try and pushthe envelope and the practice of alternative energy,” she said. “It’s our goal tocompletely close that loop, so all our energy use comes from our own wastestream.”10
The third initiative was the purchase of a $5 million system that collectedmethane from brewing wastewater and used it to fire a 290-kilowatt electricgenerator (Exhibit 7.2). When the generator was running, for an average of 10–15 hours a day, it created up to 60% of the brewery’s power. This amounted tosavings of $2,500–3,000 a month. New Belgium Brewery also conserved elec-tricity by capturing the heat created by brewing tanks and piping it back to heatwater.11 Renewable heating and cooling systems such as steam stack heatexchangers were also utilized. By treating its own wastewater, the company wasable to reduce the load on the city’s facilities. By recovering energy in the formof biogas and reusing water in nonbrewing processes, they were also able tocreate processes that support holistic sustainability. In 2006, New Belgium used4.75 liters of water for every liter of beer brewed (there are 119 liters per barrel,which is the standard measure of beer sales).12 These 4.75 liters were far lessthan the industry standard of 20 liters. New Belgium’s goal was to reduce itsusage down to 3 liters. The combination of reduced water consumption and thegenerator system created the largest savings by assisting New Belgium to avoidsteep fees that would be assessed by Fort Collins to treat the brewery’s nutrientrich wastewater. It would have cost the firm $4.43 million to build a system thatwould reprocess the used water before releasing it into the public water system,as required by local laws.
New Belgium: Brewing a New Game 407

OwnershipNew Belgium was a privately held company that allowed its employees to takeshares in the company and serve as employee-owners. The company had, onaverage, an employee ownership of 32% and employees enjoyed equal votingrights on all company issues.13
The firm’s books were opened to employees, consistent with “trust andmutual responsibility.”14 Private ownership also enabled New Belgium to keepits strategies, company data, performance figures, etc., from complete publicdisclosure. In 2006, the firm had no public debt outstanding. The collectiveemployee culture extended beyond ownership with additional perks to increasemorale. Employees were provided with generous benefits including health, den-tal, and retirement plans. Lunch was free to employees, every other week.Employees were also entitled to a free massage (at a salon) every year. Kim andJeff encouraged employees to bring their children and even dogs to work. Andthose employees that had been with the company for over five years were givenan all expenses-paid trip to Belgium to understand “Beer Culture”. Employeesfrom all departments within the organization were also given roles on the Phil-anthropy Committee which decided how to spend the company’s social andcharitable fund (see Philanthropy section for more information). Lastly, NewBelgium enjoyed a fairly decentralized management structure that enabledemployees to be readily involved. Employees were also encouraged to under-stand, guide, and take responsibility for corporate decision-making.
Philanthropy
New Belgium gaves $1 of every barrel of beer sold to local causes such as carefor kids with learning and developmental disabilities.15 From its inception to2006, New Belgium Brewing had donated more than $1.6 million to local
Exhibit 7.2 Cost Implications of Generator Purchase
Cost of new water treatment facility $5,000,000Estimated cost of discharge water treatment facility $4,430,000
Electricity costsEnergy use charge $0.0164 per kWhFixed demand charge $4.31 per kWhCoincident peak demand charge $11.62 per kWh (plus other misc.)Estimated electricity savings per month $2,500–3,000
Water costsCost of water per gallon—Denver, CO $0.001Liters per gallon 3.79Liters in a barrel of beer 119New Belgium—liters of water per liter of beer produced 4.75
Industry average—liters of water used per barrel of beerproduced
20
New Belgium—estimated barrels of beer produced per year 330,000
408 Cases

charitable organizations in the communities where the company did business.The donations were divided between States in proportion to their percentage ofoverall sales.16
Funding decisions were made by the Philanthropy Committee, made up ofowners, employee owners, area leaders, and production workers. New Belgiumtargeted nonprofit organizations that demonstrated creativity, diversity, and aninnovative approach to their mission and objectives. The Philanthropy commit-tee also looked for groups that involved the community in reaching their goals.Past recipients included Volunteers for Outdoor Colorado and The LarimerCounty Search & Rescue team, as seen in these photos.
MarketingLike most craft beer makers, New Belgium spent twice as much per barrel onadvertising as non-craft beer makers. The primary focus was to highlight“experience” and awareness of taste and brand. With “Fat Tire” being theflagship product and with a clear idea of the core values, Kim moved forward inbringing the positioning to life with a statement that appeared on all NewBelgium product packaging:
“In this box is our labor of love. We feel incredibly lucky to be creatingsomething fine that enhances people’s lives. Know that we think about youas we’re making it- enjoying Trippel by the fire, splitting Fat Tire with afriend, offering Abbey Ale as a present. Enjoy! And stop by to let us knowhow it was. We’d love to see you!”
Kim’s success in bringing New Belgium’s character to life could be seen notonly through beer aficionados’ avid enjoyment of the product, but moreimportantly through the alignment of brand champions/evangelists/ambas-sadors with the products and company.17 As noted by just one set of evangelistson numerous beer aficionado targeted sites:
Ever since we tried this beer it has been THE favorite. (We even had itkegged in for our wedding . . .) Keep bugging your local merchants to get itin their stores, it really deserves more shelf space. And thank goodnessCoors lost.18
(Shannon and Adam, October 10, 2005 [in reference to the Abby product])
The sentiments of these consumers highlighted their passion for New Belgiumand furthermore, an understanding of the competitive environment in whichtheir products competed. The call to action by other loyalists by rallying anddemanding for higher distribution showed the alignment Kim had sought toachieve between her customers and New Belgium.
Future for New BelgiumKim Jordan and Jeff Lebesch had grown their company into the third-largestAmerican craft beer maker in 2006 (after Sierra Nevada and Sam Adams). Theyhad grown their employee base to more than 260 employees.19 Sales had grown
New Belgium: Brewing a New Game 409

to more than 330,000 barrels, and New Belgium was now the fastest-growingcraft brewer in the U.S. Annual revenues had exceeded $70 million—withits corporate soul intact.20 As Kim and Jeff looked to the future, they couldnot help but wonder what more they could do for their community and NewBelgium, while still staying true to their core values.
410 Cases

Botox: How Long Would the SmileLast?
The Allergan board member listened attentively to the words of a competitor toBotox—the popular drug used to treat facial wrinkles and a lot more. This wasnothing to smile about. The drug had not had much competition in the USAsince FDA approval on April 15, 2002; but there appeared to be competition onthe horizon—enough to frown at. In 2008, Reloxin, another wrinkle removerwith similar chemical composition to Botox, was rumored to be near FDAapproval. Why had Botox done so well for Allergan all these years? Had it beenonly because of its monopoly position in the USA? Could the advantage besustained?
BotoxBotulinum toxin A—Botox for short—is perhaps best known for its ability toreduce wrinkles when injected in diluted form under wrinkled skin. It works bystopping nerves from making muscles move for months at a time—it effectivelyparalyzes the area into which it is injected. Because of this paralyzing ability,Botox could be deadly if administered to the wrong muscles. The rise of Botoxto a popular drug is a textbook case of innovation through serendipity. Botuli-num toxin A was first used in humans by pioneer Doctor Alan Scott to treattwitching and crossed eyes in 1977.1 While she was using the toxin to treat eyetwitches, Dr Jean Carruthers, a Canadian ophthalmologist, noticed that thoseof her patients to whom she had administered the drug looked more relaxed.She and her dermatologist husband Dr Alastair Carruthers investigated thispotential new application some more and published their findings on how touse the toxin to treat face wrinkles in 1989.2 As more and more dermatologistsused the drug to treat wrinkles, they found out that a large percentage of theirpatients who had had migraines before stopped having the migraines after injec-tion of the toxin. Different medical specialists and Allergan would go on to findmore applications for the drug.
Botox was first approved by the FDA in 1989 for use to treat eye-muscledisorders (crossed eyes) and that approval expanded in December 2000 to treatcervical dystonia, a neurological disorder that causes severe shoulder and neckcontractions.3 It received FDA approval on April 15, 2002 for use to reduce oreliminate frown lines or wrinkles between eyebrows. This approval meant thatAllergan could advertise Botox’s cosmetic benefits directly to consumers anddoctors in the USA. (In the USA, doctors could use a drug before it wasapproved by the FDA, in so-called “off-label uses;” but firms could not market
Chapter 8
unapproved benefits. In fact, in 2000, two years before FDA approval, morethan one million faces had been smoothened with Botox.)4
Used as a wrinkle fighter, Botox produced results within minutes, but woreoff after about six months. The procedure required no anesthesia and thepatient could return to work or other activity the same day. In some rare cases,the patient had to go back to get a few areas filled out. Contrast this withcosmetic surgery that required anesthesia, time to recover and see results, andthe risks associated with surgery.
As its name—Botulinum toxin A—reminds scientists, Botox is a biologicalsubstance derived from the bacterium Clostridium botulinum, the bacteriumthat can produce deadly botulism. If consumed in contaminated food the bac-terial toxin can paralyze and kill.5 Botulinum toxin A is but one of seven neuro-toxins produced by the bacterium, and the process of growing and isolatingBotox is difficult and risky. Allergan could not patent the process but protectedit by keeping it proprietary.6 Pharmaceutical firms often patented their chemicalcompounds to protect them from competitors; but that also meant that whenthe patent protection expired, generic versions of the drug could be produced bycompetitors.
Marketing BotoxWith FDA approval in 2002 for use in fighting frown lines, Allergan could nowmarket it as such. It launched a $50 million marketing campaign.7 (US pharma-ceutical firms spend twice as much on marketing as on R&D, on average.) In2002, it was estimated that a vial of Botox cost Allergan $40 to make and it soldit to doctors for $400.8 Each vial contained 100 units, enough for 4–5 treat-ments. In 2002, estimates of how much a doctor could charge patients foradministering the one vial ranged from $1,600 to $2,800.9 Sales of Botoxincreased steadily and in 2008, it was expected to fetch $1.38 billion in rev-enues. Pyott, Allergan’s CEO, was quoted in 2006 as saying, “To sell $830million of this stuff, you need less than one gram [of the active ingredient].”10
Pyott attributed some of Botox’s success to the fact that vanity was “a globalneed.”11
Although Botox’s 2002 FDA approval was only for use in improving frownlines between eyebrows, many doctors used it to smooth horizontal lines in theforehead, shape the jaw and sides of the face, widen the eyes to produce a morerounded look, lift the brow and shape eyebrows, treat crows feet, mouth frown,dimple chins, lines on the neck, and other cosmetic areas.12 The results of manyof these applications were enhanced when the procedures were complementedby other procedures such as laser resurfacing. In addition to these cosmeticapplications, Botox had other nonvanity applications.13 It was used by phys-icians to treat back pain in some patients who did not respond well to trad-itional pain medication, treat migraine and tension headaches, excessive sweat-ing (hyperhirosis), and bladder problems (incontinence). In Canada, it wasapproved for frown lines, crossed eyes, eye and facial spasm, wry neck, footdeformity, spasticity, and excessive sweating.
412 Cases

CompetitorsBotox faced two kinds of competition. First, it was taking on established com-petitors in each of the different markets that Allergan hoped to invade. In theface wrinkles market, it was wrestling away market share from those surgeonsthat performed facelifts, eyelid surgery, and other face procedures.14 Then therewere less invasive procedures such as chemical peel and laser skin resurfacing.More menacing was the impending approval of another botulinum toxin type-A compound, with trademark name Reloxin. Reloxin had been developed inCanada by Ipsen, Inc., but in 2006 Medicis, a US specialist pharmaceutical firm,had entered an agreement with Ipsen to develop, distribute, and commercializeReloxin in Canada, Japan, and the USA.15 If and when the drug received FDAapproval, Medicis would pay Ipsen $25 million. By October 2007, Reloxin hadbeen approved in 21 countries for aesthetic use, but approval in Japan, Canada,and the USA had not yet been received. On December 6, 2007, Ipsen andMedicis announced that an application for FDA approval for aesthetic indica-tion had been submitted.
Cosmetic Procedures MarketCosmetic surgery used to be frowned upon but by the 2000s it had become sopopular that people used to have Botox parties to discuss their latest proceduresor the ones they intended to undertake soon. The average age of people whowanted to look younger was dropping. In 2008, according to WebMD, themost popular cosmetic procedures were liposuction, eyelid surgery, breastimplants, nose jobs, facelifts, and Botox injections.16 Others included breastlifts, tummy tucks, spider veins, and skin resurfacing. The fees for some of theseprocedures are shown in Exhibit 8.1.
Exhibit 8.1 2008 Plastic Surgery Fees
Procedure Fees Average fees
Breastaugmentation
5,000–7,000 Surgeons fee: $3,050Anesthesiologist: $700Facility fee: $950Implant fee: $1,300Average total cost : $6,000
Breast lift 4,000–9,000 Surgeons fee: $3,500Anesthesiologist: $700Facility fee: $1000Average total cost: $5,200
Breastreduction
5,000–10,000 Surgeons fee: $3,500Anesthesiologist: $700Facility fee: $1000Average total cost: $5,200
Eyelid surgery 1,500–7,000 Surgeons fee: $2,500Anesthesiologist: $700Facility fee: $800Average total cost: Upper and lower lids $4,000
(Continued overleaf )
Botox: How Long Would the Smile Last? 413

AllerganAlthough with a market capitalization of $16 billion on July 17, 2008, Allerganwas nothing compared to Silicon Valley’s behemoths such as Intel ($128 bil-lion), Google ($167 billion), eBay ($31.6 billion), Cisco ($128.5 billion), andOracle ($108 billion), it was Orange County, California’s largest firm and thepride of Southern California. In 2007, Allergan had net profits of $499 millionon net product sales of $3.88 billion (Exhibit 8.2). Some $1.212 billion of thesales came from Botox, which grew 23% over 2006.17 The growth was fasteroutside the USA where there was more competition. A third of its sales wereinternational. Allergan claimed to have an 85% cosmetic market share in fiveEuropean countries where Reloxin was being marketed under the brand nameDysport by Paris-based Ipsen.18 As shown in Exhibit 8.2, Allergan had twodivisions: Specialty Pharmaceuticals, and Medical Devices. Selected productsfrom each of these divisions are shown in Exhibit 8.3. One of these products,
Exhibit 8.1 Continued
Procedure Fees Average fees
Facelift 6,000–12,000 Surgeons fee: $5,000Anesthesiologist: $1,200Facility fee: $1,700Hospital fee: $600Average total cost: $8,500
Lipenhancement
300–5,000 Cost per procedure: collagen injection $333Lip augmentation (other than injectable materials) $1,570Surgeons fee: $1,600Facility fee: $400Average total cost: $2,000
Liposuction 2,000–10,000 Surgeons fee: $2,000Anesthesiologist: $500Facility fee: $700Average total cost: (One Area) $3,500
Male breastreduction
6,000–9,000 Surgeons fee: $2,500Anesthesiologist: $700Facility fee: $1000Average total cost: $5,200
Rhinoplasty 3,000–12,000 Surgeons fee: $3,000Anesthesiologist: $700Facility fee: $800Average total cost: $4,500
Tummy tuck 5,000–9,000 Surgeons fee: $4,200Anesthesiologist: $500Facility fee: $700Average total cost: $6,400
Source: Plastic surgery research information. Retrieved July 19, 2008, from: http://www.cosmeticplasticsurgerystatistics.com/costs.html.
414 Cases

Exhibit 8.2 Allergan’s Product Areas
(In $ million) YearProduct area 2007 2006 2005 2004 2003
Specialty pharmaceuticalsEye care pharmaceuticals $1,776.5 $1,530.6 $1,321.7 $1,137.1 $999.5Botox/neuromodulator 1,211.8 982.2 830.9 705.1 563.9Skin care 110.7 125.7 120.2 103.4 109.3Urologics 6.0
Subtotal pharmaceuticals 3,105.0 2,638.5 2,272.8 1,945.6 1,672.7Other (primary contract sales) 46.4 100.0 82.7
Total specialty pharmaceuticals 3,105.0 2,638.5 2,319.2 2,045.6 1,755.4
Medical devicesBreast aesthetics 298.4 177.2Obesity intervention 270.1 142.3Facial aesthetics 202.8 52.1
Core medical devices 771.3 371.6Other 2.7
Total medical devices 774.0 371.6Total product net sales $3,879.0 $3,010.1 $2,319.2 $2,045.6 $1,755.4
Source: Allergan Inc. 2007 Annual Financial Statement. Retrieved July 18, 2008, from http://files.shareholder.com/downloads/AGN/362148606x0x184012/BB8ED2E7-30CF-443D-A2F7-0935FE134F78/2007AnnualReport.pdf.
Exhibit 8.3 Allergan’s Products in 2008
Specialty pharmaceuticals Medical devices
1. Eye carea. Acular (allergic conjunctivitis)b. Alocril (allergic conjunctivitis)c. Alphagan (glaucoma)d. Combigan (glaucoma, ocular hypertension)e. Elestat (allergic conjunctivitis)f. Exocin (ophthalmic anti-infective)g. Ganfort (glaucoma)h. Lumigan (glaucoma)i. Ocuflox (ophthalmic anti-infective)j. Oflox (ophthalmic anti-infective)k. Pred Forte (opthalmic anti-inflammatory)l. Restatis (chronic dry eye disease)m. Zymar (bacterial conjunctivitis)
2. Neuromodulatora. Botox (neuromuscular disorder treatment)b. Botox cosmetic (wrinkle reduction)
1. Breast aestheticsa. CUI (implants)b. Inspira (implants)c. McGhan (implants)d. Natrelle (implants)e. Tissue expanders
2. Obesity interventiona. BIB System (stomach implant)b. Lap-Band (stomach implant)
3. Facial aestheticsa. CosmoDerm and CosmoPlast (dermal filler)b. Juvederm (dermal fillers)c. Zyderm and Zyplast (dermal fillers)
(Continued overleaf )
Botox: How Long Would the Smile Last? 415

dermal fillers, was of particular interest when planning for Botox. Dermal fillerswere injectible products that were designed to restore the youthful firmness totissue that had gradually broken down with age.
Looking ForwardThe board member realized that he would need to do more research to under-stand more about Allergan’s business model before the next board meeting.19
The good old days when board members used to show up to board meetingsand rubberstamp everything that management wanted were gone. He could notafford to look bad when asking questions at the next meeting. What shouldAllergan’s next steps for Botox be?
Exhibit 8.3 Continued
Specialty pharmaceuticals Medical devices
3. Skin Carea. Avage (skin wrinkles or discoloration)b. Azelex (acne treatment)c. Finacea (rosacea)d. M.D. Forte (line of alpha hydroxy acid
products)e. Prevage (skin lines or wrinkles and
protection) f. Tazorac (treatment for acne and psoriasis)g. Vivite (anti-aging)
4. Urologicsa. Sanctura (overactive bladder)
Source: Hoovers. Retrieved July 19, 2008, from http://0-premium.hoovers.com.lib.bus.umich.edu:80/subscribe/co/ops.xhtml?ID=ffffrffhsrccksjcsk
416 Cases

IKEA Lands in the New World
Who was the richest European in 2008? Ingvar Kamprad, the Swedish founderof IKEA.1 In fact, according to the Swedish business magazine Veckans Affarer,Ingvar Kamprad’s net worth in 2004 was $53 billion, making him the richestperson in the world, ahead of Bill Gates ($47 billion) and Warren Buffet($43 billion).2 Poor Bill! Poor Warren! In any case, a look at IKEA’s activities,especially in the USA, can give us some idea why the firm made its founder oneof the richest people in the world.
In 2007, IKEA had revenues of �19.8 billion and 522 million customersvisited an IKEA store some time during the year (Exhibit 9.1).3 The firm had netmargins of 10%, considered by analysts to be very good for a home furnishingsfirm. According to IKEA’s CEO, Anders Dahlvig in 2005, awareness of theIKEA brand was “much bigger than the size of” IKEA.4
Opening of a New StoreFor many customers, the IKEA experience started with the activities that leadup to the opening of an IKEA store. When the Edmonton store in northLondon, UK’s largest IKEA store, opened its doors on February 10, 2005, the
Exhibit 9.1 IKEA SalesBy year
Year Sales (�)
2007 19.82006 17.82005 14.8
By region in 2007
Region Share (%)
Asia and Australia 3North America 15Europe 82
Source: Retrieved June 24, 2008, from http://www.ikea.com/ms/en_US/about_ikea_new/facts_figures/index.html.
Case 9
discounts offered by the store and the pre-opening hype attracted 5,000–6,000visitors. The rush to get into the store resulted in casualties and the store wasforced to close temporarily after only 30 minutes.5 Over 2,000 IKEA fanaticscamped outside the new Atlanta, GA store seven days before the opening, somehoping to win one of the prizes for the first 100 people in line. The enthusiasmshown in these two cases was typical of most IKEA store openings. The localpress and media picked up on the stories, arousing even more interest in IKEA.
Inside the StoreIKEA stores were located outside city centers where there was plenty of park-ing. In 2006, it cost $66 million, on average, to open a new store.6 Blue-and-yellow Sweedish colors adorned the outside of each huge building—measuringan average 300,000 square feet. A daycare center allowed shoppers to drop offtheir kids and shop. The inside of the store was designed around a “one-way”layout to make it easy for customers to see all the products and displays. Thislayout contrasted with the layout of traditional US furniture stores where theinside was laid out so that a customer could go straight to what he or she waslooking for. But IKEA’s line of products and displays were such that manycustomers enjoyed the experience of going through the long one-way, pickingup a bargain every so often. Of course, there were shortcuts to the displays inwhich one might be interested. The goal of the layout, furniture samples, dis-plays, sample rooms, and atmosphere was to delight the customer with theshopping environment, ideas, and the IKEA experience. Located at about thecenter of most stores was a restaurant for shoppers to take a break from shop-ping and enjoy some Scandinavian or local food, before continuing with shop-ping. Customers who needed help with service could look for someone to helpthem. Those who bought furniture took it home themselves and assembled it.
Product Design, Development, Distribution, andSupply“Designing beautiful-but-expensive products is easy. Designing beautiful prod-ucts that are inexpensive and functional is a huge challenge,”7 said JosephineRydberg-Dumont in 2005, president of IKEA of Sweden. In 2005, IKEA had 16in-house designers from eight different countries, and 70 freelancers from allover the world.8 The job of these designers was not only to come up withinspiring designs—contemporary or otherwise—but to work with in-houseproduction teams to identify the most suitable materials and lowest cost sup-pliers. In 2008, IKEA had 1,350 suppliers in 50 countries from which to choose(Exhibits 9.2).9 The firm served these suppliers from its 45 trading serviceoffices in 31 countries. It pioneered flat-pack designs so that furniture could bepacked and distributed to stores, or carried home with as little inconvenience aspossible. Shipping assembled furniture was regarded by IKEA as a big waste ofmoney since one was effectively paying to ship pockets of air. Using these flatpacks, supplies were transported to its 31 distribution centers in 16 countries,and distributed to its 232 stores in 24 countries.10 Furniture was not designed tobe as durable as that available in high-end furniture stores.
418 Cases

MarketingIKEA appeared to have made a connection with the global middle class, withlow budgets who were not quite sure about what furniture to buy before goingto IKEA for the first time. IKEA’s layout and displays suggested what these not-so-experienced furniture buyers could buy to fit their emerging lifestyles at amanageable budget. While it had developed a cult-like following, there werestill some people who were not as crazy about having to truck home furnitureand assemble it—themselves. IKEA appeared to have built a global brand andfollowing. In the USA, some of these followers could drive for as many as tenhours to get to an IKEA store. They eye-shopped online or used IKEA’s catalog,of which, there were plenty. In 2007, more than 191 million copies of thecatalog were printed in 56 editions and 27 languages, more than copies of thebible. About a third of IKEA’s product line was replaced every year.11 The topfive sales countries were Germany (16%), USA (10%), UK (9%), France (9%),and Sweden (7%) (Exhibit 9.3).
Exhibit 9.2 PurchasingBy region in 2007
Region Share (%)
Asia and Australia 3North America 33Europe 64
By top purchasing countries in 2007
Country Share (%)
China 22Poland 16Italy 8Sweden 6Germany 6
Source: Retrieved June 24, 2008, from http://www.ikea.com/ms/en_US/about_ikea_new/facts_figures/index.html.
Exhibit 9.3 Top Sales Countries in 2007
Country Share (%)
Germany 16USA 10UK 9France 9Sweden 7
Source: http://www.ikea.com/ms/en_US/about_ikea_new/facts_figures/index.html: Accessed: June 24, 2008.
IKEA Lands in the New World 419

IKEA CultureMany of the values that underpinned the IKEA culture appeared to have comefrom founder Kamprad’s thrifty, hard-working, value-for-the-buck mentality.No one was too important for any job. For example, during the company’sAntibureaucracy Week, CEO Dahvig would be “unloading trucks, and sellingbeds and mattresses.”12 Wastefulness was considered a sin. Flying first class wasconsidered unusual.
US Furniture MarketThe highly fragmented US furniture market could be divided into low-end andhigh-end. The high-end market was exemplified by firms such as Ethan Allenthat had large selections of furniture, superior in-store service, high qualityfurniture, classy environment, and financing, but carried a high price tag tomatch. These firms would customize your furniture for you, deliver your furni-ture to your house, install it, and even take away old unwanted furniture. Salesstaff took the time to explain everything about the furniture from the fabric tothe origins of the wood, and how durable the furniture was guaranteed to last—often longer than the customer’s marriage or lifetime. They did not carry themany other products that IKEA carried, choosing to focus on furniture and fewother furnishings. The low-end was exemplified by Wal-Mart, where the costwas lower than that at the high-end but with limited selection, quality, andservice to match. The shopping atmosphere was not as flattering.
IKEA in the New WorldIn 2008, IKEA USA was doing very well; but things had not always been thatway. IKEA opened its first US store in 1985, just outside Philadelphia. In theyears that followed, it would open more stores in the USA and make someclassic mistakes before correcting them. According to a former IKEA USemployee, “we got our clocks cleaned in the early 1990s because we reallydidn’t listen to the consumer,”13 IKEA managers did not do their homeworkwell and chose the wrong locations for many stores, their stores were too small,and their prices too high. Their beds were measured in metric units rather thanthe familiar American twin, queen, and king. Sofas were not deep enough, andso on. IKEA learnt its lessons and corrected its mistakes.
IKEA’s Corporate Structure and Holdings: Wherethe Money GoesIn 2008, each IKEA store was owned by a franchisee. The largest of thesefranchisees was Ingka Holding, a Dutch-registered private company. In 2004,Ingka Holding operated 207 of the 235 IKEA stores (Exhibit 9.4).14 In the yearthat ended in August of 2004, the Ingka Holding group had profits of �1.4billion on sales of �12.8 billion. The remaining 28 stores were owned by acollection of other private franchisees (Exhibit 9.4). Each store paid a royalty of3% of sales to Inter IKEA Systems, another Dutch-registered private company.Finally, Ingka Holding was itself wholly owned by Stichting Ingka Foundation,a Dutch-registered, tax-exempt, nonprofit legal entity.
420 Cases

IKEA: A Global Leader?In 2008, some academics enjoyed arguing about whether and why IKEA hadbecome a world darling, making its founder one of the richest people in theworld. Those who believed that the company was successful attributed thesuccess to some subset of the firm’s low cost offerings, designs-with-meaning,brand, store experience, its world-wide sourcing network, company culture, orgrowing worldwide community. Some were intrigued by what exactly Kam-prad had done to become so rich selling one of the most ancient products—furniture.
Study Questions
1 Why has IKEA been so successful and what have new games to do with it?2 What type of strategy is IKEA pursuing: global adventurer, global generic,
global heavyweight, or global star?3 What have new games had to do with Inkvar Kamprad being very rich?4 What is new game about IKEA’s structure?
Exhibit 9.4 Where the Money Goes
IKEA Lands in the New World 421

Esperion: Drano for YourArteries?*
$1.3 billion. Dr Roger Newton sat in his car after leaving the office for the day,and paused before turning the ignition and heading home. It was late Novemberin 2003, and Esperion Therapeutics, the company Dr. Newton founded, hadjust received an offer from Pfizer to buy the company for $1.3 billion. He smileda little, remembering several years earlier when he was recognized by Warner–Lambert (which was later purchased by Pfizer) for developing the world’s mostsuccessful drug—Lipitor. Along with the award, Dr Newton was provided witha cash prize: $20,000. Times had certainly changed, and the award for guidingEsperion through the development of several novel cardiovascular compoundshad obviously grown significantly. Dr Newton and his team invested time,money, and a great deal of thought and effort into Esperion, and while thefinancial offer from Pfizer was significant, he worried whether now was theright time to be acquired.
Esperion had just announced very positive clinical data for its lead candidate,and its novel method of addressing high cholesterol was generating interest inboth the scientific and business communities. Was now the right time to sell, orshould Esperion push on and build itself into a fully-integrated biotech com-pany? Was Pfizer the right suitor, or was there another company which couldbetter help continue Esperion’s success? What would happen to Esperion if itwas acquired—to the people who had founded and built the company, anddeveloped the molecules so highly regarded today? Dr Newton turned his keyand pulled out of Esperion’s parking lot. He had several weeks to evaluatePfizer’s offer, and would need the time to think fully through his options.
CholesterolCholesterol is a natural substance used in the body for a variety of purposesfrom cell membrane formation to the makeup of hormones. The liver makesmost of the cholesterol a person needs; however, it is also found in many foodsand is an inherent part of many diets. Cholesterol levels result from both geneticand dietetic influences. While genetic influences are beyond an individual’s con-trol, lifestyle choices that are marked by fatty foods and a lack of exercise serveto increase cholesterol levels for many people.
* This case was written by Brian Levy, Melissa Vasilev, Jess Rosenbloom, Scott Peterson, andPatrick Lyon under the supervision of Professor Allan Afuah as a basis for class discussion andis not intended to illustrate either effective or ineffective handling of a business situation.
Case 10

Cholesterol is transported through the bloodstream when it is coupled withspecial carriers called lipoproteins. Low-density lipoprotein (LDL), oftenreferred to as “bad” cholesterol, transports cholesterol from the liver to thebody’s cells for use. High-density lipoprotein (HDL), often referred to as“good” cholesterol, removes cholesterol and other lipids (fats) from arterialwalls and other tissues, transporting them to the liver where they are eliminatedfrom the body.
Complications from CholesterolExcessive levels of LDL can lead to the build-up of cholesterol and other fats inthe walls of arteries, a condition known as atherosclerosis, causing a progres-sive narrowing of arterial walls. If unchecked, these deposits can eventuallyform a plaque. If a plaque ruptures and a clot forms, potentially blocking anartery, a heart attack can result. A heart attack may also result if excessiveamounts of plaque form in the arteries that deliver blood to the heart, known ascoronary arteries, slowly starving the heart muscle of oxygen needed to func-tion. This set of complications is also known collectively as coronary arterydisease and is the number one cause of death in the USA (Exhibit 10.1).
High LDL also increases the chances of stroke. Like dislodged plaque block-ing a coronary artery of the heart, if a clot cuts blood flow to the brain, seriousnervous system damage or even death may occur. Further, increased blood pres-sure from high LDL also poses the risk that sensitive arteries near the brain mayburst, resulting in nervous system damage or death.
Treatment OptionsTo treat high LDL levels and reduce the likelihood of the associated healthrisks doctors had several options at their disposal. Base recommendationsalways included diets that were low in saturated fat and an increase in physicalexercise. However, lifestyle changes alone were rarely enough to reduce moreelevated patient LDL levels. Physicians often chose from the following optionsto reduce further the risks posed by cholesterol:
Pharmaceuticals (statins)—If LDL levels had not dropped enough after6–12 months of lifestyle changes, physicians recommended a drug called a
Exhibit 10.1 Selected Disease Statistics—USA 2003
People who have one or more forms of cardiovascular disease (CVD) 71,300,000High blood pressure 65,000,000Coronary artery disease 13,200,000
Myocardial infarction (heart attack) 7,200,000Angina pectoris (chest pain) 6,500,000
Stroke 5,500,000
Deaths from cardiovascular disease 910,614Deaths from coronary artery disease 479,305Deaths from cancer (all types) 554,642Deaths from accidents 105,695
Source: Cardiovascular Disease Statistics, 2003—American Heart Association.
Esperion: Drano for Your Arteries? 423

statin that works to reduce LDL levels. Statins interfere with the liver’sability to produce cholesterol and, depending on the particular patient,some statins may actually serve to increase HDL production slightly.Angioplasty—For patients with more advanced and potentially acuteatherosclerosis, a doctor may have elected for an invasive solution to coun-ter the effects of plaque in arteries. An angioplasty is a surgical procedure inwhich a surgeon inserts a small tube or balloon at the spot of arterial block-age. The balloon is inflated, expanding the artery allowing for greater bloodflow.Stents—If an angioplasty was carried out on coronary arteries, standardprocedure included the placing of a stent. A stent is a small metal scaffoldthat expands and supports the arterial wall to allow for greater blood flow.Stents are left in the patient after the angioplasty procedure to ensuregreater long-term blood flow. Some stents, called drug-eluting stents, arecoated with specialized pharmaceutical compounds to prevent futureblockages, a condition known as restenosis.
The Cardiovascular Drug MarketThe cholesterol drug market in 2003 was the world’s largest pharmaceuticalmarket, generating $17 billion annually and expected to grow at a 5% com-pound annual growth rate (CAGR) through 2010.1 While the market was com-prised of three therapeutic classes—statins, resins, and fibrates—the statin classdominated treatment, comprising 90% of dollar volume. Within the statinmarket, an oligopoly competed fiercely: Pfizer, Bristol-Meyers Squibb, andMerck promoted Lipitor, Pravachol, and Zocor against each other, generating$8 billion, $2.2 billion, and $5.5 billion, respectively.2 With each drug having asimilar efficacy and safety profile, companies utilized their significant cardio-vascular experience to apply large sales forces, high marketing spend, andexhaustive post-approval clinical trial strategies to differentiate drugs tocardiologists.
While heavy market development was helping to expand the hypolipemicmarket, several additional characteristics were expected to contribute to themarket’s growth. Recent updates to treatment guidelines encouraged physiciansto pursue lower target lipid levels in their patients, causing upward titration instatin dosage. Additionally, the first combination product—Zetia—hadrecently been launched, offering a complementary treatment to be added toongoing statin use to increase efficacy (raising the overall cost of treatment),and additional combination treatments were expected. Lastly, patient demo-graphics were expected to contribute to growing the incidence of cardiovasculardiseases worldwide: aging populations, and increasingly unhealthy eatinghabits, in the USA and Europe were driving the overall number of possiblepatients significantly.3
While patient populations and new therapeutic guidelines were expandingthe hypolipemic market, two issues did threaten the market’s growth. Zocor,Pravachol, and Lipitor all faced patent expiry by 2010, and the entrance ofgeneric forms of these drugs (typically at 10–20% of branded patent prices)would erode branded sales of these drugs significantly. Additionally, patientcompliance with statin regimens was a continuing issue. Because statins were
424 Cases

prescribed as a preventative measure (prior to a heart attack or other majorhealth event), patients often did not recognize the importance these drugsplayed in continuing their health—they often did not adhere to therecommended treatment frequency that physicians recommended, adverselyaffecting sales.
The Pharmaceutical Development ProcessWith several well-entrenched, well-performing statins already on the market in2003, few statins were in trials or expected to be developed in the future.4
Instead, new classes of drug were being developed either to complement orimprove upon the treatment success of the statins. New molecules in develop-ment faced tremendous difficulty reaching the market, however, due to signifi-cant regulatory and financial requirements (Exhibit 10.2).
Financial requirements for pharmaceutical research and development areextremely high, with research costs for each new approved drug compoundreaching as high as $850 billion. Additionally, once the decision to pursue a
Exhibit 10.2 Drug Development Process
The Food and Drug Administration (FDA) regulates drug development and requires progressionthrough testing stages to ensure the safety and efficacy of potential drugs.
• Drug Discovery is the first step in development, and is conducted in order to test a potentialmolecule’s effect on a disease target ex vivo (not in a live subject). Once a basic understanding of adisease is established, scientists will screen thousands of compounds in order to determine oneor several “lead” compounds which seem to have an effect on the disease mechanism and whichwarrant testing in vivo (in a live subject).
• Preclinical Studies are done in animals, to determine the effect of a new molecule on a livingorganism. Scientists monitor the drug’s safety in the animal and also monitor its effect on thetarget disease, attempting to understand whether the molecule has potential benefit in humans.Preclinical studies typically take 3–6 years.
• Phase I Studies typically involve 20–100 healthy volunteers, and are conducted in order to gaugebasic characteristics of a potential new drug in humans: how the drug is absorbed, distributed,metabolized and excreted, as well as its pharmacokinetics (how long the drug is active in thebody). Phase I studies typically take six months to one year to complete.
• Phase II Studies typically involve 100–500 volunteers who have the target disease. In this phase,companies attempt to establish “proof of concept:” that the potential new drug actually has abeneficial effect on its target disease. Scientists monitor the drug’s effect on the disease as well aspotential side effects, and attempt to determine the appropriate dose for the new drug. Phase IIstudies typically take six months to one year to complete.
• Phase III Studies typically involve 1,000–5,000 sick patients, and are conducted in order to providestatistically significant proof that the potential new drug is effective against its target disease.Physicians monitor patients at regular intervals and test for side effects. Phase III trials can takefrom one to four years to complete. At the end of Phase III trials, companies will submit a NDA(New Drug Application) to the FDA in order to gain approval to launch and market the drugcommercially.
• Phase IV Studies are clinical trials required after the drug has been approved (in this case, drugs areoften said to have received “conditional approval”) in order to provide the FDA with further dataregarding the drug or more long-term evidence of its use. Companies are required to fulfill thesedata requirements, but may do so after launching the drug commercially. Studies can range in bothyears and expense.
Source: Clinical trials. Retrieved July 22, 2008, from http://en.wikipedia.org/wiki/Clinical_trial.
Esperion: Drano for Your Arteries? 425

drug target is made, the probability of passing through each trial and success-fully reaching the market is very small. Of the compounds that are chosen toexit preclinical trials, only 8% will be approved by the FDA (Exhibit 10.3).
The large expenses of drug development, and large risk associated at eachtrial stage, represent significant decision points for companies engaging in drugdevelopment. Because of these factors, alliances between healthcare companiesare frequent: small companies with novel compounds often partnered withlarger sales and marketing-focused “big pharma” companies to help defraydevelopment costs and provide a commercial outlet for drugs. In fact, in thepost-bubble year of 2002, biotech companies raised $10.5 billion in financingfrom venture capital, IPOs, and other financing mechanisms. However, the bio-tech sector pulled an additional $7.5 billion through 411 partnering revenues—representing 42% of all funding for the year and yielding an average of about$18 million per agreement.
CompetitionIn 2003, there were three major cholesterol drug makers: Merck which pion-eered the statin drug category, Pfizer, and Bristol-Myers Squibb. Pfizer’s Lipitorhad a 46% share of the market, Merck’s Zocor had 32%, Bristol MyersSquibb’s Pravachol had 13% and the remaining 9% was split among otherstatin and nonstatin drugs.5 The project market for cholesterol drugs for whichthese firms were vying, a summary of their financials, and their costs of capitalare shown in Exhibits 10.4, 10.5, and 10.6, respectively.
Pfizer
Founded in 1849, Pfizer grew to become the world’s largest pharmaceuticalcompany. The firm, based in New York, focused on discovering, developing,marketing, and delivering medications for both humans and animals. Pfizer ledthe statin market with Lipitor, the most popular drug in the world. In addition
Exhibit 10.3 Drug Trial Expenses per Approved Compound
R&D Animal Phase I Phase II Phase III TOTAL
Cost ($ billion) 358.0 12.5 42.9 117.8 325.8 857.0Time (months) 21.6 38.0 56.5 116.1Success rate 69% 38% 15% 8% (FDA approval)
Source: Joseph Dimasi, Ronald Hansen, and Henry Grabowski, The price of innovation: new estimates of drugdevelopment costs, Journal of Health Economics, 2003. Bain and Co., 2003.
Exhibit 10.4 Total Hypolipemic Market Sales and Expectations
Year 2000 2001 2002 2003E 2004E 2005E 2006E 2007E 2008E 20009E
Revenues($ million)
13,937 15,830 17,210 19,845 21,990 24,232 25,390 26,725 27,680 29,115
Source: CDC IXIS Securities, Cholesterol: the battle rages on, February 24, 2003
426 Cases

to Lipitor, Pfizer’s internal development of a cholesterylester transfer protein(CETP) inhibitor called Torcetrapib stood to strengthen the company’s hold onthe cardiology market. Pfizer focused Phase III studies on the combination ofLipitor and the new Torcetrapib, based on promising Phase II studies. Theplanned Phase III trials would be the largest for any drug of any type. Torce-trapib was not only one of the most promising drugs in Pfizer’s pipeline, butalso within the entire spectrum of CETP-inhibitors.6 Pfizer backed Lipitor andother drugs with the strongest sales and marketing spending in the industry.
Merck
Merck & Co., Inc. (Merck) was a global pharmaceutical company based inNew Jersey and founded in 1901. It had two statins on the market: Mevacorand Zocor. Mevacor, launched in 1987, was one of the first statins to belaunched. Mevacor experienced tremendous success, which built high expect-ations for Merck’s second-generation statin, Zocor and by 2002, Zocor hadreplaced sales of Mevacor.7 Zocor’s popularity made it the top-selling drug forMerck and the number two cholesterol medication in the world.8 Historically,Merck’s drug pipeline created numerous successes for the company acrossseveral treatment categories, but by 2002, several Phase III setbacks called itspipeline into question. Merck continued to develop promising arthritis anddiabetes drugs in its pipeline, but its cardiovascular pipeline was relativelyweak.9 The most promising cardiovascular drug was based on a joint venturebetween Merck and Schering Plough. They co-developed a combination Zocor–
Exhibit 10.5 2002 Select Pharmaceutical Company Financial Information ($000s)
Sales ($) BMS 18,119 Merck 51,790 Pfizer 32,373
Cogs ($) 6,388 33,054 4,045Marketing, sales, and admin. ($) 5,218 6,187 10,846R&D ($) 2,218 2,667 5,176Other costs ($) 1,648 (331) 510Total costs($) 15,472 41,577 20,577Pre-tax income ($) 2,647 10,213 11,796Taxes ($) 613 3,064 2,609Net income ($) 2,034 7,149 9,187
Source: Firm 10-Ks.
Exhibit 10.6 Nominal and Real Cost-of-Capital (COC) for the Pharmaceutical Industry,1985–2000
1985 1990 1994 2000
Nominal COC (%) 16.1 15.1 14.2 15.0Inflation Rate (%) 5.4 4.5 3.1 3.1Real COC (%) 10.8 10.6 11.1 11.9
Source: Dimasi, 2003, Tufts Center for the Study of Drug Development.
Esperion: Drano for Your Arteries? 427

Zetia drug that they thought might be more effective than Zocor alone throughattacking cholesterol from different approaches.10
Bristol-Myers Squibb
Bristol-Myers Squibb (BMS), based in New York, was founded in 1914. In2002, BMS generated $18.1 billion in revenue, 81% of which came frompharmaceuticals.11 BMS is responsible for the third most successful statin in theworld, Pravachol. Pravachol was expected to lose share over the next few yearsas its patent expired in 2006.12 Pravachol was expected to be BMS’s only chol-esterol drug success, given the company’s poor drug development track recordin recent years. Two new products, Questran and Pravigard Pac, were launchedin 2003, although neither was projected to generate significant revenue. Acholestyramine, Questran targeted a nonstatin method of cholesterol reduction,but its market was much smaller than the statins. Pravigard Pac was simply acombination package of Pravachol and aspirin for patients requiring bothmedications.13
Other Competitors
London-based AstraZeneca launched a new statin in 2003, Crestor. On thesurface, Crestor appeared to face an already saturated market; however, Crestoralso demonstrated that it could be “unquestionably”14 the most effective statinon the market, including the wildly successful Lipitor. One analyst projectedthat Crestor could own 30% of the cholesterol drug market within sevenyears.15 Such promising potential for Crestor could undermine the current statinoligopoly and drive current players to seek out new cholesterol treatmentsolutions.
In addition to large pharmaceutical companies, over 35 companies weremarketing or developing lipid therapeutics that were in some stage of clinicaltrials. It is unknown how many additional companies were researching solu-tions.16 Most of the new drug development was centered on increasing theamount of HDL through a variety of new avenues, rather than lowering LDLwith traditional statins.
Esperion Therapeutics
Company History
Esperion Therapeutics was founded in July 1998 with $16 million in capitalprovided by four venture capital firms and several undisclosed investors.17
Based in Ann Arbor, Michigan, the firm focused on conducting large moleculeresearch on cardiovascular drugs with a specific emphasis on cholesterolmedication.
The driving force behind Esperion was its President and CEO, Dr. RogerNewton. At the time of Esperion’s founding, Newton was already a well-established name in the cardiovascular pharmaceutical industry. Newton wasmost famous for his work as a lead scientist at Warner-Lambert, where he wasinstrumental in the development of Lipitor.18 After his experience developing
428 Cases
Lipitor, Newton spurred the founding of Esperion to drive development furtherin cholesterol drugs. He was considered one of the leading thinkers in choles-terol therapy.
Esperion made its first significant move only a month after its founding bylicensing an HDL-raising drug from Pharmacia called ETC-216.19 The researchbehind ETC-216 first appeared in a 30-year old study of a group of rural Italianvillagers with surprisingly long life spans. The research uncovered a geneticanomaly in the villagers, forming the basis for ETC-216’s development.20 Oncelicensed from Pharmacia, the drug provided the cornerstone for Esperion’scholesterol research. The HDL-raising potential of ETC-216 offered a dramaticdeparture from the statins that target lowering LDL. Backed by the promise ofETC-216 and research on similar HDL-raising drugs (e.g. ETC-588 alsoshowed significant promise), Esperion made an initial public offering in Augustof 2000. The company raised $58 million despite never having generated asingle dollar of revenue.21 Since its founding, Esperion managed to raise $200million through venture capital and stock offerings.22
Esperion used the money raised in its IPO to drive forward clinical trials of itsHDL drugs over the next several years. In June 2003, Esperion announcedsignificant progress in the development of ETC-216. A Phase II clinical studyrevealed that ETC-216 successfully reduced the heart plaque in study partici-pants. Although the study contained only 47 patients, too few for a statisticallymeaningful sample, the effectiveness and rapidity of the treatment created abuzz across the pharmaceutical industry.23 Furthermore, the reputation ofNewton in the cholesterol industry continued to grow with ETC-216’s success.Esperion’s stock price reached a 52-week high after the June announcement.24
Challenges
Despite excitement over ETC-216’s Phase II clinical trials, Esperion faced asteep uphill battle. Many biopharmaceutical companies with promising earlystage clinical trials had faced serious setbacks in later stages.25 Esperion wouldnot be immune to this statistic.
In addition, Esperion was a new biopharmaceutical firm and did not have thecapabilities of its larger competitors. It currently had no way of commercial-izing its therapies, and therefore, had to rely heavily on the money earned fromits IPO as well as venture capital funding to support its clinical trial efforts. Ifany of Esperion’s drugs were capable of making it through clinical trials andearned FDA approval, Esperion did not have the infrastructure to commercial-ize its product candidates. Esperion would again have to rely on third parties tosuccessfully bring its new drug to market.
Current Pipeline Portfolio
Esperion’s pipeline of products looked to replace both statin treatments as wellas surgical procedures. According to preliminary results for clinical trials, Espe-rion’s product candidates were able to raise levels of HDL. This fostered theremoval of plaque from the artery walls as well as its movement to the liver forexpulsion from the body. In addition, there were also signs that the damagedarteries were able to repair themselves. If Esperion could get one of the four
Esperion: Drano for Your Arteries? 429

products in its pipeline through clinical trials, it could revolutionize the waydoctors treated cardiovascular disease.
• ETC-216 (AIM): ETC-216 was being developed as an infused treatment forpatients with acute coronary syndrome.26 The properties of ETC-216allowed it to mimic naturally-occurring HDL as well as improve HDL’sfunction. Initial preclinical studies as well as Phase I and II clinical trialsillustrated positive results for ETC-216 and proved its capabilities. ETC-216 was now poised for Phase III trials. Esperion hoped ETC-216 would bea major success in the industry. As of 1999, there were already 47 drugs inthe market with greater than $500 million in US sales.27
• ETC-588 (LUV): ETC-588 was also being developed as an infused treat-ment for acute coronary syndromes.28 When introduced in the humanbloodstream, the biopharmaceutical served as a “sponge” for cholesterol.Preclinical animal studies showed that ETC-588 did remove cholesterolfrom the arteries and helped arteries regain their flexibility and function.ETC-588 was beginning Phase II trials.
• ETC-642 (RLT Peptide): Esperion continued to develop RLT Peptide forthe treatment of acute coronary syndromes.29 ETC-642 had similar bio-logical properties to ETC-216 and ETC-588 in mimicking HDL, preventingthe accumulation of cholesterol on the artery walls. The completion ofPhase I trials in the first half of 2002 indicated that RLT Peptide was safeand well-tolerated and several different dose levels. The trials also illus-trated evidence of rapid cholesterol mobilization and increased HDL-cholesterol levels.
• ETC-1001 (HDL Elevating/Lipid Regulating Agents): Esperion was “pur-suing the discovery and development of oral small organic molecules thatcould increase HDL-C levels and/or enhance the RLT pathway.”30 Pre-clinical studies not only showed an increase in HDL-C molecules in ani-mals, but also suggested that these molecules might also have “anti-diabeticand anti-obesity properties.” Esperion hoped to file an NDA for ETC-1001and begin Phase I clinical trials in 2003.
Pfizer Inc. Company Background
Strategic Overview
Pfizer fueled its growth in research and products in three primary ways: internalR&D, mergers and acquisitions, and agreements and alliances. Given this struc-ture, Pfizer had hundreds of subsidiaries throughout the world. Despite pres-sures to develop drugs at a faster rate than witnessed in recent years, the indus-try had experienced a significant reduction in M&A activity, from $23 billion inthe first half of 2001 to just $3 billion in the second half of 2002. When con-sidering transactions, buyers were becoming more cautious, and started relyingmore heavily on licensing deals.31 The actions of Pfizer proved to be exceptionsto this rule, as the firm undertook two significant mergers: Warner–Lambert in2000 (the largest hostile takeover ever) and Pharmacia in 2003. Placing pres-sure on competitive firms to consolidate, Pfizer boasted the industry’s largestpharmaceutical R&D organization with a library of more than 700 major
430 Cases

active collaborations and a 2003 R&D budget of $7.1 billion.32 Pfizer’s pipelineacceleration strategy was expressed through the comments of Dr LaMattina,president of Pfizer Global Research and Development:
Pfizer’s strength is its ability to maximize opportunities from our internalprograms and through partnerships. Our scale and R&D breadth are obvi-ous advantages that we secure with very strict attention to our goals. Someof our competitors believe the term ‘research management’ is an oxymoron,but we don’t think so at Pfizer. True, it’s hard to predict when discoverieswill occur. The process can be managed to maximize the chances of dis-coveries happening . . . Before we closed the acquisition of Pharmacia, weconducted extensive due diligence and understood the value of the pipeline,and the way it complemented the R&D efforts under way at Pfizer. Therewere very few surprises and we have retained the great majority ofprojects.33
Proper management of acquisitions, combined with links to more than 250partners in academia and industry, strengthened Pfizer’s position on the cuttingedge of science by providing access to novel R&D tools and key data on emer-ging trends.
Marketing
Capitalizing on the US Food and Drug Administration’s 1997 decision toloosen restrictions on consumer advertising of prescription medications, Pfizerrecruited a new senior media director in 1999 to establish Pfizer’s first consumermedia unit and form a company approach on how to use the fledgling direct-to-consumer (DTC) medium.34 Two years later, Pfizer was regarded as being in thefront tier in DTC brand building with hits such as Zyrtec and Viagra. By usingconsumer ads to drive sales of prescription drugs, Pfizer became a major playerin the annual TV upfront season. Over the first six months of 2001, Pfizerbecame the second largest DTC spender with about $76 million.35
Manufacturing and Distribution
For decades, the manufacturing component of the pharmaceutical industry hadbeen highly inefficient with manufacturing expenses accounting for 36% of theindustry’s costs. The top 16 drug companies spent $90 billion on manufactur-ing in 2001.36 With inefficiencies resulting in lower quality and product recalls,the FDA updated its manufacturing regulations for the first time in 25 years in2003. In response, Pfizer applied funding towards manufacturing research anddeveloped a fast and accurate new way to test drugs. This technology was beingtested in few of Pfizer’s plants around the world.
Pfizer had the distribution capability to launch a product simultaneously indozens of markets around the world. As of 2000, Pfizer’s US sales force con-sisted of 5,400 representatives in nine divisions. Pfizer’s rigorous training andongoing education programs were unmatched in the industry, yielding best-in-class sales representatives who consistently communicated advances in theunderstanding and treatment of diseases to millions of health-care providers.37
Esperion: Drano for Your Arteries? 431

In 2002, Pfizer’s pharmaceutical sales organization was placed first overall in asurvey of US physicians in nine core specialty groups for the seventh consecutiveyear.38
Pfizer and the Cholesterol Drug Market
Pfizer obtained the rights to the blockbuster drug atorvastatin (Lipitor) after theacquisition of Warner–Lambert in 2000. Prior to the acquisition, Pfizer hadentered into a marketing agreement with Warner–Lambert to help successfullylaunch the drug in 1996.
Warner–Lambert faced a number of setbacks in bringing Lipitor to market.The firm had recently dealt with a series of drug recalls of some of its majorproducts. Furthermore, Warner-Lambert’s sales force was much smaller in sizerelative to its competitors with established cholesterol drugs already in the mar-ket. Given these circumstances, the firm signed a comarketing alliance withPfizer. Pfizer agreed to cover a significant portion of the upfront expenses oflaunching Lipitor as well as use its extensive networks of sales representatives tobring the drug to market.39 In exchange, Pfizer would receive payments basedon Lipitor’s sales targets.
On November 5, 1999, American Home Products Corporation announced a$70 billion dollar merger agreement with Warner-Lambert. Such a deal left agreat amount of uncertainty regarding the future status of marketing rights toLipitor and the alliance between Pfizer and Warner-Lambert. Lipitor’s billionsin sales represented a large portion of Pfizer’s drug sales portfolio. Therefore,before the comarketing alliance came to an end, Pfizer placed its own hostile bidof $82.4 billion for Warner-Lambert. The two companies eventually merged in2000, giving Pfizer full rights to Lipitor.40 With Lipitor secured as a Pfizer prod-uct and Torcetrapib entering Phase III trials, Pfizer was poised to strengthen itshold on the cholesterol drug market.
Pfizer’s OfferIn November 2003, Esperion published the official results of its ETC-216 studyin the Journal of the American Medical Association. The article indicated thatits drug reduced build-up of fatty plaque in arteries by over 4% in patients whowere given weekly injections of the experimental medicine over a course of onlyfive weeks during the Phase II trial.41 According to John LaMattina, director ofresearch at Pfizer, ETC-216 would have to be tested on “hundreds, possiblythousands (of people), and would have to be shown to significantly reduce therisk of a second heart attack” before the Food and Drug Administration wouldapprove it. This type of clinical trial would require a significant investment.42
After the trial results appeared in the Journal of the American MedicalAssociation, Newton publicly announced that the company would be lookingfor a partner to develop and market the drug. Pfizer acquired first bidding rightsto co-develop and commercialize ETC-216 through its acquisition ofPharmacia.43
On December 21, 2003, Pfizer announced its intent to purchase EsperionTherapeutics for $1.3 billion. Pfizer made an all-cash tender offer to acquireshares of Esperion’s common stock at $35 per share.44 This price represented a
432 Cases

54% premium over Esperion’s average closing share price over the 20 tradingdays prior to the acquisition.45 At the time of the offer, Newton owned 890,000shares of Esperion stock.
The DecisionNewton had to decide if Esperion would benefit from a buyout by a majorpharmaceutical company. Dr Newton knew that his company faced an uphillbattle with the continued development of ETC-216. Phase III trials would proveincredibly expensive for Esperion and they would again have to look to venturecapital funding and potential stock offerings for additional cash. Dr Newtonknew that despite positive Phase II results, Phase III results could always benegative and ETC-216 might never make it to FDA approval. If, however, theETC-216 Phase III trials proved successful, Esperion would have to look for apartner to help launch and commercialize the product.
Dr Newton had a lot to consider. He had started Esperion so that he couldcreate an entrepreneurial environment for drug discovery, in which the scien-tists received the rewards for their research. If he sold out to Pfizer, would he begiving up everything he had worked so hard to create? Would Esperion be ableto maintain the entrepreneurial identity that had brought about the discovery ofa new line of cardiovascular pharmaceuticals? Would Newton be giving upcontrol over the development of ETC-216 and the other promising drugs inEsperion’s pipeline? In addition, how would his employees react to working fora major pharmaceutical company?
Dr Newton had to decide whether Esperion’s future laid as an independentbiotech company, a wholly-owned subsidiary, or an integrated part of “bigpharma.”
Esperion: Drano for Your Arteries? 433

Xbox 360: Will the Second Time beBetter?*
In early 2006, Sony, Microsoft, and Nintendo were battling for supremacy inthe $30 billion videogames industry, with each firm claiming victory. Who wasright? Why?
Creation and Growth of the Home Video GameConsole Market (1968–1995)1
Ralph Baer, the man who would come to be known as the father of the videogame, created a prototype home video game unit capable of playing 12 games in1968. This prototype was inspired by a project Baer was working on for the USmilitary to design a system that could help improve soldier reflexes. The mili-tary project eventually fizzled but Baer continued development with an eyetowards the US consumer market. It wasn’t until 1972 that Magnavox intro-duced Baer’s “Brown Box” as the first home video game system—commerciallytitled Magnavox Odyssey. Odyssey enjoyed mild commercial success, selling200,000 units between 1972 and 1975.
Video game mania truly swept the USA in 1975 when an agreement betweenSears Roebuck & Co. and Atari led to production of a home version of Atari’swildly successful coin-operated arcade game “Pong.” This helped bring Atari tothe forefront of the newly-emerging home video game console industry. In1977, Atari released Atari 2600, the first programmable home console.Incorporating an 8-bit Motorola 6507 microprocessor and 256 bytes of RAM,the 2600 was on the market through 1990 and sold more than 25 million units.Over 40 different manufacturers produced 200-plus game titles for the system,and total sales volume reached 120 million cartridges.
In the mid-1980s, Nintendo quickly displaced Atari as the market leaderfollowing the 1985 launch of its 8-bit Nintendo Entertainment System (NES).The smash hit Super Mario Brothers and other game titles helped catapultNintendo to the top of the console industry by the end of the 1980s. In 1989Sega introduced the first 16-bit console, Sega Genesis. This was Nintendo’s firstserious threat. The Genesis had improved graphics, faster processing speeds,and the popular Sonic the Hedgehog video game was released on it in 1992. To
* This case was prepared by Katy Chai, Victor Colombo, Elizabeth Huntley, Ian Mackenzie,Justin Manly, and Tatsuyoshi Matsuura under the supervision of Professor Allan Afuah as abasis for class discussion and is not intended to illustrate either effective or ineffective handlingof a business situation.
Case 11
compete with Genesis, Nintendo launched its own 16-bit console, Super NES,in 1992. Super NES was a huge success; over the course of its product life,upwards of 46 million units were sold worldwide, re-establishing Nintendo asthe console market leader. Sega, following two failed attempts to introduce newconsoles (Saturn in 1995 and Dreamcast in 1999), exited the console industry in2001 to focus strictly on video game development.
In June 1996, Nintendo released the Nintendo 64 (N64) in Japan to competewith Sega’s Saturn and Sony’s PlayStation, both of which had been launched in1995. However, N64 continued to use cartridge media, while its competitorshad moved to CD-based consoles. The largest N64 titles consisted of approxi-mately 32 megabytes while PlayStation and Saturn games used 650–700 MBCDs. This discrepancy put N64 at a significant disadvantage because its gameswere limited in terms of complexity and graphics, especially for role-playinggames which were becoming increasingly popular with consumers. Nintendoattempted to attract users with extraordinary titles such as the Super MarioBrothers series, but in 1997 Nintendo’s major software developer, Square Enix,moved its legendary Final Fantasy franchise to PlayStation. The success of thenew Final Fantasy VII elevated PlayStation’s market position and helped pavethe way for Sony’s dominance of the video game industry.
A New Competitor Emerges—Sony’s PlayStationDuring the 1970s and 1980s, Sony grew into one of the world’s most successfuland innovative consumer electronics companies. In the 1980s, Sony focused itsresources on developing game software for Nintendo but faced sluggish growthin this area. Seeking additional opportunities in the video game business, Sonyentered into a development partnership with the then-market-leader Nintendoto supply sound chips for Nintendo’s home video game console. However, thisrepresented a very limited opportunity for Sony in the rapidly-growing videogame industry.
In 1986, Nintendo and Sony worked together to develop a CD-ROM add-onfor Nintendo’s console to take advantage of the substantial data capacity of CDmedia. The game cartridge had been the primary media for Nintendo’s gamesystems, but the increasingly complex game content was beginning to drive upcartridge manufacturing costs. In addition, NEC and Sega had both introducedCD-ROM-based consoles to the market. Sony and Nintendo ultimately aban-doned their joint CD peripheral which Sony had reportedly completed in proto-type form.2 Nintendo then announced a new partnership with Philips todevelop improved CD-ROM technology in June 1991. In response to this newrelationship with a Sony competitor, Sony discontinued supplying sound chipsto Nintendo and in 1993 began development of its own CD-ROM-based videogame console. Code named “PS-X,” the project was the origin of the first gen-eration Sony PlayStation. In the fall of 1993, the ownership of the project wastransferred to the Sony Computer Entertainment, Inc., a newly-formed divisionwithin Sony comprised of approximately 60 members from Sony, Inc. and SonyMusic Entertainment, Inc.
Xbox 360: Will the Second Time be Better? 435
PlayStation (PS1) Launch
PlayStation was released in Japan at the suggested retail price of JPY39,800(approximately $395) on December 3, 1994. This launch date (12/3) wasadvertised extensively with the “1! 2! 3!” countdown promotional campaign.Unique ads such as this helped Sony quickly sell out of the 100,000 consolesthat were initially shipped to stores. Sega had launched its Saturn a monthearlier, in November, but critics heralded PlayStation as the superior machine.3
PlayStation was introduced in North America on September 5, 1995 at thesuggested retail price of $299, a full $100 less than analysts had expected.4 Over100,000 units were sold in the first weekend and over a million units sold overthe first six months. Sony released game titles in nearly every genre, includingBattle Arena Toshinden, Twisted Metal, Warhawk, Philosoma, Wipeout andRidge Racer. PlayStation quickly became the bestselling home video game con-sole to-date, only to be surpassed by its successor, PlayStation 2.
PlayStation 2 (PS2) Launch
In September 1999, Sony announced the introduction of its PlayStation 2 andassociated pricing to the public. Most major software manufacturers decidedearly on to develop games for PS2, resulting in mass media predictions of aSony-dominated game market. In February 2000, Sony began accepting preor-ders for PS2 on PlayStation.com. Initial orders via the website set sales recordsfor the game industry and the site was quickly overwhelmed by heavy traffic.PS2 was released for sale on March 4, 2000 in Japan and on October 26, 2000in North America. It sold well from the beginning (over 900,000 in Japan in thefirst weekend alone), partly due to the strength of the PlayStation brand and itsbackwards compatibility with PS1. This allowed Sony to tap in to the largeinstalled base of PS1 customers, games, and developers. In 2001, the launchesof Microsoft’s Xbox and Nintendo’s Game Cube increased competition in theindustry, but Sony’s release of several best-selling and critically-acclaimed gametitles helped PS2 to continue its market dominance. These titles included theever-popular Final Fantasy and Grand Theft Auto series. In several cases, Sonystruck exclusive deals with publishers to further strengthen its position.
Competition Heats UpMicrosoft officially announced the introduction of its Xbox on March 10, 2000and released the console to consumers on November 15, 2001.5 By late 2001,the video game console industry had become highly competitive as Sony, Nin-tendo, and Microsoft all offered extremely popular and attractive units.
Price Wars
One of the ways this competition manifested itself was through pricing. ThePS2 was launched in October 2000 at a retail price of $299. When the Xboxwas launched 13 months later, in November 2001, Microsoft matched the PS2’sprice despite the fact that this meant that the Xbox was estimated to be losing$150 per unit. But Microsoft priced the Xbox below its production cost to gain
436 Cases

market share quickly. Sony responded by slashing PS2 prices by $100 sixmonths later, a move which Microsoft immediately followed for the Xbox.Thus, Sony enjoyed 19 total months of selling PS2 at the original $299 retailprice while Microsoft was able to sell Xbox at this same price for only 6months.6
Price cuts in May became an annual event. In May 2003, both Sony andMicrosoft again cut their prices, this time by only $20 to bring their suggestedretail prices to $179. In May 2004, prices fell again, this time to $149. InNovember of that year, Sony launched a thinner version of PS2 known as Slim,then dropped the price one last time to $129 in May 2006, six months after therelease of Xbox 360, and six months prior to the release of PS2’s successor,PlayStation 3. Xbox’s price remained at $149.
Game Franchises and Online Play
The wildly popular Halo franchise was launched simultaneously with theXbox, and was followed by such hits as Project Gotham Racing and Dead orAlive. However, PS2, by virtue of its earlier launch date and preexisting fran-chises from PS1, controlled a number of key game series, including premiersporting titles from Electronic Arts such as Madden and NBA Live, as well asMetal Gear Solid and Grand Theft Auto.
A defensive tactic that Sony employed just prior to the Xbox’s launch was tonegotiate a period of exclusivity with game developers, usually lasting 6–12months, during which a new title would only be available on PS2. This, com-bined with disappointing reviews of a few early Xbox-specific titles, served todampen the initial demand for Xbox.
Further complicating matters was the fact that, despite Xbox offering signifi-cantly more processing power than PS2, many of the initial games developed forXbox did not take advantage of this capability. Thus, while Microsoft toutedthe superior performance offered by their machine, this power was not readilyapparent to gamers.
The release of Xbox Live in late 2002 gave Microsoft a head start in the realmof online gaming. This broadband service initially allowed gamers around theworld to compete head-to-head over the Internet just as if they were sittingtogether playing on the same console. Xbox Live also included the ability todownload new games, hardware updates, and other content. Although the ser-vice initially grew relatively slowly, within two years of launch Microsoftreported having enrolled over one million subscribers. The service was seen asespecially compelling for many of Xbox’s hardcore gamers, and would becomea standard offering among the next generation of consoles. An Xbox Live Goldsubscription costs $50 a year.7
The year 2004 saw Xbox hit a home run with the release of Halo 2, which seta record by exceeding $125 million in sales on its first day. The launch receivedheavy national news coverage with stories of the thousands of loyal Xbox userscalling in sick on the release date to wait in line, purchase the game, and thendevote the entire day to mastering it.8
Xbox 360: Will the Second Time be Better? 437
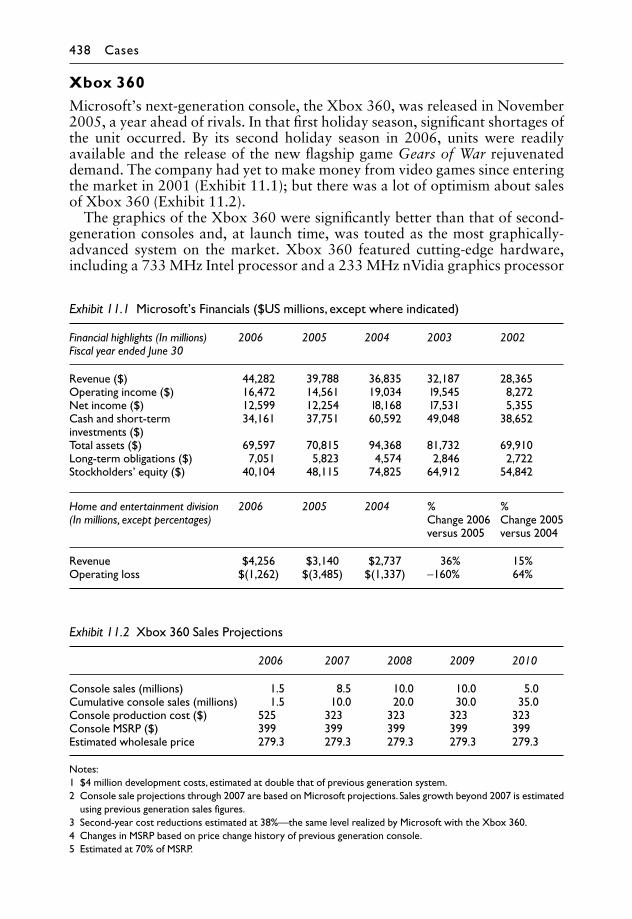
Xbox 360Microsoft’s next-generation console, the Xbox 360, was released in November2005, a year ahead of rivals. In that first holiday season, significant shortages ofthe unit occurred. By its second holiday season in 2006, units were readilyavailable and the release of the new flagship game Gears of War rejuvenateddemand. The company had yet to make money from video games since enteringthe market in 2001 (Exhibit 11.1); but there was a lot of optimism about salesof Xbox 360 (Exhibit 11.2).
The graphics of the Xbox 360 were significantly better than that of second-generation consoles and, at launch time, was touted as the most graphically-advanced system on the market. Xbox 360 featured cutting-edge hardware,including a 733 MHz Intel processor and a 233 MHz nVidia graphics processor
Exhibit 11.1 Microsoft’s Financials ($US millions, except where indicated)
Financial highlights (In millions) 2006 2005 2004 2003 2002Fiscal year ended June 30
Revenue ($) 44,282 39,788 36,835 32,187 28,365Operating income ($) 16,472 14,561 19,034 l9,545 8,272Net income ($) 12,599 12,254 l8,168 l7,531 5,355Cash and short-terminvestments ($)
34,161 37,751 60,592 49,048 38,652
Total assets ($) 69,597 70,815 94,368 81,732 69,910Long-term obligations ($) 7,051 5,823 4,574 2,846 2,722Stockholders’ equity ($) 40,104 48,115 74,825 64,912 54,842
Home and entertainment division 2006 2005 2004 % %(In millions, except percentages) Change 2006
versus 2005Change 2005versus 2004
Revenue $4,256 $3,140 $2,737 36% 15%Operating loss $(1,262) $(3,485) $(1,337) −160% 64%
Exhibit 11.2 Xbox 360 Sales Projections
2006 2007 2008 2009 2010
Console sales (millions) 1.5 8.5 10.0 10.0 5.0Cumulative console sales (millions) 1.5 10.0 20.0 30.0 35.0Console production cost ($) 525 323 323 323 323Console MSRP ($) 399 399 399 399 399Estimated wholesale price 279.3 279.3 279.3 279.3 279.3
Notes:1 $4 million development costs, estimated at double that of previous generation system.2 Console sale projections through 2007 are based on Microsoft projections. Sales growth beyond 2007 is estimated
using previous generation sales figures.3 Second-year cost reductions estimated at 38%—the same level realized by Microsoft with the Xbox 360.4 Changes in MSRP based on price change history of previous generation console.5 Estimated at 70% of MSRP.
438 Cases

capable of producing even more realistic graphics than previous machines. Notsurprisingly, the system also incorporated a Windows-based operating systemwhich Microsoft claimed simplified game development for developers.
Xbox 360 users (as well as users of the original Xbox) also had access to theXbox Live online gaming community. Over four million subscribers coulddownload games, compete and chat with friends, and buy maps and weapons.In addition to subscriptions, the service generated revenues through advertisingand additional content sales. Microsoft expected Xbox Live members to exceedsix million worldwide by June 2007.
Microsoft planned to release a game development kit for amateur gamedevelopers. The kit was expected to cost about $100 and allow developers tocreate shorter, less graphically advanced games. These games would then bemade available on Xbox Live.
On the one-year anniversary of Xbox 360’s initial release, Microsoftannounced the additional capability of downloading movies and televisionshows. Microsoft also added an HD-DVD unit to the list of accessoriesavailable for Xbox 360. The average consumer could not yet take advantage ofBlu-Ray capabilities and was unable to discern differences in quality betweenBlu-Ray and HD-DVD technologies. The HD-DVD addition was cheaperthan Blu-Ray. Xbox 360 could play music stored on an iPod or a Zune whilePS3 could only play music stored on the PlayStation Portable that was notwidely used in 2006.
Sony PlayStation 3 (PS3)Sony launched its Play Station 3 (PS3) on Friday, November 17, 2006 in theUSA. With only 400,000 units available in the US and two million worldwide,demand far exceeded supply. On opening day, it was reported that long lines ofcustomers got rowdy, with police having to disperse some crowds, a stampedeoccurring at one store, and a shooting at another. Retail analysts suggested thatthe actual number of units available to US consumers was only 150,000 onlaunch day. Limited supply prompted many profiteers to sell their units oneBay. Analysts were optimistic about PS3 sales (Exhibit 11.3).
The PS3’s technology was proprietary. It was generally viewed as the mostadvanced video game console on the market in terms of processing power aswell as graphics. PS3 came standard with the “Cell” processor, Blu-Ray DVDplayer, and high-capacity hard drive. While the Blu-Ray DVD format couldstore more data than Xbox 360’s HDD DVD, as of 2006, HDD DVD manu-facturing costs were significantly lower for both prerecorded as well as blank
Exhibit 11.3 Playstation 3 Sales Projections
2006 2007 2008 2009 2010
Console sales (millions) 2.0 11.3 13.3 13.3 6.7Cumulative console sales (millions) 2.0 13.3 26.6 39.9 46.6Console production cost ($) 806 496 496 496 496Console MSRP ($) 499 399 399 399 299Estimated wholesale price ($) 349.3 279.3 279.3 279.3 209.3
Xbox 360: Will the Second Time be Better? 439

recordable media. Blu-Ray was the format championed by Dell, while Toshiba,NEC, and Intel all favored HDD DVD. Movie studios were also divided in theirsupport of the two technologies.
Like the Xbox 360, the PS3 could also serve as an entertainment deliverysystem since users could watch HD movies, listen to music, view HD photos,and search the Internet in addition to playing video games. PS3 allowed up toseven wireless controllers and included a browser, built-in Wi-Fi, and supportedBluetooth wireless earpieces. It also permitted additional operating systems tobe added, including Linux.
All of these advancements, however, delayed PS3’s launch by several months,and resulted in a high price for consumers. Furthermore, the Blu-Ray DVDplayer only benefited users with advanced television sets. These advancementsalso increased the PS3’s complexity. Sony also added motion-sensitivity to thePS3 controller in an effort to heighten the level of realism in play. Some obser-vers wondered if Sony’s gaming division, once a cash cow for the company,would start delivering again (Exhibit 11.4).
Nintendo WiiNintendo launched its latest game console, Wii, in November 2006. Retailanalysts predicted that 450,000 of those units would be available to US shop-pers, more than double the quantity of PS3s available. Still, on November 19when Wii debuted in US stores, it quickly sold out. Some customers campedovernight to await the arrival of Wii.
Nintendo took a radically different approach to gaming than the visuallyadvanced, high-definition graphics of Xbox 360 and PS3. Nintendo was bettingthat many consumers were not technologically savvy and therefore did not carefor the newest, fastest technology that PS3 offered. Additionally, with advancesin technology, games had become increasingly complex and time-consuming,resulting in a small, albeit dedicated, customer base of avid gamers. Nintendo
Exhibit 11.4 Sony’s Summary Financials ($US millions, except where indicated)
Financial highlights 2006 2005 2004Fiscal year ended March 31
Revenue ($) 163,541 66,584 71,216Operating income ($) 1,626 1,059 940Net income 1,051 1,524 841Cash and short-term investments 10,541 11,539 10,722Total assets 90,166 l88,342 86,361Long-term obligations $ 35,731 35,520 35,439Stockholders’ equity $ 27,233 26,694 22,591
Gaming division 2006 2005 2004 % %(In millions, except percentages) Change 2006
versus 2005Change 2005versus 2004
Revenue ($) 8,125 6,185 6,569 31% −6%Operating income ($) 74 365 572 −80% −36%
440 Cases

believed that focusing only on these existing avid gamers limited growthopportunities. Instead, with the Wii, Nintendo hoped to attract “gamers andnongamers alike with intuitive game play.”9 Additionally, games were simplerand could be completed in less time. Nintendo expected this strategy to attractnew customers to the gaming market.
A key aspect of the Wii was its controller. Rather than the traditional compli-cated controllers that required knowledge of each buttons’ purpose, Wii used awand-like controller that translated the movement of the player to the screen.Gamers could, depending on the game, wave the controller around in the air,using it as a tennis racket, golf club, steering wheel, gun, or sword.
The Wii lacked high-definition graphics and a DVD player. “Nintendo’sstated goal is to hook people with the lure of the wireless controllers, low priceand a small, cute main unit that will fit easily in most entertainment centers.”10
The Wii could also display news and weather information from the Internet.“Old games from Nintendo’s back catalogue could be downloaded to draw inlapsed gamers.”11
Officials of all three firms were optimistic about their chances. Who was rightto be optimistic and why? Exhibit 11.5 provides more information aboutgames.
Exhibit 11.5 Game Sales Information
Game salesPercent of inhouse titles 50%Inhouse title profit margin 70%Third-party title profit margin 13%
Game attach ratesPlaystation 3—launch 1.5Xbox 360—launch 4.0Xbox 360—one year 5.2Wii—launch 3.0
Note: ongoing attach rates are typically one game per year after first year.
Source: GameStop Report, 11/2006. Deutsche Bank Game Sector Update,August 18, 2005.
Xbox 360: Will the Second Time be Better? 441
Nintendo Wii: A Game-changingMove
The Microsoft investor could not believe the news. Seven years after enteringthe video game console business, Microsoft was still losing money in its videogame business. Its Xbox, launched in 2001, had lost billions, and the sophisti-cated Xbox 360 did not appear to be making much money. Sony’s even moresophisticated PS3 was also losing money. In contrast, demand for the NintendoWii had been so strong during the 2007 Christmas season that Nintendo hadbeen forced to issue rain checks to customers. In fact, it was not unusual foreager Wii customers to pay prices well above Nintendo’s suggested retail priceof $249 in live online auctions. Why had the Nintendo Wii performed so well?Why had Microsoft done so poorly in video games? Why had Sony starteddoing so poorly following its initial success in video games? The Microsoftinvestor wondered if Microsoft had learned from the Nintendo Wii.
Competing for Gamers: The Early YearsAlthough the invention of the video game may date to as far back as 1947 withthe patenting of a “Cathode Ray Tube Amusement Device”1 by Thomas T.Goldsmith Jr and Estle Ray Mann, Atari is usually credited with introducing thefirst successful video game to the home. In 1975 it offered a dedicated homeversion of its popular arcade Pong called the Sears Tele-Game System and150,000 units of it sold that Christmas.2 Many other firms entered the homevideo game console business but Atari reigned until Nintendo introduced itsNintendo Entertainment System—a so-called third generation system—in1985. Nintendo’s leadership position would be challenged by Sega when itintroduced its Sega Mega Drive (called the Sega Genesis in the USA) in 1989.The Sega Genesis was a so-called fourth-generation console. Although Nin-tendo fought back, Sega would emerge as the new leader until Sony’s entry.
The Market that Wii Would Face
The Products
Sony entered the home video game business by introducing the Playstation inJapan in 1994 and in the USA in 1995. Sega and Nintendo fought back butSony emerged as the winner. Sony’s success would attract Microsoft, whichintroduced the Xbox in 2001, one year after Sony introduced the Playstation 2.The world’s number one software company was rumored to have spent $2
Case 12

billion to develop the Xbox and another $500 million to market it. In 2001when the Xbox was introduced, Microsoft officials knew that they were goingto lose money on each console but hoped to make up for the losses with soft-ware (game) sales. It was expected that each Xbox customer would buy threegames in his/her first year of owning an Xbox console, and buy one game peryear thereafter. Exhibit 12.1 shows Xbox forecasted sales, costs, and priceswhen it was launched. In November 2005, barely four years after introducingthe Xbox, Microsoft introduced the Xbox 360 in the US market. One year later,Sony introduced the Playstation 3.
Riding the Technological Progress Envelope
The microchip technological revolution that put a cell phone in most hands, acomputer on many laps and desks, an ATM at most corners, etc., and that gaveus the iPod, iPhone, Blackberry, etc., was the same technology that drove thevideo game industry. Microchip technology pushed the technology envelopeand video console makers exploited the frontier. Each new generation of con-soles was driven by a new generation of faster microprocessors and graphicprocessors with even more graphical detail. For example, the Xbox waspowered by an Intel microprocessor that ran at 733 megahertz and graphicsprocessor that delivered about 300 million polygons per second, more thanthree times the graphics performance of the Playstation 2, the previous gener-ation console that Microsoft hoped to displaced.3 The Xbox 360, which Micro-soft introduced four years after the Xbox, used a 3.2-gigahertz processor, anorder of magnitude faster than the Xbox while delivering 500 million polygons.The PS3 also used a 3.2-gigahertz processor and the firm’s new much-toutedBlu-Ray DVD technology.
These advances in technological innovation also created more options forsoftware (game) developers to design games for each generation of consoles thatwere even more lifelike and appealing to core gamers than those designed forprevious generations. However, in tracking the technology frontier, consolemakers incurred very high console costs. Console makers had to develop cus-tom chips dedicated to their consoles or use the fastest and best chips availablein the market. The result was that each console cost so much that its maker soldit at a loss, and hoped to make money from the royalties collected on softwaresales and from selling accessories.
Exhibit 12.1 Xbox 2001 Forecast Sales, Costs, and Prices
FY2002 FY2003 FY2004 FY2005 FY2006
Console forecasted sales (# of Xbox units) 4 10 11 12 13Retail price per console ($) 299 249 249 249 199Wholesale price ($) 209 174 174 174 139Production cost 350 300 250 250 250Retail price per game unit sold ($) 49 49 49 49 49Production cost of each game unit ($) 36 36 36 36 36
Source: Microsoft forecasts and analysts estimates.
Nintendo Wii: A Game-changing Move 443

Effectively, each new generation of consoles delivered outstanding techno-logical performance, images that were more lifelike than those from previousgenerations, and appealed to core gamers. Each new generation was also morecomplex than previous generations and many games took hours, if not days, toplay. Virtual violence also became more common with each generation. More-over, playing many of these games required players to master complicated com-binations of buttons on each console’s complex controls, and lots of gamingknow-how and expertise.4 Each new generation of consoles rendered the previ-ous generation technologically obsolete and out of style as far as core gamerswere concerned. Additionally, most games developed for new consoles oftenrendered previous games obsolete. The product cycle time—the time from whenthe first product in a new generation was introduced to the time when the firstproduct in the next generation was introduced—was also decreasing.
The WiiNintendo introduced its Wii video console in the Americas on November 19,2006, only about a week after Sony had introduced its PS3 console on Novem-ber 11, but one year after Microsoft had introduced its Xbox 360. The Wii hada simpler design than the Xbox 360 and PS3 to appeal to the casual or lapsedgamer, or noncore gamers who had neither the time (hours or days) to dedicateto a game, nor the expertise to handle the complexity of existing console con-trols and games.5 It had easy-to-use controls and its games sought to offer real-life, rather than escapist scenarios. According to Jeffrey M. O’Brien of Fortune,the Wii differed from the Xbox 360 and PS3 in other ways:
Nintendo used off-the-shelf parts from numerous suppliers. Sony co-developed the PS3’s screaming-fast 3.2-gigahertz “cell” chip and does themanufacturing in its own facilities. Nintendo bought its 729-megahertzchip at Kmart. (Not really. But it might as well have.) Its graphics aremarginally better than the PS2 and the original Xbox, but they pale next tothe PS3 and Xbox 360. Taking this route enabled the company to introducethe Wii at $250 in the U.S. (vs. $599 for the PS3 and as much as $399 forthe 360) and still turn a profit on every unit.6
The Wii also had no hard disk, no DVD, and no Dolby 5.1. Its video RAM was24 MB compared to 256 MB for the PS3 and up to 512 MB for the Xbox 360.
However, the Wii had some innovative features that its high-tech competitorsdid not.7 It had a remote (motion) wand-like control that resembled a TVremote control compared to the complex button-strewn controller carried bythe PS3 and Xbox 360.8 The wand-like control enabled a gamer’s movementsand actions to be directly mapped into the video game. For example, to swing atennis racket or golf club, the player literally swung the remote controller as if itwere a racket or club. The swing would be remotely detected by the Wii proces-sor and the player would get some exercise and more of a sense of playing tennisor golf from the swing. Contrast this with having to be adept and knowledge-able enough to hit the right complicated combination of buttons on the PS3 orXbox 360’s control at the right time. The other distinguishing feature was theMii. A Mii was a digital character that a player could create on the Wii. Once a
444 Cases

character had been so created, it could be used as participating characters insubsequent games. It allowed players to capture different personalities and cari-catures including their own. According to Saturo Iwata, president of Nintendowhen the Wii was introduced, the idea for the control and shorter simplergames had been developed and tested on Nintendo’s handheld device called theNintendo DS. The Wii was also connectible to the DS so that the latter could beused as the input to the former.
Beyond the remote control stick and the Mii, the Wii had other features suchas backward compatibility with all official GameCube software, and the Wii-Connect24 which enabled the Wii to receive information such as news andweather over the Internet while in standby mode.
Despite the initial success of the Wii, some incumbents did not see it as muchof a threat to Sony and Microsoft. Remarks such as the following from SonyComputer Entertainment of America’s Jack Tretton, were not uncommon:9
You have to give Nintendo credit for what they’ve accomplished . . . But ifyou look at the industry, any industry, it doesn’t typically go backwardstechnologically. The controller is innovative, but the Wii is basically arepurposed GameCube. If you’ve built your console on an innovative con-troller, you have to ask yourself, Is that long term?10
The Microsoft investor wondered how long the Wii would continue to do well.Should he have invested in Nintendo instead of Microsoft? Why hadn’t Micro-soft followed a Nintendo-type strategy when it entered the video game consolemarket in 2001? Was it too late to follow a Wii-type strategy?
The estimated costs, wholesale prices, and suggested retail prices for the Wii,Xbox 360, and PS3 are shown in Exhibit 12.2, while the forecasted number ofunits are shown in Exhibit 12.3. The exhibit is reproduced from Chapter 1.
Exhibit 12.2 Costs, Retail, and Wholesale Prices
First year After first year
Product Yearintroduced
Cost ($) Suggested retailprice ($)
Wholesaleprice ($)
Cost Suggestedretail price ($)
Wholesaleprice ($)
Xbox 360 2005 525 399 280 323 399 280Sony PS3 2006 806 499 349 496 399 280Nintendo Wii Late 2006 158.30 249 199 126 200 150
Sources: Company reports. Various sources including: Ehrenberg, R. (2007). Game console Wars II: Nintendo shavesoff profits, leaving competition scruffy. Retrieved September 8, 2007, from http://seekingalpha.com/article/34357-game-console-wars-ii-nintendo-shaves-off-profits-leaving-competition-scruff.
Nintendo Wii: A Game-changing Move 445

Exhibit 12.3 Forecasted Console and Games Sales
2005 2006 2007 2008 2009 2010
ConsoleXbox 360 1.5 8.5 10 10 5Sony PS3 2 11 13 13 7Nintendo Wii 5.8 14.5 17.4 18.3GamesXbox 360 4.5 25.5 30 30 15Sony PS3 6 33 39 39 21Nintendo Wii 28.8 66.5 114.3 128.8
Sources: Company and analysts reports. HSBC Global Research. 2007. Nintendo Co., (7974). Telecom, Media &Technology Software. Equity-Japan. July 5, 2007.
446 Cases

Notes
1 Introduction and Overview
1. Chafkin, M. (2008). The customer is the company. Inc. Magazine, June 2008.http://www.inc.com/magazine/20080601/the-customer-is-the-company.html:Accessed July 15, 2008.
2. Tischler, L. (2007). He struck gold on the net (really). Fast Company.com.December 19, 2007. http://www.fastcompany.com/magazine/59/mcewen.html:Accessed July 15, 2008.
3. Tapscott, D. & Williams, A.D. (2006). Wikinomics: How Mass CollaborationChanges Everything. New York: Penguin Books.
4. Rivkin, J.W., & Porter, M.E. (1999). Matching Dell (Condensed). Harvard Busi-ness School Case 704–440.
5. To the best of my knowledge, the phrase “New game strategies” was first usedfrom Buaron, R. (1981). New-game strategies. McKinsey Quarterly, 17(1), 24–40.He defined new game strategies as “innovative competitive moves” (p. 29); but mydefinition is different from Buaron’s. For one thing, my definition sees new gamestrategies as also involving cooperative moves and more. For the other, myapproach builds on and extends both the resource-based view (RBV) and theproduct-market-position (PMP) view of strategic management as it pertains tochange. Throughout this book the words “appropriate” and “capture” are usedinterchangeably.
6. I use the phrase “value chain” when I really mean “value chain, value network,and value shop” only to make the definition of new game activity more precise andeasier to remember. For the relationship between value chain, value network, andvalue shop, please see Stabell, C.B. & Fjeldstad, O.D. (1998). Configuring value forcompetitive advantage: On chains, shops, and networks. Strategic ManagementJournal, 19(5), 413–37.
7. Ghemawat, P. (1991). Commitment: The Dynamics of Strategy. New York: FreePress.
8. Porter, M.E. (1996). What is strategy? Harvard Business Review, 74(6), 61–78.9. We will have a lot more to say about value creation and appropriation below and
in Chapter 4 of this book. Throughout the book, we will use products to meanproducts and services. We will also use the words capture and appropriateinterchangeably.
10. See n.6.11. Buaron, R. (1981). New-game strategies. McKinsey Quarterly, 17(1), 24–40. See
also, Bales, C.F., Chatterjee, P.C., Gluck, F.W., Gogel, D., & Puri, A. (2000). Thebusiness system: A new tool for strategy formulation and cost analysis. RetrievedNovember 13, 2007, from http://www.kellogg.northwestern.edu/faculty/vohra/ftp/miin00.pdf

12. Porter, M.E. (1985). Competitive Advantage: Creating and Sustaining SuperiorPerformance. New York: Free Press.
13. Moon, Y. (2004). Ikea Invades America. HBS case #504-094. Boston, MA:Harvard Business School Press.
14. Rivkin, J.W., & Siggelkow, N. (2003). Balancing search and stability: Inter-dependencies among elements of organizational design. Management Science,49(3), 290–311.
15. Given the critical role that intangible resources play in market value, many firmsare taking another look at their financial statement reporting. See, for example,Stewart, T.A. (1997). Intellectual Capital: The New Wealth of Organizations. NewYork: Currency/Doubleday.
16. Barney, J., & Arikan, A.M. (2001). The resource-based view: Origins and implica-tions. In M.A. Hitt, R.E. Freeman, & J.S. Harrison (eds), The Blackwell Handbookof Strategic Management (124–88). Oxford: Blackwell.
17. We will have a lot more to say about first-mover advantages and disadvantages inChapter 6 of this book. See also, Lieberman, M.B., & Montgomery, D.B. (1988).First-mover (dis)advantages: Retrospective and link with the resource-based view.Strategic Management Journal, 19(12), 1111–25.
18. This definition is closest to the one offered by The Economist. See Economics A–Z.(2007). Retrieved July 26, 2007, from http://www.economist.com/research/Economics/alphabetic.cfm?letter=G#globalisation
19. Deutsche Bank Game Sector update. August, 18, 2005.20. Are big budget console games sustainable? (March 10, 2006). Retrieved April 20,
2006, from http://Biz.gamedaily.com/industry/advertorial/?id=1208921. Playing a different game: Does Nintendo’s radical new strategy represent the future
of gaming? (2006, October 26). The Economist.22. Ibid.23. Porter, M.E. (1996). What is strategy? Harvard Business Review, 74(6), 61–78.24. Barney, J., & Arikan, A.M. (2001). The resource-based view: Origins and implica-
tions. In M.A. Hitt, R.E. Freeman, & J.S. Harrison (eds), The Blackwell Handbookof Strategic Management (124–188). Oxford: Blackwell. Peteraf, M.A. (1993). Thecornerstones of competitive advantage: A resource-based view. Strategic Manage-ment Journal, 14(3), 179–91.
25. Professors Abernathy and Clark’s seminal paper also explored a similar classifica-tion. However, their classification was only about resources—technology andmarket resources—and not about the resources and PMP of this book. See Aber-nathy, W.J., & Clark, K.B. (1985). Mapping the winds of creative destruction.Research Policy, 14(1), 3–22.
26. Global Gillette. (n.d.). Retrieved March 12, 2007, from http://en.wikipedia.org/wiki/The_Gillette_Company.
27. Chandler, A. (1962). Strategy and Structure: Chapters in the History of the Ameri-can Industrial Enterprise. Cambridge, MA: MIT Press.
28. Andrews, K. (1971). The Concept of Corporate Strategy. Homewood, IL: Irwin.29. Porter, M.E. (1980). Competitive Strategy: Techniques for Analyzing Industries and
Competitors. New York: Free Press.30. See, for example: Prahalad, C.K., & Hamel, G. (1990). The core competence of the
corporation. Harvard Business Review, 68(3), 79–91. For a comprehensive reviewof the resource-based view of the firm, please see: Barney, J., & Arikan, A.M.(2001). The resource-based view: Origins and implications. In M.A. Hitt, R.E.Freeman, & J.S. Harrison (eds), The Blackwell Handbook of Strategic Management(124–88). Oxford: Blackwell.
31. Porter, M.E. (1996). What is strategy? Harvard Business Review, 74(6), 61–78.32. Oster, S. (1999). Modern Competitive Analysis. Oxford: Oxford University Press.
448 Notes

33. Grant, R.M. (2002). Contemporary Strategy Analysis: Concepts, Techniques,Applications. (4th edn). Oxford: Blackwell.
34. Hitt, M.A., Ireland, R.D., & Hoskisson, R.E. (2007). Strategic Management: Com-petitiveness and Globalization. Mason, OH: Thompson/Southwestern.
35. Mintzberg, H., Lampel, J., Quinn, J.B., & Ghoshal, S. (2003:4). The Strategy Pro-cess: Concepts Contexts Cases. Upper Saddle River, NJ: Printice Hall.
36. Ibid.37. Ibid.38. Mintzberg, H. (2007). Are strategies real things? Retrieved June 10, 2007, from
http://www.phptr.com/articles/article.asp?p=378964&seqNum=5&rl=1.39. Mintzberg, H., Lampel, J., Quinn, J.B., & Ghoshal, S. (2003: 9). The Strategy
Process: Concepts Contexts Cases. Upper Saddle River, NJ: Prentice Hall.40. Hambrick, D.C., & Frederickson, J.W. (2005). Are you sure you have a strategy?
Academy of Management Executive, 19(4), 51–62.
2 Assessing the Profitability Potential of a Strategy
1. Afuah, A.N. (2003). Business Models: A Strategic Management Approach. NewYork: McGraw-Hill/Irwin.
2. See, for example, Brealey, R.A., & Myers, S.C. (1995). Principles of CorporateFinance. New York: McGraw-Hill.
3. This example is from: Afuah, A.N. (2003). Business Models: A Strategic Manage-ment Approach. New York: McGraw-Hill/Irwin. Chapter 11.
4. Kaplan, R.S., & Norton, D.P. (1992). The balanced scorecard: Measures thatdrive performance. Harvard Business Review, 70(1), 71–80.
5. Afuah, A.N. (2003). Business Models: A Strategic Management Approach. NewYork: McGraw-Hill/Irwin.
6. Note that although no arrows are shown from Activities to Values, Appropri-ability and Change, activities underpin the first two and the ability of a firm toexploit or cope with the last one. The arrows have been left out to make the dia-gram more presentable. These relationships are explained in the text.
7. Afuah, A.N. (2003). Business Models: A Strategic Management Approach. NewYork: McGraw-Hill/Irwin.
8. See Ryanair’s website: Ryanair.com Home. (n.d.). Retrieved August 27, 2007,from http://www.ryanair.com/site/EN/.
9. Aviation: Snarling all the way to the bank. (2007, August 23). The Economist.10. Investor Relations: Passenger Traffic 20023/2007. http://www.ryanair.com/site/
EN/about. php?page=Invest&sec=traffic Roadshow Presentation. (2007).Retrieved August 27, 2007, from http://www.ryanair.com/site/about/invest/docs/present/quarter4_2007.pdf.
11. Rivkin, J.W. (1999). Dogfight over Europe: Ryanair (version C) (Harvard BusinessSchool Case No. 9–700–117). Harvard Business School Press. See Ryanair’s finan-cial statements, including the presentation on: http://www.ryanair.com/site/about/invest/docs/present/quarter4_05.pdf, and Ryanair’s history on its website:www.Ryanair.com. http://www.ryanair.com/site/about/invest/docs/Strategy.pdf
12. Capell, K. (June 2, 2003). Ryanair Rising: Ireland’s discount carrier is defyinggravity as the industry struggles. Business Week, 3835, 30.
13. Capell, K. (June 2, 2003). Ryanair Rising: Ireland’s discount carrier is defyinggravity as the industry struggles. Business Week, 3835, 30.
14. http://www.ryanair.com/site/about/invest/docs/Strategy.pdf
Notes 449

3 The Long Tail and New Games
1. Anderson, C. (2006). The Long Tail: Why the Future of Business is Selling the Lessof More. New York: Random House Business Books.
2. See similar arguments by Shirky, C. (February 8, 2003). Power laws, weblogs andinequality. Retrieved July 9, 2008, from http://www.shirky.com/writings/powerlaw_weblog.html.
3. Brynjolfsson, E., Hu, Y., & Simester, D. (2006). Goodbye pareto principle, hellolong tail: the effect of search costs on the concentration of product sales. RetrievedJuly 9, 2008, from http://papers.ssrn.com/sol3/papers.cfm?abstract_id=953587 Seealso, Brynjolfsson, E., Hu, Y., & Smith, M.D. (2003). Consumer surplus in thedigital economy: estimating the value of increased product variety at online book-sellers. Management Science, 49(11), 1580–96.
4. Freeberg, D. (2005). Netflix presents at Lehman Brothers Small Cap Conference.Retrieved October 15, 2007, from http://thomashawk.com/2005/11/Rnetflix-presents-at-lehman-brothers.html.
5. Anderson, C. (2006). The Long Tail: Why the Future of Business is Selling the Lessof More. New York: Random House Business Books.
6. Agarwal A., Johnson M., Link T., Patel S., Stone, J., & Tsuchida, K. (2006).Botox’s Makeover. Ann Arbor, MI: University of Michigan, Ross School ofBusiness.
7. Film history of the 1970s. (n.d.). Retrieved December 10, 2007, from http://www.filmsite.org/70sintro.html.
8. One million copies of iTunes for Windows software downloaded in three and ahalf days. (2003). Retrieved September 15, 2007, from htt://www.apple.com/pr/library/2003/oct/20itunes.html.
9. Taylor, C. (2003). The 99 cent solution. Retrieved December 7, 2007, from http://www.time.com/time/2003/inventions/invmusic.html.
10. iTunes. Retrieved September 8, 2007, from http://en.wikipedia.org/wiki/Itunes.11. Taylor, C. (2003). The 99 cent solution. Retrieved December 7, 2007, from http://
www.time.com/time/2003/inventions/invmusic.html.
4 Creating and Appropriating Value Using New Game Strategies
1. Apple iPhone to generate 50 percent margin, According to iSuppli’s PreliminaryAnalysis. (January 18, 2007). Retrieved July 9, 2007 from http://www.isuppli.com/news/default.asp?id=7308.
2. See similar definitions in Besanko, D., Dranove, D., & Shanley, M. (2000). Eco-nomics of Strategy. (2nd edn). New York: John Wiley & Sons, Inc. Ghemawat, P.(1991). Commitment: The Dynamics of Strategy. New York: Free Press. Saloner,G., Shepard, A., & Podolny, J. (2001). Strategic Management. New York: JohnWiley.
3. Brandenburger, A. M., & Stuart, H. W. (2007). Biform games. ManagementScience, 53(4), 537–49. MacDonald, G., & Ryall, M. (2004). How do value cre-ation and competition determine whether a firm appropriates value. ManagementScience, 50(10), 1319–33. Lipman, S., & Rumelt, R. (2003). A bargaining perspec-tive on resource advantage. Strategic Management Journal, 24(11), 1069–86.
4. Laseter, T. M., Houston, P. W., Wright, J. L., & Park, J. Y. (2000). Amazon yourindustry: Extracting value from the value chain. Strategy & Business, 18(1), 94–105. Digman, L. A. (2006). Strategic Management: Competing in the GlobalInformation Age. New York: Thomson.
5. Ibid.6. Laseter, T. M., Houston, P. W., Wright, J. L., & Park, J. Y. (2000). Amazon your
industry: Extracting value from the value chain. Strategy & Business, 18(1), 94–
450 Notes

105. Apple iPhone to generate 50 percent margin, according to iSuppli’s prelimin-ary analysis. (January 18, 2007). Retrieved July 9, 2007 from http://www.isuppli.com/news/default.asp?id=7308
7. Kanoh, Y. (July 6, 2007). Samsung Electronics Supplies Largest Share of iPhoneComponents: iSuppli. Retrieved July 9, 2007, from http://techon.nikkeibp.co.jp/english/NEWS_EN/20070706/135572/.
8. Wallace, J. (June 27, 2006). Boeing Dreamliner ‘coming to life.’ Retrieved July 8,2007, from http://seattlepi.nwsource.com/business/275465_japan27.html.
9. Gates, D. (September 11, 2005). Boeing 787: Parts from around world will beswiftly integrated. The Seattle Times.
10. Moon, Y. (2004). Ikea invades America. HBS case # 504–094. Harvard BusinessSchool Press. Boston, MA.
11. Creager, E. (2002). Move over, Tupperware: Botox injections are the latest thing athome parties. Retrieved September 14, 2007, from http://www.woai.com/guides/beauty/story.aspx?content_id=16358daf-d7db-4ade-a757-9e8d7cf30212.
12. Dyer, J.H., & Singh, H. (1998). The relational view: Cooperative strategy andsources of interorganizational competitive advantage. Academy of ManagementReview, 23(4), 660–79.
13. Dyer, J.H., & Singh, H. (1998). The relational view: Cooperative strategy andsources of interorganizational competitive advantage. Academy of ManagementReview, 23(4), 660–79.
14. My thanks to Scott Peterson from whom I obtained the “grape versus watermelon”comparison in a STRAT 675 MBA class at the Ross School in the Fall of2007.
15. Tapscott, D. & Williams, A. D. (2006). Wikinomics: How Mass CollaborationChanges Everything. New York: Penguin Books.
16. Tischler, L. (2007). He struck gold on the net (really). Fast Company.com. Decem-ber 19, 2007. Retrieved June 19, 2008, from http://www.fastcompany.com/magazine/59/mcewen.html.
17. Ibid.18. Tapscott, D. & Williams, A. D. (2006:9). Wikinomics: How Mass Collaboration
Changes Everything. New York: Penguin Books, (p. 9).19. Ibid.20. Tischler, L. (2007). He struck gold on the net (really). Fast Company.com. Decem-
ber 19, 2007. Retrieved June 19, 2008, from http://www.fastcompany.com/magazine/59/mcewen.html.
21. Ibid.22. Howe, J. (2006). The rise of crowdsourcing. Wired, 14(6). Retrieved June 19, 2008,
from http://www.wired.com/wired/archive/14.06/crowds.html.23. Tripsas, M. (1997). Unraveling the process of creative destruction: Complementary
assets and incumbent survival in the typesetter industry. Strategic ManagementJournal, 18(6), 119–42.
24. Airbus A380: The giant on the runway. (2007, October 11). The Economist. Air-bus: Gathering clouds. (2008, June 19). The Economist.
25. The Economist. 2008. Airbus: Gathering clouds. The Economist, June 19, 2008.26. Linden, G., Kraemer, K.L., & Dedrick, J. (2007). Who captures value in a global
innovation system? The case of Apple’s iPod. Retrieved July 10, 2007, from http://www.teardown.com/AllReports/product.aspx?reportid=8.
5 Resources and Capabilities in the Face of New Games
1. Grant, R.M. (2002). Contemporary Strategy Analysis: Concepts, Techniques,Applications. Oxford, UK: Blackwell.
Notes 451
2. Given the critical role that intangible resources play in market value, many firmsare taking another look at their financial statement reporting. See, for example,Stewart, T.A. (1997). Intellectual Capital: The New Wealth of Organizations. NewYork: Currency/Doubleday.
3. Hamel, G., & Prahalad, C.K. (1990). The core competence of the corporation.Harvard Business Review, 68(3), 79–91.
4. Barney, J., & Arikan, A.M. (2001). The resource-based view: Origins and implica-tions. In Hitt, M.A., Freeman, R.E., & Harrison, J.S. (eds), The Blackwell Hand-book of Strategic Management (124–88). Oxford: Blackwell.
5. Hamel, G., & Prahalad, C.K. (1990). The core competence of the corporation.Harvard Business Review, 68(3), 79–91.
6. Katz, M.L., & Shapiro, C. (1992). Product introduction with network external-ities. Journal of Industrial Economics, 40(1), 55–84.
7. Katz, M.L., & Shapiro, C. (1985). Technology adoption in the presence of net-work externalities. Journal of Political Economy, 94(4), 822–41.
8. See, for example, L. Downes & C. Mui, (1998). Unleashing the Killer App:Digital Strategies for Market Dominance. Cambridge, MA: Harvard BusinessSchool Press.
9. Afuah, A. N. (2007). How much does size matter? Working Paper, Stephen M.Ross School of Business, University of Michigan.
10. Parker, G., & Van Alstyne, M. (2005). Two-sided network effects: A theory ofinformation product design. Management Science, 51(10), 1494–504. Rochet, J., &Tirole, J. (2003). Platform competition in two-sided markets. Journal of the Euro-pean Economic Association, 1(4), 990–1029.
11. Cusumano, M.A., Mylonadis, Y., & Rosenbloom, R.S. (1992). Strategic maneuver-ing and mass-market dynamics: the triumph of VHS over Beta. Business HistoryReview, 66(1), 51–94.
12. Parker, G., & Van Alstyne, M. (2005). Two-sided network effects: A theory ofinformation product design. Management Science, 51(10), 1494–504.
13. Nair, H., Manchanda, P., & Bhatia, T. (2007). Social networks impact the drugsphysicians prescribe. Retrieved November 5, 2007, from http://www.gsb.stanford.edu/news/research/mktg_nair_drugs.shtml.
14. Teece, D.J. (1986). Profiting from technological innovation: Implications for inte-gration, collaboration, licensing and public policy. Research Policy, 15(6), 285–306.
15. This model is derived from Professor David Teece’s seminal paper: Teece, D.J.(1986). Profiting from technological innovation: Implications for integration, col-laboration, licensing and public policy. Research Policy, 15(6), 285–306.
16. Afuah, A.N. (2003). Innovation Management: Strategies, Implementation andProfits. (2nd edn). New York: Oxford University Press.
17. Burns, E. (March 23, 2007). U.S. search engine rankings, February 2007. RetrievedMay 28, 2007, from http://searchenginewatch.com/showPage.html?page=3625336.
18. Know your subject: Topic-specific search-engines hope to challenge Google, at leastin some areas. (July 12, 2007). The Economist.
19. Bartlett, C.A., Cornebise, J., & McLean, A.N. (2002). Global wine wars: Newworld challenges old. Harvard Business School Press, case # 9-303-056.
20. Yoffie, D. B., & Wang, Y. (2002). Apple Computer 2002. Harvard Business SchoolPress, case # 9-702-469.
21. Quittner, J. (2002). Apple’s latest fruit: exclusive: How Steve Jobs made a sleekmachine that could be the home-digital hub of the future. Retrieved August 23,2007, from http://www.time.com/time/covers/1101020114/cover2.html.
22. Kanellos, M. (June 11, 2002). IDC ups 2001 PC-shipment estimate. Retrieved July
452 Notes

16, 2008, from http://news.cnet.com/IDC-ups-2001-PC-shipment-estimate/2100-1001_3-935176.htm l.
23. Market share vs installed base: iPod vs Zune, Mac vs PC. (March 18, 2007).Retrieved August 23, 2007, from http://www.roughlydrafted.com/RD/RDM.Tech.Q1.07/9E601E8E-2ACC-4866-A91B-3371D1688E00.html.
24. One million copies of iTunes for windows software downloaded in three and a halfdays. (October 20, 2003). Retrieved September 15, 2007, from http://www.apple.com/pr/library/2003/oct/20itunes.html.
6 First-mover Advantages/Disadvantages and Competitors’ Handicaps
1. Many of the first-mover advantages and disadvantages outlined here were laid outin an award-winning paper by Professor Lieberman of UCLA and Professor Mont-gomery of Northwestern University. Please see Lieberman, M.B., & Montgomery,D.B. (1988). First-mover advantages. Strategic Management Journal, 9, 41–58.Lieberman, M.B., & Montgomery, D.B. (1988). First-mover (dis)advantages:Retrospective and link with the resource-based view. Strategic Management Jour-nal, 19(12), 1111–25.
2. See, for example: Fishman, C. (2006). The Wal-Mart effect and a decent society:Who knew shopping was so important? Academy of Management Perspectives,20(3), 6–25.
3. Sheremata, W.A. (2004). Competing through innovation in network markets:Strategies for challengers. Academy of Management Review, 29(3), 359–77.
4. Latif, U. (May 31, 2005). Google’s bid-for-placement patent settlement cover-up.Retrieved July 16, 2008, from http://www.techuser.net/gcoverup.html. Olsen, S.(July 18, 2003). Overture to a patent war? Retrieved July 16, 2008, from http://news.com.com/Overture+to+a+ patent+war/2100-1024_3-1027084.html.
5. The settlement included another charge against Google that Yahoo had made inconnection with a warrant that Yahoo held in connection with a June 2000 servicesagreement between the two firms.
6. Besanko, D., Dranove, D., & Shanley, M. (2000). Economics of Strategy. NewYork: John Wiley.
7. Barney, J. (1986). Organizational culture: Can it be a source of sustained competi-tive advantage? Academy of Management Review, 11(3), 656–65.
8. Teece, D.J. (1986). Profiting from technological innovation: Implications for inte-gration, collaboration, licensing and public policy. Research Policy, 15(6), 285–306.
9. Ghemawat, P. (1986). Wal-Mart Stores’ Discount Operations. Case 0-387-018.Boston, MA: Harvard Business School Press.
10. Schmalensee, R. (1978). Entry deterrence in the ready-to-eat breakfast cereal indus-try. Bell Journal of Economics, 9(2), 305–27.
11. Schmalensee, R. (1982). Product differentiation advantages of pioneering brands.American Economic Review, 72(3), 349–65.
12. Carpenter, G.S., & Nakamoto, K. (1989). Consumer preference formation andpioneering advantage. Journal of Marketing Research, 26(3), 285–98.
13. Fishburne, F. (1999, April 5). Hardware winner. Forbes (p. 59). Rivkin, J.W., &Porter, M.E. (1999). Matching Dell. HBS Case 799–158.
14. Ghemawat, P. (1991). Commitment: The Dynamics of Strategy. New York: FreePress.
15. Afuah, A.N. (2003). Innovation Management: Strategies, Implementation andProfits. (2nd edn). New York: Oxford University Press.
16. Porter, M.E. (1996). What is strategy? Harvard Business Review, 74(6), 61–78.17. Lieberman, M.B., & Montgomery, D.B. (1988). First-mover advantages. Strategic
Notes 453
Management Journal, 9, 41–58. Lieberman, M.B., & Montgomery, D.B. (1988).First-mover (dis)advantages: Retrospective and link with the resource-based view.Strategic Management Journal, 19(12), 1111–25.
18. Teece, D.J. (1986). Profiting from technological innovation: Implications for inte-gration, collaboration, licensing and public policy. Research Policy, 15(6), 285–306.
19. Hamel, G.M., & Prahalad, C.K. (1994). Competing for the Future. Boston, MA:Harvard Business School Press (p. 49).
20. Bettis, R.A., & Prahalad, C.K. (1995). The dominant logic: Retrospective andextension. Strategic Management Journal, 16(1), 5–14.
21. Besanko, D., Dranove, D., & Shanley, M. (2000). Economics of Strategy. NewYork: John Wiley.
7 Implementing New Game Strategies
1. This section draws on Chapter 5 of A.N. Afuah, Innovation Management: Strat-egies, Implementation, and Profits (New York: Oxford University Press, 2003).
2. Galbraith, J.R. (1982). Designing the innovating organization. OrganizationalDynamics, 10(3), 5–25.
3. This section draws heavily on, A.N. Afuah (2003). Business Models: A StrategicManagement Approach. New York: McGraw Hill/Irvin.
4. Lawrence, P.R., & Lorsch, J.W. (1967). Organization and Environments: Man-aging Differentiation and Integration. Homewood, IL: Irwin.
5. Chandler, A.D. (1962). Strategy and Structure: Chapters in the History of theIndustrial Enterprise. Cambridge, MA: MIT Press.
6. Miles, R.E., Snow, C.C., Mathews, J.A., Miles, G., & Coleman, H. J., Jr (1997).Organizing the knowledge age: Anticipating the cellular form. Academy ofManagement Executive, 11(4), 7–24. Byrne, J.A., & Brandt, R. (February 8, 1993).The virtual corporation. Business Week. Davidow, W.H., & Malone, M.S. (1992).The Virtual Corporation. New York: Harper Collins.
7. Afuah, A.N. (2001). Dynamic boundaries of the firm: Are firms better off beingvertically integrated in the face of a technological change? Academy of Manage-ment Journal, 44(6), 1211–28.
8. Hill, C.W.L., & Jones, G.R. (1995). Strategic Management: An IntegratedApproach. Boston, MA: Houghton Mifflin.
9. Christensen, C.M., & Overdorf, M. (2000). Meeting the challenge of disruptivechange. Harvard Business Review, 78(2), 66–77.
10. Afuah, A.N., & Tucci, C.L. (2003). Internet Business Models and Strategies: Textand Cases. New York: McGraw-Hill. Afuah, A.N. (2003). Redefining firm bound-aries in the face of the Internet: Are firms really shrinking? Academy of Manage-ment Review, 28(1), 34–53.
11. Allen, T. (1984). Managing the flow of technology. Cambridge, MA: MIT Press.12. Uttal, B., & Fierman, J. (October 17, 1983). The corporate culture vultures.
Fortune, (pp. 66–73).13. Schein, E. (1985). Organizational Culture and Leadership. San Francisco, CA:
Jossey-Bass.14. Barney, J. (1986). Organizational culture: Can it be a source of sustained competi-
tive advantage? Academy of Management Review, 11(3), 656–65.15. Fuzzy maths: In a few short years, Google has turned from a simple and popular
company into a complicated and controversial one. (May 11, 2006). TheEconomist.
16. Bettis, R.A., & Prahalad, C.K. (1995). The dominant logic: Retrospective andextension. Strategic Management Journal, 16(1), 5–14.
454 Notes
17. Walsh, J.P. (1995). Managerial and organizational cognition: Notes from a tripdown memory lane. Organizational Science, 6(3), 280–321.
18. Hamel, G.M., & Prahalad, C.K. (1994). Competing for the Future. Boston, MA:Harvard Business School Press.
19. The concept of champions was first developed by Schön in his seminal article,Schön, D.A. (1963). Champions for radical new inventions. Harvard BusinessReview, 41(2), 77–86. See also, Howell, J.M., & Higgins, C.A. (1990). Championsof technological innovation. Administrative Sciences Quarterly, 35(2), 317–41.
20. Roberts, E.B., & Fusfeld, A.R. (1981). Staffing the innovative technology-basedorganization. Sloan Management Review, 22(3), 19–34.
21. Allen, T. (1984). Managing the flow of technology. Cambridge, MA: MIT Press.22. Clark, K.B., & Fujimoto, T. (1991). Product Development Performance: Strategy,
Organization, and Management in the World Automobile Industry. Boston, MA:Harvard Business School Press.
23. Ibid.24. Ibid.25. Uttal, B., & Fierman, J. (October 17, 1983). The corporate culture vultures. For-
tune, (pp. 66–73).
8 Disruptive Technologies as New Games
1. Foster, R. Innovation: The Attacker’s Advantage. (1986). New York: SummitBooks.
2. Foster, R. Innovation: The Attacker’s Advantage. (1986). New York: SummitBooks. Afuah, A.N., & Utterback, J.M. (1991). The emergence of a new super-computer architecture. Technology Forecasting and Social Change, 40(4), 315–28.See also, Constant, E.W. (1980). The Origins of the Turbojet Revolution. Balti-more, MD: The Johns Hopkins University Press. Sahal, D. (1985). Technologicalguideposts and innovation avenues. Research Policy, 14(2), 61–82. Foster, R.D.(1985). Description of the S-Curve. Retrieved May 27, 2007, from http://www.12manage.com/description_s-curve.html.
3. Christensen, C.M., & Bower, J.L. (1996). Customer power, strategic investmentand failure of leading firms. Strategic Management Journal, 17(3), 197–218. Chris-tensen, C.M. (1997). The Innovator’s Dilemma. Boston, MA: Harvard BusinessSchool Press. See also, Christensen, C.M., & Overdorf, M. (2000). Meeting thechallenge of disruptive change. Harvard Business Review, 78(2), 66–76. Chris-tensen, C.M., & Raynor, M.E. (2003). The Innovator’s Solution. Boston, MA:Harvard Business School Press. Christensen, C.M., Anthony, S.D., & Roth, E.A.(2004). Seeing What’s Next. Boston, MA: Harvard Business School Press.
4. Christensen, C.M., & Overdorf, M. (2000). Meeting the challenge of disruptivechange. Harvard Business Review, 78(2), 68.
5. Christensen, C.M., & Overdorf, M. (2000). Meeting the challenge of disruptivechange. Harvard Business Review, 78(2), 69.
6. Bettis R.A., & Prahalad, C.K. (1995). The dominant logic: Retrospective andextension. Strategic Management Journal, 16(1), 5–14.
7. Christensen, C.M., & Raynor, M.E. (2003). The Innovator’s Solution. Boston,MA: Harvard Business School Press.
8. Von Hippel, E. (2005). Democratizing Innovation. Cambridge, MA: MIT Press.Lilien, G.L., Morrison, P.D., Searls, K., Sonnack, M., & Von Hippel, E. (2002).Performance assessment of the lead user idea-generation process for new productdevelopment. Management Science, 48(8), 1042–59.
9. Professors Abernathy and Clark’s seminal paper also explored a similar classifica-tion. However their classification was only about resources—technological and
Notes 455
marketing resources—and not about product-market position and resources asexplored in this book. See Abernathy, W.J., & Clark, K.B. (1985). Mapping thewinds of creative destruction. Research Policy, 14(1), 3–22.
10. See n.9.
9 Globalization and New Games
1. Nigerian Bonny Light (Bonny Light crude oil spot prices in Europe went as high as$80 in July. In France there was a tax of �0.5892 per liter of unleaded and a TVA of19.6%.)
2. Energy Information Administration of the US Department of Energy. (2007).Nigeria: Oil. Retrieved July 16, 2008, from http://www.eia.doe.gov/emeu/cabs/Nigeria/Oil.html.
3. Energy Information Administration of the US Department of Energy (2006). Per-formance profiles of major energy producers 2006 (Form EIA-28). Retrieved July31, 2007, from http://www.eia.doe.gov/emeu/perfpro/tab11.htm.
4. International Energy Agency (Agence Internationale de l’Energie). OECD/IEA.(2007). End-user petroleum product prices and average crude oil import costs.Retrieved August 9, 2007, from http://www.iea.org/Textbase/stats/surveys/mps.pdf.
5. Energy information administration of the US Department of Energy. (2003).Nigeria. Retrieved July 30, 2007, from http://www.eia.doe.gov/emeu/cabs/ngia-_jv.html. Vernon, C. (2006). UK Petrol Prices. Retrieved July 30, 2007, from http://europe.theoildrum.com/story/2006/5/3/17236/14255.
6. Pindyck, R.S., & Rubinfeld, D.L. (1992). Microeconomics (4th edn). UpperSaddle River, NY: Prentice Hall.
7. Ibid.8. Baxter, J. (May 19, 2003). Cotton subsidies squeeze Mali. Retrieved September
10, 2007, from http://news.bbc.co.uk/1/hi/world/africa/3027079.stm.9. This definition is closest to the one offered by The Economist. See The Econo-
mist’s definition as retrieved July 26, 2007, from http://economist.com/research/Economics/alphabetic.cfm?letter=G#globalisation.
10. IKEA. (2007). Retrieved August 10, 2007, from http://en.wikipedia.org/wiki/Ikea.11. Happy meal: How a Frenchman is reviving McDonald’s in Europe. (January 25,
2007). The Economist.12. Bove appeals over McDonalds rampage (February 15, 2001). Retrieved September
10, 2007, from http://news.bbc.co.uk/1/hi/world/europe/1171329.stm.13. How not to block a takeover: Spain’s meddling government is the big loser in the
battle over Endesa. (2007, April 4). The Economist.14. Vernon, C. (2006). UK petrol prices. Retrieved July 30, 2007, from http://europe.
theoildrum.com/story/2006/5/3/17236/14255.15. AA fuel price report: Price rises hit plateau after overtaking 2006 levels (June 20,
2007). Retrieved July 31, 2007, from http://www.theaa.com/motoring_advice/news/fuel-prices-june-2007.html.
16. Energy Information Administration of the US Department of Energy (2006). Aprimer on gasoline prices (DOE/EIA-04). Retrieved July 31, 2007, from http://www.eia.doe.gov/bookshelf/brochures/gasolinepricesprimer/printerversion.pdf.
10 New Game Environments and the Role of Governments
1. Innovation’s golden goose. (2002, December 12). The Economist.2. Bayhing for blood or Doling out cash? (2005, December 20). The Economist.
456 Notes
3. Home truths: How much does housing wealth boost consumer spending? (Octo-ber 12, 2006). The Economist.
4. Carroll, C.D., Otsuka, M., & Slacalek, J. (2006). How large is the housing wealtheffect? A new approach (NBER Working Paper No. W12746). Berlin, Germany:German Institute for Economic Research.
5. Competitiveness clusters in France. (2006). Retrieved December 4, 2007, fromhttp://www.polesdecompetitivite.gouv.fr/IMG/pdf/poles_plaquette_en.pdf.
6. The fading lustre of clusters. (October 11, 2007). The Economist.7. Farrell, C. et al. (1995). The boon in IPOs. Business Week, December 18, 1995,
(p. 64).8. Please dare to fail (September 28, 1996). The Economist.9. Porter, M.E. (1990). The Competitive Advantage of Nations. New York: The Free
Press.10. The fading lustre of clusters. (October 11, 2007). The Economist.11. This section draws heavily on Chapter 15 of A.N. Afuah (2003). Innovation Man-
agement: Strategies, Implementation and Profits. New York: Oxford UniversityPress.
12. Arrow, K.J. (1962). Economic welfare and the allocation of resources for invention.In R. Nelson (ed.), The Rate and Direction of Inventive Activity (pp. 609–26).Princeton, NJ: Princeton University Press.
13. Ibid.14. For an excellent discussion of minimum efficient scale (MES), see S. Oster (1994).
Modern Competitive Analysis. New York: Oxford University Press.15. Oster, S. (1994). Modern Competitive Analysis. New York: Oxford University Press
(p. 316).16. This section also draws heavily from Chapter 15 of A.N. Afuah (2003). Innovation
Management: Strategies, Implementation and Profits. New York: Oxford Uni-versity Press.
17. Von Hippel, E. (2005). Democratizing Innovation. Cambridge, MA: MIT Press.18. Borrus, M. G. (1988). Competing for Control: America’s Stake in Microelectronics.
Cambridge, MA: Ballinger.19. Rothwell, R. & Zegveld. W. (1981). Industrial Innovation and Public Policy.
London: Frances Pinter.20. Porter, M.E. (1990). The Competitive Advantage of Nations. New York: The Free
Press.21. Some of the data items from the figure are from PEST Analysis. Retrieved May 26,
2007, from http://www.valuebasedmanagement.net/methods_PEST_analysis.html,and PEST Analysis. (2007). Retrieved June 1, 2007, from http://www.netmba.com/strategy/pest/
11 Coopetition and Game Theory
1. Oster, S. (2002). Modern Competitive Analysis. Oxford: Oxford University Press.Pindyck, R.S., & Rubinfeld, D.L. (1992). Microeconomics (4th edn). Upper SaddleRiver, NY: Prentice Hall. Ghemawat, P. (1997). Games Businesses Play: Cases andModels. Cambridge, MA: MIT Press. Kreps, D. M. (1990). Game Theory andEconomic Modelling. Oxford, England: Clarendon Press. Dixit, A. K., & Nalebuff,B. J. (1991). Thinking Strategically. New York, New York: W. W. Norton andCompany.
2. Brandenburger, A. & Stuart, H. (2007). Biform games. Management Science53(4), 537–49.
3. Brandenburger, A. (2002). Technical note on cooperative game theory: Character-istic function, allocations, marginal contributions. Retrieved February 5, 2007 from
Notes 457

http://pages.stern.nyu.edu/~abranden/teachingmaterials/coop12502.pdf. Stuart, Jr,H. W. Cooperative games and business strategy. In K. Chatterjee and W. Samuel-son (eds), Game Theory and Business Applications, Kluwer Academic, 2001, 189–211.
4. Brandenburger, A. (2002). Technical note on cooperative game theory: Character-istic function, allocations, marginal contributions. Retrieved February 5, 2007 fromhttp://pages.stern.nyu.edu/~abranden/teachingmaterials/coop12502.pdf.
5. Pindyck, R. S., & D. L Rubinfeld. (1992). Microeconomics (4th edn). Upper SaddleRiver, NY: Prentice Hall.
6. Note that this is still a simultaneous game because, although both firms havetalked about their plans to offer planes, they have not actually made the decision tooffer the planes. Neither firm has made any irreversible commitments to offer eitherplane.
7. Ghemawat, P. (1991). Commitment: The Dynamics of Strategy. New York, NY:Free Press, 1991.
8. Basdeo, D. K., Smith, K. G., Grimm, C. M., Rindova, V. P. & Derfus, P. J. (2006).The impact of market actions on firm reputation, Strategic Management Journal,27(12), 1205–19. Heil, O., & Robertson, T. S, (1991). Toward a theory of competi-tive market signaling: A research agenda. Strategic Management Journal, 12(6),403–18.
9. Huyghebaert, N., & Van de Gucht, L. M. (2004). Incumbent strategic behavior infinancial markets and the exit of entrepreneurial start-ups, Strategic ManagementJournal, 25(6), 669–88.
10. Afuah, A. N. (1994). Strategic adoption of innovation: The case of RISC (reducedinstruction set computer) technology. Unpublished Ph.D. dissertation. Cambridge,MA: Massachusetts Institute of Technology.
11. My thanks to Professor Valerie Suslow for these insights on tacit collusion.12. Much of the pioneering management-oriented work in this area has been done by
Professors Adam Brandenburger, Barry Nalebuff, and Harthorne Stuart. See, forexample, Brandenburger, A. & Nalebuff, B. (1996). Co-opetition. New York, NY:Doubleday. Brandenburger, A. M., & Stuart, H. W. (1996). Value-based businessstrategy, Journal of Economics & Management Strategy, 5(1), 5–24. Branden-burger, A. M. and Nalebuff, B. J. (1995). The right game: Use game theory to shapestrategy. Harvard Business Review. July–August, 1995.
13. See n.12.14. The schematic that we use here is somewhat different from the Brandenburger and
Nalebuff rendition in Brandenburger, A. M. and Nalebuff, B. J. (1995). The rightgame: Use game theory to shape strategy. Harvard Business Review. July–August,1995. We chose to keep the suppliers and customers in the horizontal dimension asis customary with the strategy literature. Brandenburger and Nalebuff have substi-tutors and complementors in the horizontal dimension.
15. Brandenburger, A. M. and Nalebuff, B. J. (1995). The right game: Use game theoryto shape strategy. Harvard Business Review. July–August, 1995.
16. This example closely follows on in Stuart, Jr, H. W. (2001). Cooperative games andbusiness strategy. In K. Chatterjee, and W. Samuelson (eds), Game Theory andBusiness Applications, Kluwer Academic, 2001, 189–211.
17. Brandenburger, A. and Nalebuff, A. (1997). The added value theory of business. InStrategy & Business, published by Booz, Allen & Hamilton, fourth quarter, 1997.
18. Stuart, Jr, H. W. (2001). Cooperative games and business strategy. In K. Chatterjee,and W. Samuelson (eds), Game Theory and Business Applications, Kluwer Aca-demic, 2001, 189–211.
19. Ibid.20. The Economist, January 24, 1998 (p. 63).
458 Notes

12 Entering a New Business Using New Games
1. Porter, M.E. (1987). From competitive advantage to corporate advantage. HarvardBusiness Review, 65(3), 43–59.
2. Tirole, J. (1988). Theory of Industry Organization. Cambridge, MA: MIT Press.McWilliams, A., & Smart, D.L. (1993). Efficiency v. structure-conduct-performance: Implications for strategy research and practice. Journal of Manage-ment, 19(1), 63–78.
3. This subsection draws heavily from Afuah, A.N. (2003). Business Models: A Stra-tegic Management Approach. New York: McGrawHill/Irvin.
4. Kim, W.C., & Mauborgne, R. (2005). Blue Ocean Strategy: How to CreateUncontested Market Space and Make Competition Irrelevant. Boston, MA:Harvard Business School Press.
5. Moon, Y. (2004). Ikea Invades America (Harvard Business School case #9-504-094).
13 Strategy Frameworks and Measures
1. Year in parenthesis indicates when the first major publication that introduced theframework was published.
2. Chandler, A. (1962). Strategy and Structure: Chapters in the History of the Ameri-can Industrial Enterprise. Cambridge, MA: MIT Press.
3. Aguilar, F. (1967). Scanning the Business Environment. New York: Macmillan.4. Allen, G.B., & Hammond. J.S. (1975). Note on the Boston Consulting Group
Concept of Competitive Analysis and Corporate Strategy (Harvard Business Schoolnote 9-175-175). See also, Stern, C.W., & Deimler, M.S. (2006). The BostonConsulting Group on Strategy: Classic Concepts and New Perspectives (2nd edn).Boston, MA: BCG.
5. This example closely follows that from Afuah, A.N. (2003). Business Models: AStrategic Management Approach, New York: McGraw-Hill/Irvin.
6. Porter, M.E. (1979). How competitive forces shape strategy. Harvard BusinessReview, 57(2), 137–45. Porter, M.E. (1980). Competitive Strategy. New York: FreePress.
7. Ibid.8. Oster, S. (1999). Modern Competitive Analysis (3rd edn). Oxford: Oxford Uni-
versity Press.9. Bales, C.F., Chatterjee, P.C., Gluck, F.W., Gogel, D., & Puri, A. (2000). The busi-
ness system: A new tool for strategy formulation and cost analysis. RetrievedNovember 13, 2007, from http://www.kellogg.northwestern.edu/faculty/vohra/ftp/miin00.pdf.
10. Gluck, F.W. (1980). Strategic choice and resource allocation. The McKinsey Quar-terly, 1, 22–33.
11. Buaron, R. (1981). New-game strategies. McKinsey Quarterly, 17(1), 24–40.12. Ibid. See also, Bales, C.F., Chatterjee, P.C., Gluck, F.W., Gogel, D., & Puri, A.
(2000). The business system: A new tool for strategy formulation and cost analysis.Retrieved November 13, 2007, from http://www.kellogg.northwestern.edu/faculty/vohra/ftp/miin00.pdf.
13. Bales, C.F., Chatterjee, P.C., Gluck, F.W., Gogel, D., & Puri, A. (2000). The businesssystem: A new tool for strategy formulation and cost analysis. RetrievedNovember 13, 2007, from http://www.kellogg.northwestern.edu/faculty/vohra/ftp/miin00.pdf.
14. Porter, M.E. (1985). Competitive Advantage: Creating and Sustaining Superior Per-formance. New York: Free Press.
15. Stabell, C.B., & Fjeldstad, O.D. (1998). Configuring value for competitive
Notes 459

advantage: On chains, shops, and networks. Strategic Management Journal, 19(5),413–37.
16. Ibid.17. Ibid.18. Kaplan, R.S., & Norton, D.P. (1992). The balanced scorecard: Measures that drive
performance. Harvard Business Review, 70(1), 71–80.19. Barney, J.B. (1999). How a firm’s capabilities affect boundary decisions. Sloan
Management Review, 40(3), 137–45. Barney, J., & Hesterly, W. (2007). StrategicManagement and Competitive Advantage: Concepts (2nd edn). New York: PrenticeHall.
20. Henderson, R.M., & Clark, K.B. (1990). Architectural innovation: The reconfigur-ation of existing product technologies and the failure of established firms. Adminis-trative Science Quarterly, 35(1), 9–30.
21. Hamel, G., & Prahalad, C.K. (1990). The core competence of the corporation.Harvard Business Review, 68(3), 79–91.
22. Afuah, A.N. (1998). Innovation Management: Strategies, Implementation, andProfits. New York: Oxford University Press.
23. Hamel, G., & Prahalad, C.K. (1990). The core competence of the corporation.Harvard Business Review, 68(3), 79–91.
24. Henderson, R.M., & Clark, K.B. (1990). Architectural innovation: The reconfigur-ation of existing product technologies and the failure of established firms. Adminis-trative Science Quarterly, 35(1), 9–30.
25. Kotler, P. (1998). Marketing Management: Analysis, Planning, Implementation,and Control (9th edn). Upper Saddle River, NJ: Prentice Hall.
26. The 4Ps (Product, Pricing, Promotion and Placement) framework is a marketingframework and does not belong to a strategy textbook. However, since studentsoften ask questions about it, I have decided to add a very short note on it. Thosereaders who need details can refer to the references.
27. This section closely follows a section in the author’s previous book. See Afuah, A.N.(2003). Business Models: A Strategic Management Approach. New York: McGraw-Hill/Irvin.
28. Tully, S. (1993). EVA, the real key to creating wealth. Fortune 128 (September 20,1993), 38–50. Stern, J., Stewart, B. & Chew, D. (1992). The EVA financialmanagement system. Journal of Applied Corporate Finance, 8, 32–46.
Case 1 The New World Invades France’s Terroir
1. Genetically modified wine: Unleash the war on terroir. (December 19, 2007). TheEconomist.
2. Terroir and technology. Survey: Wine. (December 16, 1999). The Economist.3. The brand’s the thing. Survey: Wine. (December 16, 1999). The Economist.4. Viegas, J. (2007). Ancient Mashed Grapes Found in Greece. Retrieved June 16,
2008, from http://dsc.discovery.com/news.5. Jefford, A. (July 13, 2007). Rise of the terrorists. Financial Times.6. Médoc 1855 classification. (n.d.). Retrieved June 16, 2008, from http://
www.thewinedoctor.com/regionalguides/bordeauxclassifications.shtml.7. Bartlett, C.A. (2002). Global Wine Wars: New World Challenges Old (A) (HBS
case # 9–303–056). Harvard Business School Press.8. Terroir and technology. Survey: Wine. (December 16, 1999). The Economist.9. Rachman, G. (December 16, 1999). The globe in a glass. Survey: Wine. The
Economist.10. The brand’s the thing. Survey: Wine. (1999, December 16). The Economist.
460 Notes

11. Rachman, G. (December 16, 1999). The globe in a glass. Survey: Wine. TheEconomist.
12. France’s wine industry: Those vulgar markets. (January 20, 2005). The Economist.13. Wine consumption: Sour grapes in France. (December 21, 2007). The Economist.
Johnson, J. (July 22, 2004). Europe: New World ferment crisis for French wine.Financial Times.
14. France’s wine industry: Those vulgar markets. (January 20, 2005). The Economist.15. Johnson, J. (July 22, 2004). Europe: New World ferment crisis for French wine.
Financial Times.
Case 2 Sephora Takes on America
1. Raper, S. (1993). Business & Company Resource Center: News/Magazines, Shop8 and Sephora to merge. WWD, 166(21), 6.
2. Aktar, A. (1996). Business & Company Resource Center, Ross B-School, Kresge:News/Magazines, Sephora’s superstore: Setting a faster pace for French cosmetics.WWD, 172(94), 1.
3. Ibid.4. Business & Company Resource Center, Ross B-School, Kresge: Source Citation:
“Sephora Holdings S.A.” International Directory of Company Histories, Vol. 82.St James Press, 2007.
5. IBISWorld Industry Report. (March, 2008). Beauty, cosmetics & fragrance storesin the US (p. 38).
6. Ibid.7. Ibid.8. IBISWorld Industry Report. (March, 2008). Beauty, cosmetics & fragrance stores
in the US (p. 11).9. IBISWorld Industry Report. (March 2008). Beauty, cosmetics & fragrance stores
in the US (p. 9).10. Maestri, N. (February 14, 2007). J.C. Penney kicks off brand campaign. Reuters
UK.11. Business & Company Resource Center. Ulta Salon, Cosmetic & Fragrance, Inc.
Company History.12. Ibid.13. Ibid.14. Annual Report. (April 2008). Ulta Salon, Cosmetic & Fragrance, Inc. 2007 (p. 26).15. Hoover’s Online. Ulta Salon, Cosmetic & Fragrance, Inc. Company Profile.16. Sephora files suit against federated department stores. (August, 1999). Business
Wire.17. Injunction granted: Sephora wins round in federated battle. (February, 2000).
Women’s Wear Daily.18. IBISWorld Industry Report. (March, 2008). Beauty, Cosmetics & Fragrance Stores
in the US (p. 22).19. Hoover’s Online. Bath & Body Works, Inc. Company Profile.20. IBISWorld Industry Report. (March, 2008). Beauty, Cosmetics & Fragrance Stores
in the US (p. 24).
Case 3 Netflix: Responding to Blockbuster, Again
1. Spielvogel, C. (2007). Blockbuster’s total access gains subs. Retrieved May 2,2007, from http://www.videobusiness.com/article/CA6438581.html.
2. Business 2.0 Magazine Staff. (2006). 10 people who don’t matter. Retrieved July
Notes 461

21, 2008, from http://money.cnn.com/2006/06/21/technology/10dontmatter.biz2/index.htm.
3. A history of home video. (2005). Retrieved July 21, 2008, from http://www.idealink.org/Resource.phx/vsda/pressroom/history-of-industry.htx.
4. Ibid.5. Ault, S. (2007). Rental stores stock more niche titles. Retrieved July 21, 2008,
from http://www.videobusiness.com/article/CA6446483.html?q=Rental+Stores+Stock+More+Niche+Titles.
6. Datamonitor. (June 2006). Global recorded DVD & video industry profile.7. Blockbuster annual report, 1999.8. IbisWorld. (May 8, 2007). IbisWorld industry report: Video tape and disc rental in
the U.S.9. O’Brien, J.M. (2002). The Netflix effect. Retrieved July 21, 2008, from http://
www.wired.com/wired/archive/10.12/netflix.html.10. Andrews, P. (2003). Videos without late fees, Reed Hastings, digital entrepreneur.
Retrieved July 21, 2008, from http://www.usnews.com/usnews/culture/articles/031229/29hastings. htm.
11. Netflix consumer press kit. (2007). Retrieved July 21, 2008, from http://www.netflix.com/MediaCenter?id=5379.
12. Leohardt, D. (June 7, 2006). What Netflix could teach Hollywood. New YorkTimes.
13. Dornhelm, R. (2006). Netflix expands indie film biz. Retrieved July 21, 2008, fromhttp://marketplace.publicradio.org/shows/2006/12/08/AM200612081.html.
14. Netflix Prize. (2006). Retrieved June 10, 2007, from www.netflixprize.com.15. Netflix website. (2007). Retrieved June 10, 2007, from www.netflix.com.16. Netherby, J. (October 21, 2002). Three’s company in online rental. Video Business.17. Ibid.18. Lieberman, D. (April 20, 2005). Movie rental battle rages. USA Today.19. Kipnis, J. (September 4, 2004). On the video beat. Billboard.20. Daikoku, G., & Brancheau, J. (August 12, 2004). Blockbuster moves to capture
online DVD rental business. Gartner G2 Analysis.21. Wasserman, T. (December 19, 2005). Category wars: Blockbuster to hit replay on
ads for online service; Service still trails rival Netflix by 3 million subscribers.Brandweek.
22. Sweeting, P. (February 28, 2005). Blue turns to distributors for online product.Video Business.
23. Oestricher, D. (May 5, 2005). Blockbuster’s new initiatives produce mixed resultsin 1Q. Dow Jones Newswires.
24. Wasserman, T. (December 19, 2005). Category wars: Blockbuster to hit replay onads for online service; Service still trails rival Netflix by 3 million subscribers.BrandWeek.
25. Ibid.26. Blockbuster (video store). (2007). Retrieved June 10, 2007, from http://en.wikipedia.
org/w/index.php?title=Blockbuster_%28video_store%29&oldid=137206813.27.Blockbuster Online. (2007). Retrieved June 10, 2007, from www.blockbuster.com.
28. Blockbuster announces new lower prices subscription plans for online subscribers.(2007). Retrieved June 12, 2007, from http://www.b2i.us/profiles/investor/ResLibraryView.asp? BzID=553&ResLibraryID=20305&Category=1027.
29. Gonzalez, N. (2006). Movie downloads: iTunes v. the rest. Retrieved July 21, 2008,from http://www.techcrunch.com/2006/10/15/itunes-movies-v-the-rest/.
30. Leohardt, D. (June 7, 2006). What Netflix could teach Hollywood. New YorkTimes.
462 Notes

31. Hollywood and the Internet: Coming soon. (February 21, 2008). The Economist.32. Apple TV. (2007). Retrieved June 10, 2007, from www.apple.com/appletv.
Case 4 Threadless in Chicago
1. Brabham, D.C. (2008). Outsourcing as a model for problem solving: An introduc-tion and cases. Convergence: The International Journal of Research Into NewMedia Technologies, 14(1), 75–90. Gilmour, M. (November 26, 2007). Threadless:From clicks to bricks. Business Week.
2. Ogawa, S., & Piller, F.T. (2006). Reducing the risk of new product development.MIT Sloan Management Review, 47(2), 65–71.
3. Ibid.4. Weingarten, M. (June 18, 2007). “Project runway” for the T-shirt crowd. Business
2.0 Magazine.5. Kawasaki, G. (2007). Ten questions with Jeffrey Kalmikoff, Chief Creative Officer
of skinnyCorp/Threadless. Retrieved June 17, 2008, from blog.guykawasaki.com/2007/06/ten_ questions_w.html.
6. Chafkin, M. (2008, June). The customer is the company. Inc. Magazine. RetrievedJuly 21, 2008, from http://www.inc.com/magazine/20080601/the-customer-is-the-company.html.
7. Boutin, P. (2006). Crowdsourcing: Consumers as creators. Retrieved June 26,2008, from http://www.businessweek.com/innovate/content/jul2006/id20060713_755844.htm.
8. Chafkin, M. (June, 2008). The customer is the company. Inc. Magazine. RetrievedJuly 21, 2008, from http://www.inc.com/magazine/20080601/the-customer-is-the-company.html.
9. Threadless Chicago. (2008). Retrieved June 17, 2008, from http://www.threadless.com/retail.
10. Chafkin, M. (2008, June). The customer is the company. Inc. Magazine. RetrievedJuly 21, 2008, from http://www.inc.com/magazine/20080601/the-customer-is-the-company.html.
11. Weingarten, M. (June 18, 2007). “Project runway” for the T-shirt crowd. Business2.0 Magazine.
12. Kawasaki, G. (2007). Ten questions with Jeffrey Kalmikoff, Chief Creative Officerof skinnyCorp/Threadless. Retrieved June 17, 2008, from blog.guykawasaki.com/2007/06/ten_ questions_w.html.
13. Threadless Chicago. (2008). Retrieved June 17, 2008, from http://www.threadless.com/retail.
14. Ibid.
Case 5 Pixar Changes the Rules of the Game
1. Hormby, T. (2007). The Pixar Story: Dick Shoup, Alex Schure, George Lucas,Steve Jobs, and Disney. Retrieved June 21, 2008, from http://www.the-numbers.com/movies/series/Pixar.php.
2. Toy’ wonder. (1995). Retrieved June 29, 2008, from www.ew.com/ew/article/0,,299897,00.html.
3. From “Toy Story” to “Chicken Little.” (2005, December 8). The Economist.4. Schlender, B., & Furth, J. (1995). Steve Jobs’ amazing movie adventure. Disney is
betting on Computerdom’s ex-boy wonder to deliver this year’s animated Christ-mas blockbuster. Can he do for Hollywood what he did for Silicon Valley?Retrieved June 21, 2008, from http://money.cnn.com/magazines/fortune/for-tune_archive/1995/09/18/206099/index.htm.
Notes 463

5. Toy’ Wonder. (1995). Retrieved June 29, 2008, from www.ew.com/ew/article/0,,299897,00.html.
6. Schlender, B., & Furth, J. (1995). Steve Jobs’ amazing movie adventure. Disney isbetting on Computerdom’s ex-boy wonder to deliver this year’s animated Christ-mas blockbuster. Can he do for Hollywood what he did for Silicon Valley?Retrieved June 21, 2008, from http://money.cnn.com/magazines/fortune/fortune_archive/1995/09/18/206099/index.htm.
7. Hormby, T. (2007). The Pixar Story: Dick Shoup, Alex Schure, George Lucas,Steve Jobs, and Disney. Retrieved June 21, 2008, from http://www.the-numbers.com/movies/series/Pixar.php.
8. Face value: Finding another Nemo. (February 5, 2004). The Economist.9. Disney: Magic restored. (April 17, 2008). The Economist.
10. Kafka, P. (January 23, 2006). Mickey’s big move. Forbes.
Case 6 Lipitor: World’s Best-selling Drug (2008)
1. This minicase draws heavily on the case of Leafstedt, M., Marta, A., Marwaha, J.,Schallwig, P., & Shinkle, R. (2003) Lipitor: At the heart of Warner-Lambert. In A.Afuah, Business Models: A Strategic Management Approach (356–70).
2. Loftus, P. (2008). Pfizer to protect Lipitor sales until November 2011, RetrievedJune 20, 2008, from http://www.smartmoney.com/news/ON/index.cfm?story=ON–20080618–000684–1151.
3. Grom, T. (May, 1999). Reaching the goal. PharmaBusiness.4. Mincieli, G. (June, 1997). Make room for Lipitor. Med Ad News.5. Lipitor. (March, 1997). R&D Directions.6. Understanding clinical trials. (2008). Retrieved July 22, 2008, from http://clinical-
trials.gov/ct2/info/understand.
Case 7 New Belgium: Brewing a New Game
1. A bid for Bud. (June 19, 2008). The Economist.2. Ibid.3. Inc. staff. (2006). Bringing fundamental change to everyday life. And, for that
matter, death. Retrieved July 22, 2008, from http://www.inc.com/magazine/20061101/green 50_integrators.html.
4. Kessenides, D. (June 2005). Green is the new black. Inc Magazine, 27(6), 65–6.5. The brewery with the big green footprint. (2003). In Business, 25(1), 16.6. Raabe, S. (2005, June 1). Brewery supplements profits with energy savings. Knight
Ridder Tribune Business News, (p. 1).7. http://fcgov.com/utilities/wind-power.php.8. Kessenides, D. (June, 2005). Green is the new black. Inc Magazine, 27(6), 65–6.9. Raabe, S. (June 1, 2005). Brewery supplements profits with energy savings. Knight
Ridder Tribune Business News, (p. 1).10. Cohn, D. (2006). This green beer’s the real deal. Retrieved July 22, 2008, from
http://www.wired.com/news/technology/0,70361-0.html.11. Kessenides, D. (June 2005). Green is the new black. Inc Magazine, 27(6), 65–6.12. http://www.paulnoll.com/Oregon/Canning/number-liters.html.13. “Liquid—metric to non-metric. (n.d.). Retrieved July 22, 2008, from http://
www.paulnoll.com/Oregon/Canning/number-liters.html.14. Brewing up fun in the workplace. (n.d.). Retrieved July 22, 2008, from http://
www.e-businessethics.com/NewBelgiumCases/NBB-BreweryFun.pdf.15. Armstrong, D. (November 28, 2006). Philanthropy gets serious for some com-
464 Notes

panies: Growing number are making donations from revenue, not from profit.Inc.com.
16. www.newbelgiumbrewery.com/philanthropy.17. Brand evangelists/ambassadors/champions are consumers that feel so strongly con-
nected with the brand that they spread the word of the brand and attempt to helpthe brand succeed.
18. http://www.mylifeisbeer.com/beer/bottles/bottledetail/293/.19. Inc. staff. (2006). Bringing fundamental change to everyday life. And, for that
matter, death. Retrieved July 23, 2008, from http://www.inc.com/magazine/20061101/ green50_ integrators.html.
20. Ibid.
Case 8 Botox: How Long Would the Smile Last?
1. Weise, E. (2003). The little neurotoxin that could. Retrieved February 16, 2008,from http:/www.usatoday.com/news/health/2003-04-20-botox_x.htm.
2. Ibid.3. Fletcher, A. (2002). Boon for Botox injections expected with FDA’s approval.
Retrieved July 18, 2008, from http://www.bizjournals.com/denver/stories/2002/04/22/newscolumn2.html.
4. Smooth face, big Botox: A poison turned cosmetic treatment that might be thenext blockbuster. (2002, February 14). The Economist.
5. Vangelova, L. (1995). Botulinum Toxin: A poison that can heal. Retrieved July 17,2008, from http://www.fda.gov/fdac/features/095_bot.html.
6. Brush, M. (2003). Company Focus: 3 body-beautiful stocks for bountiful returns.Retrieved July 17, 2008, from http://moneycentral.msn.com/content/P65606.asp.
7. Weisul, K. (2002, May 6). Botox: Now it’s a guy thing. BusinessWeek Online.8. Creager, E. (2002). Move over, Tupperware: Botox injections are the latest thing at
home parties. Retrieved February 16, 2008, from http://www.woai.com/guides/beauty/story.aspx?content_id=16358daf-d7db-4ade-a757-9e8d7cf30212.
9. Smooth face, big Botox: A poison turned cosmetic treatment that might be thenext blockbuster. (2002, February 14). The Economist. Creager, E. (2002). Moveover, Tupperware: Botox injections are the latest thing at home parties. RetrievedFebruary 16, 2008, from http://www.woai.com/guides/beauty/story.aspx?content_id=16358daf-d7db-4ade-a757-9e8 d7cf30212.
10. Smith, A. (2006). Plenty of smooth sailing ahead for Botox. Retrieved July 17,2008, from http://money.cnn.com/2006/04/03/news/companies/allergan_botox/index.htm.
11. Ibid.12. Emerging uses of Botox. (2005). Retrieved July 18, 2008, from http://
www.botoxfacts.ca/uses.html.13. Ibid.14. Facelift information. (2008). Retrieved February 17, 2008, from http://
www.cosmeticplasticsurgerystatistics.com/facelifts.html#INFO.15. Reloxin, botulinum toxin type A: Treatment for Aesthetics. (2007). Retrieved July
17, 2008, from http://www.drugs.com/nda/reloxin_071206.html.16. The most popular cosmetic procedures: popular cosmetic surgery. (n.d.). Retrieved
July 17, 2008, from http://women.webmd.com/features/most-popular-cosmetic-procedures.
17. Realizing opportunities: Annual Report 2007. (2008). Retrieved July 18, 2008,from http://files.shareholder.com/downloads/AGN/362148606x0x184012/BB8ED2E7-30CF-443D-A2F7-0935FE134F78/2007AnnualReport.pdf.
18. Rundle, R.L. (2007). Botox faces worry lines in smooth skin game. Retrieved July
Notes 465

18, 2008, from http://medicalnewstouse.blogspot.com/2007/12/botox-may-face-competition.html.
19. I would like to thank Adeesh Agarwal, Michael Johnson, Tyler Link, Samir Patel,Jonathan Stone, and Kevin Tsuchida for drawing my attention to Botox when theywrote a case on Botox in the class New Game Business Model at the Stephen M.Ross School of Business at the University of Michigan.
Case 9 IKEA Lands in the New World
1. List of the 100 wealthiest people. (2008). Retrieved June 24, 2008, from http://en.wikipedia. org/wiki/List_of_billionaires.
2. Tycoons: Bill v Ingvar. (April 7, 2004). The Economist.3. Facts & figures. (2008). Retrieved June 24, 2008, from http://www.ikea.com/ms/
en_US/about_ikea_new/facts_figures/index.html.4. Ibid.5. Crush chaos at Ikea store opening. (2005). Retrieved June 27, 2008, from http://
news.bbc.co.uk/2/hi/uk_news/england/london/4252421.stm.6. Capell, K., Sains, A., Lindblad, C., Palmer, A.T., Bush, J., Roberts, D., & Hall, K.
(2005). Ikea: How the Swedish retailer became a global cult brand. Retrieved June27, 2008, from http://www.businessweek.com/magazine/content/05_46/b3959001.htm.
7. Ibid.8. Chang, J. (2005). How IKEA, MoMA connect with design talent. Retrieved June
27, 2008, from http://www.metropolismag.com/cda/story.php?artid=1391.9. Facts & figures. (2008). Retrieved June 24, 2008, from http://www.ikea.com/ms/
en_US/about_ikea_new/facts_figures/index.html.10. Ibid.11. Capell, K., Sains, A., Lindblad, C., Palmer, A.T., Bush, J., Roberts, D., & Hall, K.
(2005). Ikea: How the Swedish retailer became a global cult brand. Retrieved June27, 2008, from http://www.businessweek.com/magazine/content/05_46/b3959001.htm.
12. Ibid.13. Ibid.14. IKEA: Flat-pack accounting. (2006, May 11). The Economist.
Case 10 Esperion: Drano for Your Arteries?
1. CDC IXIS Securities. (February 24, 2003). Cholesterol: The Battle Rages On.2. Ibid.3. Ibid.4. Two drugs are notable exceptions. Crestor (AstraZeneca) was expected to be
launched in 2003 with a better safety and efficacy profile than any currently mar-keted statin. Additionally, Novartis/Sankyo’s Pitavastin was a statin currently inPhase IIb trials in Europe expected to be launched in 2007.
5. CDC IXIS Securities. (February 24, 2003). Cholesterol: The Battle Rages On.6. Deutsche Bank Securities. (December 22, 2003). Pfizer Inc.: Building Cardio
Dominance.7. How far we’ve come. (August 1, 2006). Pharmaceutical Executive.8. CDC IXIS Securities. (February 24, 2003). Cholesterol: The Battle Rages On.9. UBS Investment Research. (November 21, 2003). Merck & Co.
10. Harper, M. (2003). Merck’s troubles, Schering’s solution. Retrieved December 6,2006, from http://www.forbes.com/2003/11/21/cx_mh_1121mrk.html.
11. Bristol-Myers Squibb Co. (2002). 10-K.
466 Notes

12. Bristol-Myers Squibb Co. (November 19, 2003). Where’s the Growth?Oppenheimer Equity Research
13. Ibid.14. CDC IXIS Securities. (February 24, 2003). Cholesterol: The Battle Rages On.15. Ibid.16. Frost & Sullivan. (November 10, 2005). U.S. Lipid Therapeutics Market. (Section
2.6.1).17. Thomson Financial Venture Economics. (September 27, 2006). Esperion Thera-
peutics, Inc Company Report (VentureXpert).18. Rozhon, T. (December 22, 2003). Pfizer to buy maker of promising cholesterol
drug. New York Times.19. Datamonitor Company Profiles. (January 24, 2004). Esperion Therapeutics—–
history.20. Winslow, R. (November 5, 2003). New HDL drug shows promise in heart study.
The Wall Street Journal.21. PR Newswire. (October 31, 2000). Esperion Therapeutics, Inc. announce results
for third quarter 2000.22. Rozhon, T. (December 22, 2003). Pfizer to buy maker of promising cholesterol
Drug. New York Times.23. Winslow, R. (November 5, 2003). New HDL drug shows promise in heart study.
The Wall Street Journal.24. Braunschweiger, A. (June 26, 2003). Esperion shares surge on study of heart-plaque
treatment. Dow Jones Business News.25. Esperion. (2002). 10-K.26. Ibid.27. Dimasi, J., Hansen, R., & Grabowski, H. (2003). The price of innovation: New
estimates of drug development costs. Journal of Health Economics, 22(2), 151–85.28. Esperion. (2002). 10-K.29. Ibid.30. Ibid.31. Young, P. (September 18, 2002). Troubling times for Pharma. Chemical Week.32. Pfizer.com. (March 2004). Press Release.33. Ibid.34. Goetzl, D. (October 1, 2001). Media mavens: Donna Campanella. Advertising Age.35. Ibid.36. Abboud, L., & Hensley, S. (September 3, 2003). Factory shift: New prescriptions
for drug makers; update the plants—after years of neglect, industry focuses onmanufacturing; FDA acts as a catalyst; The three story blender. Wall Street Journal.
37. Physician survey ranks Pfizer sales force first in industry for fifth consecutive year.(January 20, 2000). PR Newswire.
38. Pfizer sales force most esteemed by US doctors. (February 18, 2002). Marketletter.39. Mintz, S.L. (2000). What is a merger worth? Retrieved October 12, 2006, from
http://www.cfo.com/article.cfm/298857640. Morrow, D.J., & Holson, L.M. (November 5, 1999). Warner—Lambert gets Pfizer
offer for $82.4 billion. New York Times.41. Pfizer to buy maker of promising cholesterol drug. (December 22, 2003). New York
Times.42. Ibid.43. Ibid.44. Pfizer to acquire Esperion Therapeutics to extend its research commitment in car-
diovascular disease. (December 21, 2003). Pfizer press release.45. Pfizer to buy Esperion for $1.3bn. (2003). Retrieved October 10, 2006, from http://
www. cnn.com/2003/BUSINESS/12/21/us.pfizer.reut/.
Notes 467

Case 11 Xbox 360: Will the Second Time be Better?
1. PONG-story: Introduction. (2008). Retrieved July 15, 2008, from http://www.pong-story.com/intro.htm. Atari Museum home page. (n.d.). Retrieved July15, 2008, from http://www.atarimuseum.com/mainmenu/mainmenu.html.
2. Herman, L., Horwitz, J., Kent, S., & Miller, S. (2002). The history of video games.Retrieved July 15, 2008, from http://www.gamespot.com/gamespot/features/video/hov/index.html.
3. Ibid.4. Ibid.5. Vogelstein, F. (n.d.). Rebuilding Microsoft. Retrieved December 20, 2006, from
http://www.wired.com/wired/archive/14.10/microsoft_pr.html.6. Wii price is high by historical standards. (2006). Retrieved July 15, 2008,
from http://diggy.wordpress.com/2006/10/17/wii-price-is-high-by-historical-standards/.
7. Xbox live. (n.d.). Retrieved July 15, 2008, from http://en.wikipedia.org/wiki/Xbox_Live.
8. Becker, D. (2004). “Halo 2” clears record $125 million in first day. Retrieved July15, 2008, from http://news.com.com/Halo+2+clears+record+125+million+in+first+day/2100– 1043_3–5447379.html.
9. Gamers wipe out supply of Nintendo’s new Wii. (2006). Retrieved July 15, 2008,from http://www.pcmaczone.co.uk/modules.php?name=News&file=article&sid=386.
10. Ibid.11. Playing a different game. (October 26, 2006). The Economist.
Case 12 Nintendo Wii: A Game-changing Move
1. Video game. (2007). Retrieved December 25, 2007, from http://en.wikipedia.org/wiki/Video_games.
2. Afuah, A.N., & Grimaldi, R. (2003). Architectural innovation and the attacker’sadvantage from complementary assets: The case of the video game consoleindustry. Working Paper, Stephen M. Ross School of Business at the University ofMichigan, Ann Arbor, MI.
3. Megahertz is a crude measure of the speed or power of a processor. The higher theMegahertz, the faster the processor is supposed to be. The “number of polygons” isa measure of the graphical detail in the resulting images.
4. Playing a different game: Does Nintendo’s radical new strategy represent thefuture of gaming? (October 26, 2006). The Economist. Gapper, J. (July 13, 2007).Video games have rediscovered fun. Financial Times.
5. Ibid.6. O’Brien, J.M. (2007). Wii will rock you. Retrieved December 27, 2007, from
http://www.mutualofamerica.com/articles/Fortune/June%202007/fortune2.asp.7. Turott, P. (2007). Xbox 360 vs. PlayStation 3 vs. Wii: A technical comparison.
Retrieved December 27, 2007, from http://www.winsupersite.com/showcase/Xbox360_ps3_wii.asp.
8. Gapper, J. (July 13, 2007). Video games have rediscovered fun. Financial Times.9. Bird D., Bosco N., Nainwal S., & Park E. (2007). The Nintendo Wii. Working
Case, Stephen M. Ross School of Business at the University of Michigan, AnnArbor, MI.
10. O’Brien, J.M. (2007). Wii will rock you. Retrieved January 2, 2008, from http://money. cnn.com/magazines/fortune/fortune_archive/2007/06/11/100083454/index.htm.
468 Notes

Author Index
Abboud, L. 467Abernathy, W.J. 448, 455, 456Afuah, A.N. 449, 452, 453, 454, 455,
457, 458, 459, 460, 464, 468Agarwal, A. 450, 466Aguilar, F. 328, 459Aktar, A. 461Allen, G.B. 459Allen, T. 454, 455Anderson, C. 67, 72, 87, 450Andrews, K. 28, 448Andrews, P. 462Anthony, S.D. 455Arikan, A.M. 448, 452Armstrong, D. 464Arrow, K.J. 457Ault, S. 462
Bales, C.F. 343, 447, 459Barney, J.B. 353, 448, 452, 453, 454,
460Bartlett, C.A. 452, 460Basdeo, D.K. 458Baxter, J. 456Becker, D. 468Besanko, D. 450, 453, 454Bettis, R.A. 454, 455Bhatia, T. 452Bird, D. 468Borrus, M.G. 457Bosco, N. 468Boutin, P. 463Bower, J.L. 455Brabham, D.C. 463Brancheau, J. 462Brandenburger, A.M. 290, 450, 457, 458Brandt, R. 454Braunschweiger, A. 467Brealey, R.A. 449
Brush, M. 465Brynjolfsson, E. 450Buaron, R. 447, 459Burns, E. 452Bush, J. 466Byrne, J.A. 454
Capell, K. 449, 466Carpenter, G.S. 453Carroll, C.D. 457Chafkin, M. 447, 463Chai, K. 434Chandler, A.D. 28, 448, 454, 459Chang, J. 466Chatterjee, P.C. 343, 447, 459Chew, D. 460Chock, C. 383Christensen, C.M. 202, 204–5, 207–8,
209, 212, 214, 216, 220, 454, 455Clark, K.B. 190, 448, 455, 456, 460Cohn, D. 464Coleman, Jr, H.J. 454Colombo, V. 434Constant, E.W. 455Cornebise, J. 452Crane, C. 393Creager, E. 451, 465Cusumano, M.A. 452
Daikoku, G. 462Davidow, W.H. 454Dedrick, J. 116, 451Deimler, M.S. 459Derfus, P.J. 458Dharamsey, A. 405Digman, L.A. 450Dimasi, J. 426, 427, 467Dixit, A.K. 457Dornhelm, R. 462

Downes, L. 452Dranove, D. 450, 453, 454Duran, L. 405Dyer, J.H. 451
Farrell, C. 457Fierman, J. 184, 454, 455Fishburne, F. 453Fishman, C. 453Fjeldstad, O.D. 348, 447, 459Fletcher, A. 465Foster, R.D. 201, 455Frederickson, J.W. 29, 449Freeberg, D. 450Fujimoto, T. 190, 455Furth, J. 463, 464Fusfeld, A.R. 455
Galbraith, J.R. 454Ganguly, T. 383Gapper, J. 468Gates, D. 451Ghemawat, P. 447, 450, 453, 457,
458Ghoshal, S. 449Gilmour, M. 463Gluck, F.W. 343, 447, 459Goetzl, D. 467Gogel, D. 343, 447, 459Gonzalez, N. 462Grabowski, H. 426, 467Grant, R.M. 28, 449, 451Greeno, C. 383Grimaldi, R. 468Grimm, C.M. 458Grom, T. 464
Hall, K. 466Hambrick, D.C. 29, 449Hamel, G. xvi, 28, 119, 355, 448, 452,
454, 455, 460Hammond, J.S. 459Hansen, R. 426, 467Harper, M. 466Heil, O. 458Henderson, R.M. 460Hensley, S. 467Herman, L. 468Higgins, C.A. 455Hill, C.W.L. 454Hitt, M.A. 29, 449Holson, L.M. 467Hormby, T. 463, 464
Horwitz, J. 468Hoskisson, R.E. 29, 449Houston, P.W. 450Howe, J. 107, 451Howell, J.M. 455Hu, Y. 450Huntley, E. 434Huyghebaert, N. 458
Ireland, R.D. 29, 449
Jefford, A. 460Johnson, J. 461Johnson, M. 450, 466Johnson, W. 393Jones, G.R. 454Joseph, C. 405
Kafka, P. 464Kanellos, M. 452Kanoh, Y. 451Kaplan, R.S. 350, 449, 460Katz, M.L. 452Kawasaki, G. 463Kent, S. 468Kessenides, D. 464Kim, W.C. 459Kipnis, J. 462Knakal, J. 383Knakal, T. 383Kotler, P. 460Kraemer, K.L. 116, 451Kreps, D.M. 457Krichbaum, S. 405
Lampel, J. 449Laseter, T.M. 450Latif, U. 453Lawrence, P.R. 454Leafstedt, M. 464Leohardt, D. 462Levy, B. 422Lieberman, D. 462Lieberman, M.B. 448, 453,
454Lilien, G.L. 455Lindblad, C. 466Linden, G. 116, 451Link, T. 450, 466Lipman, S. 450Loftus, P. 464Lorsch, J.W. 454Lyon, P. 422
470 Author Index

MacDonald, G. 450McLean, A.N. 452Mackenzie, I. 434McWilliams, A. 459Maestri, N. 461Malone, M.S. 454Manchanda, P. 452Manly, J. 434Marta, A. 464Marwaha, J. 464Mathews, J.A. 454Matsuura, T. 434Mauborgne, R. 459Miles, G. 454Miles, R.E. 454Miller, S. 468Mincieli, G. 464Mintz, S.L. 467Mintzberg, H. 29, 449Montgomery, D.B. 448, 453,
454Moon, Y. 448, 451, 459Morrison, K. 377Morrison, P.D. 455Morrow, D.J. 467Mui, C. 452Myers, S.C. 449Mylonadis, Y. 452
Nainwal, S. 468Nair, H. 452Nakamoto, K. 453Nalebuff, B.J. 290, 457, 458Netherby, J. 462Neumark, K. 393Norton, D.P. 350, 449, 460
O’Brien, J.M. 444, 462,468
Oestricher, D. 462Ogawa, S. 463Olsen, S. 453Oster, S. 28, 448, 457, 459Otsuka, M. 457Overdorf, M. 454, 455
Palmer, A.T. 466Paradowski, J. 377Park, E. 468Park, J.Y. 450Parker, G. 452Patel, S. 450, 466Perrigo, C. 393
Peteraf, M.A. 448Peterson, S. 422Piller, F.T. 463Pindyck, R.S. 456, 457, 458Podolny, J. 450Porter, M.E. 28, 268–9, 337, 345, 447,
448, 453, 457, 459Pototschnik, S. 377Prahalad, C.K. 28, 119, 255, 355, 448,
452, 454, 455, 460Puri, A. 344, 447, 459
Quinn, J.B. 449Quittner, J. 452
Raabe, S. 464Rachman, G. 460, 461Raper, S. 461Raynor, M.E. 455Rindova, V.P. 458Rivkin, J.W. 447, 448, 449, 453Roberts, D. 466Roberts, E.B. 455Robertson, T.S 458Rochet, J. 452Rosenbloom, J. 422Rosenbloom, R.S. 452Roth, E.A. 455Rothwell, R. 266, 457Rozhon, T. 467Rubinfeld, D.L. 456, 457, 458Rumelt, R. 450Rundle, R.L. 465Ryall, M. 450
Sahal, D. 455Sains, A. 466Saloner, G. 450Schallwig, P. 464Schein, E. 184, 454Schlender, B. 463, 464Schmalensee, R. 453Schön, D.A. 455Searls, K. 455Shanley, M. 450, 453, 454Shapiro, C. 452Shepard, A. 450Sheremata, W.A. 453Shinkle, R. 464Shirky, C. 450Siggelkow, N. 448Simester, D. 450Singh, H. 451
Author Index 471

Slacalek, J. 457Smart, D.L. 459Smith, A. 465Smith, K.G. 458Smith, M.D. 450Smucker, M. 377Snow, C.C. 454Sonnack, M. 455Spielvogel, C. 461Stabell, C.B. 348, 447, 459Stern, C.W. 459Stern, J. 460Stewart, B. 460Stewart, T.A. 448, 452Stone, J. 450, 466Stuart, Jr, H.W. 299, 450, 457,
458Sweeting, P. 462
Tapscott, D. 106, 447, 451Taylor, C. 450Teece, D.J. 124, 452, 453, 454Tirole, J. 452, 459Tischler, L. 106, 447, 451Tripsas, M. 451Tsuchida, K. 450, 466Tucci, C.L. 454Tully, S. 460Turott, P. 468
Uttal, B. 184, 454, 455Utterback, J.M. 455
Vamvaka, S. 377Van Alstyne, M. 452Vangelova, L. 465Van de Gucht, L.M. 458Vasilev, M. 422Vernon, C. 456Viegas, J. 460Vogelstein, F. 468Von Hippel, E. 75, 266, 455, 457
Wallace, J. 451Walsh, J.P. 455Wang, Y. 452Wasserman, T. 462Weingarten, M. 463Weise, E. 465Weisul, K. 465Williams, A.D. 106, 447, 451Winslow, R. 467Wright, J.L. 450
Yoffie, D.B. 452Young, P. 467
Zegveld, W. 266, 457Zehra, S. 405
472 Author Index
Subject Index
4Ps: advantages 360; applications357–61; disadvantages 360; elements358–9; new games 360–1
7Cs framework: profitability 39
activities: activities to profits 9–10;activities, value, appropriability andchange see AVAC; components 39,40–4, 56–60, 79–82; comprehensive42, 44, 60, 113–14, 216, 297, 310,324–5; coopetitors 43, 59; customervalue 45; differentiation 43, 57–8,110–11; financial support 257–8; firstto establish a system of activities154–5, 157; industry value drivers 42,44, 59–60, 112; key takeaways 64;long tail 81–2; low cost 43, 57–8;new game activities see new gameactivities; parsimonious 42, 44, 60,113–14, 216, 297, 310, 324–5;performance 40–4; primary 345–6,349; resources/capabilities 44, 60;Ryanair 56–60; support 346–7; valuechain 92, 345–7
adverse selection 263aggregators: long tail 72Amazon: long tail 68Apple: intangibles 141; iPhone 6, 84,
91–2, 99–100, 210, 443; long tail80–7
appropriability: activities, value,appropriability and change see AVAC;component 45–8, 61–2, 83–4;coopetitors 45–7, 61; Google 133–4;imitability 47–8, 61; key takeaways64–5; resources 130; Ryanair 61–2;substitutes/complements 48, 62; valuesee value appropriation
assets: intangibles 118attractiveness test: entry 306–8
AVAC: activities 39, 40–4, 56–60,79–83, 361–3; advantages 364;analysis 52–3, 79–87; applications361–4; appropriability 45–8, 61–2,83–4, 363; case example 79–87;change 48–52, 62–4, 84–5, 363–4;components 40, 362; dataorganization 53; drivers 41; elements361–4; framework 39–52; keytakeaways 64–6; logic 39–40; longtail investigation 79; new gamestrategies 17–19; outcomes compared53; profitability assessment 35–66;record labels/musicians 87; strategicconsequences 86; strategic planning53; strategy execution 79; timing 53;value 40, 82–3, 130, 363; workedexample 54–6
Balanced Scorecard: advantages 353;applications 350–3; customers 352;disadvantages 353; elements 351–2;financial perspective 352; internalbusiness perspective 352; learning andgrowth perspective 352; profitability38
bargaining leverage 340–1BCG’s Growth/Share Matrix:
advantages 333–4; application 330–4;cash cows 331; disadvantages 334;dogs 331–2; elements 330–2; questionmarks 332; relative market share 332;stars 331
better-off/alternatives test 308–12Blockbuster Inc 76–7, 387–9blockbusters: long tail 68, 72books: value system 97–8Botox 73, 77, 411–16boundary spanners 189–90breakeven 313–15, 367

business systems: strategy frameworks343–5
buyers: bargaining power 340–1
capabilities: activities 44, 60;competition 129; customers 118–19;disruptive technologies 215–16; entry304, 310; first-mover disadvantages162; game theory 297; globalization237–8, 239–40; intangibles 118; keytakeaways 142–4; new games 13,117–44; profitability 128–39; strategicconsequences 135
case studies: Botox 411–16; businessperformances 3–4; Dell 4; Esperion422–33; Goldcorp 4; Google 3; IKEA417–21; Lipitor 3, 401–4; Netflix383–90; New Belgium 405–10;Nintendo Wii 3, 442–6; Pfizer 3,401–4; Pixar 393–400; Ryanair 4;Sephora 377–82; Threadless 4,391–2; Xbox 434–41
cash flow 315–16, 367CAT scans 124, 125champions 189change: activities, value, appropriability
and change see AVAC; components48–52, 62–4, 84–5; coopetitors 51, 64;first-mover advantages (FMAs) 50–2,63; first-mover disadvantages 50–2,63, 159–60; Google 134; handicaps49; key takeaways 66; new gamefactors 48–52, 62–4; new games11–13, 84–5; questions 49; resources50, 62, 130; Ryanair 62–4; strengths49; technology 159–60; value creation50, 62
characteristic function 288Cisco Systems: market value 36–8commitments: first-mover advantages
(FMAs) 155, 284–5; first-moverdisadvantages 161; game theory284–5; irreversible commitments 155,284; relationships 161; sunk costs161–2
Compaq: competition 15competences: core competences 119competition: appropriation 6; better
positioning 10; capabilities 129;entry 307, 319; first-mover advantages(FMAs) 18, 145–77; first-moverdisadvantages 145–77; globalization238–42; government policies 260;
handicaps 15, 50–2, 160, 298;incentives 108; innovation 206–7;latent links 105; meeting thecompetition 287; missedopportunities 105; new games 17–19;players 165; position-building newgames 26–7; product-market position(PMP) 23; reactions 14–15; regularnew games 24–5; resource-based view(RBV) 23; resource-building newgames 25; resources 129, 130;strategic action 131; strategyconsequences 18–19
complementary assets: classification135; exploitation strategies 126;identification 135–6; imitability124–6; investment 261; location 152;preemption 151–2; public goods261–2, 267; rank ordering 136; role124–6; scarcity 169–70; strategicconsequences 126–7; teaming up126–7; Teece Model 124–8; valueappropriation 94
complements: appropriability 48, 62;boosting complements 122; FiveForces Framework 343
components: activities 40–4, 56–60,79–83; appropriability 45–8, 61–2,83–4; change 48–52, 62–4, 84–5; newgame strategies 17–19; value 40, 82–3
comprehensive activities 42, 44, 60,113–14, 216, 297, 310, 324–5
concentration of buyers 340consumers: direct-to-consumer
marketing (DTC) 103; globalization235; perceptual space 154; tastes/needs 235; see also customers
contribution: contribution margin 322;coopetitors 6; marginal contribution289; political contributions 74
cooperation: latent links 105; missedopportunities 105; value creation 6
cooperative games 276–7, 287–8coopetitors: activities 43, 59;
appropriability 45–7, 61; change 51,64; contribution 6; disruptivetechnologies 214–15; entry 310;environment 258–9; first-moveradvantages (FMAs) 149; Five ForcesFramework 343; game theory275–300; globalization 245; keytakeaways 32–3; long tail 71; players165; position-building new games
474 Subject Index

26–7; positioning xvi, 4, 10, 24–9, 43,112, 296–7, 310; reactions 17;relationships 95; Ryanair 57, 61, 63;value appropriation 94–5; valuecreation 97–100
cosmetic surgery 73costs: breakeven analysis 313–15; capital
asset pricing model (CAPM) 315–16;cash flow method 315–16;contribution margin 313; discountrate 315; drivers 312–13; entry312–19; estimation 313–16; fixedcosts 341; high cost channels 69; lowsee low cost; new game activities316–19; opportunity cost 313; sunkcost-related commitments 161–2;switching see switching costs;systematic risk 315; transaction costsreduced 305–6; under globalization237
crowdsourcing: cheaper/faster 108;competitor incentives 108;disadvantages 108; existing solutions107; Internet 106–9; outsourcing 107;public 107; signaling 108; talent 108
culture: failure tolerated 258, 260;financial rewards 259–60; first-moveradvantages (FMAs) 151;organizational culture 151; people184; sociocultural environment 255
customer value: activities 45; Google131–3; products 9; resources 130
customers: Balanced Scorecard 352;buyer choice under uncertainty 154;capabilities 118–19; changing needs159–60; cognitive limitations 69;disruptive technologies 214; first-at-customers 153–4, 157; heterogeneity69; most-favored customer clauses287; new game activities 110–11;reservation price 95; switching costs149, 153
data: AVAC 53; Five Forces Framework342; strategy frameworks 325; valuechain 347
debt capital 368–9definitions 4–7Dell: case studies 4; competition 15;
environment 15; first-moveradvantages (FMAs) 154–5; first-moverdisadvantages 159; new gamestrategies 5, 16
demand: innovation 269; price elasticity228–9
deterrence: game theory 283–4developing countries: cell phones 74;
microfinancing 75; regulation 238differentiation: activities 43, 57–8,
110–11; inputs 340; products 340;VIDE 356
discount retailing: rural areas 74disruptive technologies: capabilities
215–16; characteristics 202;coopetitors 214–15; customers 214;disrupted/disruptors 205;disruptiveness 218–20; handicaps210–13; incumbents 206–8, 216–17;industry value drivers 215; innovation206–7; key takeaways 220–2; limitedcoverage 209; new entrants 218; newgame strategies 210–16; new games199–222; phenomenon 202–10;potential 207–8; profitability 210–18;rationale 203–5; resources 215–16;shortcomings of model 209–10;strategy focus 209–10; strengths210–13; unique value 215–16;usefulness 206–8; value appropriation206–8; value chain 213–16; valuecreation 206–8
distribution: high cost channels 69;identification 78; long tail 69, 71, 78
domestic corporations 234drivers: costs 312–13
earnings: first-mover advantages (FMAs)155–7, 169; historical earnings 36;stabilization 237
earnings per share 367EBIDT 36economic value added (EVA) 368–9economies of scale: entry 304, 338;
first-mover advantages (FMAs) 147;globalization 237–8
entry: attractiveness test 306–8;better-off/alternatives test 308–12;capabilities 304, 310; competition307, 319; coopetitors 310; costs312–19; economies of scale 304, 338;encouragement 285; environment307, 319; evaluation 306–16; first-mover advantages (FMAs) 318–19;frameworks of analysis 308; gametheory 283, 285; growth 303;industry value drivers 310;
Subject Index 475

international financial market 304–5;key players 308; key takeaways321–2; market position 311; newbusiness 303–22; new games 316–21;new value 317–18; opportunity cost313; position-building new games321; product lines 311; profitability309–12; reasons 303–5; regular newgames 320–1; resource-building newgames 320; resources 304, 310, 318;revolutionary new games 321;Structure-Conduct-Performance (SCP)308; transaction costs reduced 305–6;value creation 317–18; verticalintegration 311–12
entry barriers: Five Forces Framework338–40; game theory 283
environment: coopetitors 259;demographic 255; economic 255;entry 307, 319; factor conditions258–9; failure tolerated 259; first-mover advantages (FMAs) 170;globalization 246–7; governmentpolicies 259–68; key takeaways272–4; macroenvironments 246–7,253–300, 343; natural environment255–6; new games 252–74;opportunities 15–16, 51, 64, 246–7,253–6, 299, 319; PESTN analysis 15,16, 216–17, 270–4; political-legal254; procreative destruction 259; S3PEframework 185–6; sociocultural 255;technology 253–4; threats 15–16, 51,64, 246–7, 253–6, 299, 319; valueappropriation 256–61; value creation256–61
equity capital 368Esperion 422–33extendability 356
factor conditions: environment 258–9;first-mover advantages (FMAs) 152;innovation 268–9
factors: industry see industry factors; newgame see new game factors; SWOT325–7
finance: financial rewards 259–60;financial support 260–1; internationalfinancial market 304–5;microfinancing 75
financial measures: 7Cs framework 38;Balanced Scorecard 38; beneath thenumbers 38; Five Forces Framework
38; historical earnings 36; marketvalue 36–8; strategy 36–8, 367–9
financial support: activities 257–8;microfinancing 75; new games259–61
financier 265–6firm-specific factors: Five Forces
Framework 342; long tail 73firms: globalization 236–8; long tail 73;
S2P 190–3; strategy/structure/rivalry269–70
first-mover advantages (FMAs): brandmindshare 154; buyer choice underuncertainty 154; change 50–2, 63;commitments 155, 284–5;competition 18, 145–77; conclusions169–74; coopetitors 149; earnings155–7, 169; economic rents 148;economies of scale 147; entry 318–19;environment 170; equity 148;exploitation 169, 172–4; factorconditions 152; first to establish asystem of activities 154–5, 157;first-at-customers 153–4, 157; gametheory 298; globalization 244–5;intellectual property 150; keytakeaways 174–7; leadership 149–51;learning 151; managers 172;mechanisms 146; numerical example172–4; organizational culture 151;plant and equipment 152; potential13–14; preemption of scarce resources151–3, 156–7; pursuit 157–8; rankorder 158; scope 145–55; size effects147; switching costs 153; technologyand innovation 156; total availablemarket preemption 146–51, 156
first-mover disadvantages:cannibalization 162; capabilities 162;change 50–2, 63, 159–60;competition 145–77; dominant logic160; first-mover inertia 159–60;free-riding 159; game theory 298;irreversible investments 161;minimization/exploitation 170; priorcommitments 161–2; relationship-related commitments 161; research &development (R&D) 159, 170;resources 162; scope 159–62;strategic fit 159–61; sunk cost-relatedcommitments 161–2; technological/marketing uncertainty 159
Five Forces Framework: advantages 341;
476 Subject Index
applications 337–43; complementors343; coopetitors 343; dataorganization 342; disadvantages342–3; elements 338–41; entrybarriers 338–40; firm-specific factors342; industry attractiveness 341;industry factors 342; narrowing down343; opportunities 342; profitability38; threats 342
followers: advantages 159; conclusions169–74; strategy 161
Foster’s S-curve 201–2France: wine 373–6
game theory: accommodate/merge/exit287–8; advertising 280; capabilities297; changing the game 290–3;changing players 290–1; characteristicfunction 288; commitments 284–5;cooperative games 276–7, 287–8;coopetitors 275–300; deterrence283–4; dominant strategy 278–9, 280;entry barriers 283; entry encouraged285; first-mover advantages (FMAs)298; first-mover disadvantages 298;future anticipated 294; industry valuedrivers 297; innovation 276;insights/possibilities/consequences294; limit pricing 283–4; limitations294–5; lower price 277; Nashequilibrium 279–80; new gameactivities 295; new game factors 298;noncooperative games 276–87;payoffs 277, 280; predatory activities285–6; prisoners’ dilemma 280,281–2; raise price 277; repeatedsimultaneous games 281–2;reputation 285; research &development (R&D) 297; resources297; revenue sources 296; rulesfought/changed 285–6; sequentialgames 282–4; signaling 285;simultaneous games 278–82; strategicquestions 294; tacit collusion 287;usefulness 293–9; value appropriation293–9; value chain 295–9; valuecreation 293–9
gatekeepers 189–90GE/McKinsey Matrix: advantages 336;
applications 334–6; Business Strength/Competitive Position 335;disadvantages 336; elements 334–5;industry attractiveness 334–5
globalization: capabilities 238, 239–40;competition 238–42; consumers 235;coopetitors 245; drivers 234–6;earnings stabilization 237; economiesof scale 237–8; environment 246–7;firms 236–8; first-mover advantages(FMAs) 245–5; following buyer 237;global adventurers 240–1; globalgeneric 242; global heavyweights241–2; global multinationals 234;global stars 241; government policies236; growth 237; handicaps 242–3;innovation 234–6; key takeaways247–9; learning 238; markets 238;meaning 232–3; multinationalcorporations (MNCs) 233–4; newgames 223–51; offensive move 237;opportunities 16, 246–7; product-market position (PMP) 238–9;production costs 237; regulation 238;resources 239–40, 244; strategies238–42; strengths 242–3; valueappropriation 224–30
Goldcorp Inc: case studies 4;crowdsourcing 106–7; new gamestrategies 4
Google: activities 131; appropriability133–4; capabilities 131–6; casestudies 3; change 134; customer value131–3; long tail 68, 70; new gamestrategies 5, 16; research &development (R&D) 6, 132
government policies: competition 261;education 268; environment 259–68;globalization 236; lead user 266;macroeconomic fundamentals 268;new games 265–8; rationale for role261–4; regulation 267–8; value chain228–30
growth: entry 303; globalization 236
handicaps: change 49; competition 15,50–2, 160, 298; disruptivetechnologies 210–13; globalization242–3; new game strategies 109; newgames 136–9
historical earnings: profitability 36Honda: core competences 119
IKEA 417–21imitability: appropriability 47–8, 61;
complementary assets 124–7; valueappropriation 96; VIDE 356
Subject Index 477

industry: minimum efficient scale (MES)264
industry attractiveness: Five ForcesFramework 341; GE/McKinseyMatrix 334–5
industry factors: Five Forces Framework342; long tail 71–3
industry value drivers: activities 41, 44,59–60, 112; disruptive technologies215; entry 310; game theory 297
information technology: innovation 70;see also Internet
innovation: competition 206–7; demand269; disruptive technologies 206–7;factor conditions 268–9; firm strategy/structure/rivalry 269–70; first-moveradvantages (FMAs) 156; game theory276; globalization 234–6; informationtechnology 70; long tail 77–9; people188–90; Porter’s Diamond 268–9;related/supporting industries 269;S2P 188–90; strategic see strategicinnovation; user innovation 75
innovations see inventionsintangibles: assets 118; assigning
numbers 139–40; leveraging effect140–2; numerical example 140–2;valuation 139–42
intellectual property: first-moveradvantages (FMAs) 150; political-legalenvironment 254
Internet: crowdsourcing 106–9; infiniteshelf space 68; long tail 70; politicalcontributions 74; user innovation 74;value creation 106–9; VOIPtechnology 199, 206–7, 212; see alsonetworks
inventions: block strategy 127–8;dynamics 127–8; imitability 124–7;invention resources 123; run strategy127–8; see also innovation
investment: complementary assets 261;irreversible investments 161; return oninvestment (ROI) 368
iPhone 6, 84, 91–2, 99–100, 210,443
iTunes Music Store (iTMS): AVAC 80–7
knowledge: paradoxical/public/leakynature 262; public knowledge 261
learning: first-mover advantages (FMAs)151; globalization 238
Lipitor: case studies 3, 401–4;first-mover advantages (FMAs) 172–4;new game strategies 5
logic: AVAC 39–40; dominantmanagerial logic 160, 188–9
long tail: aggregators 71; blockbusters68, 72; case studies 73–7; coopetitors71; distribution channels/shelf space69; firm-specific factors 73;implications for managers 77–87;industry factors 71–3; key takeaways87–8; long tail distribution 68, 71, 78;new game ideas/innovations 77–9;new games 67–88; organic foods 75;phenomenon 69–70; producers 72;profitability 71–3; rationale 69–70;suppliers 72; value appropriation 73;value creation 73
low cost: activities 43, 57–8; new gameactivities 110–11; Ryanair 56–8
managers: dominant logic 160, 188–9;entry reasons 305; first-moveradvantages (FMAs) 172; long tail andnew games 77–87; project managers190; top management team 188–9
market value: discount rate 37;profitability 36–8; worked example37–8
markets: direct-to-consumer marketing(DTC) 103; globalization 238;international financial market 304–5;market growth rate 332; marketposition 311; market power 305;marketing uncertainty 159; PMP seeproduct-market position; relativemarket share 332; total availablemarket preemption 146–51, 156
mass collaboration 107–9Microsoft: profitability 21minimum efficient scale (MES) 264, 338moral hazard 263multigames 162multinational corporations (MNCs):
globalization 233–4; strategy 236;types 233–4
Nash equilibrium 279–80natural monopoly 264Netflix 383–90networks: boosting complements 121–3;
definition and role of size 120; earlylead 121; exploiting externalities
478 Subject Index

121–2; nature 121; negative/positiveexternalities 264–5; networkexternalities 119–23, 148–9, 264–5;pricing strategy 121–2; socialnetworks 122–3; structure 120, 182;two-sided networks 120; valuenetwork 102, 146, 210, 348–50
New Belgium 405–10new game activities: costs 316–19;
customers 110–11; game theory 295;industry value drivers 112; low cost110–11; new games 7; pricing 110;revenue sources 110–11; unique value113; value 102–4; valueappropriation 103–4; value creation102–3; see also activities
new game factors: change 48–52, 62–4;game theory 298–9; new gamestrategies 109; value chain 109–14
new game strategies: AVAC 17–19;competitive consequences 18–19;components 17–19; definitions 4–6,28–9; different countries 166–8;disruptive technologies 210–16;handicaps 109; history 168;implementation 178–95, 216; keytakeaways 114–15, 193–5; new gamefactors 109; product strategies 166;profitability 109–14; strengths 109;technology 7; value appropriation91–116; value chain 109; valueestimation 20–1; value systems andoptions 7–9; video consoles 20–1
new games: 4Ps 360–1; business systemand options 8; change element 11–13,84–5; characteristics 10–16, 243–7;classification 23; competition 17–19;disruptive technologies 199–222;entry 316–21; environment 252–74;financial rewards 256; financialsupport 259–61; globalization223–51; government policies 265–8;handicaps 136–9; long tail 67–88;new game activities 7; new valuecaptured 243–4, 298; position-building see position-building newgames; product position 23; regularsee regular new games; resource-building see resource-building newgames; resources/capabilities 13,117–44; revolutionary seerevolutionary new games; role ofresources 123–8; S3PE framework
186–93; strengths 136–9; types 21–7,192–3, 319–21
Nigeria: oil industry 224–8Nintendo Wii: case studies 3, 442–6;
new game strategies 5, 20–1;profitability 21; reverse positioning103
noncooperative games 276–87nonrivalrous goods 261–2
Obama, Barack 74opportunities: environment 15–16, 51,
64, 246–7, 253–6, 299, 319; FiveForces Framework 342; globalization16, 246–7; missed opportunities 105;strategic innovation 199–300; SWOT327
Pareto Principle 67parsimonious activities 42, 44, 60,
113–14, 216, 297, 310, 324–5people: boundary spanners 190;
champions 189; culture 184;gatekeepers 189–90; heterogeneity/self-interest/cognitive limitation 264;innovation 189–90; project managers189–90; S3PE framework 184–6;sponsors 189; top management team189; types 185–6
PEST 328–30PESTN analysis: advantages/
disadvantages 272; economic 271;environment 15, 16, 216–17, 270–4;natural 272; political 270; social 271;technology 272
Pfizer: case studies 3, 401–4; direct-to-consumer marketing (DTC) 102; newgame strategies 5
pharmaceuticals: skimming 111Pixar 393–400placement 359–60players: applications of framework
165–8; business strategy 171;changing players 290–1; competition165; coopetitors 165; exploiters164–5, 171; explorers 163–4, 171;framework 163–8; key players 308;me-too 165, 171; new game productstrategies 166; superstars 164, 171;types 163–8, 171; value added 291–2
Porter’s Diamond: innovation 268–9Porter’s Five Forces see Five Forces
Framework
Subject Index 479
position multinationals 234position-building new games:
competition 26; entry 321; newproducts 26–7; S2P 188
predatory activities 285–6price elasticity of demand 228–9price sensitivity 340–1pricing: 4Ps 359; cooperative 287–8;
new game activities 110; priceleadership 287; pricing limited 283–4;relative price-performance 341;reservation price 95
pricing strategy: networks 121–2; valueappropriation 95
printing 76prisoners’ dilemma 280, 281–2producers: long tail 72product position: competition 23; new
games 24product-market position (PMP):
competition 23; globalization 238–9;revolutionary new games 27;uniqueness 238–9
products: 4Ps 358; customer value 9;differentiation 340; long tail rationale69–70; new game strategies 166; newproducts 24–5, 26–7
profitability: 7Cs framework 38;activities to profits 9–10; assessment35–66; Balanced Scorecard 38;capabilities 128–39; conduciveenvironments 256–61; disruptivetechnologies 210–18; drivers 310;entry 309–12; Five Forces Framework38; gross profit margin 367; historicalearnings 36; long tail 71–3; marketvalue 36–8; new game strategies109–14; potential 129–30; resources128–39; strategy 22, 35–66
promotion 360
regular new games: competition 24–5;entry 320–1; new products 24–5; S2P186–7; types of game 21–5
regulation: globalization 238;government policies 267–8
relationships: commitments 161;coopetitors 95
repeated simultaneous games281–2
research & development (R&D):financier 265–6; first-moverdisadvantages 158–9, 170; free-riding
159; game theory 297; Google 5;options 8–9; public knowledge261
resource multinationals 234resource-based view (RBV): competition
23resource-building new games:
competition 25; entry 320; newproducts 26; S2P 188
resources: activities 44, 60;appropriability 130; change 50, 62,130; competition 129, 130; customervalue 130; disruptive technologies215–16; entry 212, 304, 310; first-mover disadvantages 162; gametheory 297; globalization 239–40,244; intangibles 118, 139–42;invention resources 123; keytakeaways 142–4; new games 13,117–44; organizational 118;preemption 151–3, 156–7;profitability 128–39; role 123–8;tangible 118; value 130
return on investment (ROI) 368revenue sources: game theory 296;
new game activities 110–11; valueappropriation 95
reverse positioning: attributes 103;value creation 12
revolutionary new games: entry 321;product-market position (PMP) 27;S2P 187–8
rivalry: determinants 341; innovation269–70; nonrivalrous goods 261–2
rural areas: discount retailing 74Ryanair: activities 56–60;
appropriability 61–2; AVAC 54–64;case studies 4; change 62–4;coopetitors 57, 61, 63; first-moveradvantages (FMAs) 63; imitability 61;industry value drivers 59–60; low cost56–8; new game strategies 5;opportunities 15; revenue sources 96;value creation 11–12, 60
S2P: firms 190–3; impact 186–93;innovation 188–90; people 188–90;position-building new games 188;previous game components 191–2;regular new games 186–7;resource-building new games 188;revolutionary new games 187–8;types of new game 192–3
480 Subject Index

S3PE framework: advantages 357;disadvantages 357; elements 357,358; environment 185–6; impact186–8; implementation 179–93;new games 186–93; people 184–6;strategy 180; structure 180–2;systems 183
scarcity: complementary assets 169–70;preemption of scarce resources 151–3,156–7; shelf space 69
Sephora 377–82sequential games 282–4shelf space: Internet 68; scarcity 69short head 67signaling: crowdsourcing 108; game
theory 285simultaneous games 278–82size: definition and role 120; effects
147–8skimming: pharmaceuticals 111social networks 122–3Sony: profitability 21sponsors 189stock price 367strategic consequences: AVAC 86;
capabilities 135; complementaryassets 126–7
strategic innovation: dawn xv–xvi; keytakeaways 32–3; questions xvii–xviii;weaknesses 89–195
strategies: globalization 238–42strategy: block strategy 127–8; business
strategy 171; competitionconsequences 18–19; financialmeasures 36–8, 367–9; followers 161;inventions 127–8; multinationalcorporations (MNCs) 236; networks/pricing 121–2; new games see newgame strategies; profitability 22,35–66; run strategy 127–8; strategicfit 159–61
strategy frameworks: advantages 324–5;AVAC see AVAC; BCG’s Growth/ShareMatrix 330–4; business systems343–5; common language/platform324; data collection 325;disadvantages 325; GE/McKinseyMatrix 334–6; marketing-mix357–61; measures 323–69; PEST328–30; Porter’s Five Forces see FiveForces Framework; S3PE see S3PEframework; scorecard see BalancedScorecard; simplicity 324;
summarised 364–7; SWOT see SWOT;value chain analysis 345–8; valueconfigurations 348–50; VIDE 355–7;VRIO framework 353–5
strengths: change 49; disruptivetechnologies 210–13; globalization242–3; new game strategies 109; newgames 136–9; strategic innovation89–195; SWOT 326
structure: M-form 181; coordination180; functional structure 180; matrixstructure 181–2; multidivisionalstructure 181; networks 120, 182;S3PE framework 180–2; virtualstructure 182
substitutes: appropriability 48, 62;threats 341; value appropriation 96
suppliers: bargaining power 340; longtail 72
sustaining technology 206switching costs: customers 149, 153;
first-mover advantages (FMAs) 153;suppliers 340
SWOT: advantages 327; applications325–8; context dependence ofelements 327; disadvantages 328;external factors 325–7; internalfactors 325–6; key elements 325–7;opportunities 327; strengths 326;threats 327; weaknesses 326
systems: book value system 97–8;business system and options 8;first to establish a system ofactivities 154–5, 157; informationsystems 183–4; organizationalsystems 183; processes 183–4;S3PE framework 183; value systemsand options 7–9
technology: change 159–60; disruptivesee disruptive technologies;environment 253–4; first-moveradvantages (FMAs) 156; first-moverdisadvantages 158–9; Foster’s S-curve201–2; new game strategies 7; PESTNanalysis 271; potentially displaceableestablished technology 203; sustainingtechnology 206; today/ancestral 200;uncertainty 159
Threadless 4, 391–2threats: environment 15–16, 51, 64,
246–7, 253–6, 299, 319; Five ForcesFramework 342; strategic innovation
Subject Index 481

199–300; substitutes 341; SWOT327
Toyota: activities 42
uncertainty: buyer choice underuncertainty 154; first-moverdisadvantages 158–9; marketing 159;technology 159; value appropriation263; value creation 263
unique value: disruptive technologies215–16; new game activities 113
United Kingdom: oil industry 249–51United States: political contributions
74
value: activities, value, appropriabilityand change see AVAC; components 40,82–3; concepts 92–102;configurations 348–50; customer seecustomer value; drivers see industryvalue drivers; economic value added(EVA) 368–9; estimation 20–1; keytakeaways 65; networks 102, 146,210, 348–50; new game activities102–4; new value captured 243–4,298, 317–18; options 7–9;resources 130; unique see uniquevalue; value added 100, 289, 291–2;value captured 93, 100; value net 290,291; value systems 7–9, 347; VIDE355
value appropriation: appropriatorsclassified 231–2; book value system97–8; competition 6; complementaryassets 94; complexity 263; concept94–6; coopetitors 95; definition 6;disruptive technologies 206–8;environment 256–61; examples97–100; export subsidies 230; gametheory 293–9; generation 11–13;globalization 224–30; imitability 96;import duties/taxation 228–9;international element 101–2; iPhone99–100; locus shifts 104; long tail 73;new game activities 103–4; new gamestrategies 91–116; oil industry 224–8,249–51; pricing strategy 95; revenue
sources 95; substitutability 96;uncertainty 263; valuable customers96
value chain: activities 92, 345; analysis345–8; bears 232; beavers/ants 232;bees 231–2; data organization 347;disruptive technologies 213–16; firm-specific effects 347; foxes 232; gametheory 295–9; generic value chainanalysis 348; government insertion228–30; members 231–2; new gamefactors 109–14; new game strategies109; primary activities 345–6; supportactivities 346–7; value systems 347
value creation: benefits 92; betterpositioning 10; change 50, 62;complexity 263; concept 92–4;cooperation 6; coopetitors 97–100;creators classified 231–2; definitions6; disruptive technologies 206–8;entry 317–18; environment 256–61;game theory 293–9; generation11–13; international element 101–2;Internet 106–9; locus shifts 104; longtail 73; marginal contribution 289;new game activities 102–3; Ryanair11–12, 60; uncertainty 263; valuecaptured 93
value shop 348–50venture capital 257–8, 260–1VIDE 355–7video tape recorders 76–7VRIO framework 353–5
Wal-Mart: coopetitors 43; discountretailing 74; first-mover advantages(FMAs) 13; new game strategies 16;rural areas 74
weaknesses: strategic innovation89–195; SWOT 326; see alsohandicaps
Whole Foods Markets 75, 77Wii see Nintendo WiiWikinomics 107–9written word 76
Xbox 434–41
482 Subject Index