Southam Locality Profile 2011
6
Southam & Feldon District: Stratford-on-Avon District No. % No. % No. % No. % Total Population (Mid-2009)¹ 17,484 - 535,100 - Total Resident Households 6,790 - 210,898 - Male/Female Split¹ 49/51 - 49/51 - Average Household Size 2.49 - 2.37 - Total 0-15 year olds¹ 3,503 20.0% 97,800 18.3% Socially Rented Housing 823 12.1% 30,196 14.3% 10,082 57.7% 323,900 60.5% Terraced Housing 1,154 17.0% 51,458 23.6% 3,899 22.3% 113,400 21.2% Households with no car/van 874 12.8% 40,130 19.0% Non-White British Population² 638 3.7% 36,553 7.2% 0/100 - 68/32 - * 16-64 Males, 16-59 Females Low Income Households 6 No. % No. % No. % No. % 156 1.5% 8,822 2.6% 2,230 - 64,715 - 845 8.4% 38,610 11.3% 1,490 66.8% 48,005 74.2% - ESA & Incapacity Benefit 4 355 3.5% 16,360 4.8% 405 - 15,150 - - Lone Parent Benefit 4 105 1.0% 4,170 1.2% 175 - 8,075 - Pension Credit claimants 4 565 14.5% 21,130 18.6% - Number of children affected 340 - 15,135 - Fuel Poverty (2003) 5 470 6.9% 10,429 4.9% 320 7.5% 14,760 11.9% Education & Skills No. % No. % No. % No. % Managers & Senior Officials 1,742 19.2% 41,567 16.7% 130 64.4% 3,228 56.9% Professional Occupations 1,145 12.6% 29,669 11.9% 453 17.9% 14,269 20.8% 1,132 12.5% 31,451 12.6% 4,959 0.2% 146,580 0.2% Administrative & Secretarial 1,152 12.7% 31,672 12.7% 182 7.2% 7,508 10.9% Skilled Trades Occupations 1,263 13.9% 29,962 12.0% 19 3.0% 921 4.5% 601 6.6% 15,809 6.3% 3,110 25.1% 102,529 27.8% 489 5.4% 16,409 6.6% 6,216 50.3% 176,502 47.8% 682 7.5% 22,056 8.8% 2,921 23.6% 76,412 20.7% Elementary Occupations 878 9.7% 31,035 12.4% 186 9.3% 6,788 11.5% Total Working Age* Population¹ Total 65+ Males, 60+ Females*¹ Personal Services Occupations Urban/Rural Population Split³ Economy & Employment Locality Warwickshire Associate Professional & Technical All working age benefit claimants (May 2010) 4 Job Seekers Allowance claimants (Oct 2010) 4 Total families claiming child benefit (Aug 2008) Youth Service Membership (Nov 2010) 9 Occupation 2 Locality Warwickshire Total children in 'poverty' (2008) Lone Parent families claiming CTC (Aug 2008) Out of work families claiming CTC (Aug 2008) 16-18 year olds NEET (Nov 2010) 8 Total families claiming child tax credit (Aug 2008) Unauthorised Absence Sessions (2010) 7 Warwickshire Locality Households 2 Locality Warwickshire Locality Warwickshire Population Sales & Customer Service Process, Plant & Machine Operatives Pupils receiving Free School Meals (2010) 7 16-74 year olds with no qualifications 2 Level 2 or higher qualifications 2 Level 4 or higher qualifications 2 Locality Profile January 2011 Locality Name: Pupils achieving 5+ GCSE A*- C inc E&M (2010) 7 Pupils with Special Educational Need (2010) 7 The Southam and Feldon locality comprises the wards of Harbury, Long Itchington, Southam, Stockton and Napton and part of Fenny Compton. It includes the County Council Electoral Divisions of Feldon and Southam. The area is essentially rural in nature with a mix of small towns, villages, hamlets and farms. It borders the outskirts of Whitnash and Leamington Spa to the west and Daventry in Northamptonshire to the east. Warwickshire Locality
-
Upload
steve-gillis -
Category
Documents
-
view
213 -
download
1
description
Southam & Feldon Locality Profile 2011
Transcript of Southam Locality Profile 2011
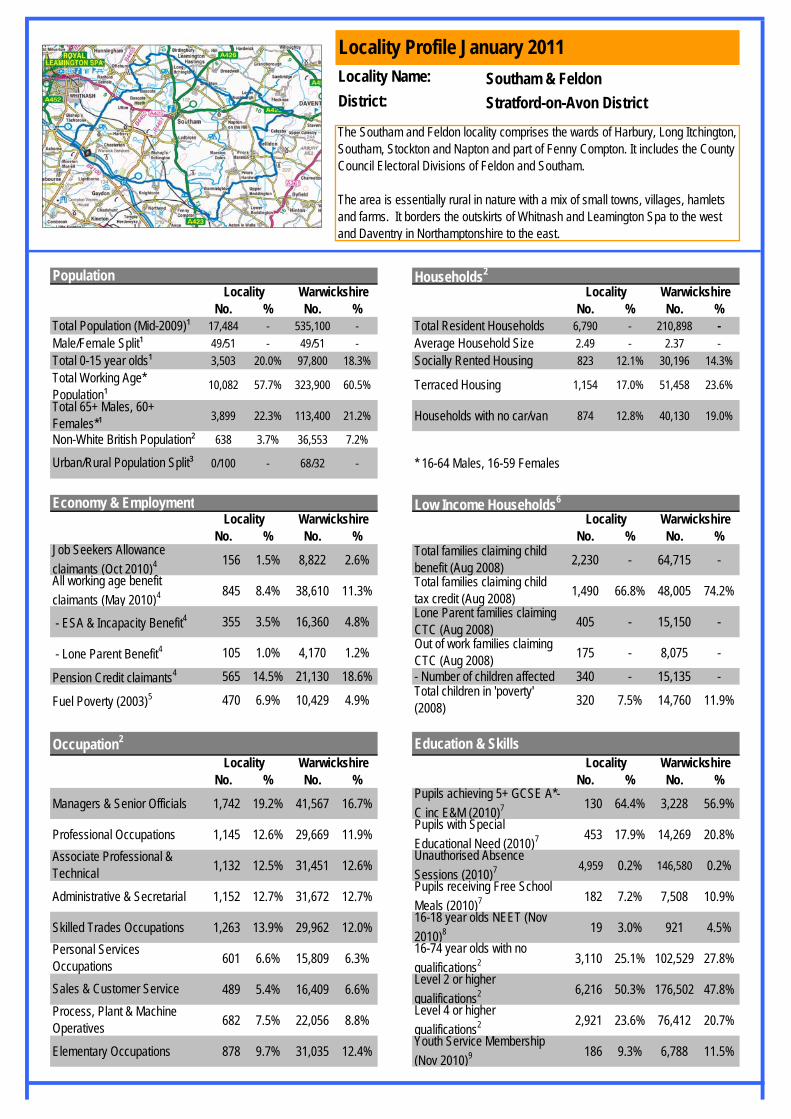
Southam & FeldonDistrict: Stratford-on-Avon District
No. % No. % No. % No. %Total Population (Mid-2009)¹ 17,484 - 535,100 - Total Resident Households 6,790 - 210,898 -Male/Female Split¹ 49/51 - 49/51 - Average Household Size 2.49 - 2.37 -Total 0-15 year olds¹ 3,503 20.0% 97,800 18.3% Socially Rented Housing 823 12.1% 30,196 14.3%
10,082 57.7% 323,900 60.5% Terraced Housing 1,154 17.0% 51,458 23.6%
3,899 22.3% 113,400 21.2% Households with no car/van 874 12.8% 40,130 19.0%
Non-White British Population² 638 3.7% 36,553 7.2%
0/100 - 68/32 - * 16-64 Males, 16-59 Females
Low Income Households6
No. % No. % No. % No. %
156 1.5% 8,822 2.6% 2,230 - 64,715 -
845 8.4% 38,610 11.3% 1,490 66.8% 48,005 74.2%
- ESA & Incapacity Benefit4 355 3.5% 16,360 4.8% 405 - 15,150 -
- Lone Parent Benefit4 105 1.0% 4,170 1.2% 175 - 8,075 -
Pension Credit claimants4 565 14.5% 21,130 18.6% - Number of children affected 340 - 15,135 -
Fuel Poverty (2003)5 470 6.9% 10,429 4.9% 320 7.5% 14,760 11.9%
Education & Skills
No. % No. % No. % No. %
Managers & Senior Officials 1,742 19.2% 41,567 16.7% 130 64.4% 3,228 56.9%
Professional Occupations 1,145 12.6% 29,669 11.9% 453 17.9% 14,269 20.8%
1,132 12.5% 31,451 12.6% 4,959 0.2% 146,580 0.2%
Administrative & Secretarial 1,152 12.7% 31,672 12.7% 182 7.2% 7,508 10.9%
Skilled Trades Occupations 1,263 13.9% 29,962 12.0% 19 3.0% 921 4.5%
601 6.6% 15,809 6.3% 3,110 25.1% 102,529 27.8%
489 5.4% 16,409 6.6% 6,216 50.3% 176,502 47.8%
682 7.5% 22,056 8.8% 2,921 23.6% 76,412 20.7%
Elementary Occupations 878 9.7% 31,035 12.4% 186 9.3% 6,788 11.5%
Total Working Age* Population¹Total 65+ Males, 60+ Females*¹
Personal Services Occupations
Urban/Rural Population Split³
Economy & EmploymentLocality Warwickshire
Associate Professional & Technical
All working age benefit claimants (May 2010)4
Job Seekers Allowance claimants (Oct 2010)4
Total families claiming child benefit (Aug 2008)
Youth Service Membership (Nov 2010)9
Occupation2
Locality Warwickshire
Total children in 'poverty' (2008)
Lone Parent families claiming CTC (Aug 2008)Out of work families claiming CTC (Aug 2008)
16-18 year olds NEET (Nov 2010)8
Total families claiming child tax credit (Aug 2008)
Unauthorised Absence Sessions (2010)7
WarwickshireLocality
Households2
Locality Warwickshire Locality WarwickshirePopulation
Sales & Customer ServiceProcess, Plant & Machine Operatives
Pupils receiving Free School Meals (2010)7
16-74 year olds with no qualifications2
Level 2 or higher qualifications2
Level 4 or higher qualifications2
Locality Profile January 2011Locality Name:
Pupils achieving 5+ GCSE A*-C inc E&M (2010)7
Pupils with Special Educational Need (2010)7
The Southam and Feldon locality comprises the wards of Harbury, Long Itchington, Southam, Stockton and Napton and part of Fenny Compton. It includes the County Council Electoral Divisions of Feldon and Southam.
The area is essentially rural in nature with a mix of small towns, villages, hamlets and farms. It borders the outskirts of Whitnash and Leamington Spa to the west and Daventry in Northamptonshire to the east.
WarwickshireLocality

No. Rate* No. Rate*
763 43.6 33,847 63.3
Domestic Burglary (2009/10) 37 5.1 1,908 8.0Vehicle Crime (2009/10) 81 4.6 3,916 7.3
89 5.1 5,241 9.8169 9.7 5,977 11.2
Health
No. % No. % No. % No. %Total Road Injuries (2009) 52 - 1,566 - Limiting Long Term Illness2 2,276 13.3% 84,795 16.8%
- 3.0 - 2.9 Not in Good Health2 1,117 6.5% 41,117 8.1%Disability Living Allowance4 530 3.0% 23,120 4.3%
Socio-demographic classification*13 Socio-demographic classification*% Index % Index
11.3% 239 0.3% 7
19.2% 169 5.0% 63
2.7% 60 2.2% 34
23.6% 155 1.9% 39
11.2% 96 3.2% 62
15.9% 178 0.1% 5
0.2% 4 0.7% 26
2.5% 41
Anti-Social Behaviour Incidents (2009/10) 609 34.8
LocalityRoad Safety12
* All crime rates are calculated on a per 1,000 population basis except domestic burglary which is caluclated on a per 1,000 household basis.
826I Lower income workers in urban terraces in often diverse areas
25,640 47.9
Warwickshire
Households
1,731
1,406
180
367
164
14
Mosaic is a classification that groups citizens in terms of their socio-demographics, lifestyles, culture and behaviour to provide a comprehensive view of citizens and their needs. Mosaic can also provide an indication of the degree of diversity across the locality.
K Residents with sufficient incomes in right-to-buy social houses
199
Road Injury Rate (per 1,000 population)
F Couples with young children in comfortable modern housingG Young, well-educated city dwellers
D Successful professionals living in suburban or semi-rural homes
A Residents of isolated rural communitiesB Residents of small and mid-sized towns with strong local rootsC Wealthy people in the most sought after neighbourhoods
819E Middle income families living in moderate suburban semis
49
Community Safety10 Residents' Perceptions11
Violent Crime (2009/10)Criminal Damage (2009/10)
% %Locality WarwickshireLocality
Total Recorded Crime (2009/10)
Warwickshire
22
L Active elderly people living in pleasant retirement locations
J Owner occupiers in older-style housing in ex-industrial areas
142
26.0%% of people who volunteer at least once a month (2008) 33.5%
90.1%% of residents satisfied with their neighbourhood as a place to live (2008)
Locality
Activities for TeenagersRoad and Pavement Repairs
Warwickshire
82.9%
Households
Top three issues that residents feel need improving in their local area (2008) Affordable Decent Housing
* Mosaic Group representation in this locality compared to Warwickshire as a whole. An index of 100 would equate to equal proportions in-line with the County.
232
6
H Couples and young singles in small modern starter homes
M Elderly people reliant on state support
N Young people renting flats in high density social housingO Families in low-rise social housing with high levels of benefit need
1,164

Income
Health & Disability
Education Skills & Training
Barriers to Housing and
Services
Crime &
Disorder
Living Environm
ent
13,750 18,925 9,454 14,939 27,583 25,422
19,673 23,949 20,732 5,696 18,402 22,181
27,013 28,802 29,924 232 29,854 16,756
22,368 26,006 26,743 5,206 18,683 11,252
18,370 25,951 19,768 19,807 30,088 12,484
25,063 29,729 28,429 4,349 28,899 25,497
22,738 26,921 25,472 21,427 29,756 24,031
27,389 28,139 19,360 19,607 26,446 21,608
21,503 28,347 22,413 27,274 29,284 31,123
21,647 27,716 27,729 23,699 31,422 30,279
25,928 26,361 21,978 27,638 29,214 28,891
27,931 30,250 31,302 32,280 31,008 29,559
Key:Ranked within top 10% most deprived areas nationallyRanked within top 10-20% most deprived areas nationallyRanked within top 20-30% most deprived areas nationally
Harbury 32,172 27,803
More information can be found on the Department for Communities & Local Government website: http://www.communities.gov.uk/publications/communities/indicesdeprivation07
Deprivation14
Bishops Itchington
17,536
20,474
Employm
ent
Index of Multiple Deprivation 2007 Super-Output Area* Ranks
Index of Multiple
DeprivationSuper Output Area (SOA)*
21,373
22,671
24,756
27,483
28,946
29,069
29,361
30,302
26,668
31,026
26,470
29,313
16,480
20,409
29,381
29,052
Long Itchington East
Long Itchington West & Ufton
Southam South & Town Centre
Stockton
Southam West
Deppers Bridge, Chester & Kings
Ladbroke & Priors
Napton on the Hill
Southam North
28,449
28,65530,469
25,644
The Index of Multiple Deprivation 2007 (IMD 2007) is a Lower layer Super Output Area (LSOA) measure of multiple deprivation. The IMD is made up of seven LSOA level domain indices, each of which measures a different aspect of deprivation (income, employment, health, education & skills, barriers to housing & services, crime and living environment.) There are also two supplementary indices (Income Deprivation Affecting Children and Income Deprivation Affecting Older People).
There are 32,482 SOAs in England and 333 SOAs in Warwickshire. Each SOA is ranked according to its relative level of deprivation based upon a score generated from a number of different indicators. Low ranks denote greater levels of relative deprivation. A ranking of 1 represents the most deprived SOA nationally and a ranking of 32,482 represents the least deprived SOA nationally. The areas are ranked either within the top 10,20 or 30% most deprived nationally.
Southam East
*Super Output Areas (SOAs) are a geographic hierarchy designed by the Office for National Statistics to improve the reporting of small area statistics in England and Wales. SOAs have a minimum population of 1,000 and a mean population of 1,500.


Summary & Key Issues:
Southam is an old market town, once an important stop on the coaching road from Coventry to Oxford. With its good road links, Southam and its surrounding villages provide a favourable location for commuters to Coventry and the town makes a convenient base for the businesses at a small industrial estate which is a significant source of employment for Southam’s residents. Local landmarks include the Holy Well and the Old Mint.
Public services in this area include a library, police station, fire station and a leisure centre at Southam. There is also a library at Harbury. There are a number of primary schools within the locality area and one secondary school; Southam College.
The A423 provides good access to Coventry to the north and Banbury to the south. Although there is a railway line from Leamington to Banbury and London which runs through the area, there are no stations along this line. However, there are regular buses linking Southam to Leamington Spa and Rugby. The proposed route of HS2 which would link Birmingham and London passes through the centre of the locality, close to Southam and the village of Ladbroke.
Community groups and volunteer groups in Southam include a Rotary Club, an Inner Wheel Club, Southam First Responders, whorespond to emergency calls in the area, a Carers’ Group, a club for the Blind & Partially Sighted and a Childrens Centre, as well as arange of sports and social groups.
The Southam and Feldon locality has the sixth highest proportion of under 16 year olds of all the localities in Warwickshire. In turn, there islower than average proportion of working age residents. The percentage of the population which is non-white British is low at just over halfthe County average. This is fairly typical for an essentially rural location. This locality is generally regarded as affluent. Its proportion of working age people employed in managerial and professional occupations isabove average. The percentage of older people claiming Pension Credit and the percentage of the working age population claiming benefitsare both well below the County average. In this locality 24% of adults are educated to degree level or equivalent compared to 21% in the County as a whole. The percentage withno qualifications is among the lowest in the County. The proportion of pupils currently achieving five or more A*-C grades at GCSE(including English and Maths) is just above the County average. The percentage of pupils completing Year 11 without a place in Education,Employment or Training (NEET) is below the County average. As with many rural areas in the county there is little recorded deprivation in the locality with the exception of the barriers to housing andservices domain. Four Super Output Areas appear in the top 20% of this rank, with one being in the top 10%. Southam and Feldon locality has a low recorded crime rate compared to the County, a rate of 43.6 crimes per 1,000 of the population,compared to a County average of 63.3. Road traffic accidents are very close to the County average. For residents in this locality, the number one issue most in need of improvement is activities for teenagers, with road and pavement repairsbeing the second priority. Overall though, the residents in this locality are the sixth most satisfied with their area as a place to live of allthe localities in Warwickshire.

Notes:
List of data sources:
1 Mid-2009 Super Output Area Population Estimates, Office for National Statistics2 2001 Census3 2004 Rural Urban Classification, Office for National Statistics4 Department for Work and Pensions5 Centre for Sustainable Energy6 Small area data, HMRC 7 Commissoning Support Service (CSS), Children, Young People and Families Directorate8 Connexions9 Youth Service, Warwickshire County Council10 Warwickshire Police11 Place Survey 200812 Road Safety Intelligence Team, Warwickshire County Council13 Mosaic Public Sector Classification, Experian14 English Indices of Deprivation 2007, Department for Communities and Local Government
Publication date: January 2011Contact: Warwickshire ObservatoryTelephone: 01926 418066Email: [email protected]
Disclaimer
Super Output Area (SOA) data is available for the majority of the datsets and can be made available on request from the Observatory.
The education data used here only takes account of those children that live in Warwickshire and attend Warwickshire County Council maintained schools. It does not include those living outside the County who travel in to attend our schools. Furthermore, the full dataset only represents those children attending Local Authority maintained schools and not the full child population in Warwickshire as we do not collect data from Independent (private) schools or individual pupil data from private residential special/hospital schools or of children that are home educated.
The locality profiles refer to the 2008 Place Survey, however in 2009/10, a Partnership Place Survey was carried out although data is not broken down to locality level. The report for the 2009/10 Partnership Place survey is available from: http://www.warwickshireobservatory.org/observatory/observatorywcc.nsf/RefDocs/KMGY-89SL46?OpenDocument
The Blueprint project considers the impacts of social, economic, and demographic changes taking place in the County over the long term. It takes the form of a series of visual map-based presentations to show analysis for a range of existing datasets. A further set of slides then detail some of the key future issues and challenges based on projected and forecasted data analysis. These help to highlight possible future implications for the County’s infrastructure and also how collectively our services are delivered across the public sector.
Analysis has been carried out at both District/Borough and Locality level. A composite Countywide picture has also been developed to show inter-relationships between the variables and the geographic spread of potential future issues. The link to the Blueprint is below: http://www.warwickshireobservatory.org/observatory/observatorywcc.nsf/RefDocs/KMGY-825JMS?OpenDocument
This profile has been prepared by the Warwickshire Observatory, Warwickshire County Council, with all reasonable skill, care, and diligence. We accept no responsibility of any nature to any third parties to whom this profile, or any part thereof, is made known. Any such party relies on the report at their own risk.
Lower-layer Super-Output Areas (LSOAs) have been used as the primary geographical building block to aggregate data to locality level. LSOAs are the smallest geography for which we have reliable data but in a small number of cases, the boundaries of the localities split an individual LSOA. Where this occurred, data has been apportioned based upon the location of residential households using a combination of Mosaic, 2001 Census and mid-year population estimate data.