Greenhouse Gas Inventory and Tracking in Portfolio Manager
15
August 2017 Greenhouse Gas Emissions 1 Technical Reference Greenhouse Gas Emissions OVERVIEW The energy used in commercial buildings accounts for nearly 17 percent of the United States’ emissions of greenhouse gases (GHGs) linked to global climate change, making buildings an important part of your GHG inventory. In order to help you assess the emissions footprint associated with your energy consumption, Portfolio Manager incorporates a number of metrics to quantify these emissions. • • Total Emissions. Total Emissions is the primary metric, quantifying the majority of GHGs associated with commercial buildings. It can be broken down into component metrics, also available in Portfolio Manager: • • Direct Emissions. Emissions from fuel that is directly burned at your building, for example natural gas that may be combusted to heat your property. Indirect Emissions. Emissions associated with energy purchased from a utility, for example emissions associated with the generation of electricity or district steam. Biomass Emissions. Biomass emissions are an additional element in your inventory. These are emissions from biogenic fuels that are burned onsite, such as wood. Though combustion occurs on site, the emissions from burning biomass are accounted for separately from direct fossil fuel emissions because they may or may not reduce carbon emissions, depending on the type and source of the biomass resources. Emissions are calculated by multiplying your site energy values by emissions factors. These factors incorporate the emissions of carbon dioxide, methane, and nitrous oxide, to provide a single carbon dioxide equivalent number. Portfolio Manager uses custom factors for the U.S. and Canada, which are further regionalized to account for differences within each country. For properties in other countries, the U.S. factors are applied. Green power (electricity generated from environmentally preferable renewable resources, such as solar, wind, geothermal, low-impact biomass, and low-impact hydro resources) can have an important effect on your emissions inventory. Green power may be obtained from either onsite sources or offsite sources. We include a variety of metrics to help you understand the emissions benefit. • • Offsite Green Power. When you purchase offsite green power, you are making a purchase of electricity from the grid bundled with environmental benefits defined by Renewable Energy Certificates (RECs). We show the emissions associated with a conventional grid purchase, the avoided emissions quantified in the REC, and the resulting net emissions benefit associated with the green power. Onsite Green Power. When you have an onsite renewable system, the implications for emissions depend on whether or not you own the RECs. If you do, then onsite green power is counted as zero emissions in your GHG inventory, and you can also track the total avoided emissions associated with the system. If you do not own the RECs, you cannot claim an environmental benefit. This technical reference is divided into the following sections: THE VALUE OF A GHG INVENTORY ................................................................................. 2 CALCULATING DIRECT EMISSIONS ................................................................................. 3 CALCULATING INDIRECT EMISSIONS ............................................................................. 4 CALCULATING BIOMASS EMISSIONS .............................................................................. 5 UNDERSTANDING AVOIDED EMISSIONS FROM GREEN POWER ................................ 5 REFERENCE GHG EMISSIONS FACTORS ....................................................................... 6
Transcript of Greenhouse Gas Inventory and Tracking in Portfolio Manager

August 2017 Greenhouse Gas Emissions 1
Technical Reference
Greenhouse Gas Emissions
OVERVIEW
The energy used in commercial buildings accounts for nearly 17 percent of the United States’ emissions of greenhouse gases (GHGs) linked to global climate change, making buildings an important part of your GHG inventory. In order to help you assess the emissions footprint associated with your energy consumption, Portfolio Manager incorporates a number of metrics to quantify these emissions.
•
•
Total Emissions. Total Emissions is the primary metric, quantifying the majority of GHGs associated with commercial buildings. It can be broken down into component metrics, also available in Portfolio Manager:
•
•
Direct Emissions. Emissions from fuel that is directly burned at your building, for example natural gas that may be combusted to heat your property.
Indirect Emissions. Emissions associated with energy purchased from a utility, for example emissions associated with the generation of electricity or district steam.
Biomass Emissions. Biomass emissions are an additional element in your inventory. These are emissions from biogenic fuels that are burned onsite, such as wood. Though combustion occurs on site, the emissions from burning biomass are accounted for separately from direct fossil fuel emissions because they may or may not reduce carbon emissions, depending on the type and source of the biomass resources.
Emissions are calculated by multiplying your site energy values by emissions factors. These factors incorporate the emissions of carbon dioxide, methane, and nitrous oxide, to provide a single carbon dioxide equivalent number. Portfolio Manager uses custom factors for the U.S. and Canada, which are further regionalized to account for differences within each country. For properties in other countries, the U.S. factors are applied.
Green power (electricity generated from environmentally preferable renewable resources, such as solar, wind, geothermal, low-impact biomass, and low-impact hydro resources) can have an important effect on your emissions inventory. Green power may be obtained from either onsite sources or offsite sources. We include a variety of metrics to help you understand the emissions benefit.
•
•
Offsite Green Power. When you purchase offsite green power, you are making a purchase of electricity from the grid bundled with environmental benefits defined by Renewable Energy Certificates (RECs). We show the emissions associated with a conventional grid purchase, the avoided emissions quantified in the REC, and the resulting net emissions benefit associated with the green power.
Onsite Green Power. When you have an onsite renewable system, the implications for emissions
depend on whether or not you own the RECs. If you do, then onsite green power is counted as zero emissions in your GHG inventory, and you can also track the total avoided emissions associated with the system. If you do not own the RECs, you cannot claim an environmental benefit.
This technical reference is divided into the following sections:
THE VALUE OF A GHG INVENTORY ................................................................................. 2 CALCULATING DIRECT EMISSIONS ................................................................................. 3 CALCULATING INDIRECT EMISSIONS ............................................................................. 4 CALCULATING BIOMASS EMISSIONS .............................................................................. 5 UNDERSTANDING AVOIDED EMISSIONS FROM GREEN POWER ................................ 5 REFERENCE GHG EMISSIONS FACTORS ....................................................................... 6

August 2017 Greenhouse Gas Emissions 2
Technical Reference
THE VALUE OF A GHG INVENTORY
Carbon dioxide (CO2), methane (CH4), and nitrous oxide (N2O) are the principal greenhouse gases emitted to the atmosphere from the burning of fossil and biomass fuels used in commercial buildings. The energy used in commercial buildings accounts for nearly 17% of the United States’ emissions of greenhouse gases (GHGs).1 Furthermore, in North America, commercial building sector GHG emissions are growing at a faster rate than those from homes, transportation, and industry.2 This makes commercial buildings an important target for organizations interested in pursuing energy and GHG management and reduction programs. Tracking and managing your GHG footprint can help improve your bottom line, while also helping to fight global climate change.
Portfolio Manager can help you inventory, track, and communicate the GHG emissions associated with the energy used by buildings in your portfolio. This includes a variety of metrics and graphs to demonstrate GHG emissions performance. An effective GHG reduction strategy may incorporate not only energy efficiency in your buildings, but also the purchase of green power to ensure that the energy you use comes from sources with a reduced GHG footprint. Therefore, Portfolio Manager includes several metrics to help you understand the environmental benefits of both onsite and offsite green power.
The methodology for calculating GHG emissions in Portfolio Manager is based on the Greenhouse Gas Protocol Corporate Accounting and Reporting Standard developed by the World Resources Institute (WRI) and World Business Council for Sustainable Development.3 This protocol was developed as the accounting framework to provide a relevant, complete, consistent and transparent account of an organization’s GHG emissions. As the global standard, it serves as the basis for the accounting, inventory and reporting guidance provided by the Environmental Protection Agency’s (EPA) Corporate Climate Leadership Center, as well as state and non-governmental organization registry, reporting, and recognition programs. The specific calculation details depend on the type of emissions, as detailed in the following sections.
Please note that Portfolio Manager does not account for energy consumed for onsite vehicle use, industrial or manufacturing processes, or fugitive refrigerant emissions resulting from a building’s use of refrigeration or air conditioning equipment. These are important contributors to an organization’s GHG footprint, but outside of the scope of Portfolio Manager.
WRI Protocol Updates and Scope 2 Emissions
In January 2015 the World Resources Institute amended their Green House Gas Protocol Corporate Accounting and Reporting Standard to update requirements and best practices for accounting and reporting of indirect (or scope 2) emissions.4 Among these changes, the amendments now require indirect emissions to be calculated and reported in two ways; both a location-based method relying on grid-average emissions factors, and a market-based method using energy supplier-specific emissions factors. The accounting and reporting of green power purchases on scope 2 emissions has also been changed. For the majority of properties, the current approach in Portfolio Manager is
1 U.S. Environmental Protection Agency, Inventory of U.S. Greenhouse Gas Emissions and Sinks 1990-2015. Table 2-12: U.S. Greenhouse Gas Emissions by Economic Sector and Gas with Electricity-Related Emissions Distributed (MMT CO2 Eq.) and Percent of Total in 2015. Published April 15, 2017. https://www.epa.gov/sites/production/files/2017-02/documents/2017_complete_report.pdf. 2 IPCC Fourth Assessment Report: Climate Change 2007, 6.2 Trends in Building Sector Emissions. Contribution of Working Group III to the Fourth Assessment Report of the Intergovernmental Panel on Climate Change, 2007 B. Metz, O.R. Davidson, P.R. Bosch, R. Dave, L.A. Meyer (eds) Cambridge University Press, Cambridge, United Kingdom and New York, NY, USA. 3 World Resources Institute and the World Business Council for Sustainable Development, The Greenhouse Gas Protocol; A Corporate Accounting and Reporting Standard. Revised Edition. http://www.ghgprotocol.org/. 4 World Resources Institute and the World Business Council for Sustainable Development, The Greenhouse Gas Protocol; GHG Protocol Scope 2 Guidance, an amendment to the GHG Protocol Corporate Standard. http://ghgprotocol.org/scope_2_guidance.

August 2017 Greenhouse Gas Emissions 3
Technical Referenceconsistent with the new location-based method. EPA will be assessing possible changes to facilitate the market-based method in the future.
Tracking Emissions Over Time
Calculating building energy use and environmental performance in Portfolio Manager is accomplished by applying one set of thermal and emissions fuel factors to a building’s historical energy consumption. These factors (detailed in the last subsequent sections) are updated annually using the most current available datasets. By applying updated factors to all previous energy consumption periods, Portfolio Manager recalculates your previous years’ emissions, effectively re-baselining emissions for your buildings. In general, corporate GHG reporting protocols encourage recalculating an emissions baseline to provide a greater degree of environmental integrity by improving accuracy in subsequent emissions calculations to reflect changing circumstances. These circumstances include acquisitions, mergers, insourcing, outsourcing, changes in calculation methodology, or improvements to factors and activity data. In practice, the magnitude of the annual changes to these updated factors alone, however, may not meet the significance threshold obligating an organization to recalculate historical emissions. This approach provides Portfolio Manager users the ability to both print out reports annually to document their historical emissions metrics, and simply allow Portfolio Manager to re-baseline the emissions footprint of their buildings with each annual factor update to better track and report their emissions reductions over time.
CALCULATING DIRECT EMISSIONS
To calculate direct GHG emissions, Portfolio Manager uses what is called a default fuel analysis approach. This approach requires that you know only the type and quantity of fuel. It eliminates the need for you to obtain fuel specific characteristics from your energy suppliers, as it assumes fuel-specific factors for heating value, carbon content, carbon to CO2 ratio (12:44), and carbon oxidation factor (100%) for each fuel. Note that this methodology accounts for the emissions that occur at your building only – emissions that may have occurred during extracting, processing, or delivering these fuels is the responsibility of the fuel supplier and does not fall within your inventory.
While a default fuel analysis approach provides a straightforward estimation of direct CO2 emissions, estimating direct emissions of CH4, and N2O is much more complicated. Unlike CO2 emissions, CH4, and N2O emissions depend not only upon fuel characteristics, but also on combustion technology (size, vintage, maintenance, and operation), combustion characteristics, usage of pollution control equipment, and ambient environmental conditions. Fortunately, as these direct emissions comprise a small percentage of the total GHG footprint of a building (<1%), fuel-specific, commercial sector factors for combustion technology, characteristics and controls are considered adequate to estimate CH4, and N2O emissions associated with on-site fuel consumption.
To calculate direct GHG emissions:
1. All billed or metered site energy consumption for each fuel is converted from native units to MBtu. Fuels thatare delivered, billed, or measured in mass or volume units (i.e., cubic feet, tons, gallons) are converted toenergy using standard heat content factors.
2. Total site energy for each fuel is multiplied by a single CO2-equivalent factor that incorporates the referenceglobal warming potential of each gas (CO2=1, CH4=25, and N2O= 298).5
a. In the US, these factors are computed at the national level (each fuel has one factor).b. In Canada, factors for fuel oil are applied at the national level, but factors for natural gas vary by
province. Specific factors for each country are presented in the last section of this document.
5 The 100 year global warming potential (GWP) of each greenhouse gas (CO2=1, CH4=25, and N2O= 298) compares the radiative forcing ability of each gas relative to CO2, which serves as the reference gas. 100-year GWPs from IPCC Fourth Assessment Report (AR4), 2007. www.ipcc.ch/ipccreports/assessments-reports.htm. More information on the use of AR4 is available at http://www.epa.gov/climateleadership/documents/emission-factors.pdf.

August 2017 Greenhouse Gas Emissions 4
Technical Reference3. Direct emissions are summed together across all fuels (e.g., oil, gas, etc.) and reported as a Direct
Emissions Metric in Portfolio Manager.4. Direct emissions are also added to the Total GHG Emissions.
CALCULATING INDIRECT EMISSIONS
Indirect emissions result from the purchase of a utility-supplied energy product such as electricity or district heat. When these secondary forms of energy are purchased, emissions occur at the plant where the heat/electricity was originally produced. These factors are applied to your site energy consumption and take into account emissions associated with the heat (or power) generation. However, the emissions associated with energy losses from the delivery of that energy (e.g. along transmission and distribution lines) is attributed to the utility, not to your building. The main sources of indirect emissions are electricity, district steam, district hot water, and district chilled water.
District Heating and Cooling
Portfolio Manager applies default emission factor values to determine the indirect emissions from district heating and cooling energy purchased from an offsite supplier. This approach is selected for simplicity; it requires that you know only the type and quantity of district fuel used in your buildings. Use of default emissions factors does not require you to obtain boiler efficiency, fuel mix, or fuel emissions factor values from your steam or hot water district energy supplier. This approach does, however, require you to obtain the general production method of the district chilled water from your energy supplier.
To calculate indirect GHG emissions from district heating and cooling:
1. All billed or metered site energy consumption for each fuel is converted from native units to MBtu. Fuels thatare delivered, billed, or measured in mass or volume units (i.e., pounds of steam) are converted to energyusing standard heat content factors.6
2. Total site energy for each fuel is multiplied by a CO2-equivalent factor that incorporates the contribution ofCO2, CH4, and N2O.
a. In the U.S., a single national factor is applied for wood.b. Canada uses a similar national approach, but the factors are different from the U.S. factors.
3. Indirect emissions from district energy consumption are added to electric indirect emissions to compute yourIndirect Emissions metrics in Portfolio Manager.
4. Indirect emissions are also added to the Total GHG Emissions.
Electricity
Portfolio Manager applies regional GHG factors to compute the GHGs associated with electric consumption. Unlike the default fuel approach for direct emissions and indirect emissions from district systems, the approach for electricity is based on measured power plant data from utility owners and operators. For the U.S., these regional factors are determined using EPA’s Emissions & Generation Resource Integrated Database (eGRID). For Canada, these factors are obtained from Canada’s National Inventory Report – Greenhouse Gas Sources and Sinks in Canada.
To calculate indirect GHG emissions from electricity:
1. All billed or metered site energy consumption for each source is converted from native units to MBtu.2. Total site energy for each source is multiplied by a single CO2 equivalent factor that incorporates the
contribution of CO2, CH4, and N2O.
6 District steam assumed delivered at 150 psig saturated steam with a Btu value of 1,194 Btu/pound. Letter communication from Robert P. Thornton, President, International District Energy Association to Felicia Ruiz, EPA Combined Heat and Power Partnership Program Manager, August 15, 2008.

August 2017 Greenhouse Gas Emissions 5
Technical Referencea. In the U.S., these are regional factors according to the eGRID subregions.b. In Canada, factors are provided at the provincial level.
3. Indirect emissions from electric energy consumption are added to indirect emissions from district energy tocompute your Indirect Emissions Metrics in Portfolio Manager.
4. Indirect emissions are also added to the Total GHG Emissions.
CALCULATING BIOMASS EMISSIONS
Biomass emissions result from the combustion of biogenic fuels. Biomass emissions from buildings are similar to other direct emissions in that they reflect emissions from onsite fuel combustion. Although combustion occurs onsite, emissions from biomass are typically tracked and reported separately from the direct emissions from fossil fuels. At this time, there is only one biogenic fuel in Portfolio Manager, wood. There is one national factor for emissions from wood that is applied within the U.S. and a different national factor for emissions from wood that is applied in Canada.
To calculate indirect GHG emissions from wood:
1. All meters for wood (the only biomass fuel) are converted from native units to MBtu.2. Total site energy for wood is multiplied by a single CO2 equivalent factor that incorporates the contribution of
CO2, CH4, and N2O.a. In the U.S., there is one national factor applied.b. In Canada, a single national factor (different from the U.S.) is applied.
3. Emissions resulting from wood are reported as biomass emissions
To allow for a separate evaluation and accounting, biomass emissions are not included in the Total GHG Emissions.
UNDERSTANDING AVOIDED EMISSIONS FROM GREEN POWER
Green power is a particular type of electricity that is produced from renewable sources (e.g., solar, wind, etc.) and is considered to have zero emissions. The methodology in Portfolio Manager to account for the contribution of green power in an emissions inventory depends on whether the green power is generated onsite or offsite. A complete discussion of green power, including information on both benchmarking and performance metrics, is available in the Technical Reference for Green Power, at www.energystar.gov/GreenPower.
Offsite Green Power
When you purchase green power that is generated offsite, you are still making a purchase of electricity supplied from the grid. According to standard protocol, there are three associated metrics:
•
•
GHG Inventory. To establish your starting GHG inventory, the standard procedures for electricity are applied. That is, your starting inventory includes the emissions from your electric purchase, irrespective of any adjustments for green power.
Avoided Emissions. The calculation of avoided emissions is based on the location where the green power was generated, which could be different than the location of your building. This location is specified in the Renewable Energy Certificate (REC), which quantifies the environmental benefits of your green power purchase. The emissions factors used to compute the avoided emissions are resolved at the same regional level as the factors associated with electric consumption. However, the actual factors are different. Whereas electric emissions associated with use of grid-supplied electricity are computed using what is called the “total output emissions rate factor,” the avoided emissions from green power are computed using the “marginal” or “non-baseload” factors. Use of these factors provides a better estimate of the emissions

August 2017 Greenhouse Gas Emissions 6
Technical Referencereductions associated with reduced electricity use, reflecting the fact that when the load decreases, non-
baseload or “peak load” power output is reduced first.7
• Net Emissions. Your net emissions is equal to your GHG Inventory minus your Avoided Emissions.
Onsite Green Power
When you have an onsite renewable system, the implications for your emissions inventory depend on whether or not you own the RECs. The RECs quantify the environmental benefit of your green power and they may be sold independently of the energy (kWh). If you sell the RECs (either directly or through arbitrage) then you can no longer claim that your power is “green.”
•
•
•
GHG Inventory. If you own the RECs, then an onsite system is counted as zero emissions in your inventory. If you do not own the RECs, then the onsite system is counted using the system average electric emissions rate for your location.
Avoided Emissions. If you own the RECs, then your avoided emissions are computed using the non-baseload (marginal) factors for your region. If you do not own the RECs, then you have no avoided emissions.
Net Emissions. Because your green power was already counted as zero emissions in your GHG Inventory, there is no additional subtraction or adjustment associated with onsite green power. Your net emissions are equal to your GHG Inventory.
It is extremely important to clarify that emissions from onsite green power are based on the total amount of energy that you consume from your onsite system. Export of renewable energy back to the grid does not change the energy requirements of your building, and therefore does not offset the building’s electricity consumption. It is not acceptable to enter a net meter reading that records the difference between the amount that is imported from the grid and the amount that is exported back to the grid (onsite generated electricity should not be net metered). For more information on the requirements of entering green power, refer to our Technical Reference on Green Power, at www.energystar.gov/GreenPower.
REFERENCE GHG EMISSIONS FACTORS
Specific GHG emissions factors are presented in the following figures. All factors are applied to your site energy consumption in MBtu, to find the resulting GHG emissions. Please note that for buildings outside the U.S. and Canada, the U.S. factors are applied by default.
Direct Emissions
Figure 1 summarizes the GHG emissions factors for each fuel in Portfolio Manager for buildings in the United States and Canada. For the U.S., this data is obtained from the published factors in the Federal Register associated with EPA’s Final Rule for Mandatory Reporting of Greenhouse Gases.8 For Canada, most onsite fuels follow the default
7 U.S. Environmental Protection Agency, Climate Leaders Greenhouse Gas Inventory Protocol Optional Modules Methodology for Project Type: Green Power and Renewable Energy Certificates (RECs), Version 2.1, November 2008, http://www.epa.gov/climateleadership/documents/greenpower_guidance.pdf. 8 Solid, gaseous, liquid and biomass fuels: Federal Register (2009) EPA; 40 CFR Parts 86, 87, 89 et al; Mandatory Reporting of Greenhouse Gases; Final Rule, 30Oct09, 261 pp. Tables C-1 and C-2 at FR pp. 56409-56410.

August 2017 Greenhouse Gas Emissions 7
Technical Referencefuel approach and have one factor per fuel type. To compute these factors, the heating content is obtained from Statistics Canada’s Report on Energy Supply and Demand in Canada while the emissions factors are obtained from the National Inventory Report submitted by Canada to the United Nations Framework Convention on Climate Change.9
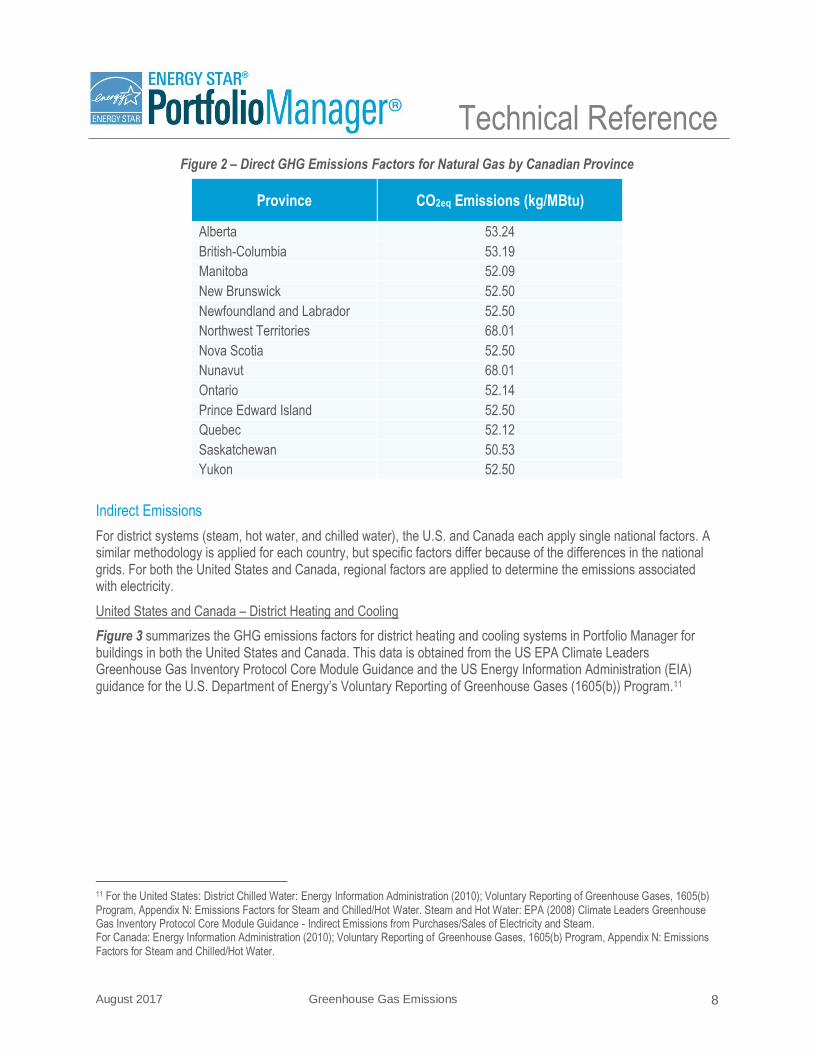
Natural gas factors in Canada are computed by province to account for difference in gas content and supply across the country. The gas factors for emissions in each province are presented in Figure 2. These figures are determined based on the National Inventory Report submitted by Canada to the United Nations Framework Convention on Climate Change.10
Figure 1 – Direct GHG Emissions Factors for the U.S. and Canada
Fuel Type CO2eq Emissions (kg/MBtu)
United States Canada
Natural Gas 53.11 by province
Propane 64.25 64.52
Fuel Oil (No. 1) 73.50 75.13
Fuel Oil (No. 2) 74.21 75.13
Fuel Oil (No. 4) 75.29 75.13
Fuel Oil (No. 5,6) 75.35 78.86
Diesel Oil 74.21 77.48
Kerosene 77.69 71.96
Coal (anthracite) 104.44 94.76
Coal (bituminous) 94.03 96.19
Coke 114.42 116.36
Revised emission factors for selected fuels: Federal Register (2010) EPA; 40 CFR Part 98; Mandatory Reporting of Greenhouse Gases; Final Rule, 17Dec10, 81 pp. With Amendments from Memo: Table of Final 2013 Revisions to the Greenhouse Gas Reporting Rule (PDF) to 40 CFR part 98, subpart C: Table C–1 to Subpart C—Default CO2 Emission Factors and High Heat Values for Various Types of Fuel and Table C–2 to Subpart C—Default CH4 and N2O Emission Factors for Various Types of Fuel. 9 Heat Content: Statistics Canada - Report on Energy Supply and Demand in Canada, Catalogue 57-003 - Text Table 1 Emissions Factors: National Inventory Report 1990-2015: Canada's 2017 Submission to the United Nations Framework Convention on Climate Change (April 2017) - Tables 6-3 to 6-4 and 6-8 to 6-10 10 National Inventory Report 1990-2015: Canada's 2017 Submission to the United Nations Framework Convention on Climate Change (April 2017) – Table 6-2.
August 2017 Greenhouse Gas Emissions 8
Technical ReferenceFigure 2 – Direct GHG Emissions Factors for Natural Gas by Canadian Province
Province CO2eq Emissions (kg/MBtu)
Alberta 53.24
British-Columbia 53.19
Manitoba 52.09
New Brunswick 52.50
Newfoundland and Labrador 52.50
Northwest Territories 68.01
Nova Scotia 52.50
Nunavut 68.01
Ontario 52.14
Prince Edward Island 52.50
Quebec 52.12
Saskatchewan 50.53
Yukon 52.50
Indirect Emissions
For district systems (steam, hot water, and chilled water), the U.S. and Canada each apply single national factors. A similar methodology is applied for each country, but specific factors differ because of the differences in the national grids. For both the United States and Canada, regional factors are applied to determine the emissions associated with electricity.
United States and Canada – District Heating and Cooling
Figure 3 summarizes the GHG emissions factors for district heating and cooling systems in Portfolio Manager for buildings in both the United States and Canada. This data is obtained from the US EPA Climate Leaders Greenhouse Gas Inventory Protocol Core Module Guidance and the US Energy Information Administration (EIA) guidance for the U.S. Department of Energy’s Voluntary Reporting of Greenhouse Gases (1605(b)) Program.11
11 For the United States: District Chilled Water: Energy Information Administration (2010); Voluntary Reporting of Greenhouse Gases, 1605(b) Program, Appendix N: Emissions Factors for Steam and Chilled/Hot Water. Steam and Hot Water: EPA (2008) Climate Leaders Greenhouse Gas Inventory Protocol Core Module Guidance - Indirect Emissions from Purchases/Sales of Electricity and Steam. For Canada: Energy Information Administration (2010); Voluntary Reporting of Greenhouse Gases, 1605(b) Program, Appendix N: Emissions Factors for Steam and Chilled/Hot Water.

August 2017 Greenhouse Gas Emissions 9
Technical ReferenceFigure 3 – Indirect GHG Emissions Factors for all District Fuels
Fuel Type CO2eq Emissions (kg/MBtu)
United States Canada
District Steam 66.40 88.54
District Hot Water 66.40 88.54
District Chilled Water -Electric Driven Chiller 52.70 17.19 District Chilled Water - Absorption Chiller using Natural Gas 73.89 73.86
District Chilled Water - Engine-Driven Chiller Natural Gas 49.31 49.29
United States – Electricity
Emissions from electricity production are determined from direct measurement of power plants by utility owners and operators, who report continuous emissions monitoring system data to EPA. This information is compiled in the U.S. EPA's Emissions & Generation Resource Integrated Database (eGRID).12 Data in eGRID are available at the power plant level and are also aggregated to state, electric generating company, parent company, power control area, eGRID subregion, NERC region, and the U.S. total levels.
Given the interconnected nature of the electric transmission and distribution system, it is not possible to identify the specific plant associated with a building in Portfolio Manager. Furthermore, it is frequently not possible to obtain the emissions rate for electricity obtained by a specific utility company. This is because the data reported by electric generation companies only accounts for emissions and generation of power plants owned or operated by that utility, and does not account for imports and exports of electricity from/to other utilities that may have attributes that are significantly different from the electric generation company. Attribution of emissions at the state level is also not possible, as a state’s electricity generation may not serve all of the consumption within that state.
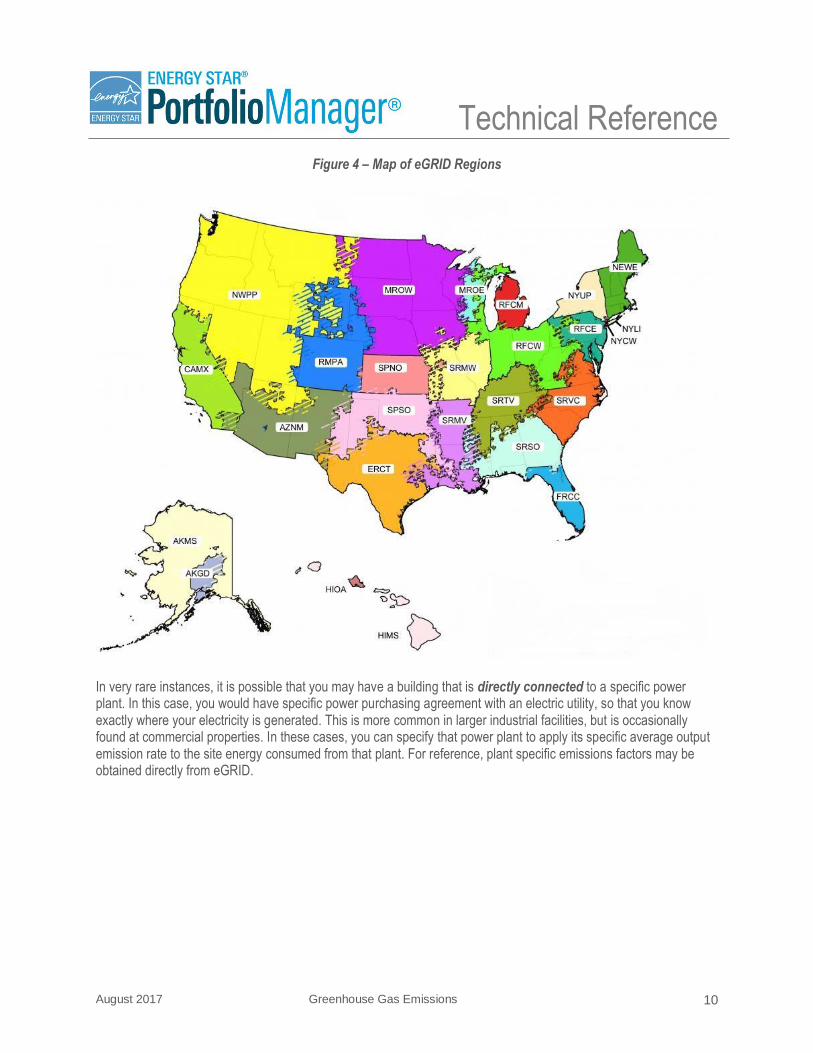
For these reasons Portfolio Manager maps buildings to eGRID subregions as a practical resolution of electricity origin to determine the emissions factors to apply to a building’s electricity consumption. An eGRID subregion represents a portion of the U.S. power grid that is contained within a single North America Electric Reliability Council (NERC) region. These regions have similar emissions and resource mix characteristics, and may be partially isolated by transmission constraints. Portfolio Manager locates a building inside an eGRID subregion by mapping its Zip code to its eGRID subregion. In many cases, a Zip code is not confined within one eGRID subregion. In these instances, you are asked to identify your electric distribution utility in order to locate your building within an eGRID subregion.13 Figure 4 presents a map of the eGRID subregions, and the system average emissions factors used to compute indirect emissions are presented Figure 5. These factors represent the average emissions from the all grid-connected electricity generation units (baseload, intermediate, and peaking), and are appropriate for developing a carbon footprint or emissions inventory.
12 U.S. EPA's Emissions & Generation Resource Integrated Database (eGRID). eGRID 11th Edition, Version 2.0 (released 2/27/2017) contains the complete release of year 2014 data, https://www.epa.gov/energy/egrid. 13 Zip code mapping accomplished through the Ventyx Velocity Suite software product, also utilized by EPA’s Power Profiler.
August 2017 Greenhouse Gas Emissions 10
Technical ReferenceFigure 4 – Map of eGRID Regions
In very rare instances, it is possible that you may have a building that is directly connected to a specific power plant. In this case, you would have specific power purchasing agreement with an electric utility, so that you know exactly where your electricity is generated. This is more common in larger industrial facilities, but is occasionally found at commercial properties. In these cases, you can specify that power plant to apply its specific average output emission rate to the site energy consumed from that plant. For reference, plant specific emissions factors may be obtained directly from eGRID.

August 2017 Greenhouse Gas Emissions 11
Technical ReferenceFigure 5 – Indirect Greenhouse Gas Emission Factors for Electricity in the U.S.
eGRID Regional Description
eGRID Acronym
CO2eq Emissions (kg/MBtu)
South/Central Alaska AKGD 123.59
Most of Alaska AKMS 90.81
Southwest US AZNM 116.97
Southwest Coast CAMX 75.84
Most of TX ERCT 152.62
Most of Florida FRCC 143.67
HI excluding Oahu HIMS 125.96
Oahu Island HIOA 198.12
Eastern WI MROE 222.87
Upper Midwest MROW 182.87
New England NEWE 76.67
Northwest US NWPP 121.43
New York City NYCW 88.66
Long Island, NY NYLI 160.10
Upstate NY NYUP 48.87
Mid Atlantic RFCE 110.93
Most of Michigan RFCM 205.07
Ohio Valley RFCW 184.89
CO-Eastern WY RMPA 232.56
KS-Western MO SPNO 210.90
TX Panhandle-OK SPSO 197.38
Lower Mississippi SRMV 136.54
Middle Mississippi SRMW 237.40
SE US, Gulf Coast SRSO 152.97
Tennessee Valley SRTV 178.85
Virginia/Carolina SRVC 114.69
National Average 150.24
Canada – Electricity
Indirect emissions for electricity in Canada are computed based on the province, to account for differences in electric generation, transmission, and distribution methods. The electric factors for emissions in each region are presented in Figure 6. These values are determined based on the National Inventory Report submitted by Canada to the United Nations Framework Convention on Climate Change.14
14 National Inventory Report 1990-2015: Canada's 2017 Submission to the United Nations Framework Convention on Climate Change (April 2017) - Tables A13-1 and A13-14.

August 2017 Greenhouse Gas Emissions 12
Technical ReferenceFigure 6 – Indirect GHG Emissions Factors for Electricity in Canada
Province CO2eq Emissions
(kg/MBtu)
Alberta 257.91
British-Columbia 4.89
Manitoba 1.03
New Brunswick 84.11
Newfoundland and Labrador 9.09
Northwest Territories 87.92
Nova Scotia 213.95
Nunavut 219.81
Ontario 11.72
Prince Edward Island 84.11
Quebec 0.47
Saskatchewan 263.77
Yukon 12.02
National Average 43.96
Biomass Emissions
The only biomass fuel available in Portfolio Manager is wood. In the U.S., the factor for wood, similar to the factors for direct emissions, is obtained from the published factors in the Federal Register associated with EPA’s Final Rule for Mandatory Reporting of Greenhouse Gases.15 The factor for Canada is obtained from the National Inventory Report: 1990-2015.16
Figure 7 – Wood GHG Emissions Factors for the U.S. and Canada
Fuel Type CO2eq Emissions (kg/MBtu)
United States Canada
Wood 94.22 100.95
15 Solid, gaseous, liquid and biomass fuels: Federal Register (2009) EPA; 40 CFR Parts 86, 87, 89 et al; Mandatory Reporting of Greenhouse Gases; Final Rule, 30Oct09, 261 pp. Tables C-1 and C-2 at FR pp. 56409-56410. Revised emission factors for selected fuels: Federal Register (2010) EPA; 40 CFR Part 98; Mandatory Reporting of Greenhouse Gases; Final Rule, 17Dec10, 81 pp. With Amendments from Memo: Table of Final 2013 Revisions to the Greenhouse Gas Reporting Rule (PDF) to 40 CFR part 98, subpart C: Table C–1 to Subpart C—Default CO2 Emission Factors and High Heat Values for Various Types of Fuel and Table C–2 to Subpart C—Default CH4 and N2O Emission Factors for Various Types of Fuel. 16 National Inventory Report 1990-2015: Canada's 2017 Submission to the United Nations Framework Convention on Climate Change (April 2017) - Table A6-32.

August 2017 Greenhouse Gas Emissions 13
Technical Reference
Avoided Emissions from Green Power
As discussed above, green power can result in a net emissions benefit for your building. Both onsite and offsite green power purchases can be recorded in Portfolio Manager. The benefits of this green power depend upon you actually purchasing and retaining the REC associated with the green power.
Your standard emissions inventory for electricity applies what are called total output emission rate factors. These factors represent the overall system average in your region, accounting for all power generation facilities. To compute the avoided emissions benefit, we use a different factor, which is called the “marginal” or “non-baseload” factor. This factor looks specifically at the generation facilities that are operated coincident with peak demands. These units are the first to shut off when demand is reduced, and therefore better estimate the emissions benefits of reductions in grid supplied electricity use. In the U.S., these factors are part of the eGRID Database and are summarized in Figure 8.17
17 U.S. EPA's Emissions & Generation Resource Integrated Database (eGRID). eGRID 11th Edition, Version 2.0 (released 2/27/2017) contains the complete release of year 2014 data, http://www.epa.gov/cleanenergy/energy-resources/egrid/index.html.

August 2017 Greenhouse Gas Emissions 14
Technical Reference
Figure 8 – Non-Baseload Factors used for Avoided Emissions in the U.S.
eGRID Regional Description
eGRID Acronym
CO2eq Emissions (kg/MBtu)
South/Central Alaska AKGD 140.25
Most of Alaska AKMS 502.37
Southwest US AZNM 167.68
Southwest Coast CAMX 121.74
Most of TX ERCT 185.43
Most of Florida FRCC 161.41
HI excluding Oahu HIMS 178.02
Oahu Island HIOA 196.75
Eastern WI MROE 242.21
Upper Midwest MROW 272.28
New England NEWE 142.59
Northwest US NWPP 209.02
New York City NYCW 174.71
Long Island, NY NYLI 179.21
Upstate NY NYUP 159.57
Mid Atlantic RFCE 196.81
Most of Michigan RFCM 249.43
Ohio Valley RFCW 261.00
CO-Eastern WY RMPA 241.15
KS-Western MO SPNO 276.54
TX Panhandle-OK SPSO 213.42
Lower Mississippi SRMV 166.95
Middle Mississippi SRMW 284.03
SE US, Gulf Coast SRSO 204.32
Tennessee Valley SRTV 257.30
Virginia/Carolina SRVC 190.98
National Average 207.64
For Canada, the factors are summarized in Figure 9. The marginal fuels are determined for both summer and winter.18 For both summer and winter, the marginal emissions are calculated by dividing the emission factors19 for each province’s marginal fuel by the energy content of the marginal fuel,20 and by the expected operating efficiency of the marginal fuel plant.21 Average marginal fuel emissions are calculated using summer and winter results.
18 Natural Resources Canada’s Analysis Modelling Division for the Energy Policy Branch, in consultation with the provinces and utilities. 19 National Inventory Report 1990-2015: Canada's 2017 Submission to the United Nations Framework Convention on Climate Change (April 2017) – Annex 6. 20 Statistics Canada’s Report on Energy Supply and Demand in Canada, Catalogue 57-003. 21 Statistics Canada’s Annual Thermal plant survey and consultation with the provincial utilities.

Technical Reference
Figure 9 – Non-Baseload Factors used for Avoided Emissions in Canada
Province CO2eq Emissions kg/MBtu
Alberta 137.57
British-Columbia 151.53
Manitoba 365.56
New Brunswick 185.27
Newfoundland and Labrador 109.23
Northwest Territories 258.27
Nova Scotia 208.67
Nunavut 258.27
Ontario 115.56
Prince Edward Island 228.88
Quebec 96.97
Saskatchewan 152.73
Yukon 258.27
National Average 132.02
ENERGY STAR is a U.S. Environmental Protection Agency program helping businesses and individuals fight climate change through superior energy efficiency.