2017 Greenhouse Inventory
76
2017 Greenhouse Inventory June 2018 Prepared by: Puget Sound Energy
Transcript of 2017 Greenhouse Inventory
2017 Greenhouse Inventory
June 2018
Prepared by: Puget Sound Energy
Prepared by: Puget Sound Energy
1
2017 Greenhouse Inventory
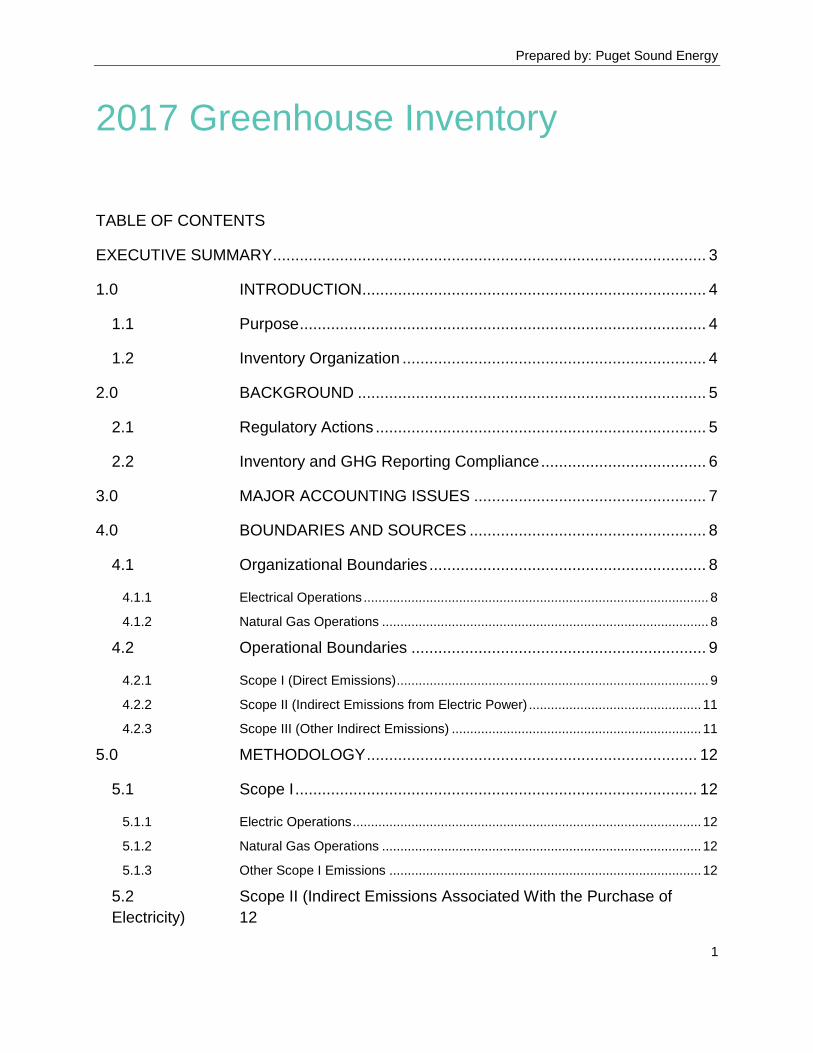
TABLE OF CONTENTS
EXECUTIVE SUMMARY ................................................................................................. 3
1.0 INTRODUCTION ............................................................................. 4
1.1 Purpose ........................................................................................... 4
1.2 Inventory Organization .................................................................... 4
2.0 BACKGROUND .............................................................................. 5
2.1 Regulatory Actions .......................................................................... 5
2.2 Inventory and GHG Reporting Compliance ..................................... 6
3.0 MAJOR ACCOUNTING ISSUES .................................................... 7
4.0 BOUNDARIES AND SOURCES ..................................................... 8
4.1 Organizational Boundaries .............................................................. 8
4.1.1 Electrical Operations .............................................................................................. 8
4.1.2 Natural Gas Operations ......................................................................................... 8
4.2 Operational Boundaries .................................................................. 9
4.2.1 Scope I (Direct Emissions) ..................................................................................... 9
4.2.2 Scope II (Indirect Emissions from Electric Power) ............................................... 11
4.2.3 Scope III (Other Indirect Emissions) .................................................................... 11
5.0 METHODOLOGY .......................................................................... 12
5.1 Scope I .......................................................................................... 12
5.1.1 Electric Operations ............................................................................................... 12
5.1.2 Natural Gas Operations ....................................................................................... 12
5.1.3 Other Scope I Emissions ..................................................................................... 12
5.2 Scope II (Indirect Emissions Associated With the Purchase of
Electricity) 12
Prepared by: Puget Sound Energy
2
5.3 Scope III (Other Indirect Emissions) Electric Operations .............. 12
5.3.1 Electric Operations ............................................................................................... 12
5.3.2 Natural Gas Supply .............................................................................................. 13
6.0 GHG EMISSIONS ......................................................................... 14
7.0 Sources and Uncertainties of GHG Emissions .............................. 15
7.1 Sources of GHG Emissions .......................................................... 15
7.2 Uncertainties in the GHG Emissions Inventory ............................. 16
7.2.1 Potential Sources of GHG Emissions Not Included ............................................. 16
7.2.2 Uncertainty Associated with Data Sources and Methodology ............................. 17
8.0 GHG EMISSIONS TIME TRENDS ................................................ 18
8.1 Changes in Organizational Boundaries ......................................... 18
8.2 Changes in Emissions – 2017 v. 2016 .......................................... 18
8.3 Changes in Methodology .............................................................. 19
8.3.1 All Emissions ........................................................................................................ 19
8.3.2 Scope I (Direct Emissions) ................................................................................... 19
8.3.3 Scope III (Other Indirect Emissions) .................................................................... 21
9.0 CONSERVATION PROGRAMS AND GHG EMISSIONS AVOIDED
23
10.0 REFERENCES.............................................................................. 24
Prepared by: Puget Sound Energy
3
EXECUTIVE SUMMARY
Puget Sound Energy’s (PSE) operating rates and greenhouse gas (GHG) emissions for calendar year
2017 are summarized in Table ES-1, Table ES-2, and Table ES-3. The emission percentages indicated in
Table ES-2 are the percentage of the total emissions of the particular pollutant within each scope. The
emission percentages indicated in Table ES-3 are the percentage of the total emissions of the particular
pollutant among all sources.
A majority of the carbon dioxide (CO2) emissions were from generated and purchased electricity (65.7%),
while the remaining emissions were from natural gas supply to end-users (34.3%). For methane (CH4),
the majority of emissions were fugitive from natural gas operations (80.9%). Generated and purchased
electricity also accounted for all nitrous oxide (N2O) emissions and all sulfur hexafluoride (SF6)
emissions.
Compared to 2016, total electricity delivered to customers in 2017 was down by 7.6%, and total
emissions were down by 0.3%. This trend is largely due to PSE dispatching less of its owned generation
(coal, gas and renewable) with more purchased energy being delivered into PSE’s system under firm
contract, but less from the spot market. In addition, emissions from PSE’s owned generating sources
were down in 2017 for several reasons including: marginally less dispatch of PSE’s coal-based Colstrip
Generating Station (emissions down 3.4%); more deliveries from firm contracted resources (emission up
29.5%); less PSE gas generation (emissions down 7.6%); and less deliveries of purchased unspecified
energy (emissions down 22.7%).
The “direct use” of natural gas often includes heating for water, buildings, and industrial processes, as
well as use as a raw material to produce petrochemicals, plastics, paints, and a wide variety of other
products. The emissions associated with the “direct use” of natural gas by end-users together with the
emissions associated with power generation and power deliveries from natural gas combustion (direct
and indirect) are accounted for in this inventory.
Prepared by: Puget Sound Energy
4
1.0 INTRODUCTION
This document presents an inventory of greenhouse gas (GHG) emissions from Puget Sound Energy
(PSE) operations during the calendar year 2017. PSE’s primary business is electric generation, purchase,
distribution, and sales and natural gas purchase, distribution, and sales. This inventory accounts for the
four major GHGs most relevant to PSE’s businesses. They are carbon dioxide (CO2), methane (CH4),
nitrous oxide (N2O), and sulfur hexafluoride (SF6). GHG emissions were calculated in accordance with a
standardized nationally accepted protocol.
1.1 Purpose
This inventory is intended to provide PSE with the information to achieve five major goals:
Maintaining an accurate and transparent estimate of GHG emissions;
Analyzing PSE’s GHG emission sources in relation to size and impact;
Tracking PSE’s GHG emissions over time;
Evaluating PSE’s GHG emissions from electric production and purchase relative to those of other
electric generators and electric utilities; and
Estimating the emissions avoided through PSE’s conservation programs.
1.2 Inventory Organization
This inventory is organized into 9 sections. The introduction explains the purpose and organization of this
inventory. The background of PSE’s GHG inventory is described in Section 2.0. Major accounting issues
within PSE’s GHG inventory are discussed in Section 3.0. Section 4.0 presents the choice of
organizational and operational boundaries used in the inventory. Section 5.0 documents the calculation
methodology, data sources, and assumptions made to estimate PSE’s GHG emissions. Section 6.0
provides a list of tables used to present and analyze PSE’s GHG emissions during calendar year 2016.
Section 7.0 provides an evaluation of the sources of PSE’s GHG emissions and discusses potential
uncertainties in the inventory. Section 8.0 describes changes in PSE’s GHG inventory over time. Section
9.0 presents PSE’s conservation programs that are relevant to the inventory and the estimated amount of
GHG emissions avoided as a result of these conservation programs. The last section contains a list of
references used to compile this inventory.
Prepared by: Puget Sound Energy
5
2.0 BACKGROUND
From 2002 to 2010, PSE’s GHG inventories have followed a widely-accepted international GHG
accounting protocol, the Greenhouse Gas Protocol (WRI/WBCSD 2004). The Greenhouse Gas Protocol
(GHG Protocol) was developed by a consortium of businesses, business organizations, governments,
and non-governmental organizations led jointly by the World Resources Institute (WRI) and the World
Business Council for Sustainable Development (WBCSD).
The WRI/WBCSD GHG Protocol has set the standard for development of GHG accounting methods for
many industries and state GHG programs. Under the GHG Protocol, six groups of GHGs are tracked:
CO2, CH4, N2O, SF6, hydrofluorocarbons (HFCs), and perfluorocarbons (PFCs). Two of the groups of
gases, HFCs and PFCs, are not tracked quantitatively in this inventory because PSE’s emissions of these
GHGs are negligible.
2.1 Regulatory Actions
This inventory continues to incorporate many of the standards developed by the WRI/WBSCD. However,
regulatory actions taken at the federal and state levels now require PSE to disclose its emissions using
newly-set procedures. Where mandatory, PSE has integrated these standards into this report.
On September 22, 2009, the United States Environmental Protection Agency (EPA) signed the
Greenhouse Gas Mandatory Reporting Rule (GHG MRR) (EPA 2009). The rule requires reporting of GHG
emissions under EPA’s GHG Reporting Program from large sources and suppliers in the United States
and is intended to collect accurate and timely emissions data to inform future policy decisions. The final
rule was published in the Federal Register on October 30, 2009, and became effective on December 29,
2009. Under the rule, suppliers of fossil fuels or industrial GHGs, manufacturers of vehicles and engines,
and facilities that emit 25,000 metric tons or more of carbon dioxide equivalent (CO2e) per calendar year
are required to submit annual reports to the EPA. PSE is subject to the reporting requirements in
Subparts A, C, D, W, DD, and NN in the GHG MRR. Under these requirements, PSE must calculate GHG
emissions from fuel combustion and electrical transmission and distribution (T-D) equipment for electric
operations, natural gas system operations, and combustion of natural gas supplied to certain customers.
The reporting timeline varies for different subparts of the GHG MRR. The initial reporting year for
Subparts A, C, D, and NN was 2010, while the reporting year for Subparts W and DD was 2011.
In December 2014, the EPA promulgated a final rule under Subpart A (effective January 1, 2015) that
adds chemical-specific and default global warming potentials (GWPs) for a number of fluorinated GHGs
and fluorinated heat transfer fluids to the general provisions of the GHG MRR. The rule amendment
increases the completeness and accuracy of the CO2e emissions calculated and reported by suppliers
and emitters of fluorinated GHGs and heat transfer fluids. The only fluorinated GHG applicable for
reporting by PSE is SF6. The GWP for SF6 remains unchanged, so the rule amendment does not affect
PSE’s GHG emission calculations and reporting.
In November 2014, the EPA promulgated a final rule under Subpart W (effective January 1, 2015) that
revises the calculation methodology, monitoring, and data reporting requirements for natural gas
operations applicable to PSE’s GHG inventory. The changes are implemented in this year’s GHG
inventory.
Prepared by: Puget Sound Energy
6
In March 2010, the Washington State Legislature passed new legislation, Substitute Senate Bill 6373,
amending the 2008 statute (House Bill 2815) requiring the Washington State Department of Ecology
(Ecology) to establish rules for the mandatory reporting of GHG emissions. The amended legislation
emphasizes consistency with the EPA’s reporting program, which was finalized after the passage of the
2008 statute. Ecology then restarted its rulemaking process to align the state and federal programs.
Under the Washington State GHG reporting requirements, as prescribed in Washington Administrative
Code (WAC) 173-441, facilities and transportation fuel suppliers that emit 10,000 metric tons or more per
year of GHG emissions in Washington are required to report GHG emissions. Reporting started with 2012
emissions, which were to be reported in 2013.
The EPA has made multiple amendments to the GHG Reporting Program since its adoption in 2009.
Under the Revised Code of Washington (RCW) 70.94.151, Ecology is required to update Chapter 173-
441 WAC to maintain consistency with the EPA’s Greenhouse Gas Reporting Program. For this reporting
period, Ecology last updated Chapter 173-441 WAC October 28, 2016. No updates were found to be
applicable.
2.2 Inventory and GHG Reporting Compliance
This inventory is intended to meet the compliance requirements set forth in the federal and state GHG
reporting requirements. After the promulgation of the GHG MRR on October 30, 2009, PSE started
incorporating GHG MRR calculation methodologies in the 2009 GHG inventory, with the objective of
preparing to meet compliance requirements starting in the 2010 reporting year. The GHG MRR, however,
has evolved since its first promulgation in 2009. Therefore, new calculation methodologies continue to be
added to the GHG inventory to achieve alignment with the new GHG MRR requirements. Since 2011,
CO2, CH4, N2O, and SF6 emissions are quantified using methodologies established in Subparts A, C, D,
W, DD, and NN.
Facilities report GHG emissions based on the EPA's GHG MRR. The GHG emissions required to be
reported to Ecology use the same calculation methodology as the EPA’s GHG MRR. The difference in the
reporting requirement is that Washington State has a lower reporting threshold of 10,000 metric tons of
CO2e per calendar year. As such, PSE’s GHG inventory continues to enable PSE to comply with local,
state, and federal reporting requirements to manage its GHG emissions and to better adapt to future
emission reduction programs as they are adopted.
Prepared by: Puget Sound Energy
7
3.0 MAJOR ACCOUNTING ISSUES
To stay relevant with the WRI/WBCSD GHG Protocol, PSE adheres to five principles. The five principles,
along with the means by which this report adheres to the principles, are as follows.
Relevance. Ensure the GHG inventory appropriately reflects the GHG emissions of the company
and serves the decision-making needs of users—both internal and external. The intended uses of this
inventory are discussed in Section 1.1.
Completeness. Account for and report on all GHG emission sources and activities within the
chosen inventory boundary. Disclose and justify any specific exclusions. The organizational and
operational boundaries chosen by PSE are discussed in Section 4.0. Emission sources that are not
included in this inventory are presented in Section 7.2.1.
Consistency. Use consistent methodologies to allow for meaningful comparisons of emissions
over time. Transparently document any changes to the data, inventory boundary, methods, or any
other relevant factors in the time series. PSE has compiled an annual GHG inventory since 2002.
PSE has remained, to the best of its ability, consistent in its emission calculation methodology to
allow for meaningful comparisons of emissions over time. However, small changes in the emission
calculation methodology have been made over the years due to the changes in data availability. The
intention of making these small changes is to increase overall accuracy of the inventory. The
differences in data sources and methodologies are presented in Section 8.3.
Transparency. Address all relevant issues in a factual and coherent manner, based on a clear
audit trail. Disclose any relevant assumptions and make appropriate references to the accounting and
calculation methodologies and data sources used. Calculation methodologies, sources of data, and
assumptions are documented by emission scope in Section 5.0. The references used are listed in
Section 10.0 of this inventory.
Accuracy. Take appropriate measures to ensure that the quantification of GHG emissions is
neither over nor under actual emissions, as far as can be judged, and that uncertainties are reduced
as far as practicable. Achieve sufficient accuracy utilizing recognized standards to enable users to
make decisions with reasonable assurance as to the integrity of the reported information. PSE has
endeavored to obtain the best available information from PSE and other relevant organizations.
Additionally, efforts were made to minimize error to the greatest extent practicable by utilizing
appropriate professional judgment, reputable sources, best available information, and peer review.
The integrity of the inventory is further discussed in Section 7.2.
Prepared by: Puget Sound Energy
8
4.0 BOUNDARIES AND SOURCES
Organizational and operational boundaries to define and allocate GHG emissions were chosen for the
inventory in accordance with the GHG Protocol. The organizational boundary is used to determine the
GHG emissions and sources associated with PSE’s activities. The operational boundary further defines
these emission sources into “scopes” so that total emissions are accounted for, but double counting is
avoided.
4.1 Organizational Boundaries
PSE’s organizational boundaries are determined using the equity share approach, i.e., PSE accounts for
GHG emissions from its operations according to its share of ownership (operations or assets) in the
operation. These operations and assets are detailed in the Puget Energy (PSE’s parent company) Annual
Report (Form 10-K). The information presented in this document was extracted from the Annual Report
and supplemented by additional information provided by relevant PSE personnel.
4.1.1 Electrical Operations
In 2017, PSE supplied electricity to 1,135,044 customers in Western Washington. PSE wholly owns three
dual-fuel combustion turbine generation facilities (Frederickson, Fredonia, and Whitehorn), five natural
gas combined cycle generation facilities (Encogen, Goldendale, Mint Farm, Ferndale, and Sumas), one
internal diesel combustion generation facility (Crystal Mountain), four hydroelectric generation facilities
(Electron, Lower Baker River, Upper Baker River, and Snoqualmie Falls), and three wind power
generation facilities (Hopkins Ridge, Lower Snake River, and Wild Horse). Also, PSE partially owns one
coal-combustion generation facility (Colstrip) and one natural gas combined cycle generation facility
(Frederickson Unit 1). All of the generation facilities are located in Western Washington, except for the
coal-combustion generation facility (Colstrip), three wind power generation facilities (Hopkins Ridge,
Lower Snake River, and Wild Horse), and one natural gas combined cycle generation facility
(Goldendale). The coal-combustion generation facility is located in Montana; the three wind power and
one natural gas combined cycle generation facilities are located in Eastern Washington.
PSE’s total electricity supplied to its customers includes electricity generated by PSE-owned generation
facilities and electricity purchased through firm contracts with other electric producers and non-firm
contracts on the wholesale electric market. In 2017, 52.3% of PSE’s total electricity was generated by
PSE and 47.7% was purchased, with 35.6% via firm contracts and 12.1% via non-firm contracts (Figure
7-1). The distribution of electricity to PSE’s customers is largely provided by PSE-owned lines, while
some is transmitted by the Bonneville Power Agency under contract with PSE.
4.1.2 Natural Gas Operations
In 2017, PSE supplied natural gas to 819,336 customers in Western Washington. PSE purchases natural
gas from natural gas producers in the United States and Canada. PSE’s natural gas supply is transported
through pipelines owned by Northwest Pipeline GP (NWP), Gas Transmission Northwest (GTN), Nova
Gas Transmission (NOVA), Foothills Pipe Lines (Foothills), and Westcoast Energy (Westcoast). PSE
owns its gas distribution networks within its service territory. PSE holds storage capacity in the Jackson
Prepared by: Puget Sound Energy
9
Prairie and Clay Basin underground natural gas storage facilities in the United States and at AECO in
Alberta, Canada. One-third of the Jackson Prairie facility is owned by PSE.
4.2 Operational Boundaries
PSE’s GHG emissions are categorized into three scopes defined by PSE control or ownership and the
operational boundary specifications in the GHG Protocol. Under the GHG Protocol, accounting and
reporting of Scope I and Scope II emissions is considered mandatory, while that of Scope III emissions is
considered optional.
Scope I emissions are direct GHG emissions released directly by PSE from the operations of PSE-owned
facilities. These emissions include those from PSE-owned electric and natural gas operations. Scope II
emissions are indirect GHG emissions from the generation of purchased electricity consumed by PSE.
Scope III emissions are other indirect GHG emissions resulting from activities by PSE but which occurred
at sources not owned or controlled by PSE. These emissions include those from electricity purchased by
PSE and resold to another intermediary owner, such as another utility, or to end-users. Also, they include
emissions that would result from the complete combustion or oxidation of natural gas provided to end-
users on PSE’s distribution system.
In addition, emission data for CO2 emissions from biomass fuels are accounted for and reported
separately from the three scopes defined above. This is consistent with the GHG Protocol. The GHG
Protocol specifies that these emissions should be accounted for separately because of the relatively quick
interplay between biomass fuels and the terrestrial carbon stock. In contrast to biomass fuels, fossil fuels
take a much longer time to develop, so the interaction between atmospheric carbon and fossil fuels is not
considered in national GHG inventories.
Table 4-1 summarizes GHG emissions from each area of PSE’s operations accounted for in this inventory
and identifies the scope under which each area falls.
4.2.1 Scope I (Direct Emissions)
PSE’s Scope I emissions come from electric operations and natural gas operations. Consistent with the
previous years’ GHG inventory, SF6 emissions from electrical T-D equipment are included. PSE’s CH4
emissions from natural gas storage is below the de minimis level of 2% that is recognized by the GHG
Protocol, therefore, were excluded from Scope I emissions. PSE’s electric and natural gas profile did not
change in 2017. The inclusion and exclusion of these emissions enable PSE’s GHG inventory to be
consistent with the GHG MRR requirements. Specifically, these emissions are reported under Subpart DD
and Subpart W of the GHG MRR.
4.2.1.1 Electric Operations
Within PSE’s electric operations, Scope I emissions come from electricity generation, transmission, and
distribution systems. The emissions that result from PSE-owned generating facilities are fully accounted
for in this inventory. In addition, three potential sources are identified for emissions from electric T-D
systems:
Prepared by: Puget Sound Energy
10
Emissions from electricity generated by PSE and lost in T-D. These emissions are included in the
total emissions from electricity generated by PSE, prior to any losses, and were not accounted for
separately.
Emissions from electrical T-D equipment. These emissions include SF6 emissions from gas-
insulated substations, circuit breakers, closed-pressure and hermetically sealed-pressure switchgear,
gas-insulated lines containing SF6, pressurized cylinders, gas carts, electric power transformers, and
other containers of SF6. On December 1, 2010, the EPA finalized the GHG MRR Subpart DD to
require calculation and reporting of these emissions. Therefore, the GHG inventory has included SF6
emissions since 2011 to be consistent with the GHG MRR requirements. SF6 emissions are very
minor when compared to the total GHG emissions footprint.
Emissions from equipment and materials used for construction, operation, and maintenance of
PSE’s electric system. This category includes incidental loss of HFCs and PFCs from refrigeration
equipment and from incidental leaks of CH4 at gas-fired turbines. Data regarding the use of PFCs and
HFCs in refrigeration equipment and incidental leaks of CH4 from gas-fired turbines were not
available and these were not considered in this inventory. PFCs and HFCs emissions from
refrigeration equipment and CH4 from incidental leaks at gas-fired turbines are extremely minor in
relation to the emissions from the coal-combustion generation facilities.
4.2.1.2 Natural Gas Operations
Scope I emissions from natural gas operations come from PSE’s natural gas distribution system. These
emissions include CO2 and CH4 emissions from equipment leaks from connectors, block valves, control
valves, pressure relief valves, orifice meters, regulators, and open-ended lines from metering and
regulating (M&R) and T-D transfer stations. On November 30, 2010, the EPA finalized the GHG MRR
Subpart W to require calculation and reporting of these emissions. Therefore, the GHG inventory has
included these emissions since 2011 to be consistent with the GHG MRR requirements. CH4 emissions
account for the majority of PSE’s Scope I emissions from natural gas operations.
4.2.1.3 Other Scope I Emissions
Scope I emissions also come from PSE’s vehicle fleet, which is used to service PSE’s electric and natural
gas operations. PSE’s vehicle fleet emissions include emissions from combustion of fuel burned by these
vehicles as well as any PFCs and/or HFCs released from air conditioning equipment installed in these
vehicles. These are all Scope I emissions attributable to PSE. PFCs and/or HFCs are of relatively minor
quantities compared to PSE’s total GHG emissions. Therefore, they are not quantified in PSE’s GHG
inventory.
The emissions from the combustion of fuel burned by these vehicles were not calculated for two reasons.
First, historically, these emissions have totaled approximately 0.1% of PSE’s total emissions output,
which is below the de minimis level of 2% that is recognized by the GHG Protocol. Second, the GHG
MRR will account for emissions from the transportation sector further up the production stream with a
method that is more accurate than the approach recommended by the GHG Protocol. Therefore, these
emissions are not included in PSE’s GHG inventory to ensure accurate and consistent reporting and to
avoid double counting.
Prepared by: Puget Sound Energy
11
4.2.2 Scope II (Indirect Emissions from Electric Power)
PSE’s Scope II emissions include emissions from electricity purchased from a third party and used by
PSE. PSE accounts for its internal use and system losses of electricity, but it does not differentiate
between losses associated with electricity generated by PSE and electricity purchased by PSE from a
third party. As such, it is difficult to separate Scope II emissions from total emissions associated with
PSE’s use of electricity. However, this inventory does account for Scope II emissions. Since PSE’s Scope
I emissions from electricity generated by PSE are based on the total amount of electricity generated, and
PSE’s Scope III emissions from purchased electricity sold to others are based on the total electricity
purchased, prior to any system loss or PSE use, complete accounting of Scope II emissions is included in
Scope I and Scope III emissions.
4.2.3 Scope III (Other Indirect Emissions)
PSE’s Scope III emissions are included in the inventory to avoid double counting of emissions among
different companies, as these emissions are accounted for as Scope I emissions by the third-party
companies. PSE’s Scope III emissions include emissions from operations and companies that support or
supply PSE, but are not owned or controlled by PSE.
PSE’s Scope III emissions accounted for in this inventory are associated with electric operations and
certain natural gas operations. Upstream emissions from the generation of power and production of
natural gas are also considered part of PSE’s Scope III emissions. However, as these emissions are
thought to be minor, more uncertain, and further from PSE’s control, they were not accounted for in this
inventory.
4.2.3.1 Electric Operations
A majority of PSE’s Scope III emissions come from third-party generated electricity purchased by PSE
and resold to intermediary owners or end-users. The electricity is purchased via firm and non-firm
contracts. The purchases and sales are tracked and the data were used to account for PSE’s Scope III
emissions.
4.2.3.2 Natural Gas Supply
PSE’s Scope III emissions associated with natural gas supply includes CO2 emissions that would result
from the complete use of natural gas provided to end-users on their distribution systems. End-users refer
to customers that consume no more than 460,000 thousand standard cubic feet (Mscf) of natural gas at a
single facility per year.
4.2.3.3 Other Scope III Emissions
Upstream emissions from the generation of power and production of natural gas are attributable to PSE’s
Scope III emissions. However, as these emissions are thought to be minor, more uncertain, and further
from PSE’s control, they are not accounted for in this inventory.
Other PSE Scope III emissions may include those associated with employee travel in vehicles other than
company vehicles, or emissions associated with wastes. However, as detailed information regarding
these emissions are not available and these emissions are thought to be minor in relation to the overall
GHG inventory, they were not accounted for in this inventory.
Prepared by: Puget Sound Energy
12
5.0 METHODOLOGY
This inventory was compiled using data provided by PSE, calculation methodologies from WRI/WBCSD
sources, the GHG MRR, and other accepted air emission calculation references. The data sources and
calculation methodologies are discussed in the following sections by emission scope (Scope I, Scope II,
Scope III, and outside scope).
5.1 Scope I
5.1.1 Electric Operations
PSE’s Scope I emissions from electric operations were calculated using the GHG MRR Subpart C Tier 2
and Tier 4 calculation methodologies (Table A-1 and Table A-2). These emissions were calculated based
on the amount of fuel consumed by the electricity generation facilities. PSE’s Scope I emissions from
electrical T-D equipment were calculated using the GHG MRR Subpart DD calculation methodologies
(Table B-9). These emissions were calculated based on the amount of SF6 removed from inventory and
acquired, less the amount disbursed and used in the electrical T-D equipment.
5.1.2 Natural Gas Operations
PSE’s Scope I emissions from its natural gas distribution system were calculated using the GHG MRR
Subpart W calculation methodologies (Table B-8). These emissions were calculated based on the
number of leaking equipment identified from PSE’s leak survey, M&R stations, and default emission
factors.
5.1.3 Other Scope I Emissions
No Other Scope I emissions were quantified.
5.2 Scope II (Indirect Emissions Associated With the Purchase of Electricity)
PSE’s Scope II emissions were not calculated separately as they could not be separated from Scope I
and Scope III emissions, as discussed in Section 4.2.2.
5.3 Scope III (Other Indirect Emissions) Electric Operations
5.3.1 Electric Operations
PSE’s Scope III emissions from firm contract purchased electricity were calculated using the amount of
electricity purchased, broken down by the electricity generation technology (e.g., coal, natural gas, or
petroleum), and emission factors applicable to each generation source. The sources of the emission
Prepared by: Puget Sound Energy
13
factors used include the Updated State-level Greenhouse Gas Emission Coefficients for Electricity
Generation 1998-2000 (DOE/EIA 2002), Voluntary Reporting of Greenhouse Gases Program – Fuel and
Energy Source Codes and Emission Coefficients (DOE/EIA 2011), Carbon Dioxide Emissions from the
Generation of Electric Power in the United States (DOE/EPA 2000), AP-42 emission factors (EPA), and
EPA eGRID regional average emission factors (Table A-3).
PSE’s Scope III emissions from non-firm contract purchased electricity were estimated using the
Washington Utilities and Transportation Commission (WUTC) net-by-counterparty methodology for
purchases and sales of non-firm contract purchased electricity. Regional average emission factors under
this methodology are provided by the Department of Commerce using data collected under the fuel mix
disclosure law, RCW 19.29A.
5.3.2 Natural Gas Supply
PSE’s Scope III CO2 emissions resulting from the complete combustion or oxidation of natural gas
provided to end-users on PSE’s distribution systems were calculated using the GHG MRR Subpart NN
calculation methodologies (Table B-10). These emissions were calculated based on the amount of natural
gas received at the city gate, less the amount delivered to downstream gas transmission pipelines and
other local distribution companies (LDCs), less the amount delivered to customers that consume more
than 460,000 Mscf of natural gas at a single facility per year, and plus the amount that bypassed the city
gate and the net amount retrieved from storage for delivery via PSE’s distribution system. Other off-
system natural gas that is not delivered to PSE’s distribution system was not included in Subpart NN
accounting.
Prepared by: Puget Sound Energy
14
6.0 GHG EMISSIONS
PSE’s GHG emissions calculations are presented in the following tables.
Table 6-1 Total Emissions by Scope
Table 6-2 Total Emissions by Scope in CO2 Equivalents (CO2e)
Table 6-3 Emissions from PSE-Owned Electric Operations
Table 6-4 Emissions from PSE-Owned Natural Gas Operations
Table 6-5 Emissions from Non-Firm Contract Purchased Electricity
Table 6-6 Detailed Emissions Calculations
Prepared by: Puget Sound Energy
15
7.0 Sources and Uncertainties of GHG Emissions
This section evaluates PSE’s GHG emissions by source to identify the sources generating the largest
amount (ton) and greatest intensity (ton/unit output).
7.1 Sources of GHG Emissions
Table 7-1 summarizes the GHG emissions from each source category. A majority of the CO2 emissions
were from generated and purchased electricity (65.7%), while the remaining emissions were from natural
gas operations and supply (34.3%). For CH4, the majority of emissions were from fugitive emissions from
natural gas operations (80.9%). Generated and purchased electricity accounted for all N2O and SF6
emissions. The other two principal GHGs, HFCs and PFCs, were not quantified.
A 100-year GWP (EPA 2014b) (Table A-4) was applied to each GHG to allow for a better comparison
among the GHGs and their respective emission sources (Table 7-2). The GWP is a factor describing the
degree of effect a given GHG has on the atmosphere relative to one unit of CO2. A CO2e is calculated for
each GHG so that GHG emissions can be compared on the same basis. In 2017, CO2 emissions from
generated and purchased electricity were the greatest source of GHGs emitted by PSE on a CO2
equivalent basis (65.5%), followed by natural gas supply (34.1%) and natural gas operations (0.4%).
Of PSE’s electricity throughput (generated and purchased) in 2017, 52.3% was generated by PSE and
47.7% was purchased (35.6% via firm contracts and 12.1% via non-firm contracts) (Figure 7-1). Of the
CO2 emissions that are associated with electricity, 60.7% were from electricity generated by PSE and
39.3% were from electricity purchased (28.7% via firm contracts and 10.6% via non-firm contracts)
(Figure 7-1). The relative amount of GHG emissions from the electricity sources did not align with the
amount of power from each electricity source. This is due to several factors.
First, about 40.8% of the electricity generated by PSE came from coal combustion (Figure 7-3), which has
a high GHG emission intensity compared to natural gas and oil combustion sources. GHG emission
intensity is the relationship between GHG emissions and production, i.e., metric tons CO2/kWh. Of CO2
emissions from electricity generated by PSE (direct emissions), about 72.0% were from coal-combustion
generation (Figure 7-3). It is the high GHG emission intensity of coal-combustion generation that made
the overall GHG emission intensity of PSE’s electric operations high.
Second, about 45.1% of firm contract purchased electricity came from hydroelectric plants in the Pacific
Northwest (Figure 7-4). Hydroelectric generation is considered a non-GHG producing generation source
in the GHG inventory. Almost all of the CO2 emissions generated from firm contract purchased electricity
come from coal-combustion generated and natural gas generated electric operations.
Third, regional average emission factors derived by Commerce were used to estimate non-firm contract
purchased electricity. Non-firm contract purchased electricity comes from different utilities and non-utilities
via the “grid” system of electric distribution. This makes it difficult to track exactly where and how each
measure of non-firm contract purchased electricity was generated. For instance, electricity purchased by
a utility from an energy trader could have been purchased by the energy trader from a hydroelectric
facility near the utility's operational territory, or from a utility generating electricity using coal outside the
Prepared by: Puget Sound Energy
16
utility's operational territory. The emissions associated with the generation are not clearly known because
they could be significantly different for each source.
Figure 7-5 shows PSE’s generated electricity and firm contract purchased electricity in 2017 by source
and the respective CO2 emissions from each source. The largest source of electricity is coal (35.6%),
followed by hydroelectricity (24.6%), natural gas/oil generated electricity (21.4%), wind power generated
electricity (9.8%), biogas (0.33%), and other or unknown sources (8.3%). The largest source of CO2
emissions is from coal-combustion electricity generation (73.4%), followed by natural gas electricity
generation (19.0%), and other or unknown sources (7.6%).
7.2 Uncertainties in the GHG Emissions Inventory
Uncertainties may exist in the inventory as a result of the following factors:
Failure to include or properly allocate emission sources within the boundaries of the inventory.
Some smaller emission sources were not quantified in the inventory because it was determined that
the large effort necessary to estimate their emissions was not warranted by the scale of their potential
emissions in relation to the overall inventory.
Failure to properly estimate emissions from each source. This issue could pertain to inaccurate
emission estimation methods or erroneous input data (e.g., fuel throughput) that were used to
estimate emissions.
These sources of uncertainty were evaluated for this year’s GHG inventory as follows.
7.2.1 Potential Sources of GHG Emissions Not Included
Some small sources of GHG emissions within the inventory boundary were not included in the inventory.
HFCs and PFCs emissions from refrigeration equipment leaks and emissions from operation of small
engines on portable equipment at remote sites were not included. The effort to gather data to produce
emission estimates for these sources would be extremely large relative to the maximum potential GHG
emissions from these sources. It appears highly unlikely that these sources of emissions would amount to
greater than 5% of PSE’s GHG emissions, the threshold for materiality used in the U.S. Department of
Energy’s (DOE) 1605(b) program. The GHG Protocol does not set a materiality standard. The GHG MRR
sets a reporting threshold of 25,000 metric tons of CO2e per year from an individual source.
Not all of PSE’s Scope III emissions were included in this inventory; only those emissions believed to be
of significant relevance to PSE’s operations were included. Quantification of Scope III emissions is
optional under the GHG Protocol. PSE chose to report some Scope III emissions because they amount to
a significant portion of the GHG emissions that are affected by PSE’s operations due to PSE’s purchase
of electricity. As an example, Scope III fugitive emissions from PSE-contracted storage at liquefied natural
gas facilities were not included in this inventory. These emissions were not expected to present significant
uncertainties in the inventory because the scale of potential GHG emissions is relatively low in relation to
the overall GHG inventory. Another example, the upstream emissions from the generation of power and
production of natural gas were also not included in the Scope III emissions for the PSE inventory. These
emissions are not accounted for in this inventory because they are thought to be minor, more uncertain,
and further from PSE’s control. Other PSE’s Scope III emissions may come from emissions associated
Prepared by: Puget Sound Energy
17
with employee travel in vehicles other than company vehicles, or emissions associated with wastes.
However, as detailed information regarding these emissions are not available and these emissions are
thought to be minor in relation to the overall GHG inventory, they were not accounted for in this inventory.
7.2.2 Uncertainty Associated with Data Sources and Methodology
The GHG Protocol specifies that neither assumptions nor methodology should introduce systematic errors
that would lead to either high or low estimates of emissions. The methodology generally used to estimate
emissions is to apply generally accepted emission factors to translate the amount of activity (e.g., kWh,
gallons of fuel) into GHG emissions. The selection of these emission factors was based on assumptions
regarding their suitability for the specific application. One of the most likely sources of systematic error
can result from the improper use of emission factors, or the use of inaccurate emission factors. Any errors
resulting from improper use of emission factors could be evaluated in detail through emissions testing of
equipment to develop equipment or source-specific emission factors. However, it is not practical to
perform this exercise for each specific emission source in this inventory. This detailed level of evaluation
is outside the scope of this inventory. All emission factors used in this inventory are based on commonly
accepted practices and best professional judgment to minimize sources of error to the maximum extent
possible within the defined scope of the inventory.
Some uncertainty also arises from the methodology used to calculate emissions from non-firm purchases
of electricity. As discussed in Section 7.1, regional emission factors were used to estimate emissions from
non-firm purchases of electricity. These regional factors were used due to the impracticality of tracking
exactly where and how non-firm contract purchased electricity was generated.
Prepared by: Puget Sound Energy
18
8.0 GHG EMISSIONS TIME TRENDS
8.1 Changes in Organizational Boundaries
PSE’s organization and operational boundaries change as it builds and purchases new facilities.
In 2005, the Hopkins Ridge wind facility was included in PSE’s GHG inventory for the first time. PSE owns
100% of the facility and it was PSE’s first wind farm. The facility began generating electricity in November
2005. The Wild Horse wind facility was first included in the 2006 GHG inventory. PSE owns 100% of the
facility, which was completed in December 2006. In 2007, the Goldendale natural gas electric generation
facility was included in PSE’s GHG inventory for the first time. PSE purchased the facility in 2007 and
owns 100% of the facility. The Sumas natural gas cogeneration facility was included in the 2008 GHG
inventory for the first time. PSE purchased the facility in July 2008 and owns 100% of the facility. The Mint
Farm natural gas combined cycle generation facility was purchased in December 2008 and was first
included in the 2009 GHG inventory. The Ferndale natural gas cogeneration facility was purchased in
November 2012, while Lower Snake River began commercial operations in February 2012.
8.2 Changes in Emissions – 2017 v. 2016
Variation over time is expected in both total emissions and energy generated or consumed by PSE
because various factors affect PSE’s business, such as weather conditions, power pricing on the energy
market, and different power contracts that are written, renewed, or expired. Apart from the factors that
affect PSE’s business, changes in calculation methodologies should be taken into account when
analyzing emission trends. Changes in methodology that have occurred over time in PSE’s GHG
inventory are provided in Section 8.3.
Overall, PSE’s CO2 emissions intensity from total electricity delivered to customers increased by eight
percent from 989 lb/MWh to 1,074 lb/MWh. As shown throughout this report, PSE delivers electricity to
customers from a combination of sources that the company owns and purchases from other providers via
firm contracts or the spot market. In 2017, 52.3% of electricity delivered to PSE customers was
generated by the company, while 47.9% of electricity was purchased via firm contracts (35.6%) and non-
firm contracts, i.e. spot market (12.1%). Of the CO2 emissions associated with electric delivery, 60.7%
were from electricity generated by PSE and 39.3% were from purchased electricity.
It’s important to remember that CO2 emissions vary based on the fuel source or technology used to
generate the electricity. Some sources are more emissions intense than others. “Intensity” is the
relationship between emissions and production. For instance, about 40.8% of the electricity generated by
PSE came from coal combustion, but this fuel source represented about 72.0% of the CO2 emissions
from electricity generated by PSE. Natural gas accounted for 35.9% of the electricity generated by PSE,
however this fuel source represented only 28.0% of the CO2 emissions from electricity generated by
PSE. Renewable power accounted for 23.2 percent of the electricity generated by PSE, and produced
zero CO2 emissions.
Compared to 2016, total electricity delivered to customers in 2017 was down by 7.6%, and total
emissions were down by 0.3%. This trend is largely due to PSE dispatching less of its owned generation
(coal, gas and renewable) with more purchased energy being delivered into PSE’s system under firm
Prepared by: Puget Sound Energy
19
contract, but less from the spot market. In addition, emissions from PSE’s owned generating sources
were down in 2017 for several reasons including: marginally less dispatch of PSE’s coal-based Colstrip
Generating Station (emissions down 3.4%); more deliveries from firm contracted resources (emission up
29.5%); less PSE gas generation (emissions down 7.6%); and less deliveries of purchased unspecified
energy (emissions down 22.7%).
In 2017, PSE purchases of electricity delivered to customers made up for less thermal generation from
the company’s owned units. Firm deliveries were up by 8.1% and unspecified deliveries (i.e. spot market)
were down by 39.2%. Firm thermal purchases come from four contracted sources: BC Hydro, BPA, BPA
WNP#3, and Centralia (“Market & Coal”). Firm deliveries from BC Hydro, BPA, BPA WNP#3, and
“Centralia Market” are assigned a system emissions rate due to a market option in the contract structure.
Firm deliveries from “Centralia Coal” are assigned a calculated rate. While unspecified purchased
electricity decreased by 39.2%, emissions from unspecified purchased electricity only decreased by
22.7% because a higher emission factor was used for the NWPP (1,004 lb/MWh in 2017 versus 895
lb/MWh in 2016) and for PSE-Firm PPA deliveries (1,092 lb/MWh in 2017 versus 1,046 lb/MWh in 2016.
8.3 Changes in Methodology
The methodology used in this year’s GHG inventory is consistent with that used to prepare the 2016 GHG
inventory with some updates in emission factors.
8.3.1 All Emissions
In the 2009 GHG inventory, the GWPs for CH4 and N2O were updated from those provided in the
Intergovernmental Panel on Climate Change (IPCC) Fourth Assessment Report - Working Group I Report
“The Physical Science Basis,” (IPCC 2007) to those provided in the GHG MRR. In 2013, the EPA revised
the GHG MRR GWP. Therefore, CH4 was updated from 23 to 25, N2O was updated from 310 to 298, and
SF6 was updated from 23,900 to 22,800 (Table A-4). There has been no change in the GHG MRR GWP
since 2013.
8.3.2 Scope I (Direct Emissions)
8.3.2.1 Electric Operations
The methodology to estimate PSE’s Scope I emissions was consistent from 2002 to 2008. The
calculation methodology was changed in the 2009 GHG inventory to align the calculation methodology to
those prescribed in the GHG MRR. The following describes the changes in the calculation methodologies
in the 2009 GHG inventory. First, the methodology to calculate CH4 and N2O emissions from the coal-
combustion generation facilities and a group of natural gas/oil generation facilities was changed from
using AP-42 emission factors, fuel consumption, and a default high heating value to using the GHG MRR
emission factors and unit-specific heat input (Table A-1, Table A-2). Also, for this group of natural gas/oil
generation facilities, the methodology to quantify CO2 emissions was changed from using AP-42 emission
factors and fuel consumption to the 40 Code of Federal Regulations (CFR) Part 75 Appendix G method,
in which hourly CO2 emissions are calculated using heat input rate measurements made with certified
Appendix D fuel flow meters together with fuel-specific, carbon-based “F-factors.” Second, the
methodology to quantify CO2, CH4, and N2O emissions for the remaining group of natural gas/oil
generation facilities was changed from using AP-42 emission factors, fuel consumption, and a default
Prepared by: Puget Sound Energy
20
high heating value to using GHG MRR emission factors, fuel consumption, and unit-specific high heating
values. This group of natural gas/oil generation facilities includes the Crystal Mountain, Fredonia 1 and 2,
Frederickson 1 and 2, and Whitehorn 2 and 3 facilities.
Beginning in 2011, PSE’s Scope I emissions have also included SF6 emissions from electricity T-D
equipment. These emissions were calculated using the GHG MRR Subpart DD calculation methodologies
(Table B-9).
In this year’s GHG inventory, there was no change in calculation methodology for Scope I electric
operations.
8.3.2.2 Natural Gas Operations
In the 2009 GHG inventory, the heating value of natural gas delivered to consumers was updated from
1,026 British thermal unit per cubic feet (Btu/ft3) to 1,027 Btu/ft
3, as provided in the Natural Gas Annual
2008 (DOE/EIA 2010a). In the 2010 GHG inventory, the heating value was updated to 1,025 Btu/ft3, as
provided in the Natural Gas Annual 2009 (DOE/EIA 2010b). In the 2011 GHG inventory, the heating value
of natural gas delivered to consumers remained unchanged. In the 2012 GHG inventory, the heating
value was updated to 1,029 Btu/ft3, as provided in the Natural Gas Annual 2011 (DOE/EIA 2013). In the
2013 GHG inventory, the heating value of natural gas delivered to consumers remained unchanged. In
the 2014 GHG inventory, the heating value was updated to 1,030 Btu/ft3, as provided in the Natural Gas
Annual 2013 (DOE/EIA 2013). The Natural Gas Annual 2014 (DOE/EIA 2014) updated the heating value
to 1,044 Btu/ft3 and was changed in the 2015 GHG inventory. In the 2016 inventory, the heating value of
natural gas was updated to 1,065 Btu/ft3 as reflected in the Natural Gas Annual 2015 (DOE/EIA 2015).
For the 2017 inventory, the heating value of natural gas was updated to 1,078 Btu/ft3 as reflected in the
Natural Gas Annual 2016 (DOE/EIA 2016, p. 52).
Beginning in 2011, the calculation methodology to estimate PSE’s Scope I emissions from natural gas
operations was changed to align to that prescribed in the GHG MRR. GHG emissions from natural gas
storage were removed, and GHG emissions from natural gas distribution were calculated using the GHG
MRR Subpart W calculation methodologies.
In this year’s GHG inventory, there was no change in calculation methodology.
8.3.2.3 Other Scope I Emissions
In the 2007 and previous GHG inventories, vehicle fleet emissions were calculated based on the vehicles’
fuel consumption and emission factors from the GHG Protocol. In 2008, vehicle fleet emissions were
calculated using the Greenhouse Gas On-Road Motor Vehicles Emissions Calculator (Ecology 2009)
developed by Ecology. The calculator provides a convenient platform to estimate GHG emissions using
fuel data. It also allows the estimation of CH4 and N2O emissions from the vehicle fleet, which could not
be quantified in the 2007 and previous inventories.
Beginning in 2009, vehicle fleet emissions were not calculated within PSE’s GHG inventory. PSE elected
not to include these emissions in the GHG inventory for two reasons. First, historically, vehicle fleet
emissions totaled approximately 0.1% of PSE’s total emissions output, which is below the de minimis
level of 2% that is recognized by the GHG Protocol. Second, the GHG MRR will account for emissions
from the transportation sector further up the production stream with a method that is more accurate than
the approach recommended by the GHG Protocol. Therefore, vehicle fleet emissions were not included to
ensure accurate and consistent reporting and avoid double counting.
Prepared by: Puget Sound Energy
21
In this year’s GHG inventory, there was no change in calculation methodology for Other Scope I
emissions.
8.3.3 Scope III (Other Indirect Emissions)
8.3.3.1 Electric Operations
The methodology used to estimate PSE’s Scope III emissions from firm contract purchased electricity has
changed over time. In the 2002 GHG inventory, the amount of electricity purchased from each source
was not available, so electricity throughput and emissions were estimated based on the relative size of
known contracts. In the 2003 GHG inventory, records of the amount of electricity purchased from each
source were available except for non-utility (Public Utility Regulatory Policies Act [PURPA]) contracts.
Only a lump sum was available for electricity purchased via PURPA contracts. This is the same as for the
2004 GHG inventory. Therefore, in the 2003 and 2004 GHG inventories, fuel-specific (e.g., coal, oil, gas)
emission factors were used to estimate emissions from non-PURPA firm contract purchased electricity.
Since the 2005 GHG inventory, detailed information regarding the source-technology for electricity
purchased via PURPA contracts was available, so this information has since been used to estimate
emissions for the inventories.
With the exception of the 2003 and 2004 GHG inventories, the methodology used to estimate PSE’s
Scope III emissions from non-firm contract purchased electricity has been consistent. In the 2002 GHG
inventory, no data on the source of non-firm contract purchased electricity were available, so the
emissions were estimated using national average emission factors. In the 2003 and 2004 GHG
inventories, data on the source of non-firm contract purchased electricity were available, so fuel-specific
emission factors were used to estimate emissions. Since the 2005 GHG inventory, no data on the source
of non-firm contract purchased electricity were available. As a result, the Western Electricity Coordinating
Council (WECC) regional average emission factor (Table 6-5) was used to estimate emissions. It is
assumed that the same data will be available in the future, so future emission inventories should continue
to use the WECC regional emission factor or equivalent to calculate emissions associated with non-firm
contracts. This will produce consistency in the calculation methodology and make results more
comparable over time.
In the 2004 inventory, the accounting of purchased electricity for resale included a slightly modified
approach. The 2002 through 2003 and 2005 through 2009 GHG inventories all used the same
methodology for purchased electricity for resale.
In the 2007 inventory, the eGRID emission factor for calculating emissions from firm and non-firm contract
purchases was updated. Specifically, the eGRID emission factor for CO2 emissions was updated from
1.027 lb/MWh for the WECC subregion in EPA Sixth Edition eGRID2007 Version 1.0 (EPA 2008a) to
0.902 lb/MWh for the Northwest Power Pool (NWPP) WECC Northwest subregion in EPA eGRID2007
Version 1.1 (EPA 2008b).
In the 2010 GHG inventory, the heat rates used to calculate emission factors for firm and non-firm
contracts purchased electricity were updated. The heat rates were updated from: 9,425 Btu/kWh to 9,200
Btu/kWh for coal, 11,700 Btu/kWh to 10,788 Btu/kWh for semi-closed gas turbine (SCGT), 6,900 Btu/kWh
to 6,752 Btu/kWh for combined cycle gas turbine (CCGT), 14,500 Btu/kWh to 9,451 Btu/kWh for biomass,
and 11,700 Btu/kWh to 10,788 Btu/kWh for petroleum.
Prepared by: Puget Sound Energy
22
In the 2011 GHG inventory, the eGRID emission factor for CO2 emissions was updated to 0.859 lb/MWh
for the NWPP WECC Northwest subregion in EPA Seventh Edition eGRID2010 Version 1.0 (EPA 2011).
In the 2012 GHG inventory, the eGRID emission factor for CO2 emissions was updated to 0.819 lb/MWh
for the NWPP WECC Northwest subregion in EPA Eighth Edition eGRID2012 Version 1.0 (EPA 2012).
Also, the heat rates used to calculate emission factors for firm and non-firm contracts purchased
electricity were updated. The heat rates were updated from: 9,200 Btu/kWh to 8,800 Btu/kWh for coal,
10,788 Btu/kWh to 10,745 Btu/kWh for SCGT, 6,752 Btu/kWh to 6,430 Btu/kWh for CCGT, 9,451
Btu/kWh to 13,500 Btu/kWh for biomass, and 10,788 Btu/kWh to 10,745 Btu/kWh for petroleum.
In the 2013 GHG inventory, the eGRID emission factor for CO2 emissions was updated to 0.843 lb/MWh
for the NWPP WECC Northwest subregion in EPA Ninth Edition eGRID Version 1.0 (EPA 2014a).
In the 2014 inventory, the eGRID emission factor for CO2 emissions was updated to 0.666 lb/MWh for the
NWPP WECC Northwest subregion in EPA eGRID2012 (EPA 2015a). Also, the heat rates used to
calculate emission factors for firm and non-firm contracts purchased electricity were updated. The heat
rates were updated from: 10,745 Btu/kWh to 10,783 Btu/kWh for SCGT and 10,745 Btu/kWh to 10,783
Btu/kWh for petroleum.
In the 2016 inventory, the CO2 eGRID emission factor was updated to 0.907 lb/kWh for the NWPP WECC
Northwest subregion in EPA eGRID (EPA 2017). Heat rates in the 2016 Assumptions to the Annual
Energy Outlook (EIA 2016) were updated from: 10,783 Btu/kWh to 9,960 Btu/kWh for SCGT, 6,430
Btu/kWh to 6,300 Btu/kWh for CCGT, and 10,783 Btu/kWh to 9,960 Btu/kWh for petroleum.
For the 2017 inventory, the CO2 grid emission factor was updated to 1,004 lb/MWh for the WECC NWPP
subregion as published by Commerce. Heat rates in the 2017 Assumptions to the Annual Energy Outlook
(EIA 2017, Table 8.2) were updated to: 9,920 Btu/kWh for SCGT, 6,600 Btu/kWh for CCGT, and 9,920
Btu/kWh for petroleum.
8.3.3.2 Natural Gas Supply
PSE’s Scope III emissions associated with natural gas supply include CO2 emissions that would result
from the complete use of natural gas provided to end-users on their distribution systems. This source of
emissions was included in the GHG inventory for the first time in 2010.
In this year’s GHG inventory, there was no change in calculation methodology for Scope III natural gas
supply.
Prepared by: Puget Sound Energy
23
9.0 CONSERVATION PROGRAMS AND GHG EMISSIONS AVOIDED
PSE operates a variety of electric and natural gas conservation programs, which result in significant
reductions in demand on electric and natural gas resources. A summary of the programs is included in
Table 9-1. These programs led to an estimated savings of 309,932,000 kWh of electricity and 3,527,457
therms of natural gas in 2016. According to PSE Aurora modeling for resource planning purposes, any
conserved electricity would most likely be replaced by a marginal plant. A marginal plant in the NWPP is a
CCGT rated at approximately 7,000 Btu/kWh.
Using this assumption, these electric conservation measures amounted to avoided emissions of over
103,603 metric tons of CO2, 0.25 metric tons of CH4, and 0.21 metric tons of N2O in 2017. PSE’s natural
gas conservation measures amounted to an avoidance of emissions of approximately 5,975 metric tons
of CH4 in 2017.
Prepared by: Puget Sound Energy
24
10.0 REFERENCES
Bank of America, Calpine, Entergy, Exelon, Ceres, Tenaska and the Natural Resources Defense Council
(NRDC). 2017. Benchmarking Air Emissions of the 100 Largest Electric Power Producers in the
United States. June.
Intergovernmental Panel on Climate Change (IPCC). 2007. IPCC Fourth Assessment Report - Working
Group I Report "The Physical Science Basis."
Puget Energy. 2017. Form 10-K Annual Report. December.
State of Washington. 2008. Engrossed Second Substitute House Bill 2815. 2008 Regular Session.
State of Washington. 2010. Substitute Senate Bill 6373. January.
United States Department of Energy, Energy Information Administration (DOE/EIA). 2002. Updated State-
level Greenhouse Gas Emission Coefficients for Electricity Generation 1998-2000. April.
United States Department of Energy, Energy Information Administration (DOE/EIA). 2011. Voluntary
Reporting of Greenhouse Gases Program – Fuel and Energy Source Codes and Emission
Coefficients. March.
United States Department of Energy, Energy Information Administration (DOE/EIA). 2010a. Natural Gas
Annual 2008. March.
United States Department of Energy, Energy Information Administration (DOE/EIA). 2010b. Natural Gas
Annual 2009. December.
United States Department of Energy, Energy Information Administration (DOE/EIA). 2013. Natural Gas
Annual 2011. February.
United States Department of Energy, Energy Information Administration (DOE/EIA). 2014. Natural Gas
Annual 2014. February.
United States Department of Energy, Energy Information Administration (DOE/EIA). 2015. Natural Gas
Annual 2015. September.
United States Department of Energy/United States Environmental Protection Agency (DOE/EPA). 2000.
Carbon Dioxide Emissions from the Generation of Electric Power in the United States. July.
United States Environmental Protection Agency (EPA). 2008a. Sixth Edition eGRID2007 Version 1.0.
October.
United States Environmental Protection Agency (EPA). 2008b. Sixth Edition eGRID2007 Version 1.1.
December.
United States Environmental Protection Agency (EPA). 2009. Greenhouse Gas Mandatory Reporting
Rule. October.
United States Environmental Protection Agency (EPA). 2011. Seventh Edition eGRID2010 Version 1.0.
February.
Prepared by: Puget Sound Energy
25
United States Environmental Protection Agency (EPA). 2012. Eighth Edition eGRID2012 Version 1.0.
May.
United States Environmental Protection Agency (EPA). 2014a. Ninth Edition eGRID Version 1.0.
February.
United States Environmental Protection Agency (EPA). 2014b. Greenhouse Gas Mandatory Reporting
Rule. December.
United States Environmental Protection Agency (EPA). 2015a. Ninth Edition eGRID2012. October.
United States Environmental Protection Agency (EPA). 2017. Tenth Edition eGRID2014v2. February.
United States Environmental Protection Agency (EPA). 2015b. GHG MRR Subpart A (40 CFR 98.9),
Table A-1.
Washington State Department of Ecology (Ecology). 2009. Greenhouse Gas On-Road Motor Vehicles
Emissions Calculator. January.
World Resources Institute/World Business Council for Sustainable Development (WRI/WBCSD). 2004.
Greenhouse Gas Protocol – A Corporate Accounting and Reporting Standard, Revised Edition.
April.
Puget Sound Energy
2017 Greenhouse Gas Inventory
Tables and Figures
TablesExecutive Summary
Table ES-1 Calendar Year 2017 Operating Rates
Table ES-2 Calendar Year 2017 Greenhouse Gas Emissions by Scope
Table ES-3 Calendar Year 2017 Greenhouse Gas Emissions by Source
Section 4.0 Boundaries and Sources
Table 4-1 Calendar Year 2017 Sources of Emissions Accounted
Section 6.0 GHG Emissions
Table 6-1 Total Emissions by Scope
Table 6-2 Total Emissions by Scope in CO2 Equivalents (CO2e)
Table 6-3 Emissions from PSE-Owned Electric Operations
Table 6-4 Emissions from PSE-Owned Natural Gas Operations
Table 6-5 Emissions from Non-Firm Contract Purchased Electricity
Table 6-6 Detailed Emissions Calculations
Section 7.0 Sources and Uncertainties of GHG Emissions
Table 7-1 Total Emissions by Source
Table 7-2 Total Emissions by Source in CO2 Equivalents (CO2e)
Section 9.0 Conservation Programs and GHG Emissions Avoided
Table 9-1 Emissions Avoided
Supporting Calculations
Table A-1 Emissions from PSE-Owned Electric Operations: Colstrip
Table A-2 Emissions from PSE-Owned Electric Operations: Natural Gas/ Petroleum
Table A-3 Emission Factors for Firm & Non-Firm Contracts Purchased Electricity
Table A-4 Global Warming Potentials
EPA GHG MRR Emission Calculations
Table B-1 EPA GHG MRR Subpart A - General Provisions
Table B-2 EPA GHG MRR Subpart C - General Stationary Fuel Combustion Sources
Table B-3 EPA GHG MRR Subpart D - Electricity Generation
Table B-4 EPA GHG MRR Subpart W - Petroleum and Natural Gas Systems
Table B-5 EPA GHG MRR Subpart DD - Electrical Transmission and Distribution Equipment Use
Table B-6 EPA GHG MRR Subpart NN - Suppliers of Natural Gas and Natural Gas Liquids
Table B-7 EPA GHG MRR Subpart C Calculations
Table B-8 EPA GHG MRR Subpart W Calculations
Table B-9 EPA GHG MRR Subpart DD Calculations
Table B-10 EPA GHG MRR Subpart NN Calculations
FiguresSection 7.0 Sources and Uncertainties of GHG Emissions
Figure 7-1 Total Electricity and its CO2 Emissions
Figure 7-2 Total Electricity by Generation Source and its CO2 Emissions
Figure 7-3 PSE-Generated Electricity by Generation Source and its CO2 Emissions
Figure 7-4 Firm Contract Purchased Electricity and its CO2 Emissions
Figure 7-5 PSE-Generated and Firm Contract Purchased Electricity by Generation Source and its CO2 Emissions
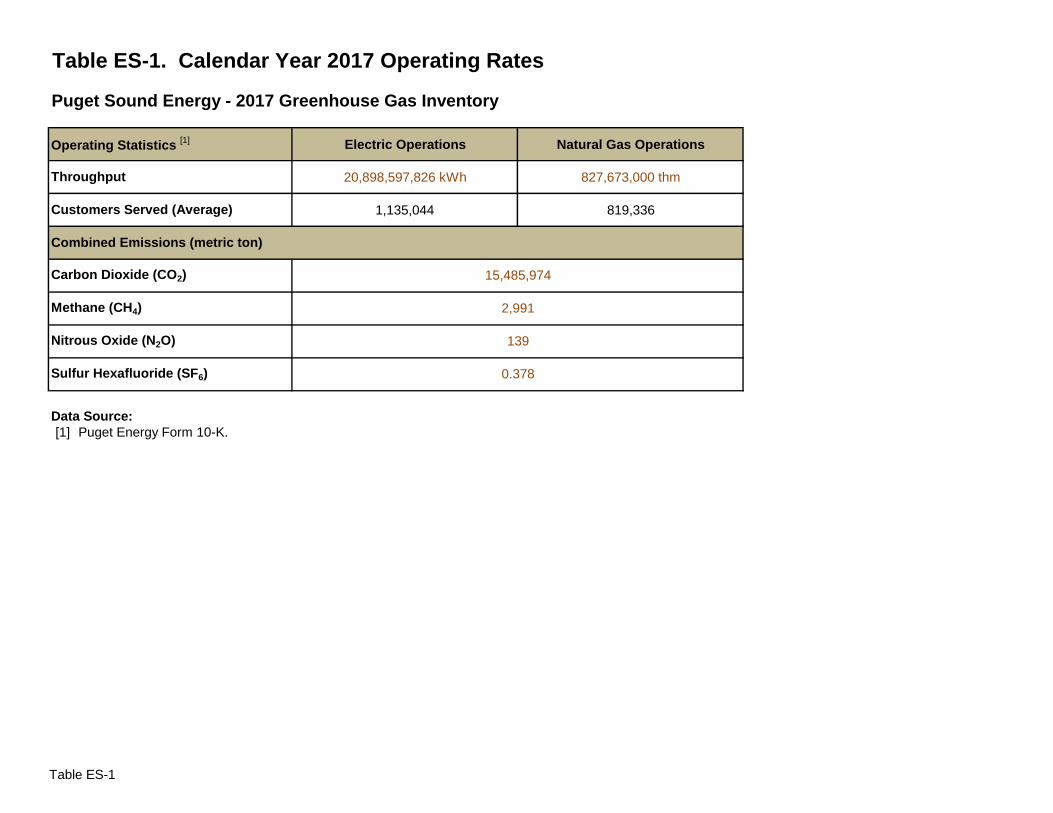
Table ES-1. Calendar Year 2017 Operating Rates
Puget Sound Energy - 2017 Greenhouse Gas Inventory
Electric Operations Natural Gas Operations
20,898,597,826 kWh 827,673,000 thm
1,135,044 819,336
Data Source:
[1] Puget Energy Form 10-K.
Sulfur Hexafluoride (SF6)
Combined Emissions (metric ton)
15,485,974
2,991
139
0.378
Methane (CH4)
Operating Statistics [1]
Throughput
Customers Served (Average)
Carbon Dioxide (CO2)
Nitrous Oxide (N2O)
Table ES-1

Table ES-2. Calendar Year 2017 Greenhouse Gas Emissions by Scope
Puget Sound Energy - 2017 Greenhouse Gas Inventory
Amount (UOM) CO2 (UOM) CH4 (UOM) N2O (UOM) SF6 (UOM)
(metric ton) (%) (3) (metric ton) (%)
(3) (metric ton) (%) (3) (metric ton) (%)
(3)
Scope I
Electric Operations
Hydro 864,821,270 kWh 0 0% 0 0% 0 0% 0 0% 0 lb/kWh 0 lb/kWh 0 lb/kWh 0 lb/kWh
Coal 4,463,705,000 kWh 4,452,203 72.0% 507 17% 74 96% 0 0% 2.2 lb/kWh 2.5E-04 lb/kWh 3.6E-05 lb/kWh 0 lb/kWh
Natural Gas/ Oil 3,924,293,418 kWh 1,729,228 28% 32 1% 3.2 4% 0 0% 1.0 lb/kWh 1.8E-05 lb/kWh 1.8E-06 lb/kWh 0 lb/kWh
Wind 1,674,790,351 kWh 0 0% 0 0% 0 0% 0 0% 0 lb/kWh 0 lb/kWh 0 lb/kWh 0 lb/kWh
Electrical Transmission and Distribution Equipment 0 kWh 0 0% 0 0% 0 0% 0.38 100% NC NC NC NC
Total Scope I - PSE-owned Electric Operations 10,927,610,039 kWh 6,181,430 100% 539 18% 77 100% 0.38 100% 1.2 lb/kWh 1.1E-04 lb/kWh 1.6E-05 lb/kWh 7.6E-08 lb/kWh
Natural Gas Operations
Distribution 827,673,000 thm 73 0% 2,420 82% 0 0% 0 NC 0 lb/thm 6.4E-03 lb/thm 0 lb/thm 0 lb/thm
Total Scope I - PSE-owned Natural Gas Operations 827,673,000 thm 73 0% 2,420 82% 0 0% 0 NC 0 lb/thm 6.4E-03 lb/thm 0 lb/thm 0 lb/thm
Total Scope I 6,181,503 100% 2,959 100% 77 100% 0.38 100%
Scope III
Electric Operations
Firm Contracts 7,436,664,869 kWh 2,917,068 31% 19 60% 40 65% 0 NC 0.9 lb/kWh 5.7E-06 lb/kWh 1.2E-05 lb/kWh 0 lb/kWh
Non-Firm Contracts (1) 2,534,322,918 kWh 1,078,342 12% 13 40% 22 35% 0 NC 0.9 lb/kWh 1.1E-05 lb/kWh 1.9E-05 lb/kWh 0 lb/kWh
Total Scope III - Electricity Purchases 9,970,987,787 kWh 3,995,410 43% 32 100% 62 100% 0 NC 0.9 lb/kWh 7.1E-06 lb/kWh 1.4E-05 lb/kWh 0 lb/kWh
Natural Gas Supply
Supply to End-Users 975,930,338 thm 5,309,061 57% 0 0% 0 0% 0 NC 12 lb/thm 0 lb/thm 0 lb/thm 0 lb/thm
Total Scope III - Natural Gas Supply 975,930,338 thm 5,309,061 57% 0 0% 0 0% 0 NC 12 lb/thm 0 lb/thm 0 lb/thm 0 lb/thm
Total Scope III 9,304,471 100% 32 100% 62 100% 0 NC
Outside Scope
Non-Firm Transport Gas 23,657,800 Mscf 1,286,984 100% 0 NC 0 NC 0 NC 0 NC 0 NC 0 NC 0 NC
Total Outside Scope - Non-Firm Transport Gas 23,657,800 Mscf 1,286,984 NC 0 NC 0 NC 0 NC 0 NC 0 NC 0 NC 0 NC
Note(s):
(1) Non-firm contract purchases do not include "Book Outs" under EITF Issue 03-11.
(2) Consistent with the GHG Protocol, only CO2 is accounted separately for biomass generation.
(3) Percentage of emissions in scope.
(4) NC = Not calculated.
Emission Source
Energy Emissions Emission Intensity
CO2 CH4 N2O SF6
Table ES-2
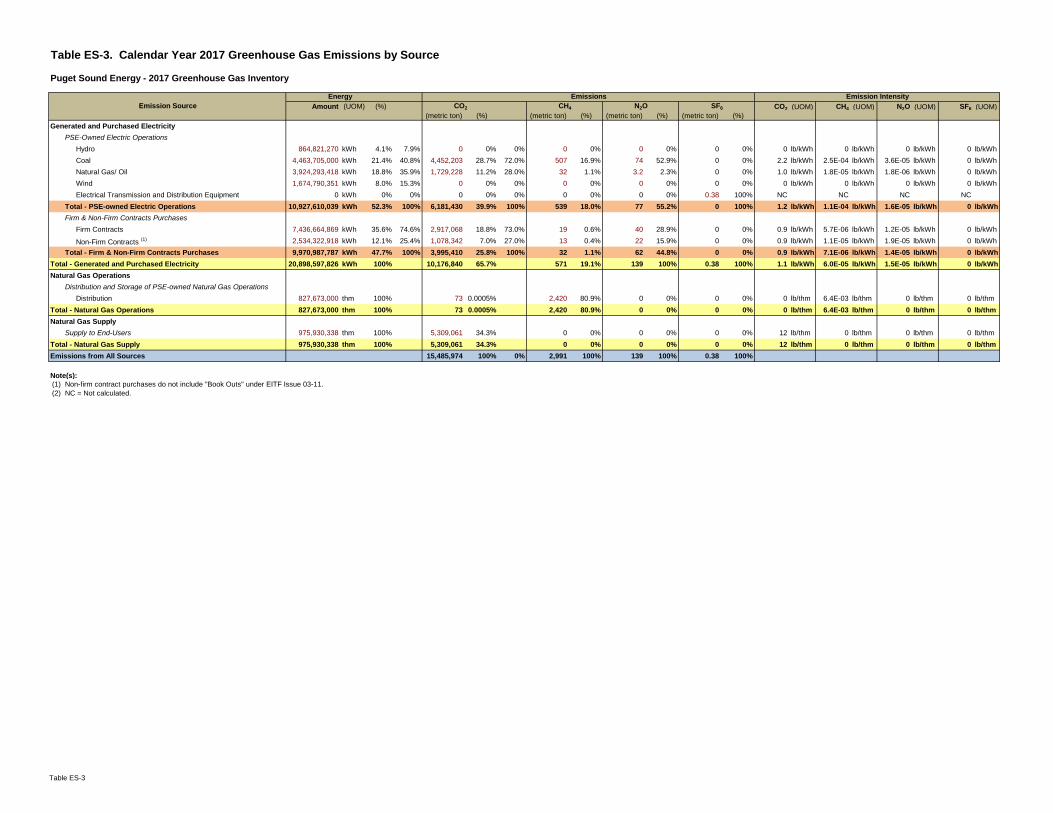
Table ES-3. Calendar Year 2017 Greenhouse Gas Emissions by Source
Puget Sound Energy - 2017 Greenhouse Gas Inventory
Amount (UOM) (%) CO2 (UOM) CH4 (UOM) N2O (UOM) SF6 (UOM)
(metric ton) (%) (metric ton) (%) (metric ton) (%) (metric ton) (%)
Generated and Purchased Electricity
PSE-Owned Electric Operations
Hydro 864,821,270 kWh 4.1% 7.9% 0 0% 0% 0 0% 0 0% 0 0% 0 lb/kWh 0 lb/kWh 0 lb/kWh 0 lb/kWh
Coal 4,463,705,000 kWh 21.4% 40.8% 4,452,203 28.7% 72.0% 507 16.9% 74 52.9% 0 0% 2.2 lb/kWh 2.5E-04 lb/kWh 3.6E-05 lb/kWh 0 lb/kWh
Natural Gas/ Oil 3,924,293,418 kWh 18.8% 35.9% 1,729,228 11.2% 28.0% 32 1.1% 3.2 2.3% 0 0% 1.0 lb/kWh 1.8E-05 lb/kWh 1.8E-06 lb/kWh 0 lb/kWh
Wind 1,674,790,351 kWh 8.0% 15.3% 0 0% 0% 0 0% 0 0% 0 0% 0 lb/kWh 0 lb/kWh 0 lb/kWh 0 lb/kWh
Electrical Transmission and Distribution Equipment 0 kWh 0% 0% 0 0% 0% 0 0% 0 0% 0.38 100% NC NC NC NC
Total - PSE-owned Electric Operations 10,927,610,039 kWh 52.3% 100% 6,181,430 39.9% 100% 539 18.0% 77 55.2% 0 100% 1.2 lb/kWh 1.1E-04 lb/kWh 1.6E-05 lb/kWh 0 lb/kWh
Firm & Non-Firm Contracts Purchases
Firm Contracts 7,436,664,869 kWh 35.6% 74.6% 2,917,068 18.8% 73.0% 19 0.6% 40 28.9% 0 0% 0.9 lb/kWh 5.7E-06 lb/kWh 1.2E-05 lb/kWh 0 lb/kWh
Non-Firm Contracts (1) 2,534,322,918 kWh 12.1% 25.4% 1,078,342 7.0% 27.0% 13 0.4% 22 15.9% 0 0% 0.9 lb/kWh 1.1E-05 lb/kWh 1.9E-05 lb/kWh 0 lb/kWh
Total - Firm & Non-Firm Contracts Purchases 9,970,987,787 kWh 47.7% 100% 3,995,410 25.8% 100% 32 1.1% 62 44.8% 0 0% 0.9 lb/kWh 7.1E-06 lb/kWh 1.4E-05 lb/kWh 0 lb/kWh
Total - Generated and Purchased Electricity 20,898,597,826 kWh 100% 10,176,840 65.7% 571 19.1% 139 100% 0.38 100% 1.1 lb/kWh 6.0E-05 lb/kWh 1.5E-05 lb/kWh 0 lb/kWh
Natural Gas Operations
Distribution and Storage of PSE-owned Natural Gas Operations
Distribution 827,673,000 thm 100% 73 0.0005% 2,420 80.9% 0 0% 0 0% 0 lb/thm 6.4E-03 lb/thm 0 lb/thm 0 lb/thm
Total - Natural Gas Operations 827,673,000 thm 100% 73 0.0005% 2,420 80.9% 0 0% 0 0% 0 lb/thm 6.4E-03 lb/thm 0 lb/thm 0 lb/thm
Natural Gas Supply
Supply to End-Users 975,930,338 thm 100% 5,309,061 34.3% 0 0% 0 0% 0 0% 12 lb/thm 0 lb/thm 0 lb/thm 0 lb/thm
Total - Natural Gas Supply 975,930,338 thm 100% 5,309,061 34.3% 0 0% 0 0% 0 0% 12 lb/thm 0 lb/thm 0 lb/thm 0 lb/thm
Emissions from All Sources 15,485,974 100% 0% 2,991 100% 139 100% 0.38 100%
Note(s):
(1) Non-firm contract purchases do not include "Book Outs" under EITF Issue 03-11.
(2) NC = Not calculated.
Emission Source
Energy Emissions Emission Intensity
CO2 CH4 N2O SF6
Table ES-3
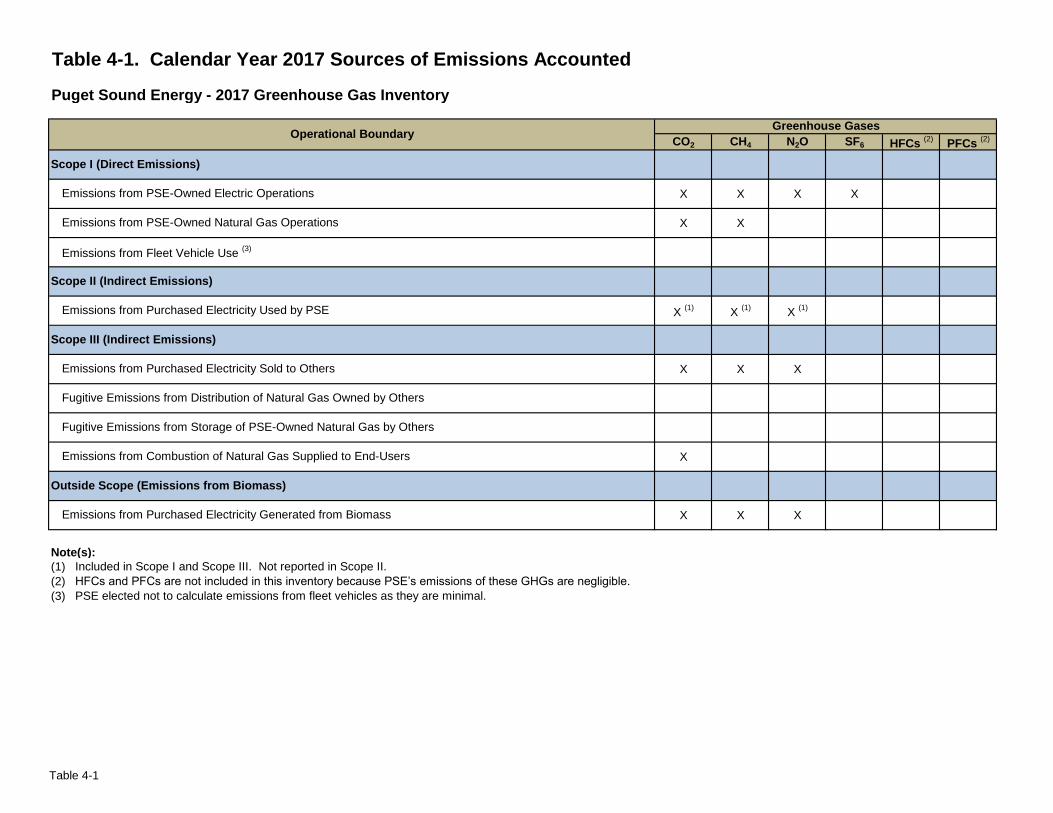
Table 4-1. Calendar Year 2017 Sources of Emissions Accounted
Puget Sound Energy - 2017 Greenhouse Gas Inventory
CO2 CH4 N2O SF6 HFCs (2)
PFCs (2)
X X X X
X X
X (1)
X (1)
X (1)
X X X
X
X X X
Note(s):
(1) Included in Scope I and Scope III. Not reported in Scope II.
(2) HFCs and PFCs are not included in this inventory because PSE’s emissions of these GHGs are negligible.
(3) PSE elected not to calculate emissions from fleet vehicles as they are minimal.
Greenhouse Gases
Emissions from PSE-Owned Natural Gas Operations
Emissions from Fleet Vehicle Use (3)
Scope II (Indirect Emissions)
Emissions from Purchased Electricity Generated from Biomass
Operational Boundary
Emissions from Purchased Electricity Used by PSE
Scope III (Indirect Emissions)
Emissions from Purchased Electricity Sold to Others
Fugitive Emissions from Distribution of Natural Gas Owned by Others
Fugitive Emissions from Storage of PSE-Owned Natural Gas by Others
Outside Scope (Emissions from Biomass)
Scope I (Direct Emissions)
Emissions from PSE-Owned Electric Operations
Emissions from Combustion of Natural Gas Supplied to End-Users
Table 4-1
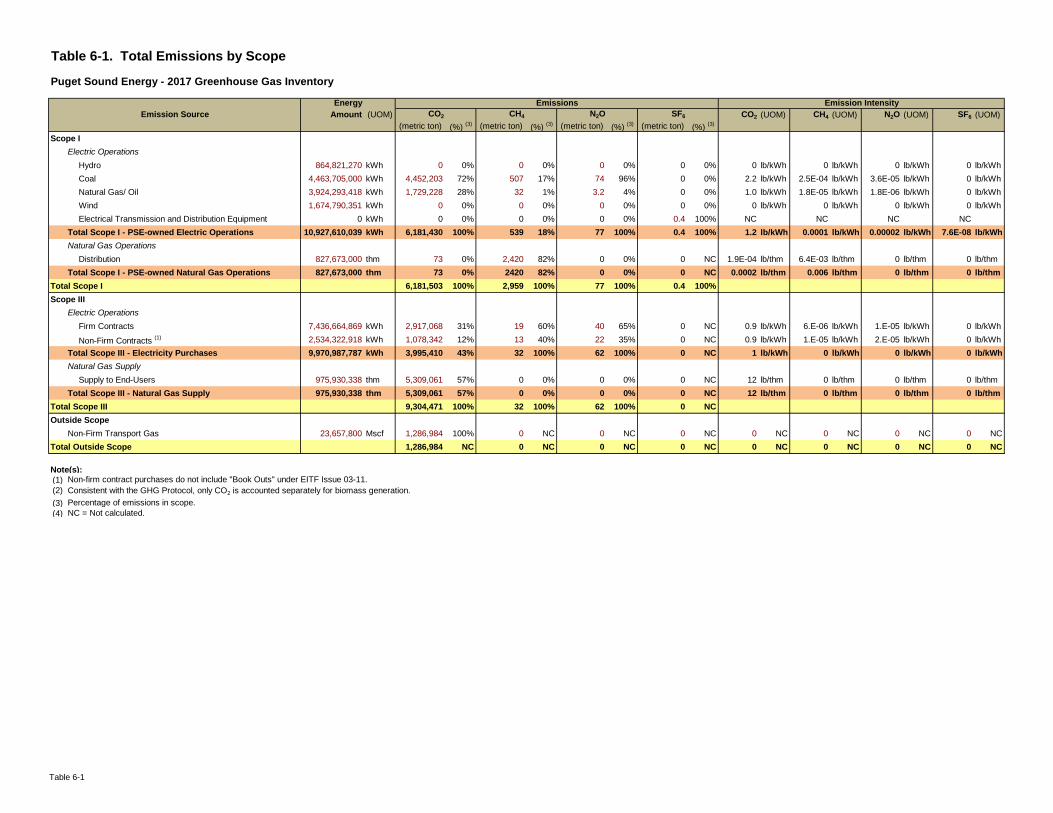
Table 6-1. Total Emissions by Scope
Puget Sound Energy - 2017 Greenhouse Gas Inventory
Amount (UOM) CO2 (UOM) CH4 (UOM) N2O (UOM) SF6 (UOM)
(metric ton) (%) (3) (metric ton) (%)
(3) (metric ton) (%) (3) (metric ton) (%)
(3)
Scope I
Electric Operations
Hydro 864,821,270 kWh 0 0% 0 0% 0 0% 0 0% 0 lb/kWh 0 lb/kWh 0 lb/kWh 0 lb/kWh
Coal 4,463,705,000 kWh 4,452,203 72% 507 17% 74 96% 0 0% 2.2 lb/kWh 2.5E-04 lb/kWh 3.6E-05 lb/kWh 0 lb/kWh
Natural Gas/ Oil 3,924,293,418 kWh 1,729,228 28% 32 1% 3.2 4% 0 0% 1.0 lb/kWh 1.8E-05 lb/kWh 1.8E-06 lb/kWh 0 lb/kWh
Wind 1,674,790,351 kWh 0 0% 0 0% 0 0% 0 0% 0 lb/kWh 0 lb/kWh 0 lb/kWh 0 lb/kWh
Electrical Transmission and Distribution Equipment 0 kWh 0 0% 0 0% 0 0% 0.4 100% NC NC NC NC
Total Scope I - PSE-owned Electric Operations 10,927,610,039 kWh 6,181,430 100% 539 18% 77 100% 0.4 100% 1.2 lb/kWh 0.0001 lb/kWh 0.00002 lb/kWh 7.6E-08 lb/kWh
Natural Gas Operations
Distribution 827,673,000 thm 73 0% 2,420 82% 0 0% 0 NC 1.9E-04 lb/thm 6.4E-03 lb/thm 0 lb/thm 0 lb/thm
Total Scope I - PSE-owned Natural Gas Operations 827,673,000 thm 73 0% 2420 82% 0 0% 0 NC 0.0002 lb/thm 0.006 lb/thm 0 lb/thm 0 lb/thm
Total Scope I 6,181,503 100% 2,959 100% 77 100% 0.4 100%
Scope III
Electric Operations
Firm Contracts 7,436,664,869 kWh 2,917,068 31% 19 60% 40 65% 0 NC 0.9 lb/kWh 6.E-06 lb/kWh 1.E-05 lb/kWh 0 lb/kWh
Non-Firm Contracts (1) 2,534,322,918 kWh 1,078,342 12% 13 40% 22 35% 0 NC 0.9 lb/kWh 1.E-05 lb/kWh 2.E-05 lb/kWh 0 lb/kWh
Total Scope III - Electricity Purchases 9,970,987,787 kWh 3,995,410 43% 32 100% 62 100% 0 NC 1 lb/kWh 0 lb/kWh 0 lb/kWh 0 lb/kWh
Natural Gas Supply
Supply to End-Users 975,930,338 thm 5,309,061 57% 0 0% 0 0% 0 NC 12 lb/thm 0 lb/thm 0 lb/thm 0 lb/thm
Total Scope III - Natural Gas Supply 975,930,338 thm 5,309,061 57% 0 0% 0 0% 0 NC 12 lb/thm 0 lb/thm 0 lb/thm 0 lb/thm
Total Scope III 9,304,471 100% 32 100% 62 100% 0 NC
Outside Scope
Non-Firm Transport Gas 23,657,800 Mscf 1,286,984 100% 0 NC 0 NC 0 NC 0 NC 0 NC 0 NC 0 NC
Total Outside Scope 1,286,984 NC 0 NC 0 NC 0 NC 0 NC 0 NC 0 NC 0 NC
Note(s):
(1) Non-firm contract purchases do not include "Book Outs" under EITF Issue 03-11.
(2) Consistent with the GHG Protocol, only CO2 is accounted separately for biomass generation.
(3) Percentage of emissions in scope.
(4) NC = Not calculated.
Emission IntensityEnergy Emissions
Emission Source CO2 CH4 N2O SF6
Table 6-1

Table 6-2. Total Emissions by Scope in CO2 Equivalents (CO2e)
Puget Sound Energy - 2017 Greenhouse Gas Inventory
Amount (UOM) Total (UOM)
(metric ton) (%) (3) (metric ton) (%)
(3) (metric ton) (%) (3) (metric ton) (%)
(3) (metric ton) (%) (3)
Scope I
Electric Operations
Hydro 864,821,270 kWh 0 0% 0 0% 0 0% 0 0% 0 0% 0 lb/kWh
Coal 4,463,705,000 kWh 4,452,203 71% 507 0.0% 74 0.0% 0 0% 4,452,783 71% 2.2 lb/kWh
Natural Gas/ Oil 3,924,293,418 kWh 1,729,228 28% 32 0.00% 3 0.00% 0 0% 1,729,263 28% 1.0 lb/kWh
Wind 1,674,790,351 kWh 0 0% 0 0% 0 0% 0 0% 0 0% 0 lb/kWh
Electrical Transmission and Distribution Equipment 0 kWh 0 0% 0 0% 0 0% 8,625 0.1% 8,625 0.1% NC
Total Scope I - PSE-owned Electric Operations 10,927,610,039 kWh 6,181,430 99% 539 0.0% 77 0.0% 8,625 0.1% 6,190,671 99% 1.2 lb/kWh
Natural Gas Operations
Distribution 827,673,000 thm 73 0.001% 60,510 1.0% 0 0% 0 0% 60,583 1.0% 0.2 lb/thm
Total Scope I - PSE-owned Natural Gas Operations 827,673,000 thm 73 0.001% 60,510 1.0% 0 0% 0 0% 60,583 1.0% 0.2 lb/thm
Total Scope I 6,181,503 99% 61,049 1.0% 77 0.0% 8,625 0.1% 6,251,254 100%
Scope III
Electric Operations
Firm Contracts 7,436,664,869 kWh 2,917,068 31% 19 0.00% 40 0.0% 0 0% 2,917,128 31% 0.9 lb/kWh
Non-Firm Contracts (1) 2,534,322,918 kWh 1,078,342 12% 13 0.00% 22 0.0% 0 0% 1,078,377 12% 0.9 lb/kWh
Total Scope III - Electricity Purchases 9,970,987,787 kWh 3,995,410 43% 32 0.00% 62 0.0% 0 0% 3,995,505 43% 0.9 lb/kWh
Natural Gas Supply
Supply to End-Users 975,930,338 thm 5,309,061 57% 0 0% 0 0% 0 0% 5,309,061 57% 12.0 lb/thm
Total Scope III - Natural Gas Supply 975,930,338 thm 5,309,061 57% 0 0% 0 0% 0 0% 5,309,061 57% 12.0 lb/thm
Total Scope III 9,304,471 100% 32 0.00% 62 0.0% 0 0% 9,304,566 100%
Outside Scope
Non-Firm Transport Gas 23,657,800 Mscf 1,286,984 NC 0 NC 0 NC 0 NC 0 NC 0.0 NC
Total Outside Scope 1,286,984 NC 0 NC 0 NC 0 NC 0 NC 0 NC
Data Source: Global Warming Potentials [1]
:
[1] EPA GHG MRR Subpart A (40 CFR 98), Table A-1 (EPA 2015).
CO2 CH4 N2O SF6
Note(s): 1 25 298 22,800
(1) Non-firm contract purchases do not include "Book Outs" under EITF Issue 03-11.
(2) Consistent with the GHG Protocol, only CO2 is accounted separately for biomass generation.
(3) Percentage of emissions in CO2e in scope.
(4) NC = Not calculated.
Time Horizon
100 years
Emission Source
Energy Emission Intensity
CO2 CH4 N2O SF6 Total
Emissions in CO2 Equivalents (CO2e) - 100-Year Timeframe (Tons)
Table 6-2
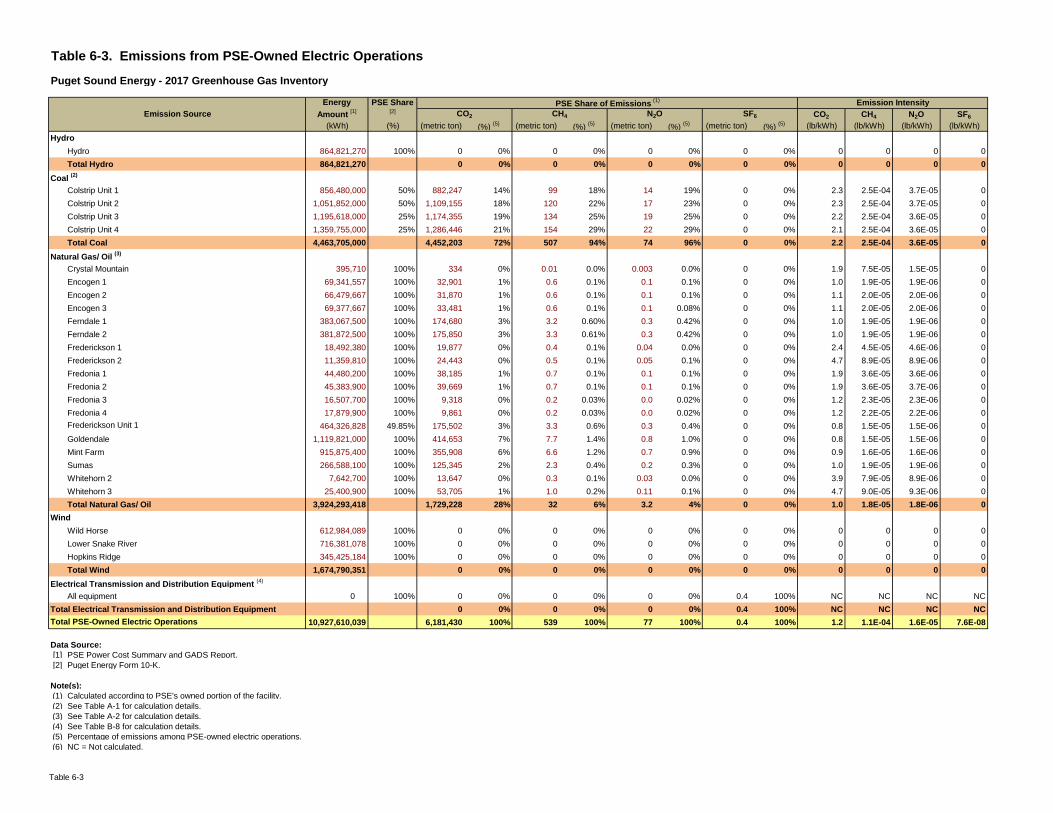
Table 6-3. Emissions from PSE-Owned Electric Operations
Puget Sound Energy - 2017 Greenhouse Gas Inventory
CO2 CH4 N2O SF6
(kWh) (%) (metric ton) (%) (5) (metric ton) (%)
(5) (metric ton) (%) (5) (metric ton) (%)
(5) (lb/kWh) (lb/kWh) (lb/kWh) (lb/kWh)
Hydro
Hydro 864,821,270 100% 0 0% 0 0% 0 0% 0 0% 0 0 0 0
Total Hydro 864,821,270 0 0% 0 0% 0 0% 0 0% 0 0 0 0
Coal (2)
Colstrip Unit 1 856,480,000 50% 882,247 14% 99 18% 14 19% 0 0% 2.3 2.5E-04 3.7E-05 0
Colstrip Unit 2 1,051,852,000 50% 1,109,155 18% 120 22% 17 23% 0 0% 2.3 2.5E-04 3.7E-05 0
Colstrip Unit 3 1,195,618,000 25% 1,174,355 19% 134 25% 19 25% 0 0% 2.2 2.5E-04 3.6E-05 0
Colstrip Unit 4 1,359,755,000 25% 1,286,446 21% 154 29% 22 29% 0 0% 2.1 2.5E-04 3.6E-05 0
Total Coal 4,463,705,000 4,452,203 72% 507 94% 74 96% 0 0% 2.2 2.5E-04 3.6E-05 0
Natural Gas/ Oil (3)
Crystal Mountain 395,710 100% 334 0% 0.01 0.0% 0.003 0.0% 0 0% 1.9 7.5E-05 1.5E-05 0
Encogen 1 69,341,557 100% 32,901 1% 0.6 0.1% 0.1 0.1% 0 0% 1.0 1.9E-05 1.9E-06 0
Encogen 2 66,479,667 100% 31,870 1% 0.6 0.1% 0.1 0.1% 0 0% 1.1 2.0E-05 2.0E-06 0
Encogen 3 69,377,667 100% 33,481 1% 0.6 0.1% 0.1 0.08% 0 0% 1.1 2.0E-05 2.0E-06 0
Ferndale 1 383,067,500 100% 174,680 3% 3.2 0.60% 0.3 0.42% 0 0% 1.0 1.9E-05 1.9E-06 0
Ferndale 2 381,872,500 100% 175,850 3% 3.3 0.61% 0.3 0.42% 0 0% 1.0 1.9E-05 1.9E-06 0
Frederickson 1 18,492,380 100% 19,877 0% 0.4 0.1% 0.04 0.0% 0 0% 2.4 4.5E-05 4.6E-06 0
Frederickson 2 11,359,810 100% 24,443 0% 0.5 0.1% 0.05 0.1% 0 0% 4.7 8.9E-05 8.9E-06 0
Fredonia 1 44,480,200 100% 38,185 1% 0.7 0.1% 0.1 0.1% 0 0% 1.9 3.6E-05 3.6E-06 0
Fredonia 2 45,383,900 100% 39,669 1% 0.7 0.1% 0.1 0.1% 0 0% 1.9 3.6E-05 3.7E-06 0
Fredonia 3 16,507,700 100% 9,318 0% 0.2 0.03% 0.0 0.02% 0 0% 1.2 2.3E-05 2.3E-06 0
Fredonia 4 17,879,900 100% 9,861 0% 0.2 0.03% 0.0 0.02% 0 0% 1.2 2.2E-05 2.2E-06 0
Frederickson Unit 1 464,326,828 49.85% 175,502 3% 3.3 0.6% 0.3 0.4% 0 0% 0.8 1.5E-05 1.5E-06 0
Goldendale 1,119,821,000 100% 414,653 7% 7.7 1.4% 0.8 1.0% 0 0% 0.8 1.5E-05 1.5E-06 0
Mint Farm 915,875,400 100% 355,908 6% 6.6 1.2% 0.7 0.9% 0 0% 0.9 1.6E-05 1.6E-06 0
Sumas 266,588,100 100% 125,345 2% 2.3 0.4% 0.2 0.3% 0 0% 1.0 1.9E-05 1.9E-06 0
Whitehorn 2 7,642,700 100% 13,647 0% 0.3 0.1% 0.03 0.0% 0 0% 3.9 7.9E-05 8.9E-06 0
Whitehorn 3 25,400,900 100% 53,705 1% 1.0 0.2% 0.11 0.1% 0 0% 4.7 9.0E-05 9.3E-06 0
Total Natural Gas/ Oil 3,924,293,418 1,729,228 28% 32 6% 3.2 4% 0 0% 1.0 1.8E-05 1.8E-06 0
Wind
Wild Horse 612,984,089 100% 0 0% 0 0% 0 0% 0 0% 0 0 0 0
Lower Snake River 716,381,078 100% 0 0% 0 0% 0 0% 0 0% 0 0 0 0
Hopkins Ridge 345,425,184 100% 0 0% 0 0% 0 0% 0 0% 0 0 0 0
Total Wind 1,674,790,351 0 0% 0 0% 0 0% 0 0% 0 0 0 0
Electrical Transmission and Distribution Equipment (4)
All equipment 0 100% 0 0% 0 0% 0 0% 0.4 100% NC NC NC NC
Total Electrical Transmission and Distribution Equipment 0 0% 0 0% 0 0% 0.4 100% NC NC NC NC
10,927,610,039 6,181,430 100% 539 100% 77 100% 0.4 100% 1.2 1.1E-04 1.6E-05 7.6E-08
Data Source:
[1] PSE Power Cost Summary and GADS Report.
[2] Puget Energy Form 10-K.
Note(s):
(1) Calculated according to PSE's owned portion of the facility.
(2) See Table A-1 for calculation details.
(3) See Table A-2 for calculation details.
(4) See Table B-8 for calculation details.
(5) Percentage of emissions among PSE-owned electric operations.
(6) NC = Not calculated.
Emission Intensity
Total PSE-Owned Electric Operations
Energy
Amount [1]
PSE Share [2] CO2 CH4 N2OEmission Source SF6
PSE Share of Emissions (1)
Table 6-3
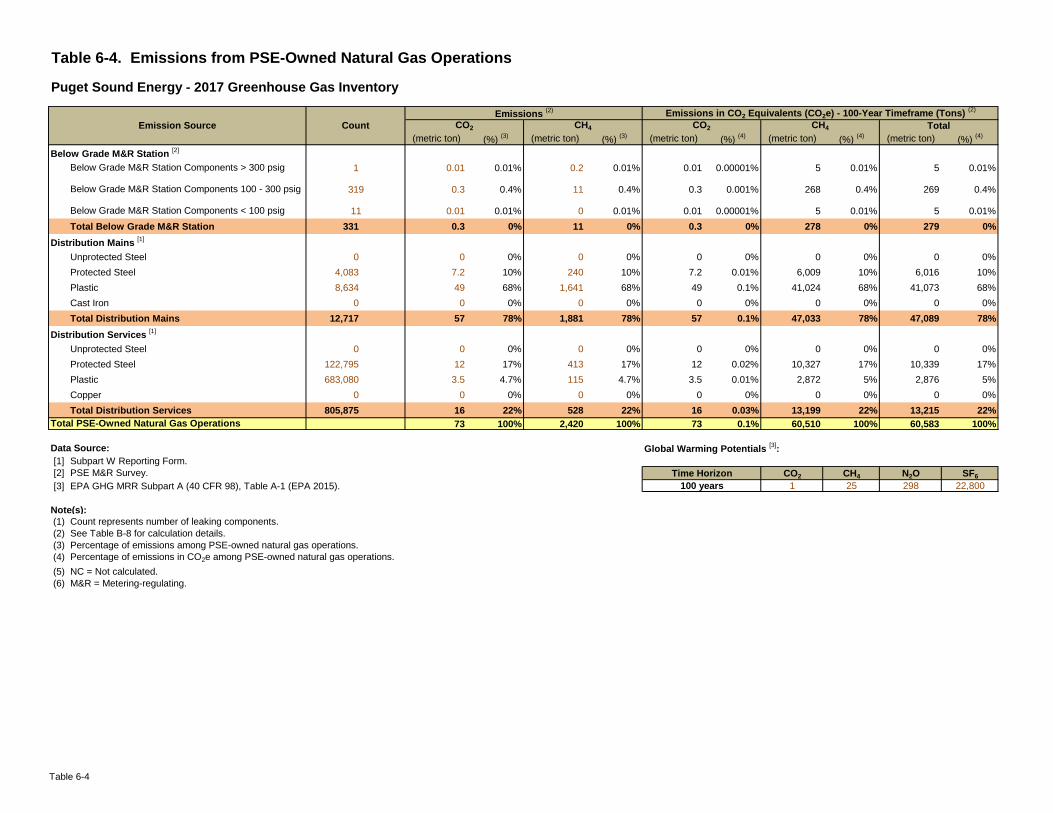
Table 6-4. Emissions from PSE-Owned Natural Gas Operations
Puget Sound Energy - 2017 Greenhouse Gas Inventory
(metric ton) (%) (3) (metric ton) (%)
(3) (metric ton) (%) (4) (metric ton) (%)
(4) (metric ton) (%) (4)
Below Grade M&R Station [2]
1 0.01 0.01% 0.2 0.01% 0.01 0.00001% 5 0.01% 5 0.01%
319 0.3 0.4% 11 0.4% 0.3 0.001% 268 0.4% 269 0.4%
11 0.01 0.01% 0 0.01% 0.01 0.00001% 5 0.01% 5 0.01%
Total Below Grade M&R Station 331 0.3 0% 11 0% 0.3 0% 278 0% 279 0%
Distribution Mains [1]
Unprotected Steel 0 0 0% 0 0% 0 0% 0 0% 0 0%
Protected Steel 4,083 7.2 10% 240 10% 7.2 0.01% 6,009 10% 6,016 10%
Plastic 8,634 49 68% 1,641 68% 49 0.1% 41,024 68% 41,073 68%
Cast Iron 0 0 0% 0 0% 0 0% 0 0% 0 0%
Total Distribution Mains 12,717 57 78% 1,881 78% 57 0.1% 47,033 78% 47,089 78%
Distribution Services [1]
Unprotected Steel 0 0 0% 0 0% 0 0% 0 0% 0 0%
Protected Steel 122,795 12 17% 413 17% 12 0.02% 10,327 17% 10,339 17%
Plastic 683,080 3.5 4.7% 115 4.7% 3.5 0.01% 2,872 5% 2,876 5%
Copper 0 0 0% 0 0% 0 0% 0 0% 0 0%
Total Distribution Services 805,875 16 22% 528 22% 16 0.03% 13,199 22% 13,215 22%
73 100% 2,420 100% 73 0.1% 60,510 100% 60,583 100%
Data Source: Global Warming Potentials [3]
:
[1] Subpart W Reporting Form.
[2] PSE M&R Survey. CO2 CH4 N2O SF6
[3] EPA GHG MRR Subpart A (40 CFR 98), Table A-1 (EPA 2015). 1 25 298 22,800
Note(s):
(1) Count represents number of leaking components.
(2) See Table B-8 for calculation details.
(3) Percentage of emissions among PSE-owned natural gas operations.
(4) Percentage of emissions in CO2e among PSE-owned natural gas operations.
(5) NC = Not calculated.
(6) M&R = Metering-regulating.
100 years
Total PSE-Owned Natural Gas Operations
Emissions (2) Emissions in CO2 Equivalents (CO2e) - 100-Year Timeframe (Tons)
(2)
Time Horizon
Below Grade M&R Station Components > 300 psig
Below Grade M&R Station Components < 100 psig
CO2 CH4 TotalCH4CO2Emission Source Count
Below Grade M&R Station Components 100 - 300 psig
Table 6-4
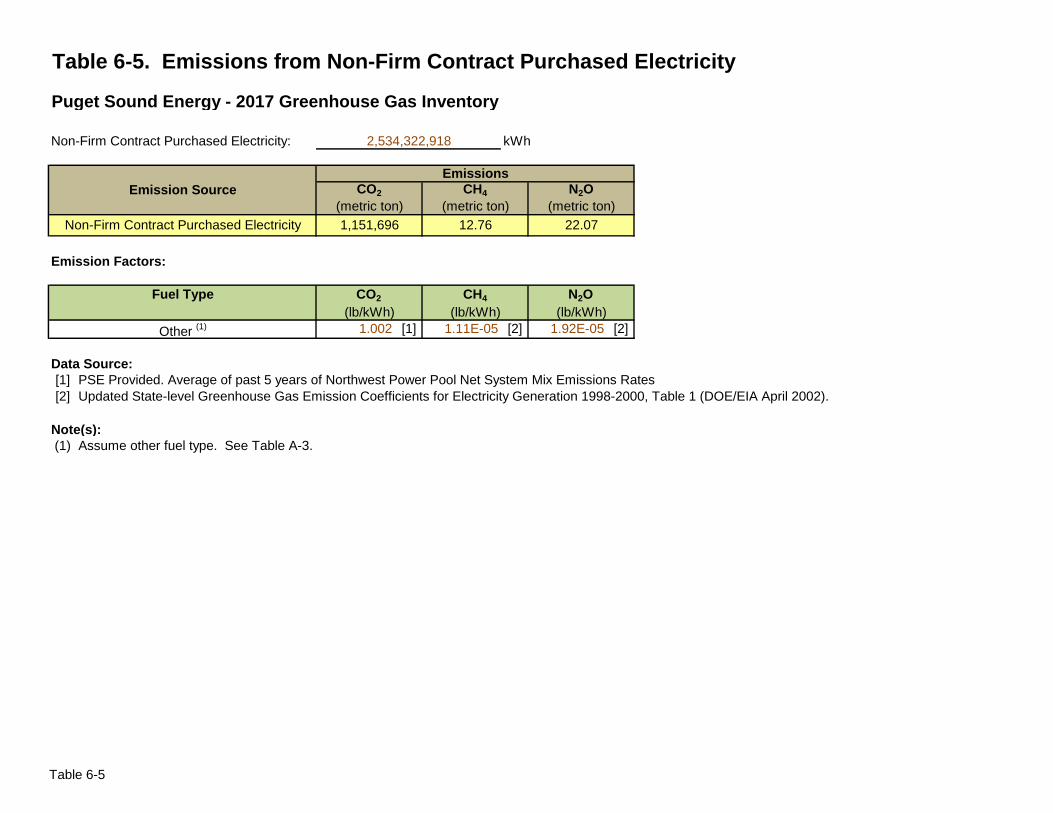
Table 6-5. Emissions from Non-Firm Contract Purchased Electricity
Puget Sound Energy - 2017 Greenhouse Gas Inventory
Non-Firm Contract Purchased Electricity: kWh
Emission Factors:
CO2 CH4 N2O
1.002 [1] 1.11E-05 [2] 1.92E-05 [2]
Data Source:
[1] PSE Provided. Average of past 5 years of Northwest Power Pool Net System Mix Emissions Rates
[2] Updated State-level Greenhouse Gas Emission Coefficients for Electricity Generation 1998-2000, Table 1 (DOE/EIA April 2002).
Note(s):
(1) Assume other fuel type. See Table A-3.
2,534,322,918
(lb/kWh) (lb/kWh) (lb/kWh)
Emission Source
Non-Firm Contract Purchased Electricity
N2O
(metric ton)
Emissions
22.07
Other (1)
CO2
(metric ton)
Fuel Type
CH4
(metric ton)
1,151,696 12.76
Table 6-5
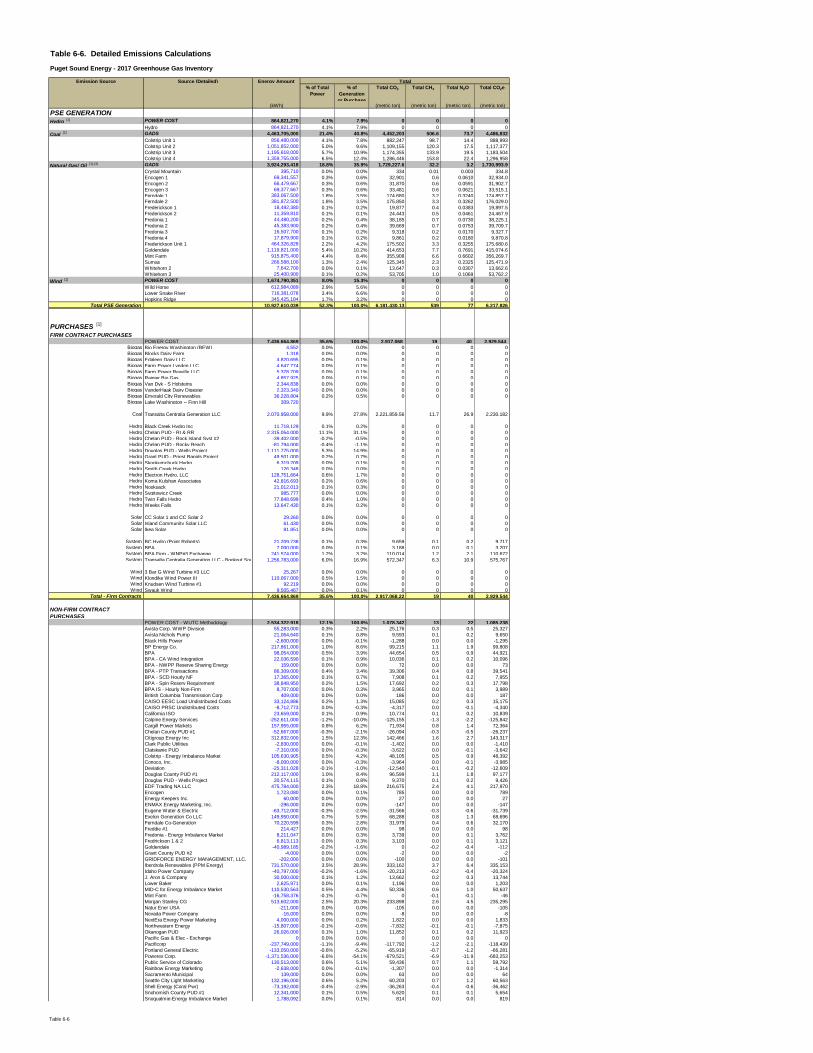
Table 6-6. Detailed Emissions Calculations
Puget Sound Energy - 2017 Greenhouse Gas Inventory
Emission Source Source (Detailed) Energy Amount
% of Total
Power
% of
Generation
or Purchase
Total CO2 Total CH4 Total N2O Total CO2e
(kWh) (metric ton) (metric ton) (metric ton) (metric ton)
PSE GENERATIONHydro
[1] POWER COST 864,821,270 4.1% 7.9% 0 0 0 0
Hydro 864,821,270 4.1% 7.9% 0 0 0 0
Coal [2] GADS 4,463,705,000 21.4% 40.8% 4,452,203 506.6 73.7 4,486,832
Colstrip Unit 1 856,480,000 4.1% 7.8% 882,247 98.7 14.4 888,993
Colstrip Unit 2 1,051,852,000 5.0% 9.6% 1,109,155 120.3 17.5 1,117,377
Colstrip Unit 3 1,195,618,000 5.7% 10.9% 1,174,355 133.9 19.5 1,183,504
Colstrip Unit 4 1,359,755,000 6.5% 12.4% 1,286,446 153.8 22.4 1,296,958
Natural Gas/ Oil [1],(3) GADS 3,924,293,418 18.8% 35.9% 1,729,227.6 32.2 3.2 1,730,993.9
Crystal Mountain 395,710 0.0% 0.0% 334 0.01 0.003 334.8
Encogen 1 69,341,557 0.3% 0.6% 32,901 0.6 0.0610 32,934.0
Encogen 2 66,479,667 0.3% 0.6% 31,870 0.6 0.0591 31,902.7
Encogen 3 69,377,667 0.3% 0.6% 33,481 0.6 0.0621 33,515.1
Ferndale 1 383,067,500 1.8% 3.5% 174,680 3.2 0.3240 174,857.7Ferndale 2 381,872,500 1.8% 3.5% 175,850 3.3 0.3262 176,029.0
Frederickson 1 18,492,380 0.1% 0.2% 19,877 0.4 0.0383 19,897.5
Frederickson 2 11,359,810 0.1% 0.1% 24,443 0.5 0.0461 24,467.9
Fredonia 1 44,480,200 0.2% 0.4% 38,185 0.7 0.0730 38,225.1
Fredonia 2 45,383,900 0.2% 0.4% 39,669 0.7 0.0753 39,709.7
Fredonia 3 16,507,700 0.1% 0.2% 9,318 0.2 0.0170 9,327.7
Fredonia 4 17,879,900 0.1% 0.2% 9,861 0.2 0.0180 9,870.8
Frederickson Unit 1 464,326,828 2.2% 4.2% 175,502 3.3 0.3255 175,680.6
Goldendale 1,119,821,000 5.4% 10.2% 414,653 7.7 0.7691 415,074.6
Mint Farm 915,875,400 4.4% 8.4% 355,908 6.6 0.6602 356,269.7
Sumas 266,588,100 1.3% 2.4% 125,345 2.3 0.2325 125,471.9
Whitehorn 2 7,642,700 0.0% 0.1% 13,647 0.3 0.0307 13,662.6
Whitehorn 3 25,400,900 0.1% 0.2% 53,705 1.0 0.1069 53,762.2
Wind [1] POWER COST 1,674,790,351 8.0% 15.3% 0 0 0 0
Wild Horse 612,984,089 2.9% 5.6% 0 0 0 0
Lower Snake River 716,381,078 3.4% 6.6% 0 0 0 0
Hopkins Ridge 345,425,184 1.7% 3.2% 0 0 0 0
Total PSE Generation 10,927,610,039 52.3% 100.0% 6,181,430.13 539 77 6,217,826
PURCHASES [1]
FIRM CONTRACT PURCHASESPOWER COST 7,436,664,869 35.6% 100.0% 2,917,068 19 40 2,929,544
Biogas Bio Energy Washington (BEW) 4,552 0.0% 0.0% 0 0 0 0
Biogas Blocks Dairy Farm 1,318 0.0% 0.0% 0 0 0 0
Biogas Edaleen Dairy LLC 4,820,695 0.0% 0.1% 0 0 0 0
Biogas Farm Power Lynden LLC 4,647,774 0.0% 0.1% 0 0 0 0
Biogas Farm Power Rexville LLC 5,378,709 0.0% 0.1% 0 0 0 0
Biogas Rainier Bio Gas 4,857,925 0.0% 0.1% 0 0 0 0
Biogas Van Dyk - S Holsteins 2,344,838 0.0% 0.0% 0 0 0 0
Biogas VanderHaak Dairy Digester 2,323,340 0.0% 0.0% 0 0 0 0
Biogas Emerald City Renewables 36,228,804 0.2% 0.5% 0 0 0 0
Biogas Lake Washington -- Finn Hill 309,720
Coal Transalta Centralia Generation LLC 2,070,958,000 9.9% 27.8% 2,221,859.56 11.7 26.9 2,230,182
Hydro Black Creek Hydro Inc 11,718,129 0.1% 0.2% 0 0 0 0
Hydro Chelan PUD - RI & RR 2,315,054,000 11.1% 31.1% 0 0 0 0
Hydro Chelan PUD - Rock Island Syst #2 -39,402,000 -0.2% -0.5% 0 0 0 0
Hydro Chelan PUD - Rocky Reach -81,794,000 -0.4% -1.1% 0 0 0 0
Hydro Douglas PUD - Wells Project 1,111,775,000 5.3% 14.9% 0 0 0 0
Hydro Grant PUD - Priest Rapids Project 49,501,000 0.2% 0.7% 0 0 0 0
Hydro Skookumchuck Hydro 6,319,209 0.0% 0.1% 0 0 0 0
Hydro Smith Creek Hydro 126,348 0.0% 0.0% 0 0 0 0
Hydro Electron Hydro, LLC 128,751,664 0.6% 1.7% 0 0 0 0
Hydro Koma Kulshan Associates 42,816,693 0.2% 0.6% 0 0 0 0
Hydro Nooksack 21,012,013 0.1% 0.3% 0 0 0 0
Hydro Sygitowicz Creek 985,777 0.0% 0.0% 0 0 0 0
Hydro Twin Falls Hydro 77,848,699 0.4% 1.0% 0 0 0 0
Hydro Weeks Falls 13,647,430 0.1% 0.2% 0 0 0 0
Solar CC Solar 1 and CC Solar 2 29,260 0.0% 0.0% 0 0 0 0
Solar Island Community Solar LLC 61,430 0.0% 0.0% 0 0 0 0
Solar Ikea Solar 81,851 0.0% 0.0% 0 0 0 0
System BC Hydro (Point Roberts) 21,209,738 0.1% 0.3% 9,659 0.1 0.2 9,717
System BPA 7,000,000 0.0% 0.1% 3,188 0.0 0.1 3,207
System BPA Firm - WNP#3 Exchange 241,574,000 1.2% 3.2% 110,014 1.2 2.1 110,672
System Transalta Centralia Generation LLC - Bookout Source Other Adjustment1,256,783,000 6.0% 16.9% 572,347 6.3 10.9 575,767
Wind 3 Bar G Wind Turbine #3 LLC 25,267 0.0% 0.0% 0 0 0 0
Wind Klondike Wind Power III 110,067,000 0.5% 1.5% 0 0 0 0
Wind Knudsen Wind Turbine #1 92,219 0.0% 0.0% 0 0 0 0
Wind Swauk Wind 9,505,467 0.0% 0.1% 0 0 0 0
Total - Firm Contracts 7,436,664,869 35.6% 100.0% 2,917,068.22 19 40 2,929,544
NON-FIRM CONTRACT
PURCHASESPOWER COST - WUTC Methodology 2,534,322,918 12.1% 100.0% 1,078,342 13 22 1,085,238
Avista Corp. WWP Division 55,283,000 0.3% 2.2% 25,176 0.3 0.5 25,327
Avista Nichols Pump 21,064,640 0.1% 0.8% 9,593 0.1 0.2 9,650
Black Hills Power -2,600,000 0.0% -0.1% -1,288 0.0 0.0 -1,295
BP Energy Co. 217,861,000 1.0% 8.6% 99,215 1.1 1.9 99,808
BPA 98,054,000 0.5% 3.9% 44,654 0.5 0.9 44,921
BPA - CA Wind Integration 22,036,590 0.1% 0.9% 10,036 0.1 0.2 10,096
BPA - NWPP Reserve Sharing Energy 159,000 0.0% 0.0% 72 0.0 0.0 73
BPA - PTP Transactions 86,309,000 0.4% 3.4% 39,306 0.4 0.8 39,541
BPA - SCD Hourly NF 17,365,000 0.1% 0.7% 7,908 0.1 0.2 7,955
BPA - Spin Reserv Requirement 38,848,950 0.2% 1.5% 17,692 0.2 0.3 17,798
BPA IS - Hourly Non-Firm 8,707,000 0.0% 0.3% 3,965 0.0 0.1 3,989
British Columbia Transmission Corp 409,000 0.0% 0.0% 186 0.0 0.0 187
CAISO EESC Load Undistributed Costs 33,124,886 0.2% 1.3% 15,085 0.2 0.3 15,175
CAISO PRSC Undistributed Costs -8,712,773 0.0% -0.3% -4,317 0.0 -0.1 -4,340
California ISO 23,659,000 0.1% 0.9% 10,774 0.1 0.2 10,839
Calpine Energy Services -252,611,000 -1.2% -10.0% -125,155 -1.3 -2.2 -125,842
Cargill Power Markets 157,955,000 0.8% 6.2% 71,934 0.8 1.4 72,364
Chelan County PUD #1 -52,667,000 -0.3% -2.1% -26,094 -0.3 -0.5 -26,237
Citigroup Energy Inc 312,832,000 1.5% 12.3% 142,466 1.6 2.7 143,317
Clark Public Utilities -2,830,000 0.0% -0.1% -1,402 0.0 0.0 -1,410
Clatskanie PUD -7,310,000 0.0% -0.3% -3,622 0.0 -0.1 -3,642
Colstrip - Energy Imbalance Market 105,630,905 0.5% 4.2% 48,105 0.5 0.9 48,392
Conoco, Inc. -8,000,000 0.0% -0.3% -3,964 0.0 -0.1 -3,985
Deviation -25,311,028 -0.1% -1.0% -12,540 -0.1 -0.2 -12,609
Douglas County PUD #1 212,117,000 1.0% 8.4% 96,599 1.1 1.8 97,177
Douglas PUD - Wells Project 20,574,115 0.1% 0.8% 9,370 0.1 0.2 9,426
EDF Trading NA LLC 475,784,000 2.3% 18.8% 216,675 2.4 4.1 217,970
Encogen 1,723,080 0.0% 0.1% 785 0.0 0.0 789
Energy Keepers Inc. 60,000 0.0% 0.0% 27 0.0 0.0 27
ENMAX Energy Marketing, Inc. -296,000 0.0% 0.0% -147 0.0 0.0 -147
Eugene Water & Electric -63,712,000 -0.3% -2.5% -31,566 -0.3 -0.6 -31,739
Exelon Generation Co LLC 149,950,000 0.7% 5.9% 68,288 0.8 1.3 68,696
Ferndale Co-Generation 70,220,599 0.3% 2.8% 31,979 0.4 0.6 32,170
Freddie #1 214,427 0.0% 0.0% 98 0.0 0.0 98
Fredonia - Energy Imbalance Market 8,211,047 0.0% 0.3% 3,739 0.0 0.1 3,762
Fredrickson 1 & 2 6,813,113 0.0% 0.3% 3,103 0.0 0.1 3,121
Goldendale -40,989,185 -0.2% -1.6% 0 -0.2 -0.4 -112
Grant County PUD #2 -4,000 0.0% 0.0% -2 0.0 0.0 -2
GRIDFORCE ENERGY MANAGEMENT, LLC. -202,000 0.0% 0.0% -100 0.0 0.0 -101
Iberdrola Renewables (PPM Energy) 731,570,000 3.5% 28.9% 333,162 3.7 6.4 335,153
Idaho Power Company -40,797,000 -0.2% -1.6% -20,213 -0.2 -0.4 -20,324
J. Aron & Company 30,000,000 0.1% 1.2% 13,662 0.2 0.3 13,744
Lower Baker 2,625,971 0.0% 0.1% 1,196 0.0 0.0 1,203
MID-C for Energy Imbalance Market 110,530,563 0.5% 4.4% 50,336 0.6 1.0 50,637
Mint Farm -16,758,376 -0.1% -0.7% 0 -0.1 -0.1 -46
Morgan Stanley CG 513,602,000 2.5% 20.3% 233,898 2.6 4.5 235,295
Natur Ener USA -211,000 0.0% 0.0% -105 0.0 0.0 -105
Nevada Power Company -16,000 0.0% 0.0% -8 0.0 0.0 -8
NextEra Energy Power Marketing 4,000,000 0.0% 0.2% 1,822 0.0 0.0 1,833
Northwestern Energy -15,807,000 -0.1% -0.6% -7,832 -0.1 -0.1 -7,875
Okanogan PUD 26,026,000 0.1% 1.0% 11,852 0.1 0.2 11,923
Pacific Gas & Elec - Exchange 0 0.0% 0.0% 0 0.0 0.0 0
Pacificorp -237,749,000 -1.1% -9.4% -117,792 -1.2 -2.1 -118,439
Portland General Electric -133,050,000 -0.6% -5.2% -65,919 -0.7 -1.2 -66,281
Powerex Corp. -1,371,536,000 -6.6% -54.1% -679,521 -6.9 -11.9 -683,253
Public Service of Colorado 130,513,000 0.6% 5.1% 59,436 0.7 1.1 59,792
Rainbow Energy Marketing -2,638,000 0.0% -0.1% -1,307 0.0 0.0 -1,314
Sacramento Municipal 139,000 0.0% 0.0% 63 0.0 0.0 64
Seattle City Light Marketing 132,196,000 0.6% 5.2% 60,203 0.7 1.2 60,563
Shell Energy (Coral Pwr) -73,192,000 -0.4% -2.9% -36,263 -0.4 -0.6 -36,462
Snohomish County PUD #1 12,341,000 0.1% 0.5% 5,620 0.1 0.1 5,654
Snoqualmie-Energy Imbalance Market 1,788,092 0.0% 0.1% 814 0.0 0.0 819
Total
Table 6-6
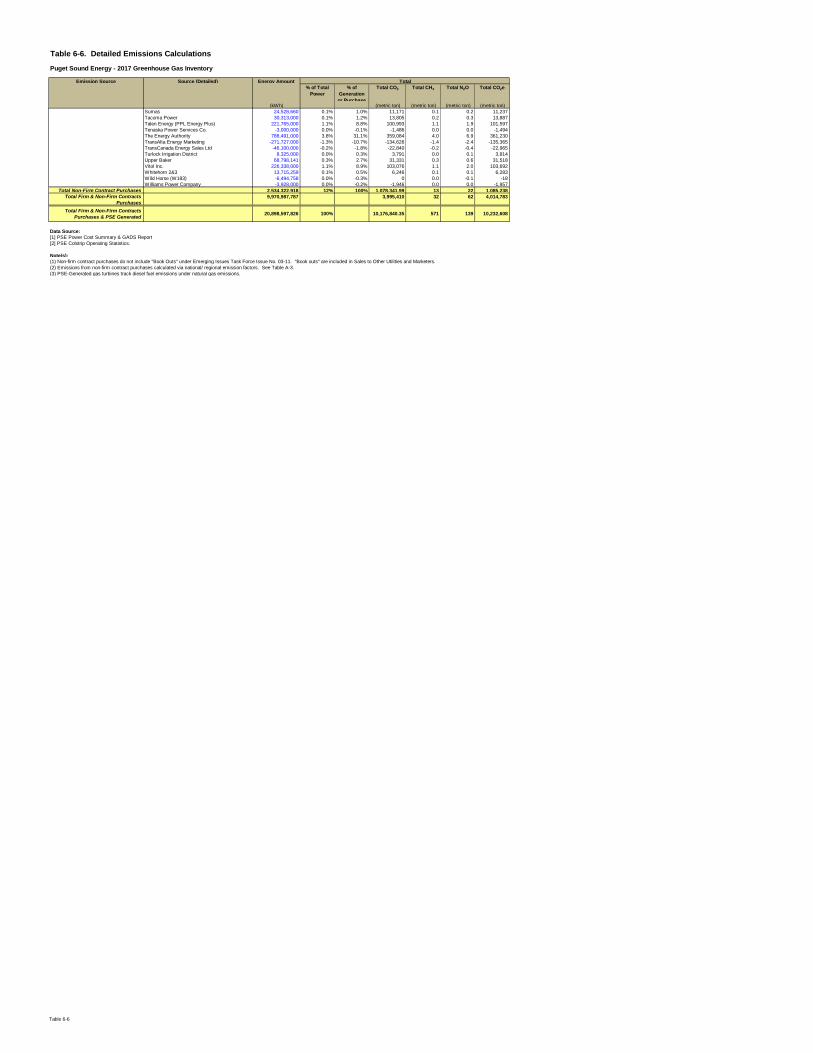
Table 6-6. Detailed Emissions Calculations
Puget Sound Energy - 2017 Greenhouse Gas Inventory
Emission Source Source (Detailed) Energy Amount
% of Total
Power
% of
Generation
or Purchase
Total CO2 Total CH4 Total N2O Total CO2e
(kWh) (metric ton) (metric ton) (metric ton) (metric ton)
Total
Sumas 24,528,660 0.1% 1.0% 11,171 0.1 0.2 11,237
Tacoma Power 30,313,000 0.1% 1.2% 13,805 0.2 0.3 13,887
Talen Energy (PPL Energy Plus) 221,765,000 1.1% 8.8% 100,993 1.1 1.9 101,597
Tenaska Power Services Co. -3,000,000 0.0% -0.1% -1,486 0.0 0.0 -1,494
The Energy Authority 788,491,000 3.8% 31.1% 359,084 4.0 6.9 361,230
TransAlta Energy Marketing -271,727,000 -1.3% -10.7% -134,626 -1.4 -2.4 -135,365
TransCanada Energy Sales Ltd -46,100,000 -0.2% -1.8% -22,840 -0.2 -0.4 -22,965
Turlock Irrigation District 8,325,000 0.0% 0.3% 3,791 0.0 0.1 3,814
Upper Baker 68,798,141 0.3% 2.7% 31,331 0.3 0.6 31,518
Vitol Inc. 226,338,000 1.1% 8.9% 103,076 1.1 2.0 103,692
Whitehorn 2&3 13,715,259 0.1% 0.5% 6,246 0.1 0.1 6,283
Wild Horse (W183) -6,494,758 0.0% -0.3% 0 0.0 -0.1 -18
Williams Power Company -3,928,000 0.0% -0.2% -1,946 0.0 0.0 -1,957
Total Non-Firm Contract Purchases 2,534,322,918 12% 100% 1,078,341.99 13 22 1,085,238
Total Firm & Non-Firm Contracts
Purchases
9,970,987,787 3,995,410 32 62 4,014,783
Total Firm & Non-Firm Contracts
Purchases & PSE Generated 20,898,597,826 100% 10,176,840.35 571 139 10,232,608
Data Source:
[1] PSE Power Cost Summary & GADS Report
[2] PSE Colstrip Operating Statistics.
Note(s):
(1) Non-firm contract purchases do not include "Book Outs" under Emerging Issues Task Force Issue No. 03-11. "Book outs" are included in Sales to Other Utilities and Marketers.
(2) Emissions from non-firm contract purchases calculated via national/ regional emission factors. See Table A-3.
(3) PSE-Generated gas turbines track diesel fuel emissions under natural gas emissions.
Table 6-6
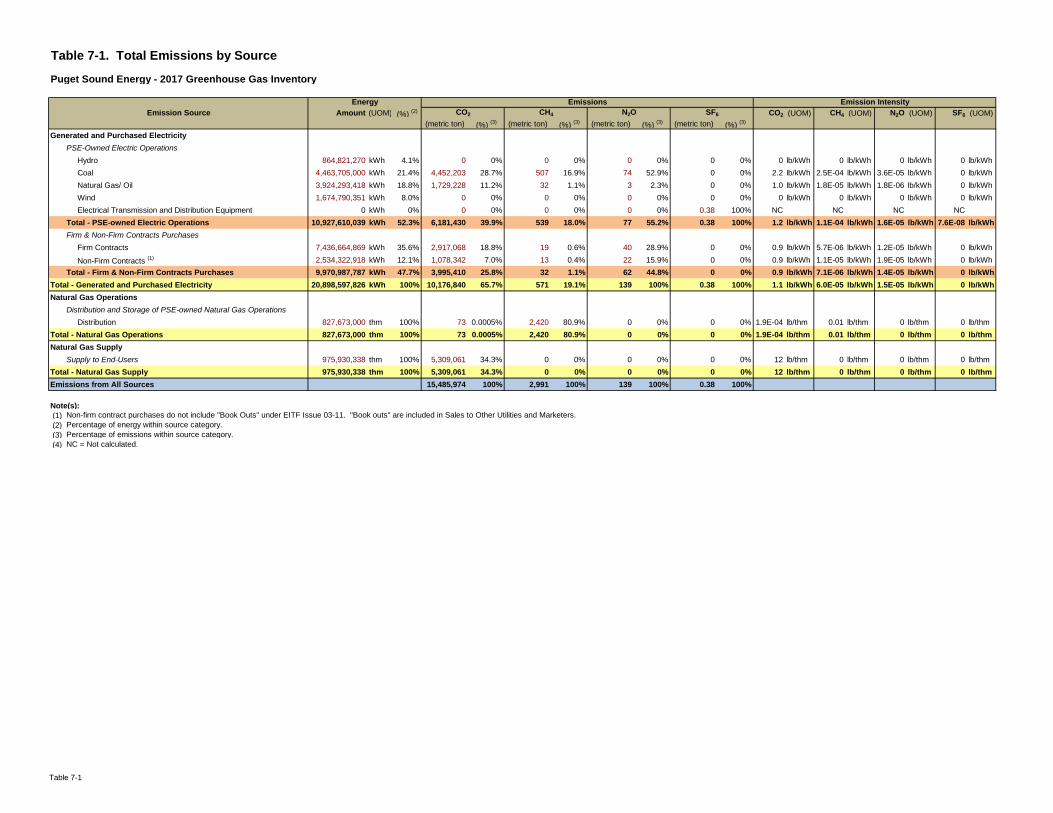
Table 7-1. Total Emissions by Source
Puget Sound Energy - 2017 Greenhouse Gas Inventory
Amount (UOM) (%) (2) CO2 (UOM) CH4 (UOM) N2O (UOM) SF6 (UOM)
(metric ton) (%) (3) (metric ton) (%)
(3) (metric ton) (%) (3) (metric ton) (%)
(3)
Generated and Purchased Electricity
PSE-Owned Electric Operations
Hydro 864,821,270 kWh 4.1% 0 0% 0 0% 0 0% 0 0% 0 lb/kWh 0 lb/kWh 0 lb/kWh 0 lb/kWh
Coal 4,463,705,000 kWh 21.4% 4,452,203 28.7% 507 16.9% 74 52.9% 0 0% 2.2 lb/kWh 2.5E-04 lb/kWh 3.6E-05 lb/kWh 0 lb/kWh
Natural Gas/ Oil 3,924,293,418 kWh 18.8% 1,729,228 11.2% 32 1.1% 3 2.3% 0 0% 1.0 lb/kWh 1.8E-05 lb/kWh 1.8E-06 lb/kWh 0 lb/kWh
Wind 1,674,790,351 kWh 8.0% 0 0% 0 0% 0 0% 0 0% 0 lb/kWh 0 lb/kWh 0 lb/kWh 0 lb/kWh
Electrical Transmission and Distribution Equipment 0 kWh 0% 0 0% 0 0% 0 0% 0.38 100% NC NC NC NC
Total - PSE-owned Electric Operations 10,927,610,039 kWh 52.3% 6,181,430 39.9% 539 18.0% 77 55.2% 0.38 100% 1.2 lb/kWh 1.1E-04 lb/kWh 1.6E-05 lb/kWh 7.6E-08 lb/kWh
Firm & Non-Firm Contracts Purchases
Firm Contracts 7,436,664,869 kWh 35.6% 2,917,068 18.8% 19 0.6% 40 28.9% 0 0% 0.9 lb/kWh 5.7E-06 lb/kWh 1.2E-05 lb/kWh 0 lb/kWh
Non-Firm Contracts (1) 2,534,322,918 kWh 12.1% 1,078,342 7.0% 13 0.4% 22 15.9% 0 0% 0.9 lb/kWh 1.1E-05 lb/kWh 1.9E-05 lb/kWh 0 lb/kWh
Total - Firm & Non-Firm Contracts Purchases 9,970,987,787 kWh 47.7% 3,995,410 25.8% 32 1.1% 62 44.8% 0 0% 0.9 lb/kWh 7.1E-06 lb/kWh 1.4E-05 lb/kWh 0 lb/kWh
Total - Generated and Purchased Electricity 20,898,597,826 kWh 100% 10,176,840 65.7% 571 19.1% 139 100% 0.38 100% 1.1 lb/kWh 6.0E-05 lb/kWh 1.5E-05 lb/kWh 0 lb/kWh
Natural Gas Operations
Distribution and Storage of PSE-owned Natural Gas Operations
Distribution 827,673,000 thm 100% 73 0.0005% 2,420 80.9% 0 0% 0 0% 1.9E-04 lb/thm 0.01 lb/thm 0 lb/thm 0 lb/thm
Total - Natural Gas Operations 827,673,000 thm 100% 73 0.0005% 2,420 80.9% 0 0% 0 0% 1.9E-04 lb/thm 0.01 lb/thm 0 lb/thm 0 lb/thm
Natural Gas Supply
Supply to End-Users 975,930,338 thm 100% 5,309,061 34.3% 0 0% 0 0% 0 0% 12 lb/thm 0 lb/thm 0 lb/thm 0 lb/thm
Total - Natural Gas Supply 975,930,338 thm 100% 5,309,061 34.3% 0 0% 0 0% 0 0% 12 lb/thm 0 lb/thm 0 lb/thm 0 lb/thm
Emissions from All Sources 15,485,974 100% 2,991 100% 139 100% 0.38 100%
Note(s):
(1) Non-firm contract purchases do not include "Book Outs" under EITF Issue 03-11. "Book outs" are included in Sales to Other Utilities and Marketers.
(2) Percentage of energy within source category.
(3) Percentage of emissions within source category.
(4) NC = Not calculated.
Emission IntensityEnergy
Emission Source CO2 CH4 N2O SF6
Emissions
Table 7-1
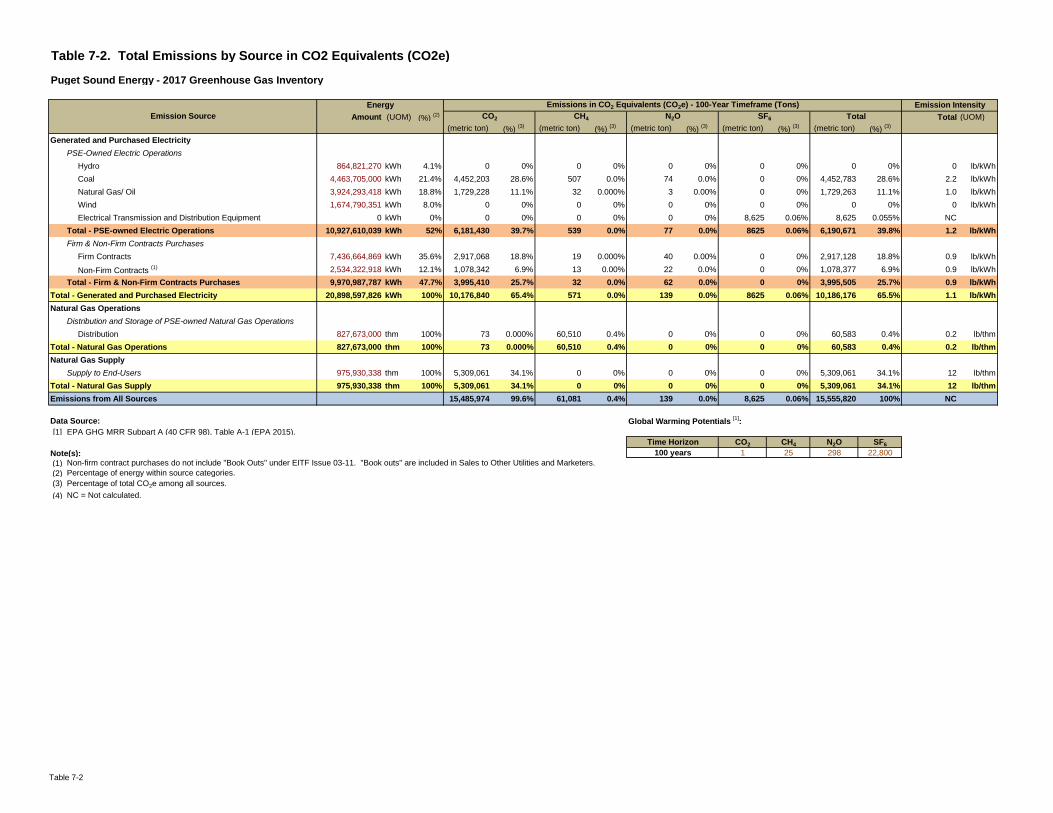
Table 7-2. Total Emissions by Source in CO2 Equivalents (CO2e)
Puget Sound Energy - 2017 Greenhouse Gas Inventory
Amount (UOM) (%) (2) Total (UOM)
(metric ton) (%) (3) (metric ton) (%)
(3) (metric ton) (%) (3) (metric ton) (%)
(3) (metric ton) (%) (3)
Generated and Purchased Electricity
PSE-Owned Electric Operations
Hydro 864,821,270 kWh 4.1% 0 0% 0 0% 0 0% 0 0% 0 0% 0 lb/kWh
Coal 4,463,705,000 kWh 21.4% 4,452,203 28.6% 507 0.0% 74 0.0% 0 0% 4,452,783 28.6% 2.2 lb/kWh
Natural Gas/ Oil 3,924,293,418 kWh 18.8% 1,729,228 11.1% 32 0.000% 3 0.00% 0 0% 1,729,263 11.1% 1.0 lb/kWh
Wind 1,674,790,351 kWh 8.0% 0 0% 0 0% 0 0% 0 0% 0 0% 0 lb/kWh
Electrical Transmission and Distribution Equipment 0 kWh 0% 0 0% 0 0% 0 0% 8,625 0.06% 8,625 0.055% NC
Total - PSE-owned Electric Operations 10,927,610,039 kWh 52% 6,181,430 39.7% 539 0.0% 77 0.0% 8625 0.06% 6,190,671 39.8% 1.2 lb/kWh
Firm & Non-Firm Contracts Purchases
Firm Contracts 7,436,664,869 kWh 35.6% 2,917,068 18.8% 19 0.000% 40 0.00% 0 0% 2,917,128 18.8% 0.9 lb/kWh
Non-Firm Contracts (1) 2,534,322,918 kWh 12.1% 1,078,342 6.9% 13 0.00% 22 0.0% 0 0% 1,078,377 6.9% 0.9 lb/kWh
Total - Firm & Non-Firm Contracts Purchases 9,970,987,787 kWh 47.7% 3,995,410 25.7% 32 0.0% 62 0.0% 0 0% 3,995,505 25.7% 0.9 lb/kWh
Total - Generated and Purchased Electricity 20,898,597,826 kWh 100% 10,176,840 65.4% 571 0.0% 139 0.0% 8625 0.06% 10,186,176 65.5% 1.1 lb/kWh
Natural Gas Operations
Distribution and Storage of PSE-owned Natural Gas Operations
Distribution 827,673,000 thm 100% 73 0.000% 60,510 0.4% 0 0% 0 0% 60,583 0.4% 0.2 lb/thm
Total - Natural Gas Operations 827,673,000 thm 100% 73 0.000% 60,510 0.4% 0 0% 0 0% 60,583 0.4% 0.2 lb/thm
Natural Gas Supply
Supply to End-Users 975,930,338 thm 100% 5,309,061 34.1% 0 0% 0 0% 0 0% 5,309,061 34.1% 12 lb/thm
Total - Natural Gas Supply 975,930,338 thm 100% 5,309,061 34.1% 0 0% 0 0% 0 0% 5,309,061 34.1% 12 lb/thm
Emissions from All Sources 15,485,974 99.6% 61,081 0.4% 139 0.0% 8,625 0.06% 15,555,820 100% NC
Data Source: Global Warming Potentials [1]
:
[1] EPA GHG MRR Subpart A (40 CFR 98), Table A-1 (EPA 2015).
CO2 CH4 N2O SF6
Note(s): 1 25 298 22,800
(1) Non-firm contract purchases do not include "Book Outs" under EITF Issue 03-11. "Book outs" are included in Sales to Other Utilities and Marketers.
(2) Percentage of energy within source categories.
(3) Percentage of total CO2e among all sources.
(4) NC = Not calculated.
Emission IntensityEmissions in CO2 Equivalents (CO2e) - 100-Year Timeframe (Tons)
CO2 CH4 N2O SF6 Total
Time Horizon
100 years
Emission Source
Energy
Table 7-2
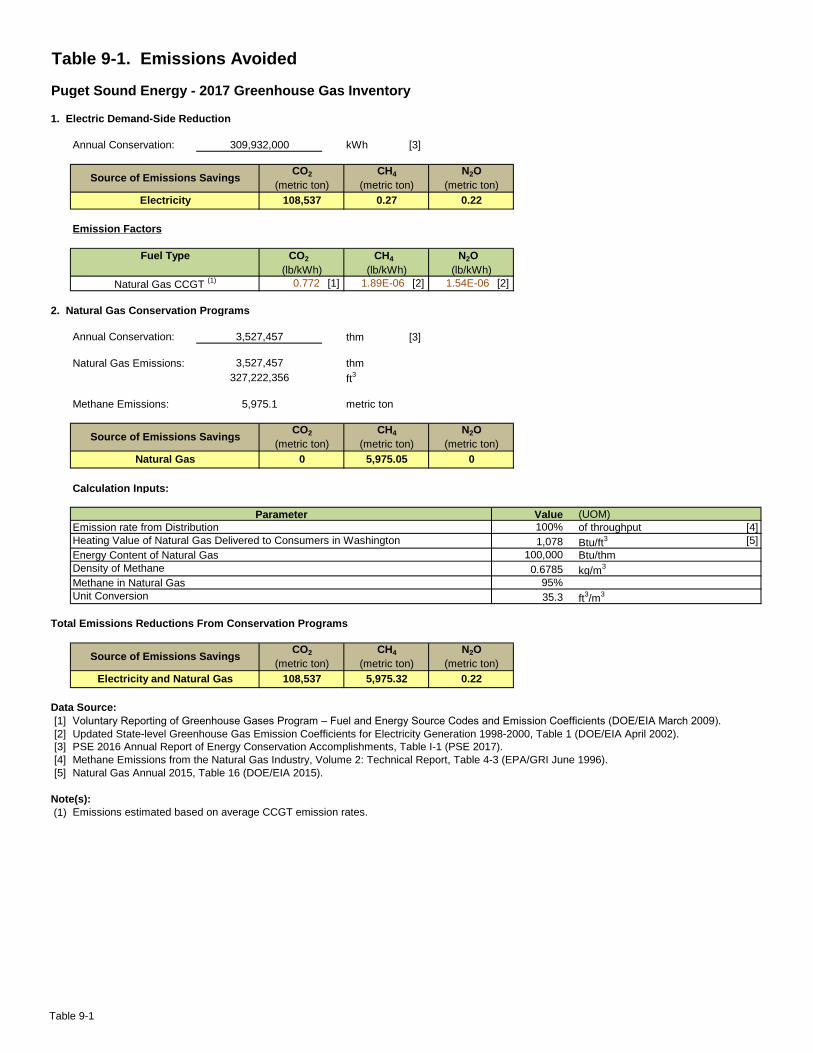
Table 9-1. Emissions Avoided
Puget Sound Energy - 2017 Greenhouse Gas Inventory
1. Electric Demand-Side Reduction
Annual Conservation: kWh [3]
Emission Factors
CO2 CH4 N2O
0.772 [1] 1.89E-06 [2] 1.54E-06 [2]
2. Natural Gas Conservation Programs
Annual Conservation: thm [3]
Natural Gas Emissions: thm
ft3
Methane Emissions: metric ton
Calculation Inputs:
(UOM)
of throughput [4]
Btu/ft3 [5]
Btu/thm
kg/m3
ft3/m
3
Total Emissions Reductions From Conservation Programs
Data Source:
[1] Voluntary Reporting of Greenhouse Gases Program – Fuel and Energy Source Codes and Emission Coefficients (DOE/EIA March 2009).
[2] Updated State-level Greenhouse Gas Emission Coefficients for Electricity Generation 1998-2000, Table 1 (DOE/EIA April 2002).
[3] PSE 2016 Annual Report of Energy Conservation Accomplishments, Table I-1 (PSE 2017).
[4] Methane Emissions from the Natural Gas Industry, Volume 2: Technical Report, Table 4-3 (EPA/GRI June 1996).
[5] Natural Gas Annual 2015, Table 16 (DOE/EIA 2015).
Note(s):
(1) Emissions estimated based on average CCGT emission rates.
309,932,000
Source of Emissions Savings
Electricity
Fuel Type
Natural Gas CCGT (1)
(metric ton)
0
CH4
(metric ton)
5,975.05
0.27
Source of Emissions Savings
Natural Gas
Electricity and Natural Gas 5,975.32
3,527,457
327,222,356
CH4
(metric ton)
5,975.1
(metric ton)
108,537
CO2Source of Emissions Savings
CO2
Density of Methane
Emission rate from Distribution
Unit Conversion
Methane in Natural Gas
N2O
(metric ton)
0.22
(lb/kWh) (lb/kWh) (lb/kWh)
CO2
(metric ton)
108,537
CH4
3,527,457
(metric ton)
(metric ton)
0.22
N2O
(metric ton)
0
Value
35.3
100%
1,078
100,000
0.6785
95%
N2O
Parameter
Heating Value of Natural Gas Delivered to Consumers in Washington
Energy Content of Natural Gas
Table 9-1
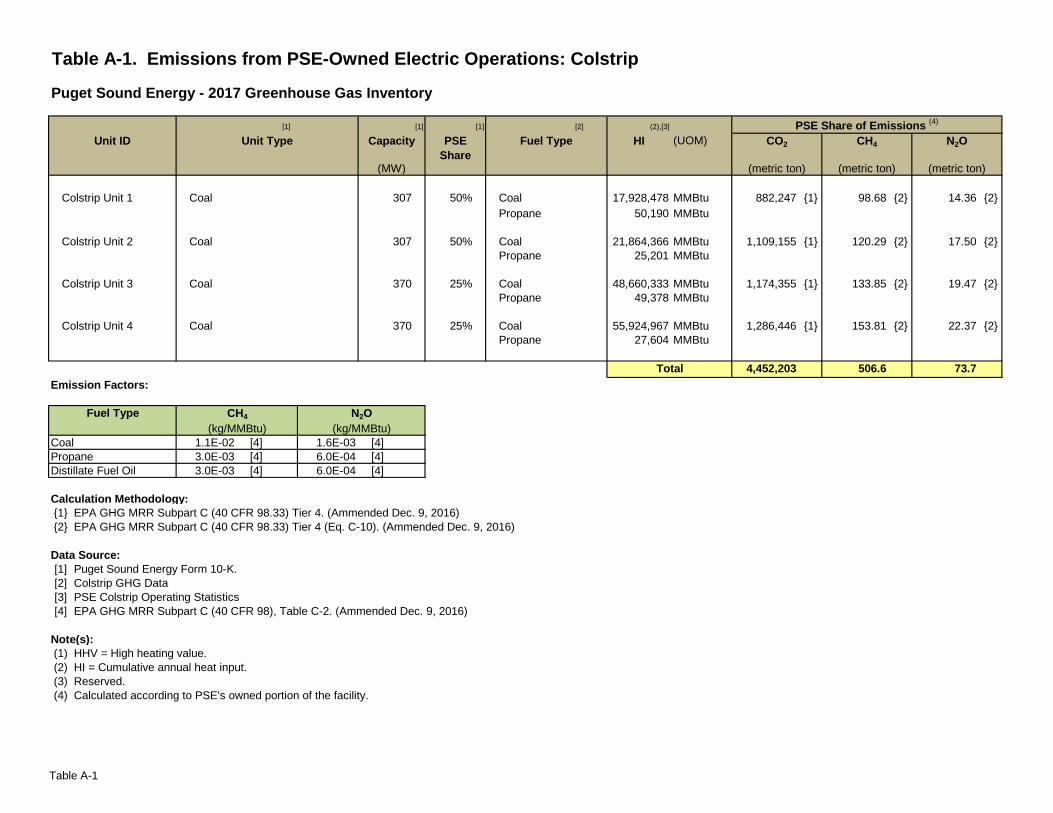
Table A-1. Emissions from PSE-Owned Electric Operations: Colstrip
Puget Sound Energy - 2017 Greenhouse Gas Inventory
[1] [1] (2),[3]
Capacity PSE
Share
HI (UOM)
(MW)
307 50% 17,928,478 MMBtu 882,247 {1} 98.68 {2} 14.36 {2}
Propane 50,190 MMBtu
307 50% 21,864,366 MMBtu 1,109,155 {1} 120.29 {2} 17.50 {2}
Propane 25,201 MMBtu
370 25% 48,660,333 MMBtu 1,174,355 {1} 133.85 {2} 19.47 {2}
Propane 49,378 MMBtu
370 25% 55,924,967 MMBtu 1,286,446 {1} 153.81 {2} 22.37 {2}
Propane 27,604 MMBtu
4,452,203 506.6 73.7
Emission Factors:
1.1E-02 [4] 1.6E-03 [4]
3.0E-03 [4] 6.0E-04 [4]
3.0E-03 [4] 6.0E-04 [4]
Calculation Methodology:
{1} EPA GHG MRR Subpart C (40 CFR 98.33) Tier 4. (Ammended Dec. 9, 2016)
{2} EPA GHG MRR Subpart C (40 CFR 98.33) Tier 4 (Eq. C-10). (Ammended Dec. 9, 2016)
Data Source:
[1] Puget Sound Energy Form 10-K.
[2] Colstrip GHG Data
[3] PSE Colstrip Operating Statistics
[4] EPA GHG MRR Subpart C (40 CFR 98), Table C-2. (Ammended Dec. 9, 2016)
Note(s):
(1) HHV = High heating value.
(2) HI = Cumulative annual heat input.
(3) Reserved.
(4) Calculated according to PSE's owned portion of the facility.
[2]
Fuel Type CO2 CH4 N2O
(metric ton) (metric ton)
PSE Share of Emissions (4)
Coal
(metric ton)
Coal
Coal
Coal
Coal
Total
Coal
(kg/MMBtu)
Colstrip Unit 1
Colstrip Unit 2
Coal
Fuel Type
Colstrip Unit 3
Colstrip Unit 4 Coal
CH4
(kg/MMBtu)
[1]
Unit Type
N2O
Propane
Distillate Fuel Oil
Unit ID
Coal
Table A-1
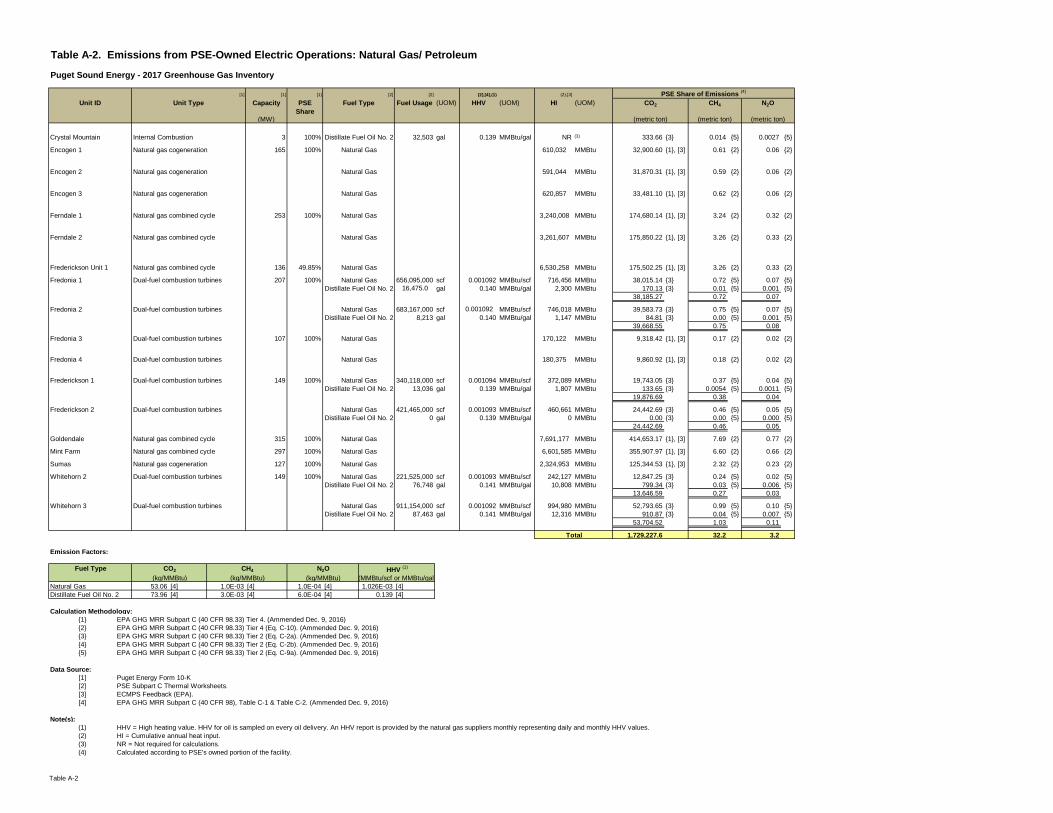
Table A-2. Emissions from PSE-Owned Electric Operations: Natural Gas/ Petroleum
Puget Sound Energy - 2017 Greenhouse Gas Inventory
[1] [1] [2] [2],[4],(1) (2),[3]
Capacity PSE
Share
Fuel Usage (UOM) HHV (UOM) HI (UOM)
(MW)
3 100% 32,503 gal 0.139 MMBtu/gal NR (3) 333.66 {3} 0.014 {5} 0.0027 {5}
165 100% 610,032 MMBtu 32,900.60 {1}, [3] 0.61 {2} 0.06 {2}
Encogen 1
591,044 MMBtu 31,870.31 {1}, [3] 0.59 {2} 0.06 {2}
Encogen 2
620,857 MMBtu 33,481.10 {1}, [3] 0.62 {2} 0.06 {2}
Encogen 3
253 100% 3,240,008 MMBtu 174,680.14 {1}, [3] 3.24 {2} 0.32 {2}
Ferndale 1
3,261,607 MMBtu 175,850.22 {1}, [3] 3.26 {2} 0.33 {2}
Ferndale 2
136 49.85% 6,530,258 MMBtu 175,502.25 {1}, [3] 3.26 {2} 0.33 {2}
207 100% 656,095,000 scf 0.001092 MMBtu/scf 716,456 MMBtu 38,015.14 {3} 0.72 {5} 0.07 {5}
16,475.0 gal 0.140 MMBtu/gal 2,300 MMBtu 170.13 {3} 0.01 {5} 0.001 {5}
38,185.27 0.72 0.07
683,167,000 scf 0.001092 MMBtu/scf 746,018 MMBtu 39,583.73 {3} 0.75 {5} 0.07 {5}
8,213 gal 0.140 MMBtu/gal 1,147 MMBtu 84.81 {3} 0.00 {5} 0.001 {5}
39,668.55 0.75 0.08
107 100% 170,122 MMBtu 9,318.42 {1}, [3] 0.17 {2} 0.02 {2}
Fredonia 3
180,375 MMBtu 9,860.92 {1}, [3] 0.18 {2} 0.02 {2}
Fredonia 4
149 100% 340,118,000 scf 0.001094 MMBtu/scf 372,089 MMBtu 19,743.05 {3} 0.37 {5} 0.04 {5}
13,036 gal 0.139 MMBtu/gal 1,807 MMBtu 133.65 {3} 0.0054 {5} 0.0011 {5}
19,876.69 0.38 0.04
421,465,000 scf 0.001093 MMBtu/scf 460,661 MMBtu 24,442.69 {3} 0.46 {5} 0.05 {5}
0 gal 0.139 MMBtu/gal 0 MMBtu 0.00 {3} 0.00 {5} 0.000 {5}
24,442.69 0.46 0.05
315 100% 7,691,177 MMBtu 414,653.17 {1}, [3] 7.69 {2} 0.77 {2}
297 100% 6,601,585 MMBtu 355,907.97 {1}, [3] 6.60 {2} 0.66 {2}
127 100% 2,324,953 MMBtu 125,344.53 {1}, [3] 2.32 {2} 0.23 {2}
149 100% 221,525,000 scf 0.001093 MMBtu/scf 242,127 MMBtu 12,847.25 {3} 0.24 {5} 0.02 {5}
76,748 gal 0.141 MMBtu/gal 10,808 MMBtu 799.34 {3} 0.03 {5} 0.006 {5}
13,646.59 0.27 0.03
911,154,000 scf 0.001092 MMBtu/scf 994,980 MMBtu 52,793.65 {3} 0.99 {5} 0.10 {5}
87,463 gal 0.141 MMBtu/gal 12,316 MMBtu 910.87 {3} 0.04 {5} 0.007 {5}
53,704.52 1.03 0.11
1,729,227.6 32.2 3.2
Emission Factors:
53.06 [4] 1.0E-03 [4] 1.0E-04 [4] 1.026E-03 [4]
73.96 [4] 3.0E-03 [4] 6.0E-04 [4] 0.139 [4]
Calculation Methodology:
{1} EPA GHG MRR Subpart C (40 CFR 98.33) Tier 4. (Ammended Dec. 9, 2016)
{2} EPA GHG MRR Subpart C (40 CFR 98.33) Tier 4 (Eq. C-10). (Ammended Dec. 9, 2016)
{3} EPA GHG MRR Subpart C (40 CFR 98.33) Tier 2 (Eq. C-2a). (Ammended Dec. 9, 2016)
{4} EPA GHG MRR Subpart C (40 CFR 98.33) Tier 2 (Eq. C-2b). (Ammended Dec. 9, 2016)
{5} EPA GHG MRR Subpart C (40 CFR 98.33) Tier 2 (Eq. C-9a). (Ammended Dec. 9, 2016)
Data Source:
[1] Puget Energy Form 10-K
[2] PSE Subpart C Thermal Worksheets.
[3] ECMPS Feedback (EPA).
[4] EPA GHG MRR Subpart C (40 CFR 98), Table C-1 & Table C-2. (Ammended Dec. 9, 2016)
Note(s):
(1) HHV = High heating value. HHV for oil is sampled on every oil delivery. An HHV report is provided by the natural gas suppliers monthly representing daily and monthly HHV values.
(2) HI = Cumulative annual heat input.
(3) NR = Not required for calculations.
(4) Calculated according to PSE's owned portion of the facility.
HHV (1)
(MMBtu/scf or MMBtu/gal)
Natural Gas
Whitehorn 3 Dual-fuel combustion turbines Distillate Fuel Oil No. 2
CH4
(kg/MMBtu)
N2O
(kg/MMBtu)
Fredonia 1
Goldendale
Mint Farm
Frederickson 2
Fredonia 2
Sumas
Fredonia 4
Fredonia 2
Natural Gas
Distillate Fuel Oil No. 2
Natural gas combined cycle
Fredonia 1
Whitehorn 3
Dual-fuel combustion turbines Natural Gas
Dual-fuel combustion turbines Distillate Fuel Oil No. 2
Frederickson Unit 1 Natural gas combined cycle Natural Gas
Natural Gas
Natural Gas
Distillate Fuel Oil No. 2
Dual-fuel combustion turbines
Dual-fuel combustion turbines
Dual-fuel combustion turbines Natural Gas
Fredonia 3
Frederickson 1
Frederickson 1
Dual-fuel combustion turbines
Natural Gas
Total
Natural Gas
Frederickson 2
Natural gas cogeneration
Natural gas combined cycle
Natural gas combined cycle
Dual-fuel combustion turbines
Natural Gas
Dual-fuel combustion turbines Distillate Fuel Oil No. 2
Dual-fuel combustion turbines
CO2 CH4 N2O
(metric ton)
Crystal Mountain
PSE Share of Emissions (4)
Distillate Fuel Oil No. 2
(metric ton) (metric ton)
[1]
Unit ID Unit Type
[2]
Fuel Type
Internal Combustion
Natural GasEncogen 1 Natural gas cogeneration
Encogen 2 Natural gas cogeneration
Encogen 3 Natural gas cogeneration Natural Gas
Natural GasDual-fuel combustion turbines
Dual-fuel combustion turbines Natural Gas
Dual-fuel combustion turbines Distillate Fuel Oil No. 2
Dual-fuel combustion turbines
Ferndale 1 Natural gas combined cycle
Natural Gas
Distillate Fuel Oil No. 2
Natural Gas
Natural Gas
(kg/MMBtu)
Whitehorn 2
Whitehorn 2
Fuel Type CO2
Natural Gas
Ferndale 2
Table A-2
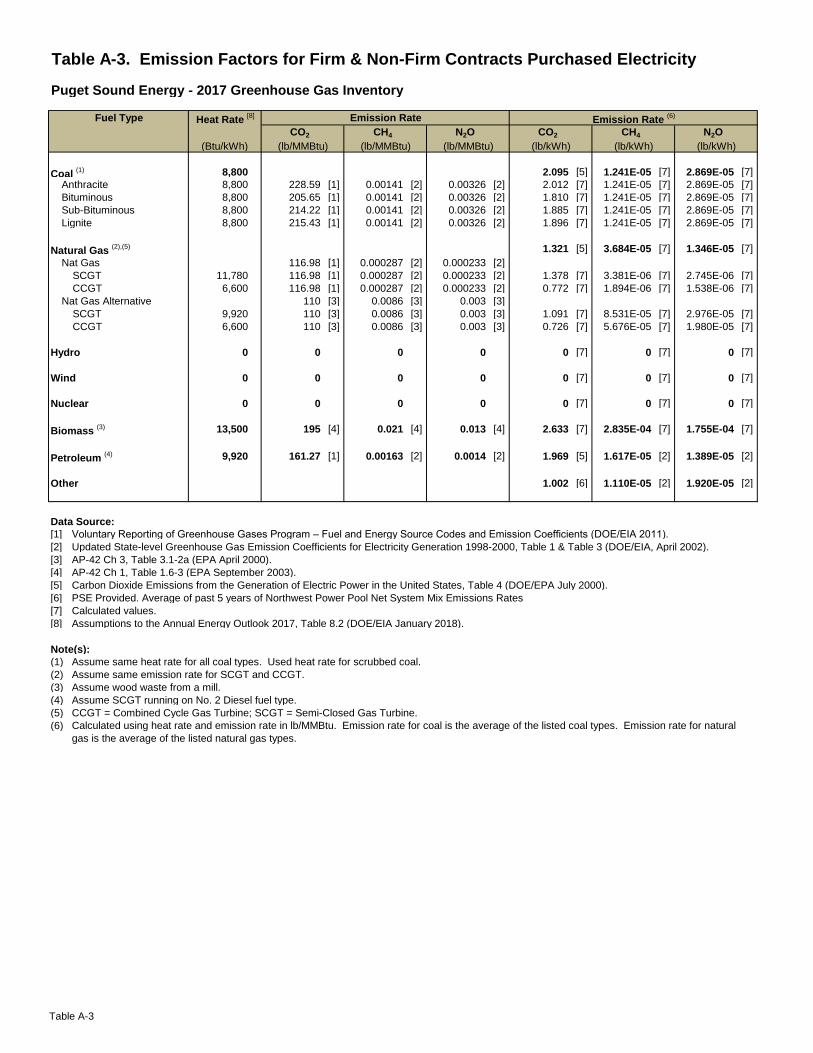
Table A-3. Emission Factors for Firm & Non-Firm Contracts Purchased Electricity
Puget Sound Energy - 2017 Greenhouse Gas Inventory
CO2 CH4 N2O CO2 CH4 N2O
(Btu/kWh)
8,800 2.095 [5] 1.241E-05 [7] 2.869E-05 [7]
8,800 228.59 [1] 0.00141 [2] 0.00326 [2] 2.012 [7] 1.241E-05 [7] 2.869E-05 [7]
8,800 205.65 [1] 0.00141 [2] 0.00326 [2] 1.810 [7] 1.241E-05 [7] 2.869E-05 [7]
8,800 214.22 [1] 0.00141 [2] 0.00326 [2] 1.885 [7] 1.241E-05 [7] 2.869E-05 [7]
8,800 215.43 [1] 0.00141 [2] 0.00326 [2] 1.896 [7] 1.241E-05 [7] 2.869E-05 [7]
1.321 [5] 3.684E-05 [7] 1.346E-05 [7]
116.98 [1] 0.000287 [2] 0.000233 [2]
11,780 116.98 [1] 0.000287 [2] 0.000233 [2] 1.378 [7] 3.381E-06 [7] 2.745E-06 [7]
6,600 116.98 [1] 0.000287 [2] 0.000233 [2] 0.772 [7] 1.894E-06 [7] 1.538E-06 [7]
110 [3] 0.0086 [3] 0.003 [3]
9,920 110 [3] 0.0086 [3] 0.003 [3] 1.091 [7] 8.531E-05 [7] 2.976E-05 [7]
6,600 110 [3] 0.0086 [3] 0.003 [3] 0.726 [7] 5.676E-05 [7] 1.980E-05 [7]
0 0 0 0 0 [7] 0 [7] 0 [7]
0 0 0 0 0 [7] 0 [7] 0 [7]
0 0 0 0 0 [7] 0 [7] 0 [7]
13,500 195 [4] 0.021 [4] 0.013 [4] 2.633 [7] 2.835E-04 [7] 1.755E-04 [7]
9,920 161.27 [1] 0.00163 [2] 0.0014 [2] 1.969 [5] 1.617E-05 [2] 1.389E-05 [2]
1.002 [6] 1.110E-05 [2] 1.920E-05 [2]
Data Source:
[1] Voluntary Reporting of Greenhouse Gases Program – Fuel and Energy Source Codes and Emission Coefficients (DOE/EIA 2011).
[2] Updated State-level Greenhouse Gas Emission Coefficients for Electricity Generation 1998-2000, Table 1 & Table 3 (DOE/EIA, April 2002).
[3] AP-42 Ch 3, Table 3.1-2a (EPA April 2000).
[4] AP-42 Ch 1, Table 1.6-3 (EPA September 2003).
[5] Carbon Dioxide Emissions from the Generation of Electric Power in the United States, Table 4 (DOE/EPA July 2000).
[6] PSE Provided. Average of past 5 years of Northwest Power Pool Net System Mix Emissions Rates
[7] Calculated values.
[8] Assumptions to the Annual Energy Outlook 2017, Table 8.2 (DOE/EIA January 2018).
Note(s):
(1) Assume same heat rate for all coal types. Used heat rate for scrubbed coal.
(2) Assume same emission rate for SCGT and CCGT.
(3) Assume wood waste from a mill.
(4) Assume SCGT running on No. 2 Diesel fuel type.
(5) CCGT = Combined Cycle Gas Turbine; SCGT = Semi-Closed Gas Turbine.
(6) Calculated using heat rate and emission rate in lb/MMBtu. Emission rate for coal is the average of the listed coal types. Emission rate for natural
gas is the average of the listed natural gas types.
Bituminous
Sub-Bituminous
Lignite
Natural Gas (2),(5)
Nat Gas
Nuclear
SCGT
CCGT
Nat Gas Alternative
SCGT
Other
Biomass (3)
Petroleum (4)
Coal (1)
Anthracite
Hydro
Wind
CCGT
(lb/kWh) (lb/kWh)
Heat Rate [8]Fuel Type Emission Rate
(6)Emission Rate
(lb/MMBtu) (lb/MMBtu) (lb/kWh)(lb/MMBtu)
Table A-3
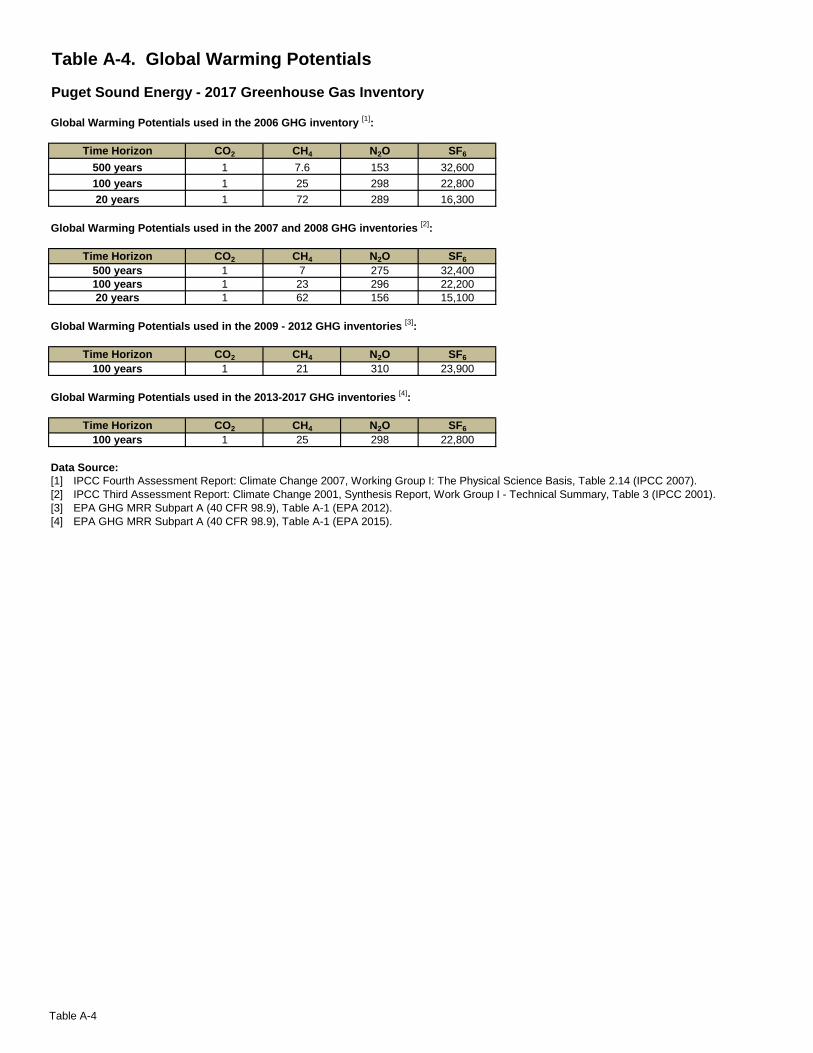
Table A-4. Global Warming Potentials
Puget Sound Energy - 2017 Greenhouse Gas Inventory
Global Warming Potentials used in the 2006 GHG inventory [1]
:
CO2 CH4 N2O SF6
1 7.6 153 32,600
1 25 298 22,800
1 72 289 16,300
Global Warming Potentials used in the 2007 and 2008 GHG inventories [2]
:
CO2 CH4 N2O SF6
1 7 275 32,400
1 23 296 22,200
1 62 156 15,100
Global Warming Potentials used in the 2009 - 2012 GHG inventories [3]
:
CO2 CH4 N2O SF6
1 21 310 23,900
Global Warming Potentials used in the 2013-2017 GHG inventories [4]
:
CO2 CH4 N2O SF6
1 25 298 22,800
Data Source:
[1] IPCC Fourth Assessment Report: Climate Change 2007, Working Group I: The Physical Science Basis, Table 2.14 (IPCC 2007).
[2] IPCC Third Assessment Report: Climate Change 2001, Synthesis Report, Work Group I - Technical Summary, Table 3 (IPCC 2001).
[3] EPA GHG MRR Subpart A (40 CFR 98.9), Table A-1 (EPA 2012).
[4] EPA GHG MRR Subpart A (40 CFR 98.9), Table A-1 (EPA 2015).
Time Horizon
100 years
100 years
20 years
Time Horizon
100 years
500 years
Time Horizon
500 years
100 years
20 years
Time Horizon
Table A-4
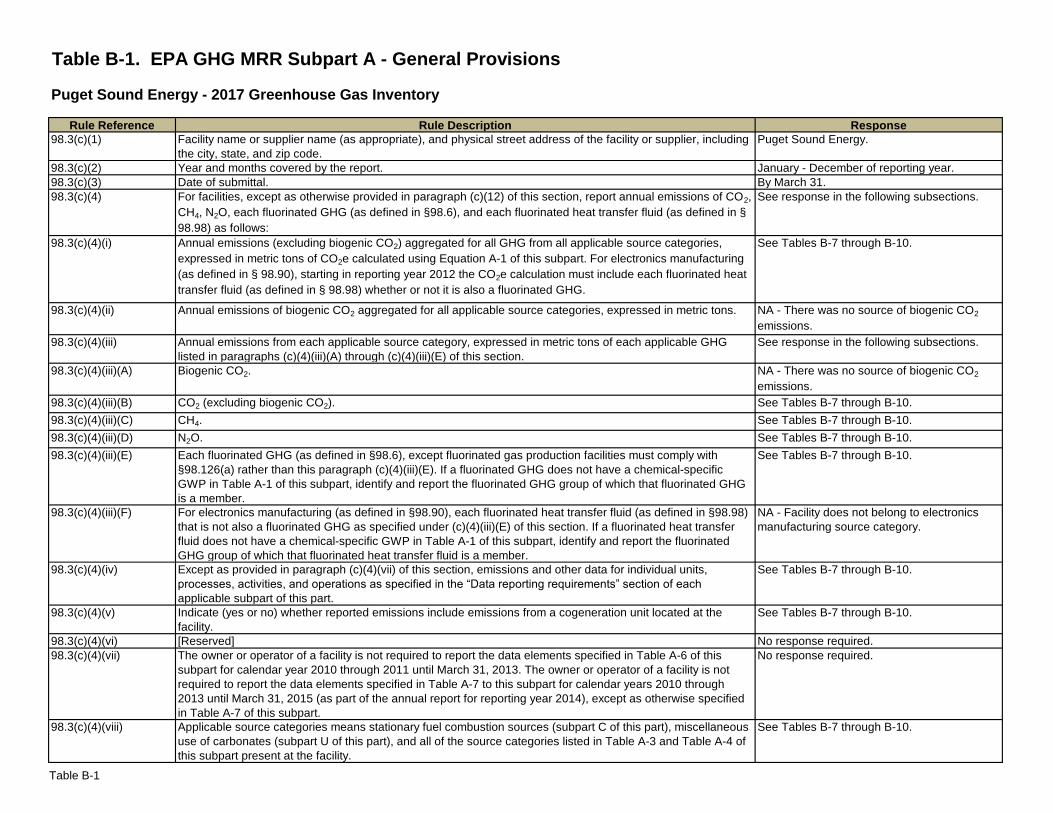
Table B-1. EPA GHG MRR Subpart A - General Provisions
Puget Sound Energy - 2017 Greenhouse Gas Inventory
Rule Description Response
Facility name or supplier name (as appropriate), and physical street address of the facility or supplier, including
the city, state, and zip code.
Puget Sound Energy.
Year and months covered by the report. January - December of reporting year.
Date of submittal. By March 31.
For facilities, except as otherwise provided in paragraph (c)(12) of this section, report annual emissions of CO2,
CH4, N2O, each fluorinated GHG (as defined in §98.6), and each fluorinated heat transfer fluid (as defined in §
98.98) as follows:
See response in the following subsections.
Annual emissions (excluding biogenic CO2) aggregated for all GHG from all applicable source categories,
expressed in metric tons of CO2e calculated using Equation A-1 of this subpart. For electronics manufacturing
(as defined in § 98.90), starting in reporting year 2012 the CO2e calculation must include each fluorinated heat
transfer fluid (as defined in § 98.98) whether or not it is also a fluorinated GHG.
See Tables B-7 through B-10.
Annual emissions of biogenic CO2 aggregated for all applicable source categories, expressed in metric tons. NA - There was no source of biogenic CO2
emissions.
Annual emissions from each applicable source category, expressed in metric tons of each applicable GHG
listed in paragraphs (c)(4)(iii)(A) through (c)(4)(iii)(E) of this section.
See response in the following subsections.
Biogenic CO2. NA - There was no source of biogenic CO2
emissions.
CO2 (excluding biogenic CO2). See Tables B-7 through B-10.
CH4. See Tables B-7 through B-10.
N2O. See Tables B-7 through B-10.
Each fluorinated GHG (as defined in §98.6), except fluorinated gas production facilities must comply with
§98.126(a) rather than this paragraph (c)(4)(iii)(E). If a fluorinated GHG does not have a chemical-specific
GWP in Table A-1 of this subpart, identify and report the fluorinated GHG group of which that fluorinated GHG
is a member.
See Tables B-7 through B-10.
For electronics manufacturing (as defined in §98.90), each fluorinated heat transfer fluid (as defined in §98.98)
that is not also a fluorinated GHG as specified under (c)(4)(iii)(E) of this section. If a fluorinated heat transfer
fluid does not have a chemical-specific GWP in Table A-1 of this subpart, identify and report the fluorinated
GHG group of which that fluorinated heat transfer fluid is a member.
NA - Facility does not belong to electronics
manufacturing source category.
Except as provided in paragraph (c)(4)(vii) of this section, emissions and other data for individual units,
processes, activities, and operations as specified in the “Data reporting requirements” section of each
applicable subpart of this part.
See Tables B-7 through B-10.
Indicate (yes or no) whether reported emissions include emissions from a cogeneration unit located at the
facility.
See Tables B-7 through B-10.
[Reserved] No response required.
The owner or operator of a facility is not required to report the data elements specified in Table A-6 of this
subpart for calendar year 2010 through 2011 until March 31, 2013. The owner or operator of a facility is not
required to report the data elements specified in Table A-7 to this subpart for calendar years 2010 through
2013 until March 31, 2015 (as part of the annual report for reporting year 2014), except as otherwise specified
in Table A-7 of this subpart.
No response required.
Applicable source categories means stationary fuel combustion sources (subpart C of this part), miscellaneous
use of carbonates (subpart U of this part), and all of the source categories listed in Table A-3 and Table A-4 of
this subpart present at the facility.
See Tables B-7 through B-10.
98.3(c)(4)(iii)(E)
98.3(c)(4)(iv)
98.3(c)(4)(v)
98.3(c)(4)(viii)
98.3(c)(4)(vii)
98.3(c)(4)(vi)
98.3(c)(4)(iii)(F)
98.3(c)(4)(iii)(D)
Rule Reference
98.3(c)(1)
98.3(c)(2)
98.3(c)(3)
98.3(c)(4)
98.3(c)(4)(i)
98.3(c)(4)(ii)
98.3(c)(4)(iii)
98.3(c)(4)(iii)(A)
98.3(c)(4)(iii)(B)
98.3(c)(4)(iii)(C)
Table B-1
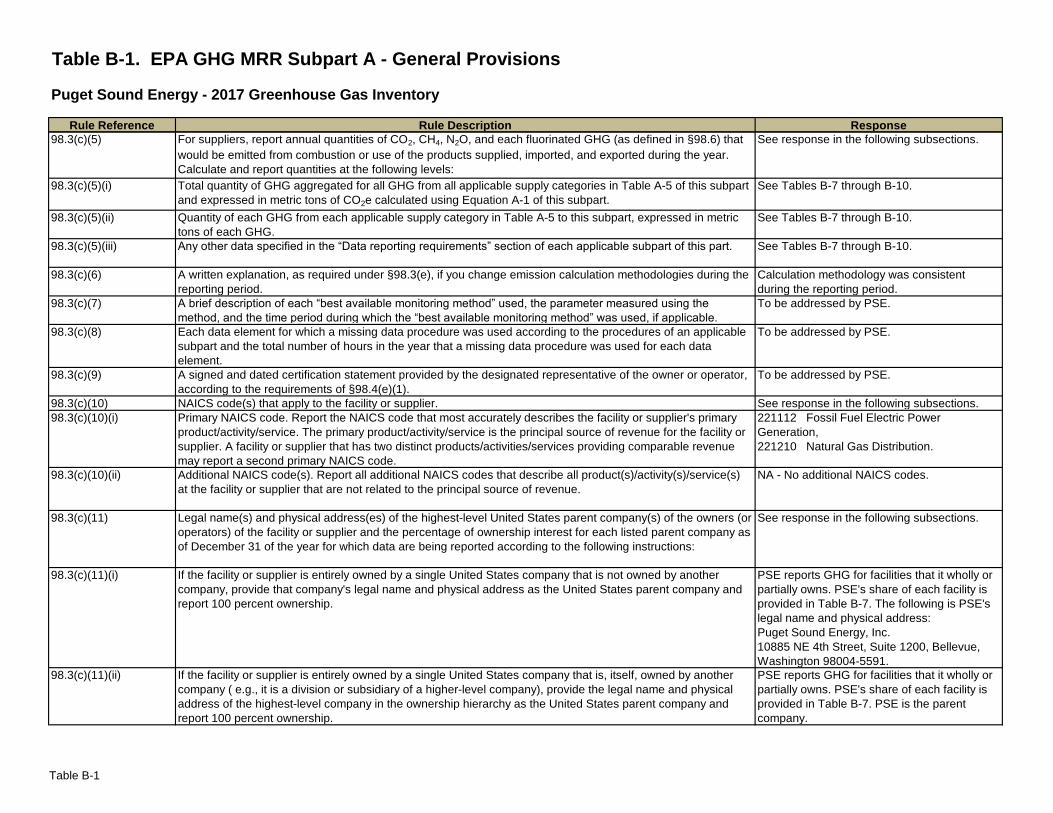
Table B-1. EPA GHG MRR Subpart A - General Provisions
Puget Sound Energy - 2017 Greenhouse Gas Inventory
Rule Description ResponseRule Reference
For suppliers, report annual quantities of CO2, CH4, N2O, and each fluorinated GHG (as defined in §98.6) that
would be emitted from combustion or use of the products supplied, imported, and exported during the year.
Calculate and report quantities at the following levels:
See response in the following subsections.
Total quantity of GHG aggregated for all GHG from all applicable supply categories in Table A-5 of this subpart
and expressed in metric tons of CO2e calculated using Equation A-1 of this subpart.
See Tables B-7 through B-10.
Quantity of each GHG from each applicable supply category in Table A-5 to this subpart, expressed in metric
tons of each GHG.
See Tables B-7 through B-10.
Any other data specified in the “Data reporting requirements” section of each applicable subpart of this part. See Tables B-7 through B-10.
A written explanation, as required under §98.3(e), if you change emission calculation methodologies during the
reporting period.
Calculation methodology was consistent
during the reporting period.
A brief description of each “best available monitoring method” used, the parameter measured using the
method, and the time period during which the “best available monitoring method” was used, if applicable.
To be addressed by PSE.
Each data element for which a missing data procedure was used according to the procedures of an applicable
subpart and the total number of hours in the year that a missing data procedure was used for each data
element.
To be addressed by PSE.
A signed and dated certification statement provided by the designated representative of the owner or operator,
according to the requirements of §98.4(e)(1).
To be addressed by PSE.
NAICS code(s) that apply to the facility or supplier. See response in the following subsections.
Primary NAICS code. Report the NAICS code that most accurately describes the facility or supplier's primary
product/activity/service. The primary product/activity/service is the principal source of revenue for the facility or
supplier. A facility or supplier that has two distinct products/activities/services providing comparable revenue
may report a second primary NAICS code.
221112 Fossil Fuel Electric Power
Generation,
221210 Natural Gas Distribution.
Additional NAICS code(s). Report all additional NAICS codes that describe all product(s)/activity(s)/service(s)
at the facility or supplier that are not related to the principal source of revenue.
NA - No additional NAICS codes.
Legal name(s) and physical address(es) of the highest-level United States parent company(s) of the owners (or
operators) of the facility or supplier and the percentage of ownership interest for each listed parent company as
of December 31 of the year for which data are being reported according to the following instructions:
See response in the following subsections.
If the facility or supplier is entirely owned by a single United States company that is not owned by another
company, provide that company's legal name and physical address as the United States parent company and
report 100 percent ownership.
PSE reports GHG for facilities that it wholly or
partially owns. PSE's share of each facility is
provided in Table B-7. The following is PSE's
legal name and physical address:
Puget Sound Energy, Inc.
10885 NE 4th Street, Suite 1200, Bellevue,
Washington 98004-5591.
If the facility or supplier is entirely owned by a single United States company that is, itself, owned by another
company ( e.g., it is a division or subsidiary of a higher-level company), provide the legal name and physical
address of the highest-level company in the ownership hierarchy as the United States parent company and
report 100 percent ownership.
PSE reports GHG for facilities that it wholly or
partially owns. PSE's share of each facility is
provided in Table B-7. PSE is the parent
company.
98.3(c)(6)
98.3(c)(7)
98.3(c)(8)
98.3(c)(9)
98.3(c)(5)(iii)
98.3(c)(5)
98.3(c)(5)(i)
98.3(c)(5)(ii)
98.3(c)(10)
98.3(c)(10)(i)
98.3(c)(10)(ii)
98.3(c)(11)
98.3(c)(11)(i)
98.3(c)(11)(ii)
Table B-1
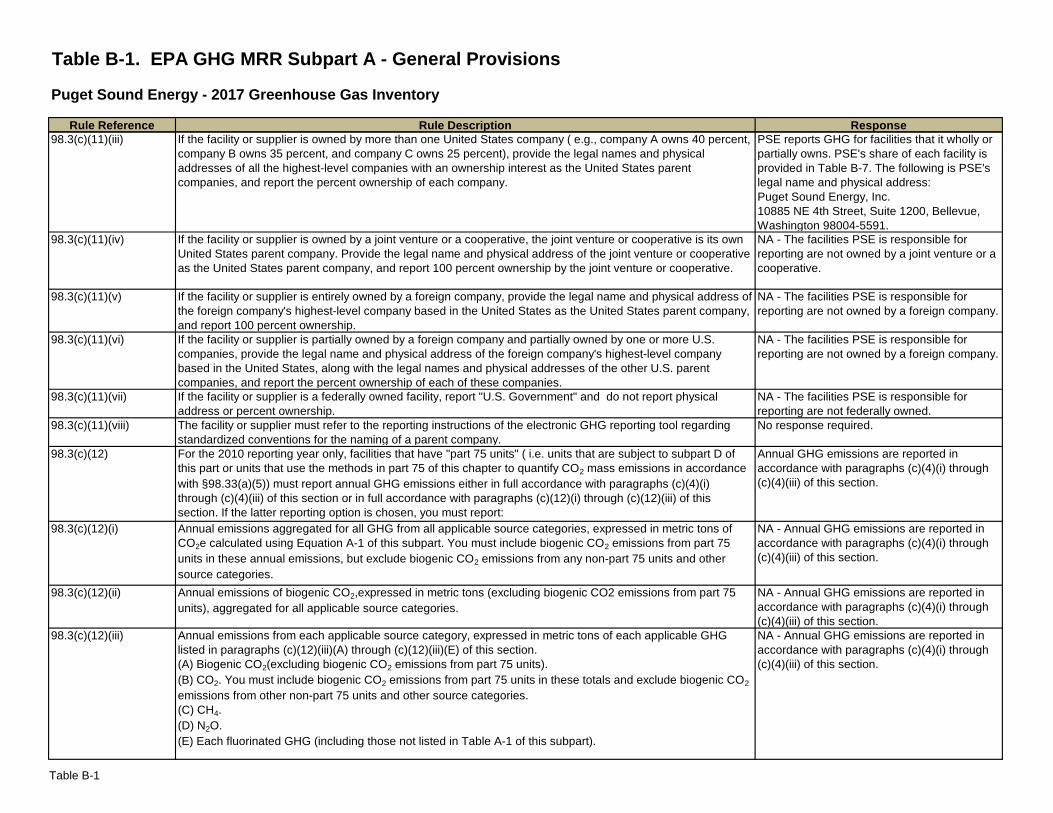
Table B-1. EPA GHG MRR Subpart A - General Provisions
Puget Sound Energy - 2017 Greenhouse Gas Inventory
Rule Description ResponseRule Reference
If the facility or supplier is owned by more than one United States company ( e.g., company A owns 40 percent,
company B owns 35 percent, and company C owns 25 percent), provide the legal names and physical
addresses of all the highest-level companies with an ownership interest as the United States parent
companies, and report the percent ownership of each company.
PSE reports GHG for facilities that it wholly or
partially owns. PSE's share of each facility is
provided in Table B-7. The following is PSE's
legal name and physical address:
Puget Sound Energy, Inc.
10885 NE 4th Street, Suite 1200, Bellevue,
Washington 98004-5591.
If the facility or supplier is owned by a joint venture or a cooperative, the joint venture or cooperative is its own
United States parent company. Provide the legal name and physical address of the joint venture or cooperative
as the United States parent company, and report 100 percent ownership by the joint venture or cooperative.
NA - The facilities PSE is responsible for
reporting are not owned by a joint venture or a
cooperative.
If the facility or supplier is entirely owned by a foreign company, provide the legal name and physical address of
the foreign company's highest-level company based in the United States as the United States parent company,
and report 100 percent ownership.
NA - The facilities PSE is responsible for
reporting are not owned by a foreign company.
If the facility or supplier is partially owned by a foreign company and partially owned by one or more U.S.
companies, provide the legal name and physical address of the foreign company's highest-level company
based in the United States, along with the legal names and physical addresses of the other U.S. parent
companies, and report the percent ownership of each of these companies.
NA - The facilities PSE is responsible for
reporting are not owned by a foreign company.
If the facility or supplier is a federally owned facility, report "U.S. Government" and do not report physical
address or percent ownership.
NA - The facilities PSE is responsible for
reporting are not federally owned.
The facility or supplier must refer to the reporting instructions of the electronic GHG reporting tool regarding
standardized conventions for the naming of a parent company.
No response required.
For the 2010 reporting year only, facilities that have "part 75 units" ( i.e. units that are subject to subpart D of
this part or units that use the methods in part 75 of this chapter to quantify CO2 mass emissions in accordance
with §98.33(a)(5)) must report annual GHG emissions either in full accordance with paragraphs (c)(4)(i)
through (c)(4)(iii) of this section or in full accordance with paragraphs (c)(12)(i) through (c)(12)(iii) of this
section. If the latter reporting option is chosen, you must report:
Annual GHG emissions are reported in
accordance with paragraphs (c)(4)(i) through
(c)(4)(iii) of this section.
Annual emissions aggregated for all GHG from all applicable source categories, expressed in metric tons of
CO2e calculated using Equation A-1 of this subpart. You must include biogenic CO2 emissions from part 75
units in these annual emissions, but exclude biogenic CO2 emissions from any non-part 75 units and other
source categories.
NA - Annual GHG emissions are reported in
accordance with paragraphs (c)(4)(i) through
(c)(4)(iii) of this section.
Annual emissions of biogenic CO2,expressed in metric tons (excluding biogenic CO2 emissions from part 75
units), aggregated for all applicable source categories.
NA - Annual GHG emissions are reported in
accordance with paragraphs (c)(4)(i) through
(c)(4)(iii) of this section.
Annual emissions from each applicable source category, expressed in metric tons of each applicable GHG
listed in paragraphs (c)(12)(iii)(A) through (c)(12)(iii)(E) of this section.
(A) Biogenic CO2(excluding biogenic CO2 emissions from part 75 units).
(B) CO2. You must include biogenic CO2 emissions from part 75 units in these totals and exclude biogenic CO2
emissions from other non-part 75 units and other source categories.
(C) CH4.
(D) N2O.
(E) Each fluorinated GHG (including those not listed in Table A-1 of this subpart).
NA - Annual GHG emissions are reported in
accordance with paragraphs (c)(4)(i) through
(c)(4)(iii) of this section.
98.3(c)(11)(iii)
98.3(c)(11)(iv)
98.3(c)(11)(v)
98.3(c)(11)(vi)
98.3(c)(11)(vii)
98.3(c)(12)
98.3(c)(12)(i)
98.3(c)(12)(ii)
98.3(c)(11)(viii)
98.3(c)(12)(iii)
Table B-1
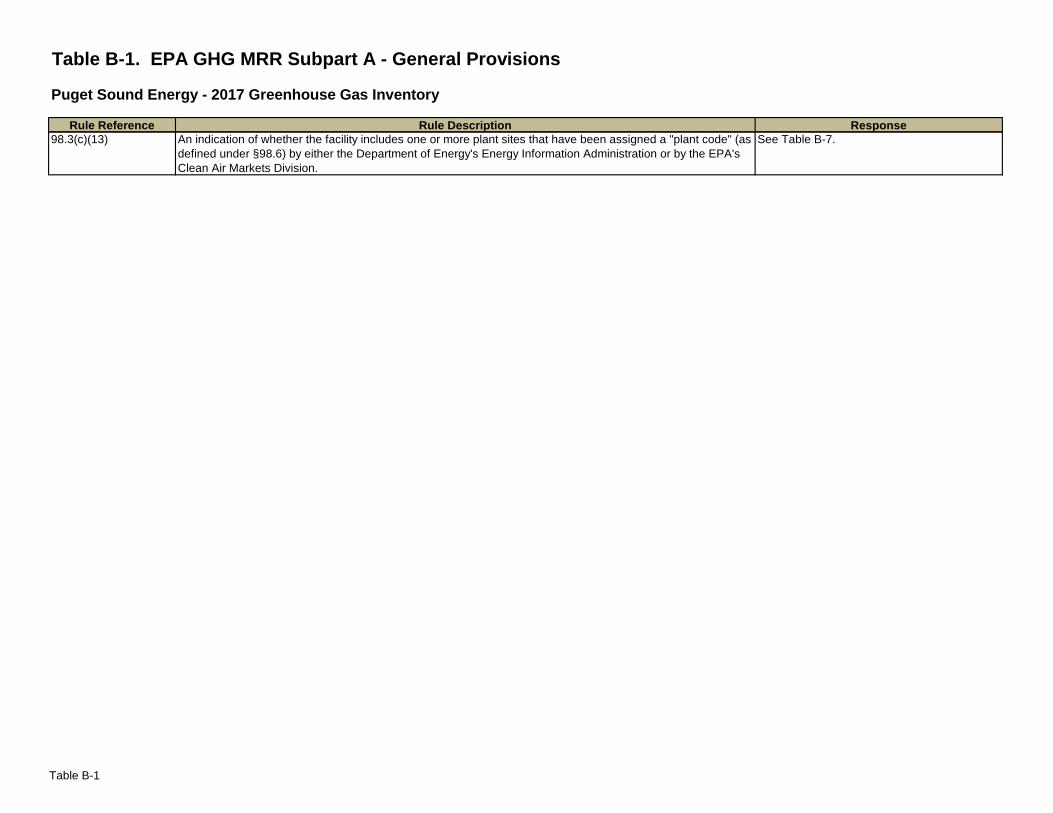
Table B-1. EPA GHG MRR Subpart A - General Provisions
Puget Sound Energy - 2017 Greenhouse Gas Inventory
Rule Description ResponseRule Reference
An indication of whether the facility includes one or more plant sites that have been assigned a "plant code" (as
defined under §98.6) by either the Department of Energy's Energy Information Administration or by the EPA's
Clean Air Markets Division.
See Table B-7.98.3(c)(13)
Table B-1
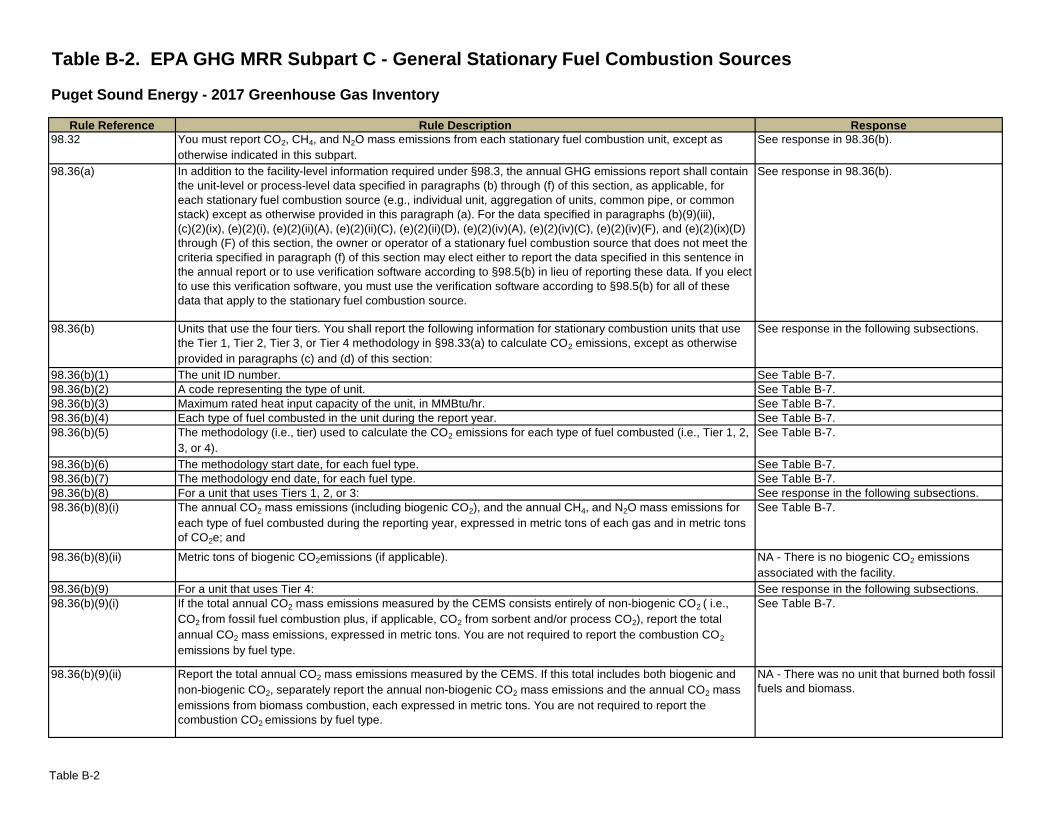
Table B-2. EPA GHG MRR Subpart C - General Stationary Fuel Combustion Sources
Puget Sound Energy - 2017 Greenhouse Gas Inventory
Rule Description Response
You must report CO2, CH4, and N2O mass emissions from each stationary fuel combustion unit, except as
otherwise indicated in this subpart.
See response in 98.36(b).
In addition to the facility-level information required under §98.3, the annual GHG emissions report shall contain
the unit-level or process-level data specified in paragraphs (b) through (f) of this section, as applicable, for
each stationary fuel combustion source (e.g., individual unit, aggregation of units, common pipe, or common
stack) except as otherwise provided in this paragraph (a). For the data specified in paragraphs (b)(9)(iii),
(c)(2)(ix), (e)(2)(i), (e)(2)(ii)(A), (e)(2)(ii)(C), (e)(2)(ii)(D), (e)(2)(iv)(A), (e)(2)(iv)(C), (e)(2)(iv)(F), and (e)(2)(ix)(D)
through (F) of this section, the owner or operator of a stationary fuel combustion source that does not meet the
criteria specified in paragraph (f) of this section may elect either to report the data specified in this sentence in
the annual report or to use verification software according to §98.5(b) in lieu of reporting these data. If you elect
to use this verification software, you must use the verification software according to §98.5(b) for all of these
data that apply to the stationary fuel combustion source.
See response in 98.36(b).
Units that use the four tiers. You shall report the following information for stationary combustion units that use
the Tier 1, Tier 2, Tier 3, or Tier 4 methodology in §98.33(a) to calculate CO2 emissions, except as otherwise
provided in paragraphs (c) and (d) of this section:
See response in the following subsections.
The unit ID number. See Table B-7.
A code representing the type of unit. See Table B-7.
Maximum rated heat input capacity of the unit, in MMBtu/hr. See Table B-7.
Each type of fuel combusted in the unit during the report year. See Table B-7.
The methodology (i.e., tier) used to calculate the CO2 emissions for each type of fuel combusted (i.e., Tier 1, 2,
3, or 4).
See Table B-7.
The methodology start date, for each fuel type. See Table B-7.
The methodology end date, for each fuel type. See Table B-7.
For a unit that uses Tiers 1, 2, or 3: See response in the following subsections.
The annual CO2 mass emissions (including biogenic CO2), and the annual CH4, and N2O mass emissions for
each type of fuel combusted during the reporting year, expressed in metric tons of each gas and in metric tons
of CO2e; and
See Table B-7.
Metric tons of biogenic CO2emissions (if applicable). NA - There is no biogenic CO2 emissions
associated with the facility.
For a unit that uses Tier 4: See response in the following subsections.
If the total annual CO2 mass emissions measured by the CEMS consists entirely of non-biogenic CO2 ( i.e.,
CO2 from fossil fuel combustion plus, if applicable, CO2 from sorbent and/or process CO2), report the total
annual CO2 mass emissions, expressed in metric tons. You are not required to report the combustion CO2
emissions by fuel type.
See Table B-7.
Report the total annual CO2 mass emissions measured by the CEMS. If this total includes both biogenic and
non-biogenic CO2, separately report the annual non-biogenic CO2 mass emissions and the annual CO2 mass
emissions from biomass combustion, each expressed in metric tons. You are not required to report the
combustion CO2 emissions by fuel type.
NA - There was no unit that burned both fossil
fuels and biomass.
98.36(b)(9)
98.36(b)(9)(ii)
98.36(b)(9)(i)
Rule Reference
98.32
98.36(a)
98.36(b)
98.36(b)(1)
98.36(b)(8)(ii)
98.36(b)(2)
98.36(b)(3)
98.36(b)(4)
98.36(b)(5)
98.36(b)(6)
98.36(b)(8)(i)
98.36(b)(7)
98.36(b)(8)
Table B-2
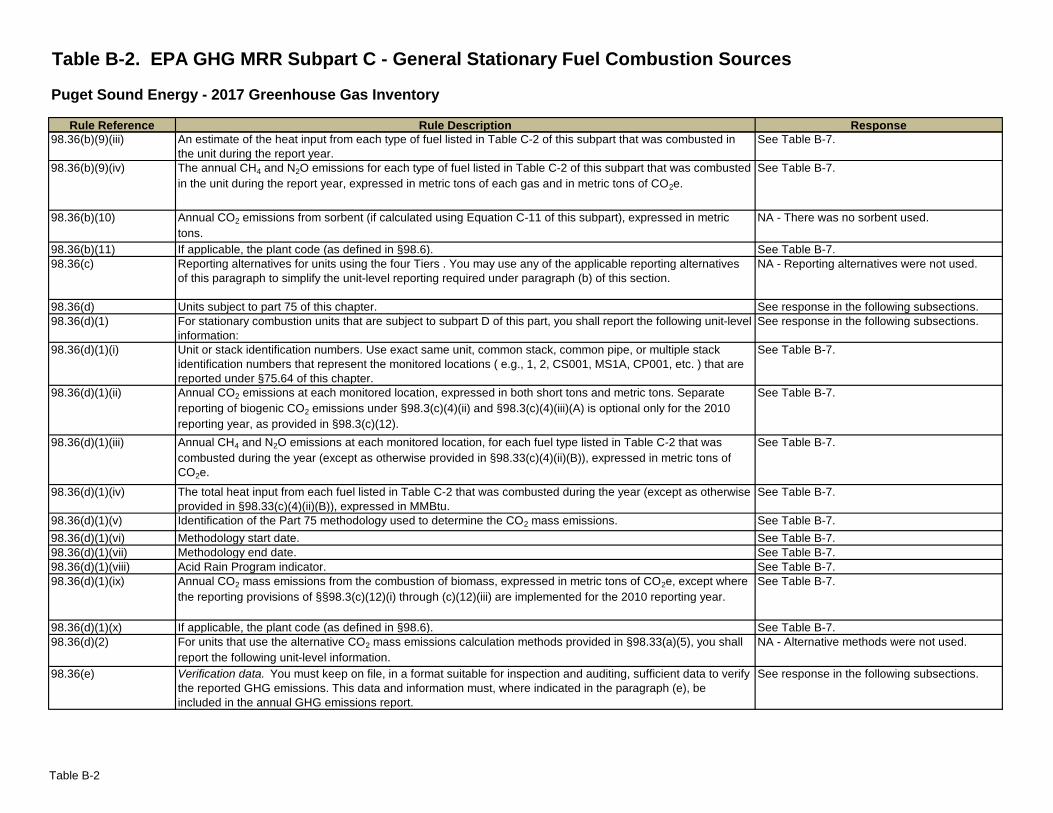
Table B-2. EPA GHG MRR Subpart C - General Stationary Fuel Combustion Sources
Puget Sound Energy - 2017 Greenhouse Gas Inventory
Rule Description ResponseRule Reference
An estimate of the heat input from each type of fuel listed in Table C-2 of this subpart that was combusted in
the unit during the report year.
See Table B-7.
The annual CH4 and N2O emissions for each type of fuel listed in Table C-2 of this subpart that was combusted
in the unit during the report year, expressed in metric tons of each gas and in metric tons of CO2e.
See Table B-7.
Annual CO2 emissions from sorbent (if calculated using Equation C-11 of this subpart), expressed in metric
tons.
NA - There was no sorbent used.
If applicable, the plant code (as defined in §98.6). See Table B-7.
Reporting alternatives for units using the four Tiers . You may use any of the applicable reporting alternatives
of this paragraph to simplify the unit-level reporting required under paragraph (b) of this section.
NA - Reporting alternatives were not used.
Units subject to part 75 of this chapter. See response in the following subsections.
For stationary combustion units that are subject to subpart D of this part, you shall report the following unit-level
information:
See response in the following subsections.
Unit or stack identification numbers. Use exact same unit, common stack, common pipe, or multiple stack
identification numbers that represent the monitored locations ( e.g., 1, 2, CS001, MS1A, CP001, etc. ) that are
reported under §75.64 of this chapter.
See Table B-7.
Annual CO2 emissions at each monitored location, expressed in both short tons and metric tons. Separate
reporting of biogenic CO2 emissions under §98.3(c)(4)(ii) and §98.3(c)(4)(iii)(A) is optional only for the 2010
reporting year, as provided in §98.3(c)(12).
See Table B-7.
Annual CH4 and N2O emissions at each monitored location, for each fuel type listed in Table C-2 that was
combusted during the year (except as otherwise provided in §98.33(c)(4)(ii)(B)), expressed in metric tons of
CO2e.
See Table B-7.
The total heat input from each fuel listed in Table C-2 that was combusted during the year (except as otherwise
provided in §98.33(c)(4)(ii)(B)), expressed in MMBtu.
See Table B-7.
Identification of the Part 75 methodology used to determine the CO2 mass emissions. See Table B-7.
Methodology start date. See Table B-7.
Methodology end date. See Table B-7.
Acid Rain Program indicator. See Table B-7.
Annual CO2 mass emissions from the combustion of biomass, expressed in metric tons of CO2e, except where
the reporting provisions of §§98.3(c)(12)(i) through (c)(12)(iii) are implemented for the 2010 reporting year.
See Table B-7.
If applicable, the plant code (as defined in §98.6). See Table B-7.
For units that use the alternative CO2 mass emissions calculation methods provided in §98.33(a)(5), you shall
report the following unit-level information.
NA - Alternative methods were not used.
Verification data. You must keep on file, in a format suitable for inspection and auditing, sufficient data to verify
the reported GHG emissions. This data and information must, where indicated in the paragraph (e), be
included in the annual GHG emissions report.
See response in the following subsections.98.36(e)
98.36(d)(1)(vi)
98.36(d)(1)(vii)
98.36(d)(1)(viii)
98.36(d)(1)(x)
98.36(d)(2)
98.36(d)
98.36(d)(1)(ix)
98.36(c)
98.36(d)(1)(i)
98.36(d)(1)(ii)
98.36(d)(1)(iii)
98.36(b)(9)(iii)
98.36(b)(10)
98.36(d)(1)
98.36(b)(11)
98.36(b)(9)(iv)
98.36(d)(1)(iv)
98.36(d)(1)(v)
Table B-2
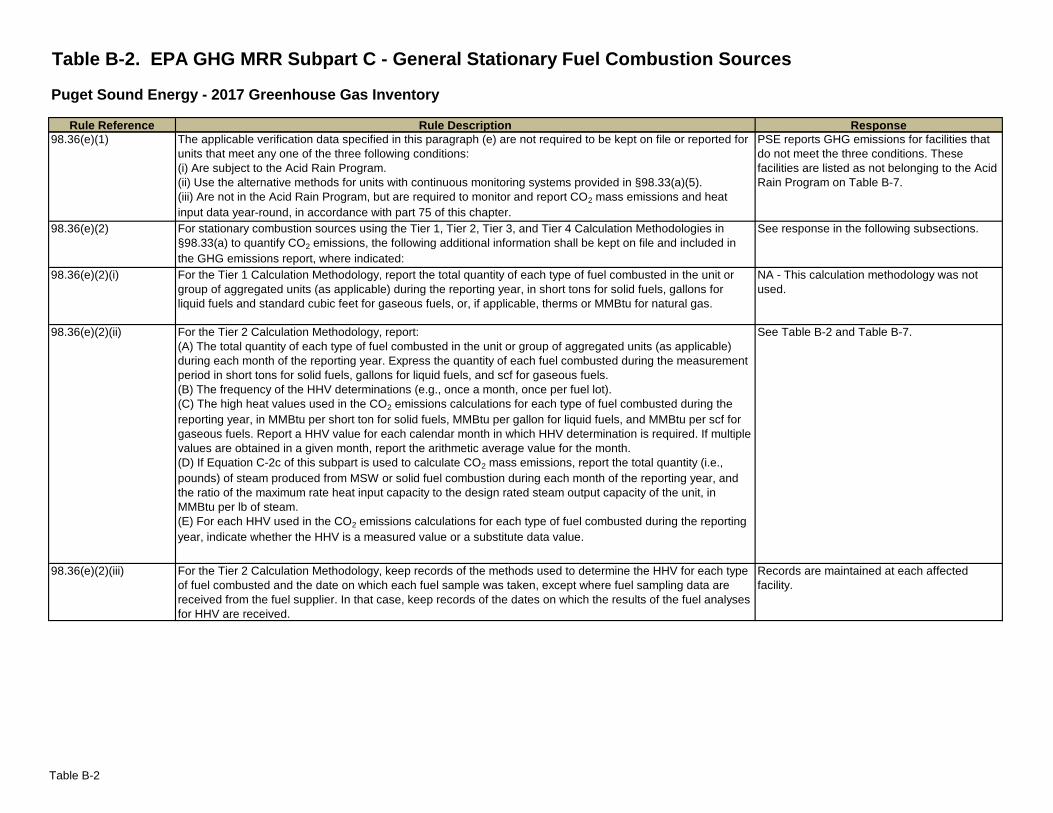
Table B-2. EPA GHG MRR Subpart C - General Stationary Fuel Combustion Sources
Puget Sound Energy - 2017 Greenhouse Gas Inventory
Rule Description ResponseRule Reference
The applicable verification data specified in this paragraph (e) are not required to be kept on file or reported for
units that meet any one of the three following conditions:
(i) Are subject to the Acid Rain Program.
(ii) Use the alternative methods for units with continuous monitoring systems provided in §98.33(a)(5).
(iii) Are not in the Acid Rain Program, but are required to monitor and report CO2 mass emissions and heat
input data year-round, in accordance with part 75 of this chapter.
PSE reports GHG emissions for facilities that
do not meet the three conditions. These
facilities are listed as not belonging to the Acid
Rain Program on Table B-7.
For stationary combustion sources using the Tier 1, Tier 2, Tier 3, and Tier 4 Calculation Methodologies in
§98.33(a) to quantify CO2 emissions, the following additional information shall be kept on file and included in
the GHG emissions report, where indicated:
See response in the following subsections.
For the Tier 1 Calculation Methodology, report the total quantity of each type of fuel combusted in the unit or
group of aggregated units (as applicable) during the reporting year, in short tons for solid fuels, gallons for
liquid fuels and standard cubic feet for gaseous fuels, or, if applicable, therms or MMBtu for natural gas.
NA - This calculation methodology was not
used.
For the Tier 2 Calculation Methodology, report:
(A) The total quantity of each type of fuel combusted in the unit or group of aggregated units (as applicable)
during each month of the reporting year. Express the quantity of each fuel combusted during the measurement
period in short tons for solid fuels, gallons for liquid fuels, and scf for gaseous fuels.
(B) The frequency of the HHV determinations (e.g., once a month, once per fuel lot).
(C) The high heat values used in the CO2 emissions calculations for each type of fuel combusted during the
reporting year, in MMBtu per short ton for solid fuels, MMBtu per gallon for liquid fuels, and MMBtu per scf for
gaseous fuels. Report a HHV value for each calendar month in which HHV determination is required. If multiple
values are obtained in a given month, report the arithmetic average value for the month.
(D) If Equation C-2c of this subpart is used to calculate CO2 mass emissions, report the total quantity (i.e.,
pounds) of steam produced from MSW or solid fuel combustion during each month of the reporting year, and
the ratio of the maximum rate heat input capacity to the design rated steam output capacity of the unit, in
MMBtu per lb of steam.
(E) For each HHV used in the CO2 emissions calculations for each type of fuel combusted during the reporting
year, indicate whether the HHV is a measured value or a substitute data value.
See Table B-2 and Table B-7.
For the Tier 2 Calculation Methodology, keep records of the methods used to determine the HHV for each type
of fuel combusted and the date on which each fuel sample was taken, except where fuel sampling data are
received from the fuel supplier. In that case, keep records of the dates on which the results of the fuel analyses
for HHV are received.
Records are maintained at each affected
facility.
98.36(e)(2)(iii)
98.36(e)(1)
98.36(e)(2)
98.36(e)(2)(i)
98.36(e)(2)(ii)
Table B-2
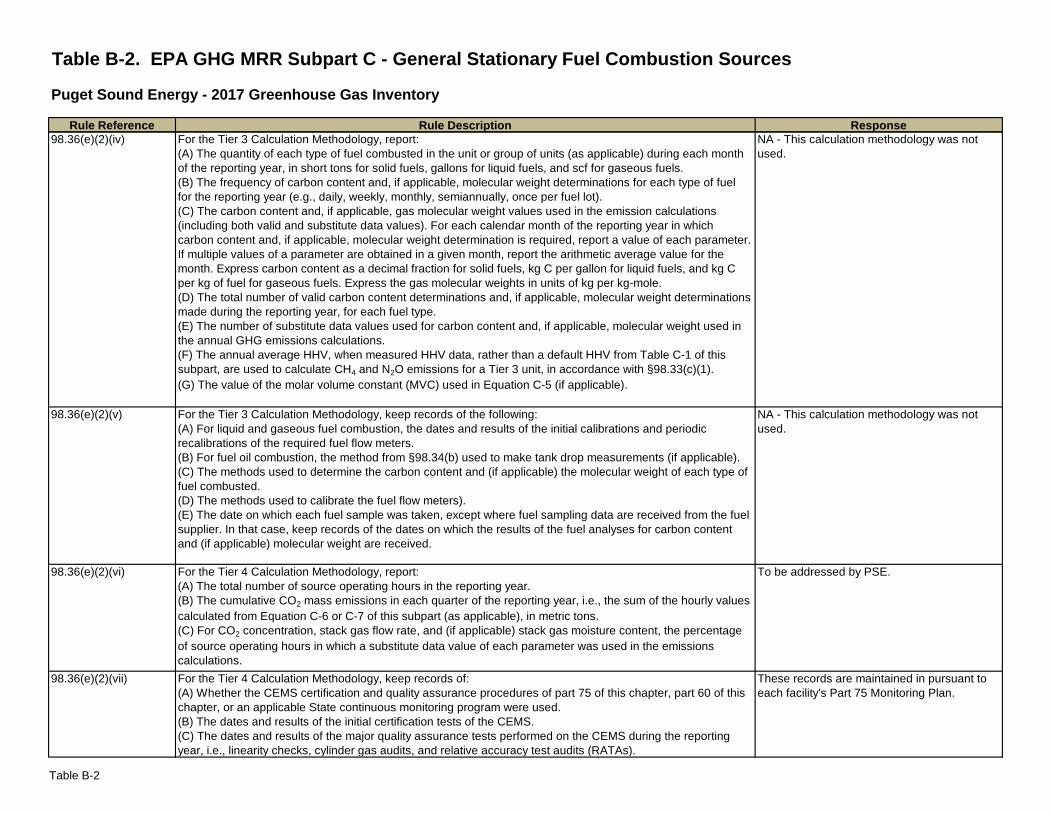
Table B-2. EPA GHG MRR Subpart C - General Stationary Fuel Combustion Sources
Puget Sound Energy - 2017 Greenhouse Gas Inventory
Rule Description ResponseRule Reference
For the Tier 3 Calculation Methodology, report:
(A) The quantity of each type of fuel combusted in the unit or group of units (as applicable) during each month
of the reporting year, in short tons for solid fuels, gallons for liquid fuels, and scf for gaseous fuels.
(B) The frequency of carbon content and, if applicable, molecular weight determinations for each type of fuel
for the reporting year (e.g., daily, weekly, monthly, semiannually, once per fuel lot).
(C) The carbon content and, if applicable, gas molecular weight values used in the emission calculations
(including both valid and substitute data values). For each calendar month of the reporting year in which
carbon content and, if applicable, molecular weight determination is required, report a value of each parameter.
If multiple values of a parameter are obtained in a given month, report the arithmetic average value for the
month. Express carbon content as a decimal fraction for solid fuels, kg C per gallon for liquid fuels, and kg C
per kg of fuel for gaseous fuels. Express the gas molecular weights in units of kg per kg-mole.
(D) The total number of valid carbon content determinations and, if applicable, molecular weight determinations
made during the reporting year, for each fuel type.
(E) The number of substitute data values used for carbon content and, if applicable, molecular weight used in
the annual GHG emissions calculations.
(F) The annual average HHV, when measured HHV data, rather than a default HHV from Table C-1 of this
subpart, are used to calculate CH4 and N2O emissions for a Tier 3 unit, in accordance with §98.33(c)(1).
(G) The value of the molar volume constant (MVC) used in Equation C-5 (if applicable).
NA - This calculation methodology was not
used.
For the Tier 3 Calculation Methodology, keep records of the following:
(A) For liquid and gaseous fuel combustion, the dates and results of the initial calibrations and periodic
recalibrations of the required fuel flow meters.
(B) For fuel oil combustion, the method from §98.34(b) used to make tank drop measurements (if applicable).
(C) The methods used to determine the carbon content and (if applicable) the molecular weight of each type of
fuel combusted.
(D) The methods used to calibrate the fuel flow meters).
(E) The date on which each fuel sample was taken, except where fuel sampling data are received from the fuel
supplier. In that case, keep records of the dates on which the results of the fuel analyses for carbon content
and (if applicable) molecular weight are received.
NA - This calculation methodology was not
used.
For the Tier 4 Calculation Methodology, report:
(A) The total number of source operating hours in the reporting year.
(B) The cumulative CO2 mass emissions in each quarter of the reporting year, i.e., the sum of the hourly values
calculated from Equation C-6 or C-7 of this subpart (as applicable), in metric tons.
(C) For CO2 concentration, stack gas flow rate, and (if applicable) stack gas moisture content, the percentage
of source operating hours in which a substitute data value of each parameter was used in the emissions
calculations.
To be addressed by PSE.
For the Tier 4 Calculation Methodology, keep records of:
(A) Whether the CEMS certification and quality assurance procedures of part 75 of this chapter, part 60 of this
chapter, or an applicable State continuous monitoring program were used.
(B) The dates and results of the initial certification tests of the CEMS.
(C) The dates and results of the major quality assurance tests performed on the CEMS during the reporting
year, i.e., linearity checks, cylinder gas audits, and relative accuracy test audits (RATAs).
These records are maintained in pursuant to
each facility's Part 75 Monitoring Plan.
98.36(e)(2)(iv)
98.36(e)(2)(v)
98.36(e)(2)(vi)
98.36(e)(2)(vii)
Table B-2
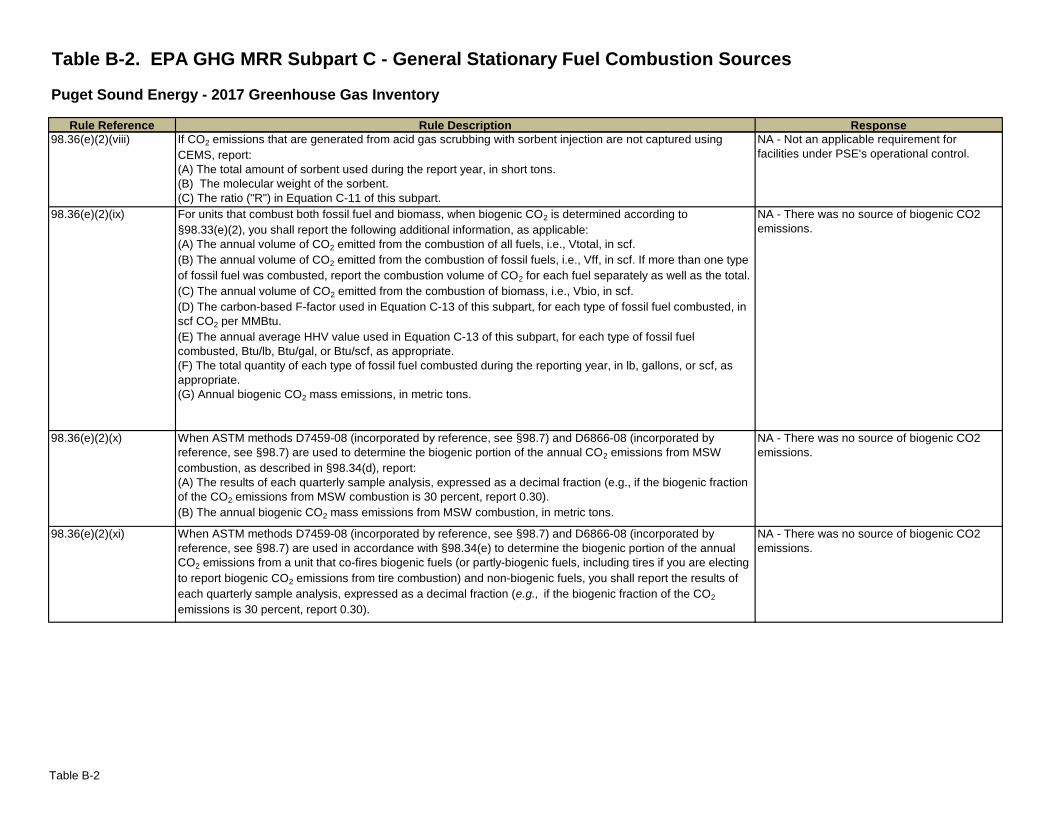
Table B-2. EPA GHG MRR Subpart C - General Stationary Fuel Combustion Sources
Puget Sound Energy - 2017 Greenhouse Gas Inventory
Rule Description ResponseRule Reference
If CO2 emissions that are generated from acid gas scrubbing with sorbent injection are not captured using
CEMS, report:
(A) The total amount of sorbent used during the report year, in short tons.
(B) The molecular weight of the sorbent.
(C) The ratio ("R") in Equation C-11 of this subpart.
NA - Not an applicable requirement for
facilities under PSE's operational control.
For units that combust both fossil fuel and biomass, when biogenic CO2 is determined according to
§98.33(e)(2), you shall report the following additional information, as applicable:
(A) The annual volume of CO2 emitted from the combustion of all fuels, i.e., Vtotal, in scf.
(B) The annual volume of CO2 emitted from the combustion of fossil fuels, i.e., Vff, in scf. If more than one type
of fossil fuel was combusted, report the combustion volume of CO2 for each fuel separately as well as the total.
(C) The annual volume of CO2 emitted from the combustion of biomass, i.e., Vbio, in scf.
(D) The carbon-based F-factor used in Equation C-13 of this subpart, for each type of fossil fuel combusted, in
scf CO2 per MMBtu.
(E) The annual average HHV value used in Equation C-13 of this subpart, for each type of fossil fuel
combusted, Btu/lb, Btu/gal, or Btu/scf, as appropriate.
(F) The total quantity of each type of fossil fuel combusted during the reporting year, in lb, gallons, or scf, as
appropriate.
(G) Annual biogenic CO2 mass emissions, in metric tons.
NA - There was no source of biogenic CO2
emissions.
When ASTM methods D7459-08 (incorporated by reference, see §98.7) and D6866-08 (incorporated by
reference, see §98.7) are used to determine the biogenic portion of the annual CO2 emissions from MSW
combustion, as described in §98.34(d), report:
(A) The results of each quarterly sample analysis, expressed as a decimal fraction (e.g., if the biogenic fraction
of the CO2 emissions from MSW combustion is 30 percent, report 0.30).
(B) The annual biogenic CO2 mass emissions from MSW combustion, in metric tons.
NA - There was no source of biogenic CO2
emissions.
When ASTM methods D7459-08 (incorporated by reference, see §98.7) and D6866-08 (incorporated by
reference, see §98.7) are used in accordance with §98.34(e) to determine the biogenic portion of the annual
CO2 emissions from a unit that co-fires biogenic fuels (or partly-biogenic fuels, including tires if you are electing
to report biogenic CO2 emissions from tire combustion) and non-biogenic fuels, you shall report the results of
each quarterly sample analysis, expressed as a decimal fraction (e.g., if the biogenic fraction of the CO2
emissions is 30 percent, report 0.30).
NA - There was no source of biogenic CO2
emissions.
98.36(e)(2)(x)
98.36(e)(2)(viii)
98.36(e)(2)(ix)
98.36(e)(2)(xi)
Table B-2
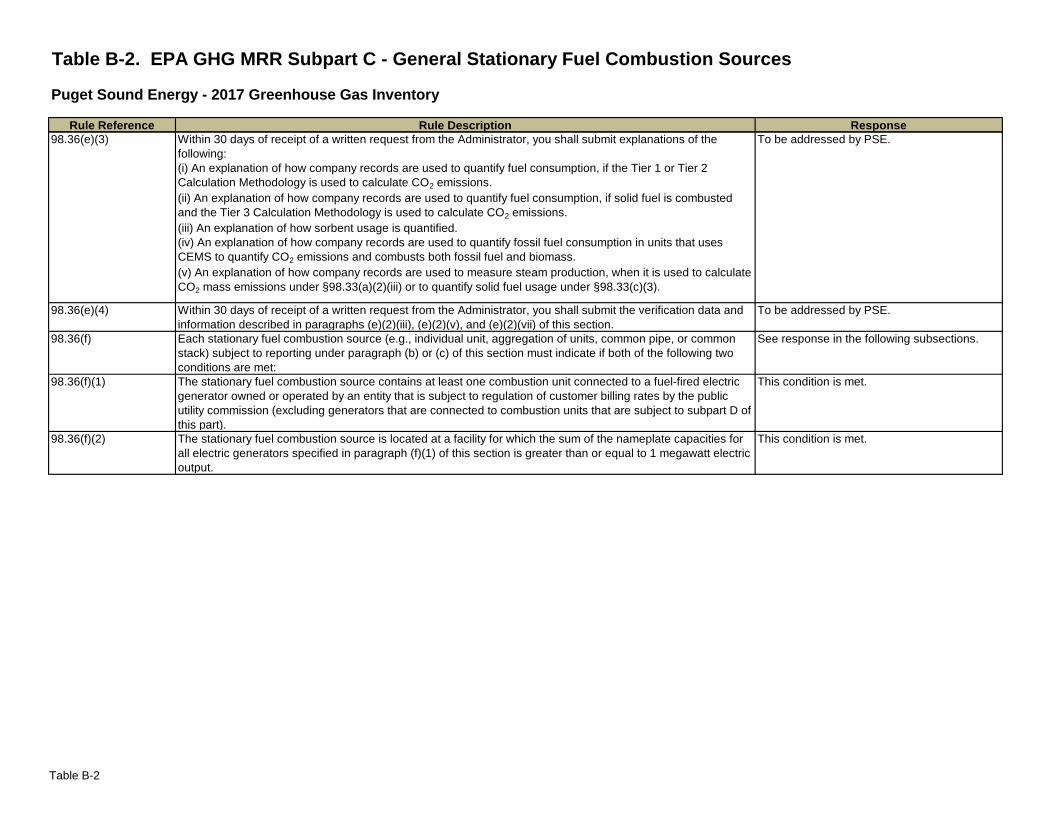
Table B-2. EPA GHG MRR Subpart C - General Stationary Fuel Combustion Sources
Puget Sound Energy - 2017 Greenhouse Gas Inventory
Rule Description ResponseRule Reference
Within 30 days of receipt of a written request from the Administrator, you shall submit explanations of the
following:
(i) An explanation of how company records are used to quantify fuel consumption, if the Tier 1 or Tier 2
Calculation Methodology is used to calculate CO2 emissions.
(ii) An explanation of how company records are used to quantify fuel consumption, if solid fuel is combusted
and the Tier 3 Calculation Methodology is used to calculate CO2 emissions.
(iii) An explanation of how sorbent usage is quantified.
(iv) An explanation of how company records are used to quantify fossil fuel consumption in units that uses
CEMS to quantify CO2 emissions and combusts both fossil fuel and biomass.
(v) An explanation of how company records are used to measure steam production, when it is used to calculate
CO2 mass emissions under §98.33(a)(2)(iii) or to quantify solid fuel usage under §98.33(c)(3).
To be addressed by PSE.
Within 30 days of receipt of a written request from the Administrator, you shall submit the verification data and
information described in paragraphs (e)(2)(iii), (e)(2)(v), and (e)(2)(vii) of this section.
To be addressed by PSE.
Each stationary fuel combustion source (e.g., individual unit, aggregation of units, common pipe, or common
stack) subject to reporting under paragraph (b) or (c) of this section must indicate if both of the following two
conditions are met:
See response in the following subsections.
The stationary fuel combustion source contains at least one combustion unit connected to a fuel-fired electric
generator owned or operated by an entity that is subject to regulation of customer billing rates by the public
utility commission (excluding generators that are connected to combustion units that are subject to subpart D of
this part).
This condition is met.
The stationary fuel combustion source is located at a facility for which the sum of the nameplate capacities for
all electric generators specified in paragraph (f)(1) of this section is greater than or equal to 1 megawatt electric
output.
This condition is met.
98.36(f)(1)
98.36(f)
98.36(f)(2)
98.36(e)(3)
98.36(e)(4)
Table B-2
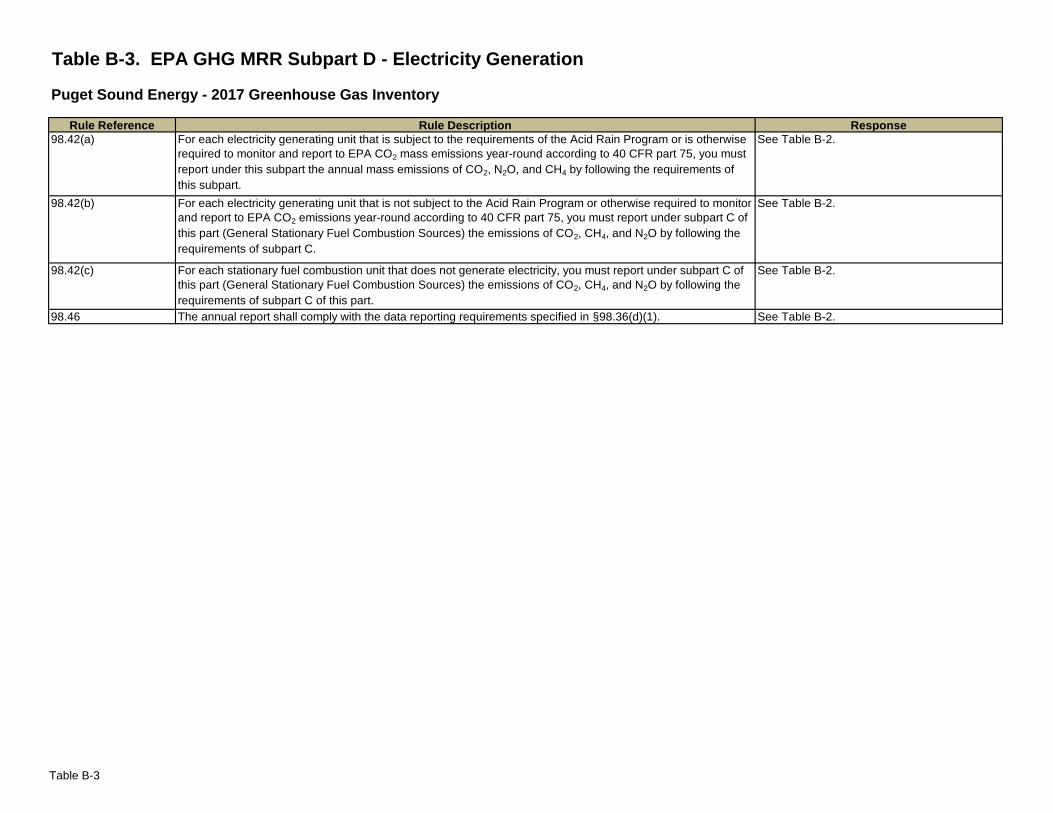
Table B-3. EPA GHG MRR Subpart D - Electricity Generation
Puget Sound Energy - 2017 Greenhouse Gas Inventory
Rule Description Response
For each electricity generating unit that is subject to the requirements of the Acid Rain Program or is otherwise
required to monitor and report to EPA CO2 mass emissions year-round according to 40 CFR part 75, you must
report under this subpart the annual mass emissions of CO2, N2O, and CH4 by following the requirements of
this subpart.
See Table B-2.
For each electricity generating unit that is not subject to the Acid Rain Program or otherwise required to monitor
and report to EPA CO2 emissions year-round according to 40 CFR part 75, you must report under subpart C of
this part (General Stationary Fuel Combustion Sources) the emissions of CO2, CH4, and N2O by following the
requirements of subpart C.
See Table B-2.
For each stationary fuel combustion unit that does not generate electricity, you must report under subpart C of
this part (General Stationary Fuel Combustion Sources) the emissions of CO2, CH4, and N2O by following the
requirements of subpart C of this part.
See Table B-2.
The annual report shall comply with the data reporting requirements specified in §98.36(d)(1). See Table B-2.
Rule Reference
98.42(a)
98.42(b)
98.42(c)
98.46
Table B-3
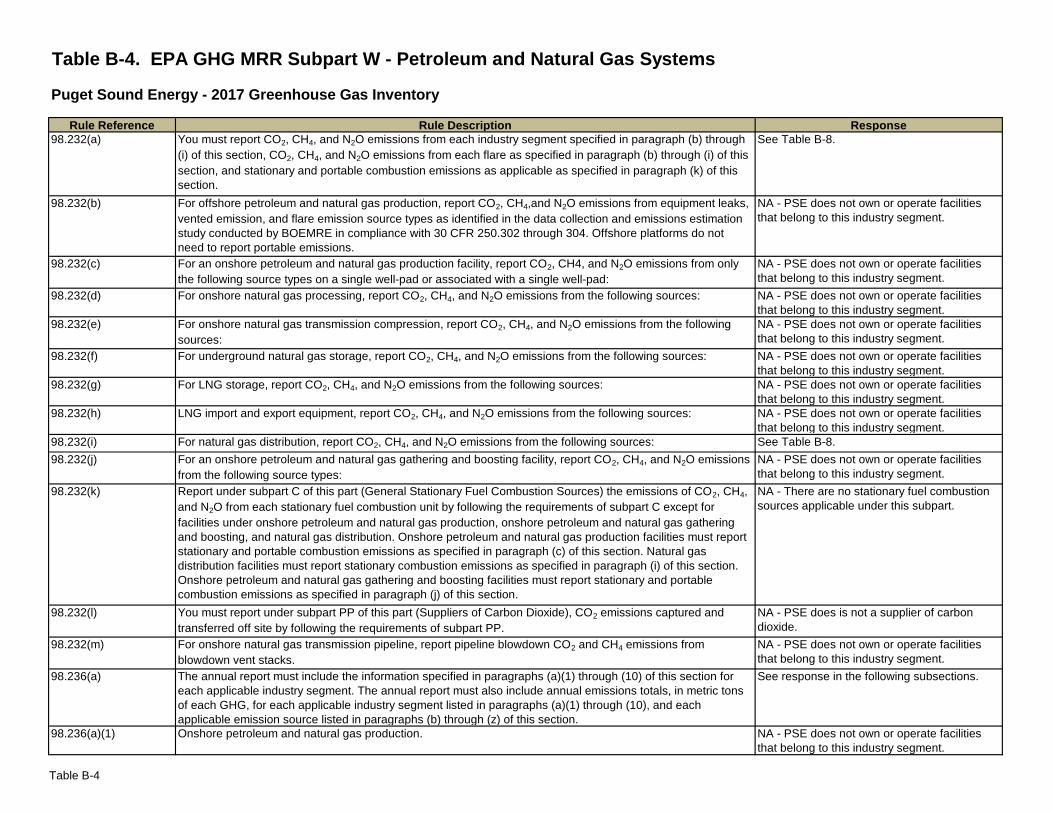
Table B-4. EPA GHG MRR Subpart W - Petroleum and Natural Gas Systems
Puget Sound Energy - 2017 Greenhouse Gas Inventory
Rule Description Response
You must report CO2, CH4, and N2O emissions from each industry segment specified in paragraph (b) through
(i) of this section, CO2, CH4, and N2O emissions from each flare as specified in paragraph (b) through (i) of this
section, and stationary and portable combustion emissions as applicable as specified in paragraph (k) of this
section.
See Table B-8.
For offshore petroleum and natural gas production, report CO2, CH4,and N2O emissions from equipment leaks,
vented emission, and flare emission source types as identified in the data collection and emissions estimation
study conducted by BOEMRE in compliance with 30 CFR 250.302 through 304. Offshore platforms do not
need to report portable emissions.
NA - PSE does not own or operate facilities
that belong to this industry segment.
For an onshore petroleum and natural gas production facility, report CO2, CH4, and N2O emissions from only
the following source types on a single well-pad or associated with a single well-pad:
NA - PSE does not own or operate facilities
that belong to this industry segment.
For onshore natural gas processing, report CO2, CH4, and N2O emissions from the following sources: NA - PSE does not own or operate facilities
that belong to this industry segment.
For onshore natural gas transmission compression, report CO2, CH4, and N2O emissions from the following
sources:
NA - PSE does not own or operate facilities
that belong to this industry segment.
For underground natural gas storage, report CO2, CH4, and N2O emissions from the following sources: NA - PSE does not own or operate facilities
that belong to this industry segment.
For LNG storage, report CO2, CH4, and N2O emissions from the following sources: NA - PSE does not own or operate facilities
that belong to this industry segment.
LNG import and export equipment, report CO2, CH4, and N2O emissions from the following sources: NA - PSE does not own or operate facilities
that belong to this industry segment.
For natural gas distribution, report CO2, CH4, and N2O emissions from the following sources: See Table B-8.
For an onshore petroleum and natural gas gathering and boosting facility, report CO2, CH4, and N2O emissions
from the following source types:
NA - PSE does not own or operate facilities
that belong to this industry segment.
Report under subpart C of this part (General Stationary Fuel Combustion Sources) the emissions of CO2, CH4,
and N2O from each stationary fuel combustion unit by following the requirements of subpart C except for
facilities under onshore petroleum and natural gas production, onshore petroleum and natural gas gathering
and boosting, and natural gas distribution. Onshore petroleum and natural gas production facilities must report
stationary and portable combustion emissions as specified in paragraph (c) of this section. Natural gas
distribution facilities must report stationary combustion emissions as specified in paragraph (i) of this section.
Onshore petroleum and natural gas gathering and boosting facilities must report stationary and portable
combustion emissions as specified in paragraph (j) of this section.
NA - There are no stationary fuel combustion
sources applicable under this subpart.
You must report under subpart PP of this part (Suppliers of Carbon Dioxide), CO2 emissions captured and
transferred off site by following the requirements of subpart PP.
NA - PSE does is not a supplier of carbon
dioxide.
For onshore natural gas transmission pipeline, report pipeline blowdown CO2 and CH4 emissions from
blowdown vent stacks.
NA - PSE does not own or operate facilities
that belong to this industry segment.
The annual report must include the information specified in paragraphs (a)(1) through (10) of this section for
each applicable industry segment. The annual report must also include annual emissions totals, in metric tons
of each GHG, for each applicable industry segment listed in paragraphs (a)(1) through (10), and each
applicable emission source listed in paragraphs (b) through (z) of this section.
See response in the following subsections.
Onshore petroleum and natural gas production. NA - PSE does not own or operate facilities
that belong to this industry segment.
98.232(k)
98.236(a)
98.236(a)(1)
98.232(j)
98.232(l)
98.232(m)
Rule Reference
98.232(a)
98.232(b)
98.232(c)
98.232(d)
98.232(e)
98.232(f)
98.232(g)
98.232(h)
98.232(i)
Table B-4
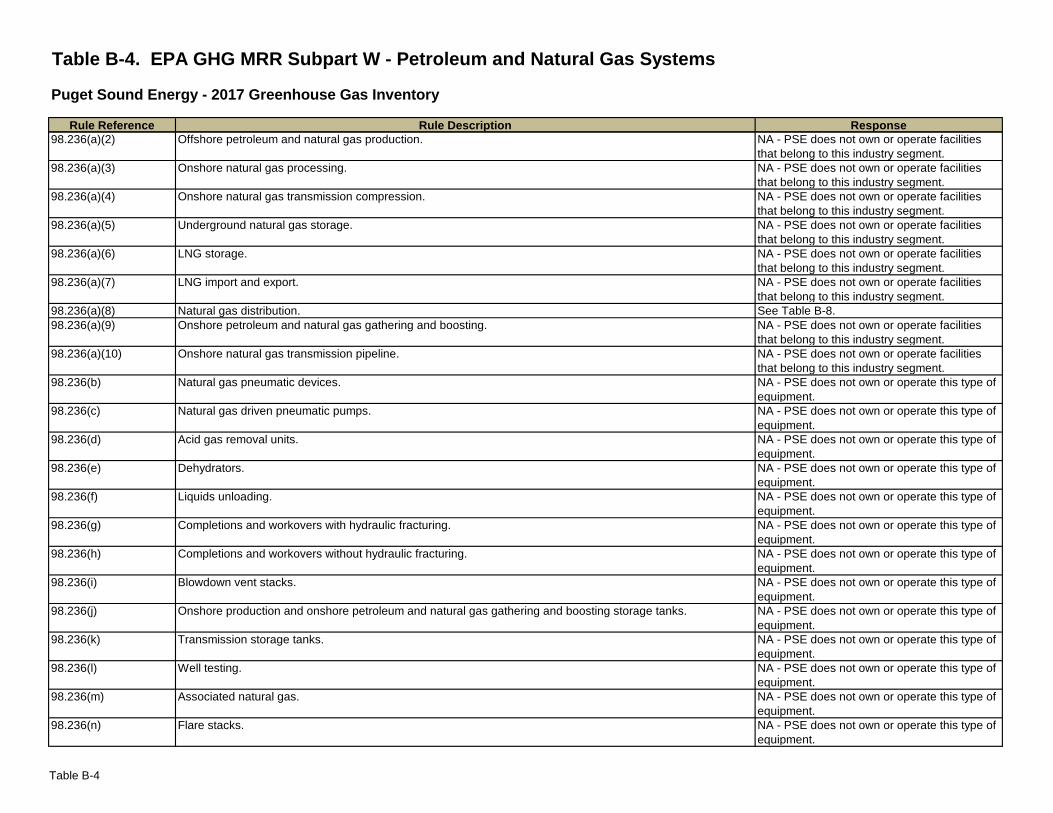
Table B-4. EPA GHG MRR Subpart W - Petroleum and Natural Gas Systems
Puget Sound Energy - 2017 Greenhouse Gas Inventory
Rule Description ResponseRule Reference
Offshore petroleum and natural gas production. NA - PSE does not own or operate facilities
that belong to this industry segment.
Onshore natural gas processing. NA - PSE does not own or operate facilities
that belong to this industry segment.
Onshore natural gas transmission compression. NA - PSE does not own or operate facilities
that belong to this industry segment.
Underground natural gas storage. NA - PSE does not own or operate facilities
that belong to this industry segment.
LNG storage. NA - PSE does not own or operate facilities
that belong to this industry segment.
LNG import and export. NA - PSE does not own or operate facilities
that belong to this industry segment.
Natural gas distribution. See Table B-8.
Onshore petroleum and natural gas gathering and boosting. NA - PSE does not own or operate facilities
that belong to this industry segment.
Onshore natural gas transmission pipeline. NA - PSE does not own or operate facilities
that belong to this industry segment.
Natural gas pneumatic devices. NA - PSE does not own or operate this type of
equipment.
Natural gas driven pneumatic pumps. NA - PSE does not own or operate this type of
equipment.
Acid gas removal units. NA - PSE does not own or operate this type of
equipment.
Dehydrators. NA - PSE does not own or operate this type of
equipment.
Liquids unloading. NA - PSE does not own or operate this type of
equipment.
Completions and workovers with hydraulic fracturing. NA - PSE does not own or operate this type of
equipment.
Completions and workovers without hydraulic fracturing. NA - PSE does not own or operate this type of
equipment.
Blowdown vent stacks. NA - PSE does not own or operate this type of
equipment.
Onshore production and onshore petroleum and natural gas gathering and boosting storage tanks. NA - PSE does not own or operate this type of
equipment.
Transmission storage tanks. NA - PSE does not own or operate this type of
equipment.
Well testing. NA - PSE does not own or operate this type of
equipment.
Associated natural gas. NA - PSE does not own or operate this type of
equipment.
Flare stacks. NA - PSE does not own or operate this type of
equipment.
98.236(d)
98.236(k)
98.236(a)(8)
98.236(f)
98.236(g)
98.236(h)
98.236(i)
98.236(a)(9)
98.236(a)(10)
98.236(b)
98.236(c)
98.236(e)
98.236(j)
98.236(l)
98.236(m)
98.236(n)
98.236(a)(4)
98.236(a)(5)
98.236(a)(6)
98.236(a)(7)
98.236(a)(2)
98.236(a)(3)
Table B-4
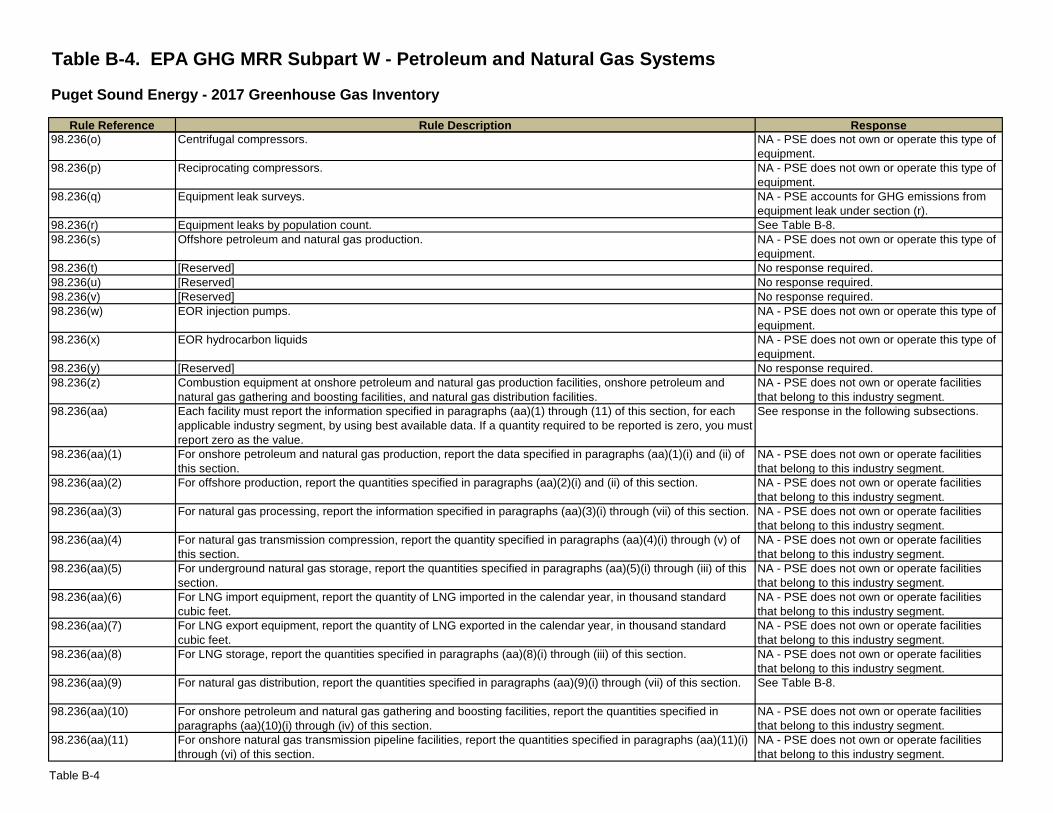
Table B-4. EPA GHG MRR Subpart W - Petroleum and Natural Gas Systems
Puget Sound Energy - 2017 Greenhouse Gas Inventory
Rule Description ResponseRule Reference
Centrifugal compressors. NA - PSE does not own or operate this type of
equipment.
Reciprocating compressors. NA - PSE does not own or operate this type of
equipment.
Equipment leak surveys. NA - PSE accounts for GHG emissions from
equipment leak under section (r).
Equipment leaks by population count. See Table B-8.
Offshore petroleum and natural gas production. NA - PSE does not own or operate this type of
equipment.
[Reserved] No response required.
[Reserved] No response required.
[Reserved] No response required.
EOR injection pumps. NA - PSE does not own or operate this type of
equipment.
EOR hydrocarbon liquids NA - PSE does not own or operate this type of
equipment.
[Reserved] No response required.
Combustion equipment at onshore petroleum and natural gas production facilities, onshore petroleum and
natural gas gathering and boosting facilities, and natural gas distribution facilities.
NA - PSE does not own or operate facilities
that belong to this industry segment.
Each facility must report the information specified in paragraphs (aa)(1) through (11) of this section, for each
applicable industry segment, by using best available data. If a quantity required to be reported is zero, you must
report zero as the value.
See response in the following subsections.
For onshore petroleum and natural gas production, report the data specified in paragraphs (aa)(1)(i) and (ii) of
this section.
NA - PSE does not own or operate facilities
that belong to this industry segment.
For offshore production, report the quantities specified in paragraphs (aa)(2)(i) and (ii) of this section. NA - PSE does not own or operate facilities
that belong to this industry segment.
For natural gas processing, report the information specified in paragraphs (aa)(3)(i) through (vii) of this section. NA - PSE does not own or operate facilities
that belong to this industry segment.
For natural gas transmission compression, report the quantity specified in paragraphs (aa)(4)(i) through (v) of
this section.
NA - PSE does not own or operate facilities
that belong to this industry segment.
For underground natural gas storage, report the quantities specified in paragraphs (aa)(5)(i) through (iii) of this
section.
NA - PSE does not own or operate facilities
that belong to this industry segment.
For LNG import equipment, report the quantity of LNG imported in the calendar year, in thousand standard
cubic feet.
NA - PSE does not own or operate facilities
that belong to this industry segment.
For LNG export equipment, report the quantity of LNG exported in the calendar year, in thousand standard
cubic feet.
NA - PSE does not own or operate facilities
that belong to this industry segment.
For LNG storage, report the quantities specified in paragraphs (aa)(8)(i) through (iii) of this section. NA - PSE does not own or operate facilities
that belong to this industry segment.
For natural gas distribution, report the quantities specified in paragraphs (aa)(9)(i) through (vii) of this section. See Table B-8.
For onshore petroleum and natural gas gathering and boosting facilities, report the quantities specified in
paragraphs (aa)(10)(i) through (iv) of this section.
NA - PSE does not own or operate facilities
that belong to this industry segment.
For onshore natural gas transmission pipeline facilities, report the quantities specified in paragraphs (aa)(11)(i)
through (vi) of this section.
NA - PSE does not own or operate facilities
that belong to this industry segment.
98.236(aa)(11)
98.236(aa)(6)
98.236(aa)(7)
98.236(aa)(8)
98.236(aa)(9)
98.236(aa)(10)
98.236(w)
98.236(p)
98.236(q)
98.236(r)
98.236(s)
98.236(aa)(4)
98.236(x)
98.236(y)
98.236(t)
98.236(u)
98.236(v)
98.236(z)
98.236(aa)
98.236(aa)(1)
98.236(aa)(2)
98.236(aa)(3)
98.236(aa)(5)
98.236(o)
Table B-4
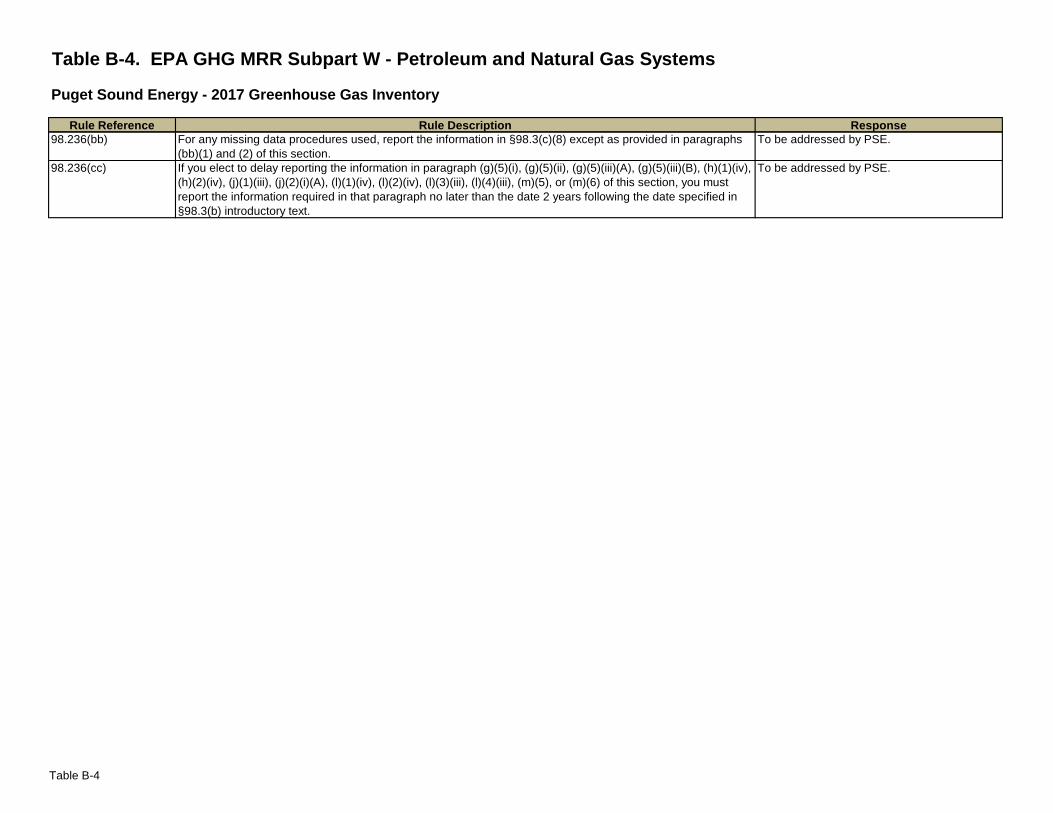
Table B-4. EPA GHG MRR Subpart W - Petroleum and Natural Gas Systems
Puget Sound Energy - 2017 Greenhouse Gas Inventory
Rule Description ResponseRule Reference
For any missing data procedures used, report the information in §98.3(c)(8) except as provided in paragraphs
(bb)(1) and (2) of this section.
To be addressed by PSE.
If you elect to delay reporting the information in paragraph (g)(5)(i), (g)(5)(ii), (g)(5)(iii)(A), (g)(5)(iii)(B), (h)(1)(iv),
(h)(2)(iv), (j)(1)(iii), (j)(2)(i)(A), (l)(1)(iv), (l)(2)(iv), (l)(3)(iii), (l)(4)(iii), (m)(5), or (m)(6) of this section, you must
report the information required in that paragraph no later than the date 2 years following the date specified in
§98.3(b) introductory text.
To be addressed by PSE.98.236(cc)
98.236(bb)
Table B-4
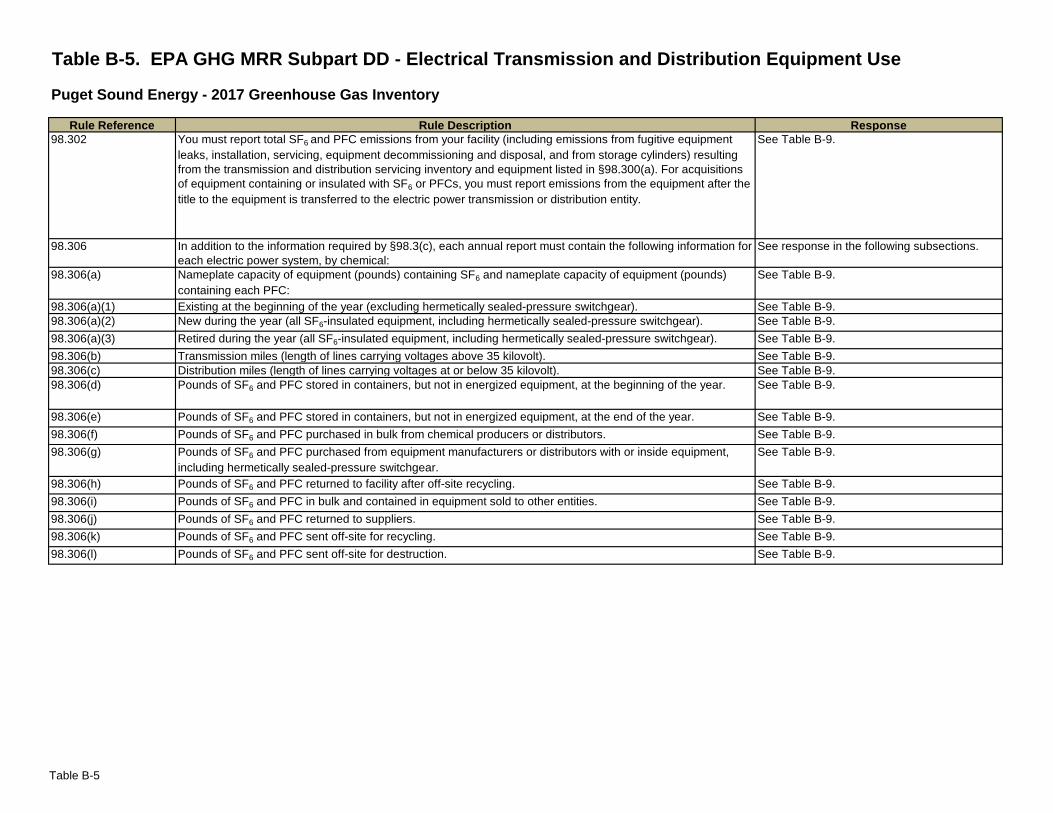
Table B-5. EPA GHG MRR Subpart DD - Electrical Transmission and Distribution Equipment Use
Puget Sound Energy - 2017 Greenhouse Gas Inventory
Rule Description Response
You must report total SF6 and PFC emissions from your facility (including emissions from fugitive equipment
leaks, installation, servicing, equipment decommissioning and disposal, and from storage cylinders) resulting
from the transmission and distribution servicing inventory and equipment listed in §98.300(a). For acquisitions
of equipment containing or insulated with SF6 or PFCs, you must report emissions from the equipment after the
title to the equipment is transferred to the electric power transmission or distribution entity.
See Table B-9.
In addition to the information required by §98.3(c), each annual report must contain the following information for
each electric power system, by chemical:
See response in the following subsections.
Nameplate capacity of equipment (pounds) containing SF6 and nameplate capacity of equipment (pounds)
containing each PFC:
See Table B-9.
Existing at the beginning of the year (excluding hermetically sealed-pressure switchgear). See Table B-9.
New during the year (all SF6-insulated equipment, including hermetically sealed-pressure switchgear). See Table B-9.
Retired during the year (all SF6-insulated equipment, including hermetically sealed-pressure switchgear). See Table B-9.
Transmission miles (length of lines carrying voltages above 35 kilovolt). See Table B-9.
Distribution miles (length of lines carrying voltages at or below 35 kilovolt). See Table B-9.
Pounds of SF6 and PFC stored in containers, but not in energized equipment, at the beginning of the year. See Table B-9.
Pounds of SF6 and PFC stored in containers, but not in energized equipment, at the end of the year. See Table B-9.
Pounds of SF6 and PFC purchased in bulk from chemical producers or distributors. See Table B-9.
Pounds of SF6 and PFC purchased from equipment manufacturers or distributors with or inside equipment,
including hermetically sealed-pressure switchgear.
See Table B-9.
Pounds of SF6 and PFC returned to facility after off-site recycling. See Table B-9.
Pounds of SF6 and PFC in bulk and contained in equipment sold to other entities. See Table B-9.
Pounds of SF6 and PFC returned to suppliers. See Table B-9.
Pounds of SF6 and PFC sent off-site for recycling. See Table B-9.
Pounds of SF6 and PFC sent off-site for destruction. See Table B-9.
98.306(d)
Rule Reference
98.302
98.306
98.306(a)
98.306(a)(1)
98.306(a)(2)
98.306(a)(3)
98.306(b)
98.306(c)
98.306(k)
98.306(l)
98.306(e)
98.306(f)
98.306(g)
98.306(h)
98.306(i)
98.306(j)
Table B-5
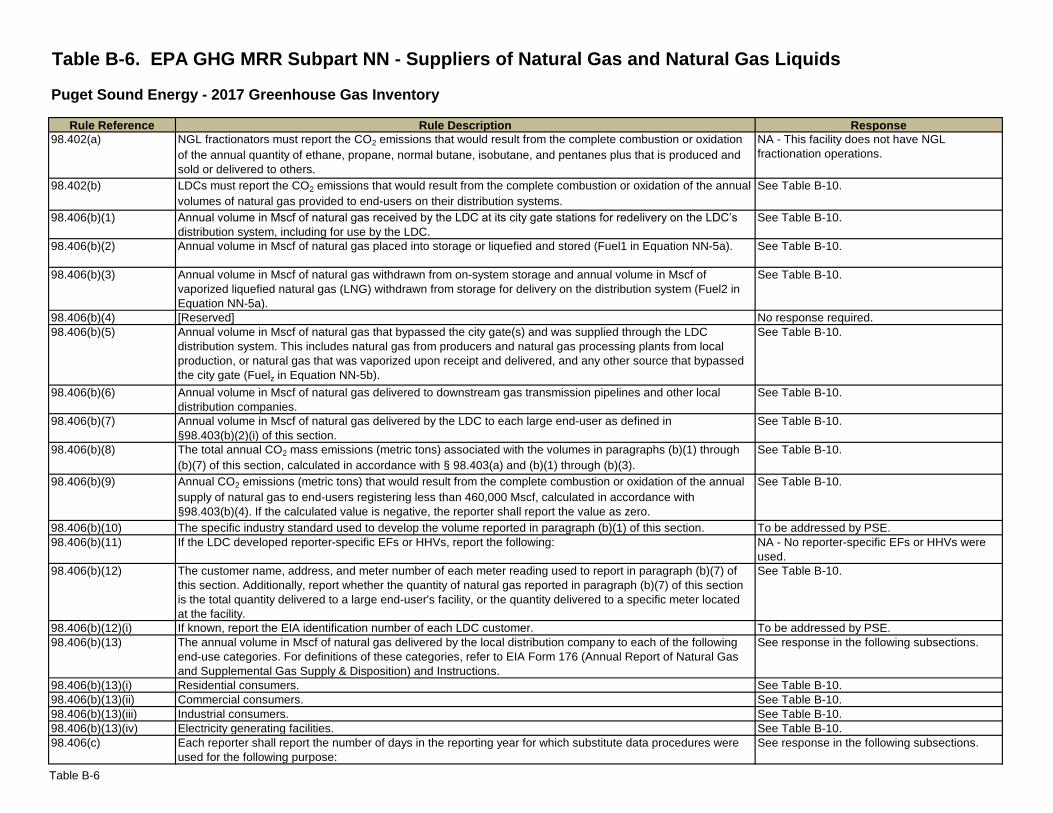
Table B-6. EPA GHG MRR Subpart NN - Suppliers of Natural Gas and Natural Gas Liquids
Puget Sound Energy - 2017 Greenhouse Gas Inventory
Rule Description Response
NGL fractionators must report the CO2 emissions that would result from the complete combustion or oxidation
of the annual quantity of ethane, propane, normal butane, isobutane, and pentanes plus that is produced and
sold or delivered to others.
NA - This facility does not have NGL
fractionation operations.
LDCs must report the CO2 emissions that would result from the complete combustion or oxidation of the annual
volumes of natural gas provided to end-users on their distribution systems.
See Table B-10.
Annual volume in Mscf of natural gas received by the LDC at its city gate stations for redelivery on the LDC’s
distribution system, including for use by the LDC.
See Table B-10.
Annual volume in Mscf of natural gas placed into storage or liquefied and stored (Fuel1 in Equation NN-5a). See Table B-10.
Annual volume in Mscf of natural gas withdrawn from on-system storage and annual volume in Mscf of
vaporized liquefied natural gas (LNG) withdrawn from storage for delivery on the distribution system (Fuel2 in
Equation NN-5a).
See Table B-10.
[Reserved] No response required.
Annual volume in Mscf of natural gas that bypassed the city gate(s) and was supplied through the LDC
distribution system. This includes natural gas from producers and natural gas processing plants from local
production, or natural gas that was vaporized upon receipt and delivered, and any other source that bypassed
the city gate (Fuelz in Equation NN-5b).
See Table B-10.
Annual volume in Mscf of natural gas delivered to downstream gas transmission pipelines and other local
distribution companies.
See Table B-10.
Annual volume in Mscf of natural gas delivered by the LDC to each large end-user as defined in
§98.403(b)(2)(i) of this section.
See Table B-10.
The total annual CO2 mass emissions (metric tons) associated with the volumes in paragraphs (b)(1) through
(b)(7) of this section, calculated in accordance with § 98.403(a) and (b)(1) through (b)(3).
See Table B-10.
Annual CO2 emissions (metric tons) that would result from the complete combustion or oxidation of the annual
supply of natural gas to end-users registering less than 460,000 Mscf, calculated in accordance with
§98.403(b)(4). If the calculated value is negative, the reporter shall report the value as zero.
See Table B-10.
The specific industry standard used to develop the volume reported in paragraph (b)(1) of this section. To be addressed by PSE.
If the LDC developed reporter-specific EFs or HHVs, report the following: NA - No reporter-specific EFs or HHVs were
used.
The customer name, address, and meter number of each meter reading used to report in paragraph (b)(7) of
this section. Additionally, report whether the quantity of natural gas reported in paragraph (b)(7) of this section
is the total quantity delivered to a large end-user's facility, or the quantity delivered to a specific meter located
at the facility.
See Table B-10.
If known, report the EIA identification number of each LDC customer. To be addressed by PSE.
The annual volume in Mscf of natural gas delivered by the local distribution company to each of the following
end-use categories. For definitions of these categories, refer to EIA Form 176 (Annual Report of Natural Gas
and Supplemental Gas Supply & Disposition) and Instructions.
See response in the following subsections.
Residential consumers. See Table B-10.
Commercial consumers. See Table B-10.
Industrial consumers. See Table B-10.
Electricity generating facilities. See Table B-10.
Each reporter shall report the number of days in the reporting year for which substitute data procedures were
used for the following purpose:
See response in the following subsections.
98.406(b)(13)(i)
98.406(b)(7)
98.406(b)(8)
98.406(b)(9)
98.406(b)(10)
98.406(b)(11)
98.406(b)(12)
98.406(b)(12)(i)
98.406(b)(13)
98.406(b)(13)(ii)
98.406(b)(13)(iii)
98.406(b)(13)(iv)
98.406(c)
98.402(a)
98.402(b)
Rule Reference
98.406(b)(6)
98.406(b)(1)
98.406(b)(2)
98.406(b)(3)
98.406(b)(4)
98.406(b)(5)
Table B-6
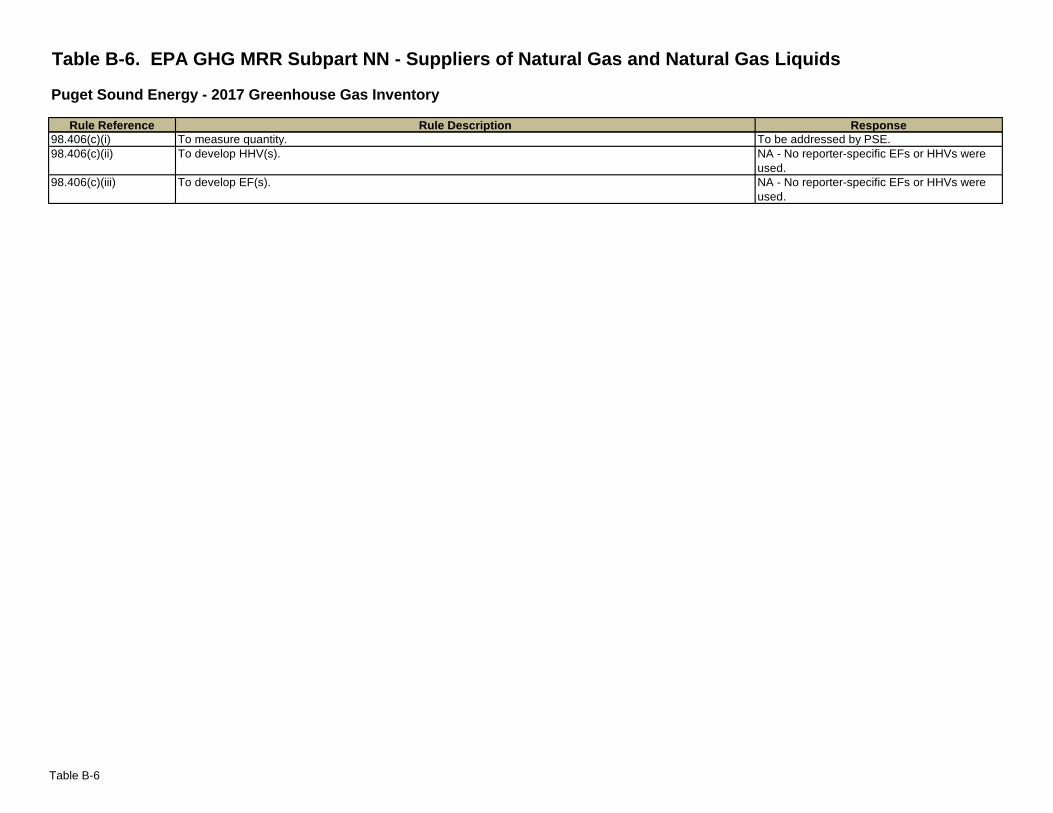
Table B-6. EPA GHG MRR Subpart NN - Suppliers of Natural Gas and Natural Gas Liquids
Puget Sound Energy - 2017 Greenhouse Gas Inventory
Rule Description ResponseRule Reference
To measure quantity. To be addressed by PSE.
To develop HHV(s). NA - No reporter-specific EFs or HHVs were
used.
To develop EF(s). NA - No reporter-specific EFs or HHVs were
used.
98.406(c)(iii)
98.406(c)(i)
98.406(c)(ii)
Table B-6
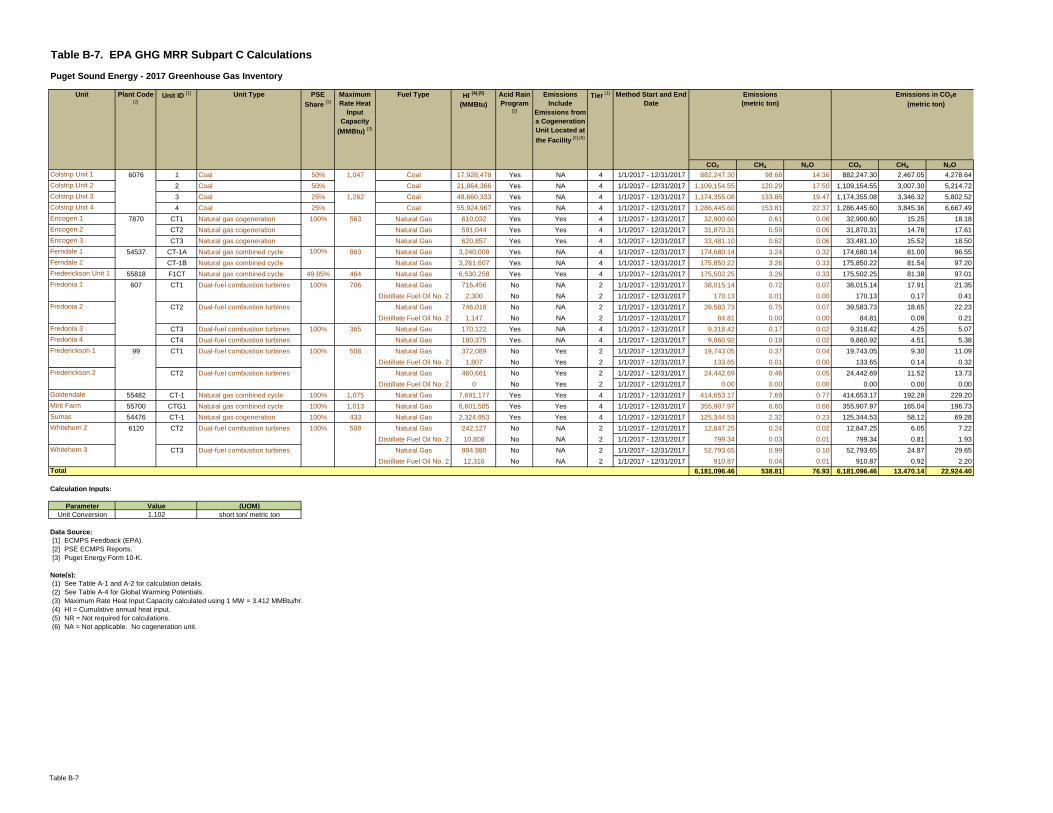
Table B-7. EPA GHG MRR Subpart C Calculations
Puget Sound Energy - 2017 Greenhouse Gas Inventory
Plant Code [2]
Unit ID [1] Unit Type PSE
Share [3]
Maximum
Rate Heat
Input
Capacity
(MMBtu) (3)
Fuel Type HI (4),(5)
(MMBtu)
Acid Rain
Program [2]
Emissions
Include
Emissions from
a Cogeneration
Unit Located at
the Facility [2],(6)
Tier (1) Method Start and End
Date
CO2 CH4 N2O CO2 CH4 N2O
6076 1 Coal 50% 1,047 Coal 17,928,478 Yes NA 4 1/1/2017 - 12/31/2017 882,247.30 98.68 14.36 882,247.30 2,467.05 4,278.64
2 Coal 50% Coal 21,864,366 Yes NA 4 1/1/2017 - 12/31/2017 1,109,154.55 120.29 17.50 1,109,154.55 3,007.30 5,214.72
3 Coal 25% 1,262 Coal 48,660,333 Yes NA 4 1/1/2017 - 12/31/2017 1,174,355.08 133.85 19.47 1,174,355.08 3,346.32 5,802.52
4 Coal 25% Coal 55,924,967 Yes NA 4 1/1/2017 - 12/31/2017 1,286,445.60 153.81 22.37 1,286,445.60 3,845.36 6,667.49
7870 CT1 Natural gas cogeneration 100% 563 Natural Gas 610,032 Yes Yes 4 1/1/2017 - 12/31/2017 32,900.60 0.61 0.06 32,900.60 15.25 18.18
CT2 Natural gas cogeneration Natural Gas 591,044 Yes Yes 4 1/1/2017 - 12/31/2017 31,870.31 0.59 0.06 31,870.31 14.78 17.61
CT3 Natural gas cogeneration Natural Gas 620,857 Yes Yes 4 1/1/2017 - 12/31/2017 33,481.10 0.62 0.06 33,481.10 15.52 18.50
54537 CT-1A Natural gas combined cycle 863 Natural Gas 3,240,008 Yes NA 4 1/1/2017 - 12/31/2017 174,680.14 3.24 0.32 174,680.14 81.00 96.55
CT-1B Natural gas combined cycle Natural Gas 3,261,607 Yes NA 4 1/1/2017 - 12/31/2017 175,850.22 3.26 0.33 175,850.22 81.54 97.20
55818 F1CT Natural gas combined cycle 49.85% 464 Natural Gas 6,530,258 Yes Yes 4 1/1/2017 - 12/31/2017 175,502.25 3.26 0.33 175,502.25 81.38 97.01
607 CT1 Dual-fuel combustion turbines 100% 706 Natural Gas 716,456 No NA 2 1/1/2017 - 12/31/2017 38,015.14 0.72 0.07 38,015.14 17.91 21.35
CT1 Dual-fuel combustion turbines Distillate Fuel Oil No. 2 2,300 No NA 2 1/1/2017 - 12/31/2017 170.13 0.01 0.00 170.13 0.17 0.41
CT2 Dual-fuel combustion turbines Natural Gas 746,018 No NA 2 1/1/2017 - 12/31/2017 39,583.73 0.75 0.07 39,583.73 18.65 22.23
CT2 Dual-fuel combustion turbines Distillate Fuel Oil No. 2 1,147 No NA 2 1/1/2017 - 12/31/2017 84.81 0.00 0.00 84.81 0.09 0.21
CT3 Dual-fuel combustion turbines 100% 365 Natural Gas 170,122 Yes NA 4 1/1/2017 - 12/31/2017 9,318.42 0.17 0.02 9,318.42 4.25 5.07
CT4 Dual-fuel combustion turbines Natural Gas 180,375 Yes NA 4 1/1/2017 - 12/31/2017 9,860.92 0.18 0.02 9,860.92 4.51 5.38
99 CT1 Dual-fuel combustion turbines 100% 508 Natural Gas 372,089 No Yes 2 1/1/2017 - 12/31/2017 19,743.05 0.37 0.04 19,743.05 9.30 11.09
CT1 Dual-fuel combustion turbines Distillate Fuel Oil No. 2 1,807 No Yes 2 1/1/2017 - 12/31/2017 133.65 0.01 0.00 133.65 0.14 0.32
CT2 Dual-fuel combustion turbines Natural Gas 460,661 No Yes 2 1/1/2017 - 12/31/2017 24,442.69 0.46 0.05 24,442.69 11.52 13.73
CT2 Dual-fuel combustion turbines Distillate Fuel Oil No. 2 0 No Yes 2 1/1/2017 - 12/31/2017 0.00 0.00 0.00 0.00 0.00 0.00
55482 CT-1 Natural gas combined cycle 100% 1,075 Natural Gas 7,691,177 Yes Yes 4 1/1/2017 - 12/31/2017 414,653.17 7.69 0.77 414,653.17 192.28 229.20
55700 CTG1 Natural gas combined cycle 100% 1,013 Natural Gas 6,601,585 Yes Yes 4 1/1/2017 - 12/31/2017 355,907.97 6.60 0.66 355,907.97 165.04 196.73
54476 CT-1 Natural gas cogeneration 100% 433 Natural Gas 2,324,953 Yes Yes 4 1/1/2017 - 12/31/2017 125,344.53 2.32 0.23 125,344.53 58.12 69.28
6120 CT2 Dual-fuel combustion turbines 100% 508 Natural Gas 242,127 No NA 2 1/1/2017 - 12/31/2017 12,847.25 0.24 0.02 12,847.25 6.05 7.22
CT2 Dual-fuel combustion turbines Distillate Fuel Oil No. 2 10,808 No NA 2 1/1/2017 - 12/31/2017 799.34 0.03 0.01 799.34 0.81 1.93
CT3 Dual-fuel combustion turbines Natural Gas 994,980 No NA 2 1/1/2017 - 12/31/2017 52,793.65 0.99 0.10 52,793.65 24.87 29.65
CT3 Dual-fuel combustion turbines Distillate Fuel Oil No. 2 12,316 No NA 2 1/1/2017 - 12/31/2017 910.87 0.04 0.01 910.87 0.92 2.20
6,181,096.46 538.81 76.93 6,181,096.46 13,470.14 22,924.40
Calculation Inputs:
(UOM)
short ton/ metric ton
Data Source:
[1] ECMPS Feedback (EPA).
[2] PSE ECMPS Reports.
[3] Puget Energy Form 10-K.
Note(s):
(1) See Table A-1 and A-2 for calculation details.
(2) See Table A-4 for Global Warming Potentials.
(3) Maximum Rate Heat Input Capacity calculated using 1 MW = 3.412 MMBtu/hr.
(4) HI = Cumulative annual heat input.
(5) NR = Not required for calculations.
(6) NA = Not applicable. No cogeneration unit.
Parameter
Whitehorn 3
Total
Frederickson 1
Frederickson 2
Goldendale
Mint Farm
Frederickson 1
Whitehorn 2
Whitehorn 2
Sumas
Whitehorn 3
Encogen 2
Frederickson 2
Encogen 3
Fredonia 1
Fredonia 4
Ferndale 1
Ferndale 2
Fredonia 2
Fredonia 2
Frederickson Unit 1
Fredonia 1
Fredonia 3
100%
Value
1.102
Colstrip Unit 1
Colstrip Unit 2
Colstrip Unit 3
Colstrip Unit 4
Emissions in CO2e
(metric ton)
Unit Conversion
Unit Emissions
(metric ton)
Encogen 1
Table B-7
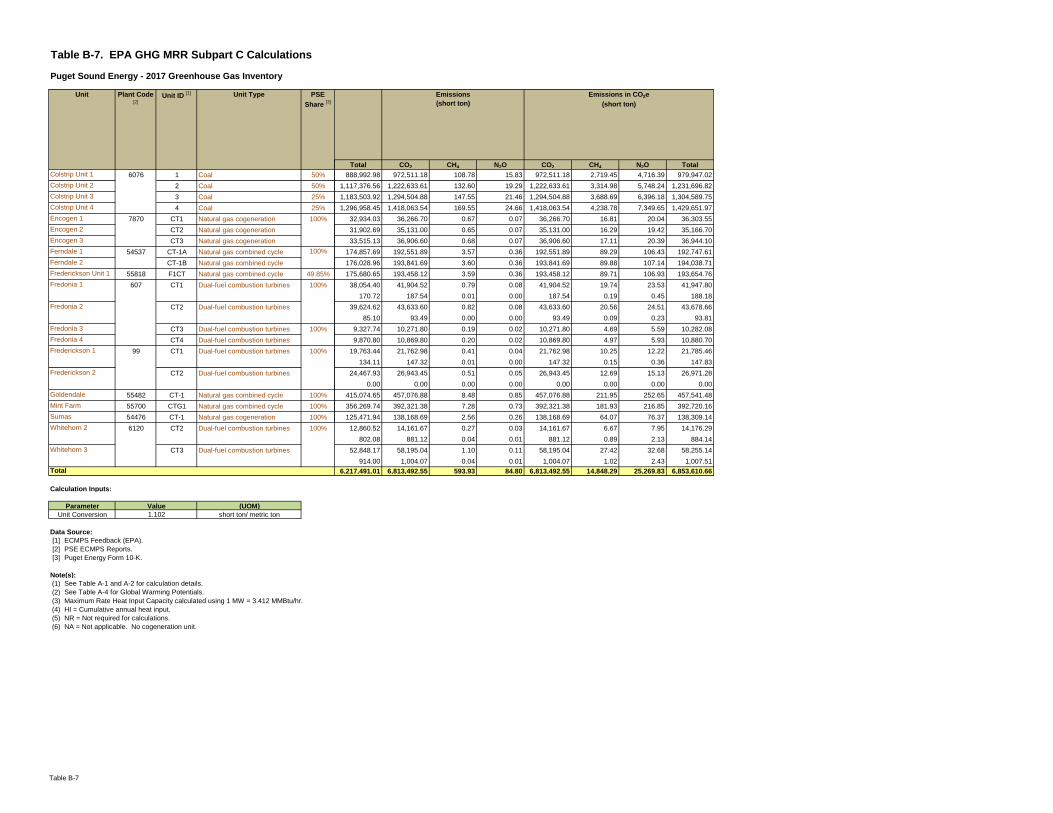
Table B-7. EPA GHG MRR Subpart C Calculations
Puget Sound Energy - 2017 Greenhouse Gas Inventory
Plant Code [2]
Unit ID [1] Unit Type PSE
Share [3]
6076 1 Coal 50%
2 Coal 50%
3 Coal 25%
4 Coal 25%
7870 CT1 Natural gas cogeneration 100%
CT2 Natural gas cogeneration
CT3 Natural gas cogeneration
54537 CT-1A Natural gas combined cycle
CT-1B Natural gas combined cycle
55818 F1CT Natural gas combined cycle 49.85%
607 CT1 Dual-fuel combustion turbines 100%
CT1 Dual-fuel combustion turbines
CT2 Dual-fuel combustion turbines
CT2 Dual-fuel combustion turbines
CT3 Dual-fuel combustion turbines 100%
CT4 Dual-fuel combustion turbines
99 CT1 Dual-fuel combustion turbines 100%
CT1 Dual-fuel combustion turbines
CT2 Dual-fuel combustion turbines
CT2 Dual-fuel combustion turbines
55482 CT-1 Natural gas combined cycle 100%
55700 CTG1 Natural gas combined cycle 100%
54476 CT-1 Natural gas cogeneration 100%
6120 CT2 Dual-fuel combustion turbines 100%
CT2 Dual-fuel combustion turbines
CT3 Dual-fuel combustion turbines
CT3 Dual-fuel combustion turbines
Calculation Inputs:
(UOM)
short ton/ metric ton
Data Source:
[1] ECMPS Feedback (EPA).
[2] PSE ECMPS Reports.
[3] Puget Energy Form 10-K.
Note(s):
(1) See Table A-1 and A-2 for calculation details.
(2) See Table A-4 for Global Warming Potentials.
(3) Maximum Rate Heat Input Capacity calculated using 1 MW = 3.412 MMBtu/hr.
(4) HI = Cumulative annual heat input.
(5) NR = Not required for calculations.
(6) NA = Not applicable. No cogeneration unit.
Parameter
Whitehorn 3
Total
Frederickson 1
Frederickson 2
Goldendale
Mint Farm
Frederickson 1
Whitehorn 2
Whitehorn 2
Sumas
Whitehorn 3
Encogen 2
Frederickson 2
Encogen 3
Fredonia 1
Fredonia 4
Ferndale 1
Ferndale 2
Fredonia 2
Fredonia 2
Frederickson Unit 1
Fredonia 1
Fredonia 3
100%
Value
1.102
Colstrip Unit 1
Colstrip Unit 2
Colstrip Unit 3
Colstrip Unit 4
Unit Conversion
Unit
Encogen 1
Total CO2 CH4 N2O CO2 CH4 N2O Total
888,992.98 972,511.18 108.78 15.83 972,511.18 2,719.45 4,716.39 979,947.02
1,117,376.56 1,222,633.61 132.60 19.29 1,222,633.61 3,314.98 5,748.24 1,231,696.82
1,183,503.92 1,294,504.88 147.55 21.46 1,294,504.88 3,688.69 6,396.18 1,304,589.75
1,296,958.45 1,418,063.54 169.55 24.66 1,418,063.54 4,238.78 7,349.65 1,429,651.97
32,934.03 36,266.70 0.67 0.07 36,266.70 16.81 20.04 36,303.55
31,902.69 35,131.00 0.65 0.07 35,131.00 16.29 19.42 35,166.70
33,515.13 36,906.60 0.68 0.07 36,906.60 17.11 20.39 36,944.10
174,857.69 192,551.89 3.57 0.36 192,551.89 89.29 106.43 192,747.61
176,028.96 193,841.69 3.60 0.36 193,841.69 89.88 107.14 194,038.71
175,680.65 193,458.12 3.59 0.36 193,458.12 89.71 106.93 193,654.76
38,054.40 41,904.52 0.79 0.08 41,904.52 19.74 23.53 41,947.80
170.72 187.54 0.01 0.00 187.54 0.19 0.45 188.18
39,624.62 43,633.60 0.82 0.08 43,633.60 20.56 24.51 43,678.66
85.10 93.49 0.00 0.00 93.49 0.09 0.23 93.81
9,327.74 10,271.80 0.19 0.02 10,271.80 4.69 5.59 10,282.08
9,870.80 10,869.80 0.20 0.02 10,869.80 4.97 5.93 10,880.70
19,763.44 21,762.98 0.41 0.04 21,762.98 10.25 12.22 21,785.46
134.11 147.32 0.01 0.00 147.32 0.15 0.36 147.83
24,467.93 26,943.45 0.51 0.05 26,943.45 12.69 15.13 26,971.28
0.00 0.00 0.00 0.00 0.00 0.00 0.00 0.00
415,074.65 457,076.88 8.48 0.85 457,076.88 211.95 252.65 457,541.48
356,269.74 392,321.38 7.28 0.73 392,321.38 181.93 216.85 392,720.16
125,471.94 138,168.69 2.56 0.26 138,168.69 64.07 76.37 138,309.14
12,860.52 14,161.67 0.27 0.03 14,161.67 6.67 7.95 14,176.29
802.08 881.12 0.04 0.01 881.12 0.89 2.13 884.14
52,848.17 58,195.04 1.10 0.11 58,195.04 27.42 32.68 58,255.14
914.00 1,004.07 0.04 0.01 1,004.07 1.02 2.43 1,007.51
6,217,491.01 6,813,492.55 593.93 84.80 6,813,492.55 14,848.29 25,269.83 6,853,610.66
Emissions in CO2e
(short ton)
Emissions in CO2e
(metric ton)
Emissions
(short ton)
Table B-7
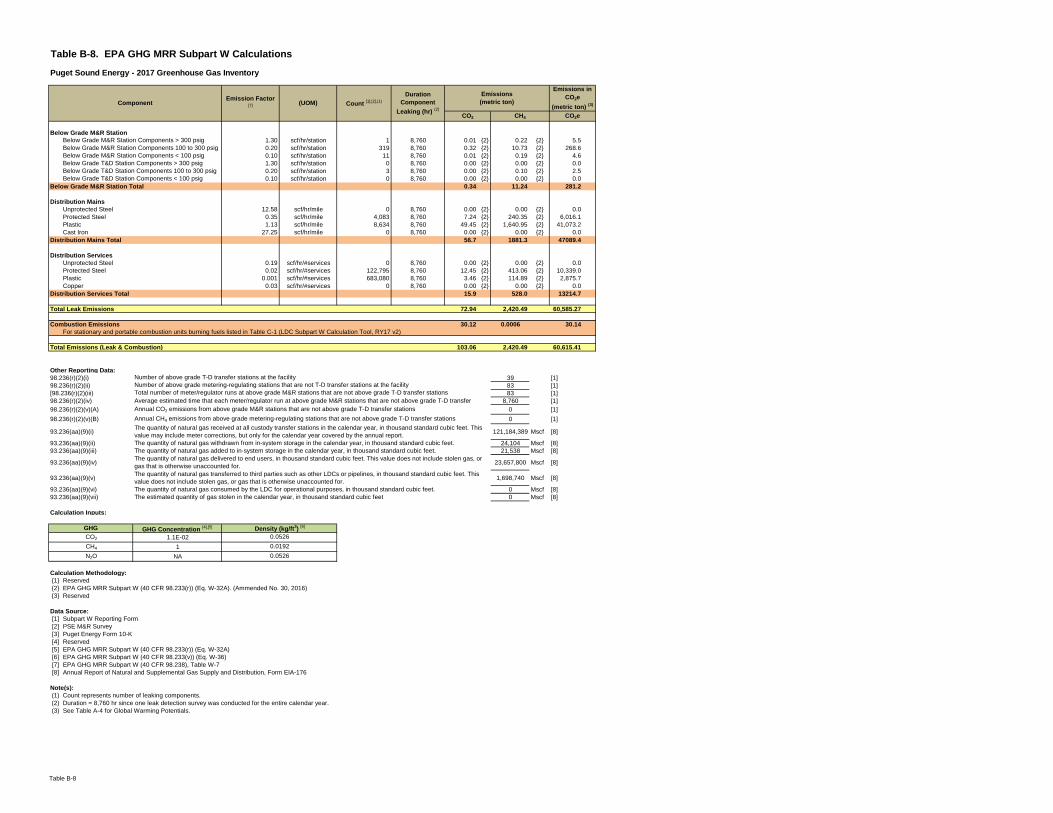
Table B-8. EPA GHG MRR Subpart W Calculations
Puget Sound Energy - 2017 Greenhouse Gas Inventory
Below Grade M&R Station
1.30 scf/hr/station 1 8,760 0.01 {2} 0.22 {2} 5.5
0.20 scf/hr/station 319 8,760 0.32 {2} 10.73 {2} 268.6
0.10 scf/hr/station 11 8,760 0.01 {2} 0.19 {2} 4.6
1.30 scf/hr/station 0 8,760 0.00 {2} 0.00 {2} 0.0
0.20 scf/hr/station 3 8,760 0.00 {2} 0.10 {2} 2.5
0.10 scf/hr/station 0 8,760 0.00 {2} 0.00 {2} 0.0
Below Grade M&R Station Total 0.34 11.24 281.2
Distribution Mains
Unprotected Steel 12.58 scf/hr/mile 0 8,760 0.00 {2} 0.00 {2} 0.0
Protected Steel 0.35 scf/hr/mile 4,083 8,760 7.24 {2} 240.35 {2} 6,016.1
Plastic 1.13 scf/hr/mile 8,634 8,760 49.45 {2} 1,640.95 {2} 41,073.2
Cast Iron 27.25 scf/hr/mile 0 8,760 0.00 {2} 0.00 {2} 0.0
Distribution Mains Total 56.7 1881.3 47089.4
Distribution Services
Unprotected Steel 0.19 scf/hr/#services 0 8,760 0.00 {2} 0.00 {2} 0.0
Protected Steel 0.02 scf/hr/#services 122,795 8,760 12.45 {2} 413.06 {2} 10,339.0
Plastic 0.001 scf/hr/#services 683,080 8,760 3.46 {2} 114.89 {2} 2,875.7
Copper 0.03 scf/hr/#services 0 8,760 0.00 {2} 0.00 {2} 0.0
Distribution Services Total 15.9 528.0 13214.7
Total Leak Emissions 72.94 2,420.49 60,585.27
Combustion Emissions 30.12 0.0006 30.14
For stationary and portable combustion units burning fuels listed in Table C-1 (LDC Subpart W Calculation Tool, RY17 v2)
Total Emissions (Leak & Combustion) 103.06 2,420.49 60,615.41
Other Reporting Data:
98.236(r)(2)(i) 39 [1]
98.236(r)(2)(ii) 83 [1]
[98.236(r)(2)(iii) 83 [1]
98.236(r)(2)(iv) 8,760 [1]
98.236(r)(2)(v)(A) 0 [1]
98.236(r)(2)(v)(B) 0 [1]
93.236(aa)(9)(i) 121,184,389 Mscf [8]
93.236(aa)(9)(ii) 24,104 Mscf [8]
93.236(aa)(9)(iii) 21,538 Mscf [8]
93.236(aa)(9)(iv) 23,657,800 Mscf [8]
93.236(aa)(9)(v) 1,698,740 Mscf [8]
93.236(aa)(9)(vi) 0 Mscf [8]
93.236(aa)(9)(vii) 0 Mscf [8]
Calculation Inputs:
GHG Concentration [4],[5]
1.1E-02
1
NA
Calculation Methodology:
{1} Reserved
{2} EPA GHG MRR Subpart W (40 CFR 98.233(r)) (Eq. W-32A). (Ammended No. 30, 2016)
{3} Reserved
Data Source:
[1] Subpart W Reporting Form
[2] PSE M&R Survey
[3] Puget Energy Form 10-K
[4] Reserved
[5] EPA GHG MRR Subpart W (40 CFR 98.233(r)) (Eq. W-32A)
[6] EPA GHG MRR Subpart W (40 CFR 98.233(v)) (Eq. W-36)
[7] EPA GHG MRR Subpart W (40 CFR 98.238), Table W-7
[8] Annual Report of Natural and Supplemental Gas Supply and Distribution, Form EIA-176
Note(s):
(1) Count represents number of leaking components.
(2) Duration = 8,760 hr since one leak detection survey was conducted for the entire calendar year.
(3) See Table A-4 for Global Warming Potentials.
N2O
GHG Density (kg/ft3)
[6]
0.0526
0.0192
0.0526
CO2
Below Grade M&R Station Components > 300 psig
Number of above grade T-D transfer stations at the facility
Number of above grade metering-regulating stations that are not T-D transfer stations at the facility
Total number of meter/regulator runs at above grade M&R stations that are not above grade T-D transfer stations
CH4
The estimated quantity of gas stolen in the calendar year, in thousand standard cubic feet
The quantity of natural gas withdrawn from in-system storage in the calendar year, in thousand standard cubic feet.
The quantity of natural gas added to in-system storage in the calendar year, in thousand standard cubic feet.
The quantity of natural gas delivered to end users, in thousand standard cubic feet. This value does not include stolen gas, or
gas that is otherwise unaccounted for.
The quantity of natural gas transferred to third parties such as other LDCs or pipelines, in thousand standard cubic feet. This
value does not include stolen gas, or gas that is otherwise unaccounted for.
The quantity of natural gas consumed by the LDC for operational purposes, in thousand standard cubic feet.
Below Grade T&D Station Components > 300 psig
Below Grade T&D Station Components 100 to 300 psig
Below Grade T&D Station Components < 100 psig
CH4 CO2e
The quantity of natural gas received at all custody transfer stations in the calendar year, in thousand standard cubic feet. This
value may include meter corrections, but only for the calendar year covered by the annual report.
Below Grade M&R Station Components < 100 psig
Emissions
(metric ton)
Emissions in
CO2e
(metric ton) (3)Component
Duration
Component
Leaking (hr) (2)
Count [1],[2],(1)(UOM)
Average estimated time that each meter/regulator run at above grade M&R stations that are not above grade T-D transfer
Annual CO2 emissions from above grade M&R stations that are not above grade T-D transfer stations
Annual CH4 emissions from above grade metering-regulating stations that are not above grade T-D transfer stations
Emission Factor [7]
CO2
Below Grade M&R Station Components 100 to 300 psig
Table B-8
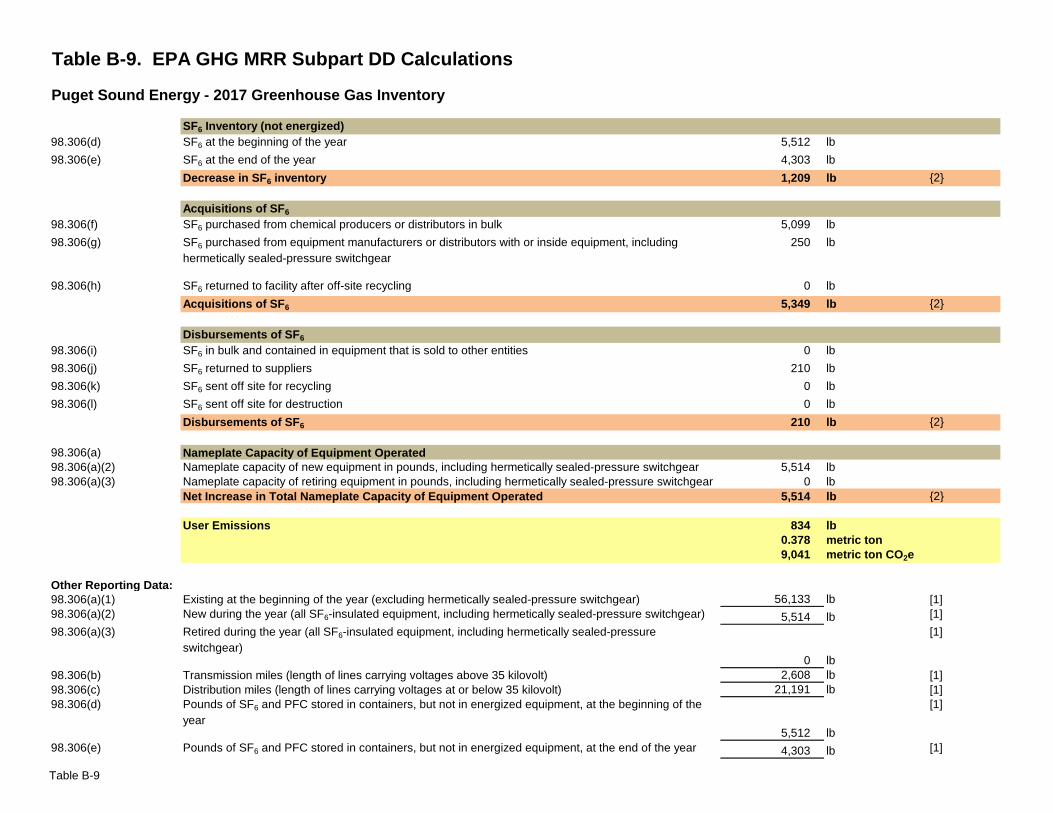
Table B-9. EPA GHG MRR Subpart DD Calculations
Puget Sound Energy - 2017 Greenhouse Gas Inventory
98.306(d) 5,512 lb
98.306(e) 4,303 lb
1,209 lb {2}
98.306(f) 5,099 lb
98.306(g) 250 lb
98.306(h) 0 lb
5,349 lb {2}
98.306(i) 0 lb
98.306(j) 210 lb
98.306(k) 0 lb
98.306(l) 0 lb
210 lb {2}
98.306(a)
98.306(a)(2) 5,514 lb
98.306(a)(3) 0 lb
5,514 lb {2}
834 lb
0.378 metric ton
9,041 metric ton CO2e
Other Reporting Data:
56,133 lb [1]
5,514 lb [1]
0 lb
[1]
2,608 lb [1]
21,191 lb [1]
5,512 lb
[1]
4,303 lb [1]
Pounds of SF6 and PFC stored in containers, but not in energized equipment, at the beginning of the
year
Pounds of SF6 and PFC stored in containers, but not in energized equipment, at the end of the year
Existing at the beginning of the year (excluding hermetically sealed-pressure switchgear)
New during the year (all SF6-insulated equipment, including hermetically sealed-pressure switchgear)
Retired during the year (all SF6-insulated equipment, including hermetically sealed-pressure
switchgear)
Distribution miles (length of lines carrying voltages at or below 35 kilovolt)
Nameplate capacity of new equipment in pounds, including hermetically sealed-pressure switchgear
Nameplate capacity of retiring equipment in pounds, including hermetically sealed-pressure switchgear
Net Increase in Total Nameplate Capacity of Equipment Operated
User Emissions
SF6 sent off site for recycling
SF6 sent off site for destruction
Disbursements of SF6
Nameplate Capacity of Equipment Operated
SF6 Inventory (not energized)
SF6 at the beginning of the year
SF6 at the end of the year
Decrease in SF6 inventory
Acquisitions of SF6
SF6 purchased from chemical producers or distributors in bulk
SF6 purchased from equipment manufacturers or distributors with or inside equipment, including
hermetically sealed-pressure switchgear
SF6 returned to facility after off-site recycling
Acquisitions of SF6
Disbursements of SF6
SF6 in bulk and contained in equipment that is sold to other entities
SF6 returned to suppliers
Transmission miles (length of lines carrying voltages above 35 kilovolt)
98.306(a)(1)
98.306(a)(2)
98.306(a)(3)
98.306(b)
98.306(c)
98.306(d)
98.306(e)
Table B-9
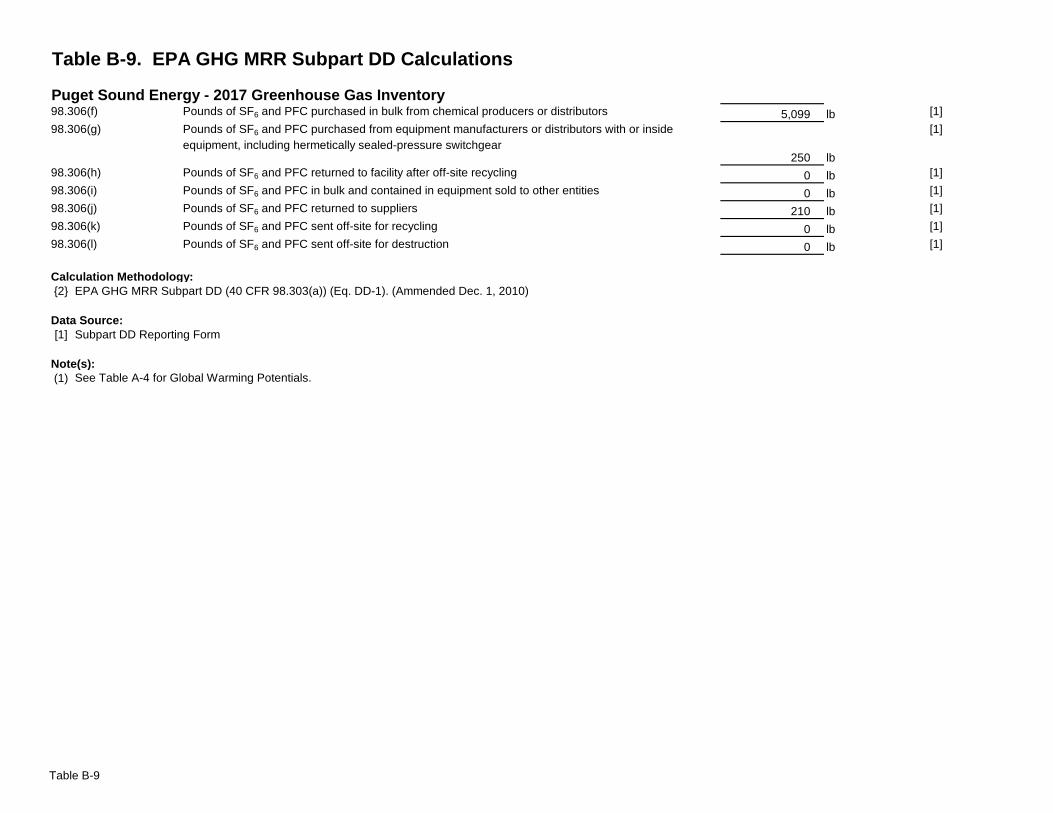
Table B-9. EPA GHG MRR Subpart DD Calculations
Puget Sound Energy - 2017 Greenhouse Gas Inventory
5,099 lb [1]
250 lb
[1]
0 lb [1]
0 lb [1]
210 lb [1]
0 lb [1]
0 lb [1]
Calculation Methodology:
{2} EPA GHG MRR Subpart DD (40 CFR 98.303(a)) (Eq. DD-1). (Ammended Dec. 1, 2010)
Data Source:
[1] Subpart DD Reporting Form
Note(s):
(1) See Table A-4 for Global Warming Potentials.
98.306(k)
98.306(l)
98.306(i)
Pounds of SF6 and PFC purchased in bulk from chemical producers or distributors
Pounds of SF6 and PFC purchased from equipment manufacturers or distributors with or inside
equipment, including hermetically sealed-pressure switchgear
Pounds of SF6 and PFC returned to facility after off-site recycling
Pounds of SF6 and PFC in bulk and contained in equipment sold to other entities
Pounds of SF6 and PFC returned to suppliers
Pounds of SF6 and PFC sent off-site for recycling
Pounds of SF6 and PFC sent off-site for destruction
98.306(j)
98.306(f)
98.306(g)
98.306(h)
Table B-9
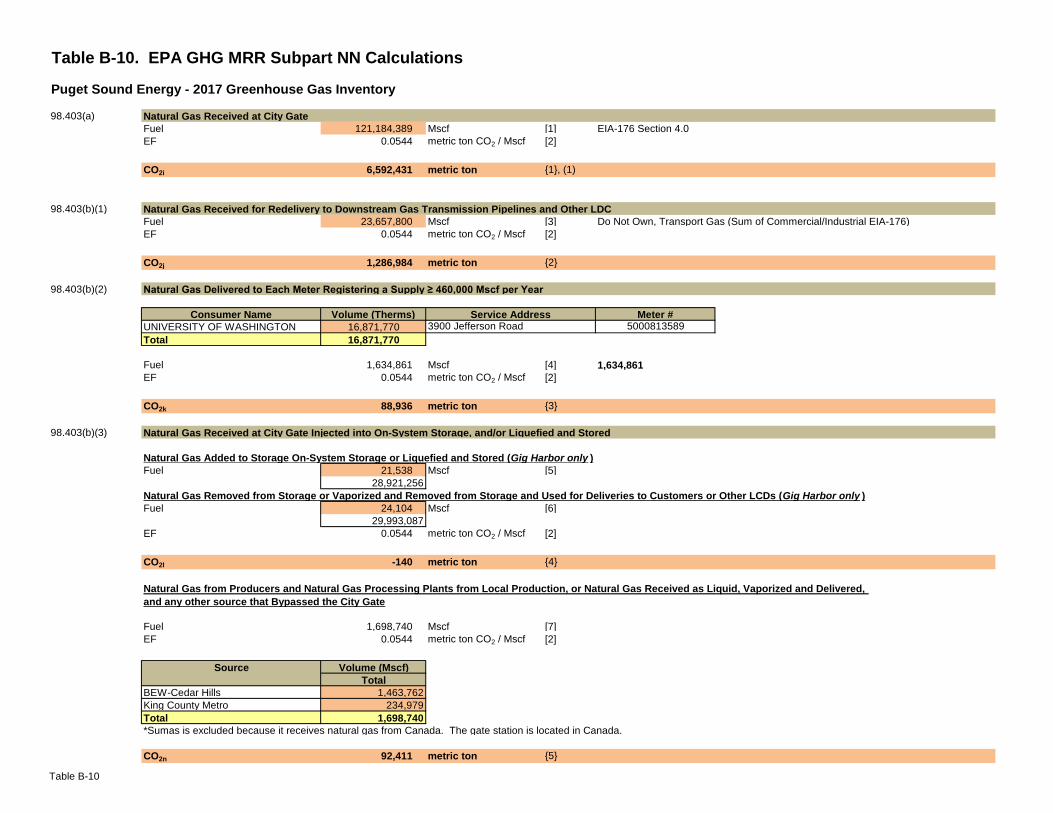
Table B-10. EPA GHG MRR Subpart NN Calculations
Puget Sound Energy - 2017 Greenhouse Gas Inventory
Natural Gas Received at City Gate
Fuel 121,184,389 Mscf [1] EIA-176 Section 4.0
EF 0.0544 metric ton CO2 / Mscf [2]
CO2i 6,592,431 metric ton {1}, (1)
Natural Gas Received for Redelivery to Downstream Gas Transmission Pipelines and Other LDC
Fuel 23,657,800 Mscf [3] Do Not Own, Transport Gas (Sum of Commercial/Industrial EIA-176)
EF 0.0544 metric ton CO2 / Mscf [2]
CO2j 1,286,984 metric ton {2}
Natural Gas Delivered to Each Meter Registering a Supply ≥ 460,000 Mscf per Year
Consumer Name Volume (Therms)
UNIVERSITY OF WASHINGTON 16,871,770
Total 16,871,770
Fuel 1,634,861 Mscf [4] 1,634,861
EF 0.0544 metric ton CO2 / Mscf [2]
CO2k 88,936 metric ton {3}
Natural Gas Received at City Gate Injected into On-System Storage, and/or Liquefied and Stored
Natural Gas Added to Storage On-System Storage or Liquefied and Stored (Gig Harbor only )
Fuel 21,538 Mscf [5]
28,921,256
Natural Gas Removed from Storage or Vaporized and Removed from Storage and Used for Deliveries to Customers or Other LCDs (Gig Harbor only )
Fuel 24,104 Mscf [6]
29,993,087
EF 0.0544 metric ton CO2 / Mscf [2]
CO2l -140 metric ton {4}
Fuel 1,698,740 Mscf [7]
EF 0.0544 metric ton CO2 / Mscf [2]
Volume (Mscf)
Total
BEW-Cedar Hills 1,463,762
King County Metro 234,979
Total 1,698,740
*Sumas is excluded because it receives natural gas from Canada. The gate station is located in Canada.
CO2n 92,411 metric ton {5}
98.403(b)(1)
98.403(b)(2)
98.403(a)
98.403(b)(3)
Meter #Service Address3900 Jefferson Road 5000813589
Natural Gas from Producers and Natural Gas Processing Plants from Local Production, or Natural Gas Received as Liquid, Vaporized and Delivered,
and any other source that Bypassed the City Gate
Source
Table B-10
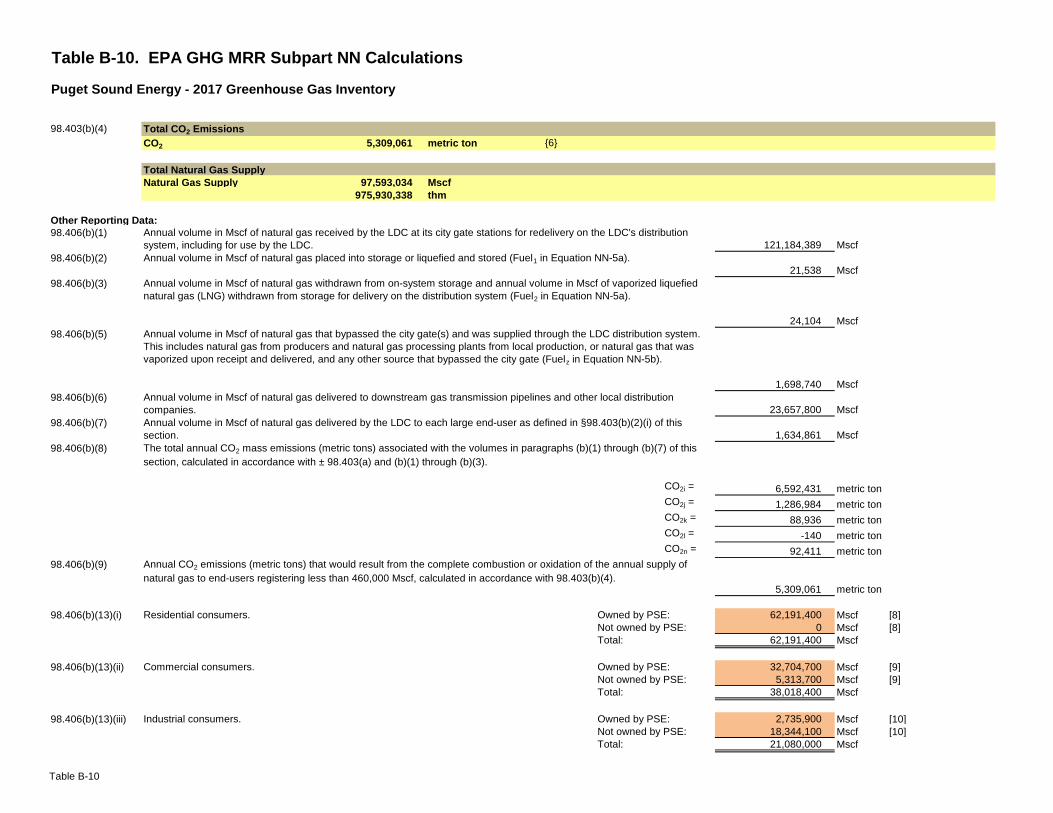
Table B-10. EPA GHG MRR Subpart NN Calculations
Puget Sound Energy - 2017 Greenhouse Gas Inventory
Total CO2 Emissions
CO2 5,309,061 metric ton {6}
Total Natural Gas Supply
Natural Gas Supply 97,593,034 Mscf
975,930,338 thm
Other Reporting Data:
Mscf
Mscf
Mscf
Mscf
Mscf
Mscf
CO2i = metric ton
CO2j = metric ton
CO2k = metric ton
CO2l = metric ton
CO2n = metric ton
metric ton
Residential consumers. Mscf [8]
Mscf [8]
Mscf
Commercial consumers. Mscf [9]
Mscf [9]
Mscf
Industrial consumers. Mscf [10]
Mscf [10]
MscfTotal:
Total:
98.406(b)(6)
98.406(b)(7)
Annual volume in Mscf of natural gas received by the LDC at its city gate stations for redelivery on the LDC's distribution
system, including for use by the LDC.
Annual volume in Mscf of natural gas placed into storage or liquefied and stored (Fuel1 in Equation NN-5a).
98.406(b)(13)(ii)
98.406(b)(13)(i)
5,309,061
88,936
-140
92,411
6,592,431
1,286,984
23,657,800
1,634,861
Annual volume in Mscf of natural gas delivered to downstream gas transmission pipelines and other local distribution
companies.
98.406(b)(3)
98.406(b)(5)
1,698,740
Annual volume in Mscf of natural gas that bypassed the city gate(s) and was supplied through the LDC distribution system.
This includes natural gas from producers and natural gas processing plants from local production, or natural gas that was
vaporized upon receipt and delivered, and any other source that bypassed the city gate (Fuelz in Equation NN-5b).
24,104
Annual volume in Mscf of natural gas withdrawn from on-system storage and annual volume in Mscf of vaporized liquefied
natural gas (LNG) withdrawn from storage for delivery on the distribution system (Fuel2 in Equation NN-5a).
98.406(b)(8)
98.406(b)(9)
98.406(b)(13)(iii)
98.403(b)(4)
121,184,389
21,538
98.406(b)(1)
98.406(b)(2)
2,735,900
62,191,400
32,704,700
Owned by PSE:
Not owned by PSE:
Total:
0
62,191,400
5,313,700
38,018,400
18,344,100
21,080,000
Owned by PSE:
Not owned by PSE:
Owned by PSE:
Not owned by PSE:
Annual volume in Mscf of natural gas delivered by the LDC to each large end-user as defined in §98.403(b)(2)(i) of this
section.
The total annual CO2 mass emissions (metric tons) associated with the volumes in paragraphs (b)(1) through (b)(7) of this
section, calculated in accordance with ± 98.403(a) and (b)(1) through (b)(3).
Annual CO2 emissions (metric tons) that would result from the complete combustion or oxidation of the annual supply of
natural gas to end-users registering less than 460,000 Mscf, calculated in accordance with 98.403(b)(4).
Table B-10
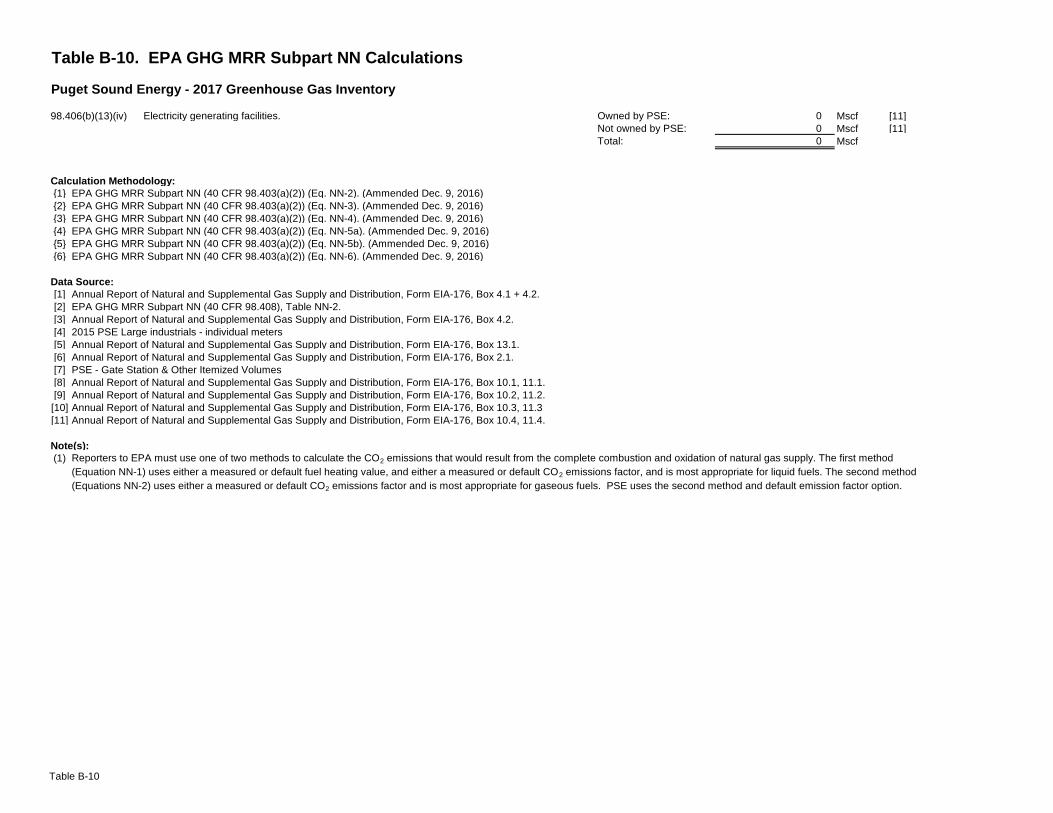
Table B-10. EPA GHG MRR Subpart NN Calculations
Puget Sound Energy - 2017 Greenhouse Gas Inventory
Electricity generating facilities. Mscf [11]
Mscf [11]
Mscf
Calculation Methodology:
{1} EPA GHG MRR Subpart NN (40 CFR 98.403(a)(2)) (Eq. NN-2). (Ammended Dec. 9, 2016)
{2} EPA GHG MRR Subpart NN (40 CFR 98.403(a)(2)) (Eq. NN-3). (Ammended Dec. 9, 2016)
{3} EPA GHG MRR Subpart NN (40 CFR 98.403(a)(2)) (Eq. NN-4). (Ammended Dec. 9, 2016)
{4} EPA GHG MRR Subpart NN (40 CFR 98.403(a)(2)) (Eq. NN-5a). (Ammended Dec. 9, 2016)
{5} EPA GHG MRR Subpart NN (40 CFR 98.403(a)(2)) (Eq. NN-5b). (Ammended Dec. 9, 2016)
{6} EPA GHG MRR Subpart NN (40 CFR 98.403(a)(2)) (Eq. NN-6). (Ammended Dec. 9, 2016)
Data Source:
[1] Annual Report of Natural and Supplemental Gas Supply and Distribution, Form EIA-176, Box 4.1 + 4.2.
[2] EPA GHG MRR Subpart NN (40 CFR 98.408), Table NN-2.
[3] Annual Report of Natural and Supplemental Gas Supply and Distribution, Form EIA-176, Box 4.2.
[4] 2015 PSE Large industrials - individual meters
[5] Annual Report of Natural and Supplemental Gas Supply and Distribution, Form EIA-176, Box 13.1.
[6] Annual Report of Natural and Supplemental Gas Supply and Distribution, Form EIA-176, Box 2.1.
[7] PSE - Gate Station & Other Itemized Volumes
[8] Annual Report of Natural and Supplemental Gas Supply and Distribution, Form EIA-176, Box 10.1, 11.1.
[9] Annual Report of Natural and Supplemental Gas Supply and Distribution, Form EIA-176, Box 10.2, 11.2.
[10] Annual Report of Natural and Supplemental Gas Supply and Distribution, Form EIA-176, Box 10.3, 11.3
[11] Annual Report of Natural and Supplemental Gas Supply and Distribution, Form EIA-176, Box 10.4, 11.4.
Note(s):
(1) Reporters to EPA must use one of two methods to calculate the CO2 emissions that would result from the complete combustion and oxidation of natural gas supply. The first method
(Equation NN-1) uses either a measured or default fuel heating value, and either a measured or default CO2 emissions factor, and is most appropriate for liquid fuels. The second method
(Equations NN-2) uses either a measured or default CO2 emissions factor and is most appropriate for gaseous fuels. PSE uses the second method and default emission factor option.
98.406(b)(13)(iv)
0
Owned by PSE:
Not owned by PSE:
Total: 0
0
Table B-10
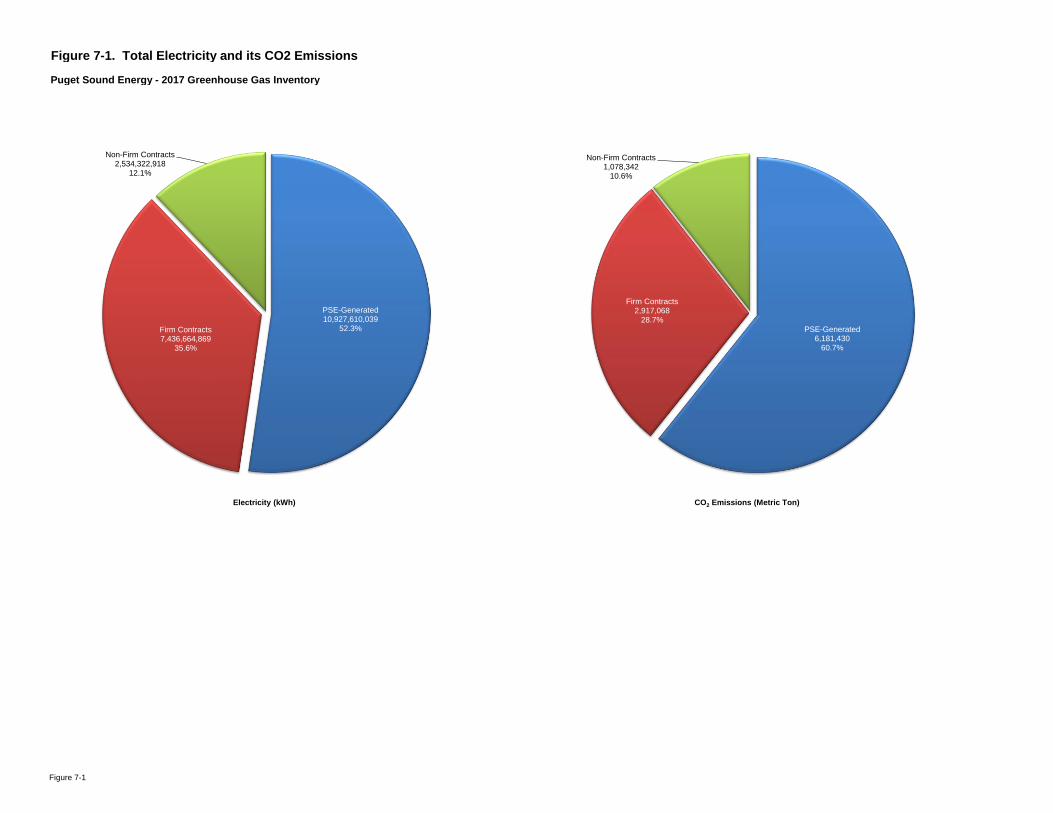
Figure 7-1. Total Electricity and its CO2 Emissions
Puget Sound Energy - 2017 Greenhouse Gas Inventory
PSE-Generated 10,927,610,039
52.3% Firm Contracts 7,436,664,869
35.6%
Non-Firm Contracts 2,534,322,918
12.1%
PSE-Generated 6,181,430
60.7%
Firm Contracts 2,917,068
28.7%
Non-Firm Contracts 1,078,342
10.6%
Electricity (kWh) CO2 Emissions (Metric Ton)
Figure 7-1
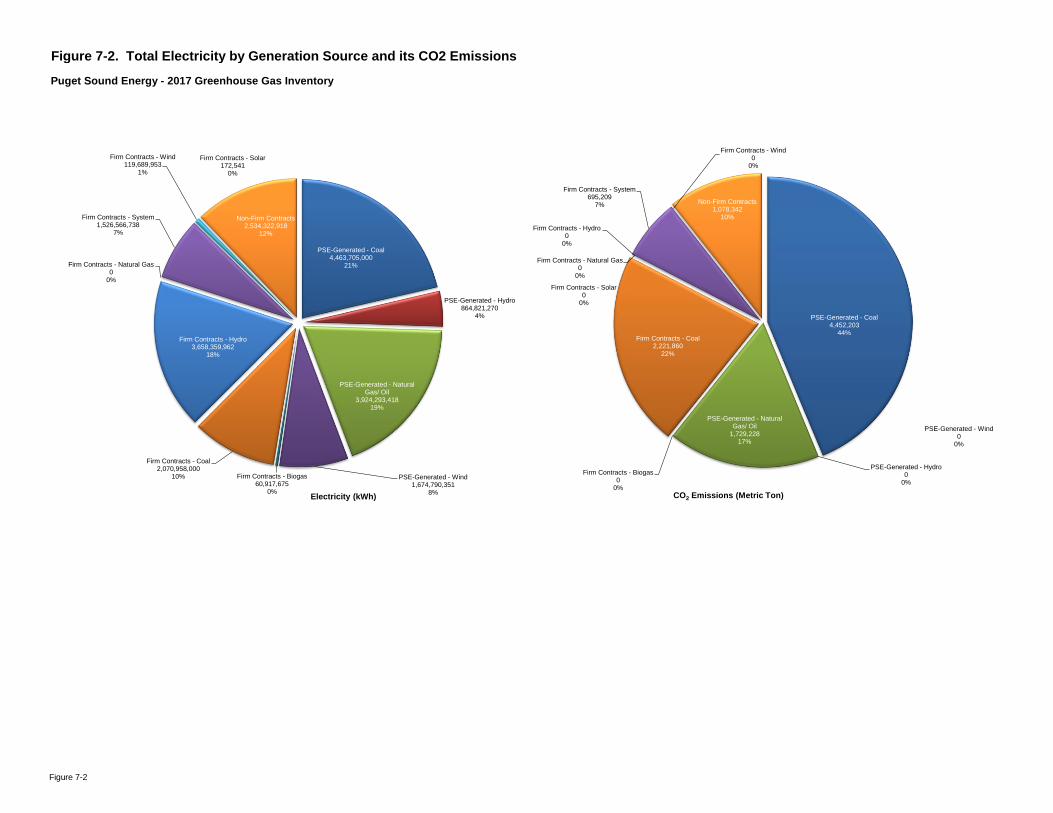
Figure 7-2. Total Electricity by Generation Source and its CO2 Emissions
Puget Sound Energy - 2017 Greenhouse Gas Inventory
PSE-Generated - Coal 4,463,705,000
21%
PSE-Generated - Hydro 864,821,270
4%
PSE-Generated - Natural Gas/ Oil
3,924,293,418 19%
PSE-Generated - Wind 1,674,790,351
8%
Firm Contracts - Biogas 60,917,675
0%
Firm Contracts - Coal 2,070,958,000
10%
Firm Contracts - Hydro 3,658,359,962
18%
Firm Contracts - Natural Gas 0
0%
Firm Contracts - Solar 172,541
0%
Firm Contracts - System 1,526,566,738
7%
Firm Contracts - Wind 119,689,953
1%
Non-Firm Contracts 2,534,322,918
12%
Electricity (kWh)
PSE-Generated - Coal 4,452,203
44%
PSE-Generated - Hydro 0
0%
PSE-Generated - Natural Gas/ Oil
1,729,228 17%
PSE-Generated - Wind 0
0%
Firm Contracts - Biogas 0
0%
Firm Contracts - Coal 2,221,860
22%
Firm Contracts - Hydro 0
0%
Firm Contracts - Natural Gas 0
0%
Firm Contracts - Solar 0
0%
Firm Contracts - System 695,209
7%
Firm Contracts - Wind 0
0%
Non-Firm Contracts 1,078,342
10%
CO2 Emissions (Metric Ton)
Figure 7-2
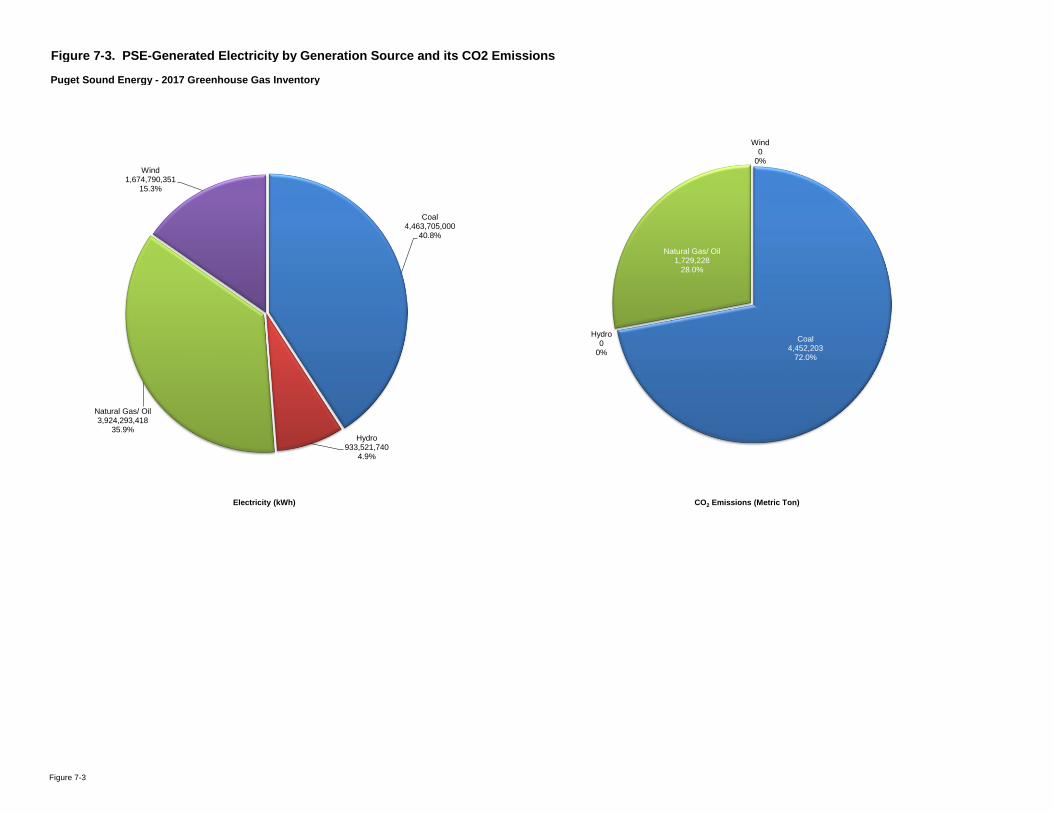
Figure 7-3. PSE-Generated Electricity by Generation Source and its CO2 Emissions
Puget Sound Energy - 2017 Greenhouse Gas Inventory
Coal 4,463,705,000
40.8%
Hydro 933,521,740
4.9%
Natural Gas/ Oil 3,924,293,418
35.9%
Wind 1,674,790,351
15.3%
Electricity (kWh) CO2 Emissions (Metric Ton)
Coal 4,452,203
72.0%
Hydro 0
0%
Natural Gas/ Oil 1,729,228
28.0%
Wind 0
0%
Figure 7-3
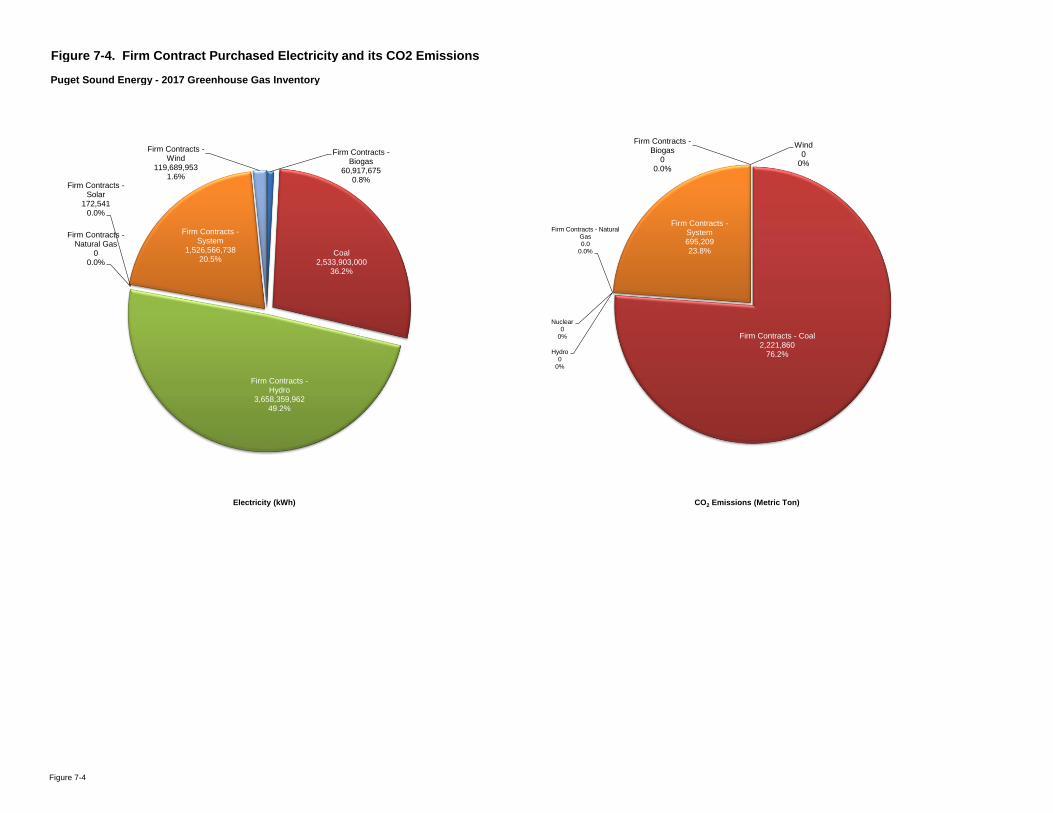
Figure 7-4. Firm Contract Purchased Electricity and its CO2 Emissions
Puget Sound Energy - 2017 Greenhouse Gas Inventory
Firm Contracts - Biogas
60,917,675 0.8%
Coal 2,533,903,000
36.2%
Firm Contracts - Hydro
3,658,359,962 49.2%
Firm Contracts - Natural Gas
0 0.0%
Firm Contracts - Solar
172,541 0.0%
Firm Contracts - System
1,526,566,738 20.5%
Firm Contracts - Wind
119,689,953 1.6%
Electricity (kWh) CO2 Emissions (Metric Ton)
Firm Contracts - Biogas
0 0.0%
Firm Contracts - Coal 2,221,860
76.2% Hydro 0
0%
Firm Contracts - Natural Gas 0.0
0.0%
Nuclear 0
0%
Firm Contracts - System 695,209 23.8%
Wind 0
0%
Figure 7-4
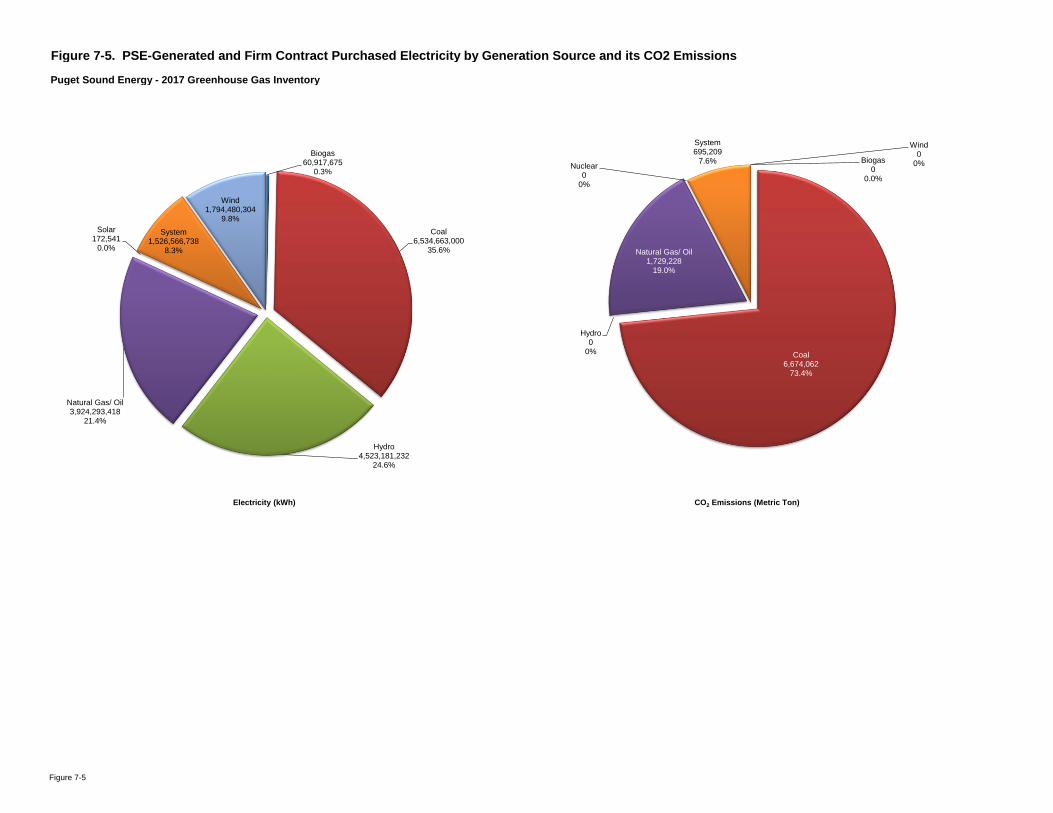
Figure 7-5. PSE-Generated and Firm Contract Purchased Electricity by Generation Source and its CO2 Emissions
Puget Sound Energy - 2017 Greenhouse Gas Inventory
Biogas 60,917,675
0.3%
Coal 6,534,663,000
35.6%
Hydro 4,523,181,232
24.6%
Natural Gas/ Oil 3,924,293,418
21.4%
Solar 172,541
0.0%
System 1,526,566,738
8.3%
Wind 1,794,480,304
9.8%
Electricity (kWh) CO2 Emissions (Metric Ton)
Biogas 0
0.0%
Coal 6,674,062
73.4%
Hydro 0
0%
Natural Gas/ Oil 1,729,228
19.0%
Nuclear 0
0%
System 695,209
7.6%
Wind 0
0%
Figure 7-5