Greenhouse Gas Emissions Reductions - Tracking · PDF fileCalifornia Energy Commission –...
16
California Energy Commission – Tracking Progress Last updated December 2017 Greenhouse Gas Emission Reductions 1 Greenhouse Gas Emission Reductions There is growing international recognition that greenhouse gas emissions are changing the climate with wide-ranging impacts. California is vulnerable to a variety of climatic changes, including changes in temperature and precipitation patterns, extreme events (including wildfire, inland and coastal flooding, and heat waves), and sea-level rise. 1 Higher temperatures due to climate change are likely to exacerbate future droughts like the one California experienced from fall 2011 to fall 2015. More than 102 million drought-stressed trees have died as result of bark beetle infestation since 2010. Further, about half of the 20 largest wildfires in California burned in the last decade with seven of the state’s largest, deadliest, and most destructive wildfires in 2017 alone. Figure 1 shows the deadliest and most destructive California wildfires since 1932, clearly indicating the increasing toll that wildfires are having on Californians. Figure 1: The Largest, Most Destructive, and Deadliest California Wildfires in the Last Century Source: California Energy Commission using data from http://cdfdata.fire.ca.gov/incidents/incidents_statsevents. 1 Summary information available at Our Changing Climate 2012 Vulnerability & Adaptation to the Increasing Risks from Climate Change in California - Brochure. Publication # CEC-500-2012-007. July, 2012. For more complete information on the Third Assessment from the California Climate Change Center, http://www.climatechange.ca.gov/climate_action_team/reports/third_assessment/index.html. 0 1 2 3 4 5 6 7 8 9 1918- 1927 1928- 1937 1938- 1947 1948- 1957 1958- 1967 1968- 1977 1978- 1987 1988- 1997 1998- 2007 2008- 2017 Largest 0 1 0 0 0 2 1 1 6 9 Most Destructive 1 0 0 0 1 0 0 4 5 9 Deadliest 0 1 1 3 2 2 0 1 4 6 Number
Transcript of Greenhouse Gas Emissions Reductions - Tracking · PDF fileCalifornia Energy Commission –...
California Energy Commission – Tracking Progress
Last updated December 2017 Greenhouse Gas Emission Reductions 1
Greenhouse Gas Emission Reductions
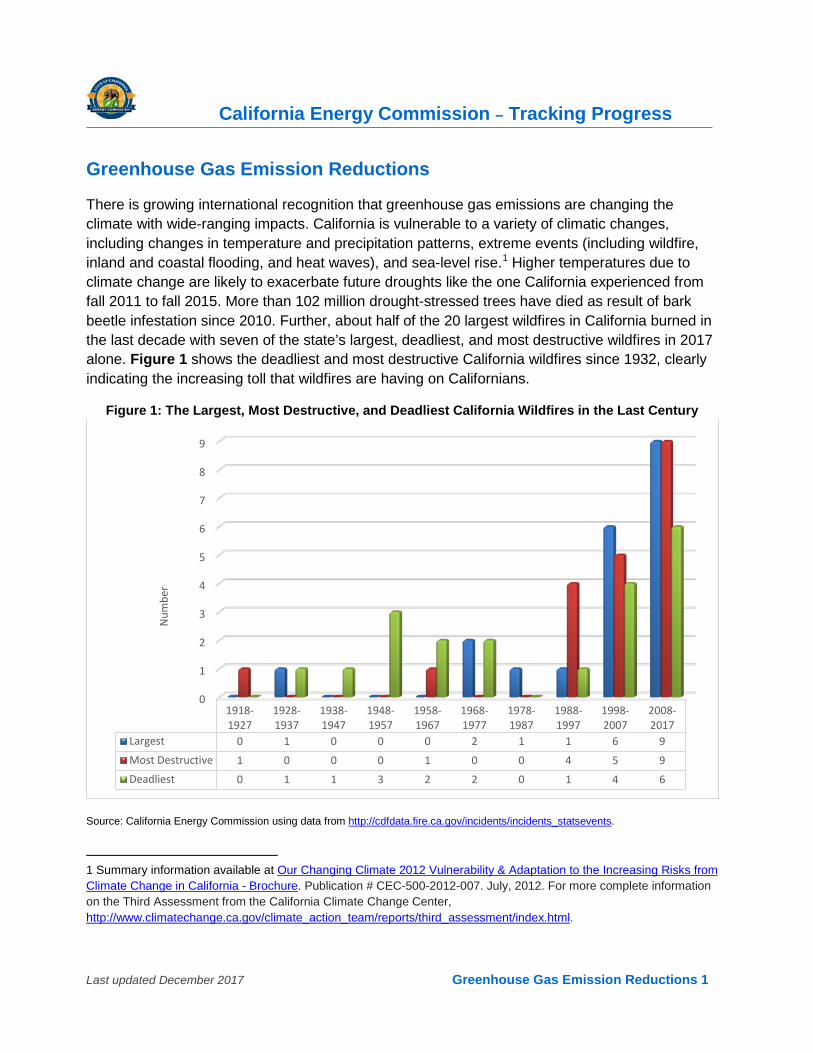
There is growing international recognition that greenhouse gas emissions are changing the climate with wide-ranging impacts. California is vulnerable to a variety of climatic changes, including changes in temperature and precipitation patterns, extreme events (including wildfire, inland and coastal flooding, and heat waves), and sea-level rise.1 Higher temperatures due to climate change are likely to exacerbate future droughts like the one California experienced from fall 2011 to fall 2015. More than 102 million drought-stressed trees have died as result of bark beetle infestation since 2010. Further, about half of the 20 largest wildfires in California burned in the last decade with seven of the state’s largest, deadliest, and most destructive wildfires in 2017 alone. Figure 1 shows the deadliest and most destructive California wildfires since 1932, clearly indicating the increasing toll that wildfires are having on Californians.
Figure 1: The Largest, Most Destructive, and Deadliest California Wildfires in the Last Century
Source: California Energy Commission using data from http://cdfdata.fire.ca.gov/incidents/incidents_statsevents.
1 Summary information available at Our Changing Climate 2012 Vulnerability & Adaptation to the Increasing Risks from Climate Change in California - Brochure. Publication # CEC-500-2012-007. July, 2012. For more complete information on the Third Assessment from the California Climate Change Center, http://www.climatechange.ca.gov/climate_action_team/reports/third_assessment/index.html.
0
1
2
3
4
5
6
7
8
9
1918-1927
1928-1937
1938-1947
1948-1957
1958-1967
1968-1977
1978-1987
1988-1997
1998-2007
2008-2017
Largest 0 1 0 0 0 2 1 1 6 9Most Destructive 1 0 0 0 1 0 0 4 5 9Deadliest 0 1 1 3 2 2 0 1 4 6
Num
ber
California Energy Commission – Tracking Progress
Last updated December 2017 Greenhouse Gas Emission Reductions 2
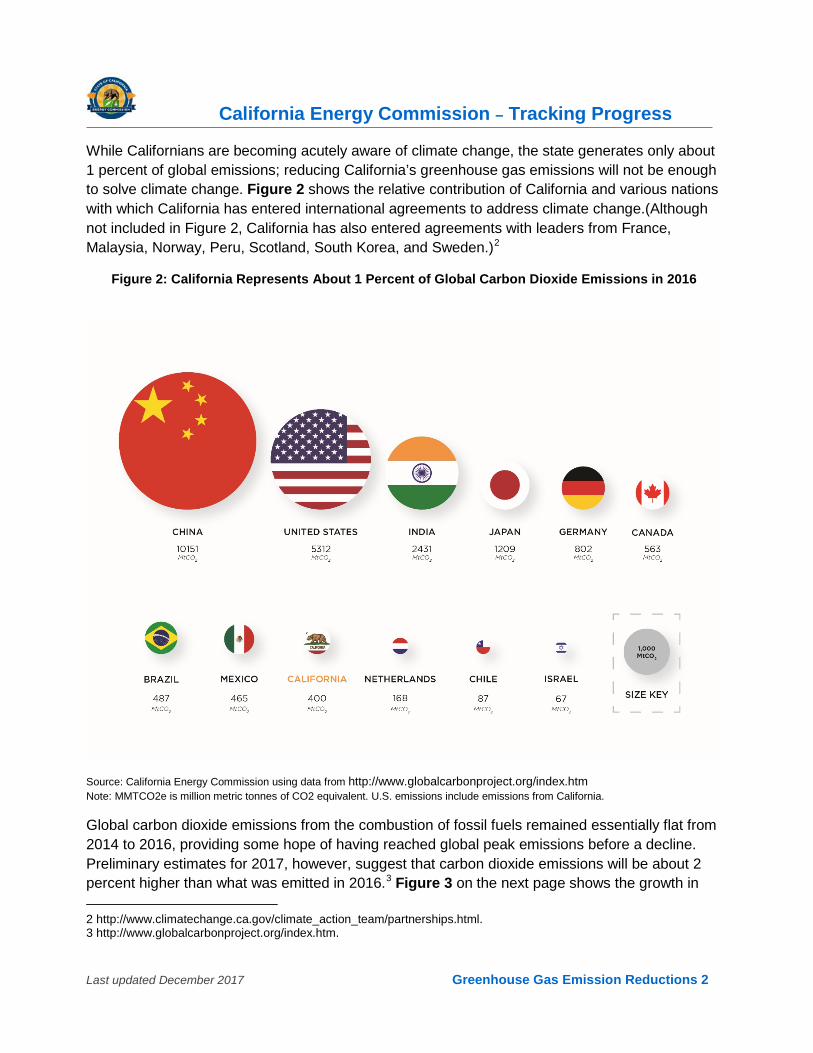
While Californians are becoming acutely aware of climate change, the state generates only about 1 percent of global emissions; reducing California’s greenhouse gas emissions will not be enough to solve climate change. Figure 2 shows the relative contribution of California and various nations with which California has entered international agreements to address climate change.(Although not included in Figure 2, California has also entered agreements with leaders from France, Malaysia, Norway, Peru, Scotland, South Korea, and Sweden.)2
Figure 2: California Represents About 1 Percent of Global Carbon Dioxide Emissions in 2016
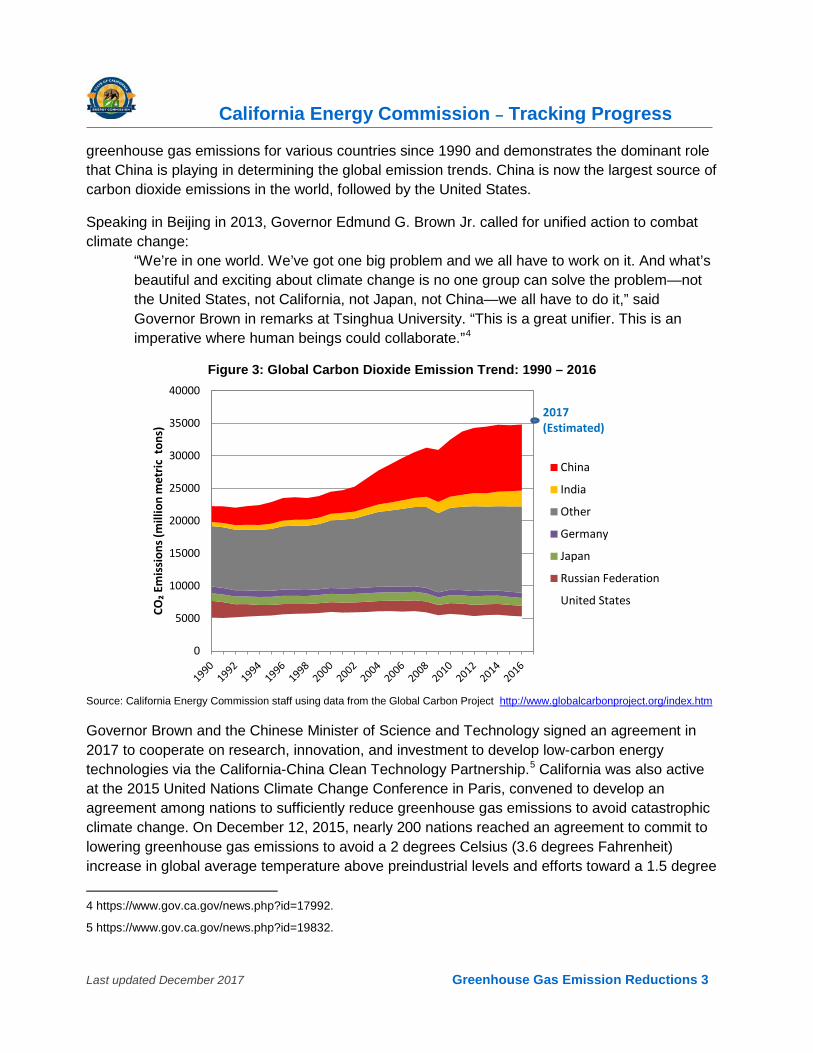
Source: California Energy Commission using data from http://www.globalcarbonproject.org/index.htm Note: MMTCO2e is million metric tonnes of CO2 equivalent. U.S. emissions include emissions from California. Global carbon dioxide emissions from the combustion of fossil fuels remained essentially flat from 2014 to 2016, providing some hope of having reached global peak emissions before a decline. Preliminary estimates for 2017, however, suggest that carbon dioxide emissions will be about 2 percent higher than what was emitted in 2016.3 Figure 3 on the next page shows the growth in 2 http://www.climatechange.ca.gov/climate_action_team/partnerships.html. 3 http://www.globalcarbonproject.org/index.htm.
California Energy Commission – Tracking Progress
Last updated December 2017 Greenhouse Gas Emission Reductions 3
greenhouse gas emissions for various countries since 1990 and demonstrates the dominant role that China is playing in determining the global emission trends. China is now the largest source of carbon dioxide emissions in the world, followed by the United States.
Speaking in Beijing in 2013, Governor Edmund G. Brown Jr. called for unified action to combat climate change:
“We’re in one world. We’ve got one big problem and we all have to work on it. And what’s beautiful and exciting about climate change is no one group can solve the problem—not the United States, not California, not Japan, not China—we all have to do it,” said Governor Brown in remarks at Tsinghua University. “This is a great unifier. This is an imperative where human beings could collaborate.”4
Figure 3: Global Carbon Dioxide Emission Trend: 1990 – 2016
Source: California Energy Commission staff using data from the Global Carbon Project http://www.globalcarbonproject.org/index.htm
Governor Brown and the Chinese Minister of Science and Technology signed an agreement in 2017 to cooperate on research, innovation, and investment to develop low-carbon energy technologies via the California-China Clean Technology Partnership.5 California was also active at the 2015 United Nations Climate Change Conference in Paris, convened to develop an agreement among nations to sufficiently reduce greenhouse gas emissions to avoid catastrophic climate change. On December 12, 2015, nearly 200 nations reached an agreement to commit to lowering greenhouse gas emissions to avoid a 2 degrees Celsius (3.6 degrees Fahrenheit) increase in global average temperature above preindustrial levels and efforts toward a 1.5 degree 4 https://www.gov.ca.gov/news.php?id=17992.
5 https://www.gov.ca.gov/news.php?id=19832.
0
5000
10000
15000
20000
25000
30000
35000
40000
CO₂ E
mis
sion
s (m
illio
n m
etric
ton
s)
China
India
Other
Germany
Japan
Russian Federation
United States
2017 (Estimated)
California Energy Commission – Tracking Progress
Last updated December 2017 Greenhouse Gas Emission Reductions 4
Celsius goal.6 The Paris Agreement entered into force on November 4, 2016, 30 days after ratification of emission reductions by at least 55 parties to the convention representing at least 55 percent of the global greenhouse gas emissions. This means that the emission reduction targets are legally recognized for those countries that sign and ratify the agreement.
The announcement of President Trump’s intent to withdraw the United States from the Paris Agreement has met with resolve from local, state, and private entities to work toward deep reduction of greenhouse gas emissions in accord with the agreement. In July 2017, Governor Brown announced that California will host the Global Climate Action Summit in San Francisco in September 2018. Governor Brown said, “I know President Trump is trying to get out of the Paris Agreement, but he doesn't speak for the rest of America. We in California and in states all across America believe it's time to act, it's time to join together and that's why at this Climate Action Summit we're going to get it done.”7
The Governor has been also working to advance global action by spearheading the Subnational Global Climate Leadership Memorandum of Understanding (the “Under2 MOU”), a commitment by cities, states, and countries to help limit the rise in global average temperature to below 2 degrees Celsius. Signatories agree to reduce greenhouse gas emissions 80 to 95 percent below 1990 levels by 2050 or achieve a per capita annual emissions target of less than 2 metric tons by 2050. Collectively, 205 jurisdictions representing 43 countries, 1.3 billion people, and almost 40 percent of the global economy have signed or endorsed the Under2 MOU as of December 2017. See http://under2mou.org/ for the latest statistics as they grow frequently.
Strong, near-term action to cut greenhouse gas emissions is critical. Under the Governor’s leadership, California continues to spur action to address climate change and share its successes and approach with others.
California’s 2030 Greenhouse Gas Reduction Requirement
On September 8, 2016, Governor Brown took an important step in the state’s commitment to reduce greenhouse gas by signing Senate Bill 32 (Pavley, Chapter 249, Statutes of 2016) (SB 32). This put into law a statewide goal to reduce greenhouse gas emissions 40 percent below 1990 levels by 2030. A companion bill, Assembly Bill 197 (Garcia, Chapter 250, Statutes of 2016) (AB 197), assures that the state’s implementation of its climate change policies is transparent and equitable, with the benefits reaching disadvantaged communities.
These bills codify the 2030 greenhouse gas reduction goal in Governor Brown’s Executive Order B-30-15 and come 10 years after enactment of the California Global Warming Solutions Act of 2006 (Assembly Bill 32, Núñez, Chapter 488, Statues of 2006), the landmark legislation to reduce
6 United Nations Framework Convention on Climate Change, Adoption of the Paris Agreement, December 12, 2015, http://unfccc.int/resource/docs/2015/cop21/eng/l09r01.pdf.
7 https://www.gov.ca.gov/news.php?id=19866.
California Energy Commission – Tracking Progress
Last updated December 2017 Greenhouse Gas Emission Reductions 5
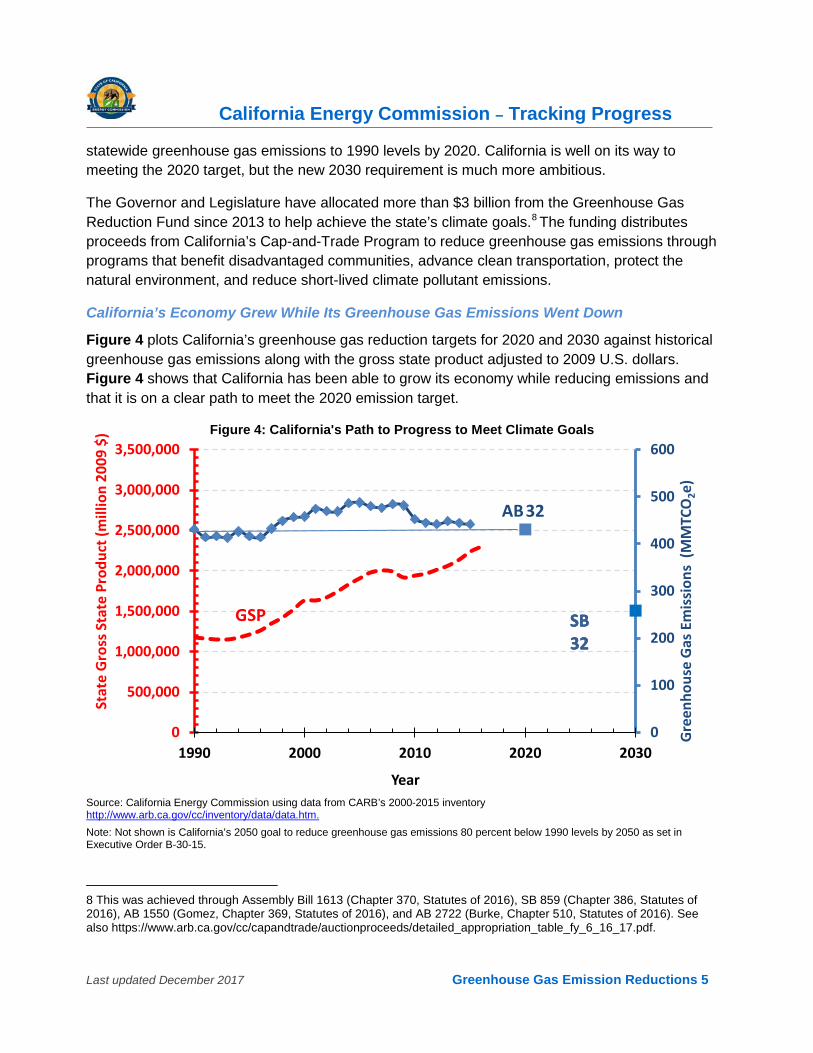
statewide greenhouse gas emissions to 1990 levels by 2020. California is well on its way to meeting the 2020 target, but the new 2030 requirement is much more ambitious.
The Governor and Legislature have allocated more than $3 billion from the Greenhouse Gas Reduction Fund since 2013 to help achieve the state’s climate goals.8 The funding distributes proceeds from California’s Cap-and-Trade Program to reduce greenhouse gas emissions through programs that benefit disadvantaged communities, advance clean transportation, protect the natural environment, and reduce short-lived climate pollutant emissions.
California’s Economy Grew While Its Greenhouse Gas Emissions Went Down
Figure 4 plots California’s greenhouse gas reduction targets for 2020 and 2030 against historical greenhouse gas emissions along with the gross state product adjusted to 2009 U.S. dollars. Figure 4 shows that California has been able to grow its economy while reducing emissions and that it is on a clear path to meet the 2020 emission target.
Figure 4: California's Path to Progress to Meet Climate Goals
Source: California Energy Commission using data from CARB’s 2000-2015 inventory http://www.arb.ca.gov/cc/inventory/data/data.htm. Note: Not shown is California’s 2050 goal to reduce greenhouse gas emissions 80 percent below 1990 levels by 2050 as set in Executive Order B-30-15.
8 This was achieved through Assembly Bill 1613 (Chapter 370, Statutes of 2016), SB 859 (Chapter 386, Statutes of 2016), AB 1550 (Gomez, Chapter 369, Statutes of 2016), and AB 2722 (Burke, Chapter 510, Statutes of 2016). See also https://www.arb.ca.gov/cc/capandtrade/auctionproceeds/detailed_appropriation_table_fy_6_16_17.pdf.
0
100
200
300
400
500
600
0
500,000
1,000,000
1,500,000
2,000,000
2,500,000
3,000,000
3,500,000
1990 2000 2010 2020 2030
Gre
enho
use
Gas
Em
issi
ons
(MM
TCO
2e)
Year
SB 32 SB 32
AB 32
SB 32
GSP
Stat
e G
ross
Sta
te P
rodu
ct (m
illio
n 20
09 $
)
California Energy Commission – Tracking Progress
Last updated December 2017 Greenhouse Gas Emission Reductions 6
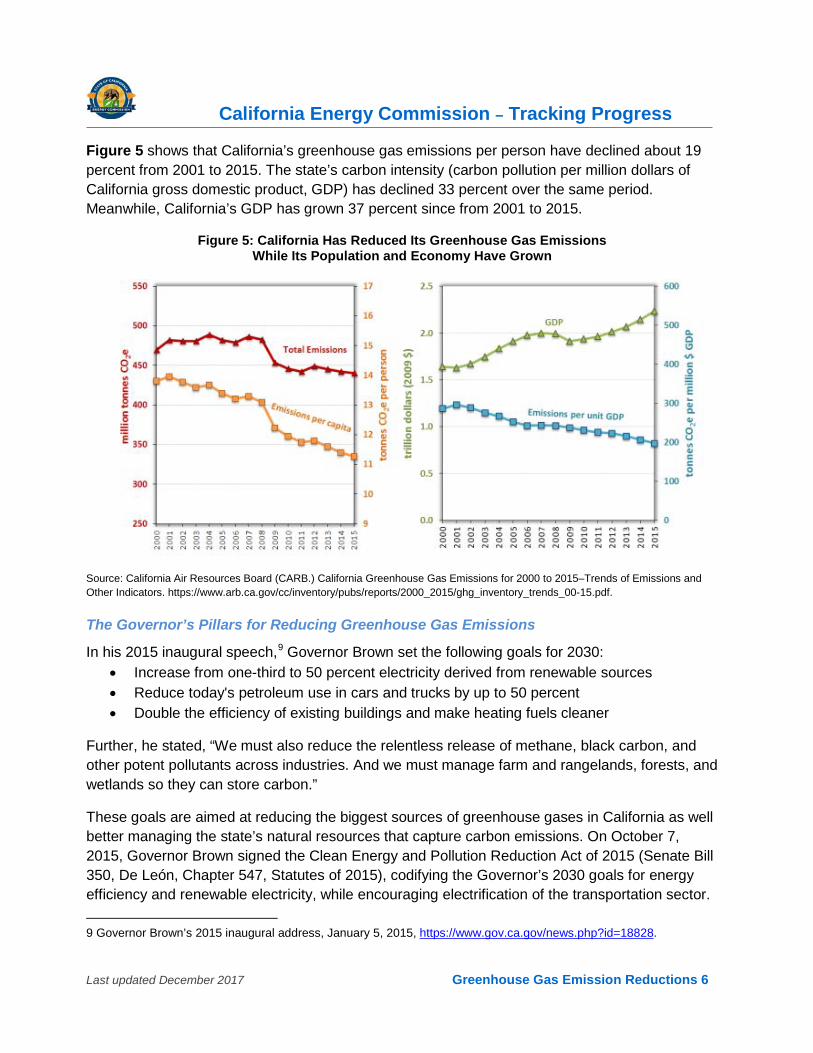
Figure 5 shows that California’s greenhouse gas emissions per person have declined about 19 percent from 2001 to 2015. The state’s carbon intensity (carbon pollution per million dollars of California gross domestic product, GDP) has declined 33 percent over the same period. Meanwhile, California’s GDP has grown 37 percent since from 2001 to 2015.
Figure 5: California Has Reduced Its Greenhouse Gas Emissions While Its Population and Economy Have Grown
Source: California Air Resources Board (CARB.) California Greenhouse Gas Emissions for 2000 to 2015–Trends of Emissions and Other Indicators. https://www.arb.ca.gov/cc/inventory/pubs/reports/2000_2015/ghg_inventory_trends_00-15.pdf.
The Governor’s Pillars for Reducing Greenhouse Gas Emissions
In his 2015 inaugural speech,9 Governor Brown set the following goals for 2030: • Increase from one-third to 50 percent electricity derived from renewable sources • Reduce today's petroleum use in cars and trucks by up to 50 percent • Double the efficiency of existing buildings and make heating fuels cleaner
Further, he stated, “We must also reduce the relentless release of methane, black carbon, and other potent pollutants across industries. And we must manage farm and rangelands, forests, and wetlands so they can store carbon.”
These goals are aimed at reducing the biggest sources of greenhouse gases in California as well better managing the state’s natural resources that capture carbon emissions. On October 7, 2015, Governor Brown signed the Clean Energy and Pollution Reduction Act of 2015 (Senate Bill 350, De León, Chapter 547, Statutes of 2015), codifying the Governor’s 2030 goals for energy efficiency and renewable electricity, while encouraging electrification of the transportation sector. 9 Governor Brown’s 2015 inaugural address, January 5, 2015, https://www.gov.ca.gov/news.php?id=18828.
California Energy Commission – Tracking Progress
Last updated December 2017 Greenhouse Gas Emission Reductions 7
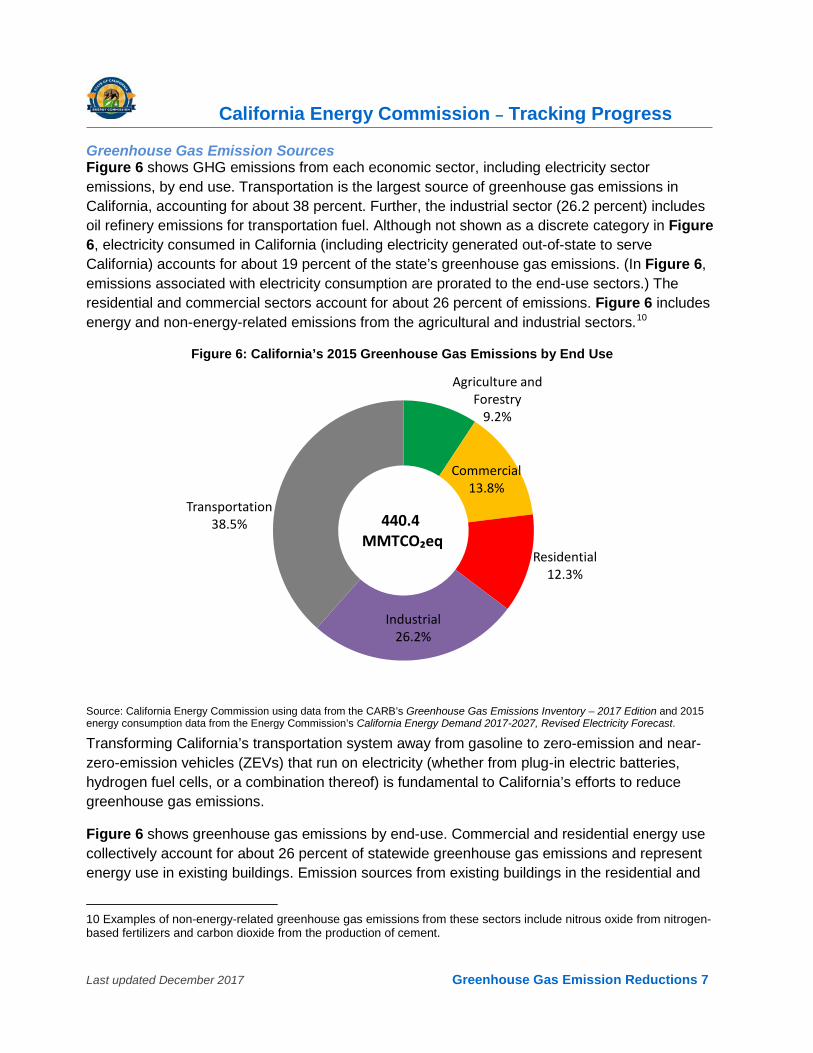
Greenhouse Gas Emission Sources Figure 6 shows GHG emissions from each economic sector, including electricity sector emissions, by end use. Transportation is the largest source of greenhouse gas emissions in California, accounting for about 38 percent. Further, the industrial sector (26.2 percent) includes oil refinery emissions for transportation fuel. Although not shown as a discrete category in Figure 6, electricity consumed in California (including electricity generated out-of-state to serve California) accounts for about 19 percent of the state’s greenhouse gas emissions. (In Figure 6, emissions associated with electricity consumption are prorated to the end-use sectors.) The residential and commercial sectors account for about 26 percent of emissions. Figure 6 includes energy and non-energy-related emissions from the agricultural and industrial sectors.10
Figure 6: California’s 2015 Greenhouse Gas Emissions by End Use
Source: California Energy Commission using data from the CARB’s Greenhouse Gas Emissions Inventory – 2017 Edition and 2015 energy consumption data from the Energy Commission’s California Energy Demand 2017-2027, Revised Electricity Forecast.
Transforming California’s transportation system away from gasoline to zero-emission and near-zero-emission vehicles (ZEVs) that run on electricity (whether from plug-in electric batteries, hydrogen fuel cells, or a combination thereof) is fundamental to California’s efforts to reduce greenhouse gas emissions.
Figure 6 shows greenhouse gas emissions by end-use. Commercial and residential energy use collectively account for about 26 percent of statewide greenhouse gas emissions and represent energy use in existing buildings. Emission sources from existing buildings in the residential and
10 Examples of non-energy-related greenhouse gas emissions from these sectors include nitrous oxide from nitrogen-based fertilizers and carbon dioxide from the production of cement.
Agriculture and Forestry
9.2%
Commercial13.8%
Residential12.3%
Industrial26.2%
Transportation38.5% 440.4
MMTCO₂eq
California Energy Commission – Tracking Progress
Last updated December 2017 Greenhouse Gas Emission Reductions 8
commercial sectors include both fossil fuel consumed on-site (for example, gas or propane for heating) and electricity consumption (for example, for lighting, appliances, and cooling). Thus, improving the efficiency of existing buildings is another high priority for achieving the state’s climate goals. See the Tracking Progress pages on “Zero-Emission Vehicles and Infrastructure,” “Renewable Energy,” and “Energy Efficiency” for more information.
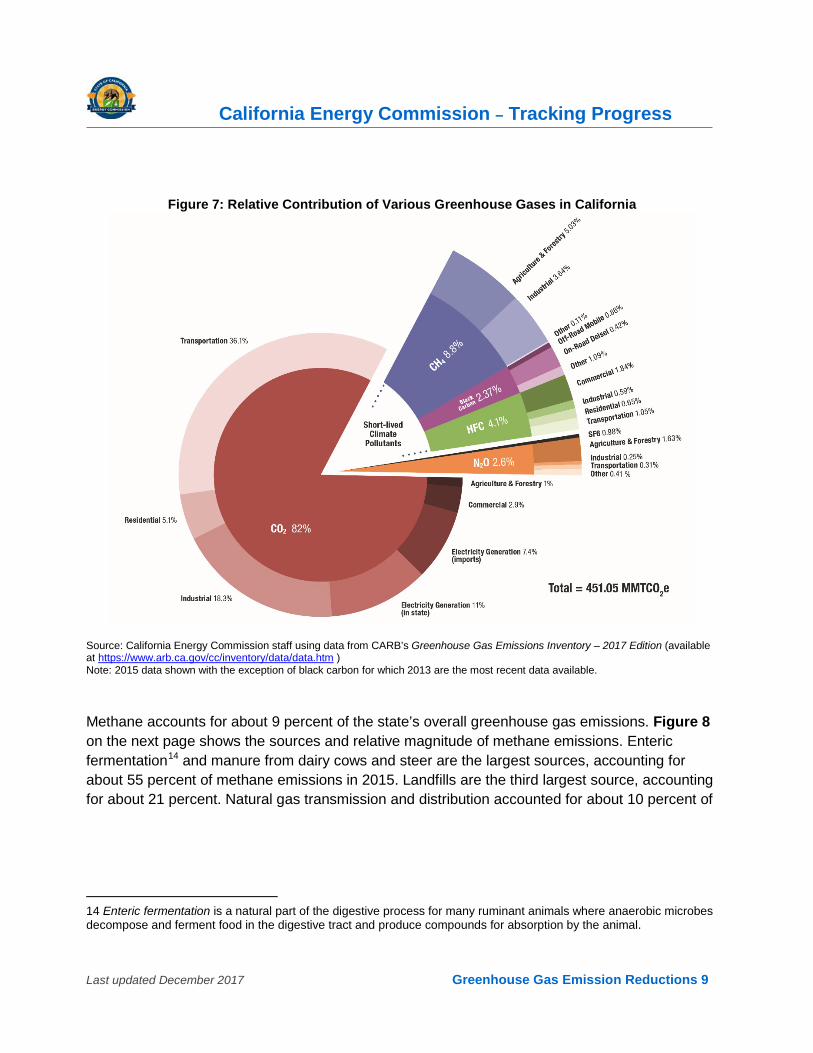
Although California’s greenhouse gas emissions are primarily (about 82 percent)11 carbon dioxide (CO2), Figure 7 includes short-lived climate pollutants (SLCP), powerful climate forcers that remain in the atmosphere for a much shorter time than climate pollutants such as CO2. SLCP include methane, black carbon (soot), and fluorinated gases. The relative potency of these climate pollutants to heat the atmosphere can be tens to thousands of times greater than CO2 and are estimated to account for about 40 percent of climate forcing from anthropogenic pollution (pollution associated with human activities).12 The California Air Resources Board (CARB) is working to reduce SLCP emissions to make an immediate beneficial impact on climate change.13 Further, Senate Bill 1383 (Lara, Chapter 395, Statutes of 2016) requires CARB to develop a strategy to reduce SLCP emissions below 2013 levels by 2030 as follows: cut methane emissions by 40 percent, hydrofluorocarbon gases by 40 percent, and anthropogenic black carbon by 50 percent. Figure 7 on the next page shows the relative contribution of SLCP and CO2.
11 The 82 percent estimate includes an accounting for black carbon, which is not part of the CARB's Greenhouse Gas Emissions Inventory – 2016 Edition. If black carbon is not included, CO2 accounts for about 84 percent of the state's GHGs.
12 Climate forcing refers to the difference between energy that Earth receives from the sun and the amount of energy radiated back into space. Man-made climate forcing is the additional energy that is retained in the Earth’s atmosphere, oceans, and land due to the presence of greenhouse gases and aerosols in the atmosphere, as well as changes in land surface reflectivity.
13 California Air Resources Board, Revised Proposed Short-Lived Climate Pollutant Reduction Strategy, November 2016, http://www.arb.ca.gov/cc/shortlived/shortlived.htm.
California Energy Commission – Tracking Progress
Last updated December 2017 Greenhouse Gas Emission Reductions 9
Figure 7: Relative Contribution of Various Greenhouse Gases in California
Source: California Energy Commission staff using data from CARB’s Greenhouse Gas Emissions Inventory – 2017 Edition (available at https://www.arb.ca.gov/cc/inventory/data/data.htm ) Note: 2015 data shown with the exception of black carbon for which 2013 are the most recent data available.
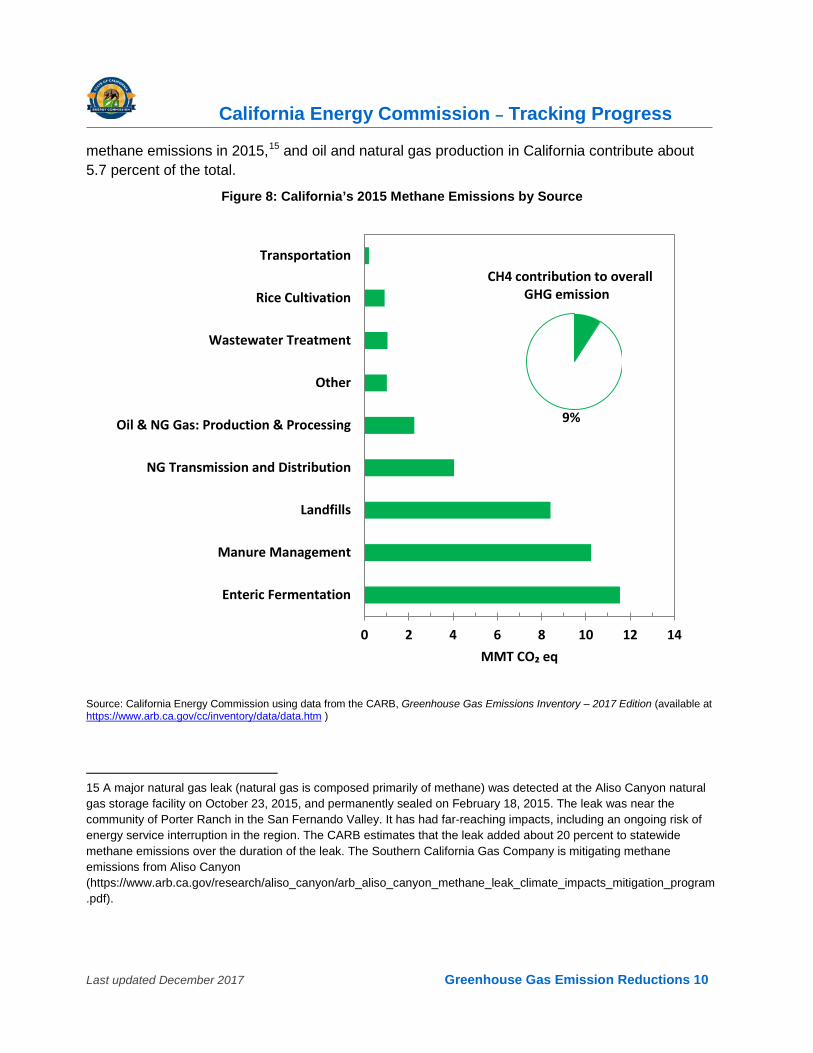
Methane accounts for about 9 percent of the state’s overall greenhouse gas emissions. Figure 8 on the next page shows the sources and relative magnitude of methane emissions. Enteric fermentation14 and manure from dairy cows and steer are the largest sources, accounting for about 55 percent of methane emissions in 2015. Landfills are the third largest source, accounting for about 21 percent. Natural gas transmission and distribution accounted for about 10 percent of
14 Enteric fermentation is a natural part of the digestive process for many ruminant animals where anaerobic microbes decompose and ferment food in the digestive tract and produce compounds for absorption by the animal.
California Energy Commission – Tracking Progress
Last updated December 2017 Greenhouse Gas Emission Reductions 10
methane emissions in 2015,15 and oil and natural gas production in California contribute about 5.7 percent of the total.
Figure 8: California’s 2015 Methane Emissions by Source
Source: California Energy Commission using data from the CARB, Greenhouse Gas Emissions Inventory – 2017 Edition (available at https://www.arb.ca.gov/cc/inventory/data/data.htm )
15 A major natural gas leak (natural gas is composed primarily of methane) was detected at the Aliso Canyon natural gas storage facility on October 23, 2015, and permanently sealed on February 18, 2015. The leak was near the community of Porter Ranch in the San Fernando Valley. It has had far-reaching impacts, including an ongoing risk of energy service interruption in the region. The CARB estimates that the leak added about 20 percent to statewide methane emissions over the duration of the leak. The Southern California Gas Company is mitigating methane emissions from Aliso Canyon (https://www.arb.ca.gov/research/aliso_canyon/arb_aliso_canyon_methane_leak_climate_impacts_mitigation_program.pdf).
0 2 4 6 8 10 12 14
Enteric Fermentation
Manure Management
Landfills
NG Transmission and Distribution
Oil & NG Gas: Production & Processing
Other
Wastewater Treatment
Rice Cultivation
Transportation
MMT CO₂ eq
CH4 contribution to overall GHG emission
9%
California Energy Commission – Tracking Progress
Last updated December 2017 Greenhouse Gas Emission Reductions 11
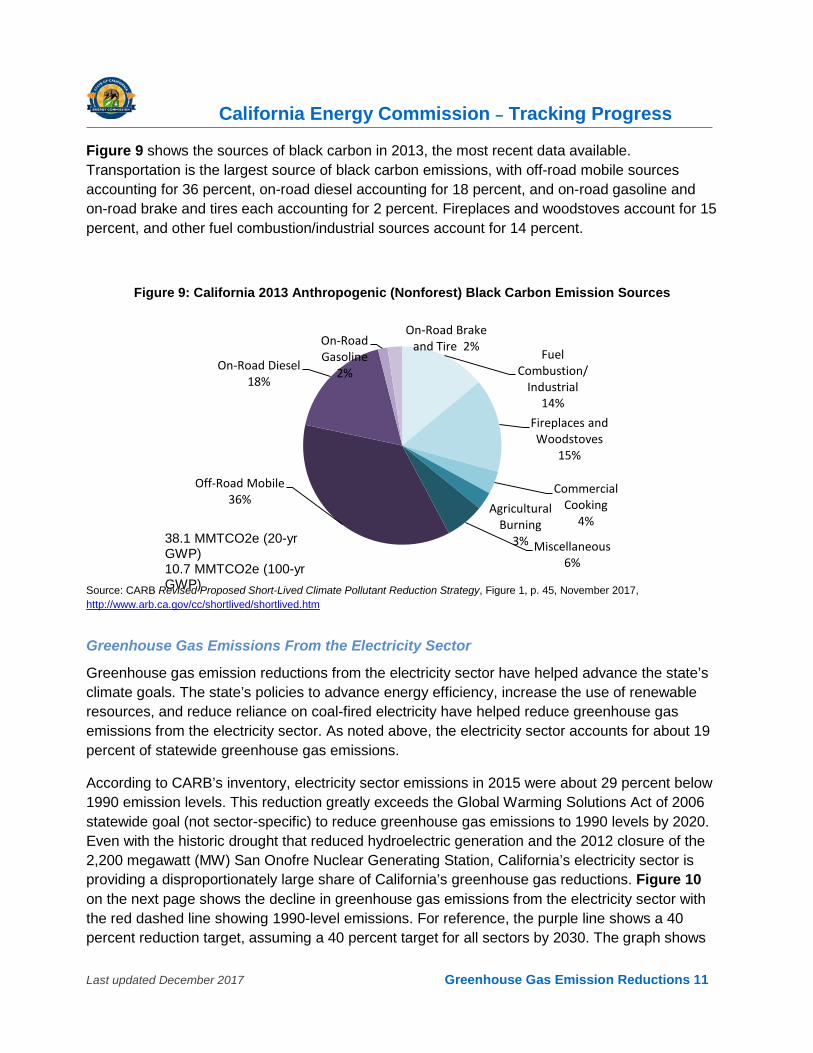
Figure 9 shows the sources of black carbon in 2013, the most recent data available. Transportation is the largest source of black carbon emissions, with off-road mobile sources accounting for 36 percent, on-road diesel accounting for 18 percent, and on-road gasoline and on-road brake and tires each accounting for 2 percent. Fireplaces and woodstoves account for 15 percent, and other fuel combustion/industrial sources account for 14 percent.
Figure 9: California 2013 Anthropogenic (Nonforest) Black Carbon Emission Sources
Source: CARB Revised Proposed Short-Lived Climate Pollutant Reduction Strategy, Figure 1, p. 45, November 2017, http://www.arb.ca.gov/cc/shortlived/shortlived.htm
Greenhouse Gas Emissions From the Electricity Sector
Greenhouse gas emission reductions from the electricity sector have helped advance the state’s climate goals. The state’s policies to advance energy efficiency, increase the use of renewable resources, and reduce reliance on coal-fired electricity have helped reduce greenhouse gas emissions from the electricity sector. As noted above, the electricity sector accounts for about 19 percent of statewide greenhouse gas emissions.
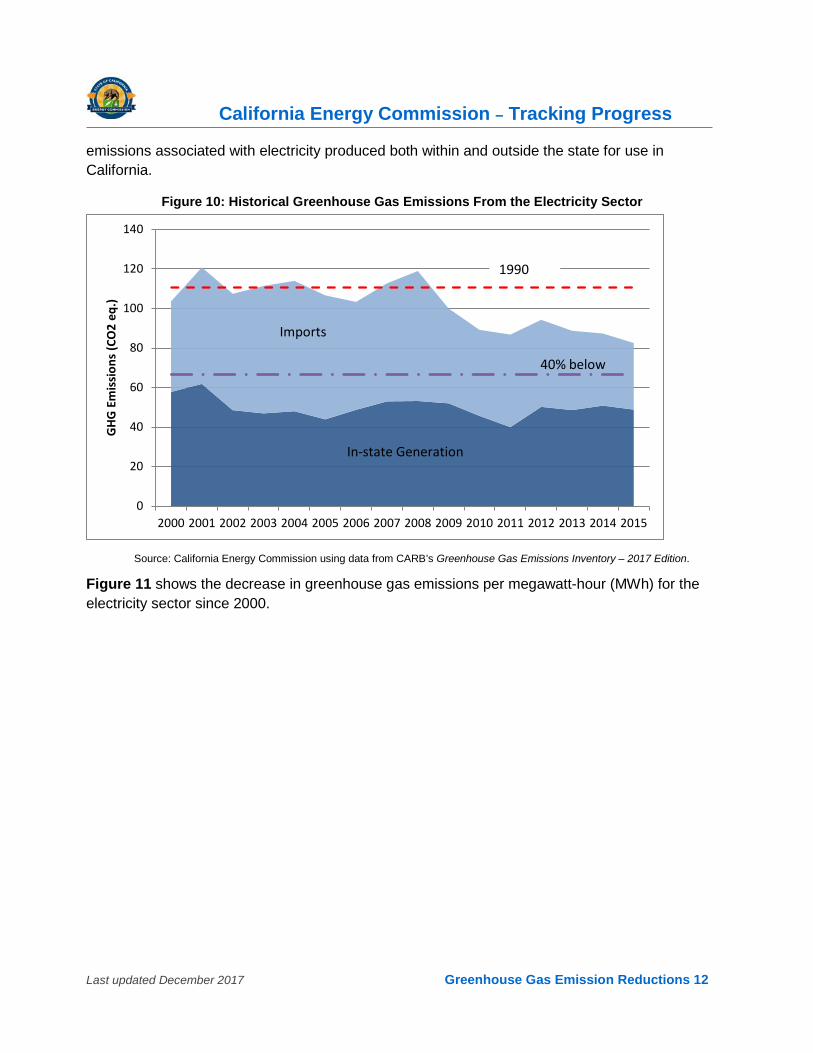
According to CARB’s inventory, electricity sector emissions in 2015 were about 29 percent below 1990 emission levels. This reduction greatly exceeds the Global Warming Solutions Act of 2006 statewide goal (not sector-specific) to reduce greenhouse gas emissions to 1990 levels by 2020. Even with the historic drought that reduced hydroelectric generation and the 2012 closure of the 2,200 megawatt (MW) San Onofre Nuclear Generating Station, California’s electricity sector is providing a disproportionately large share of California’s greenhouse gas reductions. Figure 10 on the next page shows the decline in greenhouse gas emissions from the electricity sector with the red dashed line showing 1990-level emissions. For reference, the purple line shows a 40 percent reduction target, assuming a 40 percent target for all sectors by 2030. The graph shows
Fuel Combustion/
Industrial 14%
Fireplaces and Woodstoves
15%
Commercial Cooking
4% Agricultural
Burning 3% Miscellaneous
6%
Off-Road Mobile 36%
On-Road Diesel 18%
On-Road Gasoline
2%
On-Road Brake and Tire 2%
38.1 MMTCO2e (20-yr GWP) 10.7 MMTCO2e (100-yr GWP)
California Energy Commission – Tracking Progress
Last updated December 2017 Greenhouse Gas Emission Reductions 12
emissions associated with electricity produced both within and outside the state for use in California.
Figure 10: Historical Greenhouse Gas Emissions From the Electricity Sector
Source: California Energy Commission using data from CARB’s Greenhouse Gas Emissions Inventory – 2017 Edition.
Figure 11 shows the decrease in greenhouse gas emissions per megawatt-hour (MWh) for the electricity sector since 2000.
0
20
40
60
80
100
120
140
2000 2001 2002 2003 2004 2005 2006 2007 2008 2009 2010 2011 2012 2013 2014 2015
GHG
Em
issi
ons
(CO
2 eq
.)
1990
40% below
In-state Generation
Imports
California Energy Commission – Tracking Progress
Last updated December 2017 Greenhouse Gas Emission Reductions 13
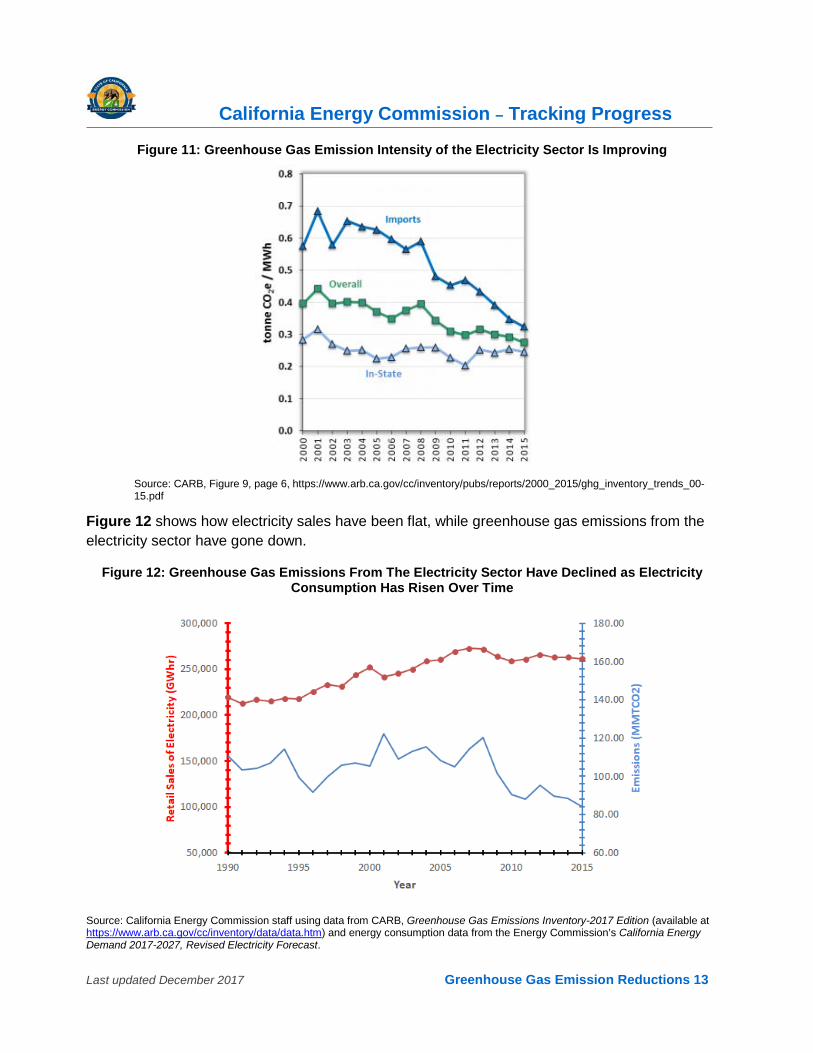
Figure 11: Greenhouse Gas Emission Intensity of the Electricity Sector Is Improving
Source: CARB, Figure 9, page 6, https://www.arb.ca.gov/cc/inventory/pubs/reports/2000_2015/ghg_inventory_trends_00-15.pdf
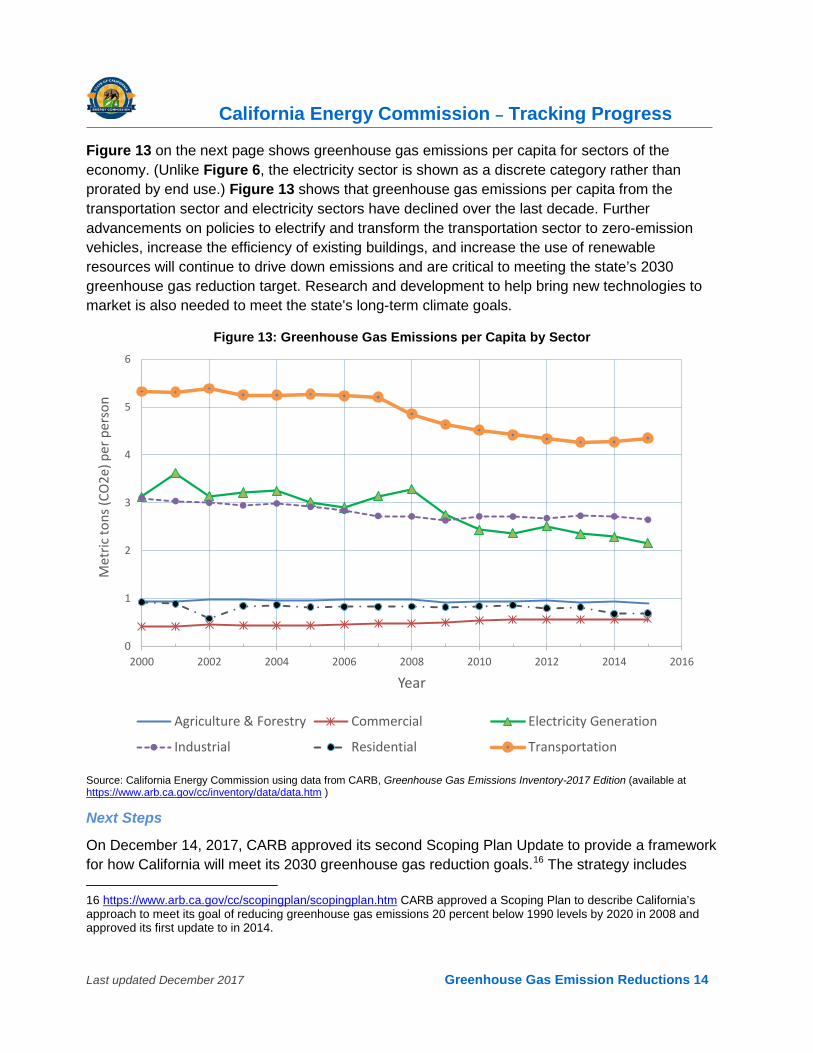
Figure 12 shows how electricity sales have been flat, while greenhouse gas emissions from the electricity sector have gone down.
Figure 12: Greenhouse Gas Emissions From The Electricity Sector Have Declined as Electricity Consumption Has Risen Over Time
Source: California Energy Commission staff using data from CARB, Greenhouse Gas Emissions Inventory-2017 Edition (available at https://www.arb.ca.gov/cc/inventory/data/data.htm) and energy consumption data from the Energy Commission’s California Energy Demand 2017-2027, Revised Electricity Forecast.
California Energy Commission – Tracking Progress
Last updated December 2017 Greenhouse Gas Emission Reductions 14
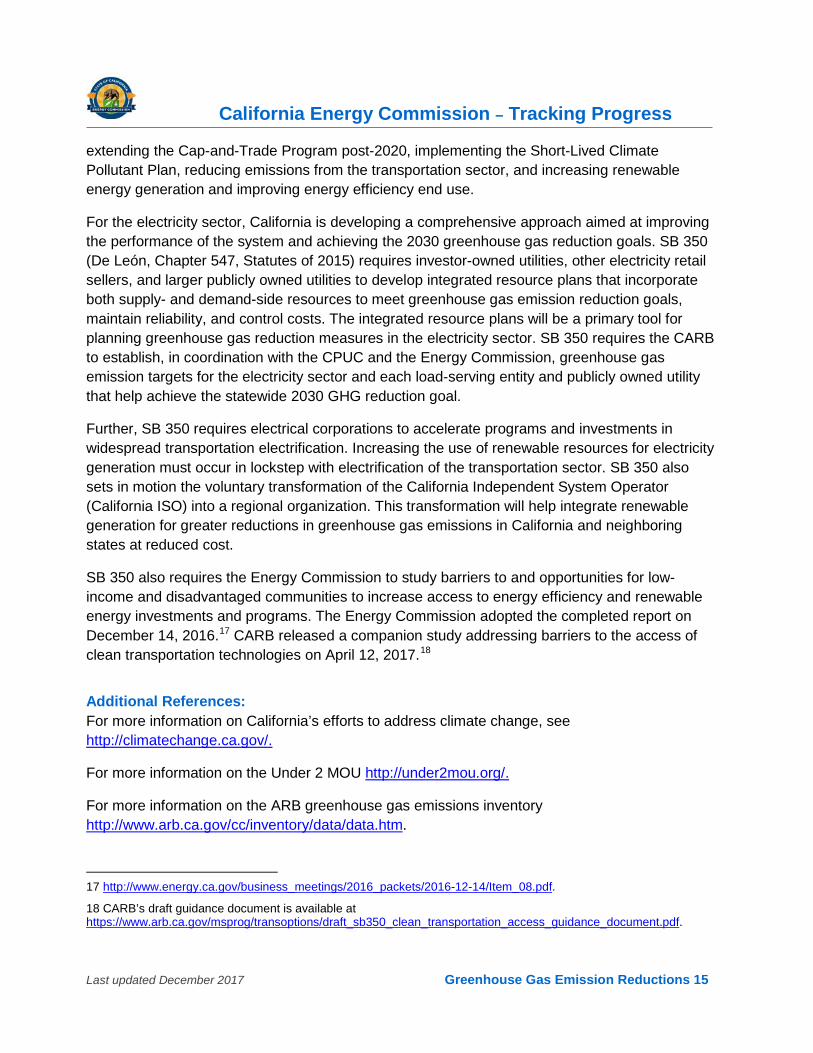
Figure 13 on the next page shows greenhouse gas emissions per capita for sectors of the economy. (Unlike Figure 6, the electricity sector is shown as a discrete category rather than prorated by end use.) Figure 13 shows that greenhouse gas emissions per capita from the transportation sector and electricity sectors have declined over the last decade. Further advancements on policies to electrify and transform the transportation sector to zero-emission vehicles, increase the efficiency of existing buildings, and increase the use of renewable resources will continue to drive down emissions and are critical to meeting the state’s 2030 greenhouse gas reduction target. Research and development to help bring new technologies to market is also needed to meet the state's long-term climate goals.
Figure 13: Greenhouse Gas Emissions per Capita by Sector
Source: California Energy Commission using data from CARB, Greenhouse Gas Emissions Inventory-2017 Edition (available at https://www.arb.ca.gov/cc/inventory/data/data.htm )
Next Steps
On December 14, 2017, CARB approved its second Scoping Plan Update to provide a framework for how California will meet its 2030 greenhouse gas reduction goals.16 The strategy includes 16 https://www.arb.ca.gov/cc/scopingplan/scopingplan.htm CARB approved a Scoping Plan to describe California’s approach to meet its goal of reducing greenhouse gas emissions 20 percent below 1990 levels by 2020 in 2008 and approved its first update to in 2014.
0
1
2
3
4
5
6
2000 2002 2004 2006 2008 2010 2012 2014 2016
Met
ric to
ns (C
O2e
) per
per
son
Year
Agriculture & Forestry Commercial Electricity Generation
Industrial Residential Transportation
California Energy Commission – Tracking Progress
Last updated December 2017 Greenhouse Gas Emission Reductions 15
extending the Cap-and-Trade Program post-2020, implementing the Short-Lived Climate Pollutant Plan, reducing emissions from the transportation sector, and increasing renewable energy generation and improving energy efficiency end use.
For the electricity sector, California is developing a comprehensive approach aimed at improving the performance of the system and achieving the 2030 greenhouse gas reduction goals. SB 350 (De León, Chapter 547, Statutes of 2015) requires investor-owned utilities, other electricity retail sellers, and larger publicly owned utilities to develop integrated resource plans that incorporate both supply- and demand-side resources to meet greenhouse gas emission reduction goals, maintain reliability, and control costs. The integrated resource plans will be a primary tool for planning greenhouse gas reduction measures in the electricity sector. SB 350 requires the CARB to establish, in coordination with the CPUC and the Energy Commission, greenhouse gas emission targets for the electricity sector and each load-serving entity and publicly owned utility that help achieve the statewide 2030 GHG reduction goal.
Further, SB 350 requires electrical corporations to accelerate programs and investments in widespread transportation electrification. Increasing the use of renewable resources for electricity generation must occur in lockstep with electrification of the transportation sector. SB 350 also sets in motion the voluntary transformation of the California Independent System Operator (California ISO) into a regional organization. This transformation will help integrate renewable generation for greater reductions in greenhouse gas emissions in California and neighboring states at reduced cost.
SB 350 also requires the Energy Commission to study barriers to and opportunities for low-income and disadvantaged communities to increase access to energy efficiency and renewable energy investments and programs. The Energy Commission adopted the completed report on December 14, 2016.17 CARB released a companion study addressing barriers to the access of clean transportation technologies on April 12, 2017.18
Additional References: For more information on California’s efforts to address climate change, see http://climatechange.ca.gov/.
For more information on the Under 2 MOU http://under2mou.org/.
For more information on the ARB greenhouse gas emissions inventory http://www.arb.ca.gov/cc/inventory/data/data.htm.
17 http://www.energy.ca.gov/business_meetings/2016_packets/2016-12-14/Item_08.pdf.
18 CARB’s draft guidance document is available at https://www.arb.ca.gov/msprog/transoptions/draft_sb350_clean_transportation_access_guidance_document.pdf.
California Energy Commission – Tracking Progress
Last updated December 2017 Greenhouse Gas Emission Reductions 16
For more information on the CARB reducing short-lived climate pollutants in California https://www.arb.ca.gov/cc/shortlived/shortlived.htm.
Contact: Guido Franco, [email protected]
Next Update: December 2018 and annually