2009 GREENHOUSE GAS (GHG) SAVINGS STUDY …usedoilrecycling.com/resources/file/BC/BCUOMA GHG Savings...
83
Worldwide Engineering, Environmental, Construction, and IT Services 2009 GREENHOUSE GAS (GHG) SAVINGS STUDY REPORT Prepared For: British Columbia Used Oil Management Association (BCUOMA) 9 – 45905 Yale Road, Suite #125 Chilliwack, British Columbia, V2P 8E6 AUGUST 2010 REF. NO. 071620(2) Prepared by: Conestoga-Rovers & Associates 110-3851 Shell Road Richmond, British Columbia Canada V6X 2W2 Office: (604) 214-0510 Fax: (604) 214-0525 web: http:\\www.CRAworld.com
Transcript of 2009 GREENHOUSE GAS (GHG) SAVINGS STUDY …usedoilrecycling.com/resources/file/BC/BCUOMA GHG Savings...

W o r l d w i d e E n g i n e e r i n g , E n v i r o n m e n t a l , C o n s t r u c t i o n , a n d I T S e r v i c e s
2009 GREENHOUSE GAS (GHG) SAVINGS STUDY REPORT Prepared For:
British Columbia Used Oil Management Association (BCUOMA) 9 – 45905 Yale Road, Suite #125 Chilliwack, British Columbia, V2P 8E6
AUGUST 2010 REF. NO. 071620(2)
Prepared by: Conestoga-Rovers & Associates 110-3851 Shell Road Richmond, British Columbia Canada V6X 2W2
Office: (604) 214-0510 Fax: (604) 214-0525
web: http:\\www.CRAworld.com
071620 (2) CONESTOGA-ROVERS & ASSOCIATES
TABLE OF CONTENTS Page
1.0 INTRODUCTION ...................................................................................................................1 1.1 BACKGROUND AND SCOPE OF STUDY .....................................................1 1.1.1 IDENTIFICATION OF PROJECT SCENARIO................................................1 1.1.2 IDENTIFICATION OF BASELINE SCENARIO .............................................2 1.2 ORGANIZATION OF THE REPORT...............................................................3
2.0 INPUT DATA ..........................................................................................................................4 2.1 DATA COLLECTION.........................................................................................4 2.2 EMISSION FACTORS.........................................................................................5
3.0 METHODOLOGY.................................................................................................................10 3.1 MATERIALS COLLECTION ...........................................................................10 3.2 TRANSPORTATION DISTANCES.................................................................12 3.2.1 BASELINE SCENARIO ....................................................................................12 3.2.2 PROJECT SCENARIO.......................................................................................12 3.2.3 DETERMINATION OF TOTAL DISTANCES ..............................................15 3.3 TRANSPORTATION GHG EMISSIONS .......................................................16 3.4 BASELINE EMISSIONS (EXCLUDING TRANSPORTATION) .................16 3.4.1 OIL PRODUCTS EMISSIONS..........................................................................17 3.4.2 OIL FILTER EMISSIONS..................................................................................17 3.4.3 OIL CONTAINER EMISSIONS.......................................................................18 3.5 PROJECT EMISSIONS (EXCLUDING TRANSPORTATION)....................18
4.0 RESULTS OF THE STUDY ..................................................................................................20
5.0 REFERENCES........................................................................................................................21

071620 (2) CONESTOGA-ROVERS & ASSOCIATES
LIST OF FIGURES (Following Text)
FIGURE 3.1 BCUOMA COLLECTION ZONE MAP FIGURE 3.2 BRITISH COLUMBIA REGIONAL DISTRICTS MAP
LIST OF TABLES (Following Text)
TABLE 1.1 PROJECT AND BASELINE ELEMENTS TABLE 2.1 MATERIAL QUANTITIES COLLECTED IN 2009 TABLE 2.2 EMISSION FACTORS (GLOBAL WARMING POTENTIAL) TABLE 3.1 USED OIL, FILTER, AND CONTAINER COLLECTION AND RECYCLING
BY CENSUS DIVISION TABLE 3.2 TRANSPORTATION COMPONENTS OF USED OIL, FILTERS AND
CONTAINERS TABLE 3.3 PROJECT – DESTINATION DISTANCES TABLE 4.1 RESULTS OF THE GHG SAVINGS STUDY
LIST OF APPENDICES APPENDIX A RAW PROCESSING FACILITY COLLECTION DATA APPENDIX B DATA CALCULATIONS APPENDIX C RAW EMISSION FACTOR DATA (GLOBAL WARMING POTENTIAL)
LIST OF ATTACHMENTS ATTACHMENT 1 MICROSOFT EXCEL WORKBOOK MODEL

071620 (2) CONESTOGA-ROVERS & ASSOCIATES
LIST OF CONVERSIONS, SYMBOLS AND ACRONYMS
0.0283 conversion factor from cubic foot to cubic metre 3.785 conversion factor from gallon to litre BC British Columbia BCUOMA British Columbia Used Oil Management Association BTU British thermal unit CO2 carbon dioxide Collector Registered Collector CRA Conestoga-Rovers & Associates ft3 cubic foot Generator used oil materials generator GHG greenhouse gases GRVD Greater Vancouver Regional District HDPE high-density polyethylene kg kilogram km kilometre L litre m3 cubic metre Processor Registered Processing Facility RD Regional District Report 2009 Greenhouse Gas Savings Study Final Report Return Facility Registered Return Collection Facility Study 2009 Greenhouse Gas Savings Study yd3 cubic yard

071620 (2) 1 CONESTOGA-ROVERS & ASSOCIATES
1.0 INTRODUCTION
This 2009 Greenhouse Gas Savings Study (Study) Final Report (Report) has been prepared by Conestoga-Rovers & Associates (CRA) on behalf of the British Columbia Used Oil Management Association (BCUOMA), to determine the reduction in GHG emissions that occurred as a result of BCUOMA's collection and recycling programs in 2009. 1.1 BACKGROUND AND SCOPE OF STUDY
The BCUOMA is a not-for-profit Society composed of 193 producer members in the province of British Columbia (BC), and is responsible for the operation of a province-wide collection and recycling program for used lubricating oil, oil filters and used oil containers sold through the producer members' retail and wholesale facilities, as mandated by the province. This Study involved the analysis of the 2009 GHG emissions savings from the operation of BCUOMA's robust collection and recycling program. Total 2009 GHG savings realized were identified for the following three functional units: 1. Per litre of oil that is collected and re-refined or used as a fuel
2. Per filter that is collected and recycled in a steel mill
3. Per kilogram (kg) of oil container that is collected and processed for sale as high-density polyethylene (HDPE) pellets
These savings were determined by calculating the difference between the GHG emissions created by the BCUOMA's program, called the Project scenario, and the emissions that would be created in the absence of the BCUOMA program, called the Baseline scenario. The Project and Baseline scenarios were divided into various Elements, which represent specific and unique processes that generate emissions, such as transportation and materials processing. 1.1.1 IDENTIFICATION OF PROJECT SCENARIO
The BCUOMA recycling program consists of a network of over 4,000 used oil material generators (Generators), of which about 500 of them are Return Collection Facilities (Return Facilities) for the do-it-yourselfers. The Generators consist mainly of auto service and repair centers and industrial operations throughout British Columbia (BC).

071620 (2) 2 CONESTOGA-ROVERS & ASSOCIATES
BCUOMA Registered Collectors (Collectors) regularly pick up the used oil materials from the Generators and deliver them to BCUOMA Registered Processing Facilities (Processors) in BC, Alberta (AB), and Washington State (WA). Almost half of the used oil is shipped directly from Collectors to pulp mills in WA and asphalt plants in BC and AB. The component of used oil recycled for re-refining purposes yields new consumer lubricating oil products that are shipped to retailers across the province. For oil filters, processing yields crushed paper and metal, and reclaimed oil. A small fraction of the crushed paper filters is sent to the Burnaby waste-to-energy facility for incineration. The remainder of the paper filters and all metal filters are sent to metal brokers and subsequently steel mills in BC and AB for processing into new steel products (paper is burned as part of the steel making operation). For oil containers, processing yields HDPE pellets and reclaimed oil. The HDPE pellets are sent to manufacturers of plastics to be turned into various products. It is noted that oil is recovered from the collected oil filters and containers, and this volume of oil recovered has been included in the total oil collected. It is not known how much of the total oil collected was recovered from the filters and containers, and therefore, the GHG savings from recovering this oil have been allocated to the recycled oil component of this Study. It is also noted that this oil would have been landfilled and therefore the calculations for the production of oil from raw materials for the recycled oil Baseline may be slightly skewed high. The individual Project Elements for each of the three materials are presented in Table 1.1. 1.1.2 IDENTIFICATION OF BASELINE SCENARIO
Previously oil was combusted at the Generators, sprayed on roads as a dust suppressant, or disposed of to the environment. As spraying oil on the roads is no longer exercised and the majority of used oil is collected and not disposed of to the environment, the Baseline scenario of combusting at the Generators is applicable. As the oil is re-refined or used as a fuel in the Project scenario, the Baseline for the oil analysis would also include the production of heating oil from raw materials. For the oil filters and containers Baseline scenario, these materials were transported to landfill for final disposal or disposed of to the environment without the operation of the BCUOMA program. For this Study, it was assumed that all materials were landfilled. Transportation thus consists of common municipal refuse trucks transporting the filters

071620 (2) 3 CONESTOGA-ROVERS & ASSOCIATES
and containers from the Generators to the closest municipal/district landfills. As the oil filters and containers are recycled and reused (or incinerated, in the case of some of the paper filters) in the Project scenario, the Baseline also includes the production of steel and HDPE from raw materials, and the decomposition of the paper filters in a municipal landfill. The individual Baseline Elements for each of the three materials are presented in Table 1.1. 1.2 ORGANIZATION OF THE REPORT
This Report has been organized into the following sections: • Section 1.0 Introduction: presents an introduction and background to the Study
• Section 2.0 Input Data: presents the input data for the Study provided by BCUOMA, Processors, and additional resources
• Section 3.0 Methodology: discusses in detail the methodology utilized in calculating the GHG savings
• Section 4.0 Results of the Study: presents the results of the Study
• Section 5.0 References: provides a list of references utilized to complete the Study

071620 (2) 4 CONESTOGA-ROVERS & ASSOCIATES
2.0 INPUT DATA
2.1 DATA COLLECTION
CRA was provided with the amount of materials collected (used oil in litres [L], oil filters in kg, and oil containers in kg) in each Zone (as specified by BCUOMA) for the 2009 year. This data is presented in Table 2.1, along with total 2009 sales of materials and additional recovery and rejection estimates for the three materials. All the original data provided by BCUOMA is highlighted blue. These values in the Microsoft Excel model file (Attachment 1) can be updated annually to analyze the GHG savings for subsequent years. As the antifreeze containers will become part of the BCUOMA program in 2011, a blank row was provided within this table, to be filled in when appropriate. 2006 Census population data for each of BC's census subdivisions was used to represent the geographic distribution of materials collection to aid in the estimation of transportation distances. This data was obtained from a Microsoft Excel data spreadsheet provided on the BC Stats website (Statistics Canada, 2006). The locations of Return Facilities, Collectors, and Processors are provided on the BCUOMA website. Additionally, the materials that each Return Facility accepts, each Collector collects and each Processor processes are indicated. The locations of pulp mills, asphalt plants, steel mills, and plastics manufacturers (end users) were found through industry association websites and associated research. Where possible, larger facilities and facilities in or near BC were selected. All transportation distances were estimated using Google Maps or Google Earth software (Google, 2010). M&R Environmental provided 2009 collection data for used oil, filters, and containers, and Merlin Plastics Supply provided 2009 collection data for containers. The raw data is presented in Appendix A. Safety-Kleen Systems, Inc. (Safety-Kleen) also provided 2009 collection data for total used oil and used oil from BC. Data specific to the Project was utilized to form the data required for the Baseline for comparison purposes.

071620 (2) 5 CONESTOGA-ROVERS & ASSOCIATES
Appendix B contains all the relevant calculations performed to obtain proper values to multiply with the emission factors to obtain GHG emissions for each Element. 2.2 EMISSION FACTORS
Appendix C contains all the raw emission factor data utilized in this analysis. Table 2.2 presents a summary of the emission factors utilized for each Project and Baseline Element. BC-specific emission factors were used where available, if not, Canadian- or North American-specific emission factors were used. In the event where emission factors were not available for North America, emission factors were taken from other locations around the world in order to evaluate each Element within this Study. Transportation The emission factors for the diesel consumption of trucks for the transportation of materials from all Generators to Collectors, Processors, and end users (i.e., asphalt plant, pulp mill, steel mill) were taken from the Energy Mobile Combustion Sources – Road Transport section of the Environment Canada document, National Inventory Report, Greenhouse Gas Source and Sinks in Canada, 1990-2008 (Environment Canada, 2009). Heavy-duty vehicle with moderate control, weighing more than 3,900 kg for both the truck and the load was assumed. For the transportation of used oil to a re-refinery by rail, emission factors for a diesel train were used from the above-noted Environment Canada document. Recycled Oil Safety-Kleen provided the results of a life cycle analysis report to CRA to be utilized in this Study. The report entitled, "Safety-Kleen Product Carbon Footprint for Re-refined Base Oil", prepared by ENVIRON International Corporation in October 2009, includes relevant emissions data for the oil re-refinery process used by Safety-Kleen. The following components of oil re-refining and associated calculated emission factors were utilized in this Study: • Re-refinery input materials
• Re-refinery diesel
• Re-refinery electricity
• Re-refinery natural gas

071620 (2) 6 CONESTOGA-ROVERS & ASSOCIATES
• Re-refinery fuel (co-products consumed on-site)
• Waste (including energy recovery)
• Co-products recovery (offsetting production from raw materials)
The process of oil re-refining consumes about 14 percent of the used oil re-refined. This percentage has been accounted for within the Baseline scenario by reducing the amount of oil to be produced from raw materials by 14 percent. The production of oil for the Baseline scenario included emission factors for the extraction of crude oil, transportation of crude oil to the refinery, and the refining of crude oil into oil products. The emission factors for the production of crude oil were taken from Pembina Institute's emission factor database (Pembina, ND) for the production of light and medium, and heavy crude oil. These emission factors include the emissions associated with initial oil well development, which includes exploratory drilling, development drilling and production. These emission factors are Canadian-specific. As the actual breakdown of light, medium and heavy oils was not available, it was assumed that the ratio between the three different types is equal. A weighted emission factor was calculated to account for this divide. The emission factors for the transportation of crude oil were taken from Pembina Institute's emission factor database (Pembina, ND) for crude oil transmission. These emission factors assume the piping of crude oil using diesel generators, using US data from 1991. These emission factors are based on volume of crude oil and transmission distance. A distance of 1,000 km was assumed to account for the distance from the oil sands in Athabasca, AB to the Chevron Corporation Refinery in Burnaby, BC. The Ecoinvent Life Cycle Inventory Database (Ecoinvent, 2009) was used to obtain emission factors for the refinery of crude oil. These emission factors include all processes on the refinery site from a survey of European refineries, excluding the emissions from combustion facilities, including waste water treatment, process emissions and direct discharges to rivers. The emission factors for the combustion of oil for heat at the Generators in the Baseline scenario were taken from the Environment Canada, 2009 document for heavy oil combustion in an industrial setting. The same emission factors were used for the combustion of used oil in asphalt plants and pulp mills in the Project scenario.

071620 (2) 7 CONESTOGA-ROVERS & ASSOCIATES
Recycled Oil Filters (Metal) M&R Environmental provided annual energy usage data for their facility in 2007 and 2008 which included: office and plant electricity requirements; natural gas for heating and distillation (85 percent used for antifreeze distillation which is outside the scope of this Study); diesel, biodiesel, and gasoline requirements for the transportation (collection) component; and, propane to operate fork lifts within the plant. An average between the two years was taken, as 2009 data was not available and the actual quantities of materials processed in 2007 and 2008 were not known. Annual quantities of each type of energy were calculated for the Project scenario based on the weight of materials recycled at M&R Environmental. M&R Environmental processes recycled oil filters (both metal and paper) and containers, and minimal effort is done on-site to handle and transport collected oil to the Processors. Based on discussions with M&R Environmental, the energy requirements for oil handling on-site is minimal, and therefore was assumed negligible. The actual energy breakdown for metal filters, paper filters, and containers is unknown and therefore assumptions were made as follows. M&R Environmental's diesel, biodiesel, and gasoline usages were not used as the transportation component of this Study was completed as a whole for the entire BCUOMA program. The 15 percent of natural gas remaining after distillation requirements was removed, was divided between metal filters, paper filters, and containers based on weight recycled at M&R Environmental. The same divide was made with the propane used in the fork lifts. Electricity requirements for metal filter, paper filter, and container processing was calculated based on equipment similar to what is actually used. The energy requirements for a commercial filter crusher were used, and the electricity requirements to crush the metal and paper filters processed at M&R Environmental were calculated. It was assumed that 20 percent of the total electricity was used in the office. Therefore, the total electricity minus the electricity calculated to crush the metal and paper filters and to operate the office was assumed to be the electricity required to process the containers. The electricity used in the office was divided between the metal filters, paper filters, and containers based on weight processed. The emission factor for electricity generation in BC was taken from the Environment Canada document, National Inventory Report, Greenhouse Gas Source and Sinks in Canada, 1990-2008 (Environment Canada, 2009), Table A13-11. The emission factors for natural gas production, processing, and distributing were taken from the Canadian Association of Petroleum Producers 2005 report, A National

071620 (2) 8 CONESTOGA-ROVERS & ASSOCIATES
Inventory of Greenhouse Gas, Criteria Air Contaminant (CAC) and Hydrogen Sulphide (H2S) Emissions by the Upstream Oil and Gas Industry, Volume 1, Overview of the GHG Emissions Inventory (Canadian Association of Petroleum Producers, 2005). The emission factors for natural gas combustion for heat were taken from the Environmental Protection Agency 1998 document, AP42, Fifth Edition, Volume 1, Chapter 1: External Combustion Sources, 1.4 Natural Gas Combustion (US EPA, 1998). The emission factor for the production of liquid propane gas was taken from the Government of Canada, Technology Early Action Measures, Emission Factor Database. The emission factors for the combustion of propane as a fuel were taken from Environment Canada, 2009, Table A8-11. Please refer to Appendix B for a further description of the assumptions made for the energy requirements and emission factors used for filter and container processing. The emission factors for the production of steel for the Baseline scenario were taken from the Pembina Institute's emission factor database (Pembina, ND) for steel production. These emission factors represent an average of values taken from sources from Canada, Alberta, US, and Switzerland. The boundaries differ for each source however the average is considered indicative of the entire life cycle production of steel from the raw materials extraction (i.e., iron ore mining activities) to hot stripping and cold rolling steel production. The transportation of steel to the steel mill is also included in these emission factors. Recycled Oil Filters (Paper) Refer to the discussion above for the emission factors for recycled metal oil filters for information pertaining to the processing of paper oil filters at the Processor for the Project scenario. The Ecoinvent Life Cycle Inventory Database (Ecoinvent, 2009) was used to obtain emission factors for the disposal of paper to a municipal incinerator for the Project. These emission factors include waste-specific air emissions from incineration, auxiliary material consumption for flue gas cleaning, utilizing technology specific to Switzerland in 2000 which is applicable to modern incineration practices in Europe, North America and Japan. The emissions associated with the decomposition of the paper filters for the Baseline scenario were calculated using the Scholl Canyon landfill gas model, assuming 100 percent paper. The model parameters for the methane generation potential (based

071620 (2) 9 CONESTOGA-ROVERS & ASSOCIATES
on material) and methane generation rate (based on precipitation) were taken from the Landfill Gas Generation Assessment Procedure Guidance Report, prepared by CRA, dated March 2009, for the British Columbia Ministry of Environment. Paper is assumed to be moderately decomposable material. Recycled Oil Containers Refer to the discussion above for the emission factors for recycled metal oil filters for information pertaining to the processing of oil containers at the Processor for the Project scenario. The emission factors for the production of HDPE for the Baseline scenario were taken from the Pembina Institute's emission factor database (Pembina, ND) for plastic (HDPE) production. These emission factors represent European data from 1993, which has been considered fairly current and applicable to North America by the Pembina Institute. These emission factors include the emissions associated with the extraction of all raw materials up to the final polymerization. The transportation of HDPE to the plastics manufacturer is also included in these emission factors.

071620 (2) 10 CONESTOGA-ROVERS & ASSOCIATES
3.0 METHODOLOGY
This Section presents the methodology developed and utilized for this GHG savings study. Select equations used during the Study are presented and referenced in this section, along with the parameters associated with the equations. Where necessary, reasonable assumptions were made and discussed. 3.1 MATERIALS COLLECTION
In order to accurately represent the transportation distances traveled by collected materials across the province, the collection data was divided by Census Subdivision (Subdivision). A Subdivision is generally an incorporated municipality, an electoral area, or a grouping of Indian Reserves. In BC, each Subdivision is tied to a Regional District (RD), of which there are 28 in the province. Indian Reserve populations were excluded, as they are totaled for each RD and thus cannot be linked to specific Subdivisions. For the Study, each Subdivision was tied to a specific BCUOMA Collection Zone (Zone), based on their locations and mapping provided by BC Stats. There are 11 Zones in the province, and Figure 3.1 shows their coverage areas. Figure 3.2 shows the coverage of the 28 regional districts. With 2001 and 2006 populations provided in the data for each Subdivision, an annual population growth rate (r) was calculated using the following formula (Equation 1):
Equation 1: Annual Growth Rate
( )nrPP +⋅= 120012006
Where, P2006 = 2006 population
P2001 = 2001 population r = annual growth rate n = number of years (5)
071620 (2) 11 CONESTOGA-ROVERS & ASSOCIATES
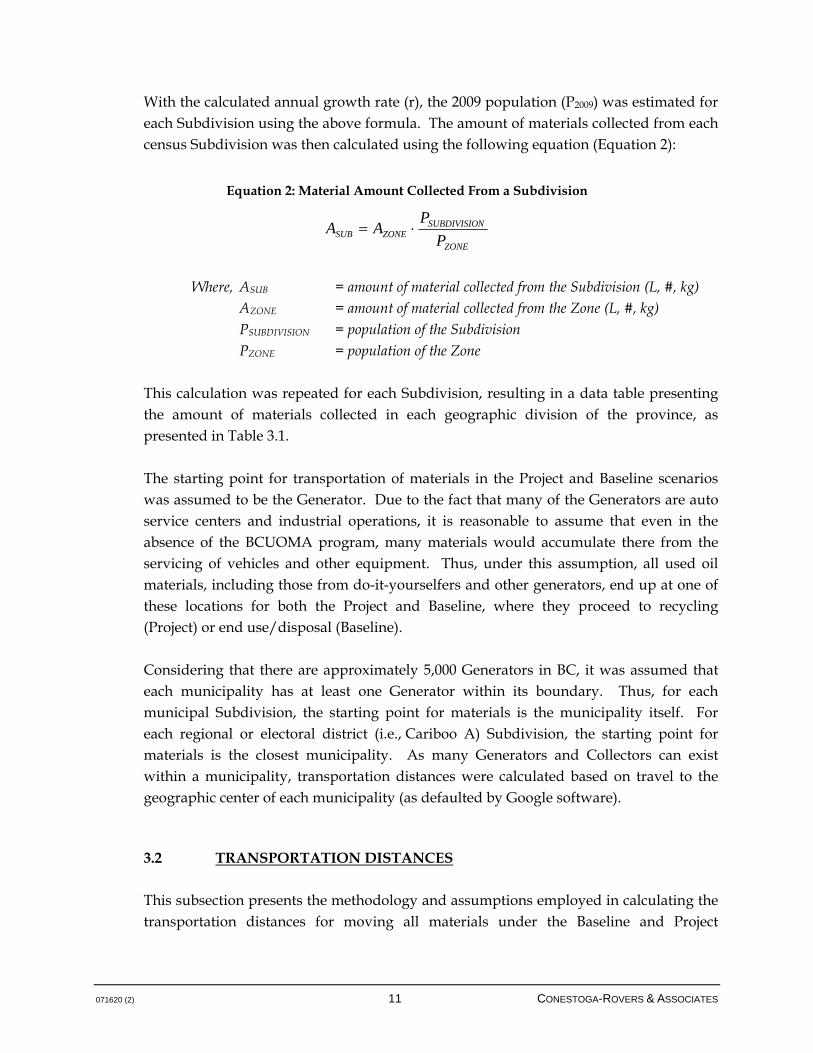
With the calculated annual growth rate (r), the 2009 population (P2009) was estimated for each Subdivision using the above formula. The amount of materials collected from each census Subdivision was then calculated using the following equation (Equation 2):
Equation 2: Material Amount Collected From a Subdivision
ZONE
NSUBDIVISIOZONESUB P
PAA ⋅=
Where, ASUB = amount of material collected from the Subdivision (L, #, kg)
AZONE = amount of material collected from the Zone (L, #, kg) PSUBDIVISION = population of the Subdivision PZONE = population of the Zone
This calculation was repeated for each Subdivision, resulting in a data table presenting the amount of materials collected in each geographic division of the province, as presented in Table 3.1. The starting point for transportation of materials in the Project and Baseline scenarios was assumed to be the Generator. Due to the fact that many of the Generators are auto service centers and industrial operations, it is reasonable to assume that even in the absence of the BCUOMA program, many materials would accumulate there from the servicing of vehicles and other equipment. Thus, under this assumption, all used oil materials, including those from do-it-yourselfers and other generators, end up at one of these locations for both the Project and Baseline, where they proceed to recycling (Project) or end use/disposal (Baseline). Considering that there are approximately 5,000 Generators in BC, it was assumed that each municipality has at least one Generator within its boundary. Thus, for each municipal Subdivision, the starting point for materials is the municipality itself. For each regional or electoral district (i.e., Cariboo A) Subdivision, the starting point for materials is the closest municipality. As many Generators and Collectors can exist within a municipality, transportation distances were calculated based on travel to the geographic center of each municipality (as defaulted by Google software). 3.2 TRANSPORTATION DISTANCES
This subsection presents the methodology and assumptions employed in calculating the transportation distances for moving all materials under the Baseline and Project

071620 (2) 12 CONESTOGA-ROVERS & ASSOCIATES
scenarios. For more information, please refer to the Microsoft Excel model file (Attachment 1). 3.2.1 BASELINE SCENARIO
Under the Baseline scenario, used oil is combusted at the Generators, while the oil filters and containers are transported to landfill for final disposal. Transportation thus consists only of common municipal refuse trucks bringing the filters and containers from the Generators to the closest municipal/district landfills. For an individual refuse truck, a capacity of 23 cubic metres (m3) (30 cubic yards [yd3]) was assumed. Generally, these trucks have capacities ranging from 20 yd3 (rear-loader) to 40 yd3 (front loader), making 30 yd3 a reasonable middle value (Mid-Iowa, 2008). The hydraulic compaction ability of refuse trucks was considered negligible. The truck's capacity for oil filters was calculated assuming a typical size of filter retrieved from FRAM, a major oil filter manufacturer. The truck's capacity for oil containers was calculated by assuming the amounts and densities of air and HDPE occupying the space. The 1-5 L containers are not compacted, and thus contain a significant portion of air (70 percent assumed). The 20 L containers are stacked, reducing the amount of air space (5 percent assumed). It was assumed that a truck's volume is equally split between 20 L and 1-5 L containers. A fuel consumption value of 0.84 L/kilometre (km) was used (Siuru, 2003, p. 1). The transportation distances of the new virgin materials (oil, steel, plastic) being produced are accounted for in the Emission Factors chosen for the associated processes, as they are based on life cycle analyses, as discussed in Section 2.2. Transportation distances for moving new lubricating oil from refinery to retailer (Baseline) were considered to be similar to distances for moving re-refined lubricating oil from re-refinery to retailer (Project) and were thus not accounted for in the calculations. 3.2.2 PROJECT SCENARIO
Under the Project scenario, used oil, oil filters, and oil containers are first transported from the Generators by the Collectors to the Processors. It was assumed that materials from each Generator were transported to the closest Collector accepting the materials. Transportation distances from Generators to Collectors that exist within the same municipality were calculated as one half of the radius of the geographic area of the
071620 (2) 13 CONESTOGA-ROVERS & ASSOCIATES
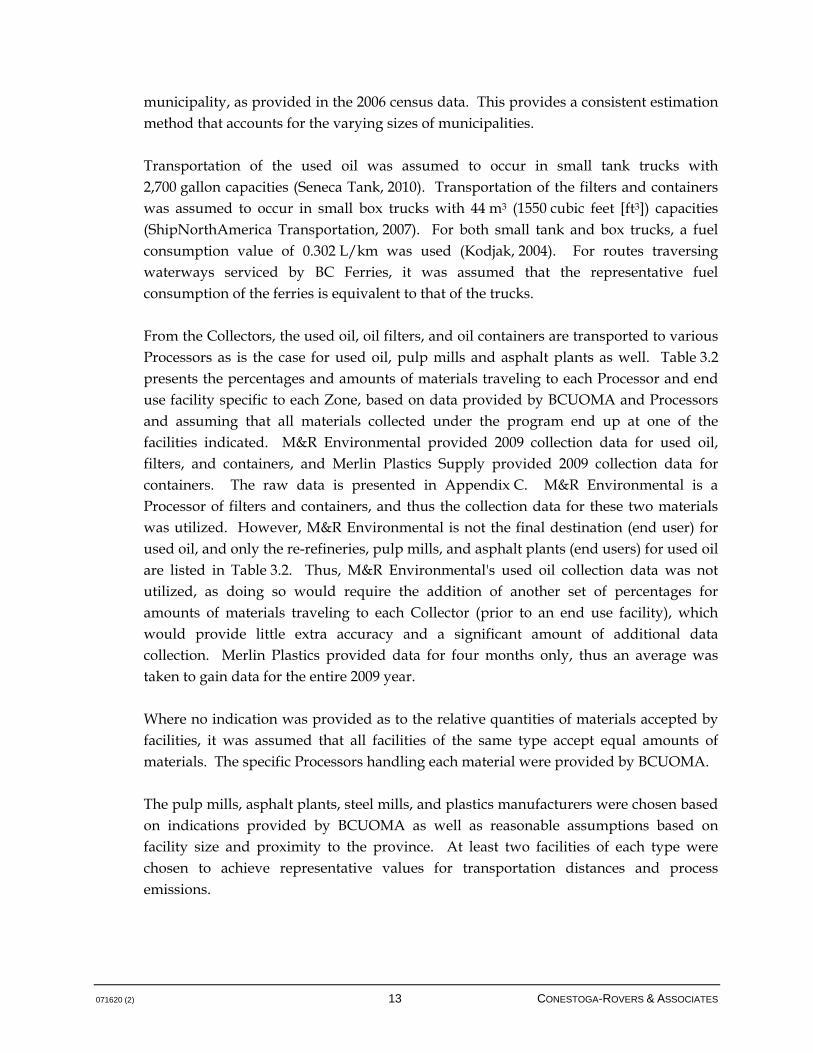
municipality, as provided in the 2006 census data. This provides a consistent estimation method that accounts for the varying sizes of municipalities. Transportation of the used oil was assumed to occur in small tank trucks with 2,700 gallon capacities (Seneca Tank, 2010). Transportation of the filters and containers was assumed to occur in small box trucks with 44 m3 (1550 cubic feet [ft3]) capacities (ShipNorthAmerica Transportation, 2007). For both small tank and box trucks, a fuel consumption value of 0.302 L/km was used (Kodjak, 2004). For routes traversing waterways serviced by BC Ferries, it was assumed that the representative fuel consumption of the ferries is equivalent to that of the trucks. From the Collectors, the used oil, oil filters, and oil containers are transported to various Processors as is the case for used oil, pulp mills and asphalt plants as well. Table 3.2 presents the percentages and amounts of materials traveling to each Processor and end use facility specific to each Zone, based on data provided by BCUOMA and Processors and assuming that all materials collected under the program end up at one of the facilities indicated. M&R Environmental provided 2009 collection data for used oil, filters, and containers, and Merlin Plastics Supply provided 2009 collection data for containers. The raw data is presented in Appendix C. M&R Environmental is a Processor of filters and containers, and thus the collection data for these two materials was utilized. However, M&R Environmental is not the final destination (end user) for used oil, and only the re-refineries, pulp mills, and asphalt plants (end users) for used oil are listed in Table 3.2. Thus, M&R Environmental's used oil collection data was not utilized, as doing so would require the addition of another set of percentages for amounts of materials traveling to each Collector (prior to an end use facility), which would provide little extra accuracy and a significant amount of additional data collection. Merlin Plastics provided data for four months only, thus an average was taken to gain data for the entire 2009 year. Where no indication was provided as to the relative quantities of materials accepted by facilities, it was assumed that all facilities of the same type accept equal amounts of materials. The specific Processors handling each material were provided by BCUOMA. The pulp mills, asphalt plants, steel mills, and plastics manufacturers were chosen based on indications provided by BCUOMA as well as reasonable assumptions based on facility size and proximity to the province. At least two facilities of each type were chosen to achieve representative values for transportation distances and process emissions.

071620 (2) 14 CONESTOGA-ROVERS & ASSOCIATES
It should be noted that significant data gaps exist in the amounts (percentages) of materials going to each facility. Only collection data from M&R Environmental, Merlin Plastics, and Safety-Kleen were received, with the remaining percentages having been calculated/assumed, applying the assumptions stated above. With more complete data from other Processors, better estimates of where the materials were actually transported during the year could be calculated. Used Oil It was assumed that all used oil going from Collector to Processor was transported in large tank trucks with 8,000 gallon capacities (Seneca Tank, 2010). For large tank trucks, a fuel consumption value of 0.395 L/km was used (NRCan, 2009). The only exception to this concerns the railway transportation for used oil that occurs from Safety-Kleen's facility in Delta, BC to their re-refinery in Breslau, ON. The transportation distances from Collectors to the Delta facility were separated from the distance of rail transport from the Delta facility to the Breslau re-refinery, in order to account for the difference in fuel consumption between trucks and rail locomotives. For rail transport, a fuel consumption value of 0.828 L/km was calculated, based on a value of 525 gallons/24 hours (Vantuono, 2002, p. 4) and an average speed of 100 km/hour (Via Rail, 2010). Due to the variable and large capacity that freight rail can offer, it was assumed that all the used oil that went to the Breslau facility in 2009 was accommodated in one trip, making the total capacity of the train on this trip equal to 2,450,030 L. With tank cars having an average capacity of over 113,563 L (30,000 gallons) (UTLX, 2008), this is equivalent to a train with 22 cars. Oil Filters It was assumed that all oil filters traveling from Collector to Processor and subsequent end users were transported in 42 US-gallon oil barrels (barrel height assumed to be twice its diameter) in large trailer trucks with 107 m3 (3,800 ft3) capacities (ShipNorthAmerica Transportation, 2007). For oil filters traveling to Processors, the number of filters that can fit into this volume was based on a weight of unprocessed filter per barrel ratio calculated by M&R Environmental based on their 2009 collection data. With the ratio between weight and number of filters from the BCUOMA 2009 collection data known (Table 2.1), the truck's capacity for filters in this arrangement was calculated. Filters are crushed/stripped at the Processors, thus allowing increased capacity for filters traveling to the metal brokers and steel mills. A percentage reduction in volume of 20 percent was assumed to accommodate this fact.

071620 (2) 15 CONESTOGA-ROVERS & ASSOCIATES
Approximately 8 percent of the filters collected and recycled are paper. Of the four oil filter Processors, however, only M&R Environmental sorts out the paper filters from the steel ones. They send the paper filters to the Greater Vancouver Regional District's (GVRDs) waste-to-energy facility in Burnaby for incineration. Thus, approximately 4.6 percent of all filters are incinerated. The other three Processors simply send the paper filters along with the steel ones to metal brokers and subsequently, steel mills. The total number of filters recycled at a steel mill (for consideration in Project and Baseline Elements) does not include the paper filters sent to the steel mills. Oil Containers It was assumed that all oil containers traveling from Collector to Processor and subsequent facility were transported in large trailer trucks with 107 m3 (3,800 ft3) capacities (ShipNorthAmerica Transportation, 2007). For oil containers, the container mass that can be fit into a truck's volume capacity was estimated by assuming the amounts and densities of air and HDPE occupying the space. The 1-5 L containers are not compacted, and thus contain a significant portion of air (70 percent assumed). The 20 L containers are stacked, reducing the amount of air space (5 percent assumed). It was assumed that a truck's volume is equally split between 20 L and 1-5 L containers. Containers are pelletized at the Processor, thus the trucks traveling to the plastics manufacturers will be able to hold more HDPE (98 percent volume assumed). Additionally, the residual oil present in the intact containers is removed at the Processors. Assuming that 10 percent of the weight of the intact containers consists of residual oil, then 90 percent of the total weight of containers recycled travels to plastics manufacturers. For large trailer trucks, a fuel consumption value of 0.395 L/km was used (NRCan, 2009). 3.2.3 DETERMINATION OF TOTAL DISTANCES
With the distances from each Collector to Processor, the total distances traveled by materials from each Subdivision were calculated. It was assumed that the materials collected by each Collector would travel to all applicable Processors, pulp mills, or asphalt plants based on the percentages indicated in Table 3.2. Similarly, it was assumed that the materials at each Processor would travel to all additional applicable facilities based on the percentages indicated in Table 3.2. This permits the calculation of a total weighted distance traveled for each transportation element of each material for

071620 (2) 16 CONESTOGA-ROVERS & ASSOCIATES
each census Subdivision (see Table 3.3 for more information). This is equal to the sum of the weighted distances for all applicable routes, as shown in Equation 3 below:
Equation 3: Total Weighted Distance
...332211 +⋅+⋅+⋅= DfDfDfDwt
Where, DWT = total weighted distance of the transport element (km)
f1 (f2,,…) = fraction of material in subdivision traveling route D1 (D2 ,…) = total distance of route (km)
3.3 TRANSPORTATION GHG EMISSIONS
The total volume of diesel fuel consumed for each transportation element of each material and each Subdivision for the 2009 year is given by Equation 4 below:
Equation 4: Transportation Diesel Consumption
FUELWTVEHICLE
SUBFUEL CD
AA
V ⋅⋅⎟⎟⎠
⎞⎜⎜⎝
⎛=
Where, VFUEL = total volume of diesel fuel consumed (L)
ASUB = amount of material collected from the Subdivision (L, #, kg)
AVEHICLE = capacity of the vehicle (L, #, kg) DWT = total weighted distance of transport element (km) CFUEL = fuel consumption of the vehicle (L / km)
This calculation is repeated for each Baseline and Project transportation element for each Subdivision. The total GHG emissions released through an individual Baseline or Project transportation element is then calculated by multiplying the amount of diesel consumed for that Element by the emission factor (EF) for diesel combustion for that certain transportation vehicle. 3.4 BASELINE EMISSIONS (EXCLUDING TRANSPORTATION)
In addition to transportation, emissions are generated during facility processes, material extraction, and disposal. Under the Baseline scenario, GHG emissions will be generated during the extraction and processing of raw materials required to produce all virgin oil,

071620 (2) 17 CONESTOGA-ROVERS & ASSOCIATES
filter, and container products that must replace those recycled under the Project scenario. Additionally, emissions will arise out of the end use or final disposal of the products, as they are not recycled. 3.4.1 OIL PRODUCTS EMISSIONS
Production of virgin oil requires the extraction of crude oil (BE1), transportation of the crude oil to refineries (BE2), and the refining of crude oil into lubricating oil products (BE3). Using appropriate emission factors for these three elements, the total GHG emissions associated with the production of virgin oil products were calculated. To correlate the volume of crude oil required to yield the volume of oil product, which is equal to the total amount recycled under the Project scenario, a specific lubricating oil to crude oil ratio was used. Lubricating oil has a heating value of approximately 8 million BTUs/barrel (Harvey, 1977), while crude oil has a heating value of approximately 5.6 million BTUs/barrel (US DOE, 2008). Lubricating oil's higher heating value reflects the additives and processing that are input during its manufacture. Dividing it by the heating value of crude oil gives a ratio higher than 1, which suitably reflects the need for a higher input, and thus this ratio was used to calculate the volume of crude oil required to match the amount of oil recycled to calculate the GHG emissions. In the Baseline scenario, the end use of the used oil consists of combustion at the Generators for heat energy (BE4), and an appropriate emission factor was used to calculate the GHG emissions associated with this Element. 3.4.2 OIL FILTER EMISSIONS
Under the Baseline scenario, virgin steel is produced by extracting raw materials, transporting the raw materials, and manufacturing steel from the raw materials (Metal Oil Filters BE1 and BE2) in order to compensate for the steel filters deposited in landfill in the absence of a recycling program. Based on the data provided by BCUOMA, approximately 92 percent of the recycled oil filters are steel, which yields the mass of virgin steel required. The filters collected contain residual oil, which was assumed to amount to 25 percent. Thus, the mass of virgin steel is equal to 75 percent of the total mass of the steel containers. Appropriate emission factors were used to calculate GHG emissions associated with this Element. Final disposal of the filters occurs at municipal landfills. As steel has been considered an inert material, only the paper filters degrade in the landfill to produce GHG emissions.

071620 (2) 18 CONESTOGA-ROVERS & ASSOCIATES
A landfill gas generation model was performed to determine these emissions, and the results of the model are presented in the final results table (Table 4.1). The mass of the plastic filters have not been discounted by 20 percent as the total mass of plastic filters is only an estimate. 3.4.3 OIL CONTAINER EMISSIONS
Under the Baseline scenario, virgin HDPE must be manufactured (BE1) and transported to plastics manufacturers (BE2) in order to compensate for the HDPE containers deposited in landfill in the absence of a recycling program. The containers collected contain residual oil, which was assumed to amount to 10 percent. Thus, the mass of virgin HDPE is equal to 90 percent of the total mass of oil containers collected. Appropriate emission factors were used to calculate GHG emissions associated with this Element. Final disposal occurs at municipal landfills, and with the assumption made that plastic are an inert material, no emissions are associated with disposal of HDPE containers in landfill. 3.5 PROJECT EMISSIONS (EXCLUDING TRANSPORTATION)
The GHG emissions from each of the non-transportation Project Elements consist of the following: • Used oil: re-refining of used oil by Processors and the combustion of used oil at pulp
mills and asphalt plants (Re-refine and Reuse PE3 and Use as a Fuel PE3)
• Oil filters: processing of paper and steel oil filters by Processors and incineration of paper filters (Metal Filters PE3 and Paper Filters PE3)
• Oil containers: processing of oil containers by Processors (PE3)
Facility data was collected from M&R Environmental for oil filters and oil containers, and from Safety-Kleen for used oil, which was utilized to calculate the emissions associated with the processing of each material. Emission factors for combustion of the used oil at the pulp mills and asphalt plants, and of the paper filters at the Burnaby waste-to-energy facility were chosen from database resources. See Section 2.2 for more information regarding the emission factors selected.

071620 (2) 19 CONESTOGA-ROVERS & ASSOCIATES
4.0 RESULTS OF THE STUDY
Based on the input data and the data analysis resources and methods used during this Study, the following presents the results of the 2009 GHG Savings Study. For the 2009 year, BCUOMA's programs resulted in the following GHG savings (also presented in Table 4.1): Recycled Oil • 2.47 kg CO2 equivalent per liter of used oil that is collected and re-refined or used as
a fuel
• 109,931,357 kg CO2 equivalent total GHG savings for 2009
Recycled Oil Filters • 1.09 kg CO2 equivalent per filter that is collected and recycled in a steel mill
• 5,395,372 kg CO2 equivalent total GHG savings for 2009
Recycled Oil Containers • 2.11 kg CO2 equivalent per kg of oil container that is collected and processed for sale
as HDPE pellets
• 2,198,298 kg CO2 equivalent total GHG savings for 2009
The total GHG savings realized for BCUOMA's program for the year 2009 is estimated to be 117,525,027 kg CO2 equivalent, which equates to the following: • Powering approximately 549,776 B.C. households for one year
• Removing approximately 33,761 cars from the road
Additionally, it should be noted that oil re-refining results in additional GHG savings of 339 percent when compared to the GHG savings associated with the use of oil in the pulp mills and asphalt plants. Table 4.1 provides a breakdown of the GHG emissions associated with each Element within the Study. Note that the results are subject to the assumptions and limitations made throughout this study.

071620 (2) 20 CONESTOGA-ROVERS & ASSOCIATES
5.0 REFERENCES
Canadian Association of Petroleum Producers. 2005. A National Inventory of Greenhouse Gas (GHG), Criteria Air Contaminant (CAC) and Hydrogen Sulphide (H2S) Emissions by the Upstream Oil and Gas Industry, Volume 1, Overview of the GHG Emissions Inventory.
Retrieved from <http://www.capp.ca/library/publications/climateChange/Pages/default.aspx> (accessed July 10, 2010).
Conestoga-Rovers & Associates (March 2009). Landfill Gas Generation Assessment Procedure Guidance Report. Prepared for the British Columbia Ministry of Environment.
Dynalab Corporation (2010). High Density Polyethylene Properties Technical Information.
Retrieved from <http://www.dynalabcorp.com/technical_info_hd_polyethylene.asp> (accessed June 21, 2010).
ENVIRON International Corporation (2009). Safety-Kleen Product Carbon Footprint for Re-refined Base Oil. Prepared for Safety-Kleen Systems Inc., October 2009.
Environment Canada (2010). National Inventory Report, Greenhouse Gas Sources and Sinks in Canada, 1990-2008.
Google (2010). Google Maps web application and Google Earth desktop software.
Retrieved from <http://maps.google.ca/maps?hl=en&tab=wl> (accessed June 1 – 11, 2010).
Harvey, D. G. (1977). Testimony, Hearing Before the Subcommittee on Advanced Energy Technologies and Energy Conservation Research, Development, and Demonstration of the Committee on Science and Technology, U.S. House of Representatives, 95th Congress, First Session, December 12, 1977. U.S. Government Printing Office, Washington, 1978. Original from the University of Michigan.
Honeywell International Inc. (Honeywell) (2010). FRAM Auto Filters Catalog – Oil Filters.
Retrieved from <http://www.framcatalog.com/Application.aspx?b=F> (accessed June 21, 2010).
Intergovernmental Panel on Climate Change (IPCC) (2007). IPCC Fourth Assessment Report (AR4): Climate Change 2007. Retrieved from <http://www.ipcc.ch/> (accessed August 11, 2010).
071620 (2) 21 CONESTOGA-ROVERS & ASSOCIATES
Kodjak, D. (2004). "Policy Discussion – Heavy-duty Truck Fuel Economy," in 10th Diesel Engine Emissions Reduction Conference (August 29 – September 2, 2004).
Retrieved from <http://www1.eere.energy.gov/vehiclesandfuels/pdfs/deer_2004/session6/2004_deer_kodjak.pdf> (accessed June 21, 2010).
Mid-Iowa Solid Waste Equipment Co. (Mid-Iowa) (2008). Used Equipment List – Garbage Trucks.
Retrieved from <http://www.mid-iowa.com/cgi-bin/iowa/vlm.cgi?view=show.cgi&show=on&category=garbage%20trucks> (accessed June 23, 2010).
Natural Resources Canada (NRCan) (2009). Fuel Efficiency Benchmarking in Canada's Trucking Industry.
Retrieved from <http://oee.nrcan.gc.ca/transportation/business/documents/case-studies/fuel-effic-benchm.cfm?attr=16> (accessed June 21, 2010).
Seneca Tank (2010). Tank Truck Info product page.
Retrieved from <http://www.senecatank.com/Newtw/tankwagon2.htm> (accessed June 21, 2010).
ShipNorthAmerica Transportation Inc. (2007). Equipment – Truck, Truck Trailer & Van Specifications.
Retrieved from <http://www.shipnorthamerica.com/htmfiles/equipment.htm> (accessed June 21, 2010).
Siuru, B. (2003). "New study makes strong case for natural gas garbage trucks – alternative fuels," in Diesel Progress North American Edition (November 2003).
Retrieved from <http://findarticles.com/p/articles/mi_m0FZX/is_11_69/ai_111463795/> (accessed June 21, 2010).
Statistics Canada (2006). 2006 Census of Canada. Prepared by BC Stats, Ministry of Labour and Citizens' Services, Victoria, British Columbia.
Statistics Canada (2007). Electric Power Generation, Transmission, and Distribution, 2003-2007 (catalogue no. 57-202-X).
Retrieved from <http://www.statcan.gc.ca/bsolc/olc-cel/olc-cel?catno=57-202-X&lang=eng> (accessed August 9, 2010).
Swiss Centre for Life Cycle Inventories. Ecoinvent Centre. Emission Factor Database. Available at <http://www.ecoinvent.org/database/> (Subscription required).

071620 (2) 22 CONESTOGA-ROVERS & ASSOCIATES
The Engineering Toolbox (2010). Density and Specific Weight of Air.
Retrieved from <http://www.engineeringtoolbox.com/air-desity-specific-weight-d_600.html> (accessed June 21, 2010).
The Pembina Institute (1998-2007). Life-Cycle Value Assessment Database. Retrieved from <http://www.lcva.ca/index2.htm?LCVA_token=22@@0bb2b6df08ea50d05203b0beb4a871f7> (access required).
Union Tank Car Company (UTLX) (2008). UTLX Tank Car Designs and Descriptions. Retrieved from <http://www.utlx.com/bdd_tank.html> (accessed June 21, 2010).
U.S. Department of Energy (US DOE) (2008). "Lower and Higher Heating Values of Fuels (excel file)." Hydrogen Properties. Hydrogen Analysis Resource Center.
Retrieved from <http://hydrogen.pnl.gov/cocoon/morf/hydrogen/article/401> (accessed June 23, 2010).
U.S. Environmental Protection Agency. 1998. AP 42, Fifth Edition, Volume 1, Chapter 1: External Combustion Sources. 1.4 Natural Gas Combustion.
Retrieved from <http://www.epa.gov/ttn/chief/ap42/ch01/index.html> (accessed July 10, 2010).
Vantuono, W. (2002). "Sipping, not slurping: how much fuel efficiency can be squeezed out of a locomotive? Railroads and suppliers have devised innovative ways to reach what has been an elusive goal," in Railway Age (September 2002).
Retrieved from <http://findarticles.com/p/articles/mi_m1215/is_9_203/ai_92284635/pg_4/?tag=content;col1> (accessed June 21, 2010).
Via Rail (2010). Locomotives – P42DC.
Retrieved from <http://www.viarail.ca/en/about-via-rail/our-fleet/locomotives-p42dc> (accessed June 21, 2010).

071620 (2)
ATTACHMENT 1
MICROSOFT EXCEL WORKBOOK MODEL (PROVIDED ON A COMPACT DISC)
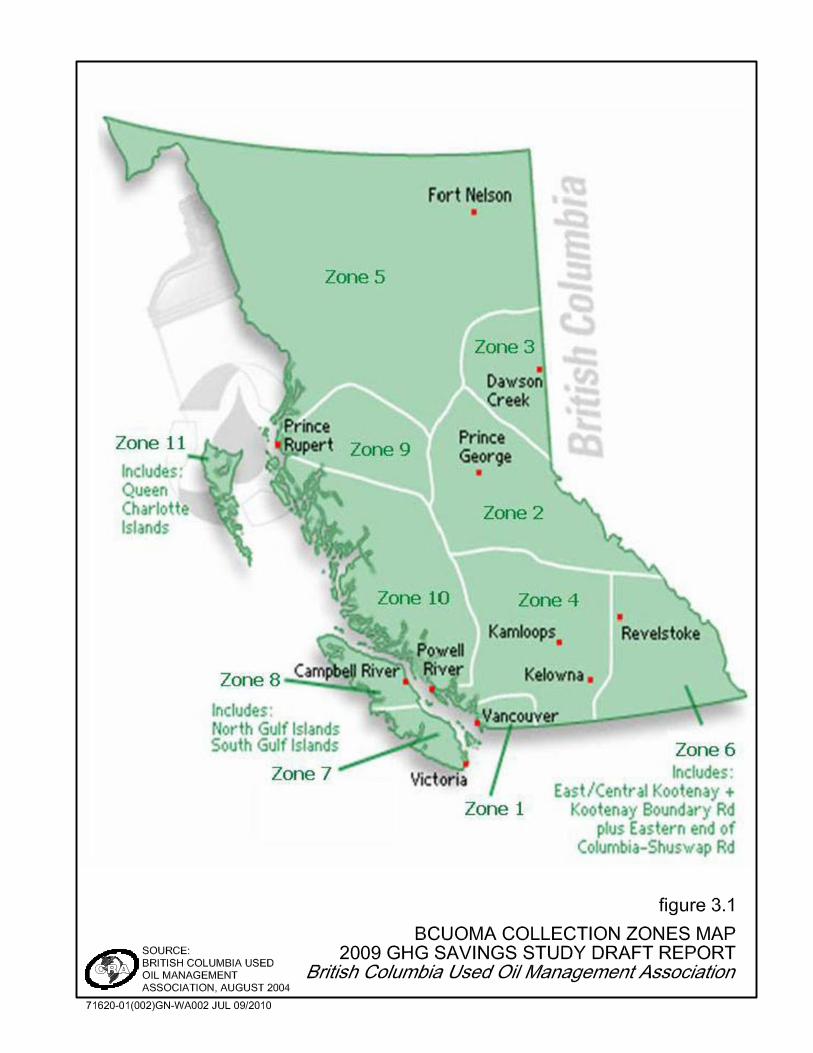

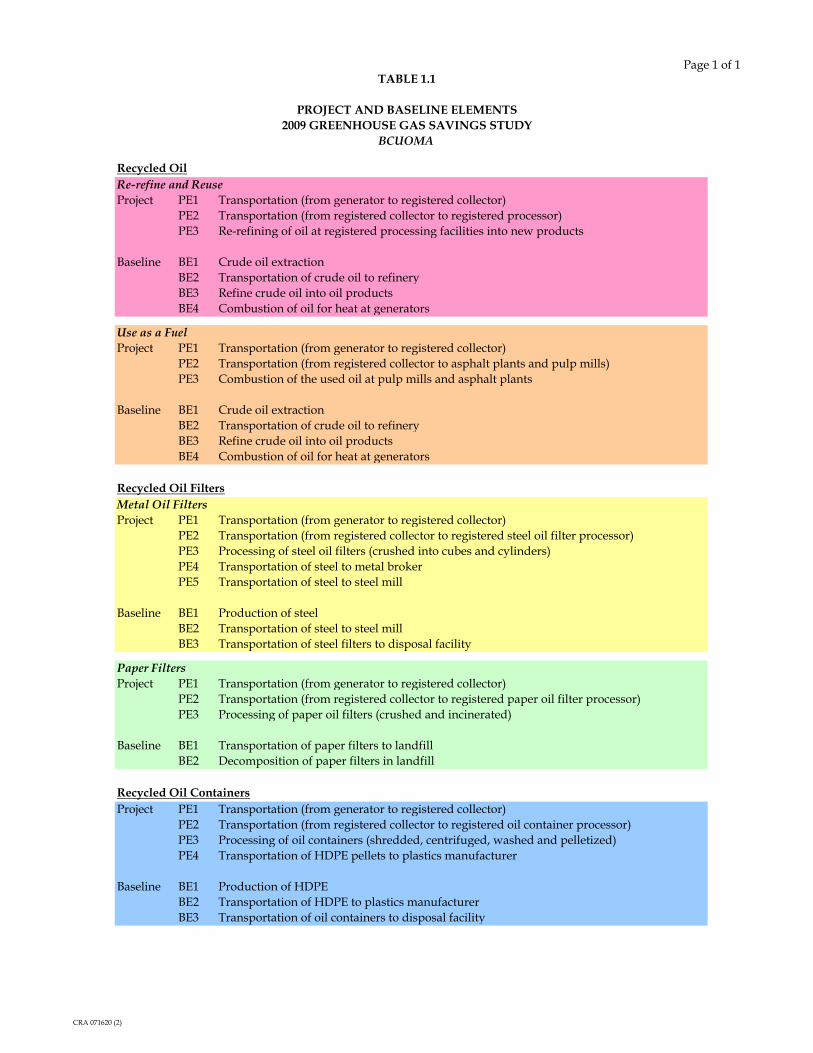
TABLE 1.1
PROJECT AND BASELINE ELEMENTS2009 GREENHOUSE GAS SAVINGS STUDY
BCUOMA
Page 1 of 1
Recycled OilRe-refine and ReuseProject PE1 Transportation (from generator to registered collector)
PE2 Transportation (from registered collector to registered processor)PE3 Re-refining of oil at registered processing facilities into new products
Baseline BE1 Crude oil extractionBE2 Transportation of crude oil to refineryBE3 Refine crude oil into oil productsBE4 Combustion of oil for heat at generators
Use as a FuelProject PE1 Transportation (from generator to registered collector)
PE2 Transportation (from registered collector to asphalt plants and pulp mills)PE3 Combustion of the used oil at pulp mills and asphalt plants
Baseline BE1 Crude oil extractionBE2 Transportation of crude oil to refineryBE3 Refine crude oil into oil productsBE4 Combustion of oil for heat at generators
Recycled Oil FiltersMetal Oil FiltersProject PE1 Transportation (from generator to registered collector)
PE2 Transportation (from registered collector to registered steel oil filter processor)PE3 Processing of steel oil filters (crushed into cubes and cylinders)PE4 Transportation of steel to metal brokerPE5 Transportation of steel to steel mill
Baseline BE1 Production of steelBE2 Transportation of steel to steel millBE3 Transportation of steel filters to disposal facility
Paper FiltersProject PE1 Transportation (from generator to registered collector)
PE2 Transportation (from registered collector to registered paper oil filter processor)PE3 Processing of paper oil filters (crushed and incinerated)
Baseline BE1 Transportation of paper filters to landfillBE2 Decomposition of paper filters in landfill
Recycled Oil ContainersProject PE1 Transportation (from generator to registered collector)
PE2 Transportation (from registered collector to registered oil container processor)PE3 Processing of oil containers (shredded, centrifuged, washed and pelletized)PE4 Transportation of HDPE pellets to plastics manufacturer
Baseline BE1 Production of HDPEBE2 Transportation of HDPE to plastics manufacturerBE3 Transportation of oil containers to disposal facility
CRA 071620 (2)

TABLE 2.1
MATERIAL QUANTITIES COLLECTED IN 20092009 GREENHOUSE GAS SAVINGS STUDY
BCUOMA
Page 1 of 1
Total 1 2 3 4 5 6 7 8 9 10 11(1) Zone
SoldOil L 83,600,000.00 -- -- -- -- -- -- -- -- -- -- --Filters kg 4,301,823.65 -- -- -- -- -- -- -- -- -- -- --
# 5,740,000.00 -- -- -- -- -- -- -- -- -- -- --Containers kg 1,773,000.00 -- -- -- -- -- -- -- -- -- -- --
ConsumedOil L 25,163,600.00 -- -- -- -- -- -- -- -- -- -- --
% 30.10% -- -- -- -- -- -- -- -- -- -- --
CollectedOil L 44,546,000.00 21,033,225.00 2,244,182.00 2,880,386.00 7,031,434.00 1,220,699.00 2,195,175.00 4,356,375.00 2,211,954.00 1,002,184.00 369,796.00 590.00
% (2) 76.23% 35.99% 3.84% 4.93% 12.03% 2.09% 3.76% 7.45% 3.79% 1.71% 0.63% 0.00%Filters kg 3,889,628.00 1,980,597.00 198,817.00 125,307.00 662,582.00 46,697.00 222,772.00 352,488.00 186,803.00 87,460.00 23,275.00 2,830.00
# 5,190,000.00 2,642,745.89 265,285.07 167,199.36 884,094.98 62,308.64 297,248.65 470,331.02 249,254.57 116,699.44 31,056.25 3,776.12% (2) 90.42% 46.04% 4.62% 2.91% 15.40% 1.09% 5.18% 8.19% 4.34% 2.03% 0.54% 0.07%
- (paper portion) % 8.00% 8.00% 8.00% 8.00% 8.00% 8.00% 8.00% 8.00% 8.00% 8.00% 8.00% 8.00% - (oil weight) % 25.00% 25.00% 25.00% 25.00% 25.00% 25.00% 25.00% 25.00% 25.00% 25.00% 25.00% 25.00%Containers kg 1,433,413.00 716,843.00 92,243.00 60,663.00 252,372.00 10,771.00 71,702.00 118,977.00 71,526.00 28,179.00 6,727.00 3,410.00
% (2) 80.85% 40.43% 5.20% 3.42% 14.23% 0.61% 4.04% 6.71% 4.03% 1.59% 0.38% 0.19% - 20L pails kg 440,000.00 220,041.90 28,314.88 18,621.10 77,468.03 3,306.26 22,009.62 36,521.14 21,955.60 8,649.82 2,064.92 1,046.73
% 30.70% 30.70% 30.70% 30.70% 30.70% 30.70% 30.70% 30.70% 30.70% 30.70% 30.70% 30.70% - 1-5L containers kg 715,257.36 357,696.79 46,028.24 30,270.17 125,930.86 5,374.61 35,778.51 59,368.22 35,690.69 14,061.01 3,356.70 1,701.55
% 49.90% 49.90% 49.90% 49.90% 49.90% 49.90% 49.90% 49.90% 49.90% 49.90% 49.90% 49.90% - Ineligible kg 278,155.64 139,104.31 17,899.87 11,771.73 48,973.11 2,090.13 13,913.87 23,087.64 13,879.71 5,468.17 1,305.38 661.71
% 19.41% 19.41% 19.41% 19.41% 19.41% 19.41% 19.41% 19.41% 19.41% 19.41% 19.41% 19.41% - Antifreeze (3) kg 0.00 0.00 0.00 0.00 0.00 0.00 0.00 0.00 0.00 0.00 0.00 0.00
% 0.00% 0.00 0.00 0.00 0.00 0.00 0.00 0.00 0.00 0.00 0.00 0.00 - (oil weight) % 10.00% 10.00% 10.00% 10.00% 10.00% 10.00% 10.00% 10.00% 10.00% 10.00% 10.00% 10.00%
UnrecoveredOil L 13,890,400.00 -- -- -- -- -- -- -- -- -- -- --
% 16.62% -- -- -- -- -- -- -- -- -- -- --Filters kg 412,195.65 -- -- -- -- -- -- -- -- -- -- --
# 550,000.00 -- -- -- -- -- -- -- -- -- -- --% 9.58% -- -- -- -- -- -- -- -- -- -- --
Containers kg 339,587.00 -- -- -- -- -- -- -- -- -- -- --% 19.15% -- -- -- -- -- -- -- -- -- -- --
Notes: (1) To update data for subsequent years, insert amounts sold, percent consumed (oil), and amounts collected (all values highlighted in blue).(2) Percentage of total amount of material sold(3) Antifreeze will become eligible in the 2011 calendar year. The mass of residual antifreeze in collected containers can be assumed negligible.
Source: British Columbia Used Oil Management Association, 2010
CRA 071620 (2)

TABLE 2.2
EMISSION FACTORS (GLOBAL WARMING POTENTIAL)2009 GREENHOUSE GAS SAVINGS STUDY
BCUOMA
Page 1 of 1
ValueGWP 100a IPCC 2007 Climate Change kg CO 2 e / UNIT
Recycled OilRe-refine and ReuseProject PE1 Transportation (from generator to registered collector) 2.69 kg CO2e/L diesel
PE2 Transportation (from registered collector to registered processor)- transport by truck 2.69 kg CO2e/L diesel- transport by rail 2.99 kg CO2e/L diesel
PE3 Re-refining of oil at registered processing facilities into new products 0.37 kg CO2e/L oil producedBaseline BE1 Crude oil extraction 51.91 kg CO2e/1 bbl crude oil
BE2 Transportation of crude oil to refinery 9.03 kg CO2e/(1x106 lkm)BE3 Refine crude oil into oil products 0.43 kg CO2e/kg crude oilBE4 Combustion of oil for heat at generators 3.15 kg CO2e/L heavy oil
Use as a FuelProject PE1 Transportation (from generator to registered collector) 2.69 kg CO2e/L diesel
PE2 Transportation (from registered collector to asphalt plants and pulp mills) 2.69 kg CO2e/L dieselPE3 Combustion of the used oil at pulp mills and asphalt plants 3.15 kg CO2e/L heavy oil
Baseline BE1 Crude oil extraction 51.91 kg CO2e/1 bbl crude oilBE2 Transportation of crude oil to refinery 9.03 kg CO2e/(1x106 lkm)BE3 Refine crude oil into oil products 0.43 kg CO2e/kg crude oilBE4 Combustion of oil for heat at generators 3.15 kg CO2e/L heavy oil
Recycled Oil FiltersMetal Oil FiltersProject PE1 Transportation (from generator to registered collector) 2.69 kg CO2e/L diesel
PE2 Transportation (from registered collector to registered steel oil filter processor) 2.69 kg CO2e/L dieselPE3 Processing of steel oil filters (crushed into cubes and cylinders)
Electricity Production 0.02 kg CO2e/ kWhNatural Gas - Production, Processing, and Distributing 11.20 kg CO2e/GJ natural gasNatural Gas - Combustion for Heat 62.98 kg CO2e/GJ natural gasPropane - Production of Liquid Propane Gas 0.39 kg CO2e/LPropane - Combustion for Fuel (forklift) 1.53 kg CO2e/L
PE4 Transportation of steel to metal broker 2.69 kg CO2e/L dieselPE5 Transportation of steel to steel mill 2.69 kg CO2e/L diesel
Baseline BE1 Production of steel 2,095.61 kg CO2e/1000 kg steelBE2 Transportation of steel to steel mill included in BE1 aboveBE3 Transportation of steel filters to disposal facility 2.69 kg CO2e/L diesel
Paper FiltersProject PE1 Transportation (from generator to registered collector) 2.69 kg CO2e/L diesel
PE2 Transportation (from registered collector to registered paper oil filter processor) 2.69 kg CO2e/L dieselPE3 Processing of paper oil filters (crushed and incinerated)
Electricity Production 0.02 kg CO2e/ kWhNatural Gas - Production, Processing, and Distributing 11.20 kg CO2e/GJ natural gasNatural Gas - Combustion for Heat 62.98 kg CO2e/GJ natural gasPropane - Production of Liquid Propane Gas 0.39 kg CO2e/LPropane - Combustion for Fuel (forklift) 1.53 kg CO2e/LIncinerating paper filters 2.40E-02 kg CO2e/kg
Baseline BE1 Transportation of paper filters to landfill 2.69 kg CO2e/L dieselBE2 Decomposition of paper filters in landfill * Modelling completed by CRA and
not included in this file.
Recycled Oil ContainersProject PE1 Transportation (from generator to registered collector) 2.69 kg CO2e/L diesel
PE2 Transportation (from registered collector to registered oil container processor) 2.69 kg CO2e/L dieselPE3 Processing of oil containers (shredded, centrifuged, washed and pelletized)
Electricity Production 0.02 kg CO2e/ kWhNatural Gas - Production, Processing, and Distributing 11.20 kg CO2e/GJ natural gasNatural Gas - Combustion for Heat 62.98 kg CO2e/GJ natural gasPropane - Production of Liquid Propane Gas 0.39 kg CO2e/LPropane - Combustion for Fuel (forklift) 1.53 kg CO2e/L
PE4 Transportation of HDPE pellets to plastics manufacturer 2.69 kg CO2e/L dieselBaseline BE1 Production of HDPE 2,153.96 kg CO2e/1000 kg HDPE
BE2 Transportation of HDPE to plastics manufacturer included in BE1 aboveBE3 Transportation of oil containers to disposal facility 2.69 kg CO2e/L diesel
CRA 071620 (2)

TABLE 3.1
USED OIL, FILTER, AND CONTAINER COLLECTION AND RECYCLING BY CENSUS SUBDIVISION2009 GREENHOUSE GAS SAVINGS STUDY
BCUOMA
Page 1 of 7
200920012006
2001 Pop Annual EstimatedBCUOMA Regional 2006 2006 Area Using 2006 Growth 2009 Oil Filters Containers Oil Filters Containers
Zone District (1) Name Population (2) km 2 Boundary (3) Rate Population L # kg L # kg
- - British Columbia 4,113,487 924,815.43 3,907,738 0.01032 4,242,100 44,546,000.00 5,190,000.00 1,433,413.00 44,546,000.00 5,190,000.00 1,155,257.361 9 Abbotsford 123,864 359.36 115,494 0.01409 129,174 1,108,350.75 139,260.12 37,774.21 1,108,350.75 139,260.12 30,444.081 9 Chilliwack 69,217 260.19 62,567 0.02041 73,542 631,006.67 79,283.62 21,505.63 631,006.67 79,283.62 17,332.431 9 Harrison Hot Springs 1,573 5.47 1,343 0.03212 1,729 14,839.56 1,864.54 505.75 14,839.56 1,864.54 407.611 9 Hope 6,185 41.42 6,184 0.00003 6,186 53,074.09 6,668.56 1,808.84 53,074.09 6,668.56 1,457.831 9 Kent 4,738 166.51 4,926 -0.00775 4,629 39,715.15 4,990.06 1,353.55 39,715.15 4,990.06 1,090.891 9 Mission 34,505 225.78 31,272 0.01987 36,603 314,064.30 39,461.00 10,703.77 314,064.30 39,461.00 8,626.691 9 Fraser Valley B 796 3,089.46 745 0.01333 828 7,106.70 892.93 242.21 7,106.70 892.93 195.211 9 Fraser Valley C 952 3,669.93 716 0.05863 1,129 9,691.08 1,217.65 330.29 9,691.08 1,217.65 266.191 9 Fraser Valley D 1,296 222.05 1,032 0.04661 1,486 12,748.55 1,601.81 434.49 12,748.55 1,601.81 350.181 9 Fraser Valley E 3,481 750.52 3,400 0.00472 3,531 30,292.83 3,806.18 1,032.42 30,292.83 3,806.18 832.081 9 Fraser Valley F 1,339 2,029.70 1,237 0.01597 1,404 12,048.36 1,513.83 410.63 12,048.36 1,513.83 330.941 9 Fraser Valley G 1,914 74.97 1,827 0.00935 1,968 16,887.47 2,121.85 575.55 16,887.47 2,121.85 463.861 9 Fraser Valley H 394 36.86 356 0.02049 419 3,592.73 451.41 122.45 3,592.73 451.41 98.681 15 Anmore 1,785 27.42 1,344 0.05840 2,116 18,158.60 2,281.56 618.87 18,158.60 2,281.56 498.781 15 Belcarra 676 5.46 682 -0.00177 672 5,769.59 724.93 196.64 5,769.59 724.93 158.481 15 Burnaby 202,799 89.12 193,954 0.00896 208,298 1,787,256.00 224,562.02 60,912.29 1,787,256.00 224,562.02 49,092.181 15 Coquitlam 114,565 121.69 112,890 0.00295 115,582 991,723.41 124,606.33 33,799.38 991,723.41 124,606.33 27,240.571 15 Delta 96,723 183.7 96,950 -0.00047 96,587 828,742.55 104,128.40 28,244.76 828,742.55 104,128.40 22,763.821 15 Langley (1) 93,726 306.93 86,896 0.01525 98,079 841,544.28 105,736.89 28,681.06 841,544.28 105,736.89 23,115.461 15 Langley (2) 23,606 10.22 23,643 -0.00031 23,584 202,355.50 25,425.21 6,896.57 202,355.50 25,425.21 5,558.281 15 Lions Bay 1,328 2.55 1,379 -0.00751 1,298 11,139.84 1,399.68 379.66 11,139.84 1,399.68 305.991 15 Maple Ridge 68,949 265.79 63,169 0.01766 72,668 623,509.49 78,341.63 21,250.11 623,509.49 78,341.63 17,126.501 15 New Westminster 58,549 15.41 54,656 0.01386 61,017 523,539.17 65,780.73 17,842.98 523,539.17 65,780.73 14,380.531 15 North Vancouver 82,562 160.67 82,310 0.00061 82,714 709,704.37 89,171.69 24,187.76 709,704.37 89,171.69 19,494.091 15 North Vancouver 45,165 11.85 44,092 0.00482 45,821 393,158.85 49,398.94 13,399.43 393,158.85 49,398.94 10,799.251 15 Pitt Meadows 15,623 85.38 14,670 0.01267 16,224 139,208.49 17,491.03 4,744.43 139,208.49 17,491.03 3,823.771 15 Port Coquitlam 52,687 28.85 51,257 0.00552 53,564 459,594.01 57,746.26 15,663.63 459,594.01 57,746.26 12,624.091 15 Port Moody 27,512 25.62 23,816 0.02927 30,000 257,403.76 32,341.82 8,772.70 257,403.76 32,341.82 7,070.341 15 Richmond 174,461 128.76 164,345 0.01202 180,827 1,551,544.33 194,945.73 52,878.89 1,551,544.33 194,945.73 42,617.681 15 Surrey 394,976 317.19 347,820 0.02575 426,285 3,657,641.32 459,568.92 124,657.75 3,657,641.32 459,568.92 100,467.761 15 Vancouver 578,041 114.71 545,671 0.01159 598,378 5,134,238.27 645,097.80 174,982.33 5,134,238.27 645,097.80 141,026.791 15 West Vancouver 42,131 87.13 41,421 0.00340 42,563 365,200.36 45,886.06 12,446.56 365,200.36 45,886.06 10,031.291 15 White Rock 18,755 5.16 18,250 0.00547 19,065 163,580.04 20,553.22 5,575.05 163,580.04 20,553.22 4,493.201 15 Greater Vancouver A 11,050 818.62 8,034 0.06583 13,379 114,794.55 14,423.50 3,912.37 114,794.55 14,423.50 3,153.172 51 Vanderhoof 4,064 54.85 4,390 -0.01531 3,880 76,385.96 9,029.59 3,139.71 76,385.96 9,029.59 2,530.442 51 Bulkley-Nechako F 3,137 5,397.05 3,384 -0.01504 2,998 59,010.78 6,975.67 2,425.53 59,010.78 6,975.67 1,954.852 41 Quesnel 9,326 35.34 10,044 -0.01472 8,920 175,604.22 20,758.20 7,217.89 175,604.22 20,758.20 5,817.252 41 Wells 236 159.15 235 0.00085 237 4,657.84 550.60 191.45 4,657.84 550.60 154.302 41 Cariboo A 5,859 783.36 6,428 -0.01837 5,542 109,103.43 12,897.13 4,484.50 109,103.43 12,897.13 3,614.272 41 Cariboo B 3,858 1,419.74 4,338 -0.02318 3,596 70,790.04 8,368.10 2,909.70 70,790.04 8,368.10 2,345.072 41 Cariboo C 1,164 7,392.10 1,323 -0.02528 1,078 21,220.48 2,508.48 872.23 21,220.48 2,508.48 702.972 41 Cariboo I 1,661 11,942.85 1,773 -0.01297 1,597 31,443.62 3,716.95 1,292.43 31,443.62 3,716.95 1,041.632 53 McBride 660 4.43 711 -0.01478 631 12,425.53 1,468.82 510.73 12,425.53 1,468.82 411.622 53 Prince George 70,981 316 72,406 -0.00397 70,139 1,380,794.24 163,223.88 56,755.02 1,380,794.24 163,223.88 45,741.642 53 Valemount 1,018 4.96 1,243 -0.03915 903 17,777.88 2,101.53 730.73 17,777.88 2,101.53 588.932 53 Fraser-Fort George A 3,275 1,379.17 3,406 -0.00781 3,199 62,973.47 7,444.10 2,588.41 62,973.47 7,444.10 2,086.132 53 Fraser-Fort George C 3,217 2,818.61 3,178 0.00244 3,241 63,796.33 7,541.37 2,622.23 63,796.33 7,541.37 2,113.382 53 Fraser-Fort George D 4,361 669.19 4,527 -0.00744 4,264 83,949.43 9,923.67 3,450.59 83,949.43 9,923.67 2,781.002 53 Fraser-Fort George E 502 617.91 564 -0.02302 468 9,215.63 1,089.38 378.79 9,215.63 1,089.38 305.292 53 Fraser-Fort George F 1,284 12,541.44 1,412 -0.01883 1,213 23,876.44 2,822.44 981.40 23,876.44 2,822.44 790.962 53 Fraser-Fort George G 349 17,200.43 479 -0.06136 289 5,681.80 671.65 233.54 5,681.80 671.65 188.22
Enter Study Year:
Total Collected - 2009 (4) Total Recycled - 2009
Enter Census Year (end):Enter Census Year (start):
CRA 071620 (2)

TABLE 3.1
USED OIL, FILTER, AND CONTAINER COLLECTION AND RECYCLING BY CENSUS SUBDIVISION2009 GREENHOUSE GAS SAVINGS STUDY
BCUOMA
Page 2 of 7
200920012006
2001 Pop Annual EstimatedBCUOMA Regional 2006 2006 Area Using 2006 Growth 2009 Oil Filters Containers Oil Filters Containers
Zone District (1) Name Population (2) km 2 Boundary (3) Rate Population L # kg L # kg
- - British Columbia 4,113,487 924,815.43 3,907,738 0.01032 4,242,100 44,546,000.00 5,190,000.00 1,433,413.00 44,546,000.00 5,190,000.00 1,155,257.36
Enter Study Year:
Total Collected - 2009 (4) Total Recycled - 2009
Enter Census Year (end):Enter Census Year (start):
2 53 Fraser-Fort George H 1,877 14,978.96 2,009 -0.01350 1,802 35,474.90 4,193.49 1,458.13 35,474.90 4,193.49 1,175.183 53 Mackenzie 4,539 159.09 5,206 -0.02705 4,181 189,254.93 10,985.79 3,985.84 189,254.93 10,985.79 3,212.393 55 Chetwynd 2,633 64.32 2,591 0.00322 2,659 120,352.28 6,986.16 2,534.71 120,352.28 6,986.16 2,042.843 55 Dawson Creek 10,994 22.32 10,754 0.00442 11,141 504,336.68 29,275.51 10,621.69 504,336.68 29,275.51 8,560.543 55 Fort St. John 17,402 22.74 16,051 0.01629 18,267 826,933.92 48,001.49 17,415.82 826,933.92 48,001.49 14,036.263 55 Hudson's Hope 1,012 869.43 1,039 -0.00525 996 45,095.47 2,617.68 949.74 45,095.47 2,617.68 765.443 55 Ingenika Point 0 5.43 0 0.00000 0 0.00 0.00 0.00 0.00 0.00 0.003 55 Pouce Coupe 739 2.06 833 -0.02366 688 31,135.62 1,807.35 655.74 31,135.62 1,807.35 528.493 55 Taylor 1,384 16.61 1,143 0.03901 1,552 70,275.41 4,079.32 1,480.05 70,275.41 4,079.32 1,192.843 55 Tumbler Ridge 2,454 1,574.45 1,851 0.05802 2,906 131,573.63 7,637.53 2,771.04 131,573.63 7,637.53 2,233.313 55 Peace River B 5,538 86,211.91 4,997 0.02077 5,890 266,656.71 15,478.77 5,615.98 266,656.71 15,478.77 4,526.193 55 Peace River C 6,350 582.49 5,813 0.01783 6,696 303,117.61 17,595.24 6,383.87 303,117.61 17,595.24 5,145.083 55 Peace River D 5,749 11,670.10 5,857 -0.00372 5,685 257,368.84 14,939.63 5,420.37 257,368.84 14,939.63 4,368.543 55 Peace River E 3,031 16,593.72 3,142 -0.00717 2,966 134,284.90 7,794.91 2,828.14 134,284.90 7,794.91 2,279.334 9 Fraser Valley A 478 2,335.28 596 -0.04317 419 5,165.41 649.47 185.40 5,165.41 649.47 149.424 41 100 Hundred Mile House 1,885 51.34 1,739 0.01625 1,978 24,405.43 3,068.61 875.96 24,405.43 3,068.61 705.984 41 Williams Lake 10,744 33.11 11,153 -0.00744 10,506 129,598.07 16,294.97 4,651.53 129,598.07 16,294.97 3,748.894 41 Cariboo D 3,073 856.15 3,296 -0.01391 2,947 36,347.60 4,570.15 1,304.59 36,347.60 4,570.15 1,051.434 41 Cariboo E 4,336 1,744.06 4,668 -0.01465 4,148 51,171.99 6,434.09 1,836.66 51,171.99 6,434.09 1,480.264 41 Cariboo F 4,384 9,775.63 4,961 -0.02443 4,071 50,213.36 6,313.56 1,802.26 50,213.36 6,313.56 1,452.534 41 Cariboo G 4,974 2,678.81 5,001 -0.00108 4,958 61,159.38 7,689.85 2,195.13 61,159.38 7,689.85 1,769.164 41 Cariboo H 1,744 2,603.71 1,834 -0.01001 1,692 20,873.86 2,624.57 749.20 20,873.86 2,624.57 603.824 41 Cariboo K 552 13,650.75 674 -0.03915 490 6,040.52 759.50 216.81 6,040.52 759.50 174.734 41 Cariboo L 4,316 1,268.42 4,254 0.00290 4,354 53,705.62 6,752.66 1,927.60 53,705.62 6,752.66 1,553.554 35 Kelowna 106,707 211.69 96,288 0.02076 113,492 1,400,017.03 176,030.67 50,249.37 1,400,017.03 176,030.67 40,498.414 35 Lake Country 9,606 122.16 9,267 0.00721 9,815 121,080.05 15,223.96 4,345.80 121,080.05 15,223.96 3,502.494 35 Peachland 4,883 15.98 4,654 0.00965 5,026 61,997.03 7,795.18 2,225.20 61,997.03 7,795.18 1,793.394 35 Central Okanagan 3,978 1,244.16 3,672 0.01614 4,174 51,486.10 6,473.59 1,847.94 51,486.10 6,473.59 1,489.344 35 Central Okanagan J 28,972 1,297.81 26,001 0.02187 30,915 381,363.83 47,950.65 13,687.90 381,363.83 47,950.65 11,031.744 39 Salmon Arm 16,012 155.36 15,210 0.01033 16,513 203,705.79 25,612.88 7,311.40 203,705.79 25,612.88 5,892.614 39 Sicamous 2,676 14.68 2,720 -0.00326 2,650 32,689.21 4,110.17 1,173.28 32,689.21 4,110.17 945.604 39 Columbia-Shuswap C 7,695 506.33 6,762 0.02619 8,316 102,578.58 12,897.68 3,681.75 102,578.58 12,897.68 2,967.304 39 Columbia-Shuswap D 3,899 694.53 3,904 -0.00026 3,896 48,060.39 6,042.86 1,724.98 48,060.39 6,042.86 1,390.254 39 Columbia-Shuswap E 1,528 1,542.18 1,491 0.00491 1,551 19,128.40 2,405.10 686.56 19,128.40 2,405.10 553.334 39 Columbia-Shuswap F 2,731 2,662.29 2,126 0.05136 3,174 39,151.17 4,922.66 1,405.21 39,151.17 4,922.66 1,132.534 37 Armstrong 4,241 5.24 4,256 -0.00071 4,232 52,205.50 6,564.04 1,873.76 52,205.50 6,564.04 1,510.154 37 Coldstream 9,471 67.25 9,106 0.00789 9,697 119,620.25 15,040.41 4,293.41 119,620.25 15,040.41 3,460.274 37 Enderby 2,828 4.23 2,818 0.00071 2,834 34,959.92 4,395.67 1,254.78 34,959.92 4,395.67 1,011.294 37 Lumby 1,634 5.27 1,618 0.00197 1,644 20,276.09 2,549.41 727.75 20,276.09 2,549.41 586.534 37 Spallumcheen 4,960 254.9 5,134 -0.00687 4,858 59,932.88 7,535.64 2,151.11 59,932.88 7,535.64 1,733.684 37 Vernon 35,944 94.2 33,542 0.01393 37,467 462,186.06 58,112.81 16,588.77 462,186.06 58,112.81 13,369.704 37 North Okanagan B 3,211 489.15 3,034 0.01140 3,322 40,981.05 5,152.74 1,470.89 40,981.05 5,152.74 1,185.464 37 North Okanagan C 3,947 301.12 3,612 0.01790 4,163 51,350.74 6,456.57 1,843.08 51,350.74 6,456.57 1,485.434 37 North Okanagan D 2,837 1,797.09 2,840 -0.00021 2,835 34,974.53 4,397.51 1,255.30 34,974.53 4,397.51 1,011.714 37 North Okanagan F 4,091 1,766.90 3,855 0.01195 4,239 52,297.45 6,575.60 1,877.06 52,297.45 6,575.60 1,512.814 7 Keremeos 1,289 2.11 1,197 0.01492 1,348 16,623.26 2,090.12 596.64 16,623.26 2,090.12 480.864 7 Oliver 4,370 4.95 4,224 0.00682 4,460 55,017.89 6,917.66 1,974.70 55,017.89 6,917.66 1,591.514 7 Osoyoos 4,752 8.76 4,295 0.02043 5,049 62,286.27 7,831.54 2,235.58 62,286.27 7,831.54 1,801.764 7 Penticton 31,909 42.02 30,985 0.00589 32,477 400,625.12 50,372.46 14,379.22 400,625.12 50,372.46 11,588.924 7 Princeton 2,677 10.25 2,610 0.00508 2,718 33,529.03 4,215.76 1,203.42 33,529.03 4,215.76 969.904 7 Summerland 10,828 73.88 10,723 0.00195 10,891 134,355.48 16,893.14 4,822.28 134,355.48 16,893.14 3,886.51
CRA 071620 (2)
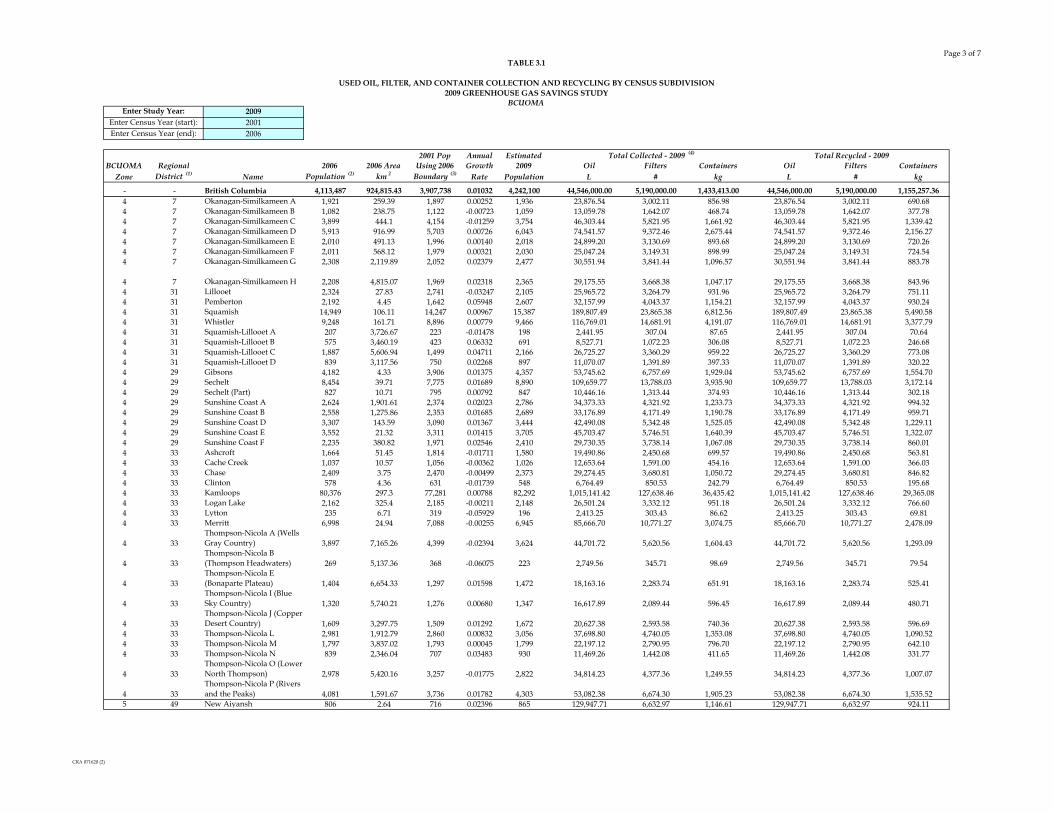
TABLE 3.1
USED OIL, FILTER, AND CONTAINER COLLECTION AND RECYCLING BY CENSUS SUBDIVISION2009 GREENHOUSE GAS SAVINGS STUDY
BCUOMA
Page 3 of 7
200920012006
2001 Pop Annual EstimatedBCUOMA Regional 2006 2006 Area Using 2006 Growth 2009 Oil Filters Containers Oil Filters Containers
Zone District (1) Name Population (2) km 2 Boundary (3) Rate Population L # kg L # kg
- - British Columbia 4,113,487 924,815.43 3,907,738 0.01032 4,242,100 44,546,000.00 5,190,000.00 1,433,413.00 44,546,000.00 5,190,000.00 1,155,257.36
Enter Study Year:
Total Collected - 2009 (4) Total Recycled - 2009
Enter Census Year (end):Enter Census Year (start):
4 7 Okanagan-Similkameen A 1,921 259.39 1,897 0.00252 1,936 23,876.54 3,002.11 856.98 23,876.54 3,002.11 690.684 7 Okanagan-Similkameen B 1,082 238.75 1,122 -0.00723 1,059 13,059.78 1,642.07 468.74 13,059.78 1,642.07 377.784 7 Okanagan-Similkameen C 3,899 444.1 4,154 -0.01259 3,754 46,303.44 5,821.95 1,661.92 46,303.44 5,821.95 1,339.424 7 Okanagan-Similkameen D 5,913 916.99 5,703 0.00726 6,043 74,541.57 9,372.46 2,675.44 74,541.57 9,372.46 2,156.274 7 Okanagan-Similkameen E 2,010 491.13 1,996 0.00140 2,018 24,899.20 3,130.69 893.68 24,899.20 3,130.69 720.264 7 Okanagan-Similkameen F 2,011 568.12 1,979 0.00321 2,030 25,047.24 3,149.31 898.99 25,047.24 3,149.31 724.544 7 Okanagan-Similkameen G 2,308 2,119.89 2,052 0.02379 2,477 30,551.94 3,841.44 1,096.57 30,551.94 3,841.44 883.78
4 7 Okanagan-Similkameen H 2,208 4,815.07 1,969 0.02318 2,365 29,175.55 3,668.38 1,047.17 29,175.55 3,668.38 843.964 31 Lillooet 2,324 27.83 2,741 -0.03247 2,105 25,965.72 3,264.79 931.96 25,965.72 3,264.79 751.114 31 Pemberton 2,192 4.45 1,642 0.05948 2,607 32,157.99 4,043.37 1,154.21 32,157.99 4,043.37 930.244 31 Squamish 14,949 106.11 14,247 0.00967 15,387 189,807.49 23,865.38 6,812.56 189,807.49 23,865.38 5,490.584 31 Whistler 9,248 161.71 8,896 0.00779 9,466 116,769.01 14,681.91 4,191.07 116,769.01 14,681.91 3,377.794 31 Squamish-Lillooet A 207 3,726.67 223 -0.01478 198 2,441.95 307.04 87.65 2,441.95 307.04 70.644 31 Squamish-Lillooet B 575 3,460.19 423 0.06332 691 8,527.71 1,072.23 306.08 8,527.71 1,072.23 246.684 31 Squamish-Lillooet C 1,887 5,606.94 1,499 0.04711 2,166 26,725.27 3,360.29 959.22 26,725.27 3,360.29 773.084 31 Squamish-Lillooet D 839 3,117.56 750 0.02268 897 11,070.07 1,391.89 397.33 11,070.07 1,391.89 320.224 29 Gibsons 4,182 4.33 3,906 0.01375 4,357 53,745.62 6,757.69 1,929.04 53,745.62 6,757.69 1,554.704 29 Sechelt 8,454 39.71 7,775 0.01689 8,890 109,659.77 13,788.03 3,935.90 109,659.77 13,788.03 3,172.144 29 Sechelt (Part) 827 10.71 795 0.00792 847 10,446.16 1,313.44 374.93 10,446.16 1,313.44 302.184 29 Sunshine Coast A 2,624 1,901.61 2,374 0.02023 2,786 34,373.33 4,321.92 1,233.73 34,373.33 4,321.92 994.324 29 Sunshine Coast B 2,558 1,275.86 2,353 0.01685 2,689 33,176.89 4,171.49 1,190.78 33,176.89 4,171.49 959.714 29 Sunshine Coast D 3,307 143.59 3,090 0.01367 3,444 42,490.08 5,342.48 1,525.05 42,490.08 5,342.48 1,229.114 29 Sunshine Coast E 3,552 21.32 3,311 0.01415 3,705 45,703.47 5,746.51 1,640.39 45,703.47 5,746.51 1,322.074 29 Sunshine Coast F 2,235 380.82 1,971 0.02546 2,410 29,730.35 3,738.14 1,067.08 29,730.35 3,738.14 860.014 33 Ashcroft 1,664 51.45 1,814 -0.01711 1,580 19,490.86 2,450.68 699.57 19,490.86 2,450.68 563.814 33 Cache Creek 1,037 10.57 1,056 -0.00362 1,026 12,653.64 1,591.00 454.16 12,653.64 1,591.00 366.034 33 Chase 2,409 3.75 2,470 -0.00499 2,373 29,274.45 3,680.81 1,050.72 29,274.45 3,680.81 846.824 33 Clinton 578 4.36 631 -0.01739 548 6,764.49 850.53 242.79 6,764.49 850.53 195.684 33 Kamloops 80,376 297.3 77,281 0.00788 82,292 1,015,141.42 127,638.46 36,435.42 1,015,141.42 127,638.46 29,365.084 33 Logan Lake 2,162 325.4 2,185 -0.00211 2,148 26,501.24 3,332.12 951.18 26,501.24 3,332.12 766.604 33 Lytton 235 6.71 319 -0.05929 196 2,413.25 303.43 86.62 2,413.25 303.43 69.814 33 Merritt 6,998 24.94 7,088 -0.00255 6,945 85,666.70 10,771.27 3,074.75 85,666.70 10,771.27 2,478.09
4 33Thompson-Nicola A (Wells Gray Country) 3,897 7,165.26 4,399 -0.02394 3,624 44,701.72 5,620.56 1,604.43 44,701.72 5,620.56 1,293.09
4 33Thompson-Nicola B (Thompson Headwaters) 269 5,137.36 368 -0.06075 223 2,749.56 345.71 98.69 2,749.56 345.71 79.54
4 33Thompson-Nicola E (Bonaparte Plateau) 1,404 6,654.33 1,297 0.01598 1,472 18,163.16 2,283.74 651.91 18,163.16 2,283.74 525.41
4 33Thompson-Nicola I (Blue Sky Country) 1,320 5,740.21 1,276 0.00680 1,347 16,617.89 2,089.44 596.45 16,617.89 2,089.44 480.71
4 33Thompson-Nicola J (Copper Desert Country) 1,609 3,297.75 1,509 0.01292 1,672 20,627.38 2,593.58 740.36 20,627.38 2,593.58 596.69
4 33 Thompson-Nicola L 2,981 1,912.79 2,860 0.00832 3,056 37,698.80 4,740.05 1,353.08 37,698.80 4,740.05 1,090.524 33 Thompson-Nicola M 1,797 3,837.02 1,793 0.00045 1,799 22,197.12 2,790.95 796.70 22,197.12 2,790.95 642.104 33 Thompson-Nicola N 839 2,346.04 707 0.03483 930 11,469.26 1,442.08 411.65 11,469.26 1,442.08 331.77
4 33Thompson-Nicola O (Lower North Thompson) 2,978 5,420.16 3,257 -0.01775 2,822 34,814.23 4,377.36 1,249.55 34,814.23 4,377.36 1,007.07
4 33Thompson-Nicola P (Rivers and the Peaks) 4,081 1,591.67 3,736 0.01782 4,303 53,082.38 6,674.30 1,905.23 53,082.38 6,674.30 1,535.52
5 49 New Aiyansh 806 2.64 716 0.02396 865 129,947.71 6,632.97 1,146.61 129,947.71 6,632.97 924.11
CRA 071620 (2)

TABLE 3.1
USED OIL, FILTER, AND CONTAINER COLLECTION AND RECYCLING BY CENSUS SUBDIVISION2009 GREENHOUSE GAS SAVINGS STUDY
BCUOMA
Page 4 of 7
200920012006
2001 Pop Annual EstimatedBCUOMA Regional 2006 2006 Area Using 2006 Growth 2009 Oil Filters Containers Oil Filters Containers
Zone District (1) Name Population (2) km 2 Boundary (3) Rate Population L # kg L # kg
- - British Columbia 4,113,487 924,815.43 3,907,738 0.01032 4,242,100 44,546,000.00 5,190,000.00 1,433,413.00 44,546,000.00 5,190,000.00 1,155,257.36
Enter Study Year:
Total Collected - 2009 (4) Total Recycled - 2009
Enter Census Year (end):Enter Census Year (start):
5 49 Stewart 496 571.5 661 -0.05582 417 62,694.61 3,200.15 553.19 62,694.61 3,200.15 445.855 49 Kitimat-Stikine A 46 25,398.73 81 -0.10699 33 4,919.28 251.10 43.41 4,919.28 251.10 34.985 49 Kitimat-Stikine D 91 28,288.47 88 0.00673 93 13,943.02 711.70 123.03 13,943.02 711.70 99.155 59 Fort Nelson 4,514 13.26 4,188 0.01511 4,722 709,046.73 36,192.16 6,256.37 709,046.73 36,192.16 5,042.315 59 Northern Rockies A 1,079 50,349.58 937 0.02862 1,174 176,348.16 9,001.41 1,556.03 176,348.16 9,001.41 1,254.085 59 Northern Rockies B 109 34,693.45 100 0.01738 115 17,237.04 879.84 152.09 17,237.04 879.84 122.585 57 Good Hope Lake 32 0.65 75 -0.15663 19 2,882.59 147.14 25.43 2,882.59 147.14 20.505 57 Lower Post 113 0.18 28 0.32186 261 39,193.23 2,000.56 345.83 39,193.23 2,000.56 278.725 57 Stikine Region 574 132,456.37 931 -0.09220 429 64,486.62 3,291.62 569.01 64,486.62 3,291.62 458.596 3 Castlegar 7,259 19.8 7,585 -0.00875 7,070 99,899.25 13,527.36 3,263.05 99,899.25 13,527.36 2,629.856 3 Creston 4,826 8.48 4,795 0.00129 4,845 68,454.06 9,269.36 2,235.95 68,454.06 9,269.36 1,802.066 3 Kaslo 1,072 2.8 1,032 0.00763 1,097 15,496.60 2,098.40 506.17 15,496.60 2,098.40 407.956 3 Nakusp 1,524 8 1,698 -0.02139 1,428 20,181.16 2,732.73 659.19 20,181.16 2,732.73 531.276 3 Nelson 9,258 11.72 9,318 -0.00129 9,222 130,306.64 17,644.82 4,256.27 130,306.64 17,644.82 3,430.336 3 New Denver 512 1.1 538 -0.00986 497 7,022.56 950.92 229.38 7,022.56 950.92 184.876 3 Salmo 1,007 2.38 1,120 -0.02105 945 13,349.01 1,807.59 436.02 13,349.01 1,807.59 351.416 3 Silverton 185 0.44 222 -0.03581 166 2,343.13 317.28 76.53 2,343.13 317.28 61.686 3 Slocan 314 0.75 336 -0.01345 301 4,260.07 576.86 139.15 4,260.07 576.86 112.156 3 Central Kootenay A 2,041 1,704.08 2,125 -0.00803 1,992 28,149.21 3,811.68 919.45 28,149.21 3,811.68 741.036 3 Central Kootenay B 4,575 1,620.91 4,742 -0.00714 4,478 63,267.62 8,567.07 2,066.54 63,267.62 8,567.07 1,665.526 3 Central Kootenay C 1,284 733.29 1,287 -0.00047 1,282 18,117.14 2,453.24 591.77 18,117.14 2,453.24 476.936 3 Central Kootenay D 1,525 5,788.48 1,500 0.00331 1,540 21,762.55 2,946.87 710.84 21,762.55 2,946.87 572.906 3 Central Kootenay E 3,716 812.61 3,521 0.01084 3,838 54,231.82 7,343.53 1,771.40 54,231.82 7,343.53 1,427.666 3 Central Kootenay F 3,730 402.62 3,907 -0.00923 3,628 51,257.90 6,940.83 1,674.26 51,257.90 6,940.83 1,349.376 3 Central Kootenay G 1,605 1,510.61 1,354 0.03460 1,777 25,114.33 3,400.73 820.32 25,114.33 3,400.73 661.146 3 Central Kootenay H 4,319 3,293.57 4,472 -0.00694 4,230 59,764.70 8,092.74 1,952.12 59,764.70 8,092.74 1,573.316 3 Central Kootenay I 2,415 109.47 2,436 -0.00173 2,402 33,946.40 4,596.68 1,108.81 33,946.40 4,596.68 893.646 3 Central Kootenay J 2,792 1,701.37 2,930 -0.00960 2,712 38,324.52 5,189.52 1,251.81 38,324.52 5,189.52 1,008.906 3 Central Kootenay K 1,800 4,390.45 1,979 -0.01878 1,700 24,027.09 3,253.51 784.81 24,027.09 3,253.51 632.516 39 Golden 3,811 11.02 4,020 -0.01062 3,691 52,150.61 7,061.71 1,703.42 52,150.61 7,061.71 1,372.876 39 Revelstoke 7,230 31.9 7,500 -0.00731 7,073 99,934.91 13,532.19 3,264.22 99,934.91 13,532.19 2,630.796 39 Columbia-Shuswap A 3,097 13,514.74 3,135 -0.00244 3,074 43,440.63 5,882.30 1,418.92 43,440.63 5,882.30 1,143.586 39 Columbia-Shuswap B 706 9,786.38 625 0.02467 760 10,732.29 1,453.26 350.55 10,732.29 1,453.26 282.536 1 Canal Flats 700 10.84 754 -0.01475 669 9,459.47 1,280.91 308.98 9,459.47 1,280.91 249.026 1 Cranbrook 18,267 25.14 18,517 -0.00271 18,119 256,010.56 34,666.39 8,362.19 256,010.56 34,666.39 6,739.506 1 Elkford 2,463 101.59 2,589 -0.00993 2,390 33,775.09 4,573.49 1,103.21 33,775.09 4,573.49 889.136 1 Fernie 4,217 16.05 4,611 -0.01771 3,997 56,475.67 7,647.37 1,844.69 56,475.67 7,647.37 1,486.736 1 Invermere 3,002 10.18 2,858 0.00988 3,092 43,687.02 5,915.66 1,426.97 43,687.02 5,915.66 1,150.066 1 Kimberley 6,139 58.31 6,484 -0.01088 5,941 83,942.73 11,366.69 2,741.86 83,942.73 11,366.69 2,209.806 1 Radium Hot Springs 735 6.31 583 0.04743 845 11,934.14 1,616.00 389.81 11,934.14 1,616.00 314.176 1 Sparwood 3,618 177.71 3,812 -0.01039 3,506 49,543.95 6,708.75 1,618.28 49,543.95 6,708.75 1,304.256 1 East Kootenay A 1,873 4,653.72 1,837 0.00389 1,895 26,774.89 3,625.59 874.56 26,774.89 3,625.59 704.856 1 East Kootenay B 1,819 2,791.55 1,838 -0.00208 1,808 25,542.16 3,458.66 834.30 25,542.16 3,458.66 672.406 1 East Kootenay C 5,866 4,519.23 5,753 0.00390 5,935 83,857.78 11,355.18 2,739.08 83,857.78 11,355.18 2,207.566 1 East Kootenay E 1,731 4,266.98 1,824 -0.01041 1,677 23,702.44 3,209.55 774.20 23,702.44 3,209.55 623.976 1 East Kootenay F 2,939 6,102.84 2,602 0.02466 3,162 44,675.32 6,049.48 1,459.25 44,675.32 6,049.48 1,176.086 1 East Kootenay G 1,563 4,654.72 1,635 -0.00897 1,521 21,495.94 2,910.77 702.13 21,495.94 2,910.77 565.886 5 Fruitvale 1,952 2.66 2,025 -0.00732 1,909 26,980.21 3,653.39 881.27 26,980.21 3,653.39 710.266 5 Grand Forks 4,036 10.44 4,054 -0.00089 4,025 56,875.38 7,701.50 1,857.75 56,875.38 7,701.50 1,497.256 5 Greenwood 625 2.52 666 -0.01263 602 8,500.73 1,151.08 277.66 8,500.73 1,151.08 223.786 5 Midway 621 12.16 638 -0.00539 611 8,633.50 1,169.06 282.00 8,633.50 1,169.06 227.28
CRA 071620 (2)

TABLE 3.1
USED OIL, FILTER, AND CONTAINER COLLECTION AND RECYCLING BY CENSUS SUBDIVISION2009 GREENHOUSE GAS SAVINGS STUDY
BCUOMA
Page 5 of 7
200920012006
2001 Pop Annual EstimatedBCUOMA Regional 2006 2006 Area Using 2006 Growth 2009 Oil Filters Containers Oil Filters Containers
Zone District (1) Name Population (2) km 2 Boundary (3) Rate Population L # kg L # kg
- - British Columbia 4,113,487 924,815.43 3,907,738 0.01032 4,242,100 44,546,000.00 5,190,000.00 1,433,413.00 44,546,000.00 5,190,000.00 1,155,257.36
Enter Study Year:
Total Collected - 2009 (4) Total Recycled - 2009
Enter Census Year (end):Enter Census Year (start):
6 5 Montrose 1,012 1.53 1,067 -0.01053 980 13,852.33 1,875.74 452.46 13,852.33 1,875.74 364.666 5 Rossland 3,278 57.97 3,646 -0.02105 3,075 43,452.72 5,883.93 1,419.32 43,452.72 5,883.93 1,143.906 5 Trail 7,237 34.78 7,575 -0.00909 7,041 99,493.98 13,472.48 3,249.82 99,493.98 13,472.48 2,619.196 5 Warfield 1,729 1.9 1,739 -0.00115 1,723 24,345.85 3,296.67 795.22 24,345.85 3,296.67 640.916 5 Kootenay Boundary A 1,989 238.52 1,984 0.00050 1,992 28,146.43 3,811.31 919.36 28,146.43 3,811.31 740.966 5 Kootenay Boundary B 1,418 778.61 1,583 -0.02177 1,327 18,755.39 2,539.67 612.62 18,755.39 2,539.67 493.746 5 Kootenay Boundary C 1,435 530.61 1,456 -0.00290 1,423 20,100.13 2,721.76 656.54 20,100.13 2,721.76 529.146 5 Kootenay Boundary D 3,176 2,116.43 3,241 -0.00404 3,138 44,333.71 6,003.23 1,448.09 44,333.71 6,003.23 1,167.096 5 Kootenay Boundary E 2,234 4,307.49 2,169 0.00592 2,274 32,129.95 4,350.72 1,049.48 32,129.95 4,350.72 845.826 37 North Okanagan E 934 2,613.15 938 -0.00085 932 13,163.34 1,782.45 429.96 13,163.34 1,782.45 346.537 17 Central Saanich 15,745 41.42 15,348 0.00512 15,988 132,513.43 14,306.66 3,619.08 132,513.43 14,306.66 2,916.797 17 Colwood 14,687 17.76 13,745 0.01335 15,283 126,668.55 13,675.62 3,459.45 126,668.55 13,675.62 2,788.147 17 Esquimalt 16,840 7.04 16,127 0.00869 17,283 143,244.48 15,465.23 3,912.15 143,244.48 15,465.23 3,152.997 17 Highlands 1,903 37.87 1,674 0.02597 2,055 17,033.80 1,839.03 465.21 17,033.80 1,839.03 374.947 17 Langford 22,459 39.55 18,840 0.03577 24,956 206,842.05 22,331.46 5,649.07 206,842.05 22,331.46 4,552.867 17 Metchosin 4,795 71.32 4,857 -0.00257 4,758 39,436.98 4,257.77 1,077.06 39,436.98 4,257.77 868.067 17 North Saanich 10,823 37.14 10,436 0.00731 11,062 91,685.05 9,898.67 2,504.01 91,685.05 9,898.67 2,018.107 17 Oak Bay 17,908 10.38 17,798 0.00123 17,974 148,975.66 16,083.99 4,068.68 148,975.66 16,083.99 3,279.147 17 Saanich 108,265 103.44 103,654 0.00874 111,129 921,068.62 99,442.12 25,155.31 921,068.62 99,442.12 20,273.897 17 Sidney 11,315 5.04 10,929 0.00697 11,553 95,755.06 10,338.09 2,615.17 95,755.06 10,338.09 2,107.697 17 Sooke 9,704 50.01 8,735 0.02126 10,336 85,669.50 9,249.21 2,339.72 85,669.50 9,249.21 1,885.697 17 Victoria 78,057 19.68 74,125 0.01039 80,516 667,333.37 72,047.88 18,225.55 667,333.37 72,047.88 14,688.867 17 View Royal 8,768 14.48 7,271 0.03815 9,810 81,310.58 8,778.60 2,220.67 81,310.58 8,778.60 1,789.757 17 Capital F 9,640 182.23 9,279 0.00766 9,863 81,749.53 8,825.99 2,232.66 81,749.53 8,825.99 1,799.417 17 Capital G 5,101 187.46 4,307 0.03442 5,646 46,795.74 5,052.25 1,278.04 46,795.74 5,052.25 1,030.037 17 Capital H (Part 1) 4,250 228.08 3,801 0.02258 4,544 37,665.72 4,066.54 1,028.69 37,665.72 4,066.54 829.077 17 Capital H (Part 2) 234 1,272.66 161 0.07765 293 2,427.24 262.05 66.29 2,427.24 262.05 53.437 19 Duncan 4,986 2.05 4,699 0.01193 5,167 42,821.62 4,623.19 1,169.50 42,821.62 4,623.19 942.567 19 Ladysmith 7,538 12.18 6,811 0.02049 8,011 66,396.62 7,168.44 1,813.36 66,396.62 7,168.44 1,461.477 19 Lake Cowichan 2,948 8.25 2,827 0.00842 3,023 25,055.97 2,705.14 684.30 25,055.97 2,705.14 551.517 19 North Cowichan 27,557 193.66 26,138 0.01063 28,445 235,760.14 25,453.57 6,438.85 235,760.14 25,453.57 5,189.387 19 Cowichan Valley A 4,073 49.43 3,416 0.03581 4,526 37,515.87 4,050.36 1,024.60 37,515.87 4,050.36 825.777 19 Cowichan Valley B 7,562 306.23 7,081 0.01323 7,866 65,196.55 7,038.87 1,780.58 65,196.55 7,038.87 1,435.067 19 Cowichan Valley C 4,530 22.64 4,525 0.00022 4,533 37,570.65 4,056.27 1,026.09 37,570.65 4,056.27 826.987 19 Cowichan Valley D 2,823 15.48 2,689 0.00977 2,907 24,090.49 2,600.90 657.94 24,090.49 2,600.90 530.267 19 Cowichan Valley E 3,878 134.87 3,785 0.00487 3,935 32,613.37 3,521.06 890.70 32,613.37 3,521.06 717.867 19 Cowichan Valley F 1,744 1,792.90 1,763 -0.00216 1,733 14,361.03 1,550.47 392.21 14,361.03 1,550.47 316.107 19 Cowichan Valley G 2,249 284.3 2,199 0.00451 2,280 18,893.42 2,039.81 516.00 18,893.42 2,039.81 415.877 19 Cowichan Valley H 2,274 83.02 2,185 0.00802 2,329 19,304.41 2,084.18 527.22 19,304.41 2,084.18 424.917 19 Cowichan Valley I 1,176 507.87 1,149 0.00466 1,193 9,883.76 1,067.09 269.94 9,883.76 1,067.09 217.557 21 Nanaimo 78,692 89.3 73,000 0.01513 82,318 682,272.58 73,660.78 18,633.55 682,272.58 73,660.78 15,017.697 21 Nanaimo A 6,751 60.11 6,423 0.01001 6,956 57,651.28 6,224.25 1,574.51 57,651.28 6,224.25 1,268.987 21 Nanaimo B 4,050 57.6 3,522 0.02833 4,404 36,502.04 3,940.90 996.91 36,502.04 3,940.90 803.467 21 Nanaimo C 2,508 1,098.49 1,932 0.05357 2,933 24,309.86 2,624.59 663.93 24,309.86 2,624.59 535.098 23 Port Alberni 17,548 19.92 17,748 -0.00226 17,429 200,424.22 22,584.85 6,480.94 200,424.22 22,584.85 5,223.318 23 Tofino 1,655 10.54 1,466 0.02455 1,780 20,467.84 2,306.42 661.85 20,467.84 2,306.42 533.428 23 Ucluelet 1,487 6.55 1,559 -0.00941 1,445 16,621.32 1,872.98 537.47 16,621.32 1,872.98 433.178 23 Alberni-Clayoquot A 303 1,621.71 285 0.01232 314 3,614.74 407.33 116.89 3,614.74 407.33 94.208 23 Alberni-Clayoquot B 476 92.53 502 -0.01058 461 5,301.81 597.44 171.44 5,301.81 597.44 138.178 23 Alberni-Clayoquot C 401 3,210.02 369 0.01677 422 4,847.20 546.21 156.74 4,847.20 546.21 126.328 23 Alberni-Clayoquot D 2,027 1,403.82 2,016 0.00109 2,034 23,385.54 2,635.20 756.20 23,385.54 2,635.20 609.46
CRA 071620 (2)

TABLE 3.1
USED OIL, FILTER, AND CONTAINER COLLECTION AND RECYCLING BY CENSUS SUBDIVISION2009 GREENHOUSE GAS SAVINGS STUDY
BCUOMA
Page 6 of 7
200920012006
2001 Pop Annual EstimatedBCUOMA Regional 2006 2006 Area Using 2006 Growth 2009 Oil Filters Containers Oil Filters Containers
Zone District (1) Name Population (2) km 2 Boundary (3) Rate Population L # kg L # kg
- - British Columbia 4,113,487 924,815.43 3,907,738 0.01032 4,242,100 44,546,000.00 5,190,000.00 1,433,413.00 44,546,000.00 5,190,000.00 1,155,257.36
Enter Study Year:
Total Collected - 2009 (4) Total Recycled - 2009
Enter Census Year (end):Enter Census Year (start):
8 23 Alberni-Clayoquot E 2,822 22.01 2,779 0.00308 2,848 32,751.69 3,690.63 1,059.06 32,751.69 3,690.63 853.558 23 Alberni-Clayoquot F 1,882 186.55 1,892 -0.00106 1,876 21,573.19 2,430.98 697.59 21,573.19 2,430.98 562.228 25 Campbell River 29,572 143.48 28,276 0.00900 30,378 349,328.47 39,364.16 11,295.93 349,328.47 39,364.16 9,103.948 25 Comox 12,136 15.16 11,391 0.01275 12,606 144,963.76 16,335.28 4,687.56 144,963.76 16,335.28 3,777.948 25 Courtenay 21,940 26.68 19,166 0.02740 23,794 273,612.13 30,832.05 8,847.55 273,612.13 30,832.05 7,130.678 25 Cumberland 2,762 29.13 2,633 0.00961 2,842 32,686.09 3,683.24 1,056.94 32,686.09 3,683.24 851.848 25 Gold River 1,362 10.51 1,359 0.00044 1,364 15,682.94 1,767.24 507.13 15,682.94 1,767.24 408.728 25 Sayward 341 4.72 379 -0.02091 320 3,680.43 414.73 119.01 3,680.43 414.73 95.928 25 Tahsis 366 5.73 600 -0.09413 272 3,128.63 352.55 101.17 3,128.63 352.55 81.548 25 Zeballos 189 1.45 224 -0.03341 171 1,962.75 221.17 63.47 1,962.75 221.17 51.158 25 Comox-Strathcona A 4,885 413.64 4,748 0.00571 4,969 57,141.62 6,439.02 1,847.74 57,141.62 6,439.02 1,489.188 25 Comox-Strathcona B 7,219 57.66 7,013 0.00581 7,345 84,468.86 9,518.39 2,731.39 84,468.86 9,518.39 2,201.368 25 Comox-Strathcona C 7,441 1,058.83 7,448 -0.00019 7,437 85,518.87 9,636.71 2,765.35 85,518.87 9,636.71 2,228.738 25 Comox-Strathcona D 4,984 1,611.81 4,920 0.00259 5,023 57,759.24 6,508.61 1,867.71 57,759.24 6,508.61 1,505.288 25 Comox-Strathcona G 74 5,104.75 66 0.02315 79 911.42 102.70 29.47 911.42 102.70 23.758 25 Comox-Strathcona H 755 2,024.49 785 -0.00776 738 8,481.43 955.73 274.26 8,481.43 955.73 221.048 25 Comox-Strathcona I 1,042 135.44 938 0.02125 1,110 12,762.69 1,438.17 412.70 12,762.69 1,438.17 332.618 25 Comox-Strathcona J 2,472 9,271.11 2,548 -0.00604 2,427 27,914.74 3,145.58 902.65 27,914.74 3,145.58 727.498 25 Comox-Strathcona K 2,169 80.95 1,982 0.01820 2,290 26,328.66 2,966.85 851.37 26,328.66 2,966.85 686.168 15 Bowen Island 3,362 49.94 2,957 0.02600 3,631 41,756.22 4,705.31 1,350.23 41,756.22 4,705.31 1,088.228 43 Alert Bay 556 1.78 583 -0.00944 540 6,214.33 700.26 200.95 6,214.33 700.26 161.958 43 Port Alice 821 7.65 1,126 -0.06123 679 7,810.91 880.17 252.57 7,810.91 880.17 203.568 43 Port Hardy 3,822 40.81 4,574 -0.03529 3,432 39,460.54 4,446.62 1,276.00 39,460.54 4,446.62 1,028.398 43 Port McNeill 2,623 7.74 2,821 -0.01445 2,511 28,874.27 3,253.70 933.68 28,874.27 3,253.70 752.508 43 Mount Waddington B 150 2,593.54 169 -0.02357 140 1,605.79 180.95 51.93 1,605.79 180.95 41.858 43 Mount Waddington C 736 1,509.91 829 -0.02352 685 7,880.38 888.00 254.82 7,880.38 888.00 205.378 43 Mount Waddington D 304 3,343.23 401 -0.05388 257 2,960.65 333.62 95.74 2,960.65 333.62 77.168 21 Lantzville 3,661 27.87 3,653 0.00044 3,666 42,154.64 4,750.21 1,363.12 42,154.64 4,750.21 1,098.608 21 Parksville 10,993 14.6 10,323 0.01266 11,416 131,273.80 14,792.62 4,244.88 131,273.80 14,792.62 3,421.168 21 Qualicum Beach 8,502 18 7,849 0.01611 8,920 102,570.11 11,558.14 3,316.72 102,570.11 11,558.14 2,673.118 21 Nanaimo E 5,462 75.11 4,820 0.02532 5,888 67,703.35 7,629.17 2,189.26 67,703.35 7,629.17 1,764.438 21 Nanaimo F 6,680 263.44 5,546 0.03791 7,469 85,887.52 9,678.26 2,777.27 85,887.52 9,678.26 2,238.348 21 Nanaimo G 7,023 48.88 6,113 0.02814 7,633 87,772.66 9,890.68 2,838.23 87,772.66 9,890.68 2,287.478 21 Nanaimo H 3,474 277.52 3,108 0.02252 3,714 42,708.54 4,812.62 1,381.03 42,708.54 4,812.62 1,113.049 51 Burns Lake 2,107 7.17 1,947 0.01592 2,209 32,433.11 3,776.68 911.94 32,433.11 3,776.68 734.989 51 Fort St. James 1,355 22.1 1,927 -0.06801 1,097 16,103.44 1,875.17 452.79 16,103.44 1,875.17 364.939 51 Fraser Lake 1,113 3.9 1,268 -0.02574 1,029 15,110.04 1,759.49 424.86 15,110.04 1,759.49 342.419 51 Granisle 364 40.21 353 0.00616 371 5,443.05 633.82 153.05 5,443.05 633.82 123.359 51 Houston 3,163 72.83 3,577 -0.02430 2,938 43,131.27 5,022.43 1,212.75 43,131.27 5,022.43 977.419 51 Smithers 5,217 15.69 5,414 -0.00739 5,102 74,904.39 8,722.25 2,106.13 74,904.39 8,722.25 1,697.439 51 Telkwa 1,295 6.56 1,371 -0.01134 1,251 18,371.90 2,139.32 516.57 18,371.90 2,139.32 416.339 51 Bulkley-Nechako A 5,290 3,688.00 5,696 -0.01468 5,060 74,290.28 8,650.74 2,088.86 74,290.28 8,650.74 1,683.529 51 Bulkley-Nechako B 2,154 3,628.08 2,277 -0.01104 2,083 30,585.83 3,561.57 860.00 30,585.83 3,561.57 693.129 51 Bulkley-Nechako C 1,355 25,663.24 1,688 -0.04300 1,188 17,435.09 2,030.23 490.23 17,435.09 2,030.23 395.109 51 Bulkley-Nechako D 1,665 4,382.94 1,715 -0.00590 1,636 24,013.15 2,796.21 675.19 24,013.15 2,796.21 544.179 51 Bulkley-Nechako E 1,788 15,912.95 1,750 0.00431 1,811 26,589.50 3,096.22 747.63 26,589.50 3,096.22 602.559 51 Bulkley-Nechako G 1,059 14,439.62 1,099 -0.00739 1,036 15,204.77 1,770.52 427.52 15,204.77 1,770.52 344.569 49 Aiyansh (Kitladamas) 1 0 13.37 0 0.00000 0 0.00 0.00 0.00 0.00 0.00 0.009 49 Gingolx 341 5.26 339 0.00118 342 5,023.80 585.00 141.26 5,023.80 585.00 113.859 49 Gitwinksihlkw 201 3.01 212 -0.01060 195 2,857.97 332.80 80.36 2,857.97 332.80 64.779 49 Hazelton 293 2.85 345 -0.03215 266 3,899.79 454.11 109.65 3,899.79 454.11 88.37
CRA 071620 (2)
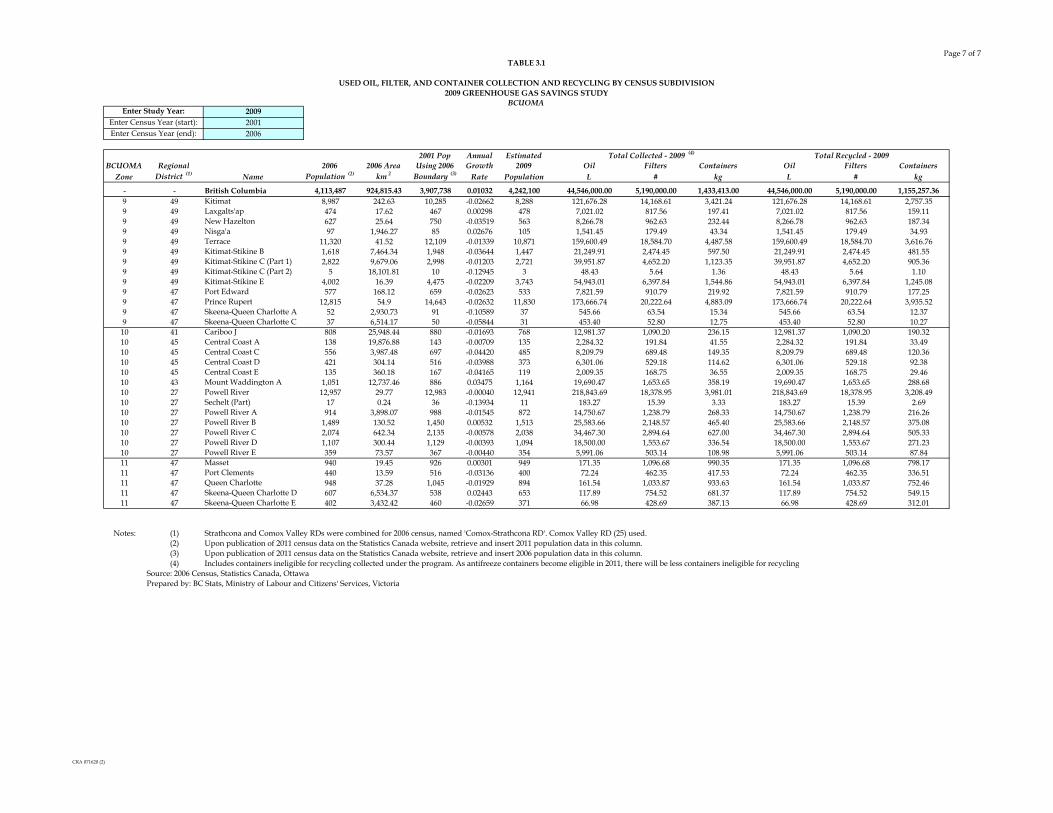
TABLE 3.1
USED OIL, FILTER, AND CONTAINER COLLECTION AND RECYCLING BY CENSUS SUBDIVISION2009 GREENHOUSE GAS SAVINGS STUDY
BCUOMA
Page 7 of 7
200920012006
2001 Pop Annual EstimatedBCUOMA Regional 2006 2006 Area Using 2006 Growth 2009 Oil Filters Containers Oil Filters Containers
Zone District (1) Name Population (2) km 2 Boundary (3) Rate Population L # kg L # kg
- - British Columbia 4,113,487 924,815.43 3,907,738 0.01032 4,242,100 44,546,000.00 5,190,000.00 1,433,413.00 44,546,000.00 5,190,000.00 1,155,257.36
Enter Study Year:
Total Collected - 2009 (4) Total Recycled - 2009
Enter Census Year (end):Enter Census Year (start):
9 49 Kitimat 8,987 242.63 10,285 -0.02662 8,288 121,676.28 14,168.61 3,421.24 121,676.28 14,168.61 2,757.359 49 Laxgalts'ap 474 17.62 467 0.00298 478 7,021.02 817.56 197.41 7,021.02 817.56 159.119 49 New Hazelton 627 25.64 750 -0.03519 563 8,266.78 962.63 232.44 8,266.78 962.63 187.349 49 Nisga'a 97 1,946.27 85 0.02676 105 1,541.45 179.49 43.34 1,541.45 179.49 34.939 49 Terrace 11,320 41.52 12,109 -0.01339 10,871 159,600.49 18,584.70 4,487.58 159,600.49 18,584.70 3,616.769 49 Kitimat-Stikine B 1,618 7,464.34 1,948 -0.03644 1,447 21,249.91 2,474.45 597.50 21,249.91 2,474.45 481.559 49 Kitimat-Stikine C (Part 1) 2,822 9,679.06 2,998 -0.01203 2,721 39,951.87 4,652.20 1,123.35 39,951.87 4,652.20 905.369 49 Kitimat-Stikine C (Part 2) 5 18,101.81 10 -0.12945 3 48.43 5.64 1.36 48.43 5.64 1.109 49 Kitimat-Stikine E 4,002 16.39 4,475 -0.02209 3,743 54,943.01 6,397.84 1,544.86 54,943.01 6,397.84 1,245.089 47 Port Edward 577 168.12 659 -0.02623 533 7,821.59 910.79 219.92 7,821.59 910.79 177.259 47 Prince Rupert 12,815 54.9 14,643 -0.02632 11,830 173,666.74 20,222.64 4,883.09 173,666.74 20,222.64 3,935.529 47 Skeena-Queen Charlotte A 52 2,930.73 91 -0.10589 37 545.66 63.54 15.34 545.66 63.54 12.379 47 Skeena-Queen Charlotte C 37 6,514.17 50 -0.05844 31 453.40 52.80 12.75 453.40 52.80 10.2710 41 Cariboo J 808 25,948.44 880 -0.01693 768 12,981.37 1,090.20 236.15 12,981.37 1,090.20 190.3210 45 Central Coast A 138 19,876.88 143 -0.00709 135 2,284.32 191.84 41.55 2,284.32 191.84 33.4910 45 Central Coast C 556 3,987.48 697 -0.04420 485 8,209.79 689.48 149.35 8,209.79 689.48 120.3610 45 Central Coast D 421 304.14 516 -0.03988 373 6,301.06 529.18 114.62 6,301.06 529.18 92.3810 45 Central Coast E 135 360.18 167 -0.04165 119 2,009.35 168.75 36.55 2,009.35 168.75 29.4610 43 Mount Waddington A 1,051 12,737.46 886 0.03475 1,164 19,690.47 1,653.65 358.19 19,690.47 1,653.65 288.6810 27 Powell River 12,957 29.77 12,983 -0.00040 12,941 218,843.69 18,378.95 3,981.01 218,843.69 18,378.95 3,208.4910 27 Sechelt (Part) 17 0.24 36 -0.13934 11 183.27 15.39 3.33 183.27 15.39 2.6910 27 Powell River A 914 3,898.07 988 -0.01545 872 14,750.67 1,238.79 268.33 14,750.67 1,238.79 216.2610 27 Powell River B 1,489 130.52 1,450 0.00532 1,513 25,583.66 2,148.57 465.40 25,583.66 2,148.57 375.0810 27 Powell River C 2,074 642.34 2,135 -0.00578 2,038 34,467.30 2,894.64 627.00 34,467.30 2,894.64 505.3310 27 Powell River D 1,107 300.44 1,129 -0.00393 1,094 18,500.00 1,553.67 336.54 18,500.00 1,553.67 271.2310 27 Powell River E 359 73.57 367 -0.00440 354 5,991.06 503.14 108.98 5,991.06 503.14 87.8411 47 Masset 940 19.45 926 0.00301 949 171.35 1,096.68 990.35 171.35 1,096.68 798.1711 47 Port Clements 440 13.59 516 -0.03136 400 72.24 462.35 417.53 72.24 462.35 336.5111 47 Queen Charlotte 948 37.28 1,045 -0.01929 894 161.54 1,033.87 933.63 161.54 1,033.87 752.4611 47 Skeena-Queen Charlotte D 607 6,534.37 538 0.02443 653 117.89 754.52 681.37 117.89 754.52 549.1511 47 Skeena-Queen Charlotte E 402 3,432.42 460 -0.02659 371 66.98 428.69 387.13 66.98 428.69 312.01
Notes: (1) Strathcona and Comox Valley RDs were combined for 2006 census, named 'Comox-Strathcona RD'. Comox Valley RD (25) used.(2) Upon publication of 2011 census data on the Statistics Canada website, retrieve and insert 2011 population data in this column.(3) Upon publication of 2011 census data on the Statistics Canada website, retrieve and insert 2006 population data in this column.(4) Includes containers ineligible for recycling collected under the program. As antifreeze containers become eligible in 2011, there will be less containers ineligible for recycling
Source: 2006 Census, Statistics Canada, OttawaPrepared by: BC Stats, Ministry of Labour and Citizens' Services, Victoria
CRA 071620 (2)
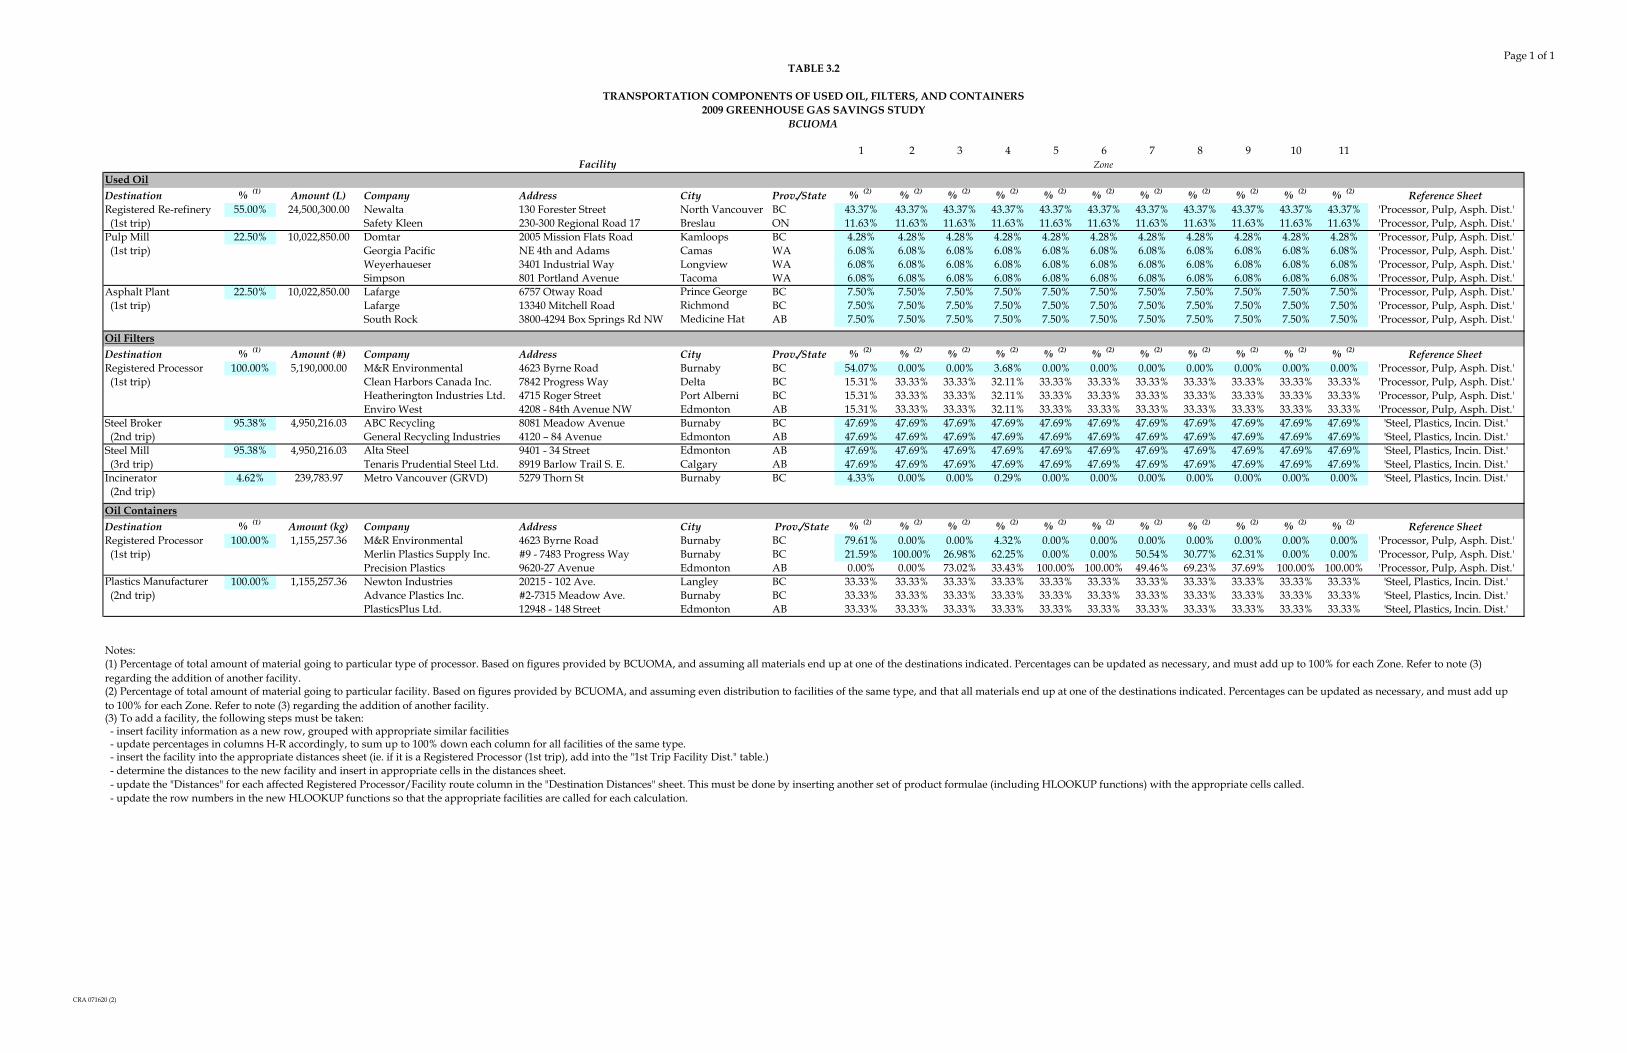
TABLE 3.2
TRANSPORTATION COMPONENTS OF USED OIL, FILTERS, AND CONTAINERS2009 GREENHOUSE GAS SAVINGS STUDY
BCUOMA
Page 1 of 1
1 2 3 4 5 6 7 8 9 10 11Zone
Used OilDestination % (1) Amount (L) Company Address City Prov./State % (2) % (2) % (2) % (2) % (2) % (2) % (2) % (2) % (2) % (2) % (2) Reference SheetRegistered Re-refinery 55.00% 24,500,300.00 Newalta 130 Forester Street North Vancouver BC 43.37% 43.37% 43.37% 43.37% 43.37% 43.37% 43.37% 43.37% 43.37% 43.37% 43.37% 'Processor, Pulp, Asph. Dist.' (1st trip) Safety Kleen 230-300 Regional Road 17 Breslau ON 11.63% 11.63% 11.63% 11.63% 11.63% 11.63% 11.63% 11.63% 11.63% 11.63% 11.63% 'Processor, Pulp, Asph. Dist.'Pulp Mill 22.50% 10,022,850.00 Domtar 2005 Mission Flats Road Kamloops BC 4.28% 4.28% 4.28% 4.28% 4.28% 4.28% 4.28% 4.28% 4.28% 4.28% 4.28% 'Processor, Pulp, Asph. Dist.' (1st trip) Georgia Pacific NE 4th and Adams Camas WA 6.08% 6.08% 6.08% 6.08% 6.08% 6.08% 6.08% 6.08% 6.08% 6.08% 6.08% 'Processor, Pulp, Asph. Dist.'
Weyerhaueser 3401 Industrial Way Longview WA 6.08% 6.08% 6.08% 6.08% 6.08% 6.08% 6.08% 6.08% 6.08% 6.08% 6.08% 'Processor, Pulp, Asph. Dist.'Simpson 801 Portland Avenue Tacoma WA 6.08% 6.08% 6.08% 6.08% 6.08% 6.08% 6.08% 6.08% 6.08% 6.08% 6.08% 'Processor, Pulp, Asph. Dist.'
Asphalt Plant 22.50% 10,022,850.00 Lafarge 6757 Otway Road Prince George BC 7.50% 7.50% 7.50% 7.50% 7.50% 7.50% 7.50% 7.50% 7.50% 7.50% 7.50% 'Processor, Pulp, Asph. Dist.' (1st trip) Lafarge 13340 Mitchell Road Richmond BC 7.50% 7.50% 7.50% 7.50% 7.50% 7.50% 7.50% 7.50% 7.50% 7.50% 7.50% 'Processor, Pulp, Asph. Dist.'
South Rock 3800-4294 Box Springs Rd NW Medicine Hat AB 7.50% 7.50% 7.50% 7.50% 7.50% 7.50% 7.50% 7.50% 7.50% 7.50% 7.50% 'Processor, Pulp, Asph. Dist.'
Oil FiltersDestination % (1) Amount (#) Company Address City Prov./State % (2) % (2) % (2) % (2) % (2) % (2) % (2) % (2) % (2) % (2) % (2) Reference SheetRegistered Processor 100.00% 5,190,000.00 M&R Environmental 4623 Byrne Road Burnaby BC 54.07% 0.00% 0.00% 3.68% 0.00% 0.00% 0.00% 0.00% 0.00% 0.00% 0.00% 'Processor, Pulp, Asph. Dist.' (1st trip) Clean Harbors Canada Inc. 7842 Progress Way Delta BC 15.31% 33.33% 33.33% 32.11% 33.33% 33.33% 33.33% 33.33% 33.33% 33.33% 33.33% 'Processor, Pulp, Asph. Dist.'
Heatherington Industries Ltd. 4715 Roger Street Port Alberni BC 15.31% 33.33% 33.33% 32.11% 33.33% 33.33% 33.33% 33.33% 33.33% 33.33% 33.33% 'Processor, Pulp, Asph. Dist.'Enviro West 4208 - 84th Avenue NW Edmonton AB 15.31% 33.33% 33.33% 32.11% 33.33% 33.33% 33.33% 33.33% 33.33% 33.33% 33.33% 'Processor, Pulp, Asph. Dist.'
Steel Broker 95.38% 4,950,216.03 ABC Recycling 8081 Meadow Avenue Burnaby BC 47.69% 47.69% 47.69% 47.69% 47.69% 47.69% 47.69% 47.69% 47.69% 47.69% 47.69% 'Steel, Plastics, Incin. Dist.' (2nd trip) General Recycling Industries 4120 – 84 Avenue Edmonton AB 47.69% 47.69% 47.69% 47.69% 47.69% 47.69% 47.69% 47.69% 47.69% 47.69% 47.69% 'Steel, Plastics, Incin. Dist.'Steel Mill 95.38% 4,950,216.03 Alta Steel 9401 - 34 Street Edmonton AB 47.69% 47.69% 47.69% 47.69% 47.69% 47.69% 47.69% 47.69% 47.69% 47.69% 47.69% 'Steel, Plastics, Incin. Dist.' (3rd trip) Tenaris Prudential Steel Ltd. 8919 Barlow Trail S. E. Calgary AB 47.69% 47.69% 47.69% 47.69% 47.69% 47.69% 47.69% 47.69% 47.69% 47.69% 47.69% 'Steel, Plastics, Incin. Dist.'Incinerator 4.62% 239,783.97 Metro Vancouver (GRVD) 5279 Thorn St Burnaby BC 4.33% 0.00% 0.00% 0.29% 0.00% 0.00% 0.00% 0.00% 0.00% 0.00% 0.00% 'Steel, Plastics, Incin. Dist.' (2nd trip)
Oil ContainersDestination % (1) Amount (kg) Company Address City Prov./State % (2) % (2) % (2) % (2) % (2) % (2) % (2) % (2) % (2) % (2) % (2) Reference SheetRegistered Processor 100.00% 1,155,257.36 M&R Environmental 4623 Byrne Road Burnaby BC 79.61% 0.00% 0.00% 4.32% 0.00% 0.00% 0.00% 0.00% 0.00% 0.00% 0.00% 'Processor, Pulp, Asph. Dist.' (1st trip) Merlin Plastics Supply Inc. #9 - 7483 Progress Way Burnaby BC 21.59% 100.00% 26.98% 62.25% 0.00% 0.00% 50.54% 30.77% 62.31% 0.00% 0.00% 'Processor, Pulp, Asph. Dist.'
Precision Plastics 9620-27 Avenue Edmonton AB 0.00% 0.00% 73.02% 33.43% 100.00% 100.00% 49.46% 69.23% 37.69% 100.00% 100.00% 'Processor, Pulp, Asph. Dist.'Plastics Manufacturer 100.00% 1,155,257.36 Newton Industries 20215 - 102 Ave. Langley BC 33.33% 33.33% 33.33% 33.33% 33.33% 33.33% 33.33% 33.33% 33.33% 33.33% 33.33% 'Steel, Plastics, Incin. Dist.' (2nd trip) Advance Plastics Inc. #2-7315 Meadow Ave. Burnaby BC 33.33% 33.33% 33.33% 33.33% 33.33% 33.33% 33.33% 33.33% 33.33% 33.33% 33.33% 'Steel, Plastics, Incin. Dist.'
PlasticsPlus Ltd. 12948 - 148 Street Edmonton AB 33.33% 33.33% 33.33% 33.33% 33.33% 33.33% 33.33% 33.33% 33.33% 33.33% 33.33% 'Steel, Plastics, Incin. Dist.'
Notes:
(3) To add a facility, the following steps must be taken: - insert facility information as a new row, grouped with appropriate similar facilities - update percentages in columns H-R accordingly, to sum up to 100% down each column for all facilities of the same type. - insert the facility into the appropriate distances sheet (ie. if it is a Registered Processor (1st trip), add into the "1st Trip Facility Dist." table.) - determine the distances to the new facility and insert in appropriate cells in the distances sheet.
Facility
(1) Percentage of total amount of material going to particular type of processor. Based on figures provided by BCUOMA, and assuming all materials end up at one of the destinations indicated. Percentages can be updated as necessary, and must add up to 100% for each Zone. Refer to note (3) regarding the addition of another facility.(2) Percentage of total amount of material going to particular facility. Based on figures provided by BCUOMA, and assuming even distribution to facilities of the same type, and that all materials end up at one of the destinations indicated. Percentages can be updated as necessary, and must add up to 100% for each Zone. Refer to note (3) regarding the addition of another facility.
- update the row numbers in the new HLOOKUP functions so that the appropriate facilities are called for each calculation. - update the "Distances" for each affected Registered Processor/Facility route column in the "Destination Distances" sheet. This must be done by inserting another set of product formulae (including HLOOKUP functions) with the appropriate cells called.
CRA 071620 (2)

TABLE 3.3
PROJECT - DESTINATION DISTANCES2009 GREENHOUSE GAS SAVINGS STUDY
BCUOMA
Page 1 of 6
BCUOMA Regional 2006 Area Generator Distance Diesel Distance Diesel Distance Diesel Distance Diesel Distance Diesel Distance Diesel Distance Diesel Distance Diesel Distance Diesel Distance Diesel Distance Diesel Distance Diesel
Zone District (1) Name km 2 Location (2) Zone RD Location (3) (km) (4)Consumed
(L) (km) (5)Consumed
(L) (km) (5) Consumed (L) (km) (5)Consumed
(L) Zone RD Location (3) (km) (4)Consumed
(L) (km) (5)Consumed
(L) (km) (5)Consumed
(L) (km) (5)Consumed
(L) (km) (5)Consumed
(L) Zone RD Location (3) (km) (4)Consumed
(L) (km) (5)Consumed
(L) (km) (5)Consumed
(L)
1 9 Abbotsford 359.36 Abbotsford 1 15 Surrey 57.5 1883.1 20.2 292.7 235.3 3402.0 503.8 89.2 1 15 Surrey 57.5 68.5 224.3 143.5 583.5 311.2 560.3 298.8 0.2 0.1 1 15 Surrey 57.5 20.2 22.5 4.2 397.6 43.21 9 Chilliwack 260.19 Chilliwack 1 15 Surrey 83.6 1558.7 20.2 166.6 235.3 1936.8 503.8 50.8 1 15 Surrey 83.6 56.7 224.3 81.7 583.5 177.2 560.3 170.1 0.2 0.1 1 15 Surrey 83.6 16.7 22.5 2.4 397.6 24.61 9 Harrison Hot Springs 5.47 Harrison Hot Springs 1 15 Surrey 109.0 47.8 20.2 3.9 235.3 45.5 503.8 1.2 1 15 Surrey 109.0 1.7 224.3 1.9 583.5 4.2 560.3 4.0 0.2 0.0 1 15 Surrey 109.0 0.5 22.5 0.1 397.6 0.61 9 Hope 41.42 Hope 1 15 Surrey 139.0 218.0 20.2 14.0 235.3 162.9 503.8 4.3 1 15 Surrey 139.0 7.9 224.3 6.9 583.5 14.9 560.3 14.3 0.2 0.0 1 15 Surrey 139.0 2.3 22.5 0.2 397.6 2.11 9 Kent 166.51 Kent 1 15 Surrey 104.0 122.0 20.2 10.5 235.3 121.9 503.8 3.2 1 15 Surrey 104.0 4.4 224.3 5.1 583.5 11.2 560.3 10.7 0.2 0.0 1 15 Surrey 104.0 1.3 22.5 0.2 397.6 1.51 9 Mission 225.78 Mission 1 15 Surrey 54.2 503.0 20.2 82.9 235.3 964.0 503.8 25.3 1 15 Surrey 54.2 18.3 224.3 40.7 583.5 88.2 560.3 84.7 0.2 0.0 1 15 Surrey 54.2 5.4 22.5 1.2 397.6 12.21 9 Fraser Valley B 3,089.46 Hope 1 15 Surrey 139.0 29.2 20.2 1.9 235.3 21.8 503.8 0.6 1 15 Surrey 139.0 1.1 224.3 0.9 583.5 2.0 560.3 1.9 0.2 0.0 1 15 Surrey 139.0 0.3 22.5 0.0 397.6 0.31 9 Fraser Valley C 3,669.93 Kent 1 15 Surrey 104.0 29.8 20.2 2.6 235.3 29.7 503.8 0.8 1 15 Surrey 104.0 1.1 224.3 1.3 583.5 2.7 560.3 2.6 0.2 0.0 1 15 Surrey 104.0 0.3 22.5 0.0 397.6 0.41 9 Fraser Valley D 222.05 Kent 1 15 Surrey 104.0 39.2 20.2 3.4 235.3 39.1 503.8 1.0 1 15 Surrey 104.0 1.4 224.3 1.7 583.5 3.6 560.3 3.4 0.2 0.0 1 15 Surrey 104.0 0.4 22.5 0.0 397.6 0.51 9 Fraser Valley E 750.52 Chilliwack 1 15 Surrey 83.6 74.8 20.2 8.0 235.3 93.0 503.8 2.4 1 15 Surrey 83.6 2.7 224.3 3.9 583.5 8.5 560.3 8.2 0.2 0.0 1 15 Surrey 83.6 0.8 22.5 0.1 397.6 1.21 9 Fraser Valley F 2,029.70 Mission 1 15 Surrey 54.2 19.3 20.2 3.2 235.3 37.0 503.8 1.0 1 15 Surrey 54.2 0.7 224.3 1.6 583.5 3.4 560.3 3.2 0.2 0.0 1 15 Surrey 54.2 0.2 22.5 0.0 397.6 0.51 9 Fraser Valley G 74.97 Mission 1 15 Surrey 54.2 27.0 20.2 4.5 235.3 51.8 503.8 1.4 1 15 Surrey 54.2 1.0 224.3 2.2 583.5 4.7 560.3 4.6 0.2 0.0 1 15 Surrey 54.2 0.3 22.5 0.1 397.6 0.71 9 Fraser Valley H 36.86 Abbotsford 1 15 Surrey 57.5 6.1 20.2 0.9 235.3 11.0 503.8 0.3 1 15 Surrey 57.5 0.2 224.3 0.5 583.5 1.0 560.3 1.0 0.2 0.0 1 15 Surrey 57.5 0.1 22.5 0.0 397.6 0.11 15 Anmore 27.42 Anmore 1 15 Burnaby 22.4 12.0 8.9 2.1 239.9 56.8 503.8 1.5 1 15 Burnaby 22.4 0.4 209.1 2.2 583.5 5.1 560.3 4.9 0.2 0.0 1 15 Burnaby 22.4 0.1 2.1 0.0 397.6 0.71 15 Belcarra 5.46 Belcarra 1 15 Burnaby 26.5 4.5 8.9 0.7 239.9 18.1 503.8 0.5 1 15 Burnaby 26.5 0.2 209.1 0.7 583.5 1.6 560.3 1.6 0.2 0.0 1 15 Burnaby 26.5 0.0 2.1 0.0 397.6 0.21 15 Burnaby 89.12 Burnaby 1 15 Burnaby 2.7 140.6 8.9 208.2 239.9 5592.1 503.8 143.9 1 15 Burnaby 2.7 5.1 209.1 215.7 583.5 501.9 560.3 481.9 0.2 0.2 1 15 Burnaby 2.7 1.5 2.1 0.6 397.6 69.71 15 Coquitlam 121.69 Coquitlam 1 15 Burnaby 24.0 703.3 8.9 115.5 239.9 3103.0 503.8 79.8 1 15 Burnaby 24.0 25.6 209.1 119.7 583.5 278.5 560.3 267.4 0.2 0.1 1 15 Burnaby 24.0 7.6 2.1 0.4 397.6 38.71 15 Delta 183.70 Delta 1 15 Delta 3.8 93.6 14.6 158.0 240.7 2601.6 503.8 66.7 1 15 Delta 3.8 3.4 218.4 104.5 583.5 232.7 560.3 223.4 0.2 0.1 1 15 Surrey 5.0 1.3 22.5 3.2 397.6 32.31 15 Langley (1) 306.93 Langley (1) 1 15 Surrey 20.0 497.3 20.2 222.2 235.3 2583.0 503.8 67.8 1 15 Surrey 20.0 18.1 224.3 109.0 583.5 236.3 560.3 226.9 0.2 0.1 1 15 Surrey 20.0 5.3 22.5 3.2 397.6 32.81 15 Langley (2) 10.22 Langley (2) 1 15 Surrey 20.0 119.6 20.2 53.4 235.3 621.1 503.8 16.3 1 15 Surrey 20.0 4.3 224.3 26.2 583.5 56.8 560.3 54.6 0.2 0.0 1 15 Surrey 20.0 1.3 22.5 0.8 397.6 7.91 15 Lions Bay 2.55 Lions Bay 1 15 North Vancouver 29.8 9.8 5.9 0.9 240.3 34.9 503.8 0.9 1 15 Burnaby 42.7 0.5 209.1 1.3 583.5 3.1 560.3 3.0 0.2 0.0 1 15 Burnaby 42.7 0.2 2.1 0.0 397.6 0.41 15 Maple Ridge 265.79 Maple Ridge 1 15 Surrey 22.5 414.5 20.2 164.7 235.3 1913.8 503.8 50.2 1 15 Surrey 22.5 15.1 224.3 80.8 583.5 175.1 560.3 168.1 0.2 0.1 1 15 Burnaby 19.6 3.9 2.1 0.2 397.6 24.31 15 New Westminster 15.41 New Westminster 1 15 Burnaby 8.3 128.4 8.9 61.0 239.9 1638.1 503.8 42.1 1 15 Burnaby 8.3 4.7 209.1 63.2 583.5 147.0 560.3 141.2 0.2 0.1 1 15 Burnaby 17.0 2.8 2.1 0.2 397.6 20.41 15 North Vancouver 160.67 North Vancouver 1 15 North Vancouver 3.6 75.0 5.9 54.7 240.3 2224.5 503.8 57.1 1 15 Burnaby 19.6 14.9 209.1 85.7 583.5 199.3 560.3 191.4 0.2 0.1 1 15 Burnaby 19.6 4.4 2.1 0.3 397.6 27.71 15 North Vancouver 11.85 North Vancouver 1 15 North Vancouver 1.0 11.3 5.9 30.3 240.3 1232.3 503.8 31.7 1 15 Burnaby 17.0 7.2 209.1 47.5 583.5 110.4 560.3 106.0 0.2 0.0 1 15 Burnaby 17.0 2.1 2.1 0.1 397.6 15.31 15 Pitt Meadows 85.38 Pitt Meadows 1 15 Surrey 25.8 106.1 20.2 36.8 235.3 427.3 503.8 11.2 1 15 Surrey 25.8 3.9 224.3 18.0 583.5 39.1 560.3 37.5 0.2 0.0 1 15 Surrey 25.8 1.1 22.5 0.5 397.6 5.41 15 Port Coquitlam 28.85 Port Coquitlam 1 15 Burnaby 23.0 312.3 8.9 53.5 239.9 1438.0 503.8 37.0 1 15 Burnaby 23.0 11.4 209.1 55.5 583.5 129.1 560.3 123.9 0.2 0.0 1 15 Burnaby 23.0 3.4 2.1 0.2 397.6 17.91 15 Port Moody 25.62 Port Moody 1 15 Burnaby 17.4 132.3 8.9 30.0 239.9 805.4 503.8 20.7 1 15 Burnaby 17.4 4.8 209.1 31.1 583.5 72.3 560.3 69.4 0.2 0.0 1 15 Burnaby 17.4 1.4 2.1 0.1 397.6 10.01 15 Richmond 128.76 Richmond 1 15 Burnaby 23.6 1081.9 8.9 180.7 239.9 4854.6 503.8 124.9 1 15 Burnaby 23.6 39.3 209.1 187.3 583.5 435.7 560.3 418.3 0.2 0.2 1 15 Burnaby 23.6 11.6 2.1 0.6 397.6 60.51 15 Surrey 317.19 Surrey 1 15 Surrey 5.0 543.0 20.2 965.9 235.3 11226.7 503.8 294.5 1 15 Surrey 5.0 19.7 224.3 473.7 583.5 1027.0 560.3 986.2 0.2 0.4 1 15 Surrey 5.0 5.8 22.5 14.0 397.6 142.61 15 Vancouver 114.71 Vancouver 1 15 North Vancouver 15.0 2275.6 5.9 396.1 240.3 16092.7 503.8 413.3 1 15 Burnaby 31.0 171.0 209.1 619.8 583.5 1441.7 560.3 1384.3 0.2 0.5 1 15 Burnaby 31.0 50.5 2.1 1.8 397.6 200.11 15 West Vancouver 87.13 West Vancouver 1 15 North Vancouver 22.1 238.5 5.9 28.2 240.3 1144.7 503.8 29.4 1 15 Burnaby 38.1 14.9 209.1 44.1 583.5 102.5 560.3 98.5 0.2 0.0 1 15 Burnaby 38.1 4.4 2.1 0.1 397.6 14.21 15 White Rock 5.16 White Rock 1 15 Surrey 16.0 77.3 20.2 43.2 235.3 502.1 503.8 13.2 1 15 Surrey 16.0 2.8 224.3 21.2 583.5 45.9 560.3 44.1 0.2 0.0 1 15 Surrey 16.0 0.8 22.5 0.6 397.6 6.41 15 Greater Vancouver A 818.62 Vancouver 1 15 North Vancouver 22.1 75.0 5.9 8.9 240.3 359.8 503.8 9.2 1 15 Burnaby 38.1 4.7 209.1 13.9 583.5 32.2 560.3 31.0 0.2 0.0 1 15 Burnaby 38.1 1.4 2.1 0.0 397.6 4.52 51 Vanderhoof 54.85 Vanderhoof 2 53 Prince George 110.0 248.3 407.8 406.3 365.9 364.6 503.8 6.1 2 53 Prince George 110.0 8.5 796.7 33.1 613.1 21.2 560.3 19.4 0.0 0.0 1 15 Prince George 110.0 3.2 788.8 12.4 397.6 3.62 51 Bulkley-Nechako F 5,397.05 Vanderhoof 2 53 Prince George 110.0 191.8 407.8 313.8 365.9 281.7 503.8 4.8 2 53 Prince George 110.0 6.6 796.7 25.5 613.1 16.4 560.3 15.0 0.0 0.0 1 15 Prince George 110.0 2.5 788.8 9.6 397.6 2.82 41 Quesnel 35.34 Quesnel 2 53 Quesnel 1.7 8.7 341.8 782.8 346.8 794.4 503.8 14.1 2 53 Quesnel 1.7 0.3 752.3 71.8 613.1 48.7 560.3 44.5 0.0 0.0 1 15 Quesnel 1.7 0.1 667.4 24.1 397.6 8.32 41 Wells 159.15 Wells 2 53 Prince George 184.0 25.3 407.8 24.8 365.9 22.2 503.8 0.4 2 53 Prince George 184.0 0.9 796.7 2.0 613.1 1.3 560.3 1.2 0.0 0.0 1 15 Prince George 184.0 0.3 788.8 0.8 397.6 0.22 41 Cariboo A 783.36 Quesnel 2 53 Quesnel 7.9 25.5 341.8 486.3 346.8 493.6 503.8 8.8 2 53 Quesnel 7.9 0.9 752.3 44.6 613.1 30.3 560.3 27.7 0.0 0.0 1 15 Quesnel 7.9 0.3 667.4 15.0 397.6 5.12 41 Cariboo B 1,419.74 Quesnel 2 53 Quesnel 10.6 22.2 341.8 315.6 346.8 320.3 503.8 5.7 2 53 Quesnel 10.6 0.8 752.3 28.9 613.1 19.6 560.3 18.0 0.0 0.0 1 15 Quesnel 10.6 0.3 667.4 9.7 397.6 3.32 41 Cariboo C 7,392.10 Quesnel 2 53 Quesnel 24.3 15.2 341.8 94.6 346.8 96.0 503.8 1.7 2 53 Quesnel 24.3 0.5 752.3 8.7 613.1 5.9 560.3 5.4 0.0 0.0 2 53 Quesnel 24.3 0.2 661.0 2.9 395.0 1.02 41 Cariboo I 11,942.85 Quesnel 2 53 Quesnel 30.8 28.6 341.8 140.2 346.8 142.3 503.8 2.5 2 53 Quesnel 30.8 1.0 752.3 12.9 613.1 8.7 560.3 8.0 0.0 0.0 2 53 Quesnel 30.8 0.4 661.0 4.3 395.0 1.52 53 McBride 4.43 McBride 2 53 Prince George 211.0 77.5 407.8 66.1 365.9 59.3 503.8 1.0 2 53 Prince George 211.0 2.6 796.7 5.4 613.1 3.4 560.3 3.2 0.0 0.0 2 53 Prince George 211.0 1.0 781.0 2.0 395.0 0.62 53 Prince George 316.00 Prince George 2 53 Prince George 5.0 204.6 407.8 7343.7 365.9 6590.5 503.8 111.2 2 53 Prince George 5.0 7.0 796.7 597.6 613.1 383.2 560.3 350.3 0.0 0.0 2 53 Prince George 5.0 2.6 781.0 221.9 395.0 64.52 53 Valemount 4.96 Valemount 2 53 Prince George 295.0 155.0 407.8 94.6 365.9 84.9 503.8 1.4 2 53 Prince George 295.0 5.3 796.7 7.7 613.1 4.9 560.3 4.5 0.0 0.0 2 53 Prince George 295.0 2.0 781.0 2.9 395.0 0.82 53 Fraser-Fort George A 1,379.17 Prince George 2 53 Prince George 10.5 19.5 407.8 334.9 365.9 300.6 503.8 5.1 2 53 Prince George 10.5 0.7 796.7 27.3 613.1 17.5 560.3 16.0 0.0 0.0 2 53 Prince George 10.5 0.3 781.0 10.1 395.0 2.92 53 Fraser-Fort George C 2,818.61 Prince George 2 53 Prince George 15.0 28.2 407.8 339.3 365.9 304.5 503.8 5.1 2 53 Prince George 15.0 1.0 796.7 27.6 613.1 17.7 560.3 16.2 0.0 0.0 2 53 Prince George 15.0 0.4 781.0 10.3 395.0 3.02 53 Fraser-Fort George D 669.19 Prince George 2 53 Prince George 7.3 18.1 407.8 446.5 365.9 400.7 503.8 6.8 2 53 Prince George 7.3 0.6 796.7 36.3 613.1 23.3 560.3 21.3 0.0 0.0 2 53 Prince George 7.3 0.2 781.0 13.5 395.0 3.92 53 Fraser-Fort George E 617.91 Prince George 2 53 Prince George 7.0 1.9 407.8 49.0 365.9 44.0 503.8 0.7 2 53 Prince George 7.0 0.1 796.7 4.0 613.1 2.6 560.3 2.3 0.0 0.0 2 53 Prince George 7.0 0.0 781.0 1.5 395.0 0.42 53 Fraser-Fort George F 12,541.44 Prince George 2 53 Prince George 31.6 22.3 407.8 127.0 365.9 114.0 503.8 1.9 2 53 Prince George 31.6 0.8 796.7 10.3 613.1 6.6 560.3 6.1 0.0 0.0 2 53 Prince George 31.6 0.3 781.0 3.8 395.0 1.12 53 Fraser-Fort George G 17,200.43 Mackenzie 2 53 Prince George 182.0 30.6 407.8 30.2 365.9 27.1 503.8 0.5 2 53 Prince George 182.0 1.0 796.7 2.5 613.1 1.6 560.3 1.4 0.0 0.0 2 53 Prince George 182.0 0.4 781.0 0.9 395.0 0.32 53 Fraser-Fort George H 14,978.96 McBride 2 53 Prince George 211.0 221.2 407.8 188.7 365.9 169.3 503.8 2.9 2 53 Prince George 211.0 7.6 796.7 15.4 613.1 9.8 560.3 9.0 0.0 0.0 2 53 Prince George 211.0 2.9 781.0 5.7 395.0 1.73 53 Mackenzie 159.09 Mackenzie 2 53 Prince George 182.0 1017.8 407.8 1006.5 365.9 903.3 503.8 15.2 2 53 Prince George 182.0 17.1 796.7 40.2 613.1 25.8 560.3 23.6 0.0 0.0 2 53 Prince George 182.0 6.8 781.0 15.6 395.0 4.53 55 Chetwynd 64.32 Chetwynd 3 55 Fort St. John 135.0 480.1 647.0 1015.7 541.1 849.5 503.8 9.7 3 55 Fort St. John 135.0 8.1 1,061.0 34.1 613.1 16.4 560.3 15.0 0.0 0.0 3 55 Fort St. John 135.0 3.2 820.5 10.4 669.4 4.93 55 Dawson Creek 22.32 Dawson Creek 3 55 Fort St. John 75.4 1123.6 647.0 4256.2 541.1 3559.7 503.8 40.6 3 55 Fort St. John 75.4 18.9 1,061.0 142.7 613.1 68.7 560.3 62.8 0.0 0.0 3 55 Fort St. John 75.4 7.5 820.5 43.6 669.4 20.53 55 Fort St. John 22.74 Fort St. John 3 55 Fort St. John 1.3 32.9 647.0 6978.6 541.1 5836.6 503.8 66.6 3 55 Fort St. John 1.3 0.6 1,061.0 234.1 613.1 112.7 560.3 103.0 0.0 0.0 3 55 Fort St. John 1.3 0.2 820.5 71.5 669.4 33.53 55 Hudson's Hope 869.43 Hudson's Hope 3 55 Fort St. John 88.0 117.3 647.0 380.6 541.1 318.3 503.8 3.6 3 55 Fort St. John 88.0 2.0 1,061.0 12.8 613.1 6.1 560.3 5.6 0.0 0.0 3 55 Fort St. John 88.0 0.8 820.5 3.9 669.4 1.83 55 Ingenika Point 5.43 Prince George 2 53 Prince George 0.7 0.0 407.8 0.0 365.9 0.0 503.8 0.0 2 53 Prince George 0.7 0.0 796.7 0.0 613.1 0.0 560.3 0.0 0.0 0.0 2 53 Prince George 0.7 0.0 781.0 0.0 395.0 0.03 55 Pouce Coupe 2.06 Pouce Coupe 3 55 Fort St. John 85.4 78.6 647.0 262.8 541.1 219.8 503.8 2.5 3 55 Fort St. John 85.4 1.3 1,061.0 8.8 613.1 4.2 560.3 3.9 0.0 0.0 3 55 Fort St. John 85.4 0.5 820.5 2.7 669.4 1.33 55 Taylor 16.61 Taylor 3 55 Fort St. John 17.3 35.9 647.0 593.1 541.1 496.0 503.8 5.7 3 55 Fort St. John 17.3 0.6 1,061.0 19.9 613.1 9.6 560.3 8.8 0.0 0.0 3 55 Fort St. John 17.3 0.2 820.5 6.1 669.4 2.83 55 Tumbler Ridge 1,574.45 Tumbler Ridge 3 55 Fort St. John 169.0 657.0 647.0 1110.4 541.1 928.7 503.8 10.6 3 55 Fort St. John 169.0 11.0 1,061.0 37.2 613.1 17.9 560.3 16.4 0.0 0.0 3 55 Fort St. John 169.0 4.4 820.5 11.4 669.4 5.33 55 Peace River B 86,211.91 Fort St. John 3 55 Fort St. John 82.8 652.6 647.0 2250.4 541.1 1882.1 503.8 21.5 3 55 Fort St. John 82.8 11.0 1,061.0 75.5 613.1 36.3 560.3 33.2 0.0 0.0 3 55 Fort St. John 82.8 4.3 820.5 23.1 669.4 10.83 55 Peace River C 582.49 Fort St. John 3 55 Fort St. John 6.8 61.0 647.0 2558.1 541.1 2139.5 503.8 24.4 3 55 Fort St. John 6.8 1.0 1,061.0 85.8 613.1 41.3 560.3 37.8 0.0 0.0 3 55 Fort St. John 6.8 0.4 820.5 26.2 669.4 12.33 55 Peace River D 11,670.10 Dawson Creek 3 55 Fort St. John 75.4 573.4 647.0 2172.0 541.1 1816.6 503.8 20.7 3 55 Fort St. John 75.4 9.6 1,061.0 72.8 613.1 35.1 560.3 32.1 0.0 0.0 3 55 Fort St. John 75.4 3.8 820.5 22.3 669.4 10.43 55 Peace River E 16,593.72 Dawson Creek 3 55 Fort St. John 75.4 299.2 647.0 1133.2 541.1 947.8 503.8 10.8 3 55 Fort St. John 75.4 5.0 1,061.0 38.0 613.1 18.3 560.3 16.7 0.0 0.0 3 55 Fort St. John 75.4 2.0 820.5 11.6 669.4 5.4
Used OilRegistered Collector
Oil ContainersPlastics Manufacturer
Oil FiltersPulp Mills & Asphalt PlantsRegistered Processor Registered ProcessorRail Travel Registered Processor Incinerator Registered CollectorRegistered Collector Steel Broker Steel Mill
CRA 071620 (2)

TABLE 3.3
PROJECT - DESTINATION DISTANCES2009 GREENHOUSE GAS SAVINGS STUDY
BCUOMA
Page 2 of 6
BCUOMA Regional 2006 Area Generator Distance Diesel Distance Diesel Distance Diesel Distance Diesel Distance Diesel Distance Diesel Distance Diesel Distance Diesel Distance Diesel Distance Diesel Distance Diesel Distance Diesel
Zone District (1) Name km 2 Location (2) Zone RD Location (3) (km) (4)Consumed
(L) (km) (5)Consumed
(L) (km) (5) Consumed (L) (km) (5)Consumed
(L) Zone RD Location (3) (km) (4)Consumed
(L) (km) (5)Consumed
(L) (km) (5)Consumed
(L) (km) (5)Consumed
(L) (km) (5)Consumed
(L) Zone RD Location (3) (km) (4)Consumed
(L) (km) (5)Consumed
(L) (km) (5)Consumed
(L)
Used OilRegistered Collector
Oil ContainersPlastics Manufacturer
Oil FiltersPulp Mills & Asphalt PlantsRegistered Processor Registered ProcessorRail Travel Registered Processor Incinerator Registered CollectorRegistered Collector Steel Broker Steel Mill
4 9 Fraser Valley A 2,335.28 Lytton 4 33 Kamloops 169.0 25.8 195.0 13.1 260.7 17.6 503.8 0.4 4 33 Kamloops 169.0 0.9 555.8 1.7 611.1 1.5 560.3 1.4 0.0 0.0 4 33 Kamloops 169.0 0.3 505.7 0.5 520.5 0.34 41 100 Mile House 51.34 100 Mile House 2 53 Prince George 332.0 239.4 407.8 129.8 365.9 116.5 503.8 2.0 2 53 Prince George 332.0 8.7 796.7 11.2 613.1 7.2 560.3 6.6 0.0 0.0 2 53 Prince George 332.0 2.7 781.0 3.4 395.0 1.04 41 Williams Lake 33.11 Williams Lake 2 53 Prince George 242.0 926.7 407.8 689.3 365.9 618.6 503.8 10.4 2 53 Prince George 242.0 33.7 796.7 59.7 613.1 38.3 560.3 35.0 0.0 0.0 2 53 Prince George 242.0 10.5 781.0 18.2 395.0 5.34 41 Cariboo D 856.15 Williams Lake 2 53 Prince George 242.0 259.9 407.8 193.3 365.9 173.5 503.8 2.9 2 53 Prince George 242.0 9.5 796.7 16.7 613.1 10.7 560.3 9.8 0.0 0.0 2 53 Prince George 242.0 2.9 781.0 5.1 395.0 1.54 41 Cariboo E 1,744.06 Williams Lake 2 53 Prince George 242.0 365.9 407.8 272.2 365.9 244.2 503.8 4.1 2 53 Prince George 242.0 13.3 796.7 23.6 613.1 15.1 560.3 13.8 0.0 0.0 2 53 Prince George 242.0 4.1 781.0 7.2 395.0 2.14 41 Cariboo F 9,775.63 Williams Lake 2 53 Prince George 242.0 359.1 407.8 267.1 365.9 239.7 503.8 4.0 2 53 Prince George 242.0 13.1 796.7 23.1 613.1 14.8 560.3 13.5 0.0 0.0 2 53 Prince George 242.0 4.1 781.0 7.0 395.0 2.04 41 Cariboo G 2,678.81 100 Mile House 2 53 Prince George 332.0 600.0 407.8 325.3 365.9 291.9 503.8 4.9 2 53 Prince George 332.0 21.8 796.7 28.2 613.1 18.1 560.3 16.5 0.0 0.0 2 53 Prince George 332.0 6.8 781.0 8.6 395.0 2.54 41 Cariboo H 2,603.71 100 Mile House 2 53 Prince George 332.0 204.8 407.8 111.0 365.9 99.6 503.8 1.7 2 53 Prince George 332.0 7.4 796.7 9.6 613.1 6.2 560.3 5.6 0.0 0.0 2 53 Prince George 332.0 2.3 781.0 2.9 395.0 0.94 41 Cariboo K 13,650.75 Williams Lake 2 53 Prince George 242.0 43.2 407.8 32.1 365.9 28.8 503.8 0.5 2 53 Prince George 242.0 1.6 796.7 2.8 613.1 1.8 560.3 1.6 0.0 0.0 2 53 Prince George 242.0 0.5 781.0 0.8 395.0 0.24 41 Cariboo L 1,268.42 100 Mile House 2 53 Prince George 332.0 526.9 407.8 285.6 365.9 256.3 503.8 4.3 2 53 Prince George 332.0 19.2 796.7 24.7 613.1 15.9 560.3 14.5 0.0 0.0 2 53 Prince George 332.0 6.0 781.0 7.5 395.0 2.24 35 Kelowna 211.69 Kelowna 4 35 Kelowna 4.1 169.8 214.4 3914.3 289.0 5276.8 503.8 112.7 4 35 Kelowna 4.1 6.2 604.9 489.4 611.1 412.0 560.3 377.7 0.0 0.0 4 35 Kelowna 4.1 1.9 552.8 139.1 520.5 75.24 35 Lake Country 122.16 Lake Country 4 35 Winfield 8.2 29.3 224.7 354.8 288.4 455.5 503.8 9.7 4 35 Winfield 8.2 1.1 611.7 42.8 611.1 35.6 560.3 32.7 0.0 0.0 4 35 Winfield 8.2 0.3 565.7 12.3 520.5 6.54 35 Peachland 15.98 Peachland 4 35 Kelowna 28.2 51.7 214.4 173.3 289.0 233.7 503.8 5.0 4 35 Kelowna 28.2 1.9 604.9 21.7 611.1 18.2 560.3 16.7 0.0 0.0 4 35 Kelowna 28.2 0.6 552.8 6.2 520.5 3.34 35 Central Okanagan 1,244.16 Kelowna 4 35 Kelowna 10.0 15.1 214.4 143.9 289.0 194.1 503.8 4.1 4 35 Kelowna 10.0 0.6 604.9 18.0 611.1 15.1 560.3 13.9 0.0 0.0 4 35 Kelowna 10.0 0.2 552.8 5.1 520.5 2.84 35 Central Okanagan J 1,297.81 Kelowna 4 35 Kelowna 10.2 114.5 214.4 1066.3 289.0 1437.4 503.8 30.7 4 35 Kelowna 10.2 4.2 604.9 133.3 611.1 112.2 560.3 102.9 0.0 0.0 4 35 Kelowna 10.2 1.3 552.8 37.9 520.5 20.54 39 Salmon Arm 155.36 Salmon Arm 4 33 Kamloops 110.0 662.1 195.0 518.1 260.7 692.8 503.8 16.4 4 33 Kamloops 110.0 24.1 555.8 65.4 611.1 59.9 560.3 55.0 0.0 0.0 4 33 Kamloops 110.0 7.5 505.7 18.5 520.5 10.94 39 Sicamous 14.68 Sicamous 4 33 Kamloops 150.0 144.9 195.0 83.1 260.7 111.2 503.8 2.6 4 33 Kamloops 150.0 5.3 555.8 10.5 611.1 9.6 560.3 8.8 0.0 0.0 4 33 Kamloops 150.0 1.6 505.7 3.0 520.5 1.84 39 Columbia-Shuswap C 506.33 Salmon Arm 4 33 Kamloops 110.0 333.4 195.0 260.9 260.7 348.9 503.8 8.3 4 33 Kamloops 110.0 12.1 555.8 32.9 611.1 30.2 560.3 27.7 0.0 0.0 4 33 Kamloops 110.0 3.8 505.7 9.3 520.5 5.54 39 Columbia-Shuswap D 694.53 Salmon Arm 4 33 Kamloops 110.0 156.2 195.0 122.2 260.7 163.5 503.8 3.9 4 33 Kamloops 110.0 5.7 555.8 15.4 611.1 14.1 560.3 13.0 0.0 0.0 4 33 Kamloops 110.0 1.8 505.7 4.4 520.5 2.64 39 Columbia-Shuswap E 1,542.18 Sicamous 4 33 Kamloops 150.0 84.8 195.0 48.6 260.7 65.1 503.8 1.5 4 33 Kamloops 150.0 3.1 555.8 6.1 611.1 5.6 560.3 5.2 0.0 0.0 4 33 Kamloops 150.0 1.0 505.7 1.7 520.5 1.04 39 Columbia-Shuswap F 2,662.29 Chase 4 33 Kamloops 58.2 67.3 195.0 99.6 260.7 133.2 503.8 3.2 4 33 Kamloops 58.2 2.4 555.8 12.6 611.1 11.5 560.3 10.6 0.0 0.0 4 33 Kamloops 58.2 0.8 505.7 3.6 520.5 2.14 37 Armstrong 5.24 Armstrong 4 35 Winfield 54.5 84.1 224.7 153.0 288.4 196.4 503.8 4.2 4 35 Winfield 54.5 3.1 611.7 18.5 611.1 15.4 560.3 14.1 0.0 0.0 4 35 Winfield 54.5 1.0 565.7 5.3 520.5 2.84 37 Coldstream 67.25 Coldstream 4 35 Winfield 33.5 118.4 224.7 350.6 288.4 450.1 503.8 9.6 4 35 Winfield 33.5 4.3 611.7 42.3 611.1 35.2 560.3 32.3 0.0 0.0 4 35 Winfield 33.5 1.3 565.7 12.2 520.5 6.44 37 Enderby 4.23 Enderby 4 33 Winfield 67.3 69.5 224.7 102.5 288.4 131.5 503.8 2.8 4 33 Winfield 67.3 2.5 611.7 12.4 611.1 10.3 560.3 9.4 0.0 0.0 4 33 Winfield 67.3 0.8 565.7 3.6 520.5 1.94 37 Lumby 5.27 Lumby 4 35 Winfield 54.6 32.7 224.7 59.4 288.4 76.3 503.8 1.6 4 35 Winfield 54.6 1.2 611.7 7.2 611.1 6.0 560.3 5.5 0.0 0.0 4 35 Winfield 54.6 0.4 565.7 2.1 520.5 1.14 37 Spallumcheen 254.90 Spallumcheen 4 35 Winfield 53.4 94.6 224.7 175.6 288.4 225.5 503.8 4.8 4 35 Winfield 53.4 3.4 611.7 21.2 611.1 17.6 560.3 16.2 0.0 0.0 4 35 Winfield 53.4 1.1 565.7 6.1 520.5 3.24 37 Vernon 94.20 Vernon 4 35 Winfield 31.3 427.5 224.7 1354.5 288.4 1738.9 503.8 37.2 4 35 Winfield 31.3 15.6 611.7 163.4 611.1 136.0 560.3 124.7 0.0 0.0 4 35 Winfield 31.3 4.8 565.7 47.0 520.5 24.84 37 North Okanagan B 489.15 Vernon 4 35 Winfield 31.3 37.9 224.7 120.1 288.4 154.2 503.8 3.3 4 35 Winfield 31.3 1.4 611.7 14.5 611.1 12.1 560.3 11.1 0.0 0.0 4 35 Winfield 31.3 0.4 565.7 4.2 520.5 2.24 37 North Okanagan C 301.12 Vernon 4 35 Winfield 31.3 47.5 224.7 150.5 288.4 193.2 503.8 4.1 4 35 Winfield 31.3 1.7 611.7 18.2 611.1 15.1 560.3 13.9 0.0 0.0 4 35 Winfield 31.3 0.5 565.7 5.2 520.5 2.84 37 North Okanagan D 1,797.09 Vernon 4 35 Winfield 31.3 32.3 224.7 102.5 288.4 131.6 503.8 2.8 4 35 Winfield 31.3 1.2 611.7 12.4 611.1 10.3 560.3 9.4 0.0 0.0 4 35 Winfield 31.3 0.4 565.7 3.6 520.5 1.94 37 North Okanagan F 1,766.90 Vernon 4 35 Winfield 31.3 48.4 224.7 153.3 288.4 196.8 503.8 4.2 4 35 Winfield 31.3 1.8 611.7 18.5 611.1 15.4 560.3 14.1 0.0 0.0 4 35 Winfield 31.3 0.5 565.7 5.3 520.5 2.84 7 Keremeos 2.11 Keremeos 4 35 Kelowna 115.0 56.5 214.4 46.5 289.0 62.7 503.8 1.3 4 35 Kelowna 115.0 2.1 604.9 5.8 611.1 4.9 560.3 4.5 0.0 0.0 4 35 Kelowna 115.0 0.6 552.8 1.7 520.5 0.94 7 Oliver 4.95 Oliver 4 35 Kelowna 110.0 178.8 214.4 153.8 289.0 207.4 503.8 4.4 4 35 Kelowna 110.0 6.5 604.9 19.2 611.1 16.2 560.3 14.8 0.0 0.0 4 35 Kelowna 110.0 2.0 552.8 5.5 520.5 3.04 7 Osoyoos 8.76 Osoyoos 4 35 Kelowna 131.0 241.1 214.4 174.1 289.0 234.8 503.8 5.0 4 35 Kelowna 131.0 8.8 604.9 21.8 611.1 18.3 560.3 16.8 0.0 0.0 4 35 Kelowna 131.0 2.7 552.8 6.2 520.5 3.34 7 Penticton 42.02 Penticton 4 35 Kelowna 72.0 852.3 214.4 1120.1 289.0 1510.0 503.8 32.3 4 35 Kelowna 72.0 31.0 604.9 140.0 611.1 117.9 560.3 108.1 0.0 0.0 4 35 Kelowna 72.0 9.6 552.8 39.8 520.5 21.54 7 Princeton 10.25 Princeton 4 35 Kelowna 165.0 163.5 214.4 93.7 289.0 126.4 503.8 2.7 4 35 Kelowna 165.0 5.9 604.9 11.7 611.1 9.9 560.3 9.0 0.0 0.0 4 35 Kelowna 165.0 1.8 552.8 3.3 520.5 1.84 7 Summerland 73.88 Summerland 4 35 Kelowna 49.1 194.9 214.4 375.6 289.0 506.4 503.8 10.8 4 35 Kelowna 49.1 7.1 604.9 47.0 611.1 39.5 560.3 36.3 0.0 0.0 4 35 Kelowna 49.1 2.2 552.8 13.3 520.5 7.24 7 Okanagan-Similkameen A 259.39 Osoyoos 4 35 Kelowna 131.0 92.4 214.4 66.8 289.0 90.0 503.8 1.9 4 35 Kelowna 131.0 3.4 604.9 8.3 611.1 7.0 560.3 6.4 0.0 0.0 4 35 Kelowna 131.0 1.0 552.8 2.4 520.5 1.34 7 Okanagan-Similkameen B 238.75 Keremeos 4 35 Kelowna 115.0 44.4 214.4 36.5 289.0 49.2 503.8 1.1 4 35 Kelowna 115.0 1.6 604.9 4.6 611.1 3.8 560.3 3.5 0.0 0.0 4 35 Kelowna 115.0 0.5 552.8 1.3 520.5 0.74 7 Okanagan-Similkameen C 444.10 Oliver 4 35 Kelowna 110.0 150.5 214.4 129.5 289.0 174.5 503.8 3.7 4 35 Kelowna 110.0 5.5 604.9 16.2 611.1 13.6 560.3 12.5 0.0 0.0 4 35 Kelowna 110.0 1.7 552.8 4.6 520.5 2.54 7 Okanagan-Similkameen D 916.99 Penticton 4 35 Kelowna 72.0 158.6 214.4 208.4 289.0 281.0 503.8 6.0 4 35 Kelowna 72.0 5.8 604.9 26.1 611.1 21.9 560.3 20.1 0.0 0.0 4 35 Kelowna 72.0 1.8 552.8 7.4 520.5 4.04 7 Okanagan-Similkameen E 491.13 Penticton 4 35 Kelowna 72.0 53.0 214.4 69.6 289.0 93.8 503.8 2.0 4 35 Kelowna 72.0 1.9 604.9 8.7 611.1 7.3 560.3 6.7 0.0 0.0 4 35 Kelowna 72.0 0.6 552.8 2.5 520.5 1.34 7 Okanagan-Similkameen F 568.12 Penticton 4 35 Kelowna 72.0 53.3 214.4 70.0 289.0 94.4 503.8 2.0 4 35 Kelowna 72.0 1.9 604.9 8.8 611.1 7.4 560.3 6.8 0.0 0.0 4 35 Kelowna 72.0 0.6 552.8 2.5 520.5 1.34 7 Okanagan-Similkameen G 2,119.89 Keremeos 4 35 Kelowna 115.0 103.8 214.4 85.4 289.0 115.2 503.8 2.5 4 35 Kelowna 115.0 3.8 604.9 10.7 611.1 9.0 560.3 8.2 0.0 0.0 4 35 Kelowna 115.0 1.2 552.8 3.0 520.5 1.64 7 Okanagan-Similkameen H 4,815.07 Keremeos 4 35 Kelowna 115.0 99.1 214.4 81.6 289.0 110.0 503.8 2.3 4 35 Kelowna 115.0 3.6 604.9 10.2 611.1 8.6 560.3 7.9 0.0 0.0 4 35 Kelowna 115.0 1.1 552.8 2.9 520.5 1.64 31 Lillooet 27.83 Lillooet 4 33 Kamloops 166.0 127.4 195.0 66.0 260.7 88.3 503.8 2.1 4 33 Kamloops 166.0 4.6 555.8 8.3 611.1 7.6 560.3 7.0 0.0 0.0 4 33 Kamloops 166.0 1.4 505.7 2.4 520.5 1.44 31 Pemberton 4.45 Pemberton 1 15 North Vancouver 156.0 148.2 5.9 2.5 240.3 100.8 503.8 2.6 1 15 Burnaby 172.0 5.9 209.1 3.9 583.5 9.0 560.3 8.7 0.2 0.0 1 15 Burnaby 172.0 1.8 2.1 0.0 397.6 1.34 31 Squamish 106.11 Squamish 1 15 North Vancouver 67.3 377.4 5.9 14.6 240.3 594.9 503.8 15.3 1 15 Burnaby 83.3 17.0 209.1 22.9 583.5 53.3 560.3 51.2 0.2 0.0 1 28 Burnaby 83.3 5.3 2.1 0.1 397.6 7.84 31 Whistler 161.71 Whistler 1 15 North Vancouver 124.0 427.8 5.9 9.0 240.3 366.0 503.8 9.4 1 15 Burnaby 140.0 17.6 209.1 14.1 583.5 32.8 560.3 31.5 0.2 0.0 1 28 Burnaby 140.0 5.5 2.1 0.0 397.6 4.84 31 Squamish-Lillooet A 3,726.67 Lillooet 4 33 Kamloops 166.0 12.0 195.0 6.2 260.7 8.3 503.8 0.2 4 33 Kamloops 166.0 0.4 555.8 0.8 611.1 0.7 560.3 0.7 0.0 0.0 4 28 Kamloops 166.0 0.1 505.7 0.2 520.5 0.14 31 Squamish-Lillooet B 3,460.19 Lillooet 4 33 Kamloops 166.0 41.8 195.0 21.7 260.7 29.0 503.8 0.7 4 33 Kamloops 166.0 1.5 555.8 2.7 611.1 2.5 560.3 2.3 0.0 0.0 4 28 Kamloops 166.0 0.5 505.7 0.8 520.5 0.54 31 Squamish-Lillooet C 5,606.94 Pemberton 1 15 North Vancouver 156.0 123.2 5.9 2.1 240.3 83.8 503.8 2.2 1 15 Burnaby 172.0 4.9 209.1 3.2 583.5 7.5 560.3 7.2 0.2 0.0 1 15 Burnaby 172.0 1.5 2.1 0.0 397.6 1.14 31 Squamish-Lillooet D 3,117.56 Squamish 1 15 North Vancouver 67.3 22.0 5.9 0.9 240.3 34.7 503.8 0.9 1 15 Burnaby 83.3 1.0 209.1 1.3 583.5 3.1 560.3 3.0 0.2 0.0 1 15 Burnaby 83.3 0.3 2.1 0.0 397.6 0.54 29 Gibsons 4.33 Roberts Creek 1 15 North Vancouver 43.1 68.4 5.9 4.1 240.3 168.5 503.8 4.3 1 15 Burnaby 60.7 3.5 209.1 6.5 583.5 15.1 560.3 14.5 0.2 0.0 1 15 Burnaby 60.7 1.1 2.1 0.0 397.6 2.24 29 Sechelt 39.71 Roberts Creek 1 15 North Vancouver 59.1 191.5 5.9 8.5 240.3 343.7 503.8 8.8 1 15 Burnaby 75.1 8.9 209.1 13.2 583.5 30.8 560.3 29.6 0.2 0.0 1 15 Burnaby 75.1 2.8 2.1 0.0 397.6 4.54 29 Sechelt (Part) 10.71 Roberts Creek 1 15 North Vancouver 59.1 18.2 5.9 0.8 240.3 32.7 503.8 0.8 1 15 Burnaby 75.1 0.8 209.1 1.3 583.5 2.9 560.3 2.8 0.2 0.0 1 15 Burnaby 75.1 0.3 2.1 0.0 397.6 0.44 29 Sunshine Coast A 1,901.61 Roberts Creek 1 15 North Vancouver 59.1 60.0 5.9 2.7 240.3 107.7 503.8 2.8 1 15 Burnaby 75.1 2.8 209.1 4.2 583.5 9.7 560.3 9.3 0.2 0.0 1 15 Burnaby 75.1 0.9 2.1 0.0 397.6 1.44 29 Sunshine Coast B 1,275.86 Roberts Creek 1 15 North Vancouver 59.1 57.9 5.9 2.6 240.3 104.0 503.8 2.7 1 15 Burnaby 75.1 2.7 209.1 4.0 583.5 9.3 560.3 9.0 0.2 0.0 1 15 Burnaby 75.1 0.8 2.1 0.0 397.6 1.44 29 Sunshine Coast D 143.59 Roberts Creek 1 15 North Vancouver 59.1 74.2 5.9 3.3 240.3 133.2 503.8 3.4 1 15 Burnaby 75.1 3.4 209.1 5.1 583.5 11.9 560.3 11.5 0.2 0.0 1 15 Burnaby 75.1 1.1 2.1 0.0 397.6 1.74 29 Sunshine Coast E 21.32 Roberts Creek 1 15 North Vancouver 59.1 79.8 5.9 3.5 240.3 143.3 503.8 3.7 1 15 Burnaby 75.1 3.7 209.1 5.5 583.5 12.8 560.3 12.3 0.2 0.0 1 15 Burnaby 75.1 1.1 2.1 0.0 397.6 1.94 29 Sunshine Coast F 380.82 Roberts Creek 1 15 North Vancouver 59.1 51.9 5.9 2.3 240.3 93.2 503.8 2.4 1 15 Burnaby 75.1 2.4 209.1 3.6 583.5 8.4 560.3 8.0 0.2 0.0 1 15 Burnaby 75.1 0.7 2.1 0.0 397.6 1.24 33 Ashcroft 51.45 Ashcroft 4 33 Kamloops 100.0 57.6 195.0 49.6 260.7 66.3 503.8 1.6 4 33 Kamloops 100.0 2.1 555.8 6.3 611.1 5.7 560.3 5.3 0.0 0.0 4 33 Kamloops 100.0 0.7 505.7 1.8 520.5 1.04 33 Cache Creek 10.57 Cache Creek 4 33 Kamloops 84.0 31.4 195.0 32.2 260.7 43.0 503.8 1.0 4 33 Kamloops 84.0 1.1 555.8 4.1 611.1 3.7 560.3 3.4 0.0 0.0 4 33 Kamloops 84.0 0.4 505.7 1.1 520.5 0.74 33 Chase 3.75 Chase 4 33 Kamloops 58.2 50.3 195.0 74.5 260.7 99.6 503.8 2.4 4 33 Kamloops 58.2 1.8 555.8 9.4 611.1 8.6 560.3 7.9 0.0 0.0 4 33 Kamloops 58.2 0.6 505.7 2.7 520.5 1.64 33 Clinton 4.36 Clinton 4 33 Kamloops 124.0 24.8 195.0 17.2 260.7 23.0 503.8 0.5 4 33 Kamloops 124.0 0.9 555.8 2.2 611.1 2.0 560.3 1.8 0.0 0.0 4 33 Kamloops 124.0 0.3 505.7 0.6 520.5 0.44 33 Kamloops 297.30 Kamloops 4 33 Kamloops 4.9 145.9 195.0 2581.8 260.7 3452.6 503.8 81.7 4 33 Kamloops 4.9 5.3 555.8 326.0 611.1 298.7 560.3 273.9 0.0 0.0 4 33 Kamloops 4.9 1.6 505.7 92.3 520.5 54.54 33 Logan Lake 325.40 Logan Lake 4 33 Kamloops 58.0 45.4 195.0 67.4 260.7 90.1 503.8 2.1 4 33 Kamloops 58.0 1.7 555.8 8.5 611.1 7.8 560.3 7.2 0.0 0.0 4 33 Kamloops 58.0 0.5 505.7 2.4 520.5 1.44 33 Lytton 6.71 Lytton 4 33 Kamloops 169.0 12.1 195.0 6.1 260.7 8.2 503.8 0.2 4 33 Kamloops 169.0 0.4 555.8 0.8 611.1 0.7 560.3 0.7 0.0 0.0 4 33 Kamloops 169.0 0.1 505.7 0.2 520.5 0.14 33 Merritt 24.94 Merritt 4 33 Kamloops 93.3 236.2 195.0 217.9 260.7 291.4 503.8 6.9 4 33 Kamloops 93.3 8.6 555.8 27.5 611.1 25.2 560.3 23.1 0.0 0.0 4 33 Kamloops 93.3 2.7 505.7 7.8 520.5 4.6
CRA 071620 (2)

TABLE 3.3
PROJECT - DESTINATION DISTANCES2009 GREENHOUSE GAS SAVINGS STUDY
BCUOMA
Page 3 of 6
BCUOMA Regional 2006 Area Generator Distance Diesel Distance Diesel Distance Diesel Distance Diesel Distance Diesel Distance Diesel Distance Diesel Distance Diesel Distance Diesel Distance Diesel Distance Diesel Distance Diesel
Zone District (1) Name km 2 Location (2) Zone RD Location (3) (km) (4)Consumed
(L) (km) (5)Consumed
(L) (km) (5) Consumed (L) (km) (5)Consumed
(L) Zone RD Location (3) (km) (4)Consumed
(L) (km) (5)Consumed
(L) (km) (5)Consumed
(L) (km) (5)Consumed
(L) (km) (5)Consumed
(L) Zone RD Location (3) (km) (4)Consumed
(L) (km) (5)Consumed
(L) (km) (5)Consumed
(L)
Used OilRegistered Collector
Oil ContainersPlastics Manufacturer
Oil FiltersPulp Mills & Asphalt PlantsRegistered Processor Registered ProcessorRail Travel Registered Processor Incinerator Registered CollectorRegistered Collector Steel Broker Steel Mill
4 33 Thompson-Nicola A 7,165.26 Kamloops 4 33 Kamloops 23.9 31.5 195.0 113.7 260.7 152.0 503.8 3.6 4 33 Kamloops 23.9 1.1 555.8 14.4 611.1 13.2 560.3 12.1 0.0 0.0 4 33 Kamloops 23.9 0.4 505.7 4.1 520.5 2.44 33 Thompson-Nicola B 5,137.36 Kamloops 4 33 Kamloops 20.2 1.6 195.0 7.0 260.7 9.4 503.8 0.2 4 33 Kamloops 20.2 0.1 555.8 0.9 611.1 0.8 560.3 0.7 0.0 0.0 4 33 Kamloops 20.2 0.0 505.7 0.2 520.5 0.14 33 Thompson-Nicola E 6,654.33 Ashcroft 4 33 Kamloops 100.0 53.7 195.0 46.2 260.7 61.8 503.8 1.5 4 33 Kamloops 100.0 2.0 555.8 5.8 611.1 5.3 560.3 4.9 0.0 0.0 4 33 Kamloops 100.0 0.6 505.7 1.7 520.5 1.04 33 Thompson-Nicola I 5,740.21 Logan Lake 4 33 Kamloops 58.0 28.5 195.0 42.3 260.7 56.5 503.8 1.3 4 33 Kamloops 58.0 1.0 555.8 5.3 611.1 4.9 560.3 4.5 0.0 0.0 4 33 Kamloops 58.0 0.3 505.7 1.5 520.5 0.94 33 Thompson-Nicola J 3,297.75 Kamloops 4 33 Kamloops 16.2 9.9 195.0 52.5 260.7 70.2 503.8 1.7 4 33 Kamloops 16.2 0.4 555.8 6.6 611.1 6.1 560.3 5.6 0.0 0.0 4 33 Kamloops 16.2 0.1 505.7 1.9 520.5 1.14 33 Thompson-Nicola L 1,912.79 Kamloops 4 33 Kamloops 12.3 13.7 195.0 95.9 260.7 128.2 503.8 3.0 4 33 Kamloops 12.3 0.5 555.8 12.1 611.1 11.1 560.3 10.2 0.0 0.0 4 33 Kamloops 12.3 0.2 505.7 3.4 520.5 2.04 33 Thompson-Nicola M 3,837.02 Merritt 4 33 Kamloops 93.3 61.2 195.0 56.5 260.7 75.5 503.8 1.8 4 33 Kamloops 93.3 2.2 555.8 7.1 611.1 6.5 560.3 6.0 0.0 0.0 4 33 Kamloops 93.3 0.7 505.7 2.0 520.5 1.24 33 Thompson-Nicola N 2,346.04 Merritt 4 33 Kamloops 93.3 31.6 195.0 29.2 260.7 39.0 503.8 0.9 4 33 Kamloops 93.3 1.2 555.8 3.7 611.1 3.4 560.3 3.1 0.0 0.0 4 33 Kamloops 93.3 0.4 505.7 1.0 520.5 0.64 33 Thompson-Nicola O 5,420.16 Kamloops 4 33 Kamloops 20.8 21.4 195.0 88.5 260.7 118.4 503.8 2.8 4 33 Kamloops 20.8 0.8 555.8 11.2 611.1 10.2 560.3 9.4 0.0 0.0 4 33 Kamloops 20.8 0.2 505.7 3.2 520.5 1.94 33 Thompson-Nicola P 1,591.67 Kamloops 4 33 Kamloops 11.3 17.7 195.0 135.0 260.7 180.5 503.8 4.3 4 33 Kamloops 11.3 0.6 555.8 17.0 611.1 15.6 560.3 14.3 0.0 0.0 4 33 Kamloops 11.3 0.2 505.7 4.8 520.5 2.95 49 New Aiyansh 2.64 New Aiyansh 2 53 Prince George 616.0 2365.3 407.8 691.1 365.9 620.2 503.8 10.5 2 53 Prince George 616.0 34.9 796.7 24.3 613.1 15.6 560.3 14.2 0.0 0.0 2 53 Prince George 616.0 6.6 781.0 4.5 395.0 1.35 49 Stewart 571.50 Stewart 2 53 Prince George 695.0 1287.5 407.8 333.4 365.9 299.2 503.8 5.0 2 53 Prince George 695.0 19.0 796.7 11.7 613.1 7.5 560.3 6.9 0.0 0.0 2 53 Prince George 695.0 3.6 781.0 2.2 395.0 0.65 49 Kitimat-Stikine A 25,398.73 Stewart 2 53 Prince George 695.0 101.0 407.8 26.2 365.9 23.5 503.8 0.4 2 53 Prince George 695.0 1.5 796.7 0.9 613.1 0.6 560.3 0.5 0.0 0.0 2 53 Prince George 695.0 0.3 781.0 0.2 395.0 0.05 49 Kitimat-Stikine D 28,288.47 Stewart 2 53 Prince George 695.0 286.3 407.8 74.2 365.9 66.5 503.8 1.1 2 53 Prince George 695.0 4.2 796.7 2.6 613.1 1.7 560.3 1.5 0.0 0.0 2 53 Prince George 695.0 0.8 781.0 0.5 395.0 0.15 59 Fort Nelson 13.26 Fort Nelson 3 59 Fort St. John 380.0 7961.4 647.0 5983.7 541.1 5004.6 503.8 57.1 3 59 Fort St. John 380.0 117.6 1,061.0 176.5 613.1 85.0 560.3 77.7 0.0 0.0 3 59 Fort St. John 380.0 22.1 820.5 25.7 669.4 12.05 59 Northern Rockies A 50,349.58 Fort Nelson 3 59 Fort St. John 380.0 1980.1 647.0 1488.2 541.1 1244.7 503.8 14.2 3 59 Fort St. John 380.0 29.2 1,061.0 43.9 613.1 21.1 560.3 19.3 0.0 0.0 3 59 Fort St. John 380.0 5.5 820.5 6.4 669.4 3.05 59 Northern Rockies B 34,693.45 Fort Nelson 3 59 Fort St. John 380.0 193.5 647.0 145.5 541.1 121.7 503.8 1.4 3 59 Fort St. John 380.0 2.9 1,061.0 4.3 613.1 2.1 560.3 1.9 0.0 0.0 3 59 Fort St. John 380.0 0.5 820.5 0.6 669.4 0.35 57 Good Hope Lake 0.65 Terrace 2 53 Prince George 1119.0 95.3 407.8 15.3 365.9 13.8 503.8 0.2 2 53 Prince George 1119.0 1.4 796.7 0.5 613.1 0.3 560.3 0.3 0.0 0.0 2 53 Prince George 1119.0 0.3 781.0 0.1 395.0 0.05 57 Lower Post 0.18 Lower Post 2 59 Fort St. John 874.0 1012.2 647.0 330.8 541.1 276.6 503.8 3.2 2 59 Fort St. John 874.0 14.9 1,061.0 9.8 613.1 4.7 560.3 4.3 0.0 0.0 2 59 Fort St. John 874.0 2.8 1217.0 2.1 395.0 0.45 57 Stikine Region 132,456.37 Smithers 2 53 Prince George 371.0 706.9 407.8 343.0 365.9 307.8 503.8 5.2 2 53 Prince George 371.0 10.4 796.7 12.1 613.1 7.7 560.3 7.1 0.0 0.0 2 53 Prince George 371.0 2.0 781.0 2.2 395.0 0.66 3 Castlegar 19.80 Castlegar 6 1 Cranbrook 230.0 678.9 463.2 603.5 344.7 449.1 503.8 8.0 6 1 Cranbrook 230.0 26.6 844.0 52.5 613.1 31.8 560.3 29.0 0.0 0.0 6 1 Cranbrook 230.0 7.0 670.0 10.9 770.8 7.26 3 Creston 8.48 Creston 6 1 Cranbrook 109.0 220.5 463.2 413.6 344.7 307.8 503.8 5.5 6 1 Cranbrook 109.0 8.6 844.0 36.0 613.1 21.8 560.3 19.9 0.0 0.0 6 1 Cranbrook 109.0 2.3 670.0 7.5 770.8 5.06 3 Kaslo 2.80 Kaslo 6 1 Cranbrook 230.0 105.3 463.2 93.6 344.7 69.7 503.8 1.2 6 1 Cranbrook 230.0 4.1 844.0 8.1 613.1 4.9 560.3 4.5 0.0 0.0 6 1 Cranbrook 230.0 1.1 670.0 1.7 770.8 1.16 3 Nakusp 8.00 Nakusp 6 1 Winfield 222.0 132.4 224.7 59.1 288.4 75.9 503.8 1.6 6 1 Winfield 222.0 5.2 619.7 7.8 613.1 6.4 560.3 5.9 0.0 0.0 6 1 Winfield 222.0 1.4 886.0 2.9 770.8 1.56 3 Nelson 11.72 Nelson 6 1 Cranbrook 233.0 897.1 463.2 787.3 344.7 585.8 503.8 10.5 6 1 Cranbrook 233.0 35.1 844.0 68.4 613.1 41.4 560.3 37.9 0.0 0.0 6 1 Cranbrook 233.0 9.2 670.0 14.3 770.8 9.46 3 New Denver 1.10 New Denver 6 1 Winfield 267.0 55.4 224.7 20.6 288.4 26.4 503.8 0.6 6 1 Winfield 267.0 2.2 619.7 2.7 613.1 2.2 560.3 2.0 0.0 0.0 6 1 Winfield 267.0 0.6 886.0 1.0 770.8 0.56 3 Salmo 2.38 Salmo 6 1 Cranbrook 189.0 74.5 463.2 80.6 344.7 60.0 503.8 1.1 6 1 Cranbrook 189.0 2.9 844.0 7.0 613.1 4.2 560.3 3.9 0.0 0.0 6 1 Cranbrook 189.0 0.8 670.0 1.5 770.8 1.06 3 Silverton 0.44 Silverton 6 1 Winfield 272.0 18.8 224.7 6.9 288.4 8.8 503.8 0.2 6 1 Winfield 272.0 0.7 619.7 0.9 613.1 0.7 560.3 0.7 0.0 0.0 6 1 Winfield 272.0 0.2 886.0 0.3 770.8 0.26 3 Slocan 0.75 Slocan Park 6 1 Cranbrook 256.0 32.2 463.2 25.7 344.7 19.2 503.8 0.3 6 1 Cranbrook 256.0 1.3 844.0 2.2 613.1 1.4 560.3 1.2 0.0 0.0 6 1 Cranbrook 256.0 0.3 670.0 0.5 770.8 0.36 3 Central Kootenay A 1,704.08 Nelson 6 1 Cranbrook 233.0 193.8 463.2 170.1 344.7 126.6 503.8 2.3 6 1 Cranbrook 233.0 7.6 844.0 14.8 613.1 8.9 560.3 8.2 0.0 0.0 6 1 Cranbrook 233.0 2.0 670.0 3.1 770.8 2.06 3 Central Kootenay B 1,620.91 Creston 6 1 Cranbrook 109.0 203.8 463.2 382.2 344.7 284.4 503.8 5.1 6 1 Cranbrook 109.0 8.0 844.0 33.2 613.1 20.1 560.3 18.4 0.0 0.0 6 1 Cranbrook 109.0 2.1 670.0 6.9 770.8 4.66 3 Central Kootenay C 733.29 Creston 6 1 Cranbrook 109.0 58.4 463.2 109.5 344.7 81.5 503.8 1.5 6 1 Cranbrook 109.0 2.3 844.0 9.5 613.1 5.8 560.3 5.3 0.0 0.0 6 1 Cranbrook 109.0 0.6 670.0 2.0 770.8 1.36 3 Central Kootenay D 5,788.48 Kaslo 6 1 Cranbrook 150.0 96.5 463.2 131.5 344.7 97.8 503.8 1.8 6 1 Cranbrook 150.0 3.8 844.0 11.4 613.1 6.9 560.3 6.3 0.0 0.0 6 1 Cranbrook 150.0 1.0 670.0 2.4 770.8 1.66 3 Central Kootenay E 812.61 Nelson 6 1 Cranbrook 233.0 373.4 463.2 327.6 344.7 243.8 503.8 4.4 6 1 Cranbrook 233.0 14.6 844.0 28.5 613.1 17.2 560.3 15.8 0.0 0.0 6 1 Cranbrook 233.0 3.8 670.0 5.9 770.8 3.96 3 Central Kootenay F 402.62 Nelson 6 1 Cranbrook 233.0 352.9 463.2 309.7 344.7 230.4 503.8 4.1 6 1 Cranbrook 233.0 13.8 844.0 26.9 613.1 16.3 560.3 14.9 0.0 0.0 6 1 Cranbrook 233.0 3.6 670.0 5.6 770.8 3.76 3 Central Kootenay G 1,510.61 Castlegar 6 1 Cranbrook 230.0 170.7 463.2 151.7 344.7 112.9 503.8 2.0 6 1 Cranbrook 230.0 6.7 844.0 13.2 613.1 8.0 560.3 7.3 0.0 0.0 6 1 Cranbrook 230.0 1.8 670.0 2.8 770.8 1.86 3 Central Kootenay H 3,293.57 Kaslo 6 1 Cranbrook 150.0 264.9 463.2 361.1 344.7 268.7 503.8 4.8 6 1 Cranbrook 150.0 10.4 844.0 31.4 613.1 19.0 560.3 17.4 0.0 0.0 6 1 Cranbrook 150.0 2.7 670.0 6.5 770.8 4.36 3 Central Kootenay I 109.47 Castlegar 6 1 Cranbrook 230.0 230.7 463.2 205.1 344.7 152.6 503.8 2.7 6 1 Cranbrook 230.0 9.0 844.0 17.8 613.1 10.8 560.3 9.9 0.0 0.0 6 1 Cranbrook 230.0 2.4 670.0 3.7 770.8 2.56 3 Central Kootenay J 1,701.37 Castlegar 6 1 Cranbrook 230.0 260.5 463.2 231.5 344.7 172.3 503.8 3.1 6 1 Cranbrook 230.0 10.2 844.0 20.1 613.1 12.2 560.3 11.1 0.0 0.0 6 1 Cranbrook 230.0 2.7 670.0 4.2 770.8 2.86 3 Central Kootenay K 4,390.45 Kaslo 6 1 Cranbrook 150.0 106.5 463.2 145.2 344.7 108.0 503.8 1.9 6 1 Cranbrook 150.0 4.2 844.0 12.6 613.1 7.6 560.3 7.0 0.0 0.0 6 1 Cranbrook 150.0 1.1 670.0 2.6 770.8 1.76 39 Golden 11.02 Golden 4 33 Kamloops 361.0 556.3 195.0 132.6 260.7 177.4 503.8 4.2 4 33 Kamloops 361.0 21.8 555.8 18.0 611.1 16.5 560.3 15.2 0.0 0.0 4 33 Kamloops 361.0 5.7 505.7 4.3 520.5 2.66 39 Revelstoke 31.90 Revelstoke 4 33 Kamloops 213.0 629.0 195.0 254.2 260.7 339.9 503.8 8.0 4 33 Kamloops 213.0 24.6 555.8 34.6 611.1 31.7 560.3 29.0 0.0 0.0 4 33 Kamloops 213.0 6.5 505.7 8.3 520.5 4.96 39 Columbia-Shuswap A 13,514.74 Golden 4 33 Kamloops 361.0 463.4 195.0 110.5 260.7 147.7 503.8 3.5 4 33 Kamloops 361.0 18.2 555.8 15.0 611.1 13.8 560.3 12.6 0.0 0.0 4 33 Kamloops 361.0 4.8 505.7 3.6 520.5 2.16 39 Columbia-Shuswap B 9,786.38 Revelstoke 4 33 Kamloops 213.0 67.5 195.0 27.3 260.7 36.5 503.8 0.9 4 33 Kamloops 213.0 2.6 555.8 3.7 611.1 3.4 560.3 3.1 0.0 0.0 4 33 Kamloops 213.0 0.7 505.7 0.9 520.5 0.56 1 Canal Flats 10.84 Canal Flats 6 1 Cranbrook 82.7 23.1 463.2 57.1 344.7 42.5 503.8 0.8 6 1 Cranbrook 82.7 0.9 844.0 5.0 613.1 3.0 560.3 2.7 0.0 0.0 6 1 Cranbrook 82.7 0.2 670.0 1.0 770.8 0.76 1 Cranbrook 25.14 Cranbrook 6 1 Cranbrook 1.4 10.7 463.2 1546.7 344.7 1151.0 503.8 20.6 6 1 Cranbrook 1.4 0.4 844.0 134.5 613.1 81.4 560.3 74.4 0.0 0.0 6 1 Cranbrook 1.4 0.1 670.0 28.1 770.8 18.56 1 Elkford 101.59 Elkford 6 1 Cranbrook 65.2 65.1 463.2 204.1 344.7 151.8 503.8 2.7 6 1 Cranbrook 65.2 2.5 844.0 17.7 613.1 10.7 560.3 9.8 0.0 0.0 6 1 Cranbrook 65.2 0.7 670.0 3.7 770.8 2.46 1 Fernie 16.05 Fernie 6 1 Cranbrook 94.1 157.0 463.2 341.2 344.7 253.9 503.8 4.5 6 1 Cranbrook 94.1 6.2 844.0 29.7 613.1 18.0 560.3 16.4 0.0 0.0 6 1 Cranbrook 94.1 1.6 670.0 6.2 770.8 4.16 1 Invermere 10.18 Invermere 6 1 Cranbrook 128.0 165.2 463.2 263.9 344.7 196.4 503.8 3.5 6 1 Cranbrook 128.0 6.5 844.0 22.9 613.1 13.9 560.3 12.7 0.0 0.0 6 1 Cranbrook 128.0 1.7 670.0 4.8 770.8 3.26 1 Kimberley 58.31 Kimberley 6 1 Cranbrook 28.8 71.4 463.2 507.1 344.7 377.4 503.8 6.8 6 1 Cranbrook 28.8 2.8 844.0 44.1 613.1 26.7 560.3 24.4 0.0 0.0 6 1 Cranbrook 28.8 0.7 670.0 9.2 770.8 6.16 1 Radium Hot Springs 6.31 Radium Hot Springs 6 1 Cranbrook 142.0 50.1 463.2 72.1 344.7 53.7 503.8 1.0 6 1 Cranbrook 142.0 2.0 844.0 6.3 613.1 3.8 560.3 3.5 0.0 0.0 6 1 Cranbrook 142.0 0.5 670.0 1.3 770.8 0.96 1 Sparwood 177.71 Sparwood 6 1 Cranbrook 126.0 184.5 463.2 299.3 344.7 222.7 503.8 4.0 6 1 Cranbrook 126.0 7.2 844.0 26.0 613.1 15.8 560.3 14.4 0.0 0.0 6 1 Cranbrook 126.0 1.9 670.0 5.4 770.8 3.66 1 East Kootenay A 4,653.72 Fernie 6 1 Cranbrook 94.1 74.4 463.2 161.8 344.7 120.4 503.8 2.2 6 1 Cranbrook 94.1 2.9 844.0 14.1 613.1 8.5 560.3 7.8 0.0 0.0 6 1 Cranbrook 94.1 0.8 670.0 2.9 770.8 1.96 1 East Kootenay B 2,791.55 Fernie 6 1 Cranbrook 94.1 71.0 463.2 154.3 344.7 114.8 503.8 2.1 6 1 Cranbrook 94.1 2.8 844.0 13.4 613.1 8.1 560.3 7.4 0.0 0.0 6 1 Cranbrook 94.1 0.7 670.0 2.8 770.8 1.86 1 East Kootenay C 4,519.23 Cranbrook 6 1 Cranbrook 19.0 47.0 463.2 506.6 344.7 377.0 503.8 6.8 6 1 Cranbrook 19.0 1.8 844.0 44.0 613.1 26.7 560.3 24.4 0.0 0.0 6 1 Cranbrook 19.0 0.5 670.0 9.2 770.8 6.16 1 East Kootenay E 4,266.98 Cranbrook 6 1 Cranbrook 18.4 12.9 463.2 143.2 344.7 106.6 503.8 1.9 6 1 Cranbrook 18.4 0.5 844.0 12.4 613.1 7.5 560.3 6.9 0.0 0.0 6 1 Cranbrook 18.4 0.1 670.0 2.6 770.8 1.76 1 East Kootenay F 6,102.84 Invermere 6 1 Cranbrook 128.0 169.0 463.2 269.9 344.7 200.9 503.8 3.6 6 1 Cranbrook 128.0 6.6 844.0 23.5 613.1 14.2 560.3 13.0 0.0 0.0 6 1 Cranbrook 128.0 1.7 670.0 4.9 770.8 3.26 1 East Kootenay G 4,654.72 Radium Hot Springs 6 1 Cranbrook 142.0 90.2 463.2 129.9 344.7 96.6 503.8 1.7 6 1 Cranbrook 142.0 3.5 844.0 11.3 613.1 6.8 560.3 6.2 0.0 0.0 6 1 Cranbrook 142.0 0.9 670.0 2.4 770.8 1.66 5 Fruitvale 2.66 Fruitvale 6 1 Cranbrook 214.0 170.6 463.2 163.0 344.7 121.3 503.8 2.2 6 1 Cranbrook 214.0 6.7 844.0 14.2 613.1 8.6 560.3 7.8 0.0 0.0 6 1 Cranbrook 214.0 1.8 670.0 3.0 770.8 2.06 5 Grand Forks 10.44 Grand Forks 4 35 Kelowna 206.0 346.2 214.4 159.0 289.0 214.4 503.8 4.6 4 35 Kelowna 206.0 13.6 604.9 21.4 611.1 18.0 560.3 16.5 0.0 0.0 4 35 Kelowna 206.0 3.6 552.8 5.1 520.5 2.86 5 Greenwood 2.52 Greenwood 4 35 Kelowna 161.0 40.4 214.4 23.8 289.0 32.0 503.8 0.7 4 35 Kelowna 161.0 1.6 604.9 3.2 611.1 2.7 560.3 2.5 0.0 0.0 4 35 Kelowna 161.0 0.4 552.8 0.8 520.5 0.46 5 Midway 12.16 Midway 4 35 Kelowna 150.0 38.3 214.4 24.1 289.0 32.5 503.8 0.7 4 35 Kelowna 150.0 1.5 604.9 3.3 611.1 2.7 560.3 2.5 0.0 0.0 4 35 Kelowna 150.0 0.4 552.8 0.8 520.5 0.46 5 Montrose 1.53 Montrose 6 1 Cranbrook 219.0 89.6 463.2 83.7 344.7 62.3 503.8 1.1 6 1 Cranbrook 219.0 3.5 844.0 7.3 613.1 4.4 560.3 4.0 0.0 0.0 6 1 Cranbrook 219.0 0.9 670.0 1.5 770.8 1.06 5 Rossland 57.97 Rossland 6 1 Cranbrook 242.0 310.7 463.2 262.5 344.7 195.4 503.8 3.5 6 1 Cranbrook 242.0 12.2 844.0 22.8 613.1 13.8 560.3 12.6 0.0 0.0 6 1 Cranbrook 242.0 3.2 670.0 4.8 770.8 3.16 5 Trail 34.78 Trail 6 1 Cranbrook 232.0 682.0 463.2 601.1 344.7 447.3 503.8 8.0 6 1 Cranbrook 232.0 26.7 844.0 52.3 613.1 31.6 560.3 28.9 0.0 0.0 6 1 Cranbrook 232.0 7.0 670.0 10.9 770.8 7.26 5 Warfield 1.90 Warfield 6 1 Cranbrook 236.0 169.8 463.2 147.1 344.7 109.5 503.8 2.0 6 1 Cranbrook 236.0 6.7 844.0 12.8 613.1 7.7 560.3 7.1 0.0 0.0 6 1 Cranbrook 236.0 1.7 670.0 2.7 770.8 1.86 5 Kootenay Boundary A 238.52 Trail 6 1 Cranbrook 232.0 192.9 463.2 170.0 344.7 126.5 503.8 2.3 6 1 Cranbrook 232.0 7.6 844.0 14.8 613.1 8.9 560.3 8.2 0.0 0.0 6 1 Cranbrook 232.0 2.0 670.0 3.1 770.8 2.06 5 Kootenay Boundary B 778.61 Rossland 6 1 Cranbrook 242.0 134.1 463.2 113.3 344.7 84.3 503.8 1.5 6 1 Cranbrook 242.0 5.3 844.0 9.9 613.1 6.0 560.3 5.4 0.0 0.0 6 1 Cranbrook 242.0 1.4 670.0 2.1 770.8 1.46 5 Kootenay Boundary C 530.61 Christina Lake 4 35 Kelowna 223.0 132.4 214.4 56.2 289.0 75.8 503.8 1.6 4 35 Kelowna 223.0 5.2 604.9 7.6 611.1 6.4 560.3 5.8 0.0 0.0 4 35 Kelowna 223.0 1.4 552.8 1.8 520.5 1.06 5 Kootenay Boundary D 2,116.43 Christina Lake 4 35 Kelowna 223.0 292.1 214.4 124.0 289.0 167.1 503.8 3.6 4 35 Kelowna 223.0 11.4 604.9 16.7 611.1 14.0 560.3 12.9 0.0 0.0 4 35 Kelowna 223.0 3.0 552.8 4.0 520.5 2.26 5 Kootenay Boundary E 4,307.49 Greenwood 4 35 Kelowna 161.0 152.9 214.4 89.8 289.0 121.1 503.8 2.6 4 35 Kelowna 161.0 6.0 604.9 12.1 611.1 10.2 560.3 9.3 0.0 0.0 4 35 Kelowna 161.0 1.6 552.8 2.9 520.5 1.66 37 North Okanagan E 2,613.15 Vernon 4 35 Winfield 31.3 12.2 224.7 38.6 288.4 49.5 503.8 1.1 4 35 Winfield 31.3 0.5 611.7 5.0 611.1 4.2 560.3 3.8 0.0 0.0 4 35 Winfield 31.3 0.1 565.7 1.2 520.5 0.6
CRA 071620 (2)

TABLE 3.3
PROJECT - DESTINATION DISTANCES2009 GREENHOUSE GAS SAVINGS STUDY
BCUOMA
Page 4 of 6
BCUOMA Regional 2006 Area Generator Distance Diesel Distance Diesel Distance Diesel Distance Diesel Distance Diesel Distance Diesel Distance Diesel Distance Diesel Distance Diesel Distance Diesel Distance Diesel Distance Diesel
Zone District (1) Name km 2 Location (2) Zone RD Location (3) (km) (4)Consumed
(L) (km) (5)Consumed
(L) (km) (5) Consumed (L) (km) (5)Consumed
(L) Zone RD Location (3) (km) (4)Consumed
(L) (km) (5)Consumed
(L) (km) (5)Consumed
(L) (km) (5)Consumed
(L) (km) (5)Consumed
(L) Zone RD Location (3) (km) (4)Consumed
(L) (km) (5)Consumed
(L) (km) (5)Consumed
(L)
Used OilRegistered Collector
Oil ContainersPlastics Manufacturer
Oil FiltersPulp Mills & Asphalt PlantsRegistered Processor Registered ProcessorRail Travel Registered Processor Incinerator Registered CollectorRegistered Collector Steel Broker Steel Mill
7 17 Central Saanich 41.42 Central Saanich 7 21 Nanaimo 111.0 434.6 53.0 91.6 266.1 459.9 503.8 10.7 7 21 Nanaimo 111.0 13.6 486.3 32.0 613.1 33.6 560.3 30.7 0.0 0.0 7 21 Nanaimo 111.0 3.7 678.2 12.3 580.9 6.07 17 Colwood 17.76 Colwood 7 21 Nanaimo 101.0 378.0 53.0 87.6 266.1 439.6 503.8 10.2 7 21 Nanaimo 101.0 11.8 486.3 30.6 613.1 32.1 560.3 29.3 0.0 0.0 7 21 Nanaimo 101.0 3.3 678.2 11.7 580.9 5.87 17 Esquimalt 7.04 Esquimalt 7 21 Nanaimo 108.0 457.1 53.0 99.1 266.1 497.1 503.8 11.5 7 21 Nanaimo 108.0 14.3 486.3 34.6 613.1 36.3 560.3 33.2 0.0 0.0 7 21 Nanaimo 108.0 3.9 678.2 13.3 580.9 6.57 17 Highlands 37.87 Highlands 7 21 Nanaimo 97.3 49.0 53.0 11.8 266.1 59.1 503.8 1.4 7 21 Nanaimo 97.3 1.5 486.3 4.1 613.1 4.3 560.3 3.9 0.0 0.0 7 21 Nanaimo 97.3 0.4 678.2 1.6 580.9 0.87 17 Langford 39.55 Langford 7 21 Nanaimo 96.0 586.7 53.0 143.1 266.1 717.8 503.8 16.7 7 21 Nanaimo 96.0 18.3 486.3 49.9 613.1 52.4 560.3 47.9 0.0 0.0 7 21 Nanaimo 96.0 5.0 678.2 19.2 580.9 9.47 17 Metchosin 71.32 Metchosin 7 21 Nanaimo 105.0 122.4 53.0 27.3 266.1 136.9 503.8 3.2 7 21 Nanaimo 105.0 3.8 486.3 9.5 613.1 10.0 560.3 9.1 0.0 0.0 7 21 Nanaimo 105.0 1.1 678.2 3.7 580.9 1.87 17 North Saanich 37.14 North Saanich 7 21 Nanaimo 123.0 333.2 53.0 63.4 266.1 318.2 503.8 7.4 7 21 Nanaimo 123.0 10.4 486.3 22.1 613.1 23.2 560.3 21.2 0.0 0.0 7 21 Nanaimo 123.0 2.9 678.2 8.5 580.9 4.27 17 Oak Bay 10.38 Oak Bay 7 21 Nanaimo 112.0 493.0 53.0 103.0 266.1 517.0 503.8 12.0 7 21 Nanaimo 112.0 15.4 486.3 35.9 613.1 37.8 560.3 34.5 0.0 0.0 7 21 Nanaimo 112.0 4.2 678.2 13.8 580.9 6.87 17 Saanich 103.44 Saanich 7 21 Nanaimo 109.0 2966.5 53.0 637.0 266.1 3196.3 503.8 74.2 7 21 Nanaimo 109.0 92.7 486.3 222.2 613.1 233.5 560.3 213.4 0.0 0.0 7 21 Nanaimo 109.0 25.5 678.2 85.4 580.9 42.07 17 Sidney 5.04 Sidney 7 21 Nanaimo 127.0 359.3 53.0 66.2 266.1 332.3 503.8 7.7 7 21 Nanaimo 127.0 11.2 486.3 23.1 613.1 24.3 560.3 22.2 0.0 0.0 7 21 Nanaimo 127.0 3.1 678.2 8.9 580.9 4.47 17 Sooke 50.01 Sooke 7 21 Nanaimo 116.0 293.6 53.0 59.2 266.1 297.3 503.8 6.9 7 21 Nanaimo 116.0 9.2 486.3 20.7 613.1 21.7 560.3 19.8 0.0 0.0 7 21 Nanaimo 116.0 2.5 678.2 7.9 580.9 3.97 17 Victoria 19.68 Victoria 7 21 Nanaimo 109.0 2149.3 53.0 461.5 266.1 2315.8 503.8 53.7 7 21 Nanaimo 109.0 67.1 486.3 161.0 613.1 169.2 560.3 154.6 0.0 0.0 7 21 Nanaimo 109.0 18.5 678.2 61.9 580.9 30.47 17 View Royal 14.48 View Royal 7 21 Nanaimo 102.0 245.1 53.0 56.2 266.1 282.2 503.8 6.5 7 21 Nanaimo 102.0 7.7 486.3 19.6 613.1 20.6 560.3 18.8 0.0 0.0 7 21 Nanaimo 102.0 2.1 678.2 7.5 580.9 3.77 17 Capital F 182.23 Sidney 7 21 Nanaimo 127.0 306.8 53.0 56.5 266.1 283.7 503.8 6.6 7 21 Nanaimo 127.0 9.6 486.3 19.7 613.1 20.7 560.3 18.9 0.0 0.0 7 21 Nanaimo 127.0 2.6 678.2 7.6 580.9 3.77 17 Capital G 187.46 Sidney 7 21 Nanaimo 127.0 175.6 53.0 32.4 266.1 162.4 503.8 3.8 7 21 Nanaimo 127.0 5.5 486.3 11.3 613.1 11.9 560.3 10.8 0.0 0.0 7 21 Nanaimo 127.0 1.5 678.2 4.3 580.9 2.17 17 Capital H (Part 1) 228.08 Victoria 7 21 Nanaimo 109.0 121.3 53.0 26.0 266.1 130.7 503.8 3.0 7 21 Nanaimo 109.0 3.8 486.3 9.1 613.1 9.5 560.3 8.7 0.0 0.0 7 21 Nanaimo 109.0 1.0 678.2 3.5 580.9 1.77 17 Capital H (Part 2) 1,272.66 Victoria 7 21 Nanaimo 109.0 7.8 53.0 1.7 266.1 8.4 503.8 0.2 7 21 Nanaimo 109.0 0.2 486.3 0.6 613.1 0.6 560.3 0.6 0.0 0.0 7 21 Nanaimo 109.0 0.1 678.2 0.2 580.9 0.17 19 Duncan 2.05 Duncan 7 21 Nanaimo 48.0 60.7 53.0 29.6 266.1 148.6 503.8 3.4 7 21 Nanaimo 48.0 1.9 486.3 10.3 613.1 10.9 560.3 9.9 0.0 0.0 7 21 Nanaimo 48.0 0.5 678.2 4.0 580.9 2.07 19 Ladysmith 12.18 Ladysmith 7 21 Nanaimo 21.0 41.2 53.0 45.9 266.1 230.4 503.8 5.3 7 21 Nanaimo 21.0 1.3 486.3 16.0 613.1 16.8 560.3 15.4 0.0 0.0 7 21 Nanaimo 21.0 0.4 678.2 6.2 580.9 3.07 19 Lake Cowichan 8.25 Lake Cowichan 7 21 Nanaimo 70.5 52.2 53.0 17.3 266.1 86.9 503.8 2.0 7 21 Nanaimo 70.5 1.6 486.3 6.0 613.1 6.4 560.3 5.8 0.0 0.0 7 21 Nanaimo 70.5 0.4 678.2 2.3 580.9 1.17 19 North Cowichan 193.66 North Cowichan 7 21 Nanaimo 43.1 300.2 53.0 163.1 266.1 818.1 503.8 19.0 7 21 Nanaimo 43.1 9.4 486.3 56.9 613.1 59.8 560.3 54.6 0.0 0.0 7 21 Nanaimo 43.1 2.6 678.2 21.9 580.9 10.87 19 Cowichan Valley A 49.43 Sidney 7 21 Nanaimo 127.0 140.8 53.0 25.9 266.1 130.2 503.8 3.0 7 21 Nanaimo 127.0 4.4 486.3 9.1 613.1 9.5 560.3 8.7 0.0 0.0 7 21 Nanaimo 127.0 1.2 678.2 3.5 580.9 1.77 19 Cowichan Valley B 306.23 Sidney 7 21 Nanaimo 127.0 244.7 53.0 45.1 266.1 226.2 503.8 5.2 7 21 Nanaimo 127.0 7.6 486.3 15.7 613.1 16.5 560.3 15.1 0.0 0.0 7 21 Nanaimo 127.0 2.1 678.2 6.0 580.9 3.07 19 Cowichan Valley C 22.64 Sidney 7 21 Nanaimo 127.0 141.0 53.0 26.0 266.1 130.4 503.8 3.0 7 21 Nanaimo 127.0 4.4 486.3 9.1 613.1 9.5 560.3 8.7 0.0 0.0 7 21 Nanaimo 127.0 1.2 678.2 3.5 580.9 1.77 19 Cowichan Valley D 15.48 Duncan 7 21 Nanaimo 48.0 34.2 53.0 16.7 266.1 83.6 503.8 1.9 7 21 Nanaimo 48.0 1.1 486.3 5.8 613.1 6.1 560.3 5.6 0.0 0.0 7 21 Nanaimo 48.0 0.3 678.2 2.2 580.9 1.17 19 Cowichan Valley E 134.87 Duncan 7 21 Nanaimo 48.0 46.3 53.0 22.6 266.1 113.2 503.8 2.6 7 21 Nanaimo 48.0 1.4 486.3 7.9 613.1 8.3 560.3 7.6 0.0 0.0 7 21 Nanaimo 48.0 0.4 678.2 3.0 580.9 1.57 19 Cowichan Valley F 1,792.90 Lake Cowichan 7 21 Nanaimo 70.5 29.9 53.0 9.9 266.1 49.8 503.8 1.2 7 21 Nanaimo 70.5 0.9 486.3 3.5 613.1 3.6 560.3 3.3 0.0 0.0 7 21 Nanaimo 70.5 0.3 678.2 1.3 580.9 0.77 19 Cowichan Valley G 284.30 Ladysmith 7 21 Nanaimo 21.0 11.7 53.0 13.1 266.1 65.6 503.8 1.5 7 21 Nanaimo 21.0 0.4 486.3 4.6 613.1 4.8 560.3 4.4 0.0 0.0 7 21 Nanaimo 21.0 0.1 678.2 1.8 580.9 0.97 19 Cowichan Valley H 83.02 Ladysmith 7 21 Nanaimo 21.0 12.0 53.0 13.4 266.1 67.0 503.8 1.6 7 21 Nanaimo 21.0 0.4 486.3 4.7 613.1 4.9 560.3 4.5 0.0 0.0 7 21 Nanaimo 21.0 0.1 678.2 1.8 580.9 0.97 19 Cowichan Valley I 507.87 Lake Cowichan 7 21 Nanaimo 70.5 20.6 53.0 6.8 266.1 34.3 503.8 0.8 7 21 Nanaimo 70.5 0.6 486.3 2.4 613.1 2.5 560.3 2.3 0.0 0.0 7 21 Nanaimo 70.5 0.2 678.2 0.9 580.9 0.57 21 Nanaimo 89.30 Nanaimo 7 21 Nanaimo 2.7 53.7 53.0 471.9 266.1 2367.6 503.8 54.9 7 21 Nanaimo 2.7 1.7 486.3 164.6 613.1 173.0 560.3 158.1 0.0 0.0 7 21 Nanaimo 2.7 0.5 678.2 63.3 580.9 31.1
CRA 071620 (2)
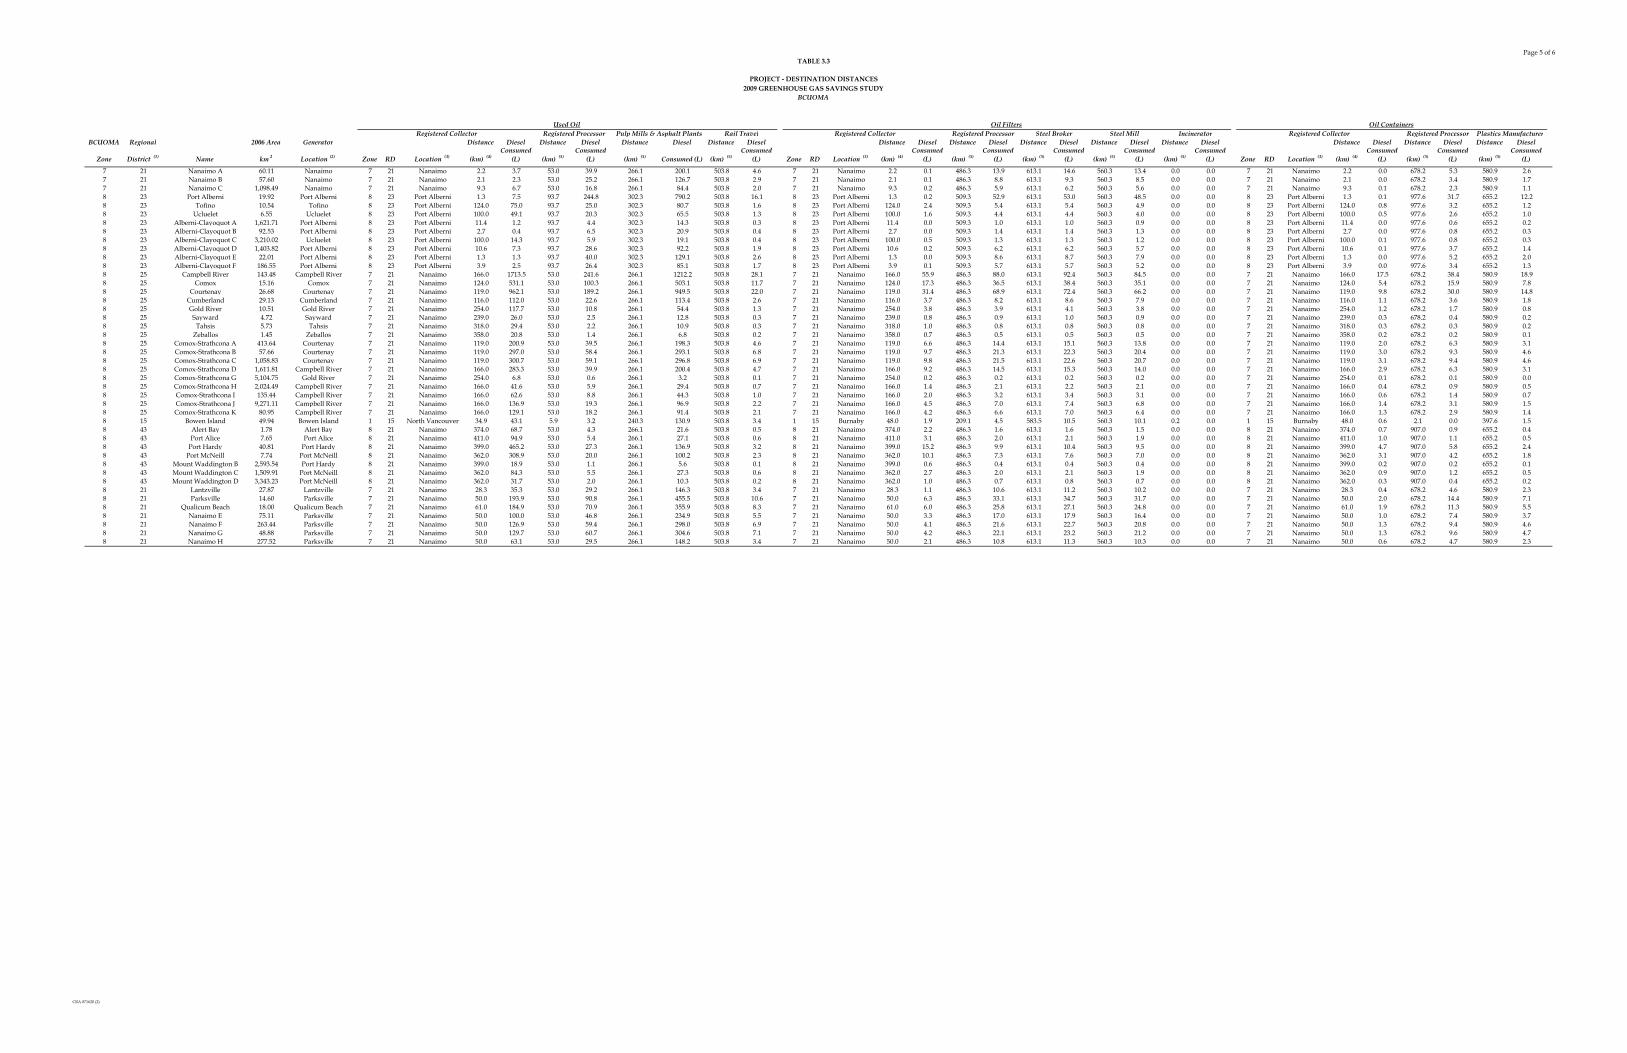
TABLE 3.3
PROJECT - DESTINATION DISTANCES2009 GREENHOUSE GAS SAVINGS STUDY
BCUOMA
Page 5 of 6
BCUOMA Regional 2006 Area Generator Distance Diesel Distance Diesel Distance Diesel Distance Diesel Distance Diesel Distance Diesel Distance Diesel Distance Diesel Distance Diesel Distance Diesel Distance Diesel Distance Diesel
Zone District (1) Name km 2 Location (2) Zone RD Location (3) (km) (4)Consumed
(L) (km) (5)Consumed
(L) (km) (5) Consumed (L) (km) (5)Consumed
(L) Zone RD Location (3) (km) (4)Consumed
(L) (km) (5)Consumed
(L) (km) (5)Consumed
(L) (km) (5)Consumed
(L) (km) (5)Consumed
(L) Zone RD Location (3) (km) (4)Consumed
(L) (km) (5)Consumed
(L) (km) (5)Consumed
(L)
Used OilRegistered Collector
Oil ContainersPlastics Manufacturer
Oil FiltersPulp Mills & Asphalt PlantsRegistered Processor Registered ProcessorRail Travel Registered Processor Incinerator Registered CollectorRegistered Collector Steel Broker Steel Mill
7 21 Nanaimo A 60.11 Nanaimo 7 21 Nanaimo 2.2 3.7 53.0 39.9 266.1 200.1 503.8 4.6 7 21 Nanaimo 2.2 0.1 486.3 13.9 613.1 14.6 560.3 13.4 0.0 0.0 7 21 Nanaimo 2.2 0.0 678.2 5.3 580.9 2.67 21 Nanaimo B 57.60 Nanaimo 7 21 Nanaimo 2.1 2.3 53.0 25.2 266.1 126.7 503.8 2.9 7 21 Nanaimo 2.1 0.1 486.3 8.8 613.1 9.3 560.3 8.5 0.0 0.0 7 21 Nanaimo 2.1 0.0 678.2 3.4 580.9 1.77 21 Nanaimo C 1,098.49 Nanaimo 7 21 Nanaimo 9.3 6.7 53.0 16.8 266.1 84.4 503.8 2.0 7 21 Nanaimo 9.3 0.2 486.3 5.9 613.1 6.2 560.3 5.6 0.0 0.0 7 21 Nanaimo 9.3 0.1 678.2 2.3 580.9 1.18 23 Port Alberni 19.92 Port Alberni 8 23 Port Alberni 1.3 7.5 93.7 244.8 302.3 790.2 503.8 16.1 8 23 Port Alberni 1.3 0.2 509.3 52.9 613.1 53.0 560.3 48.5 0.0 0.0 8 23 Port Alberni 1.3 0.1 977.6 31.7 655.2 12.28 23 Tofino 10.54 Tofino 8 23 Port Alberni 124.0 75.0 93.7 25.0 302.3 80.7 503.8 1.6 8 23 Port Alberni 124.0 2.4 509.3 5.4 613.1 5.4 560.3 4.9 0.0 0.0 8 23 Port Alberni 124.0 0.8 977.6 3.2 655.2 1.28 23 Ucluelet 6.55 Ucluelet 8 23 Port Alberni 100.0 49.1 93.7 20.3 302.3 65.5 503.8 1.3 8 23 Port Alberni 100.0 1.6 509.3 4.4 613.1 4.4 560.3 4.0 0.0 0.0 8 23 Port Alberni 100.0 0.5 977.6 2.6 655.2 1.08 23 Alberni-Clayoquot A 1,621.71 Port Alberni 8 23 Port Alberni 11.4 1.2 93.7 4.4 302.3 14.3 503.8 0.3 8 23 Port Alberni 11.4 0.0 509.3 1.0 613.1 1.0 560.3 0.9 0.0 0.0 8 23 Port Alberni 11.4 0.0 977.6 0.6 655.2 0.28 23 Alberni-Clayoquot B 92.53 Port Alberni 8 23 Port Alberni 2.7 0.4 93.7 6.5 302.3 20.9 503.8 0.4 8 23 Port Alberni 2.7 0.0 509.3 1.4 613.1 1.4 560.3 1.3 0.0 0.0 8 23 Port Alberni 2.7 0.0 977.6 0.8 655.2 0.38 23 Alberni-Clayoquot C 3,210.02 Ucluelet 8 23 Port Alberni 100.0 14.3 93.7 5.9 302.3 19.1 503.8 0.4 8 23 Port Alberni 100.0 0.5 509.3 1.3 613.1 1.3 560.3 1.2 0.0 0.0 8 23 Port Alberni 100.0 0.1 977.6 0.8 655.2 0.38 23 Alberni-Clayoquot D 1,403.82 Port Alberni 8 23 Port Alberni 10.6 7.3 93.7 28.6 302.3 92.2 503.8 1.9 8 23 Port Alberni 10.6 0.2 509.3 6.2 613.1 6.2 560.3 5.7 0.0 0.0 8 23 Port Alberni 10.6 0.1 977.6 3.7 655.2 1.48 23 Alberni-Clayoquot E 22.01 Port Alberni 8 23 Port Alberni 1.3 1.3 93.7 40.0 302.3 129.1 503.8 2.6 8 23 Port Alberni 1.3 0.0 509.3 8.6 613.1 8.7 560.3 7.9 0.0 0.0 8 23 Port Alberni 1.3 0.0 977.6 5.2 655.2 2.08 23 Alberni-Clayoquot F 186.55 Port Alberni 8 23 Port Alberni 3.9 2.5 93.7 26.4 302.3 85.1 503.8 1.7 8 23 Port Alberni 3.9 0.1 509.3 5.7 613.1 5.7 560.3 5.2 0.0 0.0 8 23 Port Alberni 3.9 0.0 977.6 3.4 655.2 1.38 25 Campbell River 143.48 Campbell River 7 21 Nanaimo 166.0 1713.5 53.0 241.6 266.1 1212.2 503.8 28.1 7 21 Nanaimo 166.0 55.9 486.3 88.0 613.1 92.4 560.3 84.5 0.0 0.0 7 21 Nanaimo 166.0 17.5 678.2 38.4 580.9 18.98 25 Comox 15.16 Comox 7 21 Nanaimo 124.0 531.1 53.0 100.3 266.1 503.1 503.8 11.7 7 21 Nanaimo 124.0 17.3 486.3 36.5 613.1 38.4 560.3 35.1 0.0 0.0 7 21 Nanaimo 124.0 5.4 678.2 15.9 580.9 7.88 25 Courtenay 26.68 Courtenay 7 21 Nanaimo 119.0 962.1 53.0 189.2 266.1 949.5 503.8 22.0 7 21 Nanaimo 119.0 31.4 486.3 68.9 613.1 72.4 560.3 66.2 0.0 0.0 7 21 Nanaimo 119.0 9.8 678.2 30.0 580.9 14.88 25 Cumberland 29.13 Cumberland 7 21 Nanaimo 116.0 112.0 53.0 22.6 266.1 113.4 503.8 2.6 7 21 Nanaimo 116.0 3.7 486.3 8.2 613.1 8.6 560.3 7.9 0.0 0.0 7 21 Nanaimo 116.0 1.1 678.2 3.6 580.9 1.88 25 Gold River 10.51 Gold River 7 21 Nanaimo 254.0 117.7 53.0 10.8 266.1 54.4 503.8 1.3 7 21 Nanaimo 254.0 3.8 486.3 3.9 613.1 4.1 560.3 3.8 0.0 0.0 7 21 Nanaimo 254.0 1.2 678.2 1.7 580.9 0.88 25 Sayward 4.72 Sayward 7 21 Nanaimo 239.0 26.0 53.0 2.5 266.1 12.8 503.8 0.3 7 21 Nanaimo 239.0 0.8 486.3 0.9 613.1 1.0 560.3 0.9 0.0 0.0 7 21 Nanaimo 239.0 0.3 678.2 0.4 580.9 0.28 25 Tahsis 5.73 Tahsis 7 21 Nanaimo 318.0 29.4 53.0 2.2 266.1 10.9 503.8 0.3 7 21 Nanaimo 318.0 1.0 486.3 0.8 613.1 0.8 560.3 0.8 0.0 0.0 7 21 Nanaimo 318.0 0.3 678.2 0.3 580.9 0.28 25 Zeballos 1.45 Zeballos 7 21 Nanaimo 358.0 20.8 53.0 1.4 266.1 6.8 503.8 0.2 7 21 Nanaimo 358.0 0.7 486.3 0.5 613.1 0.5 560.3 0.5 0.0 0.0 7 21 Nanaimo 358.0 0.2 678.2 0.2 580.9 0.18 25 Comox-Strathcona A 413.64 Courtenay 7 21 Nanaimo 119.0 200.9 53.0 39.5 266.1 198.3 503.8 4.6 7 21 Nanaimo 119.0 6.6 486.3 14.4 613.1 15.1 560.3 13.8 0.0 0.0 7 21 Nanaimo 119.0 2.0 678.2 6.3 580.9 3.18 25 Comox-Strathcona B 57.66 Courtenay 7 21 Nanaimo 119.0 297.0 53.0 58.4 266.1 293.1 503.8 6.8 7 21 Nanaimo 119.0 9.7 486.3 21.3 613.1 22.3 560.3 20.4 0.0 0.0 7 21 Nanaimo 119.0 3.0 678.2 9.3 580.9 4.68 25 Comox-Strathcona C 1,058.83 Courtenay 7 21 Nanaimo 119.0 300.7 53.0 59.1 266.1 296.8 503.8 6.9 7 21 Nanaimo 119.0 9.8 486.3 21.5 613.1 22.6 560.3 20.7 0.0 0.0 7 21 Nanaimo 119.0 3.1 678.2 9.4 580.9 4.68 25 Comox-Strathcona D 1,611.81 Campbell River 7 21 Nanaimo 166.0 283.3 53.0 39.9 266.1 200.4 503.8 4.7 7 21 Nanaimo 166.0 9.2 486.3 14.5 613.1 15.3 560.3 14.0 0.0 0.0 7 21 Nanaimo 166.0 2.9 678.2 6.3 580.9 3.18 25 Comox-Strathcona G 5,104.75 Gold River 7 21 Nanaimo 254.0 6.8 53.0 0.6 266.1 3.2 503.8 0.1 7 21 Nanaimo 254.0 0.2 486.3 0.2 613.1 0.2 560.3 0.2 0.0 0.0 7 21 Nanaimo 254.0 0.1 678.2 0.1 580.9 0.08 25 Comox-Strathcona H 2,024.49 Campbell River 7 21 Nanaimo 166.0 41.6 53.0 5.9 266.1 29.4 503.8 0.7 7 21 Nanaimo 166.0 1.4 486.3 2.1 613.1 2.2 560.3 2.1 0.0 0.0 7 21 Nanaimo 166.0 0.4 678.2 0.9 580.9 0.58 25 Comox-Strathcona I 135.44 Campbell River 7 21 Nanaimo 166.0 62.6 53.0 8.8 266.1 44.3 503.8 1.0 7 21 Nanaimo 166.0 2.0 486.3 3.2 613.1 3.4 560.3 3.1 0.0 0.0 7 21 Nanaimo 166.0 0.6 678.2 1.4 580.9 0.78 25 Comox-Strathcona J 9,271.11 Campbell River 7 21 Nanaimo 166.0 136.9 53.0 19.3 266.1 96.9 503.8 2.2 7 21 Nanaimo 166.0 4.5 486.3 7.0 613.1 7.4 560.3 6.8 0.0 0.0 7 21 Nanaimo 166.0 1.4 678.2 3.1 580.9 1.58 25 Comox-Strathcona K 80.95 Campbell River 7 21 Nanaimo 166.0 129.1 53.0 18.2 266.1 91.4 503.8 2.1 7 21 Nanaimo 166.0 4.2 486.3 6.6 613.1 7.0 560.3 6.4 0.0 0.0 7 21 Nanaimo 166.0 1.3 678.2 2.9 580.9 1.48 15 Bowen Island 49.94 Bowen Island 1 15 North Vancouver 34.9 43.1 5.9 3.2 240.3 130.9 503.8 3.4 1 15 Burnaby 48.0 1.9 209.1 4.5 583.5 10.5 560.3 10.1 0.2 0.0 1 15 Burnaby 48.0 0.6 2.1 0.0 397.6 1.58 43 Alert Bay 1.78 Alert Bay 8 21 Nanaimo 374.0 68.7 53.0 4.3 266.1 21.6 503.8 0.5 8 21 Nanaimo 374.0 2.2 486.3 1.6 613.1 1.6 560.3 1.5 0.0 0.0 8 21 Nanaimo 374.0 0.7 907.0 0.9 655.2 0.48 43 Port Alice 7.65 Port Alice 8 21 Nanaimo 411.0 94.9 53.0 5.4 266.1 27.1 503.8 0.6 8 21 Nanaimo 411.0 3.1 486.3 2.0 613.1 2.1 560.3 1.9 0.0 0.0 8 21 Nanaimo 411.0 1.0 907.0 1.1 655.2 0.58 43 Port Hardy 40.81 Port Hardy 8 21 Nanaimo 399.0 465.2 53.0 27.3 266.1 136.9 503.8 3.2 8 21 Nanaimo 399.0 15.2 486.3 9.9 613.1 10.4 560.3 9.5 0.0 0.0 8 21 Nanaimo 399.0 4.7 907.0 5.8 655.2 2.48 43 Port McNeill 7.74 Port McNeill 8 21 Nanaimo 362.0 308.9 53.0 20.0 266.1 100.2 503.8 2.3 8 21 Nanaimo 362.0 10.1 486.3 7.3 613.1 7.6 560.3 7.0 0.0 0.0 8 21 Nanaimo 362.0 3.1 907.0 4.2 655.2 1.88 43 Mount Waddington B 2,593.54 Port Hardy 8 21 Nanaimo 399.0 18.9 53.0 1.1 266.1 5.6 503.8 0.1 8 21 Nanaimo 399.0 0.6 486.3 0.4 613.1 0.4 560.3 0.4 0.0 0.0 8 21 Nanaimo 399.0 0.2 907.0 0.2 655.2 0.18 43 Mount Waddington C 1,509.91 Port McNeill 8 21 Nanaimo 362.0 84.3 53.0 5.5 266.1 27.3 503.8 0.6 8 21 Nanaimo 362.0 2.7 486.3 2.0 613.1 2.1 560.3 1.9 0.0 0.0 8 21 Nanaimo 362.0 0.9 907.0 1.2 655.2 0.58 43 Mount Waddington D 3,343.23 Port McNeill 8 21 Nanaimo 362.0 31.7 53.0 2.0 266.1 10.3 503.8 0.2 8 21 Nanaimo 362.0 1.0 486.3 0.7 613.1 0.8 560.3 0.7 0.0 0.0 8 21 Nanaimo 362.0 0.3 907.0 0.4 655.2 0.28 21 Lantzville 27.87 Lantzville 7 21 Nanaimo 28.3 35.3 53.0 29.2 266.1 146.3 503.8 3.4 7 21 Nanaimo 28.3 1.1 486.3 10.6 613.1 11.2 560.3 10.2 0.0 0.0 7 21 Nanaimo 28.3 0.4 678.2 4.6 580.9 2.38 21 Parksville 14.60 Parksville 7 21 Nanaimo 50.0 193.9 53.0 90.8 266.1 455.5 503.8 10.6 7 21 Nanaimo 50.0 6.3 486.3 33.1 613.1 34.7 560.3 31.7 0.0 0.0 7 21 Nanaimo 50.0 2.0 678.2 14.4 580.9 7.18 21 Qualicum Beach 18.00 Qualicum Beach 7 21 Nanaimo 61.0 184.9 53.0 70.9 266.1 355.9 503.8 8.3 7 21 Nanaimo 61.0 6.0 486.3 25.8 613.1 27.1 560.3 24.8 0.0 0.0 7 21 Nanaimo 61.0 1.9 678.2 11.3 580.9 5.58 21 Nanaimo E 75.11 Parksville 7 21 Nanaimo 50.0 100.0 53.0 46.8 266.1 234.9 503.8 5.5 7 21 Nanaimo 50.0 3.3 486.3 17.0 613.1 17.9 560.3 16.4 0.0 0.0 7 21 Nanaimo 50.0 1.0 678.2 7.4 580.9 3.78 21 Nanaimo F 263.44 Parksville 7 21 Nanaimo 50.0 126.9 53.0 59.4 266.1 298.0 503.8 6.9 7 21 Nanaimo 50.0 4.1 486.3 21.6 613.1 22.7 560.3 20.8 0.0 0.0 7 21 Nanaimo 50.0 1.3 678.2 9.4 580.9 4.68 21 Nanaimo G 48.88 Parksville 7 21 Nanaimo 50.0 129.7 53.0 60.7 266.1 304.6 503.8 7.1 7 21 Nanaimo 50.0 4.2 486.3 22.1 613.1 23.2 560.3 21.2 0.0 0.0 7 21 Nanaimo 50.0 1.3 678.2 9.6 580.9 4.78 21 Nanaimo H 277.52 Parksville 7 21 Nanaimo 50.0 63.1 53.0 29.5 266.1 148.2 503.8 3.4 7 21 Nanaimo 50.0 2.1 486.3 10.8 613.1 11.3 560.3 10.3 0.0 0.0 7 21 Nanaimo 50.0 0.6 678.2 4.7 580.9 2.3
CRA 071620 (2)

TABLE 3.3
PROJECT - DESTINATION DISTANCES2009 GREENHOUSE GAS SAVINGS STUDY
BCUOMA
Page 6 of 6
BCUOMA Regional 2006 Area Generator Distance Diesel Distance Diesel Distance Diesel Distance Diesel Distance Diesel Distance Diesel Distance Diesel Distance Diesel Distance Diesel Distance Diesel Distance Diesel Distance Diesel
Zone District (1) Name km 2 Location (2) Zone RD Location (3) (km) (4)Consumed
(L) (km) (5)Consumed
(L) (km) (5) Consumed (L) (km) (5)Consumed
(L) Zone RD Location (3) (km) (4)Consumed
(L) (km) (5)Consumed
(L) (km) (5)Consumed
(L) (km) (5)Consumed
(L) (km) (5)Consumed
(L) Zone RD Location (3) (km) (4)Consumed
(L) (km) (5)Consumed
(L) (km) (5)Consumed
(L)
Used OilRegistered Collector
Oil ContainersPlastics Manufacturer
Oil FiltersPulp Mills & Asphalt PlantsRegistered Processor Registered ProcessorRail Travel Registered Processor Incinerator Registered CollectorRegistered Collector Steel Broker Steel Mill
9 51 Burns Lake 7.17 Burns Lake 2 53 Prince George 228.0 218.5 407.8 172.5 365.9 154.8 503.8 2.6 2 53 Prince George 228.0 7.4 796.7 13.8 613.1 8.9 560.3 8.1 0.0 0.0 2 53 Prince George 228.0 1.9 781.0 3.6 395.0 1.09 51 Fort St. James 22.10 Fort St. James 2 53 Prince George 161.0 76.6 407.8 85.6 365.9 76.9 503.8 1.3 2 53 Prince George 161.0 2.6 796.7 6.9 613.1 4.4 560.3 4.0 0.0 0.0 2 53 Prince George 161.0 0.7 781.0 1.8 395.0 0.59 51 Fraser Lake 3.90 Fraser Lake 2 53 Prince George 158.0 70.5 407.8 80.4 365.9 72.1 503.8 1.2 2 53 Prince George 158.0 2.4 796.7 6.4 613.1 4.1 560.3 3.8 0.0 0.0 2 53 Prince George 158.0 0.6 781.0 1.7 395.0 0.59 51 Granisle 40.21 Granisle 2 53 Prince George 327.0 52.6 407.8 28.9 365.9 26.0 503.8 0.4 2 53 Prince George 327.0 1.8 796.7 2.3 613.1 1.5 560.3 1.4 0.0 0.0 2 53 Prince George 327.0 0.5 781.0 0.6 395.0 0.29 51 Houston 72.83 Houston 2 53 Prince George 308.0 392.5 407.8 229.4 365.9 205.9 503.8 3.5 2 53 Prince George 308.0 13.2 796.7 18.4 613.1 11.8 560.3 10.8 0.0 0.0 2 53 Prince George 308.0 3.5 781.0 4.7 395.0 1.49 51 Smithers 15.69 Smithers 2 53 Prince George 371.0 821.1 407.8 398.4 365.9 357.5 503.8 6.0 2 53 Prince George 371.0 27.7 796.7 31.9 613.1 20.5 560.3 18.7 0.0 0.0 2 53 Prince George 371.0 7.3 781.0 8.2 395.0 2.49 51 Telkwa 6.56 Telkwa 2 53 Prince George 357.0 193.8 407.8 97.7 365.9 87.7 503.8 1.5 2 53 Prince George 357.0 6.5 796.7 7.8 613.1 5.0 560.3 4.6 0.0 0.0 2 53 Prince George 357.0 1.7 781.0 2.0 395.0 0.69 51 Bulkley-Nechako A 3,688.00 Smithers 2 53 Prince George 371.0 814.4 407.8 395.1 365.9 354.6 503.8 6.0 2 53 Prince George 371.0 27.4 796.7 31.7 613.1 20.3 560.3 18.6 0.0 0.0 2 53 Prince George 371.0 7.2 781.0 8.2 395.0 2.49 51 Bulkley-Nechako B 3,628.08 Burns Lake 2 53 Prince George 228.0 206.1 407.8 162.7 365.9 146.0 503.8 2.5 2 53 Prince George 228.0 6.9 796.7 13.0 613.1 8.4 560.3 7.6 0.0 0.0 2 53 Prince George 228.0 1.8 781.0 3.4 395.0 1.09 51 Bulkley-Nechako C 25,663.24 Fort St. James 2 53 Prince George 161.0 82.9 407.8 92.7 365.9 83.2 503.8 1.4 2 53 Prince George 161.0 2.8 796.7 7.4 613.1 4.8 560.3 4.4 0.0 0.0 2 53 Prince George 161.0 0.7 781.0 1.9 395.0 0.69 51 Bulkley-Nechako D 4,382.94 Fraser Lake 2 53 Prince George 158.0 112.1 407.8 127.7 365.9 114.6 503.8 1.9 2 53 Prince George 158.0 3.8 796.7 10.2 613.1 6.6 560.3 6.0 0.0 0.0 2 53 Prince George 158.0 1.0 781.0 2.6 395.0 0.89 51 Bulkley-Nechako E 15,912.95 Burns Lake 2 53 Prince George 228.0 179.1 407.8 141.4 365.9 126.9 503.8 2.1 2 53 Prince George 228.0 6.0 796.7 11.3 613.1 7.3 560.3 6.6 0.0 0.0 2 53 Prince George 228.0 1.6 781.0 2.9 395.0 0.89 51 Bulkley-Nechako G 14,439.62 Houston 2 53 Prince George 320.0 143.8 407.8 80.9 365.9 72.6 503.8 1.2 2 53 Prince George 320.0 4.8 796.7 6.5 613.1 4.2 560.3 3.8 0.0 0.0 2 53 Prince George 320.0 1.3 781.0 1.7 395.0 0.59 49 Aiyansh (Kitladamas) 1 13.37 Aiyansh (Kitladamas) 1 2 53 Prince George 616.0 0.0 407.8 0.0 365.9 0.0 503.8 0.0 2 53 Prince George 616.0 0.0 796.7 0.0 613.1 0.0 560.3 0.0 0.0 0.0 2 53 Prince George 616.0 0.0 781.0 0.0 395.0 0.09 49 Gingolx 5.26 Gingolx 2 53 Prince George 693.0 102.9 407.8 26.7 365.9 24.0 503.8 0.4 2 53 Prince George 693.0 3.5 796.7 2.1 613.1 1.4 560.3 1.3 0.0 0.0 2 53 Prince George 693.0 0.9 781.0 0.6 395.0 0.29 49 Gitwinksihlkw 3.01 Gitwinksihlkw 2 53 Prince George 629.0 53.1 407.8 15.2 365.9 13.6 503.8 0.2 2 53 Prince George 629.0 1.8 796.7 1.2 613.1 0.8 560.3 0.7 0.0 0.0 2 53 Prince George 629.0 0.5 781.0 0.3 395.0 0.19 49 Hazelton 2.85 Hazelton 2 53 Prince George 444.0 51.2 407.8 20.7 365.9 18.6 503.8 0.3 2 53 Prince George 444.0 1.7 796.7 1.7 613.1 1.1 560.3 1.0 0.0 0.0 2 53 Prince George 444.0 0.5 781.0 0.4 395.0 0.19 49 Kitimat 242.63 Kitimat 2 53 Prince George 632.0 2272.2 407.8 647.1 365.9 580.8 503.8 9.8 2 53 Prince George 632.0 76.6 796.7 51.9 613.1 33.3 560.3 30.4 0.0 0.0 2 53 Prince George 632.0 20.1 781.0 13.4 395.0 3.99 49 Laxgalts'ap 17.62 Laxgalts'ap 2 53 Prince George 665.0 138.0 407.8 37.3 365.9 33.5 503.8 0.6 2 53 Prince George 665.0 4.6 796.7 3.0 613.1 1.9 560.3 1.8 0.0 0.0 2 53 Prince George 665.0 1.2 781.0 0.8 395.0 0.29 49 New Hazelton 25.64 New Hazelton 2 53 Prince George 439.0 107.2 407.8 44.0 365.9 39.5 503.8 0.7 2 53 Prince George 439.0 3.6 796.7 3.5 613.1 2.3 560.3 2.1 0.0 0.0 2 53 Prince George 439.0 0.9 781.0 0.9 395.0 0.39 49 Nisga'a 1,946.27 Terrace 2 53 Prince George 576.0 26.2 407.8 8.2 365.9 7.4 503.8 0.1 2 53 Prince George 576.0 0.9 796.7 0.7 613.1 0.4 560.3 0.4 0.0 0.0 2 53 Prince George 576.0 0.2 781.0 0.2 395.0 0.09 49 Terrace 41.52 Terrace 2 53 Prince George 576.0 2716.4 407.8 848.8 365.9 761.8 503.8 12.8 2 53 Prince George 576.0 91.5 796.7 68.0 613.1 43.6 560.3 39.9 0.0 0.0 2 53 Prince George 576.0 24.1 781.0 17.5 395.0 5.19 49 Kitimat-Stikine B 7,464.34 Smithers 2 53 Prince George 371.0 232.9 407.8 113.0 365.9 101.4 503.8 1.7 2 53 Prince George 371.0 7.8 796.7 9.1 613.1 5.8 560.3 5.3 0.0 0.0 2 53 Prince George 371.0 2.1 781.0 2.3 395.0 0.79 49 Kitimat-Stikine C (Part 1) 9,679.06 Kitimat 2 53 Prince George 632.0 746.1 407.8 212.5 365.9 190.7 503.8 3.2 2 53 Prince George 632.0 25.1 796.7 17.0 613.1 10.9 560.3 10.0 0.0 0.0 2 53 Prince George 632.0 6.6 781.0 4.4 395.0 1.39 49 Kitimat-Stikine C (Part 2) 18,101.81 Kitimat 2 53 Prince George 632.0 0.9 407.8 0.3 365.9 0.2 503.8 0.0 2 53 Prince George 632.0 0.0 796.7 0.0 613.1 0.0 560.3 0.0 0.0 0.0 2 53 Prince George 632.0 0.0 781.0 0.0 395.0 0.09 49 Kitimat-Stikine E 16.39 Terrace 2 53 Prince George 576.0 935.1 407.8 292.2 365.9 262.2 503.8 4.4 2 53 Prince George 576.0 31.5 796.7 23.4 613.1 15.0 560.3 13.7 0.0 0.0 2 53 Prince George 576.0 8.3 781.0 6.0 395.0 1.89 47 Port Edward 168.12 Port Edward 2 53 Prince George 710.0 164.1 407.8 41.6 365.9 37.3 503.8 0.6 2 53 Prince George 710.0 5.5 796.7 3.3 613.1 2.1 560.3 2.0 0.0 0.0 2 53 Prince George 710.0 1.5 781.0 0.9 395.0 0.29 47 Prince Rupert 54.90 Prince Rupert 2 53 Prince George 718.0 3684.4 407.8 923.6 365.9 828.9 503.8 14.0 2 53 Prince George 718.0 124.1 796.7 74.0 613.1 47.5 560.3 43.4 0.0 0.0 2 53 Prince George 718.0 32.6 781.0 19.1 395.0 5.59 47 Skeena-Queen Charlotte A 2,930.73 Prince Rupert 2 53 Prince George 718.0 11.6 407.8 2.9 365.9 2.6 503.8 0.0 2 53 Prince George 718.0 0.4 796.7 0.2 613.1 0.1 560.3 0.1 0.0 0.0 2 53 Prince George 718.0 0.1 781.0 0.1 395.0 0.09 47 Skeena-Queen Charlotte C 6,514.17 Prince Rupert 2 53 Prince George 718.0 9.6 407.8 2.4 365.9 2.2 503.8 0.0 2 53 Prince George 718.0 0.3 796.7 0.2 613.1 0.1 560.3 0.1 0.0 0.0 2 53 Prince George 718.0 0.1 781.0 0.0 395.0 0.010 41 Cariboo J 25,948.44 Alexis Creek 2 53 Prince George 353.0 135.4 407.8 69.0 365.9 62.0 503.8 1.0 2 53 Prince George 353.0 3.3 796.7 4.0 613.1 2.6 560.3 2.3 0.0 0.0 2 53 Prince George 353.0 0.8 781.0 0.9 395.0 0.310 45 Central Coast A 19,876.88 Bella Coola 2 53 Prince George 700.0 47.2 407.8 12.1 365.9 10.9 503.8 0.2 2 53 Prince George 700.0 1.1 796.7 0.7 613.1 0.5 560.3 0.4 0.0 0.0 2 53 Prince George 700.0 0.3 781.0 0.2 395.0 0.010 45 Central Coast C 3,987.48 Bella Coola 2 53 Prince George 700.0 169.8 407.8 43.7 365.9 39.2 503.8 0.7 2 53 Prince George 700.0 4.1 796.7 2.5 613.1 1.6 560.3 1.5 0.0 0.0 2 53 Prince George 700.0 1.0 781.0 0.6 395.0 0.210 45 Central Coast D 304.14 Bella Coola 2 53 Prince George 700.0 130.3 407.8 33.5 365.9 30.1 503.8 0.5 2 53 Prince George 700.0 3.2 796.7 1.9 613.1 1.2 560.3 1.1 0.0 0.0 2 53 Prince George 700.0 0.7 781.0 0.4 395.0 0.110 45 Central Coast E 360.18 Bella Coola 2 53 Prince George 700.0 41.6 407.8 10.7 365.9 9.6 503.8 0.2 2 53 Prince George 700.0 1.0 796.7 0.6 613.1 0.4 560.3 0.4 0.0 0.0 2 53 Prince George 700.0 0.2 781.0 0.1 395.0 0.010 43 Mount Waddington A 12,737.46 Port McNeill 8 21 Nanaimo 362.0 210.6 53.0 13.6 266.1 68.3 503.8 1.6 8 21 Nanaimo 362.0 5.1 486.3 3.7 613.1 3.9 560.3 3.5 0.0 0.0 8 21 Nanaimo 362.0 1.2 907.0 1.6 655.2 0.710 27 Powell River 29.77 Powell River 8 21 Nanaimo 169.0 1092.8 53.0 151.4 266.1 759.4 503.8 17.6 8 21 Nanaimo 169.0 26.6 486.3 41.1 613.1 43.2 560.3 39.4 0.0 0.0 8 21 Nanaimo 169.0 6.3 907.0 18.1 655.2 7.510 27 Sechelt (Part) 0.24 Powell River 8 21 Nanaimo 169.0 0.9 53.0 0.1 266.1 0.6 503.8 0.0 8 21 Nanaimo 169.0 0.0 486.3 0.0 613.1 0.0 560.3 0.0 0.0 0.0 8 21 Nanaimo 169.0 0.0 907.0 0.0 655.2 0.010 27 Powell River A 3,898.07 Powell River 8 21 Nanaimo 169.0 73.7 53.0 10.2 266.1 51.2 503.8 1.2 8 21 Nanaimo 169.0 1.8 486.3 2.8 613.1 2.9 560.3 2.7 0.0 0.0 8 21 Nanaimo 169.0 0.4 907.0 1.2 655.2 0.510 27 Powell River B 130.52 Powell River 8 21 Nanaimo 169.0 127.8 53.0 17.7 266.1 88.8 503.8 2.1 8 21 Nanaimo 169.0 3.1 486.3 4.8 613.1 5.0 560.3 4.6 0.0 0.0 8 21 Nanaimo 169.0 0.7 907.0 2.1 655.2 0.910 27 Powell River C 642.34 Powell River 8 21 Nanaimo 169.0 172.1 53.0 23.8 266.1 119.6 503.8 2.8 8 21 Nanaimo 169.0 4.2 486.3 6.5 613.1 6.8 560.3 6.2 0.0 0.0 8 21 Nanaimo 169.0 1.0 907.0 2.8 655.2 1.210 27 Powell River D 300.44 Powell River 8 21 Nanaimo 169.0 92.4 53.0 12.8 266.1 64.2 503.8 1.5 8 21 Nanaimo 169.0 2.2 486.3 3.5 613.1 3.6 560.3 3.3 0.0 0.0 8 21 Nanaimo 169.0 0.5 907.0 1.5 655.2 0.610 27 Powell River E 73.57 Powell River 8 21 Nanaimo 169.0 29.9 53.0 4.1 266.1 20.8 503.8 0.5 8 21 Nanaimo 169.0 0.7 486.3 1.1 613.1 1.2 560.3 1.1 0.0 0.0 8 21 Nanaimo 169.0 0.2 907.0 0.5 655.2 0.211 47 Masset 19.45 Masset 2 53 Prince George 1020.0 5.2 407.8 0.9 365.9 0.8 503.8 0.0 2 53 Prince George 1020.0 9.6 796.7 4.0 613.1 2.6 560.3 2.4 0.0 0.0 2 53 Prince George 1020.0 9.4 781.0 3.9 395.0 1.111 47 Port Clements 13.59 Port Clements 2 53 Prince George 951.0 2.0 407.8 0.4 365.9 0.3 503.8 0.0 2 53 Prince George 951.0 3.8 796.7 1.7 613.1 1.1 560.3 1.0 0.0 0.0 2 53 Prince George 951.0 3.7 781.0 1.6 395.0 0.511 47 Queen Charlotte 37.28 Queen Charlotte 2 53 Prince George 922.0 4.4 407.8 0.9 365.9 0.8 503.8 0.0 2 53 Prince George 922.0 8.1 796.7 3.8 613.1 2.4 560.3 2.2 0.0 0.0 2 53 Prince George 922.0 8.0 781.0 3.7 395.0 1.111 47 Skeena-Queen Charlotte D 6,534.37 Port Clements 2 53 Prince George 951.0 3.3 407.8 0.6 365.9 0.6 503.8 0.0 2 53 Prince George 951.0 6.1 796.7 2.8 613.1 1.8 560.3 1.6 0.0 0.0 2 53 Prince George 951.0 6.0 781.0 2.7 395.0 0.811 47 Skeena-Queen Charlotte E 3,432.42 Port Clements 2 53 Prince George 951.0 1.9 407.8 0.4 365.9 0.3 503.8 0.0 2 53 Prince George 951.0 3.5 796.7 1.6 613.1 1.0 560.3 0.9 0.0 0.0 2 53 Prince George 951.0 3.4 781.0 1.5 395.0 0.4
Totals of Diesel Consumed (L) 90,563.3 88,826.3 168,154.0 3,586.3 2,884.3 10,153.8 11,869.8 11,137.1 2.3 833.2 2,357.4 1,938.2Notes:
(2) The closest available municipality with a Local Collection Facility was chosen for each census subdivision.(3) The municipality with a Major Collector closest to the Local Collector for each subdivision was chosen. In the case that the Major Collector did not accept one type of material, the next closest Major Collector was selected for that material.(4) In the case that more than one Local Collector or Major Collector exists in the same municipality, the start or end point for calculating the distance was set to Google Maps' default center for that particular municipality.(5) In the case that more than one Major Collector or Processor exists in the same municipality, the start or end point for calculating the distance was set to Google Maps' default center for that particular municipality.
(1) Strathcona and Comox Valley RDs were combined for 2006 census, named 'Comox-Strathcona RD'. Comox Valley RD (25) used.
CRA 071620 (2)

TABLE 4.1
RESULTS OF THE GHG SAVINGS STUDY2009 GREENHOUSE GAS SAVINGS STUDY
BCUOMA
Page 1 of 3
Total Emissions/process
GWP 100a IPCC 2007 Climate Change kg CO 2 e
Recycled OilRe-refine and ReuseProject PE1 Transportation (from generator to registered collector) 243,700
PE2 Transportation (from registered collector to registered processor)- transport by truck 239,026- transport by rail 10,739
PE3 Re-refining of oil at registered processing facilities into new products 8,962,833
Baseline BE1 Crude oil extraction 9,778,366
BE2 Transportation of crude oil to refinery 270,344
BE3 Refine crude oil into oil products 11,864,278
BE4 Combustion of oil for heat at generators 77,079,708
Use as a Fuel
Project PE1 Transportation (from generator to registered collector) 0 Included in Re-refine/Reuse PE1
PE2 Transportation (from registered collector to asphalt plants and pulp mills) 452,492
PE3 Combustion of the used oil at pulp mills and asphalt plants 63,065,215
Baseline BE1 Crude oil extraction 9,302,885
BE2 Transportation of crude oil to refinery 257,198
BE3 Refine crude oil into oil products 11,287,368
BE4 Combustion of oil for heat at generators 63,065,215
CRA 071620 (2)

TABLE 4.1
RESULTS OF THE GHG SAVINGS STUDY2009 GREENHOUSE GAS SAVINGS STUDY
BCUOMA
Page 2 of 3
Total Emissions/process
GWP 100a IPCC 2007 Climate Change kg CO 2 e
Recycled Oil FiltersMetal Oil FiltersProject PE1 Transportation (from generator to registered collector) 7,761
PE2 Transportation (from registered collector to registered steel oil filter processor) 27,323
PE3 Processing of steel oil filters (crushed into cubes and cylinders)Electricity Production 5,543Natural Gas - Production, Processing, and Distributing 18,445Natural Gas - Combustion for Heat 103,692Propane - Production of Liquid Propane Gas 6,317Propane - Combustion for Fuel (forklift) 24,789
PE4 Transportation of steel to metal broker 31,941
PE5 Transportation of steel to steel mill 29,969
Baseline BE1 Production of steel 5,624,291
BE2 Transportation of steel to steel mill 0 Included in BE1 above
BE3 Transportation of steel filters to disposal facility 33,578
Paper Filters
Project PE1 Transportation (from generator to registered collector) 0 Included in Metal Filters PE1
PE2 Transportation (from registered collector to registered paper oil filter processor) 0 Included in Metal Filters PE2
PE3 Processing of paper oil filters (crushed and incinerated)Electricity Production 731Natural Gas - Production, Processing, and Distributing 1,604Natural Gas - Combustion for Heat 9,017Propane - Production of Liquid Propane Gas 549Propane - Combustion for Fuel (forklift) 2,156Incinerating paper filters 7,474
Baseline BE1 Transportation of paper filters to landfill 0 Included in Metal Filters BE3
BE2 Decomposition of paper filters in landfill (20 year time period) 14,813(Note: CRA completed landfill gas modelling separate from this file)
CRA 071620 (2)

TABLE 4.1
RESULTS OF THE GHG SAVINGS STUDY2009 GREENHOUSE GAS SAVINGS STUDY
BCUOMA
Page 3 of 3
Total Emissions/process
GWP 100a IPCC 2007 Climate Change kg CO 2 e
Recycled Oil ContainersProject PE1 Transportation (from generator to registered collector) 2,242
PE2 Transportation (from registered collector to registered oil container processor) 6,344
PE3 Processing of oil containers (shredded, centrifuged, washed and pelletized)Electricity Production 10,072Natural Gas - Production, Processing, and Distributing 5,955Natural Gas - Combustion for Heat 33,475Propane - Production of Liquid Propane Gas 2,039Propane - Combustion for Fuel (forklift) 8,003
PE4 Transportation of HDPE pellets to plastics manufacturer 5,216
Baseline BE1 Production of HDPE 2,239,541
BE2 Transportation of HDPE to plastics manufacturer 0 Included in BE1 above
BE3 Transportation of oil containers to disposal facility 32,103
SUMMARY OF RESULTS
Recycled OilTOTAL EMISSIONS (Re-refined oil) (Baseline - Project) 89,536,397 kg CO2e
Emissions per L of oil that is collected and re-refined (Baseline - Project) 3.65 kg CO2e/L collected oil
TOTAL EMISSIONS (Collected Oil Used as Fuel) (Baseline - Project) 20,394,960 kg CO2eEmissions per L of oil that is collected and used as a fuel (Baseline - Project) 1.02 kg CO2e/L collected oil
TOTAL EMISSIONS (Re-refined oil and Collected Oil Used as Fuel) (Baseline - Project) 109,931,357 kg CO2eTotal Emissions per L of oil that is collected and re-refined or used as a fuel (Baseline - Project) 2.47 kg CO2e/L collected oil
Recycled Oil FiltersTOTAL EMISSIONS (Metal Filters) (Baseline - Project) 5,402,089 kg CO2eTOTAL EMISSIONS (Paper Filters) (Baseline - Project) -6,717 kg CO2e
TOTAL EMISSIONS (Metal and Paper Filters) (Baseline - Project) 5,395,372 kg CO2eEmissions per filter that is collected and recycled in a steel mill (Baseline - Project) 1.09 kg CO2e/recycled filter
Recycled Oil ContainersTOTAL EMISSIONS (Baseline - Project) 2,198,298 kg CO2e
Emissions per kg oil container collected and processed for sale as HDPE pellets (Baseline - Project) 2.11 kg CO2e/kg recycled container
Note: For the summary tables above, positive emissions indicate GHG savings and negative emissions indicate an increase in GHG emissions.
CRA 071620 (2)
071620 (2)
APPENDIX A
RAW PROCESSING FACILITY COLLECTION DATA
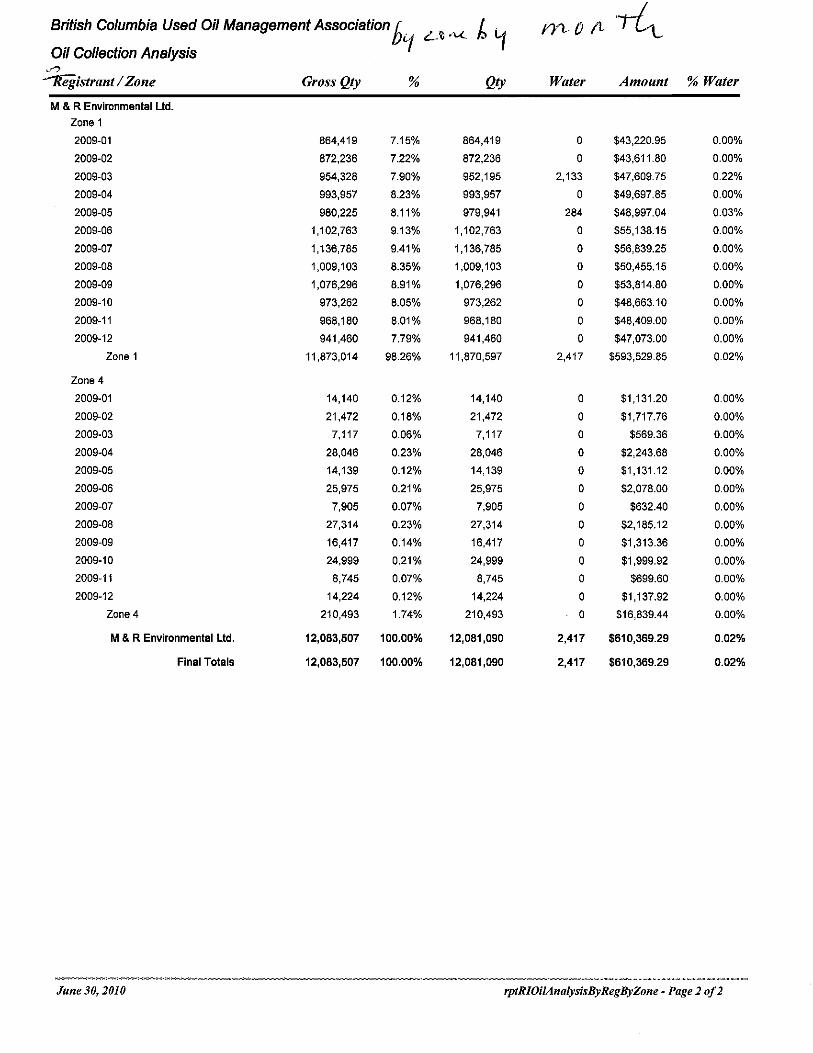


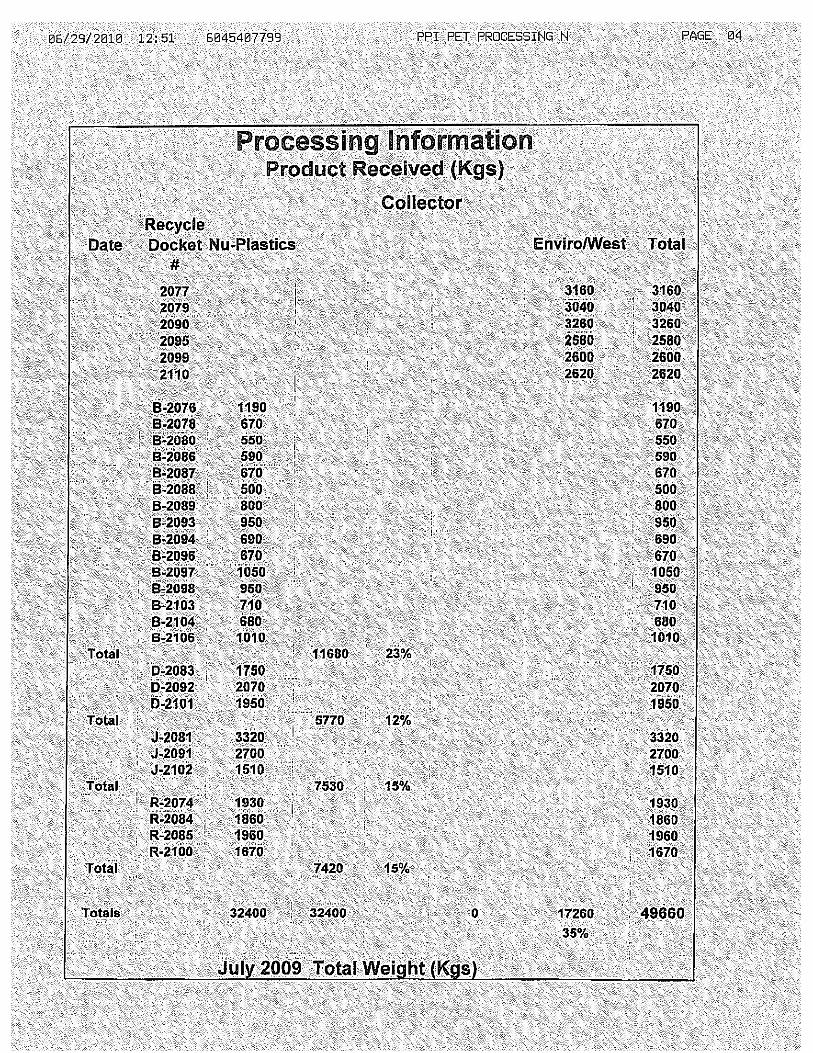
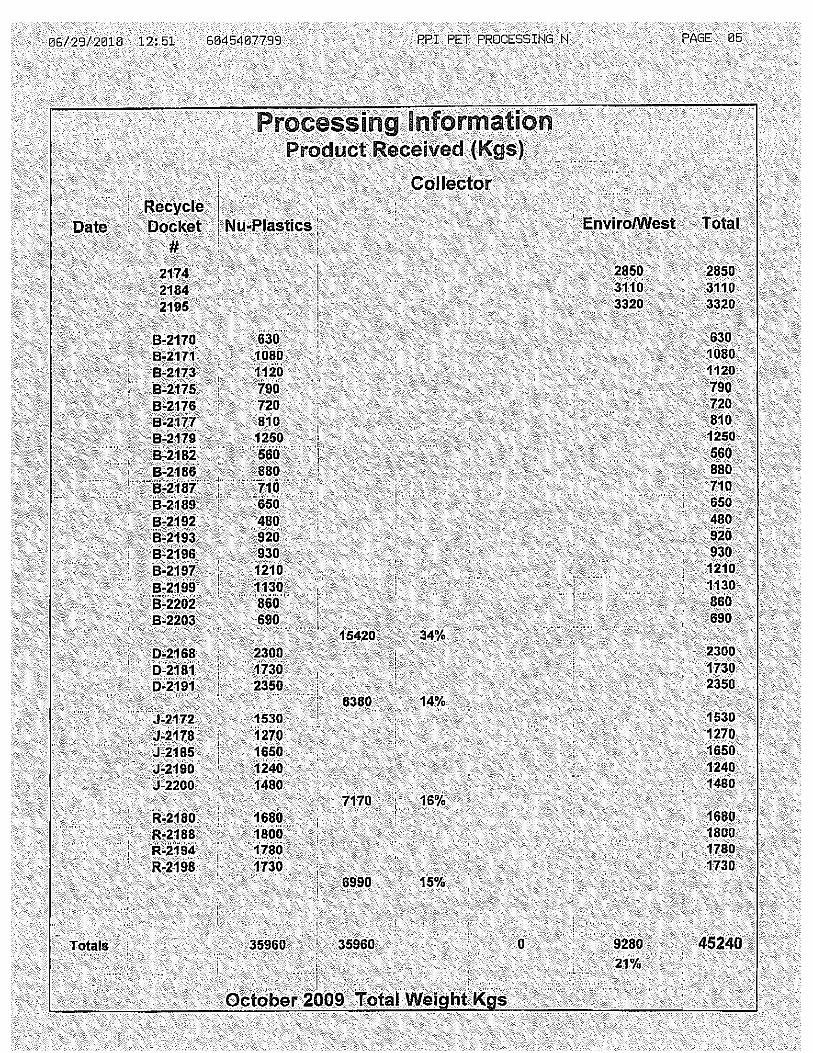

071620 (2)
APPENDIX B
DATA CALCULATIONS
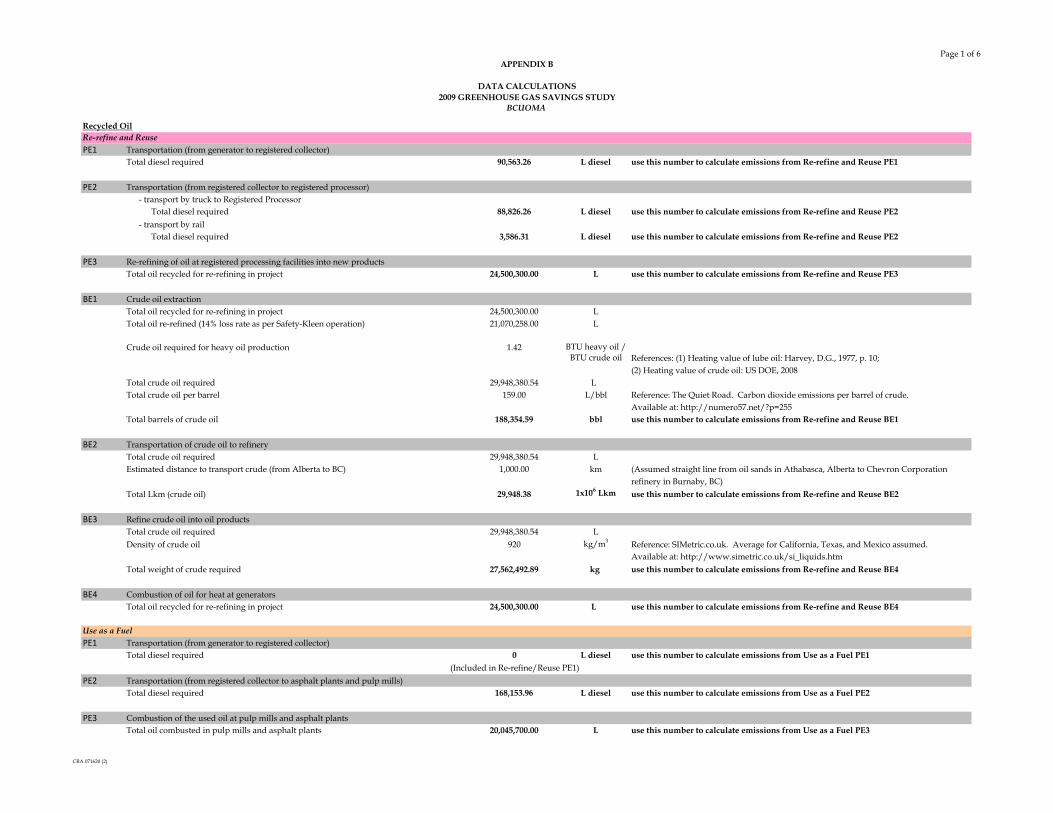
APPENDIX B
DATA CALCULATIONS2009 GREENHOUSE GAS SAVINGS STUDY
BCUOMA
Page 1 of 6
Recycled OilRe-refine and ReusePE1 Transportation (from generator to registered collector)
Total diesel required 90,563.26 L diesel use this number to calculate emissions from Re-refine and Reuse PE1
PE2 Transportation (from registered collector to registered processor)- transport by truck to Registered Processor
Total diesel required 88,826.26 L diesel use this number to calculate emissions from Re-refine and Reuse PE2- transport by rail
Total diesel required 3,586.31 L diesel use this number to calculate emissions from Re-refine and Reuse PE2
PE3 Re-refining of oil at registered processing facilities into new productsTotal oil recycled for re-refining in project 24,500,300.00 L use this number to calculate emissions from Re-refine and Reuse PE3
BE1 Crude oil extractionTotal oil recycled for re-refining in project 24,500,300.00 LTotal oil re-refined (14% loss rate as per Safety-Kleen operation) 21,070,258.00 L
Crude oil required for heavy oil production 1.42 BTU heavy oil / BTU crude oil References: (1) Heating value of lube oil: Harvey, D.G., 1977, p. 10;
(2) Heating value of crude oil: US DOE, 2008Total crude oil required 29,948,380.54 L Total crude oil per barrel 159.00 L/bbl Reference: The Quiet Road. Carbon dioxide emissions per barrel of crude.
Available at: http://numero57.net/?p=255Total barrels of crude oil 188,354.59 bbl use this number to calculate emissions from Re-refine and Reuse BE1
BE2 Transportation of crude oil to refineryTotal crude oil required 29,948,380.54 LEstimated distance to transport crude (from Alberta to BC) 1,000.00 km (Assumed straight line from oil sands in Athabasca, Alberta to Chevron Corporation
refinery in Burnaby, BC)Total Lkm (crude oil) 29,948.38 1x10⁶ Lkm use this number to calculate emissions from Re-refine and Reuse BE2
BE3 Refine crude oil into oil productsTotal crude oil required 29,948,380.54 LDensity of crude oil 920 kg/m3 Reference: SIMetric.co.uk. Average for California, Texas, and Mexico assumed.
Available at: http://www.simetric.co.uk/si_liquids.htmTotal weight of crude required 27,562,492.89 kg use this number to calculate emissions from Re-refine and Reuse BE4
BE4 Combustion of oil for heat at generatorsTotal oil recycled for re-refining in project 24,500,300.00 L use this number to calculate emissions from Re-refine and Reuse BE4
Use as a FuelPE1 Transportation (from generator to registered collector)
Total diesel required 0 L diesel use this number to calculate emissions from Use as a Fuel PE1(Included in Re-refine/Reuse PE1)
PE2 Transportation (from registered collector to asphalt plants and pulp mills)Total diesel required 168,153.96 L diesel use this number to calculate emissions from Use as a Fuel PE2
PE3 Combustion of the used oil at pulp mills and asphalt plantsTotal oil combusted in pulp mills and asphalt plants 20,045,700.00 L use this number to calculate emissions from Use as a Fuel PE3
CRA 071620 (2)

APPENDIX B
DATA CALCULATIONS2009 GREENHOUSE GAS SAVINGS STUDY
BCUOMA
Page 2 of 6
BE1 Crude oil extractionTotal oil sent for fuel use in project 20,045,700.00 L Crude oil required for heavy oil production 1.42 BTU heavy oil /
BTU crude oil References: (1) Heating value of lube oil: Harvey, D.G., 1977, p. 10;(2) Heating value of crude oil: US DOE, 2008
Total crude oil required 28,492,116.79 L Total crude oil per barrel 159 L/bbl Reference: The Quiet Road. Carbon dioxide emissions per barrel of crude.
Available at: http://numero57.net/?p=255Total barrels of crude oil 179,195.70 bbl use this number to calculate emissions from Use as a Fuel BE1
BE2 Transportation of crude oil to refineryTotal crude oil required 28,492,116.79 LEstimated distance to transport crude (from Alberta to BC) 1,000.00 km (Assumed straight line from oil sands in Athabasca, Alberta to Chevron Corporation
refinery in Burnaby, BC)Total Lkm (crude oil) 28,492.12 1x10⁶ Lkm use this number to calculate emissions from Use as a Fuel BE2
BE3 Refine crude oil into oil productsTotal crude oil required 28,492,116.79 LDensity of crude oil 920 kg/m3 Reference: SIMetric.co.uk. Average for California, Texas, and Mexico assumed.
Available at: http://www.simetric.co.uk/si_liquids.htmTotal weight of crude required 26,222,244.82 kg use this number to calculate emissions from Use as a Fuel BE3
BE4 Combustion of oil for heat at generatorsTotal oil sent for fuel use in project 20,045,700.00 L use this number to calculate emissions from Use as a Fuel BE4
Recycled Oil FiltersMetal Oil FiltersPE1 Transportation (from generator to registered collector)
Total diesel required 2,884.29 L diesel use this number to calculate emissions from Metal Oil Filters PE1
PE2 Transportation (from registered collector to registered steel oil filter processor)Total diesel required 10,153.82 L diesel use this number to calculate emissions from Metal Oil Filters PE2
PE3 Processing of steel oil filters (crushed into cubes and cylinders)
Energy requirements for M&R Environmental Reference: Provided by Rahmet Vefghi from M&R Environmental via email on July 14, 2012007 2008 Average Usages
Electricity (kWh) 245,412 339,943 292,678 Office and plant requirementsNatural gas (GJ) 4,490 5,104 720 Heating for plant and distillation (approx. 85% used in distillation unit for antifreeze - assumDiesel (L) 112,840 132,946 not applicable Transportation (collection)Bio-diesel (L) 84,883 104,264 not applicable Transportation (collection)Gasoline (L) 31,524 37,615 not applicable Transportation (employees, sales reps, etc.)Propane (L) 6,342 7,781 7,062 Fork lifts in plant
Notes:15% natural gas to be distributed between steel filters, paper filters and containers based on weight recycled.Fork lift energy usage to be divided between steel filters, paper filters, and containers based on weight recycled.Electrical energy requirements for steel filter, paper filter, and container processing to be calculated based on industrial equipment similar to what is used.Energy requirements for oil at M&R Environmental is minimal. Oil is collected in pumper truck, which is pumped to tanks by an electrical pump then sent to customer for reuse or re-refining.Energy requirements assumed negligible.Amount of materials recycled by M&R not available for 2007 or 2008, therefore, average energy requirements for each year assumed and amounts of recycled material used for 2009.
CRA 071620 (2)

APPENDIX B
DATA CALCULATIONS2009 GREENHOUSE GAS SAVINGS STUDY
BCUOMA
Page 3 of 6
Amount processed by M & R Environmental (2009)Total Filters 1,095,342 kgSteel Filters 1,007,714 kgPaper Filters 87,627 kgOil Containers 468,752 kg
Electricity
Filter CrusherNotes: 1. Actual plant data for electricity requirements of filter crusher unavailable. Assumed requirements similar to another filter crusher found (Filtermatic)2. Once the electricity requirements are estimated for crushing all the filters (steel and paper), the remaining electricity will be assumed for the processing of oil containers.3. 20% of the total electricity requirements has been assumed for the office, which will be distributed between the steel filters, paper filters, and containers by weight.
FiltermaticVoltage (outlet) 110 Volts Reference: Email from Zach Arnold, Arnold Machine Inc., Filtermatic Distributor, July 26, 2Current (at full load) 15 Amps Reference: Email from Zach Arnold, Arnold Machine Inc., Filtermatic Distributor, July 26, 2
Hydraulic pump motor will run idle for around 60 seconds without filters then automatically shut off and restart when more filters are added.Assumed crusher runs continuously throughout the day, therefore idle energy usage is minimal.
The crusher will process 50 - 60 filters per hour. Assume 55 per hour. Reference: Email from Zach Arnold, Arnold Machine Inc., Filtermatic Distributor, July 26, 255 filters/hr
P (watts) = V (volts) * I (amps) 1,650 Watts
M & R EnvironmentalTotal steel filters to crush in 2009 1,344,611.12 steel filtersTotal paper filters to crush in 2009 116,922.71 paper filters
Total time required to crush steel filters 24,447.47 hours2,037.29 days (at 12 hrs per day)
Electricity required to crush steel filters 40,338,333.68 WhElectricity required for crusher (steel filters) 40,338.33 kWh
Total time required to crush paper filters 4,251.73 hours (paper filters are crushed twice at M&R to remove more oil)354.31 days (at 12 hrs per day)
Electricity required to crush paper filters 7,015,362.38 WhElectricity required for crusher (paper filters) 7,015.36 kWh
Office Electricity Requirements (assumed 20% of total)Office electricity requirements 58,535.50 kWh
Steel Filters 37,713.26 kWh (Divided based on weight)Paper Filters 3,279.41 kWhOil Containers 17,542.83 kWh
CRA 071620 (2)

APPENDIX B
DATA CALCULATIONS2009 GREENHOUSE GAS SAVINGS STUDY
BCUOMA
Page 4 of 6
Oil Container ProcessingAssumed electricity requirements for oil container processing are the total electricity requirements for M & R minus electricity requirements to crush filters and requirements for office.
Electricity required to process oil containers 186,788.30 kWh
Steel Filters 78,051.59 kWh for M & R0.077 kWh/kg
277,166.19 kWh (total) use this number to calculate emissions from Metal Oil Filters PE3 (electricity)Paper Filters 10,294.78 kWh for M & R
0.117 kWh/kg36,557.41 kWh (total) use this number to calculate emissions from Paper Oil Filters PE3 (electricity)
Oil Containers 204,331.13 kWh for M & R0.436 kWh/kg
503,582.10 kWh (total) use this number to calculate emissions from Oil Containers PE3 (electricity)
Natural GasSteel Filters 463.61 GJ for M & R
4.60E-04 GJ/kg1,646.30 GJ (total) use this number to calculate emissions from Metal Oil Filters PE3 (natural gas)
Paper Filters 40.31 GJ for M & R4.60E-04 GJ/kg143.16 GJ (total) use this number to calculate emissions from Paper Oil Filters PE3 (natural gas)
Oil Containers 215.65 GJ for M & R4.60E-04 GJ/kg531.48 GJ (total) use this number to calculate emissions from Oil Containers PE3 (natural gas)
PropaneSteel Filters 4,549.58 L for M & R
4.51E-03 L/kg16,155.86 L (total) use this number to calculate emissions from Metal Oil Filters PE3 (propane)
Paper Filters 395.62 L for M & R4.51E-03 L/kg1,404.86 L (total) use this number to calculate emissions from Paper Oil Filters PE3 (propane)
Oil Containers 2,116.30 L for M & R4.51E-03 L/kg5,215.70 L (total) use this number to calculate emissions from Oil Containers PE3 (propane)
PE4 Transportation of steel to metal brokerTotal diesel required 11,869.78 L diesel use this number to calculate emissions from Metal Oil Filters PE4
PE5 Transportation of steel to steel millTotal diesel required 11,137.09 L diesel use this number to calculate emissions from Metal Oil Filters PE5
BE1 Production of steelTotal number of steel filters recycled 4,774,800.00 steel filtersTotal weight of steel filters 2,683,843.32 kgDivided by 1000 2,683.84 1000 kg use this number to calculate emissions from Metal Oil Filters BE1
CRA 071620 (2)

APPENDIX B
DATA CALCULATIONS2009 GREENHOUSE GAS SAVINGS STUDY
BCUOMA
Page 5 of 6
BE2 Transportation of steel to steel millTotal diesel required 0 L diesel use this number to calculate emissions from Metal Oil Filters BE2
(Included in BE1 above)BE3 Transportation of steel filters to landfill
Total diesel required 12,478.33 L diesel use this number to calculate emissions from Metal Oil Filters BE3(metal assumed inert material - no LFG production)
Paper Oil FiltersPE1 Transportation (from generator to registered collector)
Total diesel required 0 L diesel use this number to calculate emissions from Paper Oil Filters PE1(Included in Metal Filters PE1)
PE2 Transportation (from registered collector to registered paper oil filter processor)Total diesel required 0 L diesel use this number to calculate emissions from Paper Oil Filters PE2
(Included in Metal Filters PE2)PE3 Processing of paper oil filters (crushed and incinerated)
Total electricity required 36,557.41 kWh use this number to calculate emissions from Paper Oil Filters PE3 (electricity)
Total natural gas required 143.16 GJ use this number to calculate emissions from Paper Oil Filters PE3 (natural gas)
Total propane required 1,404.86 L use this number to calculate emissions from Paper Oil Filters PE3 (propane)
Total mass of paper filters incinerated 311,170.24 kg use this number to calculate emissions from Paper Oil Filters PE3 (incineration)
BE1 Transportation of paper filters to landfillTotal diesel required 0 L diesel use this number to calculate emissions from Paper Oil Filters BE1
(Included in Metal Filters BE3)BE2 Decomposition of paper filters in landfill
*CRA completed landfill gas modelling separate from this file
Recycled Oil ContainersPE1 Transportation (from generator to registered collector)
Total diesel required 833.25 L diesel use this number to calculate emissions from Recycled Oil Containers PE1
PE2 Transportation (from registered collector to registered oil container processor)Total diesel required 2,357.37 L diesel use this number to calculate emissions from Recycled Oil Containers PE2
PE3 Processing of oil containers (shredded, centrifuged, washed and pelletized)
Total electricity required 503,582.10 kWh use this number to calculate emissions from Oil Containers PE3 (electricity)
Total natural gas required 531.48 GJ use this number to calculate emissions from Oil Containers PE3 (natural gas)
Total propane required 5,215.70 L use this number to calculate emissions from Oil Containers PE3 (propane)
PE4 Transportation of HDPE pellets to plastics manufacturerTotal diesel required 1,938.18 L diesel use this number to calculate emissions from Recycled Oil Containers PE4
CRA 071620 (2)

APPENDIX B
DATA CALCULATIONS2009 GREENHOUSE GAS SAVINGS STUDY
BCUOMA
Page 6 of 6
BE1 Production of HDPETotal weight of plastic containers 1,039,731.62 kgDivided by 1000 1,039.73 1000 kg use this number to calculate emissions from Recycled Oil Containers BE1
BE2 Transportation of HDPE to plastics manufacturerTotal diesel required 0 L diesel use this number to calculate emissions from Recycled Oil Containers BE2
(Included in BE1 above)BE3 Transportation of oil containers to disposal facility
Total diesel required 11,929.99 L diesel use this number to calculate emissions from Recycled Oil Containers BE3(plastics are assumed inert material - no LFG production)
back to top
CRA 071620 (2)

071620 (2)
APPENDIX C
RAW EMISSION FACTOR DATA (GLOBAL WARMING POTENTIAL)

APPENDIX C
RAW EMISSION FACTOR DATA (GLOBAL WARMING POTENTIAL)2009 GREENHOUSE GAS SAVINGS STUDY
BCUOMA
Page 1 of 11
Emission Factor (GHG) Data Per Element
Recycled OilRe-refine and ReuseProject PE1 Transportation (from generator to registered collector)
PE2 Transportation (from registered collector to registered processor)PE3 Re-refining of oil at registered processing facilities into new products
Baseline BE1 Crude oil extractionBE2 Transportation of crude oil to refineryBE3 Refine crude oil into oil productsBE4 Combustion of oil for heat at generators
Use as a FuelProject PE1 Transportation (from generator to registered collector)
PE2 Transportation (from registered collector to asphalt plants and pulp mills)PE3 Combustion of the used oil at pulp mills and asphalt plants
Baseline BE1 Crude oil extractionBE2 Transportation of crude oil to refineryBE3 Refine crude oil into oil productsBE4 Combustion of oil for heat at generators
Recycled Oil FiltersMetal Oil FiltersProject PE1 Transportation (from generator to registered collector)
PE2 Transportation (from regstered collector to registered steel oil filter processor)PE3 Processing of steel oil filters (crushed into cubes and cylinders)PE4 Transportation of steel to metal brokerPE5 Transportation of steel to steel mill
Baseline BE1 Production of steelBE2 Transportation of steel to steel millBE3 Transportation of steel filters to disposal facility
Paper FiltersProject PE1 Transportation (from generator to registered collector)
PE2 Transportation (from registered collector to registered paper oil filter processor)PE3 Processing of paper oil filters (crushed and incinerated)
Baseline BE1 Transportation of paper filters to landfillBE2 Decomposition of paper filters in landfill
Recycled Oil ContainersProject PE1 Transportation (from generator to registered collector)
PE2 Transportation (from registered collector to registered oil container processor)PE3 Processing of oil containers (shredded, centrifuged, washed and pelletized)PE4 Transportation of HDPE pellets to plastics manufacturer
Baseline BE1 Production of HDPEBE2 Transportation of HDPE to plastics manufacturerBE3 Transportation of oil containers to disposal facility
CRA 071620 (2)

APPENDIX C
RAW EMISSION FACTOR DATA (GLOBAL WARMING POTENTIAL)2009 GREENHOUSE GAS SAVINGS STUDY
BCUOMA
Page 2 of 11
Recycled Oil
Re-refine and ReusePE1 Transportation (from generator to registered collector) (re-refine and reuse)
back to top Energy Mobile Combustion Sources - Road Transport Environment Canada, National Inventory Report, Greenhouse Gas Sources and Sinks in Canada, 1990-2008. TaHeavy Duty Diesel Vehicles (Moderate Control) (weight of truck and load greater than 3900 kg)
kg CO2eEmission
kg CO2e/unitCarbon dioxide 2663 g CO2/L 1 2.663Methane 0.14 g CH4/L 25 0.004Nitrous oxide 0.082 g N2O/L 298 0.024
PE2 Transportation (from registered collector to registered processor) (rerefine and reuse) See Recycled Oil, Re‐refine and Reuse, PE1, Transportation (from generator to registered collector)back to top For transport by truck
Transport to Breslau, Ontario by rail Environment Canada, National Inventory Report, Greenhouse Gas Sources and Sinks in Canada, 1990-2008. TaDiesel Train
kg CO2eEmission
kg CO2e/unitCarbon dioxide 2663 g CO2/L 1 2.663Methane 0.15 g CH4/L 25 0.004Nitrous oxide 1.1 g N2O/L 298 0.328
PE3 Re-refining of oil at registered processing facilities into new productsback to top Emission factors from the report, "Safety-Kleen Product Carbon Footprint for Re-refined Base Oil", prepared for Safety-Kleen Systems, Inc.,
prepared by ENVIRON International Corporation, dated October 2009.
Table 3-2 Emissions
Re-refinery input materials 90 g CO2e/gal base oil produced (assumes 14% loss rate)re-refinery diesel 3 g CO2e/gal base oil produced (assumes 14% loss rate)re-refinery electricity 202 g CO2e/gal base oil produced (assumes 14% loss rate)re-refinery natural gas 732 g CO2e/gal base oil produced (assumes 14% loss rate)re-refinery fuel (co-products consumed on-site) 536 g CO2e/gal base oil produced (assumes 14% loss rate)Waste (including energy recovery) 2.8 g CO2e/gal base oil produced (assumes 14% loss rate)Co-products -181 g CO2e/gal base oil produced (assumes 14% loss rate) (offsetting the production of other materials)Used Oil Input (virgin embodied) 14% loss rate is accounted for in the baseline - baseline oil quantity decreased by 14%
Total emissions 1,384.80 g CO2e/gal base oil produced0.37 kg CO2e/L oil produced
CRA 071620 (2)

APPENDIX C
RAW EMISSION FACTOR DATA (GLOBAL WARMING POTENTIAL)2009 GREENHOUSE GAS SAVINGS STUDY
BCUOMA
Page 3 of 11
BE1 Crude oil extraction (re-refine and reuse)back to top Produce Heavy Crude Oil Pembina Institute, Produce Crude Oil (Heavy crude oil)
Air emissions associated with initial oil well development, including exploratory drilling, development drilling and production.Canadian-based data. Does not include transmission of oil.
Carbon dioxide equivalents (unit = 1 bbl crude oil) 96.814 kg CO2e/unit
Produce Light and Medium Crude Oil Pembina Institute, Produce Crude Oil (Light and medium crude oil)Air emissions associated with initial oil well development, including exploratory drilling, development drilling and production.Canadian-based data. Does not include transmission of oil.
Carbon dioxide equivalents (unit = 1 bbl crude oil) 29.465 kg CO2e/unit
Breakdown of light, medium, and heavy oil not provided; assumed 30% of eachTherefore, weighted emission factor 51.91 kg CO2e/unit
BE2 Transportation of crude oil to refinery (re-refine and reuse)back to top Crude Oil Transmission Pembina Institute, Transmit Crude Oil
The piping of crude oil using diesel generatorsUS data, 1991. Only CO2 emissions. Fugitive emissions not accounted for.
Carbon dioxide emissions (unit = 1x10⁶ lkm) 9.026986 kg CO2e/unit
CRA 071620 (2)

APPENDIX C
RAW EMISSION FACTOR DATA (GLOBAL WARMING POTENTIAL)2009 GREENHOUSE GAS SAVINGS STUDY
BCUOMA
Page 4 of 11
BE3 Refine crude oil into oil products (re-refine and reuse)back to top Bitumen, at refinery Ecoinvent Database
Survey of Eurpoean refineries for 1 kg crude oil through refinery.All processes in the refinery site excluding the emissions from combustion facilities, including waste water treatment, process emissions and direct discharges to rivers.Description of all flows of materials and energy due to the throughput of 1kg crude oil in the refinery.
Name Unit Category kg CO2e SubcategoryMean Value
kg/unitEmission
kg CO2e/unitCarbon dioxide, fossil kg air 1 high population density 0.17648 0.17648Carbon dioxide, fossil kg air 1 low population density 0.18956 0.18956Carbon dioxide, fossil kg air 1 lower stratosphere + upper troposphere 1.2762E-08 1.2762E-08Carbon dioxide, fossil kg air 1 unspecified 0.015976 0.015976Carbon dioxide, land transformation kg air 1 low population density 0.00001408 0.00001408Carbon monoxide, fossil kg air 1.5714 high population density 0.000042 6.59988E-05Carbon monoxide, fossil kg air 1.5714 low population density 0.00037319 0.000586431Carbon monoxide, fossil kg air 1.5714 lower stratosphere + upper troposphere 1.499E-11 2.35553E-11Carbon monoxide, fossil kg air 1.5714 unspecified 0.00022698 0.000356676Chloroform kg air 30 high population density 2.5462E-11 7.6386E-10Chloroform kg air 30 low population density 9.1182E-13 2.73546E-11Chloroform kg air 30 unspecified 8.7759E-20 2.63277E-18Dinitrogen monoxide kg air 298 high population density 2.7376E-06 0.000815805Dinitrogen monoxide kg air 298 low population density 3.8701E-06 0.00115329Dinitrogen monoxide kg air 298 lower stratosphere + upper troposphere 1.2154E-13 3.62189E-11Dinitrogen monoxide kg air 298 unspecified 0.000001045 0.00031141Ethane, 1,1,1,2-tetrafluoro-, HFC-134a kg air 1430 high population density 6.5154E-13 9.31702E-10Ethane, 1,1,1,2-tetrafluoro-, HFC-134a kg air 1430 low population density 4.7994E-11 6.86314E-08Ethane, 1,1,1,2-tetrafluoro-, HFC-134a kg air 1430 unspecified 2.4861E-09 3.55512E-06Ethane, 1,1,2-trichloro-1,2,2-trifluoro-, CFC-113 kg air 6130 high population density 1.5215E-13 9.3268E-10Ethane, 1,1,2-trichloro-1,2,2-trifluoro-, CFC-113 kg air 6130 unspecified 0Ethane, 1,1-difluoro-, HFC-152a kg air 124 high population density 6.2333E-11 7.72929E-09Ethane, 1,1-difluoro-, HFC-152a kg air 124 low population density 0Ethane, 1,2-dichloro-1,1,2,2-tetrafluoro-, CFC-114 kg air 10000 low population density 8.2924E-10 8.2924E-06Ethane, 2-chloro-1,1,1,2-tetrafluoro-, HCFC-124 kg air 609 unspecified 0Ethane, hexafluoro-, HFC-116 kg air 12200 high population density 1.2022E-11 1.46668E-07Ethane, hexafluoro-, HFC-116 kg air 12200 unspecified 4.0057E-10 4.88695E-06Methane, biogenic kg air 25 high population density 3.4875E-08 8.71875E-07Methane, biogenic kg air 25 low population density 1.2844E-06 0.00003211Methane, bromo-, Halon 1001 kg air 25 unspecified 9.4034E-07 2.35085E-05Methane, bromochlorodifluoro-, Halon 1211 kg air 1890 low population density 5.9096E-10 1.11691E-06Methane, bromotrifluoro-, Halon 1301 kg air 7140 high population density 1.5838E-16 1.13083E-12Methane, bromotrifluoro-, Halon 1301 kg air 7140 low population density 3.6366E-08 0.000259653Methane, chlorodifluoro-, HCFC-22 kg air 1810 high population density 1.1057E-11 2.00132E-08Methane, chlorodifluoro-, HCFC-22 kg air 1810 low population density 2.3112E-09 4.18327E-06Methane, chlorotrifluoro-, CFC-13 kg air 14000 unspecified 0Methane, dichloro-, HCC-30 kg air 8.7 high population density 3.549E-12 3.08763E-11Methane, dichloro-, HCC-30 kg air 8.7 low population density 2.6986E-12 2.34778E-11
CRA 071620 (2)

APPENDIX C
RAW EMISSION FACTOR DATA (GLOBAL WARMING POTENTIAL)2009 GREENHOUSE GAS SAVINGS STUDY
BCUOMA
Page 5 of 11
Methane, dichlorodifluoro-, CFC-12 kg air 10900 high population density 1.2761E-12 1.39095E-08Methane, dichlorodifluoro-, CFC-12 kg air 10900 low population density 4.7836E-12 5.21412E-08Methane, dichlorodifluoro-, CFC-12 kg air 10900 unspecified 1.5816E-19 1.72394E-15Methane, dichlorofluoro-, HCFC-21 kg air 210 high population density 1.8537E-15 3.89277E-13Methane, fossil kg air 25 high population density 0.000068837 0.001720925Methane, fossil kg air 25 low population density 0.0017109 0.0427725Methane, fossil kg air 25 lower stratosphere + upper troposphere 2.0257E-13 5.06425E-12Methane, fossil kg air 25 unspecified 1.0025E-06 2.50625E-05Methane, monochloro-, R-40 kg air 13 high population density 4.4155E-14 5.74015E-13Methane, monochloro-, R-40 kg air 13 low population density 4.9275E-12 6.40575E-11Methane, tetrachloro-, R-10 kg air 1400 high population density 5.6656E-10 7.93184E-07Methane, tetrachloro-, R-10 kg air 1400 unspecified 7.0721E-17 9.90094E-14Methane, tetrafluoro-, R-14 kg air 7390 high population density 3.2059E-12 2.36916E-08Methane, tetrafluoro-, R-14 kg air 7390 unspecified 3.6052E-09 2.66424E-05Methane, trichlorofluoro-, CFC-11 kg air 4750 high population density 3.0093E-15 1.42942E-11Methane, trifluoro-, HFC-23 kg air 14800 high population density 5.8981E-13 8.72919E-09Nitrogen fluoride kg air 17200 high population density 0Sulfur hexafluoride kg air 22800 high population density 0Sulfur hexafluoride kg air 22800 low population density 3.9467E-12 8.99848E-08Sulfur hexafluoride kg air 22800 unspecified 1.0784E-08 0.000245875
0.430450114 Total emissions for 1 kcrude oil through refi
BE4 Combustion of oil for heat at generators (re-refine and reuse)back to top Heavy Oil Combustion (Industrial) Environment Canada, National Inventory Report, Greenhouse Gas Sources and Sinks in Canada, 1990-2008
kg CO2eEmission
kg CO2e/unitCarbon dioxide 3124 g CO2/L 1 3.124Methane 0.12 g CH4/L 25 0.003Nitrous oxide 0.064 g N2O/L 298 0.019
Use as a FuelPE1 Transportation (from generator to registered collector) (use as a fuel) See Recycled Oil, Re‐refine and Reuse, PE1, Transportation (from generator to registered collector)
back to top
PE2 Transportation (from registered collector to asphalt plants and pulp mills) See Recycled Oil, Re‐refine and Reuse, PE1, Transportation (from generator to registered collector)back to top
PE3 Combustion of the used oil at pulp mills and asphalt plants See Recycled Oil, Re‐refine and Reuse, BE4, Combustion of oil for heat at generatorsback to top
BE1 Crude oil extraction (use as a fuel) See Recycled Oil, Re-refine and Reuse, BE1, Crude oil extraction (re-refine and reuse)back to top
BE2 Transportation of crude oil to refinery (use as a fuel) See Recycled Oil, Re-refine and Reuse, BE2, Transportation of crude oil (re-refine and reuse)back to top
CRA 071620 (2)

APPENDIX C
RAW EMISSION FACTOR DATA (GLOBAL WARMING POTENTIAL)2009 GREENHOUSE GAS SAVINGS STUDY
BCUOMA
Page 6 of 11
BE3 Refine crude oil into oil products (use as a fuel) See Recycled Oil, Re-refine and Reuse, BE3, Refine crude oil into pil products (re-refine and reuse)back to top
BE4 Combustion of oil for heat at generators (use as a fuel) See Recycled Oil, Re‐refine and Reuse, BE4, Combustion of oil for heat at generatorsback to top
Recycled Oil Filters
Metal Oil FiltersPE1 Transportation (from generator to registered collector) (metal oil filters) See Recycled Oil, Re‐refine and Reuse, PE1, Transportation (from generator to registered collector)
back to top
PE2 Transportation (from registered collector to registered steel oil filter processor) See Recycled Oil, Re‐refine and Reuse, PE1, Transportation (from generator to registered collector)back to top
PE3 Processing of steel oil filters (crushed into cubes and cylinders)back to top
Electricity Production
Electricity generation intensity for British Columbia 0.02 kg CO2e/ kWh
Environment Canada, National Inventory Report, Greenhouse Gas Sources and Sinks in Canada, 1990-2008. Ta
Natural Gas - Production, Processing, and DistributingNatural Gas Production (Canada - 2000) 2.18E+11 m3/year Canadian Association of Petroleum Producers. 2005. A National Inventory of Greenhouse Gas (GHG), Emissions - Upstream NG (Produce, Process, Transport) CO2 44,866 kt/year Criteria Air Contaminant (CAC) and Hydrogen Sulphide (H2S) Emissions by the Upstream Oil and Gas IndustrEmissions - Upstream NG (Produce, Process, Transport) CH4 1,849 kt/year Volume 1, Overview of the GHG Emissions Inventory,Emissions - Upstream NG (Produce, Process, Transport) NOx 2.13 kt/year http://www.capp.ca/library/publications/climateChange/Pages/default.aspx
Energy content of natural gas 37.63 MJ/m3 Energy Density of Natural Gas. Average value taken. Available at: http://hypertextbook.com/facts/2004/Jess
kg/ m3
natural gas kg CO2e/GJ natural gas kg CO2eEmission
kg CO2e/unitCarbon dioxide 0.21 kg CO2 5.48 1 5.48Methane 8.50E-03 kg CH4 0.23 25 5.65Nitrous oxide 9.79E-06 kg N2O 2.60E-04 298 7.75E-02
Natural Gas - Combustion for HeatEnvironmental Protection Agency. 1998. AP 42, Fifth Edition, Volume I Chapter 1: External Combustion Source1.4 Natural Gas Combustion, http://www.epa.gov/ttn/chief/ap42/ch01/index.html.
kg/106 m3
natural gas kg CO2e/GJ natural gas kg CO2eEmission
kg CO2e/unitCarbon dioxide 1,920,000 kg CO2 51.02 1 51.02Carbon monoxide 640 kg CO 1.70E-02 1.57 2.67E-02Methane 37 kg CH4 9.78E-04 25 2.44E-02Nitrous oxide 1,504 kg N2O 4.00E-02 298 1.19E+01
CRA 071620 (2)
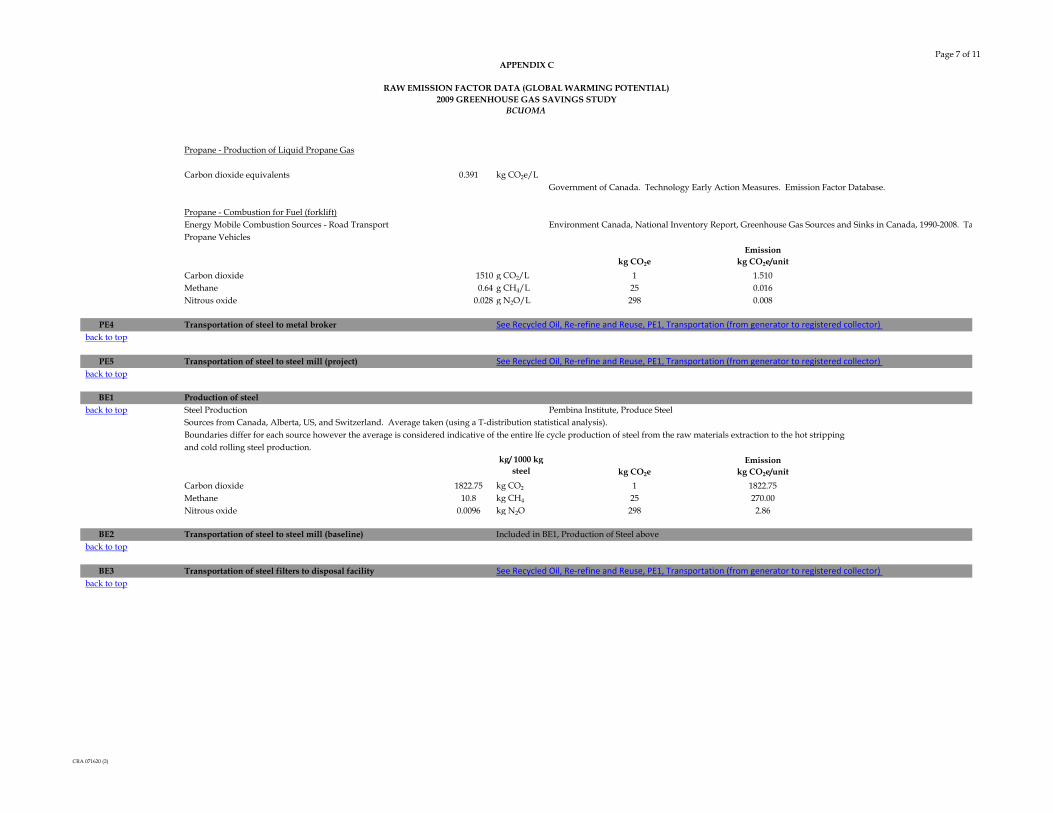
APPENDIX C
RAW EMISSION FACTOR DATA (GLOBAL WARMING POTENTIAL)2009 GREENHOUSE GAS SAVINGS STUDY
BCUOMA
Page 7 of 11
Propane - Production of Liquid Propane Gas
Carbon dioxide equivalents 0.391 kg CO2e/LGovernment of Canada. Technology Early Action Measures. Emission Factor Database.
Propane - Combustion for Fuel (forklift)Energy Mobile Combustion Sources - Road Transport Environment Canada, National Inventory Report, Greenhouse Gas Sources and Sinks in Canada, 1990-2008. TaPropane Vehicles
kg CO2eEmission
kg CO2e/unitCarbon dioxide 1510 g CO2/L 1 1.510Methane 0.64 g CH4/L 25 0.016Nitrous oxide 0.028 g N2O/L 298 0.008
PE4 Transportation of steel to metal broker See Recycled Oil, Re‐refine and Reuse, PE1, Transportation (from generator to registered collector)back to top
PE5 Transportation of steel to steel mill (project) See Recycled Oil, Re‐refine and Reuse, PE1, Transportation (from generator to registered collector)back to top
BE1 Production of steelback to top Steel Production Pembina Institute, Produce Steel
Sources from Canada, Alberta, US, and Switzerland. Average taken (using a T-distribution statistical analysis).Boundaries differ for each source however the average is considered indicative of the entire lfe cycle production of steel from the raw materials extraction to the hot stripping and cold rolling steel production.
kg/ 1000 kg steel kg CO2e
Emission kg CO2e/unit
Carbon dioxide 1822.75 kg CO2 1 1822.75Methane 10.8 kg CH4 25 270.00Nitrous oxide 0.0096 kg N2O 298 2.86
BE2 Transportation of steel to steel mill (baseline) Included in BE1, Production of Steel aboveback to top
BE3 Transportation of steel filters to disposal facility See Recycled Oil, Re‐refine and Reuse, PE1, Transportation (from generator to registered collector)back to top
CRA 071620 (2)
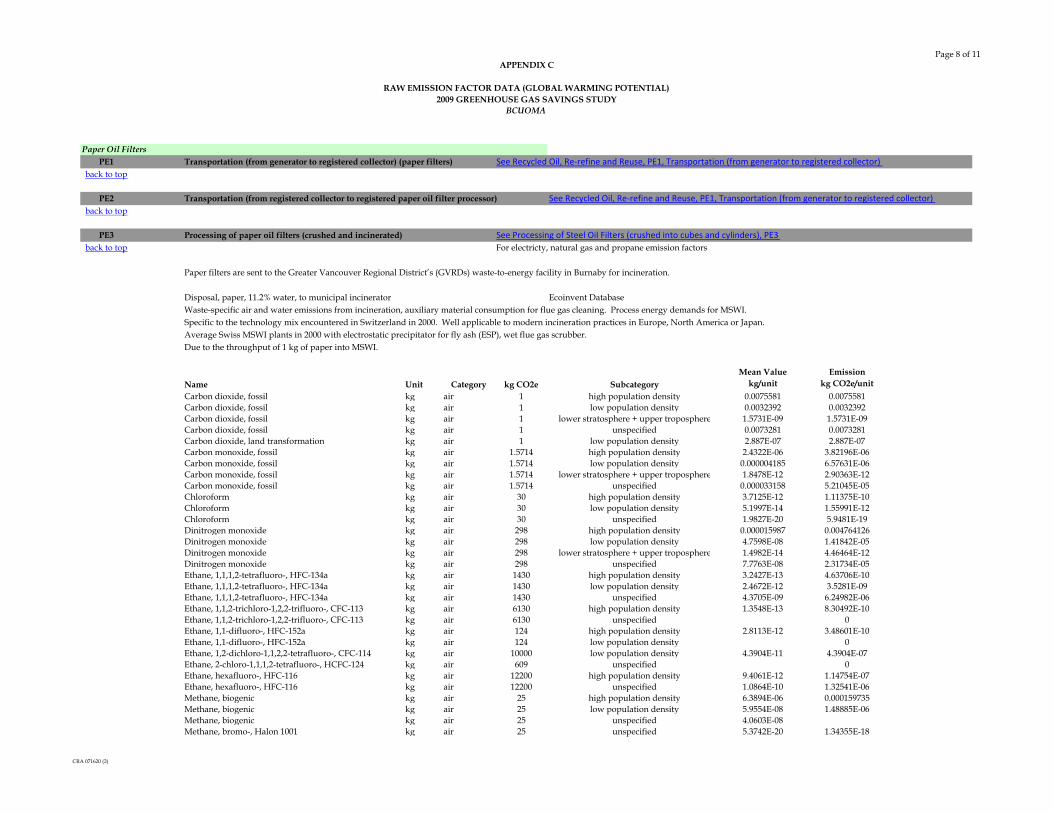
APPENDIX C
RAW EMISSION FACTOR DATA (GLOBAL WARMING POTENTIAL)2009 GREENHOUSE GAS SAVINGS STUDY
BCUOMA
Page 8 of 11
Paper Oil FiltersPE1 Transportation (from generator to registered collector) (paper filters) See Recycled Oil, Re‐refine and Reuse, PE1, Transportation (from generator to registered collector)
back to top
PE2 Transportation (from registered collector to registered paper oil filter processor) See Recycled Oil, Re‐refine and Reuse, PE1, Transportation (from generator to registered collector)back to top
PE3 Processing of paper oil filters (crushed and incinerated) See Processing of Steel Oil Filters (crushed into cubes and cylinders), PE3back to top For electricty, natural gas and propane emission factors
Paper filters are sent to the Greater Vancouver Regional District’s (GVRDs) waste-to-energy facility in Burnaby for incineration.
Disposal, paper, 11.2% water, to municipal incinerator Ecoinvent DatabaseWaste-specific air and water emissions from incineration, auxiliary material consumption for flue gas cleaning. Process energy demands for MSWI.Specific to the technology mix encountered in Switzerland in 2000. Well applicable to modern incineration practices in Europe, North America or Japan.Average Swiss MSWI plants in 2000 with electrostatic precipitator for fly ash (ESP), wet flue gas scrubber.Due to the throughput of 1 kg of paper into MSWI.
Name Unit Category kg CO2e SubcategoryMean Value
kg/unitEmission
kg CO2e/unitCarbon dioxide, fossil kg air 1 high population density 0.0075581 0.0075581Carbon dioxide, fossil kg air 1 low population density 0.0032392 0.0032392Carbon dioxide, fossil kg air 1 lower stratosphere + upper troposphere 1.5731E-09 1.5731E-09Carbon dioxide, fossil kg air 1 unspecified 0.0073281 0.0073281Carbon dioxide, land transformation kg air 1 low population density 2.887E-07 2.887E-07Carbon monoxide, fossil kg air 1.5714 high population density 2.4322E-06 3.82196E-06Carbon monoxide, fossil kg air 1.5714 low population density 0.000004185 6.57631E-06Carbon monoxide, fossil kg air 1.5714 lower stratosphere + upper troposphere 1.8478E-12 2.90363E-12Carbon monoxide, fossil kg air 1.5714 unspecified 0.000033158 5.21045E-05Chloroform kg air 30 high population density 3.7125E-12 1.11375E-10Chloroform kg air 30 low population density 5.1997E-14 1.55991E-12Chloroform kg air 30 unspecified 1.9827E-20 5.9481E-19Dinitrogen monoxide kg air 298 high population density 0.000015987 0.004764126Dinitrogen monoxide kg air 298 low population density 4.7598E-08 1.41842E-05Dinitrogen monoxide kg air 298 lower stratosphere + upper troposphere 1.4982E-14 4.46464E-12Dinitrogen monoxide kg air 298 unspecified 7.7763E-08 2.31734E-05Ethane, 1,1,1,2-tetrafluoro-, HFC-134a kg air 1430 high population density 3.2427E-13 4.63706E-10Ethane, 1,1,1,2-tetrafluoro-, HFC-134a kg air 1430 low population density 2.4672E-12 3.5281E-09Ethane, 1,1,1,2-tetrafluoro-, HFC-134a kg air 1430 unspecified 4.3705E-09 6.24982E-06Ethane, 1,1,2-trichloro-1,2,2-trifluoro-, CFC-113 kg air 6130 high population density 1.3548E-13 8.30492E-10Ethane, 1,1,2-trichloro-1,2,2-trifluoro-, CFC-113 kg air 6130 unspecified 0Ethane, 1,1-difluoro-, HFC-152a kg air 124 high population density 2.8113E-12 3.48601E-10Ethane, 1,1-difluoro-, HFC-152a kg air 124 low population density 0Ethane, 1,2-dichloro-1,1,2,2-tetrafluoro-, CFC-114 kg air 10000 low population density 4.3904E-11 4.3904E-07Ethane, 2-chloro-1,1,1,2-tetrafluoro-, HCFC-124 kg air 609 unspecified 0Ethane, hexafluoro-, HFC-116 kg air 12200 high population density 9.4061E-12 1.14754E-07Ethane, hexafluoro-, HFC-116 kg air 12200 unspecified 1.0864E-10 1.32541E-06Methane, biogenic kg air 25 high population density 6.3894E-06 0.000159735Methane, biogenic kg air 25 low population density 5.9554E-08 1.48885E-06Methane, biogenic kg air 25 unspecified 4.0603E-08Methane, bromo-, Halon 1001 kg air 25 unspecified 5.3742E-20 1.34355E-18
CRA 071620 (2)

APPENDIX C
RAW EMISSION FACTOR DATA (GLOBAL WARMING POTENTIAL)2009 GREENHOUSE GAS SAVINGS STUDY
BCUOMA
Page 9 of 11
Methane, bromochlorodifluoro-, Halon 1211 kg air 1890 low population density 1.5025E-10 2.83973E-07Methane, bromotrifluoro-, Halon 1301 kg air 7140 high population density 7.3698E-17 5.26204E-13Methane, bromotrifluoro-, Halon 1301 kg air 7140 low population density 8.5505E-11 6.10506E-07Methane, chlorodifluoro-, HCFC-22 kg air 1810 high population density 5.0685E-12 9.17399E-09Methane, chlorodifluoro-, HCFC-22 kg air 1810 low population density 5.3825E-10 9.74233E-07Methane, chlorotrifluoro-, CFC-13 kg air 14000 unspecified 0Methane, dichloro-, HCC-30 kg air 8.7 high population density 1.6223E-13 1.4114E-12Methane, dichloro-, HCC-30 kg air 8.7 low population density 1.5389E-13 1.33884E-12Methane, dichlorodifluoro-, CFC-12 kg air 10900 high population density 6.8318E-13 7.44666E-09Methane, dichlorodifluoro-, CFC-12 kg air 10900 low population density 5.1289E-13 5.5905E-09Methane, dichlorodifluoro-, CFC-12 kg air 10900 unspecified 3.5731E-20 3.89468E-16Methane, dichlorofluoro-, HCFC-21 kg air 210 high population density 9.2258E-16 1.93742E-13Methane, fossil kg air 25 high population density 1.1812E-06 0.00002953Methane, fossil kg air 25 low population density 0.000032308 0.0008077Methane, fossil kg air 25 lower stratosphere + upper troposphere 2.497E-14 6.2425E-13Methane, fossil kg air 25 unspecified 1.0495E-07 2.62375E-06Methane, monochloro-, R-40 kg air 13 high population density 4.7735E-15 6.20555E-14Methane, monochloro-, R-40 kg air 13 low population density 2.81E-13 3.653E-12Methane, tetrachloro-, R-10 kg air 1400 high population density 7.4786E-11 1.047E-07Methane, tetrachloro-, R-10 kg air 1400 unspecified 1.5977E-17 2.23678E-14Methane, tetrafluoro-, R-14 kg air 7390 high population density 1.4458E-13 1.06845E-09Methane, tetrafluoro-, R-14 kg air 7390 unspecified 9.7775E-10 7.22557E-06Methane, trichlorofluoro-, CFC-11 kg air 4750 high population density 1.4978E-15 7.11455E-12Methane, trifluoro-, HFC-23 kg air 14800 high population density 2.9355E-13 4.34454E-09Nitrogen fluoride kg air 17200 high population density 0Sulfur hexafluoride kg air 22800 high population density 0Sulfur hexafluoride kg air 22800 low population density 3.3619E-13 7.66513E-09Sulfur hexafluoride kg air 22800 unspecified 4.7119E-10 1.07431E-05
0.024018866 Total emissions for 1 kpaper through inciner
BE1 Transportation of paper filters to landfill See Recycled Oil, Re‐refine and Reuse, PE1, Transportation (from generator to registered collector)back to top
CRA 071620 (2)

APPENDIX C
RAW EMISSION FACTOR DATA (GLOBAL WARMING POTENTIAL)2009 GREENHOUSE GAS SAVINGS STUDY
BCUOMA
Page 10 of 11
BE2 Decomposition of paper filters in landfillback to top LFG Model Scholl Canyon LFG Model
Model parameters from "Landfill Gas Generation Assessment Procedure Guidance Report" by CRA dated March 2009, prepared for the British Columbia Ministry of Enviornment.
Lo (methane generation potential)Moderately Decomposable 120 m3 methane/tonne waste
k (Methane Generation rate)Moderately DecomposableAnnual Precipitation
<250 mm 0.01 yr-1
>250 to <500 mm 0.02 yr-1
>500 to <1,000mm 0.04 yr-1
>1,000 to <2,000mm 0.06 yr-1
>2,000 to <3,000mm 0.07 yr-1
>3,000mm 0.08 yr-1
Note: Modelling was conducted by CRA and the results only have been included in this analysis.
CRA 071620 (2)

APPENDIX C
RAW EMISSION FACTOR DATA (GLOBAL WARMING POTENTIAL)2009 GREENHOUSE GAS SAVINGS STUDY
BCUOMA
Page 11 of 11
Recycled Oil Containers
PE1 Transportation (from generator to registered collector) (containers) See Recycled Oil, Re‐refine and Reuse, PE1, Transportation (from generator to registered collector)back to top
PE2 Transportation (from registered collector to registered oil container processor) See Recycled Oil, Re‐refine and Reuse, PE1, Transportation (from generator to registered collector)back to top
PE3 Processing of oil containers (shredded, centrifuged, washed and pelletized) See Processing of Steel Oil Filters (crushed into cubes and cylinders), PE3back to top For electricty, natural gas and propane emission factors
PE4 Transportation of HDPE pellets to plastics manufacturer See Recycled Oil, Re‐refine and Reuse, PE1, Transportation (from generator to registered collector)back to top
BE1 Production of HDPEback to top Plastic (HDPE) Production Pembina Institute, Produce Plastic (HDPE)
Source from Europe (1993), data considered fairly current and applicable to North Americakg / 1000kg
HDPE kg CO2eEmission
kg CO2e/unitCarbon dioxide 2060 kg CO2 1 2060.00Methane 3.7 kg CH4 25 92.50Nitrous oxide 0.0049 kg N2O 298 1.46
BE2 Transportation of HDPE to plastics manufacturer Included in BE1, Production of HDPE aboveback to top
BE3 Transportation of oil containers to disposal facility See Recycled Oil, Re‐refine and Reuse, PE1, Transportation (from generator to registered collector)back to top
END OF WORKSHEET
CRA 071620 (2)