Greenhouse Gas Assessment – Ypsilanti, Michigan. What is a Scope? Scope 1: All direct greenhouse...
13
Greenhouse Gas Assessment – Ypsilanti, Michigan
-
Upload
claude-chambers -
Category
Documents
-
view
214 -
download
0
Transcript of Greenhouse Gas Assessment – Ypsilanti, Michigan. What is a Scope? Scope 1: All direct greenhouse...

Greenhouse Gas Assessment – Ypsilanti, Michigan

What is a Scope?
• Scope 1: All direct greenhouse gas (GHG) emissions
• Scope 2: Indirect GHG emissions associated with the consumption of purchased or acquired electricity, steam, heating, or cooling
• Scope 3: All other indirect emissions not covered in Scope 2
• Example – Transport-related activities in vehicles not owned or controlled by the city, outsourced activities ,waste disposal etc.

Community Governments
Emission Category Example Sources Emission Category Example Sources
Scope 1 Stationary Combustion Heating Buildings with Fossil Fuels
Stationary Combustion
Heating Buildings with Fossil Fuels
Fugitive Emissions Escaped Refrigerant Gasses (Buildings, Vehicles), Wastewater Treatment/ Landfill Emissions w/in community
Fugitive Emissions Escaped Refrigerant Gasses (Buildings, Vehicles), Methane from Gov. Operated Waste Disposal Facilities
Process Emissions Industrial Processes, Manufacturing
Mobile Emissions Vehicle Miles Travelled Within Community
Mobile Emissions Vehicle Fleet, Transit Fleet
Scope 2 Emissions from Purchased Electricity
Lighting, Appliances, Air Conditioning
Emissions from Purchased Electricity
Lighting, Computers, Air Conditioning
Scope 3 Fugitive Emissions Community-generated waste at landfills outside boundary
Fugitive Emissions Emissions from Contracted Waste Hauling Service, Gov’t Waste Disposed to Date
Mobile Emissions Emissions from Vehicles Used by Community Residents
Mobile Emissions Emission from Employee Commute, Contracted Services
Information Item
Biogenic Emissions Wood Heat, Biofuel Use Biogenic Emissions Wood Heat, Biofuel Use, Renewables
20.2%
8.5%
23.2%
30.7%
16.0%
0.3%0.2% 0.3%
0.6%
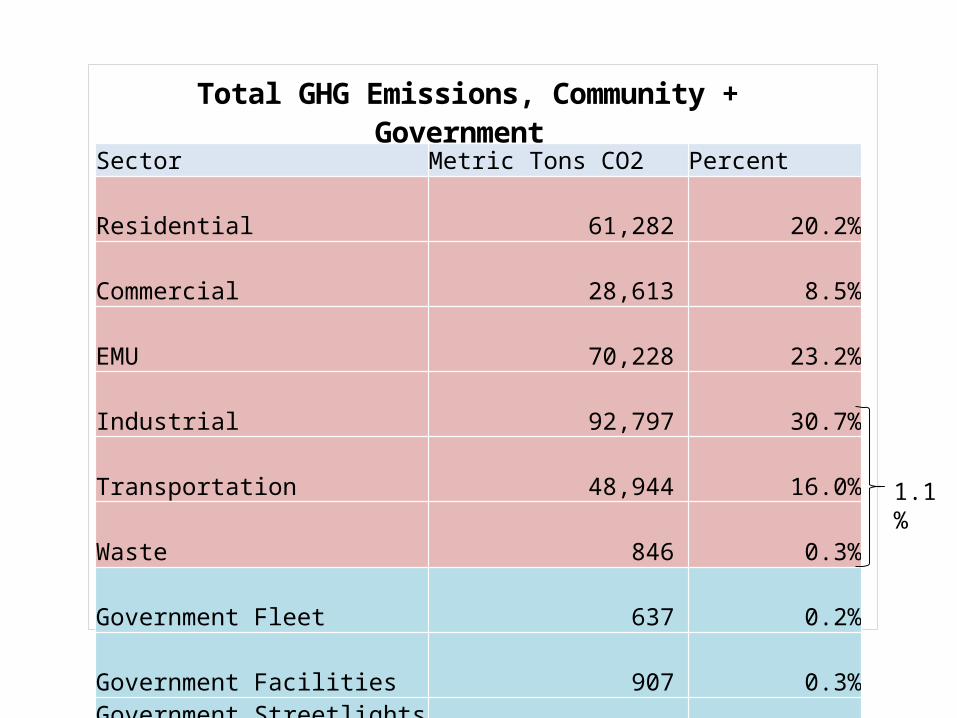
Total GHG Emissions, Community + Government (tonnes CO2e)
Residential
Commercial
EMU
Industrial
Transportation
Waste
Gov Fleet
Gov Facilities
Gov Streetlights & Signals
Sector Metric Tons CO2 Percent
Residential 61,282 20.2%Commercial 28,613 8.5%EMU 70,228 23.2%Industrial 92,797 30.7%Transportation 48,944 16.0%
Waste 846 0.3%
Government Fleet 637 0.2%Government Facilities 907 0.3%
Government Streetlights & Signals 1,843
0.6%
TOTAL 306,097 100.0%
1.1%

Residen
tialTr
ansp
ortation
Commercia
l
Industrial
Was
te
EMU
-
10,000
20,000
30,000
40,000
50,000
60,000
70,000
80,000
90,000
100,000
61,282
48,944
28,613
92,797
846
70,228
Community GHG Emissions, 2008 (metric tons CO2e)
Residential
Transportation
Commercial
Industrial
Waste
EMU
Sector metric tons CO2e Percent
Residential 61,282 20%
Transportation 48,944 16%
Commercial 28,613 9.5%
Industrial 92,797 31%
Waste 846 0.3%
EMU 70,228 23%
Total 302,710 100%

Residential Commercial Industrial Transportation Waste0
20000
40000
60000
80000
100000
120000
5,003
30,224
25
55,629
68,287
92,771
12197.9840302656
36746.3049785626
846.189378485498
2008 Community GHG Emissions by Fuel Source (metric tons CO2e)
Electricity
Natural Gas
Fuel Oil (#1 2 4)
Propane
Gasoline
Diesel
Biogenic Waste
Community Emission by Fuel Type metric tons CO2e %
Electricity 216,687 71.6%
Gasoline 36,746 12.1%
Diesel 12,198 4.0%
Natural Gas 35,252 11.6%
Fuel Oil (#1 2 4) 527 0.2%
Waste 846 0.3%
Propane 454 0.1%
54%
27%
19%
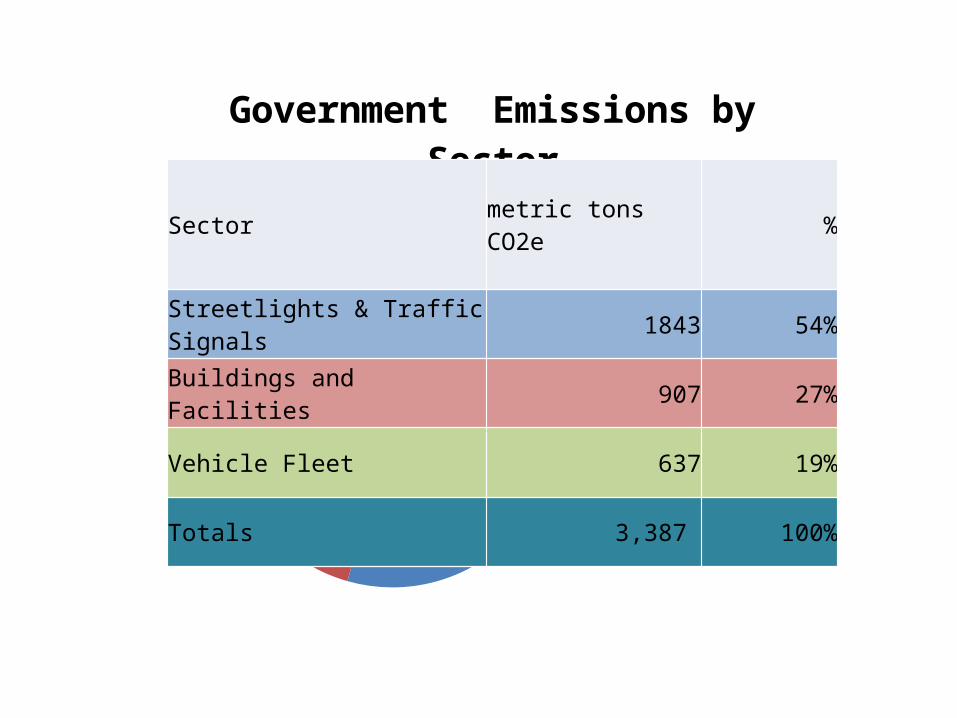
Government Emissions by Sector (metric tons CO2e)
Streetlights & Traffic Signals
Buildings and Facilities
Vehicle Fleet
Sector metric tons CO2e %
Streetlights & Traffic Signals 1843 54%
Buildings and Facilities 907 27%
Vehicle Fleet 637 19%
Totals 3,387 100%

Buildings and Facilities Streetlights & Traffic Signals
Vehicle Fleet0
200
400
600
800
1000
1200
1400
1600
1800
2000
507
1843
400
199
438
Government GHG Emissions by Source, 2005 (metric tons CO2e)
GasolineDieselNatural GasElectricity
Source metric tons CO2e %
Electricity 2,350 69%
Gasoline 438 13%
Natural Gas 400 12%
Diesel 199 6%

Facility% of Sector Emissions from Electricity
% of Sector Emissions from Natural Gas
CO2e Emissions from Electricity
CO2e Emissions from Natural Gas
Total CO2e Emissions
Fire Station 12% 10% 109 94 203
Police Station 14% 7% 128 64 191
City Hall 12% 1% 111 12 123
Public Works Yard 3% 8% 28 72 100
Rutherford Pool 5% 5% 44 44 88Parkridge Community Center
4% 5% 38 47 85
Ypsilanti Historical Museum
2% 3% 17 29 46
Senior Center 3% 2% 28 16 44Historical Museum 0% 2% 0 16 16
Ypsilanti Freighthouse Gas
0% 1% 0 6 6
Carriage House Apartments
0% 0% 3 0 3
Ypsilanti Freighthouse
0% 0% 2 0 2
Totals 56% 44% 507 400 907

2005 2010 2015 2020 2025 2030 2035 2040 2045 2050 302,600
302,650
302,700
302,750
302,800
302,850
302,900
Community Greenhouse Gas Projections - Business as Usual
Community BAU
2005 2010 2015 2020 2025 2030 2035 2040 2045 2050 -
500
1,000
1,500
2,000
2,500
3,000
3,500
4,000
Government Greenhouse Gas Projections -Business as Usual
Government BAU
Indicators Annual % ∆
Population Change 0.0013%
Government FTE-1-1.4000%
Government FTE-2 0.0013%

2005 2010 2015 2020 2025 2030 2035 2040 2045 2050 -
50,000
100,000
150,000
200,000
250,000
300,000
350,000
Community Greenhouse Gas Projections - Business as Usual
Community BAU
Community Target
2005 2010 2015 2020 2025 2030 2035 2040 2045 2050 -
500
1,000
1,500
2,000
2,500
3,000
3,500
4,000
Government Greenhouse Gas Projections -Business as Usual
Government BAU
Government Target
Indicators Annual % ∆
Community Target 1 25%
Community Target 2 50%
Government Target 1 40%
Government Target 2 80%
Target Year1 2025
Target Year2 2050
Indicators Current # BAU 2025 Target 2025 Reduction BAU 2050 Target 2050 Reduction
2008 Residents 20,166
20,170
20,170
20,170
20,175
20,175 20,175
Total Emissions 302,710
302,776
227,024
75,752
302,873
151,349 151,524
Emissions/Resident 15.0
15.0
11.3
3.8
15.0
7.5 7.5

What are the 2050 reductions equal to?
758 Railcars worth of coal NOT combusted
500
Reduction of 18,941 homes annual energy use
15,000
Carbon sequestered from
32,275 acres of Pine/Fir forest
30,000
300,000
16,970,714 Gallons of gasoline NOT used
348,506 Barrels of oil NOT combusted

Questions?