Coachella Valley Greenhouse Gas Inventory Report GHG Inventory...SOUTH COAST AIR QUALITY MANAGEMENT...
105
DRAFT REGIONAL GREENHOUSE GAS INVENTORY FOR THE COACHELLA VALLEY June 2011
Transcript of Coachella Valley Greenhouse Gas Inventory Report GHG Inventory...SOUTH COAST AIR QUALITY MANAGEMENT...
DRAFT
REGIONAL GREENHOUSE GAS INVENTORY FOR THE COACHELLA VALLEY
June 2011

2
SOUTH COAST AIR QUALITY MANAGEMENT DISTRICT
Greenhouse Gas (GHG) Inventories for the Coachella Valley
Part I: Summary of the Inventory
Part II: Technical Document: Methodology, Assumptions, Data Sources and Inventory
Prepared for the Coachella Valley Association of Governments
June 2011
3
DRAFT Part I: Summary
Regional Greenhouse Gas Inventory for the Coachella Valley
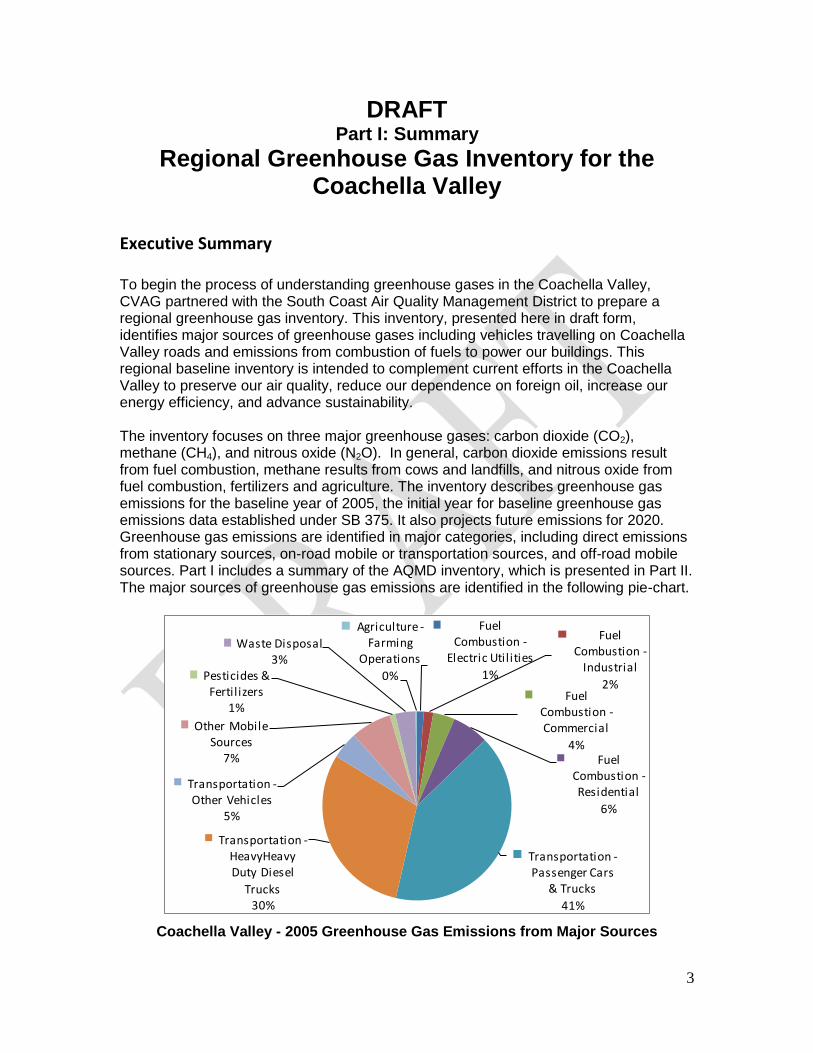
Executive Summary To begin the process of understanding greenhouse gases in the Coachella Valley, CVAG partnered with the South Coast Air Quality Management District to prepare a regional greenhouse gas inventory. This inventory, presented here in draft form, identifies major sources of greenhouse gases including vehicles travelling on Coachella Valley roads and emissions from combustion of fuels to power our buildings. This regional baseline inventory is intended to complement current efforts in the Coachella Valley to preserve our air quality, reduce our dependence on foreign oil, increase our energy efficiency, and advance sustainability. The inventory focuses on three major greenhouse gases: carbon dioxide (CO2), methane (CH4), and nitrous oxide (N2O). In general, carbon dioxide emissions result from fuel combustion, methane results from cows and landfills, and nitrous oxide from fuel combustion, fertilizers and agriculture. The inventory describes greenhouse gas emissions for the baseline year of 2005, the initial year for baseline greenhouse gas emissions data established under SB 375. It also projects future emissions for 2020. Greenhouse gas emissions are identified in major categories, including direct emissions from stationary sources, on-road mobile or transportation sources, and off-road mobile sources. Part I includes a summary of the AQMD inventory, which is presented in Part II. The major sources of greenhouse gas emissions are identified in the following pie-chart.
Coachella Valley - 2005 Greenhouse Gas Emissions from Major Sources
Fuel Combustion -
Electric Utilities
1%
Fuel Combustion -
Industrial
2%Fuel
Combustion -Commercial
4%Fuel
Combustion -Residential
6%
Transportation -Passenger Cars
& Trucks
41%
Transportation -HeavyHeavy Duty Diesel
Trucks30%
Transportation -Other Vehicles
5%
Other Mobile Sources
7%
Pesticides & Fertilizers
1%
Waste Disposal3%
Agriculture -Farming
Operations
0%

4
Introduction The Coachella Valley has a long-standing commitment to environmental sustainability and responsible stewardship of our natural resources. Our air quality management program is a state-of-the-art example of regional collaboration to address the PM10 dust problem. The Coachella Valley Multiple Species Habitat Conservation Plan provides a regional vision for long-term protection of natural open space and wildlife habitat balanced with responsible growth. For CVAG member agencies, addressing climate change and greenhouse gas reduction using a “big picture” regional perspective offers another opportunity for the region to act collectively to improve our air quality and reach greenhouse gas reduction targets. The first step in understanding our contribution to greenhouse gas emissions and advancing greenhouse gas reduction efforts through climate action planning was to complete a comprehensive inventory of the greenhouse gases currently emitted into the environment in the Coachella Valley region. To accomplish this step, CVAG partnered with the South Coast Air Quality Management District (South Coast AQMD) to prepare this Coachella Valley Regional Baseline Greenhouse Gas Inventory. We are fortunate to have the significant expertise and data resources of the South Coast AQMD. This inventory of greenhouse gas (GHG) emissions: Serves as a baseline for the Coachella Valley to prepare strategies to reduce
greenhouse gas emissions and to measure our success in that effort. Informs the process of evaluating options for implementation of legislative and
regulatory actions, including SB 375 and AB 32 Positions CVAG to address future climate change requirements Complements current efforts in the Coachella Valley to preserve our air quality,
reduce our dependence on foreign oil, increase our energy efficiency, reduce water usage and advance sustainability
Provides cost savings and economies of scale for member jurisdictions The inventory describes greenhouse gas emissions for the baseline year of 2005 and then projects future emissions for 2020. The baseline year of 2005 was chosen because CVAG had already established it as the baseline year for a 10% electricity use reduction goal set in 2008. The year 2005 is also the initial year for baseline greenhouse gas emissions data established under SB 375. This inventory report is presented in two parts. Part I, including an executive summary, provides an overview of the results of the inventory, including a summary of the highest emissions categories, general description of the methodology, and discussion of how the greenhouse gas inventory will integrate with existing CVAG and jurisdiction sustainability programs. Section I also includes basic information about greenhouse gases, what they are, where they come from, and why they are important to life on earth. Finally, it briefly addresses how this inventory will be used to identify potential emissions reduction strategies that could be adopted to curb greenhouse gas emissions in the Coachella Valley. CVAG anticipates developing a greenhouse gas reduction plan following this inventory. Part II is the inventory and technical report prepared by the South Coast Air Quality Management District. This document outlines the methods and assumptions used; the sources of the data, the limitations of the estimates, and presents detailed tables of the
5
inventory data by major source categories. These data tables are presented for the entire Coachella Valley region combined, then individually for each city, and the unincorporated areas of Riverside County. The approach used by AQMD is similar to the inventory methodology used to develop the latest Air Quality Management Plan (2007 AQMP). Data provided by AQMD was supplemented with data from various sources gathered by CVAG. Key Findings
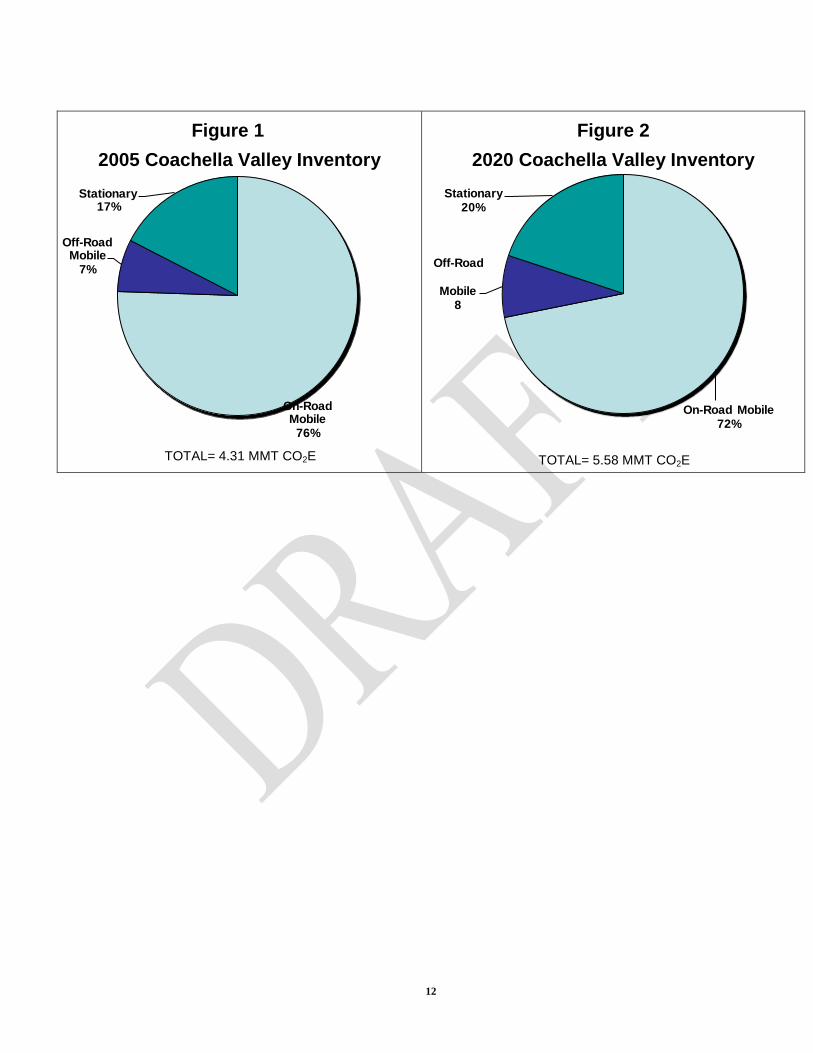
The Coachella Valley region produced 4.31 million metric tons of carbon dioxide equivalent (MMT CO2E) greenhouse gases in 2005 from direct emissions.
Emissions from transportation sources, including cars and light-duty trucks, and other mobile sources represent 76% of total greenhouse gas emissions in 2005 for the Coachella Valley as a whole.
For the Coachella Valley as a whole, emissions from the on-road transportation sector (3.26 MMT CO2E) and from stationary fuel combustion (0.75 MMT CO2E) represent over 93% (4.01 MMT CO2E) of total emissions.
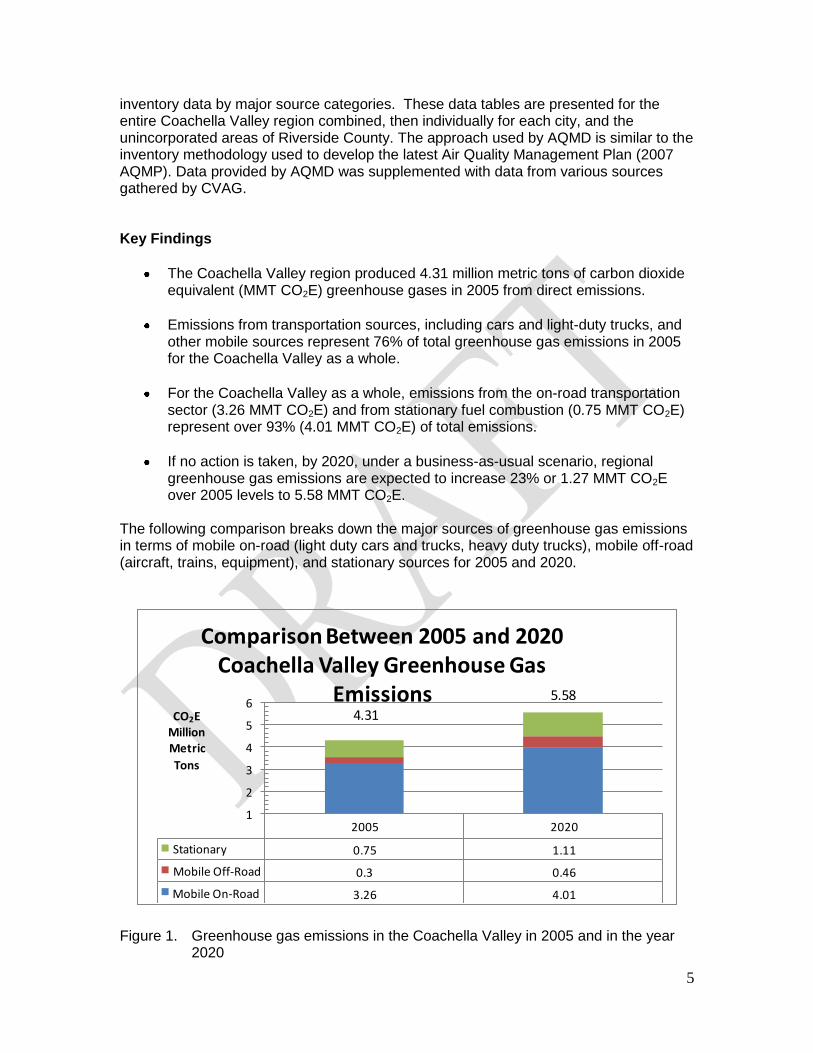
If no action is taken, by 2020, under a business-as-usual scenario, regional greenhouse gas emissions are expected to increase 23% or 1.27 MMT CO2E over 2005 levels to 5.58 MMT CO2E.
The following comparison breaks down the major sources of greenhouse gas emissions in terms of mobile on-road (light duty cars and trucks, heavy duty trucks), mobile off-road (aircraft, trains, equipment), and stationary sources for 2005 and 2020.
Figure 1. Greenhouse gas emissions in the Coachella Valley in 2005 and in the year
2020
2005 2020
Stationary 0.75 1.11
Mobile Off-Road 0.3 0.46
Mobile On-Road 3.26 4.01
1
2
3
4
5
6CO2E
MillionMetric
Tons
Comparison Between 2005 and 2020 Coachella Valley Greenhouse Gas
Emissions4.31
5.58
6
Summary and Background The Coachella Valley area is approximately 15 miles wide along most of its 45 miles in length, extending southeast from the San Bernardino Mountains and terminating on the south end at the Salton Sea. The valley is surrounded by the San Jacinto and Santa Rosa Mountains to the west and south, and the by the Little San Bernardino Mountains to the north and east. The valley is unique in that it is close in proximity to the larger communities of San Bernardino, Riverside and San Diego, but isolated by the nature of its geography. The population of the Coachella Valley including nine cities and surrounding unincorporated areas is 419,062 according to the U.S Census Bureau (April 2010). Between 2000 and 2010 the population grew by 31.7%, with over 100,000 new residents added to Coachella Valley population. The Inland Empire, of which the Coachella Valley is a part, is the 14th largest metropolitan area in the United States. The population growth rate is expected to be more than 15% over the next 5 years, and by 2020 the population is expected to surpass 600,000 people. The area covered by this inventory includes the Coachella Valley as a whole, including cities and unincorporated areas of eastern Riverside County. The CVAG member cities include Blythe, Cathedral City, Coachella, Desert Hot Springs, Indian Wells, Indio, La Quinta, Palm Desert, Palm Springs, and Rancho Mirage. Riverside County, the Agua Caliente Band of Cahuilla Indians, and the Cabazon Band of Mission Indians, are also CVAG members. However, the City of Blythe is not included in this inventory because they are not in the South Coast Air Quality Management District; therefore the South Coast AQMD did not have data for this city. The inventory does include the unincorporated areas of Riverside County within the boundary of both CVAG and the Salton Sea Air Basin. Emissions from tribal lands are included to some extent in this inventory because both the on-road and off-road models derive data to calculate emissions that may include these areas. However, because stationary source emissions data is not collected by AQMD on tribal lands, not all emissions for the Indian Reservation lands were available. For purpose of this inventory, three major greenhouse gases were included: carbon dioxide (CO2), methane (CH4), and nitrous oxide (N2O). In general, carbon dioxide emissions result from fuel combustion, methane results from cows and landfills, and nitrous oxide from fuel combustion, fertilizers and agriculture. These emissions are typically reported in millions of metric tons (MMT) of carbon dioxide equivalents (CO2E), which is the amount of CO2 that would give the same global warming potential as a given amount of another greenhouse gas. For example, methane (CH4) is a greenhouse gas which has a global warming potential 21 times that of CO2 and N2O has a global warming potential 310 times that of CO2. Additional information about these greenhouse gases is provided below. In this inventory, greenhouse gas emissions are identified in major categories, including direct emissions from stationary sources, on-road mobile or transportation sources, and off-road mobile sources. Stationary source emissions are calculated for greenhouse gases arising from point sources. These point sources include fuel combustion associated with electricity generation at power plants and natural gas and other fuels used for heating and cooling buildings in the residential, commercial, and industrial sectors. Emissions resulting from waste management, agricultural processes, and
7
fertilizer from golf courses are also included as stationary sources. On-road mobile sources include vehicles – from passenger vehicles to large trucks – that travel our roads and highways. Off-road mobile sources include aircraft, trains, off-road vehicles, and off-road equipment such as construction equipment. The majority of human produced greenhouse gases produced come from the burning of fossil fuels. The main fossil fuels used are coal, methane gas and petroleum. The emissions relating to fuel consumption are the biggest contributing factors to greenhouse gases produced in the Coachella Valley. The greenhouse gas emissions associated with electricity consumption result primarily from the combustion of fuels used to generate that electricity. This electricity generation occurs in the Coachella Valley to a limited extent, but more significantly outside the Coachella Valley region. The inventory provides emissions resulting from electricity generation at Coachella Valley power plants. It does not include emissions resulting from electricity consumption in the Coachella Valley, which are indirect sources. Greenhouse gas emissions that are derived from stationary sources incorporate electricity use. Therefore, standalone electricity consumption data are excluded from the totals to avoid double-counting. This greenhouse gas inventory reflects some of the unique land uses in this region. As the Coachella Valley is a world renowned resort destination, there are many golf courses in the area, which use fertilizer that results in greenhouse gas emissions of nitrous oxides (N2O). To address this emissions source, data was gathered on fertilizer usage on valley golf courses and the resulting greenhouse gas emissions were calculated as described in Part II.
What is a Greenhouse Gas?
What is a greenhouse gas? Simply put, they are gases found in the atmosphere, both naturally occurring and as a result of human activity, which absorb and emit radiation. Greenhouse gases are important to life on earth and help make the planet livable. The most common greenhouse gases are, in order of abundance in the atmosphere, water vapor, carbon dioxide, methane, nitrous oxide, and fluorinated gases (SF6, HFCs, PFCs). The following are brief descriptions of greenhouse gases addressed in this inventory – carbon dioxide, methane, and nitrous oxide – as well as other greenhouse gases not covered herein.
Carbon Dioxide – CO2
Carbon dioxide (CO2) is a naturally occurring colorless and odorless gas. It is the greenhouse gas that has caused concern among scientists and is the most prevalent greenhouse gas in the atmosphere. As of 2006, the U.S. Environmental Protection Agency estimated carbon dioxide to be 84.8% as a portion of all emissions in the U.S. Carbon dioxide is primarily emitted into the atmosphere during the process of burning fossil fuels (oil, natural gas, and coal), trees and wood products, solid waste, and through chemical processes such as cement and lime manufacture. Natural sources also contribute carbon dioxide, including plant and animal respiration, evaporation of oceans, and decomposition of organic matter.
8
Methane – CH4
Methane (CH4) is emitted from a variety of sources such as landfills, natural gas systems, livestock digestion (enteric fermentation), coal mining, and manure control (livestock). According to the U.S. EPA, landfills are the second–largest human-related source of methane in the U.S., accounting for 23 percent of all methane emissions in 2007. Methane produced in landfills is caused as waste decomposes under anaerobic conditions. Methane production varies by level of waste material, available moisture, and heat. The methane emissions from landfills are typically exhausted into the atmosphere, however recent regulations in the U.S. now require large landfills to recapture and recycle their methane emissions.
Nitrous Oxide – N2O
Nitrous oxide (N2O) results from both natural and human-related sources. Natural production of nitrous oxides occurs in soil and water as a result of microbial processes. Primary human-related sources of N2O are nitrogen fertilizers on agricultural soils, animal manure management, wastewater treatment, vehicle emissions, fossil-fuel power plants and other stationary combustion of fossil fuels. Reduction in use of synthetic nitrogen fertilizers in crop production and catalytic converters on automobiles are two ways to control nitrous oxide emissions.
Other Greenhouse Gases
Halocarbons - Chlorofluorocarbons (CFCs) and Hydrofluorocarbons (HFCs), PFC
Halocarbons (HFC) are compounds containing carbon, and halogens such as chlorine and fluorine, and sometimes hydrogen. Chlorofluorocarbons are synthetic with no natural sources. They were widely used as refrigerants for air conditioning systems and as propellants in aerosol containers, such as hair spray and spray-paint. Other halocarbons, Hydrofluorocarbons and hydrochlorofluorocarbons (HCFCs), are man-made compounds used as common replacements for chlorofluorocarbons (CFCs) which have a mandated phase-out under terms of the Montreal Protocol. Perfluorocarbon (PFC) emissions are a byproduct of the aluminum and semiconductor manufacturing processes.
Sulfur Hexafluoride (SF6)
Sulfur hexafluoride (SF6) is a highly potent greenhouse gas used in the electrical power industry. It use is primarily for insulation and current interruption in electrical transmission and distribution equipment. SF6 has been used since the 1950s in circuit breakers, gas-insulated substations and other switchgear used in the transmission system to manage the high voltages carried between generating stations and customer load centers. The electrical industry uses 80% of all SF6 produced worldwide. Leaks generally occur from aging equipment and gas loss during equipment service. While older circuit breakers can contain 2,000 lbs. of SF6, newer circuit breakers typically contain less than 100 lbs. Due to its long-life span and high global warming potential (GWP), even a small amount of sulfur hexafluorides can have a significant impact on our climate. According to Southern California Edison (SCE), approximately 586,000 pounds of SF6 are incorporated within SCE’s system which covers an area of 50,000 square miles. Since 1999 SCE has reduced its SF6 leak-rate by over 60%, bringing leakage down from 10% to the current level of 3.8%. Although SCE’s target of no more than 1% leakage is attainable, many of the several hundred individual pieces of equipment containing SF6
9
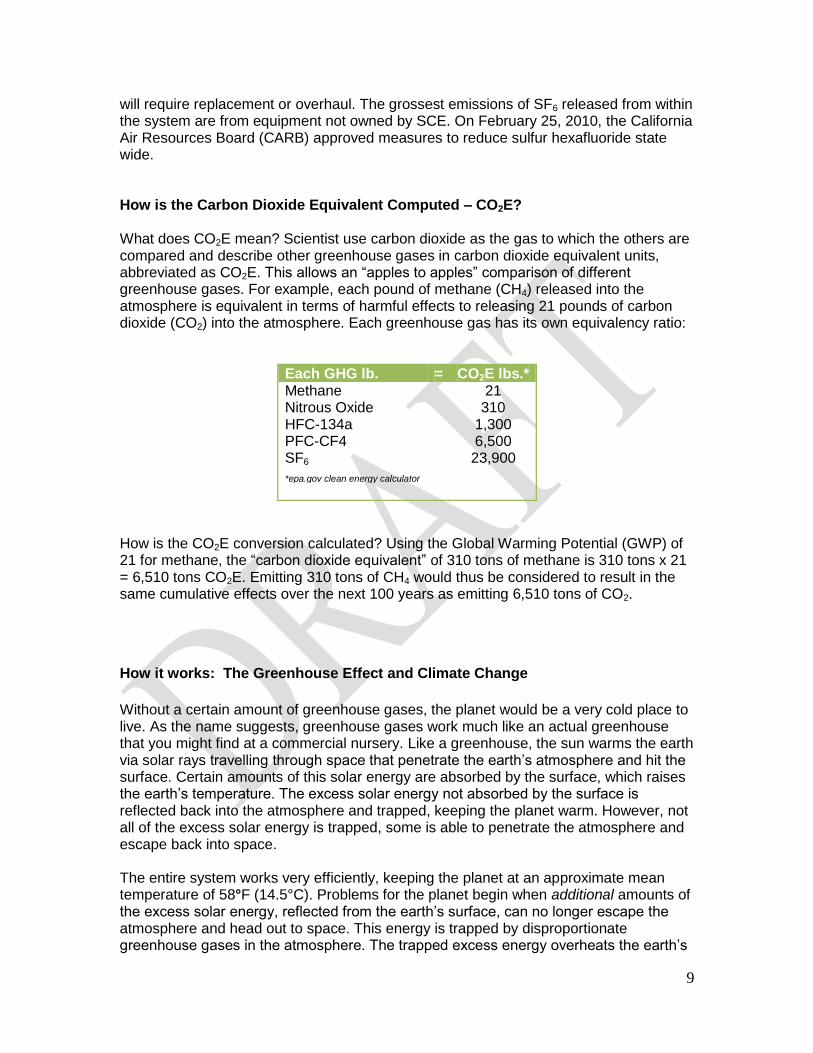
will require replacement or overhaul. The grossest emissions of SF6 released from within the system are from equipment not owned by SCE. On February 25, 2010, the California Air Resources Board (CARB) approved measures to reduce sulfur hexafluoride state wide. How is the Carbon Dioxide Equivalent Computed – CO2E? What does CO2E mean? Scientist use carbon dioxide as the gas to which the others are compared and describe other greenhouse gases in carbon dioxide equivalent units, abbreviated as CO2E. This allows an “apples to apples” comparison of different greenhouse gases. For example, each pound of methane (CH4) released into the atmosphere is equivalent in terms of harmful effects to releasing 21 pounds of carbon dioxide (CO2) into the atmosphere. Each greenhouse gas has its own equivalency ratio:
Each GHG lb. = CO2E lbs.* Methane 21 Nitrous Oxide 310 HFC-134a 1,300 PFC-CF4 6,500 SF6 23,900
*epa.gov clean energy calculator
How is the CO2E conversion calculated? Using the Global Warming Potential (GWP) of 21 for methane, the “carbon dioxide equivalent” of 310 tons of methane is 310 tons x 21 = 6,510 tons CO2E. Emitting 310 tons of CH4 would thus be considered to result in the same cumulative effects over the next 100 years as emitting 6,510 tons of CO2.
How it works: The Greenhouse Effect and Climate Change
Without a certain amount of greenhouse gases, the planet would be a very cold place to live. As the name suggests, greenhouse gases work much like an actual greenhouse that you might find at a commercial nursery. Like a greenhouse, the sun warms the earth via solar rays travelling through space that penetrate the earth’s atmosphere and hit the surface. Certain amounts of this solar energy are absorbed by the surface, which raises the earth’s temperature. The excess solar energy not absorbed by the surface is reflected back into the atmosphere and trapped, keeping the planet warm. However, not all of the excess solar energy is trapped, some is able to penetrate the atmosphere and escape back into space. The entire system works very efficiently, keeping the planet at an approximate mean temperature of 58°F (14.5°C). Problems for the planet begin when additional amounts of the excess solar energy, reflected from the earth’s surface, can no longer escape the atmosphere and head out to space. This energy is trapped by disproportionate greenhouse gases in the atmosphere. The trapped excess energy overheats the earth’s

10
climate system, creating a positive feedback system, which leads to climate change. The following diagram illustrates the greenhouse effect.
11
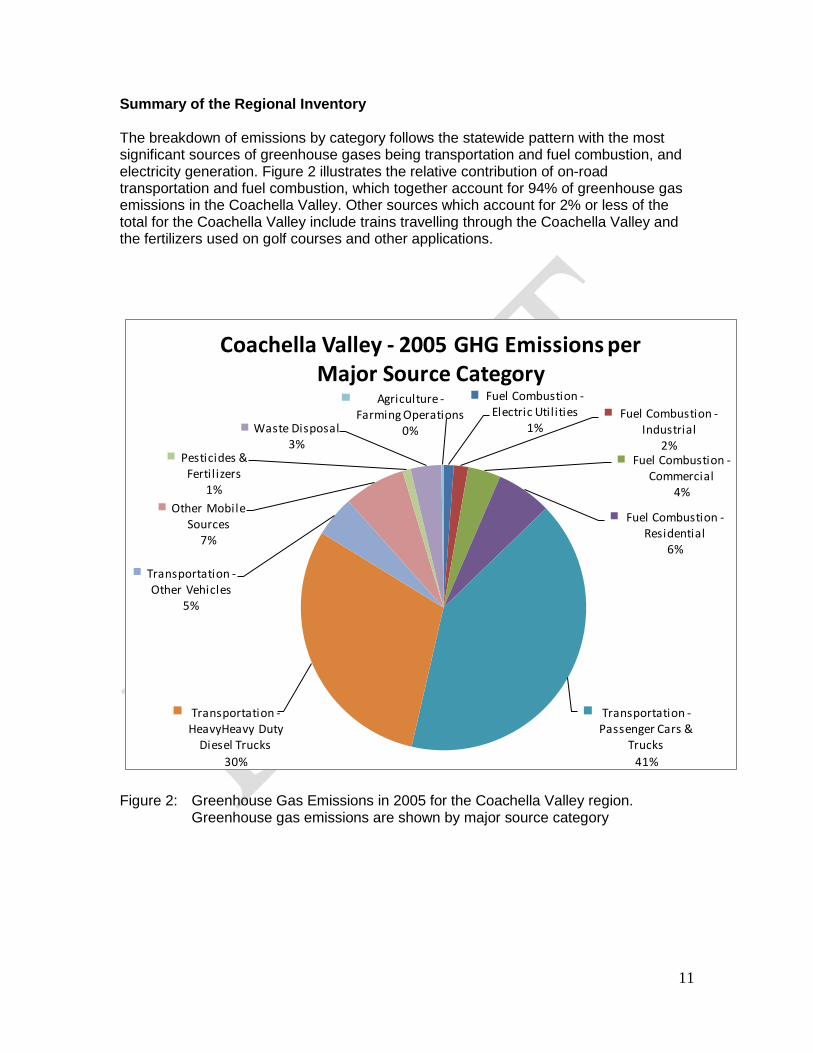
Summary of the Regional Inventory The breakdown of emissions by category follows the statewide pattern with the most significant sources of greenhouse gases being transportation and fuel combustion, and electricity generation. Figure 2 illustrates the relative contribution of on-road transportation and fuel combustion, which together account for 94% of greenhouse gas emissions in the Coachella Valley. Other sources which account for 2% or less of the total for the Coachella Valley include trains travelling through the Coachella Valley and the fertilizers used on golf courses and other applications.
Fuel Combustion -Electric Utilities
1%Fuel Combustion -
Industrial2%
Fuel Combustion -Commercial
4%
Fuel Combustion -Residential
6%
Transportation -Passenger Cars &
Trucks
41%
Transportation -HeavyHeavy Duty
Diesel Trucks
30%
Transportation -Other Vehicles
5%
Other Mobile Sources
7%
Pesticides & Fertil izers
1%
Waste Disposal3%
Agriculture -Farming Operations
0%
Coachella Valley - 2005 GHG Emissions per Major Source Category
Figure 2: Greenhouse Gas Emissions in 2005 for the Coachella Valley region.
Greenhouse gas emissions are shown by major source category

12
Vehicles travelling on roads and freeways are a major source of greenhouse gas emissions in the Coachella Valley, accounting for 76% of the regional total in 2005. Passenger vehicles, including light duty cars and trucks together produce 41% of the greenhouse gas emissions from vehicles. Another significant source of emissions is heavy duty diesel trucks, which account for 30% of GHG emissions, resulting from the truck travel along the I-10 Freeway and Highway 86 transportation corridors. CVAG will be assessing the impacts of proposed transportation projects and looking at ways to reduce the contribution from vehicle emissions.
Figure 3 Greenhouse Gas Emissions from vehicles travelling on Coachella Valley
roads in 2005. See Part II: Table B-1 for source data.
Light Duty Passenger Auto
(LDA)
25%
Light Duty Trucks 1 (T1)6%
Light Duty Trucks 2 (T2)14%
Medium Duty Trucks (T3)
10%
Medium Heavy Duty Diesel Truck
(T6)
2%
Heavy Heavy Duty Diesel Trucks (HHD)
40%
Other Vehicles3%
Coachella Valley Emissions from On-Road Vehicles - 2005
13
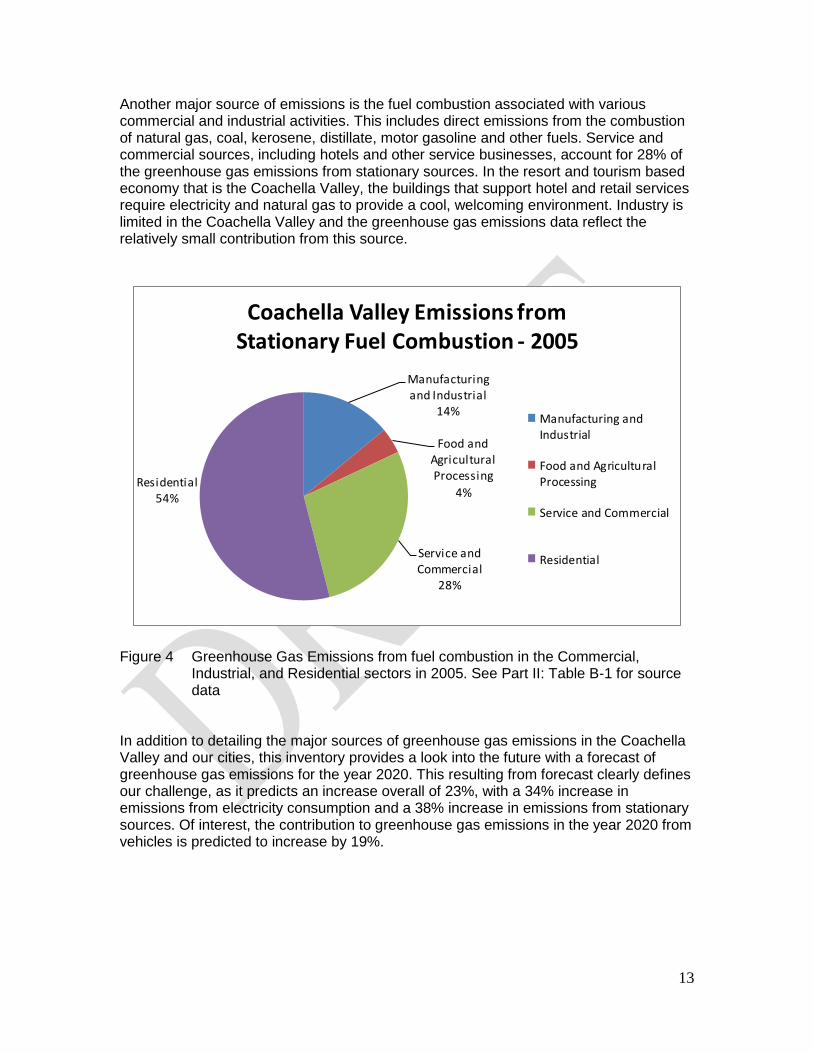
Another major source of emissions is the fuel combustion associated with various commercial and industrial activities. This includes direct emissions from the combustion of natural gas, coal, kerosene, distillate, motor gasoline and other fuels. Service and commercial sources, including hotels and other service businesses, account for 28% of the greenhouse gas emissions from stationary sources. In the resort and tourism based economy that is the Coachella Valley, the buildings that support hotel and retail services require electricity and natural gas to provide a cool, welcoming environment. Industry is limited in the Coachella Valley and the greenhouse gas emissions data reflect the relatively small contribution from this source.
Figure 4 Greenhouse Gas Emissions from fuel combustion in the Commercial,
Industrial, and Residential sectors in 2005. See Part II: Table B-1 for source data
In addition to detailing the major sources of greenhouse gas emissions in the Coachella Valley and our cities, this inventory provides a look into the future with a forecast of greenhouse gas emissions for the year 2020. This resulting from forecast clearly defines our challenge, as it predicts an increase overall of 23%, with a 34% increase in emissions from electricity consumption and a 38% increase in emissions from stationary sources. Of interest, the contribution to greenhouse gas emissions in the year 2020 from vehicles is predicted to increase by 19%.
Manufacturing and Industrial
14%
Food and Agricultural Processing
4%
Service and Commercial
28%
Residential 54%
Coachella Valley Emissions from Stationary Fuel Combustion - 2005
Manufacturing andIndustrial
Food and AgriculturalProcessing
Service and Commercial
Residential
14
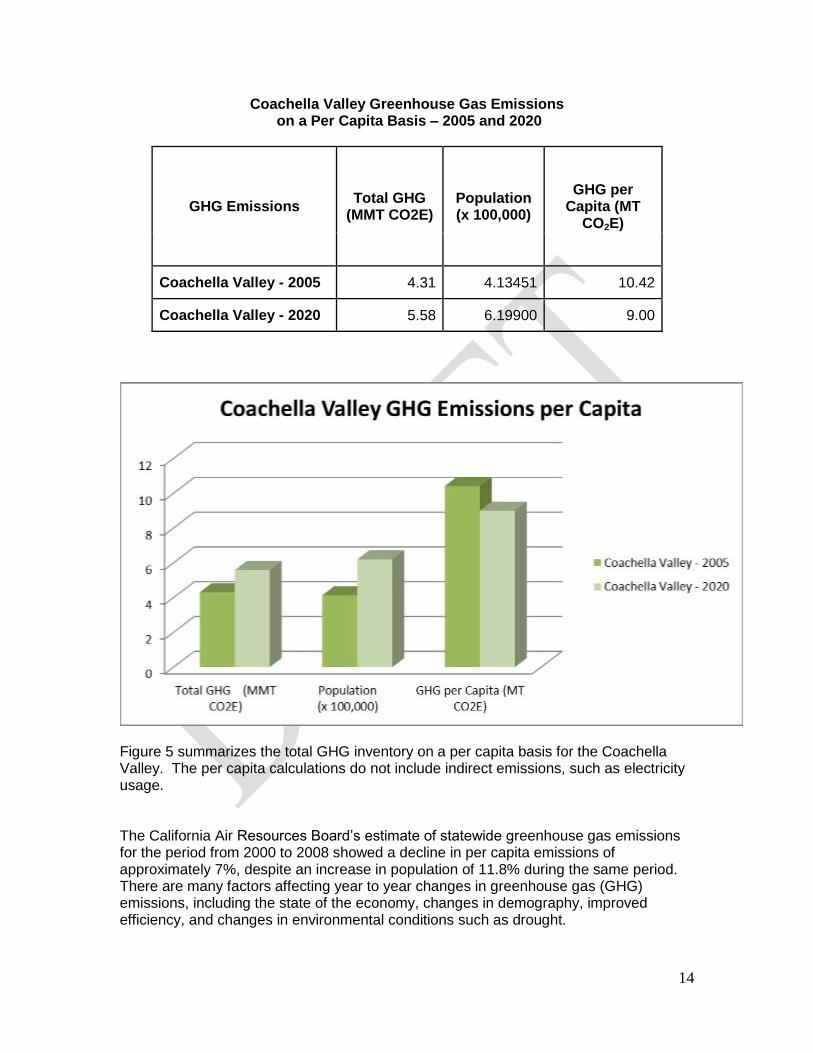
Coachella Valley Greenhouse Gas Emissions on a Per Capita Basis – 2005 and 2020
GHG Emissions Total GHG
(MMT CO2E) Population (x 100,000)
GHG per Capita (MT
CO2E)
Coachella Valley - 2005 4.31 4.13451 10.42
Coachella Valley - 2020 5.58 6.19900 9.00
Figure 5 summarizes the total GHG inventory on a per capita basis for the Coachella Valley. The per capita calculations do not include indirect emissions, such as electricity usage. The California Air Resources Board’s estimate of statewide greenhouse gas emissions for the period from 2000 to 2008 showed a decline in per capita emissions of approximately 7%, despite an increase in population of 11.8% during the same period. There are many factors affecting year to year changes in greenhouse gas (GHG) emissions, including the state of the economy, changes in demography, improved efficiency, and changes in environmental conditions such as drought.
15
The greenhouse gas emissions for individual cities follows the same general pattern as the Coachella Valley as a whole, with transportation and fuel combustion as major sources. The AQMD inventory provides a summary of the greenhouse gas emissions for each individual city and the unincorporated areas within the Coachella Valley region. The emissions reported for individual jurisdictions do not represent an exhaustive inventory but rather provide a broad, “big picture” view of major sources of greenhouse gases. Several cities have recently completed a more detailed municipal greenhouse gas inventory using the International Council for Local Environmental Initiatives (ICLEI) software. Because this inventory is completed using a different methodology, comparisons should be made with caution. CVAG expects to work with many of our jurisdictions to complete similar inventories in the coming months. We also plan to develop a regional greenhouse gas reduction plan, or climate action plan, which will build on the results of this inventory. It should be noted that this GHG Inventory represents an initial look at greenhouse gas emissions from a regional perspective using data generously provided by AQMD and other sources. Estimating greenhouse gas emissions relies on a variety of data sources and methodologies that are still evolving. As further described in Part II, as additional technical information and standardized protocols for regional GHG inventories become available over time, inventories such as this one can be further enhanced by including additional greenhouse gases, improved methodologies or better emission factors. While this inventory is not exhaustive, a good-faith effort has been made to identify major sources of greenhouse gases and establish a baseline that can be further refined as more detailed information becomes available. This greenhouse gas inventory provides the baseline for tracking our contribution to climate change. And it provides a forecast to the year 2020 of how these emissions will continue to increase. Understanding the major sources of greenhouse gases in the CVAG region is the first step local governments and the communities they serve can take to reduce greenhouse gas emissions. The next step, taking action to reduce these emissions, will have other benefits in terms of improved air quality, reduced congestion, sustainable living, and very likely, a better quality of life. Armed with information from this inventory, the next step is to take action.
The South Coast Air Quality Management District (South Coast AQMD) is the agency responsible for attaining State and Federal clean air standards in the South Coast Air Basin, which includes the area of Coachella Valley. The Coachella Valley Association of Governments (CVAG) was formed in 1973 under California’s Joint Powers Law to address issues of valley-wide significance. Today, CVAG works on a variety of projects important to the Coachella Valley, both as the lead agency and as part of larger teams. This regional inventory is an example of our collaborative approach. The Part I Summary was prepared by CVAG.
16
SOUTH COAST AIR QUALITY MANAGEMENT DISTRICT
Greenhouse Gas (GHG) Inventories for the Coachella Valley
Part II:
Technical Document: Methodology, Assumptions, Data Sources and Inventory
September 2010
ACKNOWLEDGEMENTS
South Coast Air Quality Management District
Elaine Chang, DrPH Deputy Executive Officer
Planning, Rule Development & Area Sources
Jill Whynot Director of Strategic Initiatives
Planning, Rule Development & Area Sources
This was a joint effort that included the staff listed below. Their contributions and assistance are appreciated.
SCAQMD
Joe Cassmassi, Planning and Rules Manager Ali Ghasemi, Program Supervisor Kathy Hsiao, Program Supervisor Aaron Katzenstein, Program Supervisor Chris Nelson, Senior Staff Specialist Susan Yan, Air Quality Specialist Robert Wu, Air Quality Specialist Xinqiu Zhang, Air Quality Specialist Yifang Zhu, Air Quality Specialist
COACHELLA VALLEY
Katie Barrows, Director of Environmental Resources, CVAG Tom Kirk, Executive Director, CVAG Aurora Wilson, Director of Community Resources, CVAG Jim Sullivan, GIS Program Director, CVAG Nick Peihl, GIS Analyst, CVAG Jacob Alvarez, Management Analyst, CVAG Diana Aguilar, CVAG Omar Abu-Hajar, College of the Desert Intern, CVAG Buford Crites, Board Liaison to SCAQMD, 4th District Kay Hazen, CVAG Energy and Water Conservation Subcommittee member Mark Johnson, Coachella Valley Water District Lin Juniper, Southern California Edison Pong Kunakorn, Southern California Edison Michelle Prewitt, Southern California Edison Cynthia Garcia, Southern California Edison Kathleen DeRosa, Southern California Edison Tony Coonce, Willdan/Intergy Gary Ambach, Imperial Irrigation District, Phil Falkenstein, Imperial Irrigation District Becky Estrella, Southern California Gas Company Ted Flanigan, Executive Director, Ecomotion
18
Maria Jaurequi, Business Manager, Ecomotion Virginia Nichols, Ecomotion Russell Flanigan, Ecomotion Diane Christensen, Riverside County Waste Management Department Mark Hunt, Senior Civil Engineer, Riverside County Waste Management Department Angela Dufresne, Principal Engineer, Riverside County Waste Management Department Albert Perez, Director of Golf Grounds, JW Marriott Resort & Spa Cyndy Neal, Executive Director, Hi-Lo Desert Golf Course Superintendents Association Glenn Miller, Executive Director, First Tee of the Coachella Valley Jonas Conlan, President, Hi-Lo Desert Golf Course Superintendents Association
i
TABLE OF CONTENTS
Preface...................................................................................................... 1
Background .............................................................................................. 1
Emission Inventory Methodology .......................................................... 2
Introduction ................................................................................. 2
Greenhouse Gases/Pollutants ..................................................... 2
Source Categories ....................................................................... 2
Stationary Sources ............................................................... 2
On-Road Mobile Sources ..................................................... 5
Off-Road Mobile Sources ..................................................... 6
Inventory Projection ..................................................................... 8
Summary of Coachella Valley GHG Inventories .................................. 8
References .............................................................................................13
Appendices
A – Map of Coachella Valley ..................................................... A-1
B – GHG Emissions per Major Source Category for Coachella Valley ................................................................. B-1
C – Fertilizer Data ..................................................................... D-1
D – Coachella Valley Cities… ................................................... E-1 Cathedral City Coachella
Desert Hot Springs Indian Wells Indio La Quinta Palm Desert Palm Springs Rancho Mirage Unincorporated Areas Summary
ii
List of Tables
1 – CO2E Inventory for the Coachella Valley, MMT .................................................. 8
2 – GHG Inventory Per Capita (2005, 2020) ........................................................... 10
B-1 – 2005 GHG Emissions per Major Source Category for Coachella Valley …. B-1
B-2 – 2020 GHG Emissions per Major Source Category for Coachella Valley …. B-4
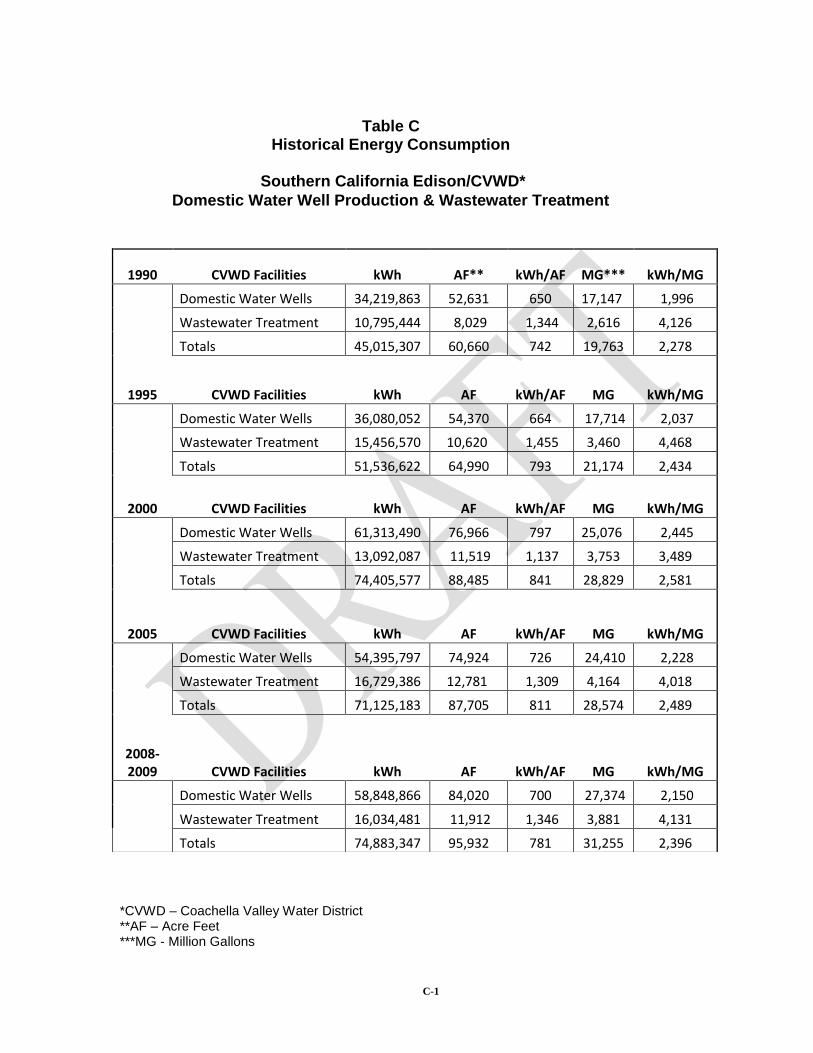
C-1 – Historical Energy Consumption ................................................................... C-2
D-1 – 2005 N2O Emissions from Fertilizer for Coachella Valley Golf Courses ….. D-1
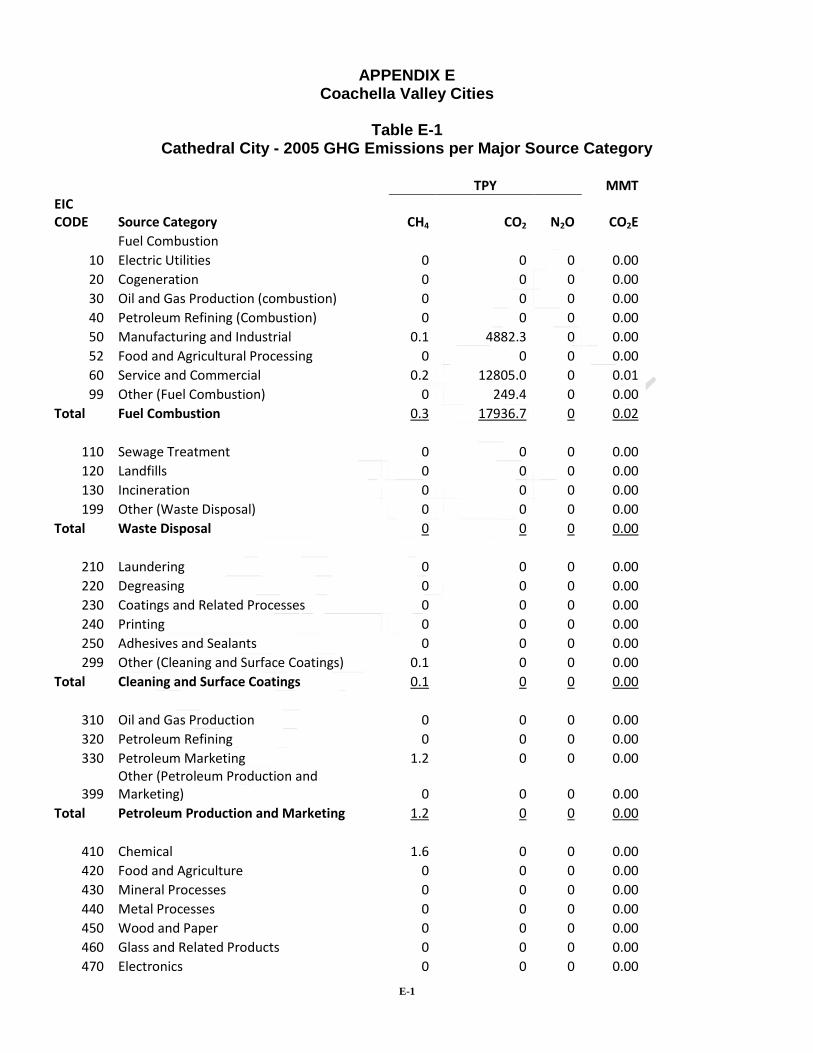
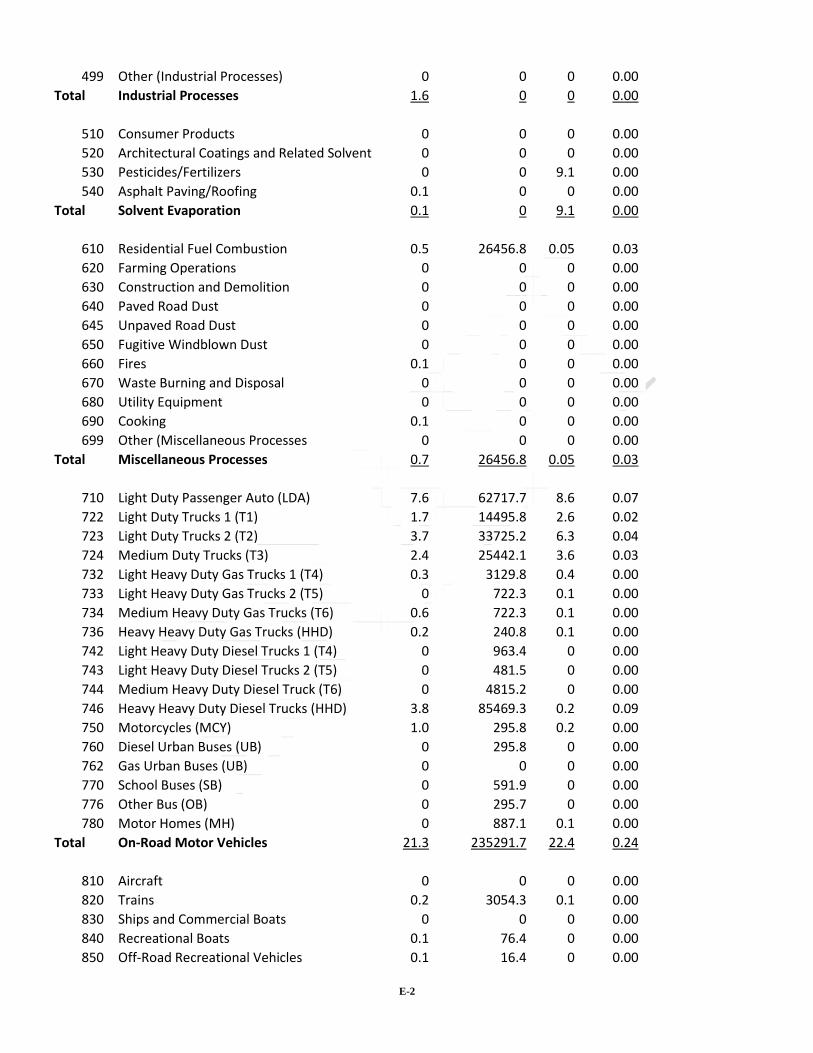
E-1 – Cathedral City – 2005 GHG Emissions per Major Source Category……… . E-1
E-2 – Cathedral City – 2020 GHG Emissions per Major Source Category……… . E-4
E-3 – Cathedral City – Fertilizer Data ................................................................... E-6
E-4 – Coachella – 2005 GHG Emissions per Major Source Category .................. E-7
E-5 – Coachella – 2020 GHG Emissions per Major Source Category ............... E-10
E-6 – Coachella – Fertilizer Data ........................................................................ E-12
E-7 – Desert Hot Springs – 2005 GHG Emissions per Major Source Category .. E-13
E-8 – Desert Hot Springs – 2020 GHG Emissions per Major Source Category. . E-16
E-9 – Desert Hot Springs – Fertilizer Data .......................................................... E-18
E-10 – Indian Wells – 2005 GHG Emissions per Major Source Category ........... E-19
E-11 – Indian Wells – 2020 GHG Emissions per Major Source Category ........... E-22
E-12 – Indian Wells – Fertilizer Data ................................................................... E-24
E-13 – Indio – 2005 GHG Emissions per Major Source Category ...................... E-25
E-14 – Indio – 2020 GHG Emissions per Major Source Category ...................... E-28
E-15 – Indio – Fertilizer Data .............................................................................. E-30
E-16 – La Quinta – 2005 GHG Emissions per Major Source Category .............. E-31
E-17 – La Quinta – 2020 GHG Emissions per Major Source Category .............. E-34
E-18 – La Quinta – Fertilizer Data....................................................................... E-36
E-19 – Palm Desert – 2005 GHG Emissions per Major Source Category .......... E-37
E-20 – Palm Desert – 2020 GHG Emissions per Major Source Category .......... E-40
E-21 – Palm Desert – Fertilizer Data .................................................................. E-42
E-22 – Palm Springs – 2005 GHG Emissions per Major Source Category ......... E-43
E-23 – Palm Springs – 2020 GHG Emissions per Major Source Category ......... E-46
E-24 – Palm Springs – Fertilizer Data ................................................................. E-48
E-25 – Rancho Mirage – 2005 GHG Emissions per Major Source Category ...... E-49
E-26 – Rancho Mirage – 2020 GHG Emissions per Major Source Category ...... E-52
E-27 – Rancho Mirage – Fertilizer Data .............................................................. E-54
iii
E-28 – Unincorporated Areas – 2005 GHG Emissions per Major Source Category ................................................................................................ E-55
E-29 – Unincorporated Areas – 2020 GHG Emissions per Major
Source Category ................................................................................................ E-58
E-30 – Unincorporated Areas – Fertilizer Data ................................................... E-60
E-31 – GHG Emissions Summary by City ........................................................... E-61
List of Figures
1 – 2005 Coachella Valley Inventory....................................................................... 12
2 – 2020 Coachella Valley Inventory....................................................................... 12
A-1 – Map of Coachella Valley .............................................................................. A-1 Acronym List F-1

1
PREFACE
This document summarizes the collaborative effort of staffs at the South Coast Air Quality Management District (SCAQMD) and the Coachella Valley Association of Governments (CVAG) to develop greenhouse gas (GHG) inventories for the Coachella Valley and its cities for the years 2005 and 2020. The purpose of this document is to outline the methods and assumptions used, the sources of data, the limitations of the estimates, and a summary of the inventories developed, by major source category. This approach largely relies on the same inventory methodology used to develop the latest Air Quality Management Plan (i.e., 2007 AQMP) and represents one approach for developing a GHG emissions inventory. There are other appropriate methodologies and protocols that can be used. This document may be useful to other areas that are developing GHG inventories.
BACKGROUND
Staff from the Coachella Valley Association of Governments (CVAG) requested that SCAQMD staff assist with its effort to develop a GHG emissions inventory for the years 2005 and 2020. The Coachella Valley Association of Governments was formed in 1973 to address issues of valley-wide significance. CVAG works on a variety of projects important to the Coachella Valley, both as the lead agency and as part of the larger jurisdictional or regional teams. CVAG members include the cities of Blythe, Cathedral City, Coachella, Desert Hot Springs, Indian Wells, Indio, La Quinta, Palm Desert, Palm Springs, and Rancho Mirage. Riverside County is a member of CVAG; the portion of eastern Riverside County within the CVAG boundary is included and data for these unincorporated areas of Riverside County is reported. The Agua Caliente Band of Cahuilla Indians and the Cabazon Band of Mission Indians are also CVAG members. Not all CVAG member jurisdictions are included in this inventory because they are not in the South Coast Air Basin, such as Blythe. Emissions from tribal lands, including reservation lands for the Agua Caliente, Cabazon, and Torrez Martinez, are included to some extent in the inventory. On- and off-road models calculate emissions that include these areas. However, point source emissions data is not collected by SCAQMD on tribal lands, so emissions from stationary sources on tribal lands in the Coachella Valley are not included in this inventory. Staff attempted to address specific areas for the GHG inventory that reflect some of the unique land uses in this region. For example, there are many golf courses in the Coachella Valley, which use fertilizer and water. The region is also a desert, with many resorts and swimming pools, which also use large amounts of

2
water. Information has been augmented in this document on fertilizer usage and the resulting GHG emissions, as well as information on electricity-related GHG emission from wells and waste water treatment.
EMISSION INVENTORY METHODOLOGY Introduction
The methodology used for developing this GHG inventory is primarily consistent with the SCAQMD 2007 Air Quality Management Plan (AQMP) inventory method, which utilized 2002 data as the base year. CVAG staff also provided additional data to augment the AQMP inventory, such as fertilizer usage. The following sections describe the key elements of the GHG inventories. Inventories for each of the cities in Coachella Valley that are in the South Coast Air Basin can be found in the appendices.
Greenhouse Gases/Pollutants
For purpose of these GHG inventories, three major pollutants were included: carbon dioxide (CO2), methane (CH4), and nitrous oxide (N2O). These emissions are typically reported in millions of metric tons (MMT) of carbon dioxide equivalents (CO2E), which is the amount of CO2 that would give the same global warming potential as a given amount of another GHG. For example, methane (CH4) is a GHG which has a higher global warming potential than CO2. To convert a metric ton of methane to a metric ton of CO2E, a factor of 21 is used and a factor of 310 is used for N2O (consistent with ARB’s GHG inventory development, based on the second assessment report (1996) of the International Panel on Climate Change (IPCC)). Emissions are reported to two decimal places. In some cases, zero represents less than 0.005 TPY or less than 0.005 MMT/year. For example, some categories of mobile sources have CO2 and N2O reported in tons per year, but when converted to MMT CO2E, the value in the table is zero, due to rounding.
Source Categories
As described below, the GHG inventory has the following major categories: stationary sources, on-road mobile sources, and off-road mobile sources. Stationary Sources: The stationary source emissions are grouped into two categories – point sources and area sources. Point source emissions are from facilities having one or more pieces of equipment registered and permitted with SCAQMD (e.g. power plants
3
and manufacturing facilities). SCAQMD is able to collect facility emission-related information from the larger of these facilities. Area source emissions are from numerous smaller facilities (e.g., gas stations and restaurants) or the source of emissions (e.g., consumer products and architectural coatings), for which locations may not be specifically identified. Emissions from point sources that do not report emissions and for area sources are calculated from estimated emission factors and corresponding activity levels by category. The stationary point and area source inventory for the Coachella Valley was calculated using the 2007 AQMP base year inventory (2002 data) for stationary source emissions in the CVAG area. The carbon dioxide (CO2), nitrous oxide (N2O), and methane (CH4) emissions from fuel combustion for stationary point and area sources were calculated using the fuel consumption by fuel type, CO2, N2O, CH4 default Emission Factors (EFs) and High Heating Values (HHVs). The fuel consumption for point sources was actual values as reported by the facilities in their Annual Emission Reports (AER). For area sources, fuel consumption was estimated using the NOx emission rates and default compliance EFs, where applicable. The CO2, N2O, and CH4 default EFs were developed using Tables 3, 4, and 6 of the California Air Resources Board (CARB) Regulation for the Mandatory Reporting of GHG Emissions (AB 32), December 2007. The HHVs of the fuels were taken from AP 42, which is a compilation of emission factors published by the U.S. EPA. For non-combustion sources, the CH4, emissions were taken from the 2007 AQMP annual average gridded inventory. When developing emission inventories for the AQMP, EPA modeling guidance is used to overlay a grid pattern of 5 km by 5 km grid cells. The location of the point sources is known. Therefore, it is straightforward to assign these sources to a grid cell. For non-point sources, spatial allocation is accomplished by using surrogates, such as population, employment, number of households, land use data, etc., to distribute emissions to the grid cells.
Once the 2002 GHG stationary and area source emission inventory was developed, it was projected to future years (2005 and 2020) using socioeconomic forecast factors provided by Southern California Association of Governments (SCAG) for the 2007 AQMP.
To develop the stationary point and area sources inventory for each city in CVAG, staff used the following methods to estimate the CO2, N2O, and CH4
emissions:
For point sources, the entire Coachella Valley 2005 and 2020 GHG estimated emissions were used, along with facility location addresses to develop the GHG inventory at the city level.
For area sources, the 2005 and 2020 GHG estimated for the area sources, as described above, for the entire Coachella Valley were scaled down to the city level using adjustment factors. The adjustment factors
4
were developed using the area source NOx emissions ratio of each city to the entire Coachella Valley. The area source NOx emissions at the city level and entire Coachella Valley were taken from the 2005 and 2020 planning gridded inventory. NOx is directly related to fuel combustion, so this ratio is expected to be representative of GHG emissions from fuel combustion.
For both point and area sources, the GHG emissions for the unincorporated portion of the Coachella Valley were calculated using the point and area source GHG emissions for the entire Coachella Valley minus the sum of emissions for all the cities.
Agriculture/Golf Courses For fertilizer usage related GHG emissions in Coachella Valley golf courses, a list of golf courses with addresses in Coachella Valley was downloaded from http://www.golflink.com. In total, there are 99 18-hole and 38 9-hole golf courses (Table D-1). Since on average a 9-hole golf course is approximately half the length of an 18-hole, it is assumed that a 9-hole golf course uses 50% of fertilizers that an 18-hole course does. This results in a total of 118 18-hole equivalent golf courses in Coachella Valley. N2O emission factors including both direct and indirect emissions (5.86 tons of CO2E per ton of synthetic fertilizers) were obtained from CARB’s GHG Inventory data base (http://www.arb.ca.gov/cc/inventory/doc/doc_index.php). Fertilizer consumption data (64.17 tons per golf course per year) were provided by CVAG staff for a representative 18-hole golf course. From this fertilizer data, each 18-hole golf course was estimated to emit 376 MT CO2E per golf course per year. Multiplying the per golf course GHG emissions by 118 courses results in total GHG emissions of 44,368 MT CO2E per year from Coachella Valley golf courses. The same methodology was applied to determine golf course emissions within individual cities and unincorporated areas (Table D-1). The 2002 GHG emissions from prescribed burning under the agricultural burning category with EIC 670 were calculated using the actual burning activities as reported in the 2002 emissions inventory and their associated EFs1.
1 EFs were developed using Andreae and Merlet report titled “Emission of Trace Gases and Aerosols
from Biomass Burning, Global Biogeochemical Cycles”, 2001, and CARB report on “Emission Factors for Open Burning of Agricultural Residues”, August 2000
5
Landfills The 2005 CO2 and CH4 emissions from Coachella Valley landfill sources under the waste disposal category were estimated using the total amount of refuse in place (provided by the Riverside County Waste Management Department) and SCAQMD default EFs, capture efficiency, and control efficiency. Staff excluded the landfills in Blythe and estimated emissions for two types of emissions sources; controlled and surface emissions. The Coachella Valley’s landfills are located in the city of Coachella and in the unincorporated area of Coachella Valley. The landfills’ CO2 and CH4 emissions for the city of Coachella and the unincorporated area of the Coachella Valley were estimated using the amount of refuse placed in these areas, and default EFs capture and control efficiencies. The analysis included both closed and currently operating landfills. The landfills, and their current operating status, are listed below:
Coachella – closed
Desert Center – open
Edom Hill – closed
Mecca II – closed
Oasis – open The 2020 landfill emissions for the city of Coachella and the unincorporated areas were estimated using population growth factors. However, since Indio, La Quinta, and Indian Wells are near the city of Coachella, the population growth of the city of Coachella was estimated based on the average of population growth of these three cities.
On-Road Mobile Sources: The 2005 and 2020 GHG emissions from on-road mobile sources were calculated for both the entire Coachella Valley and also for each city in Coachella Valley and the unincorporated portions of Riverside County within CVAG’s boundary. The EMission FACtors (EMFAC) model is used to calculate emission rates from all motor vehicles, such as passenger cars to heavy-duty trucks, operating on highways, freeways and local roads in California. EMFAC2007 is the most recent version of this model. The model calculates emission rates from all motor vehicles operating on highways, freeways and local roads in California. In the EMFAC model, the emission rates are multiplied with vehicle activity data (miles per vehicle or number of trips or total number of vehicles) provided by the regional transportation agencies to calculate the statewide or regional emission inventories. Key data used in the model includes the class of vehicle (ex. passenger car or bus), the fuel used (gasoline, diesel, electric), the fleet mix,
6
including model years and activity per class of vehicle. Vehicle population is determined through an analysis of data from the Department of Motor Vehicles (DMV). On-Road Mobile Vehicles includes several categories of trucks that are separated by fuel type and vehicle weight (T1 up to 3,750 lbs, T2 3,750-5,750lbs, T3 5,751-8,500lbs, T4 8,501-10,000 lbs, T5 10,001-14,000lbs, T6 14,001-33,000lbs, HHD >33,000lbs). The following method was used to estimate the CO2, N2O, and CH4 from on-road mobile emissions for the entire Coachella Valley, each city within Coachella Valley, and the Coachella Valley unincorporated areas:
For the entire Coachella Valley, the CO2, and CH4 emissions were calculated using the CARB EMFAC2007 V2.3 mobile source emissions model for the specified inventory years. Since the EMFAC2007 model output contains only CO2 and CH4 emissions, the N2O emissions were calculated using a CARB methodology (i.e., vehicle miles traveled and CARB N2O emission factors which are a function of vehicle type, model year, and fuel type).
For the cities in the Coachella Valley, the CO2 and CH4 emissions were taken from the 2005 and 2020 annual average gridded inventory. However, these CO2 and CH4 emissions at the city level were adjusted so that the sum of the emissions at the city level would be equal to the same values calculated for the entire CVAG area using the EMFAC2007 model. This was done because there are minor differences in the GHG emissions for the entire CVAG area when comparing the values from the planning gridded inventory with the EMFAC2007 model output values. The EMFAC2007 model has been updated since the 2007 AQMP. The adjustment factors were the CO2 and CH4 emissions ratios of the planning inventory to the EMFAC2007 model. The N2O emissions for the entire Coachella Valley were distributed to the city level using the CH4 emissions ratio of each city to the entire Coachella Valley. The emissions from the unincorporated areas were calculated as the differences between the Coachella Valley total and the sum of the cities.
Off-Road Mobile Sources: Mobile sources not included in the on-road mobile source emissions inventory are considered as off-road mobile sources. The off-road emissions inventory is an estimate of the population, activity, and emissions estimate of the various types of off-road equipment. The major categories of engines and vehicles include agricultural, construction, lawn and garden and off-road recreation, and includes equipment from hedge trimmers to cranes. The OFFROAD Model estimates the relative contribution of gasoline, diesel, compressed natural gas, and liquefied petroleum gas powered vehicles to the overall emissions inventory of the state.
7
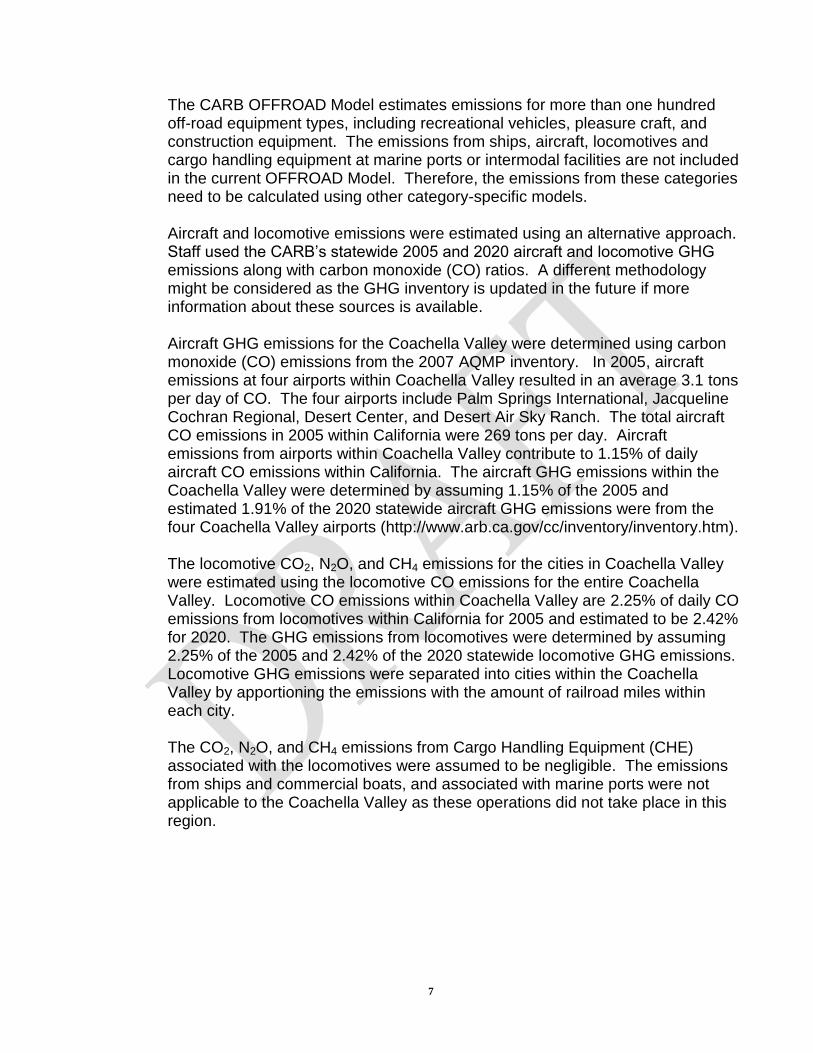
The CARB OFFROAD Model estimates emissions for more than one hundred off-road equipment types, including recreational vehicles, pleasure craft, and construction equipment. The emissions from ships, aircraft, locomotives and cargo handling equipment at marine ports or intermodal facilities are not included in the current OFFROAD Model. Therefore, the emissions from these categories need to be calculated using other category-specific models. Aircraft and locomotive emissions were estimated using an alternative approach. Staff used the CARB’s statewide 2005 and 2020 aircraft and locomotive GHG emissions along with carbon monoxide (CO) ratios. A different methodology might be considered as the GHG inventory is updated in the future if more information about these sources is available.
Aircraft GHG emissions for the Coachella Valley were determined using carbon monoxide (CO) emissions from the 2007 AQMP inventory. In 2005, aircraft emissions at four airports within Coachella Valley resulted in an average 3.1 tons per day of CO. The four airports include Palm Springs International, Jacqueline Cochran Regional, Desert Center, and Desert Air Sky Ranch. The total aircraft CO emissions in 2005 within California were 269 tons per day. Aircraft emissions from airports within Coachella Valley contribute to 1.15% of daily aircraft CO emissions within California. The aircraft GHG emissions within the Coachella Valley were determined by assuming 1.15% of the 2005 and estimated 1.91% of the 2020 statewide aircraft GHG emissions were from the four Coachella Valley airports (http://www.arb.ca.gov/cc/inventory/inventory.htm). The locomotive CO2, N2O, and CH4 emissions for the cities in Coachella Valley were estimated using the locomotive CO emissions for the entire Coachella Valley. Locomotive CO emissions within Coachella Valley are 2.25% of daily CO emissions from locomotives within California for 2005 and estimated to be 2.42% for 2020. The GHG emissions from locomotives were determined by assuming 2.25% of the 2005 and 2.42% of the 2020 statewide locomotive GHG emissions. Locomotive GHG emissions were separated into cities within the Coachella Valley by apportioning the emissions with the amount of railroad miles within each city. The CO2, N2O, and CH4 emissions from Cargo Handling Equipment (CHE) associated with the locomotives were assumed to be negligible. The emissions from ships and commercial boats, and associated with marine ports were not applicable to the Coachella Valley as these operations did not take place in this region.
8
Inventory Projection The most recently prepared complete stationary source emissions inventory for the 2007 AQMP was the one for the year 2002. Therefore, the stationary source inventories for the years 2005 and 2020 were forecasted from the 2002 inventory using the same growth surrogates and SCAG growth factors as used in the 2007 AQMP, Appendix III, Tables 2-2 through 2-7. The selection of the surrogate by which emission growth is projected depends on the type of activity. Generally these surrogates include employment growth, industry output growth, etc. The on-road and off-road GHG inventories were developed for 2005 and 2020 using the CARB EMFAC2007 and 2007 OFFROAD models. These models contain emission reductions from all rules adopted by 2007.
SUMMARY OF COACHELLA VALLEY GHG INVENTORIES
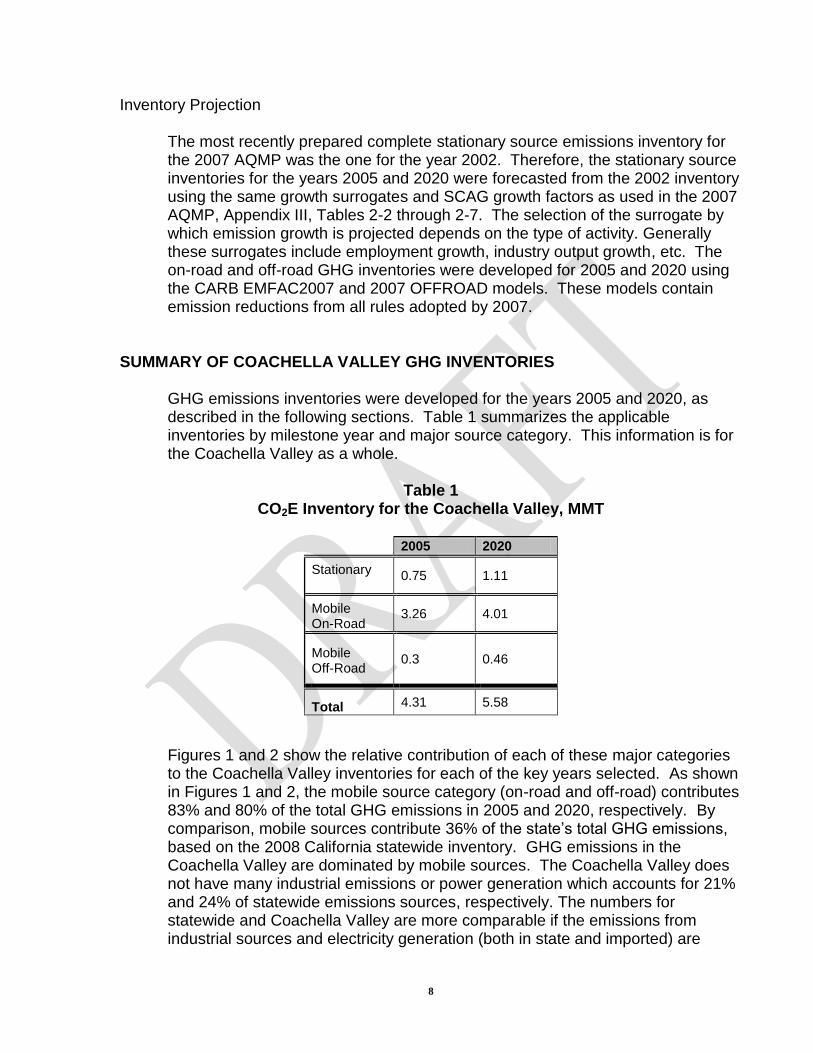
GHG emissions inventories were developed for the years 2005 and 2020, as described in the following sections. Table 1 summarizes the applicable inventories by milestone year and major source category. This information is for the Coachella Valley as a whole.
Table 1
CO2E Inventory for the Coachella Valley, MMT
2005 2020
Stationary 0.75 1.11
Mobile On-Road
3.26 4.01
Mobile Off-Road
0.3 0.46
Total 4.31 5.58
Figures 1 and 2 show the relative contribution of each of these major categories to the Coachella Valley inventories for each of the key years selected. As shown in Figures 1 and 2, the mobile source category (on-road and off-road) contributes 83% and 80% of the total GHG emissions in 2005 and 2020, respectively. By comparison, mobile sources contribute 36% of the state’s total GHG emissions, based on the 2008 California statewide inventory. GHG emissions in the Coachella Valley are dominated by mobile sources. The Coachella Valley does not have many industrial emissions or power generation which accounts for 21% and 24% of statewide emissions sources, respectively. The numbers for statewide and Coachella Valley are more comparable if the emissions from industrial sources and electricity generation (both in state and imported) are
9
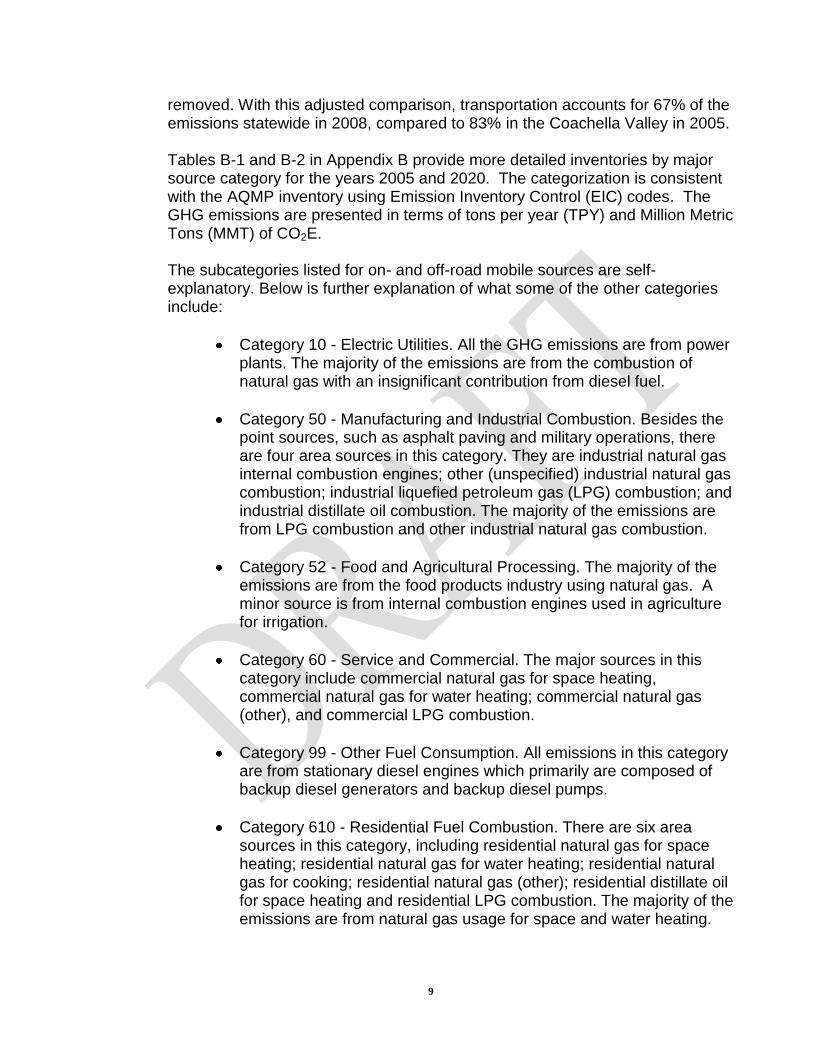
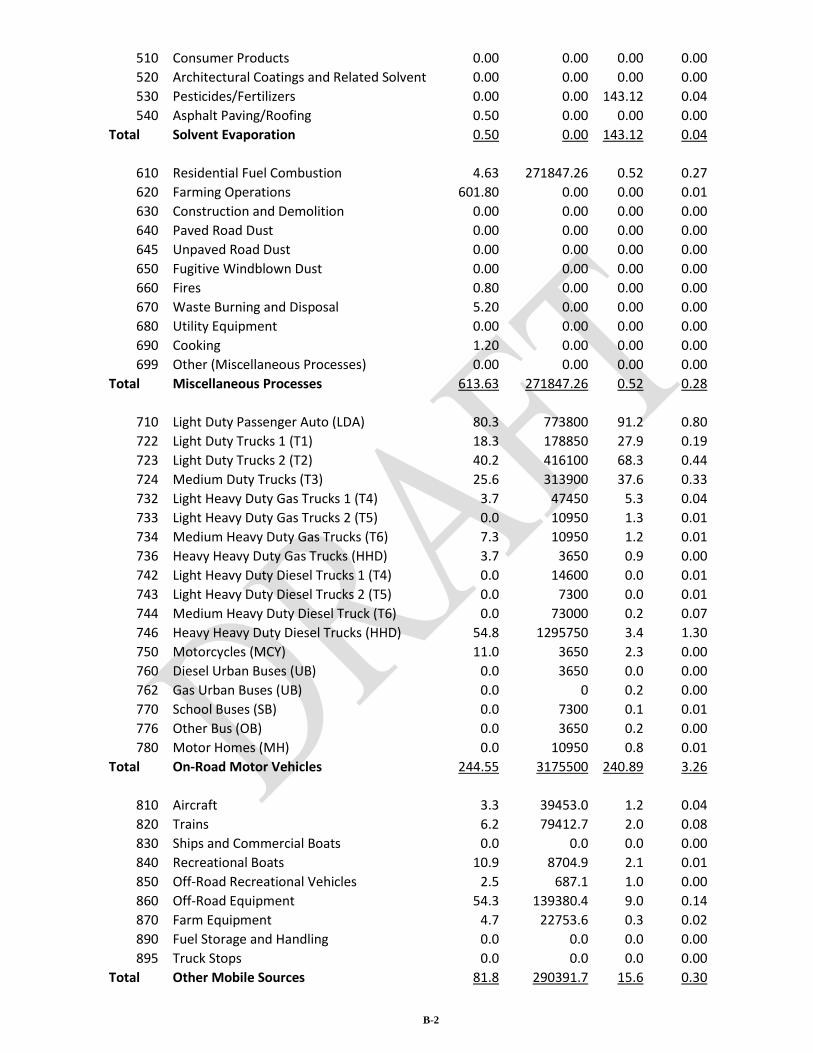
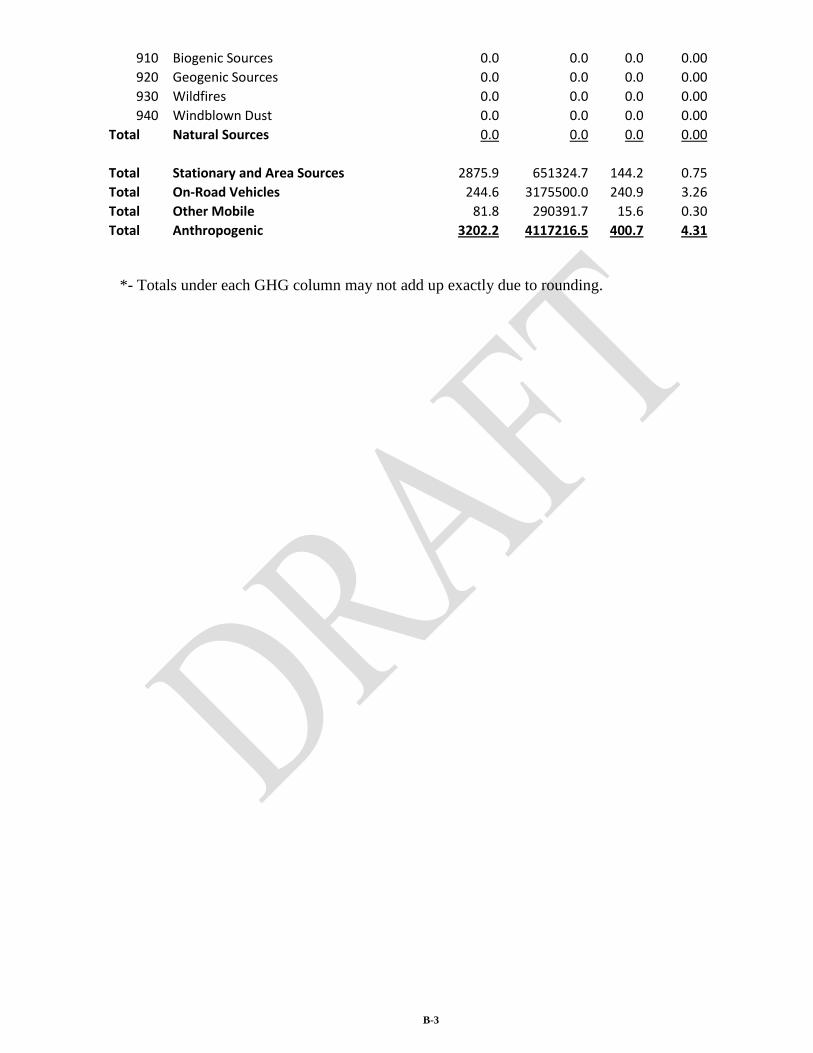
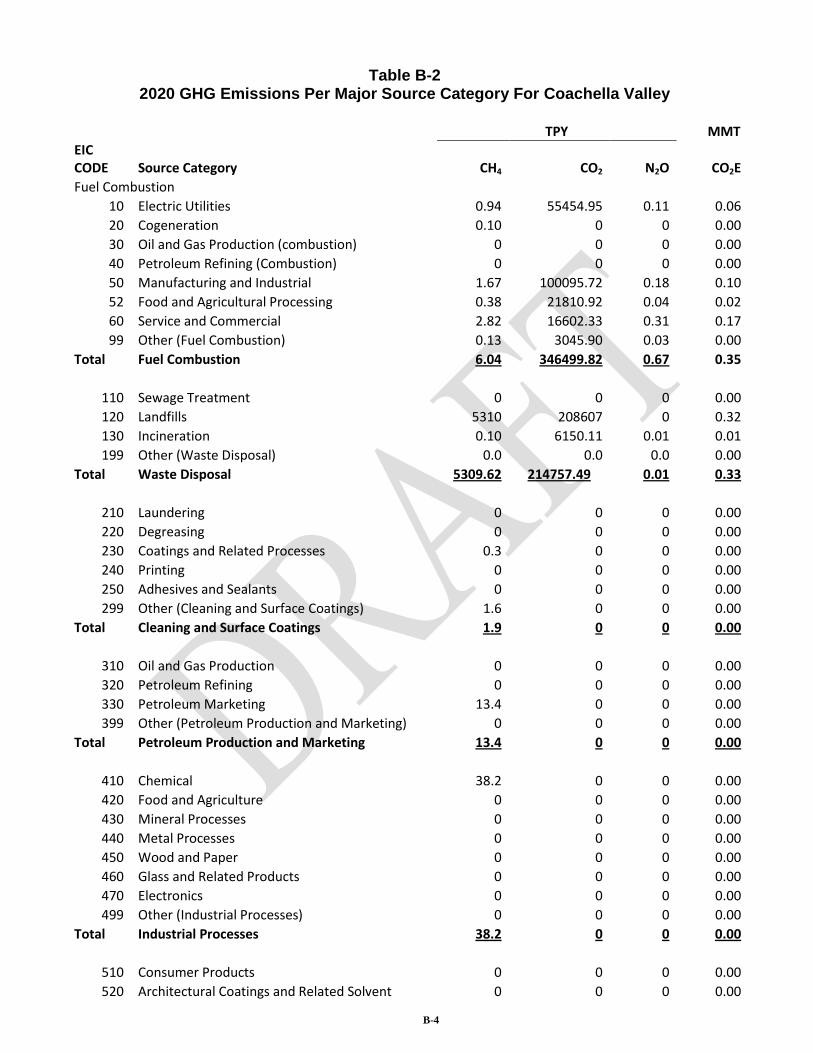
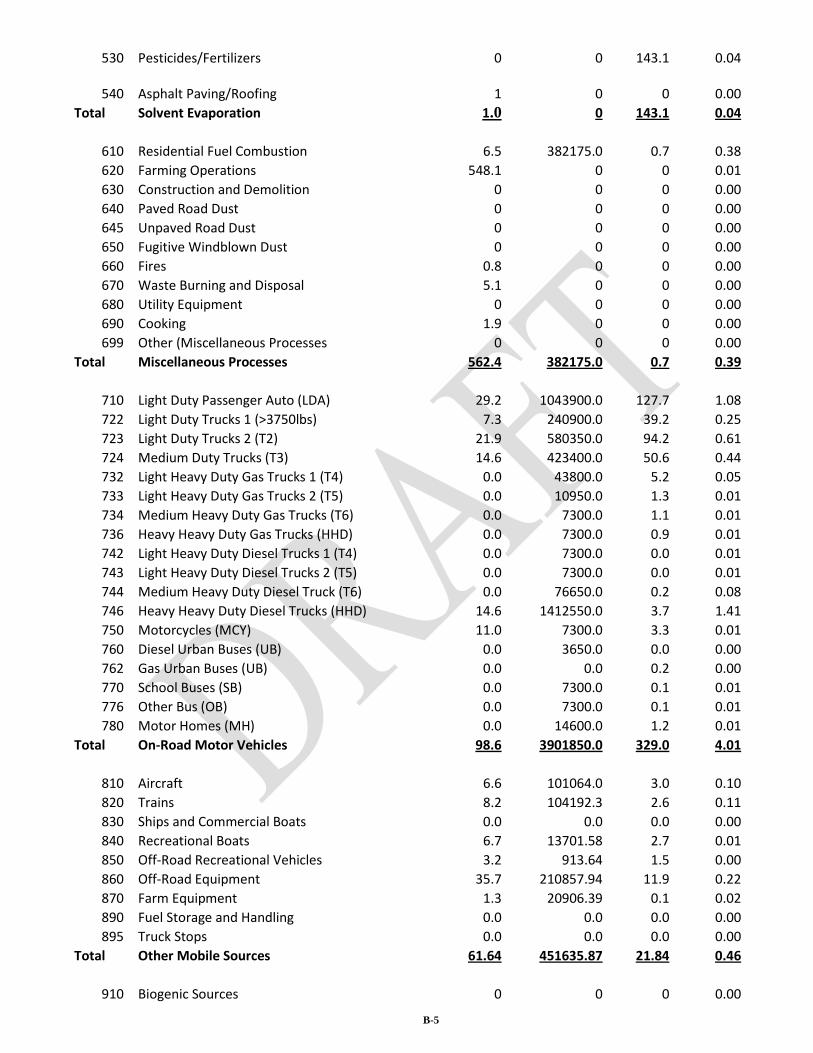
removed. With this adjusted comparison, transportation accounts for 67% of the emissions statewide in 2008, compared to 83% in the Coachella Valley in 2005. Tables B-1 and B-2 in Appendix B provide more detailed inventories by major source category for the years 2005 and 2020. The categorization is consistent with the AQMP inventory using Emission Inventory Control (EIC) codes. The GHG emissions are presented in terms of tons per year (TPY) and Million Metric Tons (MMT) of CO2E. The subcategories listed for on- and off-road mobile sources are self-explanatory. Below is further explanation of what some of the other categories include:
Category 10 - Electric Utilities. All the GHG emissions are from power plants. The majority of the emissions are from the combustion of natural gas with an insignificant contribution from diesel fuel.
Category 50 - Manufacturing and Industrial Combustion. Besides the point sources, such as asphalt paving and military operations, there are four area sources in this category. They are industrial natural gas internal combustion engines; other (unspecified) industrial natural gas combustion; industrial liquefied petroleum gas (LPG) combustion; and industrial distillate oil combustion. The majority of the emissions are from LPG combustion and other industrial natural gas combustion.
Category 52 - Food and Agricultural Processing. The majority of the emissions are from the food products industry using natural gas. A minor source is from internal combustion engines used in agriculture for irrigation.
Category 60 - Service and Commercial. The major sources in this category include commercial natural gas for space heating, commercial natural gas for water heating; commercial natural gas (other), and commercial LPG combustion.
Category 99 - Other Fuel Consumption. All emissions in this category are from stationary diesel engines which primarily are composed of backup diesel generators and backup diesel pumps.
Category 610 - Residential Fuel Combustion. There are six area sources in this category, including residential natural gas for space heating; residential natural gas for water heating; residential natural gas for cooking; residential natural gas (other); residential distillate oil for space heating and residential LPG combustion. The majority of the emissions are from natural gas usage for space and water heating.
10
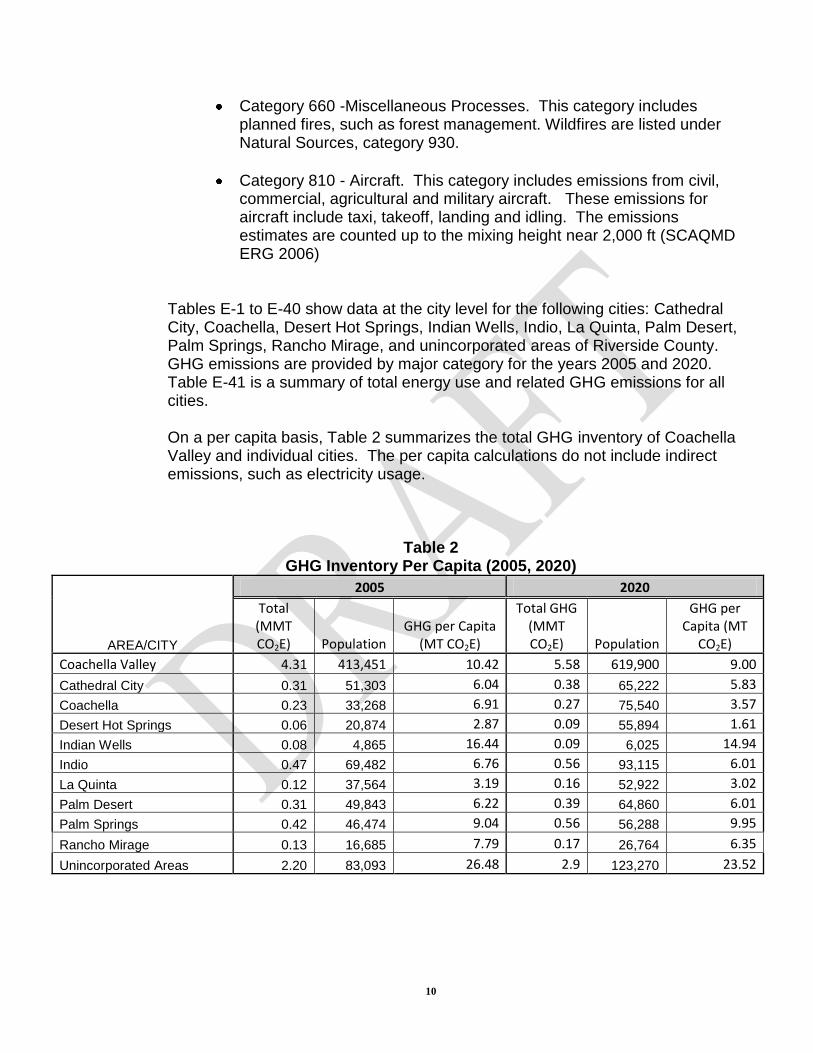
Category 660 -Miscellaneous Processes. This category includes planned fires, such as forest management. Wildfires are listed under Natural Sources, category 930.
Category 810 - Aircraft. This category includes emissions from civil, commercial, agricultural and military aircraft. These emissions for aircraft include taxi, takeoff, landing and idling. The emissions estimates are counted up to the mixing height near 2,000 ft (SCAQMD ERG 2006)
Tables E-1 to E-40 show data at the city level for the following cities: Cathedral City, Coachella, Desert Hot Springs, Indian Wells, Indio, La Quinta, Palm Desert, Palm Springs, Rancho Mirage, and unincorporated areas of Riverside County. GHG emissions are provided by major category for the years 2005 and 2020. Table E-41 is a summary of total energy use and related GHG emissions for all cities. On a per capita basis, Table 2 summarizes the total GHG inventory of Coachella Valley and individual cities. The per capita calculations do not include indirect emissions, such as electricity usage.
Table 2
GHG Inventory Per Capita (2005, 2020)
AREA/CITY
2005 2020
Total (MMT CO2E) Population
GHG per Capita (MT CO2E)
Total GHG (MMT CO2E) Population
GHG per Capita (MT
CO2E)
Coachella Valley 4.31 413,451 10.42 5.58 619,900 9.00
Cathedral City 0.31 51,303 6.04 0.38 65,222 5.83
Coachella 0.23 33,268 6.91 0.27 75,540 3.57
Desert Hot Springs 0.06 20,874 2.87 0.09 55,894 1.61
Indian Wells 0.08 4,865 16.44 0.09 6,025 14.94
Indio 0.47 69,482 6.76 0.56 93,115 6.01
La Quinta 0.12 37,564 3.19 0.16 52,922 3.02
Palm Desert 0.31 49,843 6.22 0.39 64,860 6.01
Palm Springs 0.42 46,474 9.04 0.56 56,288 9.95
Rancho Mirage 0.13 16,685 7.79 0.17 26,764 6.35
Unincorporated Areas 2.20 83,093 26.48 2.9 123,270 23.52

11
Discussion This inventory methodology is primarily based on the methodology used to develop the SCAQMD 2007 AQMP, and is consistent with the State Implementation Plan (SIP) approach, such that it can be easily integrated with the local SIP planning process. The methodology outlined in this document takes advantage of years of technical improvements for criteria pollutant inventories and the benefits of extensive public review and agency oversight. Enhancements were made to GHG inventories regarding indirect emissions (i.e., electricity consumption). As additional technical information and standardized GHG inventory protocols become available over time, the GHG inventories can be further enhanced by including additional greenhouse gases, improved methodology or better emission factors.
12
Figure 1
2005 Coachella Valley Inventory
Figure 2
2020 Coachella Valley Inventory
TOTAL= 4.31 MMT CO2E
TOTAL= 5.58 MMT CO2E
On-Road Mobile72%
Off-Road
Mobile8
Stationary20%
On-Road Mobile
76%
Off-Road Mobile
7%
Stationary17%
13
REFERENCES California Department of Finance. City/Coachella Valley Population and Housing Estimates, Table 2: E-5, January 1, 2007. CARB, 2006. CARB OFFROAD Model Input Factors. CARB, 2007. CARB EMFAC2007 Model. CARB, 2007. CARB OFFROAD Model. SCAG, 2004. Regional Transportation Plan. SCAQMD and ERG, 2006. Development of the 2002 Aircraft Emission Inventory and Projected Activity and Emissions for 2010, 2020, and 2030 SCAQMD, 2007. 2007 Air Quality Management Plan Appendix IV: District’s Stationary and Mobile Source Control Measures. SCAQMD, 2007. 2007 Air Quality Management Plan Appendix III; Base and Future Year Emission Inventories.
SCAQMD, 2007. 2007 Air Quality Management Plan.
U.S. EPA, 1998, Fifth Edition, Volume 1, Chapter 44: Greenhouse Gas Biogenic Sources 14.4 Enteric Fermentation – Greenhouse Gases, Supplement D., February 1998. U.S. EPA, AP-42, Compilation of Air Pollutant Emission Factors, Fifth Edition, January 1995. U.S. EPA, Methods for Estimating Greenhouse Gas Emissions for Livestock Manure Management, Livestock Manure Management (March 2005) Draft.
A-1
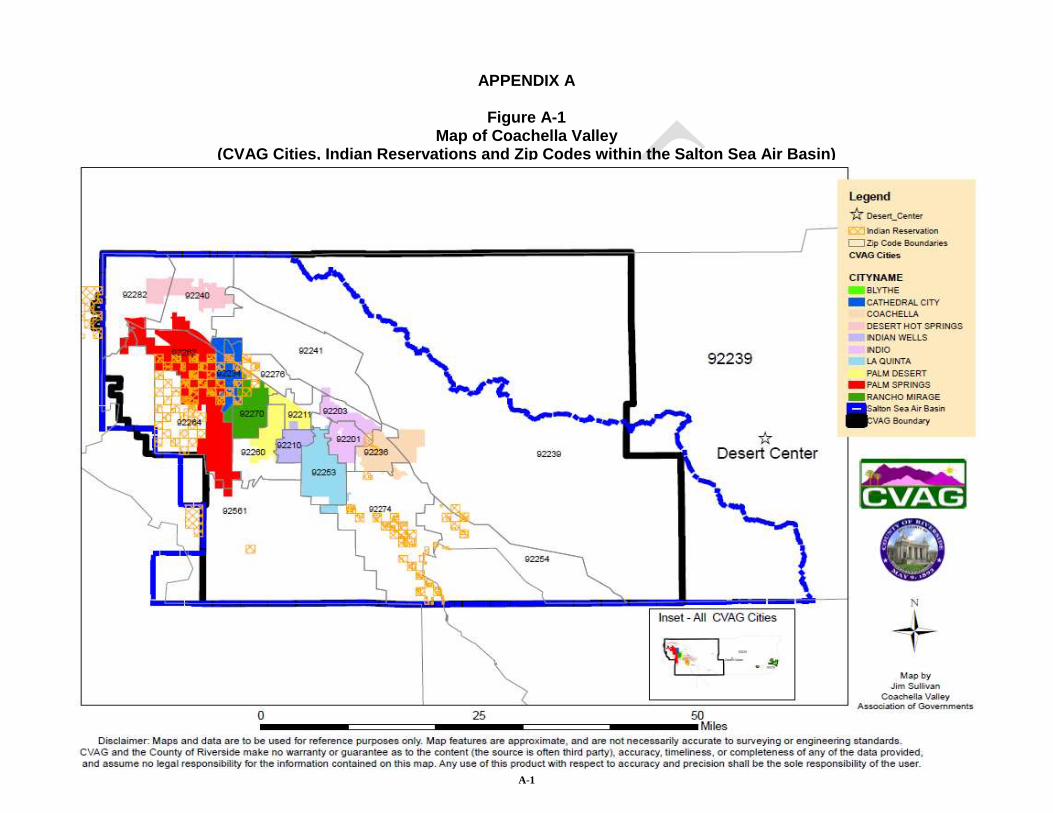
APPENDIX A
Figure A-1
Map of Coachella Valley (CVAG Cities, Indian Reservations and Zip Codes within the Salton Sea Air Basin)
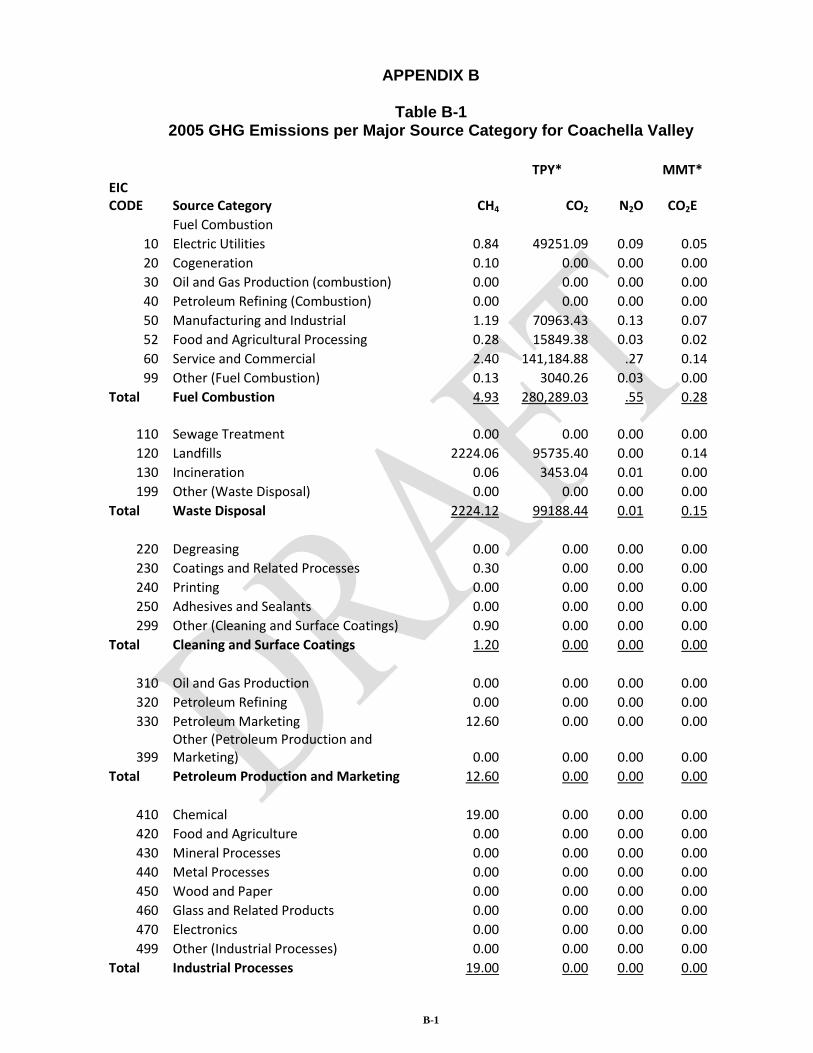
B-1
APPENDIX B
Table B-1 2005 GHG Emissions per Major Source Category for Coachella Valley
TPY* MMT*
EIC CODE Source Category CH4 CO2 N2O CO2E
Fuel Combustion
10 Electric Utilities 0.84 49251.09 0.09 0.05
20 Cogeneration 0.10 0.00 0.00 0.00
30 Oil and Gas Production (combustion) 0.00 0.00 0.00 0.00
40 Petroleum Refining (Combustion) 0.00 0.00 0.00 0.00
50 Manufacturing and Industrial 1.19 70963.43 0.13 0.07
52 Food and Agricultural Processing 0.28 15849.38 0.03 0.02
60 Service and Commercial 2.40 141,184.88 .27 0.14
99 Other (Fuel Combustion) 0.13 3040.26 0.03 0.00
Total Fuel Combustion 4.93 280,289.03 .55 0.28
110 Sewage Treatment 0.00 0.00 0.00 0.00
120 Landfills 2224.06 95735.40 0.00 0.14
130 Incineration 0.06 3453.04 0.01 0.00
199 Other (Waste Disposal) 0.00 0.00 0.00 0.00
Total Waste Disposal 2224.12 99188.44 0.01 0.15
220 Degreasing 0.00 0.00 0.00 0.00
230 Coatings and Related Processes 0.30 0.00 0.00 0.00
240 Printing 0.00 0.00 0.00 0.00
250 Adhesives and Sealants 0.00 0.00 0.00 0.00
299 Other (Cleaning and Surface Coatings) 0.90 0.00 0.00 0.00
Total Cleaning and Surface Coatings 1.20 0.00 0.00 0.00
310 Oil and Gas Production 0.00 0.00 0.00 0.00
320 Petroleum Refining 0.00 0.00 0.00 0.00
330 Petroleum Marketing 12.60 0.00 0.00 0.00
399 Other (Petroleum Production and Marketing) 0.00 0.00 0.00 0.00
Total Petroleum Production and Marketing 12.60 0.00 0.00 0.00
410 Chemical 19.00 0.00 0.00 0.00
420 Food and Agriculture 0.00 0.00 0.00 0.00
430 Mineral Processes 0.00 0.00 0.00 0.00
440 Metal Processes 0.00 0.00 0.00 0.00
450 Wood and Paper 0.00 0.00 0.00 0.00
460 Glass and Related Products 0.00 0.00 0.00 0.00
470 Electronics 0.00 0.00 0.00 0.00
499 Other (Industrial Processes) 0.00 0.00 0.00 0.00
Total Industrial Processes 19.00 0.00 0.00 0.00
B-2
510 Consumer Products 0.00 0.00 0.00 0.00
520 Architectural Coatings and Related Solvent 0.00 0.00 0.00 0.00
530 Pesticides/Fertilizers 0.00 0.00 143.12 0.04
540 Asphalt Paving/Roofing 0.50 0.00 0.00 0.00
Total Solvent Evaporation 0.50 0.00 143.12 0.04
610 Residential Fuel Combustion 4.63 271847.26 0.52 0.27
620 Farming Operations 601.80 0.00 0.00 0.01
630 Construction and Demolition 0.00 0.00 0.00 0.00
640 Paved Road Dust 0.00 0.00 0.00 0.00
645 Unpaved Road Dust 0.00 0.00 0.00 0.00
650 Fugitive Windblown Dust 0.00 0.00 0.00 0.00
660 Fires 0.80 0.00 0.00 0.00
670 Waste Burning and Disposal 5.20 0.00 0.00 0.00
680 Utility Equipment 0.00 0.00 0.00 0.00
690 Cooking 1.20 0.00 0.00 0.00
699 Other (Miscellaneous Processes) 0.00 0.00 0.00 0.00
Total Miscellaneous Processes 613.63 271847.26 0.52 0.28
710 Light Duty Passenger Auto (LDA) 80.3 773800 91.2 0.80
722 Light Duty Trucks 1 (T1) 18.3 178850 27.9 0.19
723 Light Duty Trucks 2 (T2) 40.2 416100 68.3 0.44
724 Medium Duty Trucks (T3) 25.6 313900 37.6 0.33
732 Light Heavy Duty Gas Trucks 1 (T4) 3.7 47450 5.3 0.04
733 Light Heavy Duty Gas Trucks 2 (T5) 0.0 10950 1.3 0.01
734 Medium Heavy Duty Gas Trucks (T6) 7.3 10950 1.2 0.01
736 Heavy Heavy Duty Gas Trucks (HHD) 3.7 3650 0.9 0.00
742 Light Heavy Duty Diesel Trucks 1 (T4) 0.0 14600 0.0 0.01
743 Light Heavy Duty Diesel Trucks 2 (T5) 0.0 7300 0.0 0.01
744 Medium Heavy Duty Diesel Truck (T6) 0.0 73000 0.2 0.07
746 Heavy Heavy Duty Diesel Trucks (HHD) 54.8 1295750 3.4 1.30
750 Motorcycles (MCY) 11.0 3650 2.3 0.00
760 Diesel Urban Buses (UB) 0.0 3650 0.0 0.00
762 Gas Urban Buses (UB) 0.0 0 0.2 0.00
770 School Buses (SB) 0.0 7300 0.1 0.01
776 Other Bus (OB) 0.0 3650 0.2 0.00
780 Motor Homes (MH) 0.0 10950 0.8 0.01
Total On-Road Motor Vehicles 244.55 3175500 240.89 3.26
810 Aircraft 3.3 39453.0 1.2 0.04
820 Trains 6.2 79412.7 2.0 0.08
830 Ships and Commercial Boats 0.0 0.0 0.0 0.00
840 Recreational Boats 10.9 8704.9 2.1 0.01
850 Off-Road Recreational Vehicles 2.5 687.1 1.0 0.00
860 Off-Road Equipment 54.3 139380.4 9.0 0.14
870 Farm Equipment 4.7 22753.6 0.3 0.02
890 Fuel Storage and Handling 0.0 0.0 0.0 0.00
895 Truck Stops 0.0 0.0 0.0 0.00
Total Other Mobile Sources 81.8 290391.7 15.6 0.30
B-3
910 Biogenic Sources 0.0 0.0 0.0 0.00
920 Geogenic Sources 0.0 0.0 0.0 0.00
930 Wildfires 0.0 0.0 0.0 0.00
940 Windblown Dust 0.0 0.0 0.0 0.00
Total Natural Sources 0.0 0.0 0.0 0.00
Total Stationary and Area Sources 2875.9 651324.7 144.2 0.75
Total On-Road Vehicles 244.6 3175500.0 240.9 3.26
Total Other Mobile 81.8 290391.7 15.6 0.30
Total Anthropogenic 3202.2 4117216.5 400.7 4.31
*- Totals under each GHG column may not add up exactly due to rounding.
B-4
Table B-2 2020 GHG Emissions Per Major Source Category For Coachella Valley
TPY MMT
EIC CODE Source Category CH4 CO2 N2O CO2E
Fuel Combustion
10 Electric Utilities 0.94 55454.95 0.11 0.06
20 Cogeneration 0.10 0 0 0.00
30 Oil and Gas Production (combustion) 0 0 0 0.00
40 Petroleum Refining (Combustion) 0 0 0 0.00
50 Manufacturing and Industrial 1.67 100095.72 0.18 0.10
52 Food and Agricultural Processing 0.38 21810.92 0.04 0.02
60 Service and Commercial 2.82 16602.33 0.31 0.17
99 Other (Fuel Combustion) 0.13 3045.90 0.03 0.00
Total Fuel Combustion 6.04 346499.82 0.67 0.35
110 Sewage Treatment 0 0 0 0.00
120 Landfills 5310 208607 0 0.32
130 Incineration 0.10 6150.11 0.01 0.01
199 Other (Waste Disposal) 0.0 0.0 0.0 0.00
Total Waste Disposal 5309.62 214757.49 0.01 0.33
210 Laundering 0 0 0 0.00
220 Degreasing 0 0 0 0.00
230 Coatings and Related Processes 0.3 0 0 0.00
240 Printing 0 0 0 0.00
250 Adhesives and Sealants 0 0 0 0.00
299 Other (Cleaning and Surface Coatings) 1.6 0 0 0.00
Total Cleaning and Surface Coatings 1.9 0 0 0.00
310 Oil and Gas Production 0 0 0 0.00
320 Petroleum Refining 0 0 0 0.00
330 Petroleum Marketing 13.4 0 0 0.00
399 Other (Petroleum Production and Marketing) 0 0 0 0.00
Total Petroleum Production and Marketing 13.4 0 0 0.00
410 Chemical 38.2 0 0 0.00
420 Food and Agriculture 0 0 0 0.00
430 Mineral Processes 0 0 0 0.00
440 Metal Processes 0 0 0 0.00
450 Wood and Paper 0 0 0 0.00
460 Glass and Related Products 0 0 0 0.00
470 Electronics 0 0 0 0.00
499 Other (Industrial Processes) 0 0 0 0.00
Total Industrial Processes 38.2 0 0 0.00
510 Consumer Products 0 0 0 0.00
520 Architectural Coatings and Related Solvent 0 0 0 0.00
B-5
530 Pesticides/Fertilizers 0 0 143.1 0.04
540 Asphalt Paving/Roofing 1 0 0 0.00
Total Solvent Evaporation 1.0 0 143.1 0.04
610 Residential Fuel Combustion 6.5 382175.0 0.7 0.38
620 Farming Operations 548.1 0 0 0.01
630 Construction and Demolition 0 0 0 0.00
640 Paved Road Dust 0 0 0 0.00
645 Unpaved Road Dust 0 0 0 0.00
650 Fugitive Windblown Dust 0 0 0 0.00
660 Fires 0.8 0 0 0.00
670 Waste Burning and Disposal 5.1 0 0 0.00
680 Utility Equipment 0 0 0 0.00
690 Cooking 1.9 0 0 0.00
699 Other (Miscellaneous Processes 0 0 0 0.00
Total Miscellaneous Processes 562.4 382175.0 0.7 0.39
710 Light Duty Passenger Auto (LDA) 29.2 1043900.0 127.7 1.08
722 Light Duty Trucks 1 (>3750lbs) 7.3 240900.0 39.2 0.25
723 Light Duty Trucks 2 (T2) 21.9 580350.0 94.2 0.61
724 Medium Duty Trucks (T3) 14.6 423400.0 50.6 0.44
732 Light Heavy Duty Gas Trucks 1 (T4) 0.0 43800.0 5.2 0.05
733 Light Heavy Duty Gas Trucks 2 (T5) 0.0 10950.0 1.3 0.01
734 Medium Heavy Duty Gas Trucks (T6) 0.0 7300.0 1.1 0.01
736 Heavy Heavy Duty Gas Trucks (HHD) 0.0 7300.0 0.9 0.01
742 Light Heavy Duty Diesel Trucks 1 (T4) 0.0 7300.0 0.0 0.01
743 Light Heavy Duty Diesel Trucks 2 (T5) 0.0 7300.0 0.0 0.01
744 Medium Heavy Duty Diesel Truck (T6) 0.0 76650.0 0.2 0.08
746 Heavy Heavy Duty Diesel Trucks (HHD) 14.6 1412550.0 3.7 1.41
750 Motorcycles (MCY) 11.0 7300.0 3.3 0.01
760 Diesel Urban Buses (UB) 0.0 3650.0 0.0 0.00
762 Gas Urban Buses (UB) 0.0 0.0 0.2 0.00
770 School Buses (SB) 0.0 7300.0 0.1 0.01
776 Other Bus (OB) 0.0 7300.0 0.1 0.01
780 Motor Homes (MH) 0.0 14600.0 1.2 0.01
Total On-Road Motor Vehicles 98.6 3901850.0 329.0 4.01
810 Aircraft 6.6 101064.0 3.0 0.10
820 Trains 8.2 104192.3 2.6 0.11
830 Ships and Commercial Boats 0.0 0.0 0.0 0.00
840 Recreational Boats 6.7 13701.58 2.7 0.01
850 Off-Road Recreational Vehicles 3.2 913.64 1.5 0.00
860 Off-Road Equipment 35.7 210857.94 11.9 0.22
870 Farm Equipment 1.3 20906.39 0.1 0.02
890 Fuel Storage and Handling 0.0 0.0 0.0 0.00
895 Truck Stops 0.0 0.0 0.0 0.00
Total Other Mobile Sources 61.64 451635.87 21.84 0.46
910 Biogenic Sources 0 0 0 0.00

B-6
920 Geogenic Sources 0 0 0 0.00
930 Wildfires 0 0 0 0.00
940 Windblown Dust 0 0 0 0.00
Total Natural Sources 0 0 0
Total Stationary and Area Sources 5933.0 943431.9 144.5 1.11
Total On-Road Vehicles 98.6 3901850.0 329.0 4.01
Total Other Mobile 61.6 451635.9 21.8 0.46
Total Anthropogenic 6092.8 5296918.2 495.4 5.58
C-1
*CVWD – Coachella Valley Water District **AF – Acre Feet ***MG - Million Gallons
Table C Historical Energy Consumption
Southern California Edison/CVWD*
Domestic Water Well Production & Wastewater Treatment
1990 CVWD Facilities kWh AF** kWh/AF MG*** kWh/MG
Domestic Water Wells 34,219,863 52,631 650 17,147 1,996
Wastewater Treatment 10,795,444 8,029 1,344 2,616 4,126
Totals 45,015,307 60,660 742 19,763 2,278
1995 CVWD Facilities kWh AF kWh/AF MG kWh/MG
Domestic Water Wells 36,080,052 54,370 664 17,714 2,037
Wastewater Treatment 15,456,570 10,620 1,455 3,460 4,468
Totals 51,536,622 64,990 793 21,174 2,434
2000 CVWD Facilities kWh AF kWh/AF MG kWh/MG
Domestic Water Wells 61,313,490 76,966 797 25,076 2,445
Wastewater Treatment 13,092,087 11,519 1,137 3,753 3,489
Totals 74,405,577 88,485 841 28,829 2,581
2005 CVWD Facilities kWh AF kWh/AF MG kWh/MG
Domestic Water Wells 54,395,797 74,924 726 24,410 2,228
Wastewater Treatment 16,729,386 12,781 1,309 4,164 4,018
Totals 71,125,183 87,705 811 28,574 2,489
2008-2009 CVWD Facilities kWh AF kWh/AF MG kWh/MG
Domestic Water Wells 58,848,866 84,020 700 27,374 2,150
Wastewater Treatment 16,034,481 11,912 1,346 3,881 4,131
Totals 74,883,347 95,932 781 31,255 2,396

D-1
APPENDIX D Fertilizer Data
Table D-1
2005 N2O Emissions from Fertilizer for Coachella Valley Golf Courses
City 18
holes* 9
holes* 18 hole
equivalent** N2O emissions
(MT CO2E/yr)***
Cathedral City 4 7 7.5 2,820
Coachella 0 1 0.5 188
Desert Hot Springs 2 4 4 1,504
Indian Wells 10 1 10.5 3,948
Indio 10 3 11.5 4,324
La Quinta 24 1 24.5 9,212
Palm Desert 28 10 33 12,408
Palm Springs 8 3 9.5 3,572
Rancho Mirage 12 3 13.5 5,076
Unincorporated 1 5 3.5 1,316
Total 99 38 118 44,368
* Data from www.golflink.com ** Assuming a 9 hole golf course consume 50% of the fertilizer that a regular 18 hole course would use.
*** N2O emission factors including both direct and indirect emissions (5.86 tons of CO2E per ton of synthetic fertilizers) were obtained from CARB’s GHG inventory data base (http://www.arb.ca.gov/cc/inventory/doc/doc_index.php). Fertilizer consumption data (64.17 ton per golf course per year) were provided by CVAG staff on representative 18-hole golf courses.
E-1
APPENDIX E Coachella Valley Cities
Table E-1 Cathedral City - 2005 GHG Emissions per Major Source Category
TPY MMT
EIC CODE Source Category CH4 CO2 N2O CO2E
Fuel Combustion
10 Electric Utilities 0 0 0 0.00
20 Cogeneration 0 0 0 0.00
30 Oil and Gas Production (combustion) 0 0 0 0.00
40 Petroleum Refining (Combustion) 0 0 0 0.00
50 Manufacturing and Industrial 0.1 4882.3 0 0.00
52 Food and Agricultural Processing 0 0 0 0.00
60 Service and Commercial 0.2 12805.0 0 0.01
99 Other (Fuel Combustion) 0 249.4 0 0.00
Total Fuel Combustion 0.3 17936.7 0 0.02
110 Sewage Treatment 0 0 0 0.00
120 Landfills 0 0 0 0.00
130 Incineration 0 0 0 0.00
199 Other (Waste Disposal) 0 0 0 0.00
Total Waste Disposal 0 0 0 0.00
210 Laundering 0 0 0 0.00
220 Degreasing 0 0 0 0.00
230 Coatings and Related Processes 0 0 0 0.00
240 Printing 0 0 0 0.00
250 Adhesives and Sealants 0 0 0 0.00
299 Other (Cleaning and Surface Coatings) 0.1 0 0 0.00
Total Cleaning and Surface Coatings 0.1 0 0 0.00
310 Oil and Gas Production 0 0 0 0.00
320 Petroleum Refining 0 0 0 0.00
330 Petroleum Marketing 1.2 0 0 0.00
399 Other (Petroleum Production and Marketing) 0 0 0 0.00
Total Petroleum Production and Marketing 1.2 0 0 0.00
410 Chemical 1.6 0 0 0.00
420 Food and Agriculture 0 0 0 0.00
430 Mineral Processes 0 0 0 0.00
440 Metal Processes 0 0 0 0.00
450 Wood and Paper 0 0 0 0.00
460 Glass and Related Products 0 0 0 0.00
470 Electronics 0 0 0 0.00
E-2
499 Other (Industrial Processes) 0 0 0 0.00
Total Industrial Processes 1.6 0 0 0.00
510 Consumer Products 0 0 0 0.00
520 Architectural Coatings and Related Solvent 0 0 0 0.00
530 Pesticides/Fertilizers 0 0 9.1 0.00
540 Asphalt Paving/Roofing 0.1 0 0 0.00
Total Solvent Evaporation 0.1 0 9.1 0.00
610 Residential Fuel Combustion 0.5 26456.8 0.05 0.03
620 Farming Operations 0 0 0 0.00
630 Construction and Demolition 0 0 0 0.00
640 Paved Road Dust 0 0 0 0.00
645 Unpaved Road Dust 0 0 0 0.00
650 Fugitive Windblown Dust 0 0 0 0.00
660 Fires 0.1 0 0 0.00
670 Waste Burning and Disposal 0 0 0 0.00
680 Utility Equipment 0 0 0 0.00
690 Cooking 0.1 0 0 0.00
699 Other (Miscellaneous Processes 0 0 0 0.00
Total Miscellaneous Processes 0.7 26456.8 0.05 0.03
710 Light Duty Passenger Auto (LDA) 7.6 62717.7 8.6 0.07
722 Light Duty Trucks 1 (T1) 1.7 14495.8 2.6 0.02
723 Light Duty Trucks 2 (T2) 3.7 33725.2 6.3 0.04
724 Medium Duty Trucks (T3) 2.4 25442.1 3.6 0.03
732 Light Heavy Duty Gas Trucks 1 (T4) 0.3 3129.8 0.4 0.00
733 Light Heavy Duty Gas Trucks 2 (T5) 0 722.3 0.1 0.00
734 Medium Heavy Duty Gas Trucks (T6) 0.6 722.3 0.1 0.00
736 Heavy Heavy Duty Gas Trucks (HHD) 0.2 240.8 0.1 0.00
742 Light Heavy Duty Diesel Trucks 1 (T4) 0 963.4 0 0.00
743 Light Heavy Duty Diesel Trucks 2 (T5) 0 481.5 0 0.00
744 Medium Heavy Duty Diesel Truck (T6) 0 4815.2 0 0.00
746 Heavy Heavy Duty Diesel Trucks (HHD) 3.8 85469.3 0.2 0.09
750 Motorcycles (MCY) 1.0 295.8 0.2 0.00
760 Diesel Urban Buses (UB) 0 295.8 0 0.00
762 Gas Urban Buses (UB) 0 0 0 0.00
770 School Buses (SB) 0 591.9 0 0.00
776 Other Bus (OB) 0 295.7 0 0.00
780 Motor Homes (MH) 0 887.1 0.1 0.00
Total On-Road Motor Vehicles 21.3 235291.7 22.4 0.24
810 Aircraft 0 0 0 0.00
820 Trains 0.2 3054.3 0.1 0.00
830 Ships and Commercial Boats 0 0 0 0.00
840 Recreational Boats 0.1 76.4 0 0.00
850 Off-Road Recreational Vehicles 0.1 16.4 0 0.00
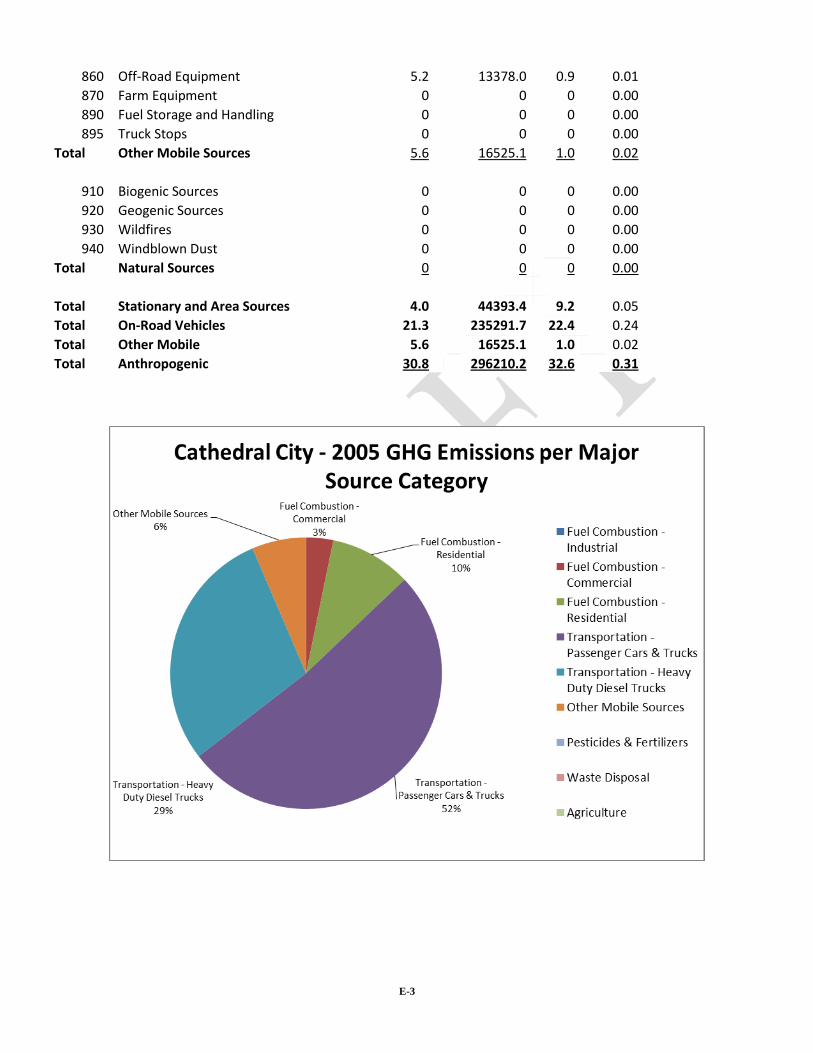
E-3
860 Off-Road Equipment 5.2 13378.0 0.9 0.01
870 Farm Equipment 0 0 0 0.00
890 Fuel Storage and Handling 0 0 0 0.00
895 Truck Stops 0 0 0 0.00
Total Other Mobile Sources 5.6 16525.1 1.0 0.02
910 Biogenic Sources 0 0 0 0.00
920 Geogenic Sources 0 0 0 0.00
930 Wildfires 0 0 0 0.00
940 Windblown Dust 0 0 0 0.00
Total Natural Sources 0 0 0 0.00
Total Stationary and Area Sources 4.0 44393.4 9.2 0.05
Total On-Road Vehicles 21.3 235291.7 22.4 0.24
Total Other Mobile 5.6 16525.1 1.0 0.02
Total Anthropogenic 30.8 296210.2 32.6 0.31
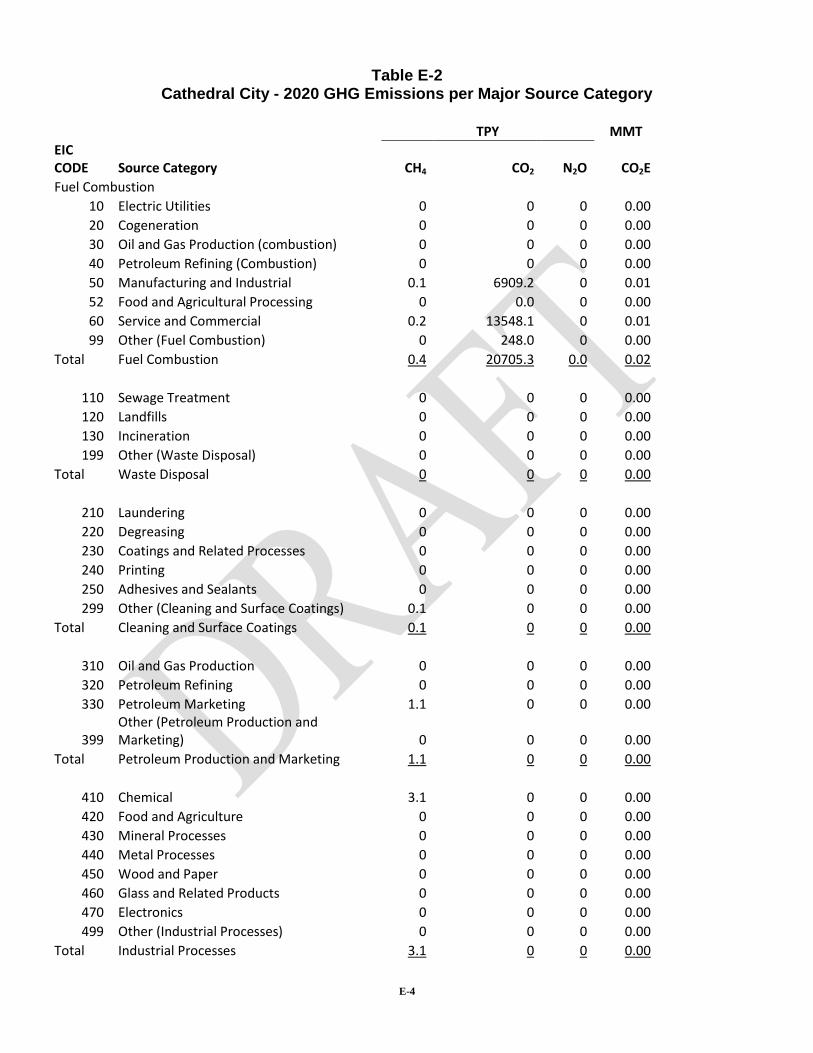
E-4
Table E-2 Cathedral City - 2020 GHG Emissions per Major Source Category
TPY MMT
EIC CODE Source Category CH4 CO2 N2O CO2E
Fuel Combustion
10 Electric Utilities 0 0 0 0.00
20 Cogeneration 0 0 0 0.00
30 Oil and Gas Production (combustion) 0 0 0 0.00
40 Petroleum Refining (Combustion) 0 0 0 0.00
50 Manufacturing and Industrial 0.1 6909.2 0 0.01
52 Food and Agricultural Processing 0 0.0 0 0.00
60 Service and Commercial 0.2 13548.1 0 0.01
99 Other (Fuel Combustion) 0 248.0 0 0.00
Total Fuel Combustion 0.4 20705.3 0.0 0.02
110 Sewage Treatment 0 0 0 0.00
120 Landfills 0 0 0 0.00
130 Incineration 0 0 0 0.00
199 Other (Waste Disposal) 0 0 0 0.00
Total Waste Disposal 0 0 0 0.00
210 Laundering 0 0 0 0.00
220 Degreasing 0 0 0 0.00
230 Coatings and Related Processes 0 0 0 0.00
240 Printing 0 0 0 0.00
250 Adhesives and Sealants 0 0 0 0.00
299 Other (Cleaning and Surface Coatings) 0.1 0 0 0.00
Total Cleaning and Surface Coatings 0.1 0 0 0.00
310 Oil and Gas Production 0 0 0 0.00
320 Petroleum Refining 0 0 0 0.00
330 Petroleum Marketing 1.1 0 0 0.00
399 Other (Petroleum Production and Marketing) 0 0 0 0.00
Total Petroleum Production and Marketing 1.1 0 0 0.00
410 Chemical 3.1 0 0 0.00
420 Food and Agriculture 0 0 0 0.00
430 Mineral Processes 0 0 0 0.00
440 Metal Processes 0 0 0 0.00
450 Wood and Paper 0 0 0 0.00
460 Glass and Related Products 0 0 0 0.00
470 Electronics 0 0 0 0.00
499 Other (Industrial Processes) 0 0 0 0.00
Total Industrial Processes 3.1 0 0 0.00
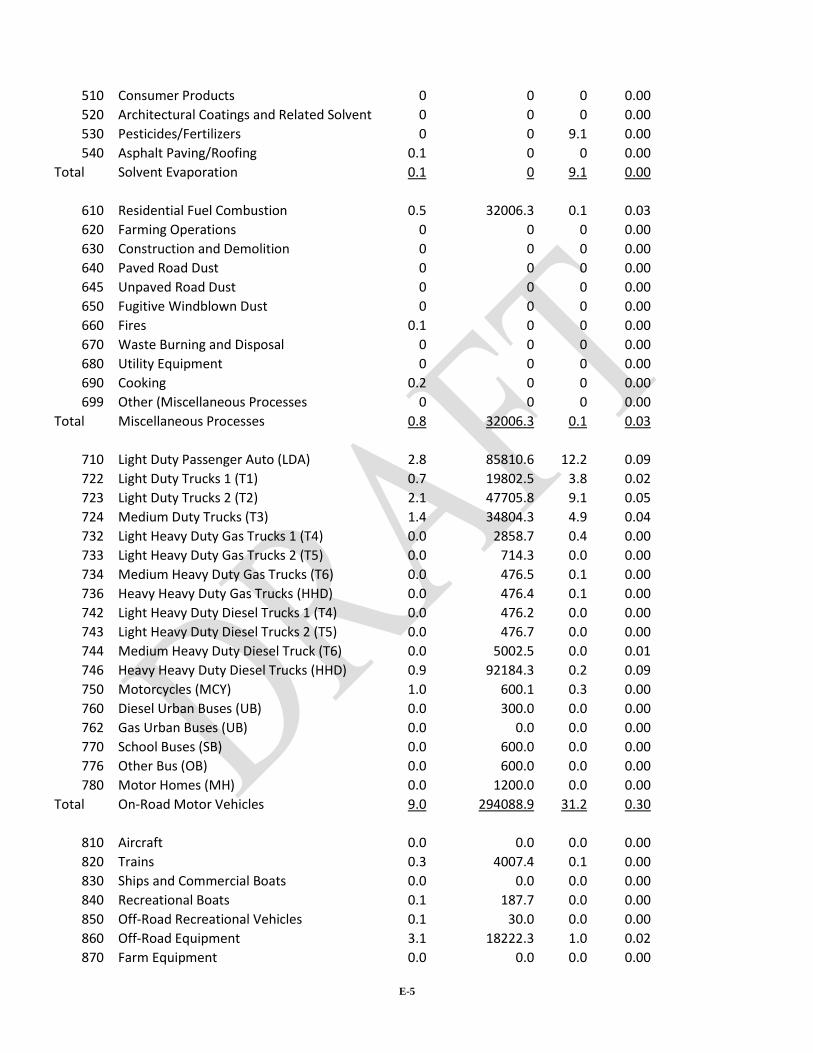
E-5
510 Consumer Products 0 0 0 0.00
520 Architectural Coatings and Related Solvent 0 0 0 0.00
530 Pesticides/Fertilizers 0 0 9.1 0.00
540 Asphalt Paving/Roofing 0.1 0 0 0.00
Total Solvent Evaporation 0.1 0 9.1 0.00
610 Residential Fuel Combustion 0.5 32006.3 0.1 0.03
620 Farming Operations 0 0 0 0.00
630 Construction and Demolition 0 0 0 0.00
640 Paved Road Dust 0 0 0 0.00
645 Unpaved Road Dust 0 0 0 0.00
650 Fugitive Windblown Dust 0 0 0 0.00
660 Fires 0.1 0 0 0.00
670 Waste Burning and Disposal 0 0 0 0.00
680 Utility Equipment 0 0 0 0.00
690 Cooking 0.2 0 0 0.00
699 Other (Miscellaneous Processes 0 0 0 0.00
Total Miscellaneous Processes 0.8 32006.3 0.1 0.03
710 Light Duty Passenger Auto (LDA) 2.8 85810.6 12.2 0.09
722 Light Duty Trucks 1 (T1) 0.7 19802.5 3.8 0.02
723 Light Duty Trucks 2 (T2) 2.1 47705.8 9.1 0.05
724 Medium Duty Trucks (T3) 1.4 34804.3 4.9 0.04
732 Light Heavy Duty Gas Trucks 1 (T4) 0.0 2858.7 0.4 0.00
733 Light Heavy Duty Gas Trucks 2 (T5) 0.0 714.3 0.0 0.00
734 Medium Heavy Duty Gas Trucks (T6) 0.0 476.5 0.1 0.00
736 Heavy Heavy Duty Gas Trucks (HHD) 0.0 476.4 0.1 0.00
742 Light Heavy Duty Diesel Trucks 1 (T4) 0.0 476.2 0.0 0.00
743 Light Heavy Duty Diesel Trucks 2 (T5) 0.0 476.7 0.0 0.00
744 Medium Heavy Duty Diesel Truck (T6) 0.0 5002.5 0.0 0.01
746 Heavy Heavy Duty Diesel Trucks (HHD) 0.9 92184.3 0.2 0.09
750 Motorcycles (MCY) 1.0 600.1 0.3 0.00
760 Diesel Urban Buses (UB) 0.0 300.0 0.0 0.00
762 Gas Urban Buses (UB) 0.0 0.0 0.0 0.00
770 School Buses (SB) 0.0 600.0 0.0 0.00
776 Other Bus (OB) 0.0 600.0 0.0 0.00
780 Motor Homes (MH) 0.0 1200.0 0.0 0.00
Total On-Road Motor Vehicles 9.0 294088.9 31.2 0.30
810 Aircraft 0.0 0.0 0.0 0.00
820 Trains 0.3 4007.4 0.1 0.00
830 Ships and Commercial Boats 0.0 0.0 0.0 0.00
840 Recreational Boats 0.1 187.7 0.0 0.00
850 Off-Road Recreational Vehicles 0.1 30.0 0.0 0.00
860 Off-Road Equipment 3.1 18222.3 1.0 0.02
870 Farm Equipment 0.0 0.0 0.0 0.00
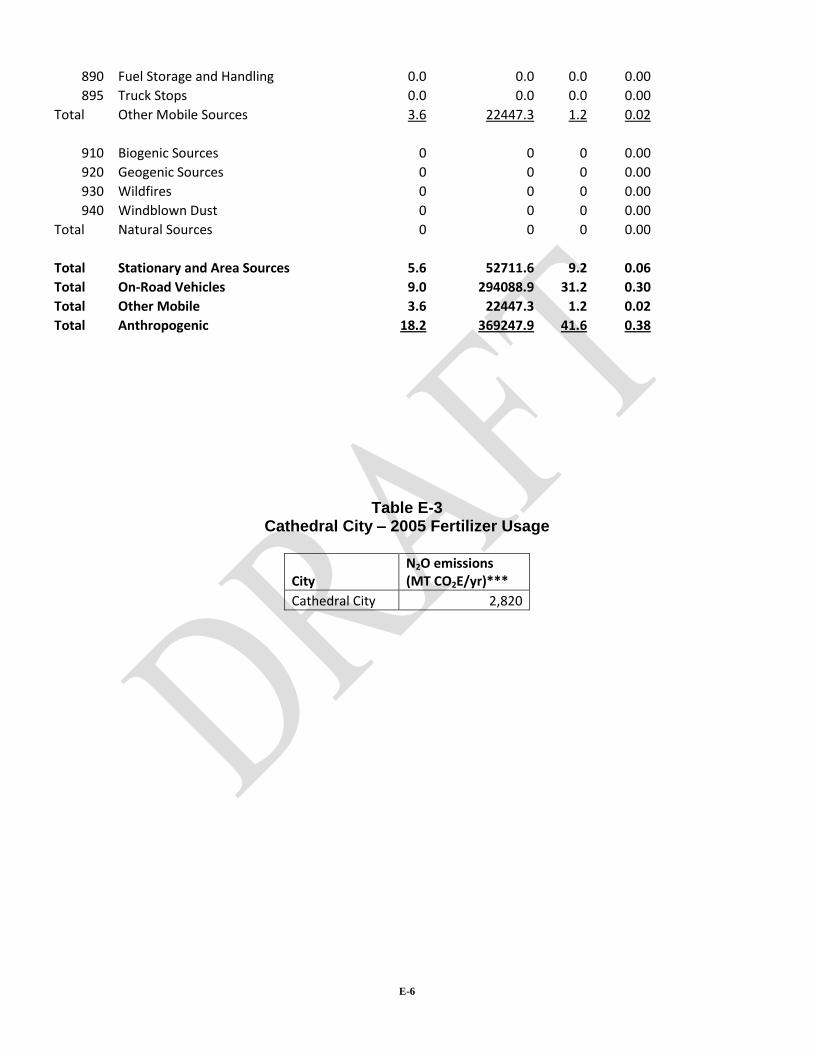
E-6
890 Fuel Storage and Handling 0.0 0.0 0.0 0.00
895 Truck Stops 0.0 0.0 0.0 0.00
Total Other Mobile Sources 3.6 22447.3 1.2 0.02
910 Biogenic Sources 0 0 0 0.00
920 Geogenic Sources 0 0 0 0.00
930 Wildfires 0 0 0 0.00
940 Windblown Dust 0 0 0 0.00
Total Natural Sources 0 0 0 0.00
Total Stationary and Area Sources 5.6 52711.6 9.2 0.06
Total On-Road Vehicles 9.0 294088.9 31.2 0.30
Total Other Mobile 3.6 22447.3 1.2 0.02
Total Anthropogenic 18.2 369247.9 41.6 0.38
Table E-3 Cathedral City – 2005 Fertilizer Usage
City N2O emissions (MT CO2E/yr)***
Cathedral City 2,820
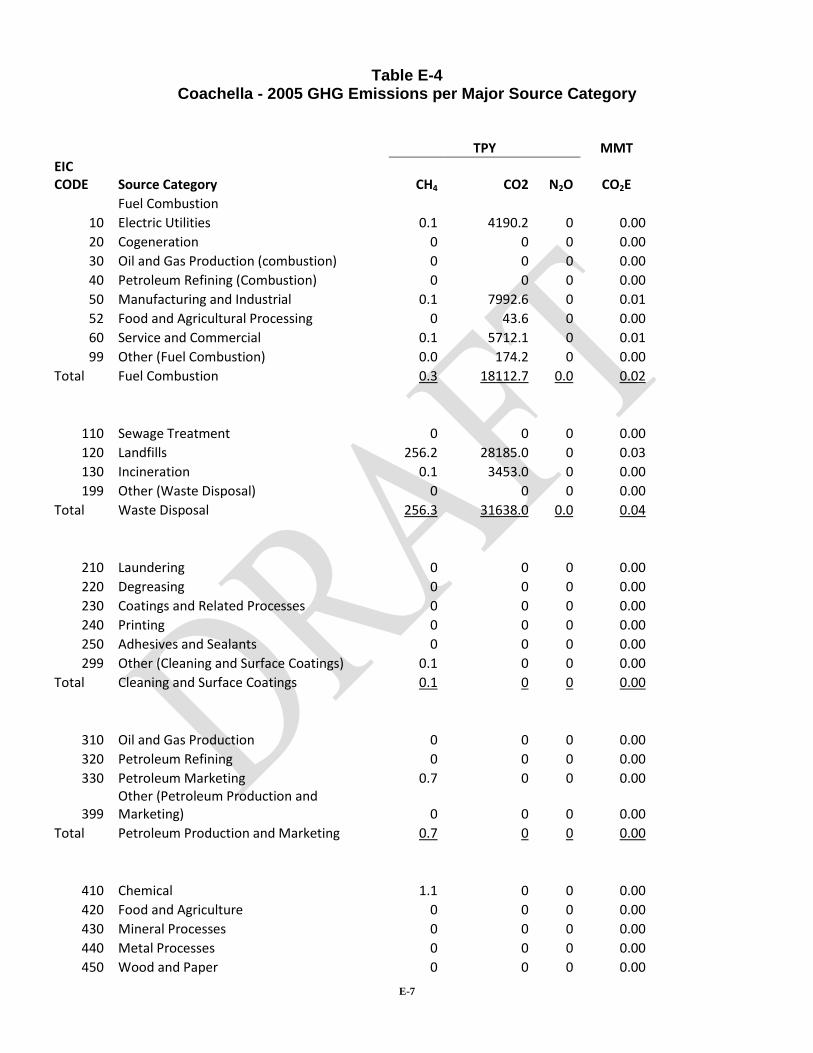
E-7
Table E-4 Coachella - 2005 GHG Emissions per Major Source Category
TPY
MMT
EIC CODE Source Category CH4 CO2 N2O CO2E
Fuel Combustion
10 Electric Utilities 0.1 4190.2 0 0.00
20 Cogeneration 0 0 0 0.00
30 Oil and Gas Production (combustion) 0 0 0 0.00
40 Petroleum Refining (Combustion) 0 0 0 0.00
50 Manufacturing and Industrial 0.1 7992.6 0 0.01
52 Food and Agricultural Processing 0 43.6 0 0.00
60 Service and Commercial 0.1 5712.1 0 0.01
99 Other (Fuel Combustion) 0.0 174.2 0 0.00
Total Fuel Combustion 0.3 18112.7 0.0 0.02
110 Sewage Treatment 0 0 0 0.00
120 Landfills 256.2 28185.0 0 0.03
130 Incineration 0.1 3453.0 0 0.00
199 Other (Waste Disposal) 0 0 0 0.00
Total Waste Disposal 256.3 31638.0 0.0 0.04
210 Laundering 0 0 0 0.00
220 Degreasing 0 0 0 0.00
230 Coatings and Related Processes 0 0 0 0.00
240 Printing 0 0 0 0.00
250 Adhesives and Sealants 0 0 0 0.00
299 Other (Cleaning and Surface Coatings) 0.1 0 0 0.00
Total Cleaning and Surface Coatings 0.1 0 0 0.00
310 Oil and Gas Production 0 0 0 0.00
320 Petroleum Refining 0 0 0 0.00
330 Petroleum Marketing 0.7 0 0 0.00
399 Other (Petroleum Production and Marketing) 0 0 0 0.00
Total Petroleum Production and Marketing 0.7 0 0 0.00
410 Chemical 1.1 0 0 0.00
420 Food and Agriculture 0 0 0 0.00
430 Mineral Processes 0 0 0 0.00
440 Metal Processes 0 0 0 0.00
450 Wood and Paper 0 0 0 0.00
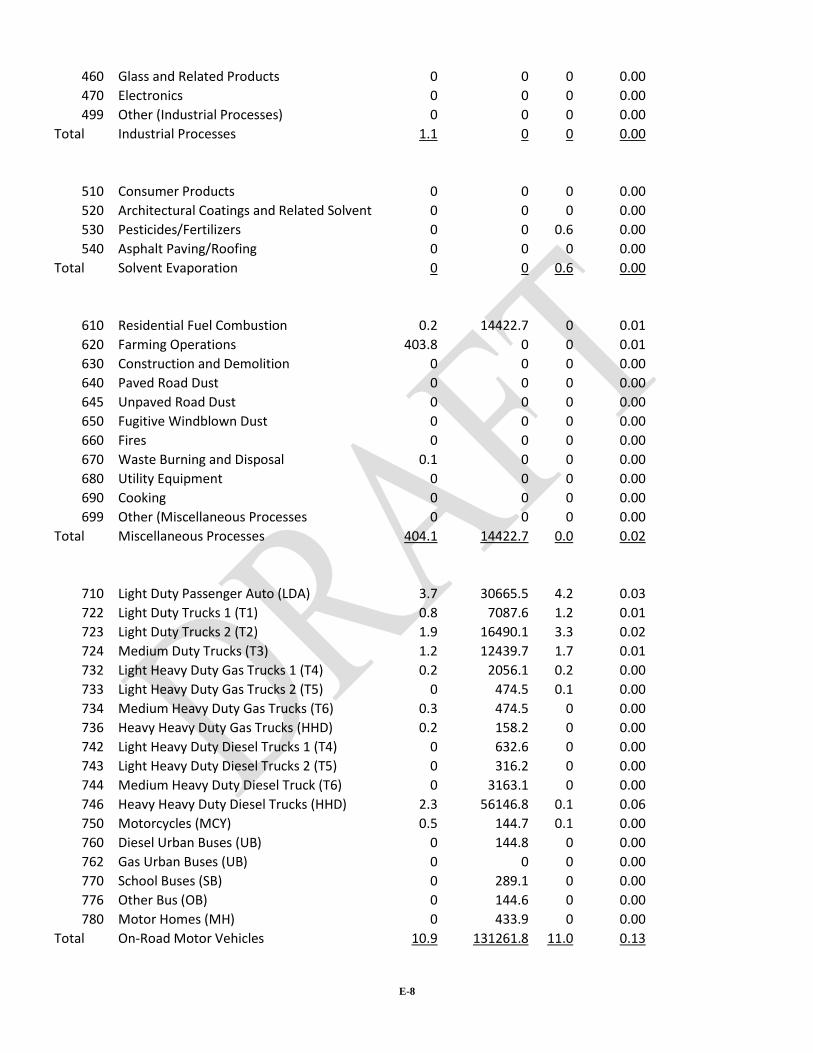
E-8
460 Glass and Related Products 0 0 0 0.00
470 Electronics 0 0 0 0.00
499 Other (Industrial Processes) 0 0 0 0.00
Total Industrial Processes 1.1 0 0 0.00
510 Consumer Products 0 0 0 0.00
520 Architectural Coatings and Related Solvent 0 0 0 0.00
530 Pesticides/Fertilizers 0 0 0.6 0.00
540 Asphalt Paving/Roofing 0 0 0 0.00
Total Solvent Evaporation 0 0 0.6 0.00
610 Residential Fuel Combustion 0.2 14422.7 0 0.01
620 Farming Operations 403.8 0 0 0.01
630 Construction and Demolition 0 0 0 0.00
640 Paved Road Dust 0 0 0 0.00
645 Unpaved Road Dust 0 0 0 0.00
650 Fugitive Windblown Dust 0 0 0 0.00
660 Fires 0 0 0 0.00
670 Waste Burning and Disposal 0.1 0 0 0.00
680 Utility Equipment 0 0 0 0.00
690 Cooking 0 0 0 0.00
699 Other (Miscellaneous Processes 0 0 0 0.00
Total Miscellaneous Processes 404.1 14422.7 0.0 0.02
710 Light Duty Passenger Auto (LDA) 3.7 30665.5 4.2 0.03
722 Light Duty Trucks 1 (T1) 0.8 7087.6 1.2 0.01
723 Light Duty Trucks 2 (T2) 1.9 16490.1 3.3 0.02
724 Medium Duty Trucks (T3) 1.2 12439.7 1.7 0.01
732 Light Heavy Duty Gas Trucks 1 (T4) 0.2 2056.1 0.2 0.00
733 Light Heavy Duty Gas Trucks 2 (T5) 0 474.5 0.1 0.00
734 Medium Heavy Duty Gas Trucks (T6) 0.3 474.5 0 0.00
736 Heavy Heavy Duty Gas Trucks (HHD) 0.2 158.2 0 0.00
742 Light Heavy Duty Diesel Trucks 1 (T4) 0 632.6 0 0.00
743 Light Heavy Duty Diesel Trucks 2 (T5) 0 316.2 0 0.00
744 Medium Heavy Duty Diesel Truck (T6) 0 3163.1 0 0.00
746 Heavy Heavy Duty Diesel Trucks (HHD) 2.3 56146.8 0.1 0.06
750 Motorcycles (MCY) 0.5 144.7 0.1 0.00
760 Diesel Urban Buses (UB) 0 144.8 0 0.00
762 Gas Urban Buses (UB) 0 0 0 0.00
770 School Buses (SB) 0 289.1 0 0.00
776 Other Bus (OB) 0 144.6 0 0.00
780 Motor Homes (MH) 0 433.9 0 0.00
Total On-Road Motor Vehicles 10.9 131261.8 11.0 0.13

E-9
810 Aircraft 0 0 0 0.00
820 Trains 0.3 3668.5 0.1 0.00
830 Ships and Commercial Boats 0 0 0 0.00
840 Recreational Boats 0 0 0 0.00
850 Off-Road Recreational Vehicles 0.1 16.4 0 0.00
860 Off-Road Equipment 3.2 8089.0 0.5 0.01
870 Farm Equipment 0.4 1936.5 0 0.00
890 Fuel Storage and Handling 0 0 0 0.00
895 Truck Stops 0 0 0 0.00
Total Other Mobile Sources 3.9 13710.4 0.7 0.01
910 Biogenic Sources 0 0 0 0.00
920 Geogenic Sources 0 0 0 0.00
930 Wildfires 0 0 0 0.00
940 Windblown Dust 0 0 0 0.00
Total Natural Sources 0 0 0 0.00
Total Stationary and Area Sources 662.6 64173.5 0.7 0.08
Total On-Road Vehicles 10.9 131261.8 11.0 0.13
Total Other Mobile 3.9 13710.4 0.7 0.01
Total Anthropogenic 677.5 209145.7 12.4 0.23

E-10
Table E-5
Coachella - 2020 GHG Emissions per Major Source Category
TPY MMT
EIC CODE Source Category CH4 CO2 N2O CO2E
Fuel Combustion
10 Electric Utilities 0.1 4718.1 0 0.00
20 Cogeneration 0 0 0 0.00
30 Oil and Gas Production (combustion) 0 0 0 0.00
40 Petroleum Refining (Combustion) 0 0 0 0.00
50 Manufacturing and Industrial 0.2 12728.0 0 0.01
52 Food and Agricultural Processing 0 37.6 0 0.00
60 Service and Commercial 0.1 7033.2 0 0.01
99 Other (Fuel Combustion) 0 164.0 0 0.00
Total Fuel Combustion 0.4 24680.9 0.0 0.02
110 Sewage Treatment 0 0 0 0.00
120 Landfills 348.2 38297.1 0 0.05
130 Incineration 0.10 6150.11 0.01 0.01
199 Other (Waste Disposal) 0 0 0 0.00
Total Waste Disposal 348.3 44447.2 0.01 0.05
210 Laundering 0 0 0 0.00
220 Degreasing 0 0 0 0.00
230 Coatings and Related Processes 0 0 0 0.00
240 Printing 0 0 0 0.00
250 Adhesives and Sealants 0 0 0 0.00
299 Other (Cleaning and Surface Coatings) 0.1 0 0 0.00
Total Cleaning and Surface Coatings 0.1 0 0 0.00
310 Oil and Gas Production 0 0 0 0.00
320 Petroleum Refining 0 0 0 0.00
330 Petroleum Marketing 0.7 0 0 0.00
399 Other (Petroleum Production and Marketing) 0 0 0 0.00
Total Petroleum Production and Marketing 0.7 0 0 0.00
410 Chemical 2.1 0 0 0.00
420 Food and Agriculture 0 0 0 0.00
430 Mineral Processes 0 0 0 0.00
440 Metal Processes 0 0 0 0.00
450 Wood and Paper 0 0 0 0.00
460 Glass and Related Products 0 0 0 0.00
470 Electronics 0 0 0 0.00
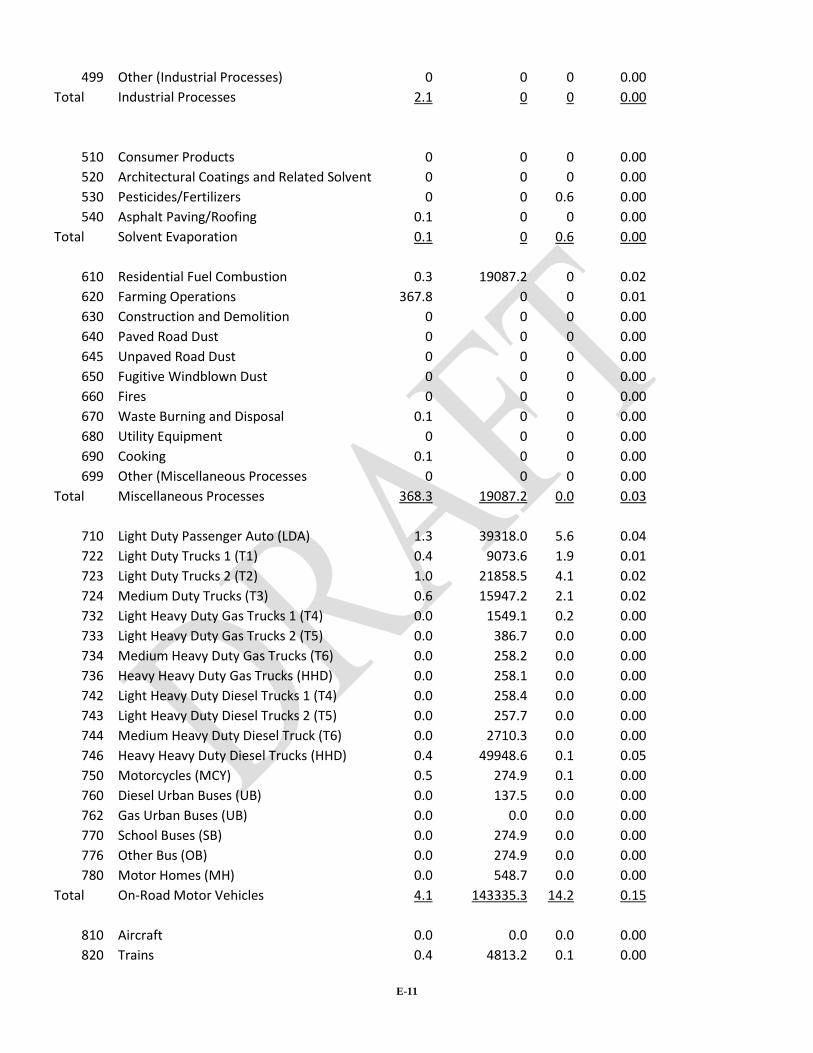
E-11
499 Other (Industrial Processes) 0 0 0 0.00
Total Industrial Processes 2.1 0 0 0.00
510 Consumer Products 0 0 0 0.00
520 Architectural Coatings and Related Solvent 0 0 0 0.00
530 Pesticides/Fertilizers 0 0 0.6 0.00
540 Asphalt Paving/Roofing 0.1 0 0 0.00
Total Solvent Evaporation 0.1 0 0.6 0.00
610 Residential Fuel Combustion 0.3 19087.2 0 0.02
620 Farming Operations 367.8 0 0 0.01
630 Construction and Demolition 0 0 0 0.00
640 Paved Road Dust 0 0 0 0.00
645 Unpaved Road Dust 0 0 0 0.00
650 Fugitive Windblown Dust 0 0 0 0.00
660 Fires 0 0 0 0.00
670 Waste Burning and Disposal 0.1 0 0 0.00
680 Utility Equipment 0 0 0 0.00
690 Cooking 0.1 0 0 0.00
699 Other (Miscellaneous Processes 0 0 0 0.00
Total Miscellaneous Processes 368.3 19087.2 0.0 0.03
710 Light Duty Passenger Auto (LDA) 1.3 39318.0 5.6 0.04
722 Light Duty Trucks 1 (T1) 0.4 9073.6 1.9 0.01
723 Light Duty Trucks 2 (T2) 1.0 21858.5 4.1 0.02
724 Medium Duty Trucks (T3) 0.6 15947.2 2.1 0.02
732 Light Heavy Duty Gas Trucks 1 (T4) 0.0 1549.1 0.2 0.00
733 Light Heavy Duty Gas Trucks 2 (T5) 0.0 386.7 0.0 0.00
734 Medium Heavy Duty Gas Trucks (T6) 0.0 258.2 0.0 0.00
736 Heavy Heavy Duty Gas Trucks (HHD) 0.0 258.1 0.0 0.00
742 Light Heavy Duty Diesel Trucks 1 (T4) 0.0 258.4 0.0 0.00
743 Light Heavy Duty Diesel Trucks 2 (T5) 0.0 257.7 0.0 0.00
744 Medium Heavy Duty Diesel Truck (T6) 0.0 2710.3 0.0 0.00
746 Heavy Heavy Duty Diesel Trucks (HHD) 0.4 49948.6 0.1 0.05
750 Motorcycles (MCY) 0.5 274.9 0.1 0.00
760 Diesel Urban Buses (UB) 0.0 137.5 0.0 0.00
762 Gas Urban Buses (UB) 0.0 0.0 0.0 0.00
770 School Buses (SB) 0.0 274.9 0.0 0.00
776 Other Bus (OB) 0.0 274.9 0.0 0.00
780 Motor Homes (MH) 0.0 548.7 0.0 0.00
Total On-Road Motor Vehicles 4.1 143335.3 14.2 0.15
810 Aircraft 0.0 0.0 0.0 0.00
820 Trains 0.4 4813.2 0.1 0.00
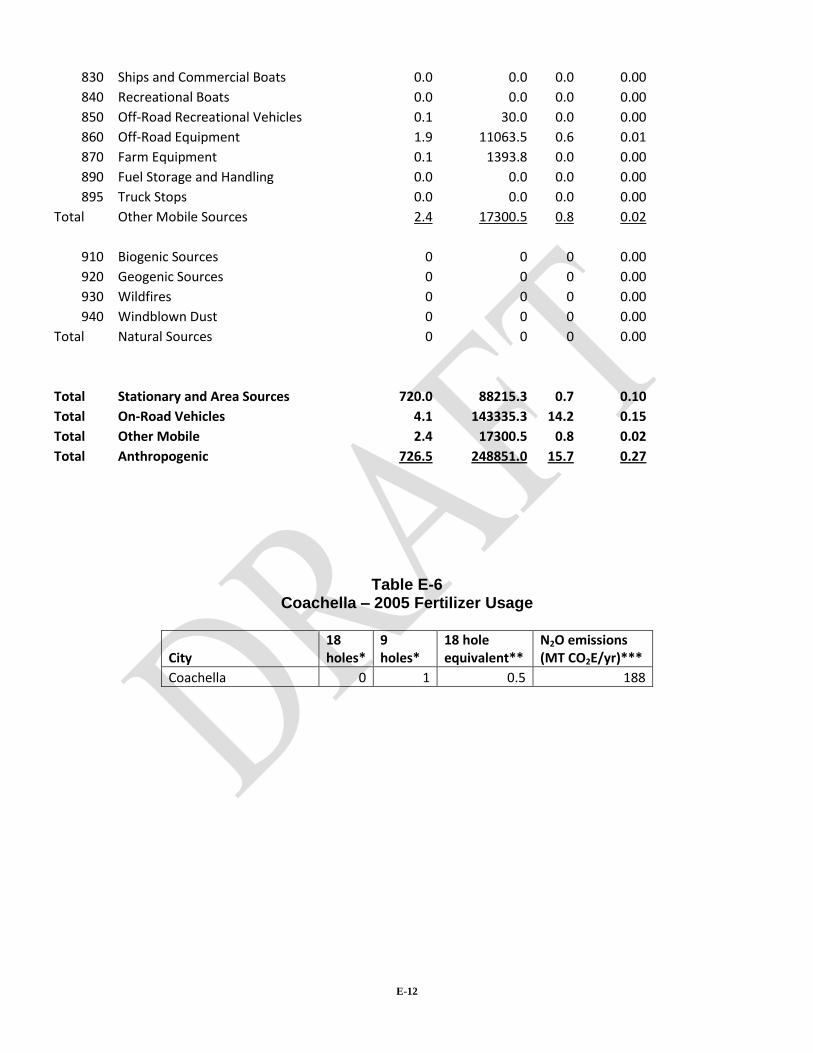
E-12
830 Ships and Commercial Boats 0.0 0.0 0.0 0.00
840 Recreational Boats 0.0 0.0 0.0 0.00
850 Off-Road Recreational Vehicles 0.1 30.0 0.0 0.00
860 Off-Road Equipment 1.9 11063.5 0.6 0.01
870 Farm Equipment 0.1 1393.8 0.0 0.00
890 Fuel Storage and Handling 0.0 0.0 0.0 0.00
895 Truck Stops 0.0 0.0 0.0 0.00
Total Other Mobile Sources 2.4 17300.5 0.8 0.02
910 Biogenic Sources 0 0 0 0.00
920 Geogenic Sources 0 0 0 0.00
930 Wildfires 0 0 0 0.00
940 Windblown Dust 0 0 0 0.00
Total Natural Sources 0 0 0 0.00
Total Stationary and Area Sources 720.0 88215.3 0.7 0.10
Total On-Road Vehicles 4.1 143335.3 14.2 0.15
Total Other Mobile 2.4 17300.5 0.8 0.02
Total Anthropogenic 726.5 248851.0 15.7 0.27
Table E-6 Coachella – 2005 Fertilizer Usage
City 18 holes*
9 holes*
18 hole equivalent**
N2O emissions (MT CO2E/yr)***
Coachella 0 1 0.5 188
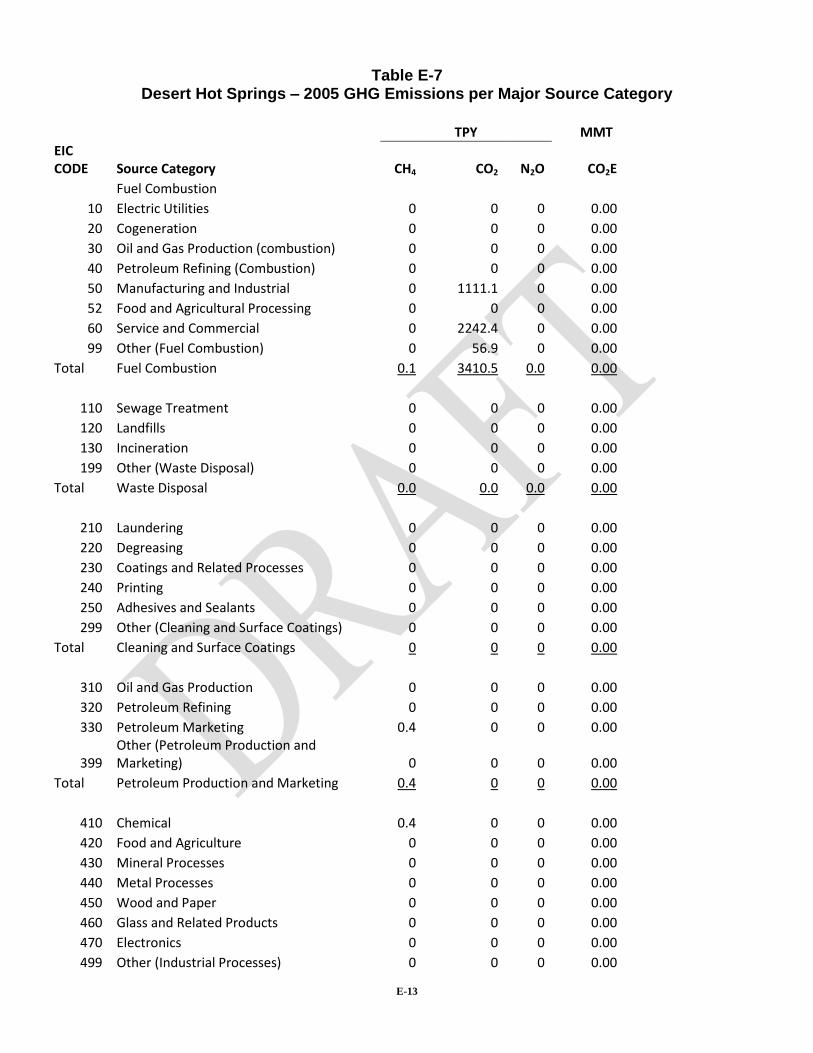
E-13
Table E-7 Desert Hot Springs – 2005 GHG Emissions per Major Source Category
TPY MMT
EIC CODE Source Category CH4 CO2 N2O CO2E
Fuel Combustion
10 Electric Utilities 0 0 0 0.00
20 Cogeneration 0 0 0 0.00
30 Oil and Gas Production (combustion) 0 0 0 0.00
40 Petroleum Refining (Combustion) 0 0 0 0.00
50 Manufacturing and Industrial 0 1111.1 0 0.00
52 Food and Agricultural Processing 0 0 0 0.00
60 Service and Commercial 0 2242.4 0 0.00
99 Other (Fuel Combustion) 0 56.9 0 0.00
Total Fuel Combustion 0.1 3410.5 0.0 0.00
110 Sewage Treatment 0 0 0 0.00
120 Landfills 0 0 0 0.00
130 Incineration 0 0 0 0.00
199 Other (Waste Disposal) 0 0 0 0.00
Total Waste Disposal 0.0 0.0 0.0 0.00
210 Laundering 0 0 0 0.00
220 Degreasing 0 0 0 0.00
230 Coatings and Related Processes 0 0 0 0.00
240 Printing 0 0 0 0.00
250 Adhesives and Sealants 0 0 0 0.00
299 Other (Cleaning and Surface Coatings) 0 0 0 0.00
Total Cleaning and Surface Coatings 0 0 0 0.00
310 Oil and Gas Production 0 0 0 0.00
320 Petroleum Refining 0 0 0 0.00
330 Petroleum Marketing 0.4 0 0 0.00
399 Other (Petroleum Production and Marketing) 0 0 0 0.00
Total Petroleum Production and Marketing 0.4 0 0 0.00
410 Chemical 0.4 0 0 0.00
420 Food and Agriculture 0 0 0 0.00
430 Mineral Processes 0 0 0 0.00
440 Metal Processes 0 0 0 0.00
450 Wood and Paper 0 0 0 0.00
460 Glass and Related Products 0 0 0 0.00
470 Electronics 0 0 0 0.00
499 Other (Industrial Processes) 0 0 0 0.00
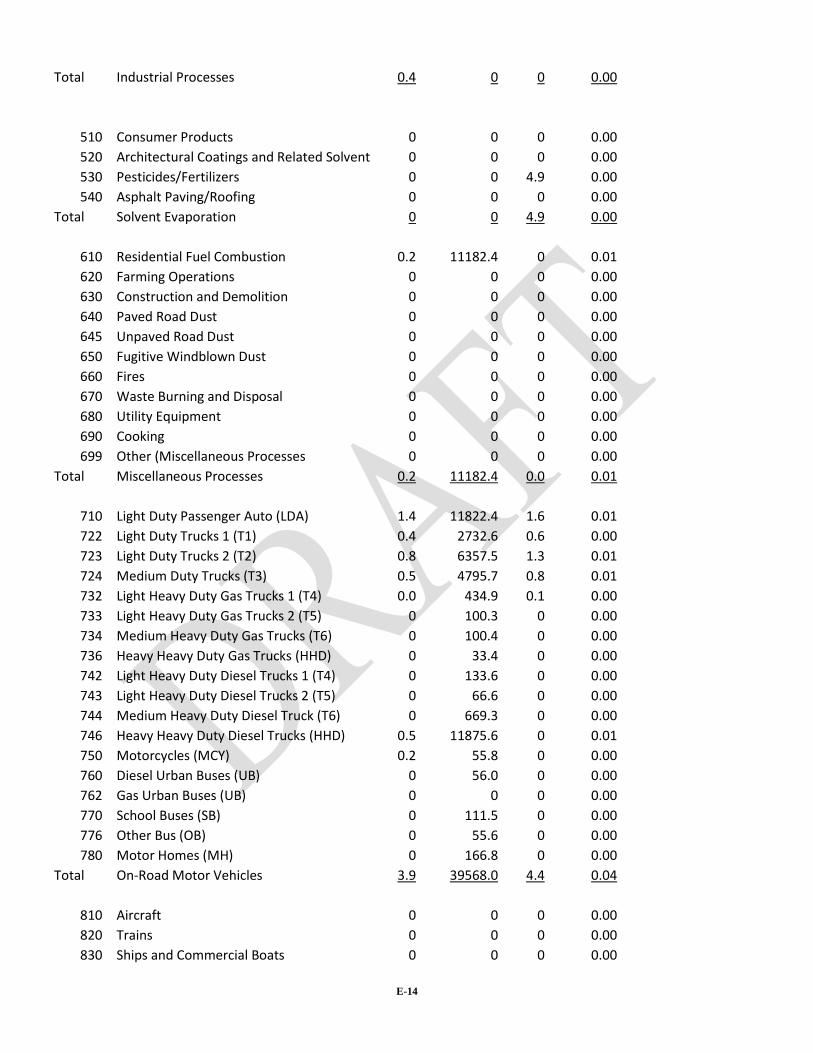
E-14
Total Industrial Processes 0.4 0 0 0.00
510 Consumer Products 0 0 0 0.00
520 Architectural Coatings and Related Solvent 0 0 0 0.00
530 Pesticides/Fertilizers 0 0 4.9 0.00
540 Asphalt Paving/Roofing 0 0 0 0.00
Total Solvent Evaporation 0 0 4.9 0.00
610 Residential Fuel Combustion 0.2 11182.4 0 0.01
620 Farming Operations 0 0 0 0.00
630 Construction and Demolition 0 0 0 0.00
640 Paved Road Dust 0 0 0 0.00
645 Unpaved Road Dust 0 0 0 0.00
650 Fugitive Windblown Dust 0 0 0 0.00
660 Fires 0 0 0 0.00
670 Waste Burning and Disposal 0 0 0 0.00
680 Utility Equipment 0 0 0 0.00
690 Cooking 0 0 0 0.00
699 Other (Miscellaneous Processes 0 0 0 0.00
Total Miscellaneous Processes 0.2 11182.4 0.0 0.01
710 Light Duty Passenger Auto (LDA) 1.4 11822.4 1.6 0.01
722 Light Duty Trucks 1 (T1) 0.4 2732.6 0.6 0.00
723 Light Duty Trucks 2 (T2) 0.8 6357.5 1.3 0.01
724 Medium Duty Trucks (T3) 0.5 4795.7 0.8 0.01
732 Light Heavy Duty Gas Trucks 1 (T4) 0.0 434.9 0.1 0.00
733 Light Heavy Duty Gas Trucks 2 (T5) 0 100.3 0 0.00
734 Medium Heavy Duty Gas Trucks (T6) 0 100.4 0 0.00
736 Heavy Heavy Duty Gas Trucks (HHD) 0 33.4 0 0.00
742 Light Heavy Duty Diesel Trucks 1 (T4) 0 133.6 0 0.00
743 Light Heavy Duty Diesel Trucks 2 (T5) 0 66.6 0 0.00
744 Medium Heavy Duty Diesel Truck (T6) 0 669.3 0 0.00
746 Heavy Heavy Duty Diesel Trucks (HHD) 0.5 11875.6 0 0.01
750 Motorcycles (MCY) 0.2 55.8 0 0.00
760 Diesel Urban Buses (UB) 0 56.0 0 0.00
762 Gas Urban Buses (UB) 0 0 0 0.00
770 School Buses (SB) 0 111.5 0 0.00
776 Other Bus (OB) 0 55.6 0 0.00
780 Motor Homes (MH) 0 166.8 0 0.00
Total On-Road Motor Vehicles 3.9 39568.0 4.4 0.04
810 Aircraft 0 0 0 0.00
820 Trains 0 0 0 0.00
830 Ships and Commercial Boats 0 0 0 0.00

E-15
840 Recreational Boats 0 0 0 0.00
850 Off-Road Recreational Vehicles 0.1 16.4 0 0.00
860 Off-Road Equipment 1.8 4666.8 0.3 0.00
870 Farm Equipment 0 0 0 0.00
890 Fuel Storage and Handling 0 0 0 0.00
895 Truck Stops 0 0 0 0.00
Total Other Mobile Sources 1.9 4683.1 0.3 0.00
910 Biogenic Sources 0 0 0 0.00
920 Geogenic Sources 0 0 0 0.00
930 Wildfires 0 0 0 0.00
940 Windblown Dust 0 0 0 0.00
Total Natural Sources 0 0 0 0.00
Total Stationary and Area Sources 1.0 14592.9 4.9 0.02
Total On-Road Vehicles 3.9 39568.0 4.4 0.04
Total Other Mobile 1.9 4683.1 0.3 0.00
Total Anthropogenic 6.8 58844.0 9.7 0.06
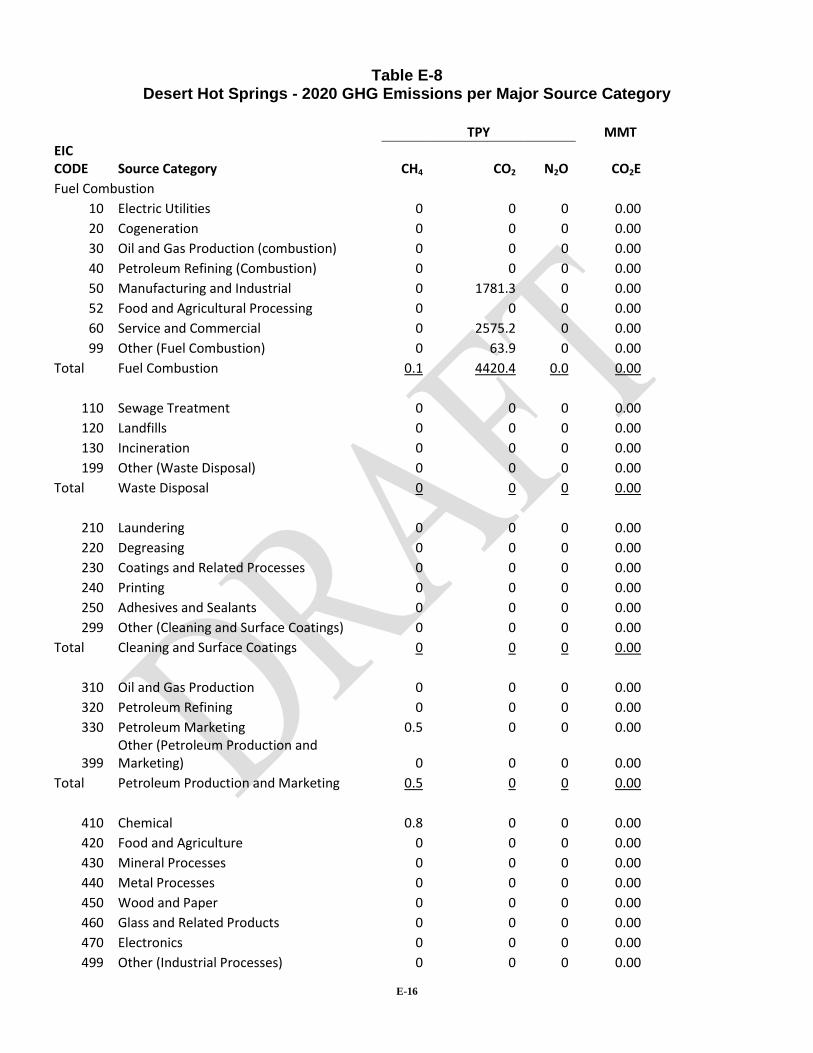
E-16
Table E-8 Desert Hot Springs - 2020 GHG Emissions per Major Source Category
TPY MMT
EIC CODE Source Category CH4 CO2 N2O CO2E
Fuel Combustion
10 Electric Utilities 0 0 0 0.00
20 Cogeneration 0 0 0 0.00
30 Oil and Gas Production (combustion) 0 0 0 0.00
40 Petroleum Refining (Combustion) 0 0 0 0.00
50 Manufacturing and Industrial 0 1781.3 0 0.00
52 Food and Agricultural Processing 0 0 0 0.00
60 Service and Commercial 0 2575.2 0 0.00
99 Other (Fuel Combustion) 0 63.9 0 0.00
Total Fuel Combustion 0.1 4420.4 0.0 0.00
110 Sewage Treatment 0 0 0 0.00
120 Landfills 0 0 0 0.00
130 Incineration 0 0 0 0.00
199 Other (Waste Disposal) 0 0 0 0.00
Total Waste Disposal 0 0 0 0.00
210 Laundering 0 0 0 0.00
220 Degreasing 0 0 0 0.00
230 Coatings and Related Processes 0 0 0 0.00
240 Printing 0 0 0 0.00
250 Adhesives and Sealants 0 0 0 0.00
299 Other (Cleaning and Surface Coatings) 0 0 0 0.00
Total Cleaning and Surface Coatings 0 0 0 0.00
310 Oil and Gas Production 0 0 0 0.00
320 Petroleum Refining 0 0 0 0.00
330 Petroleum Marketing 0.5 0 0 0.00
399 Other (Petroleum Production and Marketing) 0 0 0 0.00
Total Petroleum Production and Marketing 0.5 0 0 0.00
410 Chemical 0.8 0 0 0.00
420 Food and Agriculture 0 0 0 0.00
430 Mineral Processes 0 0 0 0.00
440 Metal Processes 0 0 0 0.00
450 Wood and Paper 0 0 0 0.00
460 Glass and Related Products 0 0 0 0.00
470 Electronics 0 0 0 0.00
499 Other (Industrial Processes) 0 0 0 0.00
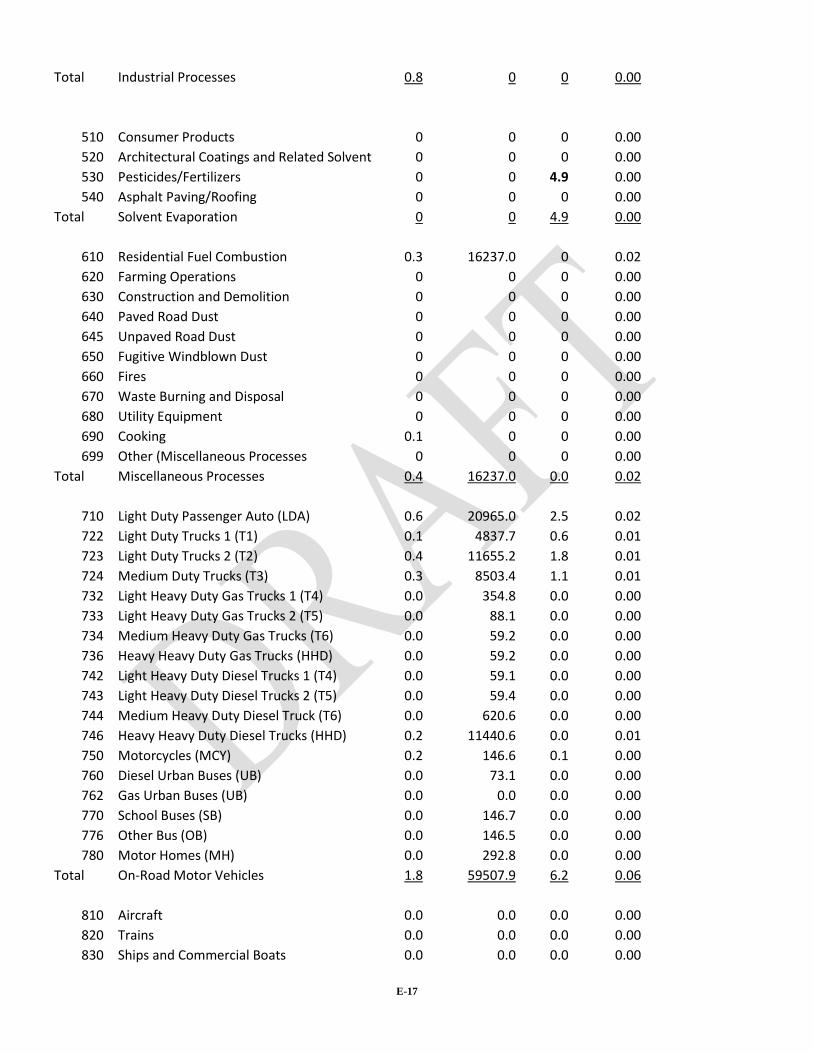
E-17
Total Industrial Processes 0.8 0 0 0.00
510 Consumer Products 0 0 0 0.00
520 Architectural Coatings and Related Solvent 0 0 0 0.00
530 Pesticides/Fertilizers 0 0 4.9 0.00
540 Asphalt Paving/Roofing 0 0 0 0.00
Total Solvent Evaporation 0 0 4.9 0.00
610 Residential Fuel Combustion 0.3 16237.0 0 0.02
620 Farming Operations 0 0 0 0.00
630 Construction and Demolition 0 0 0 0.00
640 Paved Road Dust 0 0 0 0.00
645 Unpaved Road Dust 0 0 0 0.00
650 Fugitive Windblown Dust 0 0 0 0.00
660 Fires 0 0 0 0.00
670 Waste Burning and Disposal 0 0 0 0.00
680 Utility Equipment 0 0 0 0.00
690 Cooking 0.1 0 0 0.00
699 Other (Miscellaneous Processes 0 0 0 0.00
Total Miscellaneous Processes 0.4 16237.0 0.0 0.02
710 Light Duty Passenger Auto (LDA) 0.6 20965.0 2.5 0.02
722 Light Duty Trucks 1 (T1) 0.1 4837.7 0.6 0.01
723 Light Duty Trucks 2 (T2) 0.4 11655.2 1.8 0.01
724 Medium Duty Trucks (T3) 0.3 8503.4 1.1 0.01
732 Light Heavy Duty Gas Trucks 1 (T4) 0.0 354.8 0.0 0.00
733 Light Heavy Duty Gas Trucks 2 (T5) 0.0 88.1 0.0 0.00
734 Medium Heavy Duty Gas Trucks (T6) 0.0 59.2 0.0 0.00
736 Heavy Heavy Duty Gas Trucks (HHD) 0.0 59.2 0.0 0.00
742 Light Heavy Duty Diesel Trucks 1 (T4) 0.0 59.1 0.0 0.00
743 Light Heavy Duty Diesel Trucks 2 (T5) 0.0 59.4 0.0 0.00
744 Medium Heavy Duty Diesel Truck (T6) 0.0 620.6 0.0 0.00
746 Heavy Heavy Duty Diesel Trucks (HHD) 0.2 11440.6 0.0 0.01
750 Motorcycles (MCY) 0.2 146.6 0.1 0.00
760 Diesel Urban Buses (UB) 0.0 73.1 0.0 0.00
762 Gas Urban Buses (UB) 0.0 0.0 0.0 0.00
770 School Buses (SB) 0.0 146.7 0.0 0.00
776 Other Bus (OB) 0.0 146.5 0.0 0.00
780 Motor Homes (MH) 0.0 292.8 0.0 0.00
Total On-Road Motor Vehicles 1.8 59507.9 6.2 0.06
810 Aircraft 0.0 0.0 0.0 0.00
820 Trains 0.0 0.0 0.0 0.00
830 Ships and Commercial Boats 0.0 0.0 0.0 0.00

E-18
840 Recreational Boats 0.0 0.0 0.0 0.00
850 Off-Road Recreational Vehicles 0.1 15.0 0.0 0.00
860 Off-Road Equipment 1.4 8460.3 0.5 0.01
870 Farm Equipment 0.0 0.0 0.0 0.00
890 Fuel Storage and Handling 0.0 0.0 0.0 0.00
895 Truck Stops 0.0 0.0 0.0 0.00
Total Other Mobile Sources 1.5 8475.3 0.5 0.01
910 Biogenic Sources 0 0 0 0.00
920 Geogenic Sources 0 0 0 0.00
930 Wildfires 0 0 0 0.00
940 Windblown Dust 0 0 0 0.00
Total Natural Sources 0 0 0 0.00
Total Stationary and Area Sources 1.8 20657.4 4.9 0.02
Total On-Road Vehicles 1.8 59507.9 6.2 0.06
Total Other Mobile 1.5 8475.3 0.5 0.01
Total Anthropogenic 5.1 88640.6 11.6 0.09
Table E-9 Desert Hot Springs – 2005 Fertilizer Usage
City 18 holes*
9 holes*
18 hole equivalent**
N2O emissions (MT CO2E/yr)***
Desert Hot Springs 2 4 4 1,504

E-19
Table E-10 Indian Wells – 2005 GHG Emissions per Major Source Category
TPY MMT
EIC CODE Source Category CH4 CO2 N2O CO2E
Fuel Combustion
10 Electric Utilities 0 0 0 0.00
20 Cogeneration 0 0 0 0.00
30 Oil and Gas Production (combustion) 0 0 0 0.00
40 Petroleum Refining (Combustion) 0 0 0 0.00
50 Manufacturing and Industrial 0 2878.9 0 0.00
52 Food and Agricultural Processing 0 2.4 0 0.00
60 Service and Commercial 0.1 5930.7 0 0.01
99 Other (Fuel Combustion) 0 147.1 0 0.00
Total Fuel Combustion 0.1 8959.1 0 0.01
110 Sewage Treatment 0 0 0 0.00
120 Landfills 0 0 0 0.00
130 Incineration 0 0 0 0.00
199 Other (Waste Disposal) 0 0 0 0.00
Total Waste Disposal 0.0 0.0 0.0 0.00
210 Laundering 0 0 0 0.00
220 Degreasing 0 0 0 0.00
230 Coatings and Related Processes 0 0 0 0.00
240 Printing 0 0 0 0.00
250 Adhesives and Sealants 0 0 0 0.00
299 Other (Cleaning and Surface Coatings) 0 0 0 0.00
Total Cleaning and Surface Coatings 0 0 0 0.00
310 Oil and Gas Production 0 0 0 0.00
320 Petroleum Refining 0 0 0 0.00
330 Petroleum Marketing 0.5 0 0 0.00
399 Other (Petroleum Production and Marketing) 0 0 0 0.00
Total Petroleum Production and Marketing 0.5 0 0 0.00
410 Chemical 0.9 0 0 0.00
420 Food and Agriculture 0 0 0 0.00
430 Mineral Processes 0 0 0 0.00
440 Metal Processes 0 0 0 0.00
450 Wood and Paper 0 0 0 0.00
460 Glass and Related Products 0 0 0 0.00
470 Electronics 0 0 0 0.00
499 Other (Industrial Processes) 0 0 0 0.00

E-20
Total Industrial Processes 0.9 0 0 0.00
510 Consumer Products 0 0 0 0.00
520 Architectural Coatings and Related Solvent 0 0 0 0.00
530 Pesticides/Fertilizers 0 0 12.7 0.00
540 Asphalt Paving/Roofing 0 0 0 0.00
Total Solvent Evaporation 0 0 12.7 0.00
610 Residential Fuel Combustion 0.2 9106.7 0.0 0.01
620 Farming Operations 0 0 0 0.00
630 Construction and Demolition 0 0 0 0.00
640 Paved Road Dust 0 0 0 0.00
645 Unpaved Road Dust 0 0 0 0.00
650 Fugitive Windblown Dust 0 0 0 0.00
660 Fires 0 0 0 0.00
670 Waste Burning and Disposal 0 0 0 0.00
680 Utility Equipment 0 0 0 0.00
690 Cooking 0 0 0 0.00
699 Other (Miscellaneous Processes 0 0 0 0.00
Total Miscellaneous Processes 0.2 9106.7 0.0 0.01
710 Light Duty Passenger Auto (LDA) 2.2 14382.3 2.5 0.02
722 Light Duty Trucks 1 (T1) 0.5 3324.2 0.8 0.00
723 Light Duty Trucks 2 (T2) 1.2 7734.0 2.0 0.01
724 Medium Duty Trucks (T3) 0.6 5834.1 0.9 0.01
732 Light Heavy Duty Gas Trucks 1 (T4) 0.0 501.5 0.1 0.00
733 Light Heavy Duty Gas Trucks 2 (T5) 0 115.7 0 0.00
734 Medium Heavy Duty Gas Trucks (T6) 0.1 115.7 0 0.00
736 Heavy Heavy Duty Gas Trucks (HHD) 0.1 38.6 0 0.00
742 Light Heavy Duty Diesel Trucks 1 (T4) 0 154.6 0 0.00
743 Light Heavy Duty Diesel Trucks 2 (T5) 0 77.2 0 0.00
744 Medium Heavy Duty Diesel Truck (T6) 0 771.4 0 0.00
746 Heavy Heavy Duty Diesel Trucks (HHD) 0.6 13693.2 0 0.01
750 Motorcycles (MCY) 0.3 67.8 0.1 0.00
760 Diesel Urban Buses (UB) 0 67.9 0 0.00
762 Gas Urban Buses (UB) 0 0 0 0.00
770 School Buses (SB) 0 135.6 0 0.00
776 Other Bus (OB) 0 67.7 0 0.00
780 Motor Homes (MH) 0 203.4 0 0.00
Total On-Road Motor Vehicles 5.7 47285.0 6.5 0.05
810 Aircraft 0 0 0 0.00
820 Trains 0 0 0 0.00
830 Ships and Commercial Boats 0 0 0 0.00
E-21
840 Recreational Boats 0 0 0 0.00
850 Off-Road Recreational Vehicles 0 0 0 0.00
860 Off-Road Equipment 1.9 4977.9 0.3 0.01
870 Farm Equipment 0 0 0 0.00
890 Fuel Storage and Handling 0 0 0 0.00
895 Truck Stops 0 0 0 0.00
Total Other Mobile Sources 1.9 4977.9 0.3 0.01
910 Biogenic Sources 0 0 0 0.00
920 Geogenic Sources 0 0 0 0.00
930 Wildfires 0 0 0 0.00
940 Windblown Dust 0 0 0 0.00
Total Natural Sources 0 0 0 0.00
Total Stationary and Area Sources 1.7 18065.9 12.8 0.02
Total On-Road Vehicles 5.7 47285.0 6.5 0.05
Total Other Mobile 1.9 4977.9 0.3 0.01
Total Anthropogenic 9.4 70328.7 19.5 0.08

E-22
Table E-11 Indian Wells – 2020 GHG Emissions per Major Source Category
Tons/year MMT
EIC CODE Source Category CH4 CO2 N2O CO2E
Fuel Combustion
10 Electric Utilities 0 0 0 0.00
20 Cogeneration 0 0 0 0.00
30 Oil and Gas Production (combustion) 0 0 0 0.00
40 Petroleum Refining (Combustion) 0 0 0 0.00
50 Manufacturing and Industrial 0.1 4068.2 0 0.00
52 Food and Agricultural Processing 0 2.1 0 0.00
60 Service and Commercial 0.1 6997.7 0 0.01
99 Other (Fuel Combustion) 0 146.0 0 0.00
Total Fuel Combustion 0.2 11214.0 0 0.01
110 Sewage Treatment 0 0 0 0.00
120 Landfills 0 0 0 0.00
130 Incineration 0 0 0 0.00
199 Other (Waste Disposal) 0 0 0 0.00
Total Waste Disposal 0 0 0 0.00
210 Laundering 0 0 0 0.00
220 Degreasing 0 0 0 0.00
230 Coatings and Related Processes 0 0 0 0.00
240 Printing 0 0 0 0.00
250 Adhesives and Sealants 0 0 0 0.00
299 Other (Cleaning and Surface Coatings) 0.1 0 0 0.00
Total Cleaning and Surface Coatings 0.1 0 0 0.00
310 Oil and Gas Production 0 0 0 0.00
320 Petroleum Refining 0 0 0 0.00
330 Petroleum Marketing 0.5 0 0 0.00
399 Other (Petroleum Production and Marketing) 0 0 0 0.00
Total Petroleum Production and Marketing 0.5 0 0 0.00
410 Chemical 1.8 0 0 0.00
420 Food and Agriculture 0 0 0 0.00
430 Mineral Processes 0 0 0 0.00
440 Metal Processes 0 0 0 0.00
450 Wood and Paper 0 0 0 0.00
460 Glass and Related Products 0 0 0 0.00
470 Electronics 0 0 0 0.00
499 Other (Industrial Processes) 0 0 0 0.00

E-23
Total Industrial Processes 1.8 0 0 0.00
510 Consumer Products 0 0 0 0.00
520 Architectural Coatings and Related Solvent 0 0 0 0.00
530 Pesticides/Fertilizers 0 0 12.7 0.00
540 Asphalt Paving/Roofing 0 0 0 0.00
Total Solvent Evaporation 0 0 12.7 0.00
610 Residential Fuel Combustion 0.2 11559.5 0 0.01
620 Farming Operations 0 0 0 0.00
630 Construction and Demolition 0 0 0 0.00
640 Paved Road Dust 0 0 0 0.00
645 Unpaved Road Dust 0 0 0 0.00
650 Fugitive Windblown Dust 0 0 0 0.00
660 Fires 0 0 0 0.00
670 Waste Burning and Disposal 0 0 0 0.00
680 Utility Equipment 0 0 0 0.00
690 Cooking 0.1 0 0 0.00
699 Other (Miscellaneous Processes 0 0 0 0.00
Total Miscellaneous Processes 0.3 11559.5 0.0 0.01
710 Light Duty Passenger Auto (LDA) 0.8 20425.0 3.6 0.02
722 Light Duty Trucks 1 (T1) 0.2 4713.7 1.3 0.01
723 Light Duty Trucks 2 (T2) 0.6 11355.3 2.7 0.01
724 Medium Duty Trucks (T3) 0.4 8284.5 1.4 0.01
732 Light Heavy Duty Gas Trucks 1 (T4) 0.0 313.4 0.0 0.00
733 Light Heavy Duty Gas Trucks 2 (T5) 0.0 78.4 0.0 0.00
734 Medium Heavy Duty Gas Trucks (T6) 0.0 52.2 0.0 0.00
736 Heavy Heavy Duty Gas Trucks (HHD) 0.0 52.3 0.0 0.00
742 Light Heavy Duty Diesel Trucks 1 (T4) 0.0 52.1 0.0 0.00
743 Light Heavy Duty Diesel Trucks 2 (T5) 0.0 52.6 0.0 0.00
744 Medium Heavy Duty Diesel Truck (T6) 0.0 548.6 0.0 0.00
746 Heavy Heavy Duty Diesel Trucks (HHD) 0.1 10119.7 0.0 0.01
750 Motorcycles (MCY) 0.3 142.9 0.1 0.00
760 Diesel Urban Buses (UB) 0.0 71.3 0.0 0.00
762 Gas Urban Buses (UB) 0.0 0.0 0.0 0.00
770 School Buses (SB) 0.0 142.7 0.0 0.00
776 Other Bus (OB) 0.0 142.8 0.0 0.00
780 Motor Homes (MH) 0.0 285.7 0.0 0.00
Total On-Road Motor Vehicles 2.5 56833.2 9.1 0.06
810 Aircraft 0.0 0.0 0.0 0.00
820 Trains 0.0 0.0 0.0 0.00
830 Ships and Commercial Boats 0.0 0.0 0.0 0.00

E-24
Table E-12 Indian Wells – 2005 Fertilizer Usage
City 18 holes*
9 holes*
18 hole equivalent**
N2O emissions (MT CO2E/yr)***
Indian Wells 10 1 10.5 3,948
840 Recreational Boats 0.0 0.0 0.0 0.00
850 Off-Road Recreational Vehicles 0.1 15.0 0.0 0.00
860 Off-Road Equipment 1.2 7158.8 0.4 0.01
870 Farm Equipment 0.0 0.0 0.0 0.00
890 Fuel Storage and Handling 0.0 0.0 0.0 0.00
895 Truck Stops 0.0 0.0 0.0 0.00
Total Other Mobile Sources 1.3 7173.7 0.4 0.01
910 Biogenic Sources 0 0 0 0.00
920 Geogenic Sources 0 0 0 0.00
930 Wildfires 0 0 0 0.00
940 Windblown Dust 0 0 0 0.00
Total Natural Sources 0 0 0 0.00
Total Stationary and Area Sources 2.9 22773.5 12.8 0.03
Total On-Road Vehicles 2.5 56833.2 9.1 0.06
Total Other Mobile 1.3 7173.7 0.4 0.01
Total Anthropogenic 6.7 86780.4 22.2 0.09
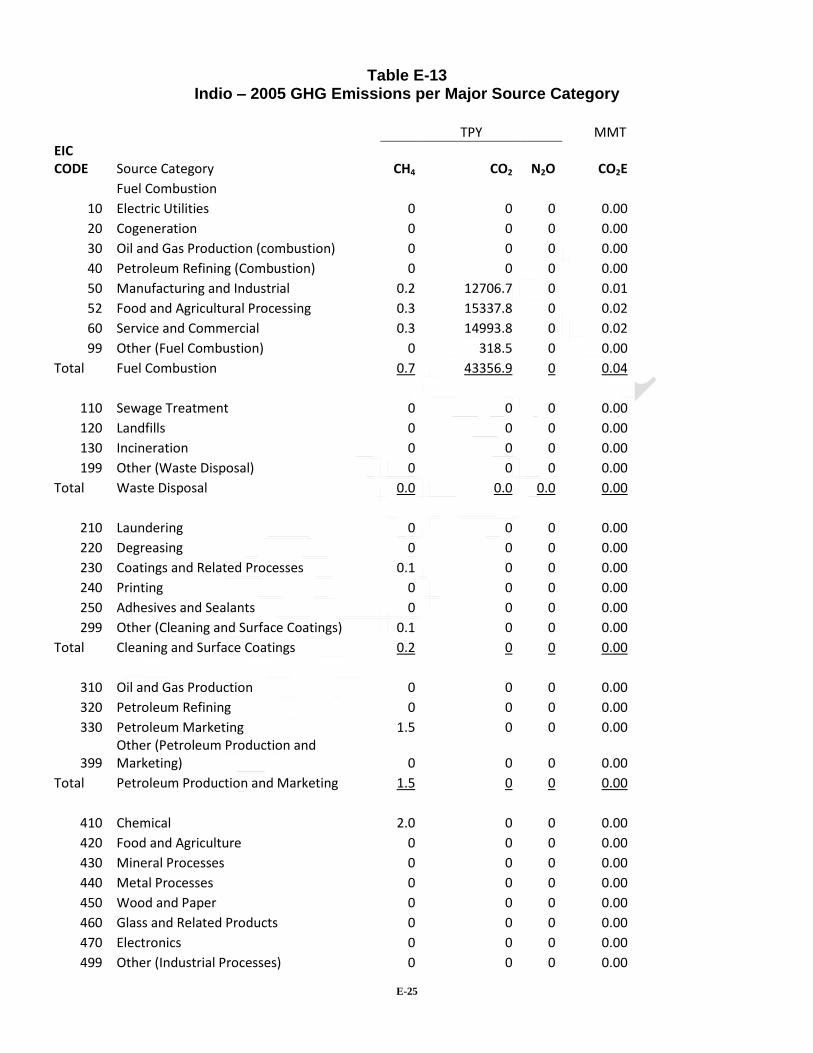
E-25
Table E-13 Indio – 2005 GHG Emissions per Major Source Category
TPY MMT
EIC CODE Source Category CH4 CO2 N2O CO2E
Fuel Combustion
10 Electric Utilities 0 0 0 0.00
20 Cogeneration 0 0 0 0.00
30 Oil and Gas Production (combustion) 0 0 0 0.00
40 Petroleum Refining (Combustion) 0 0 0 0.00
50 Manufacturing and Industrial 0.2 12706.7 0 0.01
52 Food and Agricultural Processing 0.3 15337.8 0 0.02
60 Service and Commercial 0.3 14993.8 0 0.02
99 Other (Fuel Combustion) 0 318.5 0 0.00
Total Fuel Combustion 0.7 43356.9 0 0.04
110 Sewage Treatment 0 0 0 0.00
120 Landfills 0 0 0 0.00
130 Incineration 0 0 0 0.00
199 Other (Waste Disposal) 0 0 0 0.00
Total Waste Disposal 0.0 0.0 0.0 0.00
210 Laundering 0 0 0 0.00
220 Degreasing 0 0 0 0.00
230 Coatings and Related Processes 0.1 0 0 0.00
240 Printing 0 0 0 0.00
250 Adhesives and Sealants 0 0 0 0.00
299 Other (Cleaning and Surface Coatings) 0.1 0 0 0.00
Total Cleaning and Surface Coatings 0.2 0 0 0.00
310 Oil and Gas Production 0 0 0 0.00
320 Petroleum Refining 0 0 0 0.00
330 Petroleum Marketing 1.5 0 0 0.00
399 Other (Petroleum Production and Marketing) 0 0 0 0.00
Total Petroleum Production and Marketing 1.5 0 0 0.00
410 Chemical 2.0 0 0 0.00
420 Food and Agriculture 0 0 0 0.00
430 Mineral Processes 0 0 0 0.00
440 Metal Processes 0 0 0 0.00
450 Wood and Paper 0 0 0 0.00
460 Glass and Related Products 0 0 0 0.00
470 Electronics 0 0 0 0.00
499 Other (Industrial Processes) 0 0 0 0.00
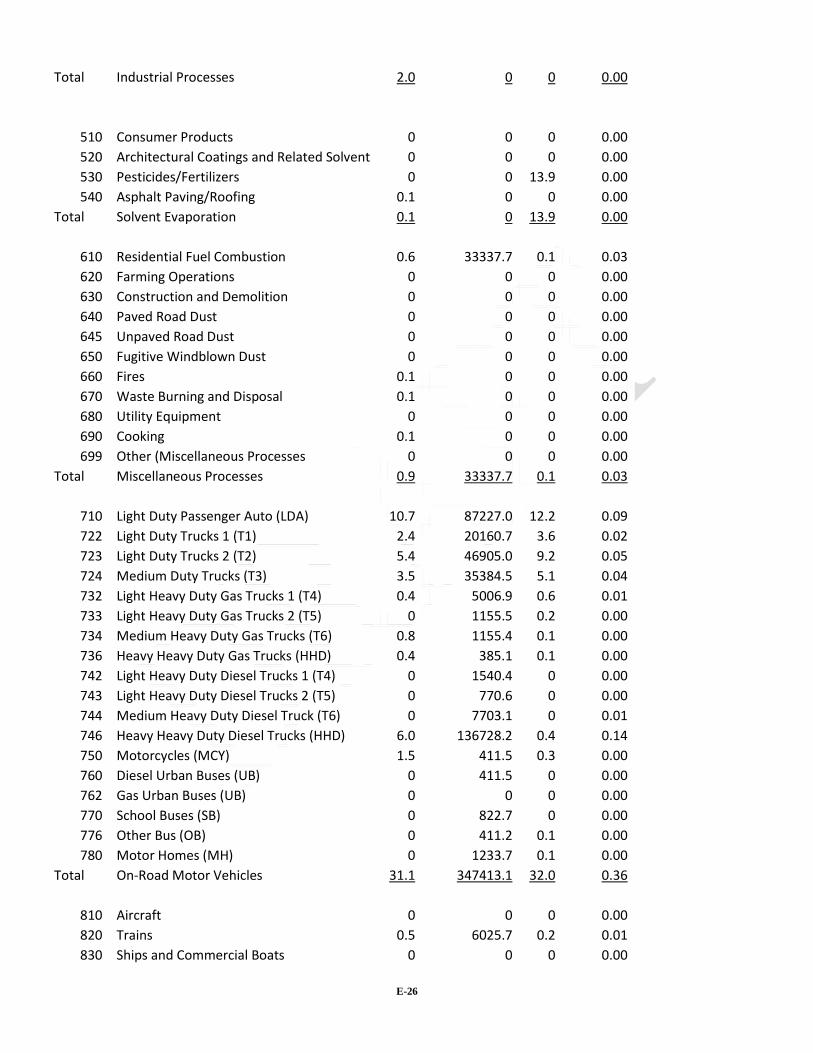
E-26
Total Industrial Processes 2.0 0 0 0.00
510 Consumer Products 0 0 0 0.00
520 Architectural Coatings and Related Solvent 0 0 0 0.00
530 Pesticides/Fertilizers 0 0 13.9 0.00
540 Asphalt Paving/Roofing 0.1 0 0 0.00
Total Solvent Evaporation 0.1 0 13.9 0.00
610 Residential Fuel Combustion 0.6 33337.7 0.1 0.03
620 Farming Operations 0 0 0 0.00
630 Construction and Demolition 0 0 0 0.00
640 Paved Road Dust 0 0 0 0.00
645 Unpaved Road Dust 0 0 0 0.00
650 Fugitive Windblown Dust 0 0 0 0.00
660 Fires 0.1 0 0 0.00
670 Waste Burning and Disposal 0.1 0 0 0.00
680 Utility Equipment 0 0 0 0.00
690 Cooking 0.1 0 0 0.00
699 Other (Miscellaneous Processes 0 0 0 0.00
Total Miscellaneous Processes 0.9 33337.7 0.1 0.03
710 Light Duty Passenger Auto (LDA) 10.7 87227.0 12.2 0.09
722 Light Duty Trucks 1 (T1) 2.4 20160.7 3.6 0.02
723 Light Duty Trucks 2 (T2) 5.4 46905.0 9.2 0.05
724 Medium Duty Trucks (T3) 3.5 35384.5 5.1 0.04
732 Light Heavy Duty Gas Trucks 1 (T4) 0.4 5006.9 0.6 0.01
733 Light Heavy Duty Gas Trucks 2 (T5) 0 1155.5 0.2 0.00
734 Medium Heavy Duty Gas Trucks (T6) 0.8 1155.4 0.1 0.00
736 Heavy Heavy Duty Gas Trucks (HHD) 0.4 385.1 0.1 0.00
742 Light Heavy Duty Diesel Trucks 1 (T4) 0 1540.4 0 0.00
743 Light Heavy Duty Diesel Trucks 2 (T5) 0 770.6 0 0.00
744 Medium Heavy Duty Diesel Truck (T6) 0 7703.1 0 0.01
746 Heavy Heavy Duty Diesel Trucks (HHD) 6.0 136728.2 0.4 0.14
750 Motorcycles (MCY) 1.5 411.5 0.3 0.00
760 Diesel Urban Buses (UB) 0 411.5 0 0.00
762 Gas Urban Buses (UB) 0 0 0 0.00
770 School Buses (SB) 0 822.7 0 0.00
776 Other Bus (OB) 0 411.2 0.1 0.00
780 Motor Homes (MH) 0 1233.7 0.1 0.00
Total On-Road Motor Vehicles 31.1 347413.1 32.0 0.36
810 Aircraft 0 0 0 0.00
820 Trains 0.5 6025.7 0.2 0.01
830 Ships and Commercial Boats 0 0 0 0.00
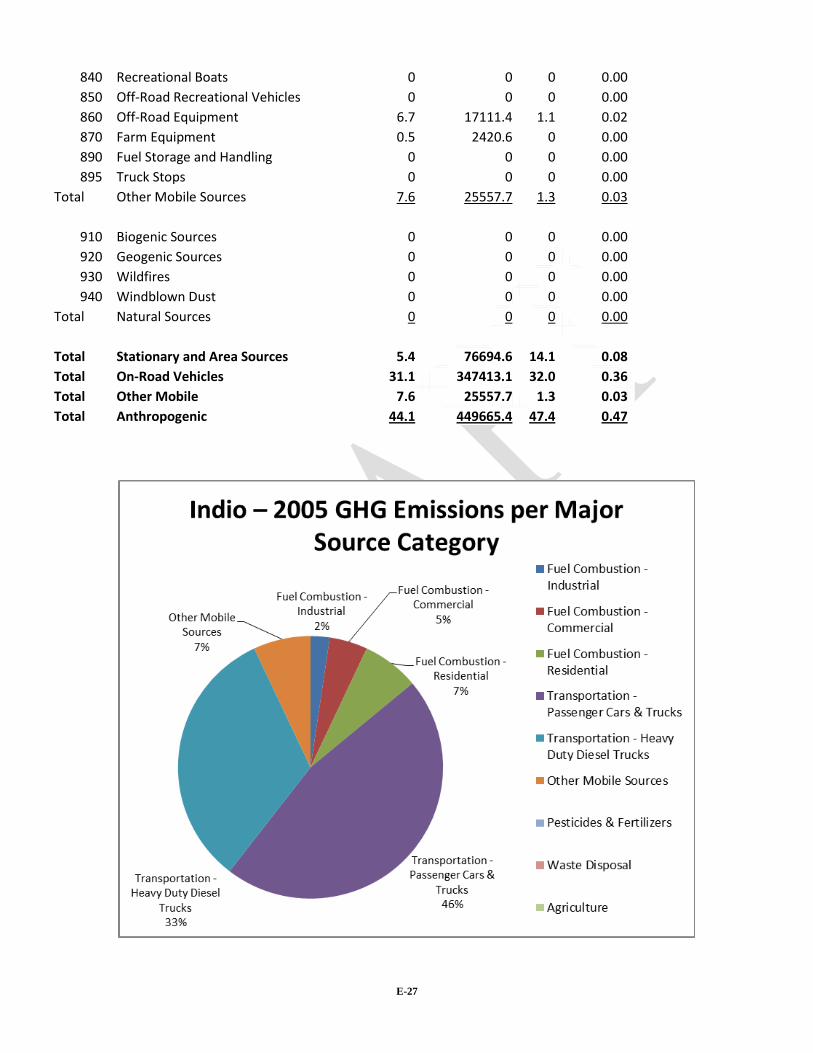
E-27
840 Recreational Boats 0 0 0 0.00
850 Off-Road Recreational Vehicles 0 0 0 0.00
860 Off-Road Equipment 6.7 17111.4 1.1 0.02
870 Farm Equipment 0.5 2420.6 0 0.00
890 Fuel Storage and Handling 0 0 0 0.00
895 Truck Stops 0 0 0 0.00
Total Other Mobile Sources 7.6 25557.7 1.3 0.03
910 Biogenic Sources 0 0 0 0.00
920 Geogenic Sources 0 0 0 0.00
930 Wildfires 0 0 0 0.00
940 Windblown Dust 0 0 0 0.00
Total Natural Sources 0 0 0 0.00
Total Stationary and Area Sources 5.4 76694.6 14.1 0.08
Total On-Road Vehicles 31.1 347413.1 32.0 0.36
Total Other Mobile 7.6 25557.7 1.3 0.03
Total Anthropogenic 44.1 449665.4 47.4 0.47

E-28
Table E-14 Indio - 2020 GHG Emissions per Major Source Category
TPY MMT
EIC CODE Source Category CH4 CO2 N2O CO2E
Fuel Combustion
10 Electric Utilities 0 0 0 0.00
20 Cogeneration 0 0 0 0.00
30 Oil and Gas Production (combustion) 0 0 0 0.00
40 Petroleum Refining (Combustion) 0 0 0 0.00
50 Manufacturing and Industrial 0.3 15203.3 0 0.02
52 Food and Agricultural Processing 0.4 21369.4 0 0.02
60 Service and Commercial 0.3 18549.2 0 0.02
99 Other (Fuel Combustion) 0 313.5 0 0.00
Total Fuel Combustion 0.9 55435.4 0.1 0.06
110 Sewage Treatment 0 0 0 0.00
120 Landfills 0 0 0 0.00
130 Incineration 0 0 0 0.00
199 Other (Waste Disposal) 0 0 0 0.00
Total Waste Disposal 0 0 0 0.00
210 Laundering 0 0 0 0.00
220 Degreasing 0 0 0 0.00
230 Coatings and Related Processes 0.1 0 0 0.00
240 Printing 0 0 0 0.00
250 Adhesives and Sealants 0 0 0 0.00
299 Other (Cleaning and Surface Coatings) 0.2 0 0 0.00
Total Cleaning and Surface Coatings 0.3 0 0 0.00
310 Oil and Gas Production 0 0 0 0.00
320 Petroleum Refining 0 0 0 0.00
330 Petroleum Marketing 1.6 0 0 0.00
399 Other (Petroleum Production and Marketing) 0 0 0 0.00
Total Petroleum Production and Marketing 1.6 0 0 0.00
410 Chemical 3.9 0 0 0.00
420 Food and Agriculture 0 0 0 0.00
430 Mineral Processes 0 0 0 0.00
440 Metal Processes 0 0 0 0.00
450 Wood and Paper 0 0 0 0.00
460 Glass and Related Products 0 0 0 0.00
470 Electronics 0 0 0 0.00
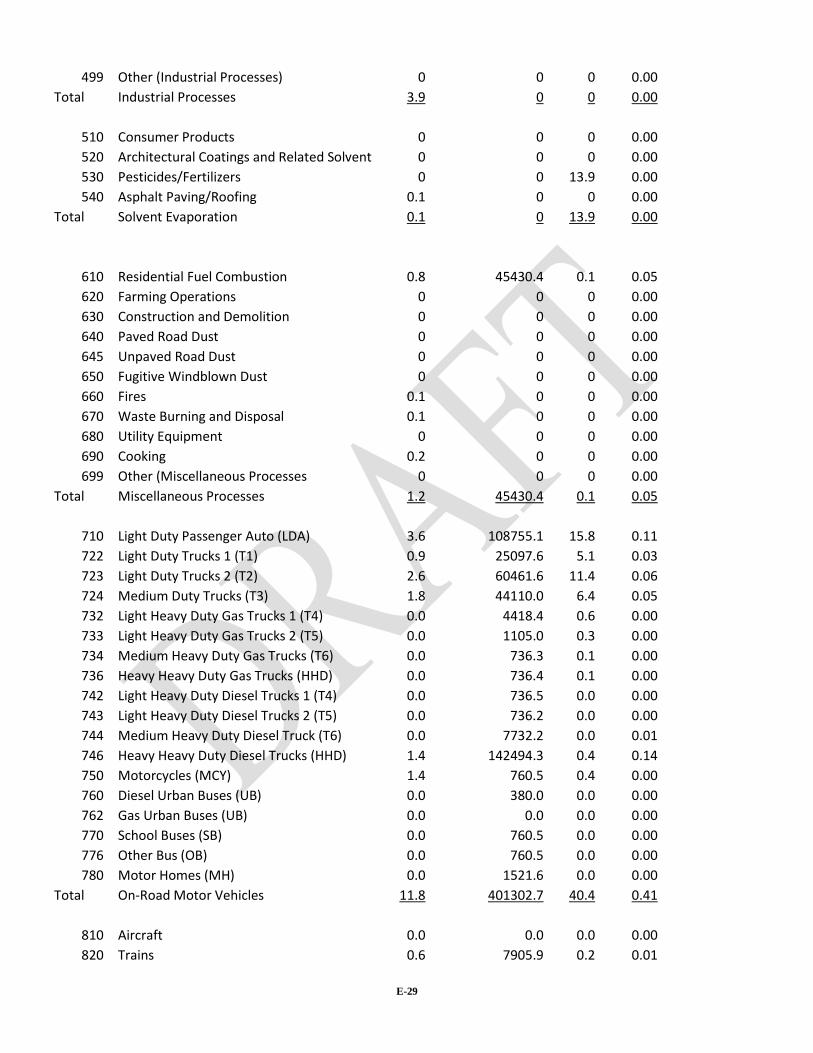
E-29
499 Other (Industrial Processes) 0 0 0 0.00
Total Industrial Processes 3.9 0 0 0.00
510 Consumer Products 0 0 0 0.00
520 Architectural Coatings and Related Solvent 0 0 0 0.00
530 Pesticides/Fertilizers 0 0 13.9 0.00
540 Asphalt Paving/Roofing 0.1 0 0 0.00
Total Solvent Evaporation 0.1 0 13.9 0.00
610 Residential Fuel Combustion 0.8 45430.4 0.1 0.05
620 Farming Operations 0 0 0 0.00
630 Construction and Demolition 0 0 0 0.00
640 Paved Road Dust 0 0 0 0.00
645 Unpaved Road Dust 0 0 0 0.00
650 Fugitive Windblown Dust 0 0 0 0.00
660 Fires 0.1 0 0 0.00
670 Waste Burning and Disposal 0.1 0 0 0.00
680 Utility Equipment 0 0 0 0.00
690 Cooking 0.2 0 0 0.00
699 Other (Miscellaneous Processes 0 0 0 0.00
Total Miscellaneous Processes 1.2 45430.4 0.1 0.05
710 Light Duty Passenger Auto (LDA) 3.6 108755.1 15.8 0.11
722 Light Duty Trucks 1 (T1) 0.9 25097.6 5.1 0.03
723 Light Duty Trucks 2 (T2) 2.6 60461.6 11.4 0.06
724 Medium Duty Trucks (T3) 1.8 44110.0 6.4 0.05
732 Light Heavy Duty Gas Trucks 1 (T4) 0.0 4418.4 0.6 0.00
733 Light Heavy Duty Gas Trucks 2 (T5) 0.0 1105.0 0.3 0.00
734 Medium Heavy Duty Gas Trucks (T6) 0.0 736.3 0.1 0.00
736 Heavy Heavy Duty Gas Trucks (HHD) 0.0 736.4 0.1 0.00
742 Light Heavy Duty Diesel Trucks 1 (T4) 0.0 736.5 0.0 0.00
743 Light Heavy Duty Diesel Trucks 2 (T5) 0.0 736.2 0.0 0.00
744 Medium Heavy Duty Diesel Truck (T6) 0.0 7732.2 0.0 0.01
746 Heavy Heavy Duty Diesel Trucks (HHD) 1.4 142494.3 0.4 0.14
750 Motorcycles (MCY) 1.4 760.5 0.4 0.00
760 Diesel Urban Buses (UB) 0.0 380.0 0.0 0.00
762 Gas Urban Buses (UB) 0.0 0.0 0.0 0.00
770 School Buses (SB) 0.0 760.5 0.0 0.00
776 Other Bus (OB) 0.0 760.5 0.0 0.00
780 Motor Homes (MH) 0.0 1521.6 0.0 0.00
Total On-Road Motor Vehicles 11.8 401302.7 40.4 0.41
810 Aircraft 0.0 0.0 0.0 0.00
820 Trains 0.6 7905.9 0.2 0.01

E-30
830 Ships and Commercial Boats 0.0 0.0 0.0 0.00
840 Recreational Boats 0.1 187.7 0.0 0.00
850 Off-Road Recreational Vehicles 0.1 15.0 0.0 0.00
860 Off-Road Equipment 4.3 25381.0 1.4 0.03
870 Farm Equipment 0.2 2787.5 0.0 0.00
890 Fuel Storage and Handling 0.0 0.0 0.0 0.00
895 Truck Stops 0.0 0.0 0.0 0.00
Total Other Mobile Sources 5.2 36277.1 1.7 0.04
910 Biogenic Sources 0 0 0 0.00
920 Geogenic Sources 0 0 0 0.00
930 Wildfires 0 0 0 0.00
940 Windblown Dust 0 0 0 0.00
Total Natural Sources 0 0 0 0.00
Total Stationary and Area Sources 8.0 100865.8 14.1 0.11
Total On-Road Vehicles 11.8 401302.7 40.4 0.41
Total Other Mobile 5.2 36277.1 1.7 0.04
Total Anthropogenic 25.1 538445.6 56.3 0.56
Table E-15 Indio – 2005 Fertilizer Usage
City 18 holes* 9 holes*
18 hole equivalent**
N2O emissions (MT CO2E/yr)***
Indio 10 3 11.5 4,324

E-31
Table E-16 La Quinta – 2005 GHG Emissions per Major Source Category
TPY MMT
EIC CODE Source Category CH4 CO2 N2O CO2E
Fuel Combustion
10 Electric Utilities 0 0 0 0.00
20 Cogeneration 0 0 0 0.00
30 Oil and Gas Production (combustion) 0 0 0 0.00
40 Petroleum Refining (Combustion) 0 0 0 0.00
50 Manufacturing and Industrial 0 2735.8 0 0.00
52 Food and Agricultural Processing 0 48.8 0 0.00
60 Service and Commercial 0.1 5383.0 0 0.01
99 Other (Fuel Combustion) 0 139.9 0 0.00
Total Fuel Combustion 0.1 8307.5 0.0 0.01
110 Sewage Treatment 0 0 0 0.00
120 Landfills 0 0 0 0.00
130 Incineration 0 0 0 0.00
199 Other (Waste Disposal) 0 0 0 0.00
Total Waste Disposal 0.0 0.0 0.0 0.00
210 Laundering 0 0 0 0.00
220 Degreasing 0 0 0 0.00
230 Coatings and Related Processes 0 0 0 0.00
240 Printing 0 0 0 0.00
250 Adhesives and Sealants 0 0 0 0.00
299 Other (Cleaning and Surface Coatings) 0 0 0 0.00
Total Cleaning and Surface Coatings 0 0 0 0.00
310 Oil and Gas Production 0 0 0 0.00
320 Petroleum Refining 0 0 0 0.00
330 Petroleum Marketing 0.9 0 0 0.00
399 Other (Petroleum Production and Marketing) 0 0 0 0.00
Total Petroleum Production and Marketing 0.9 0 0 0.00
410 Chemical 0.9 0 0 0.00
420 Food and Agriculture 0 0 0 0.00
430 Mineral Processes 0 0 0 0.00
440 Metal Processes 0 0 0 0.00
450 Wood and Paper 0 0 0 0.00
460 Glass and Related Products 0 0 0 0.00
470 Electronics 0 0 0 0.00
499 Other (Industrial Processes) 0 0 0 0.00
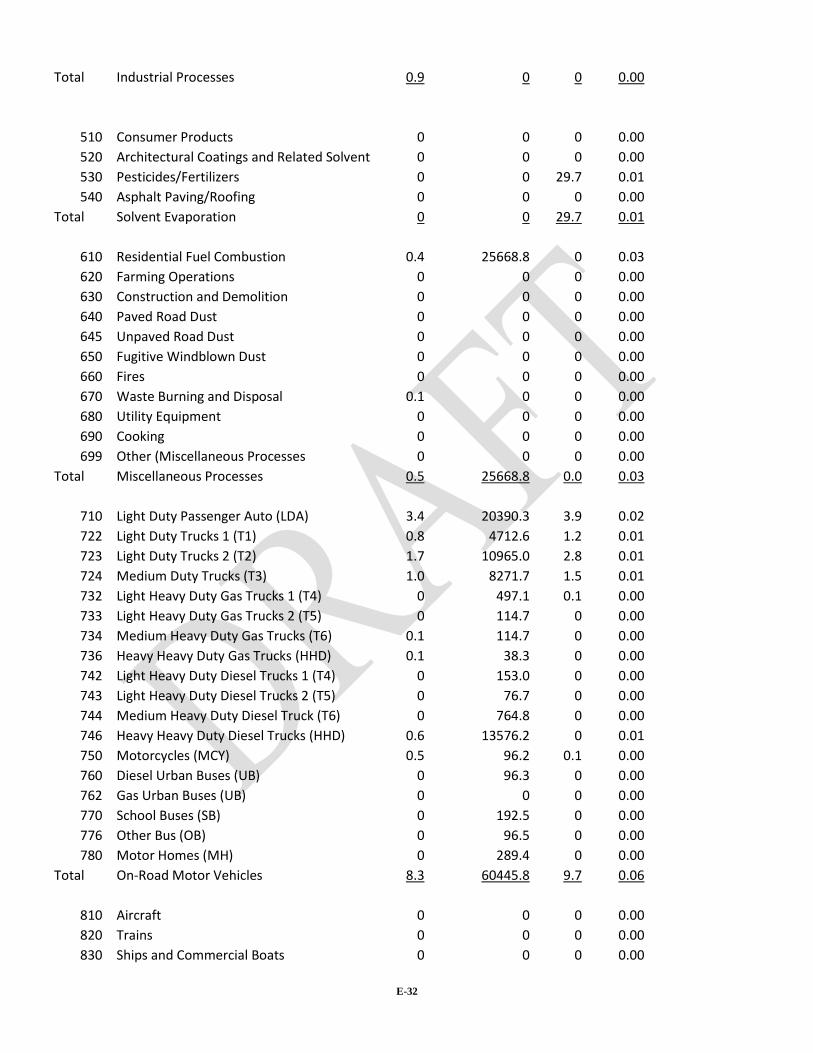
E-32
Total Industrial Processes 0.9 0 0 0.00
510 Consumer Products 0 0 0 0.00
520 Architectural Coatings and Related Solvent 0 0 0 0.00
530 Pesticides/Fertilizers 0 0 29.7 0.01
540 Asphalt Paving/Roofing 0 0 0 0.00
Total Solvent Evaporation 0 0 29.7 0.01
610 Residential Fuel Combustion 0.4 25668.8 0 0.03
620 Farming Operations 0 0 0 0.00
630 Construction and Demolition 0 0 0 0.00
640 Paved Road Dust 0 0 0 0.00
645 Unpaved Road Dust 0 0 0 0.00
650 Fugitive Windblown Dust 0 0 0 0.00
660 Fires 0 0 0 0.00
670 Waste Burning and Disposal 0.1 0 0 0.00
680 Utility Equipment 0 0 0 0.00
690 Cooking 0 0 0 0.00
699 Other (Miscellaneous Processes 0 0 0 0.00
Total Miscellaneous Processes 0.5 25668.8 0.0 0.03
710 Light Duty Passenger Auto (LDA) 3.4 20390.3 3.9 0.02
722 Light Duty Trucks 1 (T1) 0.8 4712.6 1.2 0.01
723 Light Duty Trucks 2 (T2) 1.7 10965.0 2.8 0.01
724 Medium Duty Trucks (T3) 1.0 8271.7 1.5 0.01
732 Light Heavy Duty Gas Trucks 1 (T4) 0 497.1 0.1 0.00
733 Light Heavy Duty Gas Trucks 2 (T5) 0 114.7 0 0.00
734 Medium Heavy Duty Gas Trucks (T6) 0.1 114.7 0 0.00
736 Heavy Heavy Duty Gas Trucks (HHD) 0.1 38.3 0 0.00
742 Light Heavy Duty Diesel Trucks 1 (T4) 0 153.0 0 0.00
743 Light Heavy Duty Diesel Trucks 2 (T5) 0 76.7 0 0.00
744 Medium Heavy Duty Diesel Truck (T6) 0 764.8 0 0.00
746 Heavy Heavy Duty Diesel Trucks (HHD) 0.6 13576.2 0 0.01
750 Motorcycles (MCY) 0.5 96.2 0.1 0.00
760 Diesel Urban Buses (UB) 0 96.3 0 0.00
762 Gas Urban Buses (UB) 0 0 0 0.00
770 School Buses (SB) 0 192.5 0 0.00
776 Other Bus (OB) 0 96.5 0 0.00
780 Motor Homes (MH) 0 289.4 0 0.00
Total On-Road Motor Vehicles 8.3 60445.8 9.7 0.06
810 Aircraft 0 0 0 0.00
820 Trains 0 0 0 0.00
830 Ships and Commercial Boats 0 0 0 0.00

E-33
840 Recreational Boats 0 0 0 0.00
850 Off-Road Recreational Vehicles 0 0 0 0.00
860 Off-Road Equipment 4.2 10889.1 0.7 0.01
870 Farm Equipment 0.3 1452.4 0 0.00
890 Fuel Storage and Handling 0 0 0 0.00
895 Truck Stops 0 0 0 0.00
Total Other Mobile Sources 4.5 12341.5 0.7 0.01
910 Biogenic Sources 0 0 0 0.00
920 Geogenic Sources 0 0 0 0.00
930 Wildfires 0 0 0 0.00
940 Windblown Dust 0 0 0 0.00
Total Natural Sources 0 0 0 0.00
Total Stationary and Area Sources 2.5 33976.3 29.8 0.04
Total On-Road Vehicles 8.3 60445.8 9.7 0.06
Total Other Mobile 4.5 12341.5 0.7 0.01
Total Anthropogenic 15.3 106763.6 40.2 0.12
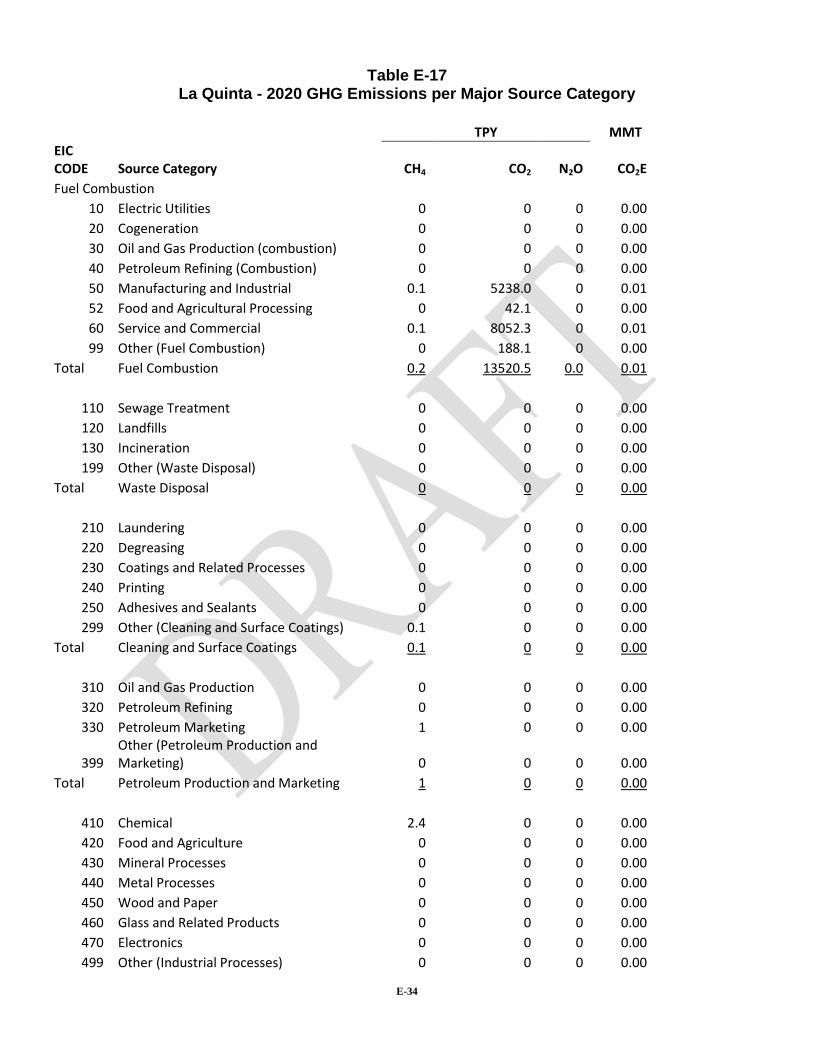
E-34
Table E-17 La Quinta - 2020 GHG Emissions per Major Source Category
TPY MMT
EIC CODE Source Category CH4 CO2 N2O CO2E
Fuel Combustion
10 Electric Utilities 0 0 0 0.00
20 Cogeneration 0 0 0 0.00
30 Oil and Gas Production (combustion) 0 0 0 0.00
40 Petroleum Refining (Combustion) 0 0 0 0.00
50 Manufacturing and Industrial 0.1 5238.0 0 0.01
52 Food and Agricultural Processing 0 42.1 0 0.00
60 Service and Commercial 0.1 8052.3 0 0.01
99 Other (Fuel Combustion) 0 188.1 0 0.00
Total Fuel Combustion 0.2 13520.5 0.0 0.01
110 Sewage Treatment 0 0 0 0.00
120 Landfills 0 0 0 0.00
130 Incineration 0 0 0 0.00
199 Other (Waste Disposal) 0 0 0 0.00
Total Waste Disposal 0 0 0 0.00
210 Laundering 0 0 0 0.00
220 Degreasing 0 0 0 0.00
230 Coatings and Related Processes 0 0 0 0.00
240 Printing 0 0 0 0.00
250 Adhesives and Sealants 0 0 0 0.00
299 Other (Cleaning and Surface Coatings) 0.1 0 0 0.00
Total Cleaning and Surface Coatings 0.1 0 0 0.00
310 Oil and Gas Production 0 0 0 0.00
320 Petroleum Refining 0 0 0 0.00
330 Petroleum Marketing 1 0 0 0.00
399 Other (Petroleum Production and Marketing) 0 0 0 0.00
Total Petroleum Production and Marketing 1 0 0 0.00
410 Chemical 2.4 0 0 0.00
420 Food and Agriculture 0 0 0 0.00
430 Mineral Processes 0 0 0 0.00
440 Metal Processes 0 0 0 0.00
450 Wood and Paper 0 0 0 0.00
460 Glass and Related Products 0 0 0 0.00
470 Electronics 0 0 0 0.00
499 Other (Industrial Processes) 0 0 0 0.00
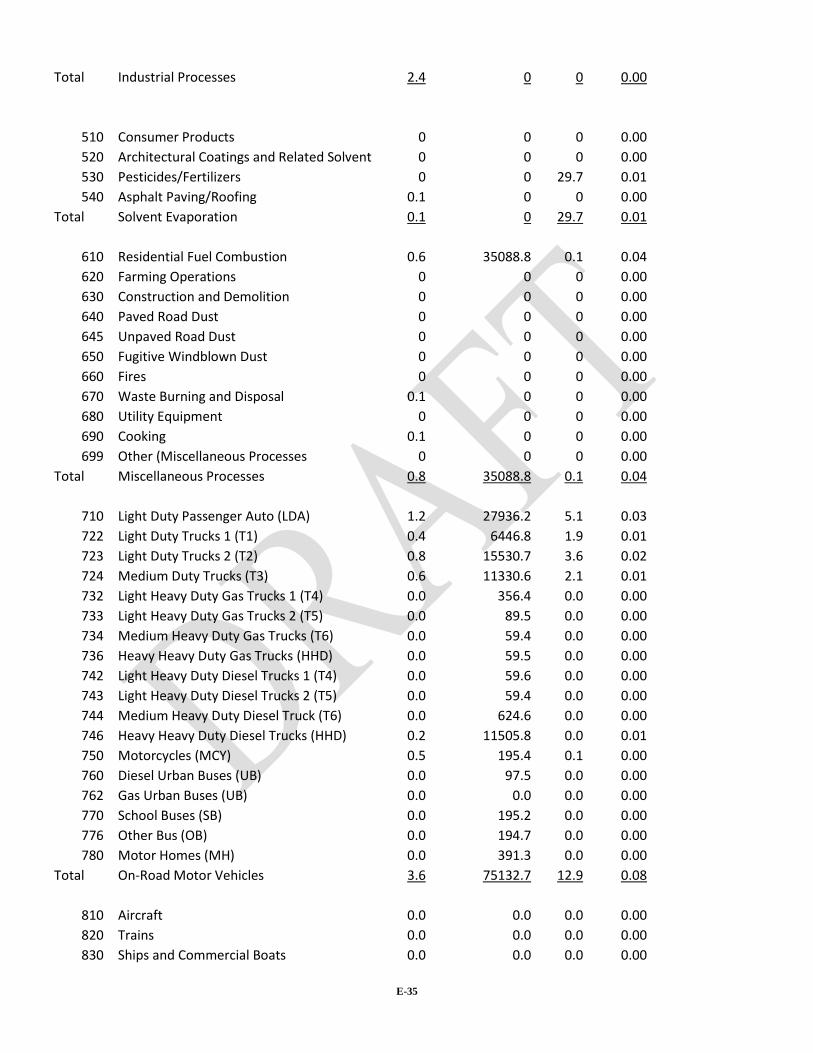
E-35
Total Industrial Processes 2.4 0 0 0.00
510 Consumer Products 0 0 0 0.00
520 Architectural Coatings and Related Solvent 0 0 0 0.00
530 Pesticides/Fertilizers 0 0 29.7 0.01
540 Asphalt Paving/Roofing 0.1 0 0 0.00
Total Solvent Evaporation 0.1 0 29.7 0.01
610 Residential Fuel Combustion 0.6 35088.8 0.1 0.04
620 Farming Operations 0 0 0 0.00
630 Construction and Demolition 0 0 0 0.00
640 Paved Road Dust 0 0 0 0.00
645 Unpaved Road Dust 0 0 0 0.00
650 Fugitive Windblown Dust 0 0 0 0.00
660 Fires 0 0 0 0.00
670 Waste Burning and Disposal 0.1 0 0 0.00
680 Utility Equipment 0 0 0 0.00
690 Cooking 0.1 0 0 0.00
699 Other (Miscellaneous Processes 0 0 0 0.00
Total Miscellaneous Processes 0.8 35088.8 0.1 0.04
710 Light Duty Passenger Auto (LDA) 1.2 27936.2 5.1 0.03
722 Light Duty Trucks 1 (T1) 0.4 6446.8 1.9 0.01
723 Light Duty Trucks 2 (T2) 0.8 15530.7 3.6 0.02
724 Medium Duty Trucks (T3) 0.6 11330.6 2.1 0.01
732 Light Heavy Duty Gas Trucks 1 (T4) 0.0 356.4 0.0 0.00
733 Light Heavy Duty Gas Trucks 2 (T5) 0.0 89.5 0.0 0.00
734 Medium Heavy Duty Gas Trucks (T6) 0.0 59.4 0.0 0.00
736 Heavy Heavy Duty Gas Trucks (HHD) 0.0 59.5 0.0 0.00
742 Light Heavy Duty Diesel Trucks 1 (T4) 0.0 59.6 0.0 0.00
743 Light Heavy Duty Diesel Trucks 2 (T5) 0.0 59.4 0.0 0.00
744 Medium Heavy Duty Diesel Truck (T6) 0.0 624.6 0.0 0.00
746 Heavy Heavy Duty Diesel Trucks (HHD) 0.2 11505.8 0.0 0.01
750 Motorcycles (MCY) 0.5 195.4 0.1 0.00
760 Diesel Urban Buses (UB) 0.0 97.5 0.0 0.00
762 Gas Urban Buses (UB) 0.0 0.0 0.0 0.00
770 School Buses (SB) 0.0 195.2 0.0 0.00
776 Other Bus (OB) 0.0 194.7 0.0 0.00
780 Motor Homes (MH) 0.0 391.3 0.0 0.00
Total On-Road Motor Vehicles 3.6 75132.7 12.9 0.08
810 Aircraft 0.0 0.0 0.0 0.00
820 Trains 0.0 0.0 0.0 0.00
830 Ships and Commercial Boats 0.0 0.0 0.0 0.00
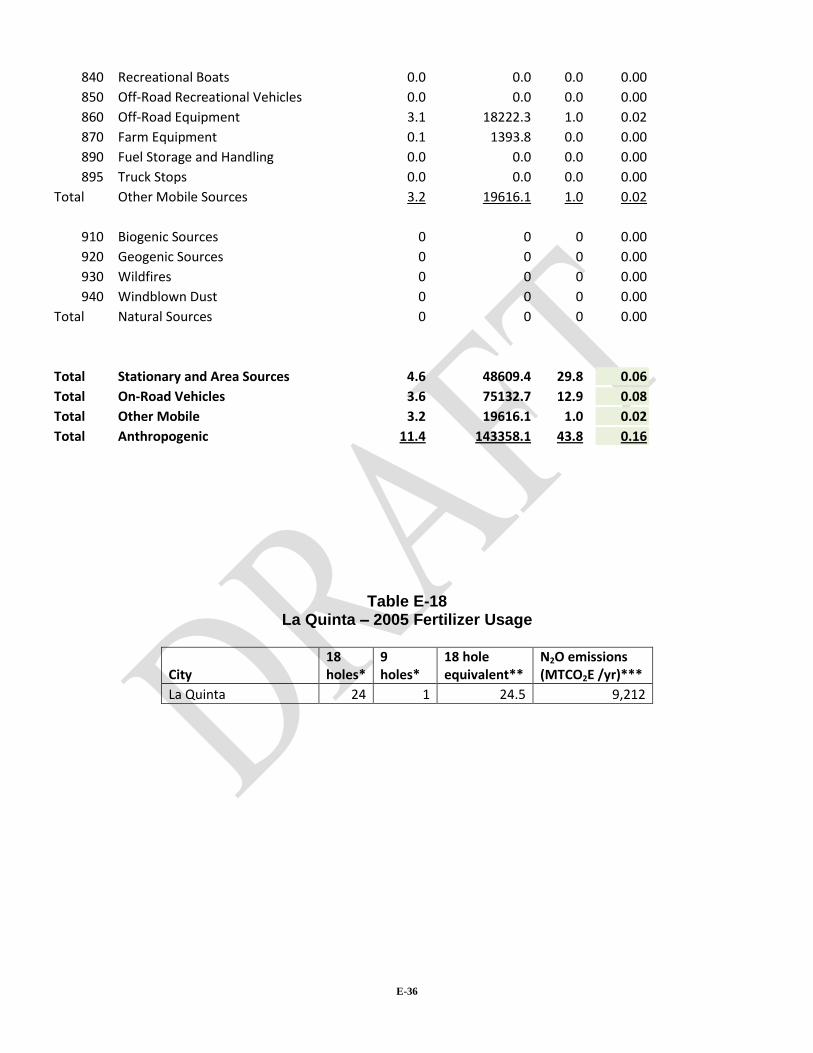
E-36
840 Recreational Boats 0.0 0.0 0.0 0.00
850 Off-Road Recreational Vehicles 0.0 0.0 0.0 0.00
860 Off-Road Equipment 3.1 18222.3 1.0 0.02
870 Farm Equipment 0.1 1393.8 0.0 0.00
890 Fuel Storage and Handling 0.0 0.0 0.0 0.00
895 Truck Stops 0.0 0.0 0.0 0.00
Total Other Mobile Sources 3.2 19616.1 1.0 0.02
910 Biogenic Sources 0 0 0 0.00
920 Geogenic Sources 0 0 0 0.00
930 Wildfires 0 0 0 0.00
940 Windblown Dust 0 0 0 0.00
Total Natural Sources 0 0 0 0.00
Total Stationary and Area Sources 4.6 48609.4 29.8 0.06
Total On-Road Vehicles 3.6 75132.7 12.9 0.08
Total Other Mobile 3.2 19616.1 1.0 0.02
Total Anthropogenic 11.4 143358.1 43.8 0.16
Table E-18 La Quinta – 2005 Fertilizer Usage
City 18 holes*
9 holes*
18 hole equivalent**
N2O emissions (MTCO2E /yr)***
La Quinta 24 1 24.5 9,212
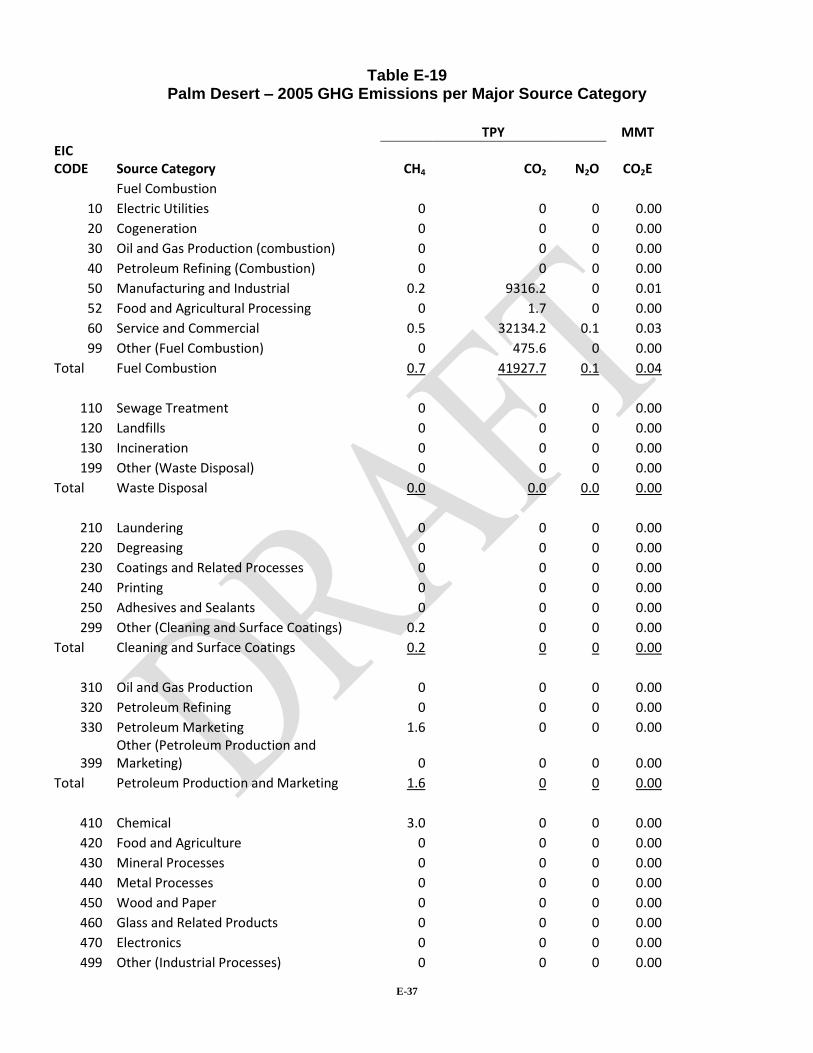
E-37
Table E-19 Palm Desert – 2005 GHG Emissions per Major Source Category
TPY MMT
EIC CODE Source Category CH4 CO2 N2O CO2E
Fuel Combustion
10 Electric Utilities 0 0 0 0.00
20 Cogeneration 0 0 0 0.00
30 Oil and Gas Production (combustion) 0 0 0 0.00
40 Petroleum Refining (Combustion) 0 0 0 0.00
50 Manufacturing and Industrial 0.2 9316.2 0 0.01
52 Food and Agricultural Processing 0 1.7 0 0.00
60 Service and Commercial 0.5 32134.2 0.1 0.03
99 Other (Fuel Combustion) 0 475.6 0 0.00
Total Fuel Combustion 0.7 41927.7 0.1 0.04
110 Sewage Treatment 0 0 0 0.00
120 Landfills 0 0 0 0.00
130 Incineration 0 0 0 0.00
199 Other (Waste Disposal) 0 0 0 0.00
Total Waste Disposal 0.0 0.0 0.0 0.00
210 Laundering 0 0 0 0.00
220 Degreasing 0 0 0 0.00
230 Coatings and Related Processes 0 0 0 0.00
240 Printing 0 0 0 0.00
250 Adhesives and Sealants 0 0 0 0.00
299 Other (Cleaning and Surface Coatings) 0.2 0 0 0.00
Total Cleaning and Surface Coatings 0.2 0 0 0.00
310 Oil and Gas Production 0 0 0 0.00
320 Petroleum Refining 0 0 0 0.00
330 Petroleum Marketing 1.6 0 0 0.00
399 Other (Petroleum Production and Marketing) 0 0 0 0.00
Total Petroleum Production and Marketing 1.6 0 0 0.00
410 Chemical 3.0 0 0 0.00
420 Food and Agriculture 0 0 0 0.00
430 Mineral Processes 0 0 0 0.00
440 Metal Processes 0 0 0 0.00
450 Wood and Paper 0 0 0 0.00
460 Glass and Related Products 0 0 0 0.00
470 Electronics 0 0 0 0.00
499 Other (Industrial Processes) 0 0 0 0.00
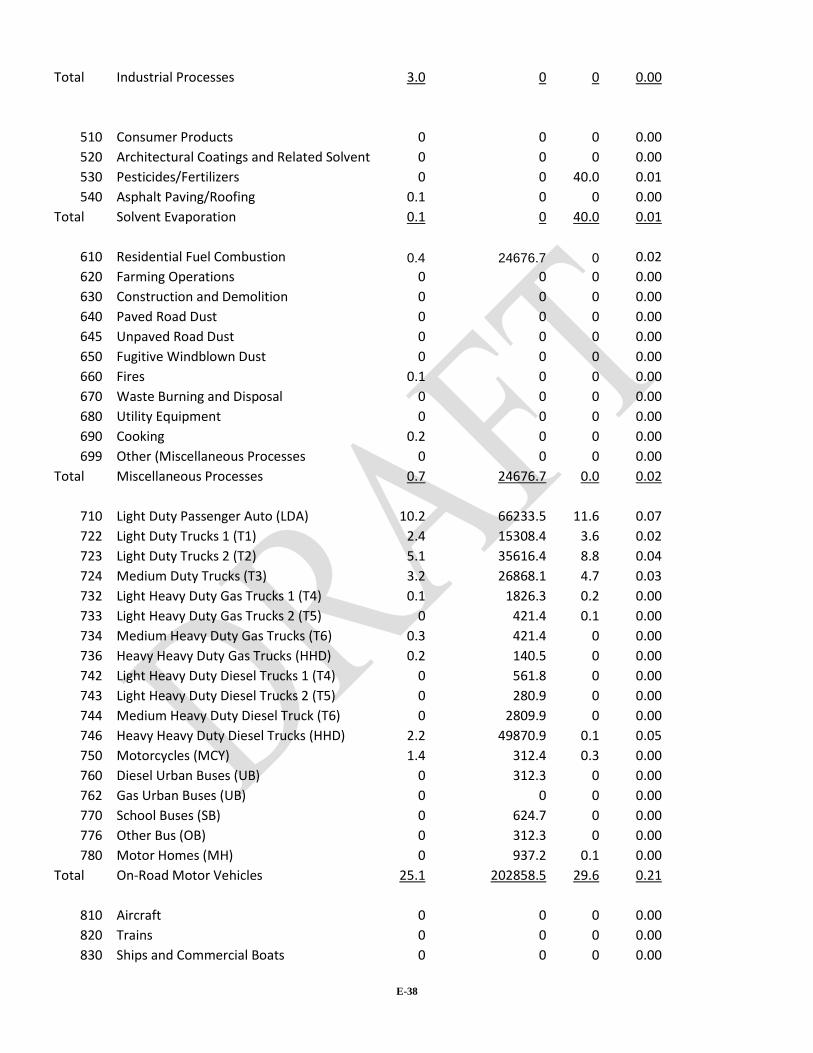
E-38
Total Industrial Processes 3.0 0 0 0.00
510 Consumer Products 0 0 0 0.00
520 Architectural Coatings and Related Solvent 0 0 0 0.00
530 Pesticides/Fertilizers 0 0 40.0 0.01
540 Asphalt Paving/Roofing 0.1 0 0 0.00
Total Solvent Evaporation 0.1 0 40.0 0.01
610 Residential Fuel Combustion 0.4 24676.7 0 0.02
620 Farming Operations 0 0 0 0.00
630 Construction and Demolition 0 0 0 0.00
640 Paved Road Dust 0 0 0 0.00
645 Unpaved Road Dust 0 0 0 0.00
650 Fugitive Windblown Dust 0 0 0 0.00
660 Fires 0.1 0 0 0.00
670 Waste Burning and Disposal 0 0 0 0.00
680 Utility Equipment 0 0 0 0.00
690 Cooking 0.2 0 0 0.00
699 Other (Miscellaneous Processes 0 0 0 0.00
Total Miscellaneous Processes 0.7 24676.7 0.0 0.02
710 Light Duty Passenger Auto (LDA) 10.2 66233.5 11.6 0.07
722 Light Duty Trucks 1 (T1) 2.4 15308.4 3.6 0.02
723 Light Duty Trucks 2 (T2) 5.1 35616.4 8.8 0.04
724 Medium Duty Trucks (T3) 3.2 26868.1 4.7 0.03
732 Light Heavy Duty Gas Trucks 1 (T4) 0.1 1826.3 0.2 0.00
733 Light Heavy Duty Gas Trucks 2 (T5) 0 421.4 0.1 0.00
734 Medium Heavy Duty Gas Trucks (T6) 0.3 421.4 0 0.00
736 Heavy Heavy Duty Gas Trucks (HHD) 0.2 140.5 0 0.00
742 Light Heavy Duty Diesel Trucks 1 (T4) 0 561.8 0 0.00
743 Light Heavy Duty Diesel Trucks 2 (T5) 0 280.9 0 0.00
744 Medium Heavy Duty Diesel Truck (T6) 0 2809.9 0 0.00
746 Heavy Heavy Duty Diesel Trucks (HHD) 2.2 49870.9 0.1 0.05
750 Motorcycles (MCY) 1.4 312.4 0.3 0.00
760 Diesel Urban Buses (UB) 0 312.3 0 0.00
762 Gas Urban Buses (UB) 0 0 0 0.00
770 School Buses (SB) 0 624.7 0 0.00
776 Other Bus (OB) 0 312.3 0 0.00
780 Motor Homes (MH) 0 937.2 0.1 0.00
Total On-Road Motor Vehicles 25.1 202858.5 29.6 0.21
810 Aircraft 0 0 0 0.00
820 Trains 0 0 0 0.00
830 Ships and Commercial Boats 0 0 0 0.00
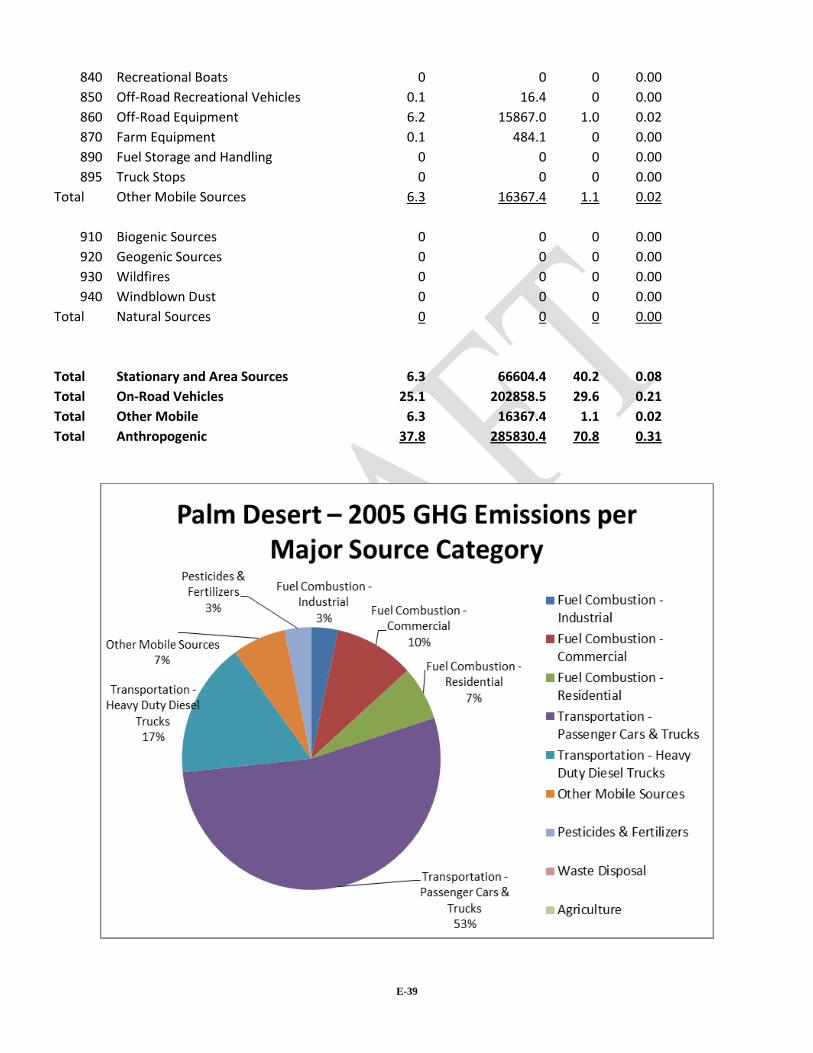
E-39
840 Recreational Boats 0 0 0 0.00
850 Off-Road Recreational Vehicles 0.1 16.4 0 0.00
860 Off-Road Equipment 6.2 15867.0 1.0 0.02
870 Farm Equipment 0.1 484.1 0 0.00
890 Fuel Storage and Handling 0 0 0 0.00
895 Truck Stops 0 0 0 0.00
Total Other Mobile Sources 6.3 16367.4 1.1 0.02
910 Biogenic Sources 0 0 0 0.00
920 Geogenic Sources 0 0 0 0.00
930 Wildfires 0 0 0 0.00
940 Windblown Dust 0 0 0 0.00
Total Natural Sources 0 0 0 0.00
Total Stationary and Area Sources 6.3 66604.4 40.2 0.08
Total On-Road Vehicles 25.1 202858.5 29.6 0.21
Total Other Mobile 6.3 16367.4 1.1 0.02
Total Anthropogenic 37.8 285830.4 70.8 0.31
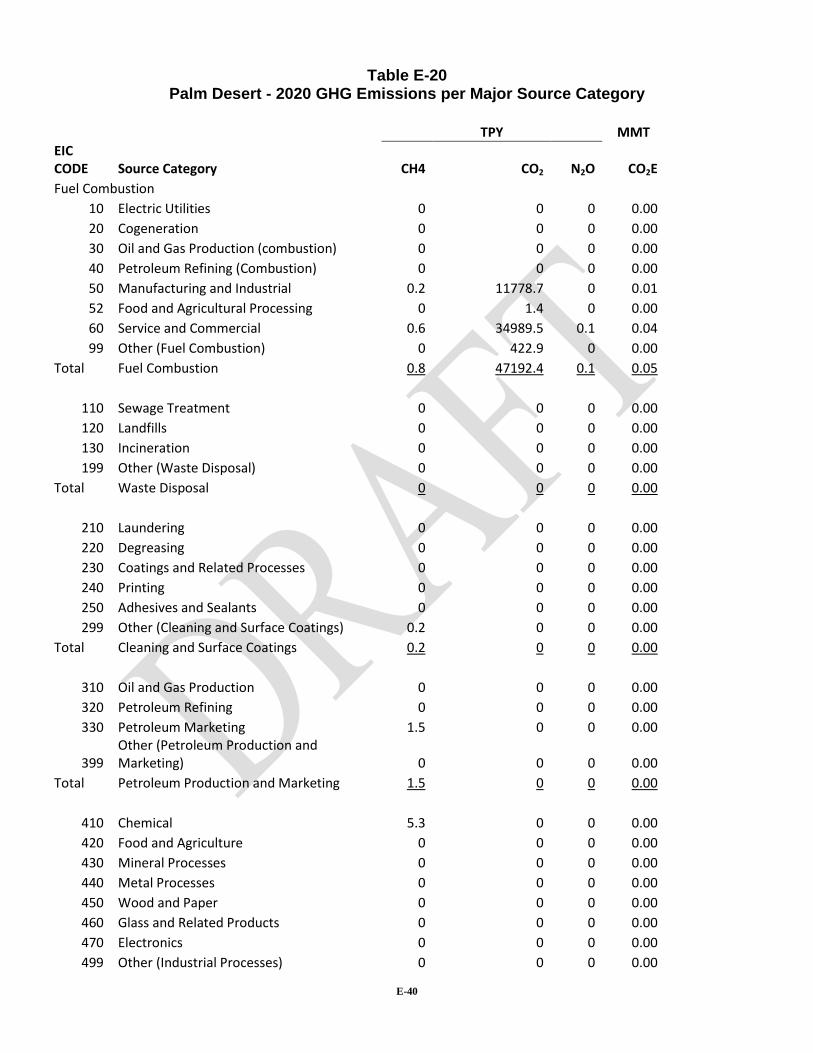
E-40
Table E-20 Palm Desert - 2020 GHG Emissions per Major Source Category
TPY MMT
EIC CODE Source Category CH4 CO2 N2O CO2E
Fuel Combustion
10 Electric Utilities 0 0 0 0.00
20 Cogeneration 0 0 0 0.00
30 Oil and Gas Production (combustion) 0 0 0 0.00
40 Petroleum Refining (Combustion) 0 0 0 0.00
50 Manufacturing and Industrial 0.2 11778.7 0 0.01
52 Food and Agricultural Processing 0 1.4 0 0.00
60 Service and Commercial 0.6 34989.5 0.1 0.04
99 Other (Fuel Combustion) 0 422.9 0 0.00
Total Fuel Combustion 0.8 47192.4 0.1 0.05
110 Sewage Treatment 0 0 0 0.00
120 Landfills 0 0 0 0.00
130 Incineration 0 0 0 0.00
199 Other (Waste Disposal) 0 0 0 0.00
Total Waste Disposal 0 0 0 0.00
210 Laundering 0 0 0 0.00
220 Degreasing 0 0 0 0.00
230 Coatings and Related Processes 0 0 0 0.00
240 Printing 0 0 0 0.00
250 Adhesives and Sealants 0 0 0 0.00
299 Other (Cleaning and Surface Coatings) 0.2 0 0 0.00
Total Cleaning and Surface Coatings 0.2 0 0 0.00
310 Oil and Gas Production 0 0 0 0.00
320 Petroleum Refining 0 0 0 0.00
330 Petroleum Marketing 1.5 0 0 0.00
399 Other (Petroleum Production and Marketing) 0 0 0 0.00
Total Petroleum Production and Marketing 1.5 0 0 0.00
410 Chemical 5.3 0 0 0.00
420 Food and Agriculture 0 0 0 0.00
430 Mineral Processes 0 0 0 0.00
440 Metal Processes 0 0 0 0.00
450 Wood and Paper 0 0 0 0.00
460 Glass and Related Products 0 0 0 0.00
470 Electronics 0 0 0 0.00
499 Other (Industrial Processes) 0 0 0 0.00
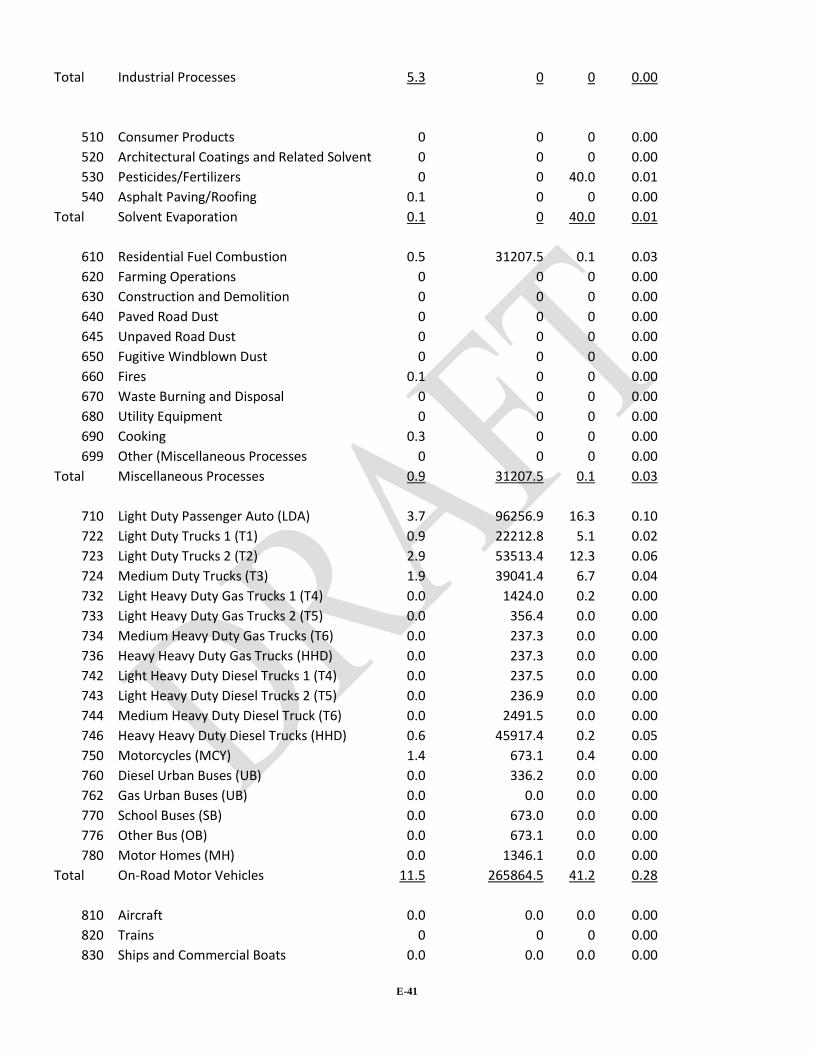
E-41
Total Industrial Processes 5.3 0 0 0.00
510 Consumer Products 0 0 0 0.00
520 Architectural Coatings and Related Solvent 0 0 0 0.00
530 Pesticides/Fertilizers 0 0 40.0 0.01
540 Asphalt Paving/Roofing 0.1 0 0 0.00
Total Solvent Evaporation 0.1 0 40.0 0.01
610 Residential Fuel Combustion 0.5 31207.5 0.1 0.03
620 Farming Operations 0 0 0 0.00
630 Construction and Demolition 0 0 0 0.00
640 Paved Road Dust 0 0 0 0.00
645 Unpaved Road Dust 0 0 0 0.00
650 Fugitive Windblown Dust 0 0 0 0.00
660 Fires 0.1 0 0 0.00
670 Waste Burning and Disposal 0 0 0 0.00
680 Utility Equipment 0 0 0 0.00
690 Cooking 0.3 0 0 0.00
699 Other (Miscellaneous Processes 0 0 0 0.00
Total Miscellaneous Processes 0.9 31207.5 0.1 0.03
710 Light Duty Passenger Auto (LDA) 3.7 96256.9 16.3 0.10
722 Light Duty Trucks 1 (T1) 0.9 22212.8 5.1 0.02
723 Light Duty Trucks 2 (T2) 2.9 53513.4 12.3 0.06
724 Medium Duty Trucks (T3) 1.9 39041.4 6.7 0.04
732 Light Heavy Duty Gas Trucks 1 (T4) 0.0 1424.0 0.2 0.00
733 Light Heavy Duty Gas Trucks 2 (T5) 0.0 356.4 0.0 0.00
734 Medium Heavy Duty Gas Trucks (T6) 0.0 237.3 0.0 0.00
736 Heavy Heavy Duty Gas Trucks (HHD) 0.0 237.3 0.0 0.00
742 Light Heavy Duty Diesel Trucks 1 (T4) 0.0 237.5 0.0 0.00
743 Light Heavy Duty Diesel Trucks 2 (T5) 0.0 236.9 0.0 0.00
744 Medium Heavy Duty Diesel Truck (T6) 0.0 2491.5 0.0 0.00
746 Heavy Heavy Duty Diesel Trucks (HHD) 0.6 45917.4 0.2 0.05
750 Motorcycles (MCY) 1.4 673.1 0.4 0.00
760 Diesel Urban Buses (UB) 0.0 336.2 0.0 0.00
762 Gas Urban Buses (UB) 0.0 0.0 0.0 0.00
770 School Buses (SB) 0.0 673.0 0.0 0.00
776 Other Bus (OB) 0.0 673.1 0.0 0.00
780 Motor Homes (MH) 0.0 1346.1 0.0 0.00
Total On-Road Motor Vehicles 11.5 265864.5 41.2 0.28
810 Aircraft 0.0 0.0 0.0 0.00
820 Trains 0 0 0 0.00
830 Ships and Commercial Boats 0.0 0.0 0.0 0.00
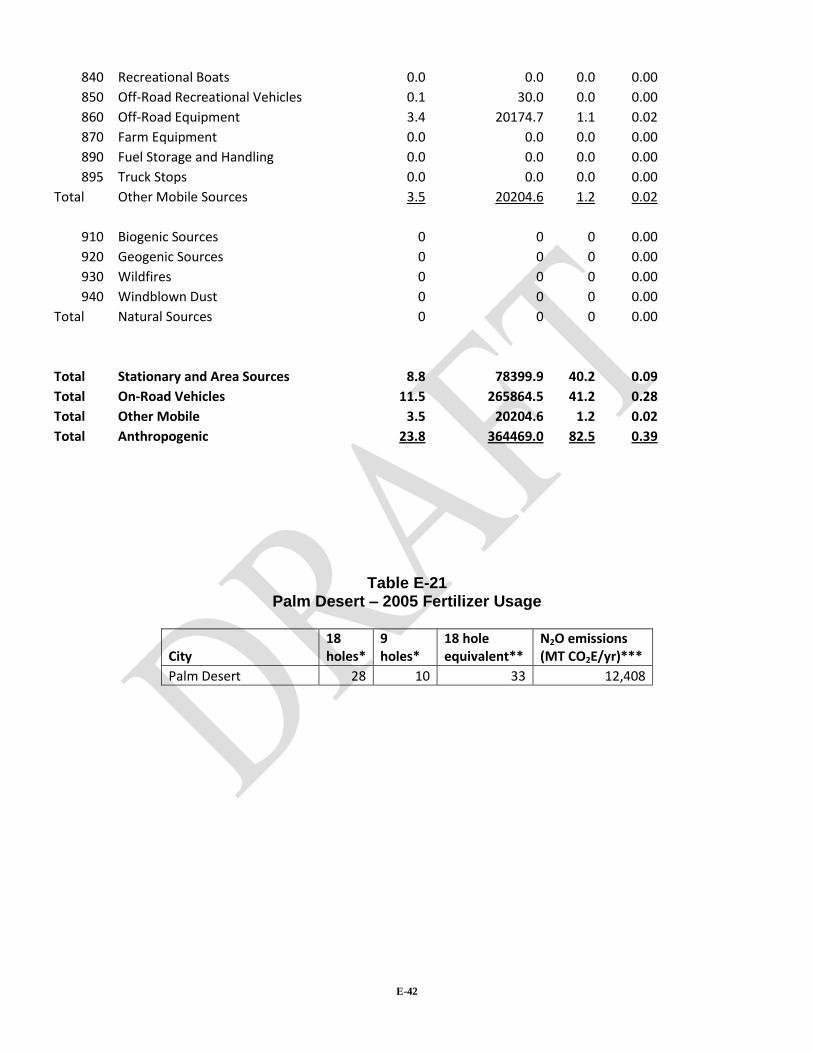
E-42
840 Recreational Boats 0.0 0.0 0.0 0.00
850 Off-Road Recreational Vehicles 0.1 30.0 0.0 0.00
860 Off-Road Equipment 3.4 20174.7 1.1 0.02
870 Farm Equipment 0.0 0.0 0.0 0.00
890 Fuel Storage and Handling 0.0 0.0 0.0 0.00
895 Truck Stops 0.0 0.0 0.0 0.00
Total Other Mobile Sources 3.5 20204.6 1.2 0.02
910 Biogenic Sources 0 0 0 0.00
920 Geogenic Sources 0 0 0 0.00
930 Wildfires 0 0 0 0.00
940 Windblown Dust 0 0 0 0.00
Total Natural Sources 0 0 0 0.00
Total Stationary and Area Sources 8.8 78399.9 40.2 0.09
Total On-Road Vehicles 11.5 265864.5 41.2 0.28
Total Other Mobile 3.5 20204.6 1.2 0.02
Total Anthropogenic 23.8 364469.0 82.5 0.39
Table E-21 Palm Desert – 2005 Fertilizer Usage
City 18 holes*
9 holes*
18 hole equivalent**
N2O emissions (MT CO2E/yr)***
Palm Desert 28 10 33 12,408

E-43
Table E-22 Palm Springs – 2005 GHG Emissions per Major Source Category
TPY MMT
EIC CODE Source Category CH4 CO2 N2O CO2E
Fuel Combustion
10 Electric Utilities 0 0 0 0.00
20 Cogeneration 0 0 0 0.00
30 Oil and Gas Production (combustion) 0 0 0 0.00
40 Petroleum Refining (Combustion) 0 0 0 0.00
50 Manufacturing and Industrial 0.2 13612.8 0 0.01
52 Food and Agricultural Processing 0 1.6 0 0.00
60 Service and Commercial 0.6 32586.1 0.1 0.03
99 Other (Fuel Combustion) 0 671.7 0 0.00
Total Fuel Combustion 0.8 46872.2 0.1 0.05
110 Sewage Treatment 0 0 0 0.00
120 Landfills 0 0 0 0.00
130 Incineration 0 0 0 0.00
199 Other (Waste Disposal) 0 0 0 0.00
Total Waste Disposal 0.0 0.0 0.0 0.00
210 Laundering 0 0 0 0.00
220 Degreasing 0 0 0 0.00
230 Coatings and Related Processes 0.1 0 0 0.00
240 Printing 0 0 0 0.00
250 Adhesives and Sealants 0 0 0 0.00
299 Other (Cleaning and Surface Coatings) 0.2 0 0 0.00
Total Cleaning and Surface Coatings 0.3 0 0 0.00
310 Oil and Gas Production 0 0 0 0.00
320 Petroleum Refining 0 0 0 0.00
330 Petroleum Marketing 2.4 0 0 0.00
399 Other (Petroleum Production and Marketing) 0 0 0 0.00
Total Petroleum Production and Marketing 2.4 0 0 0.00
410 Chemical 4.2 0 0 0.00
420 Food and Agriculture 0 0 0 0.00
430 Mineral Processes 0 0 0 0.00
440 Metal Processes 0 0 0 0.00
450 Wood and Paper 0 0 0 0.00
460 Glass and Related Products 0 0 0 0.00
470 Electronics 0 0 0 0.00
499 Other (Industrial Processes) 0 0 0 0.00

E-44
Total Industrial Processes 4.2 0 0 0.00
510 Consumer Products 0 0 0 0.00
520 Architectural Coatings and Related Solvent 0 0 0 0.00
530 Pesticides/Fertilizers 0 0 11.5 0.00
540 Asphalt Paving/Roofing 0.1 0 0 0.00
Total Solvent Evaporation 0.1 0 11.5 0.00
610 Residential Fuel Combustion 0.7 42882.0 0.08 0.04
620 Farming Operations 0 0 0 0.00
630 Construction and Demolition 0 0 0 0.00
640 Paved Road Dust 0 0 0 0.00
645 Unpaved Road Dust 0 0 0 0.00
650 Fugitive Windblown Dust 0 0 0 0.00
660 Fires 0.1 0 0 0.00
670 Waste Burning and Disposal 0 0 0 0.00
680 Utility Equipment 0 0 0 0.00
690 Cooking 0.3 0 0 0.00
699 Other (Miscellaneous Processes 0 0 0 0.00
Total Miscellaneous Processes 1.1 42882.0 0.08 0.04
710 Light Duty Passenger Auto (LDA) 8.8 73788.4 10.0 0.08
722 Light Duty Trucks 1 (T1) 2.0 17055.1 3.0 0.02
723 Light Duty Trucks 2 (T2) 4.4 39678.8 7.4 0.04
724 Medium Duty Trucks (T3) 2.8 29933.0 4.2 0.03
732 Light Heavy Duty Gas Trucks 1 (T4) 0.3 2985.4 0.4 0.00
733 Light Heavy Duty Gas Trucks 2 (T5) 0 688.9 0.1 0.00
734 Medium Heavy Duty Gas Trucks (T6) 0.4 688.9 0.1 0.00
736 Heavy Heavy Duty Gas Trucks (HHD) 0.2 229.7 0.1 0.00
742 Light Heavy Duty Diesel Trucks 1 (T4) 0 918.4 0 0.00
743 Light Heavy Duty Diesel Trucks 2 (T5) 0 459.1 0 0.00
744 Medium Heavy Duty Diesel Truck (T6) 0 4593.1 0 0.00
746 Heavy Heavy Duty Diesel Trucks (HHD) 3.6 81523.9 0.2 0.08
750 Motorcycles (MCY) 1.2 348.0 0.3 0.00
760 Diesel Urban Buses (UB) 0 348.1 0 0.00
762 Gas Urban Buses (UB) 0 0 0 0.00
770 School Buses (SB) 0 695.9 0 0.00
776 Other Bus (OB) 0 347.9 0 0.00
780 Motor Homes (MH) 0 1043.8 0.1 0.00
Total On-Road Motor Vehicles 23.7 255326.3 25.8 0.26
810 Aircraft 2.19 26475 0.79 0.03
820 Trains 0.5 6938.7 0.2 0.01
830 Ships and Commercial Boats 0 0 0 0.00
840 Recreational Boats 0.9 687.2 0.2 0.00

E-45
850 Off-Road Recreational Vehicles 0.2 49.1 0.1 0.00
860 Off-Road Equipment 9.7 24889.4 1.6 0.03
870 Farm Equipment 0 0 0 0.00
890 Fuel Storage and Handling 0 0 0 0.00
895 Truck Stops 0 0 0 0.00
Total Other Mobile Sources 13.5 59039.3 2.8 0.06
910 Biogenic Sources 0 0 0 0.00
920 Geogenic Sources 0 0 0 0.00
930 Wildfires 0 0 0 0.00
940 Windblown Dust 0 0 0 0.00
Total Natural Sources 0 0 0 0.00
Total Stationary and Area Sources 8.9 89754.2 11.7 0.09
Total On-Road Vehicles 23.7 255326.3 25.8 0.26
Total Other Mobile 13.5 59039.3 2.8 0.06
Total Anthropogenic 46.1 404119.8 40.3 0.42

E-46
Table E-23 Palm Springs - 2020 GHG Emissions per Major Source Category
TPY MMT
EIC CODE Source Category CH4 CO2 N2O CO2E
Fuel Combustion
10 Electric Utilities 0 0 0 0.00
20 Cogeneration 0 0 0 0.00
30 Oil and Gas Production (combustion) 0 0 0 0.00
40 Petroleum Refining (Combustion) 0 0 0 0.00
50 Manufacturing and Industrial 0.3 18391.5 0 0.02
52 Food and Agricultural Processing 0.0 1.4 0 0.00
60 Service and Commercial 0.6 35078.3 0 0.04
99 Other (Fuel Combustion) 0.0 639.1 0 0.00
Total Fuel Combustion 0.9 54110.3 0 0.05
110 Sewage Treatment 0 0 0 0.00
120 Landfills 0 0 0 0.00
130 Incineration 0 0 0 0.00
199 Other (Waste Disposal) 0 0 0 0.00
Total Waste Disposal 0 0 0 0.00
210 Laundering 0 0 0 0.00
220 Degreasing 0 0 0 0.00
230 Coatings and Related Processes 0.1 0 0 0.00
240 Printing 0 0 0 0.00
250 Adhesives and Sealants 0 0 0 0.00
299 Other (Cleaning and Surface Coatings) 0.3 0 0 0.00
Total Cleaning and Surface Coatings 0.4 0 0 0.00
310 Oil and Gas Production 0 0 0 0.00
320 Petroleum Refining 0 0 0 0.00
330 Petroleum Marketing 2.3 0 0 0.00
399 Other (Petroleum Production and Marketing) 0 0 0 0.00
Total Petroleum Production and Marketing 2.3 0 0 0.00
410 Chemical 7.9 0 0 0.00
420 Food and Agriculture 0 0 0 0.00
430 Mineral Processes 0 0 0 0.00
440 Metal Processes 0 0 0 0.00
450 Wood and Paper 0 0 0 0.00
460 Glass and Related Products 0 0 0 0.00
470 Electronics 0 0 0 0.00
499 Other (Industrial Processes) 0 0 0 0.00
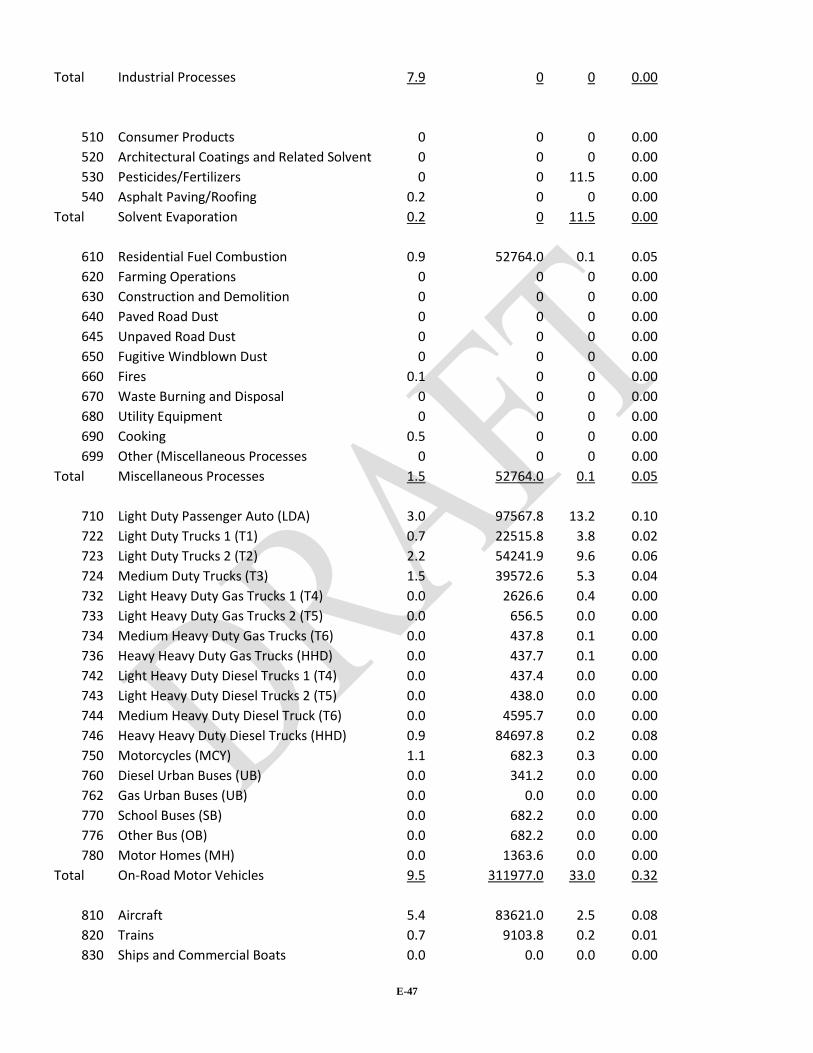
E-47
Total Industrial Processes 7.9 0 0 0.00
510 Consumer Products 0 0 0 0.00
520 Architectural Coatings and Related Solvent 0 0 0 0.00
530 Pesticides/Fertilizers 0 0 11.5 0.00
540 Asphalt Paving/Roofing 0.2 0 0 0.00
Total Solvent Evaporation 0.2 0 11.5 0.00
610 Residential Fuel Combustion 0.9 52764.0 0.1 0.05
620 Farming Operations 0 0 0 0.00
630 Construction and Demolition 0 0 0 0.00
640 Paved Road Dust 0 0 0 0.00
645 Unpaved Road Dust 0 0 0 0.00
650 Fugitive Windblown Dust 0 0 0 0.00
660 Fires 0.1 0 0 0.00
670 Waste Burning and Disposal 0 0 0 0.00
680 Utility Equipment 0 0 0 0.00
690 Cooking 0.5 0 0 0.00
699 Other (Miscellaneous Processes 0 0 0 0.00
Total Miscellaneous Processes 1.5 52764.0 0.1 0.05
710 Light Duty Passenger Auto (LDA) 3.0 97567.8 13.2 0.10
722 Light Duty Trucks 1 (T1) 0.7 22515.8 3.8 0.02
723 Light Duty Trucks 2 (T2) 2.2 54241.9 9.6 0.06
724 Medium Duty Trucks (T3) 1.5 39572.6 5.3 0.04
732 Light Heavy Duty Gas Trucks 1 (T4) 0.0 2626.6 0.4 0.00
733 Light Heavy Duty Gas Trucks 2 (T5) 0.0 656.5 0.0 0.00
734 Medium Heavy Duty Gas Trucks (T6) 0.0 437.8 0.1 0.00
736 Heavy Heavy Duty Gas Trucks (HHD) 0.0 437.7 0.1 0.00
742 Light Heavy Duty Diesel Trucks 1 (T4) 0.0 437.4 0.0 0.00
743 Light Heavy Duty Diesel Trucks 2 (T5) 0.0 438.0 0.0 0.00
744 Medium Heavy Duty Diesel Truck (T6) 0.0 4595.7 0.0 0.00
746 Heavy Heavy Duty Diesel Trucks (HHD) 0.9 84697.8 0.2 0.08
750 Motorcycles (MCY) 1.1 682.3 0.3 0.00
760 Diesel Urban Buses (UB) 0.0 341.2 0.0 0.00
762 Gas Urban Buses (UB) 0.0 0.0 0.0 0.00
770 School Buses (SB) 0.0 682.2 0.0 0.00
776 Other Bus (OB) 0.0 682.2 0.0 0.00
780 Motor Homes (MH) 0.0 1363.6 0.0 0.00
Total On-Road Motor Vehicles 9.5 311977.0 33.0 0.32
810 Aircraft 5.4 83621.0 2.5 0.08
820 Trains 0.7 9103.8 0.2 0.01
830 Ships and Commercial Boats 0.0 0.0 0.0 0.00
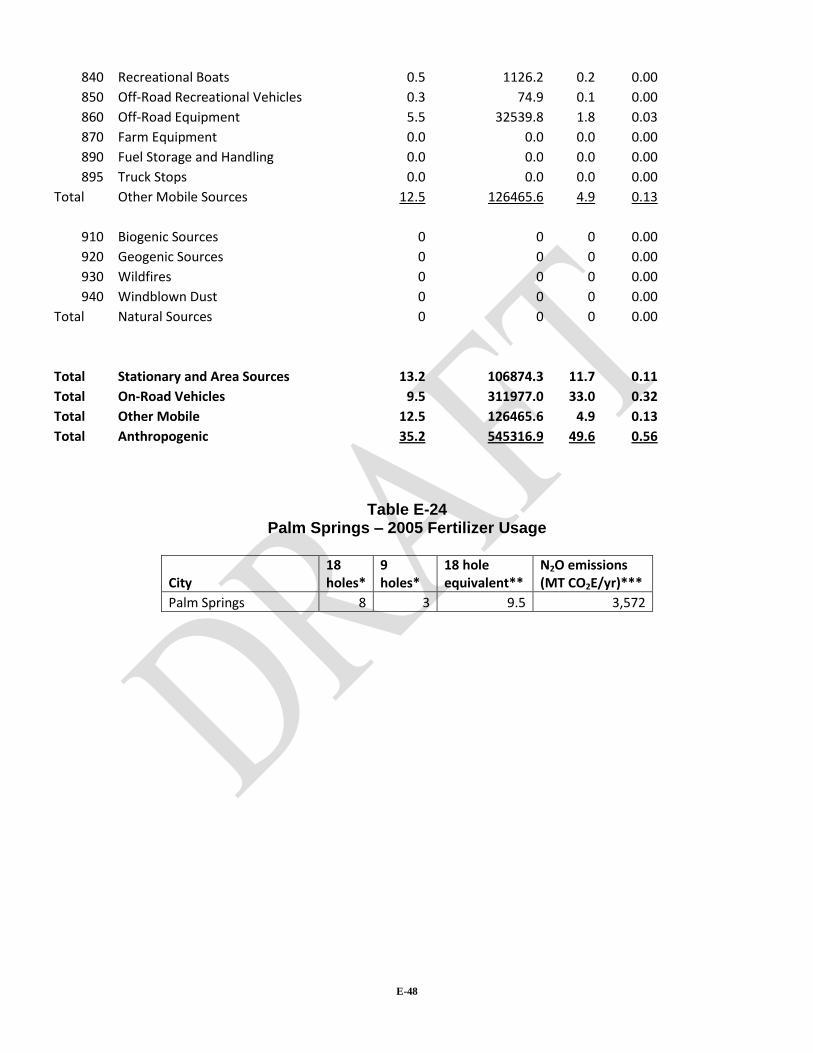
E-48
840 Recreational Boats 0.5 1126.2 0.2 0.00
850 Off-Road Recreational Vehicles 0.3 74.9 0.1 0.00
860 Off-Road Equipment 5.5 32539.8 1.8 0.03
870 Farm Equipment 0.0 0.0 0.0 0.00
890 Fuel Storage and Handling 0.0 0.0 0.0 0.00
895 Truck Stops 0.0 0.0 0.0 0.00
Total Other Mobile Sources 12.5 126465.6 4.9 0.13
910 Biogenic Sources 0 0 0 0.00
920 Geogenic Sources 0 0 0 0.00
930 Wildfires 0 0 0 0.00
940 Windblown Dust 0 0 0 0.00
Total Natural Sources 0 0 0 0.00
Total Stationary and Area Sources 13.2 106874.3 11.7 0.11
Total On-Road Vehicles 9.5 311977.0 33.0 0.32
Total Other Mobile 12.5 126465.6 4.9 0.13
Total Anthropogenic 35.2 545316.9 49.6 0.56
Table E-24 Palm Springs – 2005 Fertilizer Usage
City 18 holes*
9 holes*
18 hole equivalent**
N2O emissions (MT CO2E/yr)***
Palm Springs 8 3 9.5 3,572
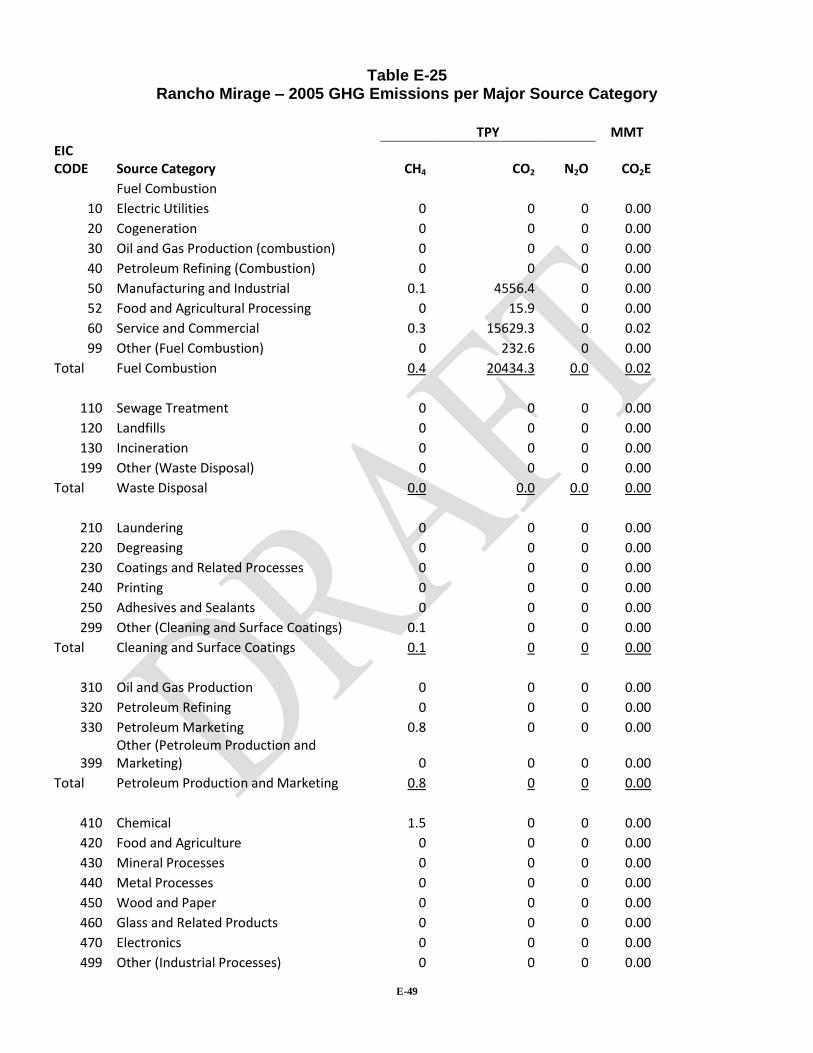
E-49
Table E-25 Rancho Mirage – 2005 GHG Emissions per Major Source Category
TPY MMT
EIC CODE Source Category CH4 CO2 N2O CO2E
Fuel Combustion
10 Electric Utilities 0 0 0 0.00
20 Cogeneration 0 0 0 0.00
30 Oil and Gas Production (combustion) 0 0 0 0.00
40 Petroleum Refining (Combustion) 0 0 0 0.00
50 Manufacturing and Industrial 0.1 4556.4 0 0.00
52 Food and Agricultural Processing 0 15.9 0 0.00
60 Service and Commercial 0.3 15629.3 0 0.02
99 Other (Fuel Combustion) 0 232.6 0 0.00
Total Fuel Combustion 0.4 20434.3 0.0 0.02
110 Sewage Treatment 0 0 0 0.00
120 Landfills 0 0 0 0.00
130 Incineration 0 0 0 0.00
199 Other (Waste Disposal) 0 0 0 0.00
Total Waste Disposal 0.0 0.0 0.0 0.00
210 Laundering 0 0 0 0.00
220 Degreasing 0 0 0 0.00
230 Coatings and Related Processes 0 0 0 0.00
240 Printing 0 0 0 0.00
250 Adhesives and Sealants 0 0 0 0.00
299 Other (Cleaning and Surface Coatings) 0.1 0 0 0.00
Total Cleaning and Surface Coatings 0.1 0 0 0.00
310 Oil and Gas Production 0 0 0 0.00
320 Petroleum Refining 0 0 0 0.00
330 Petroleum Marketing 0.8 0 0 0.00
399 Other (Petroleum Production and Marketing) 0 0 0 0.00
Total Petroleum Production and Marketing 0.8 0 0 0.00
410 Chemical 1.5 0 0 0.00
420 Food and Agriculture 0 0 0 0.00
430 Mineral Processes 0 0 0 0.00
440 Metal Processes 0 0 0 0.00
450 Wood and Paper 0 0 0 0.00
460 Glass and Related Products 0 0 0 0.00
470 Electronics 0 0 0 0.00
499 Other (Industrial Processes) 0 0 0 0.00
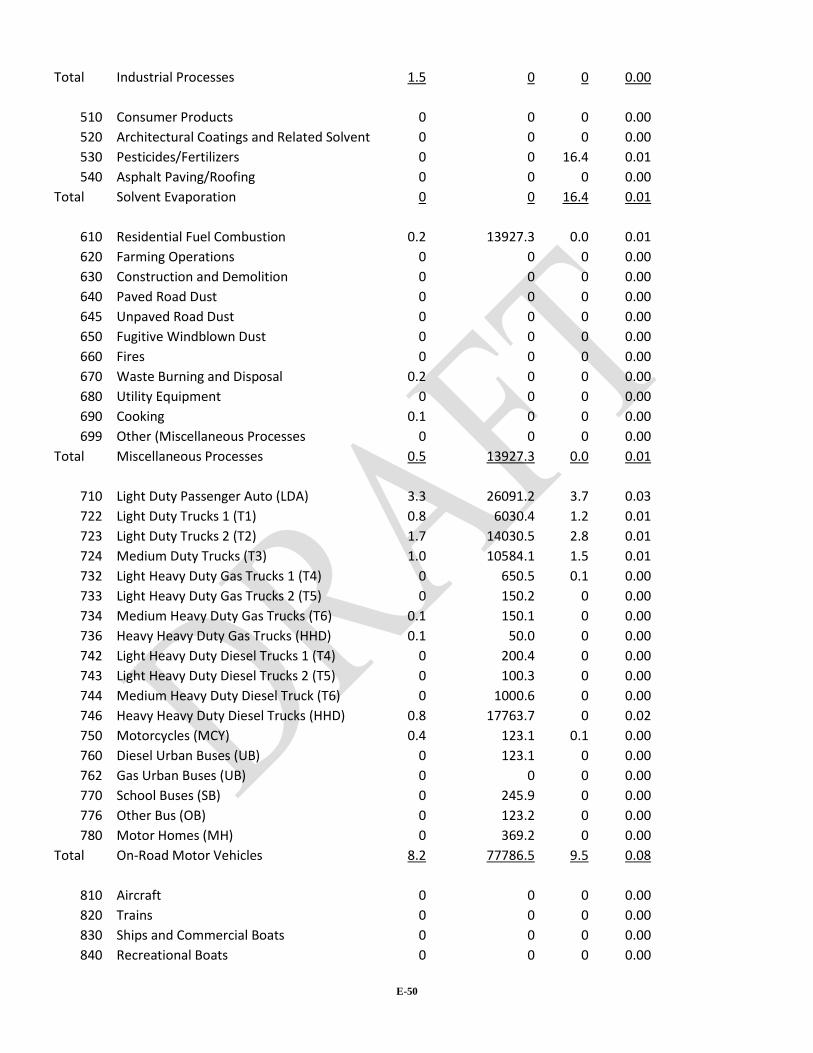
E-50
Total Industrial Processes 1.5 0 0 0.00
510 Consumer Products 0 0 0 0.00
520 Architectural Coatings and Related Solvent 0 0 0 0.00
530 Pesticides/Fertilizers 0 0 16.4 0.01
540 Asphalt Paving/Roofing 0 0 0 0.00
Total Solvent Evaporation 0 0 16.4 0.01
610 Residential Fuel Combustion 0.2 13927.3 0.0 0.01
620 Farming Operations 0 0 0 0.00
630 Construction and Demolition 0 0 0 0.00
640 Paved Road Dust 0 0 0 0.00
645 Unpaved Road Dust 0 0 0 0.00
650 Fugitive Windblown Dust 0 0 0 0.00
660 Fires 0 0 0 0.00
670 Waste Burning and Disposal 0.2 0 0 0.00
680 Utility Equipment 0 0 0 0.00
690 Cooking 0.1 0 0 0.00
699 Other (Miscellaneous Processes 0 0 0 0.00
Total Miscellaneous Processes 0.5 13927.3 0.0 0.01
710 Light Duty Passenger Auto (LDA) 3.3 26091.2 3.7 0.03
722 Light Duty Trucks 1 (T1) 0.8 6030.4 1.2 0.01
723 Light Duty Trucks 2 (T2) 1.7 14030.5 2.8 0.01
724 Medium Duty Trucks (T3) 1.0 10584.1 1.5 0.01
732 Light Heavy Duty Gas Trucks 1 (T4) 0 650.5 0.1 0.00
733 Light Heavy Duty Gas Trucks 2 (T5) 0 150.2 0 0.00
734 Medium Heavy Duty Gas Trucks (T6) 0.1 150.1 0 0.00
736 Heavy Heavy Duty Gas Trucks (HHD) 0.1 50.0 0 0.00
742 Light Heavy Duty Diesel Trucks 1 (T4) 0 200.4 0 0.00
743 Light Heavy Duty Diesel Trucks 2 (T5) 0 100.3 0 0.00
744 Medium Heavy Duty Diesel Truck (T6) 0 1000.6 0 0.00
746 Heavy Heavy Duty Diesel Trucks (HHD) 0.8 17763.7 0 0.02
750 Motorcycles (MCY) 0.4 123.1 0.1 0.00
760 Diesel Urban Buses (UB) 0 123.1 0 0.00
762 Gas Urban Buses (UB) 0 0 0 0.00
770 School Buses (SB) 0 245.9 0 0.00
776 Other Bus (OB) 0 123.2 0 0.00
780 Motor Homes (MH) 0 369.2 0 0.00
Total On-Road Motor Vehicles 8.2 77786.5 9.5 0.08
810 Aircraft 0 0 0 0.00
820 Trains 0 0 0 0.00
830 Ships and Commercial Boats 0 0 0 0.00
840 Recreational Boats 0 0 0 0.00

E-51
850 Off-Road Recreational Vehicles 0.1 16.4 0 0.00
860 Off-Road Equipment 3.2 8089.0 0.5 0.01
870 Farm Equipment 0.1 484.1 0 0.00
890 Fuel Storage and Handling 0 0 0 0.00
895 Truck Stops 0 0 0 0.00
Total Other Mobile Sources 3.3 8589.5 0.6 0.01
910 Biogenic Sources 0 0 0 0.00
920 Geogenic Sources 0 0 0 0.00
930 Wildfires 0 0 0 0.00
940 Windblown Dust 0 0 0 0.00
Total Natural Sources 0 0 0 0.00
Total Stationary and Area Sources 3.3 34361.6 16.4 0.04
Total On-Road Vehicles 8.2 77786.5 9.5 0.08
Total Other Mobile 3.3 8589.5 0.6 0.01
Total Anthropogenic 14.8 120737.6 26.5 0.13
Fuel Combustion -Commercial
15%
Fuel Combustion -Residential
8%
Transportation -Passenger Cars &
Trucks46%
Transportation -Heavy Duty
Diesel Trucks15%
Other Mobile Sources8%
Pesticides & Fertilizers8%
Rancho Mirage – 2005 GHG Emissions per Major Source Category
Fuel Combustion -
Industrial
Fuel Combustion -Commercial
Fuel Combustion -Residential
Transportation -Passenger Cars &TrucksTransportation - Heavy
Duty Diesel Trucks
Other Mobile Sources
Pesticides & Fertilizers
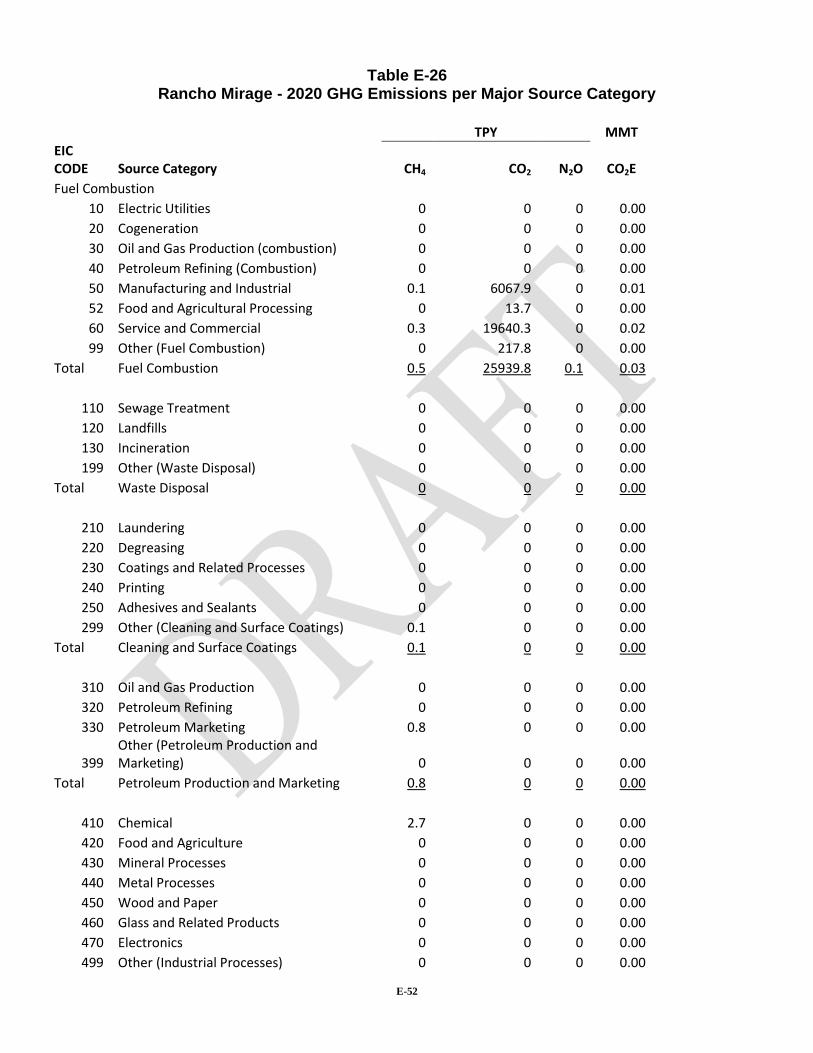
E-52
Table E-26 Rancho Mirage - 2020 GHG Emissions per Major Source Category
TPY MMT
EIC CODE Source Category CH4 CO2 N2O CO2E
Fuel Combustion
10 Electric Utilities 0 0 0 0.00
20 Cogeneration 0 0 0 0.00
30 Oil and Gas Production (combustion) 0 0 0 0.00
40 Petroleum Refining (Combustion) 0 0 0 0.00
50 Manufacturing and Industrial 0.1 6067.9 0 0.01
52 Food and Agricultural Processing 0 13.7 0 0.00
60 Service and Commercial 0.3 19640.3 0 0.02
99 Other (Fuel Combustion) 0 217.8 0 0.00
Total Fuel Combustion 0.5 25939.8 0.1 0.03
110 Sewage Treatment 0 0 0 0.00
120 Landfills 0 0 0 0.00
130 Incineration 0 0 0 0.00
199 Other (Waste Disposal) 0 0 0 0.00
Total Waste Disposal 0 0 0 0.00
210 Laundering 0 0 0 0.00
220 Degreasing 0 0 0 0.00
230 Coatings and Related Processes 0 0 0 0.00
240 Printing 0 0 0 0.00
250 Adhesives and Sealants 0 0 0 0.00
299 Other (Cleaning and Surface Coatings) 0.1 0 0 0.00
Total Cleaning and Surface Coatings 0.1 0 0 0.00
310 Oil and Gas Production 0 0 0 0.00
320 Petroleum Refining 0 0 0 0.00
330 Petroleum Marketing 0.8 0 0 0.00
399 Other (Petroleum Production and Marketing) 0 0 0 0.00
Total Petroleum Production and Marketing 0.8 0 0 0.00
410 Chemical 2.7 0 0 0.00
420 Food and Agriculture 0 0 0 0.00
430 Mineral Processes 0 0 0 0.00
440 Metal Processes 0 0 0 0.00
450 Wood and Paper 0 0 0 0.00
460 Glass and Related Products 0 0 0 0.00
470 Electronics 0 0 0 0.00
499 Other (Industrial Processes) 0 0 0 0.00
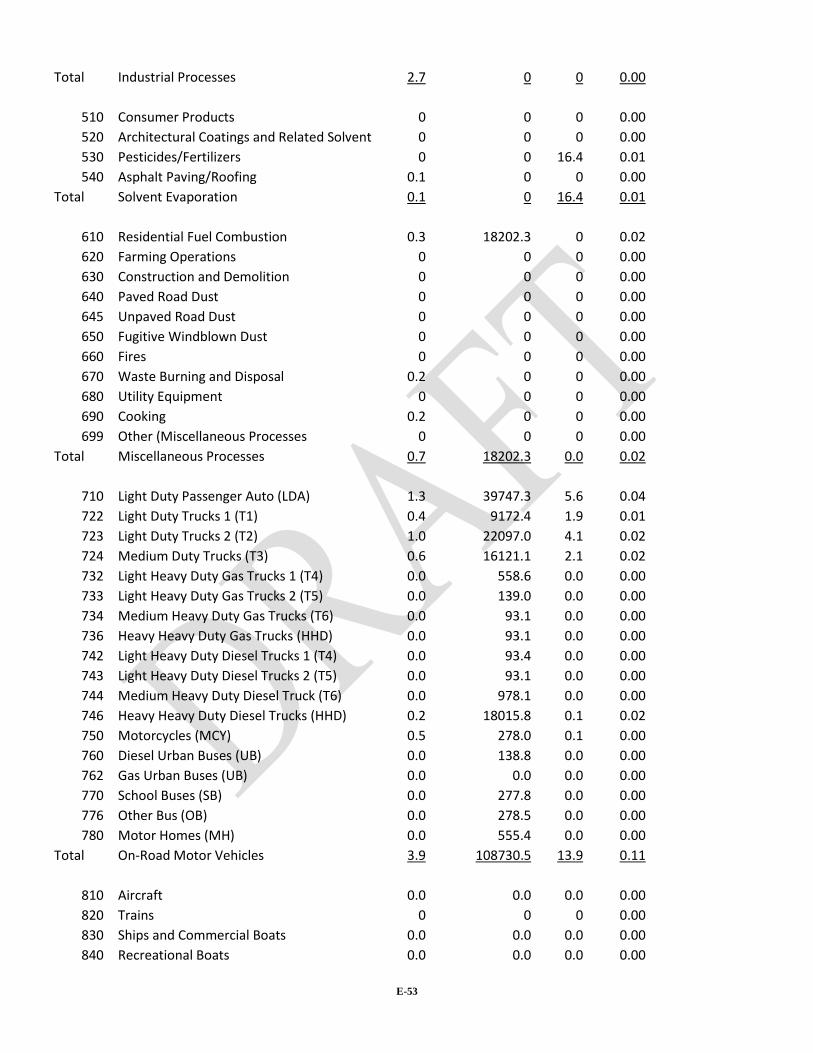
E-53
Total Industrial Processes 2.7 0 0 0.00
510 Consumer Products 0 0 0 0.00
520 Architectural Coatings and Related Solvent 0 0 0 0.00
530 Pesticides/Fertilizers 0 0 16.4 0.01
540 Asphalt Paving/Roofing 0.1 0 0 0.00
Total Solvent Evaporation 0.1 0 16.4 0.01
610 Residential Fuel Combustion 0.3 18202.3 0 0.02
620 Farming Operations 0 0 0 0.00
630 Construction and Demolition 0 0 0 0.00
640 Paved Road Dust 0 0 0 0.00
645 Unpaved Road Dust 0 0 0 0.00
650 Fugitive Windblown Dust 0 0 0 0.00
660 Fires 0 0 0 0.00
670 Waste Burning and Disposal 0.2 0 0 0.00
680 Utility Equipment 0 0 0 0.00
690 Cooking 0.2 0 0 0.00
699 Other (Miscellaneous Processes 0 0 0 0.00
Total Miscellaneous Processes 0.7 18202.3 0.0 0.02
710 Light Duty Passenger Auto (LDA) 1.3 39747.3 5.6 0.04
722 Light Duty Trucks 1 (T1) 0.4 9172.4 1.9 0.01
723 Light Duty Trucks 2 (T2) 1.0 22097.0 4.1 0.02
724 Medium Duty Trucks (T3) 0.6 16121.1 2.1 0.02
732 Light Heavy Duty Gas Trucks 1 (T4) 0.0 558.6 0.0 0.00
733 Light Heavy Duty Gas Trucks 2 (T5) 0.0 139.0 0.0 0.00
734 Medium Heavy Duty Gas Trucks (T6) 0.0 93.1 0.0 0.00
736 Heavy Heavy Duty Gas Trucks (HHD) 0.0 93.1 0.0 0.00
742 Light Heavy Duty Diesel Trucks 1 (T4) 0.0 93.4 0.0 0.00
743 Light Heavy Duty Diesel Trucks 2 (T5) 0.0 93.1 0.0 0.00
744 Medium Heavy Duty Diesel Truck (T6) 0.0 978.1 0.0 0.00
746 Heavy Heavy Duty Diesel Trucks (HHD) 0.2 18015.8 0.1 0.02
750 Motorcycles (MCY) 0.5 278.0 0.1 0.00
760 Diesel Urban Buses (UB) 0.0 138.8 0.0 0.00
762 Gas Urban Buses (UB) 0.0 0.0 0.0 0.00
770 School Buses (SB) 0.0 277.8 0.0 0.00
776 Other Bus (OB) 0.0 278.5 0.0 0.00
780 Motor Homes (MH) 0.0 555.4 0.0 0.00
Total On-Road Motor Vehicles 3.9 108730.5 13.9 0.11
810 Aircraft 0.0 0.0 0.0 0.00
820 Trains 0 0 0 0.00
830 Ships and Commercial Boats 0.0 0.0 0.0 0.00
840 Recreational Boats 0.0 0.0 0.0 0.00
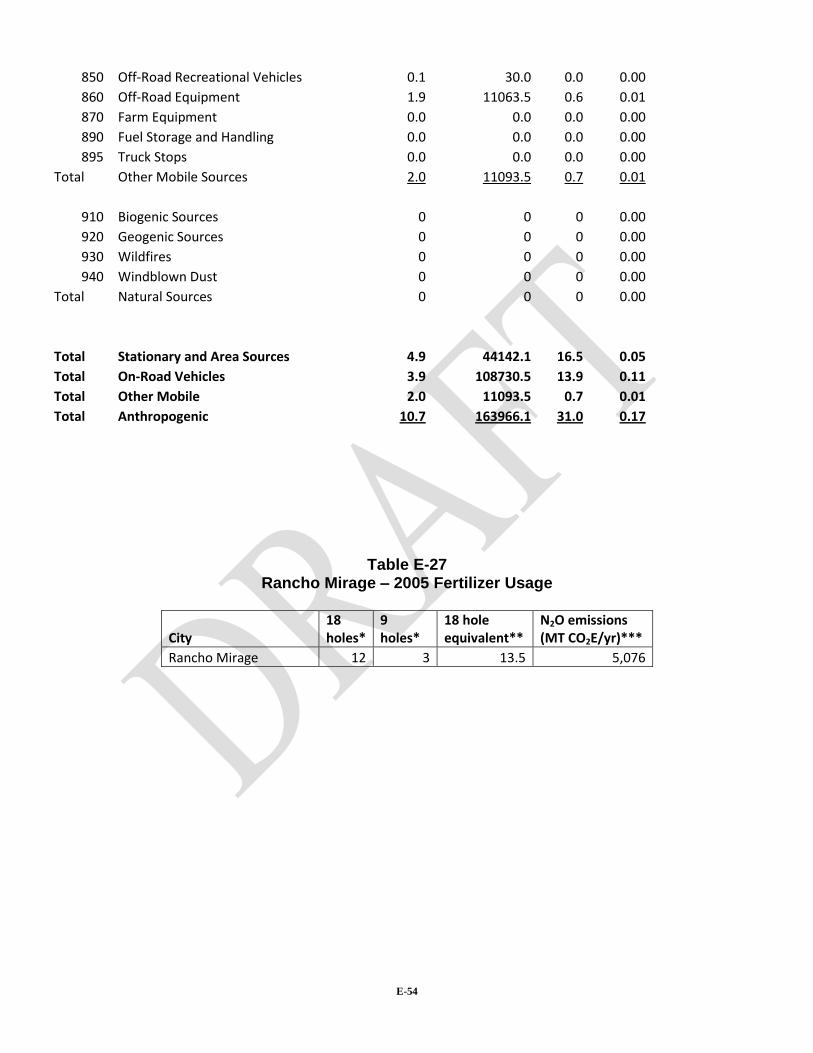
E-54
850 Off-Road Recreational Vehicles 0.1 30.0 0.0 0.00
860 Off-Road Equipment 1.9 11063.5 0.6 0.01
870 Farm Equipment 0.0 0.0 0.0 0.00
890 Fuel Storage and Handling 0.0 0.0 0.0 0.00
895 Truck Stops 0.0 0.0 0.0 0.00
Total Other Mobile Sources 2.0 11093.5 0.7 0.01
910 Biogenic Sources 0 0 0 0.00
920 Geogenic Sources 0 0 0 0.00
930 Wildfires 0 0 0 0.00
940 Windblown Dust 0 0 0 0.00
Total Natural Sources 0 0 0 0.00
Total Stationary and Area Sources 4.9 44142.1 16.5 0.05
Total On-Road Vehicles 3.9 108730.5 13.9 0.11
Total Other Mobile 2.0 11093.5 0.7 0.01
Total Anthropogenic 10.7 163966.1 31.0 0.17
Table E-27 Rancho Mirage – 2005 Fertilizer Usage
City 18 holes*
9 holes*
18 hole equivalent**
N2O emissions (MT CO2E/yr)***
Rancho Mirage 12 3 13.5 5,076
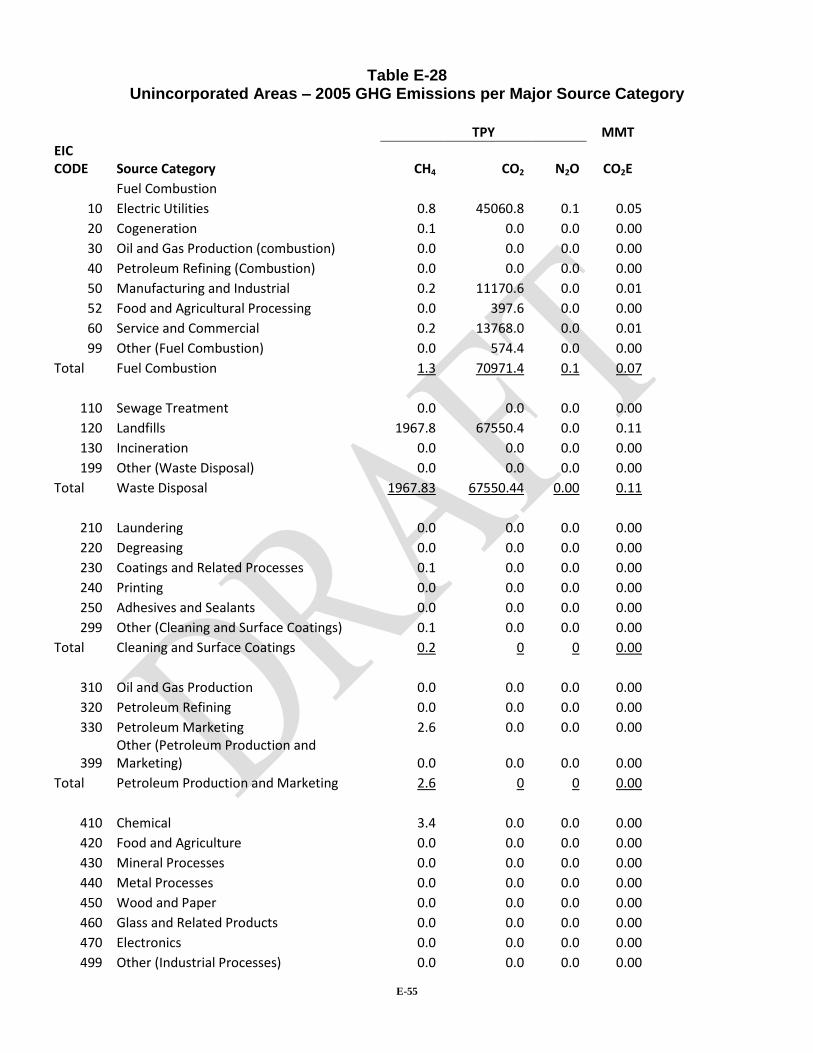
E-55
Table E-28 Unincorporated Areas – 2005 GHG Emissions per Major Source Category
TPY MMT
EIC CODE Source Category CH4 CO2 N2O CO2E
Fuel Combustion
10 Electric Utilities 0.8 45060.8 0.1 0.05
20 Cogeneration 0.1 0.0 0.0 0.00
30 Oil and Gas Production (combustion) 0.0 0.0 0.0 0.00
40 Petroleum Refining (Combustion) 0.0 0.0 0.0 0.00
50 Manufacturing and Industrial 0.2 11170.6 0.0 0.01
52 Food and Agricultural Processing 0.0 397.6 0.0 0.00
60 Service and Commercial 0.2 13768.0 0.0 0.01
99 Other (Fuel Combustion) 0.0 574.4 0.0 0.00
Total Fuel Combustion 1.3 70971.4 0.1 0.07
110 Sewage Treatment 0.0 0.0 0.0 0.00
120 Landfills 1967.8 67550.4 0.0 0.11
130 Incineration 0.0 0.0 0.0 0.00
199 Other (Waste Disposal) 0.0 0.0 0.0 0.00
Total Waste Disposal 1967.83 67550.44 0.00 0.11
210 Laundering 0.0 0.0 0.0 0.00
220 Degreasing 0.0 0.0 0.0 0.00
230 Coatings and Related Processes 0.1 0.0 0.0 0.00
240 Printing 0.0 0.0 0.0 0.00
250 Adhesives and Sealants 0.0 0.0 0.0 0.00
299 Other (Cleaning and Surface Coatings) 0.1 0.0 0.0 0.00
Total Cleaning and Surface Coatings 0.2 0 0 0.00
310 Oil and Gas Production 0.0 0.0 0.0 0.00
320 Petroleum Refining 0.0 0.0 0.0 0.00
330 Petroleum Marketing 2.6 0.0 0.0 0.00
399 Other (Petroleum Production and Marketing) 0.0 0.0 0.0 0.00
Total Petroleum Production and Marketing 2.6 0 0 0.00
410 Chemical 3.4 0.0 0.0 0.00
420 Food and Agriculture 0.0 0.0 0.0 0.00
430 Mineral Processes 0.0 0.0 0.0 0.00
440 Metal Processes 0.0 0.0 0.0 0.00
450 Wood and Paper 0.0 0.0 0.0 0.00
460 Glass and Related Products 0.0 0.0 0.0 0.00
470 Electronics 0.0 0.0 0.0 0.00
499 Other (Industrial Processes) 0.0 0.0 0.0 0.00

E-56
Total Industrial Processes 3.4 0 0 0.00
510 Consumer Products 0.0 0.0 0.0 0.00
520 Architectural Coatings and Related Solvent 0.0 0.0 0.0 0.00
530 Pesticides/Fertilizers 0.0 0.0 4.2 0.00
540 Asphalt Paving/Roofing 0.1 0.0 0.0 0.00
Total Solvent Evaporation 0.1 0.0 4.2 0.00
610 Residential Fuel Combustion 1.2 70186.2 0.1 0.07
620 Farming Operations 198.0 0.0 0.0 0.00
630 Construction and Demolition 0.0 0.0 0.0 0.00
640 Paved Road Dust 0.0 0.0 0.0 0.00
645 Unpaved Road Dust 0.0 0.0 0.0 0.00
650 Fugitive Windblown Dust 0.0 0.0 0.0 0.00
660 Fires 0.4 0.0 0.0 0.00
670 Waste Burning and Disposal 4.7 0.0 0.0 0.00
680 Utility Equipment 0.0 0.0 0.0 0.00
690 Cooking 0.4 0.0 0.0 0.00
699 Other (Miscellaneous Processes 0.0 0.0 0.0 0.00
Total Miscellaneous Processes 204.7 70186.2 0.1 0.07
710 Light Duty Passenger Auto (LDA) 28.95 380481.58 32.86 0.39
722 Light Duty Trucks 1 (T1) 6.48 87942.52 9.92 0.09
723 Light Duty Trucks 2 (T2) 14.28 204597.73 24.29 0.21
724 Medium Duty Trucks (T3) 9.24 154347.03 13.62 0.16
732 Light Heavy Duty Gas Trucks 1 (T4) 2.28 30361.33 3.28 0.03
733 Light Heavy Duty Gas Trucks 2 (T5) 0.00 7006.47 0.80 0.01
734 Medium Heavy Duty Gas Trucks (T6) 4.49 7006.67 0.76 0.01
736 Heavy Heavy Duty Gas Trucks (HHD) 2.28 2335.49 0.54 0.00
742 Light Heavy Duty Diesel Trucks 1 (T4) 0.00 9341.71 0.04 0.01
743 Light Heavy Duty Diesel Trucks 2 (T5) 0.00 4670.96 0.02 0.00
744 Medium Heavy Duty Diesel Truck (T6) 0.00 46709.55 0.15 0.05
746 Heavy Heavy Duty Diesel Trucks (HHD) 34.39 829102.29 2.11 0.83
750 Motorcycles (MCY) 3.98 1794.76 0.84 0.00
760 Diesel Urban Buses (UB) 0.00 1794.25 0.01 0.00
762 Gas Urban Buses (UB) 0.00 0.00 0.08 0.00
770 School Buses (SB) 0.00 3590.18 0.05 0.00
776 Other Bus (OB) 0.00 1795.30 0.18 0.00
780 Motor Homes (MH) 0.00 5385.46 0.34 0.01
Total On-Road Motor Vehicles 106.38 1778263.3 89.88 1.81
810 Aircraft 1.07 12978.00 0.38 0.01
820 Trains 4.68 59725.50 1.50 0.06
830 Ships and Commercial Boats 0.00 0.00 0.00 0.00
840 Recreational Boats 9.91 7941.34 1.96 0.01
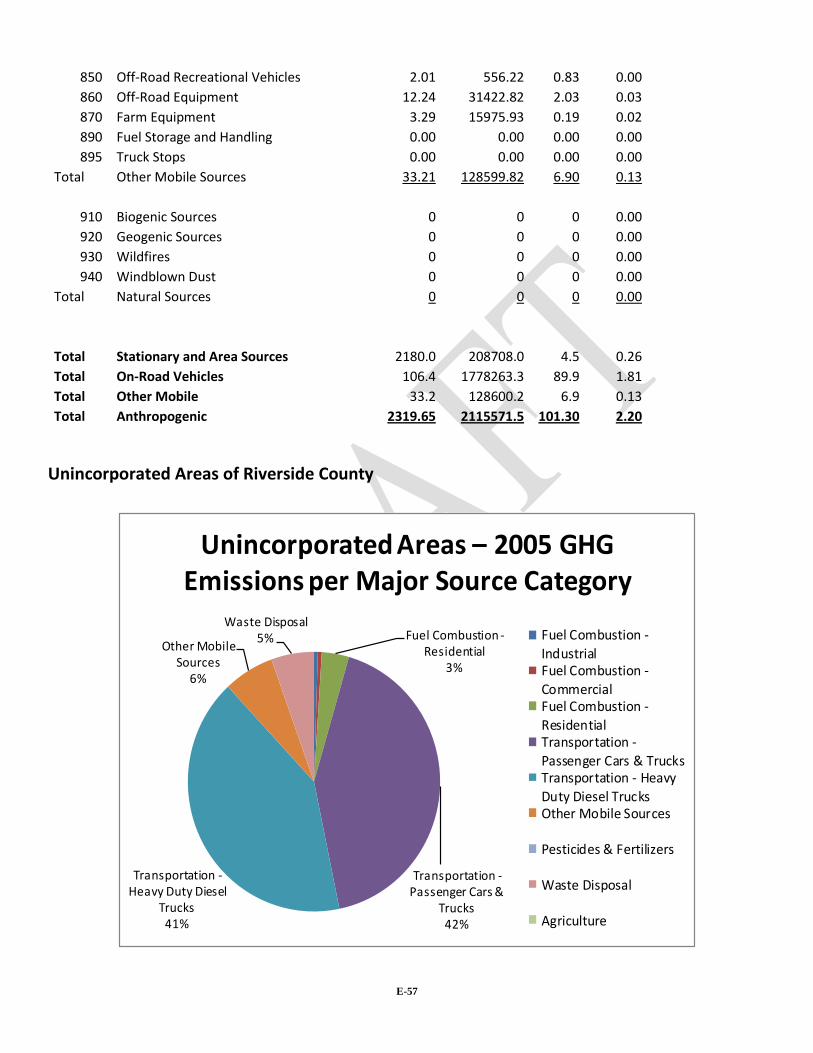
E-57
850 Off-Road Recreational Vehicles 2.01 556.22 0.83 0.00
860 Off-Road Equipment 12.24 31422.82 2.03 0.03
870 Farm Equipment 3.29 15975.93 0.19 0.02
890 Fuel Storage and Handling 0.00 0.00 0.00 0.00
895 Truck Stops 0.00 0.00 0.00 0.00
Total Other Mobile Sources 33.21 128599.82 6.90 0.13
910 Biogenic Sources 0 0 0 0.00
920 Geogenic Sources 0 0 0 0.00
930 Wildfires 0 0 0 0.00
940 Windblown Dust 0 0 0 0.00
Total Natural Sources 0 0 0 0.00
Total Stationary and Area Sources 2180.0 208708.0 4.5 0.26
Total On-Road Vehicles 106.4 1778263.3 89.9 1.81
Total Other Mobile 33.2 128600.2 6.9 0.13
Total Anthropogenic 2319.65 2115571.5 101.30 2.20
Unincorporated Areas of Riverside County
Fuel Combustion -Residential
3%
Transportation -Passenger Cars &
Trucks42%
Transportation -Heavy Duty Diesel
Trucks41%
Other Mobile Sources
6%
Waste Disposal5%
Unincorporated Areas – 2005 GHG Emissions per Major Source Category
Fuel Combustion -
IndustrialFuel Combustion -
CommercialFuel Combustion -
ResidentialTransportation -
Passenger Cars & TrucksTransportation - Heavy
Duty Diesel TrucksOther Mobile Sources
Pesticides & Fertilizers
Waste Disposal
Agriculture
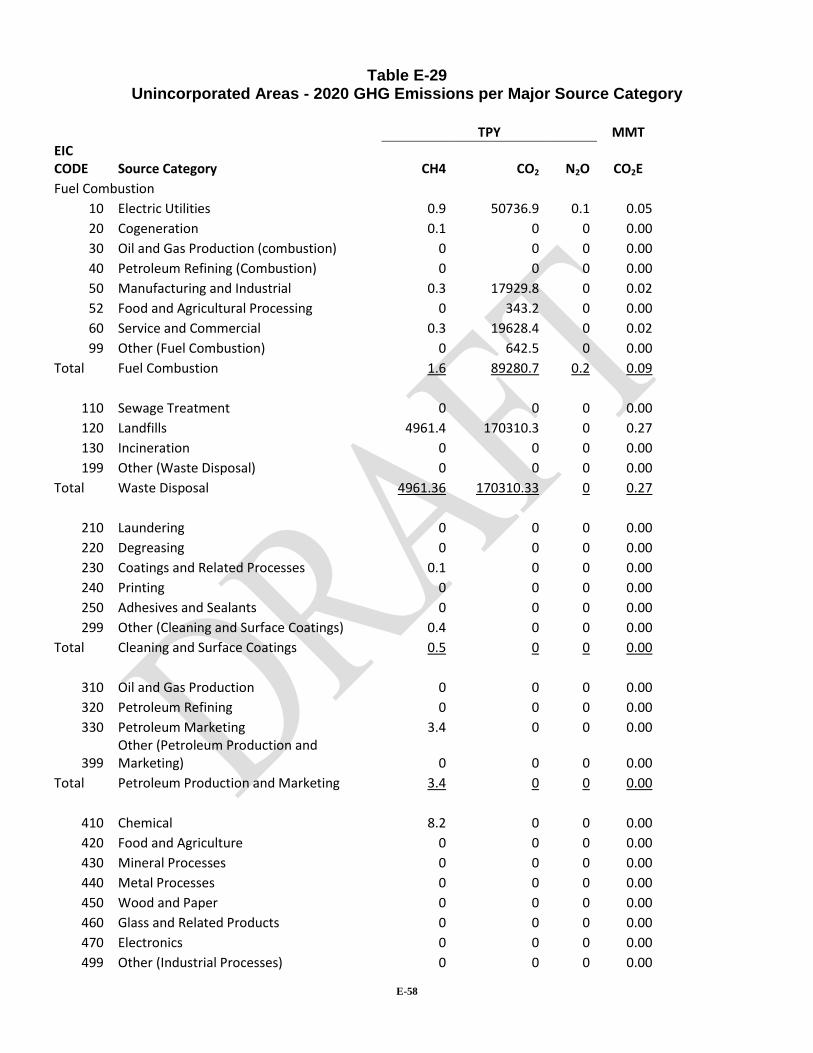
E-58
Table E-29 Unincorporated Areas - 2020 GHG Emissions per Major Source Category
TPY MMT
EIC CODE Source Category CH4 CO2 N2O CO2E
Fuel Combustion
10 Electric Utilities 0.9 50736.9 0.1 0.05
20 Cogeneration 0.1 0 0 0.00
30 Oil and Gas Production (combustion) 0 0 0 0.00
40 Petroleum Refining (Combustion) 0 0 0 0.00
50 Manufacturing and Industrial 0.3 17929.8 0 0.02
52 Food and Agricultural Processing 0 343.2 0 0.00
60 Service and Commercial 0.3 19628.4 0 0.02
99 Other (Fuel Combustion) 0 642.5 0 0.00
Total Fuel Combustion 1.6 89280.7 0.2 0.09
110 Sewage Treatment 0 0 0 0.00
120 Landfills 4961.4 170310.3 0 0.27
130 Incineration 0 0 0 0.00
199 Other (Waste Disposal) 0 0 0 0.00
Total Waste Disposal 4961.36 170310.33 0 0.27
210 Laundering 0 0 0 0.00
220 Degreasing 0 0 0 0.00
230 Coatings and Related Processes 0.1 0 0 0.00
240 Printing 0 0 0 0.00
250 Adhesives and Sealants 0 0 0 0.00
299 Other (Cleaning and Surface Coatings) 0.4 0 0 0.00
Total Cleaning and Surface Coatings 0.5 0 0 0.00
310 Oil and Gas Production 0 0 0 0.00
320 Petroleum Refining 0 0 0 0.00
330 Petroleum Marketing 3.4 0 0 0.00
399 Other (Petroleum Production and Marketing) 0 0 0 0.00
Total Petroleum Production and Marketing 3.4 0 0 0.00
410 Chemical 8.2 0 0 0.00
420 Food and Agriculture 0 0 0 0.00
430 Mineral Processes 0 0 0 0.00
440 Metal Processes 0 0 0 0.00
450 Wood and Paper 0 0 0 0.00
460 Glass and Related Products 0 0 0 0.00
470 Electronics 0 0 0 0.00
499 Other (Industrial Processes) 0 0 0 0.00
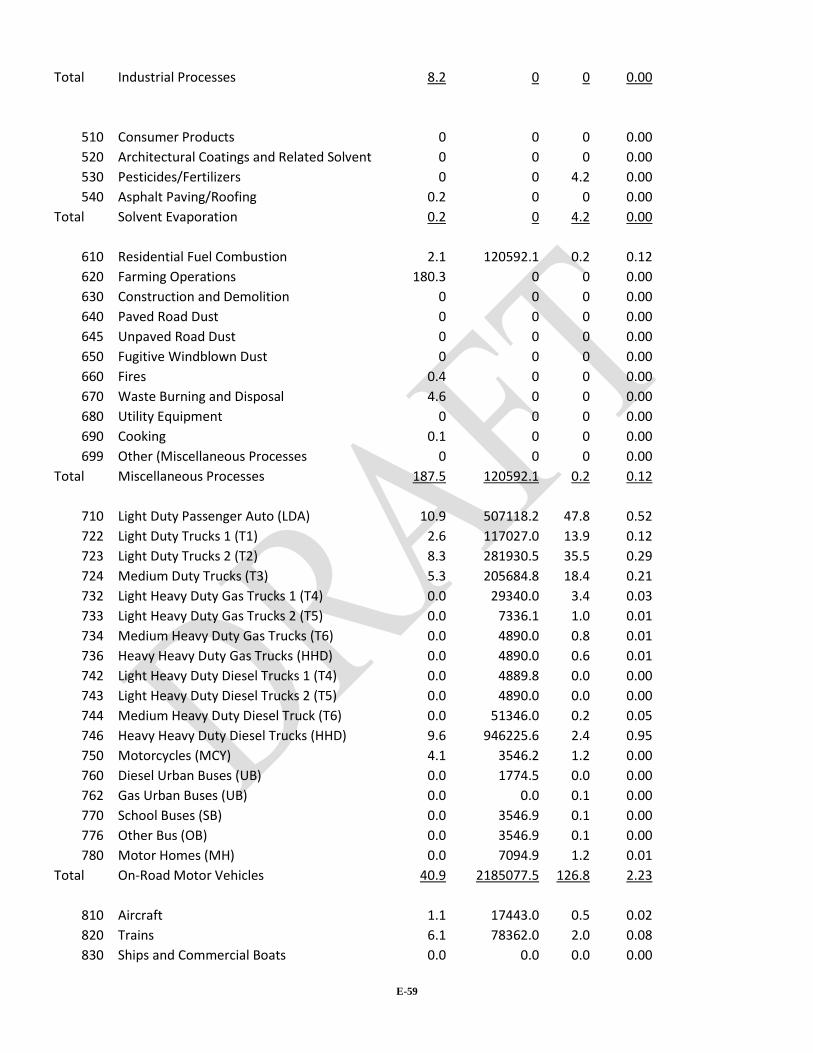
E-59
Total Industrial Processes 8.2 0 0 0.00
510 Consumer Products 0 0 0 0.00
520 Architectural Coatings and Related Solvent 0 0 0 0.00
530 Pesticides/Fertilizers 0 0 4.2 0.00
540 Asphalt Paving/Roofing 0.2 0 0 0.00
Total Solvent Evaporation 0.2 0 4.2 0.00
610 Residential Fuel Combustion 2.1 120592.1 0.2 0.12
620 Farming Operations 180.3 0 0 0.00
630 Construction and Demolition 0 0 0 0.00
640 Paved Road Dust 0 0 0 0.00
645 Unpaved Road Dust 0 0 0 0.00
650 Fugitive Windblown Dust 0 0 0 0.00
660 Fires 0.4 0 0 0.00
670 Waste Burning and Disposal 4.6 0 0 0.00
680 Utility Equipment 0 0 0 0.00
690 Cooking 0.1 0 0 0.00
699 Other (Miscellaneous Processes 0 0 0 0.00
Total Miscellaneous Processes 187.5 120592.1 0.2 0.12
710 Light Duty Passenger Auto (LDA) 10.9 507118.2 47.8 0.52
722 Light Duty Trucks 1 (T1) 2.6 117027.0 13.9 0.12
723 Light Duty Trucks 2 (T2) 8.3 281930.5 35.5 0.29
724 Medium Duty Trucks (T3) 5.3 205684.8 18.4 0.21
732 Light Heavy Duty Gas Trucks 1 (T4) 0.0 29340.0 3.4 0.03
733 Light Heavy Duty Gas Trucks 2 (T5) 0.0 7336.1 1.0 0.01
734 Medium Heavy Duty Gas Trucks (T6) 0.0 4890.0 0.8 0.01
736 Heavy Heavy Duty Gas Trucks (HHD) 0.0 4890.0 0.6 0.01
742 Light Heavy Duty Diesel Trucks 1 (T4) 0.0 4889.8 0.0 0.00
743 Light Heavy Duty Diesel Trucks 2 (T5) 0.0 4890.0 0.0 0.00
744 Medium Heavy Duty Diesel Truck (T6) 0.0 51346.0 0.2 0.05
746 Heavy Heavy Duty Diesel Trucks (HHD) 9.6 946225.6 2.4 0.95
750 Motorcycles (MCY) 4.1 3546.2 1.2 0.00
760 Diesel Urban Buses (UB) 0.0 1774.5 0.0 0.00
762 Gas Urban Buses (UB) 0.0 0.0 0.1 0.00
770 School Buses (SB) 0.0 3546.9 0.1 0.00
776 Other Bus (OB) 0.0 3546.9 0.1 0.00
780 Motor Homes (MH) 0.0 7094.9 1.2 0.01
Total On-Road Motor Vehicles 40.9 2185077.5 126.8 2.23
810 Aircraft 1.1 17443.0 0.5 0.02
820 Trains 6.1 78362.0 2.0 0.08
830 Ships and Commercial Boats 0.0 0.0 0.0 0.00

E-60
840 Recreational Boats 5.9 12200.0 2.4 0.01
850 Off-Road Recreational Vehicles 2.3 674.0 1.1 0.00
860 Off-Road Equipment 9.9 58571.7 3.3 0.06
870 Farm Equipment 1.0 15331.4 0.1 0.02
890 Fuel Storage and Handling 0.0 0.0 0.0 0.00
895 Truck Stops 0.0 0.0 0.0 0.00
Total Other Mobile Sources 26.5 182582.1 9.4 0.19
910 Biogenic Sources 0 0 0 0.00
920 Geogenic Sources 0 0 0 0.00
930 Wildfires 0 0 0 0.00
940 Windblown Dust 0 0 0 0.00
Total Natural Sources 0 0 0 0.00
Total Stationary and Area Sources 5162.6 380183.1 4.6 0.49
Total On-Road Vehicles 40.9 2185077.5 126.8 2.23
Total Other Mobile 26.5 182581.8 9.4 0.19
Total Anthropogenic 5230.0 2747842.4 140.8 2.90
Table E-30 Unincorporated Areas – 2005 Fertilizer Usage
City 18 holes*
9 holes*
18 hole equivalent**
N2O emissions (MT CO2E/yr)***
Unincorporated 1 5 3.5 1,316
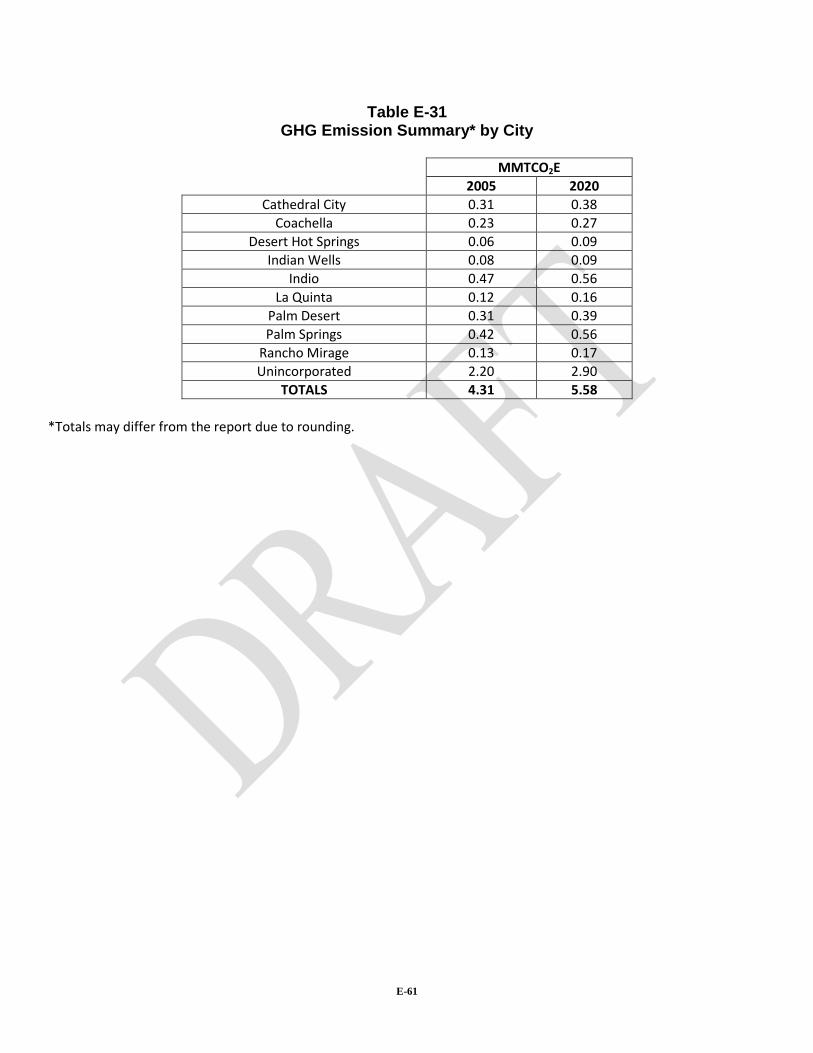
E-61
Table E-31 GHG Emission Summary* by City
MMTCO2E
2005 2020
Cathedral City 0.31 0.38
Coachella 0.23 0.27
Desert Hot Springs 0.06 0.09
Indian Wells 0.08 0.09
Indio 0.47 0.56
La Quinta 0.12 0.16
Palm Desert 0.31 0.39
Palm Springs 0.42 0.56
Rancho Mirage 0.13 0.17
Unincorporated 2.20 2.90
TOTALS 4.31 5.58
*Totals may differ from the report due to rounding.
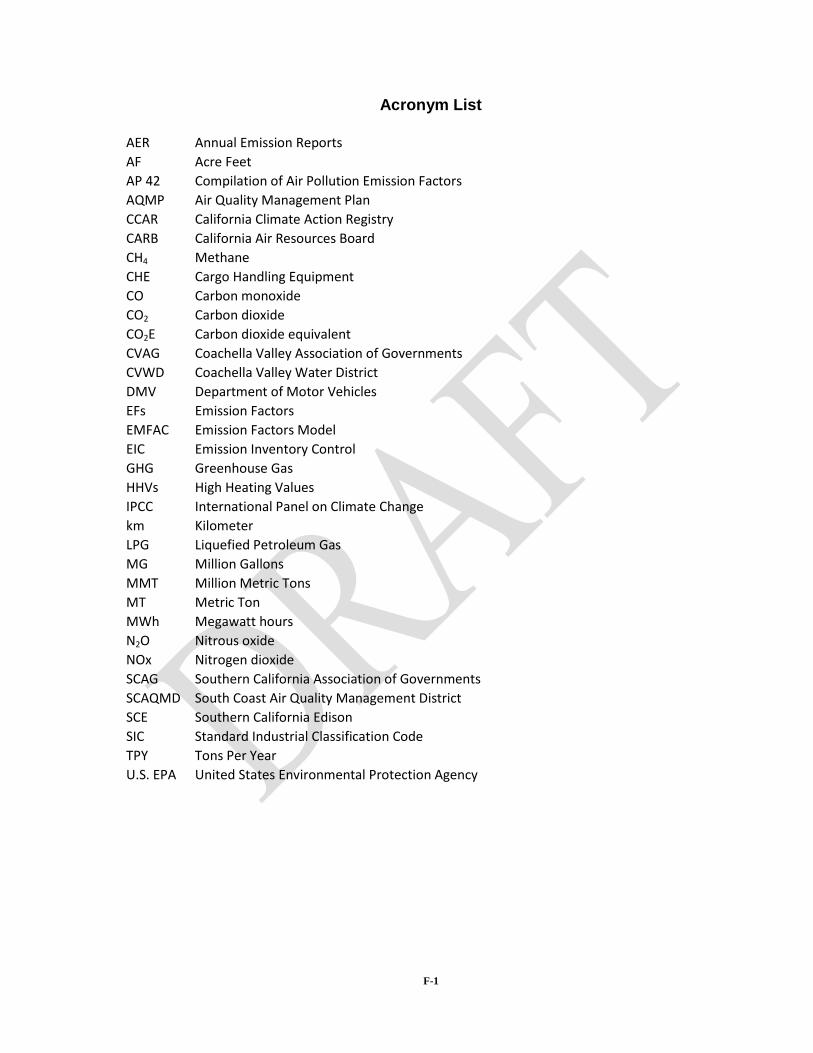
F-1
Acronym List
AER Annual Emission Reports
AF Acre Feet
AP 42 Compilation of Air Pollution Emission Factors
AQMP Air Quality Management Plan
CCAR California Climate Action Registry
CARB California Air Resources Board
CH4 Methane
CHE Cargo Handling Equipment
CO Carbon monoxide
CO2 Carbon dioxide
CO2E Carbon dioxide equivalent
CVAG Coachella Valley Association of Governments
CVWD Coachella Valley Water District
DMV Department of Motor Vehicles
EFs Emission Factors
EMFAC Emission Factors Model
EIC Emission Inventory Control
GHG Greenhouse Gas
HHVs High Heating Values
IPCC International Panel on Climate Change
km Kilometer
LPG Liquefied Petroleum Gas
MG Million Gallons
MMT Million Metric Tons
MT Metric Ton
MWh Megawatt hours
N2O Nitrous oxide
NOx Nitrogen dioxide
SCAG Southern California Association of Governments
SCAQMD South Coast Air Quality Management District
SCE Southern California Edison
SIC Standard Industrial Classification Code
TPY Tons Per Year
U.S. EPA United States Environmental Protection Agency