Technical Assessment in US Greenhouse Gas (GHG) Regulations:
13
Nic Lutsey Postdoctoral Researcher, Univ. of California, Davis ICCT GHG technology workshop Brussels, Belgium February 1, 2012 Technical Assessment in US Greenhouse Gas (GHG) Regulations: Methodology and Key Results
Transcript of Technical Assessment in US Greenhouse Gas (GHG) Regulations:

Nic Lutsey Postdoctoral Researcher, Univ. of California, Davis
ICCT GHG technology workshop Brussels, Belgium February 1, 2012
Technical Assessment in US Greenhouse Gas (GHG) Regulations:
Methodology and Key Results

Outline
• Background • Technical assessment
– Data sources, resources, steps
• Regulatory findings for proposed 2017-2025 standards – Vehicle technology modeling – Technology cost assessment
2

Background: Timeline for 2017-2025 Standards
2010 2011 2012
Proposal of Federal and California Regulations: • Target: ~54 miles per gallon • Target: ~164 grams CO2/mile
3
Initiation of work: • US EPA, NHTSA, and CARB initiate work on CO2/CAFE standards for 2017-2025
Finalize regulations
Joint technical report: • Agencies collaborate on TAR • Assess range of stringency
Further technical assessment: • Deliberation with auto industry • Vehicle modeling; contract work
Public stakeholder comment period
Today

Technology Assessment: Data Sources
• Many automotive technologies will be applied for compliance with existing 2012-2016 and proposed 2017-2025 regulations
• The technology assessment is based on many data sources – Available public technical literature
• E.g., SAE journal articles
– New and contracted technical work • Vehicle simulation work of technology packages from Ricardo • Teardown engineering cost assessment from FEV (e.g., on turbocharging,
gasoline direct injection, dual clutch transmission, stop-start, hybrid system components, lithium ion batteries)
• Mass-reduction assessment (e.g., Lotus Engineering) • Battery modeling for electric vehicles (from US energy laboratory)
– Confidential business information • From individual automobile manufacturers • From individual suppliers (e.g., of turbochargers, tires, advanced materials)
4
Publicly available, peer-reviewed technical reports

Technology Assessment: Resources
• Federal rulemaking: – By US Environmental Protection Agency (EPA) and National Highway Traffic
Safety Administration (NHTSA) – Website: http://www.epa.gov/otaq/climate/regulations.htm – Major documents:
• Proposal: “Notice of Proposed Rulemaking” (NPRM) • Technical: “Joint Technical Support Document” (TSD) • Other reports: http://www.epa.gov/otaq/climate/publications.htm#vehicletechnologies • Public docket: http://www.regulations.gov/#!searchResults;s=EPA-HQ-OAR-2010-0799
• California rulemaking – By California Air Resources Board (CARB) – Website: http://www.arb.ca.gov/regact/2012/leviiighg2012/leviiighg2012.htm
• Also: http://www.arb.ca.gov/msprog/clean_cars/clean_cars.htm
– Major document: “Initial Statement of Reasons” (ISOR) – Includes GHG; criteria pollutants, and ZEV regulations as package
5
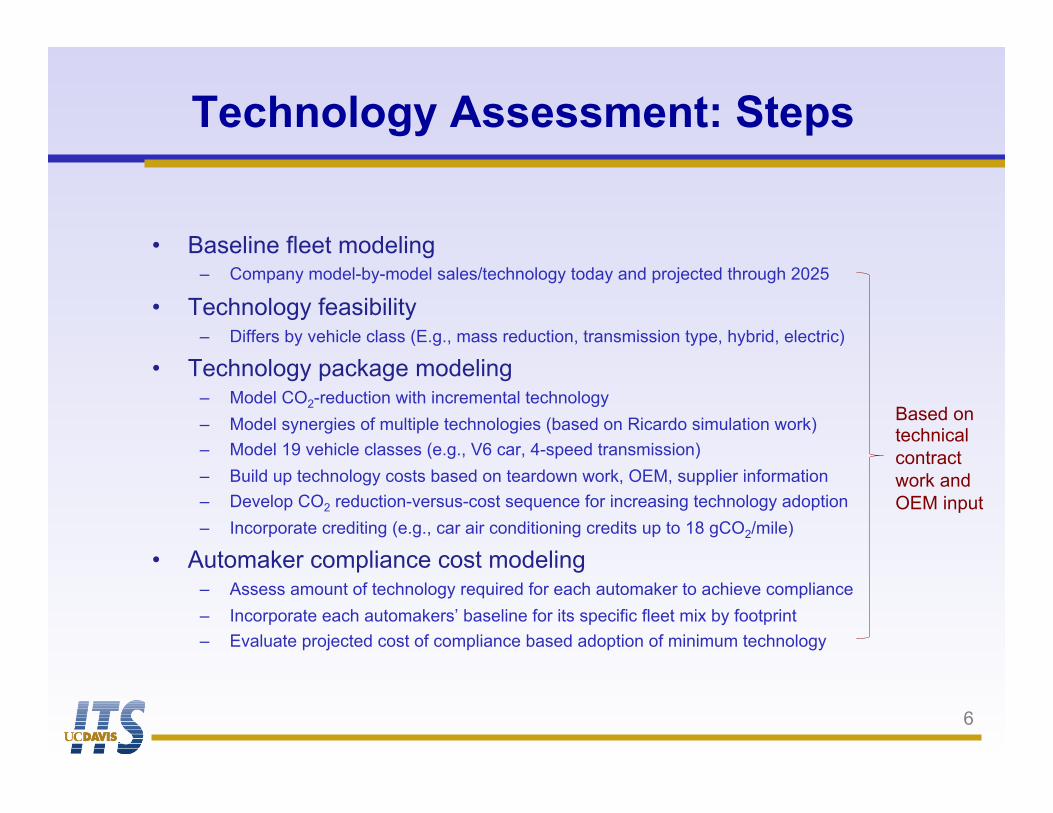
Technology Assessment: Steps
• Baseline fleet modeling – Company model-by-model sales/technology today and projected through 2025
• Technology feasibility – Differs by vehicle class (E.g., mass reduction, transmission type, hybrid, electric)
• Technology package modeling – Model CO2-reduction with incremental technology – Model synergies of multiple technologies (based on Ricardo simulation work) – Model 19 vehicle classes (e.g., V6 car, 4-speed transmission) – Build up technology costs based on teardown work, OEM, supplier information – Develop CO2 reduction-versus-cost sequence for increasing technology adoption – Incorporate crediting (e.g., car air conditioning credits up to 18 gCO2/mile)
• Automaker compliance cost modeling – Assess amount of technology required for each automaker to achieve compliance – Incorporate each automakers’ baseline for its specific fleet mix by footprint – Evaluate projected cost of compliance based adoption of minimum technology
6
Based on technical contract work and OEM input

Technical Background: Vehicle Efficiency
• The modern internal combustion automobile, at roughly 15-20% efficiency, has many efficiency losses – and many technical solutions
7 Sources: Kromer and Heywood, 2007 and U.S. EPA, 2010 http://www.fueleconomy.gov/feg/atv.shtml
CO2

Individual Technologies
8
Area Technology for CO2 reduction Technology share, MY2010
Potential CO2 reduction
Powertrain
Engine
Low friction lubrication - 0.5% Engine friction reduction - 2-4% Variable valve timing (and lift) 86% 4-6% Cylinder deactivation 7% 5-6% Turbocharging 3% 2-5% Turbo, gasoline direct injection 9% 8-15% Cooled EGR, turbo, GDI - 20-25% Compression ignition diesel 0.5% 15-25% Digital valve actuation - 5-10%
Transmission
Early torque converter lock-up - 0.5% Optimized shifting - 2-6% 6+ speed 40% 2-8% Continuously variable 10% 8-11% Dual-clutch, automated manual - 9-13%
Vehicle
Aerodynamics - 2-5% Tire rolling resistance - 2-4% Accessories (steering, air cond., alternator) - 1-4% Lower refrigerant emissions (low-leak, low-GWP) - 2-10%
Mass-reduction Advanced material component - 1-5% Integrated vehicle design - 5-10%
Hybrid systems Stop-start mild hybrid <1% 6-8% Full hybrid electric system 3% 30-35%
Technology CO2-reduction potential differs by vehicle class, by drive cycle, and when multiple technologies are combined
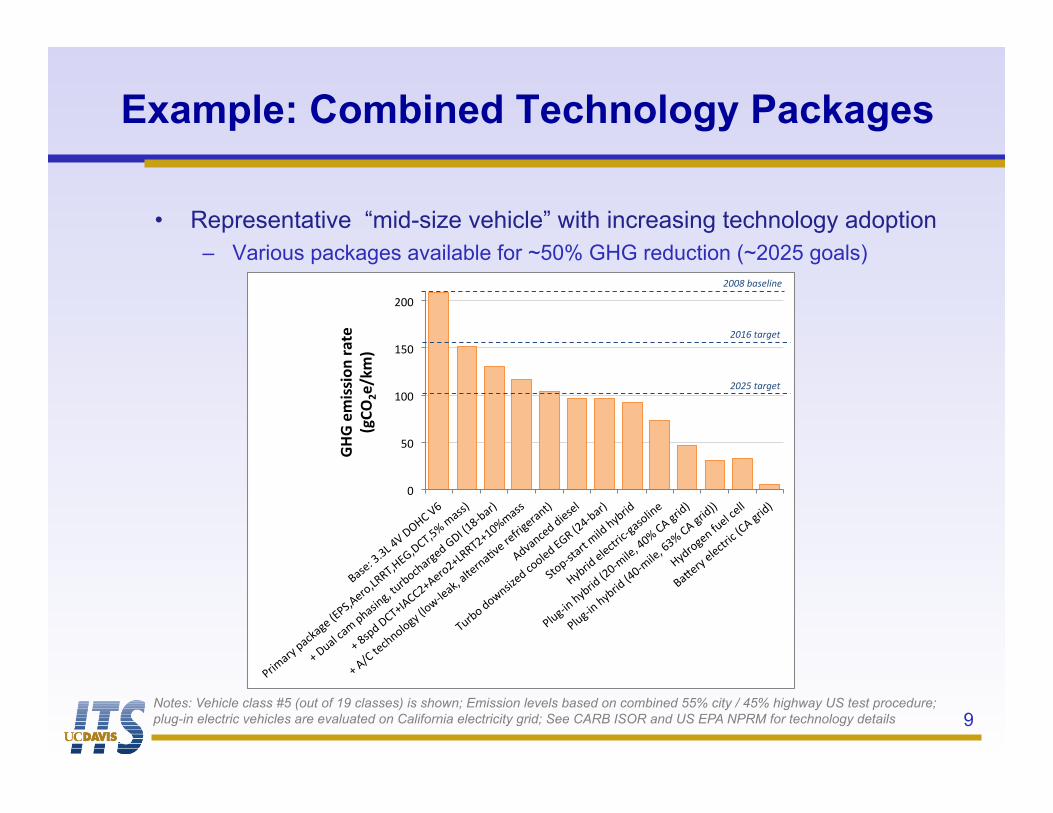
Example: Combined Technology Packages
• Representative “mid-size vehicle” with increasing technology adoption – Various packages available for ~50% GHG reduction (~2025 goals)
9 Notes: Vehicle class #5 (out of 19 classes) is shown; Emission levels based on combined 55% city / 45% highway US test procedure; plug-in electric vehicles are evaluated on California electricity grid; See CARB ISOR and US EPA NPRM for technology details
!"
#!"
$!!"
$#!"
%!!"
&'()*"+,+-"./"0123"/4"
5678'69":';<'=)">?5@AB)6CA-DDEA2?FA03EA#G"8'((H"
I"0J'K";'8":L'(7M=A"NJ6OC;L'6=)P"F0Q">$RSO'6H"
I"R(:P"03EIQB33%IB)6C%I-DDE%I$!G8'(("
I"BT3"N);LMCKC=9">KCUSK)'<A"'KN)6M'VW)"6)X67=)6'MNH"
BPW'M;)P"P7)()K"
EJ6OC"PCUM(7Y)P";CCK)P"?FD">%.SO'6H"
@NC:S(N'6N"8
7KP"L9O67P"
29O67P")K);N67;S='(CK7M)"
5KJ=S7M"L9O67P">%!S87K)A".!G"3B"=67PH"
5KJ=S7M"L9O67P">.!S87K)A"4+G"3B"=67PHH"
29P6C=)M"XJ)K";)KK"
&'Z)69")K);N67;">3B"=67PH"
!"!#$%&''&()#*+,$##
-./0
1$23%4#
!""#$%&'()*+($
!",-$.&/0(.$
!"!1$.&/0(.$

Example: Technology Cost-vs-GHG Walk-Up
• Representative “mid-size vehicle” technology-cost progression – Increasing cost with increasing technology adoption
10 Notes: Vehicle class #5 (out of 19 classes) is shown; Emission levels based on combined 55% city / 45% highway US test procedure; See CARB ISOR and US EPA NPRM for technology details
!"
#!!"
$!!!"
$#!!"
%!!!"
%#!!"
!&" $!&" %!&" '!&" (!&" #!&"
!"#$%&%"'()*'%#+",),-.*/$0#%**
1$,&*2334*0"*2325*6789+0%)#%:*
;<2*$%=>#?,"*1$,&*2334*'%#+",),-.*
)*+,-.*"-./00"1#"2/-3/4*0"
!"#$%&'&(%)*%
+,-.(/!.01(.2033.+41.0$567%
.(--87.9+:.*/38.;<="##%
./34.>[email protected]#DE$.2F.:/2%
.GH#I$$A%A?"J%KJ?>KL%
.%2033M.0$56M.(--8M%
.%0N3%>$KLC6J6OP%
.7Q<%="##%
.%K66J%+:-%
.7;<%="##%%
.%#>6IH#>"5>%

Results: Technology Adoption
• Compliance with US GHG standards is projected to primarily result from increased adoption of advanced gasoline efficiency technologies
– Federal and California rulemakings utilize same underlying technical assumptions – California’s ZEV program also includes electric-drive vehicle requirements
11 See CARB ISOR and US EPA NPRM for technology details * Mass reduction is fleet average (not percent new vehicle technology share, like other technologies listed)
Technology for CO2 reduction Technology share, 2021
[USEPA]
Technology share, 2025
[USEPA]
Technology share, 2025
[CARB]
Engine
Improvements in low friction lubrication; engine friction reduction, variable valve timing/lift
>50% >90% >90%
Turbocharged gasoline direct injection 63% 85% 51% Cooled EGR, turbocharged GDI 12% 66% 14%
Driveline
Early torque converter lock-up, high efficiency gearbox, optimized shifting, 8-speed
>50% >90% >90%
Dual-clutch, automated manual 55% 55% 56%
Accessory Electric power steering; efficient alternator, air conditioning; low-leak, low GWP refrigerant
>90% >95% >90%
Load reduction
Aerodynamic, low RR tires, low-drag brakes >60% >95% >95% Mass reduction * 7% 12% 8%
Advanced Hybrid electric 7% 15% 6% Plug-in hybrid, electric, fuel cell 1% 3% 15%

Results: Compliance Cost, Savings
• Federal and California rulemakings project similar overall increase in vehicle price and consumer fuel saving benefits
12
Federal U.S. GHG / CAFE
proposal
California proposal
(GHG, criteria, ZEV)
Assumptions
Fuel price ($/gallon in 2025) $3.50 $4.00
Vehicle median life 14 years 15 years Vehicle median lifetime mileage 230,000 205,000 Consumer fuel saving discount rate 3%/7% 5%
Technology cost Baseline (2016 v. 2008) $750 $1150
New technology (2025 v. 2016) $1750 (NHTSA) $1950 (USEPA) $1900
Consumer savings
Payback period 4 years 3 years
Lifetime fuel savings per vehicle $5200 (7%) $6600 (3%) $5900
Net lifetime savings per vehicle (fuel savings minus technology cost)
$3000 (7%) $4400 (3%) $4000
Values approximate, involve rounding; see CARB ISOR and US EPA NPRM for technology details
Conclusion
• This presentation summarizes major technical steps and findings from the US greenhouse gas regulations
• The federal (US EPA / NHTSA) rulemaking – Proposed in November 2011 – Set to be finalized in July 2012
• California (CARB) rulemaking – Includes GHG, criteria pollutant (NOx, HC, PM), and ZEV regulations – Proposed in December 2011 – Board approved January 27, 2012
• Full technical and regulatory details are available at US EPA, NHTSA, and CARB rulemaking websites
13