Greenhouse Gas Assessment –. What is a Scope? Scope 1: All direct greenhouse gas (GHG) emissions...
13
Greenhouse Gas Assessment –
Transcript of Greenhouse Gas Assessment –. What is a Scope? Scope 1: All direct greenhouse gas (GHG) emissions...
Greenhouse Gas Assessment –
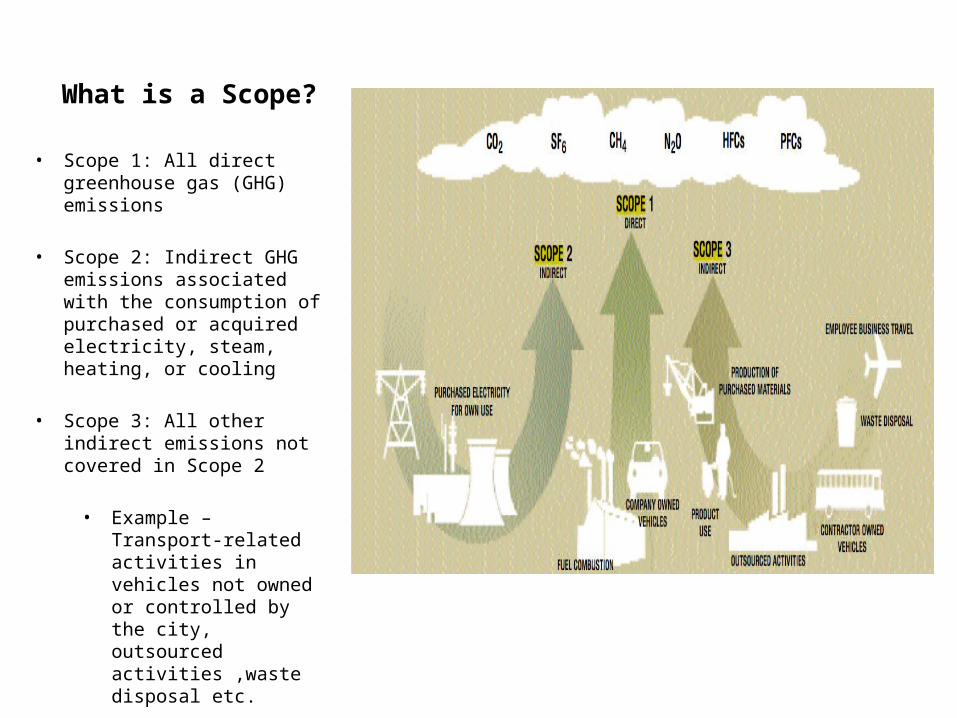
What is a Scope?
• Scope 1: All direct greenhouse gas (GHG) emissions
• Scope 2: Indirect GHG emissions associated with the consumption of purchased or acquired electricity, steam, heating, or cooling
• Scope 3: All other indirect emissions not covered in Scope 2
• Example – Transport-related activities in vehicles not owned or controlled by the city, outsourced activities ,waste disposal etc.
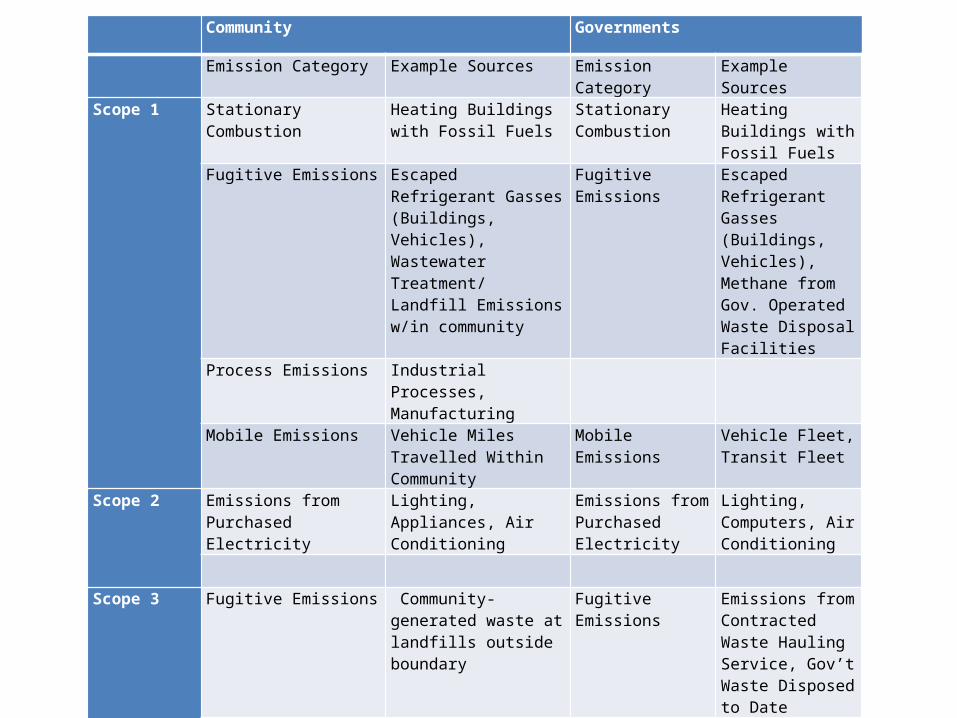
Community Governments
Emission Category Example Sources Emission Category Example Sources
Scope 1 Stationary Combustion Heating Buildings with Fossil Fuels
Stationary Combustion
Heating Buildings with Fossil Fuels
Fugitive Emissions Escaped Refrigerant Gasses (Buildings, Vehicles), Wastewater Treatment/ Landfill Emissions w/in community
Fugitive Emissions Escaped Refrigerant Gasses (Buildings, Vehicles), Methane from Gov. Operated Waste Disposal Facilities
Process Emissions Industrial Processes, Manufacturing
Mobile Emissions Vehicle Miles Travelled Within Community
Mobile Emissions Vehicle Fleet, Transit Fleet
Scope 2 Emissions from Purchased Electricity
Lighting, Appliances, Air Conditioning
Emissions from Purchased Electricity
Lighting, Computers, Air Conditioning
Scope 3 Fugitive Emissions Community-generated waste at landfills outside boundary
Fugitive Emissions Emissions from Contracted Waste Hauling Service, Gov’t Waste Disposed to Date
Mobile Emissions Emissions from Vehicles Used by Community Residents
Mobile Emissions Emission from Employee Commute, Contracted Services
Information Item
Biogenic Emissions Wood Heat, Biofuel Use Biogenic Emissions Wood Heat, Biofuel Use, Renewables
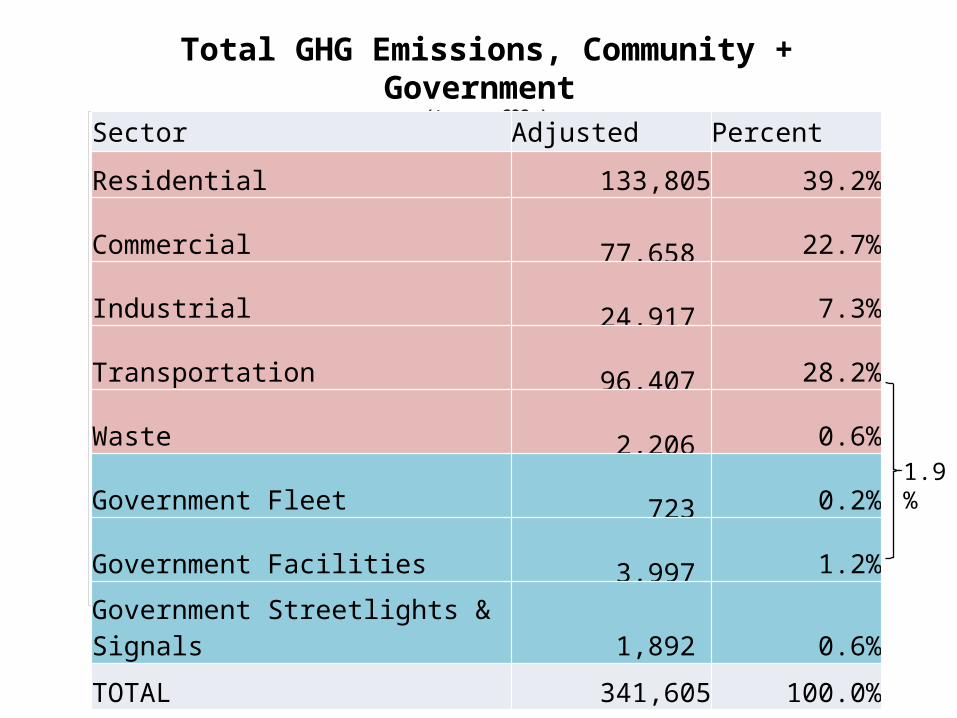
Total GHG Emissions, Community + Government (tonnes CO2e)
39%
23%
7%
28%
1% 0% 1% 1%
Residential
Commercial
Industrial
Transportation
Waste
Gov Fleet
Gov Facilities
Gov Streetlights & Signals
Sector Adjusted Percent
Residential 133,805 39.2%
Commercial 77,658 22.7%
Industrial 24,917 7.3%
Transportation 96,407 28.2%
Waste 2,206 0.6%
Government Fleet 723 0.2%
Government Facilities 3,997 1.2%
Government Streetlights & Signals 1,892 0.6%
TOTAL 341,605 100.0%
1.9%
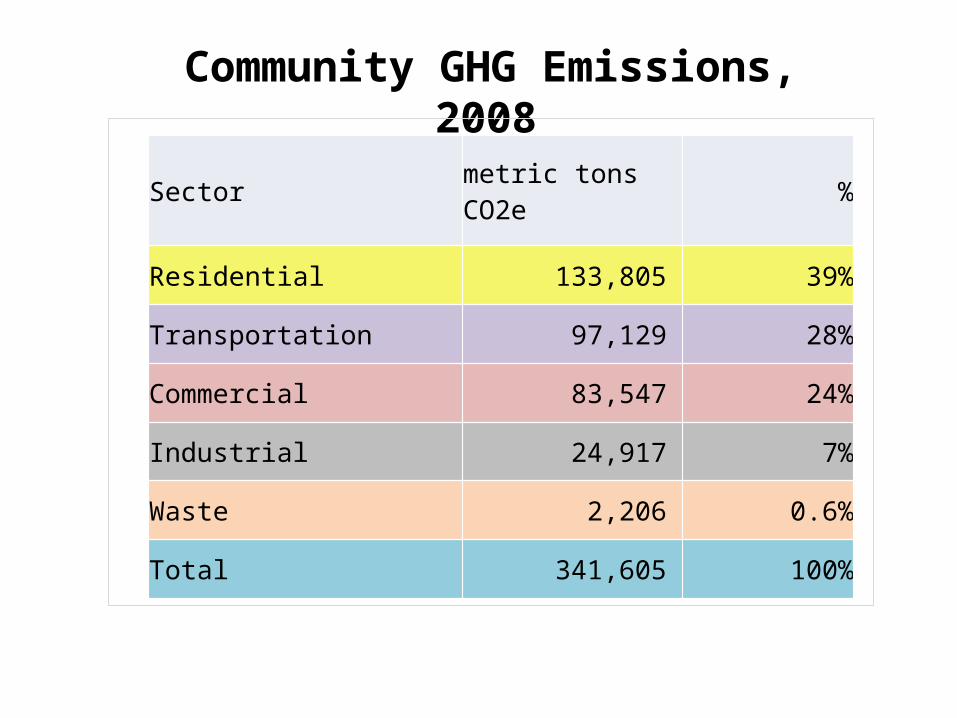
Community GHG Emissions, 2008
(metric tons CO2e)
39%
28%
24%
7% 1%
Residential
Transportation
Commercial
Industrial
Waste
Sector metric tons CO2e %
Residential 133,805 39%
Transportation 97,129 28%
Commercial 83,547 24%
Industrial 24,917 7%
Waste 2,206 0.6%
Total 341,605 100%
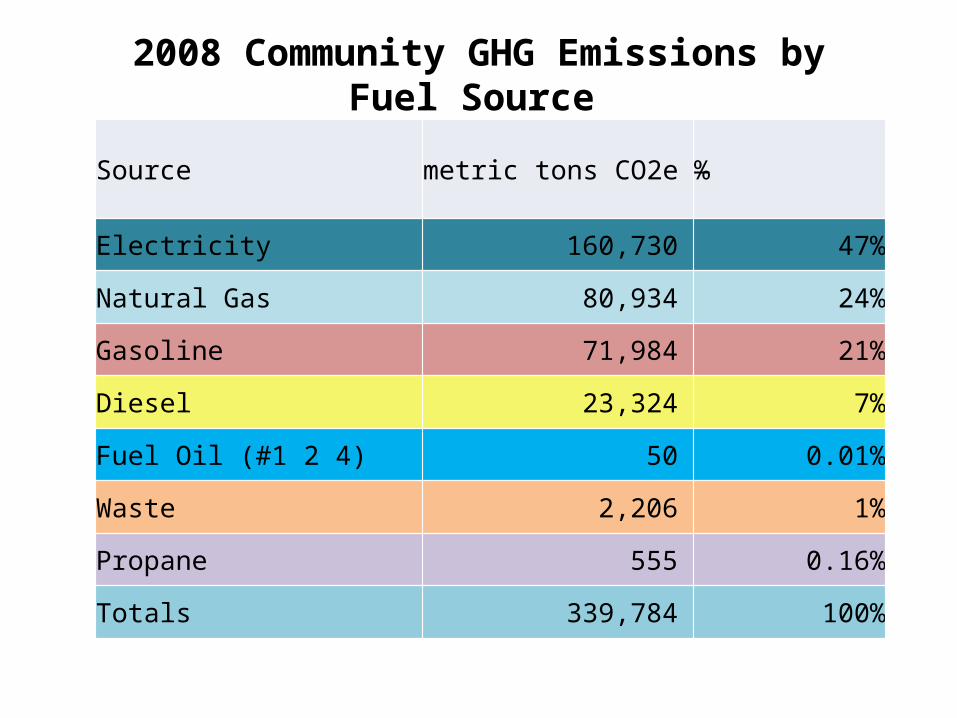
2008 Community GHG Emissions by Fuel Source (metric tons CO2e)
Residential Commercial Industrial Transportation Waste0
20000
40000
60000
80000
100000
120000
140000
160000
58,713
22,222
74,487
61,325
24,917 23324.287173065
71983.9893476036
2205.99554150268
Electricity
Natural Gas
Fuel Oil (#1 2 4)
Propane
Gasoline
Diesel
Biogenic Waste
Source metric tons CO2e %
Electricity 160,730 47%
Natural Gas 80,934 24%
Gasoline 71,984 21%
Diesel 23,324 7%
Fuel Oil (#1 2 4) 50 0.01%
Waste 2,206 1%
Propane 555 0.16%
Totals 339,784 100%
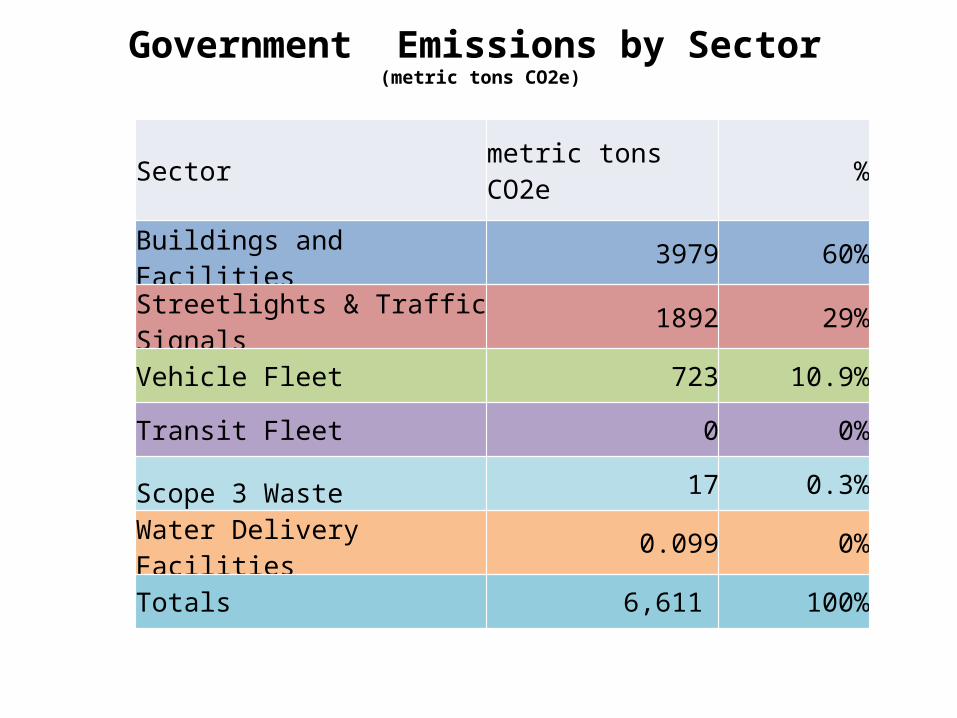
Government Emissions by Sector (metric tons CO2e)
60%
29%
11%
0% 0%
Buildings and Facilities
Streetlights & Traffic Signals
Vehicle Fleet
Transit Fleet
Scope 3 Waste
Water Delivery Facilities
Sector metric tons CO2e %
Buildings and Facilities 3979 60%
Streetlights & Traffic Signals 1892 29%
Vehicle Fleet 723 10.9%
Transit Fleet 0 0%
Scope 3 Waste 17 0.3%
Water Delivery Facilities 0.099 0%
Totals 6,611 100%
Buildings and Facilities Streetlights & Traffic Signals
Vehicle Fleet0
500
1000
1500
2000
2500
3000
3500
4000
4500
3029
1892
949.8924044
217.017295674712
505.639618834864
Government GHG Emissions by Source, 2005 (metric tonnes CO2e)
Gasoline
Diesel
Natural Gas
Electricity
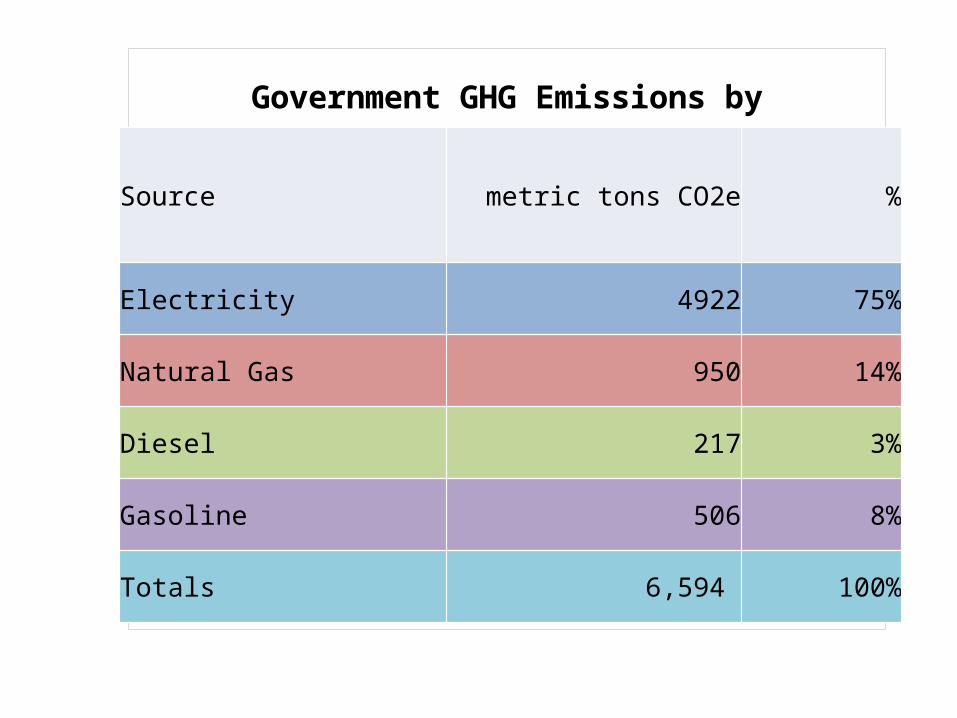
Source metric tons CO2e %
Electricity 4922 75%
Natural Gas 950 14%
Diesel 217 3%
Gasoline 506 8%
Totals 6,594 100%
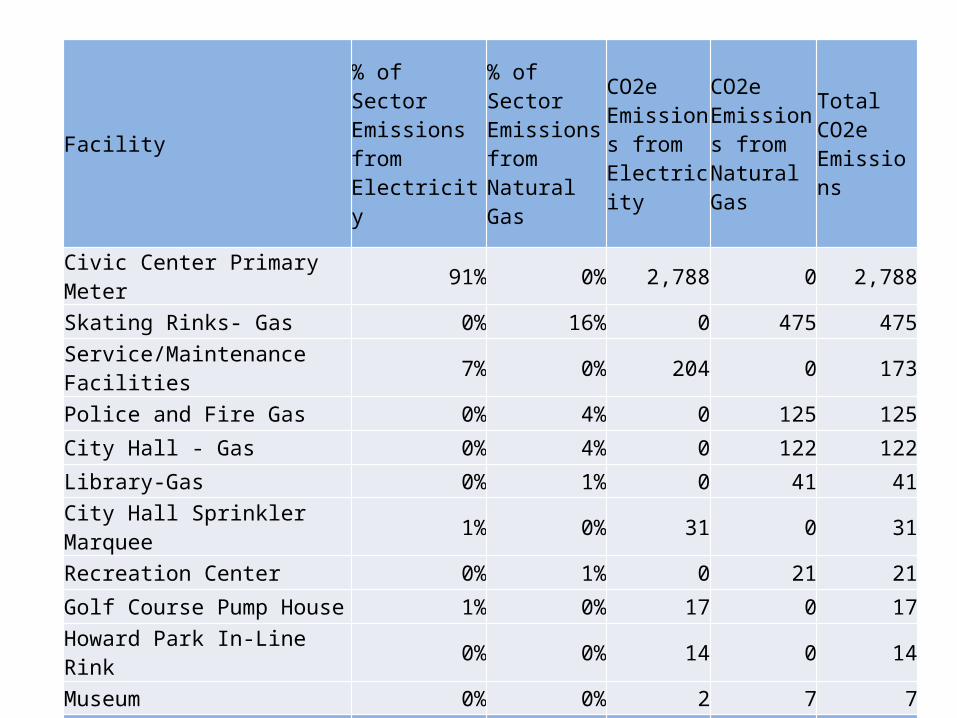
Facility% of Sector Emissions from Electricity
% of Sector Emissions from Natural Gas
CO2e Emissions from Electricity
CO2e Emissions from Natural Gas
Total CO2e Emissions
Civic Center Primary Meter 91% 0% 2,788 0 2,788
Skating Rinks- Gas 0% 16% 0 475 475
Service/Maintenance Facilities 7% 0% 204 0 173
Police and Fire Gas 0% 4% 0 125 125
City Hall - Gas 0% 4% 0 122 122
Library-Gas 0% 1% 0 41 41
City Hall Sprinkler Marquee 1% 0% 31 0 31
Recreation Center 0% 1% 0 21 21
Golf Course Pump House 1% 0% 17 0 17
Howard Park In-Line Rink 0% 0% 14 0 14
Museum 0% 0% 2 7 7
Totals: 100% 26% 3,056 791 3,813
2005 2010 2015 2020 2025 2030 2035 2040 2045 2050 335,000
336,000
337,000
338,000
339,000
340,000
341,000
342,000
343,000
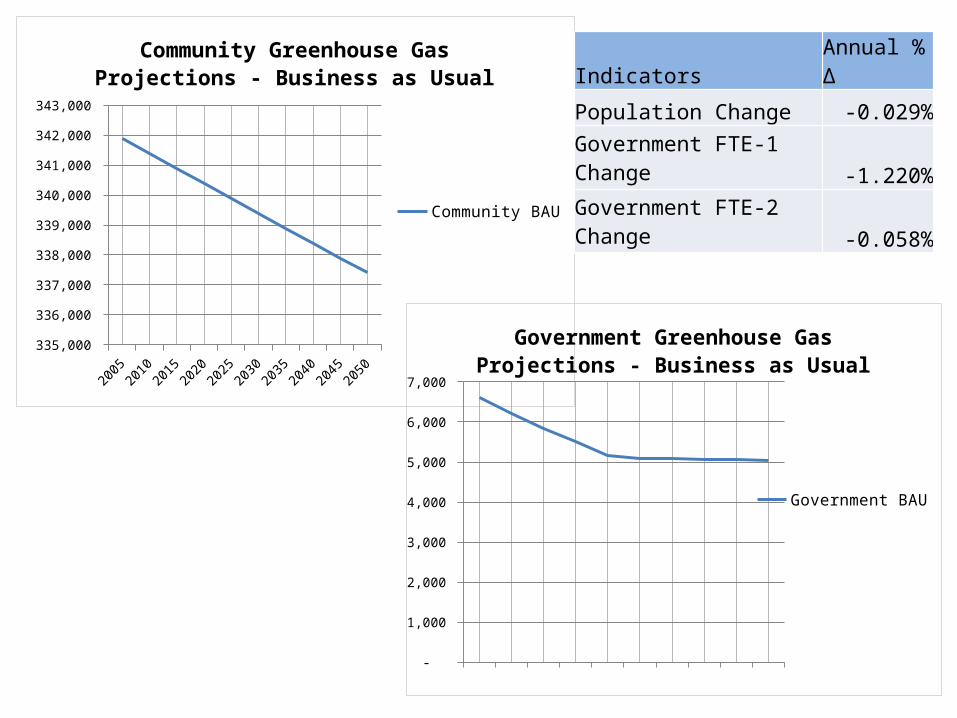
Community Greenhouse Gas Projections - Business as Usual
Community BAU
2005 2010 2015 2020 2025 2030 2035 2040 2045 2050 -
1,000
2,000
3,000
4,000
5,000
6,000
7,000
Government Greenhouse Gas Projections - Business as Usual
Government BAU
Indicators Annual % ∆
Population Change -0.029%
Government FTE-1 Change -1.220%
Government FTE-2 Change -0.058%
2005 2010 2015 2020 2025 2030 2035 2040 2045 2050 -
1,000
2,000
3,000
4,000
5,000
6,000
7,000
Government Greenhouse Gas Projections - Business as Usual
Government BAUGovernment Target
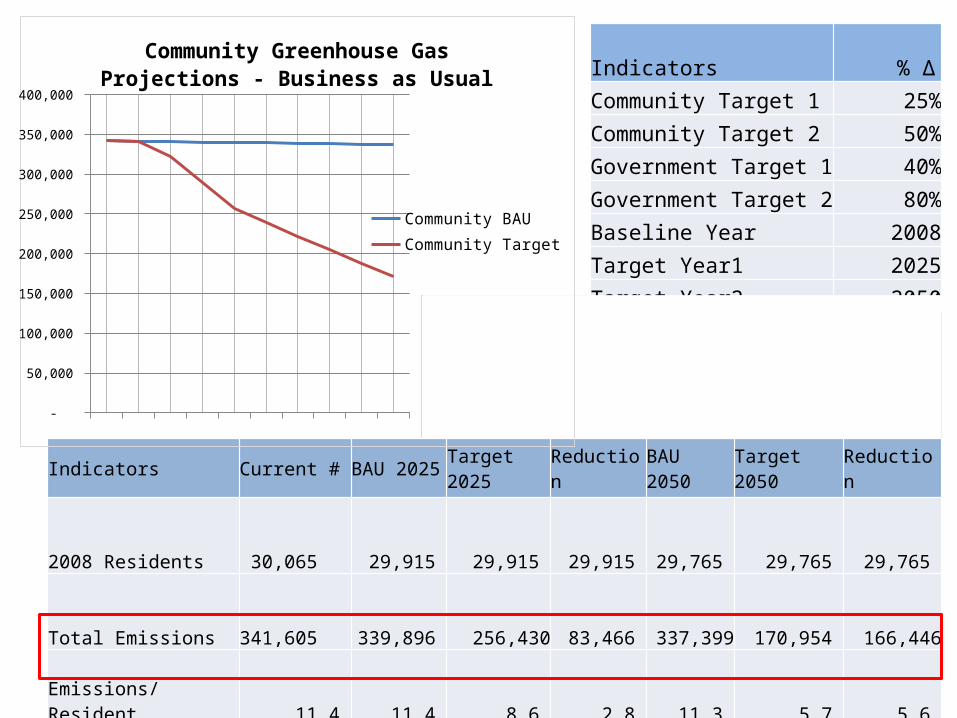
Indicators % ∆
Community Target 1 25%
Community Target 2 50%
Government Target 1 40%
Government Target 2 80%
Baseline Year 2008
Target Year1 2025
Target Year2 2050
Indicators Current # BAU 2025 Target 2025 Reduction BAU 2050 Target 2050 Reduction
2008 Residents 30,065 29,915
29,915
29,915 29,765 29,765
29,765
Total Emissions 341,605
339,896
256,430
83,466 337,399 170,954
166,446
Emissions/Resident 11.4
11.4
8.6
2.8 11.3 5.7
5.6
2005 2010 2015 2020 2025 2030 2035 2040 2045 2050 -
50,000
100,000
150,000
200,000
250,000
300,000
350,000
400,000
Community Greenhouse Gas Projections - Business as Usual
Community BAUCommunity Target
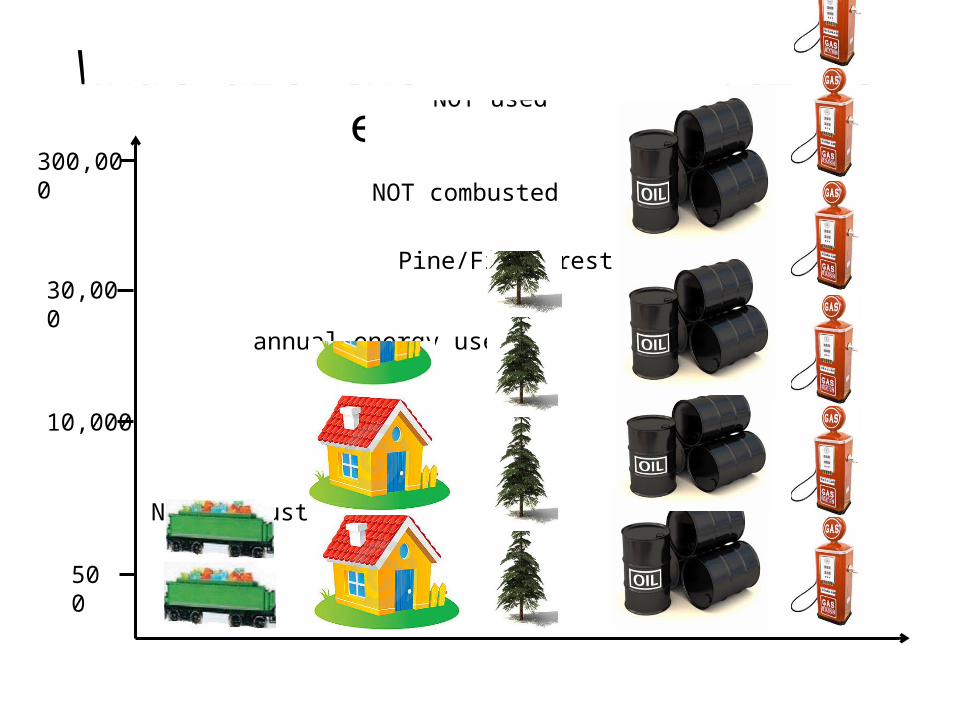
What are the 2050 reductions equal to?
500
10,000
30,000
300,000
832 Railcars worth of coal NOT combusted
Reduction of 14,481 homes annual energy use
Carbon sequestered from
35,453 acres of Pine/Fir forest
382,825 Barrels of oil NOT combusted
18,641,918 Gallons of gasoline NOT used

Questions?