Washington State Greenhouse Gas Emissions Inventory: 1990-2018
25
Washington State Greenhouse Gas Emissions Inventory: 1990-2018 Air Quality Program Washington State Department of Ecology Olympia, Washington January 2021, Publication 20-02-020
Transcript of Washington State Greenhouse Gas Emissions Inventory: 1990-2018

Washington State Greenhouse Gas Emissions Inventory: 1990-2018
Air Quality Program
Washington State Department of Ecology
Olympia, Washington
January 2021, Publication 20-02-020

Publication Information This document is available on the Department of Ecology’s website at: https://apps.ecology.wa.gov/ecy/publications/summarypages/2002020.html
Contact Information Air Quality Program
P.O. Box 47600 Olympia, WA 98504-7600 Phone: 360-407-6800 Website1: Washington State Department of Ecology
ADA Accessibility The Department of Ecology is committed to providing people with disabilities access to information and services by meeting or exceeding the requirements of the Americans with Disabilities Act (ADA), Section 504 and 508 of the Rehabilitation Act, and Washington State Policy #188.
To request an ADA accommodation, contact Ecology by phone at 360-407-6800 or email at [email protected]. For Washington Relay Service or TTY call 711 or 877-833-6341. Visit Ecology's website for more information.
1 www.ecology.wa.gov
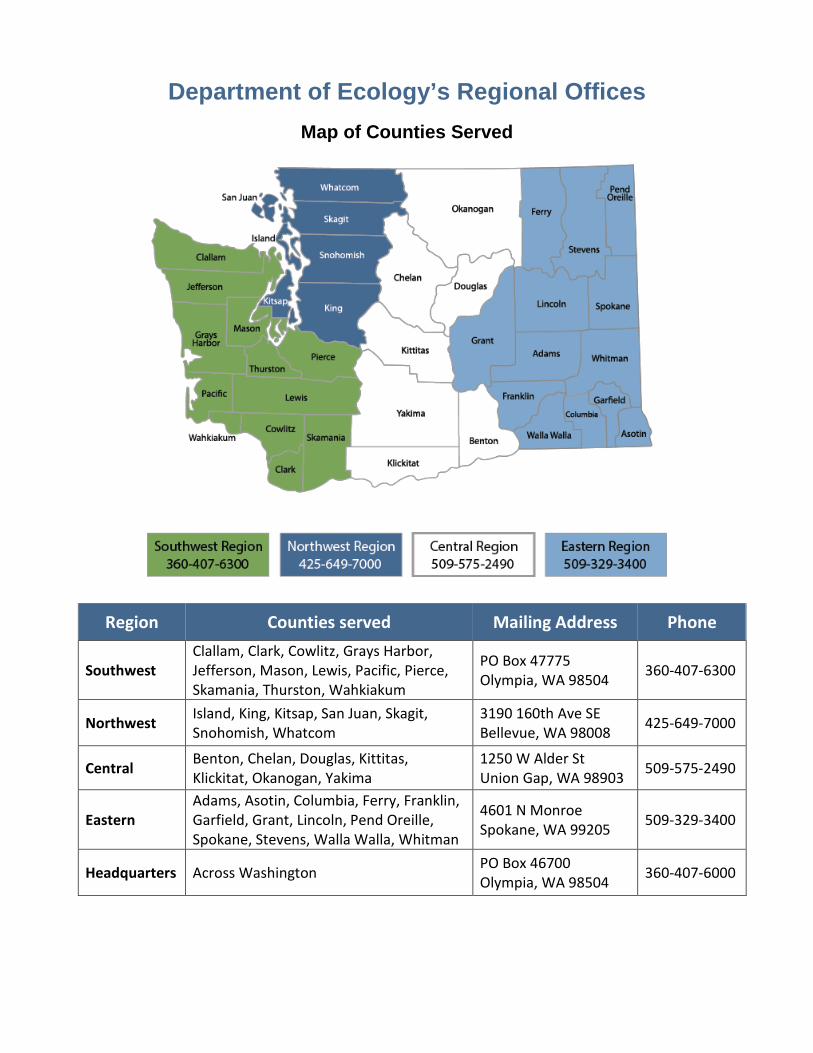
Department of Ecology’s Regional Offices Map of Counties Served
Region Counties served Mailing Address Phone
Southwest Clallam, Clark, Cowlitz, Grays Harbor, Jefferson, Mason, Lewis, Pacific, Pierce, Skamania, Thurston, Wahkiakum
PO Box 47775 Olympia, WA 98504 360-407-6300
Northwest Island, King, Kitsap, San Juan, Skagit, Snohomish, Whatcom
3190 160th Ave SE Bellevue, WA 98008 425-649-7000
Central Benton, Chelan, Douglas, Kittitas, Klickitat, Okanogan, Yakima
1250 W Alder St Union Gap, WA 98903 509-575-2490
Eastern Adams, Asotin, Columbia, Ferry, Franklin, Garfield, Grant, Lincoln, Pend Oreille, Spokane, Stevens, Walla Walla, Whitman
4601 N Monroe Spokane, WA 99205 509-329-3400
Headquarters Across Washington PO Box 46700 Olympia, WA 98504 360-407-6000

Washington State Greenhouse Gas Emissions Inventory 1990-2018
Report to the Legislature
Air Quality Program Washington State Department of Ecology
Olympia, WA
D 2020 | Publication 20-02-020

Publication 20-02-020 Washington State Greenhouse Gas Emissions Inventory 1990-2018 Page 4 January 2021
Table of Contents List of Figures and Tables ....................................................................................................... 5
Figures ......................................................................................................................................... 5
Tables .......................................................................................................................................... 5
Acknowledgements ............................................................................................................... 6
Executive Summary ............................................................................................................... 7
Background Information ........................................................................................................ 8
Washington’s greenhouse gas legislation .................................................................................. 8
Greenhouse gas emissions inventory ......................................................................................... 9
Findings: Inventory Results .................................................................................................. 11
Washington’s Greenhouse Gas Emissions Trends ................................................................. 15
Trends by sector, 2015-2018 .................................................................................................... 15
Trends by sector, Washington and U.S. .................................................................................... 16
Summary of results by sector ............................................................................................... 17
Transportation sector ............................................................................................................... 17
Electricity sector ........................................................................................................................ 19
Residential, commercial, and industrial (RCI) sectors .............................................................. 20
Fossil fuel industry sector ......................................................................................................... 21
Waste management sector....................................................................................................... 21
Industrial Processes sector…………………………………………………………………………………………………..21
Agriculture sector ..................................................................................................................... 22
Multi-year averages……………………………………………………………………………………………………………..22
Next Steps ........................................................................................................................... 24
Conclusion ........................................................................................................................... 24

Publication 20-02-020 Washington State Greenhouse Gas Emissions Inventory 1990-2018 Page 5 January 2021
List of Figures and Tables
Figures
Figure 1: Greenhouse gas emissions from wildfires in Washington State ................................... 14
Figure 2: Total Annual Greenhouse Gas Emissions (MMT CO2e) by Sector from 1990 - 2018 .... 15
Figure 3: Total Greenhouse Gas Emissions (MMT CO2e) by Sector for 2015 - 2018 .................... 16
Figure 4: Percent Greenhouse Gas Emissions by Sector - 2018, Washington and U.S. ............... 17
Figure 5: Greenhouse Gas Emissions - transportation sector subcategories (MMT CO2e) .......... 18
Figure 6: Percent distribution of electricity energy source. ......................................................... 19
Figure 7: Annual GHG emissions from Electricity (Consumption-Based) ..................................... 20
Figure 8: Residential, Commercial and Industrial sectors: GHG emissions, 2015 - 2018 ............. 21
Figure 9: Washington GHG emissions, 3-year average (2016-2018) ............................................ 23
Tables
Table 1: Washington State GHG emissions limits: 2008 and 2020 ................................................. 9
Table 2: Global warming potential factors for greenhouse gases, Fourth Assessment Report, 100-year time horizon....................................................................................................... 11
Table 3: Washington State Total Annual GHG Emissions (MMT CO2e) ........................................ 13

Publication 20-02-020 Washington State Greenhouse Gas Emissions Inventory 1990-2018 Page 6 January 2021
Acknowledgements The authors of this report thank the following people for their contribution to this study:
• Greg Nothstein, Washington Department of Commerce • Dan Stonington, Washington Department of Natural Resources
Publication 20-02-020 Washington State Greenhouse Gas Emissions Inventory 1990-2018 Page 7 January 2021
Executive Summary This report summarizes Washington’s greenhouse gas emissions from the 1990 baseline established in law through to 2018, which is the most recent year of available data necessary to create this inventory. The report evaluates Washington’s greenhouse gas emissions, shows where the emissions are coming from, and how those emissions are changing over time.
RCW 70A.45.020 (2), states,
“By December 31st of each even-numbered year beginning in 2010, the department and the department of commerce shall report to the governor and the appropriate committees of the senate and house of representatives the total emissions of greenhouse gases for the preceding two years, and totals in each major source sector…The report must include greenhouse gas emissions from wildfires, developed in consultation with the department of natural resources….”
Key findings in the report are that Washington’s greenhouse gas emissions rose 1.3 percent from 2017 to 2018, reaching a total of 99.6 million metric tons (MMT). This was the highest total for the state since 2007, when total emissions were 101.4 MMT. During the Great Recession, emissions fell sharply, reaching a low of 91.8 MMT in 2012. Between 2012 and 2018, emissions have gradually climbed higher as Washington’s economy has expanded and our state’s population has grown.
The greatest contributor to these rising emissions has been the transportation sector and the heating sector (which includes home, commercial and industrial heating). Decreases in emissions from electricity generation, in recent years, have helped to offset increases in other sectors.
Transportation is the largest category of emissions, accounting for 44.9 percent of the total. Residential, commercial and industrial heating (RCI) is second, accounting for 23.8 percent of emissions, and electrical generation is third, accounting for 16.3 percent of emissions.
The 2018 total of 99.6 million metric tons is 9.1 MMT higher than the 1990 baseline of 90.5 MMT. Under state law, future emissions reduction targets are compared to this baseline.
Publication 20-02-020 Washington State Greenhouse Gas Emissions Inventory 1990-2018 Page 8 December 2020
Background Information Greenhouse gases (GHGs) are substances that contribute to climate change by trapping heat in the atmosphere. The internationally recognized greenhouse gases that contribute to human-caused climate change are:
• Carbon dioxide. • Hydrofluorocarbons. • Methane. • Nitrogen trifluoride. • Nitrous oxide. • Perfluorocarbons. • Sulfur hexafluoride.
Greenhouse gases are released from a wide variety of sources. In this report, we consider:
• Stationary combustion, which occurs at places that use equipment (such as boilers) to produce electricity, steam, heat, or power;
• Mobile combustion, which occurs when fuel is burned for transportation (such as in cars, trucks, ships, trains, and planes);
• Industrial processes, such as manufacturing cement, aluminum, ammonia, and other products where the process itself generates greenhouse gases; and
• Fugitive releases from the production, processing, transmission, storage, or use of fuels and other substances that do not pass through a stack, chimney, vent, or exhaust pipe (such as the unintentional release of sulfur hexafluoride from electrical equipment or nitrous oxide from fertilizers).
Washington’s greenhouse gas legislation RCW 70A.45.040 requires that Ecology consult with the Climate Impacts Group (CIG) at the University of Washington to review the science on human-caused climate change within 18 months of the “next and each successive global or national assessment of climate change science.” This review may require recommendations about “whether the greenhouse gas emissions reductions under RCW 70A.45.020 need to be updated.”
In 2019, Ecology completed a review of several recent climate change reports:
• The 2018 Intergovernmental Panel on Climate Change Special Report, Global Warming of 1.5oC (SR15),
• The 2018 Fourth National Climate Assessment,
• The University of Washington CIG report on the consequences to Washington State of 1.5oC and 2oC of warming.
To moderate the most damaging effects of climate change, these reports demonstrated the need for significant additional greenhouse gas reductions beyond those established by the

Publication 20-02-020 Washington State Greenhouse Gas Emissions Inventory 1990-2018 Page 9 December 2020
Legislature in 2008. Ecology recommended in its 2019 report to the Legislature, Washington State Greenhouse Gas Reduction Limits:2
• Strengthening of the statutory greenhouse gas emissions limits;
• Creating new interim milestones;
• Setting a carbon neutral target in addition to the reduction limit for 2050.
This policy paper informed House Bill 2311, “Amending state greenhouse gas emission limits for consistency with the most recent assessment of climate change science,” that was signed into law on March 19, 2020 thus updating the greenhouse gas emissions reductions under RCW 70A.45.020. The updated requirements are more aggressive and include a state goal of achieving net zero greenhouse gas emissions by 2050. Table 1 summarizes the changes in Washington’s greenhouse gas emissions limits.
Table 1: Washington State GHG emissions limits: 2008 and 2020
Year 2008 GHG Emissions Limits
2020 GHG Emissions Limits
2020 Reduce to 1990 levels Reduce to 1990 levels
2030 45% below 1990
2035 25% below 1990
2040 70% below 1990
2050 50% below 1990 95% below 1990, achieve net zero
In addition, reporting requirements in RCW 70A.45.020 (2) now include greenhouse gas emissions from wildfires:
“By December 31st of each even-numbered year beginning in 2010, the department and the department of commerce shall report to the governor and the appropriate committees of the senate and house of representatives the total emissions of greenhouse gases for the preceding two years, and totals in each major source sector... The report must include greenhouse gas emissions from wildfires, developed in consultation with the department of natural resources…”
Because trees capture carbon as they grow, carbon dioxide emissions from wildfires are considered part of the natural carbon cycle. These emissions are tracked separately from anthropogenic greenhouse gas sources, i.e. human-caused activity such as combustion of fossil fuels.
2 Washington State Greenhouse Gas Emission Reduction Limits, report prepared under RCW 70.235.040, Dec. 2019, Publication 19-02-031
Publication 20-02-020 Washington State Greenhouse Gas Emissions Inventory 1990-2018 Page 10 December 2020
Greenhouse gas emissions inventory How the inventory was developed To develop an inventory of Washington’s greenhouse gas emissions, Ecology used a set of generally accepted principles and made adjustments as needed to apply them to Washington. The inventory is based on aggregated data for each source sector, not facility-specific emissions.
The data to develop this inventory are provided by the U.S. Environmental Protection Agency’s (EPA’s) State Inventory and Projection Tool (SIT). This greenhouse gas emissions tool has sector modules that are updated and released periodically throughout the year. The most complete annual greenhouse gas profile from these sector modules includes 2018 data.
In addition to U.S. EPA’s SIT tool, the Washington State Department of Commerce annually provides greenhouse gas emissions for the electricity sector calculated from fuel mix disclosure data.3 Each utility is required to report to the Department of Commerce the fuel mix that generates their electricity. Commerce then uses this information to determine an aggregated fuel mix for the entire state, from which electricity sector greenhouse gas emissions are calculated.
Greenhouse gas emission sectors For comparison to national and international greenhouse gas inventory data, Washington State greenhouse gas emissions data is categorized by sectors as listed below:
• Transportation. • Electricity consumption.4 • Residential, commercial, and industrial.5 • Fossil fuel industry.6 • Waste management. • Industrial processes.7 • Agriculture.
How greenhouse gas emissions are shown
3 https://www.commerce.wa.gov/growing-the-economy/energy/fuel-mix-disclosure/ 4 Electricity consumption – greenhouse gas emissions associated with Washington’s electricity demand 5 Residential, commercial, and industrial - greenhouse gas emissions from fuels combusted to primarily produce space heating and/or process heating 6 Fossil fuel industry – greenhouse gas emissions known as fugitive emissions from leaking or venting in processing or distribution systems 7 Industrial processes - non-combustion sources of greenhouse gas emissions from industrial processes

Publication 20-02-020 Washington State Greenhouse Gas Emissions Inventory 1990-2018 Page 11 December 2020
Carbon dioxide equivalent: The emissions inventory shows greenhouse gas emissions in million metric tons (MMT) of carbon dioxide equivalent (CO2e). Using carbon dioxide equivalent as a measurement allows us to capture the cumulative impacts of all greenhouse gases in one number.
Global Warming Potential (GWP): A greenhouse gas global warming potential is the ratio of its heat-trapping ability to that of carbon dioxide. For example, the global warming potential of nitrous oxide is 298 because one metric ton of nitrous oxide has 298 times more ability to trap heat in the atmosphere than one metric ton of carbon dioxide.
In 1992, the United States signed and ratified the United Nations Framework Convention on Climate Change (UNFCCC). Article 2 of the UNFCCC states:
…parties to the convention agreed to develop, periodically update, and publish, national inventories of anthropogenic emissions. The emissions are to be reported by sources and removals by sinks of all greenhouse gases not controlled by the Montreal Protocol, using comparable methodologies.
The United States fulfills these commitments by submitting EPA’s national greenhouse gas inventory report. Starting with 2013 greenhouse gas emission data, the United States and other developed countries have also agreed to submit to the UNFCCC annual inventories based on the use of Intergovernmental Panel on Climate Change (IPCC) Fourth Assessment Report (AR4) global warming potential values. Washington follows this guidance and methodology to develop this annual greenhouse gas inventory.
Greenhouse gases included in the inventory Washington’s greenhouse gas emissions inventory includes the greenhouse gases listed in Table 2. As stated previously, for greenhouse gas accounting, global warming potentials from the IPCC Fourth Assessment Report are required.
Table 2: Global warming potential factors for greenhouse gases, Fourth Assessment Report, 100-year time horizon
Greenhouse Gas Global Warming Potential Carbon dioxide (CO2) 1 Methane (CH4) 25 Nitrous oxide (N2O) 298 Hydrofluorocarbons (HFCs) 124-14,800 Perfluorocarbons (PFCs) 7,390-12,200 Nitrogen trifluoride (NF3) 17,200 Sulfur hexafluoride (SF6) 22,800
Findings: Inventory Results

Publication 20-02-020 Washington State Greenhouse Gas Emissions Inventory 1990-2018 Page 12 December 2020
Transportation continues to be the largest contributor of greenhouse gas emissions in Washington State. The data in Table 3 shows small annual variations within transportation subcategories. The 2018 inventory data indicates that emissions from electricity are declining primarily due to a reduction in coal-sourced electricity. Natural gas use continues to be a significant greenhouse gas emissions source in the residential, commercial and industrial sectors.
The total 2018 greenhouse gas emissions is estimated at 99.6 MMT CO2e. In addition to annual numbers shown in Table 3, page 13, the data are also presented as a three year average in Figure 9 on page 23. Figure 9 provides an overall percent contribution of each sector and subcategory. The three-year averaging smooths out annual variations due to data revisions reported in the periodic releases of the EPA SIT modules. Figure 9 provides a quick visual overview of the greenhouse gas sources that have the most impact in Washington state.
Due to recent significant wildfires, carbon emissions from this source have been added to the inventory report. Wildfire carbon emissions are considered biogenic greenhouse gas emissions i.e., emissions that are part of the natural carbon cycle. These emissions are tracked separately from the sector greenhouse gas emissions in Table 3. Figure 1 summarizes the carbon emissions from wildfires in Washington State from 2014 to 2018, including total acres burned.

Publication 20-02-020 Washington State Greenhouse Gas Emissions Inventory 1990-2018 Page 13 December 2020
Table 3: Washington State Total Annual GHG Emissions (MMT CO2e)8
Million metric tons CO2e 1990 2000 2010 2015 2016 2017 2018 Elecricity, net consumption-based 16.90 23.28 20.78 19.02 16.86 16.62 16.21 Coal 16.80 17.40 15.83 14.03 12.51 12.39 11.70 Natural gas 0.10 5.28 4.84 4.91 4.28 4.14 4.48 Petroleum 0.00 0.60 0.10 0.07 0.06 0.08 0.02 Biomass and waste (CH4 and N2O) 0.00 0.00 0.01 0.01 0.01 0.01 0.01 Residential/Commercial/Industial (RCI) 18.65 20.13 19.77 20.71 21.98 23.10 23.28 Coal 0.61 0.00 0.25 0.18 0.18 0.13 0.13 Natural gas 8.62 11.37 10.81 11.21 11.86 13.30 12.63 Oil 9.16 8.51 8.44 9.05 9.55 9.28 10.12 Wood (CH4 and N2O) 0.26 0.25 0.27 0.27 0.39 0.40 0.40 Transportation 37.90 44.87 40.21 40.98 43.70 43.26 44.73 On-road gasoline 20.70 24.48 21.78 21.42 21.56 21.53 22.33 On-road diesel 4.22 7.72 7.54 8.15 8.61 8.36 8.87 Marine vessels 2.48 1.76 1.61 1.92 3.02 2.49 2.28 Jet fuel and aviation gasoline 9.10 10.05 8.11 7.77 8.63 9.29 9.40 Rail 0.80 0.30 0.53 0.80 0.87 0.61 0.82 Natural gas, LPG 0.60 0.57 0.64 0.92 1.02 0.99 1.02 Fossil fuel industry 0.58 0.73 0.81 0.84 0.84 0.84 0.83 Natural gas industry (CH4) 0.58 0.73 0.81 0.84 0.84 0.84 0.83 Coal mining (CH4) 0.00 0.00 0.00 0.00 0.00 0.00 0.00 Oil industry (CH4) 0.00 0.00 0.00 0.00 0.00 0.00 0.00 Industrial processes 7.00 10.01 4.97 5.28 5.29 5.30 5.42 Cement manufacture (CO2) 0.20 0.44 0.28 0.33 0.37 0.36 0.39 Aluminum production (CO2, PFC) 5.90 7.38 1.32 0.96 0.90 0.88 0.92 Limestone and dolomite use (CO2) 0.00 0.02 0.02 0.02 0.02 0.02 0.02 Soda ash 0.10 0.10 0.05 0.05 0.05 0.05 0.05 ODS substitutes (HFC, PFC)9 0.00 1.62 3.08 3.76 3.78 3.81 3.87 Semiconductor mfg (HFC, PFC, SF4, NF3) 0.00 0.09 0.08 0.08 0.09 0.08 0.08 Electric power T&D (SF4) 0.80 0.36 0.14 0.10 0.10 0.10 0.10 Waste management 3.12 2.84 3.45 2.33 2.43 2.45 2.39 Solid waste management 2.58 2.16 2.68 1.51 1.60 1.61 1.53 Wastewater management 0.55 0.68 0.77 0.82 0.83 0.84 0.86 Agriculture 6.34 6.76 6.39 6.77 6.77 6.70 6.71 Enteric fermentation 2.62 2.57 2.40 2.58 2.62 2.62 2.65 Manure management 0.86 1.24 1.37 1.67 1.49 1.50 1.49 Agriculture soils 2.86 2.94 2.68 2.52 2.66 2.58 2.58 Total gross emissions 90.49 108.62 96.38 95.94 97.86 98.28 99.57
8 Totals may not equal exact sum of subtotals shown in this table due to independent rounding 9 ODS substitutes: HFC’s and PFC’s consumed as substitutes for ozone-depleting substances (ODS)

Publication 20-02-020 Washington State Greenhouse Gas Emissions Inventory 1990-2018 Page 14 December 2020
Figure 1: Greenhouse gas emissions from wildfires in Washington State. Acres burned may include forest and non-forest land.10
10 Summary of Natural and Working Lands Carbon Inventories and Incentive Programs in Washington, Washington Department of Natural Resources, December 1, 2020. See table on page 7. https://app.leg.wa.gov/ReportsToTheLegislature/Home/GetPDF?fileName=DNR%20Carbon%20Sequestration%20Report_8f19b00b-5acf-4c97-83b4-16cecb559803.pdf
3.95
17.97
0.89
11.48
4.95
0
2
4
6
8
10
12
14
16
18
20
2014 2015 2016 2017 2018
MM
T CO
2eGreenhouse Gases from Wildfires in WA State, MMT CO2e
1,130,625434,087acres burned 304,625 402,262 399,641
Publication 20-02-020 Washington State Greenhouse Gas Emissions Inventory 1990-2018 Page 15 December 2020
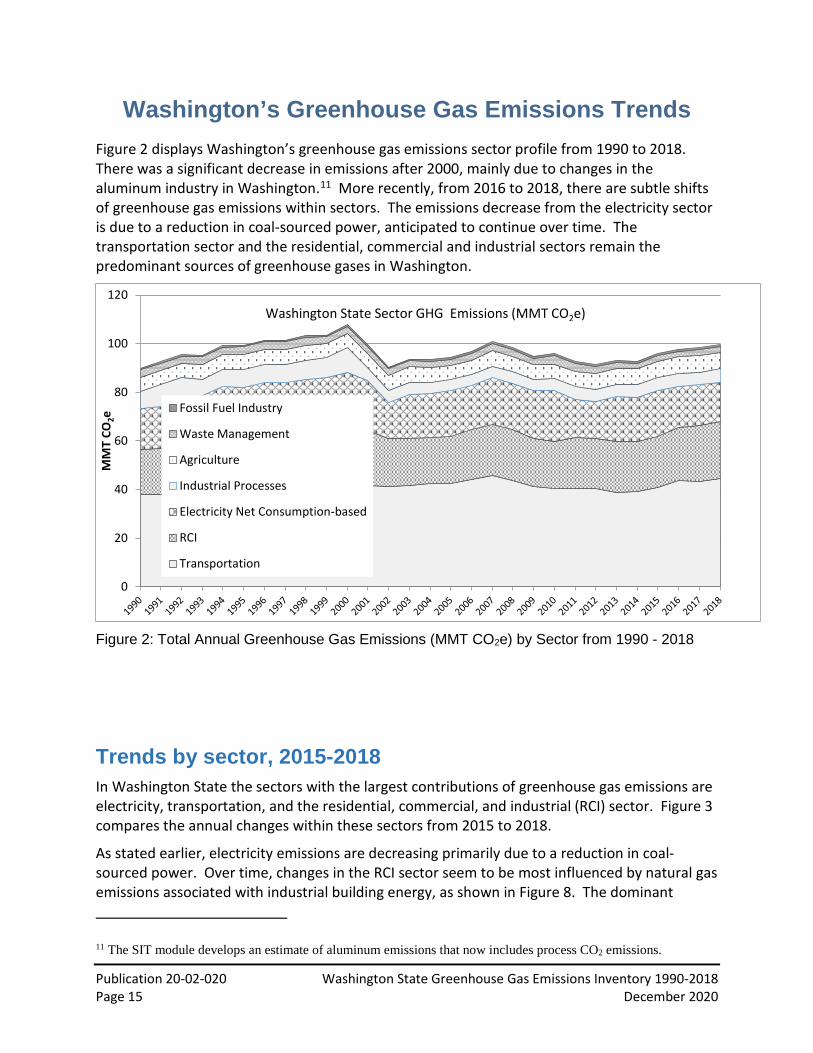
Washington’s Greenhouse Gas Emissions Trends Figure 2 displays Washington’s greenhouse gas emissions sector profile from 1990 to 2018. There was a significant decrease in emissions after 2000, mainly due to changes in the aluminum industry in Washington.11 More recently, from 2016 to 2018, there are subtle shifts of greenhouse gas emissions within sectors. The emissions decrease from the electricity sector is due to a reduction in coal-sourced power, anticipated to continue over time. The transportation sector and the residential, commercial and industrial sectors remain the predominant sources of greenhouse gases in Washington.
Figure 2: Total Annual Greenhouse Gas Emissions (MMT CO2e) by Sector from 1990 - 2018
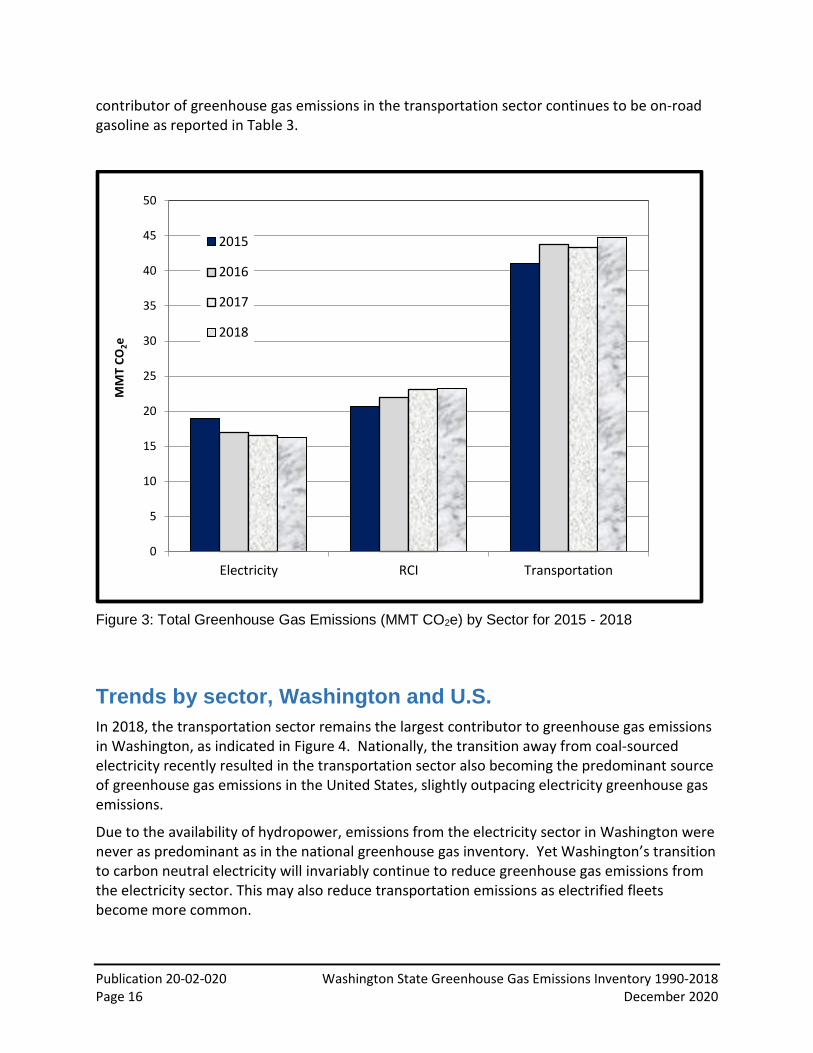
Trends by sector, 2015-2018 In Washington State the sectors with the largest contributions of greenhouse gas emissions are electricity, transportation, and the residential, commercial, and industrial (RCI) sector. Figure 3 compares the annual changes within these sectors from 2015 to 2018.
As stated earlier, electricity emissions are decreasing primarily due to a reduction in coal-sourced power. Over time, changes in the RCI sector seem to be most influenced by natural gas emissions associated with industrial building energy, as shown in Figure 8. The dominant
11 The SIT module develops an estimate of aluminum emissions that now includes process CO2 emissions.
0
20
40
60
80
100
120
MM
T CO
2e
Fossil Fuel Industry
Waste Management
Agriculture
Industrial Processes
Electricity Net Consumption-based
RCI
Transportation
Washington State Sector GHG Emissions (MMT CO2e)
Publication 20-02-020 Washington State Greenhouse Gas Emissions Inventory 1990-2018 Page 16 December 2020
contributor of greenhouse gas emissions in the transportation sector continues to be on-road gasoline as reported in Table 3.
Figure 3: Total Greenhouse Gas Emissions (MMT CO2e) by Sector for 2015 - 2018
Trends by sector, Washington and U.S. In 2018, the transportation sector remains the largest contributor to greenhouse gas emissions in Washington, as indicated in Figure 4. Nationally, the transition away from coal-sourced electricity recently resulted in the transportation sector also becoming the predominant source of greenhouse gas emissions in the United States, slightly outpacing electricity greenhouse gas emissions.
Due to the availability of hydropower, emissions from the electricity sector in Washington were never as predominant as in the national greenhouse gas inventory. Yet Washington’s transition to carbon neutral electricity will invariably continue to reduce greenhouse gas emissions from the electricity sector. This may also reduce transportation emissions as electrified fleets become more common.
0
5
10
15
20
25
30
35
40
45
50
Electricity RCI Transportation
MM
T CO
2e
2015
2016
2017
2018

Publication 20-02-020 Washington State Greenhouse Gas Emissions Inventory 1990-2018 Page 17 December 2020
Figure 4: Percent comparison of Greenhouse Gas Emissions by Sector - 2018, Washington and U.S.12
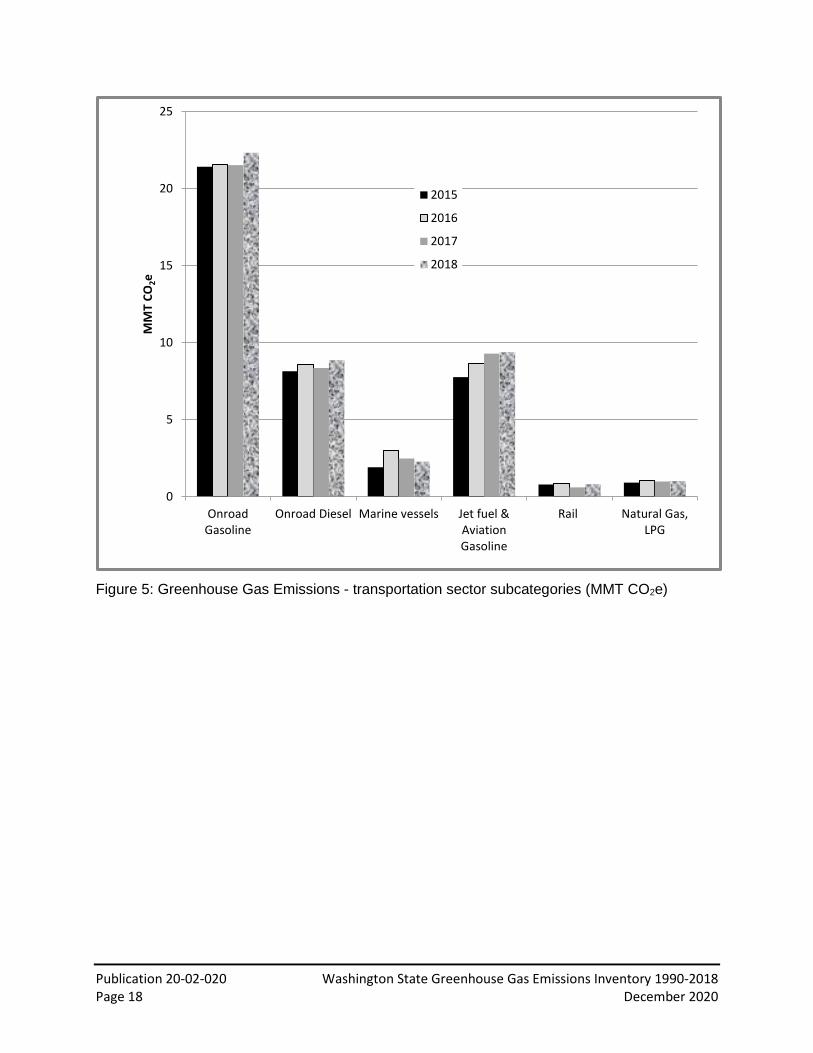
Summary of results by sector Transportation sector In 2018, transportation was the sector in Washington that contributed the most greenhouse gas emissions. This sector includes emissions from marine, rail, and aviation engines; however, on-road gasoline vehicles remain the single largest contributor to transportation greenhouse gas emissions. Greenhouse gas emissions from other transportation subcategories are fairly consistent over time; however, the data indicate an increasing trend in aviation emissions (Figure 5).
12 Source: Inventory of U.S. Greenhouse Gas Emissions and Sinks: 1990 – 2018, Table ES-2 https://www.epa.gov/ghgemissions/inventory-us-greenhouse-gas-emissions-and-sinks-1990-2018
0
5
10
15
20
25
30
35
40
45
50
RCI Transportation IndustrialProcesses
Waste Agriculture Electricity Fossil FuelIndustries
2018 WA State 2018 US
perc
ente
miss
ions
Publication 20-02-020 Washington State Greenhouse Gas Emissions Inventory 1990-2018 Page 18 December 2020
Figure 5: Greenhouse Gas Emissions - transportation sector subcategories (MMT CO2e)
0
5
10
15
20
25
OnroadGasoline
Onroad Diesel Marine vessels Jet fuel &AviationGasoline
Rail Natural Gas,LPG
MM
T CO
2e
2015
2016
2017
2018

Publication 20-02-020 Washington State Greenhouse Gas Emissions Inventory 1990-2018 Page 19 December 2020
Electricity sector Despite the large availability of clean hydroelectricity, Washington also uses electricity produced from burning coal and natural gas, as shown in Figure 6. Some of this electricity is generated within Washington and some is imported from other states.
Figure 6: Percent distribution of electricity energy source.13
Washington’s greenhouse gas emissions from electricity are estimated using a consumption-based (or “load-based”) approach. In other words, emissions are calculated based on the emissions profile of the power sources that deliver electricity to Washington consumers, regardless of where those power sources are located. For example large coal plants in Montana and Wyoming provide a portion of the emissions associated with electricity use in Washington. Greenhouse gas emissions from electricity are anticipated to continue to decline as cleaner generation replaces the use of coal-sourced power. This decline is expected to be driven in, in large part, by the 2019 Clean Energy Transformation Act, which requires all electricity supplied to Washington consumers to be renewable or non-emitting by 2045. Trends in greenhouse gas emissions from electricity consumption are shown in Figure 7.
13 https://www.commerce.wa.gov/growing-the-economy/energy/fuel-mix-disclosure/ see Fuel Mix Aggregate Time Series 2019 (CY 2018)
0%
10%
20%
30%
40%
50%
60%
70%
80%
90%
100%
2000 2001 2002 2003 2004 2005 2006 2007 2008 2009 2010 2011 2012 2013 2014 2015 2016 2017 2018
Hydropower Unspecified Coal Natural Gas Nuclear Wind Other

Publication 20-02-020 Washington State Greenhouse Gas Emissions Inventory 1990-2018 Page 20 December 2020
Figure 7: Annual GHG emissions from Electricity (Consumption-Based)
Residential, commercial, and industrial (RCI) sectors Greenhouse gas emissions in this sector occur from energy consumption when fuels are combusted to provide heat, including space heating and process heating (heating necessary for production processes or other applications).
The RCI sector is a relatively large contributor of greenhouse gas emissions in Washington. In 2018 greenhouse gas emissions for each sub-sector of RCI were:
• 12.6 MMT CO2e from industrial space and process heating. • 5.9 MMT CO2e from residential space heating. • 4.9 MMT CO2e commercial space and process heating.
As Figure 8 shows industrial space and/or process heating continues to be the largest contributor of greenhouse gas emissions in the RCI sector. Both natural gas and petroleum are greenhouse gas sources within the industrial sub-sector, see Table 3. Natural gas is the predominant fuel influencing greenhouse gas emissions from the residential and commercial sub-sectors.
14.515
15.516
16.517
17.518
18.519
19.5
2015 2016 2017 2018
MM
T CO
2eElectricity Consumption-based GHG Emissions
(MMT CO2e)

Publication 20-02-020 Washington State Greenhouse Gas Emissions Inventory 1990-2018 Page 21 December 2020
Figure 8: Residential, Commercial and Industrial sectors: GHG emissions, 2015 - 2018
Fossil fuel industry sector The fossil fuel industry sector includes fugitive methane emissions due to leakage and venting from Washington from natural gas pipelines, and petroleum systems. In 2018, these emissions were about 1.0 percent of Washington’s total greenhouse gas emissions.
Waste management sector The waste management sector includes greenhouse gas emissions from landfills and wastewater treatment facilities. This inventory does not include waste exported from Washington to other states for disposal. Washington’s 2018 greenhouse gas emissions from this sector are about 2.4 percent of the total emissions.
Industrial processes sector The industrial processes sector includes greenhouse gas emissions where the process itself produces greenhouse gas emissions, e.g., aluminum and cement manufacturing; and fugitive emissions such as sulfur hexafluoride (SF6) released from electric power transmission and distribution systems. Washington also produces small amounts of lime and nitric acid which are expected to have relatively low emissions due to their low levels of production; therefore, these estimates are excluded. In 2018, greenhouse gas emissions from the industrial processes sector contributed about 5 percent of Washington’s total greenhouse gas emissions.
0
2
4
6
8
10
12
14
2015 2016 2017 2018
MM
T CO
2eRCI GHG Emissions (MMT CO2e)
Residential Commercial Industrial

Publication 20-02-020 Washington State Greenhouse Gas Emissions Inventory 1990-2018 Page 22 December 2020
Agriculture sector Agricultural activities such as manure management, fertilizer use, and livestock digestion processes (enteric fermentation) result in methane and nitrous oxide emissions. In 2018, these agricultural emissions accounted for about 6.7 percent of Washington’s total greenhouse gas emissions.
Multi- year Greenhouse Gas Averages Because of the potential for annual data fluctuations in greenhouse gas emissions within sectors, it is useful to display the data as multi-year averages. These fluctuations may occur due to variations in hydro power and with the availability of more refined data or methodology modifications in the periodic releases of the EPA SIT modules.
Figure 9 presents a three-year averaging of greenhouse gas emissions from each sector. The inner circle displays the percent distribution of the sectors. The outer ring provides the percent distribution from each source within each sector.
The donut graph in Figure 9 also provides a visua overviewl of the predominant greenhouse gas sources in Washington State. These sources are:
1. Transportation, specifically on-road gasoline;
2. The Industrial component of the combined residential-commercial-industrial sectors, specifically natural gas and petroleum;
3. Coal in the electricity sector, which is expected to decline with reduced consumption of coal-sourced power.

Publication 20-02-020 Washington State Greenhouse Gas Emissions Inventory 1990-2018 Page 23 December 2020
Figure 9: Washington GHG emissions, 3-year average (2016-2018) ~98.5 MMT CO2e
Transportation45%
Agriculture 7%
Electricity Consumption
17%
Resi
dent
ial6
%
Industrial19%
Onroad Gasoline22.1%
Onroad Diesel8.7%
Marine Vessels2.6%
Jet Fuel and Aviation Gasoline
9.2%
Rail0.8%
Natural Gas, LPG1.0%
Solid Waste1.6%
Wastewater0.9%
Enteric Fermentation2.7%
Manure Management1.5%
Agricultural Soils2.6%
Coal12.4%
Natural Gas4.4%
Natural Gas4.9%
Other1.0% Natural Gas
3.3%Other1.4% Natural Gas
4.6%
Petroleum/Other7.8%
Natural Gas Distribution
0.8%
Industrial Processes
1.5%
ODS Substitutes3.9%
Washington Greenhouse Gas Emissions3-year Average (2016-2018)
~98.5 million metric tons of CO2e

Publication 20-02-020 Washington State Greenhouse Gas Emissions Inventory 1990-2018 Page 24 December 2020
Next Steps The 2019 annual Washington greenhouse gas inventory will be completed with the release of the relevant U.S.EPA SIT modules, anticipated by the end of 2021. These data will be made available on Ecology’s website as soon as the complete 2019 profile is available. The next legislative report on the Washington State Greenhouse Gas Inventory is scheduled for December 2022.
Conclusion This inventory summarizes the greenhouse gas emissions from specific sectors in Washington from the 1990 baseline through 2018.
Key points are:
• Washington’s 2018 total greenhouse gas emissions were 99.6 million metric tons (MMT).
• Washington’s 2018 total greenhouse gas emissions were 9.1 MMT higher than the 1990 baseline.
• Compared nationally, the electricity sector in Washington contributes significantly lower greenhouse gas emissions because of the widespread use of hydropower. In 2018, emissions from Washington’s electricity consumption decreased to 16.3 percent of total emissions.
• In 2018, Washington’s largest contributors of greenhouse gases were:
o Transportation sector at 44.9 percent.
o Residential, commercial, and industrial space and/or process heating at 23.4 percent.
o Electricity sector at 16.3 percent and anticipated to continue to decrease due to new 2019/2020 legislation.