
Greenhouse gas emissions in the Netherlands 1990–2018 ...
528
Greenhouse gas emissions in the Netherlands 1990–2018 National Inventory Report 2020 15 April 2020
Transcript of Greenhouse gas emissions in the Netherlands 1990–2018 ...

0119
42
Committed to health and sustainability
Published by
National Institute for Public Healthand the Environment, RIVMP.O. Box 1 | 3720 BA BilthovenThe Netherlandswww.rivm.nl/en
April 2020
RIVM Report 2020-0031
P.G. Ruyssenaars | P.W.H.G. Coenen1 | J.D. Rienstra² | P.J. Zijlema² | E.J.M.M. Arets⁶ | K. Baas³ | R. Dröge¹ | G. Geilenkirchen⁵ | M. ’t Hoen⁵ | E. Honig | B. van Huet⁷ | E.P. van Huis⁴| W.W.R. Koch¹ |L.L. Lagerwerf | R.A. te Molder | J.A. Montfoort | C.J. Peek | J. Vonk | M.C. van Zanten
¹ Netherlands Organization for Applied Scientific Research (TNO), P.O. Box 80015, NL-3508 TA Utrecht² Netherlands Enterprise Agency (RVO.nl), P.O. Box 8242, NL-3503 RE Utrecht³ Statistics Netherlands (in Dutch: ‘Centraal Bureau voor de Statistiek’, CBS), P.O. Box 24500, NL-2490 HA Den Haag⁴ Dutch Emissions Authority (NEa), P.O. Box 91503, NL-2509 EC Den Haag⁵ PBL Netherlands Environmental Assessment Agency, P.O. Box 30314 NL-2500 GH Den Haag⁶ Wageningen Environmental Research (Alterra) Wageningen UR, P.O. Box 47 NL-6700 AA Wageningen⁷ Rijkswaterstaat, P.O. Box 2232, NL-3500 GE Utrecht
Greenhouse gas emissions in the Netherlands 1990–2018 National Inventory Report 2020
15 April 2020

Page 1 of 525
Greenhouse gas emissions in the Netherlands 1990–2018 National Inventory Report 2020 15 April 2020
RIVM report 2020-0031

RIVM report 2020-0031
Page 2 of 525
Colophon
© RIVM 2020 National Institute for Public Health and the Environment (RIVM), P.O. Box 1, 3720 BA Bilthoven, Netherlands; Tel: +31-30-274 91 11; Fax: +31-30-278 75 31; www.rivm.nl/en. Parts of this publication may be reproduced, provided acknowledgement is given to the ‘National Institute for Public Health and the Environment’, along with the title and year of publication. DOI 10.21945/RIVM-2020-0031
P.G. Ruyssenaars, P.W.H.G. Coenen1, J.D. Rienstra2, P.J. Zijlema2, E.J.M.M. Arets6, K. Baas3, R. Dröge1, G. Geilenkirchen5, M. ’t Hoen5, E. Honig, B. van Huet7, E.P. van Huis4, W.W.R. Koch1, L.A. Lagerwerf, R.M. te Molder, J.A. Montfoort, J. Vonk, M.C. van Zanten, 1 Netherlands Organisation for Applied Scientific Research (TNO),
P.O. Box 80015, NL-3508 TA Utrecht 2 Netherlands Enterprise Agency (RVO), P.O. Box 8242, NL-3503 RE
Utrecht 3 Statistics Netherlands (in Dutch: Centraal Bureau voor de Statistiek,
CBS), P.O. Box 24500, NL-2490 HA Den Haag 4 Dutch Emissions Authority (NEa), P.O. Box 91503, NL-2509 EC Den
Haag 5 PBL Netherlands Environmental Assessment Agency, P.O. Box 30314,
NL-2500 GH Den Haag 6 Wageningen Environmental Research (Alterra) Wageningen UR,
P.O. Box 47, NL-6700 AA Wageningen 7 Rijkswaterstaat, P.O. Box 2232, NL-3500 GE Utrecht Contacts: Margreet van Zanten (RIVM) ([email protected]) Jorieke Rienstra (NIE / Netherlands Enterprise Agency (RVO)) ([email protected]) This report has been compiled by order and for the account of the Ministry of Economic Affairs and Climate Policy, within the framework of the project Emission Registration M/240037/20/NI, Netherlands Pollutant Release & Transfer Register. Report prepared for submission in accordance with the United Nations Framework Convention on Climate Change (UNFCCC) and the European Union’s Greenhouse Gas Monitoring Mechanism [including electronic Common Reporting Format (CRF) Excel spreadsheet files containing the data for 1990 to 2018].
Published by: National Institute for Public Health and the Environment, RIVM P.O. Box1 | 3720 BA Bilthoven The Netherlands www.rivm.nl/en

RIVM report 2020-0031
Page 3 of 525
Acknowledgements
Many colleagues from a number of organisations – Statistics Netherlands (CBS), Wageningen Environmental Research (WUR), Netherlands Enterprise Agency (RVO), Netherlands Environmental Assessment Agency (PBL), RIVM and TNO – have been involved in the annual update of the Netherlands Pollutant Release and Transfer Register (NL-PRTR), also called the Emission Registration (ER) system, which contains emissions data on about 350 pollutants. The emissions calculations, including those for greenhouse gas (GHG) emissions, are performed by members of the PRTR Task Forces. This is a major task, since the Netherlands’ inventory contains details of many emissions sources. These calculations form the basis for this National Inventory Report 2020 (NIR 2020). The emissions and activity data of the Netherlands’ inventory were converted into the IPCC1 source categories contained in the Common Reporting Format (CRF) tables, which form a supplement to this report. The description of the various sources, the analysis of trends and the uncertainty estimates (see Chapters 3 to 8) were made in cooperation with the following emissions experts: Eric Arets (KP and Land use), Bas van Huet (Waste), Gerben Geilenkirchen and Maarten ‘t Hoen (Transport), Romuald te Molder and Jolien van Huijstee (key categories and uncertainty analysis), Rianne Dröge (Energy and uncertainty assessment), Johanna Montfoort (Fugitive emissions), Erik Honig (Industrial processes and product use, data control, chart production), Kees Baas (Wastewater handling), Lotte Lagerwerf and Jan Vonk (Agriculture). In addition, Bas Guis provided pivotal information on CO2 emissions related to energy use. This group also provided activity data and additional information for the CRF tables in cases where these were not included in the data sheets submitted by the PRTR Task Forces. We are particularly grateful to Bert Leekstra, Dirk Wever and Jacqueline Wanders for their contributions to data processing, chart production and quality control. We greatly appreciate the contributions of each of these groups and individuals to this National Inventory Report and supplemental CRF tables, as well as those of the external reviewers who provided comments on an earlier draft of this report.
1 Intergovernmental Panel on Climate Change

RIVM report 2020-0031
Page 4 of 525
RIVM report 2020-0031
Page 5 of 525
Synopsis
Greenhouse gas emissions in the Netherlands 1990–2018 Total greenhouse gas (GHG) emissions in the Netherlands in 2018 decreased by approximately 2.7 percent, in comparison with 2017 emissions. This decrease was mainly the result of decreased coal combustion for energy and heat production. In 2018, total GHG emissions (including indirect CO2 emissions and excluding emissions from Land use, land use change and forestry (LULUCF)) in the Netherlands amounted to 188.2 Tg CO2 eq. This is approximately 15.1 percent below the emissions in the base year 1990 (221.7 Tg CO2 eq.). CO2 emissions in 2018 were 1.6 percent below the level in the base year. The total of the emissions of methane, nitrous oxide and fluorinated gases (CH4, N2O and F-gases) was reduced by more than 50% over this period. This report documents the Netherlands’ annual submission for 2020 of its GHG emissions inventory in accordance with the 2006 IPCC Guidelines for National Greenhouse Gas Inventories (IPCC, 2006) prescribed by the United Nations Framework Convention on Climate Change (UNFCCC), the Kyoto Protocol (KP) and the European Union’s Greenhouse Gas Monitoring Mechanism. This report includes explanations of observed trends in emissions, an assessment of the sources with the highest contribution to total national emissions (key sources) and a description of the uncertainty in the emissions estimates. Estimation methods, data sources and emission factors (EFs) are described for each source category, and there is also a description of the quality assurance system and the verification activities performed on the data. The report also describes changes in methodologies since the previous submission (NIR 2019), the results of recalculations and planned improvements. Keywords: greenhouse gases, emissions, trends, methodology, climate

RIVM report 2020-0031
Page 6 of 525

RIVM report 2020-0031
Page 7 of 525
Publiekssamenvatting
Emissies van broeikasgassen tussen 1990 en 2018 In 2018 is de totale uitstoot van broeikasgassen in Nederland met 2,7 procent gedaald ten opzichte van 2017. Deze daling komt vooral doordat er minder kolen zijn gebruikt om elektriciteit te produceren. De totale uitstoot van broeikasgassen naar de lucht wordt uitgedrukt in CO2-equivalenten en bedroeg in 2018 188,2 miljard kilogram. Het jaar 1990 geldt als referentiejaar (het zogeheten Kyoto-basisjaar) voor de te halen doelstellingen. De uitstoot in 1990 bedroeg 221,7 miljard kilogram CO2-equivalenten. Ten opzichte van het basisjaar is de uitstoot gedaald met 15,1 procent. De uitstoot van CO2 alleen ligt 1,6 procent onder het niveau van het basisjaar. De uitstoot van de andere broeikasgassen (methaan, distikstofoxide en gefluoreerde gassen) is sinds 1990 met meer dan 50 procent gedaald. Dit blijkt uit de inventarisatie van broeikasgasemissies die het RIVM jaarlijks op verzoek van het Ministerie van Economische Zaken en Klimaat (EZK) opstelt. Met deze inventarisatie voldoet Nederland aan de nationale rapportageverplichtingen voor 2020 van het Klimaatverdrag van de Verenigde Naties (UNFCCC), van het Kyoto Protocol en van het Bewakingsmechanisme Broeikasgassen van de Europese Unie. De inventarisatie bevat verder analyses van ontwikkelingen in de uitstoot van broeikasgassen tussen 1990 en 2018, een analyse van de belangrijkste bronnen die broeikasgassen uitstoten (‘sleutelbronnen’), evenals de onzekerheid in hun uitstoot. Daarnaast zijn de gebruikte berekeningsmethoden en databronnen beschreven. Ten slotte bevat het een overzicht van het kwaliteitssysteem en de manier waarop de Nederlandse Emissieregistratie de berekeningen controleert. Kernwoorden: broeikasgassen, emissies, trends, methodiek, klimaat

RIVM report 2020-0031
Page 8 of 525

RIVM report 2020-0031
Page 9 of 525
Contents
Samenvatting — 17
Executive summary — 21
Part I: Annual inventory report — 29
1 Introduction — 31 1.1 Background information on greenhouse gas inventories and climate
change — 31 1.1.1 Background information on climate change reporting — 31 1.1.2 Background information on the GHG emissions inventory — 31 1.1.3 Background information on supplementary information required by
Article 7 of the Kyoto Protocol — 33 1.2 Description of the national inventory arrangements — 33 1.2.1 Institutional, legal and procedural arrangements — 33 1.2.2 Overview of inventory planning, preparation and management — 34 1.2.3 Reporting, QA/QC, archiving and overall coordination — 35 1.3 Inventory preparation: data collection, processing and storage — 43 1.3.1 GHG and KP-LULUCF inventory — 43 1.3.2 Data collection — 44 1.3.3 Data processing and storage — 45 1.4 General description of methodologies (including tiers used) and data
sources used — 46 1.4.1 GHG emissions inventory — 46 1.4.2 Data sources — 50 1.4.3 KP-LULUCF inventory — 51 1.5 Brief description of key categories — 52 1.5.1 GHG emissions inventory — 52 1.5.2 KP-LULUCF inventory — 52 1.6 General uncertainty evaluation, including data on the overall uncertainty
of the inventory totals — 52 1.6.1 GHG emissions inventory — 53 1.6.2 KP-LULUCF inventory — 56 1.7 General assessment of completeness — 57 1.7.1 GHG emissions inventory — 57 1.7.2 KP-LULUCF inventory — 57
2 Trends in GHG emissions — 59 2.1 Emissions trends for aggregated GHG emissions — 59 2.2 Emissions trends by gas — 62 2.2.1 Carbon dioxide — 62 2.2.2 Methane — 66 2.2.3 Nitrous oxide — 67 2.2.4 Fluorinated gases — 69 2.2.5 Uncertainty in emissions specified by greenhouse gas — 70 2.3 Emissions trends by source category — 70 2.3.1 Uncertainty in emissions by sector — 71 2.4 Emissions trends for indirect greenhouse gases and SO2 — 71

RIVM report 2020-0031
Page 10 of 525
3 Energy (CRF sector 1) — 73 3.1 Overview of sector — 73 3.1.1. Energy supply and energy demand — 73 3.1.2 Trends in fossil fuel use and fuel mix — 74 3.1.3 GHG emissions from the Energy sector — 75 3.1.4 Overview of shares and trends in emissions — 75 3.2 Fuel combustion (1A) — 76 3.2.1 Comparison of the Sectoral Approach with the Reference Approach — 77 3.2.2 International bunker fuels (1D) — 81 3.2.3 Feed stocks and non-energy use of fuels — 82 3.2.4 Energy industries (1A1) — 83 3.2.5 Manufacturing industries and construction (1A2) — 93 3.2.6 Transport (1A3) — 105 3.2.7 Other sectors (1A4) — 119 3.2.8 Other (1A5) — 126 3.3 Fugitive emissions from fuels (1B) — 127 3.3.1 Solid fuels (1B1) — 128 3.3.2 Oil and natural gas (1B2) — 129 3.4 CO2 transport and storage (1C) — 133
4 Industrial processes and product use (CRF sector 2) — 135 4.1 Overview of sector — 135 4.2 Mineral products (2A) — 138 4.2.1 Source category description — 138 4.2.2 Methodological issues — 139 4.2.3 Uncertainty and time series consistency — 142 4.2.4 Category-specific QA/QC and verification — 143 4.2.5 Category-specific recalculations — 143 4.2.6 Category-specific planned improvements — 143 4.3 Chemical industry (2B) — 143 4.3.1 Source category description — 143 4.3.2 Methodological issues — 150 4.3.3 Uncertainty and time series consistency — 153 4.3.4 Category-specific QA/QC and verification — 153 4.3.5 Category-specific recalculations — 154 4.3.6 Category-specific planned improvements — 154 4.4 Metal production (2C) — 154 4.4.1 Source category description — 154 4.4.2 Methodological issues — 156 4.4.3 Uncertainty and time series consistency — 157 4.4.4 Category-specific QA/QC and verification — 157 4.4.5 Category-specific recalculations — 157 4.4.6 Category-specific planned improvements — 157 4.5 Non-energy products from fuels and solvent use (2D) — 157 4.5.1 Source category description — 157 4.5.2 Methodological issues — 158 4.5.3 Uncertainty and time series consistency — 158 4.5.4 Category-specific QA/QC and verification — 159 4.5.5 Category-specific recalculations — 159 4.5.6 Category-specific planned improvements — 159 4.6 Electronics industry (2E) — 159 4.6.1 Source category description — 159 4.6.2 Methodological issues — 160 4.6.3 Uncertainty and time series consistency — 160

RIVM report 2020-0031
Page 11 of 525
4.6.4 Category-specific QA/QC and verification — 160 4.6.5 Category-specific recalculations — 160 4.6.6 Category-specific planned improvements — 160 4.7 Product use as substitutes for ODS (2F) — 160 4.7.1 Source category description — 160 4.7.2 Methodological issues — 163 4.7.3 Uncertainty and time series consistency — 164 4.7.4 Category-specific QA/QC and verification — 165 4.7.5 Category-specific recalculations — 166 4.7.6 Category-specific planned improvements — 167 4.8 Other product manufacture and use (2G) — 167 4.8.1 Source category description — 167 4.8.2 Methodological issues — 168 4.8.3 Uncertainty and time series consistency — 169 4.8.4 Category-specific QA/QC and verification — 170 4.8.5 Category-specific recalculations — 170 4.8.6 Category-specific planned improvements — 170 4.9 Other (2H) — 170 4.9.1 Source category description — 170 4.9.2 Methodological issues — 170 4.9.3 Uncertainty and time series consistency — 171 4.9.4 Category-specific QA/QC and verification — 171 4.9.5 Category-specific recalculations — 171 4.9.6 Category-specific planned improvements — 171
5 Agriculture (CRF sector 3) — 173 5.1 Overview of sector — 174 5.1.1 Overview of shares and trends in emissions — 176 5.1.2 Overview of trends in activity data — 176 5.2 Enteric fermentation (3A) — 179 5.2.1 Source category description — 179 5.2.2 Methodological issues — 180 5.2.3 Uncertainty and time series consistency — 181 5.2.4 Category-specific QA/QC and verification — 181 5.2.5 Category-specific recalculations — 181 5.2.6 Category-specific planned improvements — 181 5.3 Manure management (3B) — 182 5.3.1 Source category description — 182 5.3.2 Methodological issues — 186 5.3.3 Uncertainty and time series consistency — 189 5.3.4 Category-specific QA/QC — 189 5.3.5 Category-specific recalculations — 189 5.3.6 Category-specific planned improvements — 189 5.4 Agricultural soils (3D) — 189 5.4.1 Source category description — 189 5.4.2 Methodological issues — 192 5.4.3 Uncertainty and time series consistency — 194 5.4.4 Category-specific QA/QC — 194 5.4.5 Category-specific recalculations — 194 5.4.6 Category-specific planned improvements — 195 5.5 Liming (3G) — 195 5.5.1 Source category description — 195 5.5.2 Methodological issues — 196 5.5.3 Uncertainty and time series consistency — 196

RIVM report 2020-0031
Page 12 of 525
5.5.4 Category-specific QA/QC and verification — 196 5.5.5 Category-specific recalculations — 196 5.5.6 Category-specific planned improvements — 196
6 Land use, land use change and forestry (CRF sector 4) — 197 6.1 Overview of sector — 198 6.1.1 General overview of shares and trends in sources and sinks — 198 6.1.2 Methodology and coverage — 200 6.1.3 Changes this year and recalculations for years previously
reported — 206 6.2 Land use definitions and the classification systems — 208 6.3 Information on approaches used to representing land areas and land use
databases used for the inventory preparation — 211 6.4 Forest land (4A) — 214 6.4.1 Source category description — 214 6.4.2 Methodological issues — 214 6.4.4 Category-specific QA/QC and verification — 222 6.4.5 Category-specific recalculations — 223 6.4.6 Category-specific planned improvements — 223 6.5 Cropland (4B) — 223 6.5.1 Source category description — 223 6.5.2 Methodological issues — 224 6.5.3 Uncertainty and time series consistency — 224 6.5.4 Category-specific QA/QC and verification — 225 6.5.5 Category-specific recalculations — 225 6.5.6 Category-specific planned improvements — 225 6.6 Grassland (4C) — 225 6.6.1 Source category description — 225 6.6.2 Methodological issues — 227 6.6.3 Uncertainty and time series consistency — 231 6.6.4 Category-specific QA/QC and verification — 232 6.6.5 Category-specific recalculations — 232 6.6.6 Category-specific planned improvements — 232 6.7 Wetland (4D) — 233 6.7.1 Source category description — 233 6.7.2 Methodological issues — 233 6.7.3 Uncertainty and time series consistency — 233 6.7.4 Category-specific QA/QC and verification — 234 6.7.5 Category-specific recalculations — 234 6.7.6 Category-specific planned improvements — 234 6.8 Settlements (4E) — 234 6.8.1 Source category description — 234 6.8.2 Methodological issues — 234 6.8.3 Uncertainty and time series consistency — 235 6.8.4 Category-specific QA/QC and verification — 235 6.8.5 Category-specific recalculations — 235 6.8.6 Category-specific planned improvements — 235 6.9 Other land (4F) — 236 6.9.1 Source category description — 236 6.9.2 Methodological issues — 236 6.9.3 Uncertainty and time series consistency — 236 6.9.4 Category-specific QA/QC and verification — 237 6.9.5 Category-specific recalculations — 237 6.9.6 Category-specific planned improvements — 237
RIVM report 2020-0031
Page 13 of 525
6.10 Harvested wood products (4G) — 237 6.10.1 Source category description — 237 6.10.2 Methodological issues — 237 6.10.3 Uncertainty and time series consistency — 239 6.10.4 Category-specific QA/QC and verification — 240 6.10.5 Category-specific recalculations — 240 6.10.6 Category-specific planned improvements — 240
7 Waste (CRF sector 5) — 241 7.1 Overview of sector — 241 7.2 Solid waste disposal on land (5A) — 243 7.2.1 Category description — 243 7.2.2 Methodological issues — 244 7.2.3 Uncertainty and time series consistency — 251 7.2.4 Category-specific QA/QC and verification — 251 7.2.5 Category-specific recalculations — 251 7.2.6 Category-specific planned improvements — 251 7.3 Biological treatment of solid waste (5B) — 251 7.3.1 Category description — 251 7.3.2 Methodological issues — 252 7.3.3 Uncertainty and time series consistency — 253 7.3.4 Category-specific QA/QC and verification — 253 7.3.5 Category-specific recalculations — 253 7.3.6 Category-specific planned improvements — 253 7.4 Waste incineration (5C) — 253 7.4.1 Category description — 253 7.4.2 Methodological issues — 254 7.4.3 Uncertainty and time series consistency — 255 7.4.4 Category-specific QA/QC and verification — 256 7.4.5 Category-specific recalculations — 256 7.4.6 Category-specific planned improvements — 256 7.5 Wastewater handling (5D) — 256 7.5.1 Category description — 256 7.5.2 Methodological issues — 257 7.5.3 Uncertainty and time series consistency — 264 7.5.4 Category-specific QA/QC and verification — 265 7.5.5 Category-specific recalculations — 265 7.5.6 Category-specific planned improvements — 265
8 Other (CRF sector 6) — 267
9 Indirect CO2 emissions — 269 9.1 Description of sources — 269 9.2 Methodological issues — 269 9.3 Uncertainty and time series consistency — 269 9.4 Category-specific QA/QC and verification — 269 9.5 Category-specific recalculations — 269 9.6 Category-specific planned improvements — 269
10 Recalculations and improvements — 271 10.1 Explanation of and justification for the recalculations — 271 10.1.1 GHG emissions inventory — 271 10.1.2 KP-LULUCF inventory — 273 10.2 Implications for emissions levels — 273
RIVM report 2020-0031
Page 14 of 525
10.2.1 GHG emissions inventory — 273 10.2.2 KP-LULUCF inventory — 276 10.3 Implications for emissions trends, including time series
consistency — 277 10.3.1 GHG emissions inventory — 277 10.4 Recalculations, response to the review process and planned
improvements — 278 10.4.1 GHG emissions inventory — 278 10.4.2 KP-LULUCF inventory — 280
Part ll: Supplementary information required under Article 7, paragraph 1 — 281
11 KP-LULUCF — 283 11.1 General information — 283 11.1.1 Definition of forest and any other criteria — 283 11.1.2 Elected activities under Article 3, paragraph 4 of the Kyoto
Protocol — 284 11.1.3 Description of how the definitions of each activity under Article 3.3 and
each mandatory and elected activity under Article 3.4 have been implemented and applied consistently over time — 284
11.1.4 Description of precedence conditions and/or hierarchy among Article 3.4 activities and how they have been consistently applied in determining how land was classified — 284
11.2 Land-related information — 284 11.2.1 Spatial assessment unit used for determining the area of the units of
land under Article 3.3 and Article 3.4 — 284 11.2.2 Methodology used to develop the land transition matrix — 285 11.2.3 Maps and/or database to identify geographical locations and the system
of identification codes for geographical locations — 287 11.3 Activity-specific information — 287 11.3.1 Methods for carbon stock change and GHG emissions and removal
estimates — 287 11.3.2 Changes in data and methods since the previous submission
(recalculations) — 297 11.3.3 Uncertainty estimates — 298 11.3.4 Information on other methodological issues — 298 11.3.5 The year of the onset of an activity, if after 2013 — 298 11.4 Article 3.3 — 298 11.4.1 Information that demonstrates that activities under Article 3.3 began on
or after 1 January 1990 and before 31 December 2020 and are directly human-induced — 298
11.4.2 Information on how harvesting or forest disturbance that is followed by the re-establishment of forest is distinguished from deforestation — 299
11.4.3 Information on the size and geographical location of forest areas that have lost forest cover but are not yet classified as deforested — 299
11.4.4 Information related to the natural disturbances provision under Article 3.3 — 299
11.4.5 Information on harvested wood products under Article 3.3 — 301 11.5 Article 3.4 — 302 11.5.1 Information that demonstrates that activities under Article 3.4 have
occurred since 1 January 1990 and are human-induced — 302 11.5.2 Information relating to Forest management — 302 11.6 Other information — 304
RIVM report 2020-0031
Page 15 of 525
11.6.1 Key category analysis for Article 3.3 activities and any mandatory and elected activities under Article 3.4 — 304
11.7 Information relating to Article 6 — 304
12 Information on accounting of Kyoto units — 305 12.1 Background information — 305 12.2 Summary of information reported in the SEF tables — 305 12.3 Discrepancies and notifications — 305 12.4 Publicly accessible information — 306 12.5 Calculation of the commitment period reserve (CPR) — 307 12.6 KP-LULUCF accounting — 307 12.7 Carry-over and PPSR — 307
13 Information on changes in the National System — 309
14 Information on changes in national registry in 2018 — 311
15 Information on minimisation of adverse impacts in accordance with Article 3, paragraph 14 — 313
Annex 1 Key categories — 319
Annex 2 Assessment of uncertainty — 358
Annex 3 Detailed methodological descriptions of individual sources or sink categories — 370
Annex 4 CO2: the national energy balance for the most recent inventory year — 371
Annex 5 The Netherlands’ fuel list and standard CO2 emission factors. Version January 2020 — 380
Annex 6 Assessment of completeness and (potential) sources and sinks — 390
Annex 7 Additional information to be considered as part of the NIR submission — 392
Annex 8 Chemical compounds, GWP, units and conversion factors — 393
Annex 9 List of abbreviations — 396
Annex 10 Improvements made in response to the in-country UNFCCC review of September 2019 — 399
References — 514

RIVM report 2020-0031
Page 16 of 525

RIVM report 2020-0031
Page 17 of 525
Samenvatting
Het National Inventory Report 2020 (NIR2020) bevat de rapportage van broeikasgasemissies (CO2, N2O, CH4 en de F-gassen) over de periode 1990 tot en met 2018. De emissiecijfers in de NIR 2020 zijn berekend volgens de methoderapporten behorend bij het ‘National System’ dat is voorgeschreven in het Kyoto Protocol. In de methoderapporten zijn de berekeningswijzen vastgelegd voor zowel het basisjaar (1990) als voor de emissies in de periode tot en met 2018. De methoderapporten zijn opgenomen in Annex 7 en ook elektronisch beschikbaar op de website http://www.rvo.nl/nie National Inventory Report (NIR) Dit rapport over de Nederlandse inventarisatie van broeikasgasemissies is op verzoek van het Ministerie van Economische Zaken en Klimaat (EZK) opgesteld om voor 2020 te voldoen aan de nationale rapportageverplichtingen van het Klimaatverdrag van de Verenigde Naties (UNFCCC), het Kyoto Protocol en het Bewakingsmechanisme Broeikasgassen van de Europese Unie. De emissies in dit rapport zijn berekend conform de rapportagerichtlijnen van de UNFCCC en de 2006 IPCC Richtlijnen voor Nationale Broeikasgassen Inventarisatie. Dit rapport bevat de volgende informatie:
• trendanalyses voor de emissies van broeikasgassen in de periode 1990-2018;
• een analyse van zogenaamde sleutelbronnen en de onzekerheid in hun emissies volgens de ‘Benaderingen 1 en 2’-methodiek van de 2006 IPCC Richtlijnen;
• documentatie van gebruikte berekeningsmethoden, databronnen en toegepaste emissiefactoren;
• een overzicht van het kwaliteitssysteem en de validatie van de emissiecijfers voor de Nederlandse Emissieregistratie;
• overzicht van de herberekeningen van de broeikasgasemissies als gevolg van de meest recente wijzigingen in de berekeningsmethoden.
De NIR bevat ook de informatie die voorgeschreven is volgens artikel 7 van het Kyoto Protocol (deel 2 van dit rapport). Hiermee voldoet Nederland aan alle rapportagerichtlijnen van de UNFCCC. Een losse annex bij dit rapport bevat elektronische data over emissies en activiteit data in het zogenaamde Common Reporting Format (CRF), waar door het secretariaat van het VN-Klimaatverdrag om wordt verzocht. In een aparte annex worden ook de methodiek rapporten meegeleverd. In de bijlagen bij dit rapport is onder meer een overzicht van de belangrijkste bronnen (‘sleutelbronnen’) en onzekerheden in de emissie opgenomen. De NIR gaat niet specifiek in op de invloed van het gevoerde overheidsbeleid op de emissies van broeikasgassen; meer informatie hierover is te vinden in de Balans van de Leefomgeving 2018 (opgesteld door het Planbureau voor de Leefomgeving, PBL), de zevende Nationale

RIVM report 2020-0031
Page 18 of 525
Communicatie onder het Klimaatverdrag (NC7; EZK, 2017a) en de vierde Tweejaarlijkse Voortgangsrapportage (BR4; EZK, 2019). In hoofdstuk 2 wordt wel een indicatie gegeven van achterliggende factoren die van invloed zijn (geweest) op de trendontwikkeling van de verschillende broeikasgassen.
Figuur S.1. Broeikasgassen: emissieniveaus en emissietrends (exclusief LULUCF), 1990-2018. Ontwikkeling van de broeikasgasemissies De emissieontwikkeling in Nederland wordt beschreven en toegelicht in dit Nationale Inventarisatie Rapport. Figuur S.1 geeft het emissieverloop over de periode 1990-2018 weer. De totale emissies bedroegen in 2018 circa 188,2 Tg (Teragram, ook wel Megaton of miljard kg) CO2 equivalenten en zijn daarmee circa 15,1 procent afgenomen in vergelijking met de emissies in het basisjaar (221,7 Tg CO2 eq). In de in dit rapport gepresenteerde emissies worden de indirecte CO2 emissies meegerekend. De emissies van landgebruik en bossen (LULUCF) worden echter niet meegeteld. De emissie van CO2 is sinds 1990 (het zogenaamde ‘basisjaar’) met circa 1,6 procent afgenomen, de emissies van de andere broeikasgassen zijn met 52,7 procent afgenomen. In 2018 daalde de CO2 emissie met 2,6 procent ten opzichte van het jaar 2017. Deze daling komt vooral doordat er minder kolen zijn verbruikt voor elektriciteitsproductie; in 2018 is er een toename geweest van elektriciteitsimport. De emissie van CH4 daalde in 2018 met 3,9% ten opzichte van 2017. De N2O emissie daalde met 3,6 procent ten opzichte van 2017. De emissie van F-gassen steeg in 2018 met 9,4 procent ten opzichte van 2017. De totale emissie van broeikasgassen in 2018 ligt daarmee 2,7 procent lager dan het niveau in 2017.
RIVM report 2020-0031
Page 19 of 525
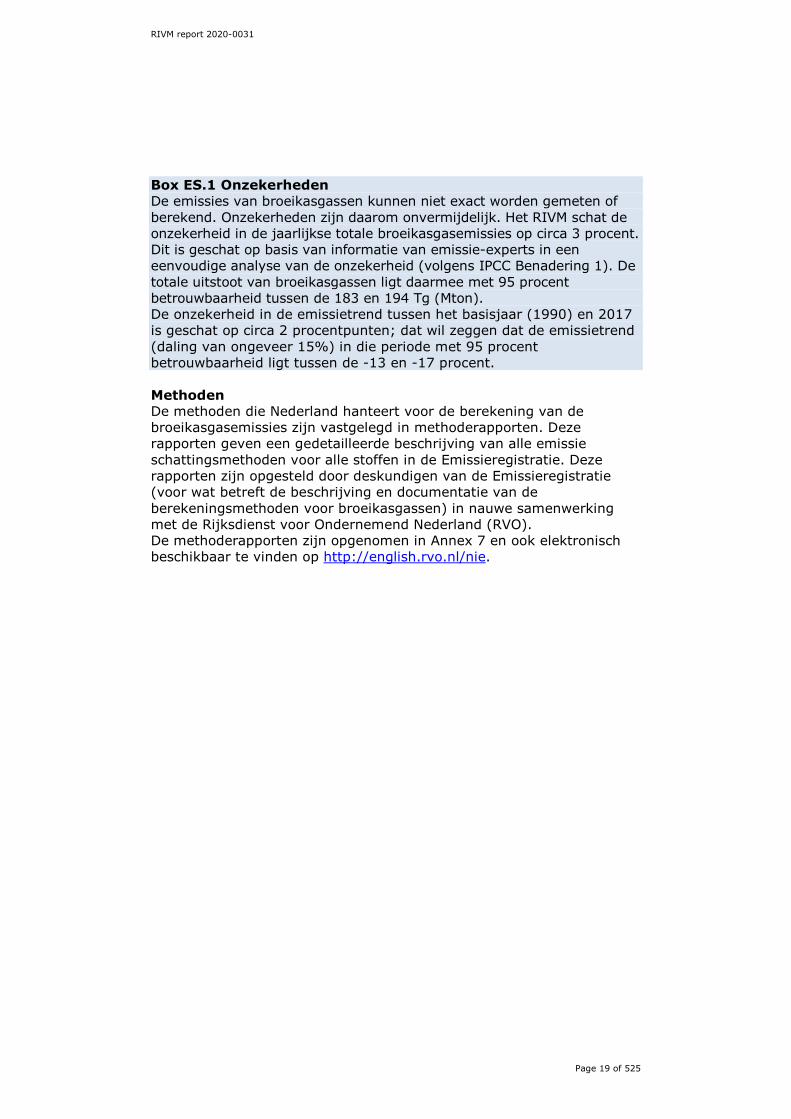
Box ES.1 Onzekerheden De emissies van broeikasgassen kunnen niet exact worden gemeten of berekend. Onzekerheden zijn daarom onvermijdelijk. Het RIVM schat de onzekerheid in de jaarlijkse totale broeikasgasemissies op circa 3 procent. Dit is geschat op basis van informatie van emissie-experts in een eenvoudige analyse van de onzekerheid (volgens IPCC Benadering 1). De totale uitstoot van broeikasgassen ligt daarmee met 95 procent betrouwbaarheid tussen de 183 en 194 Tg (Mton). De onzekerheid in de emissietrend tussen het basisjaar (1990) en 2017 is geschat op circa 2 procentpunten; dat wil zeggen dat de emissietrend (daling van ongeveer 15%) in die periode met 95 procent betrouwbaarheid ligt tussen de -13 en -17 procent. Methoden De methoden die Nederland hanteert voor de berekening van de broeikasgasemissies zijn vastgelegd in methoderapporten. Deze rapporten geven een gedetailleerde beschrijving van alle emissie schattingsmethoden voor alle stoffen in de Emissieregistratie. Deze rapporten zijn opgesteld door deskundigen van de Emissieregistratie (voor wat betreft de beschrijving en documentatie van de berekeningsmethoden voor broeikasgassen) in nauwe samenwerking met de Rijksdienst voor Ondernemend Nederland (RVO). De methoderapporten zijn opgenomen in Annex 7 en ook elektronisch beschikbaar te vinden op http://english.rvo.nl/nie.

RIVM report 2020-0031
Page 20 of 525
RIVM report 2020-0031
Page 21 of 525
Executive summary
ES1 Background information on greenhouse gas (GHG) inventories and climate change This report documents the Netherlands’ annual submission for 2020 of its greenhouse gas (GHG) emissions inventory, in line with the annual reporting requirements under the United Nations Convention on Climate Change (UNFCCC) and its Kyoto Protocol (KP). The report contributes to fulfilling the reporting requirements under the EU Monitoring Mechanism Regulation (EU 525/2013).
This report has been prepared in line with the reporting guidelines provided in Decisions by the UNFCCC Conference of the Parties (COP) and the Conference of the Parties serving as the meeting of the Parties to the Kyoto Protocol (CMP) as well as in line with the relevant (2006) IPCC reporting Guidelines. Part I of the report is structured as follows:
• Chapter 1 documents the National System as approved by the UNFCCC review in 2007 (and reconfirmed in 2017).
• Chapter 2 summarises the emissions trends, which are further described and documented in the subsequent chapters.
• Chapters 3–8 document emissions and trends for the following sectors, respectively: o Energy (sector 1); o Industrial Processes and Product Use (IPPU, sector 2); o Agriculture (sector 3); o Land Use, Land Use Change and Forestry (LULUCF, sector 4); o Waste (sector 5); o Other (sector 6).
• Chapter 9 describes indirect CO2 emissions. • Chapter 10 documents recalculations and improvements since
the previous report (NIR 2019). The supplementary information required under Article 7, paragraph 1 of the Kyoto Protocol is reported in five additional Chapters in Part II of this report. Note that this report provides no specific information on government policies for reducing GHG emissions. Such information can be found, for example, in the Netherlands State of the Environment Report 2018 (biennial edition; in Dutch: Balans van de Leefomgeving) prepared by the Netherlands Environmental Assessment Agency (PBL, 2018), the 7th National Communication (NC7; EZK, 2017a), the 4th Biennial Report (BR4: EZK, 2019), the Climate and Energy Outlook 2019 (Schoots et al., 2019) and the National Energy and Climate Plan (EZK, 2019b). The Common Reporting Format (CRF) files, containing data on emissions, activity data and implied emission factors (IEFs), accompany this report. The complete set of CRF tables, as well as the NIR 2020 in PDF format and the methodology reports, are also available on the website http://english.rvo.nl/nie.
Editor
Heading style changed to ‘Heading 2’ for clarity.
RIVM report 2020-0031
Page 22 of 525
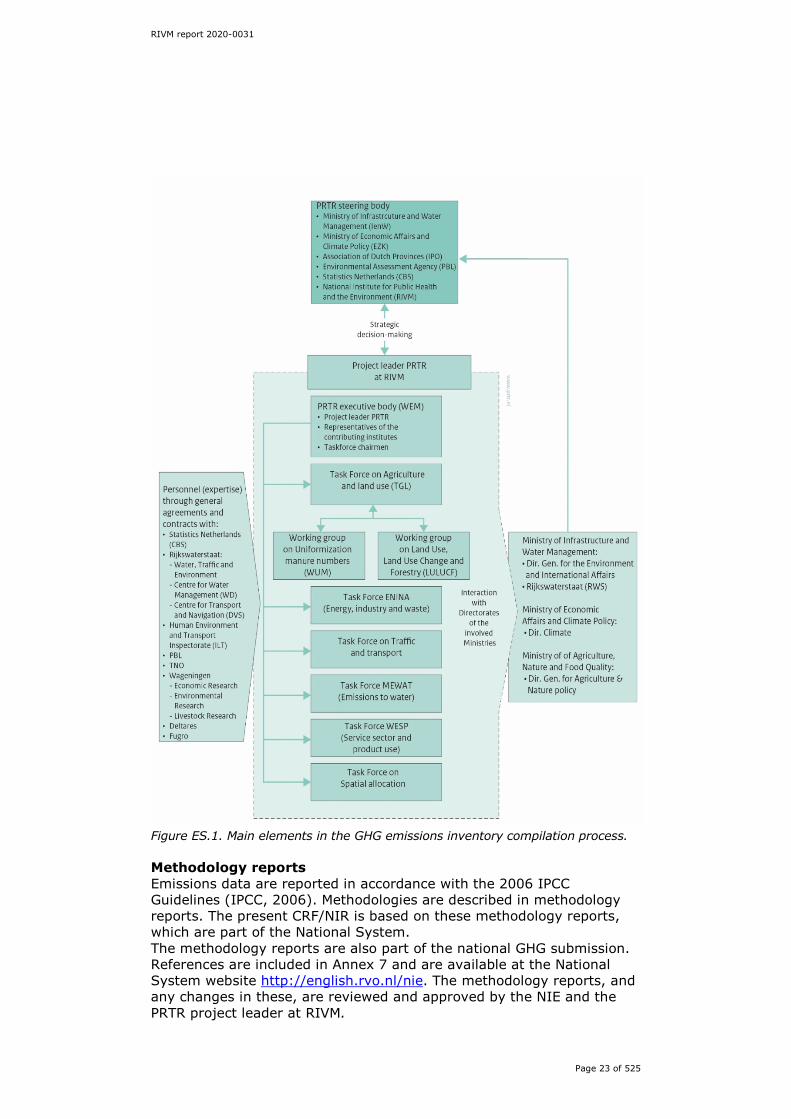
Base year In line with the reporting guidelines, the Netherlands uses 1990 as the base year for all gases. Key categories Annex 1 presents an extensive overview of the results of the key category analysis performed for this inventory. To identify the key categories (the source categories which constitute 95% of national emissions) according to the definition of the 2006 IPCC Guidelines, national emissions are categorised according to the IPCC source categories list wherever possible. Depending on the IPCC approach taken (1 or 2) and whether LULUCF is included in the key category analysis or not, the number of key categories differs. Based on an Approach 1 assessment (both level and trend, excluding LULUCF), the Netherlands’ inventory contains 40 key categories (out of a total of 119 source categories). Based on Approach 2, which also takes into account uncertainties, 12 additional sources are identified as key categories. If LULUCF is also included in the analysis, the Netherlands’ inventory contains 56 key categories. Institutional arrangements for inventory preparation The GHG emissions inventory process of the Netherlands is an integral part of the national Pollutant Release and Transfer Register (NL-PRTR). Figure ES.1 shows the structure of the inventory process and the bodies responsible for each stage. The National Institute for Public Health and the Environment (RIVM) has been contracted by the Ministry of Infrastructure and Water Management and the Ministry of Economic Affairs and Climate Policy (EZK) to compile and maintain the PRTR and to coordinate the annual preparation of the NIR and the completion of the CRF tables (see Figure ES.1). The National Systems put in place by the Netherlands follow the requirements of Article 5.1 of the Kyoto Protocol, the UNFCCC reporting guidelines and the EU Monitoring Mechanism Regulation. The National Inventory Entity (NIE) is the designated single national entity with overall responsibility for the national inventories. The RVO is designated by law as the NIE and coordinates the overall QA/QC activities and the support/response to the UNFCCC review process. This annual inventory is compiled in accordance with the procedures applicable to the National Systems.
RIVM report 2020-0031
Page 23 of 525
Figure ES.1. Main elements in the GHG emissions inventory compilation process. Methodology reports Emissions data are reported in accordance with the 2006 IPCC Guidelines (IPCC, 2006). Methodologies are described in methodology reports. The present CRF/NIR is based on these methodology reports, which are part of the National System. The methodology reports are also part of the national GHG submission. References are included in Annex 7 and are available at the National System website http://english.rvo.nl/nie. The methodology reports, and any changes in these, are reviewed and approved by the NIE and the PRTR project leader at RIVM.

RIVM report 2020-0031
Page 24 of 525
ES2 Summary of trends in national emissions and removals In 2018, total GHG emissions (including indirect CO2 emissions and excluding emissions from LULUCF) in the Netherlands were estimated at 188.2 Tg (Teragram or Megaton) CO2 equivalents (CO2 eq.). This is approximately 15.1% below total emissions in the base year (221.7 Tg CO2 eq.). CO2 emissions (excluding LULUCF) in 2018 were about 1.6% lower than in 1990. CH4 emissions in 2018 were 45.7% lower than 1990 levels, mainly due to decreases in emissions from the Waste sector and the Agricultural sector. N2O emissions decreased by 53.7% in 2018 compared with 1990, mainly due to decreases in emissions from Agriculture and from Industrial processes and product use (IPPU). In contrast, N2O emissions from fossil fuel combustion (mainly from Transport) increased. Compared with the base year, the emissions of F-gases (HFCs, PFCs and SF6) decreased by 70.7%, 93.9% and 40.2%, respectively (see Table ES.1). Total emissions of all F-gases were 77.2% lower than in 1990, partly as a result of the Netherlands’ programme for reducing emissions of non-CO2 greenhouse gases (ROB). Figure ES.2 shows a graphical representation of these trends. Table ES.1. Summary of emissions trends per gas (Tg CO2 equivalents, including indirect CO2 emissions), 1990–2018.
CO2 excl.
LULUCF
CH4 excl.
LULUCF
N2O excl.
LULUCF
HFCs PFCs SF6 Total excl.
LULUCF 1990 (base yr) 163.3 31.8 18.0 5.6 2.7 0.2 221.7 1995 173.6 29.7 18.2 7.6 2.3 0.3 231.6 2000 172.4 24.3 16.1 4.8 1.9 0.3 219.8 2005 177.9 19.9 14.6 1.7 0.4 0.2 214.7 2010 182.6 19.4 8.6 2.7 0.3 0.2 213.7 2015 166.8 18.2 8.8 1.8 0.1 0.1 195.9 2017 164.9 18.0 8.7 1.6 0.1 0.1 193.3 2018 160.6 17.3 8.3 1.6 0.2 0.1 188.2 Compared with 2017, overall 2018 GHG emissions decreased by about 2.7%. The changes for the specific gases were as follows:
• CO2 emissions (excluding LULUCF) decreased by 2.6% (-4.3 Tg), mainly due to less coal combustion (-3.2 Tg) and a decrease of 0.5 Tg in gas consumption for Electricity and heat production (1A1a). The decreased use of coal has been offset by an increase in electricity importation (29 PJ, or 7% of total electricity consumption; (CBS, 2019)).
• CH4 emissions decreased by 3.9% (c. -0.7 Tg CO2 eq.), mainly in category 1B2 (Venting and flaring) and category 3A (Enteric fermentation).
• N2O emissions decreased by about 3.6% (c. -0.4 Tg CO2 eq.), mainly due to a decrease of emissions in categories 3D (Agricultural soils) and 2B4 (Caprolactam production).
• F-gas emissions increased by 9.4% (c. 0.2 Tg CO2 eq.). This was primarily caused by an increase in HFC and PFC emissions of 5.3% and 111.6% (0.08 Tg and 0.09 CO2 eq.), respectively.
Editor
Tables not edited, as requested, but please note that some header rows are centred, some ranged left, and some ranged right; similarly with columns of figures; and some tables have horizontal rules between each row and/or column, while others do not ... All tables should be in the same format.
Editor
There is inconsistency also in the styling of bulleted lists: some are indented, some not. This should be made consistent throughout.
RIVM report 2020-0031
Page 25 of 525
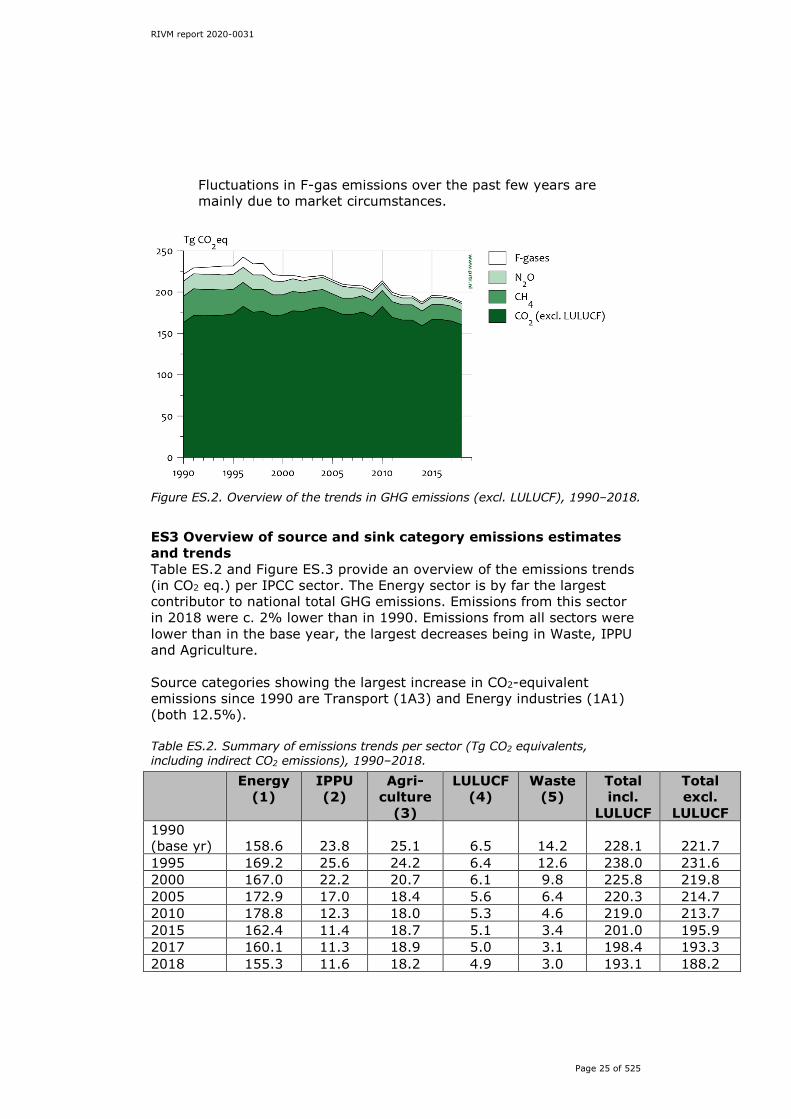
Fluctuations in F-gas emissions over the past few years are mainly due to market circumstances.
Figure ES.2. Overview of the trends in GHG emissions (excl. LULUCF), 1990–2018. ES3 Overview of source and sink category emissions estimates and trends Table ES.2 and Figure ES.3 provide an overview of the emissions trends (in CO2 eq.) per IPCC sector. The Energy sector is by far the largest contributor to national total GHG emissions. Emissions from this sector in 2018 were c. 2% lower than in 1990. Emissions from all sectors were lower than in the base year, the largest decreases being in Waste, IPPU and Agriculture. Source categories showing the largest increase in CO2-equivalent emissions since 1990 are Transport (1A3) and Energy industries (1A1) (both 12.5%). Table ES.2. Summary of emissions trends per sector (Tg CO2 equivalents, including indirect CO2 emissions), 1990–2018.
Energy (1)
IPPU (2)
Agri-culture
(3)
LULUCF (4)
Waste (5)
Total incl.
LULUCF
Total excl.
LULUCF 1990 (base yr) 158.6 23.8 25.1 6.5 14.2 228.1 221.7 1995 169.2 25.6 24.2 6.4 12.6 238.0 231.6 2000 167.0 22.2 20.7 6.1 9.8 225.8 219.8 2005 172.9 17.0 18.4 5.6 6.4 220.3 214.7 2010 178.8 12.3 18.0 5.3 4.6 219.0 213.7 2015 162.4 11.4 18.7 5.1 3.4 201.0 195.9 2017 160.1 11.3 18.9 5.0 3.1 198.4 193.3 2018 155.3 11.6 18.2 4.9 3.0 193.1 188.2
RIVM report 2020-0031
Page 26 of 525
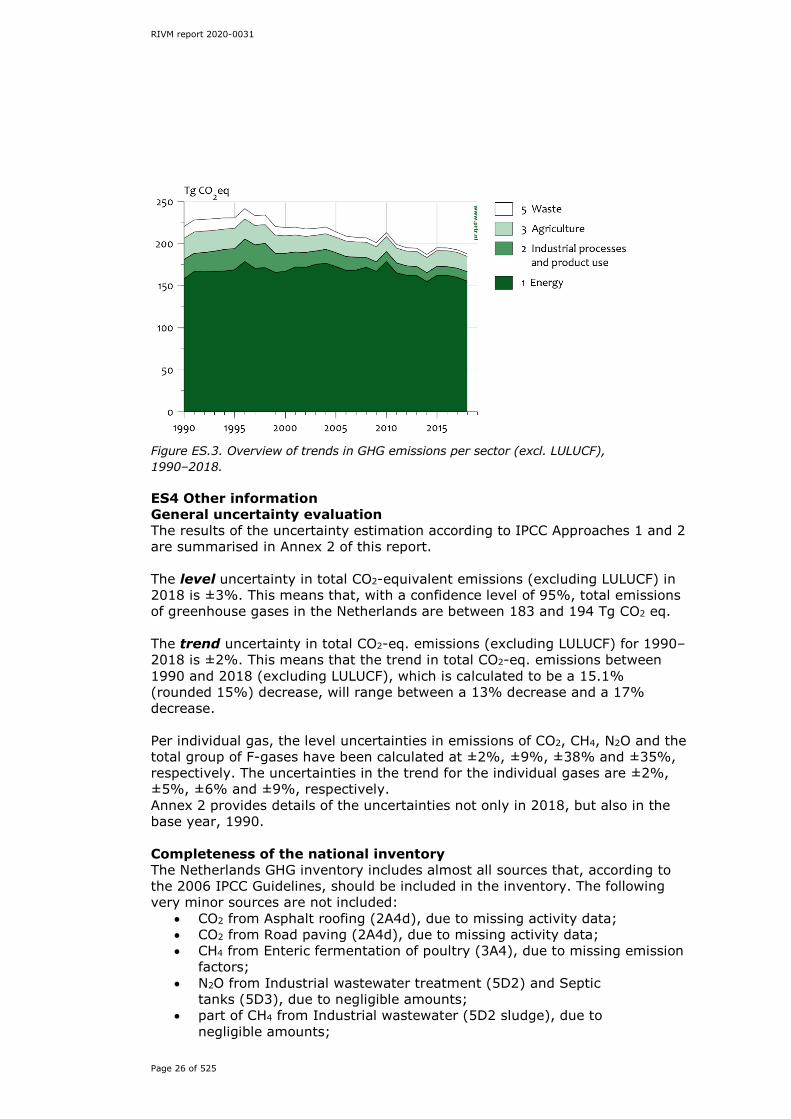
Figure ES.3. Overview of trends in GHG emissions per sector (excl. LULUCF), 1990–2018. ES4 Other information General uncertainty evaluation The results of the uncertainty estimation according to IPCC Approaches 1 and 2 are summarised in Annex 2 of this report. The level uncertainty in total CO2-equivalent emissions (excluding LULUCF) in 2018 is ±3%. This means that, with a confidence level of 95%, total emissions of greenhouse gases in the Netherlands are between 183 and 194 Tg CO2 eq. The trend uncertainty in total CO2-eq. emissions (excluding LULUCF) for 1990–2018 is ±2%. This means that the trend in total CO2-eq. emissions between 1990 and 2018 (excluding LULUCF), which is calculated to be a 15.1% (rounded 15%) decrease, will range between a 13% decrease and a 17% decrease. Per individual gas, the level uncertainties in emissions of CO2, CH4, N2O and the total group of F-gases have been calculated at ±2%, ±9%, ±38% and ±35%, respectively. The uncertainties in the trend for the individual gases are ±2%, ±5%, ±6% and ±9%, respectively. Annex 2 provides details of the uncertainties not only in 2018, but also in the base year, 1990. Completeness of the national inventory The Netherlands GHG inventory includes almost all sources that, according to the 2006 IPCC Guidelines, should be included in the inventory. The following very minor sources are not included:
• CO2 from Asphalt roofing (2A4d), due to missing activity data; • CO2 from Road paving (2A4d), due to missing activity data; • CH4 from Enteric fermentation of poultry (3A4), due to missing emission
factors; • N2O from Industrial wastewater treatment (5D2) and Septic
tanks (5D3), due to negligible amounts; • part of CH4 from Industrial wastewater (5D2 sludge), due to
negligible amounts;
RIVM report 2020-0031
Page 27 of 525
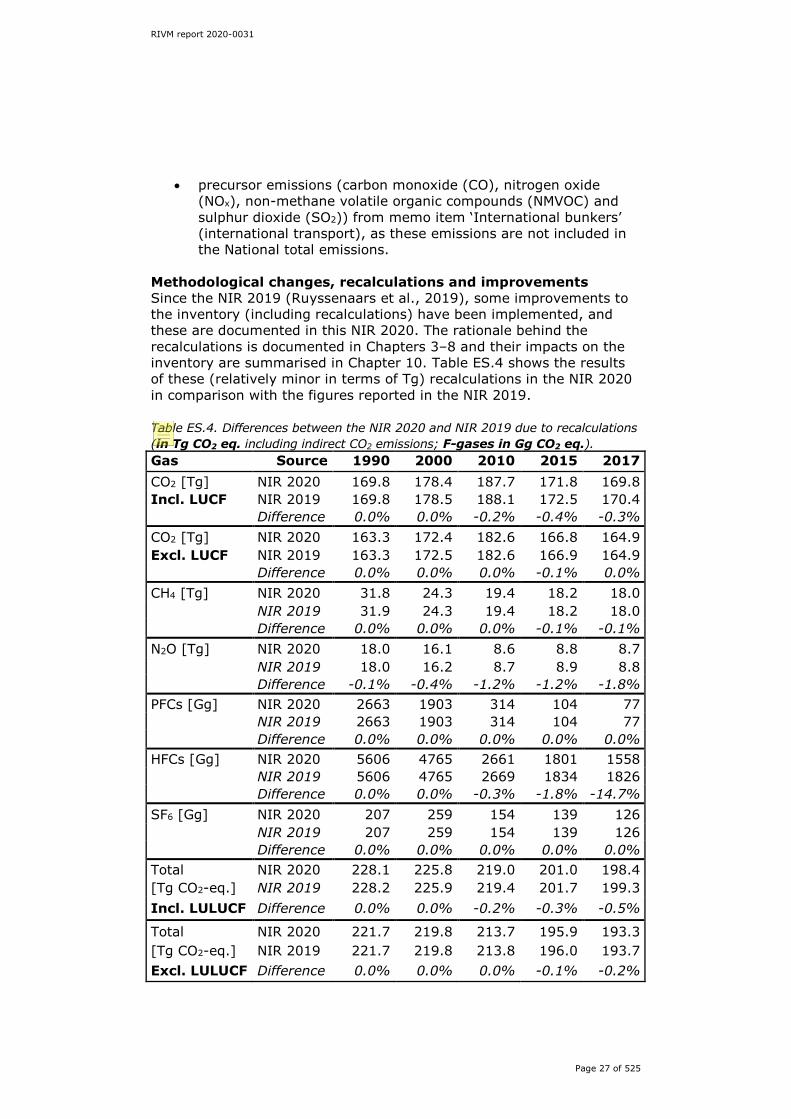
• precursor emissions (carbon monoxide (CO), nitrogen oxide (NOx), non-methane volatile organic compounds (NMVOC) and sulphur dioxide (SO2)) from memo item ‘International bunkers’ (international transport), as these emissions are not included in the National total emissions.
Methodological changes, recalculations and improvements Since the NIR 2019 (Ruyssenaars et al., 2019), some improvements to the inventory (including recalculations) have been implemented, and these are documented in this NIR 2020. The rationale behind the recalculations is documented in Chapters 3–8 and their impacts on the inventory are summarised in Chapter 10. Table ES.4 shows the results of these (relatively minor in terms of Tg) recalculations in the NIR 2020 in comparison with the figures reported in the NIR 2019. Table ES.4. Differences between the NIR 2020 and NIR 2019 due to recalculations (in Tg CO2 eq. including indirect CO2 emissions; F-gases in Gg CO2 eq.). Gas Source 1990 2000 2010 2015 2017 CO2 [Tg] NIR 2020 169.8 178.4 187.7 171.8 169.8 Incl. LUCF NIR 2019 169.8 178.5 188.1 172.5 170.4 Difference 0.0% 0.0% -0.2% -0.4% -0.3% CO2 [Tg] NIR 2020 163.3 172.4 182.6 166.8 164.9 Excl. LUCF NIR 2019 163.3 172.5 182.6 166.9 164.9 Difference 0.0% 0.0% 0.0% -0.1% 0.0% CH4 [Tg] NIR 2020 31.8 24.3 19.4 18.2 18.0 NIR 2019 31.9 24.3 19.4 18.2 18.0 Difference 0.0% 0.0% 0.0% -0.1% -0.1% N2O [Tg] NIR 2020 18.0 16.1 8.6 8.8 8.7 NIR 2019 18.0 16.2 8.7 8.9 8.8 Difference -0.1% -0.4% -1.2% -1.2% -1.8% PFCs [Gg] NIR 2020 2663 1903 314 104 77 NIR 2019 2663 1903 314 104 77 Difference 0.0% 0.0% 0.0% 0.0% 0.0% HFCs [Gg] NIR 2020 5606 4765 2661 1801 1558 NIR 2019 5606 4765 2669 1834 1826 Difference 0.0% 0.0% -0.3% -1.8% -14.7% SF6 [Gg] NIR 2020 207 259 154 139 126 NIR 2019 207 259 154 139 126 Difference 0.0% 0.0% 0.0% 0.0% 0.0% Total NIR 2020 228.1 225.8 219.0 201.0 198.4 [Tg CO2-eq.] NIR 2019 228.2 225.9 219.4 201.7 199.3 Incl. LULUCF Difference 0.0% 0.0% -0.2% -0.3% -0.5%
Total NIR 2020 221.7 219.8 213.7 195.9 193.3 [Tg CO2-eq.] NIR 2019 221.7 219.8 213.8 196.0 193.7 Excl. LULUCF Difference 0.0% 0.0% 0.0% -0.1% -0.2%
Editor
Table needs amending: a. Include subscript in ‘CO2’, etc. b. Continue vertical rules into header row. c. All commas should be full points (‘169.8’, etc.).
RIVM report 2020-0031
Page 28 of 525
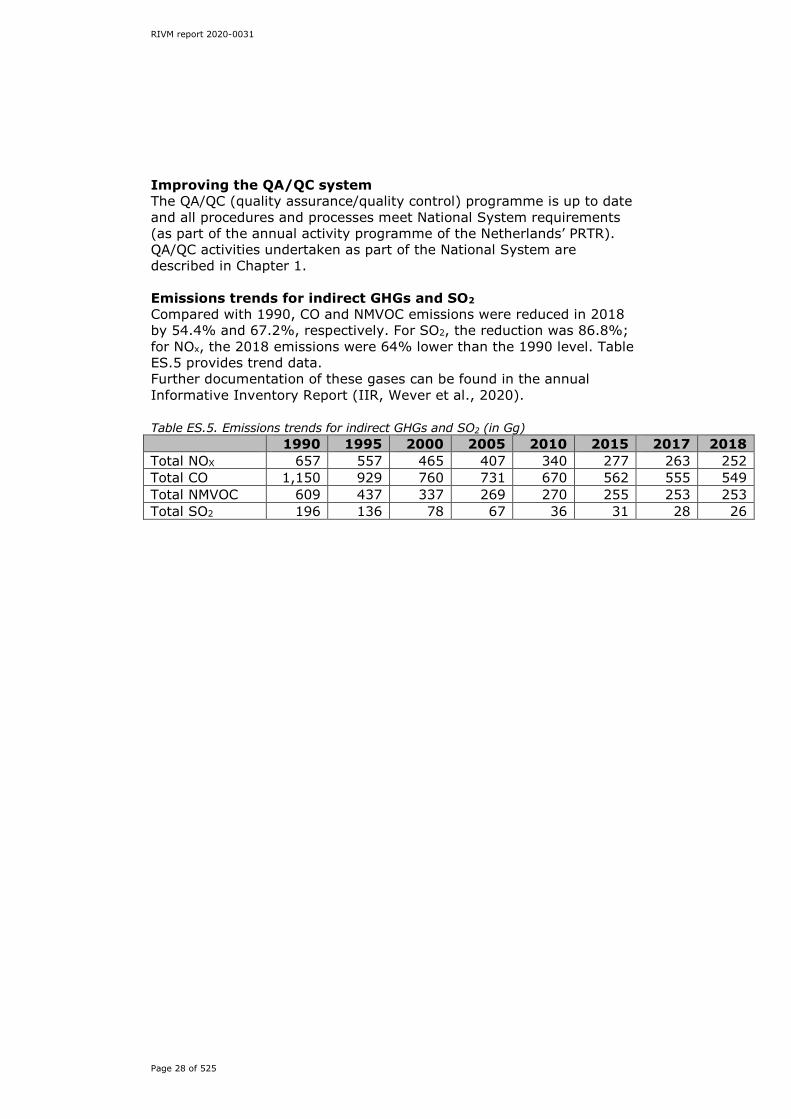
Improving the QA/QC system The QA/QC (quality assurance/quality control) programme is up to date and all procedures and processes meet National System requirements (as part of the annual activity programme of the Netherlands’ PRTR). QA/QC activities undertaken as part of the National System are described in Chapter 1. Emissions trends for indirect GHGs and SO2
Compared with 1990, CO and NMVOC emissions were reduced in 2018 by 54.4% and 67.2%, respectively. For SO2, the reduction was 86.8%; for NOx, the 2018 emissions were 64% lower than the 1990 level. Table ES.5 provides trend data. Further documentation of these gases can be found in the annual Informative Inventory Report (IIR, Wever et al., 2020). Table ES.5. Emissions trends for indirect GHGs and SO2 (in Gg)
1990 1995 2000 2005 2010 2015 2017 2018 Total NOX 657 557 465 407 340 277 263 252 Total CO 1,150 929 760 731 670 562 555 549 Total NMVOC 609 437 337 269 270 255 253 253 Total SO2 196 136 78 67 36 31 28 26
RIVM report 2020-0031
Page 29 of 525
Part I: Annual inventory report

RIVM report 2020-0031
Page 30 of 525

RIVM report 2020-0031
Page 31 of 525
1 Introduction
1.1 Background information on greenhouse gas inventories and climate change
1.1.1 Background information on climate change reporting Climate Convention, Kyoto Protocol and EU Monitoring Mechanism Regulation The United Nations Framework Convention on Climate Change (UNFCCC) was ratified for the European part of the Netherlands in 1994 and took effect in March 1994. In 2005, the Kyoto Protocol (KP) under the Convention entered into force. Rules for Monitoring, Reporting and Verification (MRV), initially agreed under the Convention itself, were further elaborated in the KP under the Articles 5, 7 and 8, and have been implemented successively. The National System for the Netherlands under Article 5.1 of the KP was reviewed (Article 8 of the KP) and accepted in 2007. The greenhouse gas (GHG) inventory is prepared on an annual basis under this National System (Article 7.1 of the KP). The latest UNFCCC review of the inventory in September 2019 confirmed that the Netherlands’ inventory and inventory process are still in line with the rules for National Systems. The inventory is accompanied by the Common Reporting Format (CRF), representing the national GHG emissions of the Netherlands. The methodologies applied for calculating the emissions are in accordance with the Guidelines of the IPCC, as agreed in 2006. Both the inventory and this National Inventory Report (NIR) are also in line with the rules of the European Commission, as laid down in the EU Monitoring Mechanism Regulation (EU 525/2013). Part I of this NIR, together with the CRF, represents the 2020 national emissions inventory of GHGs under the UNFCCC and the KP. Additional reporting requirements under the KP, other than inventory-related issues, are included in Part II of this report. Geographical coverage The reported emissions are those that derive from the legal territory of the Netherlands. This includes inland water bodies and coastal water in a zone stretching 12 miles from the coastline. It excludes Aruba, Curaçao and Sint Maarten, which are constituent countries of the Kingdom of the Netherlands. It also excludes Bonaire, Saba and Sint Eustatius, which since 10 October 2010 have been public bodies (openbare lichamen) with their own legislation that is not applicable to the European part of the Netherlands. Emissions from offshore oil and gas production on the Dutch part of the continental shelf are included.
1.1.2 Background information on the GHG emissions inventory The NIR (and CRF) cover the seven direct GHGs included in the Kyoto Protocol: carbon dioxide (CO2), methane (CH4), nitrous oxide (N2O), hydrofluorocarbons (HFCs), perfluorocarbons (PFCs), sulphur hexafluoride (SF6) and nitrogen trifluoride (NF3) (the last four are called

RIVM report 2020-0031
Page 32 of 525
the F-gases). NF3 is included in the figure for PFCs. NF3 emissions cannot be reported separately due to the confidentiality of the data. The Netherlands reports total GHG emissions including indirect CO2 emissions. The following indirect GHG emissions are also reported: nitrogen oxides (NOx), carbon monoxide (CO), non-methane volatile organic compounds (NMVOC) and sulphur oxides (SOx). This report provides explanations of the trends in GHG emissions per gas and per sector for the period 1990–2018. It summarises the methods and data sources used for:
a. Approach 1 assessments of the uncertainty in annual emissions and in emissions trends;
b. Key source assessments following Approach 1 and Approach 2 of the 2006 IPCC Guidelines;
c. Quality assurance and quality control (QA/QC) activities. This inventory report does not include detailed assessments of the extent to which changes in emissions are due to the implementation of policy measures. This information can be found in the Netherlands’ State of the Environment Report 2018 (biennial edition; in Dutch: Balans van de Leefomgeving) (PBL, 2018), the 7th Netherlands National Communication under the United Nations Framework Convention on Climate Change (NC7: EZK, 2017a), the 4th Biennial Report (BR4: EZK, 2019), the Climate and Energy Outlook 2019 (Schoots et al., 2019) and the National Energy and Climate Plan (EZK, 2019). The Netherlands also reports emissions under other international agreements, such as the United Nations Economic Commission for Europe (UNECE) Convention on Long Range Transboundary Air Pollutants (CLRTAP) and the EU’s National Emission Ceilings (NEC) Directive. All emissions estimates are taken from the Netherlands’ Pollutant Release and Transfer Register (PRTR), which is compiled by various cooperating organisations, as described in Box 1 below. The GHG emissions inventory and the PRTR share underlying data, which ensures consistency between the inventories and other internationally reported data. In line with the requirements of the National System and in accordance with Article 5.1 of the KP, both the National System and the methodologies for calculating GHG emissions in the Netherlands are kept up to date on an annual basis. Information on the latest changes to the National System is included in Chapter 13 of this report. Since 2015, emissions data have been calculated according to the 2006 IPCC Guidelines (IPCC, 2006). The methodologies applied in the Netherlands are documented in five methodology reports, one for each PRTR Task Force. The NIR 2020 is based on these methodologies. The methodology reports are an integral part of this submission (see Annex 7) and are available at the National System website: http://english.rvo.nl/nie. The methodology reports and any changes in methodologies are reviewed by the National Inventory Entity (NIE) and approved by the chair of the PRTR Task Force concerned. Changes in methodologies are also described in the NIR; both in the relevant chapters and in Chapter 10 (documenting the recalculations and

RIVM report 2020-0031
Page 33 of 525
improvements made following the recommendations of the latest reviews). The structure of this report complies with the format required by the UNFCCC (FCCC/SBSTA/2004/8) and the latest annotated outline of the National Inventory Report, including reporting elements under the Kyoto Protocol. It also includes supplementary information under Article 7 of the Kyoto Protocol. This information is included in Part II of the NIR 2020. Greenhouse gas (GHG) emissions are given in gigagrams (Gg) and teragrams (Tg) in this report. 1 gigagram is equal to 1 kiloton (kt); 1 teragram (Tg) is equal to 1 megaton (Mt). Global warming potential (GWP) weighted emissions of the GHGs are also provided (in CO2 equivalents), using GWP values based on the effects of GHGs over a 100-year horizon, in accordance with UNFCCC Decision 24/CP.19 Annex III (UNFCCC, 2013). The GWP of each individual GHG is given in Annex 8. The CRF spreadsheet files accompany this report as electronic annexes. The CRF tables contain detailed information on GHG emissions, activity data and (implied) emission factors (EFs) by sector, source category and GHG. The complete set of CRF tables and this report comprise the NIR, which is published on the website http://english.rvo.nl/nie.
1.1.3 Background information on supplementary information required by Article 7 of the Kyoto Protocol Part II of this report provides the supplementary information required by (Article 7 of) the Kyoto Protocol. Supplementary information on Land use, land use change and forestry according to the Kyoto Protocol definitions (KP-LULUCF) pertains to activities under Article 3, paragraph 3, and supplementary information on Forest management pertains to the mandatory activity under Article 3, paragraph 4. The Netherlands has chosen not to include any other activities under Article 3, paragraph 4, of the Kyoto Protocol. Information on the accounting of Kyoto units is also provided in the SEF file RREG1_NL_2019_2_1.xlsx
1.2 Description of the national inventory arrangements 1.2.1 Institutional, legal and procedural arrangements
The Ministry of Economic Affairs and Climate Policy (EZK) has overall responsibility for climate change policy issues, including the preparation of the National GHG Emissions Inventory. In December 2005, the Netherlands Enterprise Agency (RVO) was designated by law as the National Inventory Entity (NIE), the single national entity required under the Kyoto Protocol. As well as coordinating the establishment and maintenance of a National System, the RVO was tasked with the coordination of improved QA/QC activities as part of the National System and the coordination of support/response to the UNFCCC review process. The National System is described in greater detail in the Seventh Netherlands National Communication under the United Nations Framework Convention on Climate Change (NC7: EZK, 2017a).
RIVM report 2020-0031
Page 34 of 525
The RIVM has been assigned by the EZK as the institute responsible for coordinating the compilation and maintenance of the pollutants emission register/inventory (PRTR system), which contains data on approximately 350 pollutants, including GHGs. The PRTR project system is used as the basis for the GHG emissions documented in this NIR and for the completion of the CRF tables. The RIVM also coordinates the compilation of the NIR.
1.2.2 Overview of inventory planning, preparation and management The Dutch PRTR system has been in operation in the Netherlands since 1974. This system encompasses data collection, data processing and the registering and reporting of emissions data for approximately 350 policy-relevant compounds and compound groups that are present in air, water and soil. The emissions data are produced in an annual (project) cycle (RIVM, 2019). This system also serves as the basis for the National GHG emissions Inventory. The overall coordination of the PRTR is outsourced by the EZK to the RIVM. The main purpose of the PRTR project is the production of an annual set of unequivocal emissions data that is up-to-date, complete, transparent, comparable, consistent and accurate. In addition to the RIVM, various external agencies contribute to the PRTR by performing calculations or submitting activity data (see Box 1). Box 1: Pollutant Release and Transfer Register (PRTR) project Responsibilities for coordination of the PRTR project Major decisions on tasks and priorities are taken by the Steering Committee ER (SCER) by approving the Annual Work Plan. This committee consists of representatives of the commissioning ministries, regional governments, the RIVM and the PBL. The PRTR project leader at the RIVM acts as coordinator and is responsible for the PRTR process; the outcomes of that process are the responsibility of the bodies involved. The collaboration of the various bodies is ensured by means of contracts, covenants or other agreements. Task Forces Various emissions experts from the participating organisations take part in the Task Forces that calculate national emissions from 650 emission sources. A formal agreement is drawn up by all the participating organisations. After intensive checking, national emissions figures are accepted by the leader of the PRTR project and the dataset is stored in the Central Database. The 650 emissions sources are logically divided into 55 work packages. An emissions expert is responsible for one or more work packages, the collection of the data and the calculation of the emissions. The experts are also closely involved in developing the methodologies for calculating the emissions. Work packages are assigned to five Task Forces, as described below. Task Force on Energy, Industry and Waste Management (ENINA) Covers emissions to air from the Industry, Energy production, Refineries

RIVM report 2020-0031
Page 35 of 525
and Waste management sectors. ENINA includes emissions experts from the following organisations: RIVM, TNO, Statistics Netherlands (CBS), Rijkswaterstaat Environment (Waste Management Department) and Fugro-Ecoplan. Task Force on Transportation Covers emissions to soil and air from the Transportation sector (aviation, shipping, rail and road transport). The following organisations are represented: PBL (Netherlands Environmental Assessment Agency), CBS, RIVM, Rijkswaterstaat and TNO. Task Force on Agriculture Covers the calculation of emissions to soil and air from Agriculture. Participating organisations include RIVM, PBL, Wageningen Environmental Research (WenR), Wageningen Economic Research (WecR) and CBS. Task Force on Water (MEWAT) Covers the calculation of emissions from all sectors to water. MEWAT includes Rijkswaterstaat, Deltares, PBL, RIVM, CBS and TNO. Task Force on Consumers and Other Sources of Emissions (WESP) Covers emissions caused by consumers, trade and services. The members are emissions experts from the RIVM and TNO.
1.2.2.1 Responsibility for reporting The NIR Part I is prepared by the RIVM as part of the PRTR project. Most institutes involved in the PRTR also contribute to the NIR. In addition, the Netherlands Enterprise Agency (RVO) is involved in its role as NIE. The RVO also prepares most of the NIR Part II. The RIVM integrates all information into the NIR. The RVO takes care of submission to the UNFCCC in its role as NIE. Submission to the UNFCCC takes place only after approval by the EZK.
1.2.2.2 Overview of inventory preparation and management under Article 7 of the Kyoto Protocol Following the annotated outline, the supplementary information, as required according to Article 7 of the Kyoto Protocol, is reported in the NIR Part II. This information is prepared by the RVO using information from various other organisations involved, such as the NEa (Dutch Emissions Authority), WUR and EZK.
1.2.3 Reporting, QA/QC, archiving and overall coordination The NIR is prepared by the RIVM with input from the relevant PRTR Task Forces and from the RVO. The preparation of the NIR also includes the documentation and archiving of statistical data for the estimates and QA/QC activities. The EZK formally approves the NIR before it is submitted; in some cases, approval follows consultation with other ministries. The RVO is responsible for coordinating QA/QC and responses to the EU and for providing additional information requested by the UNFCCC after the NIR and the CRF have been submitted. The RVO is also responsible for coordinating the submission of supporting data for the UNFCCC review process.
RIVM report 2020-0031
Page 36 of 525
For KP-LULUCF, consistency with the values submitted for the Convention is assured by using the same base data and calculation structure. The data, as required in the KP-LULUCF CRF tables, are derived from calculations required by the UNFCCC and specifically aggregated to the KP-LULUCF activities. The data and calculations are thus subject to the same QA/QC procedures (Arets et al., 2020). The calculated values were generated using the LULUCF bookkeeping model at Wageningen Environmental Research and checked by the LULUCF sectoral expert. Subsequently, they were sent to the NL-PRTR for the data to be entered in the CRF database for all sectors, and checked again. Any unexpected or incomplete values were reported to the LULUCF sectoral expert, checked and, if necessary, corrected.
1.2.3.1 Information on the QA/QC plan The National System, in line with the Kyoto requirements, was finalised and established by the end of 2005. As part of this system, the Act on the Monitoring of Greenhouse Gases also took effect in December 2005. This Act required the establishment of the National System for the monitoring of GHGs and empowered the Minister of Economic Affairs and Climate Policy (EZK) to appoint an authority responsible for the National System and the National GHG Emissions Inventory. In a subsequent regulation, the Minister appointed the RVO as the NIE, the single national entity required under the Kyoto Protocol. As part of its National System, the Netherlands has developed and implemented a QA/QC programme. This programme is assessed annually and updated, if necessary. The key elements of the current programme (RVO, 2019) are summarised in this chapter, notably those relating to the current NIR.
1.2.3.2 QA/QC procedures for the CRF / NIR 2020 The system of methodology reports was developed and implemented in order to increase the transparency of the inventory (including methodologies, procedures, tasks, roles and responsibilities with regard to inventories of GHGs). Transparent descriptions of all these aspects are included in the methodology reports for each gas and sector and in process descriptions for other relevant tasks in the National System. The methodology reports are assessed annually and updated, if necessary. Several QC issues relate to the NIR, partly referring to earlier reports:
• In 2017 the Expert Review Team (ERT) recommended that more information on the methodologies used in the NIR be provided. As a result of this recommendation, since 2018, the Netherlands has been including methodology reports as an integral part of the NIR (see Annex 7). The methodology reports sometimes refer to background documentation. Most of the background documentation is in English and can be made available for review purposes. The PRTR Task Forces are eager to continuously improve the quality and transparency of the methodology reports.
• In 2017 the Netherlands started a special project for the improvement of notation keys in the CRF tables. Over the past few years, this resulted in much better filling of CRF tables with notation keys.

RIVM report 2020-0031
Page 37 of 525
• For the NIR 2020, changes were incorporated into both methodology reports and background documents. The methodology reports are available on the National System website (http://english.rvo.nl/nie) and are an integral part of the NIR 2020 (see Annex 7).
To facilitate the general QC checks, a checklist was developed and implemented. A number of general QC checks have been added to the annual Work Plan of the PRTR and are also mentioned in the methodology reports. The QC checks included in the Work Plan are aimed at covering issues such as the consistency, completeness and correctness of the CRF data. The general QC for the present inventory was largely performed at the institutes involved as an integral part of their PRTR work (Wever, 2011). The PRTR Task Forces filled in a standard-format database with emissions data for 1990–2018 (with the exception of LULUCF). After a first check of the data by the RIVM for completeness, the (corrected) data were made available to the relevant Task Forces for consistency checks and trend analyses (comparability, accuracy). For that purpose, the Task Forces had access to the national emissions database. Several weeks before the dataset was fixed, a trend verification workshop was organised by the RIVM (5 December 2019). The conclusions of this workshop (including how the experts should resolve the issues for improvement as identified during this workshop) are documented at the RIVM. Further improvements to the database were then implemented by the Task Forces. QA for the current NIR 2020 includes the following activities:
• Taking into account the results of former UNFCCC reviews and ESD reviews and making the requested improvements.
• A peer and public review on the basis of the draft NIR in January/February 2020. Results of these reviews are summarised in Chapter 10. Issues will be addressed in upcoming NIRs.
The QA/QC system must operate within the available resources (both capacity and finance). Within those limitations, QA/QC activities focus on: The QA/QC programme (RVO, 2019), which has been developed and implemented as part of the National System. This programme includes quality objectives for the National System, the QA/QC plan and a schedule for the implementation of the activities. It is updated annually as part of an ‘evaluation and improvement cycle’ for the inventory and National System and is kept available for review. Figure 1.1 summarises the main elements of the annual QA/QC cycle, including the corresponding timeline. To ensure high-quality and continuous improvement, the annual inventory process is implemented as a cyclical project. This cycle is a key quality management tool (based on the Deming cycle of Plan–Do–Check–Act). QA/QC procedures for basic LULUCF data are different from QA/QC procedures for other sectors, and have been elaborated and documented in the description of QA/QC of the external agencies (Wever, 2011).

RIVM report 2020-0031
Page 38 of 525
Figure 1.1. QA/QC cycle (including timeline).
• Adaptation of the PRTR project to the quality system of the RIVM
(ISO 9001:2008 system), completed in 2012. • The annual Work Plan of the RIVM (RIVM, 2019). The Work Plan
describes the tasks and responsibilities of the parties involved in the PRTR process, such as products to be delivered, scheduling (planning) and emissions estimation (including the methodology reports on GHGs), as well as those of the members of the Task Forces. The annual Work Plan also describes the general QC activities to be performed by the Task Forces before the annual PRTR database is fixed (see Section 1.6.2).
• European Emission Trading Scheme (EU-ETS). Selected companies (large emitters) are part of the EU-ETS. They are obliged to report their CO2 emissions in accordance with strict monitoring procedures, which include strict QA/QC. The reported emissions are checked and approved by the Dutch Emission authority (NEa) and used in the inventory for QC and to calculate specific EFs.
• Agreements/covenants between the RIVM and other institutes involved in the annual PRTR process. The general agreement is that, by accepting the annual Work Plan, the institutes involved commit themselves to delivering capacity for the work/products specified in that Work Plan. The role and responsibilities of each institute have been described (and agreed upon) within the framework of the PRTR Work Plan.
• Specific procedures that have been established to fulfil the QA/QC requirements of the UNFCCC and Kyoto Protocol. General agreements on these procedures are described in the QA/QC programme as part of the National System. The following specific procedures and agreements have been described in the QA/QC plan and the annual PRTR Work Plan: o QC on data input and data processing, as part of the annual
trend analysis and consolidation of the database following approval of the institutions involved.
RIVM report 2020-0031
Page 39 of 525
o Documentation of the consistency, completeness and correctness of the CRF data (see also Section 1.6.2). Documentation is required for all changes to the historical dataset (recalculations) and for emissions trends that exceed 5% at the sector level and 0.5% at the national total level. This is the Netherlands’ interpretation of the IPCC Good Practice Guidance requirement in section 8.7.1.4: ‘[…] it is good practice to check emissions estimates for all source categories or sub-source categories that show greater than 10% change in a year compared to the previous year’s inventory’.
o Peer reviews of the CRF tables and NIR by the RVO and institutions not directly involved in the PRTR process.
o Public review of the draft NIR: Every year, the RVO organises a public review (via the internet), and relevant comments are incorporated into the final NIR.
o Audits: In the context of the annual Work Plan, it has been agreed that the institutions involved in the PRTR will inform the RIVM about forthcoming internal audits. Furthermore, the RVO is assigned the task of organising audits, if needed, of relevant processes or organisational issues within the National System.
o Archiving and documentation: Internal procedures are agreed (in the PRTR annual Work Plan) for general data collection and the storage of fixed datasets in the RIVM database, including the documentation/archiving of QC checks. Since 2012, the RIVM database has held storage space where the Task Forces can store the data needed for their emissions calculations. The use of this storage space is optional, as the storage of essential data is also guaranteed by the quality systems at the external agencies.
o Methodology reports: These have been updated and documented and are an integral part of this submission (see Annex 7); they will be published on the website http://english.rvo.nl/nie. To improve transparency, the implemented QC checklists have also been documented and archived, as part of the QA/QC plan. The RVO (as NIE) maintains the National System website and a central archive of relevant National System documents.
o QA/QC procedures: Whenever a contributing institution cites or quotes data from the annually fixed database in their own reports, their own QA/QC procedures apply.
• Annual inventory improvement: Within the inventory project, resources are made available to keep the total inventory up to the latest standards. In an annual cycle, the Task Forces are invited to draft proposals for the improvement of their emissions estimates. The proposals are prioritised in a consensus process and budgets are made available for the selected improvements. The available resources have to be shared between the different items of the inventory (GHG, air pollutants and water emissions). GHG-related issues are given high priority when they relate to improvements of key source estimates and/or if the reviews ask for specific improvements in methods or activity data. Proposals for improvements that contribute to a decrease in the uncertainty

RIVM report 2020-0031
Page 40 of 525
of emissions estimates are given priority over others. All planned improvements are documented in the annual Work Plan.
• Evaluation: Those involved in the annual inventory tasks are invited once a year to participate in an evaluation of the process. In this evaluation, the results of any internal and external reviews and evaluations are taken into account. The results are used for the annual update of the QA/QC programme and the annual Work Plan.
• Category-specific QC: The comparison of emissions data with data from independent sources was one of the actions proposed in the inventory improvement programme. However, because it did not seem possible to reduce uncertainties substantially through independent verification (measurements) – at least not on a national scale – this issue has received low priority. In the PRTR project over the last two years, efforts have been made to improve and update the assessment of uncertainties and the sector-specific QC activities. A revised uncertainty assessment (Approach 2 using Monte Carlo analysis) of Dutch GHG emissions is included in this NIR.
1.2.3.3 Verification activities for the CRF/NIR 2020
Two weeks prior to a trend analysis meeting, a snapshot from the database was made available by the RIVM in a web-based application (Emission Explorer, EmEx) for checking by the institutes and experts involved (PRTR Task Forces). This allowed the Task Forces to check for level errors and inconsistency in the algorithms/methods used for calculations throughout the time series. The Task Forces performed checks for all gases and sectors. The sector totals were compared with the previous year’s dataset. Where significant differences were found, the Task Forces evaluated the emissions data in greater detail. The results of these checks were then brought up for discussion at the trend analysis workshop and subsequently documented. During the trend analysis, the GHG emissions for all years between 1990 and 2018 were checked in two ways:
1. The datasets from previous years’ submissions were compared with the current submission; emissions from 1990 to 2017 should be identical to those reported last year for all emissions for which no methodological changes have been announced.
2. The data for 2018 were compared with the trend development for each gas since 1990. Checks of outliers were carried out at a more detailed level for the sub-sources of all sector background tables. Experts have been specifically looking at: • annual changes in emissions of all GHGs; • annual changes in activity data; • annual changes in IEFs; • level values of IEFs.
Exceptional trend changes and observed outliers were noted and discussed at the trend analysis workshop, resulting in an action list. Items on this list must either be processed within two weeks or be dealt with in the following year’s inventory. All the above-mentioned checks were included in the annual Work Plan for 2019 (RIVM, 2019). Data checks (including checks on non-GHGs)

RIVM report 2020-0031
Page 41 of 525
were also performed. To facilitate the data checks and the trend verification workshop, several tables were prepared from the PRTR emissions database:
• Based on the PRTR emissions database, a table with a comparison of emissions in 2017 and 2018. In this table, differences of more than 5% at sectoral level were used to document trends.
• A table with a comparison of data from the two sources, to check that no errors had occurred during the transfer of data from the PRTR emissions database to the CRF tables.
Data checks were performed by sector experts and others involved in preparing the emissions database and the inventory. Communications (emails) between the participants in the data checks were centrally collected and analysed. This resulted in a checklist of actions to be taken. This checklist was used as input for the trend verification workshop and was supplemented by the actions agreed in this workshop. Furthermore, in the trend verification workshop, trends of more than 5% at sector level were explained. Table 1.1 shows the key verification actions for the CRF tables/NIR 2020. The completion of an action was reported on the checklist. Based on the completed checklist and the documentation of trends, the dataset was formally agreed to by the three principal institutes: RIVM, PBL and CBS. The dataset was also discussed and accepted by the PRTR executive body (WEM). The internal versions of the CRF and NIR and all documentation (emails, data sheets and checklists) used in the preparation of the NIR are stored electronically on a server at the RIVM.

RIVM report 2020-0031
Page 42 of 525
Table 1.1. Key actions for the NIR 2020. Item Date Who Result Documentation Automated initial check on internal and external data consistency
During each upload
Data Exchange Module (DEX)
Acceptance or rejection of uploaded sector data
result logging in the PRTR database
Input of outstanding issues for this inventory
08-07-2019 RIVM-PRTR List of remaining issues/actions from last inventory
Actiepunten voorlopige cijfers 2018 v 8 juli 2019. xls
sheets for comparing final data 2017 and 2018
20-11-2019 RIVM Input for trend analyses Verschiltabel_LuchtIPCC_18-11-2019.xls
sheets for comparing final data 2017 and 2018
26-11-2019 RIVM Input for trend analyses Verschiltabel_LuchtIPCC_26-11-2019.xls
Trend analysis 5-12-2019 Task Forces Updated action list Actiepunten definitieve cijfers 1990-2018 v 10 december 2018.xls
Resolving the issues on the action list
Until 18-12-2019
Task Forces RIVM/ TNO National Inventory Compiler (NIC)
Final dataset Actiepunten definitieve cijfers 1990-2017 v 19 december 2018.xls
Comparison of data in CRF tables and EPRTR database
Until 10-02-2020
NIC/TNO First draft CRF sent to the EU and final CRF to EU
15-01-2020 15-03-2020
Writing and checks of NIR Until 15-3-2020 Task Forces/ NIC/TNO/NIE
Draft texts R:\.\NI National Inventory Report\NIR 2020\NIR redactie
Generation of tables for NIR from CRF tables
Until 15-3-2020 NIC/TNO Final text and tables NIR R:\....\NIR 2020\CRF….\Tables and Figures v13.xlsx

RIVM report 2020-0031
Page 43 of 525
1.2.3.4 Treatment of confidentiality issues Some of the data used in the compilation of the inventory are confidential and cannot be published in print or electronic format. For these data items, the Netherlands uses the code ‘C’ in the CRF. Although this requirement reduces the transparency of the inventory, all confidential data can nevertheless be made available to the official review process of the UNFCCC.
1.3 Inventory preparation: data collection, processing and storage 1.3.1 GHG and KP-LULUCF inventory
The primary process of preparing the GHG emissions inventory in the Netherlands is summarised in Figure 1.2. This process comprises several major steps, which are described in greater detail in the following sections.
Figure 1.2. Main elements in the GHG emissions inventory process. The preparation of the KP-LULUCF inventory is combined with the work for reporting LULUCF by the unit Wettelijke Onderzoekstaken Natuur & Milieu, part of Wageningen UR. The LULUCF project team (which is part of the Task Force Agriculture) is responsible for data management, the

RIVM report 2020-0031
Page 44 of 525
preparation of the reports on LULUCF, and the QA/QC activities, and decides on further improvements.
1.3.2 Data collection Various data suppliers provide the basic input data for emissions estimates. The principal data sources for GHG emissions are: Statistical data Statistical data are provided under various (not specifically GHG-related) obligations and legal arrangements. These include national statistics from the CBS and a number of other sources of data on sinks, water and waste. The provision of relevant data for GHGs is guaranteed through covenants and an Order in Decree prepared by the EZK. For GHGs, relevant agreements with Statistics Netherlands (CBS) and Rijkswaterstaat Environment with respect to waste management are in place. An agreement with the Ministry of Agriculture, Nature and Food Quality (LNV) and related institutions was established in 2005. Data from individual companies Data from individual companies are provided in the form of electronic annual environmental reports (e-AERs). A large number of companies have a legal obligation to submit an e-AER that includes – in addition to other environment-related information – emissions data validated by the competent authorities (usually provincial and occasionally local authorities), which also issue environmental permits to these companies. Every industrial activity in the Netherlands requires an environmental permit. As part of the permit application, the operator has to submit a documented account of the emissions and the production capacity (which need not be made available to the general public). On the basis of these data, the competent authority will set (emissions) limits in the environmental permit. The determination of the applicable (emissions) limits is based on national policies and the specific expertise of the competent authorities. This expertise is also used in the annual verification of the emissions in the environmental reports. The national inventory relies on this verification and only performs sample checks on these data. This procedure is only possible due to the country-specific situation in the Netherlands, where industry is fully aware of the need for emissions reductions as required by legislation. This results in a very open and constructive communication (on activity levels and emissions) between plant operators and competent authorities (although these data are not available to the general public). For this reason the inventory team can limit the verification of the emissions data from individual companies to a minimum. Some companies provide data voluntarily within the framework of environmental covenants. Large companies are also obliged to participate in the European Emission Trading System (EU-ETS). These companies have to report their CO2 emissions in specific annual ETS emissions reports. Whenever these reports from major industries contain plant-specific activity data and EFs of sufficient quality and transparency, these are used in the calculation of CO2 emissions estimates for specific sectors. The AERs from individual companies also provide essential information for calculating the emissions of substances other than CO2. The
RIVM report 2020-0031
Page 45 of 525
calculations of industrial process emissions of non-CO2 GHGs (e.g. N2O, HFC-23 and PFCs released as by-products) are mainly based on information from these AERs, as are emissions figures for precursor gases (CO, NOx, NMVOC and SO2). Only those AERs with high-quality and transparent data are used as a basis for calculating total source emissions in the Netherlands. Many Dutch industrial (sub)sectors consist of just a single company. This is the reason why the Netherlands cannot report activity data (confidential business information) in the NIR or CRF on the most detailed level. Although this may hamper the review process, all confidential data can and will be made available to the ESD and UNFCCC review teams (on request). Additional GHG-related data Additional GHG-related data are provided by other institutes and consultants specifically contracted to provide information on sectors not sufficiently covered by the above-mentioned data sources. For example, the RIVM makes contracts and financial arrangements with various agricultural institutes and the TNO. In 2004, the Ministry of Agriculture, Nature and Food Quality (LNV) contracted a number of agricultural institutes to develop a monitoring system and methodology description for the LULUCF dataset. In accordance with a written agreement between the Ministry of Economic Affairs and Climate Policy (EZK) and the RIVM, these activities are also part of the PRTR.
1.3.3 Data processing and storage Data processing and storage are coordinated by the RIVM. These processes consist most notably of the elaboration of emissions estimates and data preparation in the PRTR database. The emissions data are stored in a central database, thereby satisfying – in an efficient and effective manner – national and international criteria for emissions reporting. Using a custom-made programme (CRF Connector), all relevant emissions and activity data are extracted from the PRTR database and included in the CRF Reporter, thus ensuring the highest level of consistency. Data from the CRF Reporter are used in the compilation of the NIR. The emissions calculations and estimates that are made using the input data are performed by five Task Forces, as described in Section 1.2. The Task Forces are responsible for assessing emissions estimates based on the input data and EFs provided. The RIVM commissioned the TNO to assist in the compilation of the CRF tables (see Figure 1.3).
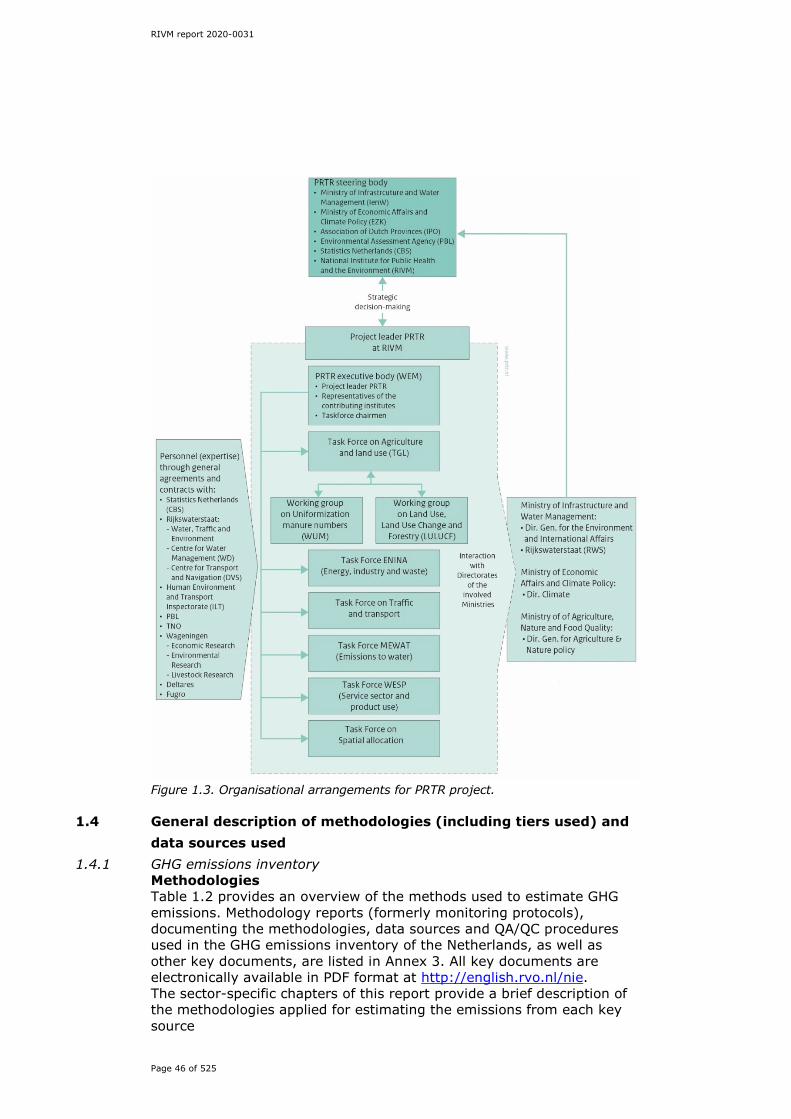
RIVM report 2020-0031
Page 46 of 525
Figure 1.3. Organisational arrangements for PRTR project.
1.4 General description of methodologies (including tiers used) and data sources used
1.4.1 GHG emissions inventory Methodologies Table 1.2 provides an overview of the methods used to estimate GHG emissions. Methodology reports (formerly monitoring protocols), documenting the methodologies, data sources and QA/QC procedures used in the GHG emissions inventory of the Netherlands, as well as other key documents, are listed in Annex 3. All key documents are electronically available in PDF format at http://english.rvo.nl/nie. The sector-specific chapters of this report provide a brief description of the methodologies applied for estimating the emissions from each key source
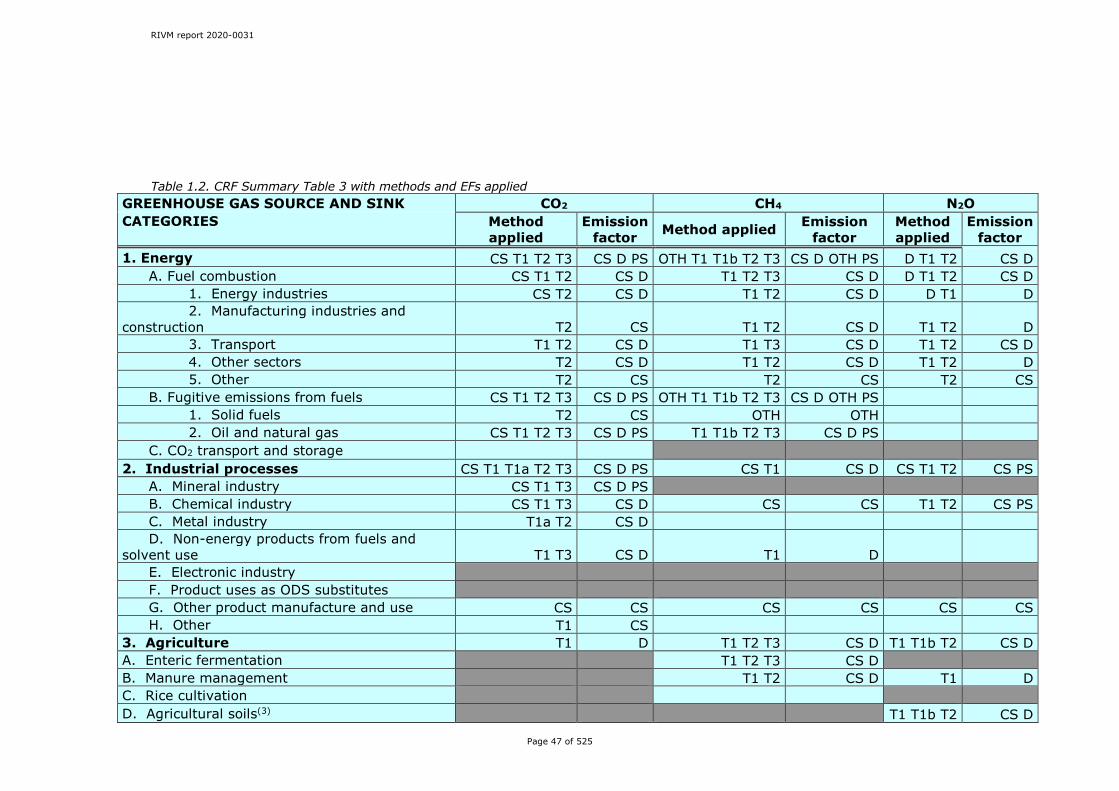
RIVM report 2020-0031
Page 47 of 525
Table 1.2. CRF Summary Table 3 with methods and EFs applied GREENHOUSE GAS SOURCE AND SINK CO2 CH4 N2O CATEGORIES Method
applied Emission
factor Method applied Emission factor
Method applied
Emission factor
1. Energy CS T1 T2 T3 CS D PS OTH T1 T1b T2 T3 CS D OTH PS D T1 T2 CS D A. Fuel combustion CS T1 T2 CS D T1 T2 T3 CS D D T1 T2 CS D
1. Energy industries CS T2 CS D T1 T2 CS D D T1 D 2. Manufacturing industries and
construction T2 CS T1 T2 CS D T1 T2 D 3. Transport T1 T2 CS D T1 T3 CS D T1 T2 CS D 4. Other sectors T2 CS D T1 T2 CS D T1 T2 D 5. Other T2 CS T2 CS T2 CS
B. Fugitive emissions from fuels CS T1 T2 T3 CS D PS OTH T1 T1b T2 T3 CS D OTH PS 1. Solid fuels T2 CS OTH OTH 2. Oil and natural gas CS T1 T2 T3 CS D PS T1 T1b T2 T3 CS D PS
C. CO2 transport and storage 2. Industrial processes CS T1 T1a T2 T3 CS D PS CS T1 CS D CS T1 T2 CS PS
A. Mineral industry CS T1 T3 CS D PS B. Chemical industry CS T1 T3 CS D CS CS T1 T2 CS PS C. Metal industry T1a T2 CS D D. Non-energy products from fuels and
solvent use T1 T3 CS D T1 D E. Electronic industry F. Product uses as ODS substitutes G. Other product manufacture and use CS CS CS CS CS CS H. Other T1 CS
3. Agriculture T1 D T1 T2 T3 CS D T1 T1b T2 CS D A. Enteric fermentation T1 T2 T3 CS D B. Manure management T1 T2 CS D T1 D C. Rice cultivation D. Agricultural soils(3) T1 T1b T2 CS D

RIVM report 2020-0031
Page 48 of 525
GREENHOUSE GAS SOURCE AND SINK CO2 CH4 N2O CATEGORIES Method
applied Emission
factor Method applied Emission factor
Method applied
Emission factor
E. Prescribed burning of savannas F. Field burning of agricultural residues G. Liming T1 D H. Urea application I. Other carbon-containing fertilizers J. Other 4. Land use land-use change and forestry CS T1 T2 CS D CS T1 CS D CS D T1 CS D A. Forest land T1 T2 CS D T1 CS D T1 CS D B. Cropland CS T1 CS D D T1 CS C. Grassland CS T1 T2 CS D CS D CS D T1 CS D D. Wetlands T1 T2 CS D D T1 CS E. Settlements CS T1 T2 CS D T1 CS F. Other land CS T1 T2 CS D T1 CS G. Harvested wood products T1 D H. Other 5. Waste CS CS CS T1 T2 CS D CS T1 T2 CS D A. Solid waste disposal T2 CS B. Biological treatment of solid waste T1 CS T1 CS C. Incineration and open burning of waste CS CS CS CS CS CS D. Waste water treatment and discharge T1 T2 CS D T1 T2 D E. Other 6. Other (as specified in summary 1.A)
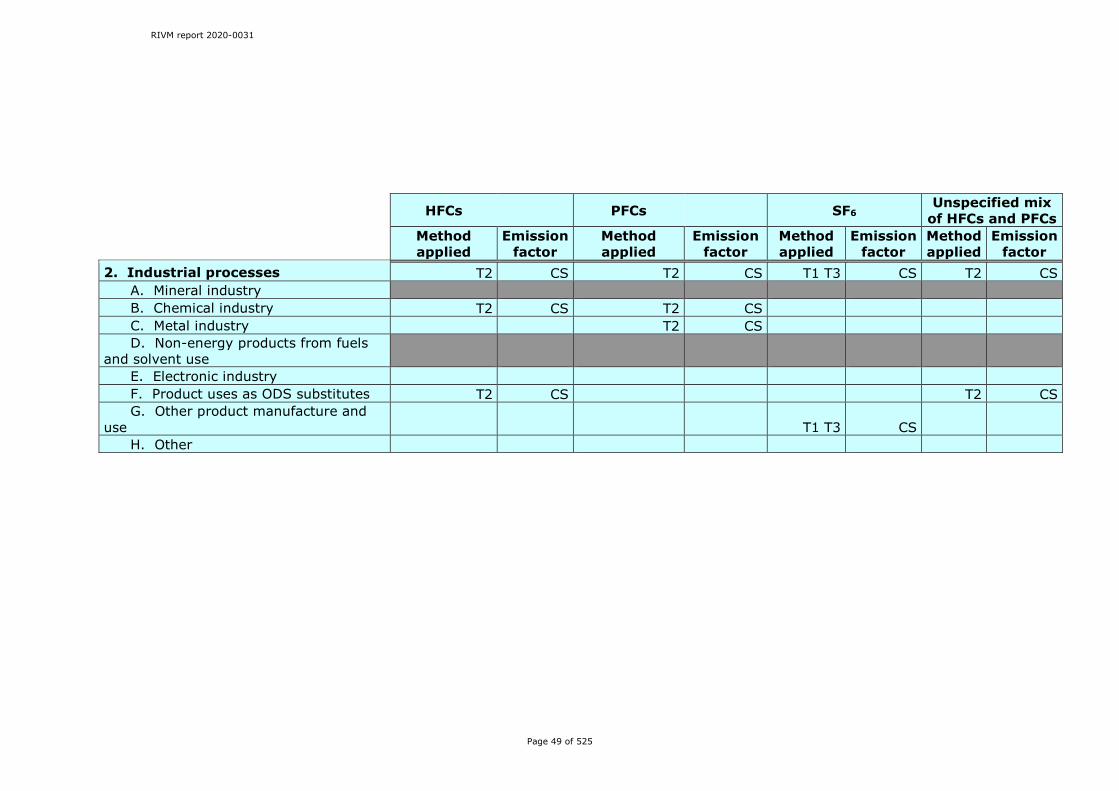
RIVM report 2020-0031
Page 49 of 525
HFCs PFCs SF6 Unspecified mix
of HFCs and PFCs
Method applied
Emission factor
Method applied
Emission factor
Method applied
Emission factor
Method applied
Emission factor
2. Industrial processes T2 CS T2 CS T1 T3 CS T2 CS A. Mineral industry B. Chemical industry T2 CS T2 CS C. Metal industry T2 CS D. Non-energy products from fuels
and solvent use E. Electronic industry F. Product uses as ODS substitutes T2 CS T2 CS G. Other product manufacture and
use T1 T3 CS H. Other

RIVM report 2020-0031
Page 50 of 525
1.4.2 Data sources The methodology reports provide detailed information on the activity data used for the inventory. In general, the following primary data sources supply the annual activity data used in the emissions calculations:
• Fossil fuel data: (1) national energy statistics from the CBS (Energy Monitor); (2) natural gas and diesel consumption in the agricultural sector (Wageningen Economic Research (WecR); (3) (residential) bio fuel data: national renewable energy statistics from the CBS (Renewable Energy).
• Transport statistics: (1) monthly statistics for traffic and transport; (2) national renewable energy statistics from the CBS (Renewable Energy).
• Industrial production statistics: (1) AERs from individual companies; (2) national statistics; incidentally ETS reports for QA/QC reasons.
• Consumption/emissions of PFCs and SF6: reported by individual firms.
• Anaesthetic gas: data provided by the three suppliers of this gas in the Netherlands. In case not all suppliers provide their data, gap-filling is performed on the basis of market shares.
• Spray cans containing N2O: the Dutch Association of Aerosol Producers (Nederlandse Aerosol Vereniging, NAV).
• Animal numbers and Manure production and handling: CBS/WecR agricultural database and data from the annual agricultural census.
• Fertiliser statistics: WecR agricultural statistics. • Forest and wood statistics:
o stem volume, annual growth, carbon balance: data from three National Forest Inventories: HOSP (1988–1992), fifth National Forest Inventory (NFI-5, 2001–2005) and sixth National Forest Inventory (NFI-6 2012–2013);
o harvest data: wood balance data from the National Forest Inventories NFI-5 and NFI-6, in combination with FAO harvest statistics.
• Land use and land use change: based on digitised and digital topographical maps of 1990 (Kramer and van Dorland, 2009), 2004 (Kramer et al., 2007), 2009 (Kramer and Clement, 2016), 2013 (Kramer and Clement, 2015) and 2017 (Kramer, 2019).
• Soil maps: de Vries et al. (2003) and 2014 update (de Vries et al., 2014).
• Soil information system: information on soil profiles, soil organic matter, bulk density (Finke et al., 2001; Kuikman et al., 2003; de Groot et al., 2005a; Lesschen et al., 2012).
• Waste production and handling and CH4 recovery from landfills: Working Group on Waste Registration (WAR), Rijkswaterstaat Environment and the CBS.
Many recent statistics are available at Statistics Netherlands’ statistical website StatLine and in the CBS/PBL/RIVM Environmental Data Compendium. It should be noted, however, that the units and definitions used for domestic purposes on those websites occasionally differ from those used in this report (for instance: temperature-corrected CO2 emissions versus actual emissions in this report; in other cases,
RIVM report 2020-0031
Page 51 of 525
emissions are presented with or without the inclusion of organic CO2 and with or without LULUCF sinks and sources).
1.4.3 KP-LULUCF inventory Methodologies The methods used to estimate data on sinks and sources as well as the units of land subject to Article 3.3 Afforestation/Reforestation (AR) and Deforestation (D) and Article 3.4 Forest management (FM) are similar to the methods used for LULUCF. Mostly the same base data are used; only the aggregation to the KP activities differs from the aggregations to the UNFCCC LULUCF categories. The methodology used by the Netherlands to assess emissions from LULUCF is based on a wall-to-wall approach for the estimation of area per category of land use. For the wall-to-wall map overlay approach, harmonised and validated digital topographical maps dated 1 January 1990, 2004, 2009, 2013 and 2017 were used (Kramer and van Dorland, 2009; Kramer et al., 2007; Kramer and Clement, 2016; Kramer and Clement, 2015; Kramer, 2019; Arets et al., 2020). The results were national-scale land use and land use change matrices (1990–2004, 2004–2009, 2009–2013 and 2013–2017; see Arets et al., 2020). To distinguish between mineral soils and peat soils, overlays were made with the Dutch Soil Map (de Vries et al., 2004, 2003) and its 2014 update of organic soils (de Vries et al., 2014). The result was a map with national coverage that identifies for each pixel whether it was subject to AR, D or FM between 1990 and 2017, whether it is located on a mineral soil or on an organic soil (peat or peaty) and, if on a mineral soil, what the aggregated soil type is. Land use changes after 2017 are extrapolated from the latest land use change matrix. These changes will be updated once a new land use map becomes available. A future land use map is anticipated with a map date of 1 January 2021. Data sources The base data sources used for calculating emissions and removals for KP-LULUCF are the same as those used for reporting under the convention. Like the GHG emissions inventory, it uses:
• Forest and wood statistics: o stem volume, annual growth, carbon balance: data from
three National Forest Inventories: HOSP (1988–1992), fifth National Forest Inventory (NFI-5, 2001–2005) and sixth National Forest Inventory (NFI-6 2012–2013);
o harvest data: wood balance data from the National Forest Inventories NFI-5 and NFI-6, in combination with FAO harvest statistics.
• Land use and land use change: based on digitised and digital topographical maps of 1990 (Kramer and van Dorland, 2009), 2004 (Kramer et al., 2007), 2009 (Kramer and Clement, 2016), 2013 (Kramer and Clement, 2015) and 2017 (Kramer, 2019).
• Soil maps: de Vries et al. (2003) and 2014 update (de Vries et al., 2014).
• Soil information system: information on soil profiles, soil organic matter and bulk density (Finke et al., 2001; Kuikman et al., 2003; de Groot et al., 2005; Lesschen et al., 2012).

RIVM report 2020-0031
Page 52 of 525
1.5 Brief description of key categories 1.5.1 GHG emissions inventory
The analysis of key categories is performed in accordance with the 2006 IPCC Guidelines. To facilitate the identification of key sources, the contribution of source categories to emissions per gas is classified according to the IPCC potential key category list, as presented in volume 1, chapter 4, Table 4.1 of the 2006 IPCC Guidelines. An extensive overview of the results of the key category analysis is provided in Annex 1 of this report. Per sector, the key categories are also listed in the first section of each of Chapters 3 to 9 (in overview tables). Please note that the Netherlands uses a country-specific aggregation of sources. The key category analysis is used for the prioritisation of possible inventory improvement actions. In comparison with the key category analysis for the NIR 2019 submission, one additional key category has been identified: ‘indirect CO2 emissions’. Erroneously, this source category was not included in the analysis in 2019. Compared with the NIR 2019, two sources are no longer key categories:
• 2G: Other product manufacture and use (N2O); • 5D: Wastewater treatment and discharge (N2O).
In addition, source categories 3B and 3B1 for N2O and 3B1 for CH4 have been split into several sub-categories in this year’s inventory. The sub-categories have been included in the key category analysis for 2020. Based on an Approach 1 assessment (both level and trend, excluding LULUCF), the Netherlands’ inventory contains 40 key categories. Based on Approach 2, which also takes into account uncertainties, 12 additional sources are identified as key categories. If LULUCF is included in the analysis, the Netherlands’ inventory contains 56 key categories. Annex 2 to this NIR also includes information on key categories in 1990. One source category shows as a key category in 1990, but not in 2018. The 2018 inventory contains, in comparison with 1990, 9 additional source categories on the basis of a level analysis; and 3 additional source categories on the basis of a trend analysis.
1.5.2 KP-LULUCF inventory The smallest key category based on the Approach 1 level analysis including LULUCF is 544.0 Gg CO2 (1A4 Liquids (excluding 1A4c)). With net emissions of -613.3 Gg CO2, the absolute annual contribution of Afforestation/Reforestation under the KP-LULUCF in 2017 is larger than the smallest key category. Deforestation under the KP-LULUCF in 2018 causes a net emission of 1317.7 Gg CO2, which is more than the smallest key category. With a net emission of -1027.30 Gg CO2, the absolute contribution of Forest management is also larger than the smallest key category.
1.6 General uncertainty evaluation, including data on the overall uncertainty of the inventory totals The IPCC Approach 1 methodology for estimating uncertainty in annual emissions and trends has been applied to the list of potential key
RIVM report 2020-0031
Page 53 of 525
categories (see Annex 1) in order to obtain an estimate of the uncertainties in annual emissions, as well as in the trends. The IPCC Approach 2 methodology for estimating uncertainty in annual emissions has been applied to all of the emission categories in order to obtain an estimate of the uncertainties in annual emissions (and to compare this with the Approach 1 methodology).
1.6.1 GHG emissions inventory Approach 1 uncertainty – propagation of error The following information sources were used for estimating the Approach 1 uncertainty in activity data and EFs (Olivier et al., 2009):
• estimates used for reporting uncertainty in GHG emissions in the Netherlands that were discussed at a national workshop in 1999 (Amstel et al., 2000);
• default uncertainty estimates provided in the 2006 IPCC Guidelines;
• RIVM fact sheets on calculation methodology and data uncertainty (RIVM, 1999);
• other information on the quality of data (Boonekamp et al., 2001); • a comparison with uncertainty ranges reported by other European
countries, which has led to a number of improvements in (and increased underpinning of) the Netherlands’ assumptions for the present Approach 1 assessment (Ramírez-Ramírez et al., 2006).
The uncertainty of waste incineration, landfilling and composting, and digestion is described in a separate report (RWS, 2014). These data sources were supplemented by expert judgements by RIVM/PBL and CBS emissions experts. They prepared, independent from one another, uncertainty estimates. Their views were discussed to reach a consensus on the estimates. This was followed by an estimation of the uncertainty in the emissions in 1990 and 2017 according to the IPCC Approach 1 methodology – for both annual emissions and the emissions trend for the Netherlands. All uncertainty figures should be interpreted as corresponding to a confidence interval of two standard deviations (2σ), or 95%. In cases where asymmetric uncertainty ranges were assumed, the larger percentage was used in the calculation. The results of the uncertainty calculation according to the IPCC Approach 1 are summarised in Annex 2 of this report. The Approach 1 uncertainties are also indicated in the relevant sections of Chapters 3–9. The Approach 1 calculation of annual uncertainty in CO2-equivalent emissions results in an overall uncertainty of approximately 3% in 2018, based on calculated uncertainties of 2%, 9%, 38% and 35% for CO2 (excluding LULUCF), CH4, N2O and F-gases, respectively. The uncertainty in CO2-equivalent emissions including emissions from LULUCF has not been elaborated in this report, but is also calculated to be 3%. However, these figures do not include the correlation between source categories (e.g. cattle numbers for enteric fermentation and animal manure production), nor a correction for non-reported sources. The
RIVM report 2020-0031
Page 54 of 525
correlation between source categories can be included in an Approach 2 uncertainty assessment. Approach 2 uncertainty – Monte Carlo analysis Currently, an Approach 2 uncertainty assessment (using Monte Carlo analysis) is implemented in the Dutch emissions inventory and this is used as a comparison with the Approach 1 results. Most of the uncertainty estimates now incorporated in the Dutch Inventory database are based on the results of expert elicitations (within the Task Forces ENINA (Energy/Industry/Waste), Traffic and transport, Agriculture, and WESP (product use)). For the sectors Agriculture and Waste, the expert elicitation was combined with a recent Approach 1 uncertainty calculation (Agriculture and Waste). For LULUCF, a sector-specific Approach 2 uncertainty calculation was already available from the Task Force. The expert elicitations were set up following the expert elicitation guidance in the 2006 IPCC Guidelines (motivating, structuring, conditioning, encoding and verification). These expert elicitations were performed to assess the uncertainties of the individual source-specific activity data and EFs separately (this approach is more detailed than the uncertainty assessment on the level of the CRF categories). Correlations between activity data and the EFs of different emissions sources have been included in the Monte Carlo analysis (as far as possible). These correlations are included for the following types of data:
• Activity data: o The energy statistics are more accurate on an aggregated
level (e.g. for Industry) than on a detailed level (e.g. for the individual industry sectors separately). This type of correlation is also used in several Transport sub-sectors (such as road transport, shipping and aviation).
o The number of animals in one emissions source is correlated to the number of animals in another emissions source. This type of correlation is used were the identifier of the activity (animal number or inhabitants) has to be equal in different source/ pollutant combinations.
• Emission factors: o The uncertainty of an EF of a fuel from stationary combustion
is assumed to be equal for all of the sources that use the specific fuel in the stationary combustion sector. This type of correlation is also used in several Transport subsectors (such as shipping and aviation).
o The EFs for the different types of cows (cows for meat production or dairy cows) are assumed to be correlated. The same holds for the EFs for ducks and chickens, and for horses and asses.
The results of the Approach 2 uncertainty analysis are presented in Table 1.3.

RIVM report 2020-0031
Page 55 of 525
Table 1.3. Uncertainties (95% confidence ranges) based on the Approach 2 uncertainty assessment (Monte Carlo analysis) for 2018.
CRF category
CO2 CH4 N2O F-gases Total (CO2 eq.)
1 3% 35% 30% 3% 2 8% 62% 23% 27% 9% 3 26% 10% 35% 14% 4 35% 35% 5 27% 22% 38% 21%
Total 3% 9% 26% 27% 3% Results of the uncertainty analyses The results of the calculated Approach 2 uncertainty analysis are of the same order of magnitude as the Approach 1 uncertainty assessment for total CO2 equivalents. For methane, nitrous oxide and F-gases, the uncertainty according to Approach 2 is somewhat lower. Table 1.4 shows the currently estimated values for the Approach 1 and Approach 2 analyses. Table 1.4. Approach 1 and the Approach 2 uncertainty assessment of 2018 emissions (without LULUCF). Greenhouse gas
Approach 1 annual
uncertainty
Approach 2 annual
uncertainty
Carbon dioxide 2% 3%
Methane 9% 9%
Nitrous oxide 38% 26%
F-gases 35% 27%
Total 3% 3% Table 1.4 shows that taking into account the correlations between source categories increases the uncertainty of the national CO2 emissions. For the other gases, the Approach 2 analysis yields lower uncertainties. The lower uncertainties in the Approach 2 calculations are also caused by lower initial uncertainties. For example, for Agriculture, the overall uncertainty of CH4 emissions is lower in the Approach 2 analysis than in the Approach 1 analysis. Table A2.1 in Annex 2 shows the estimates of the trend uncertainties for 1990–2018 calculated according to the IPCC Approach 1 analysis set out in the 2006 IPCC Guidelines. The result is a trend uncertainty in total CO2-equivalent emissions (including LULUCF) for 1990–2018 of ±2%. This means that the trend in total CO2-equivalent emissions between 1990 and 2018 (excluding LULUCF), which is calculated to be a 15.1% (rounded 15%) decrease, will be between a 13% and a 17% decrease.

RIVM report 2020-0031
Page 56 of 525
For each individual gas, the trend uncertainties in total emissions of CO2, CH4, N2O and the total group of F-gases have been calculated to be ±2%, ±5%, ±6% and ±9%, respectively. More details on the level and trend uncertainty assessment can be found in Annex 2. In the analyses described above (and in more detail in Annex 2), only random errors were estimated, on the assumption that the methodology used for the calculations did not include systematic errors, which can occur in practice. An independent verification of emissions levels and emissions trends using, for example, comparisons with atmospheric concentration measurements is therefore encouraged by the 2006 IPCC Guidelines (IPCC, 2006). In the Netherlands, such approaches, funded by the National Research Programme on Global Air Pollution and Climate Change (NOP-MLK) or by the Dutch Reduction Programme on Other Greenhouse Gases (ROB), have been used for several years. The results of these studies can be found in Berdowski et al. (2001), Roemer and Tarasova (2002) and Roemer et al. (2003). Several institutes involved in the Netherlands’ PRTR are involved in the Horizon 2020 VERIFY project. Progress in this project is closely followed, with a view to considering linking the resulting approach to the Netherlands’ inventory system. Base year (1990) uncertainties As a result of a recommendation in the 2019 inventory review, Annex 2 also includes an overview of uncertainties in the base year. Because the Netherlands uses the uncertainties in the current year as an instrument to set priorities for further inventory improvement, we have paid little attention in the past to reporting the uncertainties in the base year. Table 1.5 shows the uncertainties in the base year (Approach 1) based on expert judgement in 2000 (van Amstel et al., 2000) as well as on the current, more detailed, methodology (taking into account the specific uncertainties for all source categories). Table 1.5. Assessment of uncertainties in 1990 emissions (without LULUCF). Greenhouse gas Approach 1
2000 methodology Approach 1
2020 methodology
Carbon dioxide 3% 3%
Methane 17% 21%
Nitrous oxide 34% 70%
HFC/SF6 PFC
41% 100%
70%
F-gases 100% 70% Total 4.4% 4.3%
1.6.2 KP-LULUCF inventory The uncertainty analysis uses Monte Carlo simulations to combine different types of uncertainties and correctly represent the uncertainties in the land use matrix (see chapter 14 in Arets et al., 2020, for details).
RIVM report 2020-0031
Page 57 of 525
The analysis combines uncertainty estimates of forest statistics, land use and land use change data (topographical data) and the method used to calculate the yearly growth in carbon increase and removals. The uncertainty analysis is performed for Forest Land and is based on the same data and calculations used for the KP Article 3.3 categories and Article 3.4 Forest Management. Thus, the uncertainty for total net emissions from units of land under Article 3.3 Afforestation/ Reforestation are estimated at +10% to -12%, which is equal to the uncertainty in Land converted to Forest Land. Similarly, the uncertainty for total net removals from units of land under Article 3.4 Forest Management is estimated at +26% to -21%, which equals the uncertainty of Forest Land remaining Forest Land (see Section 6.4.3).
1.7 General assessment of completeness 1.7.1 GHG emissions inventory
At present the Netherlands’ GHG inventory includes almost all sources that, according to the 2006 IPCC Guidelines, should be included in the inventory. The following very minor sources are not included:
• CO2 from Asphalt roofing (2D3), due to missing activity data; • CO2 from Road paving (2D3), due to missing activity data; • CH4 from Enteric fermentation of poultry (3A4), due to missing
EFs; • N2O from Industrial wastewater (5D2) and septic tanks, due to
negligible amounts; • part of CH4 from Industrial wastewater (5D2 sludge), due to
negligible amounts. Annex 6 presents the assessment of completeness and sources, potential sources and sinks for this submission of the NIR 2020 and the CRF tables.
1.7.2 KP-LULUCF inventory The inventory for KP-LULUCF in general is complete. Changes in carbon stocks are reported for all significant pools for Afforestation, Reforestation (AR), Deforestation (D) and Forest Management (FM). In the Netherlands, the conversion of non-forest to forest (AR) involves a build-up of carbon in litter. However, because good data are lacking to quantify this sink, we report the accumulation of carbon in litter for AR conservatively as ‘not a source’ (notation key NR in CRF Table NIR 1) and as ‘not estimated’ (NE) in the CRF Tables 4(KP-I)A.1 and 4(KP-I)B.1. Because no other land use category includes carbon in dead wood, the conversion of non-forest to forest involves a build-up of carbon in dead wood. But as it is unlikely that much dead wood will accumulate in very young trees, the accumulation of carbon in dead wood in AR plots is a very small sink. We therefore report this carbon sink during the first 20 years conservatively as zero. Once forest becomes older (>20 years), changes in carbon stocks in dead wood are estimated in the same way as is done for Forest land remaining forest land under the Convention. Fertilisation in Re/afforested areas and areas under Forest management does not occur in the Netherlands, so is reported as ‘NO’ (not occurring). Fertilisation on Grassland and cropland is included in the Agriculture sector.

RIVM report 2020-0031
Page 58 of 525
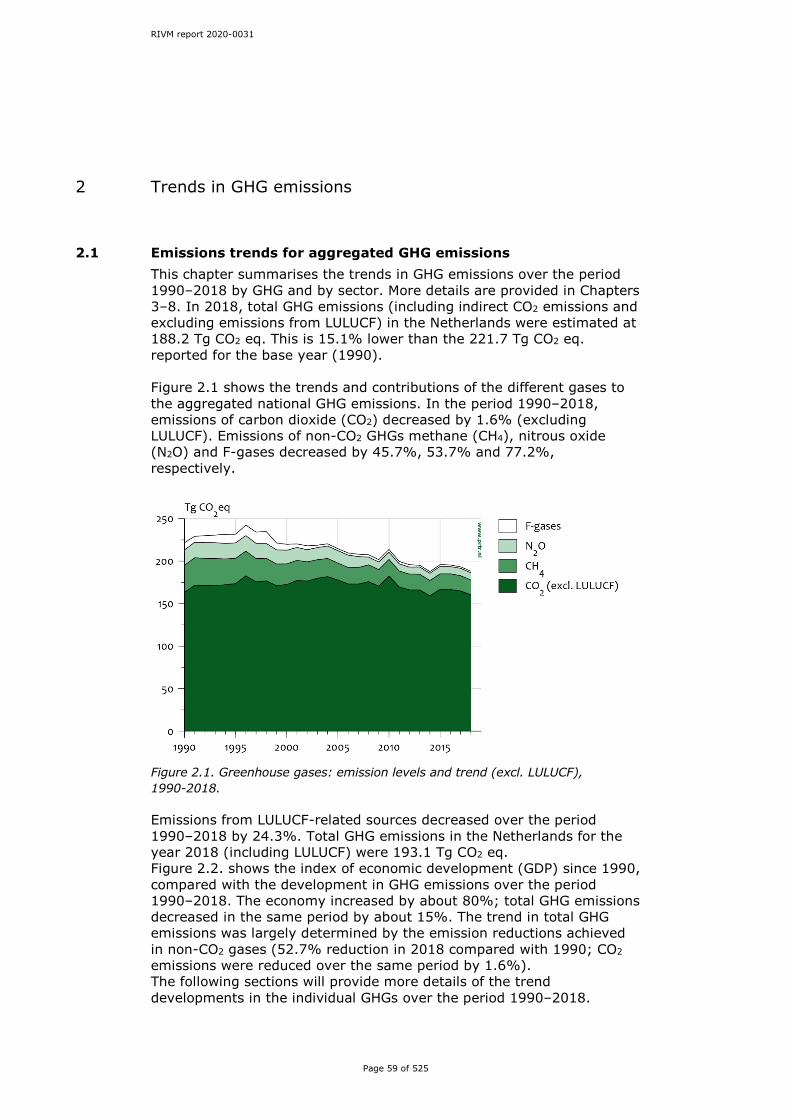
RIVM report 2020-0031
Page 59 of 525
2 Trends in GHG emissions
2.1 Emissions trends for aggregated GHG emissions This chapter summarises the trends in GHG emissions over the period 1990–2018 by GHG and by sector. More details are provided in Chapters 3–8. In 2018, total GHG emissions (including indirect CO2 emissions and excluding emissions from LULUCF) in the Netherlands were estimated at 188.2 Tg CO2 eq. This is 15.1% lower than the 221.7 Tg CO2 eq. reported for the base year (1990). Figure 2.1 shows the trends and contributions of the different gases to the aggregated national GHG emissions. In the period 1990–2018, emissions of carbon dioxide (CO2) decreased by 1.6% (excluding LULUCF). Emissions of non-CO2 GHGs methane (CH4), nitrous oxide (N2O) and F-gases decreased by 45.7%, 53.7% and 77.2%, respectively.
Figure 2.1. Greenhouse gases: emission levels and trend (excl. LULUCF), 1990-2018. Emissions from LULUCF-related sources decreased over the period 1990–2018 by 24.3%. Total GHG emissions in the Netherlands for the year 2018 (including LULUCF) were 193.1 Tg CO2 eq. Figure 2.2. shows the index of economic development (GDP) since 1990, compared with the development in GHG emissions over the period 1990–2018. The economy increased by about 80%; total GHG emissions decreased in the same period by about 15%. The trend in total GHG emissions was largely determined by the emission reductions achieved in non-CO2 gases (52.7% reduction in 2018 compared with 1990; CO2 emissions were reduced over the same period by 1.6%). The following sections will provide more details of the trend developments in the individual GHGs over the period 1990–2018.

RIVM report 2020-0031
Page 60 of 525
Figure 2.2. Development of greenhouse gas emissions compared with economic growth over the period 1990–2018. Energy consumption – most important source of greenhousegas emissions About 81% of total GHG emissions in the Netherlands are related to sector 1, Energy. Figure 2.3 shows both the division of energy demand between specific sectors and the energy supply divided between energy sources (in PJ NCV per year). The upper part of Figure 2.3 shows that primary energy consumption in the period 1990–2018 increased by about 8.4%. However, in 2018, primary energy demand decreased by c. 1.5% compared with 2017. Final energy consumption remained stable between 2017 and 2018 at 1,875 PJ – about 5% above 1990 levels. Most energy is consumed in the built environment, followed by industry and transport. The effect of the economic crisis in 2008 is most clearly visible in the industrial sector. The energy consumption of industry has not returned to the pre-2008 level, although it has been increasing again since 2014. Year-on-year dips and jumps in energy demand can largely be explained by weather conditions. Natural gas is the main source of energy used in the Netherlands for space heating. Figure 2.3 shows that the winters of 1996 and 2010 were relatively cold, whereas the winter of 2014 was relatively warm.
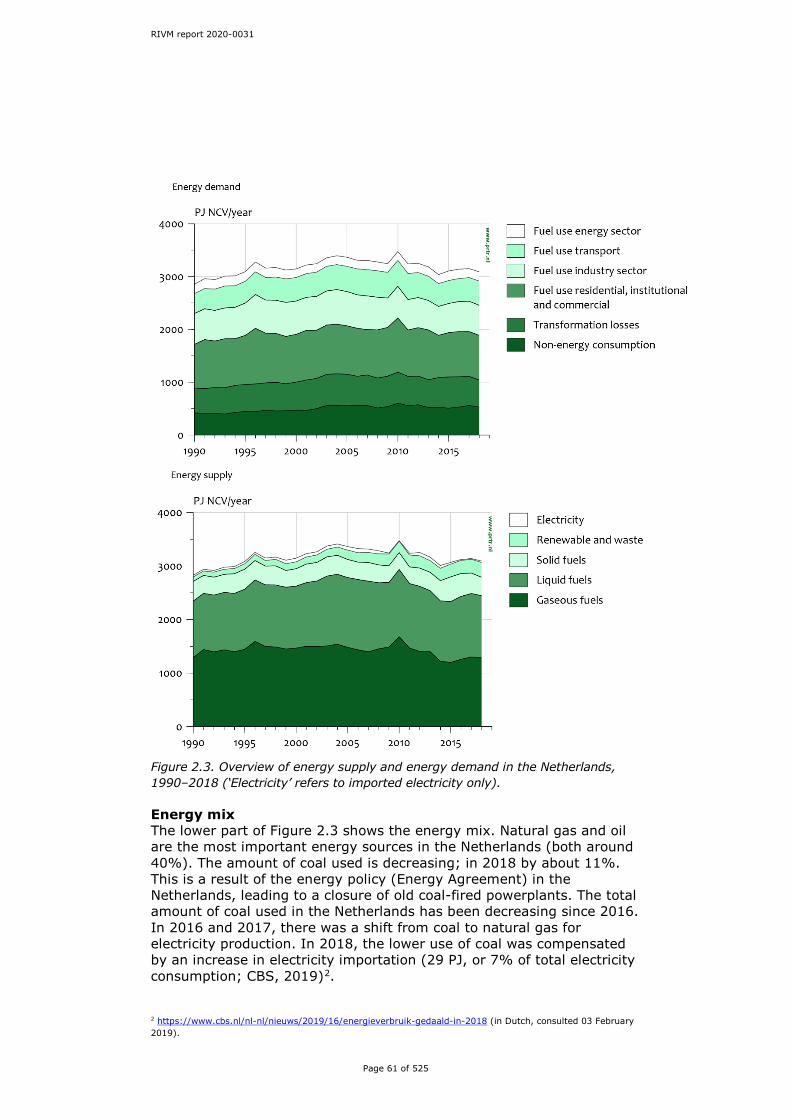
RIVM report 2020-0031
Page 61 of 525
Figure 2.3. Overview of energy supply and energy demand in the Netherlands, 1990–2018 (‘Electricity’ refers to imported electricity only). Energy mix The lower part of Figure 2.3 shows the energy mix. Natural gas and oil are the most important energy sources in the Netherlands (both around 40%). The amount of coal used is decreasing; in 2018 by about 11%. This is a result of the energy policy (Energy Agreement) in the Netherlands, leading to a closure of old coal-fired powerplants. The total amount of coal used in the Netherlands has been decreasing since 2016. In 2016 and 2017, there was a shift from coal to natural gas for electricity production. In 2018, the lower use of coal was compensated by an increase in electricity importation (29 PJ, or 7% of total electricity consumption; CBS, 2019)2.
2 https://www.cbs.nl/nl-nl/nieuws/2019/16/energieverbruik-gedaald-in-2018 (in Dutch, consulted 03 February 2019).

RIVM report 2020-0031
Page 62 of 525
Figure 2.3 also shows that the amount of renewables and waste in the Netherlands is increasing. Figure 2.4 shows the mix of renewable energy sources in the Netherlands and the trend. Renewables accounted for 157 PJ in 2018 (about 7.4% of total energy use in the Netherlands).
Figure 2.4. Development of renewable energy as a percentage of total energy demand in the Netherlands, 1990–2018 (CLO, 2019)3. Energy efficiency The efficiency for final energy consumption, as measured by the so-called technical ODEX has improved by around 1.9% per year since 20004. Smaller gains have been registered for transport (0.9%/year including international aviation), and larger gains of 2.6%/year for the residential sector and 2.3% for industry. Efficiency improvements in the Industry sector have slowed down since 2008. This may be due to lower investment in new equipment since the economic crisis.
2.2 Emissions trends by gas 2.2.1 Carbon dioxide
Figure 2.5 shows the contribution of the most important sectors to the trend in total national CO2 emissions (excluding LULUCF). In the period 1990–2018, national CO2 emissions decreased by 1.6% (from 163.3 Tg CO2 eq. to 160.6 Tg CO2 eq.). In 2018, total CO2 emissions decreased by about 2.7% compared with 2017 (-4.4 Tg CO2 eq.). The main reasons for the decrease were:
• reduction in coal combustion for Electricity and heat production (1A1a), compensated by an increase in electricity importation;
• total energy use decreased by about 1.5% compared with 2017.
3 https://www.clo.nl/en/indicators/en0385-renewable-energy-use (consulted 03 March 2020). 4 https://www.odyssee-mure.eu/publications/efficiency-trends-policies-profiles/netherlands.html (consulted 03 March 2020).

RIVM report 2020-0031
Page 63 of 525
Figure 2.5. CO2 trend and emissions levels of sectors (excl. LULUCF), 1990–2018. Energy industries (1A1) The Energy sector (Energy industries, Category 1A1) is the largest contributor to total CO2 emissions in the Netherlands (37.2%). Figure 2.6 shows the emissions trend in category 1A1 between 1990 and 2018.
Figure 2.6. 1A1 Energy industries – trend in total GHG emission by sub-category, 1990–2018. The Dutch electricity sector (1A1a) has a few notable features: it has a large share of coal-fired power stations and a large proportion of gas-fired cogeneration plants, many of the latter being operated as joint ventures with industries. The increasing trend in electric power production corresponds to a substantial increase in CO2 emissions from fossil fuel combustion by power plants. Over the years there has been a fluctuation in CO2 emissions in 1A1a due to market circumstances. Influencing factors have been:
• In some years the import of electricity was higher (e.g. 1999–2008, 2012–2014) than in other years;

RIVM report 2020-0031
Page 64 of 525
• an increase in natural gas combustion due to a change in the ownership structure of plants (which resulted in a substantial shift of natural gas combustion allocation from 1A2 to 1A1a) in 1990–1998;
• new, large coal-fired power plants in 2015, resulting in a shift from natural gas to coal;
• closure of old coal-fired power plants in 2015–2017, resulting in a decrease in coal consumption.
There are five large refineries in the Netherlands, which export approximately 50% of their products to the European market. As a consequence, the Dutch petrochemical industry (category 1A1b) is relatively large. Between 1990 and 2018, total CO2 emissions from the refineries (including fugitive CO2 emissions from hydrogen production reported in 1B2a-iv Refining) fluctuated between 10 and 13 Tg CO2. CO2 emissions from category 1A1c (Manufacture of solid fuels and other energy industries) increased from 2008 onwards, mainly because sites for oil and gas production tend to be less productive than those operated in the past.This fact explains the steady increase over time shown by this category with respect to gas consumption. Between 2014 and 2018, the production of natural gas was reduced by more than 50%, which also resulted in a decrease in the amount of natural gas combusted in this sector. Manufacturing Industries (1A2)
Figure 2.7. 1A2 Manufacturing industries and construction – trend and emissions levels of source categories, 1990–2018. Manufacturing industries consists of 7 sub-categories. As Figure 2.7 shows, category 1A2c Chemicals is the most important one. CO2 emissions from this sub-category have decreased since the early 1990s, mainly due to a large decrease in the consumption of natural gas. This in turn was mainly due to a decrease in cogeneration facilities in this industrial sector. CO2 emissions from liquid fuel combustion stem predominantly from the combustion of chemical waste gas. The decrease in liquid fuel consumption in the 1990s was mainly due to a shift in the ownership of cogeneration plants to joint ventures, thus reallocating liquid fuel consumption to the energy industries. This also explains the large decrease in solid fuel combustion in this sub-category.

RIVM report 2020-0031
Page 65 of 525
Figure 2.7 clearly shows the effect of the economic crisis in 2008. Besides the effects indicated above in 1A2c, emissions in the category 1A2 generally follow production in the manufacturing industries: over the last few years, emissions have tended to increase because of positive economic development. Road transport (1A3) GHG emissions from road transport steadily increased between 1990 and 2006; see Figure 2.8. The increase was more or less in line with the increase in road transport volumes.
Figure 2.8. 1A3 Transport – emissions levels of source categories, 1990–2018. Between 2006 and 2008, emissions stabilised due to an increase in the use of biofuels in road transport. CO2 emissions from biofuels are reported separately in the inventory and are not part of the national emissions totals. In 2009, GHG emissions from transport decreased by 4%, primarily due to the economic crisis and the resulting decrease in freight transport volumes. In 2010 and 2011, emissions increased slightly due to a decrease in the use of biofuels in 2010 and an increase in road transport volumes in 2011. Between 2011 and 2014, CO2 emissions decreased by 13%. This can largely be attributed to an increase in cross-border refuelling resulting from an increasing difference in fuel prices between the Netherlands and Belgium/Germany (Geilenkirchen et al., 2017). Since 2014 GHG emissions have increased again by c. 1% per year. In 2018, GHG emissions from transport were 0.8% higher than in 2017. This increase in emissions was caused by an increase in transport volumes. Other sectors (1A4) The principal developments in Other sectors (1A4) are:
• Substantial interannual fluctuations in emissions, as a result of fluctuations in temperature, as clearly shown in Figure 2.9. More natural gas is used during cold winters (e.g. 1996 and 2010) and less in warm winters (e.g. 2014).

RIVM report 2020-0031
Page 66 of 525
• In the residential category (1A4b), CO2 emissions have decreased since 1990, while the number of households has increased. This is mainly due to the improved insulation of dwellings and the increased use of high-efficiency boilers for central heating.
More information is provided in Section 3.2.7.
Figure 2.9. 1A4 (Other sectors) – trend and emissions levels of source sub-categories, 1990–2018.
2.2.2 Methane Figure 2.10 shows the contribution of the most relevant sectors to the trend in total CH4 emissions. National CH4 emissions decreased by 43.4%, from 31.8 Tg in to 17.3 Tg CO2 eq., between 1990 and 2018. The Agriculture and Waste sectors (69.8% and 16.3%, respectively) were the largest contributors in 2018. Compared with 2017, national CH4 emissions decreased by about 3.9% in 2018 (-0.7 Tg CO2 eq.). CH4 emissions mainly decreased in category 3A (Enteric fermentation) and category 5A (Solid waste disposal on land), to c. 0.4 Tg CO2 eq. and 0.1 Tg CO2 eq., respectively. The 1990–2018 trend shows a relatively strong reduction in CH4 emissions between 1990 and 2005. After 2005, emissions were further reduced, but at a slower pace.

RIVM report 2020-0031
Page 67 of 525
Figure 2.10. CH4 – trend and emissions levels of sectors, 1990–2018. Emissions from the Waste sector decreased by 79.0% between 1990 and 2018 (from 14.0 Tg CO2 eq. in 1990 to 2.8 Tg CO2 eq.), mainly due to an 81.9% reduction in CH4 from Landfills (5A1). The main reductions in 5A1 were achieved between 1990 and 2005 (-57.4%). Between 2017 and 2018, CH4 emissions from landfills decreased by 3.4%. Decreased methane emissions from landfills since 1990 are the result of:
• increased recycling of waste; • a considerable reduction in the amount of municipal solid waste
(MSW) disposal at landfills; • a decrease in the organic waste fraction in the waste disposed; • increased methane recovery from landfills (from 4% in 1990 to
13% in 2018). CH4 emissions from Agriculture (categories 3A and 3B) reduced by 17.7% overall between 1990 and 2018. After an initial decrease of 23.2% between 1990 and 2005, emissions increased again (slightly) in the following period. In 2017 and 2018, CH4 emissions from enteric fermentation and manure management decreased again. The trend in emissions is mainly explained by the change in the number of mature dairy cattle. The number of dairy cattle has decreased since the 1990s (and milk production per cow has increased). In recent years (since 2009) the number of cows has increased, due to the fact that the European Commission slightly raised the milk quota, anticipating the cancellation of the milk quota in 2015.
2.2.3 Nitrous oxide Figure 2.11 shows the contribution of the most relevant sectors to the trend in national total N2O emissions. The total national inventory of N2O emissions decreased by about 53.7%, from 18.0 Tg CO2 eq. in 1990 to 8.3 Tg CO2 eq. in 2017. The IPPU sector contributed the most to this decrease; N2O emissions decreased by 80.3% compared with the base year. This is a result of a change in the process of nitric acid production (2B2), leading to a substantive emission reduction in this source category (from 5.4 Gg CO2 eq. in 2005 to 0.3 Gg CO2 eq. in 2010).

RIVM report 2020-0031
Page 68 of 525
Figure 2.11. N2O – trend and emissions levels of sectors, 1990–2018. As Figure 2.11 shows, total N2O emissions from agricultural soils have substantially decreased (-42%) between 1990 and 2018. This decrease has been caused by a relatively large decrease in N input to soil (from inorganic fertiliser and organic N fertiliser application and production of animal manure on pasture during grazing). Total N supply to the soil decreased by 36% between 1990 and 2018. This can be explained by the Netherlands’ manure and fertiliser policy, aimed at reducing N leaching and run-off. This policy regulates the amount of manure production and its application by the introduction of measures such as restrictions on the numbers of swine and poultry per farm (so-called ‘manure production rights’) and maximum application limits for manure and inorganic N fertiliser, per the Dutch Manure and Fertilisers Act, in accordance with the Nitrates Directive. Since the leaching fraction has decreased over time, the amount of nitrogen leached or run off has been reduced by 44% since 1990. This was partly counteracted by a shift from applying manure on top of the soil (surface spreading) towards incorporating manure into the soil, initiated by the Dutch ammonia policy. Incorporating manure into the soil reduces emissions of ammonia but increases direct emissions of N2O. However, indirect N2O emissions are lower because of reduced atmospheric deposition of NH3 and NOx, resulting from EU policies on air pollution (specifically the NECD Directive (2016/2284/EU)) and the Gothenburg Protocol under the UNECE Convention on Long Range Transboundary Air Pollution (LRTAP). Compared with 2017, total N2O emissions decreased by 3.6% in 2018 (-0.3 Tg CO2 eq.), mainly due to a decrease in emissions in category 2B (Caprolactam production, -0.14 Tg CO2 eq.). However, in 2018, N2O emissions from Grazing (category 3A) increased by about 2% compared with 2017, as a result of an increased number of cattle kept on pasture. Emissions from Inorganic N fertilisers (3D) decreased by 3% in 2018 compared with 2017, due to a decrease in application. Emissions from crop residues have remained at the same level between 2017 and 2018.

RIVM report 2020-0031
Page 69 of 525
2.2.4 Fluorinated gases Figure 2.12 shows the trend in F-gas emissions included in the National GHG Emissions Inventory. Total emissions of F-gases have decreased by 77.2% from 8.4 Tg CO2 eq. in 1990 to 1.9 Tg CO2 eq. in 2018. Emissions of hydrofluorocarbons (HFCs) and perfluorocarbons (PFCs) have decreased by 70.7% and 93.9%, respectively, during the same period, while sulphur hexafluoride (SF6) emissions have decreased by 40.2%. It should be noted that, due to the fact that there is no separate registration of NF3 in the Netherlands, emissions of NF3 are included in PFC emissions.
Figure 2.12. Fluorinated gases – trend and emissions levels of individual F-gases, 1990–2018. Emissions of HFC-23 increased by approximately 35% in the period 1995–1998, due to increased production of HCFC-22. In the period 1998–2001, however, emissions of HFC-23 decreased by 69% following the installation of a thermal converter (TC) at the plant. The improved removal efficiency of the TC (kg HFC-23 processed in TC/kg HFC-23 in untreated flow/year) was the primary factor and a decrease in production levels the secondary factor influencing the variation in emissions during the 2000–2008 period. Due to the economic crisis, the production level of HCFC-22 was much lower in the last quarter of 2008 and in 2009, resulting in lower HFC-23 emissions in both 2008 and 2009. Primarily as a result of the economic recovery, the production level of HCFC-22 was much higher in 2010, resulting in higher HFC-23 emissions in 2010, compared with 2009. After 2010 the emission fluctuations were mainly caused by fluctuations in the handling activities, which depend on market circumstances. From 2003 onwards, the level of PFC emissions from Aluminium production (2C3) decreased sharply because reduction measures (side feed to point feed) were taken (see Figure 2.12). From then on, emission levels depended mainly on the number of anode effects, rather than on production level. Because of the closure of Zalco, PFC emissions decreased after 2011 to 11 Gg CO2 eq. in 2013. In 2014, PFC emissions decreased to 0.05 Gg CO2 eq. as a result of the closure of Aldel at the end
RIVM report 2020-0031
Page 70 of 525
of 2013. The restart under the name Klesch Aluminium Delfzijl at the end of 2014 resulted in increases in PFC emissions in 2015 and 2016. Between 2017 and 2018, aggregated emissions of F-gases increased by 9.4%. HFC emissions increased by 5.3% and PFC emissions increased by 111.6% between 2017 and 2018. The latter increase was mainly a result of emissions in category 2B9 (Fluorochemical production). The emissions in this category (especially in sub-category 2B9b3 Handling activities) fluctuated significantly during the period 1992–2018. This can be explained by the large fluctuations in handling activities, which depend on market circumstances. SF6 emissions decreased by 2.1% between 2017 and 2018. Please note that, though the relative changes are substantial, the absolute changes are small.
2.2.5 Uncertainty in emissions specified by greenhouse gas The uncertainty in the trend of CO2-equivalent emissions of the six GHGs together is approximately 2%, based on IPCC Approach 1 Trend Uncertainty Assessment (see Section 1.6 and Annex 2). For each individual gas, the trend uncertainty in total emissions of CO2, CH4, N2O and the sum of the F-gases is estimated to be ±2%, ±5%, ±6% and ±9%, respectively. For all GHGs together, the uncertainty estimate in annual emissions is ±3%. The uncertainty estimates in annual emissions for CO2, CH4 and N2O are ±2%, ±9% and ±38%, respectively, and for HFCs, PFCs and SF6 ±35% (see Section 1.7 and Annex 2). For all GHG emissions together, the estimated uncertainty is 3%.
2.3 Emissions trends by source category Figure 2.13 provides an overview of emissions trends for each IPCC sector in Tg CO2 equivalents. The Energy sector is, as expected, by far the largest contributor to total GHG emissions in the national inventory (contributing 71.5% in the base year and 82.5% in 2018). The emissions of the Energy sector decreased by approximately 2% in the period 1990–2018. Total GHG emissions of all other sectors (IPPU, Agriculture, LULUCF and Waste) decreased, by 51.5%, 27.3%, 24.3% and 79.0%, respectively, in 2018 compared with the base year. Trends in emissions by sector category are described in more detail in Chapters 3–8. The trends per gas were given in Section 2.2.
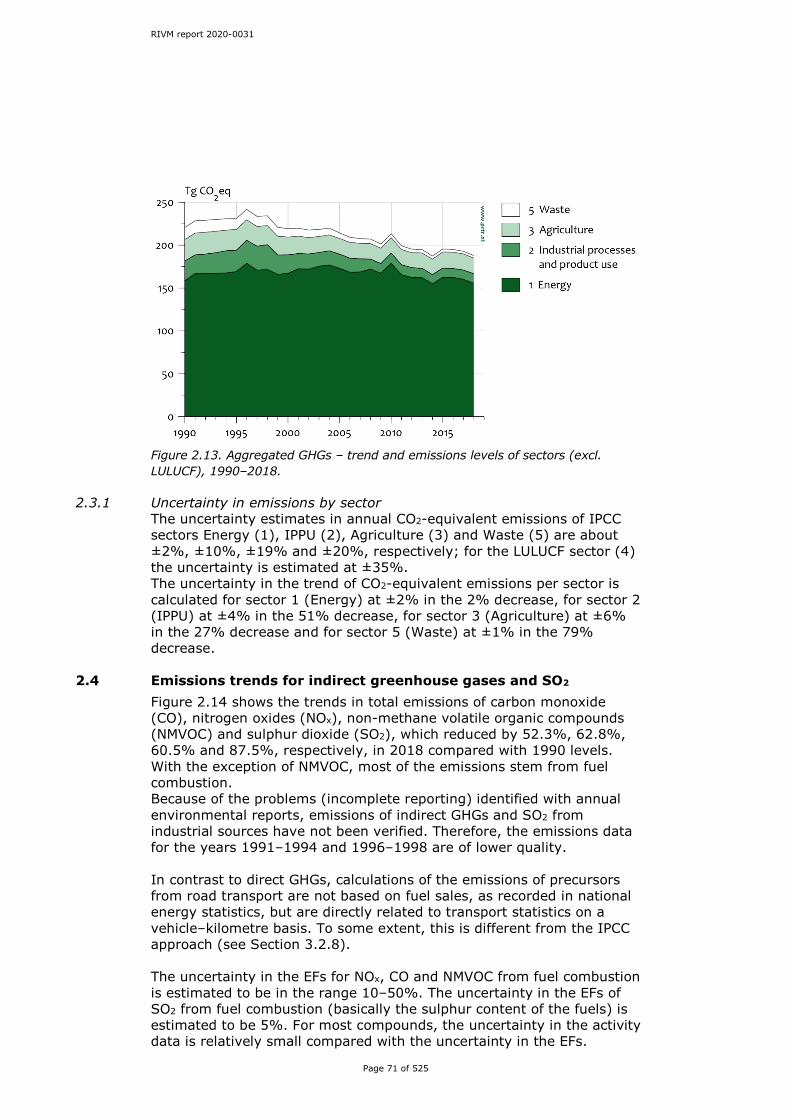
RIVM report 2020-0031
Page 71 of 525
Figure 2.13. Aggregated GHGs – trend and emissions levels of sectors (excl. LULUCF), 1990–2018.
2.3.1 Uncertainty in emissions by sector The uncertainty estimates in annual CO2-equivalent emissions of IPCC sectors Energy (1), IPPU (2), Agriculture (3) and Waste (5) are about ±2%, ±10%, ±19% and ±20%, respectively; for the LULUCF sector (4) the uncertainty is estimated at ±35%. The uncertainty in the trend of CO2-equivalent emissions per sector is calculated for sector 1 (Energy) at ±2% in the 2% decrease, for sector 2 (IPPU) at ±4% in the 51% decrease, for sector 3 (Agriculture) at ±6% in the 27% decrease and for sector 5 (Waste) at ±1% in the 79% decrease.
2.4 Emissions trends for indirect greenhouse gases and SO2
Figure 2.14 shows the trends in total emissions of carbon monoxide (CO), nitrogen oxides (NOx), non-methane volatile organic compounds (NMVOC) and sulphur dioxide (SO2), which reduced by 52.3%, 62.8%, 60.5% and 87.5%, respectively, in 2018 compared with 1990 levels. With the exception of NMVOC, most of the emissions stem from fuel combustion. Because of the problems (incomplete reporting) identified with annual environmental reports, emissions of indirect GHGs and SO2 from industrial sources have not been verified. Therefore, the emissions data for the years 1991–1994 and 1996–1998 are of lower quality. In contrast to direct GHGs, calculations of the emissions of precursors from road transport are not based on fuel sales, as recorded in national energy statistics, but are directly related to transport statistics on a vehicle–kilometre basis. To some extent, this is different from the IPCC approach (see Section 3.2.8). The uncertainty in the EFs for NOx, CO and NMVOC from fuel combustion is estimated to be in the range 10–50%. The uncertainty in the EFs of SO2 from fuel combustion (basically the sulphur content of the fuels) is estimated to be 5%. For most compounds, the uncertainty in the activity data is relatively small compared with the uncertainty in the EFs.
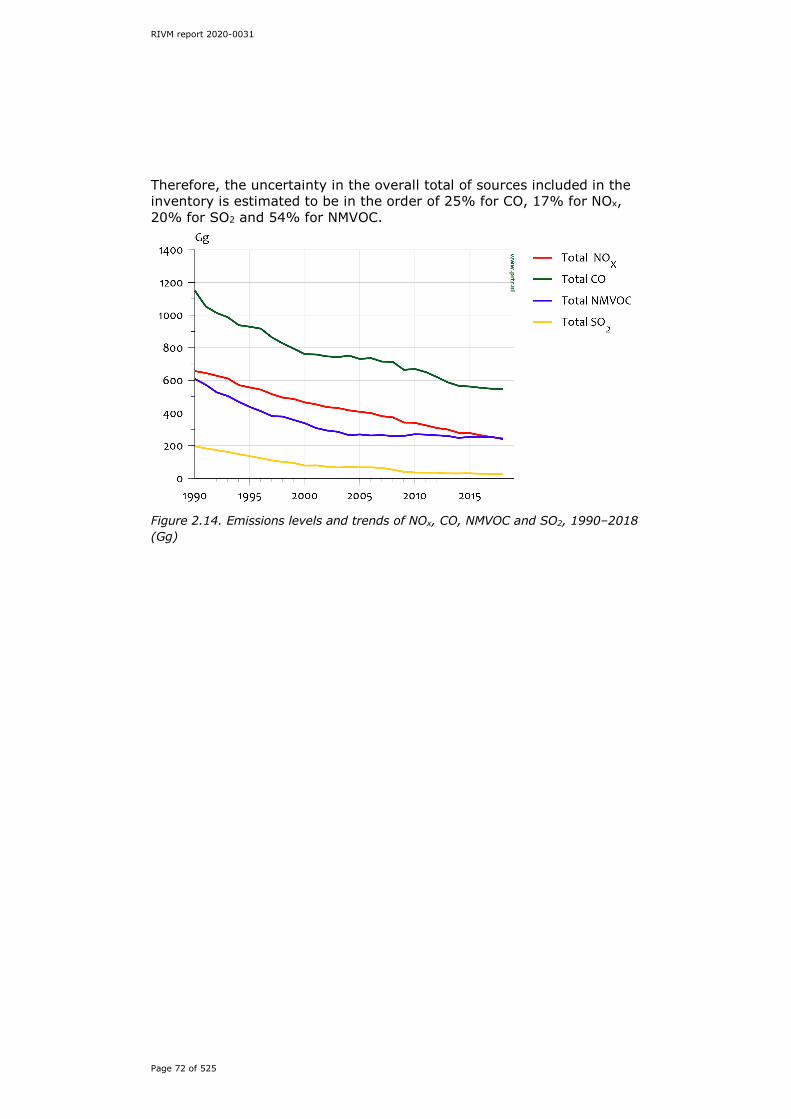
RIVM report 2020-0031
Page 72 of 525
Therefore, the uncertainty in the overall total of sources included in the inventory is estimated to be in the order of 25% for CO, 17% for NOx, 20% for SO2 and 54% for NMVOC.
Figure 2.14. Emissions levels and trends of NOx, CO, NMVOC and SO2, 1990–2018 (Gg)
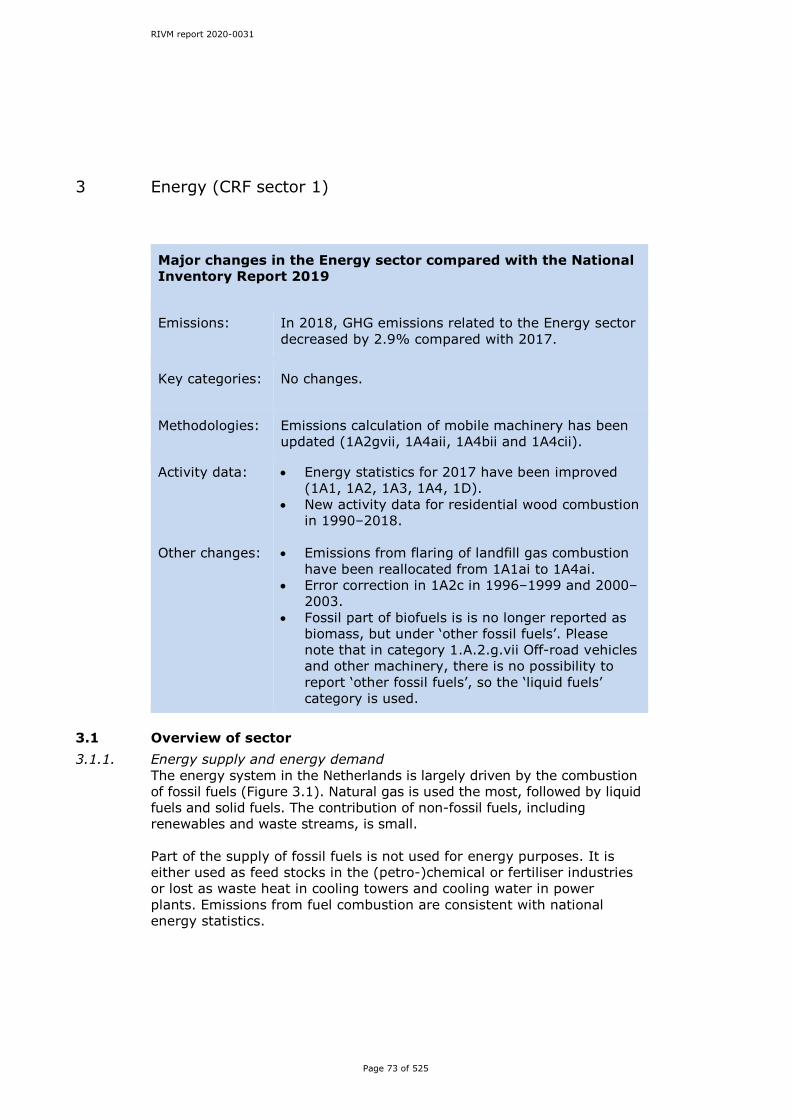
RIVM report 2020-0031
Page 73 of 525
3 Energy (CRF sector 1)
Major changes in the Energy sector compared with the National Inventory Report 2019
Emissions: In 2018, GHG emissions related to the Energy sector decreased by 2.9% compared with 2017.
Key categories:
No changes.
Methodologies: Emissions calculation of mobile machinery has been updated (1A2gvii, 1A4aii, 1A4bii and 1A4cii).
Activity data: Other changes:
• Energy statistics for 2017 have been improved (1A1, 1A2, 1A3, 1A4, 1D).
• New activity data for residential wood combustion in 1990–2018.
• Emissions from flaring of landfill gas combustion
have been reallocated from 1A1ai to 1A4ai. • Error correction in 1A2c in 1996–1999 and 2000–
2003. • Fossil part of biofuels is is no longer reported as
biomass, but under ‘other fossil fuels’. Please note that in category 1.A.2.g.vii Off-road vehicles and other machinery, there is no possibility to report ‘other fossil fuels’, so the ‘liquid fuels’ category is used.
3.1 Overview of sector 3.1.1. Energy supply and energy demand
The energy system in the Netherlands is largely driven by the combustion of fossil fuels (Figure 3.1). Natural gas is used the most, followed by liquid fuels and solid fuels. The contribution of non-fossil fuels, including renewables and waste streams, is small. Part of the supply of fossil fuels is not used for energy purposes. It is either used as feed stocks in the (petro-)chemical or fertiliser industries or lost as waste heat in cooling towers and cooling water in power plants. Emissions from fuel combustion are consistent with national energy statistics.

RIVM report 2020-0031
Page 74 of 525
Figure 3.1. Overview of energy supply and energy demand in the Netherlands, 1990–2018 (‘Electricity’ refers to imported electricity only).
3.1.2 Trends in fossil fuel use and fuel mix Natural gas represents a very large share of national energy consumption in all non-transport subsectors: Power generation, Industrial processes and Other (mainly for space heating). Oil products are primarily used in transport, refineries and the petrochemical industry, while the use of coal is limited to power generation and steel production. In the 1990–2018 period, total fossil fuel combustion increased by 3%, due to a 10% increase in liquid fuel consumption, a 6% decrease in solid fuel consumption and a 0.01% decrease in gaseous fuel consumption. Total fossil fuel consumption for combustion decreased by about 2.8% between 2017 and 2018, due to a decrease of 10.2%, 2.4% and 0.9% in solid, liquid and gaseous fuel consumption, respectively. Note that solid fuel consumption showed an increase in 2014 and 2015, caused by the new coal-fired power plants. The decrease in solid fuel consumption in 2016–2018 was due to the closure of three old coal-fired power plants in these years.
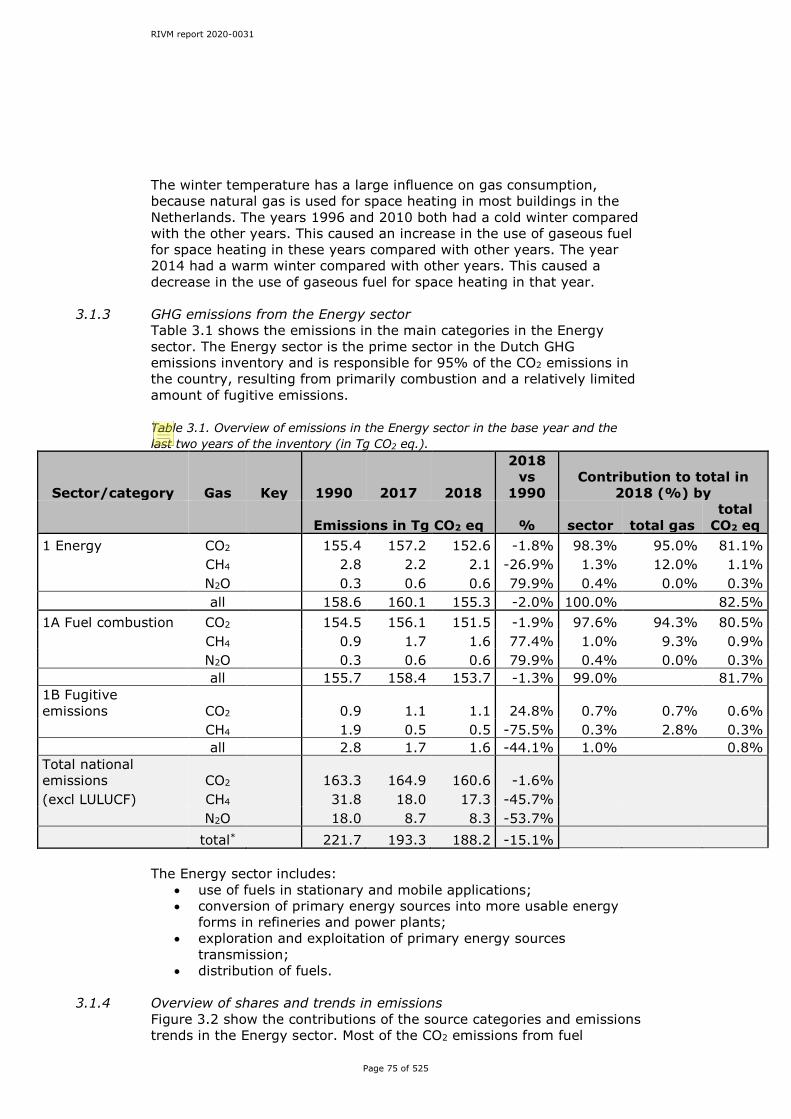
RIVM report 2020-0031
Page 75 of 525
The winter temperature has a large influence on gas consumption, because natural gas is used for space heating in most buildings in the Netherlands. The years 1996 and 2010 both had a cold winter compared with the other years. This caused an increase in the use of gaseous fuel for space heating in these years compared with other years. The year 2014 had a warm winter compared with other years. This caused a decrease in the use of gaseous fuel for space heating in that year.
3.1.3 GHG emissions from the Energy sector Table 3.1 shows the emissions in the main categories in the Energy sector. The Energy sector is the prime sector in the Dutch GHG emissions inventory and is responsible for 95% of the CO2 emissions in the country, resulting from primarily combustion and a relatively limited amount of fugitive emissions. Table 3.1. Overview of emissions in the Energy sector in the base year and the last two years of the inventory (in Tg CO2 eq.).
Sector/category Gas Key 1990 2017 2018
2018 vs
1990 Contribution to total in
2018 (%) by
Emissions in Tg CO2 eq % sector total gas total
CO2 eq 1 Energy CO2 155.4 157.2 152.6 -1.8% 98.3% 95.0% 81.1% CH4 2.8 2.2 2.1 -26.9% 1.3% 12.0% 1.1% N2O 0.3 0.6 0.6 79.9% 0.4% 0.0% 0.3% all 158.6 160.1 155.3 -2.0% 100.0% 82.5% 1A Fuel combustion CO2 154.5 156.1 151.5 -1.9% 97.6% 94.3% 80.5% CH4 0.9 1.7 1.6 77.4% 1.0% 9.3% 0.9% N2O 0.3 0.6 0.6 79.9% 0.4% 0.0% 0.3% all 155.7 158.4 153.7 -1.3% 99.0% 81.7% 1B Fugitive emissions CO2 0.9 1.1 1.1 24.8% 0.7% 0.7% 0.6% CH4 1.9 0.5 0.5 -75.5% 0.3% 2.8% 0.3% all 2.8 1.7 1.6 -44.1% 1.0% 0.8% Total national emissions CO2 163.3 164.9 160.6 -1.6% (excl LULUCF) CH4 31.8 18.0 17.3 -45.7% N2O 18.0 8.7 8.3 -53.7% total* 221.7 193.3 188.2 -15.1%
The Energy sector includes:
• use of fuels in stationary and mobile applications; • conversion of primary energy sources into more usable energy
forms in refineries and power plants; • exploration and exploitation of primary energy sources
transmission; • distribution of fuels.
3.1.4 Overview of shares and trends in emissions
Figure 3.2 show the contributions of the source categories and emissions trends in the Energy sector. Most of the CO2 emissions from fuel
Editor
All commas in table should be full points (e.g. ‘155.2’) and ‘CO2’ in header row should be ‘CO2’.

RIVM report 2020-0031
Page 76 of 525
combustion stem from the combustion of natural gas, followed by liquid fuels and solid fuels. CH4 and N2O emissions from fuel combustion contribute less than 2% to total emissions from this sector.
Figure 3.2. Sector 1 Energy – trend and emissions levels of total greenhouse gas emissions per source category, 1990–2018
3.2 Fuel combustion (1A) Table 3.2 presents the source categories under category 1A in the Energy sector. Aggregated emissions by fuel type and category are used for the categorisation of key categories in 1A1, 1A2, 1A3 and 1A4. This is in line with the IPCC Guidelines (see volume 1, Table 4.1 in IPCC, 2006). Table 3.2. Overview of emissions in the Fuel combustion sector (1A) in the base year and the last two years of the inventory (in Tg CO2 eq.).
Sector/category Gas Key 1990 2017 2018
2018 vs
1990 Contribution to total in
2018 (%) by
Emissions in Tg CO2 eq % sector total gas total
CO2 eq 1A Fuel combustion CO2 154.5 156.1 151.5 -1.9% 97.6% 94.3% 80.5% CH4 0.9 1.7 1.6 77.4% 1.0% 9.3% 0.9% N2O 0.3 0.6 0.6 79.9% 0.4% 0.0% 0.3% All 155.7 158.4 153.7 -1.3% 99.0% 103.6% 81.7% 1A1 Energy Industries CO2 53.1 63.1 59.8 12.5% 38.5% 37.2% 31.8% CH4 non key 0.1 0.1 0.1 50.8% 0.1% 0.6% 0.1% N2O non key 0.1 0.3 0.3 79.1% 0.2% 0.0% 0.1% All 53.4 63.5 60.1 12.7% 38.7% 32.0% 1A2 Manufacturing industries and construction
CO2 34.4 28.9 27.9 -19.0% 18.0% 17.4% 14.8%
CH4 non key 0.1 0.1 0.1 -3.9% 0.0% 0.4% 0.0% N2O non key 0.0 0.0 0.0 17.6% 0.0% 0.0% 0.0% All 34.5 29.0 28.0 -18.9% 18.0% 14.9%
Editor
All commas in table should be full points (e.g. ‘155.2’) and ‘CO2’ in header row should be ‘CO2’. Full points after ‘1A3’ and ‘1A4’ to be deleted.
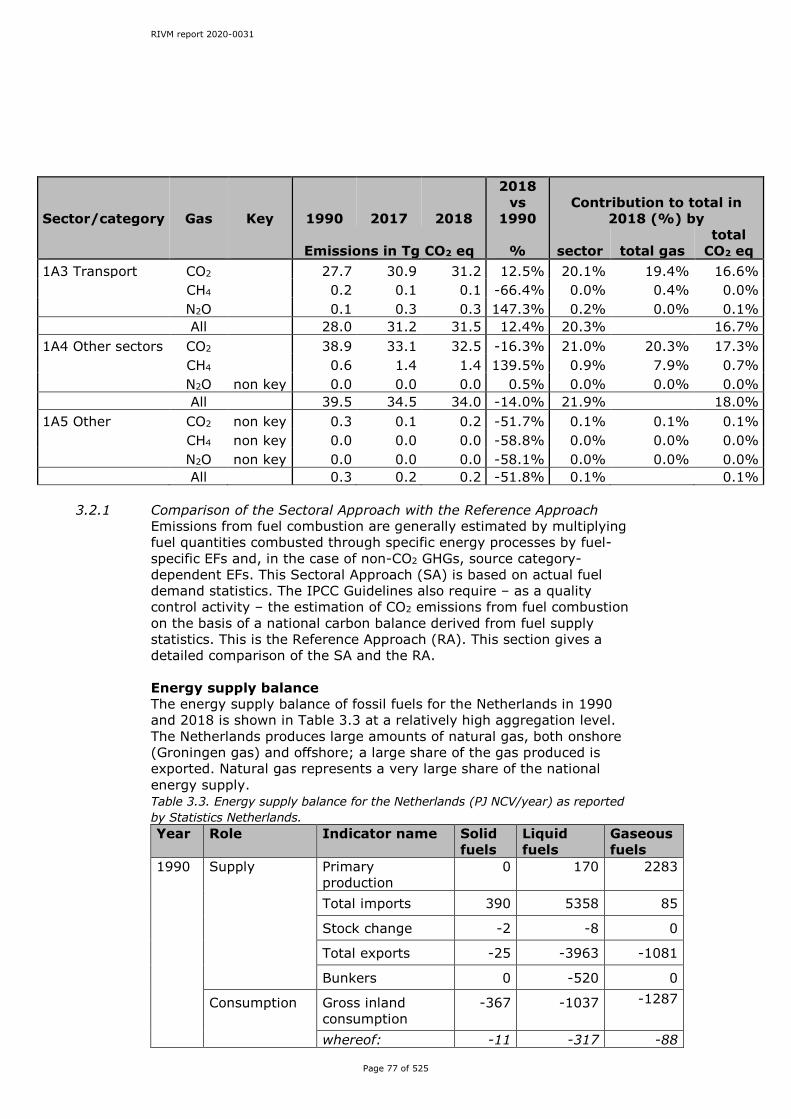
RIVM report 2020-0031
Page 77 of 525
Sector/category Gas Key 1990 2017 2018
2018 vs
1990 Contribution to total in
2018 (%) by
Emissions in Tg CO2 eq % sector total gas total
CO2 eq 1A3 Transport CO2 27.7 30.9 31.2 12.5% 20.1% 19.4% 16.6% CH4 0.2 0.1 0.1 -66.4% 0.0% 0.4% 0.0% N2O 0.1 0.3 0.3 147.3% 0.2% 0.0% 0.1% All 28.0 31.2 31.5 12.4% 20.3% 16.7% 1A4 Other sectors CO2 38.9 33.1 32.5 -16.3% 21.0% 20.3% 17.3% CH4 0.6 1.4 1.4 139.5% 0.9% 7.9% 0.7% N2O non key 0.0 0.0 0.0 0.5% 0.0% 0.0% 0.0% All 39.5 34.5 34.0 -14.0% 21.9% 18.0% 1A5 Other CO2 non key 0.3 0.1 0.2 -51.7% 0.1% 0.1% 0.1% CH4 non key 0.0 0.0 0.0 -58.8% 0.0% 0.0% 0.0% N2O non key 0.0 0.0 0.0 -58.1% 0.0% 0.0% 0.0% All 0.3 0.2 0.2 -51.8% 0.1% 0.1%
3.2.1 Comparison of the Sectoral Approach with the Reference Approach
Emissions from fuel combustion are generally estimated by multiplying fuel quantities combusted through specific energy processes by fuel-specific EFs and, in the case of non-CO2 GHGs, source category-dependent EFs. This Sectoral Approach (SA) is based on actual fuel demand statistics. The IPCC Guidelines also require – as a quality control activity – the estimation of CO2 emissions from fuel combustion on the basis of a national carbon balance derived from fuel supply statistics. This is the Reference Approach (RA). This section gives a detailed comparison of the SA and the RA. Energy supply balance The energy supply balance of fossil fuels for the Netherlands in 1990 and 2018 is shown in Table 3.3 at a relatively high aggregation level. The Netherlands produces large amounts of natural gas, both onshore (Groningen gas) and offshore; a large share of the gas produced is exported. Natural gas represents a very large share of the national energy supply. Table 3.3. Energy supply balance for the Netherlands (PJ NCV/year) as reported by Statistics Netherlands. Year Role Indicator name Solid
fuels Liquid fuels
Gaseous fuels
1990 Supply Primary production
0 170 2283
Total imports 390 5358 85
Stock change -2 -8 0
Total exports -25 -3963 -1081
Bunkers 0 -520 0
Consumption Gross inland consumption
-367 -1037 -1287
whereof: -11 -317 -88
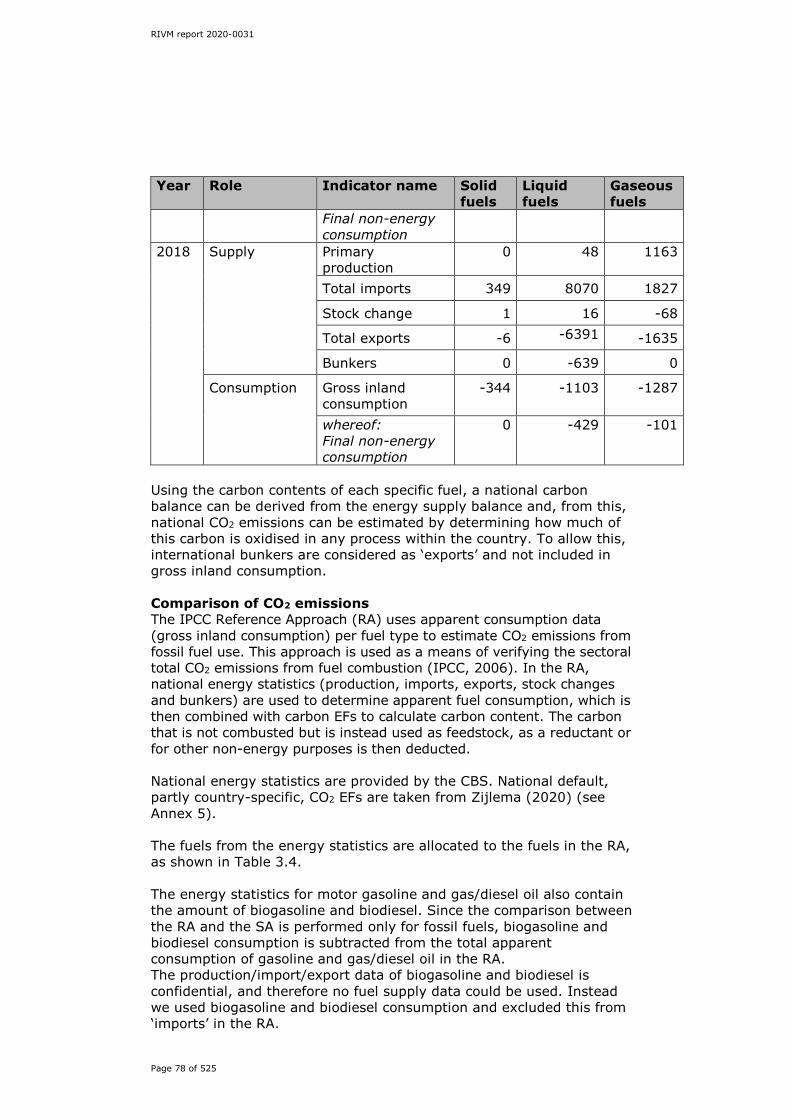
RIVM report 2020-0031
Page 78 of 525
Year Role Indicator name Solid fuels
Liquid fuels
Gaseous fuels
Final non-energy consumption
2018 Supply Primary production
0 48 1163
Total imports 349 8070 1827
Stock change 1 16 -68
Total exports -6 -6391 -1635
Bunkers 0 -639 0
Consumption Gross inland consumption
-344 -1103 -1287
whereof: Final non-energy consumption
0 -429 -101
Using the carbon contents of each specific fuel, a national carbon balance can be derived from the energy supply balance and, from this, national CO2 emissions can be estimated by determining how much of this carbon is oxidised in any process within the country. To allow this, international bunkers are considered as ‘exports’ and not included in gross inland consumption. Comparison of CO2 emissions The IPCC Reference Approach (RA) uses apparent consumption data (gross inland consumption) per fuel type to estimate CO2 emissions from fossil fuel use. This approach is used as a means of verifying the sectoral total CO2 emissions from fuel combustion (IPCC, 2006). In the RA, national energy statistics (production, imports, exports, stock changes and bunkers) are used to determine apparent fuel consumption, which is then combined with carbon EFs to calculate carbon content. The carbon that is not combusted but is instead used as feedstock, as a reductant or for other non-energy purposes is then deducted. National energy statistics are provided by the CBS. National default, partly country-specific, CO2 EFs are taken from Zijlema (2020) (see Annex 5). The fuels from the energy statistics are allocated to the fuels in the RA, as shown in Table 3.4. The energy statistics for motor gasoline and gas/diesel oil also contain the amount of biogasoline and biodiesel. Since the comparison between the RA and the SA is performed only for fossil fuels, biogasoline and biodiesel consumption is subtracted from the total apparent consumption of gasoline and gas/diesel oil in the RA. The production/import/export data of biogasoline and biodiesel is confidential, and therefore no fuel supply data could be used. Instead we used biogasoline and biodiesel consumption and excluded this from ‘imports’ in the RA.
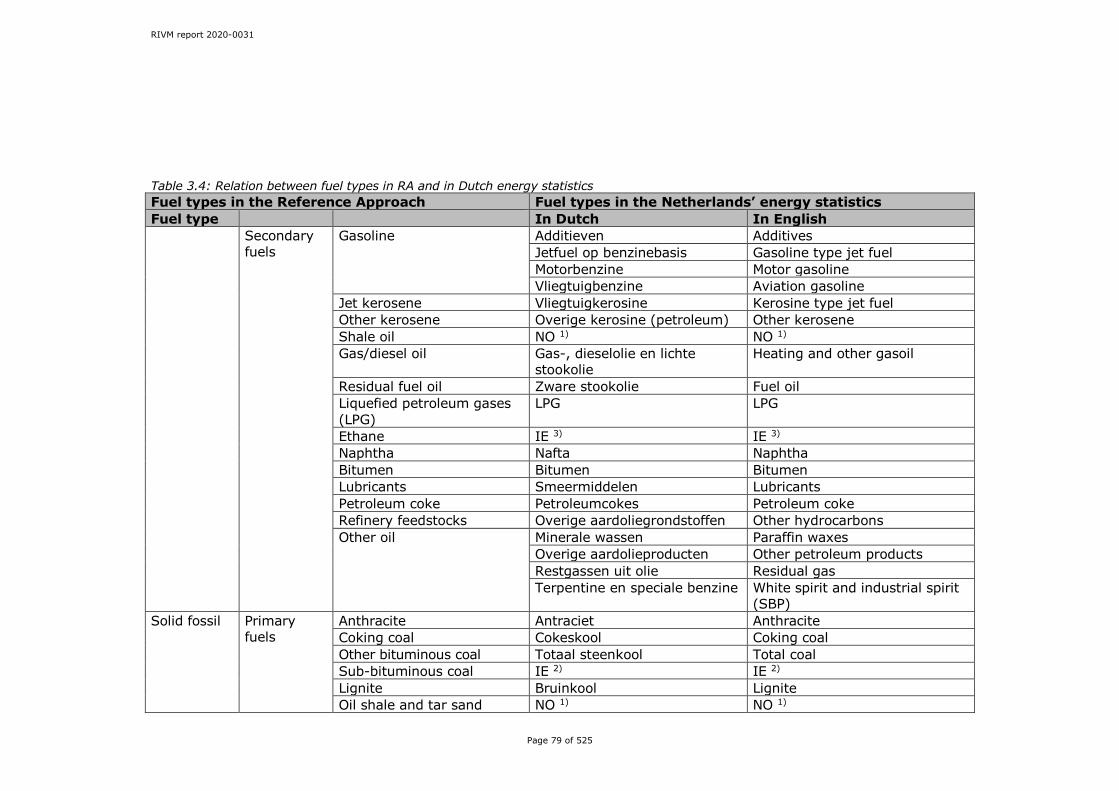
RIVM report 2020-0031
Page 79 of 525
Table 3.4: Relation between fuel types in RA and in Dutch energy statistics Fuel types in the Reference Approach Fuel types in the Netherlands’ energy statistics Fuel type In Dutch In English
Secondary fuels
Gasoline Additieven Additives Jetfuel op benzinebasis Gasoline type jet fuel Motorbenzine Motor gasoline Vliegtuigbenzine Aviation gasoline
Jet kerosene Vliegtuigkerosine Kerosine type jet fuel Other kerosene Overige kerosine (petroleum) Other kerosene Shale oil NO 1) NO 1) Gas/diesel oil Gas-, dieselolie en lichte
stookolie Heating and other gasoil
Residual fuel oil Zware stookolie Fuel oil Liquefied petroleum gases (LPG)
LPG LPG
Ethane IE 3) IE 3) Naphtha Nafta Naphtha Bitumen Bitumen Bitumen Lubricants Smeermiddelen Lubricants Petroleum coke Petroleumcokes Petroleum coke Refinery feedstocks Overige aardoliegrondstoffen Other hydrocarbons Other oil Minerale wassen Paraffin waxes
Overige aardolieproducten Other petroleum products Restgassen uit olie Residual gas Terpentine en speciale benzine White spirit and industrial spirit
(SBP) Solid fossil Primary
fuels Anthracite Antraciet Anthracite Coking coal Cokeskool Coking coal Other bituminous coal Totaal steenkool Total coal Sub-bituminous coal IE 2) IE 2) Lignite Bruinkool Lignite Oil shale and tar sand NO 1) NO 1)
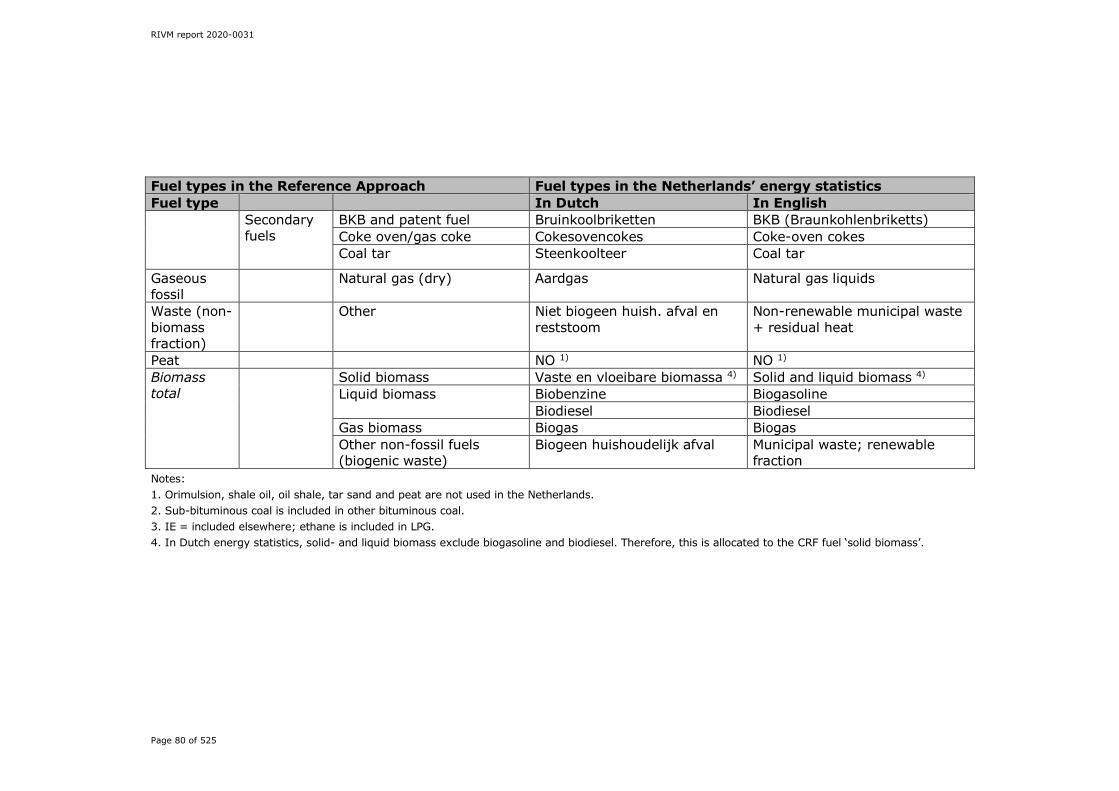
RIVM report 2020-0031
Page 80 of 525
Fuel types in the Reference Approach Fuel types in the Netherlands’ energy statistics Fuel type In Dutch In English
Secondary fuels
BKB and patent fuel Bruinkoolbriketten BKB (Braunkohlenbriketts) Coke oven/gas coke Cokesovencokes Coke-oven cokes Coal tar Steenkoolteer Coal tar
Gaseous fossil
Natural gas (dry) Aardgas Natural gas liquids
Waste (non-biomass fraction)
Other Niet biogeen huish. afval en reststoom
Non-renewable municipal waste + residual heat
Peat NO 1) NO 1) Biomass total
Solid biomass Vaste en vloeibare biomassa 4) Solid and liquid biomass 4)
Liquid biomass Biobenzine Biogasoline Biodiesel Biodiesel
Gas biomass Biogas Biogas Other non-fossil fuels (biogenic waste)
Biogeen huishoudelijk afval Municipal waste; renewable fraction
Notes: 1. Orimulsion, shale oil, oil shale, tar sand and peat are not used in the Netherlands. 2. Sub-bituminous coal is included in other bituminous coal. 3. IE = included elsewhere; ethane is included in LPG. 4. In Dutch energy statistics, solid- and liquid biomass exclude biogasoline and biodiesel. Therefore, this is allocated to the CRF fuel ‘solid biomass’.
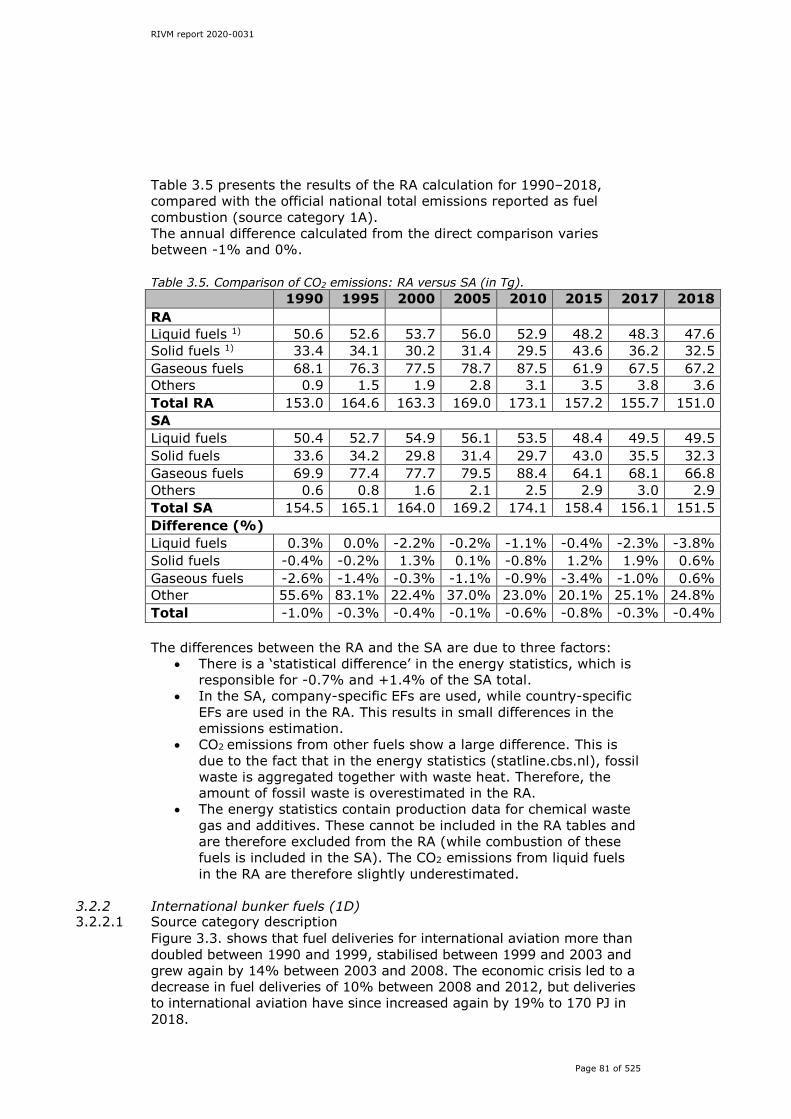
RIVM report 2020-0031
Page 81 of 525
Table 3.5 presents the results of the RA calculation for 1990–2018, compared with the official national total emissions reported as fuel combustion (source category 1A). The annual difference calculated from the direct comparison varies between -1% and 0%. Table 3.5. Comparison of CO2 emissions: RA versus SA (in Tg).
1990 1995 2000 2005 2010 2015 2017 2018 RA Liquid fuels 1) 50.6 52.6 53.7 56.0 52.9 48.2 48.3 47.6 Solid fuels 1) 33.4 34.1 30.2 31.4 29.5 43.6 36.2 32.5 Gaseous fuels 68.1 76.3 77.5 78.7 87.5 61.9 67.5 67.2 Others 0.9 1.5 1.9 2.8 3.1 3.5 3.8 3.6 Total RA 153.0 164.6 163.3 169.0 173.1 157.2 155.7 151.0 SA Liquid fuels 50.4 52.7 54.9 56.1 53.5 48.4 49.5 49.5 Solid fuels 33.6 34.2 29.8 31.4 29.7 43.0 35.5 32.3 Gaseous fuels 69.9 77.4 77.7 79.5 88.4 64.1 68.1 66.8 Others 0.6 0.8 1.6 2.1 2.5 2.9 3.0 2.9 Total SA 154.5 165.1 164.0 169.2 174.1 158.4 156.1 151.5 Difference (%) Liquid fuels 0.3% 0.0% -2.2% -0.2% -1.1% -0.4% -2.3% -3.8% Solid fuels -0.4% -0.2% 1.3% 0.1% -0.8% 1.2% 1.9% 0.6% Gaseous fuels -2.6% -1.4% -0.3% -1.1% -0.9% -3.4% -1.0% 0.6% Other 55.6% 83.1% 22.4% 37.0% 23.0% 20.1% 25.1% 24.8% Total -1.0% -0.3% -0.4% -0.1% -0.6% -0.8% -0.3% -0.4% The differences between the RA and the SA are due to three factors:
• There is a ‘statistical difference’ in the energy statistics, which is responsible for -0.7% and +1.4% of the SA total.
• In the SA, company-specific EFs are used, while country-specific EFs are used in the RA. This results in small differences in the emissions estimation.
• CO2 emissions from other fuels show a large difference. This is due to the fact that in the energy statistics (statline.cbs.nl), fossil waste is aggregated together with waste heat. Therefore, the amount of fossil waste is overestimated in the RA.
• The energy statistics contain production data for chemical waste gas and additives. These cannot be included in the RA tables and are therefore excluded from the RA (while combustion of these fuels is included in the SA). The CO2 emissions from liquid fuels in the RA are therefore slightly underestimated.
3.2.2 International bunker fuels (1D) 3.2.2.1 Source category description
Figure 3.3. shows that fuel deliveries for international aviation more than doubled between 1990 and 1999, stabilised between 1999 and 2003 and grew again by 14% between 2003 and 2008. The economic crisis led to a decrease in fuel deliveries of 10% between 2008 and 2012, but deliveries to international aviation have since increased again by 19% to 170 PJ in 2018.
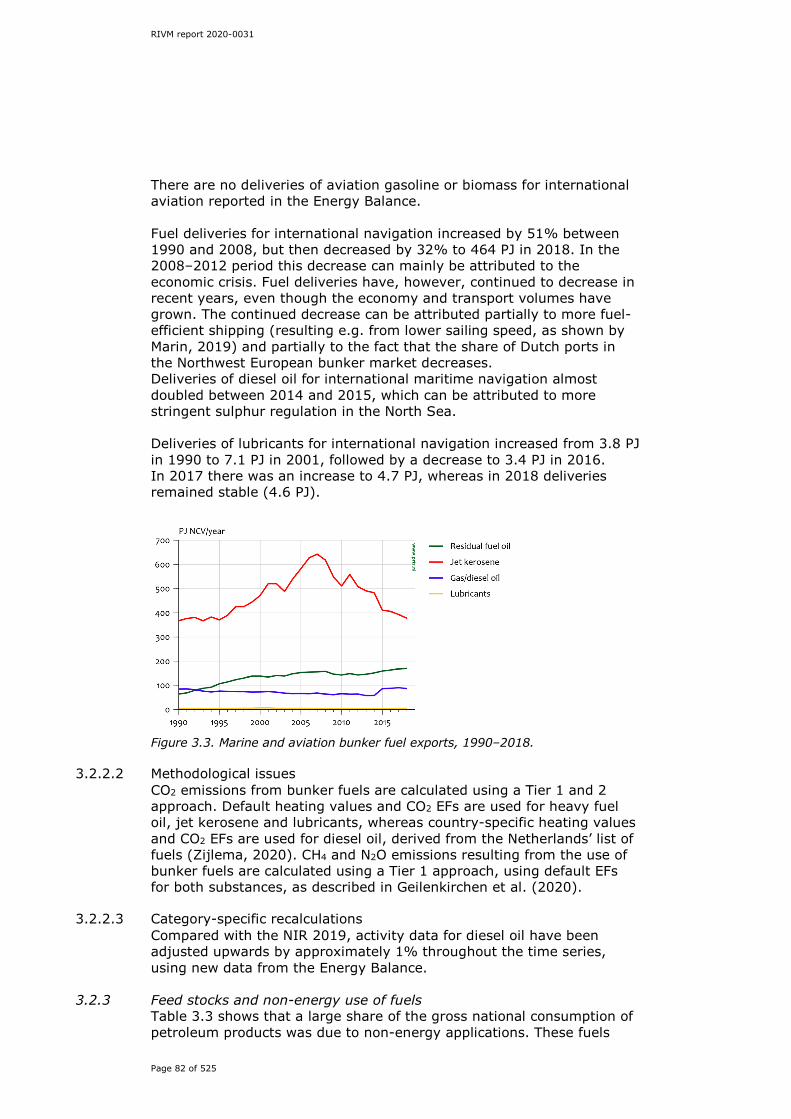
RIVM report 2020-0031
Page 82 of 525
There are no deliveries of aviation gasoline or biomass for international aviation reported in the Energy Balance. Fuel deliveries for international navigation increased by 51% between 1990 and 2008, but then decreased by 32% to 464 PJ in 2018. In the 2008–2012 period this decrease can mainly be attributed to the economic crisis. Fuel deliveries have, however, continued to decrease in recent years, even though the economy and transport volumes have grown. The continued decrease can be attributed partially to more fuel-efficient shipping (resulting e.g. from lower sailing speed, as shown by Marin, 2019) and partially to the fact that the share of Dutch ports in the Northwest European bunker market decreases. Deliveries of diesel oil for international maritime navigation almost doubled between 2014 and 2015, which can be attributed to more stringent sulphur regulation in the North Sea. Deliveries of lubricants for international navigation increased from 3.8 PJ in 1990 to 7.1 PJ in 2001, followed by a decrease to 3.4 PJ in 2016. In 2017 there was an increase to 4.7 PJ, whereas in 2018 deliveries remained stable (4.6 PJ).
Figure 3.3. Marine and aviation bunker fuel exports, 1990–2018.
3.2.2.2 Methodological issues CO2 emissions from bunker fuels are calculated using a Tier 1 and 2 approach. Default heating values and CO2 EFs are used for heavy fuel oil, jet kerosene and lubricants, whereas country-specific heating values and CO2 EFs are used for diesel oil, derived from the Netherlands’ list of fuels (Zijlema, 2020). CH4 and N2O emissions resulting from the use of bunker fuels are calculated using a Tier 1 approach, using default EFs for both substances, as described in Geilenkirchen et al. (2020).
3.2.2.3 Category-specific recalculations Compared with the NIR 2019, activity data for diesel oil have been adjusted upwards by approximately 1% throughout the time series, using new data from the Energy Balance.
3.2.3 Feed stocks and non-energy use of fuels Table 3.3 shows that a large share of the gross national consumption of petroleum products was due to non-energy applications. These fuels
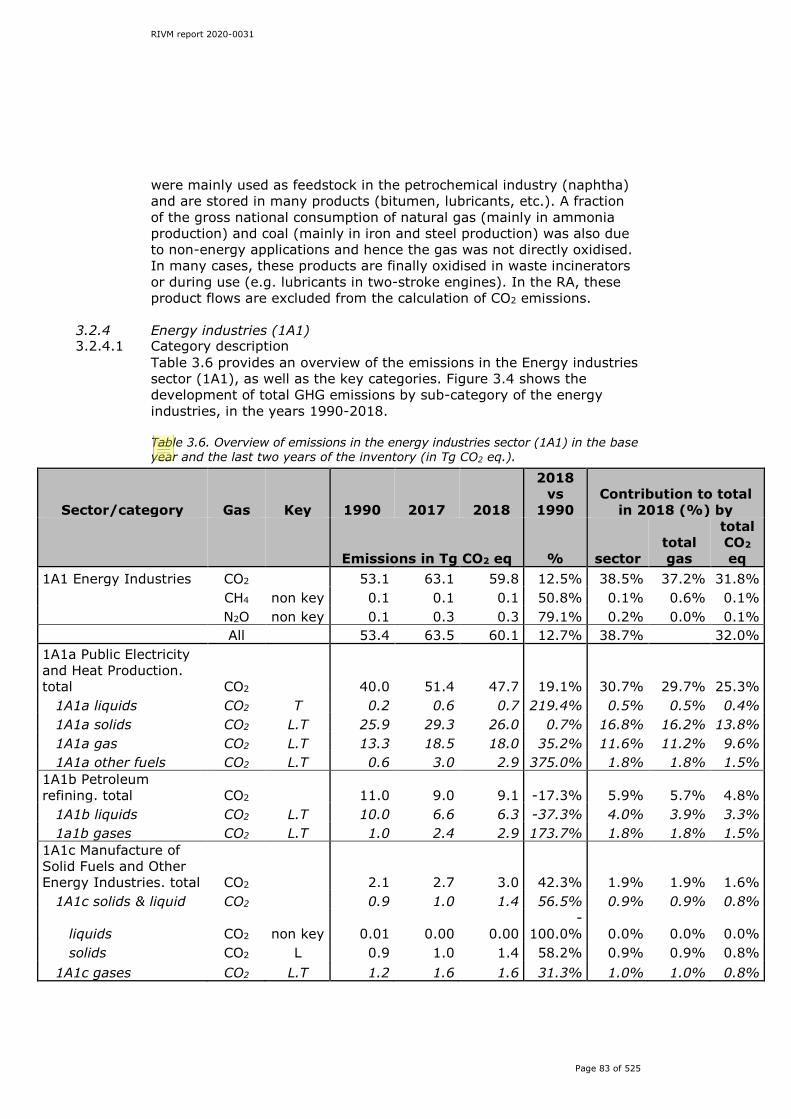
RIVM report 2020-0031
Page 83 of 525
were mainly used as feedstock in the petrochemical industry (naphtha) and are stored in many products (bitumen, lubricants, etc.). A fraction of the gross national consumption of natural gas (mainly in ammonia production) and coal (mainly in iron and steel production) was also due to non-energy applications and hence the gas was not directly oxidised. In many cases, these products are finally oxidised in waste incinerators or during use (e.g. lubricants in two-stroke engines). In the RA, these product flows are excluded from the calculation of CO2 emissions.
3.2.4 Energy industries (1A1) 3.2.4.1 Category description
Table 3.6 provides an overview of the emissions in the Energy industries sector (1A1), as well as the key categories. Figure 3.4 shows the development of total GHG emissions by sub-category of the energy industries, in the years 1990-2018. Table 3.6. Overview of emissions in the energy industries sector (1A1) in the base year and the last two years of the inventory (in Tg CO2 eq.).
Sector/category Gas Key 1990 2017 2018
2018 vs
1990 Contribution to total
in 2018 (%) by
Emissions in Tg CO2 eq % sector total gas
total CO2 eq
1A1 Energy Industries CO2 53.1 63.1 59.8 12.5% 38.5% 37.2% 31.8% CH4 non key 0.1 0.1 0.1 50.8% 0.1% 0.6% 0.1% N2O non key 0.1 0.3 0.3 79.1% 0.2% 0.0% 0.1% All 53.4 63.5 60.1 12.7% 38.7% 32.0% 1A1a Public Electricity and Heat Production. total CO2 40.0 51.4 47.7 19.1% 30.7% 29.7% 25.3%
1A1a liquids CO2 T 0.2 0.6 0.7 219.4% 0.5% 0.5% 0.4% 1A1a solids CO2 L.T 25.9 29.3 26.0 0.7% 16.8% 16.2% 13.8% 1A1a gas CO2 L.T 13.3 18.5 18.0 35.2% 11.6% 11.2% 9.6% 1A1a other fuels CO2 L.T 0.6 3.0 2.9 375.0% 1.8% 1.8% 1.5%
1A1b Petroleum refining. total CO2 11.0 9.0 9.1 -17.3% 5.9% 5.7% 4.8%
1A1b liquids CO2 L.T 10.0 6.6 6.3 -37.3% 4.0% 3.9% 3.3% 1a1b gases CO2 L.T 1.0 2.4 2.9 173.7% 1.8% 1.8% 1.5%
1A1c Manufacture of Solid Fuels and Other Energy Industries. total CO2 2.1 2.7 3.0 42.3% 1.9% 1.9% 1.6%
1A1c solids & liquid CO2 0.9 1.0 1.4 56.5% 0.9% 0.9% 0.8%
liquids CO2 non key 0.01 0.00 0.00 -
100.0% 0.0% 0.0% 0.0% solids CO2 L 0.9 1.0 1.4 58.2% 0.9% 0.9% 0.8%
1A1c gases CO2 L.T 1.2 1.6 1.6 31.3% 1.0% 1.0% 0.8%
Editor
Corrections required to table, as previously.
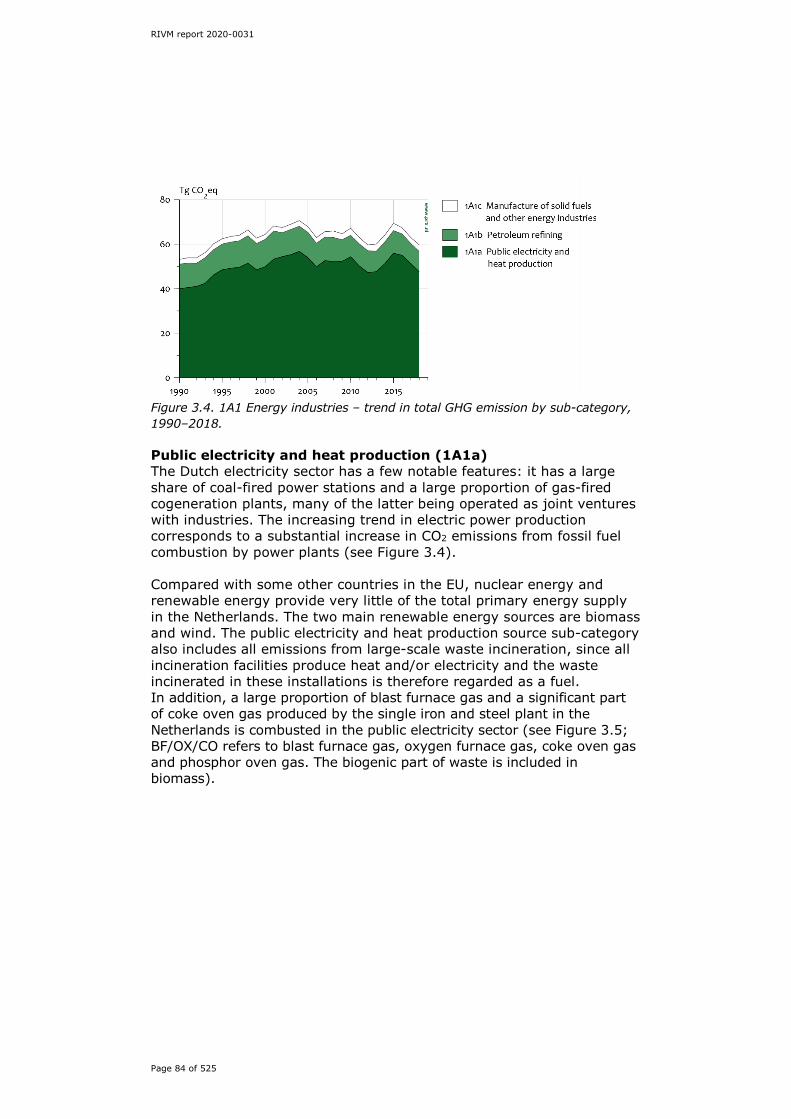
RIVM report 2020-0031
Page 84 of 525
Figure 3.4. 1A1 Energy industries – trend in total GHG emission by sub-category, 1990–2018. Public electricity and heat production (1A1a) The Dutch electricity sector has a few notable features: it has a large share of coal-fired power stations and a large proportion of gas-fired cogeneration plants, many of the latter being operated as joint ventures with industries. The increasing trend in electric power production corresponds to a substantial increase in CO2 emissions from fossil fuel combustion by power plants (see Figure 3.4). Compared with some other countries in the EU, nuclear energy and renewable energy provide very little of the total primary energy supply in the Netherlands. The two main renewable energy sources are biomass and wind. The public electricity and heat production source sub-category also includes all emissions from large-scale waste incineration, since all incineration facilities produce heat and/or electricity and the waste incinerated in these installations is therefore regarded as a fuel. In addition, a large proportion of blast furnace gas and a significant part of coke oven gas produced by the single iron and steel plant in the Netherlands is combusted in the public electricity sector (see Figure 3.5; BF/OX/CO refers to blast furnace gas, oxygen furnace gas, coke oven gas and phosphor oven gas. The biogenic part of waste is included in biomass).

RIVM report 2020-0031
Page 85 of 525
Figure 3.5. Trend in CO2 emissions from fossil and biogenic fuel use in power plants, 1990–2018. Waste oils (waste oil, waste lubricant, waste solvent, etc.) are collected by certified waste management companies. Until 2002 waste oils were used in the preparation of bunker fuels. Since this date their use in bunker fuel has been prohibited for environmental reasons, and waste oils are either exported to Germany or recycled. The recycling part (feedstock for chemical plants, clean-up and or distillation) results in only small fractions of non-useable wastes. In the past these were incinerated in a special combustion facility in the Netherlands (at that time reported under 1.A.1.a, as the plant recovered waste heat). Since the closure of this plant (which reported its emissions and activity data directly to the inventory) the residues have been exported for ecological processing, and the resulting foreign emissions are not included in the Dutch inventory. Emissions from waste incineration are included in 1A1a because all waste incinerators recover heat and produce electricity. Most of the combustion of biogas recovered at landfill sites occurs in combined heat and power (CHP) plants operated by utilities; therefore, it is also allocated to this category. CO2 emissions from the waste incineration of fossil carbon increased from 1990 onwards. From 1990, an increasing amount of waste was combusted instead of being deposited in landfills, which was the result of environmental policy aimed at reducing waste disposal in landfills as well as the import of waste (see Chapter 7). The increase in the CO2 EF for other fuels between 2004 and 2010 is due to the increase in the share of plastics (which have a high carbon content) in combustible waste. The decrease in the IEF for CO2 from biomass is due to the increase in the share of pure biomass (co-combusted with coal-firing), as opposed to the organic carbon in waste combustion with energy recovery, which traditionally contributes the most to biomass combustion. For the former type, a lower EF is applied than for the latter. Between 1990 and 1998, a change in the ownership structures of plants (joint ventures) caused a shift of cogeneration plants from category 1A2
RIVM report 2020-0031
Page 86 of 525
(Manufacturing industries) to 1A1a (Public electricity and heat production). Half of the almost 30% increase in natural gas combustion that occurred between 1990 and 1998 is largely explained by this shift and by the similar shift of a few large chemical waste gas-fired steam boilers. The corresponding CO2 emissions allocated to the Energy sector increased from virtually zero in 1990 to 8.5 Tg in 1998 and 9.1 Tg in 2005. The strong increase in liquid fuel use in 1994 and 1995 was due to the use of chemical waste gas in joint venture electricity and heat production facilities. This also explains the somewhat lower IEF for CO2 from liquids since 1995. Over the years there has been a fluctuation in CO2 emissions in 1A1a due to market circumstances. Other influencing factors have been:
• an increase in natural gas combustion due to a change in ownership structures of plants (which resulted in a shift of natural gas combustion from 1A2 to 1A1a) in 1990–1998;
• new, large coal-fired power plants commencing operations in 2015, resulting in a shift from natural gas to coal;
• closure of old coal-fired power plants in 2015–2017, resulting in a decrease in coal consumption;
• In some years the import of electricity was higher (e.g. 1999–2008, 2012–2014) than in other years.
Petroleum refining (1A1b) There are five large refineries in the Netherlands, which export approximately 50% of their products to the European market. Consequently, the Dutch petrochemical industry is relatively large. 1A1b is the second largest emission source sub-category in category 1A1. The combustion emissions from this sub-category should be viewed in relation to the fugitive emissions reported under category 1B2. Between 1990 and 2018, total CO2 emissions from the refineries (including fugitive CO2 emissions from hydrogen production reported in 1B2a-iv Refining) fluctuated between 10 and 13 Tg CO2. Since 1998, one refinery has operated a Shell Gasification and Hydrogen Production (SGHP) unit, supplying all the hydrogen for a large-scale hydrocracker. The chemical processes involved in the production of hydrogen also generate CO2 (CO2 removal and a two-stage CO shift reaction). Refinery data specifying these fugitive CO2 emissions are available and have been used since 2002, being reported in the category 1B2. Combustion emissions reported in this category are calculated once the fuel used to provide the carbon for this non-combustion process is subtracted from the total fuel used in this category. The use of plant-specific EFs for refinery gas from 2002 onwards also caused a change in the IEF for CO2 emissions from total liquid fuel, compared with the years prior to 2002. The EF for refinery gas is adjusted to obtain exact correspondence between the total CO2
emissions calculated and the total CO2 emissions officially reported by the refineries.

RIVM report 2020-0031
Page 87 of 525
The interannual variation in the IEFs for CO2, CH4 and N2O emissions from liquid fuels is explained by the high and variable proportion (between 40% and 90%) of refinery gas in total liquid fuel, which has a low default EF compared with most other oil products and has variable EFs for the years 2002 onward. Manufacture of solid fuels and other energy industries (1A1c) Source sub-category 1A1c comprises:
• Fuel combustion (of solid fuels) for on-site coke production by the iron and steel plant Tata Steel and fuel combustion from an independent coke production facility (Sluiskil, which ceased operations in 1999).
• Combustion of ‘own’ fuel (natural gas) by the oil and gas production industry for heating purposes (the difference between the amounts of fuel produced and sold, minus the amounts of associated gas that are flared, vented or lost by leakage).
CO2 emissions from this source sub-category increased from 2008 onwards, mainly due to the operation of less productive sites for oil and gas production, compared with those operated in the past. This fact explains the steady increase over time shown by this category with respect to gas consumption. Between 2014 and 2018, the production of natural gas was reduced by more than 50%, which also resulted in a decrease in the amount of natural gas combusted in this sector. The interannual variability in the EFs for CO2 and CH4 emissions from gas combustion (non-standard natural gas) is mainly due to differences in gas composition and the variable losses in the compressor stations of the gas transmission network, which are reported in the Annual Environmental Reports (AERs) of the gas transport company. Liquid fuels are generally not used in this sector. A small amount of liquid fuels was used in this sector only in 1990. From 1991 on no liquid fuel use was registered in the energy statistics for this sub-sector. Fuel combustion emissions for coke production by the iron and steel plant are based on a mass balance. See Section 3.2.5.1 for more information on emissions from the iron and steel sector (including emissions from coke production).
3.2.4.2 Methodological issues Details of methodologies, data sources and country-specific source allocation issues are provided in paragraph 2.1 of the ENINA methodology report (Honig et al., 2020). This paragraph provides a brief description of the methodology. The emissions from this source category are calculated in two steps: First, emissions are calculated by multiplying fuel consumption by country-specific EFs. Second, reported emissions of a select number of companies are used to refine the emission calculation. This section provides a description of these two steps, and it provides a comparison of the country-specific EFs and the IEFs (including an explanation of the differences).

RIVM report 2020-0031
Page 88 of 525
Emission calculation step 1 The first step of the emission calculation consists of a multiplication of fuel consumption by country-specific EFs. Activity data are derived from the aggregated statistical data from national energy statistics published annually by the CBS (see www.cbs.nl). The aggregated statistical data are based on confidential data from individual companies. When necessary, emissions data from individual companies are also used; for example, when companies report a different EF for derived gases (see the following section, Emission calculation step 2). Emission factors are either IPCC default or country-specific EFs (Tier 1 and Tier 2 method for CO2, Tier 2 method for CH4 and Tier 1 method for N2O). For CO2, IPCC default EFs are used (see Annex 5), with the exception of CO2 from natural gas, coal, cokes, waste, waste gases, gas/diesel oil, gasoline, LPG, liquid biomass and gaseous biomass, for which country-specific EFs are used. The CH4 EFs are taken from Scheffer (1997), except for the use of natural gas in gas engines (see paragraph 2.1 of the ENINA methodology report (Honig et al., 2020) for more details on the CH4 EF of gas engines). For N2O, IPCC default EFs are used. For waste incineration the activity data and EFs are explained in section 7.4. Emission calculation step 2 In the second step, the reported emissions of selected companies are used to refine the emission calculation. Emissions data from individual companies are used when companies report a different CO2 EF for derived gases or other bituminous coal. For this, emissions data from the AERs and the reporting under the ETS from selected companies are used. The data are validated by the competent authority. If the data are not accepted by the competent authority, the CO2 emissions data are not used for the emissions inventory; country-specific EFs are used instead. This occurs only rarely, and the emissions are recalculated when the validated data from these companies become available. For each relevant company, data from the AERs and the ETS are compared (QC check) and the data that provide greater detail for the relevant fuels and installations are used. The reported CO2 emissions of a company are combined with energy use, as recorded in energy statistics for that specific company, to derive a company-specific EF. For each selected company, a different company-specific EF is derived and is used to calculate the emissions. The following company-specific EFs have been calculated:
• Natural gas: Since 2003, company-specific EFs have been derived for the combustion of ‘raw’ natural gas. For the years prior to 2003, EFs from the Netherlands’ list of fuels (Zijlema, 2020) are used.
• Refinery gas: Since 2002, company-specific EFs have been derived for all companies and are used in the emissions inventory. For the years prior to 2002, EFs from the Netherlands’ list of fuels (Zijlema, 2020) are used.

RIVM report 2020-0031
Page 89 of 525
• Chemical waste gas: Since 1995, company-specific EFs have been derived for a selection of companies (largest companies). For the remaining companies, the default EF is used. If any of the selected companies was missing, then a company-specific EF for the missing company was used (derived in 1995). For the period 1990–1994, a country-specific EF based on an average EF for four (large) companies has been used.
• Blast furnace gas: Since 2007, company-specific EFs have been derived for most companies. Since blast furnace gas is produced only at the single iron and steel company in the Netherlands, it is assumed that all blast furnace gas has the same content and the derived EF is used for all companies using blast furnace gas. For years prior to 2007, EFs from the Netherlands’ list of fuels (Zijlema, 2020) are used.
• Coke oven gas: Since 2007, company-specific EFs have been derived for most companies. Since coke oven gas is produced only at the single iron and steel company in the Netherlands, it is assumed that all coke oven gas has the same content and the derived EF is used for all companies that use coke oven gas. For years prior to 2007, EFs from the Netherlands’ list of fuels (Zijlema, 2020) are used.
• Phosphor gas: Since 2006, company-specific EFs have been derived for the single company and are used in the emissions inventory. For years prior to 2006, EFs from the Netherlands’ list of fuels (Zijlema, 2020) are used.
• Coal: Since 2006, company-specific EFs have been derived for most companies and for the remaining companies the default EFs are used. For years prior to 2006, EFs from the Netherlands list of fuels (Zijlema, 2020) are used.
• Coke oven/gas coke: Since 2006, a company-specific EF has been derived for one company. For the other companies, a country-specific EF is used. For the years prior to 2006, a country-specific EF is used for all companies.
Comparison of emission factors For the year 2018, approximately 98% of the fossil CO2 emissions were calculated using either country-specific or company-specific EFs. The remaining 2% of CO2 emissions (from petroleum and bitumen) were calculated using default IPCC EFs. An overview of the EFs used for the most important fuels (up to 95% of the fuel use) in the category Energy industries (1A1) is provided in Table 3.7. Since some emissions data in this sector originate from individual companies, some of the values (in Table 3.7) are IEFs. For reasons of confidentiality, detailed data on fuel consumption and EFs per CRF category and fuel are not presented in the NIR, but these are available to reviewers upon request.

RIVM report 2020-0031
Page 90 of 525
Table 3.7. Overview of EFs used for the year 2018 in the category Energy industries (1A1).
Fuel
Amount of fuel used in 2018
(TJ NCV)
IEFs (g/GJ) CO2
(x1000) N2O CH4 Natural gas 389,762 57.5 0.18 8.20 Other bituminous coal
300,031 93.2 1.11 0.44
Waste gas 93,600 62.3 0.10 3.60 Waste, biomass 39,094 126.2 6.23 0.00 Waste, fossil 35,556 80.3 4.82 0.00 Natural gas The CO2, CH4 and N2O EFs for natural gas deviate from the standard EFs (56.6 kg CO2/GJ, 5.7 g CH4/GJ and 0.1 g N2O/GJ), because this category includes emissions from the combustion of crude ‘wet’ natural gas. Coal CO2 emissions from coal are based on emissions data from the ETS, and the IEF is different from the country-specific EF. Waste gas (refinery gas) CO2 emissions from refinery gas are counted as emissions occurring in refineries and in the Energy sector. The emissions are partly based on emissions data from the ETS. Waste The EF for N2O emissions from waste combustion (both the fossil and biomass fraction) is either with selective non-catalytic reduction (SNCR) or with selective catalytic reduction (SCR) (100 g/ton and 20 g/ton, respectively). This depends on how the incinerator is operated. The EF for CH4 from waste incineration is 0 g/GJ as a result of a study on emissions from waste incineration (section 2.3.2.1.2 of Honig et al., 2020; DHV, 2010; and NL Agency, 2010). That this is possible is stated in the 2006 IPCC Guidelines V5, section 5.2.2.3 and section 5.4.2. The emissions are reported in the CRF file with the code NO (as the CRF cannot handle zero values). The EF of CO2 is dependent on the carbon content of the waste, which is determined annually (Section 7.4 and Honig et al., 2020). The methodology for the calculation of Non-road mobile machinery (NRMM) emissions is described in Section 3.2.7.2. Trends in the IEF Trends in the IEF for most sectors can be explained by the composition of fuels used in that sector. The largest fluctuations can be explained as follows:
• 1A1a solid CO2: The trend in the CO2 IEF for solid fuels in 1A1a varies between 103.1 and 111.8 kg/GJ. The main fuels used are other bituminous coal (with an EF of 94.7 kg/GJ) and blast furnace gas (with a default EF of 247.4 kg/GJ). A larger share of blast furnace gas results in a higher IEF.
RIVM report 2020-0031
Page 91 of 525
• 1A1c gaseous CO2: The trend in the CO2 IEF for gaseous fuels in 1A1c varies between 56.2 and 74.9 kg/GJ. The main fuels used in the production of oil and natural gas sector are regular natural gas and crude ‘wet’ natural gas (directly extracted from the wells). The EF of wet natural gas is variable and most often somewhat higher than the EF of regular natural gas. The variation in the EF of wet natural gas causes the variation in the IEF for gaseous fuels in 1A1c.
3.2.4.3 Uncertainty and time series consistency
Uncertainty The uncertainty in CO2 emissions from this category is estimated to be 3% (see Section 1.7/Annex 2 for details). The accuracy of data on fuel consumption in power generation and oil refineries is generally considered to be very high, with an estimated uncertainty of approximately 1%. The high accuracy in most of this activity data is due to the limited number of utilities and refineries, their large fuel consumption and the fact that the data recorded in national energy statistics are verified as part of the European ETS. The consumption of gaseous fuels in the 1A1c sub-category is mainly in the oil and gas production industry, where the split into ‘own use’ and ‘venting/flaring’ has proven quite difficult to establish, and therefore a high uncertainty of 20% has been assigned. For other fuels, a 3% uncertainty is used, which relates to the amount of fossil waste being incinerated and therefore to the uncertainties in the total amount of waste and the fossil and biomass fractions. For natural gas, the uncertainty in the CO2 EF is estimated to be 0.25%, based on the fuel quality analysis reported by Heslinga and Van Harmelen (2006) and further discussed in Olivier et al. (2009). This value is used in the uncertainty assessment in Annex 2 and key category assessment in Annex 1. For hard coal (bituminous coal), an analysis was made of coal used in power generation (Van Harmelen and Koch, 2002), which is accurate to within approximately 0.5% for 2000 (based on 1,270 samples taken in 2000). In 1990 and 1998, however, the EF varied by ±0.9 kg CO2/GJ (see Table 4.1 in Van Harmelen and Koch, 2002); consequently, when the default EF is applied to other years, the uncertainty is larger: approximately 1%. Analysis of the default CO2 EFs for coke oven gas and blast furnace gas reveals uncertainties of approximately 10% and 15%, respectively (data reported by the steel plant). Since the share of BF/OX gas in total solid fuel emissions from power generation is approximately 15–20%, the overall uncertainty in the CO2 EF for solids in power generation is estimated to be approximately 3%. The CO2 EFs for chemical waste gas are more uncertain than those for other fuels used by utilities. So, for liquid fuels in these sectors, a higher uncertainty of 20–25% is assumed in view of the quite variable composition of the derived gases used in both sectors. For natural gas and liquid fuels in oil and gas production (1A1c), uncertainties of 5% and 2%, respectively, are assumed, which relate to
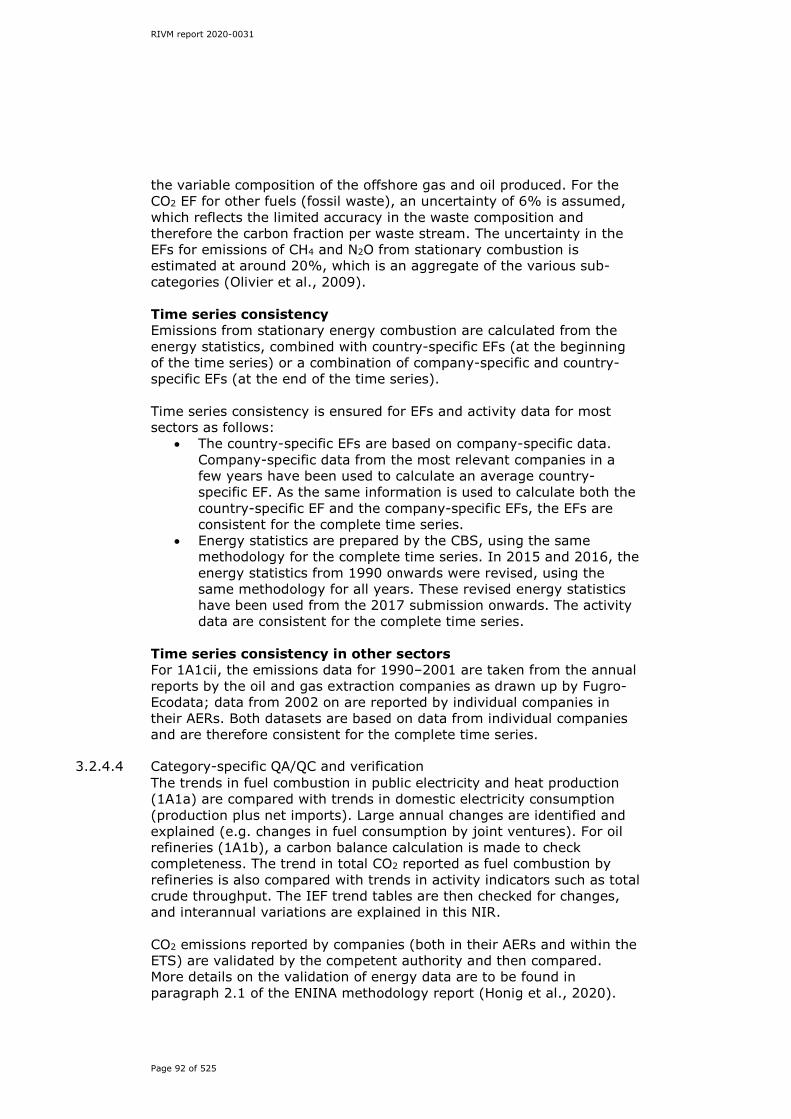
RIVM report 2020-0031
Page 92 of 525
the variable composition of the offshore gas and oil produced. For the CO2 EF for other fuels (fossil waste), an uncertainty of 6% is assumed, which reflects the limited accuracy in the waste composition and therefore the carbon fraction per waste stream. The uncertainty in the EFs for emissions of CH4 and N2O from stationary combustion is estimated at around 20%, which is an aggregate of the various sub-categories (Olivier et al., 2009). Time series consistency Emissions from stationary energy combustion are calculated from the energy statistics, combined with country-specific EFs (at the beginning of the time series) or a combination of company-specific and country-specific EFs (at the end of the time series). Time series consistency is ensured for EFs and activity data for most sectors as follows:
• The country-specific EFs are based on company-specific data. Company-specific data from the most relevant companies in a few years have been used to calculate an average country-specific EF. As the same information is used to calculate both the country-specific EF and the company-specific EFs, the EFs are consistent for the complete time series.
• Energy statistics are prepared by the CBS, using the same methodology for the complete time series. In 2015 and 2016, the energy statistics from 1990 onwards were revised, using the same methodology for all years. These revised energy statistics have been used from the 2017 submission onwards. The activity data are consistent for the complete time series.
Time series consistency in other sectors For 1A1cii, the emissions data for 1990–2001 are taken from the annual reports by the oil and gas extraction companies as drawn up by Fugro-Ecodata; data from 2002 on are reported by individual companies in their AERs. Both datasets are based on data from individual companies and are therefore consistent for the complete time series.
3.2.4.4 Category-specific QA/QC and verification The trends in fuel combustion in public electricity and heat production (1A1a) are compared with trends in domestic electricity consumption (production plus net imports). Large annual changes are identified and explained (e.g. changes in fuel consumption by joint ventures). For oil refineries (1A1b), a carbon balance calculation is made to check completeness. The trend in total CO2 reported as fuel combustion by refineries is also compared with trends in activity indicators such as total crude throughput. The IEF trend tables are then checked for changes, and interannual variations are explained in this NIR. CO2 emissions reported by companies (both in their AERs and within the ETS) are validated by the competent authority and then compared. More details on the validation of energy data are to be found in paragraph 2.1 of the ENINA methodology report (Honig et al., 2020).

RIVM report 2020-0031
Page 93 of 525
3.2.4.5 Category-specific recalculations The energy statistics for 2017 have been improved (some minor corrections). This results in the following changes in CO2 emissions (in Gg CO2): 2017 1A1a -0.19 1A1b +0.0003 1A1c +0.00003
CH4 and N2O emissions have also been recalculated using the improved energy statistics. Emissions from the flaring of landfill gas have been reallocated from 1A1ai to 1A4ai for the complete time series. In 1990, this results in a decrease of 116 Gg CO2 and 0.1 Gg CH4 in 1A1ai. In 2017, it results in a decrease of 113 Gg CO2 and 0.1 Gg CH4 in 1A1ai.
3.2.4.6 Category-specific planned improvements There are no planned improvements.
3.2.5 Manufacturing industries and construction (1A2) 3.2.5.1 Source category description
Table 3.8 provides an overview of sub-source categories, emissions and key categories in the Manufacturing industries and construction sector (1A2). Table 3.8. Overview of emissions in the Manufacturing industries and construction sector (1A2) in the base year and the last two years of the inventory (in Tg CO2 eq.).
Sector/category Gas Key 1990 2017 2018
2018 vs
1990 Contribution to total
in 2018 (%) by
Emissions in Tg CO2 eq % sector total gas
total CO2 eq
1A2 Manufacturing industries and construction CO2 34.4 28.9 27.9 -19.0% 18.0% 17.4% 14.8% CH4 non key 0.1 0.1 0.1 -3.9% 0.0% 0.4% 0.0% N2O non key 0.0 0.0 0.0 17.6% 0.0% 0.0% 0.0% All 34.5 29.0 28.0 -18.9% 18.0% 14.9%
1A2 liquids CO2 L.T 8.8 9.3 9.3 6.2% 6.0% 5.8% 5.0% 1A2 solids CO2 L.T 6.6 5.2 4.8 -27.3% 3.1% 3.0% 2.6% 1A2 gases CO2 L.T 19.0 14.5 13.8 -27.7% 8.9% 8.6% 7.3%
1A2a Iron and steel CO2 5.6 5.4 5.0 -10.1% 3.2% 3.1% 2.7% 1A2b Non-Ferrous Metals CO2 0.2 0.2 0.2 -21.2% 0.1% 0.1% 0.1% 1A2c Chemicals CO2 17.3 14.5 13.9 -19.4% 9.0% 8.7% 7.4% 1A2d Pulp. Paper and Print CO2 1.7 0.9 0.8 -52.2% 0.5% 0.5% 0.4%
Editor
Corrections to table as previously.
RIVM report 2020-0031
Page 94 of 525
Sector/category Gas Key 1990 2017 2018
2018 vs
1990 Contribution to total
in 2018 (%) by
Emissions in Tg CO2 eq % sector total gas
total CO2 eq
1A2e Food Processing. Beverages and Tobacco CO2 4.0 3.7 3.7 -7.9% 2.4% 2.3% 2.0% 1A2f Non metalic minerals CO2 2.3 1.2 1.3 -43.9% 0.8% 0.8% 0.7% 1A2g Other CO2 3.4 3.0 3.0 -11.5% 1.9% 1.9% 1.6%
Within these categories, liquid fuel and natural gas combustion by the chemical industry, solid fuel combustion in the iron and steel sector and natural gas combustion by the food processing industries are the dominant emissions sources. The shares of CH4 and N2O emissions from industrial combustion are relatively small and these are not key sources. Natural gas is mostly used in the chemical, food and drinks and related industries (1A2c and 1A2e); solid fuels (i.e. coal and coke-derived fuels, such as blast furnace/oxygen furnace gas) are mostly used in the iron and steel industry (1A2a); liquid fuels are mostly used in the chemicals industry (1A2c) and in other industries (1A2f) (see Table 3.9). Within the category 1A2 (Manufacturing industries and construction), the sub-category 1A2c (Chemicals) is the largest fuel user (see Table 3.7). Other large fuel-using industries are included in 1A2a (Iron and steel), 1A2e (Food processing, beverages and tobacco) and 1A2g (Other). In the period 1990–2018, CO2 emissions from combustion in 1A2 decreased (see Figure 3.6). The chemical industry contributed the most to the decrease in emissions in this source category. Table 3.9. Fuel use in 1A2 Manufacturing industries and construction in selected years (PJ NCV/year).
Fuel type/ Sub-category
Amount of fuel used (PJ NCV/year) 1990 1995 2000 2005 2010 2015 2017 2018
Gaseous fuels Iron and steel 11.7 13.0 13.7 12.5 12.0 11.1 11.4 11.1
Non-ferrous metals 3.8 4.3 4.2 4.0 3.6 2.7 3.1 3.0 Chemicals 170.7 139.0 117.8 105.3 97.6 105.1 118.7 110.0
Pulp, paper and print 29.2 24.4 27.4 29.7 21.0 15.6 15.9 14.1 Food processing,
beverages and tobacco
63.7 68.5 73.7 67.1 57.0 61.5 63.7 63.0
Non-metallic minerals 26.1 23.8 26.5 23.5 22.6 17.9 17.8 19.1 Other 30.1 34.8 36.3 32.6 31.4 23.2 25.1 23.0
Liquid fuels Iron and steel 0.3 0.3 0.1 0.1 0.1 NO NO NO
Non-ferrous metals NO NO NO NO NO NO NO NO Chemicals 96.2 77.6 82.6 93.2 112.7 109.5 119.8 119.8
Pulp, paper and print 0.0 0.0 NO NO NO NO NO NO
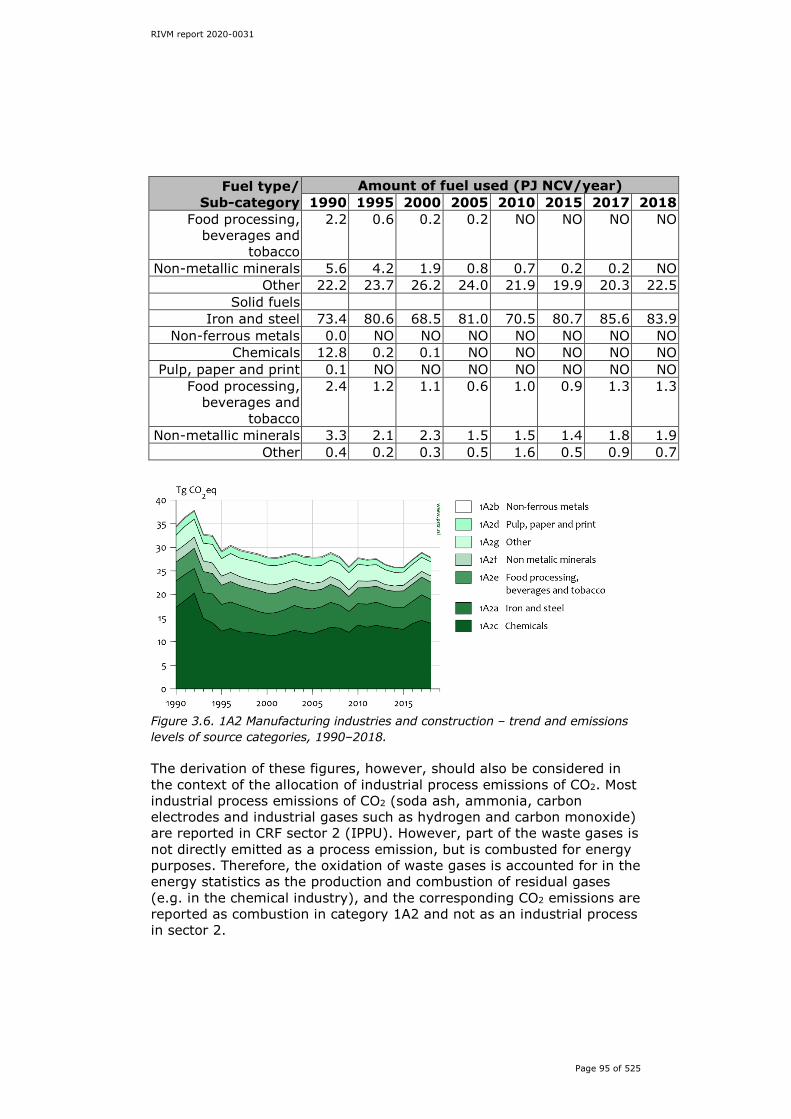
RIVM report 2020-0031
Page 95 of 525
Fuel type/ Sub-category
Amount of fuel used (PJ NCV/year) 1990 1995 2000 2005 2010 2015 2017 2018
Food processing, beverages and
tobacco
2.2 0.6 0.2 0.2 NO NO NO NO
Non-metallic minerals 5.6 4.2 1.9 0.8 0.7 0.2 0.2 NO Other 22.2 23.7 26.2 24.0 21.9 19.9 20.3 22.5
Solid fuels Iron and steel 73.4 80.6 68.5 81.0 70.5 80.7 85.6 83.9
Non-ferrous metals 0.0 NO NO NO NO NO NO NO Chemicals 12.8 0.2 0.1 NO NO NO NO NO
Pulp, paper and print 0.1 NO NO NO NO NO NO NO Food processing,
beverages and tobacco
2.4 1.2 1.1 0.6 1.0 0.9 1.3 1.3
Non-metallic minerals 3.3 2.1 2.3 1.5 1.5 1.4 1.8 1.9 Other 0.4 0.2 0.3 0.5 1.6 0.5 0.9 0.7
Figure 3.6. 1A2 Manufacturing industries and construction – trend and emissions levels of source categories, 1990–2018. The derivation of these figures, however, should also be considered in the context of the allocation of industrial process emissions of CO2. Most industrial process emissions of CO2 (soda ash, ammonia, carbon electrodes and industrial gases such as hydrogen and carbon monoxide) are reported in CRF sector 2 (IPPU). However, part of the waste gases is not directly emitted as a process emission, but is combusted for energy purposes. Therefore, the oxidation of waste gases is accounted for in the energy statistics as the production and combustion of residual gases (e.g. in the chemical industry), and the corresponding CO2 emissions are reported as combustion in category 1A2 and not as an industrial process in sector 2.
RIVM report 2020-0031
Page 96 of 525
Iron and steel (1A2a) This sub-category refers mainly to the integrated steel plant (Tata Steel, previously Corus and/or Hoogovens), which produces approximately 7,000 kton of crude steel per annum. Figure 3.7 shows the production process of the Tata Steel integrated steel plant. Besides the integrated crude steel plant, there is a (small) secondary steel-making plant, which uses mostly scrap metal in an electric arc furnace to produce wire, and a number of iron foundries. The method used for calculating CO2 emissions from Tata Steel is based on a carbon mass balance, so CO2 emissions are not measured directly. The method allocates a quantity of C to relevant incoming and outgoing process streams (Table 3.10). As a result of this calculation method, CO2 emissions can be determined only at plant level. The allocation of emissions to the different sub-processes is not possible. The final difference between input and output, net C, is converted into a net CO2 emission at plant level. For reasons of confidentiality Table 3.10 does not include the quantities of the inputs and outputs. The figures can, however, be made available for review purposes.

RIVM report 2020-0031
Page 97 of 525
Table 3.10. Input/output table for the Tata Steel integrated steel plant. Input Output Excipients Produced steel Steel scrap and raw iron Carbonaceous products Oil Cokes Pellets BTX Additives (limestone/dolomite) TPA Iron ore Mixed process gases: power plants Injection coal Natural gas Coking coal
Figure 3.7 shows the relation between the input streams from Table 3.10 (highlighted yellow) and the processes, together with the resulting emissions and the CRF categories where these are reported. Please note that the sub-flows of the gases (emissions) cannot be disaggregated in this approach; only the final flows are relevant and reported. During the production of iron and steel, coke and coal are used as reducing agents in the blast and oxygen furnaces, resulting in the by-products blast furnace gas and oxygen furnace gas, which are used as fuel for energy purposes (see also Figure 3.7). The Energy Balance of Statistics Netherlands distinguishes between energy figures from the Cokes Plant and the summed fuel use of the rest of processes in the integrated steel plant. Therefore, only combustion emissions from the Coke Plant and the rest of the integrated crude steel plant can be estimated. These combustion emissions (including flaring emissions) are included in 1A1ci (Manufacture of solid fuels) and 1A2a (Energy iron and steel). Tata Steel also exports a large part of its carbon to the Energy sector in the form of mixed production gas. These emissions are included in 1A1a (Public electricity and heat production). The relevant net process emissions are reported under sub-categories 1B1b (Solid fuel transformation), 2C1 (Iron and steel production) and 2A4d (Other process uses of carbonates). Inter-annual variations in CO2 combustion emissions from the crude steel plant can be explained mainly by the varying amounts of solid fuels used in this sector. When all CO2 emissions from the sector are combined, total emissions closely follow the inter-annual variation in crude steel production (see Figure 3.8). Total CO2 emissions from crude steel production have decreased over time, even though production has increased. This indicates a substantial energy efficiency improvement in the sector.

RIVM report 2020-0031
Page 98 of 525
SINTER PLANT
PELLETIZING PLANT
BLAST FURNACE BASIC OXYGEN FURNACE
STEEL PROCESSING
OTHER COMBUSTION
PROCESSES
MIXING PROCESS GASES POWER PLANT
COKE OVEN
Iron Ore
Additives/excipients
Breeze
Iron Ore
Additives/Excipients
Breeze
Sinter
Pellets
Cokes Coal Injection
Pellets
Pig Iron
Flaring*
Additives
Blast Furnace Gas
Crude Steel
Slag
Flaring*
Scrap and raw iron
Coking coal
Flaring*Cokes Oven Gas
CO2/CH4 (1A1a)
BASIC OXYGEN FURNACE Gas
CO2/CH4 (1A1c/1B1b)
TPA
BTX
StockCokes (incl. Breeze)
Mixed process gases
*Flaring only in special operating conditions
Natural Gas
CO2/CH4 (1A2a/2C1/2A4d)
Figure 3.7. Production process of the Tata Steel integrated steel plant.

RIVM report 2020-0031
Page 99 of 525
Figure 3.8. CO2 emissions (Gg) from crude steel production compared with crude steel production, 1990–2018 (kton).
Non-ferrous metals (1A2b) This sub-category consists mainly of two aluminium smelters. CO2 emissions from anode consumption in the aluminium industry are included in 2C (Metal production). This small source category contributes only about 0.2 Tg CO2 to the total National GHG Emissions Inventory, predominantly from the combustion of natural gas. Energy production in the aluminium industry is largely based on electricity, the emissions of which are included in 1A1a (Public electricity and heat production). The amounts of liquid and solid fuels vary considerably between years, but both the amounts and the related emissions are almost negligible. The interannual variation of the IEFs for liquid fuels is largely a result of changes in the mix of underlying fuels (e.g. the share of LPG, which has a relatively low EF) and partly due to the small amounts used. Chemicals (1A2c) CO2 emissions from this sub-category have decreased since 1990, mainly due to a large decrease in the consumption of natural gas during the same period. This is mainly caused by a decrease of cogeneration facilities in this industrial sector. CO2 emissions from liquid fuel combustion stem predominantly from the combustion of chemical waste gas. The decrease in liquid fuel consumption in the 1990s was mainly due to a shift in the ownership of cogeneration plants to joint ventures, thus reallocating liquid fuel consumption to energy industries. This also explains the large decrease in solid fuel combustion. The increase in 2003 of the IEF for CO2 emissions from liquid fuels is explained by the increase in the use of chemical waste gas and a change in its composition. For CO2 from waste gas (reported under Liquid and gaseous fuels), source-specific EFs were used from 1995 onwards based on data from selected years. For 16 individual plants, the residual chemical gas from the combustion of liquids was hydrogen, for which the CO2 EF is 0. For another 9 companies, plant-specific CO2 EFs based on annual reporting by the companies were used (most in the 50–55 kg CO2/GJ range, with exceptional values of 23 and 95 kg CO2/GJ).

RIVM report 2020-0031
Page 100 of 525
The increased use of chemical waste gas (included in Liquid fuels) since 2003 and the changes in the composition of the gases explain the increase in the IEF for liquid fuels from c. 55 to 70 kg CO2/GJ. For 1990, an average sector-specific value for the chemical industry was calculated using the plant-specific EFs for 1995 from the four largest companies and the amounts used per company in 1990. For CO2 from phosphorous furnace gas (included in gaseous fuels), plant-specific values were used, with values of around 149.5 kg/GJ. The operation of the phosphorous plant started in 1998, which explains the increase in the IEF for gaseous fuels, and the plant closed in 2012, resulting in a decrease in the IEF for gaseous fuels. Pulp, paper and print (1A2d) In line with the decreased consumption of natural gas, CO2 emissions have decreased since 1990. A substantial fraction of the natural gas has been used for cogeneration. The relatively low CO2 emissions since 1995 can be explained by the reallocation of emissions to the Energy sector, due to the aforementioned formation of joint ventures. The amounts of liquid and solid fuel combustion vary considerably between years, but the amounts and related emissions are almost negligible. The interannual variation in the IEFs for liquid fuels is due to variable shares of derived gases (chemical waste gas) and LPG in total liquid fuel combustion. Food processing, beverages and tobacco (1A2e) CO2 emissions from this sub-category decreased in the period 1990–2018. This is due to the reallocation (since 2003) of joint ventures at cogeneration plants, whose emissions were formerly allocated to 1A2e but are now reported under Public electricity and heat production (1A1a). The amounts of liquid and solid fuels vary considerably between years, but the amounts and related emissions are relatively small. The interannual variation in the IEFs for liquid fuels is due to variable shares of LPG in total liquid fuel combustion. Non-metallic minerals (1A2f) CO2 emissions from this sub-category decreased in the period 1990-2018 as a result of the decreasing consumption of natural gas. The amounts of liquid and solid fuels vary considerably between years, but the amounts and related emissions are relatively small. The interannual variation in the IEFs for liquid fuels is due to variable shares of LPG in total liquid fuel combustion, which has a lower CO2 EF. In the revised energy statistics, no biomass consumption in the non-metallic minerals sector is reported in the period 1990–1995.
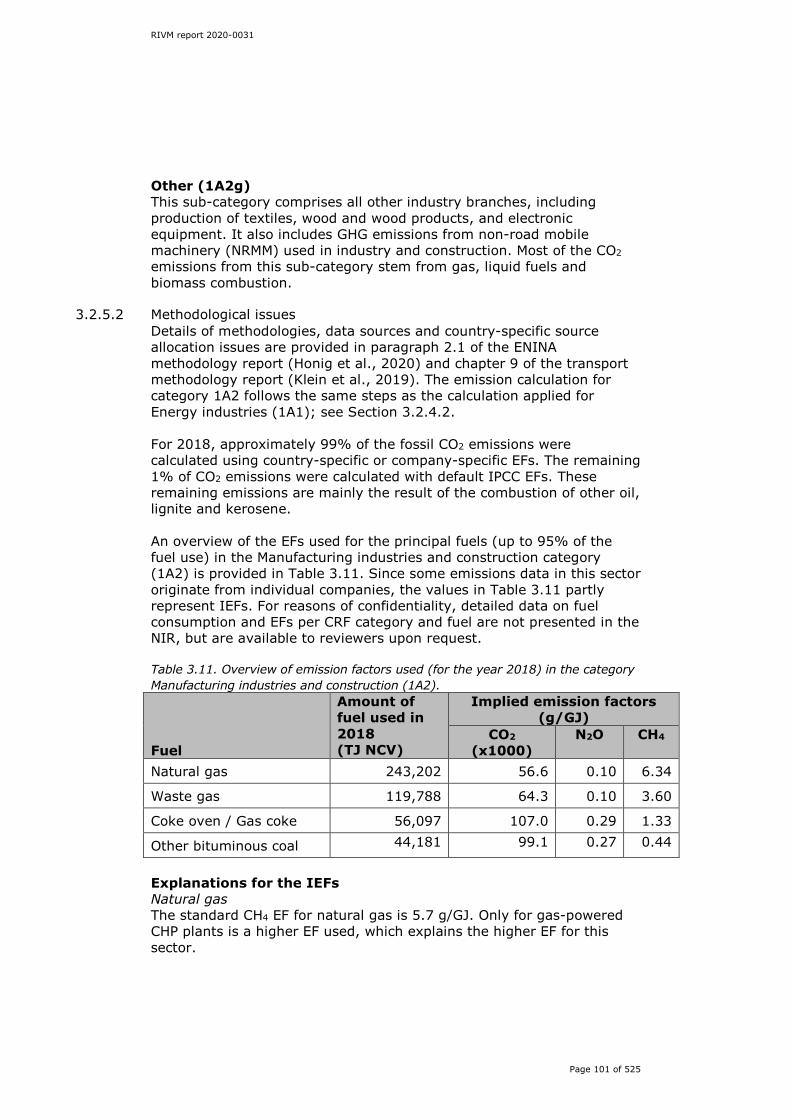
RIVM report 2020-0031
Page 101 of 525
Other (1A2g) This sub-category comprises all other industry branches, including production of textiles, wood and wood products, and electronic equipment. It also includes GHG emissions from non-road mobile machinery (NRMM) used in industry and construction. Most of the CO2 emissions from this sub-category stem from gas, liquid fuels and biomass combustion.
3.2.5.2 Methodological issues Details of methodologies, data sources and country-specific source allocation issues are provided in paragraph 2.1 of the ENINA methodology report (Honig et al., 2020) and chapter 9 of the transport methodology report (Klein et al., 2019). The emission calculation for category 1A2 follows the same steps as the calculation applied for Energy industries (1A1); see Section 3.2.4.2. For 2018, approximately 99% of the fossil CO2 emissions were calculated using country-specific or company-specific EFs. The remaining 1% of CO2 emissions were calculated with default IPCC EFs. These remaining emissions are mainly the result of the combustion of other oil, lignite and kerosene. An overview of the EFs used for the principal fuels (up to 95% of the fuel use) in the Manufacturing industries and construction category (1A2) is provided in Table 3.11. Since some emissions data in this sector originate from individual companies, the values in Table 3.11 partly represent IEFs. For reasons of confidentiality, detailed data on fuel consumption and EFs per CRF category and fuel are not presented in the NIR, but are available to reviewers upon request. Table 3.11. Overview of emission factors used (for the year 2018) in the category Manufacturing industries and construction (1A2).
Fuel
Amount of fuel used in 2018 (TJ NCV)
Implied emission factors (g/GJ)
CO2 (x1000)
N2O CH4
Natural gas 243,202 56.6 0.10 6.34
Waste gas 119,788 64.3 0.10 3.60
Coke oven / Gas coke 56,097 107.0 0.29 1.33
Other bituminous coal 44,181 99.1 0.27 0.44
Explanations for the IEFs Natural gas The standard CH4 EF for natural gas is 5.7 g/GJ. Only for gas-powered CHP plants is a higher EF used, which explains the higher EF for this sector.
RIVM report 2020-0031
Page 102 of 525
Waste gas Reported CO2 emissions from waste gas are based on emissions data from the ETS. Therefore, the IEF is different from the standard country-specific EF. Coke oven / Gas coke and other bituminous coal For solid fuels, an EF of 0.27 g N2O/GJ (based on reported emissions from Tata Steel) and an EF of 0.44 g CH4/GJ (standard EF for other bituminous coal) are used to calculate emissions from the iron and steel plant. The standard EFs are used for solid fuel combustion in other sectors. Reported CO2 emissions from other bituminous coal and coke oven/gas coke are based on emissions data from the ETS. Therefore, the CO2 IEFs are different from the standard country-specific EF. In the iron and steel industry, a substantial proportion of total CO2 emissions is reported as process emissions in CRF 2C1, based on net losses calculated from the carbon balance of the process (coke and coal inputs in the blast furnaces and the blast furnace gas produced). Since the fraction of BF/OX gas captured and used for energy varies over time, the trend in the emissions of CO2 accounted for by this source category should be viewed in association with the reported process emissions (see Figure 3.7). The emissions calculation of the iron and steel industry is based on a mass balance. For the chemical industry, CO2 emissions from the production of silicon carbide, carbon black, methanol and ethylene from the combustion of residual gas (a by-product of the non-energy use of fuels) are included in 1A2c (Chemicals). Although these CO2 emissions are more or less process-related, they are included in 1A2 to keep consistency with energy statistics that account for the combustion of residual gases. The fuel consumption data in 1A2g (Other) are not based on large surveys and therefore are the least accurate in this part of sub-category 1A2. The methodology for the calculation of NRMM emissions is described in Section 3.2.7.2.
3.2.5.3 Uncertainty and time series consistency Uncertainty The uncertainty in CO2 emissions of this category is estimated to be about 2% (see Annex 2 for details). The uncertainty of fuel consumption data in the manufacturing industries is about 2%, with the exception of that for derived gases included in solids and liquids (Olivier et al., 2009). The uncertainty of fuel consumption data includes the uncertainty in the subtraction of the amounts of gas and solids for non-energy/feedstock uses, including the uncertainty in the conversion from physical units to Joules, and the assumed full coverage of capturing blast furnace gas in total solid consumption and full coverage of chemical waste gas in liquid fuel consumption. For natural gas, the uncertainty in the CO2 EF is estimated to be 0.25%, based on the fuel quality analysis reported by Heslinga and Van Harmelen (2006) and further discussed in Olivier et al. (2009). The 25% uncertainty
RIVM report 2020-0031
Page 103 of 525
estimate in the CO2 EF for liquids is based on an uncertainty of 25% in the EF for chemical waste gas in order to account for the quite variable composition of the gas and its more than 50% share in the total liquid fuel use in the sector. An uncertainty of 10% is assigned to solids, which reflects the uncertainty in the carbon content of blast furnace gas/oxygen furnace gas based on the standard deviation in a three-year average. BF/OX gas accounts for the majority of solid fuel use in this category. Time series consistency Emissions from stationary energy combustion are calculated from the energy statistics, combined with country-specific EFs (at the beginning of the time series) or a combination of company-specific and country-specific EFs (at the end of the time series). Time series consistency is ensured for EFs and activity data for most sectors as follows:
• The country-specific EFs are based on company-specific data. Company-specific data from the most relevant companies in a few years have been used to calculate an average country-specific EF. As the same information is used to calculate both the country-specific EF and the company-specific EFs, the EFs are consistent for the complete time series.
• Energy statistics are prepared by the CBS, using the same methodology for the complete time series. In 2015 and 2016, the energy statistics from 1990 onwards were revised, using the same methodology for all years. These revised energy statistics have been used from the 2017 submission onwards. The activity data are consistent for the complete time series.
Following a review recommendation of 2017, the CO2 EF of chemical waste gas for the earlier years was studied. It was concluded that the EFs for combustion of chemical waste gas are based on emissions and activity data of individual companies. The company-specific data have also been used to derive a country-specific EF. As the same information is used to calculate both the country-specific EF and the company-specific EFs, the EFs are consistent for the complete time series. See Section 3.2.5.5 for more details.
3.2.5.4 Category-specific QA/QC and verification The trends in CO2 emissions from fuel combustion in the iron and steel industry, non-ferrous industry, food processing, pulp and paper and other industries are compared with trends in the associated activity data: crude steel and aluminium production, indices of food production, pulp and paper production and cement and brick production. Large annual changes are identified and explained (e.g. changed allocation of fuel consumption due to joint ventures). Moreover, for the iron and steel industry, the trend in total CO2 emissions reported as fuel combustion-related emissions (included in 1A2a) and industrial process emissions (included in 2C1) is compared with the trend in the activity data (crude steel production). A similar comparison is made for the total trend in CO2 emissions from the chemical industry (sum of 1A2c and 2B) and trends split per main fuel type or specific process (chemical waste gas combustion and process emissions from ammonia production). IEF trend tables are checked for large changes and large interannual variations at different levels, which are explained in the NIR.

RIVM report 2020-0031
Page 104 of 525
CO2 emissions reported by companies (both in AERs and as part of the ETS) are validated by the competent authority and then compared (see also Section 3.2.4.4). More details on the validation of the energy data can be found in Honig et al. (2020).
3.2.5.5 Category-specific recalculations The energy statistics for 2017 have been improved (minor corrections). This results in the following changes in CO2 emissions (in Gg CO2):
2017 1A2a -0.00003 1A2b -0.0000001 1A2c +1.23 1A2d -0.000006 1A2e +0.00003 1A2f -0.001 1A2gvii -81.26
CH4 and N2O emissions have also been recalculated using the improved energy statistics. In addition, there was an error correction for the years 1996–1999 and 2001–2003 in Rubber and plastics production (1A2c). Emissions for 1996 have been reduced by 239 Gg CO2, 0.023 Gg CH4 and 0.0005 Gg N2O. Emissions for 2003 have been reduced by 196 Gg CO2, 0.020 Gg CH4 and 0.0003 Gg N2O. Chemical waste gas Following a review recommendation of 2017, the CO2 EF of chemical waste gas for the earlier years was analysed. It was checked whether reported emissions data from individual companies in ETS and AERs could be used to improve the CO2 EF in earlier years. It was also checked whether additional emissions data from earlier years were available to improve the emission estimates. Currently, the emissions are calculated by using company-specific EFs for four companies. These four companies use the largest amounts of chemical waste gas. For the remaining companies, the default EF is used. If any of the selected companies was missing, a company-specific EF for the missing company was used (derived in 1995). For the period 1990–1994, a country-specific EF based on an average EF for the four companies was used. The company-specific EFs for these four companies in 1995 were compared with the data in ETS and AERs. For three of the companies, the old company-specific EFs are in the same order of magnitude as the new company-specific EFs. For one company, the old company-specific EF is lower than the new company-specific EF. We checked whether additional data were available regarding the emissions from chemical waste gas from these companies, but this was not the case. The different company-specific EFs for one company could be due to changes in the company’s processes. As the most up-to-date company-specific data were used to derive the company-specific EF in 1995, it is
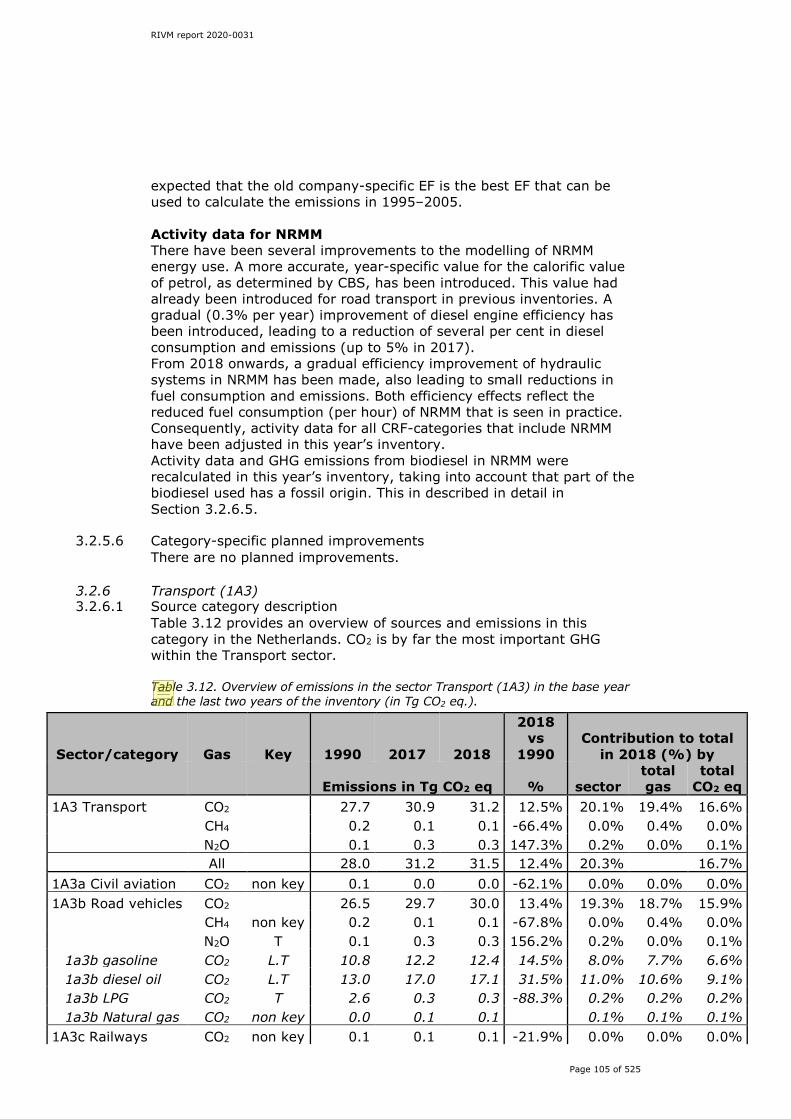
RIVM report 2020-0031
Page 105 of 525
expected that the old company-specific EF is the best EF that can be used to calculate the emissions in 1995–2005. Activity data for NRMM There have been several improvements to the modelling of NRMM energy use. A more accurate, year-specific value for the calorific value of petrol, as determined by CBS, has been introduced. This value had already been introduced for road transport in previous inventories. A gradual (0.3% per year) improvement of diesel engine efficiency has been introduced, leading to a reduction of several per cent in diesel consumption and emissions (up to 5% in 2017). From 2018 onwards, a gradual efficiency improvement of hydraulic systems in NRMM has been made, also leading to small reductions in fuel consumption and emissions. Both efficiency effects reflect the reduced fuel consumption (per hour) of NRMM that is seen in practice. Consequently, activity data for all CRF-categories that include NRMM have been adjusted in this year’s inventory. Activity data and GHG emissions from biodiesel in NRMM were recalculated in this year’s inventory, taking into account that part of the biodiesel used has a fossil origin. This in described in detail in Section 3.2.6.5.
3.2.5.6 Category-specific planned improvements There are no planned improvements.
3.2.6 Transport (1A3) 3.2.6.1 Source category description
Table 3.12 provides an overview of sources and emissions in this category in the Netherlands. CO2 is by far the most important GHG within the Transport sector. Table 3.12. Overview of emissions in the sector Transport (1A3) in the base year and the last two years of the inventory (in Tg CO2 eq.).
Sector/category Gas Key 1990 2017 2018
2018 vs
1990 Contribution to total
in 2018 (%) by
Emissions in Tg CO2 eq % sector total gas
total CO2 eq
1A3 Transport CO2 27.7 30.9 31.2 12.5% 20.1% 19.4% 16.6% CH4 0.2 0.1 0.1 -66.4% 0.0% 0.4% 0.0% N2O 0.1 0.3 0.3 147.3% 0.2% 0.0% 0.1% All 28.0 31.2 31.5 12.4% 20.3% 16.7% 1A3a Civil aviation CO2 non key 0.1 0.0 0.0 -62.1% 0.0% 0.0% 0.0% 1A3b Road vehicles CO2 26.5 29.7 30.0 13.4% 19.3% 18.7% 15.9% CH4 non key 0.2 0.1 0.1 -67.8% 0.0% 0.4% 0.0% N2O T 0.1 0.3 0.3 156.2% 0.2% 0.0% 0.1%
1a3b gasoline CO2 L.T 10.8 12.2 12.4 14.5% 8.0% 7.7% 6.6% 1a3b diesel oil CO2 L.T 13.0 17.0 17.1 31.5% 11.0% 10.6% 9.1% 1a3b LPG CO2 T 2.6 0.3 0.3 -88.3% 0.2% 0.2% 0.2% 1a3b Natural gas CO2 non key 0.0 0.1 0.1 0.1% 0.1% 0.1%
1A3c Railways CO2 non key 0.1 0.1 0.1 -21.9% 0.0% 0.0% 0.0%
Editor
Corrections to table as previously.

RIVM report 2020-0031
Page 106 of 525
Sector/category Gas Key 1990 2017 2018
2018 vs
1990 Contribution to total
in 2018 (%) by
Emissions in Tg CO2 eq % sector total gas
total CO2 eq
1A3d Domestic Navigation CO2 L.T 0.7 1.0 1.0 32.8% 0.6% 0.6% 0.5% 1A3e Other Transportation CO2 non key 0.3 0.1 0.1 -73.6% 0.1% 0.1% 0.0%
Overview of shares and trends in energy use and emissions Transport was responsible for 16.7% of GHG emissions in the Netherlands in 2018. Greenhouse gas emissions from transport increased by 29% between 1990 and 2006, from 28.0 to 36.3 Tg CO2 eq. This increase was mainly due to an increase in diesel fuel consumption and resulting CO2 emissions from road transport. Since 2006, GHG emissions from transport have decreased by 13% to 31.5 Tg CO2 eq. in 2018. Total energy use and resulting GHG emissions from transport are summarised in Figure 3.9 and Figure 3.10. As Figure 3.9 shows, road transport accounts for 95–97% of energy use and GHG emissions in this category over the time series.
Figure 3.9. 1A3 Transport – energy use of source categories in PJ, 1990–2018. Figure 3.10 shows that GHG emissions from transport steadily increased between 1990 and 2006. The increase is more or less in line with the increase in road transport volumes. Between 2006 and 2008, emissions stabilised due to an increase in the use of biofuels in road transport. CO2 emissions from biofuels are reported separately in the inventory and are not part of the national emissions totals (and are therefore not included in Figure 3.10). In 2009, GHG emissions from transport decreased by 4%, primarily due to the economic crisis and the resulting decrease in freight transport volumes. In 2010 and 2011, emissions increased slightly due to a decrease in the use of biofuels in 2010 and an increase in road transport volumes in 2011.
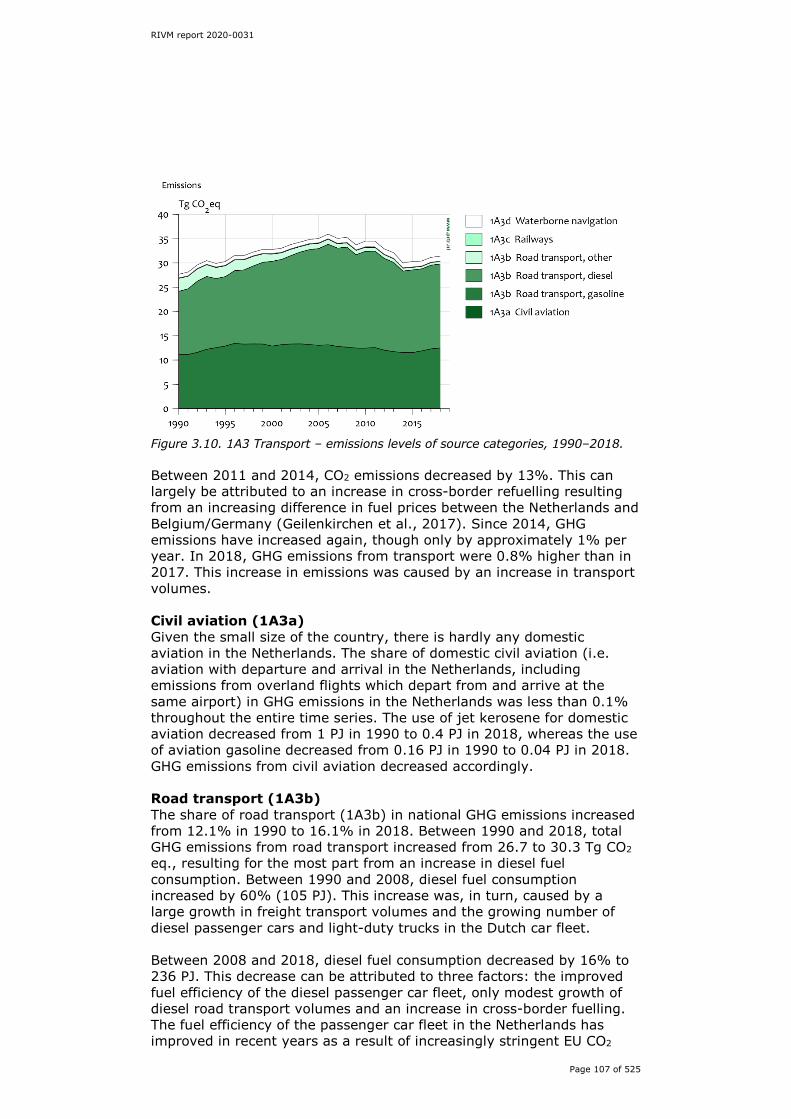
RIVM report 2020-0031
Page 107 of 525
Figure 3.10. 1A3 Transport – emissions levels of source categories, 1990–2018. Between 2011 and 2014, CO2 emissions decreased by 13%. This can largely be attributed to an increase in cross-border refuelling resulting from an increasing difference in fuel prices between the Netherlands and Belgium/Germany (Geilenkirchen et al., 2017). Since 2014, GHG emissions have increased again, though only by approximately 1% per year. In 2018, GHG emissions from transport were 0.8% higher than in 2017. This increase in emissions was caused by an increase in transport volumes. Civil aviation (1A3a) Given the small size of the country, there is hardly any domestic aviation in the Netherlands. The share of domestic civil aviation (i.e. aviation with departure and arrival in the Netherlands, including emissions from overland flights which depart from and arrive at the same airport) in GHG emissions in the Netherlands was less than 0.1% throughout the entire time series. The use of jet kerosene for domestic aviation decreased from 1 PJ in 1990 to 0.4 PJ in 2018, whereas the use of aviation gasoline decreased from 0.16 PJ in 1990 to 0.04 PJ in 2018. GHG emissions from civil aviation decreased accordingly. Road transport (1A3b) The share of road transport (1A3b) in national GHG emissions increased from 12.1% in 1990 to 16.1% in 2018. Between 1990 and 2018, total GHG emissions from road transport increased from 26.7 to 30.3 Tg CO2 eq., resulting for the most part from an increase in diesel fuel consumption. Between 1990 and 2008, diesel fuel consumption increased by 60% (105 PJ). This increase was, in turn, caused by a large growth in freight transport volumes and the growing number of diesel passenger cars and light-duty trucks in the Dutch car fleet. Between 2008 and 2018, diesel fuel consumption decreased by 16% to 236 PJ. This decrease can be attributed to three factors: the improved fuel efficiency of the diesel passenger car fleet, only modest growth of diesel road transport volumes and an increase in cross-border fuelling. The fuel efficiency of the passenger car fleet in the Netherlands has improved in recent years as a result of increasingly stringent EU CO2
RIVM report 2020-0031
Page 108 of 525
emissions standards for new passenger cars and fiscal incentives for the purchase of fuel-efficient cars. In recent years, as more fuel-efficient cars have entered the car fleet, average fuel efficiency has improved (although it should be noted that improvements in fuel efficiency in the real world were much smaller than those indicated by type approval values). Also, road transport volumes were more or less stable between 2008 and 2014, mainly due to the economic crisis. In recent years, however, transport volumes have increased again due to the economic upturn. Finally, an increase in excise duties for diesel fuel in the Netherlands in 2014 led to an increase in cross-border refuelling, especially for freight transport (Geilenkirchen et al., 2020). Gasoline consumption increased from 142 to 170 PJ between 1990 and 1996 and subsequently fluctuated between 165 and 170 PJ until 2011. Thereafter, gasoline sales to road transport decreased to 156 PJ in 2014 but then increased again to 169 PJ in 2018. The decrease between 2011 and 2014 can be attributed to a combination of improved fuel efficiency of the passenger car fleet, stabilisation of road transport volumes and an increase in cross-border refuelling. The subsequent increase can for the most part be attributed to economic growth resulting in increased traffic volumes. LPG consumption for road transport decreased steadily throughout the time series: from 40 PJ in 1990 to 5 PJ in 2018, mainly due to the decreasing number of LPG-powered passenger cars in the car fleet. As a result, the share of LPG in energy use by road transport decreased significantly between 1990 and 2018. The use of natural gas in road transport has increased in recent years and amounted to 3 PJ in 2018. Within the Transport sector, natural gas is mainly used for public transport buses, although the number of CNG-powered passenger cars and light-duty trucks has increased in recent years. Biofuels have been used in road transport since 2003. The use of biofuels increased from 0.1 PJ in 2003 to 15 PJ in 2009, and then fluctuated between 10 and 15 PJ until 2017. In 2018, biofuel use for road transport increased by 60% to 20 PJ, accounting for 4.6% of total energy use for road transport. The large increase in the use of biofuels in 2018, that will continue until 2020, is a result of a legal obligation to use renewable energy for transport. This obligation for the most part is met by the increasing use of biofuels. The share of CH4 in GHG emissions from road transport (in CO2 eq.) is very small (0.04% in 2018). CH4 emissions from road transport decreased by almost 70% between 1990 and 2018. This decrease was due to a reduction in VOC emissions, resulting from the implementation and subsequent tightening of EU emissions legislation for new vehicles. Total VOC emissions from road transport decreased by almost 90% between 1990 and 2018, primarily due to the penetration of catalyst-equipped and canister-equipped vehicles into the passenger car fleet. Since CH4 emissions are estimated as a fraction of total VOC emissions, the decrease in VOC emissions throughout the time series has also resulted in a decrease in CH4 emissions. The share of CH4 in total VOC increased with the introduction of three-way catalysts (TWCs) in gasoline passenger cars. Therefore, the decrease in CH4 emissions throughout the time series is smaller than the decrease in

RIVM report 2020-0031
Page 109 of 525
total VOC emissions. Since almost the entire gasoline car fleet is currently equipped with catalysts and carbon canisters, the decrease in VOC emissions has stagnated in recent years. Therefore, CH4 emissions from road transport stabilised between 2014 and 2018. The share of N2O in total GHG emissions from road transport (in CO2 eq.) is also small (0.2% in 2018). N2O emissions from road transport increased from 0.1 Gg in 1990 to 0.9 Gg in 1997, but have since (slightly) decreased to 0.3 Gg in 2018. The increase in N2O emissions up to 1997 resulted from the increasing number of gasoline cars equipped with TWCs in the passenger car fleet, as these emit more N2O per vehicle–kilometre than gasoline cars without a TWC. The subsequent stabilisation of N2O emissions between 1997 and 2016, despite a further increase in transport volumes, can be explained by a combination of two factors:
1. N2O emissions per vehicle–kilometre of subsequent generations of TWC-equipped gasoline cars have decreased (Kuiper and Hensema, 2012).
2. Recent generations of heavy-duty diesel trucks, equipped with selective catalytic reduction (SCR) catalysts to reduce NOx emissions, emit more N2O per vehicle–kilometre than older trucks (Kuiper and Hensema, 2012). This led to an increase in N2O emissions from heavy-duty vehicles in recent years, which more or less offset the decrease in N2O emissions from gasoline-powered passenger cars.
Railways (1A3c) Railways (1A3c) are a minor source of GHG emissions, accounting for 0.04% of total GHG emissions from Transport in the Netherlands. Diesel fuel consumption by railways has fluctuated between 1.0 and 1.4 PJ throughout the time series, even though transport volumes have grown. This decoupling between transport volumes and diesel fuel consumption has been caused by the increasing electrification of rail (freight) transport. In 2018, diesel fuel consumption by railways amounted to 1.0 PJ. Passenger transport by diesel trains accounts for approximately 0.4-0.5 PJ of diesel fuel consumption annually, the remainder being used for freight transport. Most rail transport in the Netherlands is electric, with total electricity use for rail transport amounting to over 5-6 PJ annually in recent years. GHG emissions resulting from electricity generation for railways are not reported under 1A3c. Waterborne navigation (1A3d) (Domestic) waterborne navigation is a small source of GHG emissions in the Netherlands. Waterborne navigation in the Netherlands is for the most part internationally orientated, i.e. either departs or arrives abroad. Because emissions from international navigation are reported under Bunkers (1D, Section 3.2.2), the share of (domestic) waterborne navigation in total GHG emissions from the transport sector is small and varies between 2% and 4% throughout the time series.
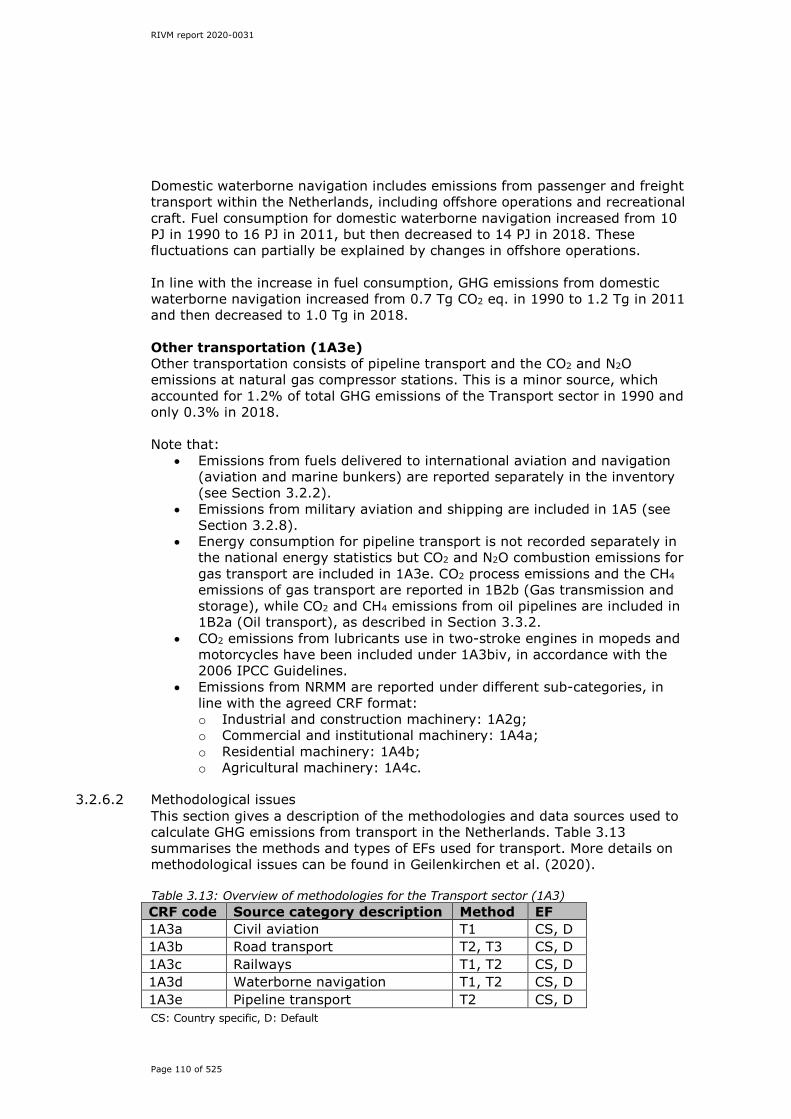
RIVM report 2020-0031
Page 110 of 525
Domestic waterborne navigation includes emissions from passenger and freight transport within the Netherlands, including offshore operations and recreational craft. Fuel consumption for domestic waterborne navigation increased from 10 PJ in 1990 to 16 PJ in 2011, but then decreased to 14 PJ in 2018. These fluctuations can partially be explained by changes in offshore operations. In line with the increase in fuel consumption, GHG emissions from domestic waterborne navigation increased from 0.7 Tg CO2 eq. in 1990 to 1.2 Tg in 2011 and then decreased to 1.0 Tg in 2018. Other transportation (1A3e) Other transportation consists of pipeline transport and the CO2 and N2O emissions at natural gas compressor stations. This is a minor source, which accounted for 1.2% of total GHG emissions of the Transport sector in 1990 and only 0.3% in 2018. Note that:
• Emissions from fuels delivered to international aviation and navigation (aviation and marine bunkers) are reported separately in the inventory (see Section 3.2.2).
• Emissions from military aviation and shipping are included in 1A5 (see Section 3.2.8).
• Energy consumption for pipeline transport is not recorded separately in the national energy statistics but CO2 and N2O combustion emissions for gas transport are included in 1A3e. CO2 process emissions and the CH4 emissions of gas transport are reported in 1B2b (Gas transmission and storage), while CO2 and CH4 emissions from oil pipelines are included in 1B2a (Oil transport), as described in Section 3.3.2.
• CO2 emissions from lubricants use in two-stroke engines in mopeds and motorcycles have been included under 1A3biv, in accordance with the 2006 IPCC Guidelines.
• Emissions from NRMM are reported under different sub-categories, in line with the agreed CRF format: o Industrial and construction machinery: 1A2g; o Commercial and institutional machinery: 1A4a; o Residential machinery: 1A4b; o Agricultural machinery: 1A4c.
3.2.6.2 Methodological issues
This section gives a description of the methodologies and data sources used to calculate GHG emissions from transport in the Netherlands. Table 3.13 summarises the methods and types of EFs used for transport. More details on methodological issues can be found in Geilenkirchen et al. (2020). Table 3.13: Overview of methodologies for the Transport sector (1A3) CRF code Source category description Method EF 1A3a Civil aviation T1 CS, D 1A3b Road transport T2, T3 CS, D 1A3c Railways T1, T2 CS, D 1A3d Waterborne navigation T1, T2 CS, D 1A3e Pipeline transport T2 CS, D CS: Country specific, D: Default
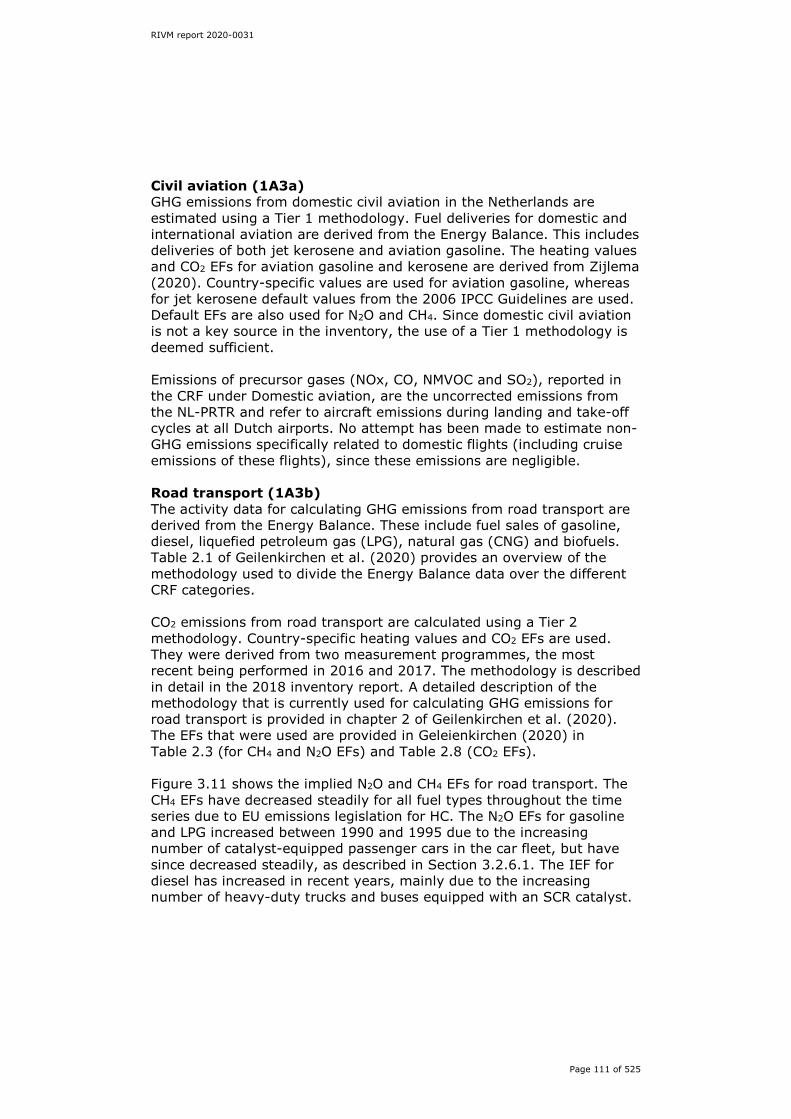
RIVM report 2020-0031
Page 111 of 525
Civil aviation (1A3a) GHG emissions from domestic civil aviation in the Netherlands are estimated using a Tier 1 methodology. Fuel deliveries for domestic and international aviation are derived from the Energy Balance. This includes deliveries of both jet kerosene and aviation gasoline. The heating values and CO2 EFs for aviation gasoline and kerosene are derived from Zijlema (2020). Country-specific values are used for aviation gasoline, whereas for jet kerosene default values from the 2006 IPCC Guidelines are used. Default EFs are also used for N2O and CH4. Since domestic civil aviation is not a key source in the inventory, the use of a Tier 1 methodology is deemed sufficient. Emissions of precursor gases (NOx, CO, NMVOC and SO2), reported in the CRF under Domestic aviation, are the uncorrected emissions from the NL-PRTR and refer to aircraft emissions during landing and take-off cycles at all Dutch airports. No attempt has been made to estimate non-GHG emissions specifically related to domestic flights (including cruise emissions of these flights), since these emissions are negligible. Road transport (1A3b) The activity data for calculating GHG emissions from road transport are derived from the Energy Balance. These include fuel sales of gasoline, diesel, liquefied petroleum gas (LPG), natural gas (CNG) and biofuels. Table 2.1 of Geilenkirchen et al. (2020) provides an overview of the methodology used to divide the Energy Balance data over the different CRF categories. CO2 emissions from road transport are calculated using a Tier 2 methodology. Country-specific heating values and CO2 EFs are used. They were derived from two measurement programmes, the most recent being performed in 2016 and 2017. The methodology is described in detail in the 2018 inventory report. A detailed description of the methodology that is currently used for calculating GHG emissions for road transport is provided in chapter 2 of Geilenkirchen et al. (2020). The EFs that were used are provided in Geleienkirchen (2020) in Table 2.3 (for CH4 and N2O EFs) and Table 2.8 (CO2 EFs). Figure 3.11 shows the implied N2O and CH4 EFs for road transport. The CH4 EFs have decreased steadily for all fuel types throughout the time series due to EU emissions legislation for HC. The N2O EFs for gasoline and LPG increased between 1990 and 1995 due to the increasing number of catalyst-equipped passenger cars in the car fleet, but have since decreased steadily, as described in Section 3.2.6.1. The IEF for diesel has increased in recent years, mainly due to the increasing number of heavy-duty trucks and buses equipped with an SCR catalyst.
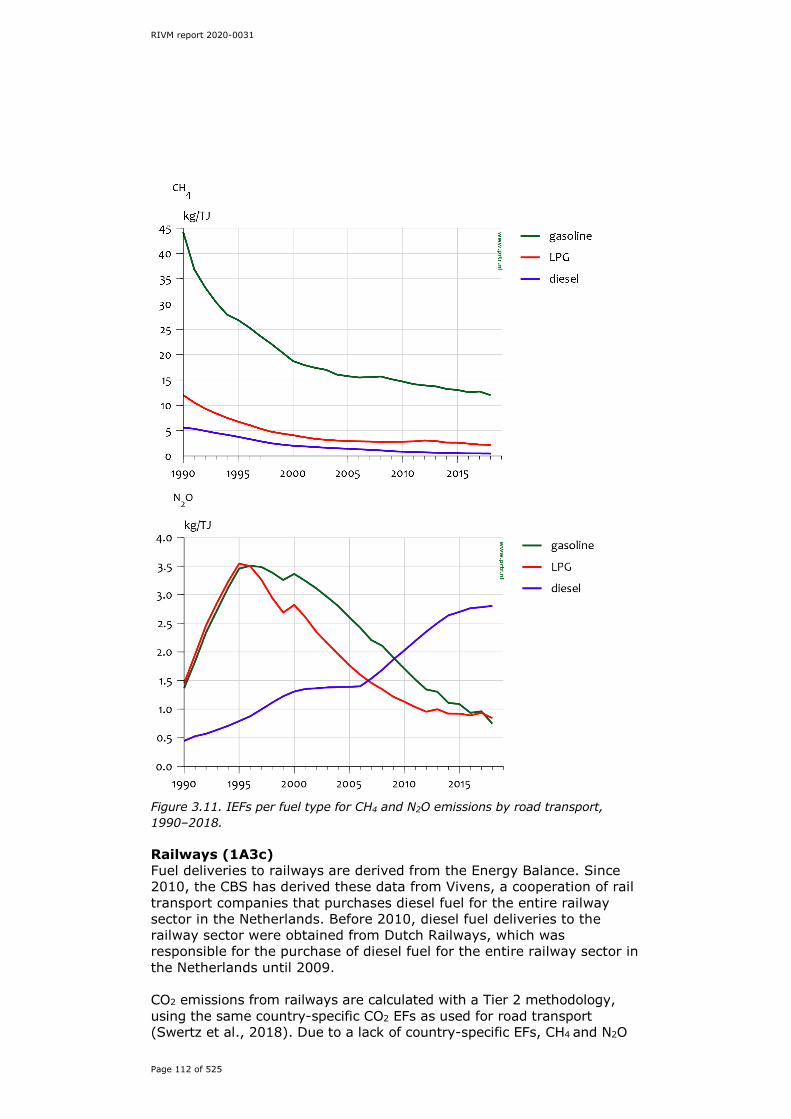
RIVM report 2020-0031
Page 112 of 525
Figure 3.11. IEFs per fuel type for CH4 and N2O emissions by road transport, 1990–2018. Railways (1A3c) Fuel deliveries to railways are derived from the Energy Balance. Since 2010, the CBS has derived these data from Vivens, a cooperation of rail transport companies that purchases diesel fuel for the entire railway sector in the Netherlands. Before 2010, diesel fuel deliveries to the railway sector were obtained from Dutch Railways, which was responsible for the purchase of diesel fuel for the entire railway sector in the Netherlands until 2009. CO2 emissions from railways are calculated with a Tier 2 methodology, using the same country-specific CO2 EFs as used for road transport (Swertz et al., 2018). Due to a lack of country-specific EFs, CH4 and N2O

RIVM report 2020-0031
Page 113 of 525
emissions for railways are estimated using a Tier 1 methodology, employing EFs derived from the 2016 EEA Emission Inventory Guidebook. Waterborne navigation (1A3d) Diesel fuel consumption for domestic inland navigation is derived from the Energy Balance. Gasoline consumption for recreational craft is not reported separately in the Energy Balance, but is included under Road transport. In order to calculate GHG emissions from gasoline consumption by recreational craft, fuel consumption is estimated annually using a bottom-up approach derived from Deltares & TNO (2016). Gasoline sales data for road transport, as derived from the Energy Balance, are corrected accordingly (as shown in Table 2.1 of Geilenkirchen et al. (2020)). The fuel consumption from the Energy Balance is apportioned between international bunkers and inland navigation as follows: Each fuel supplier has to report its total fuel sales to the CBS, and subsequently fills in a survey. In this survey, the fuel supplier indicates to which type(s) of shipping (inland navigation, fisheries, international shipping, etc.) its fuels are delivered. Within inland navigation, the distinction between domestic inland navigation (included in 1A3d) and international inland navigation (included in 1D International bunker fuels) is uncertain. Based on the survey and expert judgement by the CBS, the fuel sales of each fuel supplier for inland navigation are attributed to either national or international navigation. This methodology is used consistently throughout the time series. A Tier 2 methodology is used to calculate CO2 emissions from domestic waterborne navigation, using country-specific CO2 EFs, while a Tier 1 method is used for CH4 and N2O emissions. A description of the country-specific EFs for CO2 and CH4 and N2O EFs that are used and underlying methodology is provided in Geilenkirchen et al. (2020); the EFs are included in Table 2.2. Other transportation (1A3e) The methodology used for calculating emissions from other transportation is described in Section 3.3.
3.2.6.3 Uncertainty and time series consistency Uncertainty estimates for the activity data and IEFs used for calculating transport emissions are presented in Table 2.6 of Geilenkirchen et al. (2020), which also shows the sources used to estimate uncertainties. Table 3.14 summarises the uncertainties for activity data and EFs per source category, fuel type and gas. The estimations of uncertainties in activity data are all derived from the CBS. The uncertainty estimates for N2O and CH4 for civil aviation, railways and waterborne navigation are IPCC defaults. The uncertainties in EFs for road transport and CO2 EFs for other source categories are based on expert judgements, which were determined in workshops. Information on uncertainties will be reviewed and, if necessary, the uncertainty analysis of the NIR 2021will be updated accordingly.
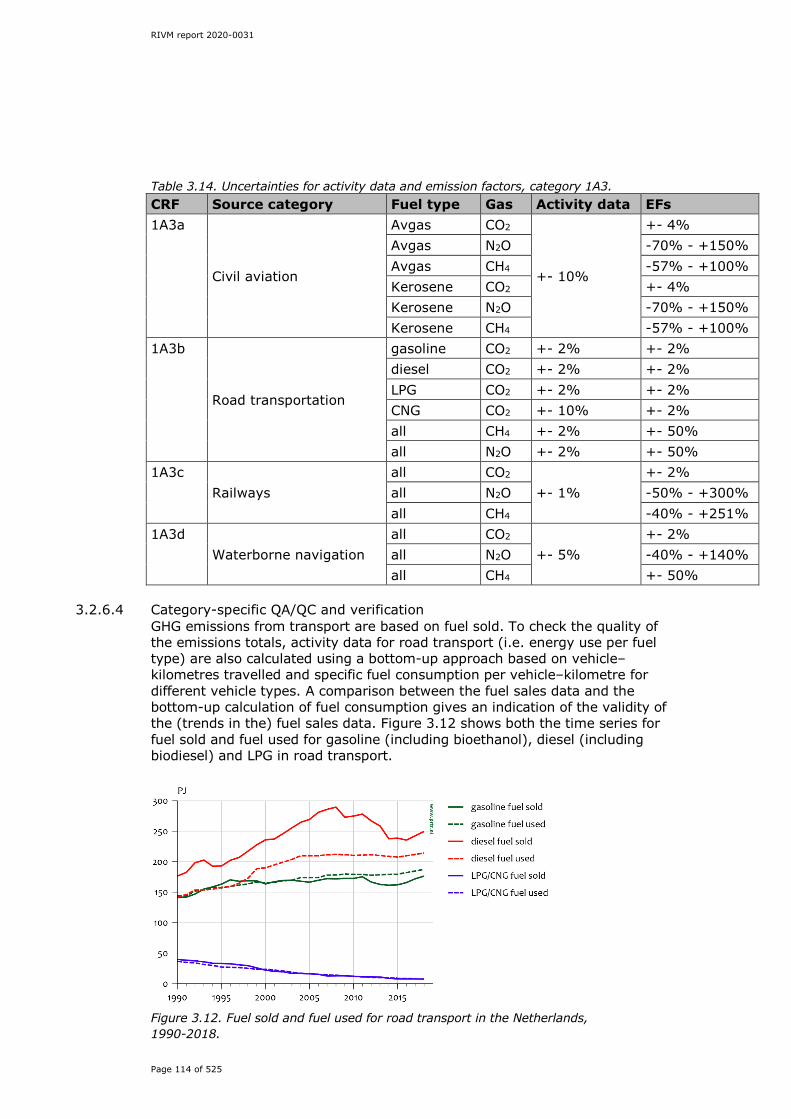
RIVM report 2020-0031
Page 114 of 525
Table 3.14. Uncertainties for activity data and emission factors, category 1A3. CRF Source category Fuel type Gas Activity data EFs 1A3a
Civil aviation
Avgas CO2
+- 10%
+- 4% Avgas N2O -70% - +150% Avgas CH4 -57% - +100% Kerosene CO2 +- 4% Kerosene N2O -70% - +150% Kerosene CH4 -57% - +100% 1A3b
Road transportation
gasoline CO2 +- 2% +- 2% diesel CO2 +- 2% +- 2% LPG CO2 +- 2% +- 2% CNG CO2 +- 10% +- 2% all CH4 +- 2% +- 50% all N2O +- 2% +- 50% 1A3c
Railways all CO2
+- 1% +- 2%
all N2O -50% - +300% all CH4 -40% - +251% 1A3d
Waterborne navigation all CO2
+- 5%
+- 2% all N2O -40% - +140% all CH4 +- 50%
3.2.6.4 Category-specific QA/QC and verification GHG emissions from transport are based on fuel sold. To check the quality of the emissions totals, activity data for road transport (i.e. energy use per fuel type) are also calculated using a bottom-up approach based on vehicle–kilometres travelled and specific fuel consumption per vehicle–kilometre for different vehicle types. A comparison between the fuel sales data and the bottom-up calculation of fuel consumption gives an indication of the validity of the (trends in the) fuel sales data. Figure 3.12 shows both the time series for fuel sold and fuel used for gasoline (including bioethanol), diesel (including biodiesel) and LPG in road transport.
Figure 3.12. Fuel sold and fuel used for road transport in the Netherlands, 1990-2018.

RIVM report 2020-0031
Page 115 of 525
The bottom-up calculation of gasoline consumption in road transport closely corresponds with the (adjusted) sales data from the Energy Balance for the 1990–2011 period; differences between the two figures are small throughout the time series. As of 2011, fuel sold had decreased compared with fuel used, due to an increase in cross-border refuelling, as described in Section 3.2.6.1. The difference between fuel used and fuel sold has, however, become smaller in recent years. The time series fuel sold and fuel consumed show good correspondence for LPG and -to a less extent- gasoline, over the entire time series, as can be seen in Figure 3.12. However, the time series for diesel deviate. Although the trend is comparable for the most part, diesel sales are substantially higher than diesel consumption on Dutch territory throughout the time series. Differences vary between 12% and 37%. In recent years the difference between fuel used and fuel sold has, however, become smaller than in previous years. The difference between the two time series for diesel can partly be explained by the use of diesel in long-haul distribution trucks, which can travel several thousand kilometres on a full tank. Diesel fuel sold to long-haul trucks in the Netherlands is mostly consumed abroad and is therefore not included in the diesel consumption on Dutch territory. Although this omission is partially offset by the consumption by trucks that travel in the Netherlands but do not refuel here, it is expected that the impact of Dutch long-haul trucks refuelling in the Netherlands is dominant given the small size of the country. In order to validate the activity data for railways and waterborne navigation, as derived from the Energy Balance, the trends in fuel sales data for both source categories are compared with trends in transport volumes. Trends in energy use for waterborne navigation show rather close correspondence with trends in transport volumes, although this does not necessarily hold true for trends in domestic inland navigation. This would suggest that the growth in transport volumes mostly relates to international transport. For railways, the correspondence between diesel deliveries and freight transport volumes is weak. This can be explained by the electrification of rail freight transport, as described above. Figures compiled by Rail Cargo (2007, 2013) show that in 2007 only 10% of all locomotives used in the Netherlands were electric, whereas by 2012 the proportion of electric locomotives had increased to over 40%. For this reason, there has been a decoupling of transport volumes and diesel deliveries in recent years in the time series. Consequently, the decline in diesel consumption for railways, as derived from the Energy Balance, is deemed plausible. VITO (2019) performed a peer review of the GHG emissions for transport reported in the 2019 inventory report. The methodology used for calculating the GHG emissions for transport in the Netherlands was ‘deemed suitable as input for the CRF and NFR reporting’ (VITO, 2019). The main grounds for this conclusion were that a fuel-based methodology was applied, a subsector methodology, based on detailed and well documented assumptions, was adopted, and a Tier 3 methodology was implemented when input data were available at the required level of detail.

RIVM report 2020-0031
Page 116 of 525
For road transport, the methodology used was deemed appropriate, well documented and scientifically underpinned. VITO recommended also calculating emissions by means of the EEA methodology and comparing the results to identify possible lacunae or points for improvement. Applying the EEA methodology only makes sense, however, for N2O and CH4. Since the EFs used for these substances mostly stem from or are in line with the EEA Emission Inventory Guidebook, it was deemed unnecessary to apply the EEA methodology for road transport. For railways, VITO acknowledged that, due to the lack of detailed data on the fleet and activity data, a bottom-up approach could not be implemented at the current time. VITO did, however, recommend further investigation of a more detailed approach. Following this recommendation, CE Delft was commissioned to perform a study on available data for calculating emissions from railways in the Netherlands. The results will be available in time for next year’s inventory report. For NRMM, civil aviation, inland navigation, maritime navigation, fisheries and military activities, VITO deemed the applied methodologies appropriate for the intended purpose of reporting GHG emissions. No recommendations were made for further improvements.
3.2.6.5 Category-specific recalculations Minor changes (<0.5%) were made in the activity data for road transport, railways and inland navigation. New data were derived from the Energy Balance. GHG emissions changed accordingly. Fossil carbon in biofuels In this year’s inventory the activity data and resulting GHG emissions from biofuels in transport were recalculated to take into account that part of the carbon in certain types of biofuels has a fossil origin and as such should be reported as fossil fuel. The methodology used for this recalculation is as follows:
1. Deriving the total amount of biogasoline and biodiesel used for transport in the Netherlands from the Energy Balance, as reported annually by the CBS.
2. Determining the share of different types of biogasoline and biodiesel used in the Dutch market, as reported annually by the Dutch Emission Authority (NEa, 2019).
3. Applying the fossil fraction of the carbon content per type of biofuel as provided by Sempos (2018).
Table 3.15 shows the input for steps 2 and 3, i.e. the shares of different types of biofuels in total biogasoline and biodiesel use for transport in the 2011–2018 period, as reported by NEa (2019), and the fossil part of the carbon content per fuel type.
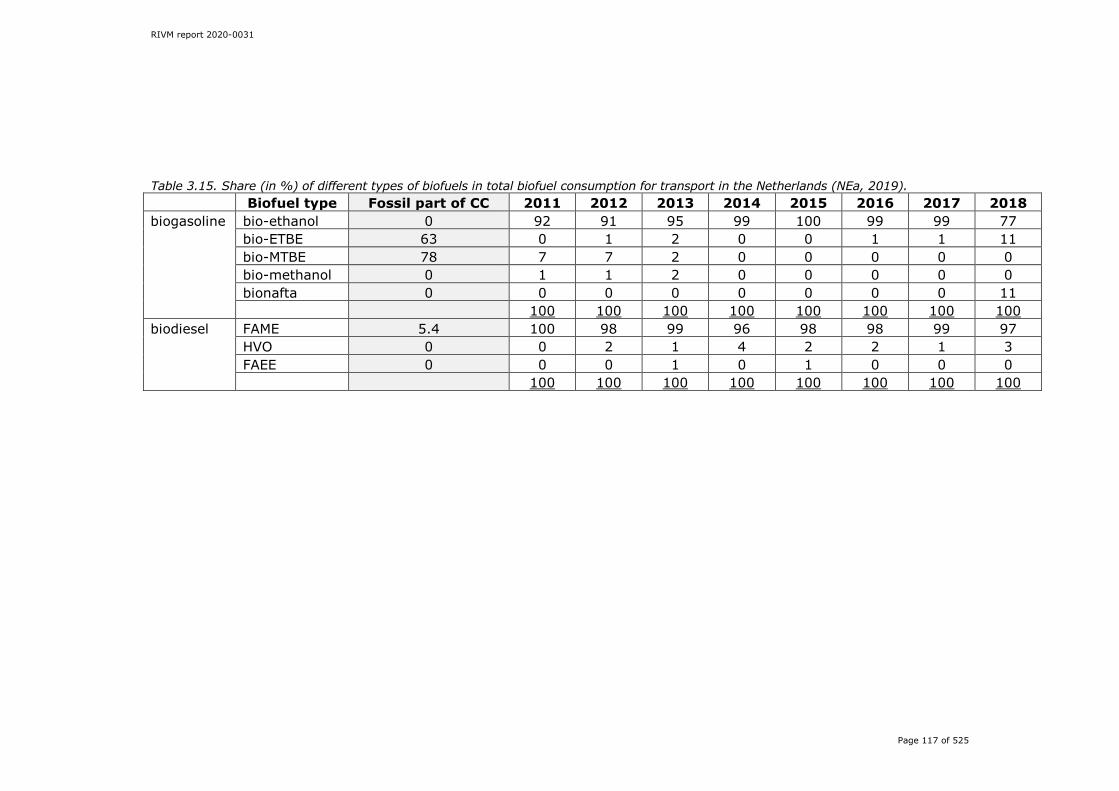
RIVM report 2020-0031
Page 117 of 525
Table 3.15. Share (in %) of different types of biofuels in total biofuel consumption for transport in the Netherlands (NEa, 2019). Biofuel type Fossil part of CC 2011 2012 2013 2014 2015 2016 2017 2018 biogasoline bio-ethanol 0 92 91 95 99 100 99 99 77
bio-ETBE 63 0 1 2 0 0 1 1 11 bio-MTBE 78 7 7 2 0 0 0 0 0 bio-methanol 0 1 1 2 0 0 0 0 0 bionafta 0 0 0 0 0 0 0 0 11
100 100 100 100 100 100 100 100 biodiesel FAME 5.4 100 98 99 96 98 98 99 97
HVO 0 0 2 1 4 2 2 1 3 FAEE 0 0 0 1 0 1 0 0 0
100 100 100 100 100 100 100 100
RIVM report 2020-0031
Pagina 118 van 525
For biogasoline, no adjustments were made to the activity data from the Energy Balance, as the CBS already takes into account that part of bio-ETBE and bio-MTBE has a fossil origin and adjusts its data accordingly. The fossil fractions used by the CBS were derived from Annex III of the EU Renewable Energy Directive (RED) (2009/28/EC). These fractions, as shown in Table 3.15, differ slightly from those provided by Sempos (2018). Sempos assumes a fossil fraction of 66.7% for bio-ETBE (compared with 63% according to the RED) and 80.0% for bio-MTBE (compared with 78% according to the RED). Given the small difference between the two sources and the small share of bio-ETBE and bio-MTBE in total use of biogasoline for transport in the Netherlands (as shown in Table 3.15), no adjustments were made in the activity data for biogasoline as derived from the Energy Balance. Biodiesel for transport in the Netherlands mostly (97–100%) consists of FAME. For the 2003–2010 period, all biodiesel used for transport was assumed to be FAME. To determine the fossil part of FAME, the default value of 5.4% as provided by Sempos (2018) was applied. The activity data from the Energy Balance were adjusted accordingly. Thus, 5.4% of FAME is assumed to be of fossil origin. This is reported separately in the CRF under Other fossil fuels for source categories 1A3b, 1A3c, 1A4aii and 1A4cii, as biodiesel is used in road transport, rail transport and non-road mobile machinery. For source category 1A2gvii the CRF does not include ‘other fossil fuels’. Therefore, the activity data and GHG emissions from the fossil part of biodiesel were included under Liquid fuels for this source category. The resulting amount of FAME with a fossil origin increases from 7 TJ in 2003 to 827 TJ in 2018 (corresponding to 0.6 kt of CO2 in 2003 and 64 kt of CO2 in 2018), which is now reported as fossil CO2 and as such is included in the national emission totals. Bottom-up calculation of fuel used emissions There was a change in methodology for the calculation of fuel used emissions for road transport. As of 2020, fuel used emissions for road transport are calculated using a bottom-up method that takes vehicle–kilometres per vehicle (based on licence plate numbers) as a starting point. Using this methodology, we can calculate emissions per vehicle class much more precisely. Data were available for reference years 2012, 2015 and 2018 and will be available for every year onwards. For years between 2012 and 2018, an interpolation was made of vehicle class distributions using national vehicle–kilometre totals per vehicle category. The same applies for 2005–2012. A more detailed description of the bottom-up methodology is presented in Geilenkirchen et al. (2020). This methodology change does not have consequences for emission totals, as they are based on fuel sales data, which are derived from national energy statistics. However, the distribution of fuel sales between vehicle categories is based on fuel used emissions. This has been adjusted according to the new calculations. This mainly results in a shift of CO2 emissions from light-duty trucks (-12% in 2017) to heavy-duty trucks (+8% in 2017).

RIVM report 2020-0031
Page 119 of 525
3.2.6.6 Category-specific planned improvements Following the recommendations from the peer review by VITO (2019), a study was commissioned from CE Delft to investigate potential improvements in the calculation of GHG emissions from railways. Results are expected in 2020.
3.2.7 Other sectors (1A4) 3.2.7.1 Source category description
Table 3.16 shows the subcategories under sector 1A4, as well as the key categories. Sub-category 1A4a (Commercial and institutional services) comprises commercial and public services such as banks, schools and hospitals, and services related to trade (including retail) and communications; it also includes emissions from the production of drinking water and miscellaneous combustion emissions from waste handling activities and from wastewater treatment plants (WWTPs) and emissions from NRMM used in trade. Table 3.16. Overview of emissions in the Other sectors (1A4) in the base year and the last two years of the inventory (in Tg CO2 eq.).
Sector/category Gas Key 1990 2017 2018 2018 vs
1990 Contribution to total
in 2018 (%) by
Emissions in Tg CO2 eq % sector total gas
total CO2 eq
1A4. Other sectors CO2 38.9 33.1 32.5 -16.3% 21.0% 20.3% 17.3% CH4 0.6 1.4 1.4 139.5% 0.9% 7.9% 0.7% N2O non key 0.0 0.0 0.0 0.5% 0.0% 0.0% 0.0% All 39.5 34.5 34.0 -14.0% 21.9% 18.0% 1A4a. Commercial/Institutional CO2 8.3 7.7 7.5 -9.9% 4.8% 4.7% 4.0% CH4 non key 0.0 0.0 0.0 4.8% 0.0% 0.3% 0.0%
1A4a Natural gas CO2 L.T 7.8 7.3 7.1 -8.4% 4.6% 4.4% 3.8% 1A4b. Residential CO2 20.7 16.5 16.4 -20.9% 10.6% 10.2% 8.7% CH4 L 0.5 0.4 0.4 -8.5% 0.3% 0.3% 0.2%
1A4b Natural gas CO2 L.T 19.9 16.3 16.2 -18.5% 10.4% 10.1% 8.6% 1A4c. Agriculture/Forestry/ Fisheries CO2 9.8 8.8 8.7 -11.8% 5.6% 5.4% 4.6% CH4 L.T 0.1 0.9 0.9 1142.1% 0.6% 0.6% 0.5%
1A4c liquids CO2 L.T 2.5 1.6 1.6 -36.9% 1.0% 1.0% 0.8% 1A4c Natural gas CO2 L.T 7.3 7.2 7.1 -3.2% 4.6% 4.4% 3.8%
Sub-category 1A4b (Residential) relates to fuel consumption by households for space heating, water heating and cooking. Space heating uses about three-quarters of the Netherlands’ total consumption of natural gas. The residential sub-category also includes emissions from NRMM used by households.
Editor
Corrections as above.
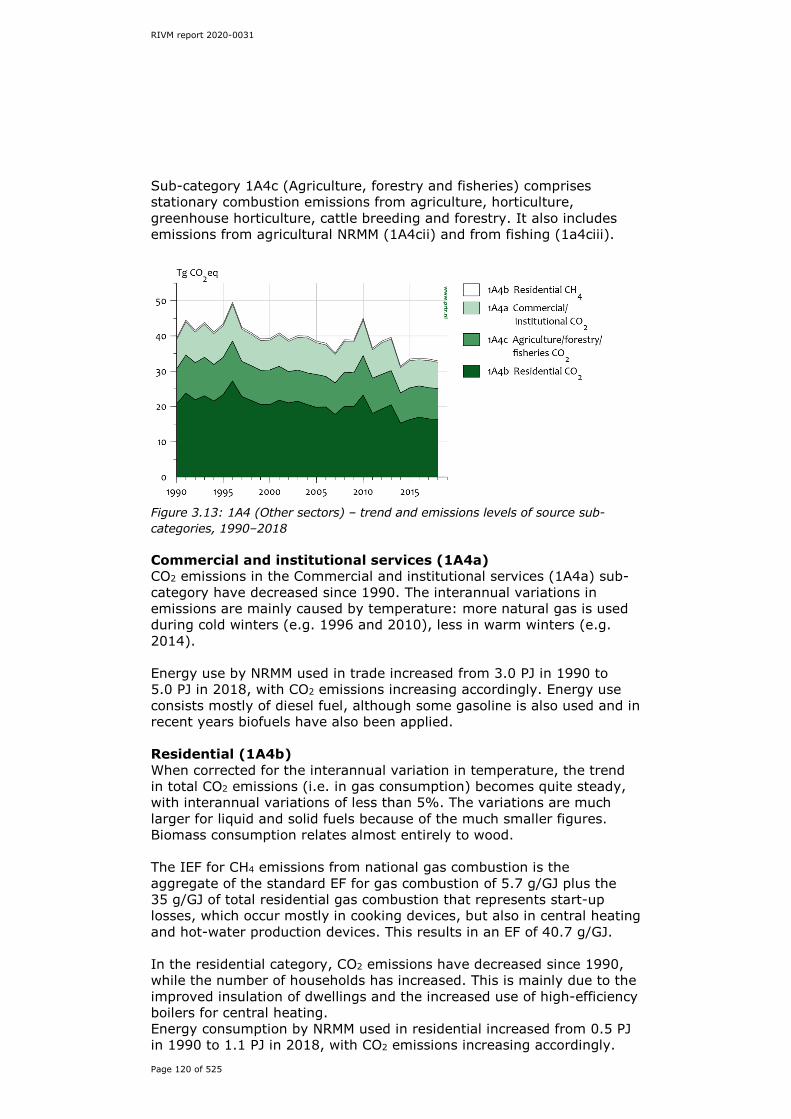
RIVM report 2020-0031
Page 120 of 525
Sub-category 1A4c (Agriculture, forestry and fisheries) comprises stationary combustion emissions from agriculture, horticulture, greenhouse horticulture, cattle breeding and forestry. It also includes emissions from agricultural NRMM (1A4cii) and from fishing (1a4ciii).
Figure 3.13: 1A4 (Other sectors) – trend and emissions levels of source sub-categories, 1990–2018 Commercial and institutional services (1A4a) CO2 emissions in the Commercial and institutional services (1A4a) sub-category have decreased since 1990. The interannual variations in emissions are mainly caused by temperature: more natural gas is used during cold winters (e.g. 1996 and 2010), less in warm winters (e.g. 2014). Energy use by NRMM used in trade increased from 3.0 PJ in 1990 to 5.0 PJ in 2018, with CO2 emissions increasing accordingly. Energy use consists mostly of diesel fuel, although some gasoline is also used and in recent years biofuels have also been applied. Residential (1A4b) When corrected for the interannual variation in temperature, the trend in total CO2 emissions (i.e. in gas consumption) becomes quite steady, with interannual variations of less than 5%. The variations are much larger for liquid and solid fuels because of the much smaller figures. Biomass consumption relates almost entirely to wood. The IEF for CH4 emissions from national gas combustion is the aggregate of the standard EF for gas combustion of 5.7 g/GJ plus the 35 g/GJ of total residential gas combustion that represents start-up losses, which occur mostly in cooking devices, but also in central heating and hot-water production devices. This results in an EF of 40.7 g/GJ. In the residential category, CO2 emissions have decreased since 1990, while the number of households has increased. This is mainly due to the improved insulation of dwellings and the increased use of high-efficiency boilers for central heating. Energy consumption by NRMM used in residential increased from 0.5 PJ in 1990 to 1.1 PJ in 2018, with CO2 emissions increasing accordingly.
RIVM report 2020-0031
Page 121 of 525
Energy use consists mostly of diesel fuel, although some gasoline is also used and in recent years biofuels have also been applied. Agriculture, forestry and fisheries (1A4c) Most of the energy in this source sub-category is used for space heating and water heating, although some is used for cooling. The major fuel used in the sub-category is natural gas. Almost no solid fuels are used in this sub-category. NRMM used in agriculture mostly uses diesel oil, although some biofuel and gasoline is used as well. Fishing mostly uses diesel oil, combined with some residual fuel oil. Total CO2 emissions in the Agriculture, forestry and fisheries sub-category have decreased since 1990, mainly due to a decrease in gas consumption for stationary combustion as a result of various energy conservation measures (e.g. in greenhouse horticulture: the surface area of heated greenhouses has increased but their energy consumption has been reduced). Part of the CO2 emissions from the agricultural sector consists of emissions from cogeneration facilities, which may also provide electricity to the national grid. It should also be noted that the increased use of internal combustion engines in CHP plants operating on natural gas has increased the IEF for methane in this category, as these engines are characterised by high methane emissions. In addition, since the autumn of 2005, CO2 emissions from two plants have been used for crop fertilisation in greenhouse horticulture, thereby reducing the net CO2 emissions generated by CHP facilities. Total annual amounts are approximately 0.4 Tg CO2. GHG emissions from agricultural NRMM (1A4cii) have been constant throughout the time series at between 1.0 and 1.2 Tg CO2 eq. GHG emissions from fisheries have significantly decreased, from 1.3 Tg in 2000 to 0.5 Tg in 2018. This has been caused by a decrease in the number of fishing vessels in the Netherlands since 1990, along with a decrease in their engine power.
3.2.7.2 Methodological issues Details of methodologies, data sources and country-specific source allocation issues are provided in:
• Honig et al. (2020), paragraph 2.1: Stationary combustion; • Visschedijk et al. (2020), chapters 21 and 25: Residential wood
combustion and charcoal use; • Klein et al. (2019), chapter 9: Non-road mobile machinery.
This section provides a brief description of the methodology applied for 1A4c. Stationary combustion The emissions from this source category are estimated by multiplying fuel-use statistics by IPCC default and country-specific EFs (Tier 1 and Tier 2 method for CO2 and CH4 and Tier 1 method for N2O).

RIVM report 2020-0031
Page 122 of 525
Activity data The activity data used in this sector are mainly derived from energy statistics from the CBS. For the following emission sources, other activity data are used:
• The activity data for charcoal consumption in barbecues are based on energy statistics from the CBS, and corrected for annual meat consumption.
• Fuel consumption by off-road agricultural machinery is derived from the EMMA model (Hulskotte and Verbeek, 2009). This model is based on sales data for different types of mobile machinery and assumptions made about average use (hours per year) and fuel consumption (kilograms per hour) for different machine types.
• The consumption of diesel oil and heavy fuel oil by fisheries is derived from the Energy Balance.
• The activity data for residential wood combustion are based on surveys by the CBS (every 6 years), and the results of these surveys are used to prepare a complete time series. See Visschedijk et al. (2020) for more details on these wood combustion statistics.
Emission factors For stationary combustion, the following EFs are used: For CO2, IPCC default EFs are used (see Annex 5) for all fuels except natural gas, gas/diesel oil, LPG and gaseous biomass, for which country-specific EFs are used. The Netherlands’ list of fuels (Zijlema, 2020) indicates whether the EFs are country-specific or IPCC default values. For CH4, country-specific EFs are used for all fuels except solid biomass and charcoal, and diesel in the fisheries sector. For natural gas in gas engines, a different EF is used (see Honig et al., 2020). The CH4 country-specific EF for residential gas combustion includes start-up losses, a factor mostly neglected by other countries. For N2O, IPCC default EFs are used. Mobile combustion
• Emissions from fisheries (1A4c iii) are calculated on the basis of IPCC Tier 2 methodologies. Fuel-use data are combined with country-specific EFs for CO2. CH4 and N2O emissions from fisheries are derived using a Tier 1 methodology. The EFs are shown in Table 2.2B of Klein et al. (2019).
• Fuel consumption by NRMM is derived from the Energy Balance, which in turn uses the output of the EMMA model (Hulskotte and Verbeek, 2009). CO2 emissions from NRMM are estimated using a Tier 2 methodology. Country-specific heating values and CO2 EFs are used, as for road transport. CH4 and N2O emissions from NRMM are estimated using a Tier 3 methodology, using country-specific EFs derived from the EMMA model. CH4 EFs are presented in Table 2.2C of Klein et al. (2019).

RIVM report 2020-0031
Page 123 of 525
Table 3.17. Overview of methods used for calculation of emissions for NRMM and fisheries. CRF code Source category description Method EF 1A2gii Industry and construction T2, T3 CS 1A4aii Commercial/institutional T2, T3 CS 1A4bii Residential T2, T3 CS 1A4cii Agriculture/Forestry T2, T3 CS 1A4aiii National Fishing T1, T2 CS, D
CS: Country specific, D: Default General For 2018, 99% of the CO2 emissions in 1A4 were calculated using country-specific EFs (mainly natural gas). The remaining 1% of CO2 emissions were calculated with default IPCC EFs. These mainly consist of emissions from residual fuel oil, other kerosene and lignite. An overview of the IEFs used for the most important fuels (up to 95% of the fuel use) in the other sectors (category 1A4) is provided in Table 3.18. Table 3.18. Overview of IEFs used (for the year 2018) in Other sectors (1A4).
Fuel Amount of fuel used in 2018 (TJ NCV)
IEFs (g/GJ) CO2 (x 1000) N2O CH4
Natural gas 537,282 56.6 0.1 89.4 Gas / Diesel oil 24,747 72.5 0.9 2.5 Solid biomass 21,634 111.4 4.0 300.0
Explanations of the IEFs The standard CH4 EF for natural gas is 5.7 g/GJ. Only for gas engines is a higher EF used (due to gas slip), which explains the higher EF for this sector. Gas/Diesel oil is used in stationary and mobile combustion, for which different EFs for CH4 and N2O are used. The implied CO2 EF for solid biomass consist of a combination of wood combustion with an EF of 112 kg/GJ and solid biomass combustion with an EF of 109.6 kg/GJ. Trends in the IEF for most sectors can be explained by the composition of fuels used in that sector. The largest fluctuations are visible in the CH4 EF of gaseous fuels. This is caused by the difference in CH4 EF that is used for natural gas combusted in gas engines (varying between 250 and 450 g/GJ) and the CH4 EF that is used for natural gas combusted in other plants (5.7 g/GJ). Figure 3.14 shows the trend in natural gas combusted in gas engines and in other plants, as well as the trend in the IEF.

RIVM report 2020-0031
Page 124 of 525
Figure 3.14. Trend in natural gas consumption in gas engines (with a relatively high emission factor) and other engines (with a relatively low emission factor) in the agricultural sector compared with the implied CH4 emission factor from natural gas combustion in the agricultural sector, 1990–2018.
3.2.7.3 Uncertainty and time series consistency Uncertainty The uncertainty in total CO2 emissions from this source category is approximately 5%, with uncertainty concerning the composite parts of approximately 5% for the Residential category, 10% for the Agriculture category and 10% for the Services category (see Annex 2 for more details). The uncertainty in the gas consumption data is similarly estimated at 5% for the Residential category, 10% for Agriculture and 10% for the Services category. An uncertainty of 20% is assumed for liquid fuel use for the Services category. Since the uncertainty in small figures in national statistics is generally greater than it is with large figures, as indicated by the high interannual variability of the data, the uncertainty in solid fuel consumption is estimated to be even higher, i.e. 50%. However, the uncertainty in the fuel statistics for the total of Other sectors is somewhat smaller than the uncertainty in the data for the underlying sub-sectors: consumption per fuel type is defined as the remainder of total national supply after subtraction of the amount used in Energy, Industry and Transport. Consequently, energy consumption by the Residential and Agricultural sub-categories is estimated separately using a trend analysis of sectoral data (‘HOME’ survey of the Residential category and Wageningen Economic Research data for Agriculture). For natural gas, the uncertainty in the CO2 EF is estimated at 0.25%, on the basis of the fuel quality analysis reported by Heslinga and Van Harmelen (2006) and further discussed in Olivier et al. (2009). For the CO2 EFs for liquids and solids, uncertainties of 2% and 10%,

RIVM report 2020-0031
Page 125 of 525
respectively, have been assigned. The uncertainty in the CH4 and N2O EFs is estimated to be much higher (about 50%). Since most of the fuel consumption in this source category is for space heating, consumption has varied considerably across the years due to variations in winter temperatures. For trend analysis, a method is used to correct the CO2 emissions from gas combustion (the main fuel for heating purposes) for the varying winter temperatures. This involves the use of the number of ‘heating degree days’ under normal climate conditions, which is determined by the long-term trend, as explained in Visser (2005). The uncertainty in activity data for NRMM is estimated to be 2% for gasoline and diesel and 5% for LPG, as reported in Klein et al. (2019). The uncertainty in the EFs is estimated to be 2% for CO2 (all fuels): 50%/+300% for N2O and -40%/+250% for CH4. The CO2 estimate was assumed to be equal to the estimate for road transport fuels, which in turn was based on expert judgement. The estimates for CH4 and N2O were derived from the 2006 IPCC Guidelines. Time series consistency Emissions from stationary energy combustion are calculated from the energy statistics, combined with country-specific EFs (at the beginning of the time series) or a combination of company-specific and country-specific EFs (at the end of the time series). Time series consistency is ensured for EFs and activity data:
• The country-specific EFs are based on company-specific data. Company-specific data from the most relevant companies in a few years have been used to calculate an average country-specific EF. As the same information is used to calculate both the country-specific EF and the company-specific EFs, the EFs are consistent for the complete time series.
• Energy statistics are consistent for the complete time series, as these are derived from the same data source (CBS).
3.2.7.4 Category-specific QA/QC and verification
Trends in CO2 emissions from the three sub-categories were compared with trends in related activity data: number of households, number of people employed in the services sector and area of heated greenhouses. Large annual changes were identified and explanations were sought (e.g. interannual changes in CO2 emissions by calculating temperature-corrected trends to identify the anthropogenic emissions trends). The trend tables for the IEFs were then used to identify large changes and large interannual variations at the category level, for which explanations were sought and included in the NIR. More details on the validation of the energy data can be found in Honig et al. (2020).
3.2.7.5 Category-specific recalculations The energy statistics for 2017 have been improved (minor corrections). This results in the following changes in CO2 emissions (in Gg CO2):
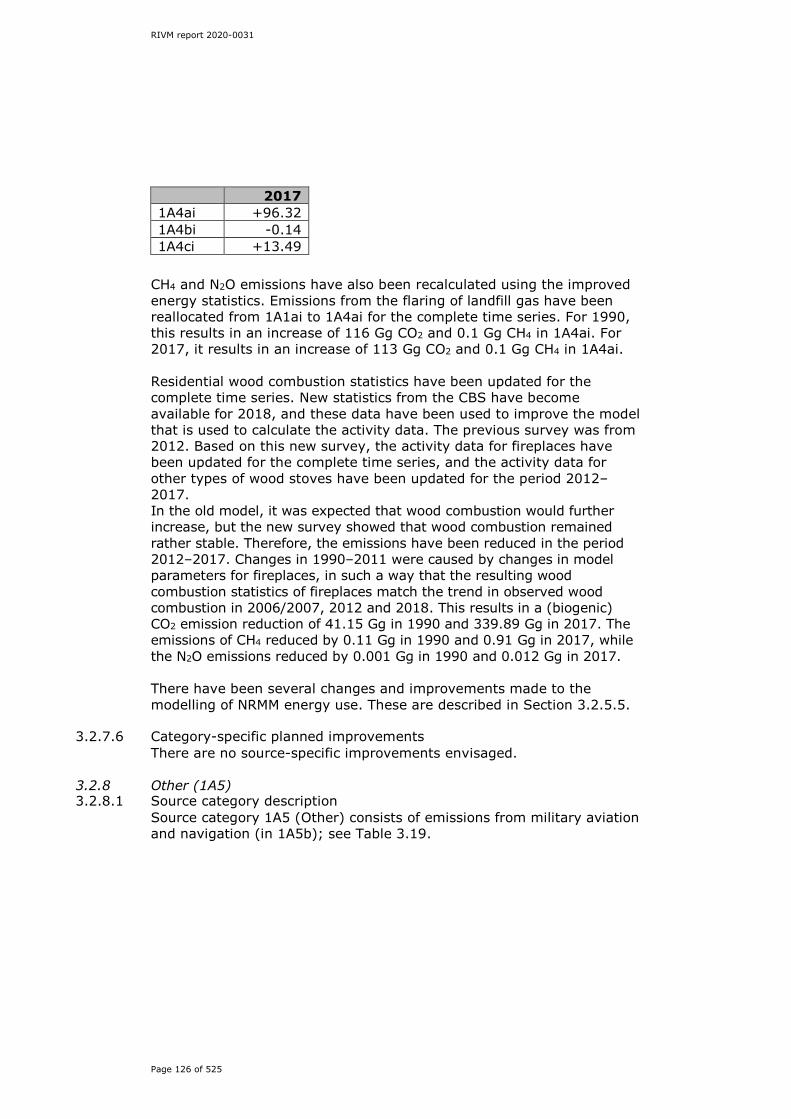
RIVM report 2020-0031
Page 126 of 525
CH4 and N2O emissions have also been recalculated using the improved energy statistics. Emissions from the flaring of landfill gas have been reallocated from 1A1ai to 1A4ai for the complete time series. For 1990, this results in an increase of 116 Gg CO2 and 0.1 Gg CH4 in 1A4ai. For 2017, it results in an increase of 113 Gg CO2 and 0.1 Gg CH4 in 1A4ai. Residential wood combustion statistics have been updated for the complete time series. New statistics from the CBS have become available for 2018, and these data have been used to improve the model that is used to calculate the activity data. The previous survey was from 2012. Based on this new survey, the activity data for fireplaces have been updated for the complete time series, and the activity data for other types of wood stoves have been updated for the period 2012–2017. In the old model, it was expected that wood combustion would further increase, but the new survey showed that wood combustion remained rather stable. Therefore, the emissions have been reduced in the period 2012–2017. Changes in 1990–2011 were caused by changes in model parameters for fireplaces, in such a way that the resulting wood combustion statistics of fireplaces match the trend in observed wood combustion in 2006/2007, 2012 and 2018. This results in a (biogenic) CO2 emission reduction of 41.15 Gg in 1990 and 339.89 Gg in 2017. The emissions of CH4 reduced by 0.11 Gg in 1990 and 0.91 Gg in 2017, while the N2O emissions reduced by 0.001 Gg in 1990 and 0.012 Gg in 2017. There have been several changes and improvements made to the modelling of NRMM energy use. These are described in Section 3.2.5.5.
3.2.7.6 Category-specific planned improvements There are no source-specific improvements envisaged.
3.2.8 Other (1A5) 3.2.8.1 Source category description
Source category 1A5 (Other) consists of emissions from military aviation and navigation (in 1A5b); see Table 3.19.
2017 1A4ai +96.32 1A4bi -0.14 1A4ci +13.49

RIVM report 2020-0031
Page 127 of 525
Table 3.19. Overview of emissions in the sector Other (1A5) in the base year and the last two years of the inventory (in Tg CO2 equivalents).
Sector/category Gas Key 1990 2017 2018
2018 vs
1990 Contribution to total in
2018 (%) by
Emissions in Tg CO2 eq % sector total gas total
CO2 eq 1A5 Other CO2 non key 0.3 0.1 0.2 -51.7% 0.1% 0.1% 0.1% CH4 non key 0.0 0.0 0.0 -58.8% 0.0% 0.0% 0.0% N2O non key 0.0 0.0 0.0 -58.1% 0.0% 0.0% 0.0% All 0.3 0.2 0.2 -51.8% 0.1% 0.1%
3.2.8.2 Methodological issues
A country-specific top-down (Tier 2) method is used for calculating the emissions from fuel combustion from military aviation and navigation. Activity data for both aviation and navigation are derived from the Energy Balance, and include all fuel delivered for military aviation and navigation purposes within the Netherlands, including fuel deliveries to militaries of other countries. The EFs are presented in Table 3.20. The CO2 EFs were derived from the Ministry of Defence, whereas the EFs for N2O and CH4 were derived from Hulskotte (2004). Table 3.20. Emission factors used for military marine and aviation activities. Category CO2 CH4 N2O Military ships EF (g/GJ) 75,250 2.64 1.87 Military aviation
EF (g/GJ) 72,900 10.00 5.80
Total Emissions in 2018 (Gg)
152 0.01 0.01
Source: Hulskotte (2004).
3.2.8.3 Uncertainty and time series consistency The uncertainty in total CO2 emissions from this source category is approximately 20%, mainly determined by uncertainty in the activity data. Uncertainties for CH4 and N2O emissions from this category are substantially higher: up to around 80% in the EF for N2O.
3.2.8.4 Category-specific QA/QC and verification The source category is covered by the general QA/QC procedures, which are discussed in Chapter 1.
3.2.8.5 Category-specific recalculations No recalculations have been made.
3.2.8.6 Category-specific planned improvements No improvements are planned.
3.3 Fugitive emissions from fuels (1B) This source category includes fuel-related emissions from non-combustion activities in the energy production and transformation industries and comprises two categories:
• 1B1 Solid fuels (coke manufacture);
Editor
Corrections to table as above.
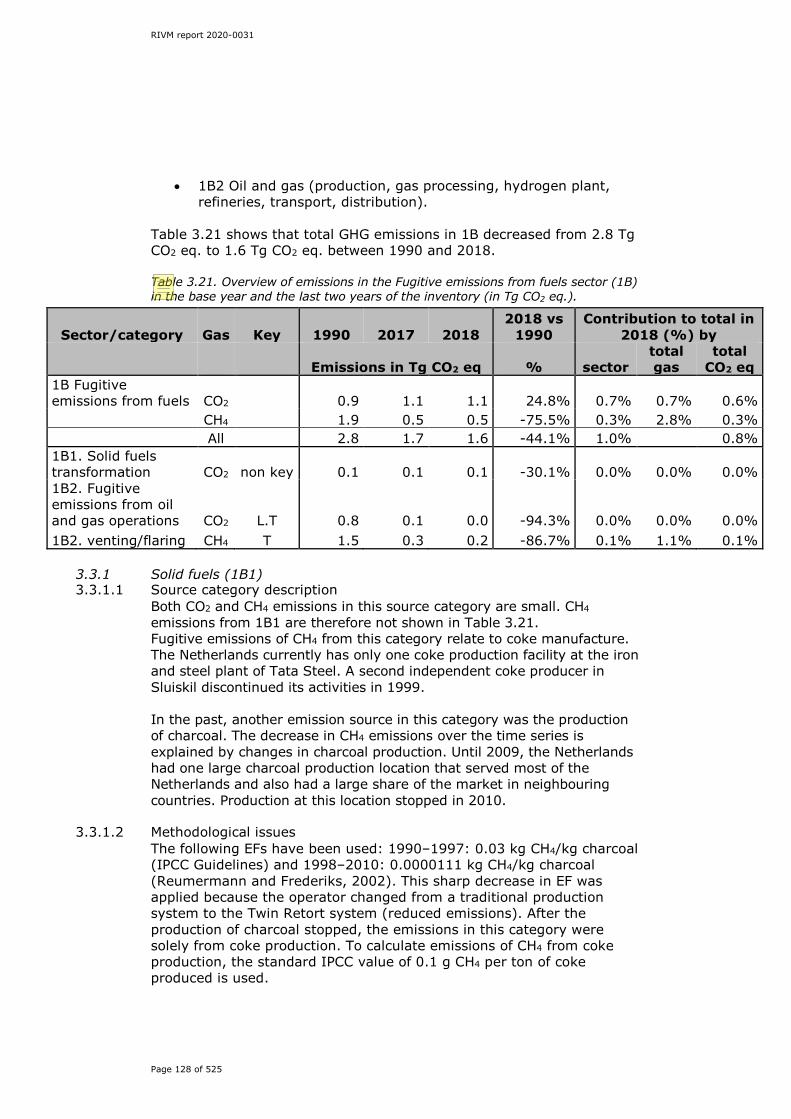
RIVM report 2020-0031
Page 128 of 525
• 1B2 Oil and gas (production, gas processing, hydrogen plant, refineries, transport, distribution).
Table 3.21 shows that total GHG emissions in 1B decreased from 2.8 Tg CO2 eq. to 1.6 Tg CO2 eq. between 1990 and 2018. Table 3.21. Overview of emissions in the Fugitive emissions from fuels sector (1B) in the base year and the last two years of the inventory (in Tg CO2 eq.).
Sector/category Gas Key 1990 2017 2018 2018 vs
1990 Contribution to total in
2018 (%) by
Emissions in Tg CO2 eq % sector total gas
total CO2 eq
1B Fugitive emissions from fuels CO2 0.9 1.1 1.1 24.8% 0.7% 0.7% 0.6% CH4 1.9 0.5 0.5 -75.5% 0.3% 2.8% 0.3% All 2.8 1.7 1.6 -44.1% 1.0% 0.8% 1B1. Solid fuels transformation CO2 non key 0.1 0.1 0.1 -30.1% 0.0% 0.0% 0.0% 1B2. Fugitive emissions from oil and gas operations CO2 L.T 0.8 0.1 0.0 -94.3% 0.0% 0.0% 0.0% 1B2. venting/flaring CH4 T 1.5 0.3 0.2 -86.7% 0.1% 1.1% 0.1%
3.3.1 Solid fuels (1B1) 3.3.1.1 Source category description
Both CO2 and CH4 emissions in this source category are small. CH4 emissions from 1B1 are therefore not shown in Table 3.21. Fugitive emissions of CH4 from this category relate to coke manufacture. The Netherlands currently has only one coke production facility at the iron and steel plant of Tata Steel. A second independent coke producer in Sluiskil discontinued its activities in 1999. In the past, another emission source in this category was the production of charcoal. The decrease in CH4 emissions over the time series is explained by changes in charcoal production. Until 2009, the Netherlands had one large charcoal production location that served most of the Netherlands and also had a large share of the market in neighbouring countries. Production at this location stopped in 2010.
3.3.1.2 Methodological issues The following EFs have been used: 1990–1997: 0.03 kg CH4/kg charcoal (IPCC Guidelines) and 1998–2010: 0.0000111 kg CH4/kg charcoal (Reumermann and Frederiks, 2002). This sharp decrease in EF was applied because the operator changed from a traditional production system to the Twin Retort system (reduced emissions). After the production of charcoal stopped, the emissions in this category were solely from coke production. To calculate emissions of CH4 from coke production, the standard IPCC value of 0.1 g CH4 per ton of coke produced is used.
Editor
As above.

RIVM report 2020-0031
Page 129 of 525
CO2 emissions related to transformation losses from coke ovens are only a small part of the total emissions from the iron and steel industry in the Netherlands. Emission totals for the iron and steel industry can be found in Section 3.2.5. Until this submission, the figures for emissions from transformation losses were based on national energy statistics of coal inputs and of coke and coke oven gas produced, from which a carbon balance of the losses was calculated. Any non-captured gas was by definition included in the net carbon loss calculation used for the process emissions. Because of uncertainty in the very large input and output volumes of the coke oven, the amount of fugitive emissions calculated with the mass balance method was unrealistically high. Therefore, the method has been changed and the CO2 EF for fugitives is determined on the basis of the conservative assumption that about 1% of coke oven input is lost in the form of fugitive emissions. Industrial producers in the Netherlands are not obliged to report any activity data in their AERs and only a limited set of activity data is published by the CBS. For category 1B1, the production of coke oven coke as registered by the CBS is reported in the CRF. Detailed information on activity data and EFs can be found in the annex ‘Methodology Report on the Calculation of Emissions to Air from the Sectors Energy, Industry and Waste’ in Honig et al. (2020).
3.3.1.3 Uncertainty and time series consistency The uncertainty in annual CO2 emissions from coke production (included in 1B1b) is estimated to be about 15%. This uncertainty relates to the conservative assumption of the carbon losses in the conversion from coking coal to coke and coke oven gas. The methodology used to estimate emissions from solid fuel transformation is consistent throughout the time series.
3.3.1.4 Category-specific QA/QC and verification These source categories are covered by the general QA/QC procedures, which are discussed in Chapter 1.
3.3.1.5 Category-specific recalculations There are no category-specific recalculations.
3.3.1.6 Category-specific planned improvements No improvements are planned.
3.3.2 Oil and natural gas (1B2) 3.3.2.1 Source category description
Emissions from oil and natural gas comprise: • emissions from oil and gas exploration, production, processing,
flaring and venting (CO2, CH4, N2O); • emissions from oil and gas transport (CO2, CH4, N2O); • emissions from gas distribution networks (pipelines for local
transport) (CO2, CH4); • emissions from oil refining (CH4); • emissions from hydrogen plants (CO2).
RIVM report 2020-0031
Page 130 of 525
Note that: • combustion emissions from oil and gas exploration and
production are reported under 1A1c. • fugitive emissions from gas and oil exploration and production
are included in fugitive emissions from combined venting and flaring (1B2c).
• CO2 and N2O combustion emissions from gas transmission are included in 1A3ei (Pipeline transport gaseous fuels). CO2 process emissions and CH4 emissions from gas transmission can still be found in 1B2b4 (Gas transmission and storage).
• CO2 and CH4 emissions from pipelines for oil are included in 1B2a3 (Oil transport). This is consistent with the 2006 IPCC Guidelines.
• fugitive CO2 emissions from refineries are included in the combustion emissions reported in category 1A1b, as the fugitive emissions cannot be separated from the total emissions reported under 1A1b.
• since the 2007 submission, process emissions of CO2 from a hydrogen plant of a refinery (about 0.9 Tg CO2 per year) were reported in 1B2a4. As refinery data specifying these fugitive CO2 emissions were available from 2002 onwards (environmental reports (AER) from the plant), these emissions have been re-allocated from 1A1b to 1B2a4.
• Due to the Dutch emission regulation for VOCs, all possible sources included in 1B2a5 (Distribution of oil products; refineries, distributors, filling stations) are equipped with abatement measures to capture any fugitive emissions. Therefore, emissions are considered as ‘not applicable’ (NA) and activity data ‘not estimated’ (NE).
• There are also no relevant emissions expected in the Netherlands in categories 1B2a6 Other (NE) and 1B2d Other ‘not occurring’ (NO).
Gas production and gas transmission vary according to demand: in cold winters, more gas is produced. The gas distribution network is still gradually expanding as new housing estates are being built. PVC and PE are mostly used for this expansion. Besides, PVC and PE are also used to replace cast iron pipelines (see Honig et al., 2020). The IEF for gas distribution gradually decreases as the proportion of cast iron pipelines decreases due to their gradual replacement and the expansion of the network. Their present share of the total is less than 3.5%; in 1990 it was 10%. CO2 and CH4 emissions from oil and gas production, particularly from flaring and venting, have been reduced significantly since the 1990s. This is due to the implementation of environmental measures to reduce venting and flaring such as using gas for energy production purposes that was formerly wasted.
3.3.2.2 Methodological issues Country-specific methods comparable to the IPCC Tier 3 method are used to estimate emissions of fugitive CH4 and CO2 emissions from Oil and gas exploration, production and processing, venting and flaring (1B2). Each operator uses its own detailed installation data to calculate

RIVM report 2020-0031
Page 131 of 525
emissions and reports those emissions and fuel uses in aggregated form in its electronic AER (e-AER). Activity data are taken from national energy statistics as a proxy and reported in the CRF tables. The data in the statistics can be adjusted retrospectively (changes in definitions/ allocation) and these statistical changes will show up in the CRF tables. Since 2004, the gas distribution sector has annually recorded the number of leaks found per material and detailed information on pipeline length per material. A yearly survey of leakages per length, material and pressure range is also carried out, covering the entire length of the grid every five years. Total CH4 emissions in m3 are taken from the Methane Emission from Gas Distribution (Methaanemissie door Gasdistributi) annual report, commissioned by Netbeheer Nederland (Association of Energy Network Operators in the Netherlands) and compiled by KIWA (KIWA, multiple years). CH4 emissions in m3 are calculated using a bottom-up method which complies with the Tier 3 methodology described in chapter 4 of the 2006 IPCC Guidelines. The IPCC Tier 3 method for calculating CH4 emissions from gas distribution due to leakages (1B2b5) is based on country-specific EFs calculated from leakage measurements. Because of the availability of new sets of leakage measurements, Netbeheer Nederland commissioned an evaluation of the EFs being applied. As a result, the calculation of emissions of methane from gas distribution was improved for the NIR 2016 (KIWA, 2015). In earlier submissions, the IPCC Tier 3 method for methane (CH4) emissions from gas distribution due to leakages was based on two country-specific EFs: 610 m3 CH4 per km of pipeline for grey cast iron, and 120 m3 CH4 per km of pipeline for other materials. These EFs were based on the small base of 7 measurements at one pressure level of leakage per hour for grey cast iron and 18 measurements at three pressure levels for other materials (PVC, steel, nodular cast iron and PE) and subsequently aggregated to EFs for the pipeline material mix in 2004. As a result of a total of 40 additional leakage measurements, an improved set of EFs could be derived. Based on the (total of) 65 leakage measurements, the pipeline material mix in 2013 and the results of the leakage survey, three new EFs were calculated: 323 m3 CH4 per km of pipeline for grey cast iron, 51 m3 CH4 per km of pipeline for other materials with a pressure of <=200 mbar, and 75 m3 CH4 per km of pipeline for other materials with a pressure of >200 mbar. Using these improved EFs led to a reduction in the calculated emissions of CH4 for the period 1990–2014. Emissions of CO2 and CH4 due to the transmission of natural gas (1B2b4) are taken from the VG&M (safety, health and environment) part of the annual report of NV Nederlandse Gasunie. The emissions of CO2 given in the annual reports are considered to be combustion emissions and therefore reported under IPCC category 1A1c3ei (gaseous). Additionally, to give a complete overview of emissions, the amount of fugitive CO2 emissions from gas transportation is calculated using the Tier 1 method with the new default IPCC EF of 8.8E-7 Gg per 106 m3 of marketable gas, taken from the 2006 IPCC Guidelines, chapter 4, Table 4.2.4. This figure is applied to CRF category 1B2b4 for the whole time series.

RIVM report 2020-0031
Page 132 of 525
For the NIR 2016, emissions of methane from gas transmission were evaluated and improved. As a result of the implementation of the LDAR (Leak Detection and Repair) programme of Gasunie, new emissions data for CH4 became available. Leakages at larger locations such as the 13 compressor stations were all fully measured. In addition, fugitive emissions of methane from each of those locations were added to the emissions the year after the facilities came into operation. The adjustments of the CH4 emissions for the smaller locations were based on measurements of a sample of those locations and added for the whole time series. Fugitive emissions of CH4 from refineries in category 1B2a4 are based on a 4% share in total VOC emissions reported in the AERs of the refineries (Spakman et al., 2003) and in recent years have been directly reported in those AERs. These show significant annual fluctuations in CH4 emissions, as the allocation of the emissions to either combustion or process has not been uniform over the years. (For more information, see Honig et al., 2020.) Also, process emissions of CO2 from the only hydrogen factory of a refinery in the Netherlands are reported in category 1B2a4. As Dutch companies are not obliged to report activity data, the AERs only include emissions. The energy input of refineries from national energy statistics is taken as a proxy for activity data for this category and is reported in the CRF tables. The data in the statistics can be adjusted retrospectively (changes in definitions/allocation) and these adjustments will show up in the latest version of the CRF tables. Detailed information on activity data and EFs can be found in paragraph 2.4 of the annex ‘Methodology Report on the Calculation of Emissions to Air from the Sectors Energy, Industry and Waste’ to Honig et al. (2020).
3.3.2.3 Uncertainty and time series consistency The uncertainty in CO2 emissions from gas flaring and venting is estimated to be about 50%. The uncertainty in CH4 emissions from oil and gas production (venting) and gas transport and distribution (leakage) is also estimated to be 50%. The uncertainty in the EF of CO2 from gas flaring and venting (1B2) is estimated at 2%. For flaring, this uncertainty takes into account the variability in the gas composition of the smaller gas fields. For venting, it accounts for the high CO2 content of the natural gas produced at a few locations. For CH4 from fossil fuel production (gas venting) and distribution, the uncertainty in the EFs is estimated to be 25% and 50%, respectively. This uncertainty refers to the changes in reported venting emissions by the oil and gas production industry over the years and to the limited number of actual leakage measurements for different types of materials and pressures, on which the Tier 3 methodology for methane emissions from gas distribution is based. A consistent methodology is used to calculate emissions throughout the time series, relying on, among others, energy statistics.
RIVM report 2020-0031
Page 133 of 525
3.3.2.4 Category-specific QA/QC and verification The source categories are covered by the general QA/QC procedures, which are discussed in Chapter 1.
3.3.2.5 Category-specific recalculations No category-specific recalculations have been made.
3.3.2.6 Category-specific planned improvements At the moment there are neither planned actions to investigate whether it is possible to separate the CH4 combustion emissions and fugitive emissions of gas transmission; nor plans to investigate separation of the venting and flaring emissions. Note this would not change the total emissions but would only reallocate the emissions.
3.4 CO2 transport and storage (1C) Underground storage of CO2 (CCS) is not yet implemented in the Netherlands. For that reason we use the notation key ‘NO’ in the CRF for the 1C category. Transport of combustion off-gases (containing CO2) occurs from energy production facilities to nearby greenhouses, to increase the CO2 content of the greenhouse atmosphere (as growth enhancer). The emissions from this activity are accounted for in the combustion emissions from the energy producers.

RIVM report 2020-0031
Page 134 of 525
RIVM report 2020-0031
Page 135 of 525
4 Industrial processes and product use (CRF sector 2)
Major changes in the Industrial processes and product use (IPPU) sector compared with the National Inventory Report 2019
Emissions:
The total GHG emissions of the IPPU sector increased from 11.3 Tg CO2 eq. in 2017 to 11.7 Tg CO2 eq. in 2018, mainly due to an increase in CO2 emissions (0.36 Tg).
Key categories:
2G (N2O emissions from other product manufacture and use) is no longer a key category.
Methodologies: For Mobile air-conditioning (2F1), more adequate information has become available about the rest volume of HFC in scrapped cars. Therefore, HFC emissions have been changed for the whole time series.
4.1 Overview of sector
Emissions of GHGs in this sector include the following: • all non-energy-related emissions from industrial activities
(including construction); • all emissions from the use of F-gases (HFCs, PFCs (incl. NF3) and
SF6), including their use in other sectors; • N2O emissions originating from the use of N2O in anaesthesia and
as a propelling agent in aerosol cans (e.g. cans of cream). Fugitive emissions of GHGs in the Energy sector (not relating to fuel combustion) are included in IPCC category 1B (Fugitive emissions). Table 4.1 and Figure 4.1 show the trends in total GHG emissions from the IPPU sector. In 2018, IPPU contributed 6.2% to the total national GHG emissions (without LULUCF) in comparison with 10.8% in 1990. The sector is a major source of N2O emissions in the Netherlands, accounting for 17% of total national N2O emissions in 2018. Category 2B (Chemical industry) contributes most to the emissions from this sector with 1.4 Tg CO2 eq. in 2018.

RIVM report 2020-0031
Page 136 of 525
Table 4.1. Overview of emissions in the Industrial production and product use sector, in the base year and the last two years of the inventory (in Tg CO2 eq.)
Sector/category Gas Key 1990 2017 2018 2018 vs
1990 Contribution to total in 2018 (%)
by Emissions in Tg CO2 eq % sector total gas total CO2 eq 2. Total Industrial Processes CO2 7.8 7.6 8.0 2.7% 68.3% 5.0% 4.2% CH4 0.3 0.3 0.3 4.7% 2.9% 1.9% 0.2% N2O 7.3 1.6 1.4 -80.3% 12.3% 17.2% 0.8% HFC 5.6 1.6 1.6 -70.7% 14.1% 100.0% 0.9% PFC 2.7 0.1 0.2 -93.9% 1.4% 100.0% 0.1% SF6 0.3 0.1 0.1 -52.6% 1.1% 100.0% 0.1% All 23.9 11.3 11.7 -51.2% 100.0% 6.2% 2A. Mineral industry CO2 1.4 1.6 1.50 6.0% 12.8% 0.9% 0.8% 2B. Chemical industry CO2 4.7 5.1 5.6 19.5% 48.3% 3.5% 3.0% CH4 0.3 0.3 0.3 6.8% 2.5% 1.7% 0.2% N2O 7.1 1.5 1.4 -80.9% 11.6% 16.2% 0.7% HFC 5.6 0.1 0.2 -95.6% 2.1% 15.1% 0.1% PFC 0.0 0.0 0.1 0.8% 59.5% 0.1% All 17.7 7.0 7.6 -56.9% 65.3% 4.0% 2C. Metal Production CO2 0.5 0.1 0.0 -95.7% 0.2% 0.0% 0.0% PFC 2.6 0.0 0.0 -99.1% 0.2% 13.8% 0.0% All 3.1 0.1 0.0 -98.6% 0.4% 0.0% 2D. Non-energy products from fuels and solvent use CO2 0.2 0.3 0.3 73.0% 2.8% 0.2% 0.2%
CH4 0.0 0.0 0.0 104.5% 0.0% 0.0% 0.0% All 0.2 0.3 0.3 73.0% 2.8% 0.2%
2E. Integrated circuit or semiconductor PFC non key 0.0 0.0 0.0 73.2% 0.4% 26.7% 0.0%
Editor
Usual correx.
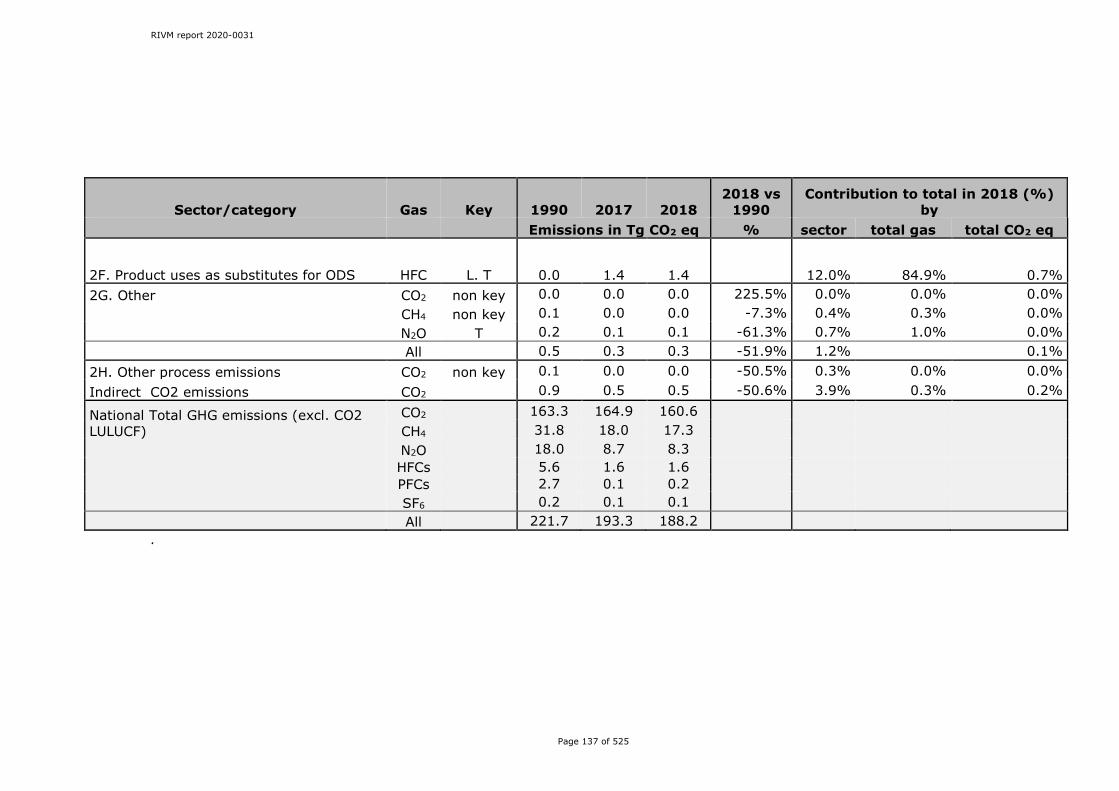
RIVM report 2020-0031
Page 137 of 525
Sector/category Gas Key 1990 2017 2018 2018 vs
1990 Contribution to total in 2018 (%)
by Emissions in Tg CO2 eq % sector total gas total CO2 eq
2F. Product uses as substitutes for ODS HFC L. T 0.0 1.4 1.4 12.0% 84.9% 0.7% 2G. Other CO2 non key 0.0 0.0 0.0 225.5% 0.0% 0.0% 0.0% CH4 non key 0.1 0.0 0.0 -7.3% 0.4% 0.3% 0.0% N2O T 0.2 0.1 0.1 -61.3% 0.7% 1.0% 0.0% All 0.5 0.3 0.3 -51.9% 1.2% 0.1% 2H. Other process emissions CO2 non key 0.1 0.0 0.0 -50.5% 0.3% 0.0% 0.0% Indirect CO2 emissions CO2 0.9 0.5 0.5 -50.6% 3.9% 0.3% 0.2%
National Total GHG emissions (excl. CO2 LULUCF)
CO2 163.3 164.9 160.6 CH4 31.8 18.0 17.3
N2O 18.0 8.7 8.3 HFCs 5.6 1.6 1.6 PFCs 2.7 0.1 0.2 SF6 0.2 0.1 0.1 All 221.7 193.3 188.2
.
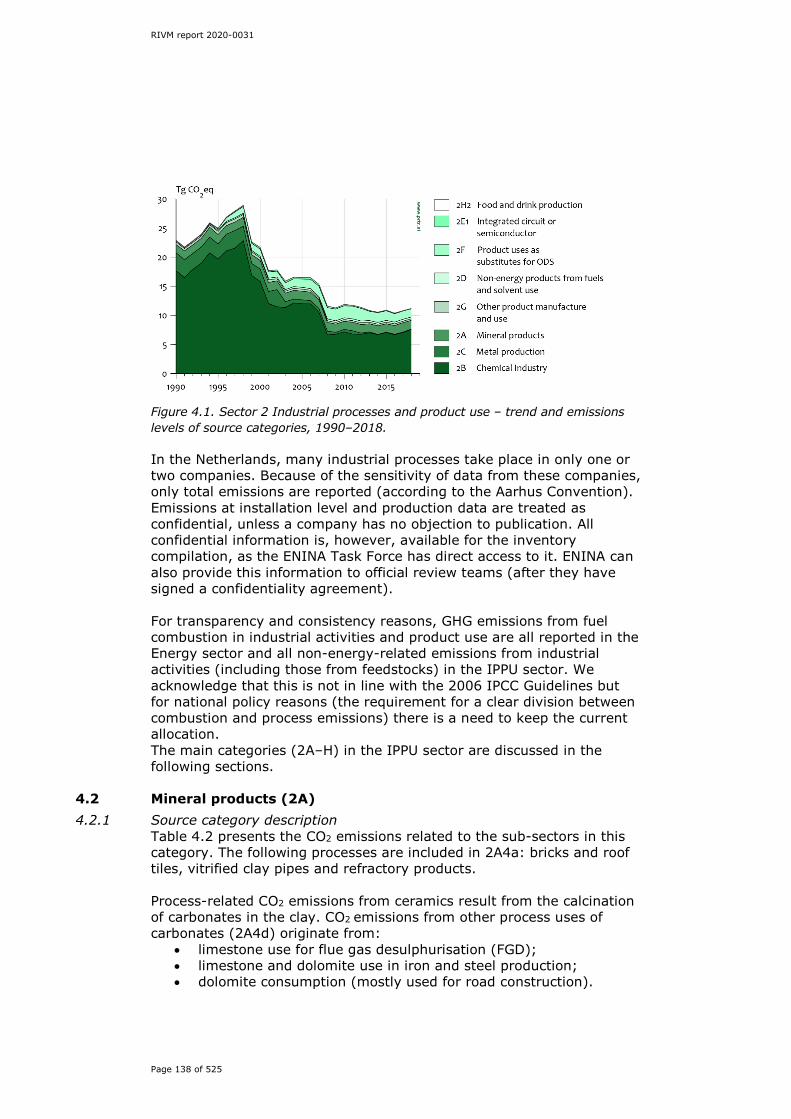
RIVM report 2020-0031
Page 138 of 525
Figure 4.1. Sector 2 Industrial processes and product use – trend and emissions levels of source categories, 1990–2018. In the Netherlands, many industrial processes take place in only one or two companies. Because of the sensitivity of data from these companies, only total emissions are reported (according to the Aarhus Convention). Emissions at installation level and production data are treated as confidential, unless a company has no objection to publication. All confidential information is, however, available for the inventory compilation, as the ENINA Task Force has direct access to it. ENINA can also provide this information to official review teams (after they have signed a confidentiality agreement). For transparency and consistency reasons, GHG emissions from fuel combustion in industrial activities and product use are all reported in the Energy sector and all non-energy-related emissions from industrial activities (including those from feedstocks) in the IPPU sector. We acknowledge that this is not in line with the 2006 IPCC Guidelines but for national policy reasons (the requirement for a clear division between combustion and process emissions) there is a need to keep the current allocation. The main categories (2A–H) in the IPPU sector are discussed in the following sections.
4.2 Mineral products (2A) 4.2.1 Source category description
Table 4.2 presents the CO2 emissions related to the sub-sectors in this category. The following processes are included in 2A4a: bricks and roof tiles, vitrified clay pipes and refractory products. Process-related CO2 emissions from ceramics result from the calcination of carbonates in the clay. CO2 emissions from other process uses of carbonates (2A4d) originate from:
• limestone use for flue gas desulphurisation (FGD); • limestone and dolomite use in iron and steel production; • dolomite consumption (mostly used for road construction).

RIVM report 2020-0031
Page 139 of 525
Table 4.2. Overview of the sector Mineral Industry (2A), in the base year and the last two years of the inventory (in Tg CO2 eq.).
Sector/category Gas Key 1990 2017 2018
2018 vs
1990 Contribution to total in
2018 (%) by
Emissions in Tg CO2 eq % sector total gas
total CO2 eq
2A. Mineral industry CO2 1.4 1.6 1.5 6.0% 12.8% 0.9% 0.8% 2A1. Cement production CO2 non key 0.4 0.3 0.2 -47.0% 1.9% 0.1% 0.1%
2A2. Lime production CO2 non key 0.2 0.2 0.2 41.1% 2.0% 0.1% 0.1%
2A3. Glass production non key 0.1 0.1 0.1 -50.0% 0.6% 0.0% 0.0%
2A4a Ceramics CO2 non key 0.1 0.1 0.1 -11.6% 1.1% 0.1% 0.1% 2A4b Other uses of Soda Ash CO2 non key 0.1 0.1 0.1 74.9% 1.0% 0.1% 0.1%
2A4d Other CO2 L.T 0.5 0.8 0.7 51.7% 6.3% 0.5% 0.4%
4.2.2 Methodological issues For all the source categories, the methodologies used to estimate emissions of CO2 comply with the 2006 IPCC Guidelines, volume 3. More detailed descriptions of the methods and EFs used can be found in section 2.2.3.2 ‘Non-fossil process emissions’ of Honig et al., (2020). 2A1 (Cement clinker production) Because of changes in raw material composition over time, it is not possible to reliably estimate CO2 process emissions on the basis of clinker production activity data and a default EF. For that reason, the only cement producer in the Netherlands has chosen to base the calculation of CO2 emissions on the carbonate content of the process input. From 2002 onwards, process emissions from cement clinker production are calculated as follows:
Em = AD * Rf * C * 44/12 Where:
Em = process emissions (ton); AD = amount of raw material (incl. organic fraction) (ton); Rf = recirculation factor (calculated via vowel viewing); C = total C content of the raw material in ton C/ton raw material (determined weekly).
CO2 emissions from the raw material are calculated on a monthly basis by multiplying the amount of raw material (including the organic fraction) by a derived process EF. The content of organic carbon in the raw material is <0.5%. From every batch in a month, a sample is taken just before the raw material is fed into the kiln. The process EF and composition of the batch are determined in a laboratory. The EF is determined by measuring the weight loss of the sample. The monthly EF is set as the average of all sample EFs determined that month. As a result, the total yearly process emissions of the company are the sum of all monthly CO2 emissions.
Editor
Usual correx.
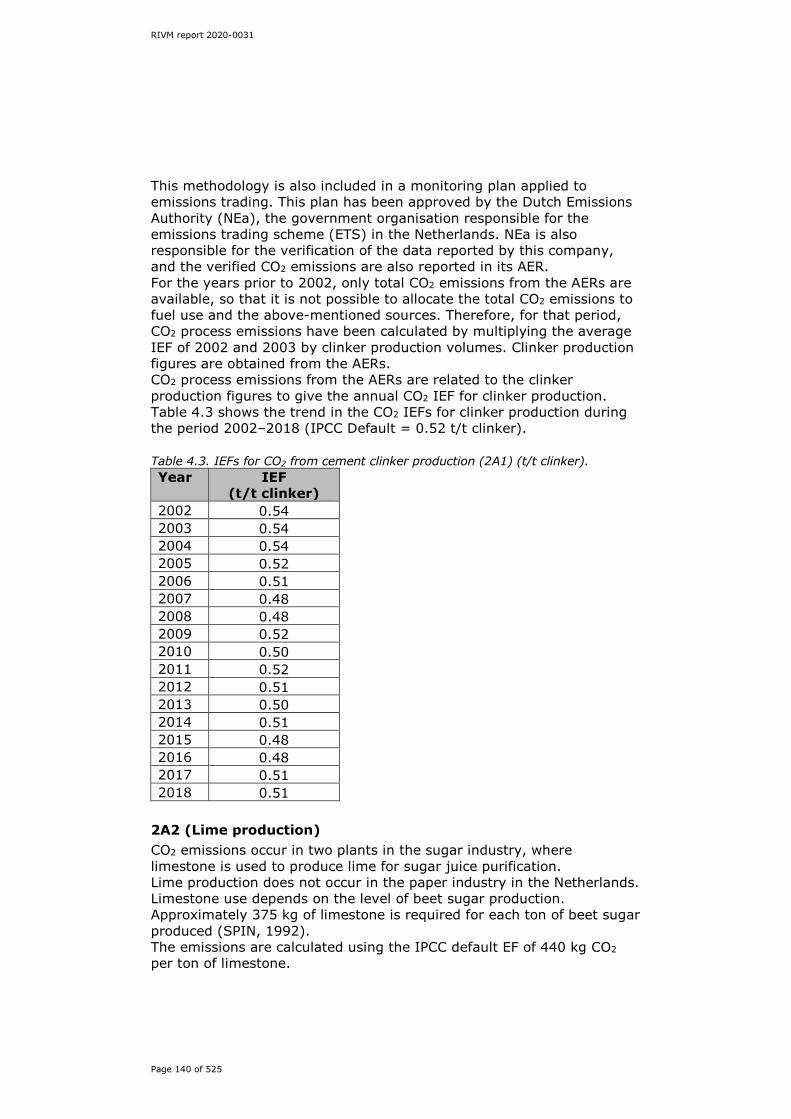
RIVM report 2020-0031
Page 140 of 525
This methodology is also included in a monitoring plan applied to emissions trading. This plan has been approved by the Dutch Emissions Authority (NEa), the government organisation responsible for the emissions trading scheme (ETS) in the Netherlands. NEa is also responsible for the verification of the data reported by this company, and the verified CO2 emissions are also reported in its AER. For the years prior to 2002, only total CO2 emissions from the AERs are available, so that it is not possible to allocate the total CO2 emissions to fuel use and the above-mentioned sources. Therefore, for that period, CO2 process emissions have been calculated by multiplying the average IEF of 2002 and 2003 by clinker production volumes. Clinker production figures are obtained from the AERs. CO2 process emissions from the AERs are related to the clinker production figures to give the annual CO2 IEF for clinker production. Table 4.3 shows the trend in the CO2 IEFs for clinker production during the period 2002–2018 (IPCC Default = 0.52 t/t clinker). Table 4.3. IEFs for CO2 from cement clinker production (2A1) (t/t clinker). Year IEF
(t/t clinker) 2002 0.54 2003 0.54 2004 0.54 2005 0.52 2006 0.51 2007 0.48 2008 0.48 2009 0.52 2010 0.50 2011 0.52 2012 0.51 2013 0.50 2014 0.51 2015 0.48 2016 0.48 2017 0.51 2018 0.51
2A2 (Lime production) CO2 emissions occur in two plants in the sugar industry, where limestone is used to produce lime for sugar juice purification. Lime production does not occur in the paper industry in the Netherlands. Limestone use depends on the level of beet sugar production. Approximately 375 kg of limestone is required for each ton of beet sugar produced (SPIN, 1992). The emissions are calculated using the IPCC default EF of 440 kg CO2 per ton of limestone.
RIVM report 2020-0031
Page 141 of 525
2A3 (Glass production) Until the 2015 submission, CO2 emissions were based on plant-specific EFs and gross glass production. Plant-specific EFs have been used for the years 1990 (0.13 t CO2/t glass), 1995 (0.15 t CO2/t glass) and 1997 (0.18 t CO2/t glass). For other years in the time series, there was not enough data available to calculate plant-specific EFs. For the years 1991–1994 and 1996, EFs have been estimated by interpolation. Because no further measurement data are available, the EF for 1998–2012 has been kept at the same level as the EF of 1997 (0.18 t CO2/t glass). Because no reliable data regarding growth in the use of recycled scrap glass (cullet) in the glass production sector are available for the period 1997–2012, the estimation of CO2 emissions for that period does not take into account the growth in the use of cullet in glass production. The activity data (gross glass production) are based on data from the CBS and the glass trade organisation. From the 2015 submission, the CO2 figures are based on the verified EU-ETS Emission Reports of the glass production companies and the emissions as estimated in earlier submissions for the year (‘old 1990’ emissions). EU-ETS Emission Reports are available from 2005 onwards. For the calculation of CO2 emissions from limestone, dolomite and soda ash, consumption default IPCC EFs are used; for the other substances, the C-content is multiplied by 44/12. Consumption figures for limestone, dolomite, soda ash and other substances are confidential. Due to the lack of information on the use of cullet, emissions for the period 1991–2005 have been determined by interpolation. For this calculation the ‘old 1990’ emissions have been used as the starting point. 2A4a (Ceramics) The calculation of CO2 emissions from the manufacture of ceramic products in the Netherlands complies with the Tier 1 method as described in the 2006 IPCC Guidelines, volume 3, chapter 2, sect. 2.34:
CO2 emissions = Mc x (0.85EFls + 0.15EFd)
Where: Mc = mass of carbonate consumed (tonnes); 0.85 = fraction of limestone; 0.15 = fraction of dolomite; EFls = EF limestone (0.440 ton CO2/ton limestone); EFd = EF dolomite (0.477 ton CO2/ton dolomite).
Based on Olivier et al (2009). The fractions and EFs (both defaults) are obtained from the 2006 IPCC Guidelines.
The mass of carbonate consumed (Mc) is determined as follows:
Mc = Mclay x cc
Where:
Mclay = amount of clay consumed, calculated by multiplying the national production data for bricks and
roof tiles, vitrified clay pipes and refractory products by

RIVM report 2020-0031
Page 142 of 525
the default loss factor of 1.1 from the 2006 Guidelines. National production data are obtained from the ceramics trade organisation.
cc = default carbonate content of clay (0.1) from the 2006 Guidelines.
2A4b (Other uses of soda ash) For the years 2001 and 2002, net domestic consumption of soda ash is estimated by taking the production figure of 400 kton as a basis, then adding the import figures and deducting the export figures for the relevant year. For the years 1990–2000 and 2003 onwards, these figures are estimated by extrapolating from the figures for 2001 and 2002. This extrapolation incorporates the trend in chemicals production, since this is an important user of soda ash. Emissions are calculated using the standard IPCC EF of 415 kg CO2 per ton of soda ash (Na2CO3) (2006 IPCC Guidelines, volume 3, chapter 2, Table 2.1). 2A4d (Other) CO2 emissions from this source category are based on figures for the consumption of limestone for FGD in the coal-fired power plants, limestone and dolomite use in crude steel production and apparent dolomite consumption (mostly in road construction). After comparison of the emissions with the limestone use, the sum of the CO2 emissions from the AERs of the coal-fired power plants is included in the national inventory. From 2000 onwards, data reported in the AERs of Tata Steel have been used to calculate CO2 emissions from limestone and dolomite use in iron and steel production. For the period 1990–2000, CO2 emissions were calculated by multiplying the average IEF (107.9 kg CO2 per ton of crude steel produced) over the 2000–2003 period by crude steel production. The emissions are calculated using the IPCC default EF (limestone use: EF = 0.440 t/t; dolomite use: EF = 0.477 t/t). The consumption of dolomite is based on statistical information obtained from the CBS, which can be found on the website. CO2 emissions from the use of limestone and dolomite and from the use of other substances in the glass production sector are included in 2A3 (Glass production).
4.2.3 Uncertainty and time series consistency Uncertainty The Approach 1 uncertainty analysis outlined in Annex 2 and shown in Tables A2.1 and A2.2, provides the estimates of uncertainties by IPCC source category. Uncertainty estimates used in the Tier 1 analysis are based on expert judgement, since no detailed information is available that might enable the uncertainties in the emissions reported by the facilities (cement clinker production, limestone and dolomite use, and soda ash production) to be assessed. The uncertainty in CO2 emissions from cement clinker and limestone production is estimated to be in the range of 10% and is mainly determined by uncertainties in the EFs.

RIVM report 2020-0031
Page 143 of 525
For dolomite and limestone use for FGD, the uncertainty is estimated to be 50%. This is mainly determined by the relatively high uncertainty in the activity data. The activity data for soda ash use and glass production are also assumed to be relatively uncertain (50% and 25%, respectively). The uncertainties of the IPCC default EFs used for some processes are not assessed. As these are minor sources of CO2, however, this absence of data was not given any further consideration. Time series consistency Consistent methodologies have been applied to all source categories. The time series involves a certain amount of extrapolation with respect to the activity data for soda ash use and emissions data for glass production, thereby introducing further uncertainties in the first part of the time series for these sources.
4.2.4 Category-specific QA/QC and verification The source categories are covered by the general QA/QC procedure discussed in Chapter 1. For the source categories 2A and 2A4d, the activity and emissions data of the AERs were compared with the EU-ETS monitoring reports. No differences were found. This (annual) comparison is documented in a (confidential) document. This document is available to the ERT upon request and after signature of a confidentiality agreement. For category 2A4b no such comparison was made on account of the unavailability of ETS data and the fact that the contribution to the national total is only 0.1%. However, for the NIR 2021 this issue will be addressed again.
4.2.5 Category-specific recalculations No recalculations have been made.
4.2.6 Category-specific planned improvements Although category 2A4b makes only a minor contribution to the national total (0.1%), we will endeavour to find out in which chemical industries soda ash is used, and to investigate whether EU-ETS data could be used to improve the data in the inventory.
4.3 Chemical industry (2B) 4.3.1 Source category description
The national inventory of the Netherlands includes emissions of GHGs from the following source categories reported in category 2B (Chemical industry):
• Ammonia production (2B1): CO2 emissions: in the Netherlands, natural gas is used as feedstock for ammonia production. CO2 is a by-product of the chemical separation of hydrogen from natural gas. During the process of ammonia (NH3) production, hydrogen and nitrogen are combined and react together.
• Nitric acid production (2B2): N2O emissions: The production of nitric acid (HNO3) generates N2O, which is a by-product of the high-temperature catalytic oxidation of ammonia. Until 2010, three companies, each with two HNO3 production plants, were responsible for the N2O emissions from nitric acid production in the Netherlands. Two plants of one company were closed in 2010
RIVM report 2020-0031
Page 144 of 525
and one of these was taken over by one of the other companies. Since then, two companies, one with three and one with two HNO3 production plants, are responsible for the N2O emissions from nitric acid production in the Netherlands.
• Caprolactam production (2B4a): N2O emissions. Caprolactam is produced in the Netherlands as part of the production cycle for nylon materials, and is manufactured (since 1952) by only one company. This emission source is therefore responsible for all (100%) N2O emissions by the caprolactam industry in the Netherlands. N2O emissions from caprolactam production in the Netherlands are not covered by the EU-ETS.
• Silicon carbide production (2B5a): CH4 emissions: Petrol cokes are used during the production of silicon carbide; the volatile compounds in the petrol cokes form CH4.
• Titanium dioxide production (2B6): CO2 emissions arise from the oxidation of coke used as a reductant.
• Soda ash production (2B7): CO2 emissions are related to the non-energy use of coke.
• Petrochemical and carbon black production (2B8): o methanol: CH4 (2B8a); o ethylene: CH4 (2B8b); o ethylene oxide: CO2 (2B8d); o acrylonitrile: CO2/CH4/N2O (2B8e). o carbon black: CH4 (2B8f).
• Fluorochemical production (2B9): o by-product emissions – production of HCFC-22 (2B9a1): HFC-
23 emissions: Chlorodifluoromethane (HCFC-22) is produced at one plant in the Netherlands. Tri-fluoromethane (HFC-23) is generated as a by-product during the production of chlorodifluoromethane and emitted through the plant condenser vent.
o by-product emissions – other – handling activities (2B9b3): emissions of HFCs: One company in the Netherlands repackages HFCs from large units (e.g. containers) into smaller units (e.g. cylinders) and trades in HFCs. There are also many companies in the Netherlands that import small units with HFCs and sell them in the trading areas.
• Other (2B10): o Industrial gas production: Hydrogen and carbon monoxide are
produced mainly from the use of natural gas as a chemical feedstock. During the gas production process CO2 is emitted.
o Carbon electrode production: Carbon electrodes are produced from petroleum coke and coke, used as feedstock. In this process CO2 is produced.
o Activated carbon production: Norit is one of world’s largest manufacturers of activated carbon, for which peat is used as a carbon source, and CO2 is a by-product.
Adapic acid (2B3), glyoxal (2B4b), glyoxylic acid (2B4c) and calcium carbide (2B5b) are not produced in the Netherlands. So the Netherlands does not report emissions in the CRF under 2B4, which are covered by the EU-ETS.

RIVM report 2020-0031
Page 145 of 525
CO2 emissions resulting from the use of fossil fuels as feedstocks for the production of silicon carbide, carbon black, ethylene and methanol are included in the Energy sector (1A2c; see Section 3.2.7 for details). Many processes related to this source category take place in only one or two companies. Because of the confidentiality of data from these companies, emissions from 2B5 and 2B6 are included in 2B8g. Overview of shares and trends in emissions Table 4.4 gives an overview of the proportions of emissions from the main categories. Emissions from this category contributed 8.0% of total national GHG emissions (without LULUCF) in 1990 and 4.0% in 2018. Table 4.4 Overview of the sector Chemical industry (2B), in the base year and the last two years of the inventory (in Tg CO2 eq.).
Sector/category Gas Key 1990 2017 2018
2018 vs
1990 Contribution to total
in 2018 (%) by
Emissions in Tg CO2 eq % sector total gas
total CO2 eq
2B. Chemical industry CO2 4.7 5.1 5.6 19.5% 48.3% 3.5% 3.0%
CH4 0.3 0.3 0.3 6.8% 2.5% 1.7% 0.2% N2O 7.1 1.5 1.4 -80.9% 11.6% 16.2% 0.7% HFC 5.6 0.1 0.2 -95.6% 2.1% 15.1% 0.1% PFC 0.0 0.0 0.1 0.8% 59.5% 0.1% All 17.7 7.0 7.6 -56.9% 65.3% 4.0% 2B1. Ammonia production CO2 L.T 3.7 3.9 3.8 0.7% 32.2% 2.3% 2.0%
2B2. Nitric acid production N2O T 6.1 0.3 0.3 -95.4% 2.4% 3.4% 0.1%
2B4. Caprolactam production N2O L 0.7 0.8 0.7 -1.9% 6.2% 8.7% 0.4%
2B7. Soda ash production CO2 non key 19.0 NO NO -
100.0% 0.0% 0.0% 0.0%
2B8. Petrochemical and carbon black production CO2 L.T
0.3 0.5 0.5 36.6% 3.9% 0.3% 0.2%
CH4 L 0.3 0.3 0.3 6.8% 2.5% 1.7% 0.2% 2B9. Fluorochemical production HFC T 7.3 0.1 0.2 -96.6% 2.1% 15.1% 0.1%
PFC non key 0.0 0.0 0.1 0.8% 59.5% 0.1% 2B10. Other chemical industry CO2 L 0.6 0.7 1.4 142.7% 12.1% 0.9% 0.8%
Editor
Usual correx.
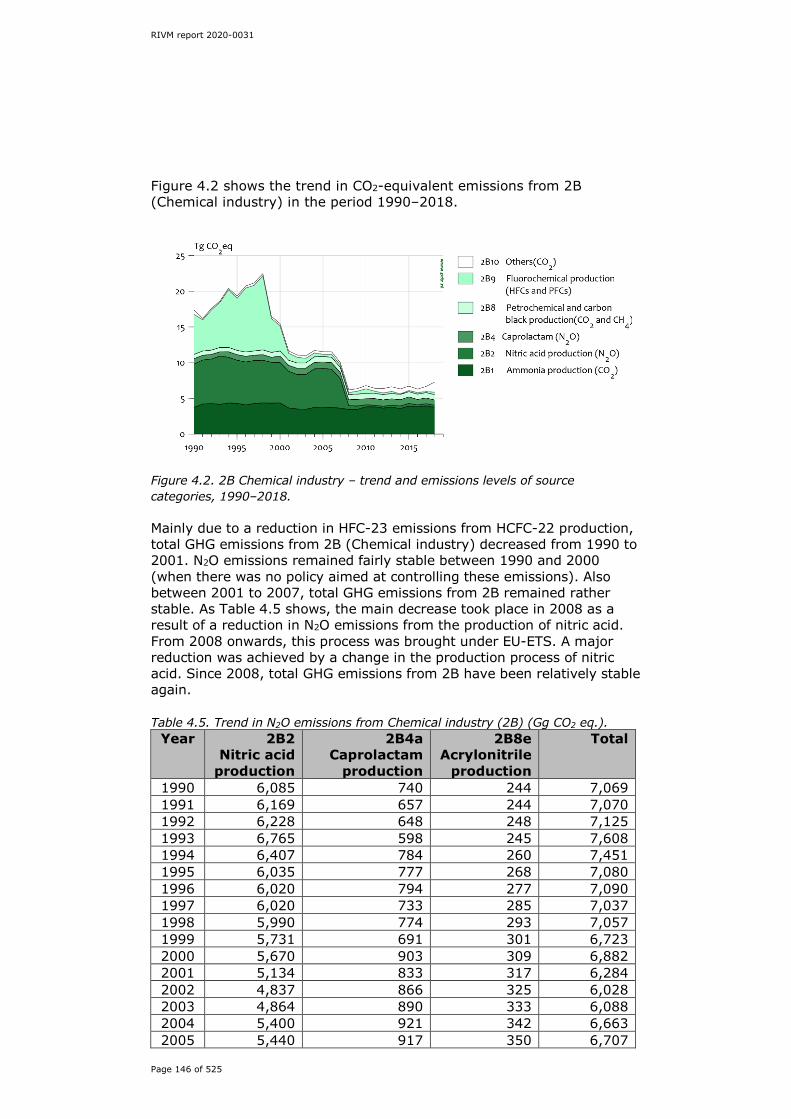
RIVM report 2020-0031
Page 146 of 525
Figure 4.2 shows the trend in CO2-equivalent emissions from 2B (Chemical industry) in the period 1990–2018.
Figure 4.2. 2B Chemical industry – trend and emissions levels of source categories, 1990–2018. Mainly due to a reduction in HFC-23 emissions from HCFC-22 production, total GHG emissions from 2B (Chemical industry) decreased from 1990 to 2001. N2O emissions remained fairly stable between 1990 and 2000 (when there was no policy aimed at controlling these emissions). Also between 2001 to 2007, total GHG emissions from 2B remained rather stable. As Table 4.5 shows, the main decrease took place in 2008 as a result of a reduction in N2O emissions from the production of nitric acid. From 2008 onwards, this process was brought under EU-ETS. A major reduction was achieved by a change in the production process of nitric acid. Since 2008, total GHG emissions from 2B have been relatively stable again. Table 4.5. Trend in N2O emissions from Chemical industry (2B) (Gg CO2 eq.).
Year 2B2 Nitric acid
production
2B4a Caprolactam
production
2B8e Acrylonitrile
production
Total
1990 6,085 740 244 7,069 1991 6,169 657 244 7,070 1992 6,228 648 248 7,125 1993 6,765 598 245 7,608 1994 6,407 784 260 7,451 1995 6,035 777 268 7,080 1996 6,020 794 277 7,090 1997 6,020 733 285 7,037 1998 5,990 774 293 7,057 1999 5,731 691 301 6,723 2000 5,670 903 309 6,882 2001 5,134 833 317 6,284 2002 4,837 866 325 6,028 2003 4,864 890 333 6,088 2004 5,400 921 342 6,663 2005 5,440 917 350 6,707
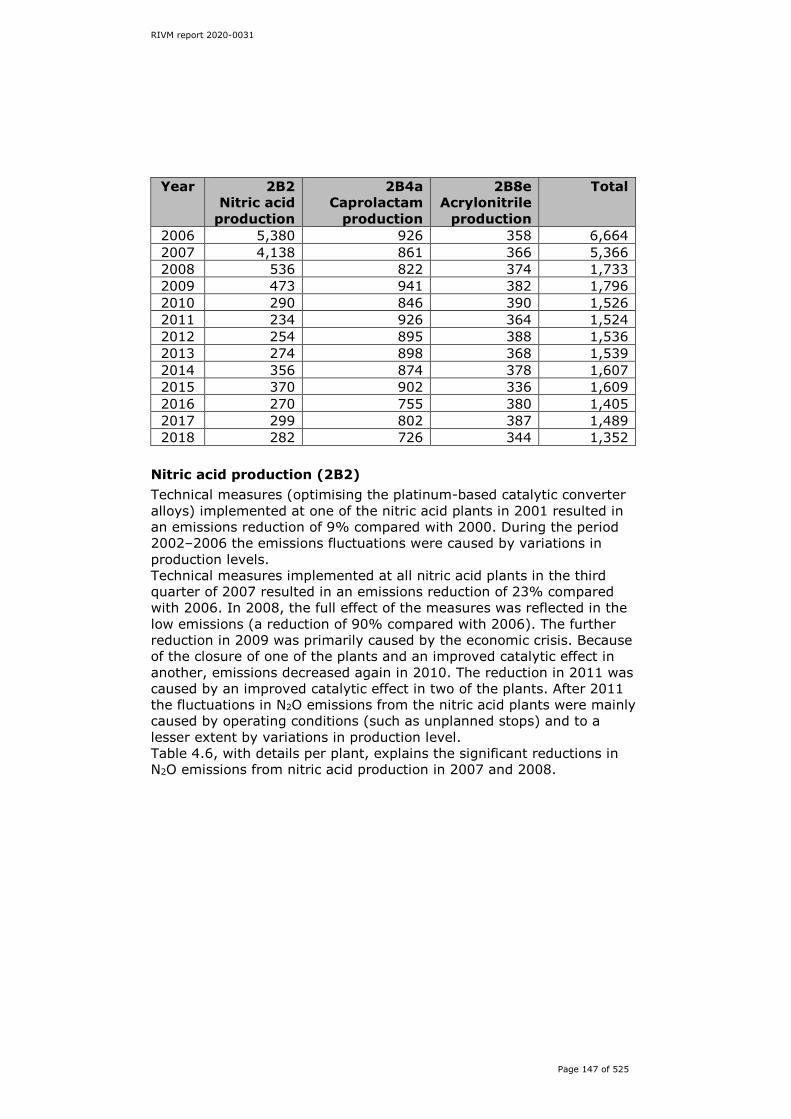
RIVM report 2020-0031
Page 147 of 525
Year 2B2 Nitric acid
production
2B4a Caprolactam
production
2B8e Acrylonitrile
production
Total
2006 5,380 926 358 6,664 2007 4,138 861 366 5,366 2008 536 822 374 1,733 2009 473 941 382 1,796 2010 290 846 390 1,526 2011 234 926 364 1,524 2012 254 895 388 1,536 2013 274 898 368 1,539 2014 356 874 378 1,607 2015 370 902 336 1,609 2016 270 755 380 1,405 2017 299 802 387 1,489 2018 282 726 344 1,352
Nitric acid production (2B2) Technical measures (optimising the platinum-based catalytic converter alloys) implemented at one of the nitric acid plants in 2001 resulted in an emissions reduction of 9% compared with 2000. During the period 2002–2006 the emissions fluctuations were caused by variations in production levels. Technical measures implemented at all nitric acid plants in the third quarter of 2007 resulted in an emissions reduction of 23% compared with 2006. In 2008, the full effect of the measures was reflected in the low emissions (a reduction of 90% compared with 2006). The further reduction in 2009 was primarily caused by the economic crisis. Because of the closure of one of the plants and an improved catalytic effect in another, emissions decreased again in 2010. The reduction in 2011 was caused by an improved catalytic effect in two of the plants. After 2011 the fluctuations in N2O emissions from the nitric acid plants were mainly caused by operating conditions (such as unplanned stops) and to a lesser extent by variations in production level. Table 4.6, with details per plant, explains the significant reductions in N2O emissions from nitric acid production in 2007 and 2008.
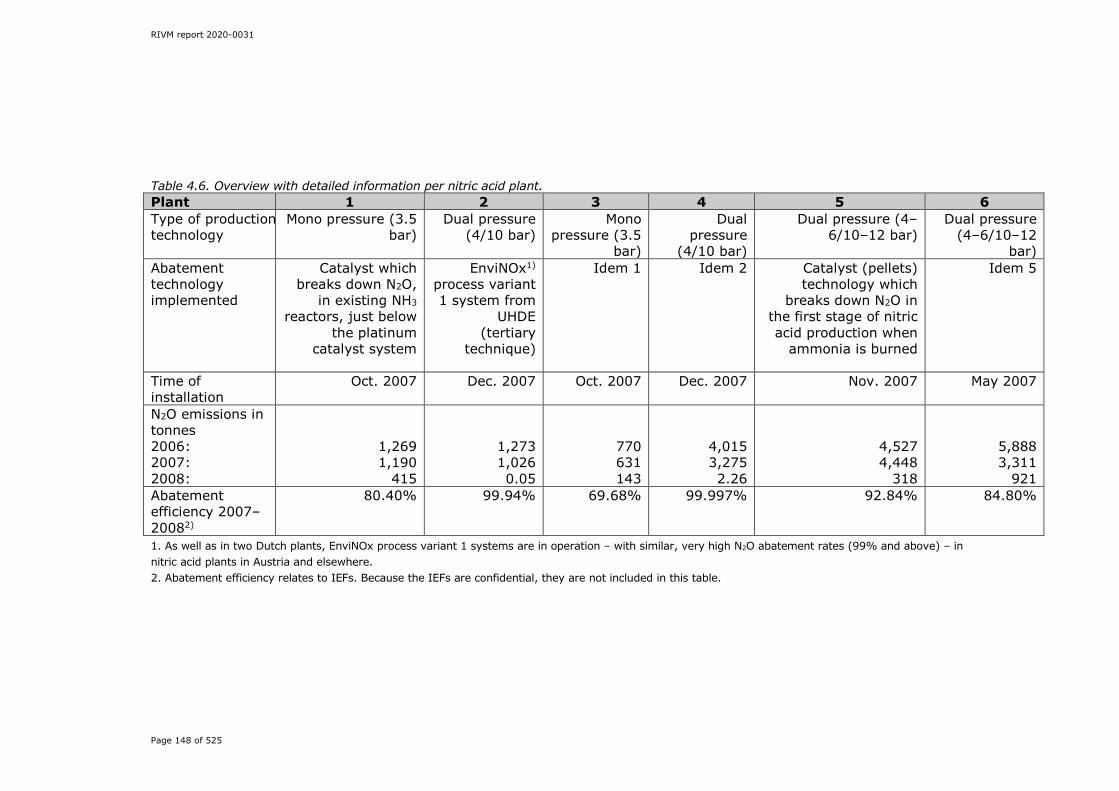
RIVM report 2020-0031
Page 148 of 525
Table 4.6. Overview with detailed information per nitric acid plant. Plant 1 2 3 4 5 6 Type of production technology
Mono pressure (3.5 bar)
Dual pressure (4/10 bar)
Mono pressure (3.5
bar)
Dual pressure
(4/10 bar)
Dual pressure (4–6/10–12 bar)
Dual pressure (4–6/10–12
bar) Abatement technology implemented
Catalyst which breaks down N2O,
in existing NH3 reactors, just below
the platinum catalyst system
EnviNOx1)
process variant 1 system from
UHDE (tertiary
technique)
Idem 1 Idem 2 Catalyst (pellets) technology which
breaks down N2O in the first stage of nitric acid production when
ammonia is burned
Idem 5
Time of installation
Oct. 2007 Dec. 2007 Oct. 2007 Dec. 2007 Nov. 2007 May 2007
N2O emissions in tonnes 2006: 2007: 2008:
1,269 1,190
415
1,273 1,026 0.05
770 631 143
4,015 3,275 2.26
4,527 4,448
318
5,888 3,311
921 Abatement efficiency 2007–20082)
80.40% 99.94% 69.68% 99.997% 92.84% 84.80%
1. As well as in two Dutch plants, EnviNOx process variant 1 systems are in operation – with similar, very high N2O abatement rates (99% and above) – in nitric acid plants in Austria and elsewhere. 2. Abatement efficiency relates to IEFs. Because the IEFs are confidential, they are not included in this table.

RIVM report 2020-0031
Page 149 of 525
From 2008 onwards, N2O emissions from HNO3 production in the Netherlands came under the EU-ETS. For this purpose, the companies developed monitoring plans that were approved by the NEa (the government organisation responsible for EU-ETS in the Netherlands, including emission verification). In 2018, the companies’ emissions reports (2017 emissions) were independently verified and submitted to the NEa, where they were checked against those reported in the CRF tables (for the year 2017). No differences were found between the emissions figures in the CRF tables and those in the emissions reports under EU-ETS. Caprolactam production (2B4a) and Acrylonitrile production (2B8e) The emissions fluctuations from these sources are mainly caused by variations in production level. Fluorochemical production (2B9) Table 4.7 shows the trend in HFC emissions from the categories HCFC-22 production and HFCs/PFCs from handling activities for the period 1990–2018. Emissions of HFC-23 increased by approximately 35% in the period 1995–1998, due to increased production of HCFC-22. In the period 1998–2000, however, emissions of HFC-23 decreased by 69% following the installation of a thermal converter (TC) at the plant. The removal efficiency of the TC (kg HFC-23 processed in TC/kg HFC-23 in untreated flow/year) is the primary factor and production level the secondary factor influencing the variation in emission levels during the 2000–2008 period. Due to the economic crisis, the production level of HCFC-22 was much lower in the last quarter of 2008 and in 2009, resulting in lower HFC-23 emissions in both 2008 and 2009. Primarily as a result of the economic recovery, the production level of HCFC-22 was much higher in 2010, resulting in higher HFC-23 emissions in 2010, compared with 2009. After 2010 the emission fluctuations are mainly caused by the fluctuations in the removal efficiency of the TC and to a lesser extent by the production level. The significant emissions fluctuations in sub-category 2B9b3 (Handling activities) during the period 1992–2018 can be explained by the large fluctuations in handling activities, which depend on the demand from customers.
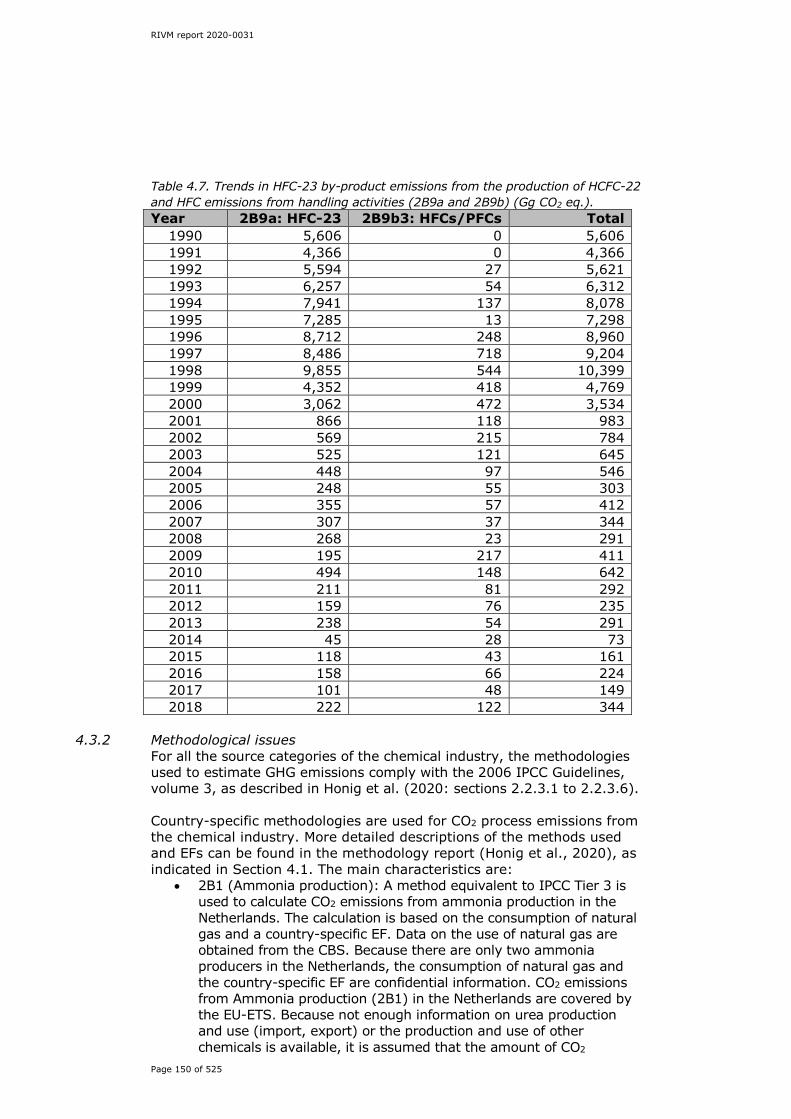
RIVM report 2020-0031
Page 150 of 525
Table 4.7. Trends in HFC-23 by-product emissions from the production of HCFC-22 and HFC emissions from handling activities (2B9a and 2B9b) (Gg CO2 eq.). Year 2B9a: HFC-23 2B9b3: HFCs/PFCs Total
1990 5,606 0 5,606 1991 4,366 0 4,366 1992 5,594 27 5,621 1993 6,257 54 6,312 1994 7,941 137 8,078 1995 7,285 13 7,298 1996 8,712 248 8,960 1997 8,486 718 9,204 1998 9,855 544 10,399 1999 4,352 418 4,769 2000 3,062 472 3,534 2001 866 118 983 2002 569 215 784 2003 525 121 645 2004 448 97 546 2005 248 55 303 2006 355 57 412 2007 307 37 344 2008 268 23 291 2009 195 217 411 2010 494 148 642 2011 211 81 292 2012 159 76 235 2013 238 54 291 2014 45 28 73 2015 118 43 161 2016 158 66 224 2017 101 48 149 2018 222 122 344
4.3.2 Methodological issues
For all the source categories of the chemical industry, the methodologies used to estimate GHG emissions comply with the 2006 IPCC Guidelines, volume 3, as described in Honig et al. (2020: sections 2.2.3.1 to 2.2.3.6). Country-specific methodologies are used for CO2 process emissions from the chemical industry. More detailed descriptions of the methods used and EFs can be found in the methodology report (Honig et al., 2020), as indicated in Section 4.1. The main characteristics are:
• 2B1 (Ammonia production): A method equivalent to IPCC Tier 3 is used to calculate CO2 emissions from ammonia production in the Netherlands. The calculation is based on the consumption of natural gas and a country-specific EF. Data on the use of natural gas are obtained from the CBS. Because there are only two ammonia producers in the Netherlands, the consumption of natural gas and the country-specific EF are confidential information. CO2 emissions from Ammonia production (2B1) in the Netherlands are covered by the EU-ETS. Because not enough information on urea production and use (import, export) or the production and use of other chemicals is available, it is assumed that the amount of CO2
RIVM report 2020-0031
Page 151 of 525
recovered is zero. This is a worst case emission estimate, as the Netherlands is a net exporter of fertilisers.
• 2B2 (Nitric acid production): An IPCC Tier 2 method is used to estimate N2O emissions. Until 2002, N2O emissions from nitric acid production were based on IPCC default EFs. N2O emissions measurements made in 1998 and 1999 resulted in a new EF of 7.4 kg N2O/ton nitric acid for total nitric acid production. The results of these measurements are confidential and can be viewed at the company’s premises.
• Plant-specific EFs for the period 1990–1998 are not available. Because no measurements were taken but the operational conditions did not change during the period 1990–1998, the EFs obtained from the 1998/1999 measurements have been used to recalculate emissions for the period 1990–1998. Activity data are also confidential.
• The emissions figures are based on data reported by the nitric acid manufacturing industry and are included in the emissions reports under EU-ETS and the national Pollutant Release and Transfer Register (PRTR).
• 2B4a (Caprolactam production): From 2015 onwards, N2O emissions are based on the updated and improved measurement programme in 2014. For the period 2005–2014 a recalculation was done with the help of the insights provided by the updated and improved N2O emissions measurement programme. The recalculation for the period 1990–2004 was done by using the ‘new’ average IEF for 2005–2015.
• Information about the methods used before 2015 can be found in Honig et al. (2020), as indicated in Section 4.1.
• 2B5 (Carbide production): The activity data (petcoke) are confidential, so the IPCC default EF was used to calculate CH4
emissions. • 2B6 (Titanium dioxide production): Activity data, EF and
emissions are confidential. CO2 emissions are calculated on the basis of the non-energy use of coke and a plant-specific EF.
• 2B7 (Soda ash production): Before the closure in 2010 of the only soda ash producer in the Netherlands, CO2 emissions were calculated on the basis of the non-energy use of coke and the IPCC default EF (0.415 t/t), assuming the 100% oxidation of carbon. The environmental report was used for data on the non-energy use of coke. To avoid double counting, the plant-specific figures on the non-energy use of coke were subtracted from the figures on non-energy use of coke. This data was earmarked as feedstock in national energy statistics. The Netherlands has included the notation code ‘NO’ in the CRF tables from 2010 onwards, as soda ash production has stopped.
• 2B8 (Petrochemicals and carbon black production): o 2B8a: methanol, CH4; o 2B8b: ethylene, CH4; o 2B8e: acrylonitrile, CO2; CH4; N2O; o 2B8f: carbon black, CH4. The CO2 and CH4 process emissions from these minor sources are calculated by multiplying the IPCC default EFs by the annual production figures from the AERs (Tier 1). The N2O emissions from 2017 onwards are based on measurements. For the periods
RIVM report 2020-0031
Page 152 of 525
1990–1994 and 2010–2016 the emissions are calculated with the help of the emission and production levels in 2017 and the production levels in both periods. Emissions for the period 1995–2009 are determined by extrapolation between 1994 and 2010.
• 2B8d (Ethylene oxide production): CO2 emissions are estimated on the basis of capacity data by using a default capacity utilisation rate of 86% (based on Neelis et al., 2005) and applying the default EF of 0.86 t/t ethylene oxide. As there are no actual activity data available for ethylene production at this moment in the Prodcom database from EUROSTAT, the Netherlands cannot verify this assumption. For reasons of confidentiality all above-mentioned sources of 2B8, 2B5 and 2B6 are included in 2B8g.
• 2B9a1 (production of HCFC-22): This source category is identified as a trend key source of HFC-23 emissions. In order to comply with the 2006 IPCC Guidelines, volume 3, an IPCC Tier 2 method is used to estimate emissions from this source category. HFC-23 emissions are calculated using the following formula:
• HFC-23 emissions = HFC-23 load in untreated flow - amount of untreated HFC-23, destroyed in the TC.
• The HFC-23 load in the untreated flow is determined by a continuous flow meter in combination with an in-line analysis of the composition of the stream. The amount of HFC-23 destroyed in the TC is registered by the producer.
• 2B9b3 (Handling activities: HFCs): Tier 1 country-specific methodologies are used to estimate emissions of HFCs from handling activities. The estimations are based on emissions data reported by the manufacturing and sales companies. Activity data used to estimate HFC emissions are confidential. The EFs used are plant-specific and confidential, and they are based on 1999 measurement data.
• 2B10 (Other): The aggregated CO2 emissions included in this source category are not identified as a key source. Because no IPCC methodologies exist for these processes, country-specific methods and EFs are used. These refer to: o The production of industrial gases: With natural gas as input
(chemical feedstock), industrial gases, e.g. H2 and CO, are produced. The oxidation fraction of 20% (80% storage) is derived from Huurman (2005). From the two producers in the Netherlands, the total amount of carbon stored in the industrial gases produced and the total carbon content of the natural gas used as feedstock are derived from the AERs. These data result in a storage factor of 80%. The storage factor is determined by dividing the total amount of carbon stored in the industrial gases produced by the carbon content of the natural gas used as feedstock.
o Production of carbon electrodes: CO2 emissions are estimated on the basis of fuel use (mainly petcoke and coke). A small oxidation fraction (5%) is assumed, based on data reported in the AERs.
o Production of activated carbon: From 2013 onwards, CO2 emissions from activated carbon production in the Netherlands were included in the EU-ETS. So, from the 2015 submission, the figures are based on the verified EU-ETS Emission Reports of the activated carbon producer. For the

RIVM report 2020-0031
Page 153 of 525
years 2004 and 2005 peat use data have been obtained from the AERs and the emissions calculated with the help of the C-content of the peat in 2013. For the years before 2003 no peat use and C-content data are available. Therefore, emissions for the period 1990–2002 are kept equal to the emissions of 2004. Emissions for the period 2005–2012 have been determined by extrapolation between 2004 and 2013.
Activity data for estimating CO2 emissions are based on data for the feedstock use of fuels provided by the CBS.
4.3.3 Uncertainty and time series consistency Uncertainty The Approach 1 uncertainty analysis outlined in Annex 2 (shown in Tables A2.1 and A2.2) provides estimates of uncertainties according to IPCC source categories. The uncertainty in annual CO2 emissions from ammonia production is estimated to be approximately 10%. For all the other sources in this category the uncertainty is estimated to be about 70%. The uncertainty in the activity data and the EF for CO2 is estimated at 2% and 10%, respectively, for ammonia production and at 50% for all the other sources in this category. The uncertainty in the annual emissions of N2O from caprolactam and acrylonitrile production is estimated to be approximately 30%. Since N2O emissions from HNO3 production in the Netherlands are included in the EU-ETS, all companies have continuous measuring of their N2O emissions. This has resulted in a lower annual emissions uncertainty, of approximately 8%. The uncertainty in HFC-23 emissions from HCFC-22 production is estimated to be approximately 15%. For HFC emissions from handling activities the uncertainty is estimated to be about 20%. These figures are all based on expert judgement. Time series consistency Consistent methodologies are used throughout the time series for the sources in this category. A certain amount of extrapolation is involved with respect to emissions data for acrylonitrile production, thereby introducing further uncertainties for the period 1995–2009.
4.3.4 Category-specific QA/QC and verification The source categories are covered by the general QA/QC procedures discussed in Chapter 1. N2O emissions from HNO3 production are also verified by the EU-ETS. For Ammonia production (2B1) the energy and emissions data from the EU-ETS companies have been compared with the sector data from the CBS and the national inventory (emissions). For both source categories no differences were found. For the production of HCFC-22 (2B9a1) the operators’ data in annual environmental reports (including the confidential information) are verified annually by the competent authority and the Dutch inventory IPPU expert, consecutively. These (annual) comparisons are documented in a (confidential) document. This document can be made available to the ERT upon request, after signature of a confidentiality agreement.

RIVM report 2020-0031
Page 154 of 525
4.3.5 Category-specific recalculations No recalculations have been made.
4.3.6 Category-specific planned improvements No improvements are planned.
4.4 Metal production (2C) 4.4.1 Source category description
General description of the source categories The national inventory of the Netherlands includes emissions of GHGs related to two source categories belonging to 2C (Metal production):
• Iron and steel production (2C1): CO2 emissions: the Netherlands has one integrated iron and steel plant (Tata Steel, previously Corus and/or Hoogovens). The process emissions from anode use during steel production in the electric arc furnace are also included in this category.
• Aluminium production (2C3): CO2 and PFC emissions: The Netherlands had two primary aluminium smelters: Zalco, previously Pechiney (partly closed at the end of 2011) and Aldel (closed at the end of 2013). Towards the end of 2014 Aldel restarted its plant under the name Klesch Aluminium Delfzijl.
• CO2 is produced by the reaction of the carbon anodes with alumina and by the reaction of the anode with other sources of oxygen (especially air). PFCs (CF4 and C2F6) are formed during the phenomenon known as the anode effect, which occurs when the concentration of aluminium oxide in the reduction cell electrolyte drops below a certain level.
There are some small Ferroalloy trading companies in the Netherlands, which do not produce ferroalloys and so do not have GHG process emissions that would be included in 2C2. Their combustion emissions are included in 1A2. The following sources of GHG emissions do not exist in the Netherlands:
• magnesium production (2C4); • lead production (2C5); • zinc production via electro-thermic distillation or the
pyrometallurgical process (2C6); • other metal production (2C7).
Overview of shares and trends in emissions Table 4.8 provides an overview of emissions, by proportion, from the main source categories. From 2003 onwards, the level of the PFC emissions from aluminium production (2C3) decreased sharply because reduction measures (side feed to point feed) were taken (see Table 4.9). From then on, emissions depended mainly on the number of anode effects and little on production level.
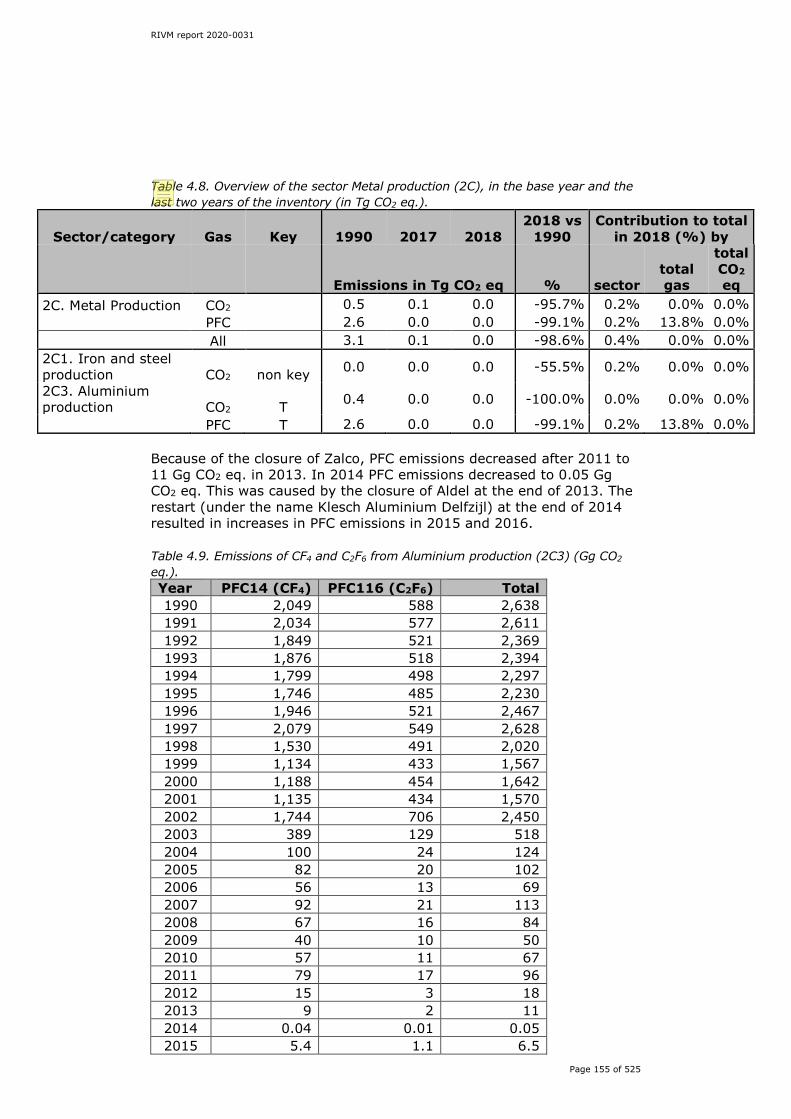
RIVM report 2020-0031
Page 155 of 525
Table 4.8. Overview of the sector Metal production (2C), in the base year and the last two years of the inventory (in Tg CO2 eq.).
Sector/category Gas Key 1990 2017 2018 2018 vs
1990 Contribution to total
in 2018 (%) by
Emissions in Tg CO2 eq % sector total gas
total CO2 eq
2C. Metal Production CO2 0.5 0.1 0.0 -95.7% 0.2% 0.0% 0.0% PFC 2.6 0.0 0.0 -99.1% 0.2% 13.8% 0.0% All 3.1 0.1 0.0 -98.6% 0.4% 0.0% 0.0% 2C1. Iron and steel production CO2 non key 0.0 0.0 0.0 -55.5% 0.2% 0.0% 0.0%
2C3. Aluminium production CO2 T 0.4 0.0 0.0 -100.0% 0.0% 0.0% 0.0%
PFC T 2.6 0.0 0.0 -99.1% 0.2% 13.8% 0.0% Because of the closure of Zalco, PFC emissions decreased after 2011 to 11 Gg CO2 eq. in 2013. In 2014 PFC emissions decreased to 0.05 Gg CO2 eq. This was caused by the closure of Aldel at the end of 2013. The restart (under the name Klesch Aluminium Delfzijl) at the end of 2014 resulted in increases in PFC emissions in 2015 and 2016. Table 4.9. Emissions of CF4 and C2F6 from Aluminium production (2C3) (Gg CO2 eq.). Year PFC14 (CF4) PFC116 (C2F6) Total 1990 2,049 588 2,638 1991 2,034 577 2,611 1992 1,849 521 2,369 1993 1,876 518 2,394 1994 1,799 498 2,297 1995 1,746 485 2,230 1996 1,946 521 2,467 1997 2,079 549 2,628 1998 1,530 491 2,020 1999 1,134 433 1,567 2000 1,188 454 1,642 2001 1,135 434 1,570 2002 1,744 706 2,450 2003 389 129 518 2004 100 24 124 2005 82 20 102 2006 56 13 69 2007 92 21 113 2008 67 16 84 2009 40 10 50 2010 57 11 67 2011 79 17 96 2012 15 3 18 2013 9 2 11 2014 0.04 0.01 0.05 2015 5.4 1.1 6.5
Editor
Usual correx.

RIVM report 2020-0031
Page 156 of 525
Year PFC14 (CF4) PFC116 (C2F6) Total 2016 11.3 2.3 13.6 2017 10.8 2.2 13.0 2018 18.7 3.8 22.5
4.4.2 Methodological issues
The methodologies used to estimate GHG emissions in all source categories of metal production comply with the 2006 IPCC Guidelines. More detailed descriptions of the methods and EFs used can be found in Honig et al. (2020: sections 2.1.3.3 and 2.2.3.2 (iron and steel production) and 2.2.3.7 (aluminium production)). Iron and steel production (2C1) As mentioned in Section 3.2.5 (for sub-category 1A2a), the emissions calculation for this category is based on a mass balance, which is not included in the NIR for reasons of confidentiality but can be made available for review purposes. Process emissions – from, amongst other things, the conversion of pig iron to steel – are obtained from the C mass balance. From 2000 onwards, data reported in the C mass balance of Tata Steel have been used to calculate CO2 process emissions. For the period 1990–2000, CO2 emissions have been calculated by multiplying the average IEF (8.3 kg CO2 per ton of crude steel produced) over the 2000–2003 period by crude steel production. In former submissions the Netherlands reported fuel-related emissions in this category. During the in-country review this was considered not to be transparent. To improve transparency all fuel-related emissions are now reported in the Energy sector, with the result that emissions in this category have decreased strongly in comparison with previous submissions. For anode use in the electric arc furnace, an EF of 5 kg CO2/ton steel produced is used. Aluminum production (2C3) A Tier 1a IPCC method (IPCC, 2006) is used to estimate CO2 emissions from the anodes used in the primary production of aluminium, with aluminium production serving as activity data. Activity and emissions data are based on data reported in the AERs of both companies. In order to calculate the IPCC default EF, the stoichiometric ratio of carbon needed to reduce the aluminium ore to pure aluminium is based on the reaction:
Al2O3 + 3/2C 2Al + 3/2 CO2. This factor is corrected to include additional CO2 produced by the reaction of the carbon anode with oxygen in the air. A country-specific EF of 0.00145 tons CO2 per ton of aluminium is used to estimate CO2 emissions and it has been verified that this value is within the range of the IPCC factor of 0.0015 and the factor of 0.00143 calculated by the
RIVM report 2020-0031
Page 157 of 525
World Business Council for Sustainable Development (WBCSD) (WBCSD/WRI, 2004). Estimations of PFC emissions from primary aluminium production reported by these two facilities are based on the IPCC Tier 2 method for the complete period 1990–2017. EFs are plant-specific and confidential and are based on measured data.
4.4.3 Uncertainty and time series consistency Uncertainty The Approach 1 uncertainty analysis explained in Annex 2, provides estimates of uncertainties per IPCC source category. The uncertainty in annual CO2 emissions is estimated at approximately 6% for iron and steel production and 5% for aluminium production, whereas the uncertainty in PFC emissions from aluminium production is estimated to be 20%. The uncertainty in the activity data is estimated at 2% for aluminium production and 3% for iron and steel production. The uncertainty in the EFs for CO2 (from all sources in this category) is estimated at 5% and for PFC from aluminium production at 20%. Time series consistency A consistent methodology is used throughout the time series.
4.4.4 Category-specific QA/QC and verification The source categories are covered by the general QA/QC procedures discussed in Chapter 1. For the source category 2C1 the activity and emissions data of the AERs were compared with the EU-ETS monitoring reports. No differences were found. The confidential production data for pellet and sinter can be made available to the review team.
4.4.5 Category-specific recalculations No category specific recalculations were made.
4.4.6 Category-specific planned improvements No improvements are planned.
4.5 Non-energy products from fuels and solvent use (2D) 4.5.1 Source category description
Table 4.10 presents an overview of emissions related to to three sources in this category. The CO2 emissions reported in categories 2D1 and 2D2 stem from the direct use of specific fuels for non-energy purposes, which results in partial or full oxidation during use (ODU) of the carbon contained in the products, e.g. candles. CO2 emissions reported in category 2D3 stem from Urea use in SCR in diesel vehicles.

RIVM report 2020-0031
Page 158 of 525
Table 4.10. Overview of the sector Non-energy products from fuels and solvents use (2D), in the base year and the last two years of the inventory (in Tg CO2 eq.).
Sector/category Gas Key 1990 2017 2018 2018 vs
1990 Contribution to total in
2018 (%) by
Emissions in Tg CO2
eq % sector total gas
total CO2 eq
2D. Non-energy products from fuels and solvent use CO2 0.2 0.3 0.3 73.0% 2.8% 0.2% 0.2% CH4 0.0 0.0 0.0 104.5% 0.0% 0.0% 0.0% All 0.2 0.3 0.3 73.0% 2.8% 0.0% 0.2% 2D1. Lubricant use CO2 non key 0.1 0.1 0.1 10.3% 0.8% 0.1% 0.0% 2D2. Paraffin wax use CO2 L.T 0.1 0.2 0.2 104.5% 1.8% 0.1% 0.1% 2D3. Other non specified CO2 non key 0.00 0.02 0.02 0.2% 0.0% 0.0%
CO2 emissions from paraffin wax use are identified as an Approach 2 level and trend key source in this category (see Annex 1). Overview of shares and trends in emissions The small CO2 and CH4 emissions from 2D1 and 2D2 remained fairly constant between 1990 and 2017. CO2 emissions from Urea use in diesel vehicles (2D3) increased from 0 to 21 kton during the period 2005-2018. Due to the small amounts these are not visible in Table 4.10.
4.5.2 Methodological issues The methodologies used to estimate GHG emissions in 2D1, 2D2 and 2D3 comply with the 2006 IPCC Guidelines, volume 3, as described in Honig et al. (2020: section 2.2.3.1). A Tier 1 method is used to estimate emissions from lubricants and waxes using IPCC default EFs. For the use of lubricants, an ODU factor of 20% and for the use of waxes an ODU factor of 100% have been used. CO2 emissions from urea-based catalysts are estimated with a Tier 3 methodology using country-specific CO2 EFs for different vehicle types. More detailed descriptions of the method and EFs used can be found in Geilenkirchen et al. (2020). The activity data are based on fuel use data from the CBS.
4.5.3 Uncertainty and time series consistency Uncertainty The Approach 1 uncertainty analysis outlined in Annex 2 and shown in Tables A2.1 and A2.2 provides estimates of the uncertainties by IPCC source category. The uncertainty in the CO2 EF is estimated to be approximately 50% in the ODU factor for lubricants. The uncertainty in the activity data (such as domestic consumption of these fuel types) is generally very large, since it is based on production, import and export figures. These sources do not affect the overall total or the trend in direct GHG emissions.
Editor
Usual correx.

RIVM report 2020-0031
Page 159 of 525
Time series consistency Consistent methodologies and activity data have been used to estimate emissions from these sources.
4.5.4 Category-specific QA/QC and verification The source categories are covered by the general QA/QC procedures discussed in Chapter 1.
4.5.5 Category-specific recalculations There were no category specific recalculations.
4.5.6 Category-specific planned improvements No improvements are planned.
4.6 Electronics industry (2E) 4.6.1 Source category description
PFCs (incl. NF3) and SF6 are released via the use of these compounds in Semiconductor manufacture (2E1). SF6 emissions are included in 2G2. PFC and SF6 emissions from thin-film transistor (TFT) flat panel displays (2E2), Photovoltaics (2E3) and Heat transfer fluid (2E4) manufacturing do not occur in the Netherlands. No Other sources (2E5) are identified in the inventory. Overview of shares and trends in emissions The contribution of F-gas emissions from category 2E to the total national inventory of F-gas emissions was 0.3% in 1990 and 2.3% in 2018). The latter figure corresponds to 0.04 Tg CO2 eq. and accounts for 0.02% of the national total GHG emissions in 2018 (Table 4.11). Table 4.11. Overview of the sector Integrated circuit or semiconductor (2E) in the base year and the last two years of the inventory (in Tg CO2 eq.).
Sector/category Gas Key 1990 2017 2018
2018 vs
1990 Contribution to total in
2018 (%) by
Emissions in Tg CO2 eq % sector total gas
total CO2 eq
2E1. Integrated circuit or semiconductor PFC non key 0.03 0.04 0.04 73.2% 0.4% 267% 0.0%
Due to an increasing production level in the semiconductor manufacturing industry, PFC emissions increased from 25 Gg CO2 eq. in the base year to 305 Gg CO2 eq. in 2007. The decrease after 2007 was mainly caused by an intensive PFC (incl. NF3) reduction scheme (see Table 4.12).
Editor
Usual correx.
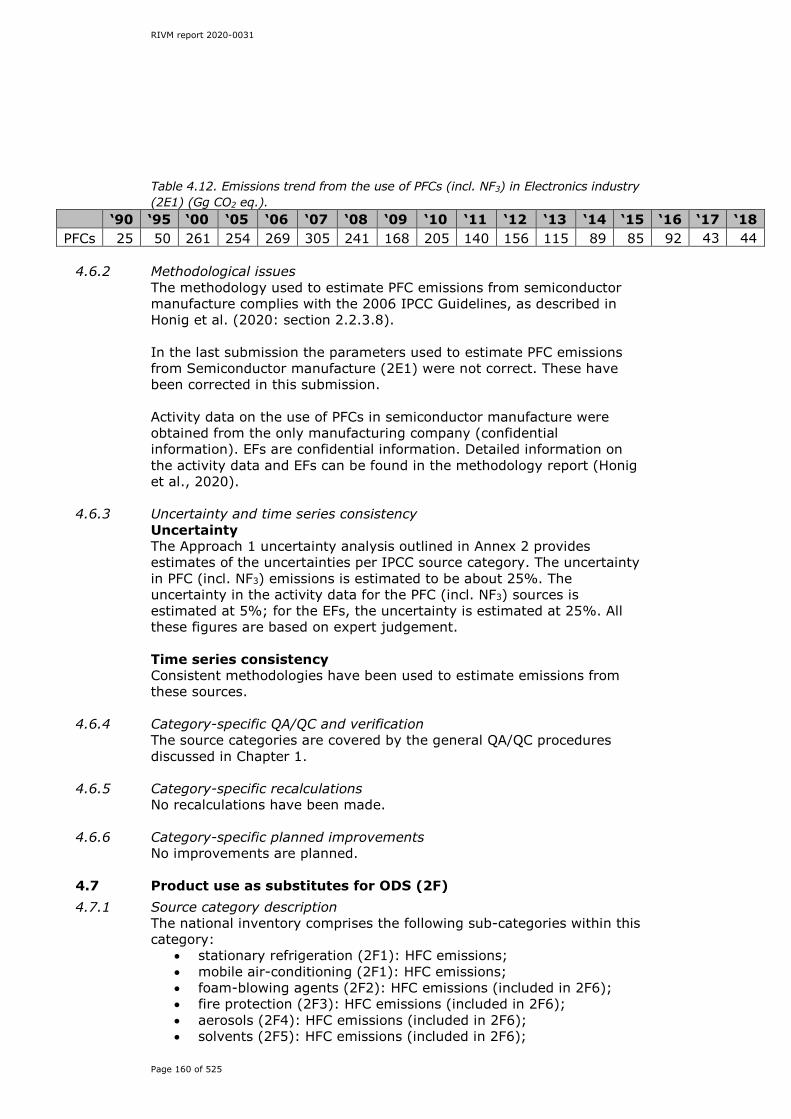
RIVM report 2020-0031
Page 160 of 525
Table 4.12. Emissions trend from the use of PFCs (incl. NF3) in Electronics industry (2E1) (Gg CO2 eq.).
‘90 ‘95 ‘00 ‘05 ‘06 ‘07 ‘08 ‘09 ‘10 ‘11 ‘12 ‘13 ‘14 ‘15 ‘16 ‘17 ‘18 PFCs 25 50 261 254 269 305 241 168 205 140 156 115 89 85 92 43 44
4.6.2 Methodological issues
The methodology used to estimate PFC emissions from semiconductor manufacture complies with the 2006 IPCC Guidelines, as described in Honig et al. (2020: section 2.2.3.8). In the last submission the parameters used to estimate PFC emissions from Semiconductor manufacture (2E1) were not correct. These have been corrected in this submission. Activity data on the use of PFCs in semiconductor manufacture were obtained from the only manufacturing company (confidential information). EFs are confidential information. Detailed information on the activity data and EFs can be found in the methodology report (Honig et al., 2020).
4.6.3 Uncertainty and time series consistency Uncertainty The Approach 1 uncertainty analysis outlined in Annex 2 provides estimates of the uncertainties per IPCC source category. The uncertainty in PFC (incl. NF3) emissions is estimated to be about 25%. The uncertainty in the activity data for the PFC (incl. NF3) sources is estimated at 5%; for the EFs, the uncertainty is estimated at 25%. All these figures are based on expert judgement. Time series consistency Consistent methodologies have been used to estimate emissions from these sources.
4.6.4 Category-specific QA/QC and verification The source categories are covered by the general QA/QC procedures discussed in Chapter 1.
4.6.5 Category-specific recalculations No recalculations have been made.
4.6.6 Category-specific planned improvements No improvements are planned.
4.7 Product use as substitutes for ODS (2F) 4.7.1 Source category description
The national inventory comprises the following sub-categories within this category:
• stationary refrigeration (2F1): HFC emissions; • mobile air-conditioning (2F1): HFC emissions; • foam-blowing agents (2F2): HFC emissions (included in 2F6); • fire protection (2F3): HFC emissions (included in 2F6); • aerosols (2F4): HFC emissions (included in 2F6); • solvents (2F5): HFC emissions (included in 2F6);
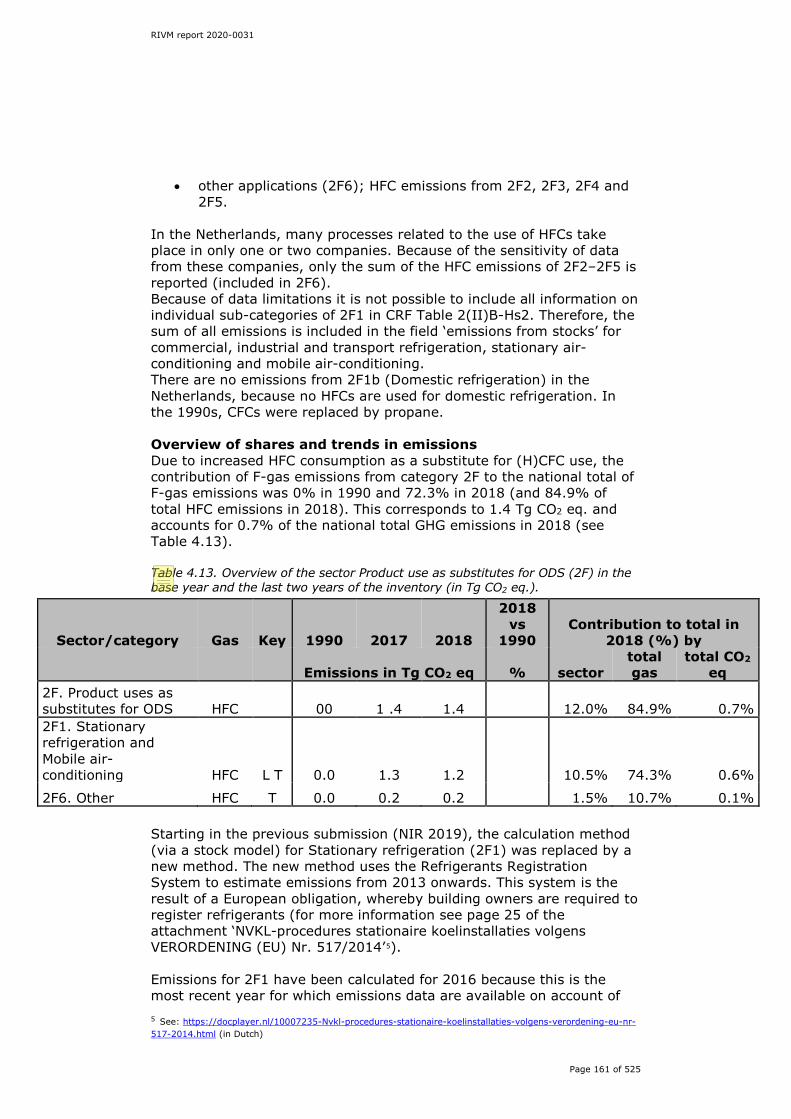
RIVM report 2020-0031
Page 161 of 525
• other applications (2F6); HFC emissions from 2F2, 2F3, 2F4 and 2F5.
In the Netherlands, many processes related to the use of HFCs take place in only one or two companies. Because of the sensitivity of data from these companies, only the sum of the HFC emissions of 2F2–2F5 is reported (included in 2F6). Because of data limitations it is not possible to include all information on individual sub-categories of 2F1 in CRF Table 2(II)B-Hs2. Therefore, the sum of all emissions is included in the field ‘emissions from stocks’ for commercial, industrial and transport refrigeration, stationary air-conditioning and mobile air-conditioning. There are no emissions from 2F1b (Domestic refrigeration) in the Netherlands, because no HFCs are used for domestic refrigeration. In the 1990s, CFCs were replaced by propane. Overview of shares and trends in emissions Due to increased HFC consumption as a substitute for (H)CFC use, the contribution of F-gas emissions from category 2F to the national total of F-gas emissions was 0% in 1990 and 72.3% in 2018 (and 84.9% of total HFC emissions in 2018). This corresponds to 1.4 Tg CO2 eq. and accounts for 0.7% of the national total GHG emissions in 2018 (see Table 4.13). Table 4.13. Overview of the sector Product use as substitutes for ODS (2F) in the base year and the last two years of the inventory (in Tg CO2 eq.).
Sector/category Gas Key 1990 2017 2018
2018 vs
1990 Contribution to total in
2018 (%) by
Emissions in Tg CO2 eq % sector total gas
total CO2 eq
2F. Product uses as substitutes for ODS HFC 00 1 .4 1.4 12.0% 84.9% 0.7% 2F1. Stationary refrigeration and Mobile air-conditioning HFC L T 0.0 1.3 1.2 10.5% 74.3% 0.6%
2F6. Other HFC T 0.0 0.2 0.2 1.5% 10.7% 0.1% Starting in the previous submission (NIR 2019), the calculation method (via a stock model) for Stationary refrigeration (2F1) was replaced by a new method. The new method uses the Refrigerants Registration System to estimate emissions from 2013 onwards. This system is the result of a European obligation, whereby building owners are required to register refrigerants (for more information see page 25 of the attachment ‘NVKL-procedures stationaire koelinstallaties volgens VERORDENING (EU) Nr. 517/2014’5). Emissions for 2F1 have been calculated for 2016 because this is the most recent year for which emissions data are available on account of 5 See: https://docplayer.nl/10007235-Nvkl-procedures-stationaire-koelinstallaties-volgens-verordening-eu-nr-517-2014.html (in Dutch)
Editor
Usual correx.

RIVM report 2020-0031
Page 162 of 525
the delay in reporting. Due to the phasing-out of refrigerants with a high GWP, emissions decreased from 1.053 Mton in 2015 to 0.839 Mton in 2016 (see Table 4.14). The emissions in 2017 and 2018 were the same as in 2016. With the new method, emission figures are available for:
• 4 sectors: Commercial, Industrial, Stationary airco’s and Transport refrigeration;
• 4 emission sources: leakage, filling, dismantling and refrigerant management;
• 5 HFCs: HFC-125, HFC-134a, HFC-143a, HFC-23 and HFC-32. Presenting all these emission figures would require a large number of tables. Therefore, as an example, the sources of HFC-134a emissions from stationary cooling in the commercial sector for the year 2016 are presented below: Source HCF134-emission in kg, 2016 Refrigerant management Filling of (new) installations Leakage from working systems Dismantling insallations Total
235 79
31042 179
31535 These figures show that leakage emissions are the major emissions source from stationary cooling. Emissions from refrigerant management, filling and dismantling are almost negligible. The other three sectors show a comparable distribution of emissions over sources. Table 4.14. Emissions trends per sub-category from the use of HFCs as substitutes for ODS (Gg CO2 eq.). Year 2F1 Stationary
refrigeration HFCs
2F1 Mobile air-conditioning: HFC134a
2F6 Other applications: HFCs
HFCs Total
1990 NO NO NO NO 1991 NO NO NO NO 1992 NO NO NO NO 1993 NO NO NO NO 1994 16 3 62 81 1995 63 9 201 273 1996 143 17 474 634 1997 217 31 746 994 1998 267 54 849 1,170 1999 311 84 849 1,243 2000 420 122 689 1,231 2001 537 163 386 1,086 2002 644 204 181 1,029 2003 761 244 167 1,172
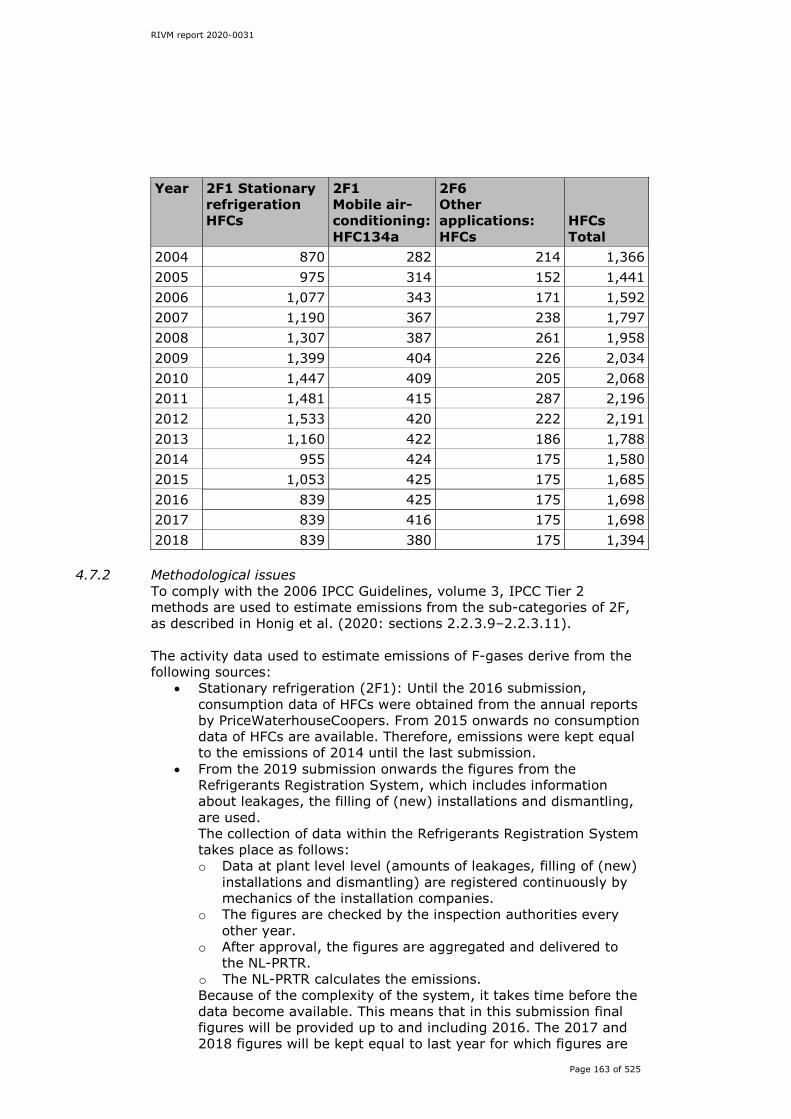
RIVM report 2020-0031
Page 163 of 525
Year 2F1 Stationary refrigeration HFCs
2F1 Mobile air-conditioning: HFC134a
2F6 Other applications: HFCs
HFCs Total
2004 870 282 214 1,366 2005 975 314 152 1,441 2006 1,077 343 171 1,592 2007 1,190 367 238 1,797 2008 1,307 387 261 1,958 2009 1,399 404 226 2,034 2010 1,447 409 205 2,068 2011 1,481 415 287 2,196 2012 1,533 420 222 2,191 2013 1,160 422 186 1,788 2014 955 424 175 1,580 2015 1,053 425 175 1,685 2016 839 425 175 1,698 2017 839 416 175 1,698 2018 839 380 175 1,394
4.7.2 Methodological issues To comply with the 2006 IPCC Guidelines, volume 3, IPCC Tier 2 methods are used to estimate emissions from the sub-categories of 2F, as described in Honig et al. (2020: sections 2.2.3.9–2.2.3.11). The activity data used to estimate emissions of F-gases derive from the following sources:
• Stationary refrigeration (2F1): Until the 2016 submission, consumption data of HFCs were obtained from the annual reports by PriceWaterhouseCoopers. From 2015 onwards no consumption data of HFCs are available. Therefore, emissions were kept equal to the emissions of 2014 until the last submission.
• From the 2019 submission onwards the figures from the Refrigerants Registration System, which includes information about leakages, the filling of (new) installations and dismantling, are used. The collection of data within the Refrigerants Registration System takes place as follows: o Data at plant level level (amounts of leakages, filling of (new)
installations and dismantling) are registered continuously by mechanics of the installation companies.
o The figures are checked by the inspection authorities every other year.
o After approval, the figures are aggregated and delivered to the NL-PRTR.
o The NL-PRTR calculates the emissions. Because of the complexity of the system, it takes time before the data become available. This means that in this submission final figures will be provided up to and including 2016. The 2017 and 2018 figures will be kept equal to last year for which figures are

RIVM report 2020-0031
Page 164 of 525
available (2016). In the 2021 submission, the 2017 figures from the current submission will be replaced by the final figures for 2017.
• For mobile air-conditioning (2F1), the number of cars (by year of construction) and the number of scrapped cars (by year of construction) were obtained from the CBS. The amounts of recycled and destroyed refrigerants were obtained from ARN, a waste-processing organisation (personal communication).
• Other applications (2F6): HFC emissions from 2F2, 2F3, 2F4 and 2F5: Until the 2016 submission, consumption data of HFCs were obtained from the annual reports by PriceWaterhouseCoopers. From 2015 onwards no consumption data of HFCs are available. Therefore, emissions from these sources are kept equal to the emissions of 2014.
EFs used to estimate emissions of F-gases in this category are based on the following:
• Stationary refrigeration: Until the 2016 submission annual leak rates from surveys (Baedts et al., 2001) were used. From this submission onwards figures from the Refrigerants Registration System are used. These include information about leakages, the filling of (new) installations and dismantling.
• Mobile air-conditioning: Annual leak rates from surveys (Baedts et al., 2001) and other literature (Minnesota Pollution Control Agency, 2009; YU & CLODIC, 2008).
• Other applications (2F6): IPCC default EFs. More detailed descriptions of the methods and EFS used can be found in the methodology report (Honig et al., 2020), as indicated in Section 4.1. For reasons of confidentiality, the detailed figures for Mobile air-conditioning (2F1) are not included in this submission, but can be made available for review purposes.
4.7.3 Uncertainty and time series consistency Uncertainty The Approach 1 uncertainty analysis outlined in Annex 2 provides estimates of uncertainties per IPCC source category. Based on expert judgement, the uncertainty in HFC emissions from HFC consumption is estimated to be approximately 50%, mostly determined by uncertainties in activity data. Time series consistency Consistent methodologies have been used to estimate emissions from Mobile air-conditioning (2F1) and Other applications (2F6). For Stationary refrigeration (2F1), two methods have been used to estimate emissions. The stock model method has been used for the period 1990–2012 and the method using the Refrigerants Registration System from 2013 onwards. For the stock model method, activity data were derived from the sales figures of individual HFCs to the total cooling sector in the Netherlands. Until the 2016 submission, these were available annually via a trade flow study. However, the trade flow study stopped after the 2016 submission (reporting year 2014). From reporting year 2015 onwards, the annual sales figures
RIVM report 2020-0031
Page 165 of 525
were not sufficiently reliable to allow for a split into the annual filling of new installations and the refilling of existing installations. It was also not possible to divide the sales among the different subsectors. Therefore, a stock model was set up for the complete sector, to determine the refilling of existing installations, the filling of new installations and other figures. To determine the different figures, a fixed leakage percentage was used. The starting year of the stock model was the year in which a certain HFC is used as cooling agent for the first time. The only actual input variables were the sales figures from HFCs. The other parameters (the filling of new installations, total stock, dismantling amounts, emissions) were calculated using the model. The new method uses figures from the Refrigerants Registration System to calculate emissions. In this system, data about leakages, filling of new installations, dismantling, etc. are collected from the sectors commercial, industrial and transport refrigeration and stationary air-conditioning. Data on leakages, filling of (new) installations, dismantling, etc. are not calculated but taken directly from the system. This new method provides more accurate data than the stock model method. All equipment with a content >3 kg is covered by the Refrigerants Registration System. This makes it the best source we have and as complete as possible. In addition, the emissions calculated with the new method are lower than those calculated with the old stock model method. That the stock model gave higher emissions was probably due to the assumption that usage figures were the same as the sales figures and the fact that a fixed leakage percentage of 5.8% was used, while according to the new method the average leakage rate during the period 2013–2015 was approximately 4%. Figures from the Refrigerants Registration System are available from 2013 onwards. As described above, the two methods are completely different. The old method uses default leakage percentages, whereas the new method is based on real refrigerant use schemes. Therefore, a comparison is unrealistic. For that reason it is nearly impossible to construct a consistent time series for the whole period 1990–2018. Based on the new method, real leakage percentages appear lower than the default guidebook factors. This is the reason why the old time series is higher than the new one. For the 2021 NIR submission (as a result of comments from the 2019 review), we will try to use the Overlap splicing technique from the IPCC Guidelines to create a consistent timeseries.
4.7.4 Category-specific QA/QC and verification The source categories are covered by the general QA/QC procedures discussed in Chapter 1. For the method used to estimate HFC emissions from Stationary refrigeration (2F1): HFC emissions, a quality control procedure is included in volume 3, paragraph 7.5.4.1 of the 2006 IPCC Guidelines. This control procedure compares the annual national HFC refrigerant market declared by the refrigerant distributors with annual HFC refrigerant needs. However, because the annual reports by PriceWaterhouseCoopers are no longer available, the data needed to
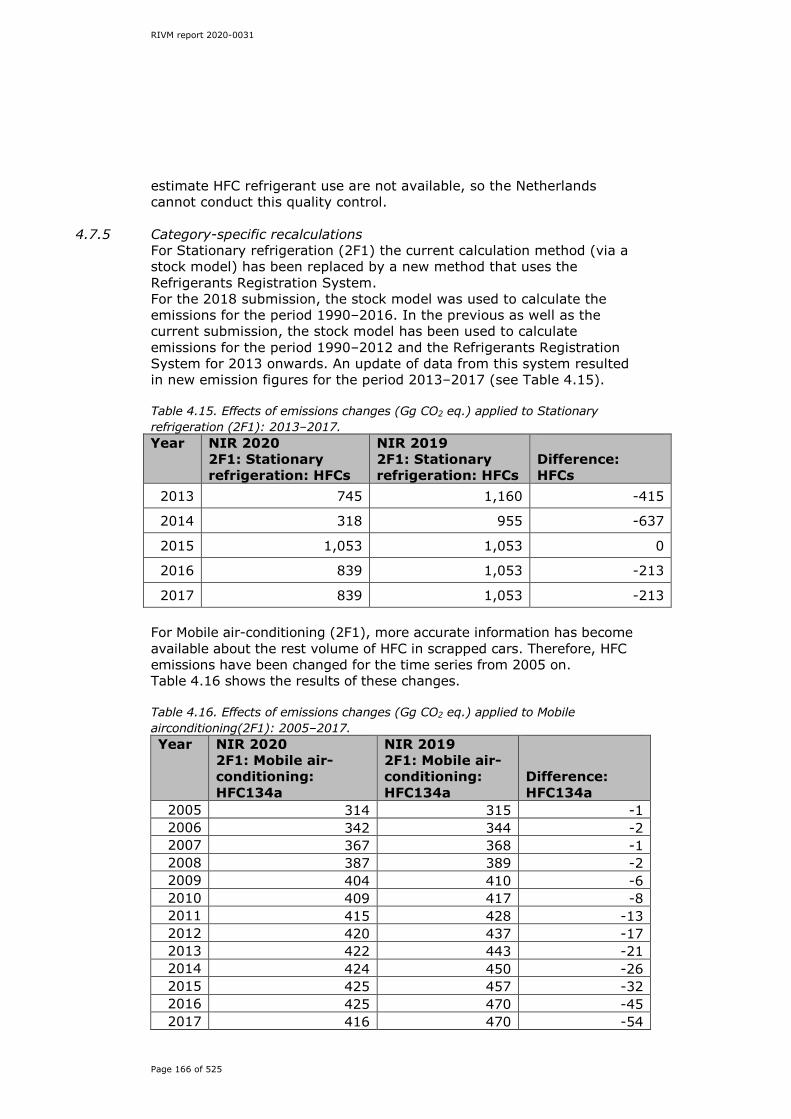
RIVM report 2020-0031
Page 166 of 525
estimate HFC refrigerant use are not available, so the Netherlands cannot conduct this quality control.
4.7.5 Category-specific recalculations For Stationary refrigeration (2F1) the current calculation method (via a stock model) has been replaced by a new method that uses the Refrigerants Registration System. For the 2018 submission, the stock model was used to calculate the emissions for the period 1990–2016. In the previous as well as the current submission, the stock model has been used to calculate emissions for the period 1990–2012 and the Refrigerants Registration System for 2013 onwards. An update of data from this system resulted in new emission figures for the period 2013–2017 (see Table 4.15). Table 4.15. Effects of emissions changes (Gg CO2 eq.) applied to Stationary refrigeration (2F1): 2013–2017. Year NIR 2020
2F1: Stationary refrigeration: HFCs
NIR 2019 2F1: Stationary refrigeration: HFCs
Difference: HFCs
2013 745 1,160 -415
2014 318 955 -637
2015 1,053 1,053 0
2016 839 1,053 -213
2017 839 1,053 -213 For Mobile air-conditioning (2F1), more accurate information has become available about the rest volume of HFC in scrapped cars. Therefore, HFC emissions have been changed for the time series from 2005 on. Table 4.16 shows the results of these changes. Table 4.16. Effects of emissions changes (Gg CO2 eq.) applied to Mobile airconditioning(2F1): 2005–2017. Year NIR 2020
2F1: Mobile air-conditioning: HFC134a
NIR 2019 2F1: Mobile air-conditioning: HFC134a
Difference: HFC134a
2005 314 315 -1 2006 342 344 -2 2007 367 368 -1 2008 387 389 -2 2009 404 410 -6 2010 409 417 -8 2011 415 428 -13 2012 420 437 -17 2013 422 443 -21 2014 424 450 -26 2015 425 457 -32 2016 425 470 -45 2017 416 470 -54
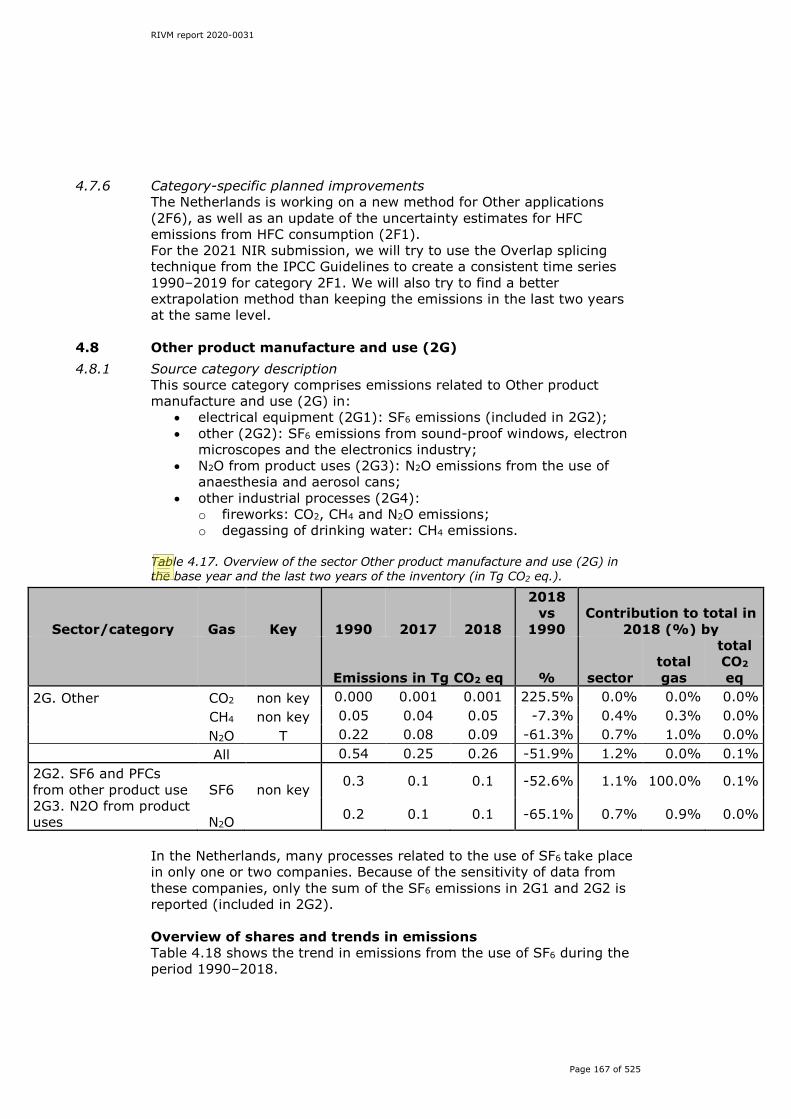
RIVM report 2020-0031
Page 167 of 525
4.7.6 Category-specific planned improvements The Netherlands is working on a new method for Other applications (2F6), as well as an update of the uncertainty estimates for HFC emissions from HFC consumption (2F1). For the 2021 NIR submission, we will try to use the Overlap splicing technique from the IPCC Guidelines to create a consistent time series 1990–2019 for category 2F1. We will also try to find a better extrapolation method than keeping the emissions in the last two years at the same level.
4.8 Other product manufacture and use (2G) 4.8.1 Source category description
This source category comprises emissions related to Other product manufacture and use (2G) in:
• electrical equipment (2G1): SF6 emissions (included in 2G2); • other (2G2): SF6 emissions from sound-proof windows, electron
microscopes and the electronics industry; • N2O from product uses (2G3): N2O emissions from the use of
anaesthesia and aerosol cans; • other industrial processes (2G4):
o fireworks: CO2, CH4 and N2O emissions; o degassing of drinking water: CH4 emissions.
Table 4.17. Overview of the sector Other product manufacture and use (2G) in the base year and the last two years of the inventory (in Tg CO2 eq.).
Sector/category Gas Key 1990 2017 2018
2018 vs
1990 Contribution to total in
2018 (%) by
Emissions in Tg CO2 eq % sector total gas
total CO2 eq
2G. Other CO2 non key 0.000 0.001 0.001 225.5% 0.0% 0.0% 0.0% CH4 non key 0.05 0.04 0.05 -7.3% 0.4% 0.3% 0.0% N2O T 0.22 0.08 0.09 -61.3% 0.7% 1.0% 0.0% All 0.54 0.25 0.26 -51.9% 1.2% 0.0% 0.1% 2G2. SF6 and PFCs from other product use SF6 non key 0.3 0.1 0.1 -52.6% 1.1% 100.0% 0.1%
2G3. N2O from product uses N2O 0.2 0.1 0.1 -65.1% 0.7% 0.9% 0.0%
In the Netherlands, many processes related to the use of SF6 take place in only one or two companies. Because of the sensitivity of data from these companies, only the sum of the SF6 emissions in 2G1 and 2G2 is reported (included in 2G2). Overview of shares and trends in emissions Table 4.18 shows the trend in emissions from the use of SF6 during the period 1990–2018.
Editor
Usual correx. to table.
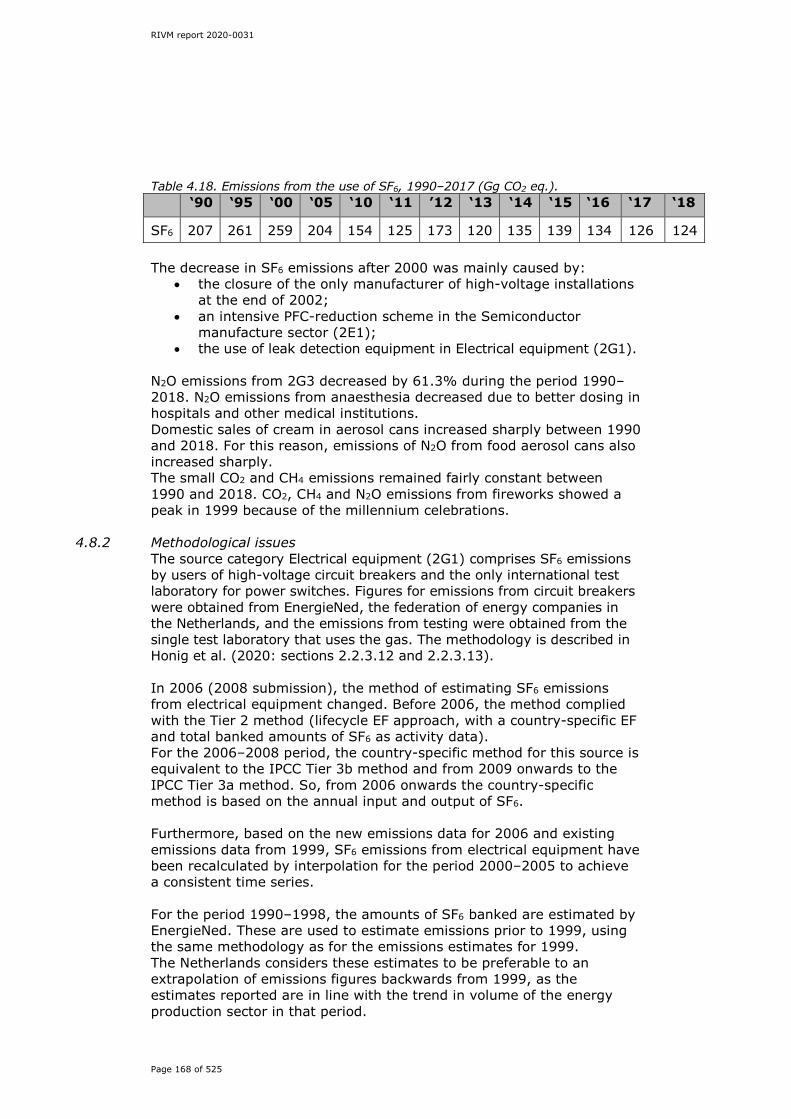
RIVM report 2020-0031
Page 168 of 525
Table 4.18. Emissions from the use of SF6, 1990–2017 (Gg CO2 eq.). ‘90 ‘95 ‘00 ‘05 ‘10 ‘11 ’12 ‘13 ‘14 ‘15 ‘16 ‘17 ‘18
SF6 207 261 259 204 154 125 173 120 135 139 134 126 124 The decrease in SF6 emissions after 2000 was mainly caused by:
• the closure of the only manufacturer of high-voltage installations at the end of 2002;
• an intensive PFC-reduction scheme in the Semiconductor manufacture sector (2E1);
• the use of leak detection equipment in Electrical equipment (2G1). N2O emissions from 2G3 decreased by 61.3% during the period 1990–2018. N2O emissions from anaesthesia decreased due to better dosing in hospitals and other medical institutions. Domestic sales of cream in aerosol cans increased sharply between 1990 and 2018. For this reason, emissions of N2O from food aerosol cans also increased sharply. The small CO2 and CH4 emissions remained fairly constant between 1990 and 2018. CO2, CH4 and N2O emissions from fireworks showed a peak in 1999 because of the millennium celebrations.
4.8.2 Methodological issues The source category Electrical equipment (2G1) comprises SF6 emissions by users of high-voltage circuit breakers and the only international test laboratory for power switches. Figures for emissions from circuit breakers were obtained from EnergieNed, the federation of energy companies in the Netherlands, and the emissions from testing were obtained from the single test laboratory that uses the gas. The methodology is described in Honig et al. (2020: sections 2.2.3.12 and 2.2.3.13). In 2006 (2008 submission), the method of estimating SF6 emissions from electrical equipment changed. Before 2006, the method complied with the Tier 2 method (lifecycle EF approach, with a country-specific EF and total banked amounts of SF6 as activity data). For the 2006–2008 period, the country-specific method for this source is equivalent to the IPCC Tier 3b method and from 2009 onwards to the IPCC Tier 3a method. So, from 2006 onwards the country-specific method is based on the annual input and output of SF6. Furthermore, based on the new emissions data for 2006 and existing emissions data from 1999, SF6 emissions from electrical equipment have been recalculated by interpolation for the period 2000–2005 to achieve a consistent time series. For the period 1990–1998, the amounts of SF6 banked are estimated by EnergieNed. These are used to estimate emissions prior to 1999, using the same methodology as for the emissions estimates for 1999. The Netherlands considers these estimates to be preferable to an extrapolation of emissions figures backwards from 1999, as the estimates reported are in line with the trend in volume of the energy production sector in that period.
RIVM report 2020-0031
Page 169 of 525
The country-specific methods used for the sources Semiconductor manufacture, Sound-proof windows, and Electron microscopes are equivalent to IPCC Tier 2 methods. Figures for the use of SF6 in semiconductor manufacture, sound-proof windows and electron microscopes were obtained from individual companies (confidential information). EFs used to estimate the emissions of SF6 in this category are based on the following:
• semiconductor manufacture: confidential information from the only company;
• sound-proof windows: EF used for production is 33% (IPCC default); EF (leak rate) used during the lifetime of the windows is 2% per year (IPCC default);
• electron microscopes: confidential information from the only company.
Country-specific methodologies are used for the N2O sources in 2G3. Since the N2O emissions in this source category are from non-key sources, the present methodology complies with the 2006 IPCC Guidelines. A full description of the methodology is provided in Jansen et al. (2019). The major hospital supplier of N2O for anaesthetic use reports the consumption data for anaesthetic gas in the Netherlands annually. NAV reports data on the annual sales of N2O-containing spray cans. The EF used for N2O in anaesthesia is 1 kg/kg gas used. Sales and consumption of N2O for anaesthesia are assumed to be equal each year. The EF for N2O from aerosol cans is estimated to be 7.6 g/can (based on data provided by one producer) and is assumed to be constant over time. The methodologies used to estimate emissions of 2G4 are:
• fireworks: Country-specific methods and EFs are used to estimate emissions of CO2, CH4 and N2O.
• degassing of drinking water: A country-specific methodology and EF are used to estimate CH4 emissions, this being the main source of CH4 emissions in this category.
The activity data used in 2G4 derives from the following sources:
• fireworks: data on annual sales from the trade organisation; • production of drinking water: volume and fuel use from the CBS.
The EFs used in 2G4 are based on the following:
• fireworks: CO2: 43 kg/t; CH4: 0.78 kg/t; N2O: 1.96 kg/t (Visschedijk et al., 2020);
• production of drinking water: 2.47 tons CH4/106 m3 (Visschedijk et al., 2020).
4.8.3 Uncertainty and time series consistency
Uncertainty The Approach 1 uncertainty analysis outlined in Annex 2 provides estimates of the uncertainties by IPCC source category. The uncertainty in SF6 emissions from 2G1 is estimated to be 34% (IPCC Tier 3a method). For the activity data and the EFs for 2G1 the uncertainty is estimated to be approximately 30% and 15%, respectively.
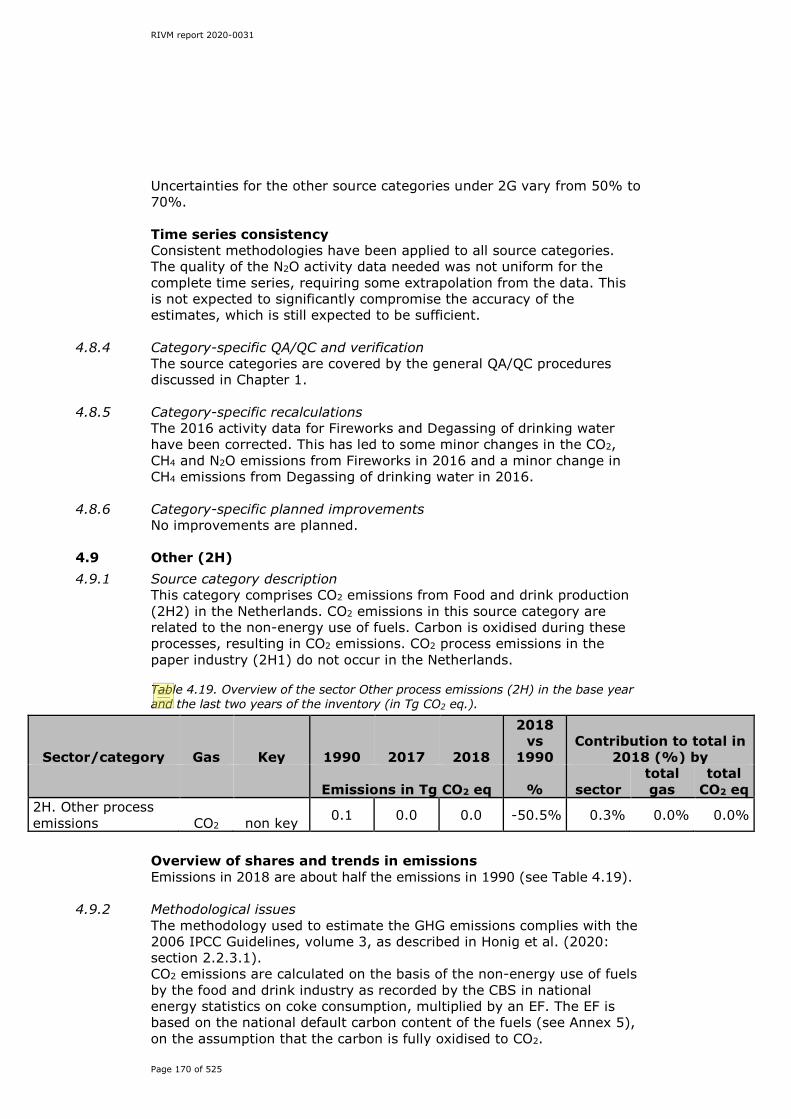
RIVM report 2020-0031
Page 170 of 525
Uncertainties for the other source categories under 2G vary from 50% to 70%. Time series consistency Consistent methodologies have been applied to all source categories. The quality of the N2O activity data needed was not uniform for the complete time series, requiring some extrapolation from the data. This is not expected to significantly compromise the accuracy of the estimates, which is still expected to be sufficient.
4.8.4 Category-specific QA/QC and verification The source categories are covered by the general QA/QC procedures discussed in Chapter 1.
4.8.5 Category-specific recalculations The 2016 activity data for Fireworks and Degassing of drinking water have been corrected. This has led to some minor changes in the CO2, CH4 and N2O emissions from Fireworks in 2016 and a minor change in CH4 emissions from Degassing of drinking water in 2016.
4.8.6 Category-specific planned improvements No improvements are planned.
4.9 Other (2H) 4.9.1 Source category description
This category comprises CO2 emissions from Food and drink production (2H2) in the Netherlands. CO2 emissions in this source category are related to the non-energy use of fuels. Carbon is oxidised during these processes, resulting in CO2 emissions. CO2 process emissions in the paper industry (2H1) do not occur in the Netherlands. Table 4.19. Overview of the sector Other process emissions (2H) in the base year and the last two years of the inventory (in Tg CO2 eq.).
Sector/category Gas Key 1990 2017 2018
2018 vs
1990 Contribution to total in
2018 (%) by
Emissions in Tg CO2 eq % sector total gas
total CO2 eq
2H. Other process emissions CO2 non key 0.1 0.0 0.0 -50.5% 0.3% 0.0% 0.0%
Overview of shares and trends in emissions Emissions in 2018 are about half the emissions in 1990 (see Table 4.19).
4.9.2 Methodological issues The methodology used to estimate the GHG emissions complies with the 2006 IPCC Guidelines, volume 3, as described in Honig et al. (2020: section 2.2.3.1). CO2 emissions are calculated on the basis of the non-energy use of fuels by the food and drink industry as recorded by the CBS in national energy statistics on coke consumption, multiplied by an EF. The EF is based on the national default carbon content of the fuels (see Annex 5), on the assumption that the carbon is fully oxidised to CO2.
Editor
Usual correx.
RIVM report 2020-0031
Page 171 of 525
4.9.3 Uncertainty and time series consistency Uncertainty The Approach 1 uncertainty analysis outlined in Annex 2 provides estimates of the uncertainties per IPCC source category. The uncertainty in the emissions of this category is estimated to be 6% (3% and 5% uncertainty in activity data and EF, respectively). Time series consistency Consistent methodologies and activity data are used throughout the time series for this source.
4.9.4 Category-specific QA/QC and verification The source categories are covered by the general QA/QC procedures, which are discussed in Chapter 1.
4.9.5 Category-specific recalculations No recalculations have been made.
4.9.6 Category-specific planned improvements No improvements are planned.

RIVM report 2020-0031
Page 172 of 525

RIVM report 2020-0031
Page 173 of 525
5 Agriculture (CRF sector 3)
Major changes in the Agriculture sector compared with the National Inventory Report 2019
Emissions:
Total emissions from the Agriculture sector decreased from 18.9 Tg CO2 eq. in 2017 to 18.2 Tg CO2 eq. in 2018.
Key categories:
No changes.
Methodologies: A new method for registering the number of poultry was introduced in 2018. Previously, poultry numbers at 1 April were reported in the Agricultural census by farmers. From 2018 onward, poultry numbers are prefilled in the Agricultural Census, based on the Identification and Registration system for poultry (I&R pluimvee; data from the Netherlands Enterprise Agency), with flocks of animals being registered year-round. This change in methodology results in a lower number of poultry. The difference is mainly caused by farmers not having reported their animal numbers as zero when their housing was empty on the reference date of the Agricultural Census, or not having taken mortality during production cycles into account. With the data from I&R this overestimation is minimised (Van Os et al., 2019).
As a result of new insights into the feed intake of horses and ponies, the N excretion has increased in 2018 (Bikker et al., 2019), leading to an increased IEF for N2O.
The preliminary figures for inorganic fertiliser use in 2017 were replaced by final numbers, leading to a reduction in N2O emissions by 167 ton. Likewise, final figures for liming became available, increasing 2017 emissions by 1.9 kton CO2.
New research has been done on the N content of residues from arable crops, resulting in revised emission estimates, based on De Ruijter and Huijsmans (2019). This has resulted in a decrease of 10.6 ton N2O emissions in 1990 and 7.9 ton N2O emissions in 2017. For grassland renewal the figure for 2017 has been adjusted, increasing emissions by 13.3 ton. Overall, N2O emissions from crop residues therefore increased by 5.4 ton in 2017.
RIVM report 2020-0031
Page 174 of 525
A change in methodology in LULUCF has resulted in a change in the area of peat and other organic soils as described in Chapter 6 from 2015 onwards. N2O emissions decrease by 13.8 ton N2O in 2015 and 41.3 ton N2O in 2017.
The emission factor (EF) for ammonia in inorganic fertiliser used in greenhouses is set to zero for the entire time series. Including the effect on NH3 and NOx emissions resulting from the changes in the N content of arable crops, this results in decreases of 9.5 ton N2O in 1990 and 4.6 ton N2O in 2017 for indirect N2O emission following atmospheric deposition. Due to lower N supply to soil by crop residues, N2O emissions from leaching and run-off decrease by 1.2 ton in 1990 and 14.8 ton in 2017 (the latter also including the decrease in inorganic fertiliser use).
5.1 Overview of sector
Emissions of GHGs from agriculture include all anthropogenic emissions from the agricultural sector, with the exception of emissions from fuel combustion (these emissions are included in 1A2g Manufacturing industries and construction – Other; and 1A4c Other sectors – Agriculture/Forestry/Fisheries) and carbon dioxide emissions through land use in agriculture (CRF sector 4 LULUCF; see Chapter 6). To ensure consistency between the EU-ETS part and the non EU-ETS part of the national system, CO2 emissions from the application of urea fertiliser (3H) are included in 2B1 (Ammonia production). Table 5.1 provides an overview of the contribution of the sector Agriculture, subdivided into the relevant subcategories, to total GHG emissions in the Netherlands. Emissions of GHGs in this sector include the following:
• 3A Enteric fermentation (CH4); • 3B Manure management (CH4 and N2O); • 3D Crop production and agricultural soils (N2O); • 3G Liming (CO2).
The IPCC categories Rice cultivation (3C), Prescribed burning of savannahs (3E), Field burning of agricultural residues (3F), Other carbon-containing fertilisers (3I) and Other (3J) do not occur in the Netherlands. Throughout the whole period 1990–2018, the field burning of agricultural residues was prohibited in the Netherlands (article 10.2 of the Environmental Management Act; Wet Milieubeheer in Dutch). In this chapter the national emissions from agriculture and their trends are discussed. The methods used to calculate the emissions are described in Lagerwerf et al. (2019). The activity data used to calculate the emissions are summarised in Van Bruggen et al. (2020). The activity data that could not be included in the CRF are included in this report. An exception is the activity data on volatile solids (VS) and N excretion, which are published in
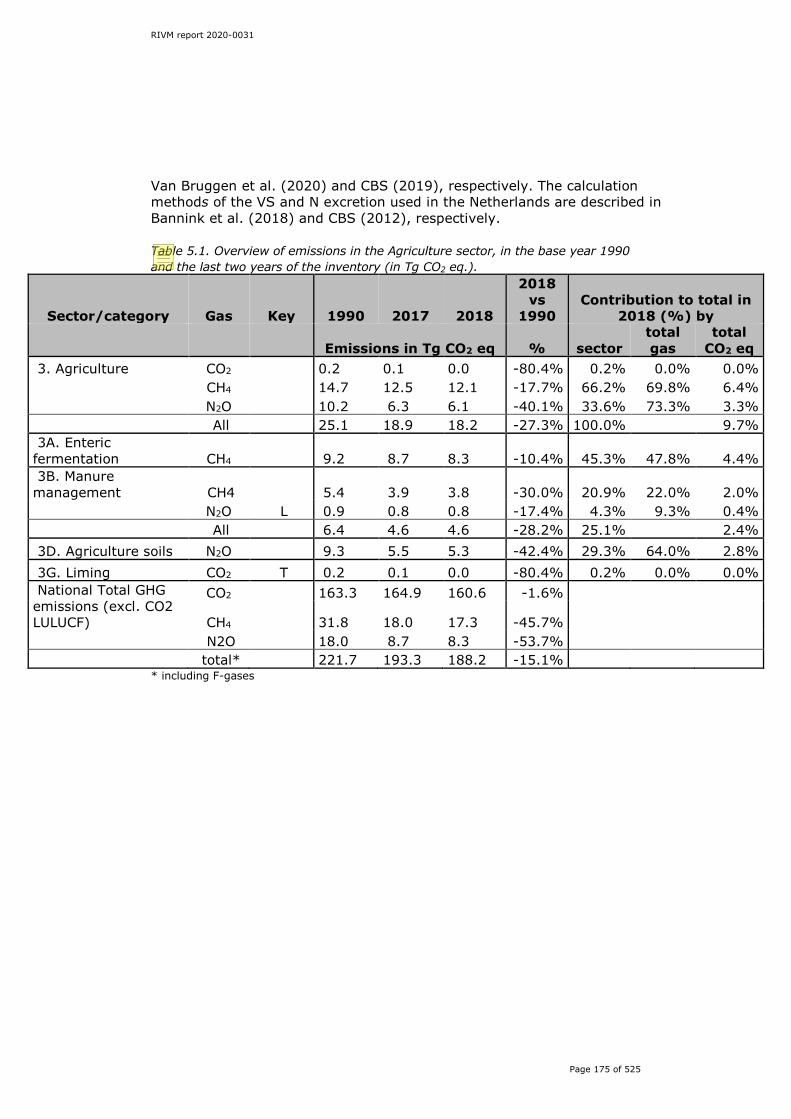
RIVM report 2020-0031
Page 175 of 525
Van Bruggen et al. (2020) and CBS (2019), respectively. The calculation methods of the VS and N excretion used in the Netherlands are described in Bannink et al. (2018) and CBS (2012), respectively. Table 5.1. Overview of emissions in the Agriculture sector, in the base year 1990 and the last two years of the inventory (in Tg CO2 eq.).
Sector/category Gas Key 1990 2017 2018
2018 vs
1990 Contribution to total in
2018 (%) by
Emissions in Tg CO2 eq % sector total gas
total CO2 eq
3. Agriculture CO2 0.2 0.1 0.0 -80.4% 0.2% 0.0% 0.0% CH4 14.7 12.5 12.1 -17.7% 66.2% 69.8% 6.4% N2O 10.2 6.3 6.1 -40.1% 33.6% 73.3% 3.3% All 25.1 18.9 18.2 -27.3% 100.0% 9.7% 3A. Enteric fermentation CH4 9.2 8.7 8.3 -10.4% 45.3% 47.8% 4.4% 3B. Manure management CH4 5.4 3.9 3.8 -30.0% 20.9% 22.0% 2.0% N2O L 0.9 0.8 0.8 -17.4% 4.3% 9.3% 0.4% All 6.4 4.6 4.6 -28.2% 25.1% 2.4% 3D. Agriculture soils N2O 9.3 5.5 5.3 -42.4% 29.3% 64.0% 2.8% 3G. Liming CO2 T 0.2 0.1 0.0 -80.4% 0.2% 0.0% 0.0% National Total GHG emissions (excl. CO2 LULUCF)
CO2 163.3 164.9 160.6 -1.6%
CH4 31.8 18.0 17.3 -45.7% N2O 18.0 8.7 8.3 -53.7% total* 221.7 193.3 188.2 -15.1%
* including F-gases
Editor
Usual correx.

RIVM report 2020-0031
Page 176 of 525
5.1.1 Overview of shares and trends in emissions Figure 5.1 shows the trend in total GHG emissions from the sector Agriculture.
Figure 5.1. Sector 3 Agriculture – trend and emission levels of source categories, 1990–2018. In 2018, agriculture contributed 9.7% of the national GHG emissions in comparison with 11.3% in 1990. This sector is, however, a major contributor to national total CH4 and N2O emissions, accounting for 69.8% of total CH4 emissions and for 73.3% of total N2O emissions. Trend in methane emissions CH4 emissions from agriculture show a decline from 1990 to 2005. Emissions stabilised in 2006, but from 2007 onwards an increase is observed, which continues until 2016. In the last two years, CH4
emissions from enteric fermentation and manure management have decreased again. This trend in emissions is mainly explained by the change in the number of mature dairy cattle. Trend in nitrous oxide emissions From 1990 onwards a decline in N2O emissions can be seen, caused by a decrease in organic and inorganic N fertiliser application, a decrease in animal numbers and a decrease in animal production on pasture. From 2010 the decline in N2O emissions stabilised, with a small increase in the last years, caused by an increase of manure production of dairy cows. Trend in carbon dioxide emissions CO2 emissions from agriculture decreased between 1990 and 2018. This was caused by a decrease in the application of liming products in the Netherlands.
5.1.2 Overview of trends in activity data Animal numbers are the primary activity data used in all emission calculations for Agriculture. Animal numbers come from the annual Agricultural Census, performed by the CBS. Table 5.2 presents an overview. Animal numbers decreased between 1990 and 2018 for total cattle, swine and sheep by 22%, 23% and 29%, respectively. For poultry, horses and goats, animal numbers increased by 4%, 11% and 932%. The number of goats increased dramatically due to increased

RIVM report 2020-0031
Page 177 of 525
demand for goat’s milk and goat’s cheese. The number of rabbits decreased by 61% due to a fall in demand. The number of fur-bearing animals increased by 65%. A decrease in the numbers of cattle, sheep and swine was caused by higher production rates per animal and restrictions via quotas (pig and poultry production rights and phosphate rights for dairy cattle). The phosphate quota introduced in 2018 limits the amount of cattle (all categories) that can be kept in the Netherlands and resulted in a decrease in cattle numbers setting in during 2017 and 2018. Increased production rates per animal resulted in a decrease in swine numbers until 2004, after which more animals were kept. An increase in the number of poultry was observed between 1990 and 2002. As a direct result of the avian flu outbreak in 2003 poultry numbers decreased by almost 30%. In 2004 poultry numbers increased again. In 2010 the number of poultry was equal to the number of poultry in 2002. From 2011 onwards poultry numbers stabilised, with small annual fluctuations. However, a decrease is shown between 2017 and 2018, which can be explained by a change in the way the number of poultry is collected. Before 2018 poultry numbers were based on the Agricultural Census filled in by farmers, with the number of animals present on the reference date of 1 April. From 2018 onward poultry numbers in the Agricultural Census are based on the Identification and Registration system for poultry (I&R pluimvee; data from the Netherlands Enterprise Agency), in which animals must be registered year-round. This results in lower poultry numbers. The difference is mainly caused by farmers not having reported their animal numbers as zero when their housing was empty on the reference date of the Agricultural Census. With the data from I&R this overestimation is minimised (Van Os et al., 2019). The introduction of phosphate rights for dairy cattle set a limit to excretion as of 1 January 2018. This in turn limited the number of dairy cattle a farmer could keep from that date on. Because of the strong decrease in the number of cattle, the number in the Agricultural Census of 2018 (reference date being 1 April) was not representative of the average number of cattle from April 2017 to April 2018. Therefore, for the emission calculations of 2017 and 2018, the average number of dairy cattle was adjusted using the Identification and Registration system (CBS, 2019).
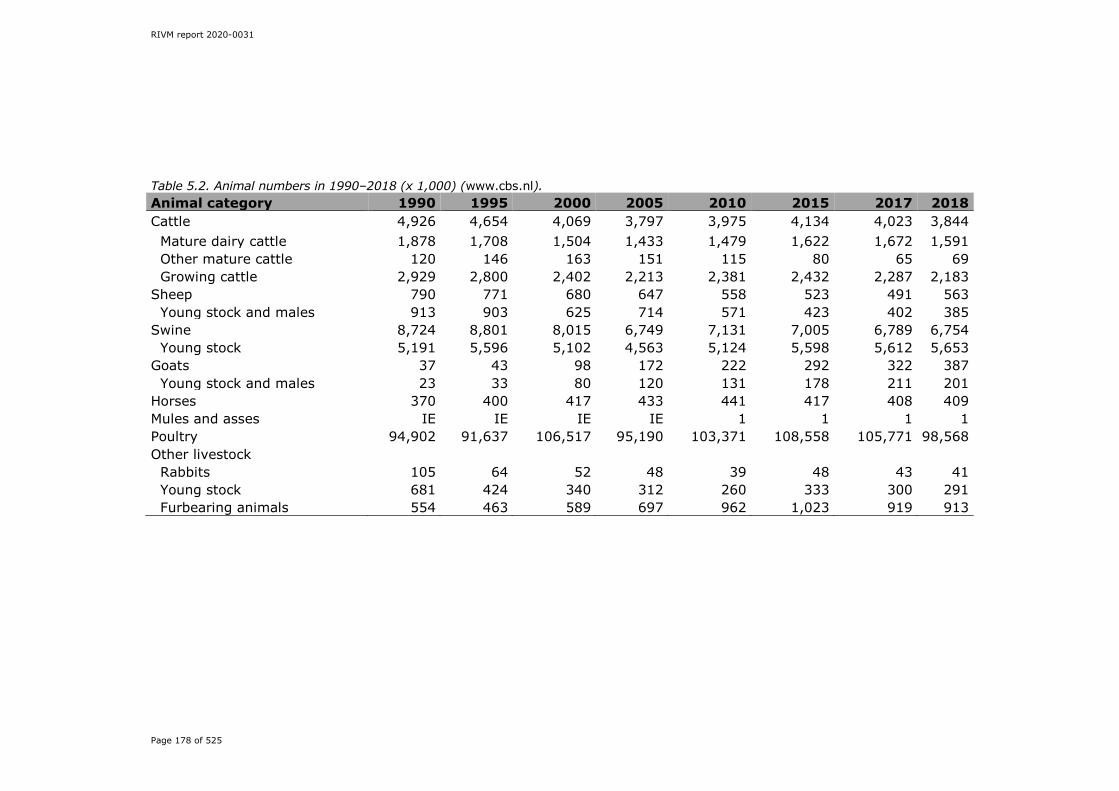
RIVM report 2020-0031
Page 178 of 525
Table 5.2. Animal numbers in 1990–2018 (x 1,000) (www.cbs.nl). Animal category 1990 1995 2000 2005 2010 2015 2017 2018 Cattle 4,926 4,654 4,069 3,797 3,975 4,134 4,023 3,844
Mature dairy cattle 1,878 1,708 1,504 1,433 1,479 1,622 1,672 1,591 Other mature cattle 120 146 163 151 115 80 65 69 Growing cattle 2,929 2,800 2,402 2,213 2,381 2,432 2,287 2,183
Sheep 790 771 680 647 558 523 491 563 Young stock and males 913 903 625 714 571 423 402 385
Swine 8,724 8,801 8,015 6,749 7,131 7,005 6,789 6,754 Young stock 5,191 5,596 5,102 4,563 5,124 5,598 5,612 5,653
Goats 37 43 98 172 222 292 322 387 Young stock and males 23 33 80 120 131 178 211 201
Horses 370 400 417 433 441 417 408 409 Mules and asses IE IE IE IE 1 1 1 1 Poultry 94,902 91,637 106,517 95,190 103,371 108,558 105,771 98,568 Other livestock
Rabbits 105 64 52 48 39 48 43 41 Young stock 681 424 340 312 260 333 300 291 Furbearing animals 554 463 589 697 962 1,023 919 913

RIVM report 2020-0031
Page 179 of 525
The methodology used to calculate CH4 and N2O emissions is based on different activity data (see Sections 5.2 and 5.3). These sometimes include different animal numbers, since for N2O the N excretion data for female swine, sheep and goats and their young offspring/male animals are estimated in one combined figure. The N excretion is estimated by the Working Group on Uniformity of Calculations of Manure and Mineral Data (WUM). For CH4 calculations, default IPCC EFs for average animals are used at present. These calculations are therefore based on the total number of animals, including young and male animals. Detailed information on data sources can be found in chapter 2 of the methodology report (Lagerwerf et al., 2019). For cattle, the same animal numbers are used for the calculation of both CH4 and N2O emissions.
5.2 Enteric fermentation (3A) 5.2.1 Source category description
Methane emissions are a by-product of enteric fermentation, the digestive process by which organic matter (mainly carbohydrates) is degraded and utilised by micro-organisms under anaerobic conditions. Both ruminant animals (e.g. cattle, sheep and goats) and non-ruminant animals (e.g. swine, horses, mules and asses) produce CH4, but per unit of feed intake, ruminants produce considerably more. Enteric fermentation from poultry is not estimated due to the negligible amount of CH4 production in this animal category. The 2006 IPCC Guidelines also do not provide a default EF for enteric CH4 emissions from poultry. CH4 emissions decreased from 9.2 Tg CO2 eq. to 8.3 Tg CO2 eq. (-10%) between 1990 and 2018 (Table 5.3), which is almost entirely explained by the decrease in CH4 emissions from cattle. Cattle accounted for the majority (89%) of CH4 emissions from enteric fermentation in 2018. Swine contributed 6% and the animal categories sheep, goats, horses, and mules and asses accounted for the remaining 5%. The reduction in CH4 emissions from cattle was caused by a decrease in animal numbers, softened by an increase in EF for mature dairy cattle (higher production/animal) and white veal calves (dietary changes to also include roughage). The source category Enteric fermentation includes emissions from:
• mature dairy cattle (3A1a); • other mature cattle (3A1b); • growing cattle (3A1c); • sheep (3A2); • swine (3A3); • goats (3A4); • horses (3A4); • mules and asses (3A4); • poultry (3A4); • rabbits (3A4); • fur-bearing animals (3A4).

RIVM report 2020-0031
Page 180 of 525
Table 5.3. Overview of the sector Enteric fermentation (3A) in the base year and the last two years of the inventory (in Tg CO2 eq.).
Sector/category Gas Key 1990 2017 2018 2018 vs
1990 Contribution to total in
2018 (%) by
Emissions in Tg CO2 eq % sector total gas
total CO2 eq
3A. Enteric fermentation CH4 9.2 8.7 8.3 -10.4% 45.3% 47.8% 4.4% 3A1. Cattle CH4 8.2 7.8 7.4 -10.2% 40.3% 42.5% 3.9%
3A1. Mature dairy cattle CH4 L,T 5.2 5.6 5.4 3.3% 29.4% 30.9% 2.8%
3A1. Other mature cattle CH4 non key 0.2 0.1 0.1 -35.9% 0.7% 0.8% 0.1%
3A1. Growing cattle CH4 L,T 2.8 2.0 1.9 -33.4% 10.2% 10.8% 1.0% 3A2. Sheep CH4 0.3 0.2 0.2 -44.3% 1.0% 1.1% 0.1% 3A3. Swine CH4 L 0.5 0.5 0.5 -10.8% 2.6% 2.7% 0.2% 3A4. Other livestock CH4 non key 0.2 0.3 0.3 48.2% 1.4% 1.5% 0.1%
5.2.2 Methodological issues
For all the sub-source categories, the methodologies used to estimate emissions comply with the 2006 IPCC Guidelines. Detailed information on calculation methods and EFs can be found in chapter 3 of the methodology report (Lagerwerf et al., 2019). An overview of the activity data can be found in CBS (2011–2019); Van Bruggen et al. (2020). Cattle (3A1) A Tier 3 method is used for the calculation of emissions from mature dairy cattle. For the calculation of the EF for mature dairy cattle the Netherlands is split into two regions, because of differences in diets. The north-west (NW) has a diet that contains mainly grass and the south-east (SE) has a larger fraction of maize in the diet. Data used between 1990 and 2012 are published in an annex to Van Bruggen et al. (2014). A yearly update of the diets of cattle is published by the CBS (2014–2019). Table 5.4 shows the IEFs for the different cattle categories that are reported, including the subdivision into the NW and SE regions for mature dairy cattle. The IEF for growing cattle is a weighted average calculated from several sub-categories (CBS, 2019). Table 5.4. IEFs for methane emissions from enteric fermentation specified according to CRF animal category (kg CH4/animal/year).
Animal category 1990 1995 2000 2005 2010 2015 2017 2018 Mature dairy cattle 110.4 114.4 120.0 125.0 128.0 129.0 134.6 134.6 Of which NW region 111.0 115.4 121.7 126.4 129.9 131.2 135.1 135.5 Of which SE region 109.9 113.5 118.4 123.6 126.7 127.5 134.3 134.0
Other mature cattle 70.3 71.3 72.1 76.7 78.1 79.1 77.6 77.6 Growing cattle 38.3 38.6 35.4 34.4 35.0 36.4 35.3 34.2 For both mature dairy cattle and other mature cattle, EFs increased primarily as a result of an increase in total feed intake during the period 1990–2018. For mature dairy cattle, a change in the feed nutrient
Editor
Usual correx.
RIVM report 2020-0031
Page 181 of 525
composition partly counteracted this effect. Also, the average weight of mature dairy cattle and average milk production increased, while animal numbers decreased (CBS, 2019). Both these factors increased the gross energy intake of mature dairy cattle in 2018 compared with 1990. For growing cattle, the decrease of EF between 1990 and 2018 can be explained by a decrease in the average total feed intake due to an increased share of veal calves in the population of growing cattle. This is softened, however, by an increase in EF for white veal calves, as increasing amounts of roughage are fed because of animal welfare considerations. Other livestock (3A2, 3A3 and 3A4) According to the IPCC Guidelines, no Tier 2 method is needed if the share of a sub-source category is less than 25% of total emissions from a key source category. The animal categories sheep, swine, goats, horses, and mules and asses have a combined share in total CH4 emissions from enteric fermentation of c. 10%. Therefore, the IPCC 2006 default (Tier 1) EFs are used for sheep, swine, goats, horses, and mules and asses (8, 1.5, 5, 18 and 10 kg CH4/animal, respectively). Changes in emissions from these animal categories are explained entirely by changes in livestock numbers.
5.2.3 Uncertainty and time series consistency Uncertainty The Approach 1 uncertainty analysis explained in Annex 2 provides estimates of uncertainty according to IPCC source categories. The uncertainty of CH4 emissions from the enteric fermentation emissions varies between 15% and 50%, a variation mostly determined by uncertainties in the EFs (uncertainty in the EF for 3A3 (swine) estimated at 50%; for mature dairy cattle at 15%). Uncertainties in the activity data are estimated about 5%. New insights into uncertainties for this source category will be further elaborated and taken into account in the NIR 2021. Time series consistency A consistent methodology is used throughout the time series; see Section 5.2.2. Emissions are calculated as the product of livestock numbers and EFs. Livestock numbers are collected in an annual census and published by the CBS. Consistent methods are used in compiling the census to ensure continuity in the collected data. EFs are either constant (default IPCC) or calculated/modelled from feed intake data collected through an annual survey.
5.2.4 Category-specific QA/QC and verification This source category is covered by the general QA/QC procedures discussed in Chapter 1.
5.2.5 Category-specific recalculations No category-specific recalculations were made.
5.2.6 Category-specific planned improvements No improvements are planned.
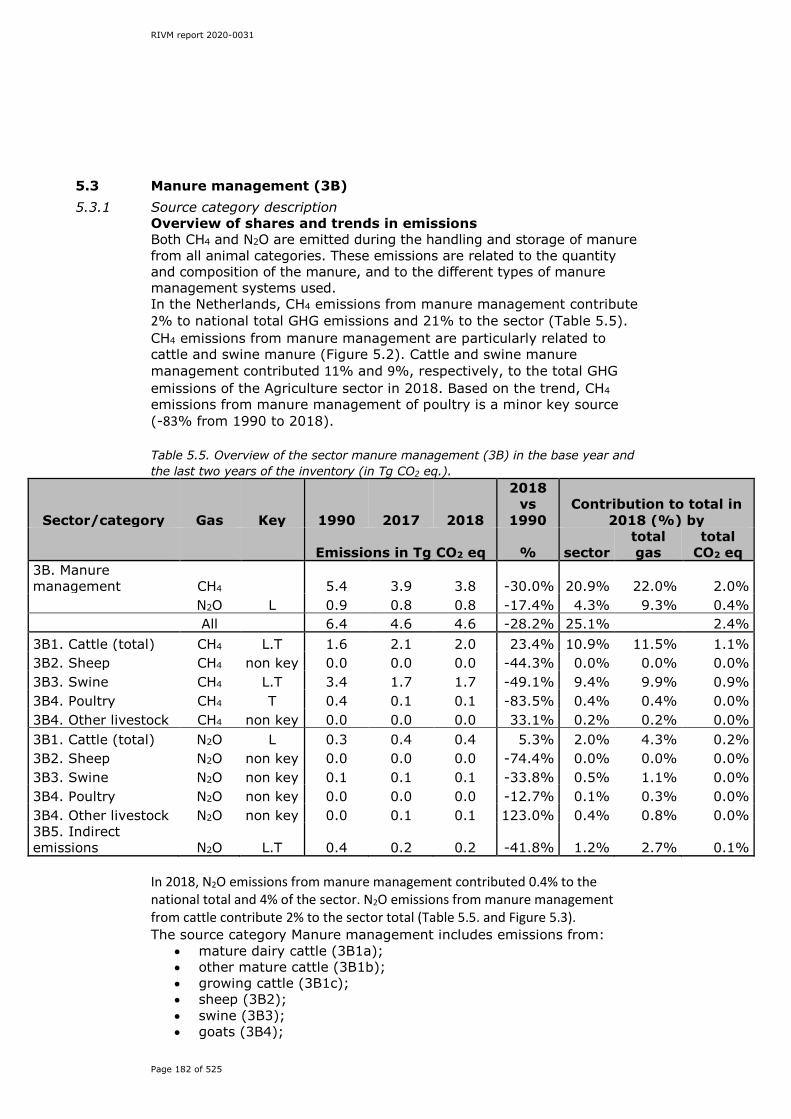
RIVM report 2020-0031
Page 182 of 525
5.3 Manure management (3B) 5.3.1 Source category description
Overview of shares and trends in emissions Both CH4 and N2O are emitted during the handling and storage of manure from all animal categories. These emissions are related to the quantity and composition of the manure, and to the different types of manure management systems used. In the Netherlands, CH4 emissions from manure management contribute 2% to national total GHG emissions and 21% to the sector (Table 5.5). CH4 emissions from manure management are particularly related to cattle and swine manure (Figure 5.2). Cattle and swine manure management contributed 11% and 9%, respectively, to the total GHG emissions of the Agriculture sector in 2018. Based on the trend, CH4 emissions from manure management of poultry is a minor key source (-83% from 1990 to 2018). Table 5.5. Overview of the sector manure management (3B) in the base year and the last two years of the inventory (in Tg CO2 eq.).
Sector/category Gas Key 1990 2017 2018
2018 vs
1990 Contribution to total in
2018 (%) by
Emissions in Tg CO2 eq % sector total gas
total CO2 eq
3B. Manure management CH4 5.4 3.9 3.8 -30.0% 20.9% 22.0% 2.0% N2O L 0.9 0.8 0.8 -17.4% 4.3% 9.3% 0.4% All 6.4 4.6 4.6 -28.2% 25.1% 2.4% 3B1. Cattle (total) CH4 L.T 1.6 2.1 2.0 23.4% 10.9% 11.5% 1.1% 3B2. Sheep CH4 non key 0.0 0.0 0.0 -44.3% 0.0% 0.0% 0.0% 3B3. Swine CH4 L.T 3.4 1.7 1.7 -49.1% 9.4% 9.9% 0.9% 3B4. Poultry CH4 T 0.4 0.1 0.1 -83.5% 0.4% 0.4% 0.0% 3B4. Other livestock CH4 non key 0.0 0.0 0.0 33.1% 0.2% 0.2% 0.0% 3B1. Cattle (total) N2O L 0.3 0.4 0.4 5.3% 2.0% 4.3% 0.2% 3B2. Sheep N2O non key 0.0 0.0 0.0 -74.4% 0.0% 0.0% 0.0% 3B3. Swine N2O non key 0.1 0.1 0.1 -33.8% 0.5% 1.1% 0.0% 3B4. Poultry N2O non key 0.0 0.0 0.0 -12.7% 0.1% 0.3% 0.0% 3B4. Other livestock N2O non key 0.0 0.1 0.1 123.0% 0.4% 0.8% 0.0% 3B5. Indirect emissions N2O L.T 0.4 0.2 0.2 -41.8% 1.2% 2.7% 0.1%
In 2018, N2O emissions from manure management contributed 0.4% to the national total and 4% of the sector. N2O emissions from manure management from cattle contribute 2% to the sector total (Table 5.5. and Figure 5.3). The source category Manure management includes emissions from:
• mature dairy cattle (3B1a); • other mature cattle (3B1b); • growing cattle (3B1c); • sheep (3B2); • swine (3B3); • goats (3B4);
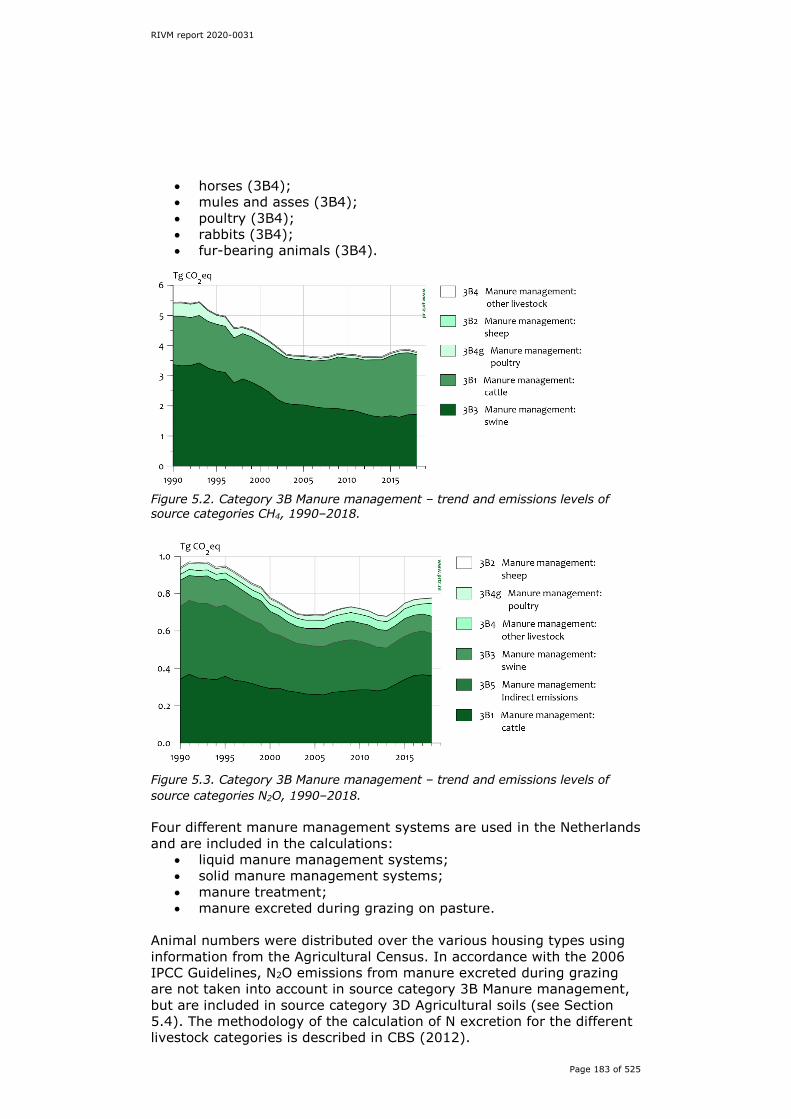
RIVM report 2020-0031
Page 183 of 525
• horses (3B4); • mules and asses (3B4); • poultry (3B4); • rabbits (3B4); • fur-bearing animals (3B4).
Figure 5.2. Category 3B Manure management – trend and emissions levels of source categories CH4, 1990–2018.
Figure 5.3. Category 3B Manure management – trend and emissions levels of source categories N2O, 1990–2018. Four different manure management systems are used in the Netherlands and are included in the calculations:
• liquid manure management systems; • solid manure management systems; • manure treatment; • manure excreted during grazing on pasture.
Animal numbers were distributed over the various housing types using information from the Agricultural Census. In accordance with the 2006 IPCC Guidelines, N2O emissions from manure excreted during grazing are not taken into account in source category 3B Manure management, but are included in source category 3D Agricultural soils (see Section 5.4). The methodology of the calculation of N excretion for the different livestock categories is described in CBS (2012).
RIVM report 2020-0031
Page 184 of 525
CH4 from manure management Between 1990 and 2018, emissions of CH4 from manure management decreased by 30% (Figure 5.3). Emissions from cattle increased by 23%, while swine and poultry emissions decreased by 49% and 83%, respectively. With an increasing percentage of cattle kept indoors, a larger proportion of the manure is excreted inside animal housing facilities, with a higher EF than manure excreted on pasture, thus increasing the overall emissions during the time period. In growing cattle, emissions decreased due to lower livestock numbers; this outweighs the small increase in EF. In poultry the large decrease in emissions is associated with the change from battery cage systems with liquid manure, to floor housing systems or aviary systems with solid manure. This lowered the CH4 emissions, since the solid manure systems have a lower EF. The increase of manure treatment also had an effect, by shortening the storage time of the manure. The decreasing trend in CH4 emissions from swine is directly related to the decrease in VS excretions by swine (CBS, 2019). VS excretion has decreased due to changes in the feed composition (Zom and Groenestein, 2015). The decrease in CH4 emissions was somewhat offset by an increase in livestock numbers in the first part of the time series (up to 1997). N2O from manure management N2O emissions are calculated using an N-flow model (Lagerwerf et al., 2019). Figure 5.4 is a schematic representation of N flows and the resulting emissions from agriculture. The amount of N in the manure is used throughout the model, minus the N emissions that have already taken place. For example, with N excretion in animal housing, losses in the form of NH3, NOx, N2 and N2O are all relative to the amount of N excreted. Only at the end of the calculation is the combined loss subtracted in order to yield the remaining N available for application. Direct N2O emissions from cattle and other livestock increased between 1990 and 2018 by 5% and 123%, respectively. Sheep, swine and poultry emissions decreased by 74%, 34% and 13% in the same period. Decreasing livestock numbers and N excretions per animal influence this trend. Between 1990 and 2013, N excretion decreased due to an optimisation of animal production that resulted in higher production rates with lower dietary crude protein for all animal categories. From 2014 onwards the amount of dietary crude protein stabilised. In 2017, N excretion increased again for cattle, which can be explained by a decrease in fed maize and an increase in fed grass, grass having a higher N content than maize. Besides the increased share of grass in the feed, nutrient requirements increased due to higher average milk production and body weight (RVO, 2018). The Netherlands’ manure and fertiliser policy – in line with the Dutch Manure and Fertilisers Act, which conforms to the Nitrates Directive – is aimed at reducing N leaching and run-off, and regulates the amount of manure production and application by the introduction of measures such as restrictions on the numbers of swine and poultry per farm (so-called

RIVM report 2020-0031
Page 185 of 525
manure production rights) and maximum application limits for manure and inorganic N fertiliser. This has led to a decrease in manure management emissions. Indirect N2O emissions following atmospheric deposition of NH3 and NOx emitted during the handling of animal manure decreased by 42% between 1990 and 2018. This decrease is explained by reduction measures for NH3 and NOx emissions from animal housing systems and manure storages over the years.
Figure 5.4. Schematic representation of N flows in agriculture and the allocation of emissions to source categories.
RIVM report 2020-0031
Page 186 of 525
5.3.2 Methodological issues For all the sub-source categories, the methodologies used to estimate emissions comply with the 2006 IPCC Guidelines. Detailed information on calculation methods and EFs can be found in chapters 4 and 7 of the methodology report (Lagerwerf et al., 2019). An overview of the activity data can be found in CBS (2011–2019); Van Bruggen et al. (2020). More information on housing systems used in the Netherlands can be found at https://www.infomil.nl/onderwerpen/landbouw/stalsystemen/stalbeschrijvingen/ (in Dutch). A description of and EFs for the different types of manure treatment used in the Netherlands can be found in Melse and Groenestein (2016). CH4 from manure management A country-specific Tier 2 approach is used to calculate CH4 EFs for manure management annually. The EFs are calculated for liquid and solid manure management systems within the key animal categories cattle, swine and poultry and, where applicable, for the manure produced on pasture during grazing. These calculations are based on country-specific data on:
• manure characteristics: VS excretion (in kg/animal/year) and maximum CH4 producing potential (B0, in m3 CH4/kg VS);
• manure management system conditions (storage temperature and period) for liquid manure systems, which determine the Methane Conversion Factor (MCF).
In the Netherlands, animal manure is stored in pits underneath the slatted floors of animal housing facilities. Liquid manure is regularly pumped into outside storage facilities or spread on the land. Given this practice, country-specific MCF values were calculated for liquid manure, since the manure management systems are different from the circumstances on which the IPCC default is based, as demonstrated in Groenestein et al. (2016). For solid manure systems and manure produced on pasture while grazing, IPCC default values are used. The time spent on pasture is calculated yearly by the WUM (CBS, 2011–2019). Table 5.6 shows the IEFs for manure management per animal category. These are expressed in kg CH4 per animal per year and are calculated by dividing total emissions by livestock numbers in a given category.

RIVM report 2020-0031
Page 187 of 525
Table 5.6. CH4 implied emission factors (kg/animal/year) for manure management specified by animal category, 1990–2018. Animal category 1990 1995 2000 2005 2010 2015 2017 2018 Cattle
Mature dairy cattle 23.07 24.10 27.97 31.07 34.87 36.72 37.85 38.80 Other mature cattle 7.42 7.53 7.50 7.84 8.04 8.01 6.85 6.88 Growing cattle 6.87 7.04 6.62 6.30 7.05 7.88 8.07 7.85
Sheep* 0.19 0.19 0.19 0.19 0.19 0.19 0.19 0.19 Goats* 0.13 0.13 0.13 0.13 0.13 0.13 0.13 0.13 Horses 1.56 1.56 1.56 1.56 1.56 1.56 1.56 1.56 Mules and asses IE IE IE IE 0.76 0.76 0.76 0.76 Swine* 9.68 8.77 8.05 7.19 6.07 5.31 5.51 5.52 Swine excl. piglets 15.44 14.34 13.18 12.06 10.43 9.55 10.06 10.15
Fattening pigs 12.87 11.81 10.76 9.70 8.40 7.53 7.87 8.02 Breeding swine 26.09 25.08 23.60 22.47 20.18 19.27 20.68 20.39
Poultry 0.18 0.13 0.08 0.05 0.03 0.03 0.03 0.03 Other animals* 0.33 0.37 0.44 0.48 0.54 0.52 0.52 0.52 * The IEF is calculated on total animal numbers, including young stock. Manure production by young stock is accounted for in manure production by adult breeding swine. Cattle (3B1) The IEF for the manure management of mature dairy cattle increased between 1990 and 2018 due to increased VS production per cow. The shift in the proportion of the two main manure management systems used in dairy farming (liquid manure in the animal house and manure production on pasture) also contributed to the increased IEF. The share of liquid manure, compared with the amount of manure produced on pasture, increased between 1990 and 2018 (CBS, 2019). Swine (3B3) Between 1990 and 2018, the IEF of swine manure management (based on total swine numbers, including piglets) decreased in line with lower VS excretions per animal. The decrease in VS excretion per animal counteracts the increase in animal numbers in earlier years of the time series. VS excretion has decreased over the years because the feed composition has changed, increasing overall digestibility. Poultry (3B4) The substantial decrease in CH4 emissions in poultry is explained by a shift in the proportion of the two poultry manure management systems (solid and liquid manure) between 1990 and 2013, when the liquid manure system was fully replaced by the solid manure system (Van der Hoek and Van Schijndel, 2006). The increase in poultry numbers by 4% since 1990 is counteracted by the shift towards solid manure management systems with a lower EF. This has led to an overall decrease in CH4 emissions of poultry. Other animals (3B2 and 3B4) Sheep, goats, horses, and mules and asses produce only solid manure, which has a low EF. Therefore, the IEFs are also small. These represent the IPCC Tier 1 defaults. The category Other livestock includes rabbits (solid manure) and fur-bearing animals (liquid manure). The resulting IEF for this category therefore largely depends on the ratio between the two species in a given year. As rabbit numbers have decreased and

RIVM report 2020-0031
Page 188 of 525
mink numbers increased over the entire time period, the CH4 IEF has increased because a larger proportion of the manure consisted of liquid manure, with a higher EF. Comparison with IPCC default EF for CH4 The methods applied by the Netherlands for CH4 calculations are in accordance with the 2006 IPCC Guidelines. For the key categories cattle, swine and poultry a Tier 2 approach is used to calculate CH4 emissions from manure management. For all other animal categories emissions are estimated using a Tier 1 approach. Detailed descriptions of the methods are given in the methodology report (Lagerwerf et al., 2019). More detailed data on manure management based on statistical information on manure management systems is documented in Van der Hoek and Van Schijndel (2006) for the period 1990–2006 and CBS (2019) for the period from 2006 onwards. N2O from manure management Emissions of N2O from manure management are calculated using the 2006 IPCC default EFs. An increase in IEF between 2013 and 2018 is the result of increased N excretion combined with a decrease in animal numbers (Table 5.7), caused by an increased feed intake, as a result of a higher average weight of mature dairy cattle (CBS, 2019; Van Bruggen et al., 2019) and a higher average milk production. As a result of new insights into the feed intake of horses and ponies, N excretion has increased in 2018 (Bikker et al., 2019). Table 5.7. N2O IEFs for manure management per animal category, 1990–2018 (mln kg/year and kg N2O/kg manure-N). Animal category 1990 1995 2000 2005 2010 2015 2017 2018 Cattle
Mature dairy cattle 0.34 0.36 0.32 0.34 0.34 0.35 0.39 0.40
Other mature cattle 0.19 0.22 0.20 0.18 0.17 0.18 0.21 0.22
Growing cattle 0.14 0.15 0.13 0.11 0.11 0.12 0.12 0.13 Sheep 0.03 0.03 0.03 0.02 0.01 0.01 0.01 0.01 Goats 0.31 0.34 0.30 0.28 0.28 0.29 0.29 0.31 Horses 0.21 0.21 0.21 0.21 0.19 0.19 0.19 0.25 Mules and asses IE IE IE IE 0.10 0.10 0.10 0.13 Swine 0.05 0.05 0.05 0.05 0.04 0.03 0.03 0.03 Poultry 0.00 0.00 0.00 0.00 0.00 0.00 0.00 0.00 Rabbits 0.07 0.06 0.06 0.06 0.06 0.07 0.07 0.06 Fur-bearing animals 0.01 0.01 0.01 0.01 0.01 0.01 0.01 0.01 For indirect emissions from manure management, the atmospheric N deposition is calculated as described in section 7.4.1 of Lagerwerf et al. (2019). The 2006 IPCC Guidelines also calculate leaching and run-off from manure storage. In the Netherlands, all slurry manure is stored underneath animal houses or in fully closed outside storage tanks (this is an obligation of the EU Nitrates Directive). Solid manure must be stored on concrete plates, with run-off directed into a slurry pit or separate tank.
RIVM report 2020-0031
Page 189 of 525
Comparison with IPCC default EF for N2O For the relevant manure management systems and animal categories, the total N content of the manure is calculated by multiplying N excretion (kg/year/head) by livestock numbers. Activity data were collected in compliance with a Tier 2 method. The N2O EFs used for liquid and solid manure management systems are IPCC defaults. The method used complies with the 2006 IPCC Guidelines.
5.3.3 Uncertainty and time series consistency Uncertainty The Approach 1 uncertainty analysis, detailed in Annex 2, provides estimates of uncertainty according to IPCC source categories. The uncertainty for CH4 varies between 20% and 40%, a variation mostly determined by the estimated uncertainties in the EF (20% for 3B1 growing cattle; 40% for poultry (3B4)). Uncertainty in the activity data varies between 1% and 10%. The uncertainty in the annual N2O emissions from manure management is much higher; estimated at 100–190% and attributable to the uncertainties in the EFs. New insights into uncertainties for this source category will be further elaborated and taken into account in the NIR 2021. Time series consistency A consistent methodology is used throughout the time series; see Section 5.3.2. Emissions are calculated from animal population data and EFs. The animal population data are collected in an annual census and published by the CBS. Consistent methods are used in compiling the census to ensure consistency in the collected data. EFs are either constant (default IPCC) or calculated/modelled from feed intake data collected through an annual survey.
5.3.4 Category-specific QA/QC This source category is covered by the general QA/QC procedures discussed in Chapter 1.
5.3.5 Category-specific recalculations No category-specific recalculations were made.
5.3.6 Category-specific planned improvements It will be investigated whether enough information is available to include the emissions from more manure treatment techniques, namely manure hygienisation and the composting of manure.
5.4 Agricultural soils (3D) 5.4.1 Source category description
In 2018 agricultural soils were responsible for 29% of total GHG emissions in the Agriculture sector. Total N2O emissions from agricultural soils decreased by 42% between 1990 and 2018 (Table 5.8). In 2018, N2O emissions from grazing increased by about 2% compared with 2017, as a result of an increase in the number of cattle kept on pasture. Emissions from inorganic N fertilisers decreased by 9% in 2018 compared with 2017, due to a decrease in application. Emissions from crop residues have remained similar between 2017 and 2018.

RIVM report 2020-0031
Page 190 of 525
Table 5.8. Overview of the sector agricultural soils (3D) in the base year and the last two years of the inventory (in Tg CO2 eq.).
Sector/category Gas Key 1990 2017 2018 2018 vs
1990 Contribution to total in
2018 (%) by
Emissions in Tg CO2 eq % sector total gas
total CO2 eq
3D. Agriculture soils N2O 9.3 5.5 5.3 -42.4% 29.3% 64.0% 2.8% 3Da. Direct N2O emissions from agricultural soils N2O L.T 7.7 4.9 4.7 -38.3% 25.9% 56.5% 2.5% 3Da1. Inorganic ferilizers N2O 2.5 1.5 1.4 -44.4% 7.7% 16.7% 0.7% 3Da2. Organic N fertilizers N2O 0.8 1.4 1.3 74.1% 7.4% 16.1% 0.7% 3Da3. Urine and dung from grazing animals N2O 3.0 0.9 1.0 -68.5% 5.2% 11.4% 0.5% 3Da4. Crop residues N2O 0.5 0.3 0.3 -27.4% 1.9% 4.0% 0.2% 3Da6. Cultivation of organic soils N2O - 0.9 0.7 0.7 -21.7% 3.8% 8.2% 0.4% 3Db. Indirect N2O Emissions from managed soils N2O L.T 1.6 0.6 0.6 -61.3% 3.4% 7.5% 0.3%
The decrease in total N2O emissions from 1990 was caused by a relatively large decrease in N input into soil (from inorganic fertiliser and organic N fertiliser application and production of animal manure on pasture during grazing; Figure 5.5). This was partly counteracted by a shift from applying manure on top of the soil (surface spreading) towards incorporating manure into the soil, initiated by the Dutch ammonia policy. Incorporating manure into the soil reduces emissions of ammonia but increases direct emissions of N2O, counteracted in part by lower indirect N2O emission following the atmospheric deposition of NH3 and NOx. Methane emissions from agricultural soils are regarded as natural, non-anthropogenic emissions and are therefore not estimated.
Editor
Usual correx.
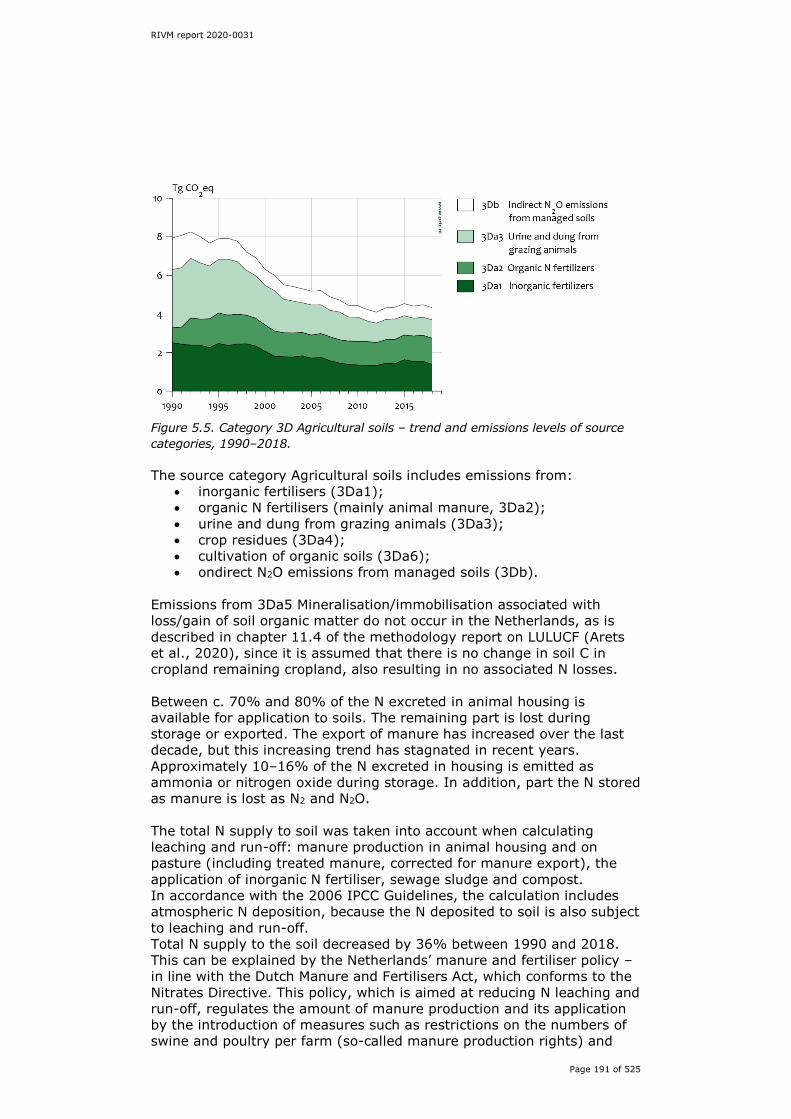
RIVM report 2020-0031
Page 191 of 525
Figure 5.5. Category 3D Agricultural soils – trend and emissions levels of source categories, 1990–2018. The source category Agricultural soils includes emissions from:
• inorganic fertilisers (3Da1); • organic N fertilisers (mainly animal manure, 3Da2); • urine and dung from grazing animals (3Da3); • crop residues (3Da4); • cultivation of organic soils (3Da6); • ondirect N2O emissions from managed soils (3Db).
Emissions from 3Da5 Mineralisation/immobilisation associated with loss/gain of soil organic matter do not occur in the Netherlands, as is described in chapter 11.4 of the methodology report on LULUCF (Arets et al., 2020), since it is assumed that there is no change in soil C in cropland remaining cropland, also resulting in no associated N losses. Between c. 70% and 80% of the N excreted in animal housing is available for application to soils. The remaining part is lost during storage or exported. The export of manure has increased over the last decade, but this increasing trend has stagnated in recent years. Approximately 10–16% of the N excreted in housing is emitted as ammonia or nitrogen oxide during storage. In addition, part the N stored as manure is lost as N2 and N2O. The total N supply to soil was taken into account when calculating leaching and run-off: manure production in animal housing and on pasture (including treated manure, corrected for manure export), the application of inorganic N fertiliser, sewage sludge and compost. In accordance with the 2006 IPCC Guidelines, the calculation includes atmospheric N deposition, because the N deposited to soil is also subject to leaching and run-off. Total N supply to the soil decreased by 36% between 1990 and 2018. This can be explained by the Netherlands’ manure and fertiliser policy – in line with the Dutch Manure and Fertilisers Act, which conforms to the Nitrates Directive. This policy, which is aimed at reducing N leaching and run-off, regulates the amount of manure production and its application by the introduction of measures such as restrictions on the numbers of swine and poultry per farm (so-called manure production rights) and
RIVM report 2020-0031
Page 192 of 525
maximum application limits for manure and inorganic N fertiliser. Since the leaching fraction has also decreased over time, the amount of nitrogen leached or run off has been reduced by 44% since 1990. Emissions from crop residues decreased by 27% between 1990 and 2018. The same decreasing trend can be seen in the amount of crop residues left on the field. This is mainly because of a decrease in grassland renewal.
5.4.2 Methodological issues Direct and indirect N2O emissions from agricultural soils are estimated using country-specific activity data on N input to soil and NH3 volatilisation during grazing, manure management and manure application. Most of these data are estimated at a Tier 2 or Tier 3 level. The present methodologies comply with the 2006 IPCC Guidelines. A description of the methodologies used and data sources is presented in Lagerwerf et al. (2019). Calculations of N2O emissions from agricultural soils are based on a variety of activity data, including manure production (calculated as described in Section 5.3) and statistics on inorganic N fertiliser application, compost and sewage sludge use, crop area and cultivated organic soil area. For an overview of data sources, see chapter 12 of the methodology report (Lagerwerf et al., 2019) or the background document by Van der Hoek et al. (2007). The activity data and characteristics for crops are presented in Van Bruggen et al. (2020). Direct N2O emissions (3Da) An IPCC Tier 1b/2 methodology is used to estimate direct N2O emissions from agricultural soils. The EF of inorganic N fertiliser application for direct N2O emissions is based on a weighted mean of different inorganic N fertiliser types applied on both mineral and organic soils. The EFs for the application of animal manure or manure produced on pasture land during grazing are also based on weighted means of the EF for mineral and organic soils. As arable farming hardly ever occurs on organic soils in the Netherlands, the EF for crop residues is based on mineral soils only. An overview of the EFs used is presented in Table 5.9, with default IPCC EFs included for comparison. For compost no experimental data on emissions are available. The EF for compost was set equal to that of surface-applied manure, because compost is also surface-applied. The EF used for urine and dung deposited by gazing animals is based on Velthof et al. (1996). Annex 10.1 and 10.7 of the methodology report of Lagerwerf et al. (2019) describe how the results of this paper were used to calculate the EFs used in the inventory of the Netherlands.

RIVM report 2020-0031
Page 193 of 525
Table 5.9. EFs for direct N2O emissions from agricultural soils (kg N2O-N per kg N supplied). Source Default IPCC EF used Reference Inorganic N fertiliser 0.01 0.013 1 Animal manure application 0.01 Surface spreading 0.004 1 Incorporation into soil 0.009 1 Sewage sludge 0.01 Surface spreading 0.004 1 Incorporation into soil 0.009 1 Compost 0.01 0.004 2 Crop residues 0.01 0.01 3 Cultivation of organic soils 0.02 3, 4 Animal manure during grazing (cattle/swine/poultry)
0.02 0.033 1
Animal manure during grazing (sheep/other animals)
0.01 0.033 1
References: 1 = Velthof et al. (2010), Velthof and Mosquera (2011), Van Schijndel and Van der Sluis (2011); 2 = equal to that of surface-applied manure (Velthof and Mosquera, 2011); 3 = Van der Hoek et al. (2007); 4 = Kuikman et al. (2005). The IEF for direct N2O emissions from agricultural soils for the application of animal manure shows a substantial increase in the period 1990–2018 (Table 5.10). This was caused by an ammonia policy-driven shift from the surface spreading of manure to the incorporation of manure into the soil. Table 5.10. N2O implied emission factor (kg N2O-N per kg N supplied) from animal manure applied (excl. manure on pasture) to agricultural soils, 1990–2018. ‘90 ‘95 ‘00 ‘05 ‘10 ‘15 ‘17 ‘18 Nitrogen input from manure applied to soils
0.004 0.008 0.009 0.009 0.009 0.009 0.009 0.009
The net decrease in direct N2O emissions can be explained by the decrease in the direct N input to the soil by manure and inorganic N fertiliser application, partly countered by an increase in IEF due to incorporation into soil. Emissions from animal manure application are estimated for two manure application methods: surface spreading (with a lower EF) and incorporation into soil (with a higher EF). The higher value for incorporation is explained by two mechanisms. Incorporation of animal manure into the soil produces less ammonia; therefore, more reactive nitrogen enters the soil and is available for N2O emission. Furthermore, the manure is more concentrated (i.e. hot spots/anaerobic) than with surface spreading, generally creating improved conditions for N2O production during nitrification and denitrification processes.
RIVM report 2020-0031
Page 194 of 525
There is insufficient information on the amount of urea made, imported, exported and used in the Netherlands to calculate the CO2 emissions from urea. Therefore, all the emissions are reported in 2B1. For more information, see Section 4.3.1. Indirect N2O emissions (3Db) An IPCC Tier 1 method is used to estimate indirect N2O emissions from atmospheric deposition. Country-specific data on NH3 and NOx emissions (estimated at Tier 3 level using NEMA) are multiplied by the IPCC default N2O EF. Indirect N2O emissions resulting from leaching and run-off are estimated using country-specific data on total N input to soil and leaching fraction (estimated at Tier 3 level). The difference in FRACleach is justified by specific characteristics of the Netherlands’ agricultural soils, with relatively high water tables. A model (STONE) was adopted to assess this fraction, as described in Velthof and Mosquera (2011), with IPCC default values used for the N2O EF.
5.4.3 Uncertainty and time series consistency Uncertainty The Approach 1 uncertainty analysis, outlined in Annex 2, provides estimates of uncertainty per IPCC source category. The uncertainty in direct N2O emissions from inorganic N fertiliser, organic N fertiliser, and manure and dung deposited by grazing animals is estimated to be 45%, 66% and 67%, respectively. The uncertainty in indirect N2O emissions from N used in agriculture is estimated to be 267% (leaching and run-off) and 414% (atmospheric deposition). Time series consistency A consistent methodology is used throughout the time series; see Section 5.4.2. Emissions are calculated as the product of livestock numbers and EFs. Livestock numbers are collected through the Identification and Registration system and in an annual census, as published by the CBS. Consistent methods are used in compiling the census to ensure consistency in the collected data.
5.4.4 Category-specific QA/QC This source category is covered by the general QA/QC procedures discussed in Chapter 1.
5.4.5 Category-specific recalculations The definitive amount of inorganic fertiliser used in 2017 is included in the activity data. The total amount of inorganic fertiliser used in the calculations of the NIR 2019 was 253.4 kton N, which was adjusted to 245.2 kton N for this submission. As a result, N2O emissions were lowered by 167 ton. New research was carried out on the N content of arable crop residues, resulting in revised emission estimates (De Ruijter and Huijsmans, 2019). This has resulted in a decrease in direct N2O emissions of 10.6 ton (3.2 kton CO2 eq.) in 1990, and 7.9 ton (2.3 kton CO2 eq.) in 2017. For grassland renewal the figure for 2017 was, however, adjusted, increasing emissions by 13.3 ton N2O (4.0 kton CO2 eq.). Overall, N2O
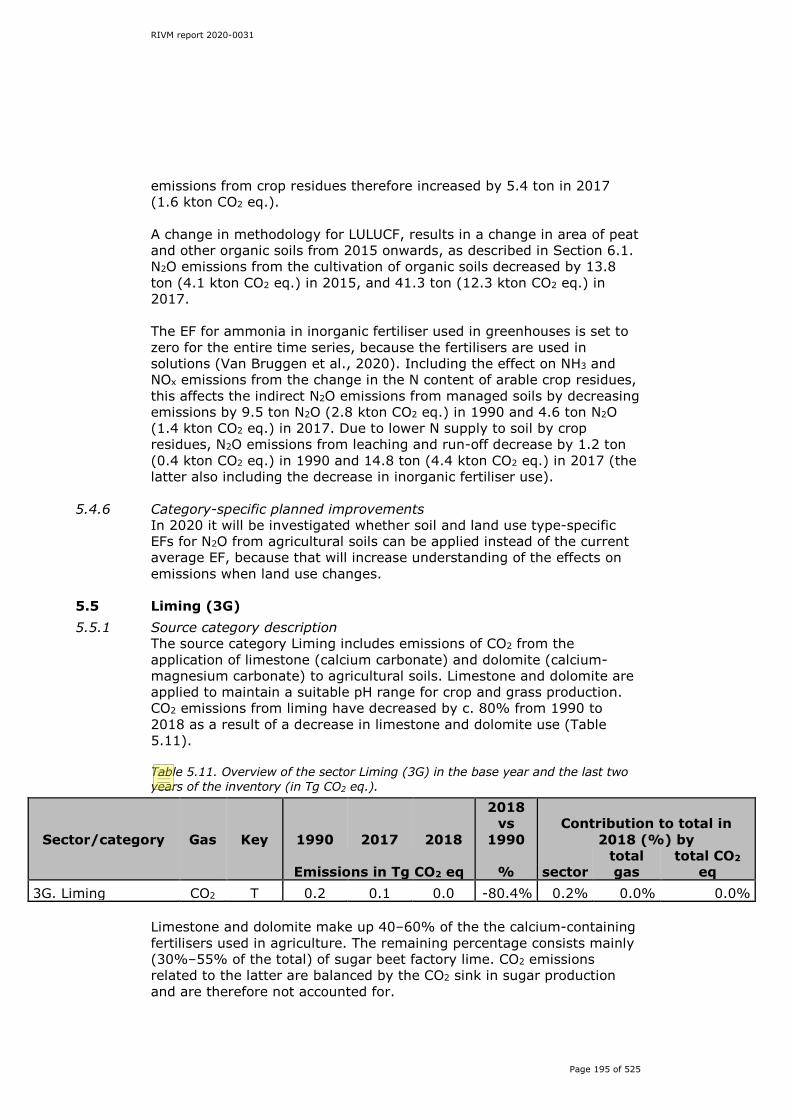
RIVM report 2020-0031
Page 195 of 525
emissions from crop residues therefore increased by 5.4 ton in 2017 (1.6 kton CO2 eq.). A change in methodology for LULUCF, results in a change in area of peat and other organic soils from 2015 onwards, as described in Section 6.1. N2O emissions from the cultivation of organic soils decreased by 13.8 ton (4.1 kton CO2 eq.) in 2015, and 41.3 ton (12.3 kton CO2 eq.) in 2017. The EF for ammonia in inorganic fertiliser used in greenhouses is set to zero for the entire time series, because the fertilisers are used in solutions (Van Bruggen et al., 2020). Including the effect on NH3 and NOx emissions from the change in the N content of arable crop residues, this affects the indirect N2O emissions from managed soils by decreasing emissions by 9.5 ton N2O (2.8 kton CO2 eq.) in 1990 and 4.6 ton N2O (1.4 kton CO2 eq.) in 2017. Due to lower N supply to soil by crop residues, N2O emissions from leaching and run-off decrease by 1.2 ton (0.4 kton CO2 eq.) in 1990 and 14.8 ton (4.4 kton CO2 eq.) in 2017 (the latter also including the decrease in inorganic fertiliser use).
5.4.6 Category-specific planned improvements In 2020 it will be investigated whether soil and land use type-specific EFs for N2O from agricultural soils can be applied instead of the current average EF, because that will increase understanding of the effects on emissions when land use changes.
5.5 Liming (3G) 5.5.1 Source category description
The source category Liming includes emissions of CO2 from the application of limestone (calcium carbonate) and dolomite (calcium-magnesium carbonate) to agricultural soils. Limestone and dolomite are applied to maintain a suitable pH range for crop and grass production. CO2 emissions from liming have decreased by c. 80% from 1990 to 2018 as a result of a decrease in limestone and dolomite use (Table 5.11). Table 5.11. Overview of the sector Liming (3G) in the base year and the last two years of the inventory (in Tg CO2 eq.).
Sector/category Gas Key 1990 2017 2018
2018 vs
1990 Contribution to total in
2018 (%) by
Emissions in Tg CO2 eq % sector total gas
total CO2 eq
3G. Liming CO2 T 0.2 0.1 0.0 -80.4% 0.2% 0.0% 0.0% Limestone and dolomite make up 40–60% of the the calcium-containing fertilisers used in agriculture. The remaining percentage consists mainly (30%–55% of the total) of sugar beet factory lime. CO2 emissions related to the latter are balanced by the CO2 sink in sugar production and are therefore not accounted for.
Editor
Usual correx.
RIVM report 2020-0031
Page 196 of 525
5.5.2 Methodological issues Data on liming are derived from annually updated statistics on fertiliser use. The yearly amounts of applied limestone and dolomite are converted into CO2 emissions in line with the calculations in the 2006 IPCC Guidelines. Limestone and dolomite amounts, reported in CaO (calcium oxide) equivalents, are multiplied by the EFs for limestone (440 kg CO2/ton pure limestone) and for dolomite (477 kg CO2/ton pure dolomite). This method complies with the IPCC Tier 1 methodology. More detailed descriptions of the methodologies and EFs used can be found in the methodology report (Lagerwerf et al., 2019).
5.5.3 Uncertainty and time series consistency Uncertainty The Approach 1 analysis, outlined in Annex 2, provides estimates of uncertainties by IPCC source category. The uncertainty in CO2 emissions from Liming of soils is calculated to be 100%. The uncertainty in the activity data is estimated to be 100% and the uncertainty in the EFs is 10%. When considered over a longer time span, all carbon applied through liming is emitted. New insights into uncertainties for this source category will be further elaborated and taken into account in the NIR 2021. Time series consistency The methodology used to calculate CO2 emissions from limestone and dolomite application for the period 1990–2017 is consistent over time. Statistics on calcium-containing fertiliser use are collected by Wageningen Economic Research and published on the website agrimatie.nl (direct link: http://agrimatie.nl/KunstMest.aspx?ID=16927).
5.5.4 Category-specific QA/QC and verification The source categories are covered by the general QA/QC procedures discussed in Chapter 1.
5.5.5 Category-specific recalculations Updated activity data for liming became available, increasing 2017 emissions by 1.9 kton CO2.
5.5.6 Category-specific planned improvements No category-specific improvements are currently planned.

RIVM report 2020-0031
Page 197 of 525
6 Land use, land use change and forestry (CRF sector 4)
Major changes in the LULUCF sector compared with the National Inventory Report 2019
Emissions:
Total LULUCF emissions in 2018 decreased by 2.6% compared with 2017. Compared with the base year, there is a reduction of 24.3%. As a result of methodological changes described in this NIR 2020, emissions in the LULUCF sector for the year 1990 decreased by less than 0.1% compared with the NIR 2019. For 2017 they decreased by 10% compared with the NIR 2019.
Key categories: No changes.
Methodologies: This year, five methodological changes have been implemented: 1) A new soil map (2014) was included in the NIR 2019, which resulted in a gradually decreasing area of organic soils in the Netherlands between 1977 and 2014. The decreasing trend has now been extrapolated after 2014. (In the NIR 2019 this was kept constant after 2014.) This is in line with the provisional recommendation L.20 of the ERT in the 2019 review. This has an effect on areas of, and emissions from, organic soils in both the ‘land converted to’ and ‘remaining’ land use categories. 2) The EFs for drainage of organic (peat and peaty) soils have been corrected to take into consideration the changed area of organic soils. EFs decreased from an average 19 (peat) or 13 (peaty) ton CO2 per ha of drained organic soil in 2004 to 17.7 (peat) or 12 (peaty) ton CO2 per ha of drained soil in 2014. Between 2004 and 2014 the trend in decreasing EFs has been interpolated and after 2014 the trend has been extrapolated. 3) Calculations for CO2 emissions from the drainage of organic soils under forest land were included in the NIR 2019. The associated N2O emissions have now also been included. This change conforms to the recommendation L.16 of the ERT in the 2019 review. 4) In this NIR 2020 the total round wood harvest is allocated to Forest land remaining forest land to be more consistent with the data used for assessing
RIVM report 2020-0031
Page 198 of 525
round wood harvests. This is an addition to the approach introduced in the NIR 2019 for assessing wood harvests from forests. 5) Until the NIR 2019 the 1990 land area included on the land use map was used as the basis for all overlays. However, between 2008 and 2013, 2,000 ha of land was reclaimed from the sea as an extension of the harbour in Rotterdam (Maasvlakte 2). Now the total area is determined with the 2017 land use map as a basis.
6.1 Overview of sector 6.1.1 General overview of shares and trends in sources and sinks
This chapter describes the 2020 GHG inventory for the Land use, land use change and forestry (LULUCF) sector. It covers both the sources and sinks of CO2 from land use, land use change and forestry. Emissions of nitrous oxide (N2O) from the cultivation of organic souls are included in the Agriculture sector (category 3D), except for N2O emissions from forest land, which are reported in CRF Table 4(II). Emissions of CH4 from wetland are not estimated due to the lack of data. Land use in the Netherlands is dominated by agriculture (approximately 55%), followed by settlements (15%) and forestry (9%); 3% comprises dunes, nature reserves, wildlife areas, heather and reed swamp. The remaining area (18%) is open water. The soils in the Netherlands are dominated by mineral soils, mainly sandy soils and clay soils (of fluvial or marine origin). Organic soils, used mainly as meadowland or hayfields, cover about 11% of the land area, one-third of them being peaty soils. The Netherlands has an intensive agricultural system with high inputs of nutrients and organic matter. The majority of agricultural land is grassland (54%) or arable farming land (28%). The remaining land is fallow or used for horticulture, fruit trees, etc. A total of 71% of grassland is permanent grassland (4% of which is high-nature-value grassland); the remaining 25% is temporary grassland, on which grass and fodder maize are cultivated in rotation (CBS, 2017a). Since 1990, the agricultural land area has decreased by about 5%, mainly because of conversion to settlements/infrastructure and nature. Table 6.1 shows the sources and sinks in the LULUCF sector in 1990, 2017 and 2018. For 1990 and 2018, total net emissions are estimated to be approximately 6.5 Tg CO2 eq. and 4.9 Tg CO2 eq., respectively. The results for 2017 have been added to give insight into annual changes.
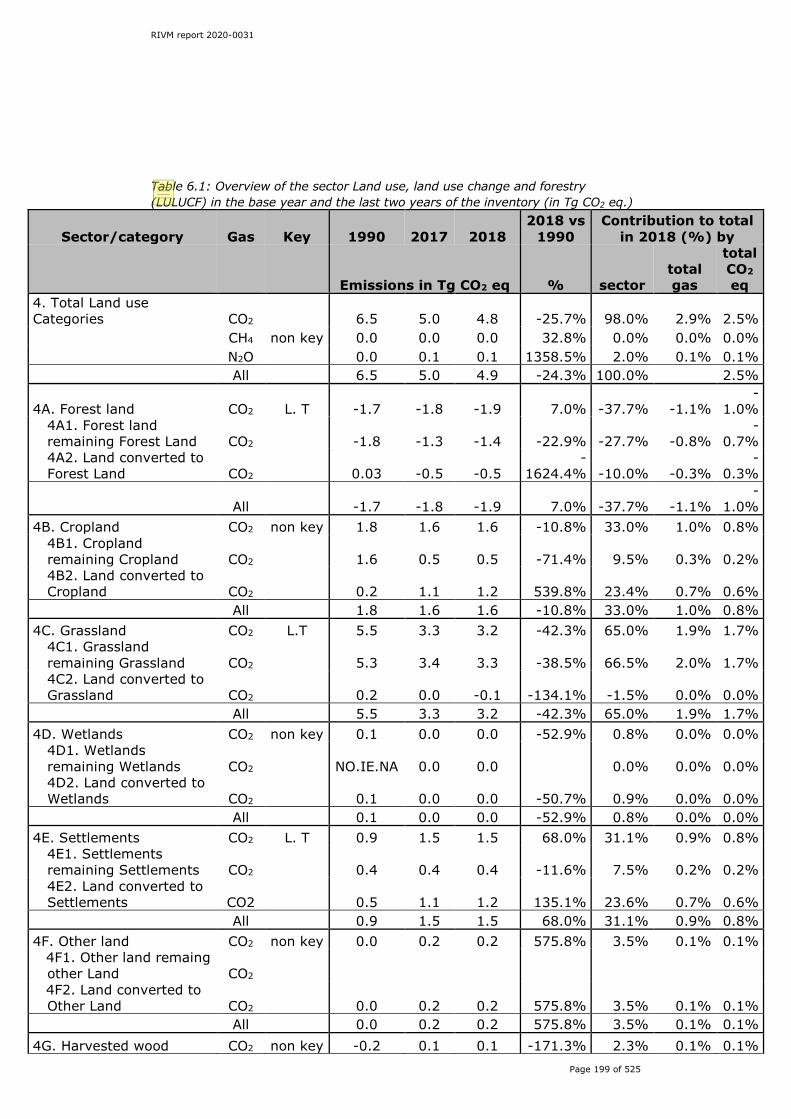
RIVM report 2020-0031
Page 199 of 525
Table 6.1: Overview of the sector Land use, land use change and forestry (LULUCF) in the base year and the last two years of the inventory (in Tg CO2 eq.)
Sector/category Gas Key 1990 2017 2018 2018 vs
1990 Contribution to total
in 2018 (%) by
Emissions in Tg CO2 eq % sector total gas
total CO2 eq
4. Total Land use Categories CO2 6.5 5.0 4.8 -25.7% 98.0% 2.9% 2.5% CH4 non key 0.0 0.0 0.0 32.8% 0.0% 0.0% 0.0% N2O 0.0 0.1 0.1 1358.5% 2.0% 0.1% 0.1% All 6.5 5.0 4.9 -24.3% 100.0% 2.5%
4A. Forest land CO2 L. T -1.7 -1.8 -1.9 7.0% -37.7% -1.1% -
1.0% 4A1. Forest land remaining Forest Land CO2 -1.8 -1.3 -1.4 -22.9% -27.7% -0.8%
-0.7%
4A2. Land converted to Forest Land CO2 0.03 -0.5 -0.5
-1624.4% -10.0% -0.3%
-0.3%
All -1.7 -1.8 -1.9 7.0% -37.7% -1.1% -
1.0% 4B. Cropland CO2 non key 1.8 1.6 1.6 -10.8% 33.0% 1.0% 0.8%
4B1. Cropland remaining Cropland CO2 1.6 0.5 0.5 -71.4% 9.5% 0.3% 0.2% 4B2. Land converted to Cropland CO2 0.2 1.1 1.2 539.8% 23.4% 0.7% 0.6%
All 1.8 1.6 1.6 -10.8% 33.0% 1.0% 0.8% 4C. Grassland CO2 L.T 5.5 3.3 3.2 -42.3% 65.0% 1.9% 1.7%
4C1. Grassland remaining Grassland CO2 5.3 3.4 3.3 -38.5% 66.5% 2.0% 1.7% 4C2. Land converted to Grassland CO2 0.2 0.0 -0.1 -134.1% -1.5% 0.0% 0.0%
All 5.5 3.3 3.2 -42.3% 65.0% 1.9% 1.7% 4D. Wetlands CO2 non key 0.1 0.0 0.0 -52.9% 0.8% 0.0% 0.0%
4D1. Wetlands remaining Wetlands CO2 NO.IE.NA 0.0 0.0 0.0% 0.0% 0.0% 4D2. Land converted to Wetlands CO2 0.1 0.0 0.0 -50.7% 0.9% 0.0% 0.0%
All 0.1 0.0 0.0 -52.9% 0.8% 0.0% 0.0% 4E. Settlements CO2 L. T 0.9 1.5 1.5 68.0% 31.1% 0.9% 0.8%
4E1. Settlements remaining Settlements CO2 0.4 0.4 0.4 -11.6% 7.5% 0.2% 0.2% 4E2. Land converted to Settlements CO2 0.5 1.1 1.2 135.1% 23.6% 0.7% 0.6%
All 0.9 1.5 1.5 68.0% 31.1% 0.9% 0.8% 4F. Other land CO2 non key 0.0 0.2 0.2 575.8% 3.5% 0.1% 0.1%
4F1. Other land remaing other Land CO2 4F2. Land converted to Other Land CO2 0.0 0.2 0.2 575.8% 3.5% 0.1% 0.1%
All 0.0 0.2 0.2 575.8% 3.5% 0.1% 0.1% 4G. Harvested wood CO2 non key -0.2 0.1 0.1 -171.3% 2.3% 0.1% 0.1%
Editor
Usual correx. to table.
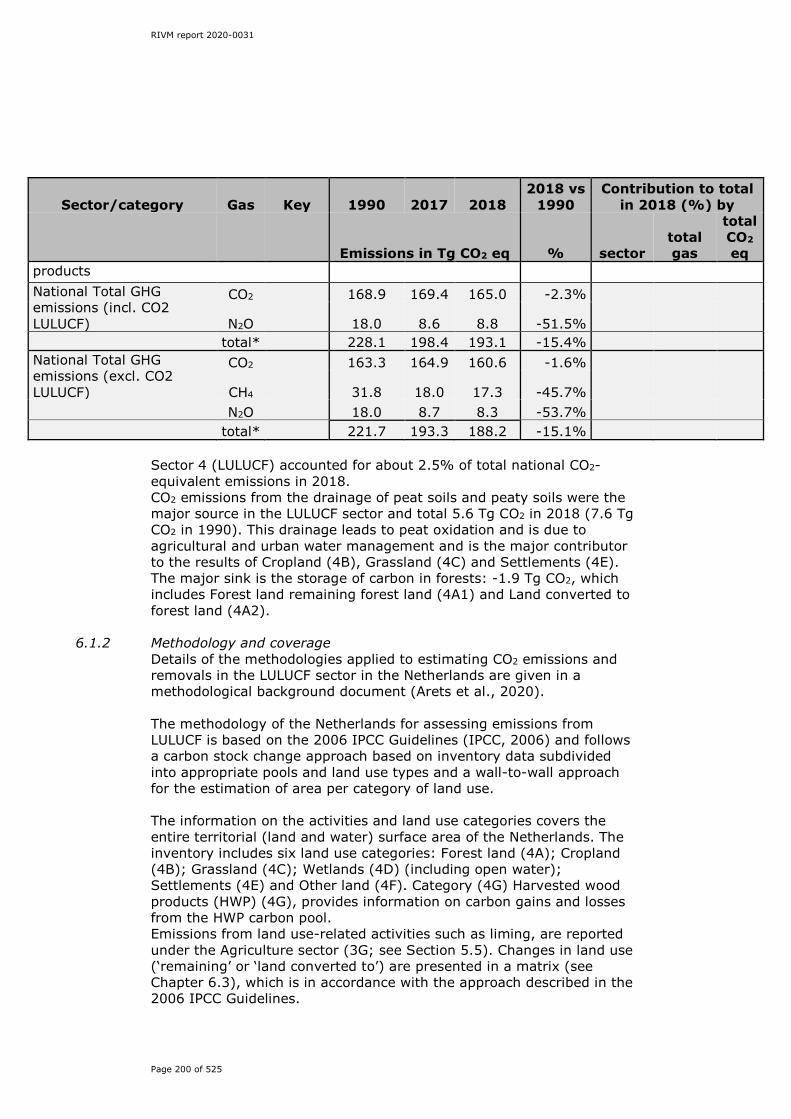
RIVM report 2020-0031
Page 200 of 525
Sector/category Gas Key 1990 2017 2018 2018 vs
1990 Contribution to total
in 2018 (%) by
Emissions in Tg CO2 eq % sector total gas
total CO2 eq
products National Total GHG emissions (incl. CO2 LULUCF)
CO2 168.9 169.4 165.0 -2.3%
N2O 18.0 8.6 8.8 -51.5% total* 228.1 198.4 193.1 -15.4% National Total GHG emissions (excl. CO2 LULUCF)
CO2 163.3 164.9 160.6 -1.6%
CH4 31.8 18.0 17.3 -45.7% N2O 18.0 8.7 8.3 -53.7% total* 221.7 193.3 188.2 -15.1%
Sector 4 (LULUCF) accounted for about 2.5% of total national CO2-equivalent emissions in 2018. CO2 emissions from the drainage of peat soils and peaty soils were the major source in the LULUCF sector and total 5.6 Tg CO2 in 2018 (7.6 Tg CO2 in 1990). This drainage leads to peat oxidation and is due to agricultural and urban water management and is the major contributor to the results of Cropland (4B), Grassland (4C) and Settlements (4E). The major sink is the storage of carbon in forests: -1.9 Tg CO2, which includes Forest land remaining forest land (4A1) and Land converted to forest land (4A2).
6.1.2 Methodology and coverage Details of the methodologies applied to estimating CO2 emissions and removals in the LULUCF sector in the Netherlands are given in a methodological background document (Arets et al., 2020). The methodology of the Netherlands for assessing emissions from LULUCF is based on the 2006 IPCC Guidelines (IPCC, 2006) and follows a carbon stock change approach based on inventory data subdivided into appropriate pools and land use types and a wall-to-wall approach for the estimation of area per category of land use. The information on the activities and land use categories covers the entire territorial (land and water) surface area of the Netherlands. The inventory includes six land use categories: Forest land (4A); Cropland (4B); Grassland (4C); Wetlands (4D) (including open water); Settlements (4E) and Other land (4F). Category (4G) Harvested wood products (HWP) (4G), provides information on carbon gains and losses from the HWP carbon pool. Emissions from land use-related activities such as liming, are reported under the Agriculture sector (3G; see Section 5.5). Changes in land use (‘remaining’ or ‘land converted to’) are presented in a matrix (see Chapter 6.3), which is in accordance with the approach described in the 2006 IPCC Guidelines.

RIVM report 2020-0031
Page 201 of 525
The land use category Grassland is subdivided in two sub-categories: Grassland (non-TOF) and Trees outside forests (TOF) (see Section 6.2 and Arets et al., 2020). The sub-category Grassland (non-TOF) is the aggregation of the main sub-categories Grassland (i.e. predominantly grass vegetation), Nature (mainly heathland and peat moors) and Orchards. All IPCC categories are applicable in the Netherlands. Trees outside forests are units of land that do not meet the minimum area requirement for the forest definition, but otherwise fulfil those requirements in terms of tree cover and tree height. This category is included under Grassland (see also Chapter 11). In terms of carbon stocks and their changes, the TOF category, however, is similar to Forest land. Conversions of land use from, to and between Grassland (non-TOF) and TOF are separately monitored, and subsequent calculations of carbon stock changes differ from one another (see Arets et al., 2020). An overview of the completeness of reporting by the Netherlands is provided in Table 6.2. In this table, pools for which carbon stock changes are reported are indicated in bold, with the appropriate tier level in brackets. ‘NO’ is used for pools for which there are no carbon stock changes. ‘IE’ indicates that carbon stock changes are included elsewhere. Pools for which carbon stock changes are not estimated are marked ‘NE’, with an indication of the significance of the respective source or sink (‘s’ = significant, ‘n.s.’ = not significant) and a reference to the section where this is justified in this NIR. Based on the recommendations of the ERT in the draft review of the NIR 2019, the notation key NA is used in cases with a Tier 1 assumption of carbon stock equilibrium.
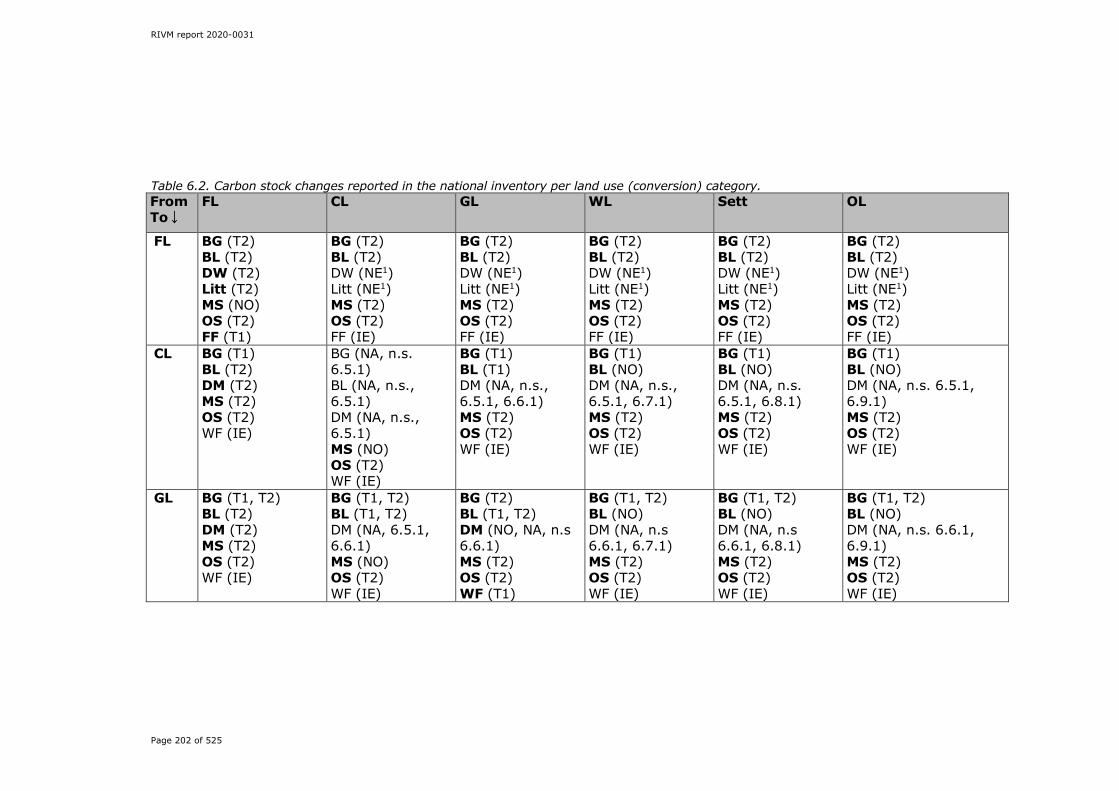
RIVM report 2020-0031
Page 202 of 525
Table 6.2. Carbon stock changes reported in the national inventory per land use (conversion) category. From To↓
FL CL GL WL Sett OL
FL BG (T2) BL (T2) DW (T2) Litt (T2) MS (NO) OS (T2) FF (T1)
BG (T2) BL (T2) DW (NE1) Litt (NE1) MS (T2) OS (T2) FF (IE)
BG (T2) BL (T2) DW (NE1) Litt (NE1) MS (T2) OS (T2) FF (IE)
BG (T2) BL (T2) DW (NE1) Litt (NE1) MS (T2) OS (T2) FF (IE)
BG (T2) BL (T2) DW (NE1) Litt (NE1) MS (T2) OS (T2) FF (IE)
BG (T2) BL (T2) DW (NE1) Litt (NE1) MS (T2) OS (T2) FF (IE)
CL BG (T1) BL (T2) DM (T2) MS (T2) OS (T2) WF (IE)
BG (NA, n.s. 6.5.1) BL (NA, n.s., 6.5.1) DM (NA, n.s., 6.5.1) MS (NO) OS (T2) WF (IE)
BG (T1) BL (T1) DM (NA, n.s., 6.5.1, 6.6.1) MS (T2) OS (T2) WF (IE)
BG (T1) BL (NO) DM (NA, n.s., 6.5.1, 6.7.1) MS (T2) OS (T2) WF (IE)
BG (T1) BL (NO) DM (NA, n.s. 6.5.1, 6.8.1) MS (T2) OS (T2) WF (IE)
BG (T1) BL (NO) DM (NA, n.s. 6.5.1, 6.9.1) MS (T2) OS (T2) WF (IE)
GL BG (T1, T2) BL (T2) DM (T2) MS (T2) OS (T2) WF (IE)
BG (T1, T2) BL (T1, T2) DM (NA, 6.5.1, 6.6.1) MS (NO) OS (T2) WF (IE)
BG (T2) BL (T1, T2) DM (NO, NA, n.s 6.6.1) MS (T2) OS (T2) WF (T1)
BG (T1, T2) BL (NO) DM (NA, n.s 6.6.1, 6.7.1) MS (T2) OS (T2) WF (IE)
BG (T1, T2) BL (NO) DM (NA, n.s 6.6.1, 6.8.1) MS (T2) OS (T2) WF (IE)
BG (T1, T2) BL (NO) DM (NA, n.s. 6.6.1, 6.9.1) MS (T2) OS (T2) WF (IE)

RIVM report 2020-0031
Page 203 of 525
From To↓
FL CL GL WL Sett OL
WL BG (NE, n.s. 6.7.1) BL (T2) DM (T2) MS (T2) OS (T2) WF (IE)
BG (NE, n.s. 6.7.1) BL (T1) DM (NE, 6.5.1, 6.7.1) MS (T2) OS (T2) WF (IE)
BG (NE, n.s. 6.7.1) BL (T1, T2) DM (NE, 6.6.1, 6.7.1) MS (T2) OS (T2) WF (IE)
BG (NE, n.s. 6.7.1) BL (NE, n.s. 6.7.1) DM (NE, n.s. 6.7.1) MS (T2) OS (NO) WF (IE)
BG (NE, n.s. 6.7.1) BL (NO) DM (NE, n.s 6.7.1, 6.8.1) MS (T2) OS (NO) WF (IE)
BG (NE, n.s. 6.7.1) BL (NO) DM (NE, n.s 6.7.1, 6.9.1) MS (T2) OS (NO) WF (IE)
Sett BG (NE, n.s. 6.8.1) BL (T2) DM (T2) MS (T2) OS (T2) WF (NO)
BG (NE, n.s. 6.8.1) BL (T1) DM (NA, 6.5.1, 6.8.1) MS (T2) OS (T2) WF (NO)
BG (NE, n.s. 6.8.1) BL (T1, T2) DM (NA, 6.6.1, 6.8.1) MS (T2) OS (T2) WF (NO)
BG (NE, n.s. 6.8.1) BL (NO) DM (NA, 6.7.1, 6.8.1) MS (T2) OS (T2) WF (NO)
BG (NA, n.s. 6.8.1) BL (NA, n.s. 6.8.1) DM (NA, 6.8.1) MS (NO) OS (T2) WF (NO)
BG (NE, n.s. 6.8.1) BL (NO) DM (NA, 6.8.1, 6.9.1) MS (T2) OS (T2) WF (NO)
OL BG (NO, n.s. 6.9.1) BL (T2) DM (T2) MS (T2) OS (NO) WF (NO)
BG (NO, n.s. 6.9.1) BL (T1) DM (NA, 6.5.1, 6.9.1) MS (T2) OS (T2) WF (NO)
BG (NO, n.s. 6.9.1) BL (T1, T2) DM (NA, 6.6.1, 6.9.1) MS (T2) OS (T2) WF (NO)
BG (NO, n.s. 6.9.1) BL (NO) DM (NA, 6.7.1, 6.9.1) MS (T2) OS (NO) WF (NO)
BG (NO, n.s. 6.9.1) BL (NO) DM (NA, 6.8.1, 6.9.1) MS (T2) OS (T2) WF (NO)
NA
Carbon stock changes included are: BG: Biomass Gain; BL: Biomass Loss; DW: Dead Wood; Litt: Litter; DM: Dead organic Matter; MS: Mineral Soils; OS: Organic Soils; FF: Forest Fires; WF: Other Wildfires. Land use types are: FL: Forest Land; CL: Cropland; GL: Grassland; TOF: Trees Outside Forests; WL: Wetland; Sett: Settlements; OL: Other Land. 1 Not a source; see chapter 4.2.2 of Arets et al. (2020).
RIVM report 2020-0031
Page 204 of 525
Forest land, Cropland, Grassland and Settlements are key categories. The last three are key categories due to their significant emissions from peat soils (see Sections 6.5.1, 6.6.1 and 6.8.1). Carbon stock changes in mineral soils The Netherlands has developed a Tier 2 approach for calculating carbon stock changes in mineral and organic soils. For mineral soils the approach is based on the overlay of the land use maps with the 2014 update of the Dutch soil map, combined with the soil carbon stocks that have been quantified for each land use and soil type combination (see section 3.5 in Arets et al., 2020). For the Netherlands, the basis for quantifying carbon emissions from land use changes on mineral soils is the LSK national sample survey of soil map units (Finke et al., 2001), which covers about 1,400 locations at five different depths. The carbon stock in the upper 30 cm was measured by de Groot et al. (2005a). The data were classified into 11 soil types and 4 land use categories (at the time of sampling) (Lesschen et al., 2012). Samples were taken only on forest land, cropland and grassland. For conversions involving other land uses, estimates were made using the 2006 IPCC Guidelines. The assumptions were:
• For conversion to settlements: 50% is paved and has a soil carbon stock of 80% of that of the former land use, 50% consists of grassland or wooded land with corresponding soil carbon stock.
• For wetland converted to or from forest, there is no change in carbon stock.
• For other land, the carbon stock is zero (conservative assumption).
The 2006 IPCC Guidelines prescribe a transition period of 20 years in which carbon stock changes take place. Such a transition period in mineral soils means that land use changes in 1970 will still have a small effect on reported carbon stock changes in 1990. Currently these effects are not included, but in order to improve on this, a new 1970 land use map is being prepared and tested. It is foreseen that this map will be included in the NIR 2021. Carbon stock changes in organic soils On the basis of the definition of organic soils in the 2006 IPCC Guidelines, two types of organic soils are considered. These are peat soils, which have a peat layer of at least 40 cm within the first 120 cm, and, peaty soils (Dutch: moerige gronden), which have a peat layer of 5–40 cm within the first 80 cm. Based on overlays of two soil maps – the initial map with the average year of sampling dated at 1977 and a 2014 update on the spatial extent of organic soils – the development of organic soil area between 1990 and 2014 was assessed (see Arets et al., 2020 for details). Drainage of cultivated organic soils results in oxidation and thus loss of peat in the Netherlands. As a result the total area of organic soils decreases from 528 kha in 1977 to 500 kha in 1990 and 437 kha in 2014. The total area of organic soils for the intermediate years is interpolated between 1977 and 2014. After 2014 the loss of
RIVM report 2020-0031
Page 205 of 525
organic soil area is extrapolated on the basis of the trend between 1977 and 2014. Changes in organic soil area are not yet monitored on a regular basis, but currently receive a lot of policy attention. Once new information on the extent of organic soils is available, the trend from 2014 will be recalculated. Overlays with the land use maps provide information on areas of organic soils under the different land use categories. Detailed information is provided in Arets et al. (2020). Based on the available datasets, two different approaches for calculating the EFs for peat soils and for peaty soils have been developed (see Arets et al., 2020). For CO2 emissions from cultivated peat soils the methodology is described in Kuikman et al. (2005). This method is based on subsidence as a consequence of the oxidation of organic matter. Estimated total annual emissions from cultivated soils are converted to an annual EF per ha peat soil to report emissions from peat soils for land use (change) categories Grassland, Cropland and Settlements. Using an intermediary peat map from 2004, this results in an average EF for peat of 19 tons CO2 ha-1 for the period 1990–2004. Using the updated 2014 land use map (see Arets et al., 2020), the approach results in an EF of 17.7 tons CO2 ha-1. The EF decreases because relatively more of the deepest drained peat areas have disappeared and hence draining is on average currently less deep than in the past, resulting in reduced emissions per ha of peat. Through interpolation the EF gradually decreases from 19 tons CO2 ha-1 in 2004 to 17.7 tons CO2 ha-1 in 2014. This decreasing trend of the EF is then extrapolated after 2014. Analyses are under way to also establish an EF based on the 1977 soil map. This will be included in future submissions, and will change the EFs in the period 1990–2004. For peaty soils, another approach was used, based on a large dataset of soil profile descriptions over time (de Vries et al., in press). From this dataset the average loss rate of peat was derived from the change in thickness of the peat layer over time. Again two EFs were assessed on the basis of the areas of peaty soils present on the 2004 map or the 2014 map. For 2004 the average EF for peaty soils was 13 tons CO2 ha-1, which is applied to the period 1990–2004 and an average EF of 12 tons CO2 ha-1 in 2014 (see Arets et al., 2020). Through interpolation the EF gradually decreases from 13 tons CO2 ha-1 in 2004 to 12 tons CO2 ha-1 in 2014. This decreasing trend of the EF then is extrapolated after 2014. Analyses are under way to also establish an EF based on the 1977 soil map. This will be included in future submissions, and will change the EFs in the period 1990–2004. Drainage of organic soils is not usually applied in forestry in the Netherlands. However, since afforestation usually occurs on land with previously agricultural land use, the possibility cannot be completely excluded that the old drainage systems from the agricultural sites are still active. Therefore, to account for possible emissions, the area of forest that is planted on organic soils that were previously in agricultural use and where drainage systems may still be (partially) functioning was

RIVM report 2020-0031
Page 206 of 525
estimated at 24.2% of the total forest area on peat soils and 22.0% of the total forest area on peaty soils. The same country-specific EFs are then applied to these areas as are used for drained peat and peaty soils under Grassland, Cropland and Settlements. Additionally, the associated emissions of N2O are calculated. For this a Tier 1 approach is used using the Tier 1 EF for boreal and temperate organic nutrient-rich (0.6 kg N2O-N ha-1) and nutrient-poor (0.1 kg N2O-N ha-1) forest soils. On average over the period 1990–2017, 79% of the forests on peat soil were on nutrient-rich peat soils and 21% on nutrient-poor peat soils (see Arets et al., 2020), and 100% of the forests on peaty soils were on nutrient-rich peaty soils. These ratios were then applied to the Tier 1 EFs to get average EFs of 0.495 kg N2O-N ha-1 for N2O emissions from drained peat soils under forest land and 0.6 kg N2O-N ha-1 for peaty soils. Detailed information on calculations for peat and peaty soils is provided in Arets et al. (2020). Emissions and removals from drainage and rewetting and other management of organic soils Carbon stock changes resulting from drainage are included in organic soils under the various land use categories. Rewetting and other management does not occur in the Netherlands. Direct nitrous oxide emissions from disturbance associated with land-use conversions Nitrous oxide (N2O) emissions from soils resulting from disturbance associated with land use conversions were calculated for all land use conversions using a Tier 2 methodology (see Arets et al., 2020). The default EF of 0.01 kg N2O-N/kg N was used. Average C:N ratios for three aggregated soil types, based on measurements (Arets et al., 2020), were used. For all other aggregated soil types, we used the default C:N ratio of 15 (IPCC, 2006: section 11.16). For aggregated soil types where conversion of land use led to a net gain of carbon, N2O emissions were set to zero. Controlled biomass burning Controlled biomass burning is reported as ‘IE’ and ‘NO’. The area of and emissions from the occasional burning carried out in the interest of nature management are included under wildfires. Other controlled burning, such as the burning of harvest residues, is not allowed in the Netherlands (see Article 10.2 of Wet Milieubeheer, the Environmental Protection Act).
6.1.3 Changes this year and recalculations for years previously reported This year, five methodological changes have been implemented, resulting in modifications to the carbon stock changes and associated emissions and removals along the whole time series. Extrapolation of trend of decreasing area of peat soil A new soil map (2014) was included in the NIR 2019 (Ruyssenaars et al., 2019), which resulted in a gradually decreasing area of organic soils in the Netherlands between 1977 and 2014. In the NIR 2019 this was kept constant after 2014. The decreasing trend has now been
RIVM report 2020-0031
Page 207 of 525
extrapolated after 2014. This conforms to the recommendation L.20 of the ERT in the 2019 review. This method change has an effect on areas of, and emissions from, organic soils in both the ‘land converted to’ and ‘remaining’ land use categories. Compared with the NIR 2019, emissions from organic soils under Forest land, Cropland, Grassland and Settlements are smaller, due to the projected smaller areas of drained organic soils after 2014. In total the area of peat soils has decreased by 1.7 kha per year, while the area of peaty soils has decreased by 0.8 kha per year. Emission factors for drained peat and peaty soils In the NIR 2020 the EFs for drainage of organic (peat and peaty) soils have been corrected to take into consideration the changed area of organic soils. Between 2004 and 2014 the decreasing trends in EFs are interpolated and after 2014 the trend is extrapolated (see paragraph on carbon stock changes in organic soils in Section 6.1, and Arets et al., 2020, for details). This method change is in line with the recommendation L.16 of the ERT in the draft 2019 review. As a result of this method change, emissions from drained organic soils gradually decrease further from 2004 onwards, as compared with the NIR 2019. N20 emissions from potential drainage of organic soils under forest land In addition to the calculations for CO2 emissions from the drainage of organic soils under forest land that were included in the NIR 2019, the associated N2O emissions are included in the present NIR (see paragraph on carbon stock changes in organic soils in Section 6.1, and Arets et al., 2020, for details). This conforms to the recommendation L.16 of the ERT in the draft 2019 review. This is a new source of emissions, which was not previously included in the NIR. Allocation of round wood harvests In the NIR 2020 the total round wood harvest is allocated to Forest land remaining forest land to be more consistent with the data used for assessing round wood harvests. This is an addition to the approach introduced in the NIR 2019 for assessing wood harvests from forests. In the NIR 2019 an improved approach was presented for the estimation of round wood harvests from forest (see NIR 2019 and chapter 4.2 in the LULUCF method report, Arets et al., 2020). The basis of this approach is that the total wood harvest is determined from information on harvesting from permanent plots recorded in repeated National Forest Inventories. However, the old allocation – assuming that deforestation contributes to the total harvest – was retained. As a result, the wood that potentially became available from deforestation was subtracted from the total harvest to assess the amount harvested from Forest land remaining forest land. Given that in the new approach the total harvest from Forest land remaining forest land has already been explicitly assessed from NFI data, this old allocation is not consistent with the underlying data.

RIVM report 2020-0031
Page 208 of 525
In order to improve consistency, the calculated harvest of round wood calculated from the NFI data is now considered to come from Forest land remaining forest land. Additional wood from deforestation is calculated separately on the basis of the area of deforestation and is considered as an instantaneous oxidation. The new method has consequences only for the Harvested wood products (HWP) pool category. In the new approach, the wood harvest from Forest land remaining forest land is bigger; hence the annual input into the HWP pool increases. The change has no effect on the emissions from Forest land remaining forest land because the net changes in carbon stock as determined from the Forest Inventories are not altered. The ‘gains’ and ‘losses’ of carbon stocks in living biomass do change, but their net effect is therefore zero. Total land area Until the NIR 2019, the 1990 land area included on the land use map was used as the basis for all overlays. Now the total area is determined from the 2017 land use map so that the area of land reclaimed from the sea as an extension of the harbour in Rotterdam (Maasvlakte 2, which has been ongoing since 2008) is also included. The total extent of this area is about 2 kha. About 0.5 kha of this area was included as sea (open water) on the 1990 map. As a result of this change there are differences in the total land area and land use changes compared with previous submissions. The total area included in the reporting increased by 1.5 kha from 4,151.5 kha to 4,153 kha. This additional area was included as open water under the Wetland category on the 1990 map and it remains water until a different land use is indicated on a renewed land use map. By 1 January 2017 (i.e. the date of the 2017 map), the outer contour of the seawall and part of the reclamation of Maasvlakte 2 was completed, resulting in changes in land use from Wetland to Settlement and Other land between 2013 and 2017 compared with the old situation. Note that part (0.5 kha) of the changes were, within the mask of the 1990 map, already included in the old situation. Also, part of the area will remain open water within the new harbour area (i.e. as waterway).
6.2 Land use definitions and the classification systems This section provides an overview of land use definitions and the classification systems used in the Netherlands, and their correspondence to the land use, land use change and forestry categories that need to be covered. The Netherlands has defined the different land use categories in line with the descriptions given in the 2006 IPCC Guidelines. For more detailed information see Arets et al. (2020). Forest land (4A) The Netherlands has chosen to define the land use category Forest land as ‘all land with woody vegetation, now or expected in the near future (e.g. clear-cut areas to be replanted, young afforestation areas)’. The following criteria define this category:
• Forests are patches of land exceeding 0.5 ha, with: o a minimum width of 30 m; o a tree crown cover of at least 20%; and
RIVM report 2020-0031
Page 209 of 525
o a tree height of at least 5 m, or, if this is not the case, these thresholds are likely to be achieved at the particular site.
This definition is in conformity with FAO reporting standards and within the ranges set by the Kyoto Protocol. Cropland (4B) The Netherlands has chosen to define Cropland as ‘arable land and nurseries (including tree nurseries)’. Intensively managed grasslands are not included in this category and are reported under Grassland. For part of the Netherlands’ agricultural land, rotation between cropland and grassland is frequent, but data on where exactly this is occurring are not available. Currently, the situation on the topographical map is used as the guideline, with lands under agricultural crops and classified as arable lands at the time of recording reported under Cropland and lands with grass vegetation at the time of recording classified as Grassland. Grassland (4C) From the NIR 2018 onwards two distinct sub-categories are identified within the Grassland category, and these are spatially explicitly assessed. These are (1) Trees outside forests (TOF) and (2) Grassland (non-TOF). Both are explained below. Trees outside forests (TOF) Trees outside forests (TOF) are wooded areas that comply with the Forest land definition except for their surface area (<0.5 ha or less than 30 m width). These represent fragmented forest plots as well as groups of trees in parks and natural terrains, and most woody vegetation lining roads and fields. Until the NIR 2014 these areas were included as a separate category under Forest land. This, however, appeared to be confusing when comparing UNFCCC and KP reporting and accounting and resulted in continuing questions and recommendations during the review process. In the NIRs 2015–2017 these areas were included under Forest land without making a distinction between units of forest land that did comply with the definition and those that did not. Due to new insights and to improve transparency the separate reporting of Trees outside forests has been reinstated. But to prevent the previously observed confusion between emissions and removals as reported under UNFCCC and KP, the category TOF is now included under Grassland. Grassland (non-TOF) Any type of terrain that is predominantly covered by grass vegetation is reported under Grassland (non-TOF). The category also includes vegetation that falls below, and is not expected to reach, the thresholds used in the Forest land category. It is further stratified into the following sub-categories:
• Grassland vegetation, i.e. all areas predominantly covered by grass vegetation (whether natural, recreational or cultivated);
• Nature, i.e. all natural areas not covered by grassland vegetation. This mainly consists of heathland and peat moors and may have the occasional tree as part of the typical vegetation structure.

RIVM report 2020-0031
Page 210 of 525
• Orchards, i.e. areas with standard fruit trees, dwarf varieties or shrubs. These do not conform to the Forest land definition and, while agro-forestry systems are mentioned in the definition of Cropland, in the Netherlands the main undergrowth of orchards is grass. Therefore, orchards are reported under Grassland (non-TOF). A separate carbon stock for orchards is being estimated as part of an area-weighted averaged carbon stock in grasslands (see Section 6.6 and Arets et al., 2020). In the calculations orchards are not spatially explicitly included. Instead, statistics on areas of orchards are used. See Arets et al. (2020) for details.
Wetland (4D) The Netherlands is characterised by wet areas. Many of these areas are covered by a grassy vegetation, and these are included under Grassland. Some wetlands are covered by rougher vegetation consisting of wild grasses or shrubs, and these are reported in the sub-category Nature, under Grassland. Forested wetlands (e.g. willow coppices) are included in Forest land. Therefore, in the Netherlands, only reed marshes and open water bodies are included in the Wetland land use category. This includes natural open water in rivers, but also man-made open water in channels, ditches and artificial lakes. It includes bare areas that are under water only part of the time, as a result of tidal influences, and very wet areas without vegetation. It also includes ‘wet’ infrastructure for boats, i.e. waterways as well as the water in harbours and docks. Settlements (4E) In the Netherlands, the main categories included under the category Settlements are (1) built-up areas and (2) urban areas and transport infrastructure. Built-up areas include any constructed item, independent of the type of construction material, that is (expected to be) permanent, is fixed to the soil surface and serves as a place of residence or location for trade, traffic and/or work. It therefore includes houses, blocks of houses and apartments, office buildings, shops and warehouses, as well as filling stations and greenhouses. Urban areas and transport infrastructure includes all roads, whether paved or not – with the exception of forest roads, which are included in the official forest definition. They also include train tracks, (paved) open spaces in urban areas, car parks and graveyards. Though some of the latter categories are covered by grass, the distinction cannot be made from a study of maps. Because even grass graveyards are not managed as grassland, their inclusion in the land use category Settlements conforms better to the rationale of the land use classification. Other land (4F) The Netherlands uses this land use category to report surfaces of bare soil that are not included in any other category. In the Netherlands, this means mostly almost bare sands and the earliest stages of succession on sand in coastal areas (beaches, dunes and sandy roads) or uncultivated land alongside rivers. It does not include bare areas that emerge from shrinking and expanding water surfaces, which are included in Wetland. In general, the amount of carbon in Other land is limited.

RIVM report 2020-0031
Page 211 of 525
6.3 Information on approaches used to representing land areas and land use databases used for the inventory preparation One consistent approach has been used for all land use categories. The Netherlands applies full and spatially explicit land use mapping that allows geographical stratification at 25 m x 25 m (0.0625 ha) pixel resolution (Kramer et al., 2009; van den Wyngaert et al., 2012). This corresponds to the wall-to-wall approach used for reporting under the Convention (approach 3 in chapter 3 of IPCC, 2006). Harmonised and validated digital topographical maps (originally developed to support temporal and spatial development in land use and policy in the field of nature conservation) representing land use on 1 January 1990, 2004, 2009, 2013 and 2017 were used for wall-to-wall map overlays (Arets et al., 2019; Kramer and Clement, 2015; Kramer et al., 2007, 2009a,b; Van den Wyngaert et al., 2012), resulting in four national scale land use and land use change matrices covering the periods 1990–2004 (Table 6.3), 2004–2009 (Table 6.4), 2009–2013 (Table 6.5) and 2013–2017 (Table 6.6). The information concerning the activities and land use categories, covers the entire territorial (land and water) surface area of the Netherlands. The sum of all land use categories is constant over time. For more details see Arets et al. (2020). The classification of forest areas on the underlying topographical maps that are used to compile the LULUCF maps takes into consideration management interventions to prevent harvested areas from being classified under Deforestation (D). Additional information on (planned) destination of areas and subsidy schemes is used to support the classification. An overlay was produced with all land use and soil maps, resulting in an array of trajectories, showing land use in the respective maps (1990, 2009, 2013, 2017) and soil in the respective maps (1977, 2014), plus the area on which this sequence occurred. For trajectories that changed from one mineral soil type to another, we assumed the 1977 value to be the same as the 2014 value, since the new map is considered to be more accurate than the old one. The resulting array of trajectories was then aggregated so that only unique trajectories remained. In response to the recommendation L.4 to include the pre-1990 land use changes to correctly represent the ‘land converted to’ categories from 1990 onwards, a new 1970 map is being prepared and tested. It is foreseen that this map will be included in the next inventory report.

RIVM report 2020-0031
Page 212 of 525
Table 6.3. Land use and land use change matrix aggregated to the six UNFCCC land use categories for the period 1990–2004 (ha) with Grassland (GL) divided into GL (non-TOF) and GL (TOF).
BN 2004 BN 1990 FL CL GL (non-TOF) G (TOF) WL Sett OL Total FL 334,211 1,218 14,586 2,852 1,503 7,031 699 362,100 CL 12,520 739,190 176,797 2,039 6,821 81,782 201 1,019,352 GL-non TOF 18,066 196,595 1,190,740 4,474 18,641 78,259 907 1,507,682 GL-TOF 2,352 386 3,316 11,336 319 2,988 110 20,806 WL 888 596 9,092 328 777,519 2,836 2,791 794,051 Sett 1,452 1,623 10,987 1,078 1,390 392,804 122 409,457 OL 552 8 2,547 98 2,583 629 33,143 39,562 Total 370,041 939,617 1,408,064 22,207 808,777 566,330 37,973 4,153,009
Note: For comparison with CRF tables, map dates are 1 January 1990 and 2004, i.e. the areas for 2004 correspond to the areas reported in CRF tables for the 2003 inventory year. Table 6.4. Land use and land use change matrix aggregated to the six UNFCCC land use categories for the period 2004–2009 (ha) with Grassland (GL) divided into GL (non-TOF) and GL (TOF).
BN 2009 BN 2004 FL CL GL (non-TOF) GL (TOF) WL Sett OL Total FL 357,474 350 5,219 1,516 703 4,571 208 370,041 CL 2,007 813,282 108,480 297 1,794 13,729 27 939,617 GL-non TOF
7,119 106,547 1,243,329 1,708 10,610 37,705 1,047 1,408,064
GL-TOF 1,701 137 1,198 16,893 126 2,122 30 22,207 WL 374 177 9,633 92 796,297 1,441 762 808,777 Sett 4,597 4,367 23,123 1,558 3,033 529,415 237 566,330 OL 209 2 506 29 890 137 36,200 37,973 Total 373,480 924,863 1,391,488 22,092 813,453 589,121 38,512 4,153,009
Table 6.5. Projected land use and land use change matrix for the six UNFCCC land use categories for the period 2009–2013 using the land use data available on 1 January 2013 (ha) with Grassland (GL) divided into GL (non-TOF) and GL (TOF).
BN 2013 BN 2009
FL CL GL (non-TOF)
GL (TOF) WL Sett OL Total
FL 360,211 1,315 6,245 1,483 699 3,324 204 373,480 CL 2,480 793,892 116,002 311 1,410 10,740 28 924,863 GL-non TOF
8,081 145,410 1,194,126 1,591 10,849 30,915 516 1,391,488
GL-TOF 1,347 220 1,534 17,215 164 1,582 31 22,092 WL 651 304 6,179 112 803,050 1,311 1,846 813,453 Sett 2,530 3,198 20,653 815 4,477 557,312 135 589,121 OL 444 1 970 49 1,825 328 34,896 38,512 Total 375,743 944,340 1,345,709 21,575 822,474 605,512 37,656 4,153,009
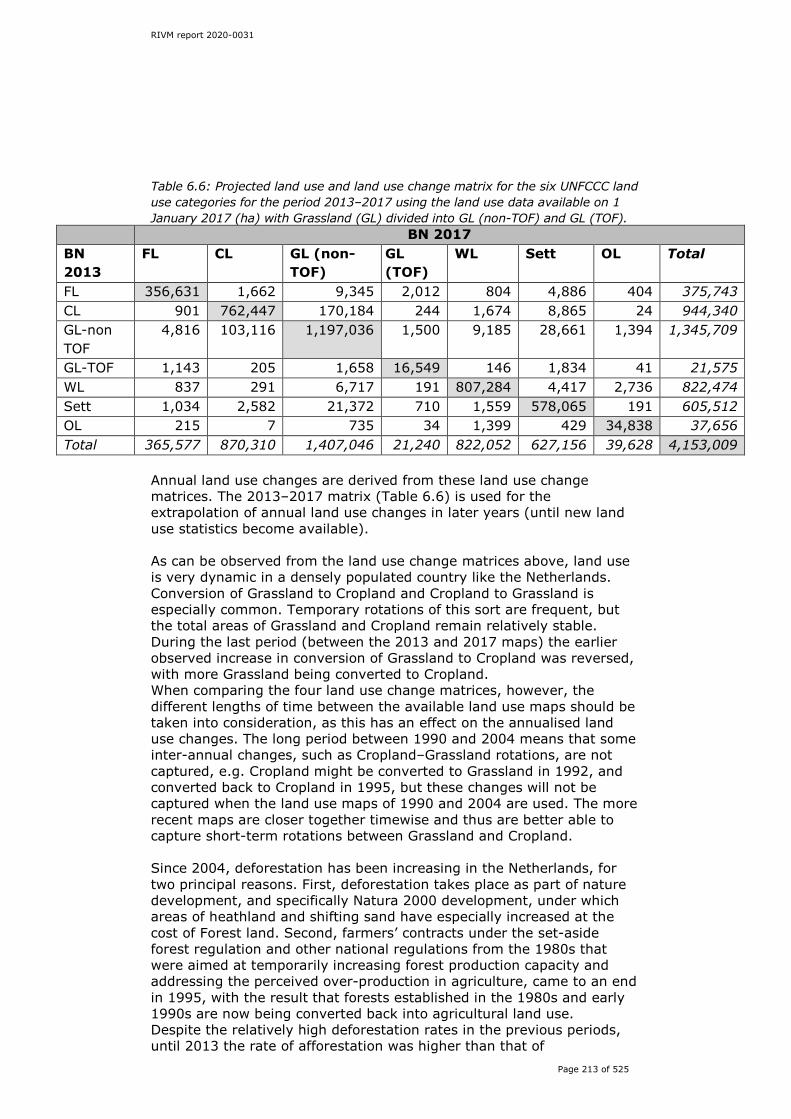
RIVM report 2020-0031
Page 213 of 525
Table 6.6: Projected land use and land use change matrix for the six UNFCCC land use categories for the period 2013–2017 using the land use data available on 1 January 2017 (ha) with Grassland (GL) divided into GL (non-TOF) and GL (TOF).
BN 2017 BN 2013
FL CL GL (non-TOF)
GL (TOF)
WL Sett OL Total
FL 356,631 1,662 9,345 2,012 804 4,886 404 375,743 CL 901 762,447 170,184 244 1,674 8,865 24 944,340 GL-non TOF
4,816 103,116 1,197,036 1,500 9,185 28,661 1,394 1,345,709
GL-TOF 1,143 205 1,658 16,549 146 1,834 41 21,575 WL 837 291 6,717 191 807,284 4,417 2,736 822,474 Sett 1,034 2,582 21,372 710 1,559 578,065 191 605,512 OL 215 7 735 34 1,399 429 34,838 37,656 Total 365,577 870,310 1,407,046 21,240 822,052 627,156 39,628 4,153,009
Annual land use changes are derived from these land use change matrices. The 2013–2017 matrix (Table 6.6) is used for the extrapolation of annual land use changes in later years (until new land use statistics become available). As can be observed from the land use change matrices above, land use is very dynamic in a densely populated country like the Netherlands. Conversion of Grassland to Cropland and Cropland to Grassland is especially common. Temporary rotations of this sort are frequent, but the total areas of Grassland and Cropland remain relatively stable. During the last period (between the 2013 and 2017 maps) the earlier observed increase in conversion of Grassland to Cropland was reversed, with more Grassland being converted to Cropland. When comparing the four land use change matrices, however, the different lengths of time between the available land use maps should be taken into consideration, as this has an effect on the annualised land use changes. The long period between 1990 and 2004 means that some inter-annual changes, such as Cropland–Grassland rotations, are not captured, e.g. Cropland might be converted to Grassland in 1992, and converted back to Cropland in 1995, but these changes will not be captured when the land use maps of 1990 and 2004 are used. The more recent maps are closer together timewise and thus are better able to capture short-term rotations between Grassland and Cropland. Since 2004, deforestation has been increasing in the Netherlands, for two principal reasons. First, deforestation takes place as part of nature development, and specifically Natura 2000 development, under which areas of heathland and shifting sand have especially increased at the cost of Forest land. Second, farmers’ contracts under the set-aside forest regulation and other national regulations from the 1980s that were aimed at temporarily increasing forest production capacity and addressing the perceived over-production in agriculture, came to an end in 1995, with the result that forests established in the 1980s and early 1990s are now being converted back into agricultural land use. Despite the relatively high deforestation rates in the previous periods, until 2013 the rate of afforestation was higher than that of

RIVM report 2020-0031
Page 214 of 525
deforestation. From the most recent matrix, 2013–2017, it can be inferred, however, that afforestation rates have decreased considerably, resulting in a net decrease in forest area since 2013. In principle, deforestation needs to be compensated by afforestation of an equal area elsewhere. The exception to this rule is when conversion to priority nature takes place on the basis of ecological arguments, e.g. through Natura 2000 development or management plans. In such cases, forest conversion can take place without compensation. There are also signs that there is a lack of monitoring and enforcement of the compensation rule at local government level. Recently, however, this issue has received more attention and it is currently being addressed. Therefore, it is expected that this trend of net loss of forest cover will be reversed again in the coming years. A new land use map will be implemented and used in the NIR 2022.
6.4 Forest land (4A) 6.4.1 Source category description
Reported in this category of land use are emissions and sinks of CO2 caused by changes in forests. All forests in the Netherlands are classified as temperate: 30% of them coniferous, 38% broadleaved and the remainder a mixture of the two. The share of mixed and broadleaved forests has grown in recent decades (Schelhaas et al., 20146). In the Netherlands, with its very high population density and strong pressure on land, all forests are managed. Consequently, no sub-division is applied between managed and unmanaged forest land. Where such a sub-division is asked for in the CRF, the notation key NO is used in the tables for unmanaged forests. Units of land that meet all the requirements for Forest land except the minimum area (0.5 ha) or width (30 m) are reported as Trees outside forests under the Grassland category. The Forest land category includes three sub-categories:
• forest land remaining forest land (4A1): includes estimates of changes to the carbon stock in different carbon pools in Forest land;
• land converted to forest land (4A2): includes estimates of changes in land use to forest land during the 20-year transition period, since 1990;
• forest land converted to other land use categories (4B2, 4C2, 4E2, 4F2): includes emissions related to the conversion of forest land to all other land use categories (deforestation).
6.4.2 Methodological issues
Removals and emissions of CO2 from forestry and changes in woody biomass stock are estimated using a country-specific Tier 2 methodology. The chosen approach follows the 2006 IPCC Guidelines, which suggest a stock difference approach. The basic assumption is that the net flux can be derived by converting the change in growing stock 6 Report on the 6th Forest Inventory with results only in Dutch. For an English summary of the results and an English summary flyer ‘State of the Forests in the Netherlands’, see: https://www.wur.nl/en/Expertise-Services/Research-Institutes/Environmental-Research/Projects/Dutch-Forest-Inventory/Results.htm
RIVM report 2020-0031
Page 215 of 525
volumes in the forest into volumes of carbon. Detailed descriptions of the methods and EFs used can be found in the methodological background report for the LULUCF sector (Arets et al., 2020). The Netherlands’ national inventory follows the carbon cycle of a managed forest and wood products system. Changes in carbon stock are calculated for above-ground biomass (AGB), below-ground biomass (BGB) and dead wood and litter in forests. National Forest Inventories Data on forests are based on three National Forest Inventories (NFI) carried out during 1988–1992 (HOSP: Schoonderwoerd and Daamen, 1999), 2000–2005 (NFI-5: Daamen and Dirkse, 2005) and 2012–2013 (NFI-6: Schelhaas et al., 2014). As these most accurately describe the state of Dutch forests, they were applied in the calculations for Forest land remaining forest land, Land converted to forest land and Forest land converted to other land use, representing the state of the forest at three moments in time; 1990 (HOSP), 2003 (NFI-5) and 2012 (NFI-6). Information between 2013 and 2023 was based on an extrapolation with the EFISCEN model using age class-dependent projections and applying five-year time intervals (see Arets et al., 2020). This generates the same information as is taken from the NFIs for the year 2023. Once new information from the NFI-7 is available (by 2021), these extrapolated numbers will be replaced by that information. From plot-level data from the HOSP, NFI-5 and NFI-6 inventories, changes in carbon stocks in living biomass in forests have been calculated. In addition, changes in activity data have been assessed using several databases of tree biomass information, with allometric equations to calculate AGB, BGB and forest litter. More detailed descriptions of the methods and EFs used can be found in Arets et al. (2020).
6.4.2.1 Forest land remaining forest land The net change in carbon stocks for Forest land remaining forest land is calculated as the difference in carbon contained in the forest between two points in time. Carbon in the forest is derived from the growing stock volume, making use of other forest traits routinely determined in forest inventories. With the three repeated measures, changes in biomass and carbon stocks were assessed for the periods 1990–2003 and 2003–2012. The annual changes during the years between 1990 and 2003 and between 2003 and 2012 were determined using linear interpolation. An exception was made for units of Forest land remaining forest land that were afforested between 20 and 30 years ago. These are reported under Forest land remaining forest land, but the calculation of carbon stock changes in these units follows the approach for Land converted to forest land (see Section 6.4.2.2).
RIVM report 2020-0031
Page 216 of 525
Living biomass For each plot measured during the NFIs, information is available on the dominant tree species, their standing stock (stem volumes) and the forest area they represent. Based on this information the following calculation steps are implemented (for more details see Arets et al., 2020):
1. On the basis of the growing stock information from the three forest inventories and biomass expansion functions (BCEFs) for each plot in the NFIs, total tree biomass per hectare is calculated. Biomass is calculated using the dominant tree species group’s specific BCEFs.
2. Average growing stocks (in m3 ha-1), average BCEFs (tonnes biomass m-3) and average root-to-shoot ratios are calculated (Arets et al., 2020). These are weighted for the representative area of each of the NFI plots for each NFI.
3. On the basis of the distribution of total biomass per hectare between coniferous and broadleaved plots (determined by the dominant tree species), the relative share of coniferous and broadleaved forest is determined.
4. The average growing stock, average BCEFs, average root-to-shoot ratios and shares of coniferous and broadleaved forests are linearly interpolated between the NFIs to estimate those parameters for all the intermediate years.
5. Combining for each year average growing stock, BCEF and root-to-shoot ratios, the average above-ground and below-ground biomasses (tonnes dry matter ha-1) are estimated for each year (Table 6.7).
6. Using the relative share of coniferous and broadleaved forests and the differentiated T1 carbon fractions for conifers and broad-leaved species, above- and below-ground biomass are converted to carbon amounts.
Losses from wood harvesting are not taken into account, as these are already included in the differences in carbon stocks between the three forest inventories, HOSP, NFI-5 and NFI-6.
In several review reports the ERT referred to the apparent high growth rates of biomass in Dutch forests, indicating that it is among the highest in Annex I countries. Dutch experts consider this a misinterpretation of the results. Although the increase in growing stock in Dutch forests indeed appears to be higher than in other countries, the volume growth rates are not. However, the very low harvest intensities in the Netherlands, with only about 55% of the increment being harvested (see Schelhaas et al., 2018, and annex 5 in Arets et al., 2020), result in a strong net increase in growing stock over time.
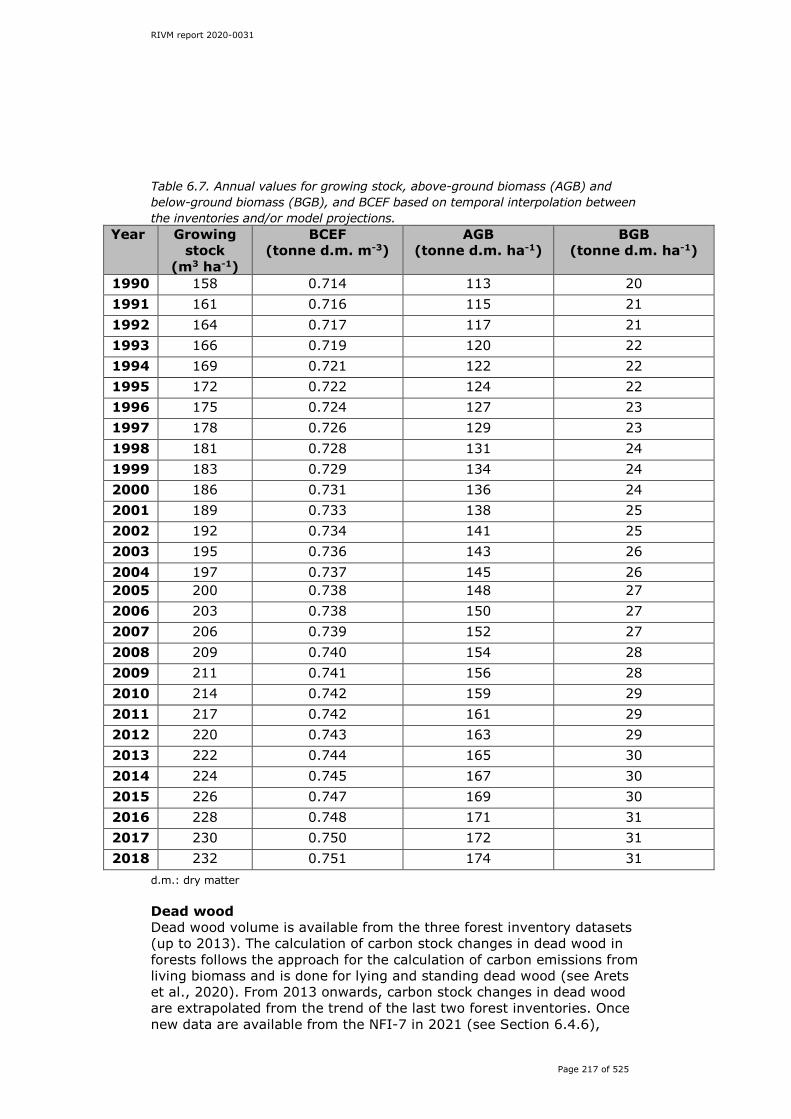
RIVM report 2020-0031
Page 217 of 525
Table 6.7. Annual values for growing stock, above-ground biomass (AGB) and below-ground biomass (BGB), and BCEF based on temporal interpolation between the inventories and/or model projections.
Year Growing stock
(m3 ha-1)
BCEF (tonne d.m. m-3)
AGB (tonne d.m. ha-1)
BGB (tonne d.m. ha-1)
1990 158 0.714 113 20 1991 161 0.716 115 21 1992 164 0.717 117 21 1993 166 0.719 120 22 1994 169 0.721 122 22 1995 172 0.722 124 22 1996 175 0.724 127 23 1997 178 0.726 129 23 1998 181 0.728 131 24 1999 183 0.729 134 24 2000 186 0.731 136 24 2001 189 0.733 138 25 2002 192 0.734 141 25 2003 195 0.736 143 26 2004 197 0.737 145 26 2005 200 0.738 148 27 2006 203 0.738 150 27 2007 206 0.739 152 27 2008 209 0.740 154 28 2009 211 0.741 156 28 2010 214 0.742 159 29 2011 217 0.742 161 29 2012 220 0.743 163 29 2013 222 0.744 165 30 2014 224 0.745 167 30 2015 226 0.747 169 30 2016 228 0.748 171 31 2017 230 0.750 172 31 2018 232 0.751 174 31
d.m.: dry matter Dead wood Dead wood volume is available from the three forest inventory datasets (up to 2013). The calculation of carbon stock changes in dead wood in forests follows the approach for the calculation of carbon emissions from living biomass and is done for lying and standing dead wood (see Arets et al., 2020). From 2013 onwards, carbon stock changes in dead wood are extrapolated from the trend of the last two forest inventories. Once new data are available from the NFI-7 in 2021 (see Section 6.4.6),
RIVM report 2020-0031
Page 218 of 525
these carbon stock changes will be recalculated on the basis of the actual data. Litter Analysis of carbon stock changes based on collected data has shown that there is probably a build-up of litter in Dutch forest land. Data from around 1990, however, are extremely uncertain and, therefore, in order to be conservative, this highly uncertain sink is not reported (see Arets et al., 2020). Effects of wood harvests on biomass gains and losses Net carbon stock changes in biomass in Forest land remaining forest land are based on the information from the forest inventories. As a result, the effect of harvesting wood on carbon in the remaining forest biomass is already implicitly included in the carbon stock differences between the different forest inventories. The gross gains in biomass between the inventories were thus higher than calculated from the inventories’ stock differences. Therefore, the carbon in the biomass of the harvested wood in a given year was added to the carbon stock changes in living biomass. At the same time, this same amount of carbon was reported under carbon stock losses from living biomass, resulting in the net change as determined from the carbon stock differences between the forest inventories. As a consequence, the net stock change is gradual, but the gains and losses are more erratic. See Arets et al. (2020) for more details. Emissions from forest fires In the Netherlands no recent statistics are available on the occurrence and intensity of wildfires in forests (forest fires). The area of burned forest is based on a historical series from 1980 to 1992, for which the annual number of forest fires and the total area burned is available (Wijdeven et al., 2006). The average annual area (37.77 ha) from the period 1980–1992 is used for all years from 1990 onwards (Arets et al., 2020). Emissions of CO2, CH4 and N2O from forest fires are reported at Tier 2 level according the method described in the 2006 IPCC Guidelines (IPCC 2006: equation 2.27). The mass of fuel for forest fires is based on the average annual carbon stock in living biomass, litter and dead wood (Table 6.9). These values change yearly, depending on forest growth and harvesting. Because burned sites are also part of the NFI, the loss of carbon due to forest fires is covered in the carbon stock changes derived from the NFI. Yet forest fires are very infrequent, mostly cover small areas and have a relatively mild impact on biomass. As a result, it’s not clear if the NFI fully covers information on forest fires and their emissions. The approach followed may therefore include some double counting of these emissions and is therefore considered to be a conservative approach. With the available data it is not possible to distinguish between forest fires in Forests remaining forests and Land converted to forest land. Therefore, total emissions from forest fires are reported in CRF Table 4(V) under ‘wildfires for forests remaining forests’.

RIVM report 2020-0031
Page 219 of 525
The UNFCCC reviewer of the NIR 2019 pointed to available geospatial techniques for the identification of forest fires, such as the European Forest Fire Information System (EFFIS), as a possible data source to improve fire activity data after 1992. An earlier attempt to improve wildfire activity data by testing various remote sensors and geospatial techniques showed that the potential for remote sensing is limited in the case of the Netherlands (see Roerink and Arets, 2016). Because forest fires are infrequent, usually have a low intensity and cover relatively small areas, none of the geospatial approaches was very effective in detecting the relevant forest fires and wildfires. Moreover, the cost of monitoring and analysis was considered to be disproportionate to the potential quality improvement for the GHG inventory (see Roerink and Arets, 2016, and Arets et al., 2020 for more details). We have looked into other possible improvements in wildfire statistics in the Netherlands using the EFFIS data that have been reported in its annual fire reports since 2000. Until 2017 the Netherlands did not submit a report to EFFIS, but the EFFIS reports also include independent rapid damage assessments that aim to provide reliable and harmonised estimates of the areas affected by forest fires in collaborating countries. Although the Netherlands is included in these assessments, EFFIS’s resolution of fire detection of 50 ha (older years), or more recently 30 ha, is larger than the area of most forest and wildfires in the Netherlands. As a result, these remain largely undetected in the EFFIS system. Since 2004 only seven wildfires have been included in the EFFIS data for the Netherlands (see section 12.3 in Arets et al., 2020, for more details). We will further explore possible sources of improved wildfire activity data by combining geospatial analyses with the information registered by the Netherlands Fire Service. Given the currently small extent of wildfires in the Netherlands, an important prerequisite will be that such approaches should be cost-effective and proportionate to the expected emissions from wildfires. Emissions from fertiliser use in forests Fertilisers are not much applied in forestry in the Netherlands. Therefore, in CRF Table 4(I) direct nitrous oxide (N2O) emissions from nitrogen (N) inputs for Forest land remaining forest land are reported as NO.
6.4.2.2 Land converted to forest land Removals and emissions of CO2 from forestry and changes in woody biomass stock are estimated using a country-specific Tier 2 methodology. The approach chosen follows the 2006 IPCC Guidelines. Living biomass Changes in carbon stocks in AGB and BGB in Land converted to forest land are estimated using the following set of assumptions and calculation steps:
1. The EF is calculated for each annual set of newly established units of forest land separately. Thus, the specific age of the reforested/afforested units of land is taken into account.
2. At the time of afforestation, carbon stocks in AGB and BGB are zero.
3. The specific growth curve of new forests is unknown, but analyses of NFI plot data show that carbon stocks in newly

RIVM report 2020-0031
Page 220 of 525
planted forests reach the carbon stock of average forests in 30 years. Consequently, carbon stocks in AGB or BGB on units of newly established forest land increase annually by the difference between the carbon stock in AGB or BGB at that time and the carbon stock in AGB or BGB of the average forest under Forest land remaining forest land, divided by the number of years left to reach an age of 30 years.
For Cropland and Grassland converted to forest land, biomass loss in the year of conversion is calculated using Tier 1 default values. Conversion from Grassland (TOF) to Forest land may occur when areas surrounding units of Trees outside forests are converted to Forest land and the total forested area becomes larger than the lower limit of the forest definition (i.e. 0.5 ha). For these conversions from TOF to FL it is assumed that the biomass remains and the forest continues to grow as in Forest land remaining forest land. Litter and dead organic matter The accumulation of dead wood and litter in newly established forest plots is not known, though it is definitely a carbon sink (see Arets et al., 2020). This sink is not reported, in order to be conservative. Emissions from forest fires All emissions from forest fires are included under Forest land remaining forest land and therefore are reported here as IE. Emissions from fertiliser use in forests Fertilisers are not much applied in forestry in the Netherlands. Therefore, in CRF Table 4(I) direct N2O emissions from N inputs for Land converted to forest land are reported as NO.
6.4.2.3 Forest land converted to other land use categories Living biomass Total emissions from the tree component after deforestation are calculated by multiplying the total area deforested by the average carbon stock in living biomass, above as well as below ground, as estimated by the calculations for Forest land remaining forest land. It is therefore assumed that, with deforestation, all carbon stored in AGB and BGB is lost to the atmosphere. National averages are used for the EFs (see Table 6.8), as there is no record of the spatial occurrence of specific forest types. The IEF for carbon stock change from changes in living biomass, i.e. the average carbon stock in living biomass, follows the calculations from the NFI data. The calculated EFs show a progression over time. The systematic increase in average standing carbon stock reflects the fact that the annual increment exceeds the annual harvest.
Conversion from Forest land to Grassland (TOF) occurs when surrounding forest is converted to other land uses and the remaining forest area becomes smaller than the lower limit of the forest definition (i.e. 0.5 ha). For these conversions from FL to TOF it is assumed that no loss of biomass occurs.

RIVM report 2020-0031
Page 221 of 525
Table 6.8. Emission factors for deforestation (Mg C ha-1).
Year EF biomass EF dead wood EF litter 1990 65.6 0.41 28.66 1991 67.0 0.49 29.22 1992 68.3 0.57 29.78 1993 69.6 0.64 30.34 1994 70.9 0.72 30.90 1995 72.3 0.80 31.46 1996 73.6 0.87 32.02 1997 75.0 0.95 32.59 1998 76.4 1.03 33.15 1999 77.7 1.10 33.71 2000 79.1 1.18 34.27 2001 80.5 1.26 34.83 2002 81.8 1.33 35.39 2003 83.2 1.41 35.95 2004 84.5 1.46 35.63 2005 85.8 1.52 35.32 2006 87.1 1.58 35.00 2007 88.3 1.63 34.68 2008 89.6 1.69 34.37 2009 90.9 1.74 34.05 2010 92.2 1.80 33.73 2011 93.5 1.86 33.41 2012 94.8 1.91 33.10 2013 96.1 1.97 32.78 2014 97.1 2.02 32.53 2015 98.1 2.08 32.27 2016 99.1 2.13 32.02 2017 100.1 2.19 31.76 2018 101.1 2.25 31.51
Dead wood Total emissions from the dead wood component after deforestation are calculated by multiplying the total area deforested by the average carbon stock in dead wood, as estimated by the calculations for Forest land remaining forest land. Thus it is assumed that, with deforestation, all carbon stored in dead wood is lost to the atmosphere. National averages are used, as there is no record of the spatial occurrence of specific forest types. This loss is also applied to Grassland (TOF). Litter Total emissions from the litter component after deforestation are calculated by multiplying the total area deforested by the average carbon stock in litter. Thus it is assumed that, with deforestation, all carbon stored in AGB and BGB is lost to the atmosphere. National averages are used for the EFs, as there is no record of the spatial occurrence of specific forest types.

RIVM report 2020-0031
Page 222 of 525
The average carbon stock in the litter layer has been estimated at national level (Van den Wyngaert et al., 2012). Data for litter layer thickness and carbon in litter are available from five different datasets, but none of these could be used exclusively. Selected forest stands on poor and rich sands were also intensively sampled with the explicit purpose of providing conversion factors or functions. From these data, a stepwise approach was used to estimate the national litter carbon stock in a consistent way. A step-by-step approach was developed to accord mean litter stock values with any of the sampled plots of the available forest inventories (HOSP, NFI-5 and NFI-6). The assessment of carbon stocks and changes thereto in litter in Dutch forests was based on extensive datasets on litter thickness and carbon content in litter (see Arets et al., 2020: section 4.2.1). Carbon stock changes per area of litter pool of the area of deforestation is high compared with those reported by other parties. These high values are related to the large share of the forest area that is on poor Pleistocene soils characterised by relatively thick litter layers. Additional information on geomorphological aspects is provided in Schulp et al. (2008) and de Waal et al. (2012).
6.4.3 Uncertainty and time series consistency Uncertainties The Approach 1 analysis in Annex 2, shown in Table A2.4, provides estimates of uncertainty by IPCC source category. The Netherlands also applies an improved uncertainty assessment to the LULUCF sector with better representation of uncertainties in the land use matrix, using Monte Carlo simulations for combining different types of uncertainties (see chapter 14 in Arets et al., 2020, for details). The analysis combines uncertainty estimates of forest statistics, land use and land use change data (topographical data) and the method used to calculate the yearly growth in carbon increase and removals. The uncertainty range in CO2 emissions from 4A1 (Forest land remaining forest land) is calculated at +10% to -12% and for Land converted to forest land at +26% to -21%. See Arets et al. (2020) for details. Time series consistency To ensure time series consistency in Forest land remaining forest land, for all years up to 2018 the same approach is used for activity data, land use area and emissions calculation. More detailed information is provided in Section 6.4.2.1. To ensure time series consistency in Land converted to forest land, the same approach is used for activity data, land use area and emissions calculation for all years. More detailed information is provided in Section 6.4.2.2.
6.4.4 Category-specific QA/QC and verification The source categories are covered by the general QA/QC procedures, as discussed in Chapter 1. Additional Forest land-specific QA/QC includes:
• During the measurements of the three forest inventories, specific QA/QC measures were implemented to prevent errors in measurements and reporting (see Arets et al., 2020).

RIVM report 2020-0031
Page 223 of 525
• Changes in forest area and mean carbon stocks in Dutch forests were verified by data from the FAO Forest Resources Assessment (FRA).
6.4.5 Category-specific recalculations A number of the methodological changes described in Section 6.1 have resulted in recalculations in the Forest land categories. As a result of the methodological changes in the calculation of the EF for drained organic soils, the reported carbon stock losses in organic soils in this category have been recalculated from 2004 onwards. Additionally, the new method of extrapolating the change in the extent of organic soils in the Netherlands has resulted in recalculations of emissions from organic soils from 2014 onwards. The additional estimates of N2O emissions as a result of possible drainage of organic forest soils has resulted in N2O emissions from Forest land that were previously not included. See also Section 6.1.
6.4.6 Category-specific planned improvements In 2017 the Netherlands started its 7th National Forest Inventory (NFI-7). This is expected to deliver results by 2021. The results will be used in the NIR 2022 and will then replace the currently extrapolated changes in carbon stocks in dead wood and the extrapolated changes in carbon stocks in living biomass based on the projections with the EFISCEN model.
6.5 Cropland (4B) 6.5.1 Source category description
Emissions resulting from the disturbance of mineral soils due to land use changes to Cropland and emissions resulting from the lowering of the ground water table in organic soils under Cropland are significant, and are calculated separately for areas of Cropland remaining cropland and Land converted to cropland (see Arets et al., 2020). As a result of these high emissions from mineral drained organic soils, the Cropland category is a key source. The carbon stock gains and losses in living biomass in Grassland converted to cropland also strongly contribute to the emissions and removals in the Cropland category, but this contribution remains below the threshold of 25% of gains/losses in the category needed for it to be a significant pool under the Cropland category. Because Cropland in the Netherlands mainly consists of annual cropland were annual biomass gains are harvested each year, no net accumulation of carbon stocks in biomass over time is expected to occur in Cropland (IPCC, 2006). Based on estimates using the Tier 1 EFs, the carbon pool biomass gains and dead organic matter (DOM) in Cropland remaining cropland and Land converted to cropland can be considered not significant. Therefore, following the Tier 1 method in the 2006 IPCC Guidelines, carbon stock changes in living biomass are not estimated for Cropland remaining cropland. Even if we apply the unrealistically high average IEF for biomass gains and losses of Land converted to cropland to the area of Cropland remaining cropland, the resulting carbon stock changes remain well below the significance level (i.e. 25% of gains/losses in the category).

RIVM report 2020-0031
Page 224 of 525
Therefore, in CRF Table 4.B these carbon stock changes are reported with the notation key NA. There are significant carbon stock changes in biomass in orchards, which in the Netherlands predominantly consist of fruit trees. Because of the usually grassy vegetation between the trees, orchards are included under Grassland (see Section 6.6). Dead organic matter in annual cropland is expected to be negligible and, applying a Tier 1 method, it is assumed that dead wood and litter stocks (DOM) are not present in Cropland (IPCC, 2016). Therefore, neither are carbon stock gains in DOM estimated in land use conversions to Cropland, nor are carbon stock losses in conversions from Cropland to other land uses. Carbon stock losses for conversions to Cropland will depend on the carbon stocks in DOM in the ‘converted from’ land use category. Currently, carbon stocks in DOM are included only under Forest land. As with living biomass and DOM, no carbon stock changes in mineral soils are expected in Cropland remaining cropland. Therefore, for Cropland remaining cropland no net carbon stock changes in mineral soils are calculated or reported.
6.5.2 Methodological issues With regard to soil emissions, a 20-year transition period is included, starting from 1990, while carbon stock changes in biomass are considered to be instantaneous on conversion. In CRF Table 4.B, the area associated with the transition period for soil is reported. Living biomass Emissions and removals of CO2 from carbon stock changes in living biomass for Land converted to cropland is calculated using a Tier 1 approach. This value is also used for determining emissions for Cropland converted to other land use categories (4A2, 4C2, 4D2, 4E2, 4F2). Net carbon stock changes in both mineral and organic soils for land use changes involving Cropland are calculated using the methodology provided in Arets et al. (2020).
6.5.3 Uncertainty and time series consistency Uncertainties The Approach 1 analysis in Annex 2, shown in Table A2.4, provides estimates of uncertainties for each IPCC source category. The Netherlands also applies an improved uncertainty assessment to the LULUCF sector with better representation of uncertainties in the land use matrix, using Monte Carlo simulations for combining different types of uncertainties (see chapter 14 in Arets et al., 2020, for details). The uncertainties in the Dutch analysis of carbon levels depend on the factors that feed into the calculations (calculation of the organic substances in the soil profile and conversion to a national level) and data on land use and land use change (topographical data). The uncertainty range in the CO2 emissions for 4B1 (Cropland remaining cropland) is calculated at -60% to +61% and for 4B2 (Land converted to cropland) at -45% to +61%; see Arets et al. (2020) for details.
RIVM report 2020-0031
Page 225 of 525
Time series consistency To ensure time series consistency, for all years up to 2018 the same approach is used for activity data and land use area.
6.5.4 Category-specific QA/QC and verification The source categories are covered by the general QA/QC procedures discussed in Chapter 1.
6.5.5 Category-specific recalculations As a result of the methodological changes in the calculation of the EF for drained organic soils described in Section 6.1, the reported carbon stock losses in organic soils in this category have been recalculated from 2004 onwards. Additionally the new method of extrapolating the change in the extent of organic soils in the Netherlands has resulted in recalculations from 2014 onwards. Both changes have resulted in reduced emissions from organic soils compared with the NIR 2019.
6.5.6 Category-specific planned improvements Currently the 7th National Forest Inventory is being carried out. The results are expected to become available in 2021 and will then be used to update the forest-based information and replace the projections with the EFISCEN model (Section 6.4).
6.6 Grassland (4C) 6.6.1 Source category description
Under the Grassland category, two main sub-categories are identified: (1) Trees outside forests (TOF) and (2) Grassland (non-TOF); see Section 6.2. Conversions of land use to-, from- and between Grassland (non-TOF) and TOF are separately monitored and the approach to calculate the carbon stock changes differs between them. Trees outside forests (TOF) The trees outside forests (TOF) category is determined in a spatially explicit way and experiences carbon stock changes similar to those of Forest land (see Section 6.4.2 and Arets et al., 2020). For land use conversion to TOF, the same biomass increase and associated changes in carbon stocks are assumed as for Land converted to forest land. For conversions from TOF to other land uses, however, no losses of dead wood or litter are assumed. As the patches are smaller and any edge effects therefore larger than in forests, the uncertainty regarding dead wood and litter accumulation is even higher for TOF than for Forest land. Moreover, for small patches and linear woody vegetation, the chance of dead wood removal is very high, and disturbance effects on litter may prevent accumulation. Therefore, the conservative estimate of no carbon accumulation in these pools is applied. Conversion from Forest land to TOF may occur if connected surrounding units of Forest land are converted to other land uses and the remaining area no longer complies with the forest definition. Such units of land are considered to remain with tree cover but losses of carbon in dead wood and litter will occur.

RIVM report 2020-0031
Page 226 of 525
Grassland (non-TOF) As for Cropland, emissions resulting from the lowering of the ground water table in organic soils under Grassland (non-TOF) are significant. Therefore, these are explicitly calculated for areas of Grassland remaining grassland (non-TOF) and Land converted to grassland (non-TOF) (see Arets et al., 2020). For carbon stock changes in living biomass in grassland vegetation and nature remaining in those categories, a Tier 1 method is applied, assuming no change in carbon stocks (IPCC, 2006; for details see Arets et al., 2020). In orchards an increase in carbon stocks can be expected as the fruit trees age. However, data on orchards indicate that the average age of trees in orchards remains relatively constant at 10.5 years (see chapter 6 in Arets et al., 2020). Therefore, it is assumed that at the national level average carbon stocks per unit of area of orchard will not change. As a result of changing areas of grassland vegetation and orchards, the average carbon stocks in Grassland remaining grassland (non-TOF) change between years, which is reflected in the carbon stock changes in biomass in Grassland remaining grassland (non-TOF). Carbon stock gains in living biomass for Land converted to grassland (non-TOF) are calculated using a Tier 1 approach (see Section 6.6.2). Carbon stocks in Grassland (non-TOF) depend on carbon stocks per unit of area of grassland vegetation, nature and orchards and the relative contribution of these categories to the Grassland (non-TOF) area. This value is also used to determine carbon stock losses in biomass for Grassland converted to other land use categories. Dead organic matter in grassland and orchards is expected to be negligible. While dead wood and litter may be formed in orchards, common orchard management that includes pruning and the removal of dead wood and litter will prevent build-up of large amounts of DOM. Even if we applied a value of 10% of annual carbon stock gains in biomass as an estimate of carbon stock gains in DOM in the same sub-category for which NE is currently used, this would make up only 1% of the carbon stock gains and losses in the Grassland category. Therefore, the Tier 1 approach is used (IPCC, 2006), assuming no build-up of DOM, which is reported as ‘NE’. This means that neither are carbon stock gains in DOM included in land use conversions to Grassland (non-TOF), nor are carbon stock losses included in conversions from Grassland (non-TOF) to other land use categories. Carbon stock losses for conversions to Grassland (non-TOF) will depend on the carbon stocks in DOM in the ‘converted from’ land use category. Currently, carbon stocks in DOM are included only under Forest land. Following the IPCC Guidelines, no carbon stock changes in mineral soils are expected for Grassland (non-TOF) remaining grassland (non-TOF). However, since transitions between nature and grassland vegetation are treated as Grassland (non-TOF) remaining grassland (non-TOF), and land is always reported under its last known use, a unit of land that is converted from another land use to nature (or grassland vegetation) and subsequently to grassland vegetation (or nature) will be reported under Land converted to grassland (non-TOF) until its conversion to
RIVM report 2020-0031
Page 227 of 525
grassland vegetation, and as Grassland (non-TOF) remaining grassland (non-TOF) thereafter. However, the soil carbon stock is still in the transition phase, causing a change in the mineral soil carbon stock in the Grassland (non-TOF) remaining grassland (non-TOF) category even if soil carbon under grassland is assumed to be stable. Land converted to grassland that within the 20-year transition period changes from one Grassland (non-TOF) category to another (i.e. from grassland vegetation to nature, see Arets et al., 2020), from that point in time is reported under Grassland (non-TOF) remaining grassland (non-TOF). Continued carbon stock changes in mineral soils, however, are still being assessed, and are also reported under Grassland (non-TOF) remaining grassland (non-TOF). This results in a minor misallocation of areas and emissions between Land converted to grassland and Grassland remaining grassland, although total emissions for the Grassland category are correct. Correcting this allocation error in the LULUCF bookkeeping model is not easy. Currently the LULUCF bookkeeping model is reprogrammed in a different programming language. This allocation issue is taken into account in the reprogramming and will be solved once the model is implemented. The model will be tested in 2021 and it is foreseen that it will be used for the NIR 2022. Conversions between Grassland (non-TOF) and TOF Whereas conversions between Grassland (non-TOF) and TOF are reported under Grassland remaining grassland, the two categories are considered as separate in the calculations. Conversions from Grassland (non-TOF) to TOF will result in the loss of Grassland (non-TOF) biomass in the year of conversion and subsequent growth of biomass in TOF. Conversion from TOF to Grassland (non-TOF) will involve a loss of carbon stocks in biomass from TOF and an increase in carbon stocks in Grassland (non-TOF), as with conversions from other land use categories.
6.6.2 Methodological issues With regard to soil emissions, a 20-year transition period is included, starting from 1990, while carbon stock changes in biomass are considered to be instantaneous on conversion. In the CRF, the area associated with the transition period for soil is reported. Living biomass Grassland non-TOF Carbon stock changes due to changes in biomass in land use conversions to and from Grassland (non-TOF) are calculated using Tier 1 default carbon stocks. For the whole Grasslands (non-TOF) category, including grassland vegetation, nature and orchards, an average carbon stock per unit of land is calculated from the carbon stocks per unit area of grassland vegetation, nature and orchards, weighted for their relative contribution to the Grassland (non-TOF) category. Therefore, average carbon stocks for Grassland (non-TOF) will vary over time as a result of varying relative contributions of the different vegetation types to the total Grassland (non-TOF) area (see Table 6.9).
RIVM report 2020-0031
Page 228 of 525
Default values for dry matter and carbon factors are used to determine carbon stocks in living biomass in grassland vegetation and nature. Combined, these give 6.4 ton C per ha (see Arets et al., 2020). Carbon stocks in living biomass in orchards are based on an average age of trees in orchards of 10.5 years and a Tier 1 biomass accumulation rate of 2.1 ton C ha-1 yr-1 (IPCC, 2003a). Average carbon stocks in living biomass in orchards are thus estimated at 22 tons C per ha. Areas of orchards as published by CBS7 between 1992 and 2016 are used to assess the area-weighted average carbon stocks in Grassland non-TOF (Table 6.9). Areas of orchards after 2016 have been kept constant to obtain the same average carbon stocks in Grassland (non-TOF) as in 2016. These areas will be updated once more recent data are published by the CBS. Net carbon stock changes in both mineral and organic soils for land use changes involving Grassland are calculated using the methodology provided in Arets et al. (2020).
7 https://opendata.cbs.nl/statline/#/CBS/nl/dataset/70671NED/table?fromstatweb
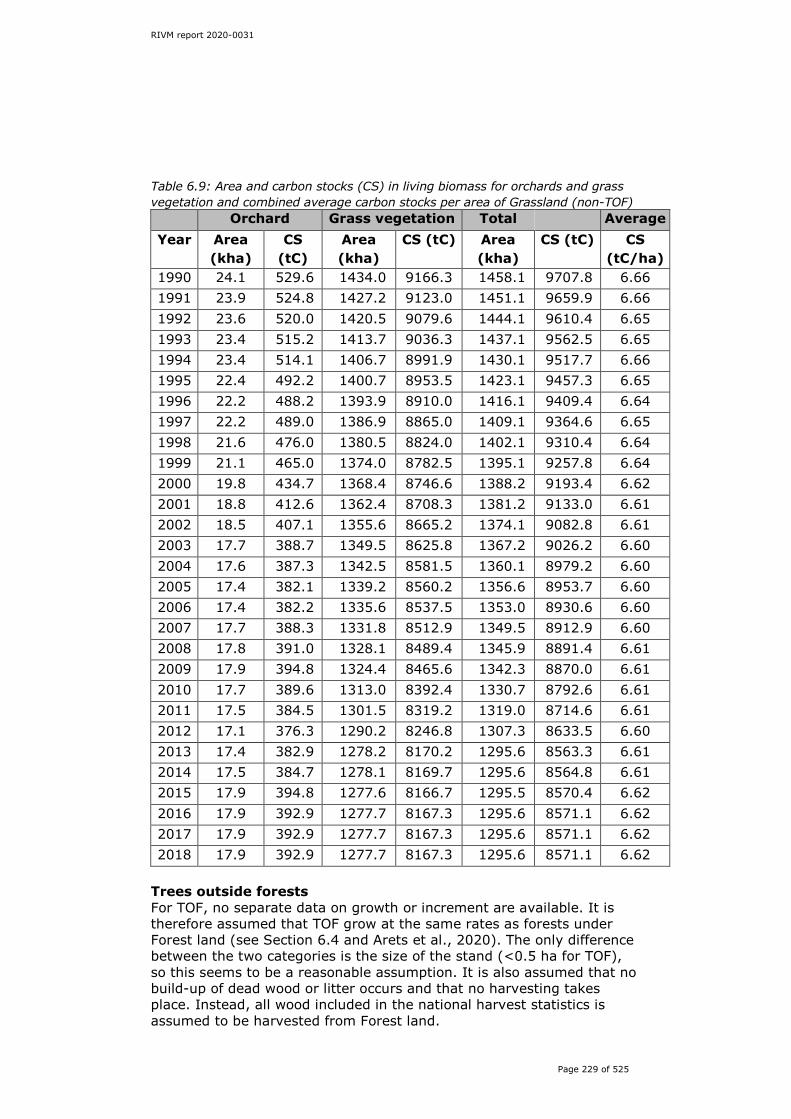
RIVM report 2020-0031
Page 229 of 525
Table 6.9: Area and carbon stocks (CS) in living biomass for orchards and grass vegetation and combined average carbon stocks per area of Grassland (non-TOF)
Orchard Grass vegetation Total
Average Year Area
(kha) CS
(tC) Area (kha)
CS (tC) Area (kha)
CS (tC) CS (tC/ha)
1990 24.1 529.6 1434.0 9166.3 1458.1 9707.8 6.66 1991 23.9 524.8 1427.2 9123.0 1451.1 9659.9 6.66 1992 23.6 520.0 1420.5 9079.6 1444.1 9610.4 6.65 1993 23.4 515.2 1413.7 9036.3 1437.1 9562.5 6.65 1994 23.4 514.1 1406.7 8991.9 1430.1 9517.7 6.66 1995 22.4 492.2 1400.7 8953.5 1423.1 9457.3 6.65 1996 22.2 488.2 1393.9 8910.0 1416.1 9409.4 6.64 1997 22.2 489.0 1386.9 8865.0 1409.1 9364.6 6.65 1998 21.6 476.0 1380.5 8824.0 1402.1 9310.4 6.64 1999 21.1 465.0 1374.0 8782.5 1395.1 9257.8 6.64 2000 19.8 434.7 1368.4 8746.6 1388.2 9193.4 6.62 2001 18.8 412.6 1362.4 8708.3 1381.2 9133.0 6.61 2002 18.5 407.1 1355.6 8665.2 1374.1 9082.8 6.61 2003 17.7 388.7 1349.5 8625.8 1367.2 9026.2 6.60 2004 17.6 387.3 1342.5 8581.5 1360.1 8979.2 6.60 2005 17.4 382.1 1339.2 8560.2 1356.6 8953.7 6.60 2006 17.4 382.2 1335.6 8537.5 1353.0 8930.6 6.60 2007 17.7 388.3 1331.8 8512.9 1349.5 8912.9 6.60 2008 17.8 391.0 1328.1 8489.4 1345.9 8891.4 6.61 2009 17.9 394.8 1324.4 8465.6 1342.3 8870.0 6.61 2010 17.7 389.6 1313.0 8392.4 1330.7 8792.6 6.61 2011 17.5 384.5 1301.5 8319.2 1319.0 8714.6 6.61 2012 17.1 376.3 1290.2 8246.8 1307.3 8633.5 6.60 2013 17.4 382.9 1278.2 8170.2 1295.6 8563.3 6.61 2014 17.5 384.7 1278.1 8169.7 1295.6 8564.8 6.61 2015 17.9 394.8 1277.6 8166.7 1295.5 8570.4 6.62 2016 17.9 392.9 1277.7 8167.3 1295.6 8571.1 6.62 2017 17.9 392.9 1277.7 8167.3 1295.6 8571.1 6.62 2018 17.9 392.9 1277.7 8167.3 1295.6 8571.1 6.62
Trees outside forests For TOF, no separate data on growth or increment are available. It is therefore assumed that TOF grow at the same rates as forests under Forest land (see Section 6.4 and Arets et al., 2020). The only difference between the two categories is the size of the stand (<0.5 ha for TOF), so this seems to be a reasonable assumption. It is also assumed that no build-up of dead wood or litter occurs and that no harvesting takes place. Instead, all wood included in the national harvest statistics is assumed to be harvested from Forest land.

RIVM report 2020-0031
Page 230 of 525
Wildfires There are no recent statistics available on the occurrence and intensity of wildfires in the Netherlands. Emissions of CO2, CH4 and N2O from wildfires are reported according to the Tier 1 method described in the 2006 IPCC Guidelines. The area of wildfires is based on a historical series from 1980 to 1992, for which the annual number of forest fires and the total area burned are available (Wijdeven et al., 2006). Forest fires are reported under Forest land (see Section 6.4.2). The average annual area of other wildfires is 210 ha (Arets et al., 2020). This includes all land use categories. Most wildfires in the Netherlands, however, are associated with heath and grassland. All other emissions from wildfires, except forest fires, are therefore included under Grassland remaining grassland. CO2, CH4 and N2O emissions from wildfires are based on the default carbon stock in living biomass on Grassland (non-TOF). Area of cultivated organic soils Only the areas of cultivated organic soils under Grassland (non-TOF) are drained. Areas of nature grasslands are not drained. While in CRF Table 4.C the total area of organic soil is included, the carbon stock changes are based only on the cultivated areas. This also explains the differences between the areas of organic soils reported under Cropland and Grassland in the LULUCF sector and the areas reported in CRF Table 3.D in the Agriculture sector. To improve transparency, a comparison between the different areas is presented in Table 6.10.

RIVM report 2020-0031
Page 231 of 525
Table 6.10. Areas of peat and peaty soil within the total Grassland (non-TOF) category compared with the part considered to be cultivated grassland reported in CRF Table 3.D Year Grassland (non-TOF) Cultivated grassland
Peat Peaty Total Peat Peaty Total kha
1990 223,485 96,411 319,896 218,058 93,677 311,735 1991 221,894 95,845 317,739 216,507 93,118 309,625 1992 220,312 95,281 315,593 214,964 92,562 307,526 1993 218,739 94,719 313,458 213,429 92,008 305,437 1994 217,175 94,159 311,334 211,901 91,456 303,358 1995 215,619 93,601 309,221 210,382 90,907 301,289 1996 214,072 93,046 307,118 208,870 90,360 299,230 1997 212,535 92,492 305,027 207,367 89,816 297,182 1998 211,006 91,941 302,947 205,871 89,274 295,144 1999 209,486 91,391 300,877 204,383 88,734 293,117 2000 207,975 90,844 298,819 202,903 88,196 291,099 2001 206,472 90,299 296,771 201,431 87,661 289,092 2002 204,979 89,756 294,734 199,966 87,129 287,095 2003 203,494 89,215 292,709 198,510 86,599 285,109 2004 201,920 88,684 290,604 196,969 86,043 283,012 2005 200,353 88,153 288,506 195,436 85,488 280,923 2006 198,794 87,621 286,415 193,909 84,932 278,842 2007 197,242 87,088 284,330 192,390 84,377 276,767 2008 195,698 86,555 282,252 190,878 83,822 274,700 2009 194,713 85,976 280,689 189,914 83,208 273,122 2010 193,736 85,394 279,131 188,958 82,592 271,550 2011 192,768 84,810 277,578 188,010 81,975 269,985 2012 191,807 84,224 276,031 187,071 81,356 268,427 2013 191,347 84,890 276,237 186,602 82,029 268,631 2014 190,863 85,544 276,408 186,110 82,690 268,800 2015 189,950 86,225 276,175 185,201 83,385 268,586 2016 189,034 86,885 275,919 184,290 84,058 268,348 2017 188,100 87,508 275,608 183,365 84,700 268,065 2018 187,163 88,111 275,274 182,438 85,320 267,758
6.6.3 Uncertainty and time series consistency
Uncertainties The Approach 1 analysis in Annex 2, shown in Table A2.4, provides estimates of uncertainties by IPCC source category. The Netherlands also applies an improved uncertainty assessment to the LULUCF sector with better representation of uncertainties in the land use matrix, using Monte Carlo simulations for combining different types of uncertainties (see chapter 14 in Arets et al., 2020, for details). The uncertainty range for CO2 emissions in category 4C1 Grassland (non-TOF) remaining grassland (non-TOF) is calculated at -60% to +68% and for 4C2 Land
Editor
Please centre figures in Columns 4 and 7.
RIVM report 2020-0031
Page 232 of 525
converted to grassland (non-TOF) at -220% to +340%; see Arets et al. (2020) for details. There is not yet a Monte Carlo uncertainty assessment based on the TOF category, but uncertainties are likely to be similar to those of Forest land – except that the uncertainty related to the land use map may be larger as a result of the inherently small patches of TOF. A new Monte Carlo uncertainty assessment including TOF is foreseen in the next NIR. Time series consistency To ensure time series consistency, for all years up to 2018 the same approach is used for activity data, land use area and emissions calculation. Net annual emissions of CO2 due to the conversion of land to Grassland show a decrease from 221 Gg CO2 in 1990 to -75 Gg CO2 in 2018. Removals in the later years are the result of carbon stock gains in mineral soil that are mainly due to the relatively large areas of cropland that have converted to grassland since 2013. Inter-annual changes in implied EFs in mineral soils are the result of changes in trends of land use changes. Carbon stock changes in mineral soils are based on combinations of land use change and soil type. Therefor, the mix of combinations of land use changes and soil types included, changes over time. Moreover, actual annual land use changes, mixed with the timing of the 20-year transition periods for carbon stock changes in soils, further affects the inter-annual changes in the implied EFs calculated on the basis of the total area in a certain conversion category (e.g. Cropland converted to grassland).
6.6.4 Category-specific QA/QC and verification The source categories are covered by the general QA/QC procedures discussed in Chapter 1.
6.6.5 Category-specific recalculations A number of the methodological changes described in Section 6.1 have resulted in recalculations in the Grassland categories. As a result of the methodological changes in the calculation of the EF for drained organic soils, the reported carbon stock losses in organic soils in this category have been recalculated from 2004 onwards. Additionally, the new method of extrapolating the change in the extent of organic soils in the Netherlands has resulted in recalculations of emissions from organic soils from 2014 onwards. Both changes have resulted in decreased emissions from drained organic soils.
6.6.6 Category-specific planned improvements A correction of the misallocation of Land converted to grassland that within the 20-year transition period changes from one Grassland (non-TOF) category to another is currently being implemented in a new version of the LULUCF model. After testing in 2021 the model is expected to be used for the NIR 2022.

RIVM report 2020-0031
Page 233 of 525
6.7 Wetland (4D) 6.7.1 Source category description
The land use category Wetland mainly comprises open water. Therefore for 4D1 (Wetland remaining wetland) no changes in carbon stocks in living biomass and soil are estimated. For land use conversions from Wetland to other land uses no carbon stock losses in living biomass are assumed to occur. These will be reported as not occurring (NO). For land use changes from Forest land, Cropland and Grassland to Wetland (4D2) losses in carbon stocks in living biomass and net carbon stock changes in soils are included. Because the Wetland category is mainly open water, dead organic matter (DOM) is assumed to be negligible. Therefore, neither are carbon stock gains in DOM included in land use conversions to Wetland, nor are carbon stock losses included in conversions from Wetland to other land use categories. Carbon stock losses for conversions to Wetland will depend on the carbon stocks in DOM in the ‘converted from’ land use category. Currently, carbon stocks in DOM are included only under Forest land. In the Netherlands, land use on peat areas is mainly Grassland, Cropland or Settlements. Emissions from drainage in peat areas are included in carbon stock changes in organic soils for these land use categories.
6.7.2 Methodological issues Living biomass Carbon stocks in living biomass and DOM on flooded land and in open water are considered to be zero. For conversion from other land uses to Wetland, the Netherlands applies a stock difference method assuming that all the carbon in biomass and organic matter that existed before conversion is emitted. Emissions of CH4 from Wetland are not estimated, due to a lack of data. Emissions from fertilizer use in Wetland The land use category Wetland mainly comprises open water, on which no direct nitrogen inputs occur. Therefore, in CRF Table 4(I) direct N2O emissions from N inputs for Wetland are reported as NO.
6.7.3 Uncertainty and time series consistency Uncertainties The Approach 1 analysis in Annex 2, shown in Table A2.4, provides estimates of uncertainties according to IPCC source categories. The Netherlands also applies an improved uncertainty assessment to the LULUCF sector with better representation of uncertainties in the land use matrix, using Monte Carlo simulations for combining different types of uncertainties (see chapter 14 in Arets et al., 2020, for details). The uncertainty range in the CO2 emissions for 4D2 Wetland converted to wetland is calculated at -67% to +76%; see Arets et al. (2020) for details.

RIVM report 2020-0031
Page 234 of 525
Time series consistency To ensure time series consistency, for all years up to 2018 the same approach is used for activity data, land use area and emissions calculation. The time series shows a decrease in CO2 emissions from 87 Gg CO2 in 1990 to 41 Gg CO2 in 2018.
6.7.4 Category-specific QA/QC and verification The source categories are covered by the general QA/QC procedures discussed in Chapter 1.
6.7.5 Category-specific recalculations There are no category-specific recalculations.
6.7.6 Category-specific planned improvements No improvements are planned.
6.8 Settlements (4E) 6.8.1 Source category description
Also in peat soils under Settlements, lowering of the groundwater table leads to oxidation of peat that result in high emissions. Together with loss of carbon stocks in biomass resulting from conversion of Forest land to settlement and Grassland to settlement these are significant sources of CO2. Although Settlements also include areas with grass and trees, biomass gains and losses are expected to be in balance. Therefore, the Netherlands applies the Tier 1 method, assuming no change in carbon stocks in biomass in 4E1 (Settlements remaining settlements). Moreover, due to the high resolution of the land use grid, areas of land of 25 x 25 m or more within urban areas meeting the criteria for Forest land, Grassland or Trees outside forests will be reported under those land use categories and not under Settlements (see Arets et al., 2020). In other words, the major pools of carbon in urban areas are covered by other land use categories. Since no additional data are available on carbon stocks in biomass and DOM in Settlements, and because conversions to Settlements are more frequent than conversions from Settlements to other land uses, it is considered to be more conservative not to report carbon stock gains and losses for biomass and DOM in Settlement resulting from conversions to and from Settlements. It is also assumed that no carbon stock changes occur in mineral soils under Settlements remaining settlements. For conversions from other land uses to Settlements, the Netherlands applies a stock difference method assuming that all the carbon in living biomass and organic matter that existed before conversion is emitted at once.
6.8.2 Methodological issues The methodology for calculating carbon stock losses in biomass for Forest land converted to settlements is provided in Section 6.4. Sections 6.5 (Cropland) and 6.6 (Grassland) provide the methodology for calculating carbon stock losses in biomass for conversions from Cropland and Grassland to Settlements. Land use conversions from
RIVM report 2020-0031
Page 235 of 525
Wetlands or Other land to Settlements will result in no changes in carbon stocks in living biomass. Emissions from fertilizer use in Settlements Under Settlements, direct N2O emissions from the use of fertilisers and compost by private consumers and hobby farmers are reported under 3Da1 (Inorganic N fertilisers) and 3Da2 (Organic N fertilisers). 3Da1 and 3Da2 also include fertilisers used outside agriculture. Therefore, in CRF Table 4(I) N2O emissions from N inputs for Settlements are reported as ‘IE’.
6.8.3 Uncertainty and time series consistency Uncertainties The Approach 1 analysis in Annex 2, shown in Table A2.4, provides estimates of uncertainties for each IPCC source category. The Netherlands also applies an improved uncertainty assessment to the LULUCF sector with better representation of uncertainties in the land use matrix, using Monte Carlo simulations for combining different types of uncertainties (see chapter 14 in Arets et al., 2020, for details). The uncertainty range in CO2 emissions for 4E1 (Settlements remaining settlements) is calculated at -64% to +53% and for 4E2 (Land converted to settlements) at -17% to +90%; see Arets et al. (2020) for details. Time series consistency To ensure time series consistency, for all years up to 2018 the same approach is used for activity data, land use area and emissions calculation. The time series shows a consistent increase from 911 Gg CO2 in 1990 to 1,529 Gg CO2 in 2018, which is the result of increasing land use change to Settlements.
6.8.4 Category-specific QA/QC and verification The source categories are covered by the general QA/QC procedures discussed in Chapter 1.
6.8.5 Category-specific recalculations A number of the methodological changes described in Section 6.1 have resulted in recalculations in the Settlements categories. As a result of the methodological changes in the calculation of the EF for drained organic soils, the reported carbon stock losses in organic soils in this category have been recalculated from 2004 onwards. Additionally, the new method of extrapolating the change in the extent of organic soils in the Netherlands has resulted in recalculations of emissions from organic soils from 2014 onwards. As a result of the new mask for the land use maps to include the harbour extension into the sea (Maasvlakte 2), the area included under Wetland converted to settlements has increased by 0.11 kha between 2013 and 2017, resulting in small increases in emissions from mineral and organic soils.
6.8.6 Category-specific planned improvements No improvements are planned.

RIVM report 2020-0031
Page 236 of 525
6.9 Other land (4F) 6.9.1 Source category description
In the Netherlands the land use category 4F (Other land) is used to report areas of bare soil that are not included in any other category. These include coastal dunes and beaches with little or no vegetation, inland dunes and shifting sands, i.e. areas where the vegetation has been removed to create spaces for early succession species (and which are kept bare by the wind). Inland bare sand dunes developed in the Netherlands as a result of heavy overgrazing. This was for a long time combated by forest planting. These inland dunes and shifting sands, however, provided a habitat to some species that have now become rare. As a conservation measure in certain areas, these habitats have now been restored by removing vegetation and topsoil. No carbon stock changes occur on Other land remaining other land. For units of land converted from other land uses to the category Other land, the Netherlands assumes that all the carbon in living biomass and DOM that existed before conversion is lost and no gains on Other land exist. Carbon stock changes in mineral and organic soils on land converted to Other land are calculated and reported. Similarly, land use conversions from Other land to the other land use categories will involve no carbon stock losses from biomass or DOM.
6.9.2 Methodological issues The methodology for calculating carbon stock changes in biomass for Forest land converted to settlements is provided in Section 6.4. Sections 6.5 (Cropland) and 6.6 (Grassland) provide the methodology for calculating carbon stock changes in biomass in conversions from Cropland and Grassland to Other land. Land use conversions from Wetland or Settlements to Other Land will result in no changes in carbon stocks in living biomass.
6.9.3 Uncertainty and time series consistency Uncertainties The Approach 1 analysis in Annex 2, shown in Table A2.3, provides estimates of uncertainties for each IPCC source category. The Netherlands also applies an improved uncertainty assessment to the LULUCF sector with better representation of uncertainties in the land use matrix, using Monte Carlo simulations for combining different types of uncertainties (see chapter 14 in Arets et al., 2020, for details). The uncertainty range in CO2 emissions for 4F2 (Land converted to other land) is calculated at -3% to +152%; see Arets et al. (2020) for details. Time series consistency To ensure time series consistency, for all years up to 2018 the same approach is used for activity data, land use area and emissions calculation. The time series shows a consistent slow increase from 26 Gg CO2 in 1990 to 173 Gg CO2 in 2018.

RIVM report 2020-0031
Page 237 of 525
6.9.4 Category-specific QA/QC and verification The source categories are covered by the general QA/QC procedures discussed in Chapter 1.
6.9.5 Category-specific recalculations As a result of the new mask for the land use maps to include the harbour extension into the sea (Maasvlakte 2), the area included under Wetland converted to Other land has increased by 0.06 kha between 2013 and 2017, resulting in small increases in emissions from mineral soils.
6.9.6 Category-specific planned improvements No improvements are planned.
6.10 Harvested wood products (4G) 6.10.1 Source category description
The Netherlands calculates sources and sinks from Harvested wood products (HWP) on the basis of the change of the pool, as suggested in the 2013 IPCC KP guidance (IPCC, 2014). For greater transparency, and following footnote 12 in the Convention CRF Table 4.G s1, both the HWP changes reported under the convention and those reported under the KP are calculated using the same methodology (see Arets et al., 2020). Under the convention, HWP emissions and removals are reported in the CRF using Approach B2.
6.10.2 Methodological issues The approach taken to calculate the HWP pools and fluxes follows the guidance in chapter 2.8 of the 2013 IPCC KP guidance (IPCC, 2014). As required by the guidelines, carbon from HWP allocated to Deforestation is reported using instantaneous oxidation (Tier 1) as the calculation method. The remainder of the carbon is allocated to Forest management and is subsequently added to the respective HWP pools. As no country-specific methodologies or half-life constants exist, the calculation for the HWP pools follows the Tier 2 approach outlined in the 2013 IPCC KP guidance (i.e. applying equations 2.8.1–2.8.6 in that guidance) (Arets et al., 2020). Four categories of HWP are taken into account: Sawn wood, Wood-based panels, Other industrial round wood, and Paper and paperboard. Emissions from wood harvested for energy purposes are included in carbon stock losses in living biomass under Forest management, but are not used as an inflow to the HWP pool. As a result, these emissions are accounted for on the basis of instantaneous oxidation. The distribution of material inflow in the different HWP pools is based on the data reported from 1990 onwards to the FAO for its statistics on imports, production and exports of the different wood product categories (see Table 6.12), including those for industrial round wood and wood pulp as a whole. To assess carbon amounts in the different HWP categories, the default carbon conversion factors for the aggregated HWP categories Sawn wood, Wood-based panels, and Paper and paperboard from the 2013 IPCC KP guidance (see Table 6.11) have been used. For the category Other industrial round wood, the values for Sawn wood have been used, as the latter category includes certain types of round wood use, such as
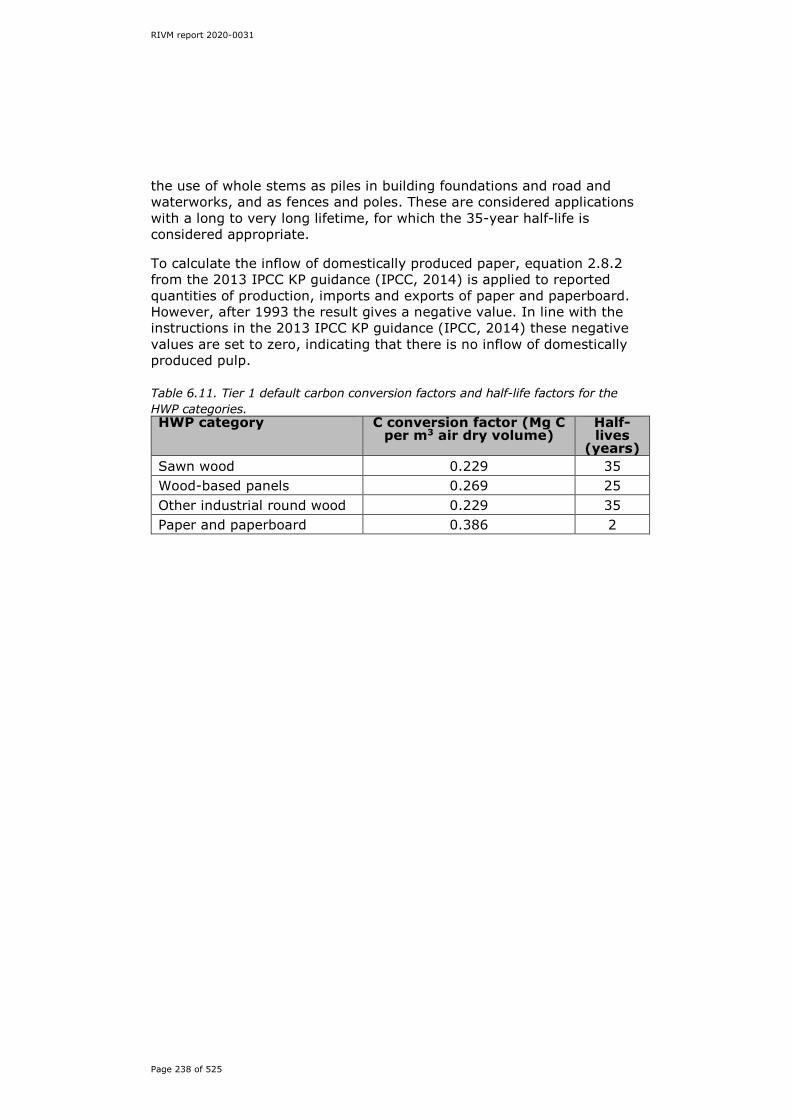
RIVM report 2020-0031
Page 238 of 525
the use of whole stems as piles in building foundations and road and waterworks, and as fences and poles. These are considered applications with a long to very long lifetime, for which the 35-year half-life is considered appropriate. To calculate the inflow of domestically produced paper, equation 2.8.2 from the 2013 IPCC KP guidance (IPCC, 2014) is applied to reported quantities of production, imports and exports of paper and paperboard. However, after 1993 the result gives a negative value. In line with the instructions in the 2013 IPCC KP guidance (IPCC, 2014) these negative values are set to zero, indicating that there is no inflow of domestically produced pulp. Table 6.11. Tier 1 default carbon conversion factors and half-life factors for the HWP categories. HWP category C conversion factor (Mg C
per m3 air dry volume) Half-lives
(years) Sawn wood 0.229 35 Wood-based panels 0.269 25 Other industrial round wood 0.229 35 Paper and paperboard 0.386 2

RIVM report 2020-0031
Page 239 of 525
Table 6.12: Annual production, import and export statistics for Sawn wood, Wood-based panels, Other industrial round wood (only production, no import or export) and Paper and paperboard
Sawn wood Wood-based panels
Other Paper and paperboard
Prod. Im. Ex. Prod. Im. Ex. Prod. Prod. Im. Ex. Year 1000 m3 metric kt 1990 455 3,450 413 97 1,621 141 115 2,770 2,420 2,099 1991 425 3,149 461 105 1,589 154 132 2,862 2,547 2,135 1992 405 3,222 440 111 1,532 167 95 2,835 2,579 2,224 1993 389 3,564 427 107 1,456 237 77 2,855 2,429 2,050 1994 383 3,771 426 110 1,593 312 100 3,011 2,366 2,204 1995 426 3,277 458 114 1,599 305 75 2,967 2,522 2,250 1996 359 3,322 389 96 1,531 318 70 2,987 2,798 2,438 1997 401 3,431 377 101 1,765 313 59 3,159 3,178 2,844 1998 349 3,534 415 59 1,813 299 39 3,180 3,523 2,810 1999 362 3,606 427 61 2,089 288 92 3,256 3,496 2,588 2000 390 3,705 380 61 1,727 275 110 3,332 3,210 3,001 2001 268 3,294 305 20 1,816 257 84 3,174 3,211 2,558 2002 258 3,022 356 23 1,631 254 116 3,346 3,306 2,819 2003 269 3,163 400 10 1,630 247 126 3,339 3,264 3,044 2004 273 3,175 388 8 1,597 308 33 3,459 3,055 2,957 2005 279 3,100 488 11 1,643 327 44 3,471 3,386 3,151 2006 265 3,399 555 10 1,871 363 32 3,367 3,367 3,169 2007 273 3,434 601 18 1,886 405 20 3,224 3,519 3,106 2008 243 3,101 423 33 1,894 411 31 2,977 3,413 2,374 2009 210 2,575 292 46 1,495 301 48 2,609 2,923 2,007 2010 231 2,750 314 51 1,483 274 52 2,859 3,036 2,270 2011 238 2,710 322 46 1,680 295 61 2,748 2,874 2,484 2012 190 2,557 432 58 1,431 329 20 2,761 2,570 1,941 2013 216 2,477 446 33 1,371 288 14 2,792 2,758 2,279 2014 228 2,506 508 29 1,404 290 14 2,767 2,789 2,268 2015 185 2,757 526 29 1,568 314 13 2,643 2,592 2,217 2016 184 2,821 468 29 1,608 326 21 2,671 2,424 2,289 2017 171 3,164 587 29 1,815 335 20 2,983 2,439 2,508 2018 140 3,374 607 29 1,913 290 24 2,980 2,470 2,513
6.10.3 Uncertainty and time series consistency Uncertainties For harvested wood products no Approach 1 uncertainty estimate is currently available. The Netherlands has, however, included HWP in the improved uncertainty assessment of the LULUCF sector using Monte Carlo simulations for combining different types of uncertainties (see chapter 14 in Arets et al., 2020, for details).
RIVM report 2020-0031
Page 240 of 525
The uncertainty range in the CO2 emissions for 4G (Harvested wood products) is calculated at -8% to +1%; see Arets et al. (2020) for details. Time series consistency Annual changes in carbon stocks in HWP are erratic by nature because they depend on highly variable inputs of wood production, imports and exports. Net CO2 emissions and removals in the period 1990–2018 range between -158 Gg CO2 (removals) and 165 Gg CO2.
6.10.4 Category-specific QA/QC and verification The source categories are covered by the general QA/QC procedures discussed in Chapter 1.
6.10.5 Category-specific recalculations Reported carbon stock gains and losses in HWP have been recalculated for the whole time series due to the methodological changes to the allocation of wood harvests described in Section 6.1. As a result, a larger share of HWP is considered to be produced from domestic wood. The inputs into the HWP categories have therefore increased.
6.10.6 Category-specific planned improvements Because the FAO sometimes changes its forest statistics without notice or explanation, in the future we plan to use data on production, import and export of wood from PROBOS, the Dutch national correspondent to the Joint Forest Sector Questionnaire (JFSQ), which is used to report national forestry statistics to the FAO and other international organisations. This should improve the transparency and consistency of the data used. It is expected that these data will be used from 2021 onwards.

RIVM report 2020-0031
Page 241 of 525
7 Waste (CRF sector 5)
Major changes in the Waste sector compared with the National Inventory Report 2019
Emissions:
In 2018, total GHG emissions from the Waste sector further reduced by 3.2% compared with 2017; and by 79% compared with 1990.
Key categories: 5D (N2O emissions from wastewater treatment and discharge) is no longer a key category.
Methodologies: No changes.
7.1 Overview of sector
The national inventory of the Netherlands comprises four source categories in the Waste sector:
• solid waste disposal on land (5A): CH4 (methane) emissions; • composting and digesting of biomass waste (including manure)
(5B): CH4 and N2O emissions; • treatment of waste, including communal waste incineration
plants (5C): CO2 and N2O emissions (included in 1A1a); • wastewater treatment and discharge (5D): CH4 and N2O
emissions. Table 7.1 shows the contribution of the emissions from the Waste sector to total GHG emissions in the Netherlands, as well as the key sources in this sector by level, trend or both. The list of all (key and non-key) sources in the Netherlands is included in Annex 1.

RIVM report 2020-0031
Page 242 of 525
Table 7.1. Overview of the sector Waste (5) in the base year and the last two years of the inventory (in Tg CO2 eq.).
Sector/category Gas Key 1990 2017 2018 2018 vs
1990 Contribution to total in
2018 (%) by
Emissions in Tg
CO2 eq % sector total gas
total CO2 eq
5 Waste CH4 14.0 2.9 2.8 -79.9% 94.4% 16.3% 1.5% N2O 0.2 0.2 0.2 -7.5% 5.6% 2.0% 0.1% All 14.2 3.1 3.0 -79.0% 100.0% 1.6% 5A. Solid Waste Disposal CH4 13.7 2.6 2.5 -81.9% 83.1% 14.3% 1.3% 5A1. Managed Waste Disposal on Land CH4 L,T 13.7 2.6 2.5 -81.9% 83.1% 14.3% 1.3% 5B. Biological treatment of solid waste CH4 non key 0.0 0.1 0.1 718.1% 3.7% 0.6% 0.1% N2O non key 0.0 0.1 0.1 1277.4% 3.0% 1.1% 0.0% All 0.0 0.2 0.2 898.7% 6.8% 0.1% 5D. Wastewater treatment and discharge N2O non key 0.2 0.1 0.1 -56.5% 2.5% 0.9% 0.0% CH4 non key 0.3 0.2 0.2 -28.3% 7.4% 1.3% 0.1% All 0.5 0.3 0.3 -38.4% 9.9% 0.2% National Total GHG emissions (excl. CO2 LULUCF)
CO2 163.3 164.9 160.6 -1.6%
CH4 31.8 18.0 17.3 -45.7% N2O 18.0 8.7 8.3 -53.7% total* 221.7 193.3 188.2 -15.1%
* including F-gases CO2 emissions from the anaerobic decay of waste in landfill sites are not included here, since these are considered to be part of the carbon cycle and not a net source. The Netherlands does not report emissions from waste incineration facilities in the Waste sector either, because these facilities also produce electricity and/or heat used for energy purposes; these emissions are therefore included in category 1A1a (to comply with IPCC reporting guidelines). Methodological issues concerning this source category are briefly discussed in Section 7.4. The methodology is described in detail in the methodology report (Honig et al., 2020), see also the reference in Annex 7. The Waste sector accounted for 1.6% of total national emissions (without LULUCF) in 2018, compared with 6.4% in 1990. Emissions of CH4 and N2O accounted for about 94% and 6% of CO2-equivalent emissions from the sector, respectively. Emissions of CH4 from waste – almost all of which (83%) originates from landfills (5A1 Managed waste disposal on land) – accounted for 16.3% of total CH4 emissions in 2018. N2O emissions from the Waste sector originate from biological treatment of solid waste and from wastewater treatment. Fossil fuel-related emissions from waste incineration, mainly CO2, are included in fuel combustion emissions from the Energy sector (1A1a), since all large-scale incinerators also produce electricity and/or heat for energy purposes.
Editor
Usual correx to table.
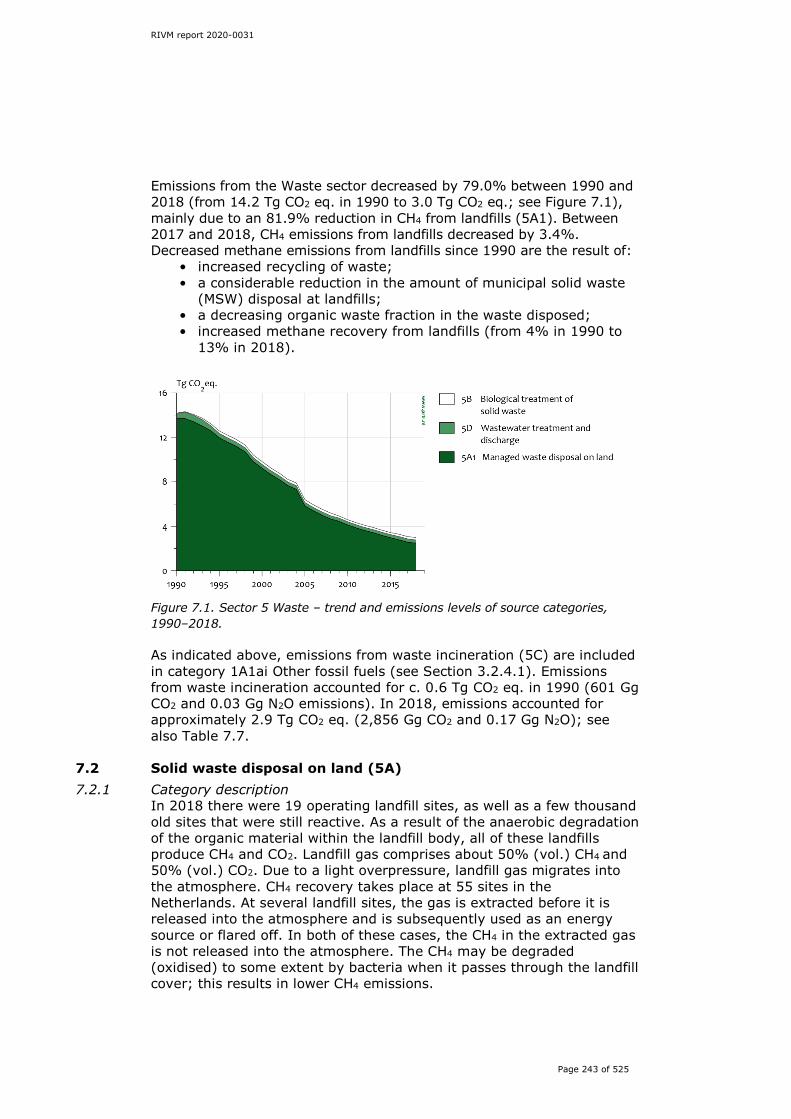
RIVM report 2020-0031
Page 243 of 525
Emissions from the Waste sector decreased by 79.0% between 1990 and 2018 (from 14.2 Tg CO2 eq. in 1990 to 3.0 Tg CO2 eq.; see Figure 7.1), mainly due to an 81.9% reduction in CH4 from landfills (5A1). Between 2017 and 2018, CH4 emissions from landfills decreased by 3.4%. Decreased methane emissions from landfills since 1990 are the result of:
• increased recycling of waste; • a considerable reduction in the amount of municipal solid waste
(MSW) disposal at landfills; • a decreasing organic waste fraction in the waste disposed; • increased methane recovery from landfills (from 4% in 1990 to
13% in 2018).
Figure 7.1. Sector 5 Waste – trend and emissions levels of source categories, 1990–2018. As indicated above, emissions from waste incineration (5C) are included in category 1A1ai Other fossil fuels (see Section 3.2.4.1). Emissions from waste incineration accounted for c. 0.6 Tg CO2 eq. in 1990 (601 Gg CO2 and 0.03 Gg N2O emissions). In 2018, emissions accounted for approximately 2.9 Tg CO2 eq. (2,856 Gg CO2 and 0.17 Gg N2O); see also Table 7.7.
7.2 Solid waste disposal on land (5A) 7.2.1 Category description
In 2018 there were 19 operating landfill sites, as well as a few thousand old sites that were still reactive. As a result of the anaerobic degradation of the organic material within the landfill body, all of these landfills produce CH4 and CO2. Landfill gas comprises about 50% (vol.) CH4 and 50% (vol.) CO2. Due to a light overpressure, landfill gas migrates into the atmosphere. CH4 recovery takes place at 55 sites in the Netherlands. At several landfill sites, the gas is extracted before it is released into the atmosphere and is subsequently used as an energy source or flared off. In both of these cases, the CH4 in the extracted gas is not released into the atmosphere. The CH4 may be degraded (oxidised) to some extent by bacteria when it passes through the landfill cover; this results in lower CH4 emissions.
RIVM report 2020-0031
Page 244 of 525
The anaerobic degradation of organic matter in landfills may take many decades. Some of the factors influencing this process are known; some are not. Each landfill site has unique characteristics: concentration and type of organic matter, moisture and temperature, among others. The major factors determining the decrease in net CH4 emissions are lower quantities of organic carbon deposited in landfills (organic carbon content multiplied by the total amount of land-filled waste) and higher methane recovery rates from landfills (see Sections 7.2.2 and 7.2.3). The share of CH4 emissions from landfills in the total national inventory of GHG emissions was 6.1% in 1990 and 1.3% in 2018. This decrease is partly due to the increase in recovered CH4, from about 4% in 1990 to 13% in 2018. A second cause is the decrease in methane produced at solid waste disposal sites (SWDS) and the decrease in the relative amount of methane in landfill gas from 57% to 50%. In 2018, solid waste disposal on land accounted for 83.1% of total emissions from the Waste sector and 1.3% of total national CO2-equivalent emissions (see Table 7.1). Dutch policies directly aim at reducing the amount of waste sent to landfill sites. This requires enhanced prevention of waste production and increased recycling of waste, followed by incineration. As early as the 1990s, the government introduced bans on the landfilling of certain categories of waste; for example, the organic fraction of household waste. Another means of reducing landfilling was raising landfill taxes in line with the higher costs of incinerating waste.8 As a result of this policy, the amount of waste sent to landfills decreased from 14 million tons in 1990 to 3.2 million tons in 2018, thereby reducing emissions from this source category.
7.2.2 Methodological issues A more detailed description of the method and EFs used can be found in paragraph 2.3.2.2 of Honig et al. (2020) and Annex 7. Data on the amount of waste disposed of at landfill sites derive mainly from the annual survey performed by the Working Group on Waste Registration (WAR) at all the landfill sites in the Netherlands. These data are documented in Rijkswaterstaat (2020), which also gives the annual amount of CH4 recovered from landfill sites. The IEFs correspond with the IPCC default values. In order to calculate CH4 emissions from all the landfill sites in the Netherlands, it is assumed that all waste is disposed of at one landfill site. As stated above, however, characteristics of individual sites vary substantially. CH4 emissions from this ‘national landfill’ were then calculated using a first-order decomposition model (first-order decay function) with an annual input of the total amounts deposited, the characteristics of the landfilled waste and the amount of landfill gas extracted. This is equivalent to the IPCC Tier 2 methodology. Since landfills
8 In extreme circumstances, e.g. an increase in demand for incineration capacity due to unprecedented supply, the regional government can grant an exemption from these ‘obligations’.
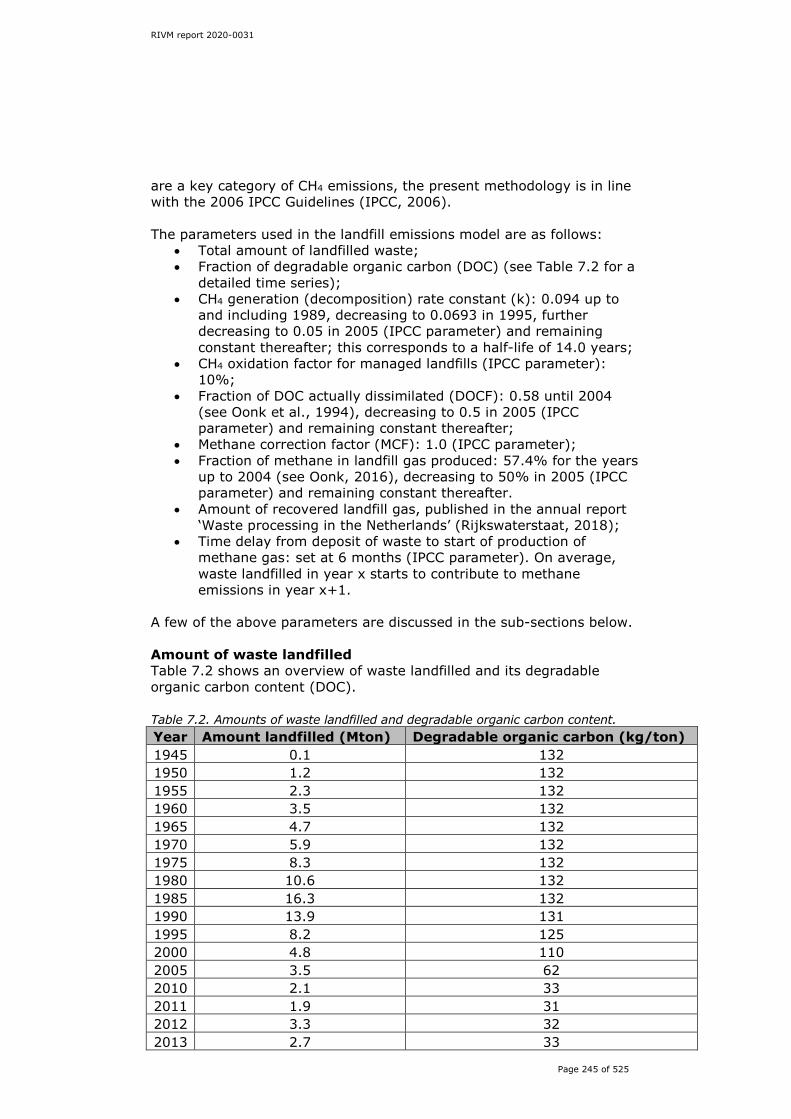
RIVM report 2020-0031
Page 245 of 525
are a key category of CH4 emissions, the present methodology is in line with the 2006 IPCC Guidelines (IPCC, 2006). The parameters used in the landfill emissions model are as follows:
• Total amount of landfilled waste; • Fraction of degradable organic carbon (DOC) (see Table 7.2 for a
detailed time series); • CH4 generation (decomposition) rate constant (k): 0.094 up to
and including 1989, decreasing to 0.0693 in 1995, further decreasing to 0.05 in 2005 (IPCC parameter) and remaining constant thereafter; this corresponds to a half-life of 14.0 years;
• CH4 oxidation factor for managed landfills (IPCC parameter): 10%;
• Fraction of DOC actually dissimilated (DOCF): 0.58 until 2004 (see Oonk et al., 1994), decreasing to 0.5 in 2005 (IPCC parameter) and remaining constant thereafter;
• Methane correction factor (MCF): 1.0 (IPCC parameter); • Fraction of methane in landfill gas produced: 57.4% for the years
up to 2004 (see Oonk, 2016), decreasing to 50% in 2005 (IPCC parameter) and remaining constant thereafter.
• Amount of recovered landfill gas, published in the annual report ‘Waste processing in the Netherlands’ (Rijkswaterstaat, 2018);
• Time delay from deposit of waste to start of production of methane gas: set at 6 months (IPCC parameter). On average, waste landfilled in year x starts to contribute to methane emissions in year x+1.
A few of the above parameters are discussed in the sub-sections below. Amount of waste landfilled Table 7.2 shows an overview of waste landfilled and its degradable organic carbon content (DOC). Table 7.2. Amounts of waste landfilled and degradable organic carbon content. Year Amount landfilled (Mton) Degradable organic carbon (kg/ton) 1945 0.1 132 1950 1.2 132 1955 2.3 132 1960 3.5 132 1965 4.7 132 1970 5.9 132 1975 8.3 132 1980 10.6 132 1985 16.3 132 1990 13.9 131 1995 8.2 125 2000 4.8 110 2005 3.5 62 2010 2.1 33 2011 1.9 31 2012 3.3 32 2013 2.7 33

RIVM report 2020-0031
Page 246 of 525
Year Amount landfilled (Mton) Degradable organic carbon (kg/ton) 2014 2.2 34 2015 2.3 43 2016 2.8 52 2017 2.9 56 2018 3.2 51 Between 1945 and 1970 a number of municipalities kept detailed records of the collection of waste. In addition, information was available about which municipalities had their waste incinerated or composted. All other municipal waste was landfilled. This information, in combination with data on landfilling from various sources (SVA, 1973; CBS, 1988, 1989; Nagelhout, 1989) and data for the years 1950, 1955, 1960, 1965 and 1970 determined and published by Van Amstel et al. (1993), was used to compile the dataset, assuming that during the Second World War hardly any waste was landfilled. These data are also used in the FOD model, while missing years (1945–1950, 1951–1954, 1956–1959, 1961–1964 and 1966–1969) are linearly extrapolated. From 1970 on, accurate data on production and waste treatment are available (Spakman et. al., 2003). Landfill site operators systematically monitor the amount of waste dumped (weight and composition) at each waste site. Since 1993 monitoring has occurred by weighing the amount of waste dumped and by regulating dumping via compulsory environmental permits. Data on the amounts of waste dumped since 1991 are supplied by the WAR and included in the annual report ‘Waste processing in the Netherlands’. Information on the way in which these data are gathered and the scope of the information used can be found in these reports, available since 1991 from the WAR (Rijkswaterstaat). Since 2005 landfill operators have been obliged to register their waste according to European Waste List (EWL) codes. Landfill operators also use EWL codes for the annual survey by the WAR, so that the WAR has a complete overview of the waste that is landfilled for every EWL code. Fraction of degradable organic carbon The amount of degradable organic carbon (DOC) for the period 1945–1990 was determined at 132 kg/ton (Spakman et. al., 2003). In the period 1991–1997, the fraction degradable organic carbon (DOCf) value slowly declines due to the start of separate collection of organic waste from households in 1992 and the introduction of landfill bans for municipal waste in 1995. Rijkswaterstaat gathers information on the amounts and composition of a large number of waste flows as part of its work to draw up the annual ‘Netherlands Waste in Figures’ report (AgentschapNL, 2010). The results of several other research projects also helped to determine the composition of the waste dumped. This method was used until 2004. In the period 2000–2004 effects of the policy of reducing the amount of DOC being landfilled (especially in waste from households) resulted in a decrease of the DOC value from 110 kg/ton in 2000 to 74 kg/ton in 2004. From 2005 onwards all waste that is landfilled is included in the figures. This includes waste streams that have very low DOC content (contaminated soil, dredging spoils) or no DOC at all (inert waste). The
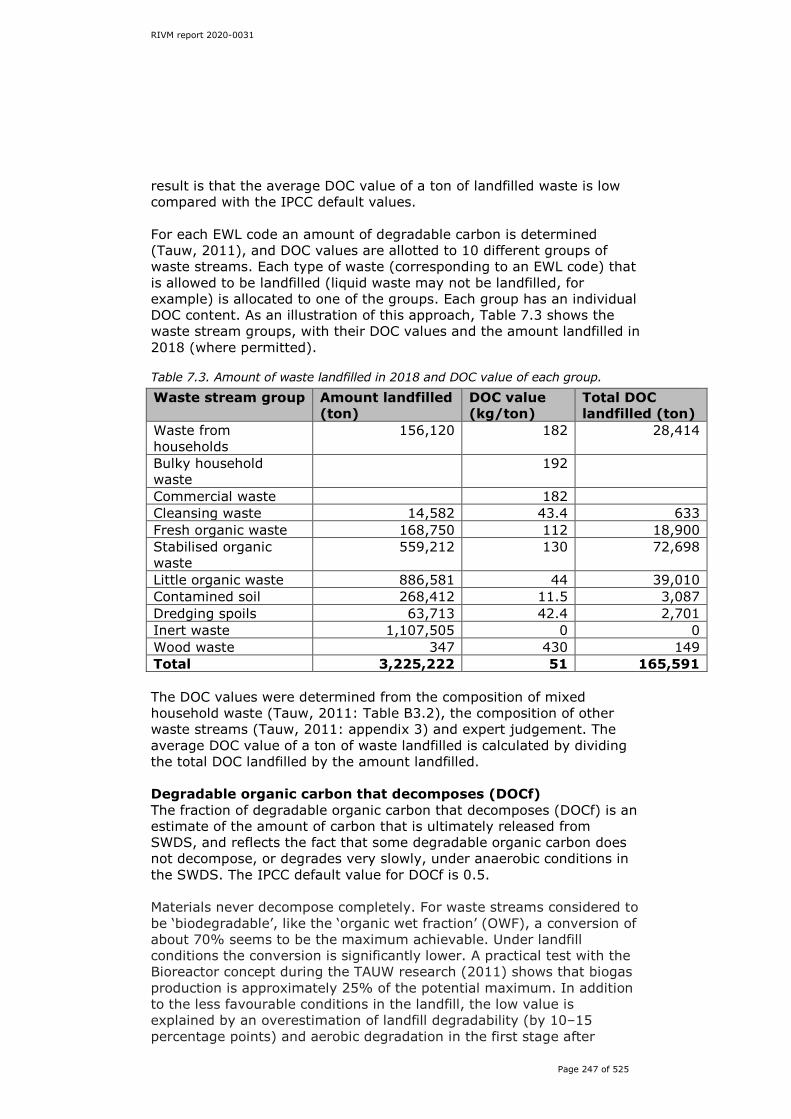
RIVM report 2020-0031
Page 247 of 525
result is that the average DOC value of a ton of landfilled waste is low compared with the IPCC default values. For each EWL code an amount of degradable carbon is determined (Tauw, 2011), and DOC values are allotted to 10 different groups of waste streams. Each type of waste (corresponding to an EWL code) that is allowed to be landfilled (liquid waste may not be landfilled, for example) is allocated to one of the groups. Each group has an individual DOC content. As an illustration of this approach, Table 7.3 shows the waste stream groups, with their DOC values and the amount landfilled in 2018 (where permitted). Table 7.3. Amount of waste landfilled in 2018 and DOC value of each group.
Waste stream group Amount landfilled (ton)
DOC value (kg/ton)
Total DOC landfilled (ton)
Waste from households
156,120 182 28,414
Bulky household waste
192
Commercial waste 182 Cleansing waste 14,582 43.4 633 Fresh organic waste 168,750 112 18,900 Stabilised organic waste
559,212 130 72,698
Little organic waste 886,581 44 39,010 Contamined soil 268,412 11.5 3,087 Dredging spoils 63,713 42.4 2,701 Inert waste 1,107,505 0 0 Wood waste 347 430 149 Total 3,225,222 51 165,591 The DOC values were determined from the composition of mixed household waste (Tauw, 2011: Table B3.2), the composition of other waste streams (Tauw, 2011: appendix 3) and expert judgement. The average DOC value of a ton of waste landfilled is calculated by dividing the total DOC landfilled by the amount landfilled. Degradable organic carbon that decomposes (DOCf) The fraction of degradable organic carbon that decomposes (DOCf) is an estimate of the amount of carbon that is ultimately released from SWDS, and reflects the fact that some degradable organic carbon does not decompose, or degrades very slowly, under anaerobic conditions in the SWDS. The IPCC default value for DOCf is 0.5. Materials never decompose completely. For waste streams considered to be ‘biodegradable’, like the ‘organic wet fraction’ (OWF), a conversion of about 70% seems to be the maximum achievable. Under landfill conditions the conversion is significantly lower. A practical test with the Bioreactor concept during the TAUW research (2011) shows that biogas production is approximately 25% of the potential maximum. In addition to the less favourable conditions in the landfill, the low value is explained by an overestimation of landfill degradability (by 10–15 percentage points) and aerobic degradation in the first stage after

RIVM report 2020-0031
Page 248 of 525
deposition (about 15 percentage points, based on a laboratory test). If these values are taken into account, approximately 46% of the carbon is decomposed within the test period (aerobic + anaerobic). In the long term, degradation may increase and an f value of 0.58 can be approximated. This f value, however, relates only to anaerobic degradation; there is no correction for aerobic degradation in the initial stage of the landfill process (Tauw, 2011: pp. 89–90). Therefore, we assume that the IPCC default value of 0.5 is quite accurate for the amount of waste that actually decomposes. k-value The k-value is a value for slowly degrading waste (wood, paper, textiles) in a wet and temperate climate zone. The IPCC default value is between 0.03 and 0.06; a k-value of 0.05 is used in the Dutch model. Degradable waste is not landfilled in large quantities in the Netherlands. There is still a quantity of mixed municipal waste landfilled (EWL code 200301). In theory, this code applies to several waste streams, e.g. waste from households and commercial waste. In fact, in recent years only commercial waste has been landfilled, because waste from households is incinerated. The problem with commercial waste is that an accurate composition of this waste stream is not available. Waste incinerator operators do not accept this stream, so an exemption of the landfill ban is permitted by the regional authorities. Waste incinerator operators must give an explanation why waste cannot be incinerated at their plants. In most cases the operators state that the waste stream is not combustible or not suitable for their processes and therefore has to be landfilled. The same problem applies to residues from waste treatment. If residues have to be landfilled, it is in most cases because they are not combustible or recyclable. In some cases waste incinerator operators argue that the caloric value is also too high, mainly due a high content of plastics in the residues. Residues do not contain rapidly degrading waste such as food waste or sewage sludge. Other waste streams that are landfilled in large quantities, such as contaminated soil (EWL code 170504) and sludges from physic-chemical treatment (EWL code 190206: in fact mainly residues from soil remediation), have a low DOC value. It is reasonable to assume that these residues contain only slowly degrading waste, because the organic content is stabilised. Methane correction factor (MCF) All sites that were in operation after World War II can be regarded as being managed as defined in the IPCC Guidelines, according to which they must have controlled placement of waste (i.e. waste is directed to specific deposition areas, and there is a degree of control over scavenging and over the outbreak of fire) and feature at least one of the following: (i) cover material; (ii) mechanical compacting; or (iii) levelling of the waste. Many landfill sites are situated near urban areas. In order to prevent odour and scavenging animals (birds, rats) the management of landfill sites has attracted close attention since the beginning of the 20th century. A major study conducted in 2005 (NAVOS, 2005) investigated about 4,000 old landfill sites and concluded that:

RIVM report 2020-0031
Page 249 of 525
• From 1930 a method of placing the waste in defined layers and covering it with ashes, soil, sand or dirt from street sweeping became common practice.
• In the early 1970s the waste sector introduced a ‘code of practice’ in which a method of environmentally friendly landfilling was described.
• During the 1970s and early 1980s national legislation introduced an obligation to landfill in a controlled manner. Some old permits for landfill sites (from the early 1970s) contained obligations to compact and cover the waste and to deposit waste in specific parts of the site covering a certain maximum size instead of using the whole area simultaneously. Several permits also paid attention to fire-prevention.
On the basis of these findings, waste disposal sites can be generally considered as managed during the whole relevant period. A few landfill sites are semi-aerobic. At three selected landfill sites research is currently being undertaken into how the site should be managed after it is closed. This is the responsibility of the regional authorities. A few parts of these landfills are semi-aerobic, but emissions from all waste landfilled at these sites are included in the emissions from anaerobic landfills. Fraction of methane generated in landfill gas Most models of CH4 formation in landfills and emissions from landfills are based on landfills of municipal solid waste. This type of waste was landfilled in the Netherlands until the early 1990s, but since then Dutch waste policy has changed. The landfilling of waste with large amounts of biodegradables (such as household waste) was first discouraged and then banned. Food and garden waste are now collected separately and composted. Other types of household wastes are nowadays mostly incinerated and or recycled. As a result, existing models are extrapolated to deal with this changed waste composition. Another explanation for a lower fraction of methane generated in landfill gas is that there is reduced methane content in the landfill gas being formed. Landfill gas is produced from a broad range of materials. Cellulose and hemicellulose, for example, produce gas with a theoretical methane concentration of about 50%. Proteins and fats, however, produce gas with a significantly higher methane concentration. When waste is landfilled, it is conceivable that the more readily degradable components decompose first, resulting in a methane concentration that gradually declines from e.g. 57% to about 50%. Since less and less readily degradable material is landfilled in the Netherlands, it is possible that the observed decline is at least partially the result of a decline in CH4 concentration in the gas that is formed (Oonk, 2011). Based on measurements by Coops et al. (1995), the amount of methane in landfill gas was determined at 60%. In earlier research the amount of CO2 absorbed in seepage water was not included. Research by Oonk (2016) estimated that 2–10% of the CO2 was removed by the leachate. In the calculations 10% of the CO2 is removed, resulting in a fraction of methane in landfill gas of 57.4% for the period 1990–2004.
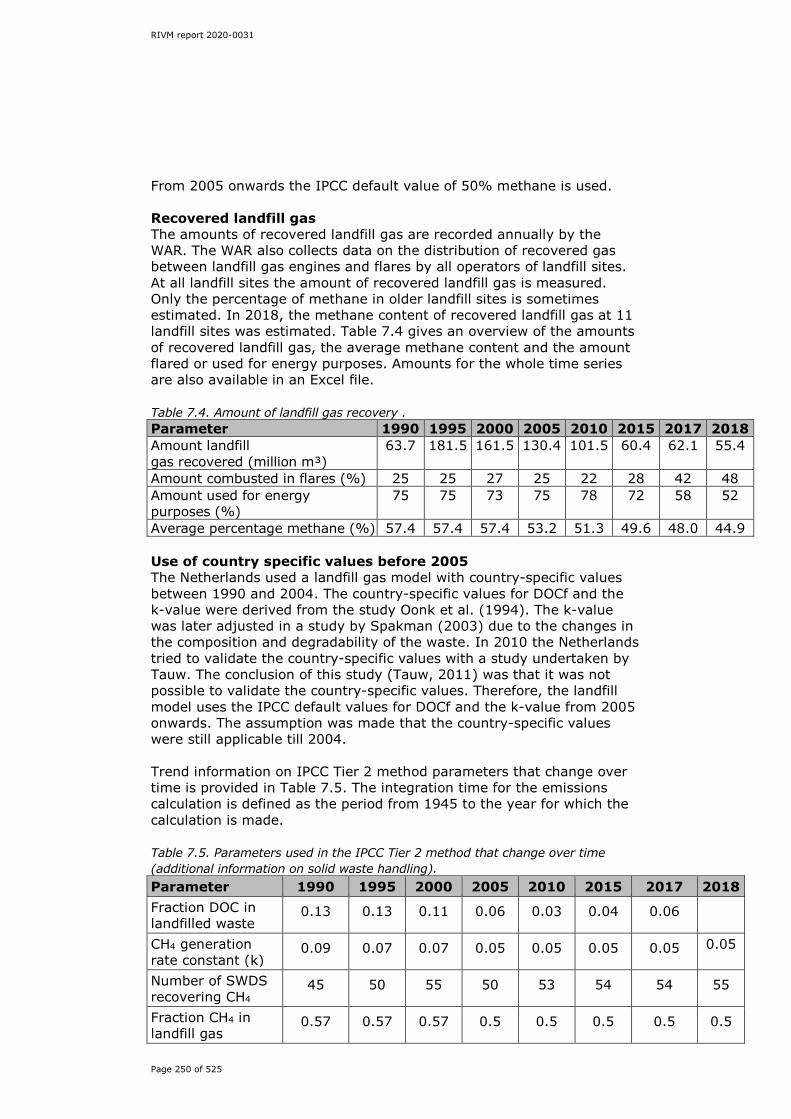
RIVM report 2020-0031
Page 250 of 525
From 2005 onwards the IPCC default value of 50% methane is used. Recovered landfill gas The amounts of recovered landfill gas are recorded annually by the WAR. The WAR also collects data on the distribution of recovered gas between landfill gas engines and flares by all operators of landfill sites. At all landfill sites the amount of recovered landfill gas is measured. Only the percentage of methane in older landfill sites is sometimes estimated. In 2018, the methane content of recovered landfill gas at 11 landfill sites was estimated. Table 7.4 gives an overview of the amounts of recovered landfill gas, the average methane content and the amount flared or used for energy purposes. Amounts for the whole time series are also available in an Excel file. Table 7.4. Amount of landfill gas recovery . Parameter 1990 1995 2000 2005 2010 2015 2017 2018 Amount landfill gas recovered (million m³)
63.7 181.5 161.5 130.4 101.5 60.4 62.1 55.4
Amount combusted in flares (%) 25 25 27 25 22 28 42 48 Amount used for energy purposes (%)
75 75 73 75 78 72 58 52
Average percentage methane (%) 57.4 57.4 57.4 53.2 51.3 49.6 48.0 44.9 Use of country specific values before 2005 The Netherlands used a landfill gas model with country-specific values between 1990 and 2004. The country-specific values for DOCf and the k-value were derived from the study Oonk et al. (1994). The k-value was later adjusted in a study by Spakman (2003) due to the changes in the composition and degradability of the waste. In 2010 the Netherlands tried to validate the country-specific values with a study undertaken by Tauw. The conclusion of this study (Tauw, 2011) was that it was not possible to validate the country-specific values. Therefore, the landfill model uses the IPCC default values for DOCf and the k-value from 2005 onwards. The assumption was made that the country-specific values were still applicable till 2004. Trend information on IPCC Tier 2 method parameters that change over time is provided in Table 7.5. The integration time for the emissions calculation is defined as the period from 1945 to the year for which the calculation is made. Table 7.5. Parameters used in the IPCC Tier 2 method that change over time (additional information on solid waste handling). Parameter 1990 1995 2000 2005 2010 2015 2017 2018 Fraction DOC in landfilled waste
0.13 0.13 0.11 0.06 0.03 0.04 0.06
CH4 generation rate constant (k)
0.09 0.07 0.07 0.05 0.05 0.05 0.05 0.05
Number of SWDS recovering CH4
45 50 55 50 53 54 54 55
Fraction CH4 in landfill gas
0.57 0.57 0.57 0.5 0.5 0.5 0.5 0.5

RIVM report 2020-0031
Page 251 of 525
7.2.3 Uncertainty and time series consistency Uncertainty The Approach 1 uncertainty analysis shown in Annex 2 provides estimates of uncertainties by IPCC source category and gas. The uncertainty in CH4 emissions from SWDS is estimated to be approximately 24%. The uncertainty in the activity data and the EF is estimated to be less than 0.5% and 24%, respectively. For a more detailed analysis of these uncertainties, see Rijkswaterstaat (2014). Time series consistency The estimates for all years are calculated from the same model, which means that the methodology is consistent throughout the time series. The time series consistency of the activity data is very good, due to the continuity in the data provided.
7.2.4 Category-specific QA/QC and verification The source categories are covered by the general QA/QC procedures discussed in Chapter 1, and the specific QA/QC described in the document on the QA/QC of outside agencies (Wever, 2011). In general, the QA/QC procedures within the Waste sector are:
• checking activity data against other sources within the monitoring of waste;
• checking trends in the resulting emissions.
7.2.5 Category-specific recalculations Compared with the previous submission, minor errors in the data have been corrected in this submission.
7.2.6 Category-specific planned improvements In 2018, potential improvements for this category (in coherence with the categories Solid waste disposal on land and Other waste handling) were investigated. Due to the prioritising of all possible improvements in the Dutch inventory, however, none of the Waste improvements were selected to be implemented.
7.3 Biological treatment of solid waste (5B) 7.3.1 Category description
This source category consists of CH4 and N2O emissions from the composting and digesting of separately collected organic waste from households and green waste from gardens and horticulture; and emissions from manure from agriculture. Emissions from the small-scale composting of garden waste and food waste by households are not estimated, as these are assumed to be negligible. The amount of composted and digested organic waste increased from almost nothing in 1990 to 4.0 million ton in 2018. In 2018, this treatment accounted for 6.7% of the emissions in the Waste sector (see Table 7.1). The biological treatment of solid waste is not a key source of CH4 or N2O emissions.
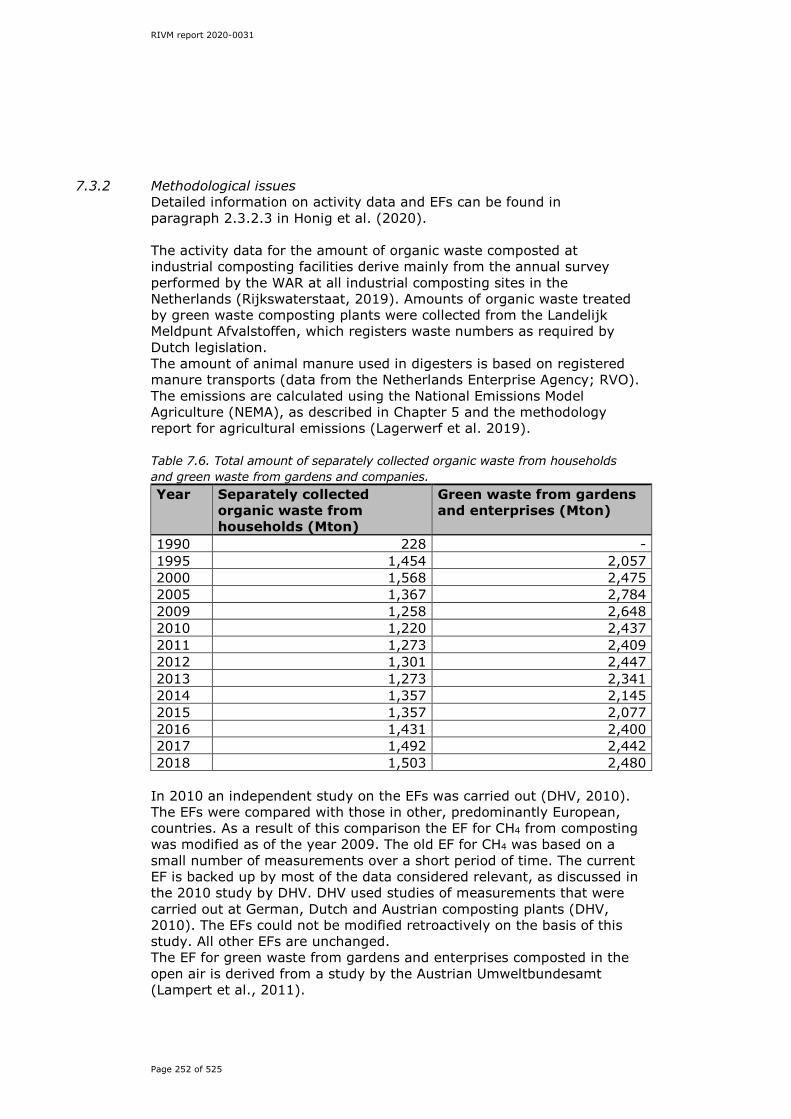
RIVM report 2020-0031
Page 252 of 525
7.3.2 Methodological issues Detailed information on activity data and EFs can be found in paragraph 2.3.2.3 in Honig et al. (2020). The activity data for the amount of organic waste composted at industrial composting facilities derive mainly from the annual survey performed by the WAR at all industrial composting sites in the Netherlands (Rijkswaterstaat, 2019). Amounts of organic waste treated by green waste composting plants were collected from the Landelijk Meldpunt Afvalstoffen, which registers waste numbers as required by Dutch legislation. The amount of animal manure used in digesters is based on registered manure transports (data from the Netherlands Enterprise Agency; RVO). The emissions are calculated using the National Emissions Model Agriculture (NEMA), as described in Chapter 5 and the methodology report for agricultural emissions (Lagerwerf et al. 2019). Table 7.6. Total amount of separately collected organic waste from households and green waste from gardens and companies. Year Separately collected
organic waste from households (Mton)
Green waste from gardens and enterprises (Mton)
1990 228 - 1995 1,454 2,057 2000 1,568 2,475 2005 1,367 2,784 2009 1,258 2,648 2010 1,220 2,437 2011 1,273 2,409 2012 1,301 2,447 2013 1,273 2,341 2014 1,357 2,145 2015 1,357 2,077 2016 1,431 2,400 2017 1,492 2,442 2018 1,503 2,480
In 2010 an independent study on the EFs was carried out (DHV, 2010). The EFs were compared with those in other, predominantly European, countries. As a result of this comparison the EF for CH4 from composting was modified as of the year 2009. The old EF for CH4 was based on a small number of measurements over a short period of time. The current EF is backed up by most of the data considered relevant, as discussed in the 2010 study by DHV. DHV used studies of measurements that were carried out at German, Dutch and Austrian composting plants (DHV, 2010). The EFs could not be modified retroactively on the basis of this study. All other EFs are unchanged. The EF for green waste from gardens and enterprises composted in the open air is derived from a study by the Austrian Umweltbundesamt (Lampert et al., 2011).

RIVM report 2020-0031
Page 253 of 525
7.3.3 Uncertainty and time series consistency Uncertainty Emissions from this source category are calculated using an average EF that has been obtained from the literature. The uncertainty in annual CH4 and N2O emissions is estimated at 63% and 50%. The uncertainty is mainly determined by uncertainties in the EF (63% and 50%, respectively); whereas to uncertainty in the activity data is about 5%. For a more detailed analysis of these uncertainties, see Rijkswaterstaat (2014). Time series consistency The time series consistency of the activity data is very good, due to the continuity in the data provided.
7.3.4 Category-specific QA/QC and verification The source categories are covered by the general QA/QC procedures, which are discussed in Chapter 1, and the specific QA/QC described in the document for the QA/QC of outside agencies (Wever, 2011). In general, the QA/QC procedures within the Waste sector are:
• checking activity data against other sources within the monitoring of waste;
• checking trends in the resulting emissions; • checking EFs every four to five years against EFs in other
European countries.
7.3.5 Category-specific recalculations Compared with the previous submission, minor errors in the data have been corrected in this submission. Additionally, CH4 emissions from the digesting of manure (category 5B2) have been added from the starting year 2006 (4 Gg CO2 eq.) up to 54 Gg CO2 eq. in 2017.
7.3.6 Category-specific planned improvements A few year sago (2017), potential improvements for this category (in coherence with the categories Solid waste disposal on land and Other waste handling) were investigated. Due to the prioritising of all possible improvements in the Dutch inventory, however, none of the Waste improvements was selected to be carried out.
7.4 Waste incineration (5C) 7.4.1 Category description
This category comprises emissions from activities of the waste incineration facilities that process municipal solid waste and other waste streams. In general, the open burning of waste does not occur in the Netherlands, as it is prohibited by law. However, bonfires (wood burning) are occasionally allowed, and as of this year are included in the inventory. Bonfires occur mainly at New Year’s Eve and Easter. They are fuelled by biomass waste (wooden pallets, organic degradable waste). Municipalities grant permits for these bonfires, so it is known where they occur. The permits often specify how much biomass waste may be burned in the open air. During the process of open burning, emissions of N2O and CH4
occur. This is a minor source.
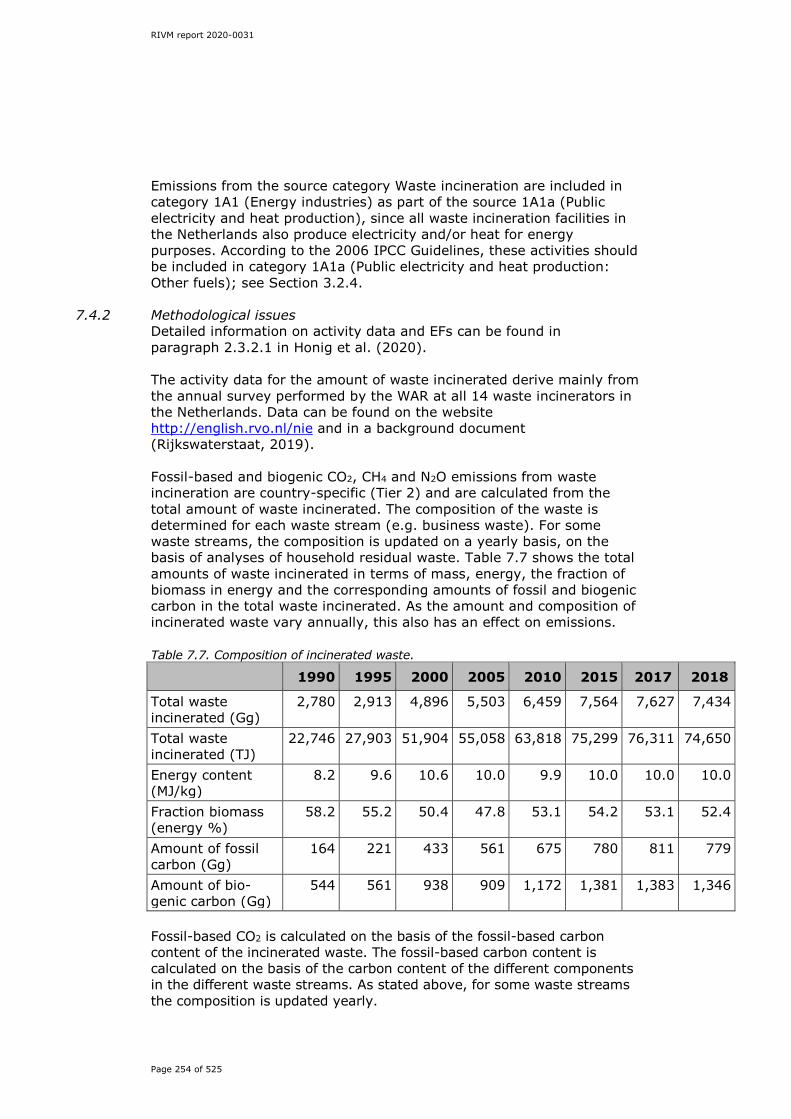
RIVM report 2020-0031
Page 254 of 525
Emissions from the source category Waste incineration are included in category 1A1 (Energy industries) as part of the source 1A1a (Public electricity and heat production), since all waste incineration facilities in the Netherlands also produce electricity and/or heat for energy purposes. According to the 2006 IPCC Guidelines, these activities should be included in category 1A1a (Public electricity and heat production: Other fuels); see Section 3.2.4.
7.4.2 Methodological issues Detailed information on activity data and EFs can be found in paragraph 2.3.2.1 in Honig et al. (2020). The activity data for the amount of waste incinerated derive mainly from the annual survey performed by the WAR at all 14 waste incinerators in the Netherlands. Data can be found on the website http://english.rvo.nl/nie and in a background document (Rijkswaterstaat, 2019). Fossil-based and biogenic CO2, CH4 and N2O emissions from waste incineration are country-specific (Tier 2) and are calculated from the total amount of waste incinerated. The composition of the waste is determined for each waste stream (e.g. business waste). For some waste streams, the composition is updated on a yearly basis, on the basis of analyses of household residual waste. Table 7.7 shows the total amounts of waste incinerated in terms of mass, energy, the fraction of biomass in energy and the corresponding amounts of fossil and biogenic carbon in the total waste incinerated. As the amount and composition of incinerated waste vary annually, this also has an effect on emissions. Table 7.7. Composition of incinerated waste.
1990 1995 2000 2005 2010 2015 2017 2018
Total waste incinerated (Gg)
2,780 2,913 4,896 5,503 6,459 7,564 7,627 7,434
Total waste incinerated (TJ)
22,746 27,903 51,904 55,058 63,818 75,299 76,311 74,650
Energy content (MJ/kg)
8.2 9.6 10.6 10.0 9.9 10.0 10.0 10.0
Fraction biomass (energy %)
58.2 55.2 50.4 47.8 53.1 54.2 53.1 52.4
Amount of fossil carbon (Gg)
164 221 433 561 675 780 811 779
Amount of bio-genic carbon (Gg)
544 561 938 909 1,172 1,381 1,383 1,346
Fossil-based CO2 is calculated on the basis of the fossil-based carbon content of the incinerated waste. The fossil-based carbon content is calculated on the basis of the carbon content of the different components in the different waste streams. As stated above, for some waste streams the composition is updated yearly.
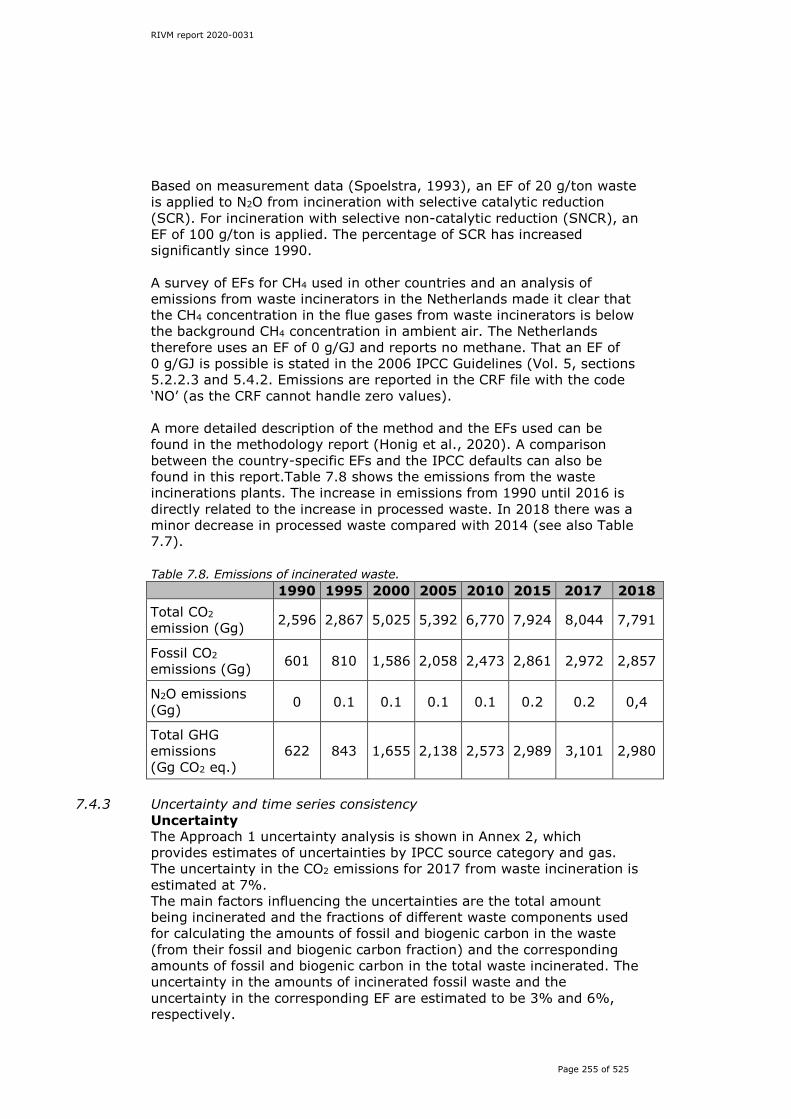
RIVM report 2020-0031
Page 255 of 525
Based on measurement data (Spoelstra, 1993), an EF of 20 g/ton waste is applied to N2O from incineration with selective catalytic reduction (SCR). For incineration with selective non-catalytic reduction (SNCR), an EF of 100 g/ton is applied. The percentage of SCR has increased significantly since 1990. A survey of EFs for CH4 used in other countries and an analysis of emissions from waste incinerators in the Netherlands made it clear that the CH4 concentration in the flue gases from waste incinerators is below the background CH4 concentration in ambient air. The Netherlands therefore uses an EF of 0 g/GJ and reports no methane. That an EF of 0 g/GJ is possible is stated in the 2006 IPCC Guidelines (Vol. 5, sections 5.2.2.3 and 5.4.2. Emissions are reported in the CRF file with the code ‘NO’ (as the CRF cannot handle zero values). A more detailed description of the method and the EFs used can be found in the methodology report (Honig et al., 2020). A comparison between the country-specific EFs and the IPCC defaults can also be found in this report.Table 7.8 shows the emissions from the waste incinerations plants. The increase in emissions from 1990 until 2016 is directly related to the increase in processed waste. In 2018 there was a minor decrease in processed waste compared with 2014 (see also Table 7.7). Table 7.8. Emissions of incinerated waste. 1990 1995 2000 2005 2010 2015 2017 2018 Total CO2 emission (Gg) 2,596 2,867 5,025 5,392 6,770 7,924 8,044 7,791
Fossil CO2 emissions (Gg) 601 810 1,586 2,058 2,473 2,861 2,972 2,857
N2O emissions (Gg) 0 0.1 0.1 0.1 0.1 0.2 0.2 0,4
Total GHG emissions (Gg CO2 eq.)
622 843 1,655 2,138 2,573 2,989 3,101 2,980
7.4.3 Uncertainty and time series consistency
Uncertainty The Approach 1 uncertainty analysis is shown in Annex 2, which provides estimates of uncertainties by IPCC source category and gas. The uncertainty in the CO2 emissions for 2017 from waste incineration is estimated at 7%. The main factors influencing the uncertainties are the total amount being incinerated and the fractions of different waste components used for calculating the amounts of fossil and biogenic carbon in the waste (from their fossil and biogenic carbon fraction) and the corresponding amounts of fossil and biogenic carbon in the total waste incinerated. The uncertainty in the amounts of incinerated fossil waste and the uncertainty in the corresponding EF are estimated to be 3% and 6%, respectively.
RIVM report 2020-0031
Page 256 of 525
The uncertainty in annual N2O emissions from waste incineration is estimated at 71%. The uncertainty in the activity data and the uncertainty in the corresponding EF for N2O are estimated to be less than 0.5% and 71%, respectively. For a more detailed analysis of these uncertainties, see Rijkswaterstaat (2014).
The reporting on waste incineration under 5C has been extended since the NIR 2019 with an additional source: bonfires. Uncertainties in the related emissions (both CH4 and N2O) are high: over 300%. This relates to uncertainties in activity data as well as in EFs: estimated at 100% and 300%, respectively, for both gases. Time series consistency Consistent methodologies have been used throughout the time series for this source category. Time series consistency of the activity data is considered to be very good, due to the continuity of the data provided by the WAR.
7.4.4 Category-specific QA/QC and verification The source categories are covered by the general QA/QC procedures, which are discussed in Chapter 1, and the specific QA/QC described in the document for the QA/QC of outside agencies (Wever, 2011).
7.4.5 Category-specific recalculations There are no category specific recalculations.
7.4.6 Category-specific planned improvements In 2018, potential improvements for this category (in coherence with the categories Solid waste disposal on land and Other waste handling) were investigated. Due to the prioritising of all possible improvements in the Dutch inventory, however, none of the Waste improvements was selected to be carried out.
7.5 Wastewater handling (5D) 7.5.1 Category description
This source category includes emissions from industrial wastewater, domestic (urban) wastewater and septic tanks. In 2018, only 0.5% of the Dutch population was not connected to a closed sewer system, and these households were obliged to treat wastewater in a small scale on-site treatment system (a septic tank or a more advanced system). In 2018, urban wastewater (the mixture of domestic, industrial and commercial wastewater, including urban run-off) was treated aerobically in 323 public wastewater treatment plants (WWTPs). The treatment of the resulting wastewater sludges is accomplished mainly by anaerobic digesters. During wastewater treatment, the biological breakdown of degradable organic compounds (DOC) and nitrogen compounds can result in CH4 and N2O emissions. Incidental venting of biogas also leads to CH4 emissions. As 0.5% of the resident population is still connected to a septic tank, CH4 emissions from septic tanks are also calculated, but these are very small compared with those from public WWTPs. The discharge of effluents, as well as other direct discharges from households and companies, result in indirect N2O emissions from surface

RIVM report 2020-0031
Page 257 of 525
water due to the natural breakdown of residual nitrogen compounds. The source category also includes CH4 emissions from the operational anaerobic industrial WWTPs (IWWTPs) (2018: 52 plants). N2O emissions from the wastewater treatment (see Tables 7.1 and 7.9) contributed about 0.9% of total N2O emissions in 2018 and 0.04% in total CO2-equivalent emissions. During the period 1990–2018 N2O emissions from wastewater handling and effluents decreased by 56.5%. This decrease is mainly the result of lower untreated discharges, resulting in lower effluent loads (see Table 7.10) and a subsequent decrease in (indirect) N2O emissions from domestic and industrial effluents. The contribution of wastewater handling to the national total of CH4 emissions in 2018 was 1.3%, or 0.1% of total CO2 equivalents. Since 1994, CH4 emissions from public WWTPs have decreased due to the introduction in 1990 of a new sludge stabilisation system in one of the largest WWTPs. As the operation of the plant took a few years to optimise, venting emissions were higher in the introductory period (1991–1994) than under subsequent normal operating conditions. During the period 1990–2018 CH4 emissions from wastewater handling decreased by 28.3%. The amount of wastewater and sludge being treated does not change much over time. Therefore, the annual changes in methane emissions can be explained by varying fractions of methane being vented incidentally instead of flared or used for energy purposes. It should be noted that non-CO2 emissions from the combustion of biogas at wastewater treatment facilities are allocated to category 1A4 (Fuel combustion – other sectors) because this combustion is partly used for heat or power generation at the treatment plants Table 7.9 shows the trend in GHG emissions from the different types of wastewater handling. Table 7.9. Wastewater handling emissions of CH4 and N2O (Gg/year). 1990 2000 2010 2015 2017 2018 CH4 domestic wastewater1) 8.13 6.88 7.40 7.36 7.97 7.87 CH4 industrial wastewater 0.29 0.39 0.38 0.38 0.38 0.42 CH4 septic tanks 3.93 1.99 0.68 0.63 0.56 0.57 Net CH4 emissions 12.35 9.25 8.46 8.37 8.91 8.85 CH4 recovered2) and/or flared 33.0 40.6 40.0 44.4 49.1 47.1
N2O domestic WWTP 0.076 0.076 0.079 0.082 0.085 0.084 N2O effluents 0.501 0.302 0.174 0.168 0.167 0.167 Total N2O emissions 0.577 0.378 0.253 0.250 0.251 0.251 1) Including emissions caused by venting of biogas at public WWTPs. 2) Used for energy purposes on site at public WWTPs and/or flared, so excludes CH4 in external delivered biogas and vented amounts.
7.5.2 Methodological issues Activity data and EFs Most of the activity data on wastewater treatment is collected by the CBS via yearly questionnaires that cover all public WWTPs as well as all anaerobic IWWTPs, and is presented in StatLine (CBS, 2019a); see also www.statline.nl for detailed statistics on wastewater treatment.
RIVM report 2020-0031
Page 258 of 525
Table 7.10 shows the development in the main activity data with respect to domestic wastewater treatment as well as industrial wastewater treatment and septic tanks. Due to varying weather conditions, the volumes of treated wastewater and of the total load of DOC of domestic wastewater can fluctuate from year to year, depending on the amount of run-off rainwater that enters the sewerage systems. In the method developed for calculating methane emissions, the DOC (or total organics in wastewater, TOW) is based on an organic load expressed in terms of chemical oxygen demand (COD). In the calculation of the COD of sewage sludge, the average content of 1.4 kg COD per kg organic dry solids is used (STOWA, 2014). Organic dry solids weights are determined by measurements of sewage sludge at all public WWTPs. These data are inventoried by the CBS. From Table 7.10 it can be concluded that the DOC of treated domestic wastewater and sludge does not change significantly over time. Therefore, inter-annual changes in CH4 emissions can be explained by varying fractions of CH4 being vented instead of flared or used for energy purposes. The total amount of recovered biogas has increased steadily over the last few years, because a larger fraction of sludge is digested. Emissions from the source category Septic tanks have steadily decreased since 1990. This can be explained by the increased number of households connected to the sewerage system in the Netherlands (and therefore no longer using septic tanks; see Table 7.10). Total direct discharges of N have also decreased steadily, due to improved wastewater treatment and prevention measures. Detailed information on activity data and EFs can be found in paragraph 2.3.2.4 of Honig et al. (2020). In general, emissions are calculated according to the 2006 IPCC Guidelines, with country-specific activity data.

RIVM report 2020-0031
Page 259 of 525
Table 7.10. Activity data of domestic and industrial wastewater handling. Unit 1990 2000 2010 2015 2017 2018
Domestic (urban) WWTPs: Treated volume Mm3/yr 1,711 2,034 1,934 1,957 1,928 1,771 TOW as COD1) Gg/year 933 921 953 999 1,021 1,016 Sludge organic dry solids2) Gg/year 260 308 340 360 364 359 Sludge DOC as COD1)2) Gg/year 365 431 476 505 509 502 Biogas recovered 3) mio m3/yr 74 87.9 98.5 107.0 116.8 116.1 Biogas flared 1,000 m3/yr 8,961 6,150 7,360 7,405 12,717 11,278 Biogas vented 1,000 m3/yr 2,524 284 1,066 82.3 678.3 238.0 Actual PE load WWTP4) 1,000 23,798 23,854 24,745 25,686 26,427 26,394
IWWTPs: TOW as COD1) Gg/year 144 194 192 190 192 209 Total biogas converted5) TJ/year 468 974 2,900 5,320 5,496 5,584
Septic tanks: Resident population 6) 1,000 14,952 15,926 16,615 16,940 17,133 17,223 inhabitants with septic tank % of pop. 4 1.9 0.62 0.57 0.50 0.50
Direct discharges of nitrogen: Nitrogen in effluents7), total Gg/yr 63.79 38.45 22.13 21.35 22.11 21.23 Via effluents from UWWTP8) Gg/yr 42.68 30.44 17.69 17.05 17.16 16.28 Via industrial discharges Gg/yr 12.71 4.51 2.36 2.29 2.19 2.19 Via other direct discharges Gg/yr 8.40 3.51 2.07 2.01 2.76 2.76
1) Chemical oxygen demand. 2) Primary and secondary sludge produced, before eventual sludge digestion. 3) Sum of measured biogas, total for energy conversion, flaring, venting and external deliveries. 4) PE = Pollution Equivalents, representing the total load of biodegradable substances in the mixture of domestic and industrial wastewater treated in urban WWTPs (UWWTPs). 5) Total amount of biogas from anaerobic IWWTPs as well as other biomass fermentation within industries, converted into energy. Flared amounts are not included. 6) Average population over a year. 7) Sum of domestic and industrial discharges of N in wastewater to surface water. 8) Including discharges from combined sewer overflows and storm water sewers.
Editor
Align with indents above.
RIVM report 2020-0031
Page 260 of 525
CH4 emissions from domestic wastewater treatment (5D1) In 2018, 99.5% of the population was connected to closed sewer systems, which were in turn connected to 323 public WWTPs. All public WWTPs in the Netherlands are of the advanced aerobic treatment type. In addition, in larger plants sludge digestion is carried out. For the category 5D1 (Domestic wastewater treatment), CH4 emissions from three types of processes are calculated:
1. Wastewater treatment process emissions: Although according to IPCC (2006) methane emissions from advanced aerobic WWTPs are zero, small amounts of methane can be formed during certain wastewater treatment process steps and there can be small emissions from the influent cellars, anaerobic zones created for phosphorus removal and anaerobic pockets in zones with poor aeration, for example.
2. Anaerobic sludge digestion emissions: In addition to the methane that is recovered and used for energy processes, uncontrolled CH4 emissions can arise from sludge (post-)thickeners, sludge silos and the digesters.
3. Emissions from incidental venting of biogas: The incidental venting of biogas produced in anaerobic sludge digesters is also a source of CH4 emissions.
Detailed information on activity data and EFs can be found in paragraphs 2.3.2.4.2 and 2.3.2.4.3 in Honig et al. (2020). The calculation of emissions from these processes is described below. 1. Wastewater treatment process emissions Methane emissions from the wastewater treatment process are calculated using the B0 from the 2006 IPCC Guidelines, a country-specific MCF and country-specific data for the TOW and sludge produced. The country-specific activity data on the influent COD, as well as the amounts of sludge produced in all public WWTPs, are derived from the yearly survey conducted by the CBS among the Water Boards. Data on influent COD are available for the years 1990 until the present for every treatment plant. Data on sludge produced are available on an annual basis for the years 1990 until 2016. Due to a re-evaluation of the statistical programme these data in future will only be inventoried for the even years. For odd years (starting 2017) the data of the previous year will be used as a best estimate; see also paragraph 2.3.2.4.2 in Honig et al. (2020). The COD of sludge is calculated using the conversion factor 1.4 kg COD per kg organic solids (STOWA, 2014). Organic solids are calculated as total dry solids minus the inorganic fraction. The total dry solids are measured at each public WWTP; the inorganic fraction is calculated on the basis of measurements of the ash content. Table 7.10 gives the time series of the values of influent COD, organic solids weight of sludge and sludge COD.
RIVM report 2020-0031
Page 261 of 525
2. Anaerobic sludge digestion emissions Emissions of CH4 from sludge digesters and related process steps (e.g. post-thickening) are calculated using a country-specific method based on an EF per m3 biogas recovered in the sludge digesters. The emissions are calculated per WWTP with sludge digestion facilities. In 2018, 73 urban WWTPs (UWWTPs) were equipped with sludge digesters. See also paragraph 2.3.2.4.2 in Honig et al. (2020). Country-specific activity data on the volume of recovered biogas in all public WWTPs with sludge digesters are derived from the yearly survey conducted by the CBS among the Water Boards. Data are available for the years 1990 until the present for every treatment plant. 3. Emissions from incidental venting of biogas Incidental venting of biogas at public WWTPs is recorded by the plant operators and subsequently reported to the CBS. In 2018, the amount of CH4 emitted by the venting of biogas was 0.110 Gg CH4, equalling 1.4% of total CH4 emissions from the category Domestic wastewater. During the last decade, this value varied between 1% and 9%, which means that the venting of biogas in 2018 was low. Recovered biogas is largely used for energy generation purposes, but a small amount is flared, vented or delivered to third parties. Table 7.9 provides data on the recovery of CH4 (total) and CH4 combusted via flaring. See also paragraph 2.3.2.4.3 in Honig et al. (2020). CH4 emissions from industrial wastewater treatment (5D2) In the calculation of methane emissions from anaerobic industrial wastewater treatment, the Netherlands uses the default IPCC parameters for the EF and country-specific activity data for the TOW as well as a country-specific fraction for losses of methane by leakage. Recovered biogas is generally used as fuel in energy processes. Emissions from biogas combustion are included in the Energy sector. A more detailed description of the method and the EFs used can be found in paragraph 2.3.2.4.5 of Honig et al. (2020). In the Netherlands no information is available on the actual load of COD that is treated in the IWWTPs. The TOW thus has to be determined in an alternative way. The TOW is estimated by using statistics on the design capacity of the IWWTPs and an assumed average loading rate of 80% of the design capacity (Oonk, 2004). The design capacity is expressed in terms of a standardised value for quantifying organic pollution in industrial wastewater: Pollution Equivalents (PE). One PE equals an amount of 40 kg COD per year. Data on the design capacity is available from the CBS (2018). Table 7.9 provides the time series of total TOW for IWWTPs. In 2018, 65% of the anaerobic capacity was installed within the food and beverage industry. Other sectors with anaerobic wastewater treatment are waste processing facilities (15%), the chemical industry (15%) and the paper and cardboard industry (4.5%).
RIVM report 2020-0031
Page 262 of 525
The activity data and CH4 emissions for 2018 are mainly a copy of the 2017 values but have been corrected using information on closed and/or newly started anaerobic WWTPs. Since 2017, the inventory on industrial wastewater treatment is no longer continued. Information on existing anaerobic WWTPs is no longer updated on a regular basis. No numerical estimate of the recovered CH4 in anaerobic industrial wastewater treatment plants available (response to review question) No numerical estimate of the CH4 recovered from anaerobic IWWTPs is available (response to review question). Statistics Netherlands currently has data on total biogas produced within biomass fermentation plants, including anaerobic WWTPs, but in these statistics no distinction is made in the type of substrate or type of installation. So biogas recovery at anaerobic IWWTPs cannot be quantified separately (see also Section 7.5.4). In 2018, the total biogas converted into energy from biomass fermentation by industrial companies equals 5,584 TJ. It is not known which part stems from anaerobic industrial wastewater treatment. During the next inventory (2019 data; 2021 submission) it will be investigated whether data on biogas production from anaerobic wastewater treatment plants can be derived or estimated from information becoming available via the individual Annual Emission (ePRTR) Reports. CH4 emissions from septic tanks (5D3) Emissions of methane from septic tanks are calculated using IPCC default values for B0 and MCF and the IPCC value of TOW of 60 g BOD (biological oxygen demand) per connected person per day (IPCC, 2006: Table 6.4). Detailed information on activity data and EFs can be found in paragraph 2.3.2.4.4 of Honig et al. (2020). Table 7.10 shows the time series of the percentage of the population connected to septic tanks. The percentage of the population connected to septic tanks decreased from 4% in 1990 to 0.5% in 2018. These data derive from surveys and estimates by various organisations in the Netherlands, such as Rioned (2009, 2016) and the National Water Authorities. N2O emissions from centralized wastewater treatment (5D1) N2O emissions from domestic wastewater handling are determined on the basis of the IPCC default EF of 3.2 g N2O/person/year and country-specific activity data for the number of people connected, including the extra fraction of industrial and commercial wastewater. This is determined by the number of Pollution Equivalents (PEs). Rationale for using the Pollution Equivalent (PE) as activity data (response to review question) PEs, as measured and reported by all UWWTPs, reflect the total amount of organic degradable matter that is treated in the plants. 1 PE equals the wastewater (and degradable substances in it) from one person. Its basis and method of calculation are anchored in Dutch water laws.
RIVM report 2020-0031
Page 263 of 525
As the PE is calculated from influent data on COD and Kjeldahl nitrogen, it includes the loads from industrial and commercial activities as well as loads from urban run-off into the sewerage system. In formula 6.9, box 6.1 of the 2006 IPCC Guidelines, the total PE thus can replace the terms P*TPLANT*FIND−COM. For example, the PE value for 2018 is 26.4 million. With an average population of 17.2 million, this means that 9.2 million PE comes from industrial and commercial sources and urban run-off. With TPLANT is almost 1, FIND−COM in 2018 is approximately equal to 1.5. A description of the calculation of PE, the method and the EF used can also be found in paragraph 2.3.2.4.2 of Honig et al. (2020). Table 7.10 provides a time series of the PE. In 2018, the total PE equalled 26.4 million. As wastewater treated at public WWTPs is a mixture of household wastewater, (urban) run-off rainwater and wastewater from industries and services, the N2O emissions are reported under category 5D1 (Domestic and commercial wastewater). Indirect N2O emissions from surface water as a result of discharge of domestic and industrial effluents (5D3, Wastewater effluents) For the calculation of indirect N2O emissions from wastewater effluents, the Netherlands uses the default EF of 0.005 kg N2O-N/kg N discharged (IPCC, 2006) and country-specific activity data. The country-specific activity data on kg N discharged per year via industrial, domestic and commercial effluents is derived from the Netherlands’ Emissions Inventory System. Rationale for country-specific activity data and not using the ‘Note’ in box 6.1 in 2006 IPCC Guidelines (response to 2016 review question) For calculating indirect (or better: ‘delayed’) N2O emissions from wastewater treatment effluent, the Netherlands uses country-specific activity data on the total N discharged to surface water via effluents of UWWTP, combined sewer overflows, plus industrial effluents and other direct discharges to surface water. The Netherlands does not make use of equation 6.8 of the 2006 IPCC Guidelines. Hence, information on population, protein consumption, fraction of nitrogen in protein, FNON-CON, FIND-COM and TPLANT values are reported as ‘NA’ in the additional information table of CRF Table 5.D. The use of equation 6.8 might result in an overestimation of N effluent, because FAO statistics seem to be based on protein supply data and might also include amounts not being consumed (e.g. food waste) and consequently not being discharged to wastewater. Instead, the Netherlands has chosen to use activity data derived from other sources, such as statistical surveys, environmental reporting and models, often based on actual measurements. These data are inventoried yearly via the national emission inventory system, in which several agencies and institutes work together. The data include loads of N in (1) effluents of all UWWTPs, (2) direct discharges from companies and households (via septic tanks), (3)

RIVM report 2020-0031
Page 264 of 525
other estimated wastewater discharges such as those from combined sewer overflows. As a consequence of using these data, the Netherlands does not take into account the Note in box 6.1 of IPCC (2006). The discharges of N already represent ‘end of pipe’ values, so an adjustment for amounts of N related to emissions resulting from nitrification/dentrification processes in advanced centralised wastewater treatment is not needed. Detailed information on activity data and EFs can be found in paragraph 2.3.2.4.6 of Honig et al. (2020). Table 7.10 provides a time series of the activity data: total N discharges. Emissions not calculated within category 5D Within category 5D the following emissions are not calculated (NE) or not occurring (NO): N2O emissions from industrial wastewater treatment (5D2: NE) The 2006 IPCC Guidelines do not provide a method for calculating N2O emissions from industrial sources, except for industrial wastewater that is co-discharged with domestic wastewater into the sewerage system. N2O emissions from industrial sources are believed to be insignificant in comparison with emissions from domestic wastewater. In the Netherlands most industries discharge their wastewater into the sewerage system/WWTPs (emissions included in 5D1). Indirect emissions from surface water resulting from the discharge of wastewater effluents are already included under 5D3 (Other, wastewater effluents). Direct N2O emissions from septic tanks (5D3: NO) Direct emissions of N2O from septic tanks are not calculated since they are unlikely to occur, given the anaerobic circumstances in these tanks. Indirect N2O emissions from septic tank effluents are included in CRF category 5D3 (Indirect N2O emissions from surface water as a result of discharge of domestic and industrial effluents). CH4 emissions from industrial sludge treatment (5D2: NE) From a recent survey among IWWTPs conducted by the CBS it can be concluded that anaerobic sludge digestion within industries is not significant. These data are not published on www.cbs.statline.nl for reasons of confidentiality. Forthcoming CH4 emissions are therefore not estimated (NE). It is likely, however, that these emissions are a very minor source and can be neglected.
7.5.3 Uncertainty and time series consistency Uncertainty The Approach 1 uncertainty analysis shown in Annex 2 provides estimates of uncertainties by IPCC source category and gas. The uncertainty in annual CH4
and N2O emissions from wastewater handling is estimated to be 38% and 102%, respectively. The uncertainty in activity data is based on expert judgement and is estimated to be >20%. The yearly loads of DOCinfluent, DOCsludge Ninfluent and Neffluent are calculated on the basis of wastewater and sludge sampling and analysis, as well as flow measurements at all WWTPs; all these measurements can involve uncertainty.
RIVM report 2020-0031
Page 265 of 525
The uncertainty in the EFs for CH4 and N2O is estimated to be 32% and 100%, respectively. An international study (GWRC, 2011), in which the Dutch public wastewater sector participated, showed that N2O EFs, in particular, are highly variable among WWTPs as well as at the same WWTP during different seasons or even at different times of day. In fact, the same study concluded that the use of a generic EF (such as the IPCC default) to estimate N2O emissions from an individual WWTP is inadequate; but at the same time the study provides no alternative method, except the recommendation that GHG emissions from an individual WWTP can be determined only on the basis of continuous measurements over the whole operational range of the WWTP (GWRC, 2011). The results of this study, therefore, provide no starting point from which to improve the method for estimating CH4 and N2O emissions and the related uncertainty. Time series consistency The same methodology has been used to estimate emissions for all years, thereby providing good time series consistency. The time series consistency of the activity data is very good due to the continuity in the data provided by the CBS.
7.5.4 Category-specific QA/QC and verification The source categories are covered by the general QA/QC procedures, as discussed in Chapter 1. Statistical data are covered by the specific QA/QC procedures of the CBS. For annual CH4 and N2O emissions from domestic and commercial wastewater handling, the results of a study by GWRC (2011) neither support nor reject the use of current methods (see also Section 7.5.3). The Dutch wastewater sector will continue research into determining more precisely the factors and circumstances that lead to the formation of CH4 and N2O in public WWTP. In the last four reviews it was recommended that future NIRs should include an estimate of biogas recovery at anaerobic IWWTPs. This will not be possible, at least not this submission. The CBS has data on total biogas recovery from biomass fermentation plants, including anaerobic WWTPs, but in the statistics no distinction is made in the type of substrate or type of installation. During the next inventory (2019 data; 2021 submission) it will be investigated whether data on biogas production from anaerobic wastewater treatment plants can be derived or estimated from information becoming available via the individual Annual Emission (ePRTR) Reports. It should, however, be noted that this data source might not cover all industrial anaerobic WWTPs.
7.5.5 Category-specific recalculations Due to final activity data on total N discharges in 2016 and 2017, indirect N2O emissions from surface water as a result of the discharge of domestic and industrial effluents (5D3, Wastewater effluents) increased for these years. This increase is 0.0036 Gg N2O (+2.1%) for 2016 and 0.0071 Gg N2O (+4.1%) for 2017, compared with the previous submission.
7.5.6 Category-specific planned improvements There are no category-specific improvements planned.

RIVM report 2020-0031
Page 266 of 525
RIVM report 2020-0031
Page 267 of 525
8 Other (CRF sector 6)
The Netherlands allocates all GHG emissions to sectors 1 to 5. Therefore, no sources of GHG emissions are included in sector 6.

RIVM report 2020-0031
Page 268 of 525
RIVM report 2020-0031
Page 269 of 525
9 Indirect CO2 emissions
9.1 Description of sources Methane, carbon monoxide (CO) and NMVOC emissions are oxidised to CO2 in the atmosphere. In this chapter indirect CO2 emissions as a result of this atmospheric oxidation are described. As the Netherlands already assumes 100% oxidation during the combustion of fuels, only process emissions of NMVOC (mainly from product use) are used to calculate indirect CO2 emissions. Indirect CO2 emissions originate from the use and/or evaporation of NMVOC in the following sectors:
1. Energy (Energy, Traffic and transport, and Refineries); 2. IPPU (Consumers, Commercial and governmental institutions,
Industry, and Construction and building industries); 3. Agriculture; 4. Waste.
Indirect CO2 emissions decreased from 0.92 Tg in 1990 to 0.44 Tg in 2018 as a result of the Dutch policy to reduce NMVOC emissions.
9.2 Methodological issues Indirect CO2 emissions are calculated as follows: CO2 (in Gg) = NMVOC emission (in Gg) * C * 44/12 Where: C = default IPCC carbon content (C) of 0.6 NMVOC emissions data per sector are obtained from the Dutch PRTR.
9.3 Uncertainty and time series consistency Based on expert judgement, the uncertainty in NMVOC emissions is estimated to be 25% and the uncertainty in carbon content is estimated at 10%, resulting in an uncertainty in CO2 emissions of approximately 27%. Consistent methodologies and activity data have been used to estimate indirect CO2 emissions.
9.4 Category-specific QA/QC and verification The source categories are covered by the general QA/QC procedures discussed in Chapter 1.
9.5 Category-specific recalculations There are no category-specific recalculations.
9.6 Category-specific planned improvements No improvements are planned.

RIVM report 2020-0031
Page 270 of 525
RIVM report 2020-0031
Page 271 of 525
10 Recalculations and improvements
Major recalculations and improvements compared with the National Inventory Report 2019 For the NIR 2020, the data for the most recent year (2018) have been added to the inventory and corresponding Common Reporting Format (CRF). As a result of the recommendations of the ERT review of 2019, improvements have been made to both the inventory and the NIR. These include corrections of errors in previous submissions. These have resulted in (limited) changes in emissions over the entire 1990–2017 period. Other recalculations have been performed as a result of methodical changes and/or on the basis of new, improved activity data and/or improved EFs. For details of the effects of and justification for the recalculations, see Chapters 3–8.
10.1 Explanation of and justification for the recalculations 10.1.1 GHG emissions inventory
For the NIR 2020, the Netherlands has used the CRF Reporter software v6.0.7. The ERT review 2019 of the UNFCCC suggested in its provisional main findings report of September 2019 that there was room for improvement in the Dutch GHG inventory. To the extent possible, the review recommendations have (where deemed necessary)been incorporated in this NIR and CRF; and also in the methodology reports. Besides these externally induced improvements, additional improvements have been made as a result of our own QA/QC programme:
• methodological changes and data improvements; • changes in source allocation; • error corrections.
Methodological changes and data improvements The improvements to QA/QC activities in the Netherlands implemented in past years (process of assessing and documenting methodological changes) are still in place. This process (using a brief checklist for timely discussion on likely changes with relevant experts and information users) improves the peer review and timely documentation of the background to and justification for changes made. The most significant (>0.1 kton CO2 eq.) recalculations in this submission (compared with the NIR 2019) are:
• Energy sector: o Approximately 5% of the biodiesel used in transport is of
fossil origin. As of this submission this fossil part is no longer reported as biomass but reported separately under Other

RIVM report 2020-0031
Page 272 of 525
fossil fuels. Please note that in category 1.A.2.g.vii (Off-road vehicles and other machinery) there is no possibility to report ‘other fossil fuels’, so here we used the ‘liquid fuels’ category.
o Recalculation of emissions from off-road vehicles due to improvements in the model used to calculate these emissions. The emissions decreased (in 1.A.2 and 1.A.4) over the whole time series in the order of magnitude of -34 Gg CO2 eq. In 1990 to -200 Gg CO2 eq. in 2017.
o As a result of a census on wood combustion in households, emissions from biomass in 1.A.4.b.i decreased. Emissions of N2O and CH4 decreased in the order of magnitude of -26 Gg CO2 eq. in 2017. For previous years the decrease was less. The decreased CO2 emissions do not affect the national total
• IPPU sector: o Recalculations based on a new data source for HFC emissions
from mobile air-conditioning (2.F.1) from scrapped cars as of 2003. The emissions decrease is in the range -0.08 Gg CO2 eq. HFC 134a in 2003 to -38.3 Gg CO2 eq. in 2017, compared with the latest submission.
• Agriculture sector: o The way in which the numbers of poultry are registered in the
annual census changed as of 2018. o N2O emissions from agricultural soils decreased over the
whole time series as a result of several methodological changes, related to: − fertiliser use in greenhouses; − the EF for crop residues; − an increase in N excretion for horses and ponies resulting
from new insights into food intake; − changes in the area of peat and other organic soils.
The decrease is -6.4 Gg CO2 eq. in 1990 up to -66.6 Gg CO2 eq. in 2017.
• LULUCF sector: o Extrapolation of the loss of extent of organic soils after 2014; o Corrections of EF for drained organic soils; o N2O emissions from peat under forests are now included in
the inventory. o Improved allocation of wood harvest to Forest land remaining
forest land; o New mask for the total area of the Netherlands to include
land reclaimed from the sea (Maasvlakte 2). • Waste sector:
o No methodological changes Other minor recalculations due to data improvements are described in the sectoral sections. Changes in source allocation As a result of recommendations of the 2019 review, the fossil part of biofuels is now allocated to Other fossil fuels, as described above (Methodological changes to Energy sector). Additionally, N2O emissions from Other livestock are now allocated to the different animal species in Table 3s1 of the CRF.

RIVM report 2020-0031
Page 273 of 525
Error correction and regular data improvements In general, the 2017 and in some cases 2016 figures have been updated whenever improved statistical data have become available since the last submission. This applies, for example, to the improvement of the energy statistics for 2017. The effect of this update was most prominent in category 1A.4, where CO2 emissions increased by about 100 Gg. Another example is the change in N2O emissions from Wastewater handling (cat. 5D). HFC emissions from stationary cooling for 2016 were recalculated (based on new activity data), and as these are the most recent available figures, these were also applied to the 2017 and 2018 estimates. For the NIR 2021, the Netherlands will explore options to apply a different methodology with the aim of improving the accuracy of emissions estimates in recent years. Finally, as a result of internal QA/QC procedures, corrections have been made in activity data and related emission figures (e.g. small changes in CO2 emissions (appr. -0.4 Gg CO2) from paraffin use in category 2D (Burning of candles)).
10.1.2 KP-LULUCF inventory The methodological changes in the LULUCF sector, as reported in Section 6.2, have also resulted in recalculations in the KP-LULUCF inventory. Emissions from organic soils have decreased in all activities that the Netherlands reports (AR, D and FM), due to the changes in the EF from 2004 onwards and extrapolation of the decreasing extent of organic soils from 2014 onwards. N2O emissions from potentially drained forest land are now included for AR and FM activities in CRF Table 4(KP-II)2. Improved allocation of the wood harvests to Forest land remaining forest land has resulted in changes in emissions and removals in the HWP pool under FM. This, however, has no effect on the carbon stock changes reported under FM itself. Finally, the new map mask that includes recently reclaimed land only has marginal effects in AR and D, as this is mainly a harbour and industrial zone and hardly any of the new land is related to forest land.
10.2 Implications for emissions levels 10.2.1 GHG emissions inventory
This section summarises the implications of the changes described in Section 10.1 for the emissions levels reported in the GHG emissions inventory. Table 10.1 shows the changes in emissions per relevant sector in Gg CO2 eq., compared with the 2019 submission, as a result of the recalculations. For 1990 the recalculations resulted in a decreased emission total compared with the previous submission (-0.02%). For 2017 the recalculated emissions also decreased in comparison with the previous submission (-0.47%). Only for the last 10 years of the inventory, the changes in emissions are above ±0.18% and never do they surpass ±0.5%, which means that the recalculations have had only a minor impact on the total emissions

RIVM report 2020-0031
Page 274 of 525
figures. The sectors most contributing to the emission changes in recent years were IPPU and LULUCF. As it is difficult to interpret the described changes in terms of emissions of individual gases, Table 10.2 shows the changes per gas and per sector in 1990 and 2017.

RIVM report 2020-0031
Page 275 of 525
Table 10.1: Summary of recalculations for the period 1990–2017 (Gg CO2 eq.)
Gas(es) 1990 1995 2000 2005 2010 2015 2017 CO2, CH4, N2O 1.A.1 Energy industries -2.7 -7.6 -6.6 -5.4 -4.4 -2.4 -2.4 CO2, CH4, N2O 1.A.2 Manufacturing industries
and construction -11.6 -37.0 -33.8 -43.0 -57.3 -73.5 -59.7 CO2, CH4, N2O 1.A.3 Transport -8.7 -17.9 -14.7 -23.7 4.7 17.8 66.7 CO2, CH4, N2O 1.A.4 Other sectors -23.1 -5.5 -3.5 -4.1 -10.5 -37.1 -57.8
CO2, CH4, N2O 2.D. Industrial processes -0.4 -0.2 -0.6 -0.1 -0.4 -1.0 -2.3
HFC 2.F.1 Refrigeration and Airconditioning
0.0 0.0 0.0 -0.5 -7.9 -32.4 -267.9
N2O 3.D Agricultural soils -6.4 -5.5 -5.9 -5.0 -6.0 -9.5 -66.4 CO2 3.G Liming 0.0 0.0 0.0 0.0 0.0 0.0 3.8
CO2, CH4, N2O 4 LULUCUF 0.3 2.6 -12.1 -42.7 -294.3 -544.8 -552.2
CH4 5.A Solid waste disposal 0.0 0.0 0.0 0.0 0.1 0.1 0.1
CH4, N2O 5.D Wastewater Handling 0.0 0.0 0.0 0.0 0.0 0.0 2.1
CH4, N2O 5.C Incineration and open
burning of waste 0.0 0.0 0.0 0.0 0.0 0.0 0.3
CO2 Indirect emissions 0.0 0.0 0.0 0.0 0.0 0.0 0.0 Total
difference
-52.5 -71.1 -77.3 -124.6 -376.0 -682.9 -935.6 Total emissions NIR 2019 (1) 228202.3 238091.9 225907.6 220407.4 219390.3 201657.6 199313.0 Total emissions NIR 2020 (1) 228149.8 238020.7 225830.3 220282.7 219014.3 200974.8 198377.4
(1) : including LULUCF and indirect CO2 emissions

RIVM report 2020-0031
Page 276 of 525
In relation to the above-mentioned changes (and others), figures for emissions from precursor gases changed over the entire time series. The explanation of the recalculations can be found in the IIR report (Wever et al., 2020). Table 10.2. Summary of recalculations per gas and sector (Gg CO2 eq.), 1990 and 2017.
10.2.2 KP-LULUCF inventory
The changes in the methodologies have resulted in recalculations in the whole time series. Table 10.3 shows the differences between the previous and recalculated emissions and removals. Table 10..: Summary of recalculations for KP-LULUCF 2013–2017 in Gg CO2-eq. Activity 2013 2014 2015 2016 2017 A. Article 3.3 activities A1 Afforestation and Reforestation -1.2 -1.4 -1.7 -2.0 -12.0
A2 Deforestation -2.9 -3.1 -3.5 -4.2 -7.6 B1 Forest management -11.7 -5.6 0.3 -11.0 -52.6
Total -15.9 -10.1 -4.9 -17.3 -72.2
CO2 1990 2017 1 Energy -42.72 -37.02 2 IPPU -0.35 -0.45 3 Agriculture 0.00 3.79 4 LULUCF -0.84 -553.38 5 Waste NA NA Indirect emissions 0.00 0.00 CH4 1 Energy -2.75 -18.63 2 IPPU 0.00 0.00 3 Agriculture 0.00 0.00 4 LULUCF 0.00 0.00 5 Waste 0.00 0.28 N2O 1 Energy -0.57 2.51 2 IPPU 0.00 -1.83 3 Agriculture -6.36 -66.42 4 LULUCF 1.11 1.23 5 Waste 0.00 2.26 HFCs
2 IPPU 0.00 -267.93

RIVM report 2020-0031
Page 277 of 525
10.3 Implications for emissions trends, including time series consistency
10.3.1 GHG emissions inventory The recalculations and error corrections have further improved both the accuracy and the time series consistency of the estimated emissions. Table 10.4 shows the changes made due to the recalculations for 1990, 2000, 2010 and 2017 (compared with the NIR 2019). From the table, it emerges that the recalculations changed national emissions only to a small extent (-0.2%) compared with the last NIR. Table 10.4. Differences between the NIR 2019 and NIR 2020 for the period 1990–2017 due to recalculations (Units: Tg CO2 eq.; for F-gases: Gg CO2 eq.). Gas Source 1990 2000 2010 2015 2017
CO2 [Tg] NIR 2020 169.8 178.4 187.7 171.8 169.8
Incl. LULUCF NIR 2019 169.8 178.5 188.1 172.5 170.4
Difference 0.0% 0.0% -0.2% -0.4% -0.3%
CO2 [Tg] NIR 2020 163.3 172.4 182.6 166.8 164.9
Excl. LULUCF NIR 2019 163.3 172.5 182.6 166.9 164.9
Difference 0.0% 0.0% 0.0% -0.1% 0.0%
CH4 [Tg] NIR 2020 31.8 24.3 19.4 18.2 18.0
NIR 2019 31.9 24.3 19.4 18.2 18.0
Difference 0.0% 0.0% 0.0% -0.1% -0.1%
N2O [Tg] NIR 2020 18.0 16.1 8.6 8.8 8.7
NIR 2019 18.0 16.2 8.7 8.9 8.8
Difference -0.1% -0.4% -1.2% -1.2% -1.8%
PFCs [Gg] NIR 2020 2663 1903 314 104 77
NIR 2019 2663 1903 314 104 77
Difference 0.0% 0.0% 0.0% 0.0% 0.0%
HFCs [Gg] NIR 2020 5606 4765 2661 1801 1558
NIR 2019 5606 4765 2669 1834 1826
Difference 0.0% 0.0% -0.3% -1.8% -14.7%
SF6 [Gg] NIR 2020 207 259 154 139 126
NIR 2019 207 259 154 139 126
Difference 0.0% 0.0% 0.0% 0.0% 0.0%
Total NIR 2020 228.1 225.8 219.0 201.0 198.4
[Tg CO2-eq.] NIR 2019 228.2 225.9 219.4 201.7 199.3
Incl. LULUCF Difference 0.0% 0.0% -0.2% -0.3% -0.5%
Total NIR 2020 221.7 219.8 213.7 195.9 193.3
[Tg CO2-eq.] NIR 2019 221.7 219.8 213.8 196.0 193.7
Excl. LULUCF Difference 0.0% 0.0% -0.04% -0.1% -0.2%
RIVM report 2020-0031
Page 278 of 525
10.4 Recalculations, response to the review process and planned improvements
10.4.1 GHG emissions inventory 10.4.1.1 Response to the review process
Public and peer review Drafts of the NIR are subject to an annual process of general public review and a peer review. During the public review of the draft NIR of January 2020, no specific remarks were received. The annual peer review pays special attention to a specific sector or topic and checks the report for transparency, readability and consistency with 2006 IPCC Guidelines (IPCC, 2006). In 2019, due to organisational problems, the annual peer review was postponed to May 2019. The results of this peer review, with a focus on the transport sector, are addressed in Sections 3.2.6.4 and 3.2.6.6. The peer review on the draft NIR of January 2020 (Oonk, 2020) had a focus on the emissions from waste. The review concluded that, overall, the calculations on waste emissions in the Dutch NIR 2020 are in line with the 2006 IPCC Guidelines (IPCC, 2006). More specifically, the review made suggestions for improving the justification of: DOC values for solid waste disposal on land, k-values for the rate constant of biodegradation, EFs for the biological treatment of waste, and the country-specific MCF value for estimating methane emissions from WWTPs. In some cases it was recommended to improve the time series consistency of a value or explain why specific parameters have changed over time. A suggestion was also made to exclude capped landfills from the total amount of waste, if this information is available, in order to prevent capped landfills from becoming a virtual source of emissions. Another suggestion was to estimate the amount of TOW treated in industrial wastewater treatment systems, based on the amount of COD discharged to open waters and the removal efficiency in the IWWTPs. In order to demonstrate the completeness of the inventory for solid waste disposal on land, it was recommended to add more information on this in the NIR. In addition, the peer review made recommendations for the preparations in the implementation of the 2019 Refinement. For example, for emissions from solid waste disposal additional information is required on the fraction of DOC that is highly, moderately and poorly degradable. For industrial wastewater treatment, direct and indirect N2O emissions for industrial wastewater need to be quantified. As a result of this peer review, some references were added in the final NIR in March 2020. Other recommendations will be followed up during the preparation of the NIR 2021. Peer reviews in past years have focused on the following sectors and categories:
• Transport (VITO, 2019); • Reference approach and waste incineration (CE, 2018);
RIVM report 2020-0031
Page 279 of 525
• N2O and CO2 emissions from Agriculture (Kuikman, 2017); • Energy (excluding transport) (CE Delft, 2014); • Industrial process emissions (Royal HaskoningDHV, 2013); • LULUCF (Somogyi, 2012); • Waste (Oonk, 2011); • Transport (Hanschke et al., 2010); • Combustion and process emissions in industry (Neelis and Blinde,
2009); • Agriculture (Monteny, 2008).
In general, the conclusion of these peer reviews has been that the Dutch NIR adequately describes the way that the Netherlands calculates the emissions of greenhouse gases. The major recommendations refer to the readability and transparency of the NIR and suggestions for textual improvement. UNFCCC review In early March 2020 we received the ARR report on the individual review of the 2019 inventory and NIR 2019. The findings (including recommendations from earlier reviews) can be found in Annex 10. Due to the timing of the ARR report, we were not able to address all issues in this (15 March) version of the NIR. Where possible, we will address them in the 15 April version. Note that Annex 10 only includes summaries of the recommendations in the ARR report. The full text can be found in the ARR report, via the reference number given in the first three columns of the table (Sector, ARR table number and Issue indication). Annex 10 does not include the issues which, according to the ARR report, have already been resolved. The table in Annex 10 also provides references to the sectoral sections in this NIR, the CRF tables and updated methodology reports (2020) in which the follow-up of the recommendations is detailed. The review also recommended (1) the inclusion in the NIR of more detailed information on the annual sector-specific QA/QC cycles and their results, and (2) the inclusion of confidential information in the NIR. The Netherlands will only include detailed information on the QA/QC cycle in cases where an issue was found that requires attention in the NIR. The Netherlands will not follow up on a (recurring) request to include confidential information its NIR. We have a very good, long-standing track record for the timely and correct provision of such information to the review team during the UNFCCC reviews.
10.4.1.2 Completeness of NIR The Netherlands’ GHG emission inventory includes all sources identified by the revised Intergovernmental Panel on Climate Change (IPCC) Guidelines (IPCC, 2006), with the exception of the following, very minor, sources:
• CO2 from asphalt roofing (2A4d), due to missing activity data; • CO2 from road paving (2A4d), due to missing activity data; • CH4 from enteric fermentation in poultry (3A4), due to missing EFs; • N2O from industrial wastewater treatment (5D2) and septic tanks
(5D3), due to missing method and negligible amounts;

RIVM report 2020-0031
Page 280 of 525
• Part of CH4 from industrial wastewater (5D2 sludge), due to negligible amounts;
• Precursor emissions (i.e. CO, NOx, NMVOC) and SO2) from memo item ‘International bunkers’ (international transport), as these emissions are not part of the national total.
For more detailed information on this issue, see Annex 6.
10.4.1.3 Completeness of CRF tables Since the Industrial processes source categories in the Netherlands often relate to only a few companies, it is generally not possible to report detailed and disaggregated data. Activity data are confidential and not reported when a source category comprises three or fewer companies. During (in-country) reviews, however, these data will be made available to the ERT, on request.
10.4.1.4 Planned improvements The Netherlands’ National System was established at the end of 2005, in line with the requirements of the Kyoto Protocol and the EU Monitoring Mechanism, as a result of the implementation of a monitoring improvement programme (see Section 1.6). The conclusion of the initial review (2007) was that the Netherlands’ National System had been established in accordance with the guidelines for National Systems set out in Article 5, section 1 of the Kyoto Protocol (decision 19/CMP.1) and that it met the requirements for the implementation of the general functions of a National System, as well as the specific functions of inventory planning, inventory preparation and inventory management. The latest UNFCCC review of the inventory in September 2019 confirmed that the Netherlands’ inventory and inventory process are still in line with the rules for National Systems. Monitoring improvement The National System includes an annual evaluation and improvement process. The evaluation is based on experience in previous years and the results of UN and EU reviews, peer reviews and audits. Where needed, improvements are included in the annual update of the QA/QC programme (RVO, 2019). QA/QC programme The QA/QC programme for this year (RVO, 2019) continues the assessment of long-term improvement options based on the consequences of the 2006 IPCC Guidelines on reporting from 2015 onwards. Improvement actions for new methodologies and changes of EF will be performed in 2020 and are governed by the annual Work Plan.
10.4.2 KP-LULUCF inventory A new forest inventory (NFI-7) has begun and will provide results by 2021. Results will be included in the NIR 2022.

RIVM report 2020-0031
Page 281 of 525
Part ll: Supplementary information required under Article 7, paragraph 1
RIVM report 2020-0031
Page 282 of 525

RIVM report 2020-0031
Page 283 of 525
11 KP-LULUCF
11.1 General information 11.1.1 Definition of forest and any other criteria
In its Initial Report for the first commitment period, the Netherlands identified the single minimum values under Article 3.3 of the Kyoto Protocol. Following Annex 1 to Decision 2/CMP.8, these values are also to be used during the second commitment period of the Kyoto Protocol. The complete forest definition the Netherlands uses for Kyoto reporting is: ‘Forest is land with woody vegetation and with tree crown cover of more than 20% and area of more than 0.5 ha. The trees should be able to reach a minimum height of 5 m at maturity in situ. They may consist either of closed forest formations where trees of various storeys and undergrowth cover a high proportion of the ground, or open forest formations with a continuous vegetation cover in which tree crown cover exceeds 20%. Young natural stands and all plantations established for forestry purposes which have yet to reach a crown density of 20% or tree height of 5 m are included under forest as areas normally forming part of the forest area which are temporally un-stocked as a result of human intervention or natural causes but which are expected to revert to forest. Forest land also includes:
• forest nurseries and seed orchards that constitute an integral part of the forest;
• roads, cleared tracts, firebreaks and other small open areas, all narrower than 6 m, within the forest;
• forests in national parks, nature reserves and other protected areas, such as those of special environmental, scientific, historical, cultural or spiritual interest, with an area of more than 0.5 ha and a width of more than 30 m;
• windbreaks and shelter belts of trees with an area of more than 0.5 ha and a width of more than 30 m.
This definition excludes tree stands in agricultural production systems; for example, in fruit plantations and agro-forestry systems’. This definition is in line with FAO reporting since 1984 and within the ranges set by the Kyoto Protocol. The definition also matches the category Forest land in the inventory under the Convention on Climate Change (Chapter 6 of this NIR, and Arets et al., 2020). During the second commitment period of the Kyoto Protocol this definition will also apply to the Forest Management activity under Article 3.4 of the Kyoto Protocol. Under UNFCCC reporting (Chapter 6) a sub-category Trees outside forests (TOF) is included under Grassland. TOF consists of units of land with trees that do not meet the minimum area requirement for the forest definition. Conversions from TOF to Forest land are included under Afforestation and reforestation (AR), while conversions from Forest land to TOF are included under Deforestation (D).
RIVM report 2020-0031
Page 284 of 525
11.1.2 Elected activities under Article 3, paragraph 4 of the Kyoto Protocol The Netherlands has not elected any other activities to include under Article 3, paragraph 4 of the Kyoto Protocol.
11.1.3 Description of how the definitions of each activity under Article 3.3 and each mandatory and elected activity under Article 3.4 have been implemented and applied consistently over time Units of land subject to Article 3.3 Afforestation and Reforestation (AR) are reported jointly and are defined as units of land that did not comply with the forest definition on 1 January 1990 but did so at any moment before 31 December 2018. Land is classified as re/afforested as long as it complies with the forest definition. Units of AR land that are deforested again later will be reported under Article 3.3 Deforestation from that point in time onwards. Units of land subject to Article 3.3 Deforestation (D) are defined as units of land that did comply with the forest definition on or after 1 January 1990 but ceased to comply with this definition at any moment in time after 1 January 1990. Once land is classified as deforested (D) land, it remains in this category, even if it is subsequently reforested and thus complies with the forest definition again. Units of land subject to Article 3.4 Forest Management (FM) are units of land meeting the definition of forest that are managed for stewardship and use of forest land and that have not been classified under AR or D. Here, the Netherlands applies the broad interpretation of FM. As a result, all Forest land under the UNFCCC that is not classified as AR or D land will be classified as FM land. Further, since all Forest land in the Netherlands is considered to be managed land, and conversions from other land uses to Forest land are always human-induced, such conversions to Forest land will always be reported under AR. For each individual pixel, an overlay of land use maps shows all mapped land use changes since 1990. All these are taken into account to ensure that AR land remains AR land unless it is deforested and that D land remains D land, even when it is later reconverted to forest land. CRF Table 4(KP-I)A.2 provides the information for D land disaggregated for the land use categories in the reporting year, including forest land, i.e. units of land that were reforested after earlier deforestation.
11.1.4 Description of precedence conditions and/or hierarchy among Article 3.4 activities and how they have been consistently applied in determining how land was classified This is not applicable, as besides the mandatory activity Forest Management, no Article 3.4 activities have been elected.
11.2 Land-related information 11.2.1 Spatial assessment unit used for determining the area of the units of
land under Article 3.3 and Article 3.4 The Netherlands applies complete and spatially explicit land use mapping that allows for geographical stratification at 25 m x 25 m (0.0625 ha) pixel resolution (Kramer et al., 2009). This corresponds with the wall-to-wall approach used for reporting under the Convention,

RIVM report 2020-0031
Page 285 of 525
i.e. approach 3 in chapter 3 of the 2006 IPCC Guidelines, and is described as reporting method 2 in the 2013 IPCC KP Guidance (IPCC, 2014: para. 2.2.2). AR, D and FM activities are recorded on a pixel basis. The status of each pixel is monitored over the full time series. Any group of pixels changing from non-compliance to compliance with the forest definition is treated as reforestation/afforestation. In order to comply with the forest definition a group of clustered pixels should together cover at least 0.5 ha. As a result, one pixel changing from non-forest to forest without connection to other forest pixels does not result in afforestation, but changes to TOF. On the other hand, one pixel changing to forest that is connected to other forested pixels that together cover an area smaller than 0.5 ha (i.e. classified as TOF) may result in the whole cluster changing to comply with the forest definition and hence result in the whole cluster being treated as afforestation. Similarly, any group of pixels changing from compliance with the Kyoto forest definition to non-compliance is treated as D. If for instance one pixel changes from tree cover to another land use, that pixel is treated as D. However if this one pixel results in a neighbouring cluster of forest pixels becoming smaller than 0.5 ha, the whole group changes to TOF and therefore the whole group of pixels is treated as Deforestation. Groups of clustered pixels that together cover at least 0.5 ha of Forest land in 1990 and continue to do so over the full time period since 1990 are treated as FM.
11.2.2 Methodology used to develop the land transition matrix The basis for the spatially explicit land use mapping is wall-to-wall maps for 1 January 1990, 1 January 2004 (Kramer et al., 2007, 2009), 1 January 2009 (Van den Wyngaert et al., 2012), 1 January 2013 (Kramer and Clement, 2015), and 1 January 2017 (Arets et al., 2019); see Section 11.2.3 below. An overlay was made of these five land use maps plus two maps of soil types (Arets et al., 2020). This resulted in four land use change matrices; a first matrix between 1 January 1990 and 1 January 2004, a second covering the period 1 January 2004–1 January 2009, a third covering the period 1 January 2009–1 January 2013 and a fourth covering the period 1 January 2013–1 January 2017. Together the four matrices thus cover the period 1 January 1990–1 January 2017, which ensures that we are able to capture all land use changes. Mean annual rates of change for all land use transitions between the map years were calculated by linear interpolation. From 2017 onwards, the annual changes as obtained from the matrix 2013–2017 are used to extrapolate land use changes. These values will be used until a new land use map is available (provisionally planned to be included in the NIR 2022 with a map date of 1 January 2021). Table 11.1 gives the annual area change from 1990 onwards for the cells in Table NIR-2 that are related to the Article 3.3 activities and FM. The summed values in Table 11.1 for AR (AR land remaining AR land + land converted to AR land) match the sum of values reported under Convention sub-category 4A2 (Land converted to forest land) for the respective years up to 2003. From 2004 onwards these start to differ because part of the afforestation that is included in Convention category 4A2 is on land that was deforested between 1990 and 2003. Additionally, due to the 20-year transition period for forests, from 2010 onwards, land reported under 4A2 that was converted to Forest land
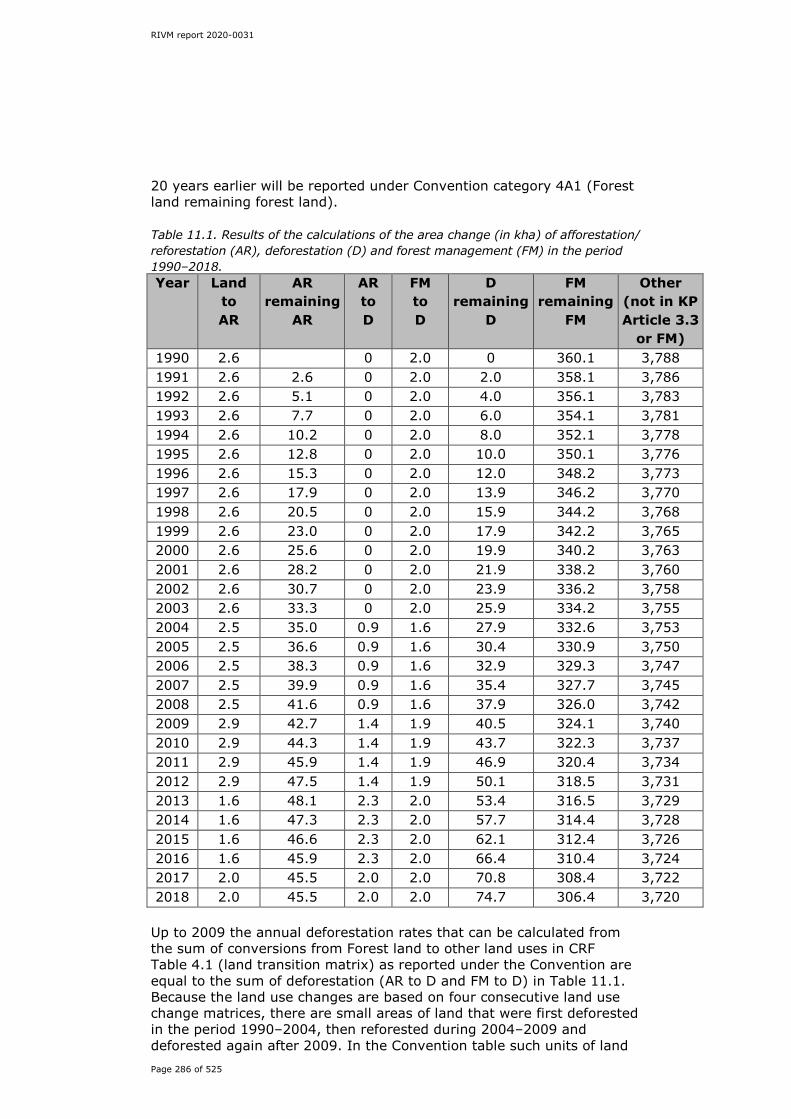
RIVM report 2020-0031
Page 286 of 525
20 years earlier will be reported under Convention category 4A1 (Forest land remaining forest land). Table 11.1. Results of the calculations of the area change (in kha) of afforestation/ reforestation (AR), deforestation (D) and forest management (FM) in the period 1990–2018. Year
Land
to AR
AR remaining
AR
AR to D
FM to D
D remaining
D
FM remaining
FM
Other (not in KP Article 3.3
or FM) 1990 2.6 0 2.0 0 360.1 3,788 1991 2.6 2.6 0 2.0 2.0 358.1 3,786 1992 2.6 5.1 0 2.0 4.0 356.1 3,783 1993 2.6 7.7 0 2.0 6.0 354.1 3,781 1994 2.6 10.2 0 2.0 8.0 352.1 3,778 1995 2.6 12.8 0 2.0 10.0 350.1 3,776 1996 2.6 15.3 0 2.0 12.0 348.2 3,773 1997 2.6 17.9 0 2.0 13.9 346.2 3,770 1998 2.6 20.5 0 2.0 15.9 344.2 3,768 1999 2.6 23.0 0 2.0 17.9 342.2 3,765 2000 2.6 25.6 0 2.0 19.9 340.2 3,763 2001 2.6 28.2 0 2.0 21.9 338.2 3,760 2002 2.6 30.7 0 2.0 23.9 336.2 3,758 2003 2.6 33.3 0 2.0 25.9 334.2 3,755 2004 2.5 35.0 0.9 1.6 27.9 332.6 3,753 2005 2.5 36.6 0.9 1.6 30.4 330.9 3,750 2006 2.5 38.3 0.9 1.6 32.9 329.3 3,747 2007 2.5 39.9 0.9 1.6 35.4 327.7 3,745 2008 2.5 41.6 0.9 1.6 37.9 326.0 3,742 2009 2.9 42.7 1.4 1.9 40.5 324.1 3,740 2010 2.9 44.3 1.4 1.9 43.7 322.3 3,737 2011 2.9 45.9 1.4 1.9 46.9 320.4 3,734 2012 2.9 47.5 1.4 1.9 50.1 318.5 3,731 2013 1.6 48.1 2.3 2.0 53.4 316.5 3,729 2014 1.6 47.3 2.3 2.0 57.7 314.4 3,728 2015 1.6 46.6 2.3 2.0 62.1 312.4 3,726 2016 1.6 45.9 2.3 2.0 66.4 310.4 3,724 2017 2.0 45.5 2.0 2.0 70.8 308.4 3,722 2018 2.0 45.5 2.0 2.0 74.7 306.4 3,720 Up to 2009 the annual deforestation rates that can be calculated from the sum of conversions from Forest land to other land uses in CRF Table 4.1 (land transition matrix) as reported under the Convention are equal to the sum of deforestation (AR to D and FM to D) in Table 11.1. Because the land use changes are based on four consecutive land use change matrices, there are small areas of land that were first deforested in the period 1990–2004, then reforested during 2004–2009 and deforested again after 2009. In the Convention table such units of land

RIVM report 2020-0031
Page 287 of 525
are reported under conversions from Forest land, while in Table 11.1 they are included under ‘D remaining D’ from the first deforestation event on the particular unit of land.
11.2.3 Maps and/or database to identify geographical locations and the system of identification codes for geographical locations The land use information reported under both the Convention (see also Section 6.3) and the Kyoto Protocol is based on five land use maps specifically monitoring nature development in the Netherlands: Basiskaart Natuur (Base Map Nature, BN) for 1 January 1990, 1 January 2004 (Kramer et al., 2007, 2009), 1 January 2009 (Van den Wyngaert et al., 2012), 1 January 2013 (Kramer and Clement, 2015) and 1 January 2017 (Arets et al., 2020). To distinguish between mineral soils and organic soils and to include the temporal developments in organic soil, an overlay is also made with two versions of the soil maps. These are the initial version of the Dutch Soil Map (De Vries et al., 2003), dated 1977, and a 2014 update based on the latest information on organic soils from the soil information system Netherlands (BIS; see https://www.wur.nl/nl/show/Bodemkundig-Informatie-Systeem-BIS.htm). As a result of the oxidation that is caused by the drainage of cultivated soils, the total area of organic soils decreases over time (see Section 6.1). The total area of organic soils for the intermediate years is interpolated between 1990 and 2014. After 2014 the loss of organic soil area is extrapolated on the basis of the trend between 1990 and 2014. Due to the conversion of organic soils to mineral soils, the area of mineral soils consequently increases at the same rate (see Arets et al., 2020 for more details). As a result, detailed land use information with national coverage is available. For each pixel, it identifies whether it was subject to AR or D or remained as FM between 1990 and 2004, 2004 and 2009, 2009 and 2013, and 2013 and 2017 and whether it is located on mineral or organic soil. Because of the multiple-year intervals between the different land use maps, it is unknown for each individual location in which year exactly AR or D occurred. A mean annual rate for the Netherlands as a whole is derived from the aforementioned analysis by linear interpolation.
11.3 Activity-specific information 11.3.1 Methods for carbon stock change and GHG emissions and removal
estimates 11.3.1.1 Description of the methodologies and the underlying assumptions used
Data on forests are based on three national forest inventories carried out during 1988–1992 (HOSP data, Schoonderwoerd and Daamen, 1999), 2000–2005 (NFI-5 data, Daamen and Dirkse, 2005) and 2012–2013 (NFI-6, Schelhaas et al., 2014). As these most accurately describe the state of Dutch forests, they were applied in the calculations for Forest land remaining forest land, Land converted to forest land and Forest land converted to other land use, representing the state of the forest at three moments in time; 1990 (HOSP), 2003 (NFI-5) and 2012 (NFI-6). Until a new NFI becomes available, in 2020, the development of
RIVM report 2020-0031
Page 288 of 525
carbon stocks in forests is based on projections using the EFISCEN model (see Arets et al., 2020). Using plot-level data from the HOSP, NFI-5 and NFI-6, changes in carbon stocks in living biomass in forests were calculated. In addition, changes in activity data were assessed using several databases of tree biomass information, with allometric equations to calculate above-ground biomass (AGB), below-ground biomass (BGB) and forest litter. More detailed descriptions of the methods used and EFs can be found in Arets et al. (2020). Afforestation/reforestation Reporting of AR is linked to the following land use categories used for reporting under the Convention:
• 4.A.2.1: Cropland converted to forest land; • 4.A.2.2: Grassland converted to forest land; • 4.A.2.3: Wetland converted to forest land; • 4.A.2.4: Settlement converted to forest land; • 4.A.2.5: Other Land converted to forest land.
The methodologies used to calculate carbon stock changes in biomass due to AR activities are in accordance with those under the Convention, as presented in section 6.4.2.2. The carbon stock changes due to changes in forest biomass were attributed to changes in above-ground or below-ground biomass based on the fact that carbon stocks in newly planted plots would reach the carbon stocks of the average forest in 30 years (see section 6.4.2.2 and Arets et al., 2020). Carbon stock losses due to changes in AGB and BGB in land use conversions from Cropland and Grassland (non-TOF) were calculated on the basis of Tier 1 default carbon stocks. Carbon stock changes in litter and dead wood follow the approach for Land converted to forest land (section 4.2.2 Arets et al., 2020) during the first 20 years after establishment, which are not estimated due to lack of data. Twenty years after establishment, the carbon stock changes in litter and dead wood are calculated using the methods for Forest land remaining forest land (Section 4.2.1 and Arets et al., 2020). The analysis for litter in this category consistently showed a carbon sink in litter, but the magnitude was very uncertain. Therefore, applying the ‘not a source’ principle, assuming zero accumulation of carbon in litter was considered to be conservative (Section 4.2.1 and Arets et al., 2020). Carbon stock changes in litter therefore were reported as NE for AR. Carbon stock changes in dead wood are included. Methods for calculating carbon stock changes in mineral and organic soils are presented below. Results for carbon stock changes for all pools during the second KP commitment period are given in Table 11.2. Carbon stock losses in organic soils are lower than reported in the previous submission as a result of method changes in organic soil estimates (activity data after 2014 and EF over the whole time series); see Sections 11.3.2 and 6.1. As a result of the changes in activity data for organic soils small differences also occur in the carbon stock changes
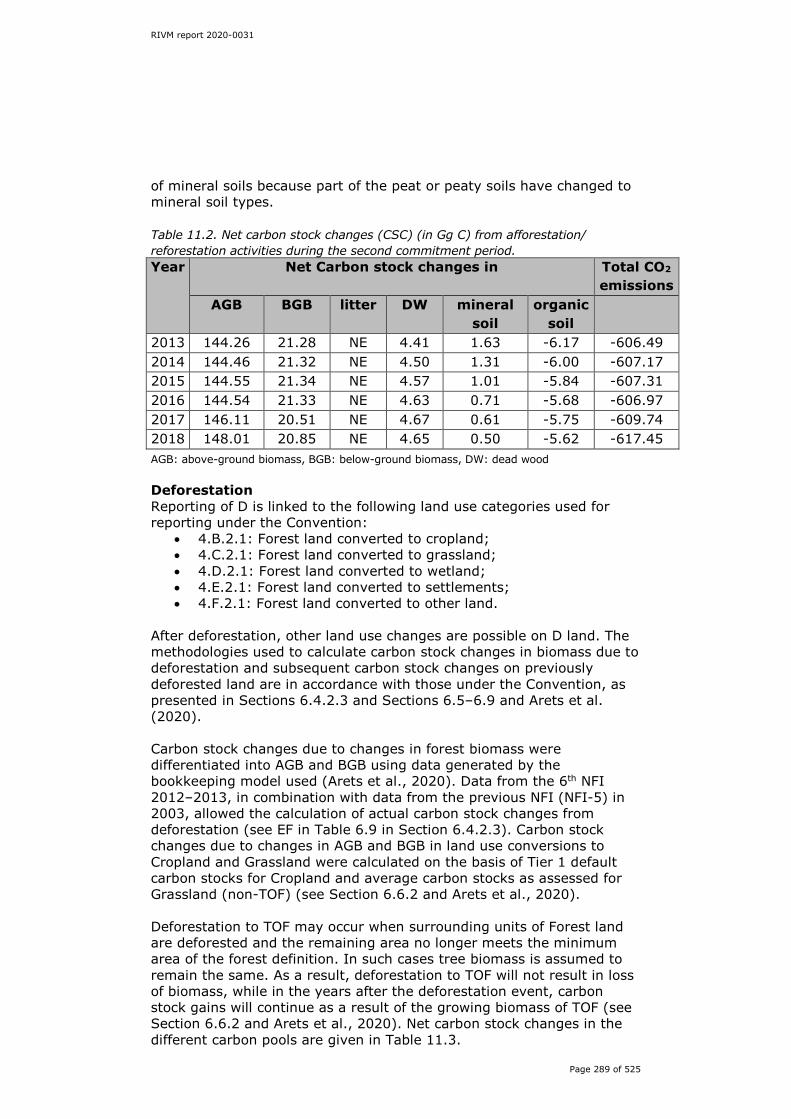
RIVM report 2020-0031
Page 289 of 525
of mineral soils because part of the peat or peaty soils have changed to mineral soil types. Table 11.2. Net carbon stock changes (CSC) (in Gg C) from afforestation/ reforestation activities during the second commitment period. Year Net Carbon stock changes in Total CO2
emissions AGB BGB litter DW mineral
soil organic
soil
2013 144.26 21.28 NE 4.41 1.63 -6.17 -606.49 2014 144.46 21.32 NE 4.50 1.31 -6.00 -607.17 2015 144.55 21.34 NE 4.57 1.01 -5.84 -607.31 2016 144.54 21.33 NE 4.63 0.71 -5.68 -606.97 2017 146.11 20.51 NE 4.67 0.61 -5.75 -609.74 2018 148.01 20.85 NE 4.65 0.50 -5.62 -617.45 AGB: above-ground biomass, BGB: below-ground biomass, DW: dead wood Deforestation Reporting of D is linked to the following land use categories used for reporting under the Convention:
• 4.B.2.1: Forest land converted to cropland; • 4.C.2.1: Forest land converted to grassland; • 4.D.2.1: Forest land converted to wetland; • 4.E.2.1: Forest land converted to settlements; • 4.F.2.1: Forest land converted to other land.
After deforestation, other land use changes are possible on D land. The methodologies used to calculate carbon stock changes in biomass due to deforestation and subsequent carbon stock changes on previously deforested land are in accordance with those under the Convention, as presented in Sections 6.4.2.3 and Sections 6.5–6.9 and Arets et al. (2020). Carbon stock changes due to changes in forest biomass were differentiated into AGB and BGB using data generated by the bookkeeping model used (Arets et al., 2020). Data from the 6th NFI 2012–2013, in combination with data from the previous NFI (NFI-5) in 2003, allowed the calculation of actual carbon stock changes from deforestation (see EF in Table 6.9 in Section 6.4.2.3). Carbon stock changes due to changes in AGB and BGB in land use conversions to Cropland and Grassland were calculated on the basis of Tier 1 default carbon stocks for Cropland and average carbon stocks as assessed for Grassland (non-TOF) (see Section 6.6.2 and Arets et al., 2020). Deforestation to TOF may occur when surrounding units of Forest land are deforested and the remaining area no longer meets the minimum area of the forest definition. In such cases tree biomass is assumed to remain the same. As a result, deforestation to TOF will not result in loss of biomass, while in the years after the deforestation event, carbon stock gains will continue as a result of the growing biomass of TOF (see Section 6.6.2 and Arets et al., 2020). Net carbon stock changes in the different carbon pools are given in Table 11.3.

RIVM report 2020-0031
Page 290 of 525
Table 11.3. Net carbon stock changes (in Gg C) in carbon pools of deforestation activities during the second commitment period. Year Carbon stock changes in Total CO2
emissions AGB BGB litter DW mineral
soil organic
soil
2013 -187.43 -22.89 -79.01 -4.51 4.20 -11.20 1,103.08 2014 -194.64 -24.21 -80.36 -4.71 4.71 -12.41 1,142.75 2015 -202.20 -25.53 -81.68 -5.00 5.22 -13.59 1,183.54 2016 -209.72 -26.89 -82.97 -5.26 5.73 -14.74 1,224.11 2017 -217.89 -28.586 -83.99 -5.61 5.92 -15.79 1,269.48 2018 -225.11 -30.16 -85.83 -5.93 6.11 -16.82 1,331.69 AGB: above-ground biomass, BGB: below-ground biomass, DW: dead wood Carbon stock changes in mineral soils are reported using a 20-year transition period. Carbon stock changes in organic soils are reported for all organic soils under Article 3.3 activities. The methods are presented below. Deforestation of AR land involves an emission of all accumulated carbon stocks up to the time of deforestation that have been calculated following the methodologies for AR. Carbon stock changes per area for the litter pool under deforestation are found to be higher in the Netherlands than in other countries. As a result of a characteristic combination of geomorphological and climate conditions, a large share of Forest land in the Netherlands is on poor Pleistocene soils, characterised by relatively thick litter layers, which may explain the differences with other countries. The assessment of the carbon stocks and changes thereto in litter in Dutch forests is based on extensive datasets on litter thickness and carbon content in litter (see sections 4.2.1 and 4.2.3 in Arets et al., 2020). Additional information on geomorphological aspects is provided in Schulp et al. (2008) and de Waal et al. (2012). Forest management Reporting of FM is linked to the category 4A1 Forest land remaining forest land used for reporting under the Convention. Yet the area and total figures of carbon stock changes differ due to the fact that, under Convention reporting, from 2009 onwards land that was afforested after 1990 exceeds the 20-year transition period and is included in the category Forest land remaining forest land, while under KP reporting such land is still reported under AR. The calculation of carbon stock changes and resulting EFs is the same as used under the Convention (see Section 6.4.2.1 and Arets et al., 2020). Net carbon stock changes are given in Table 11.4.

RIVM report 2020-0031
Page 291 of 525
Table 11.4. Net carbon stock changes (in Gg C) in carbon pools of Forest management and total CO2 emissions (Gg CO2) during the second commitment period. Year Carbon stock changes in Total CO2
emissions AGB BGB litter DW mineral
soil organic
soil HWP
2013 264.69 47.64 NE 17.66 NO -14.12 -19.72 -1,085.92 2014 263.76 47.48 NE 17.54 NO -13.79 -20.48 -1,079.89 2015 262.82 47.31 NE 17.43 NO -13.44 -29.44 -1,043.82 2016 261.87 47.14 NE 17.31 NO -13.10 -21.56 -1,069.44 2017 260.97 46.97 NE 17.20 NO -12.77 -25.25 -1,052.77 2018 260.06 46.81 NE 17.09 NO -12.45 -30.18 -1,031.52
AGB: above-ground biomass, BGB: below-ground biomass, DW: dead wood, HWP: harvested wood products Carbon stock changes in litter in Forest land remaining forest land were estimated, but a Monte Carlo uncertainty assessment showed that while litter consistently remained a carbon sink, the magnitude of this sink was very uncertain. Therefore, carbon stock change in litter was considered to be ‘not a source’ and the accumulation of carbon in FM was conservatively set to zero and subsequently reported as NE (see Arets et al., 2020). Method of estimating carbon stock changes in AR or D land in mineral soils Carbon stock changes in mineral and organic soils are reported for all soils changing land use under Article 3.3. This includes changes in the use of units of land reported under Deforestation. Carbon stock changes in mineral soils were calculated from base data taken from the LSK survey (de Groot et al., 2005; Lesschen et al., 2012). The LSK database contains quantified soil properties, including soil organic matter, for approximately 1,400 locations at five depths. The soil types for each of the sample points were reclassified to 11 main soil types, which represent the main variation in carbon stocks in the Netherlands. Combined with land use at the time of sampling, this led to a new soil/land use-based classification of all points (see Arets et al., 2020, for more details). The LSK dataset contains only data on soil carbon stocks for the land uses Grassland, Cropland and Forest land. About 44% of deforested land is Grassland. For the remaining land use categories, separate estimates were made. For Settlements, which constitute about 32% of deforested land, the estimates make use of information in the 2006 IPCC Guidelines. An average soil carbon stock under Settlements of 0.9 times the carbon stock of the previous land use is calculated on the basis of the following assumptions:
(i) 50% of the area classified as Settlements is paved and has a soil carbon stock 0.8 times the corresponding carbon stock of the previous land use. Considering the high resolution of the land use change maps in the Netherlands (25 m x 25 m grid cells), it can

RIVM report 2020-0031
Page 292 of 525
be assumed that, in reality, a large portion of that grid cell is indeed paved.
(ii) The remaining 50% consists mainly of Grassland and wooded land, for which the reference soil carbon stock from the previous land use, i.e. Forest, is assumed.
For the land use category Wetland, which makes up 5% of deforested land, no change in carbon stocks in mineral soils is assumed upon conversion to or from Forest. For the category Other land, a carbon stock of zero is assumed. This is a conservative estimate, yet in many cases very realistic. (Other land in the Netherlands comprises mainly sandy beaches and inland (drifting) sandy areas.) The estimated annual C flux associated with AR or D is then estimated from the difference between land use classes divided by 20 years (the IPCC default transition period):
∑
⋅
−=
i
xyixiyi
xy AT
CCE
1min_min_
Where:
xyEmin_ annual emissions from land converted from land use x to land use y on soil-type i (Gg C yr-1);
xyAmin_ area of land converted from land use x to land use y
on soil-type i in years more recent than the length of the transition period (i.e. <20 years ago) (ha);
xiyi CC , carbon stocks of land use x or y on soil-type i (Gg
C.ha-1);
T length of transition period (= 20 years). For units of land subject to land use change during the transition period (e.g. changing from Forest to Grassland and then to Cropland), the estimated carbon stock at time of land use change was calculated with:
T
CCtCC xiyi
xiyit
−⋅+=∆
Where (as above plus):
tyiC∆ carbon stock of land converted from land use x to land use y on soil-type i at time t years after conversion (Gg C ha-1);
t years since land use change to land use y. And this carbon stock was filled in the first formula to calculate the mineral soil emissions involved in another land use change. Method of estimating carbon stock change in organic soils The area of organic soils under forests on the 2017 map is small: 20.24 kha, which is 4.5% of the total area of organic soil. In 2018 the area of AR land on organic soils was 5.50 kha (11.6% of total AR area), the

RIVM report 2020-0031
Page 293 of 525
area of FM land on organic soils was 13.41 kha (4.5% of total FM area) and the area of D land on organic soils was 7.20 kha (9.2% of total D area). In 2018 the majority of this area of D (67%) on organic soils was on agricultural land (Cropland or Grassland). Organic soils are divided into peat soils, which have a peat layer of at least 40 cm within the first 120 cm, and peaty soils (in Dutch: moerige gronden), which have a peat layer of 5–40 cm within the first 80 cm. Based on the available datasets, two different approaches to calculating the EFs for peat and peaty soils have been developed (see Arets et al., 2020, for details). For CO2 emissions from cultivated peat soils the methodology is described in Kuikman et al. (2005). This method is based on subsidence as a consequence of the oxidation of organic matter. Estimated total annual emissions from cultivated peat soils are then converted to an annual EF per ha peat soil to report emissions from peat soils for land use (change) categories involving Grassland (non-TOF), Cropland and Settlements (see chapter 11.3 in Arets et al., 2020). Using an intermediary peat map from 2004 an average EF of 19 tons CO2 ha-1 was calculated. In addition, using the updated 2014 soil map, an EF of 17.7 tons CO2 ha-1 was calculated (see Arets et al., 2020). Between 2004 and 2014 the EF is interpolated as between 19 and 17.7 tons CO2 ha-1 and after 2014 the trend is extrapolated. (See also the paragraphs on organic soils in Section 6.1.) The EF in 2018 was 17.2 tons CO2 ha-1. For peaty soils, a different approach was used, based on a large dataset of soil profile descriptions over time (de Vries et al., 2016). This dataset holds information on the change in thickness of the peat layer over time, and from these data the average loss rate of peat was calculated. This resulted in an average overall EF of 13.02 tonnes CO2 per ha per year for peaty soils under agriculture. For Settlements no data were available, but the same average EF was used. Again two EFs were assessed on the basis of the areas of peaty soils present on the 2004 map and the 2014 map. For 2004 the average EF for peaty soils was 13 tons CO2 ha-1, which was applied to the period 1990–2004 and an average EF of 12 tons CO2 ha-1 in 2014 (see Arets et al., 2020). Through interpolation the EF gradually decreases from 13 tons CO2 ha-1 in 2004 to 12 tons CO2 ha-1 in 2014. This decreasing trend of the EF then is extrapolated after 2014. The EF in 2018 was 11.6 tons CO2 ha-1. For organic soils under deforestation for which the current land use is Cropland, Grassland or Settlements, these emissions from organic soils are applied. Drainage of organic soils is usually not applied in forestry in the Netherlands. However, since afforestation often occurs on land with previous agricultural use, it cannot be entirely ruled out that the old drainage systems from the agricultural sites are still active. Therefore, to account for possible emissions, the area of forest planted on organic soils that were in agricultural use before and where drainage systems may still be (partially) functioning was estimated at 24.2% of the total forest area on peat soils and 22.0% of the total forest area on peaty soils. Subsequently to 24.2% of the FM land and AR land on peat soils,
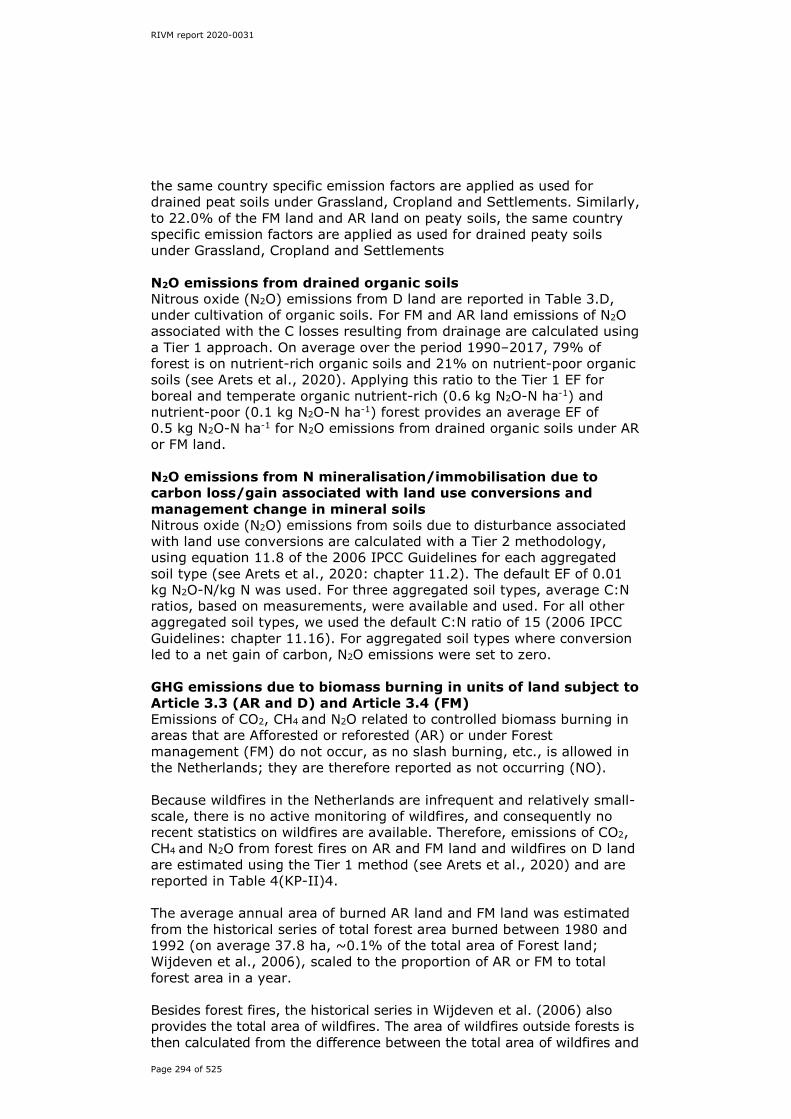
RIVM report 2020-0031
Page 294 of 525
the same country specific emission factors are applied as used for drained peat soils under Grassland, Cropland and Settlements. Similarly, to 22.0% of the FM land and AR land on peaty soils, the same country specific emission factors are applied as used for drained peaty soils under Grassland, Cropland and Settlements N2O emissions from drained organic soils Nitrous oxide (N2O) emissions from D land are reported in Table 3.D, under cultivation of organic soils. For FM and AR land emissions of N2O associated with the C losses resulting from drainage are calculated using a Tier 1 approach. On average over the period 1990–2017, 79% of forest is on nutrient-rich organic soils and 21% on nutrient-poor organic soils (see Arets et al., 2020). Applying this ratio to the Tier 1 EF for boreal and temperate organic nutrient-rich (0.6 kg N2O-N ha-1) and nutrient-poor (0.1 kg N2O-N ha-1) forest provides an average EF of 0.5 kg N2O-N ha-1 for N2O emissions from drained organic soils under AR or FM land. N2O emissions from N mineralisation/immobilisation due to carbon loss/gain associated with land use conversions and management change in mineral soils Nitrous oxide (N2O) emissions from soils due to disturbance associated with land use conversions are calculated with a Tier 2 methodology, using equation 11.8 of the 2006 IPCC Guidelines for each aggregated soil type (see Arets et al., 2020: chapter 11.2). The default EF of 0.01 kg N2O-N/kg N was used. For three aggregated soil types, average C:N ratios, based on measurements, were available and used. For all other aggregated soil types, we used the default C:N ratio of 15 (2006 IPCC Guidelines: chapter 11.16). For aggregated soil types where conversion led to a net gain of carbon, N2O emissions were set to zero. GHG emissions due to biomass burning in units of land subject to Article 3.3 (AR and D) and Article 3.4 (FM) Emissions of CO2, CH4 and N2O related to controlled biomass burning in areas that are Afforested or reforested (AR) or under Forest management (FM) do not occur, as no slash burning, etc., is allowed in the Netherlands; they are therefore reported as not occurring (NO). Because wildfires in the Netherlands are infrequent and relatively small-scale, there is no active monitoring of wildfires, and consequently no recent statistics on wildfires are available. Therefore, emissions of CO2, CH4 and N2O from forest fires on AR and FM land and wildfires on D land are estimated using the Tier 1 method (see Arets et al., 2020) and are reported in Table 4(KP-II)4. The average annual area of burned AR land and FM land was estimated from the historical series of total forest area burned between 1980 and 1992 (on average 37.8 ha, ~0.1% of the total area of Forest land; Wijdeven et al., 2006), scaled to the proportion of AR or FM to total forest area in a year. Besides forest fires, the historical series in Wijdeven et al. (2006) also provides the total area of wildfires. The area of wildfires outside forests is then calculated from the difference between the total area of wildfires and
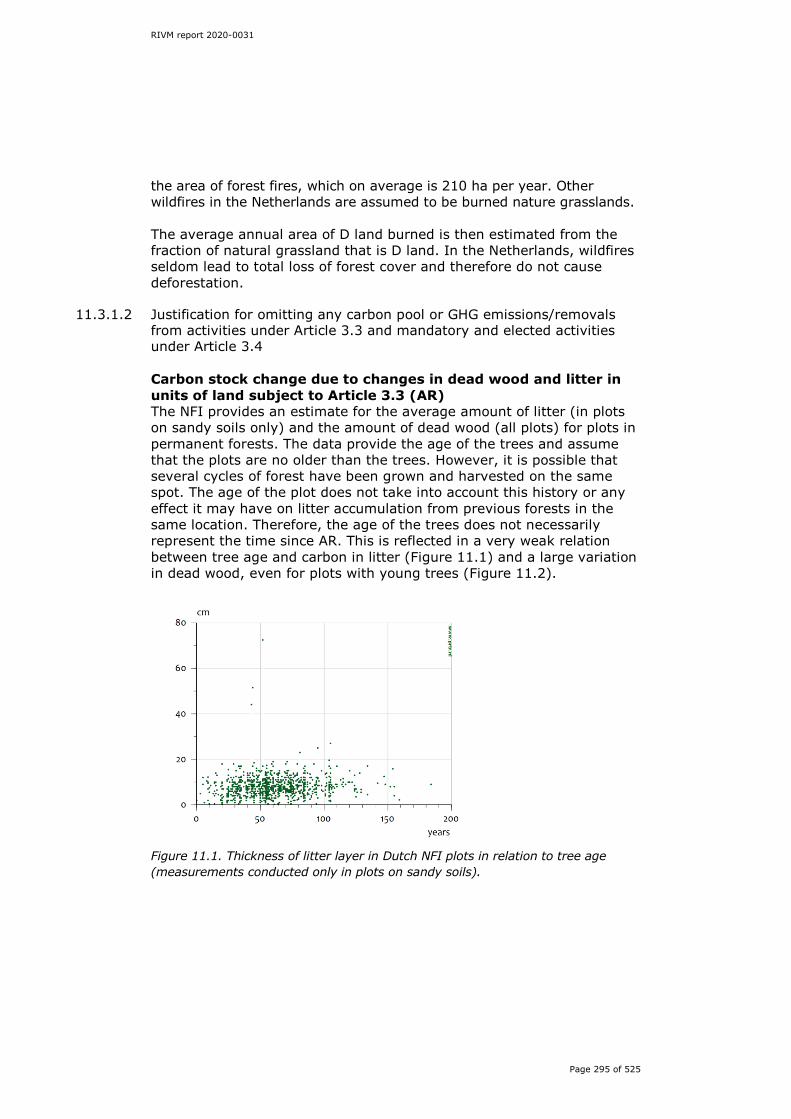
RIVM report 2020-0031
Page 295 of 525
the area of forest fires, which on average is 210 ha per year. Other wildfires in the Netherlands are assumed to be burned nature grasslands. The average annual area of D land burned is then estimated from the fraction of natural grassland that is D land. In the Netherlands, wildfires seldom lead to total loss of forest cover and therefore do not cause deforestation.
11.3.1.2 Justification for omitting any carbon pool or GHG emissions/removals from activities under Article 3.3 and mandatory and elected activities under Article 3.4 Carbon stock change due to changes in dead wood and litter in units of land subject to Article 3.3 (AR) The NFI provides an estimate for the average amount of litter (in plots on sandy soils only) and the amount of dead wood (all plots) for plots in permanent forests. The data provide the age of the trees and assume that the plots are no older than the trees. However, it is possible that several cycles of forest have been grown and harvested on the same spot. The age of the plot does not take into account this history or any effect it may have on litter accumulation from previous forests in the same location. Therefore, the age of the trees does not necessarily represent the time since AR. This is reflected in a very weak relation between tree age and carbon in litter (Figure 11.1) and a large variation in dead wood, even for plots with young trees (Figure 11.2).
Figure 11.1. Thickness of litter layer in Dutch NFI plots in relation to tree age (measurements conducted only in plots on sandy soils).
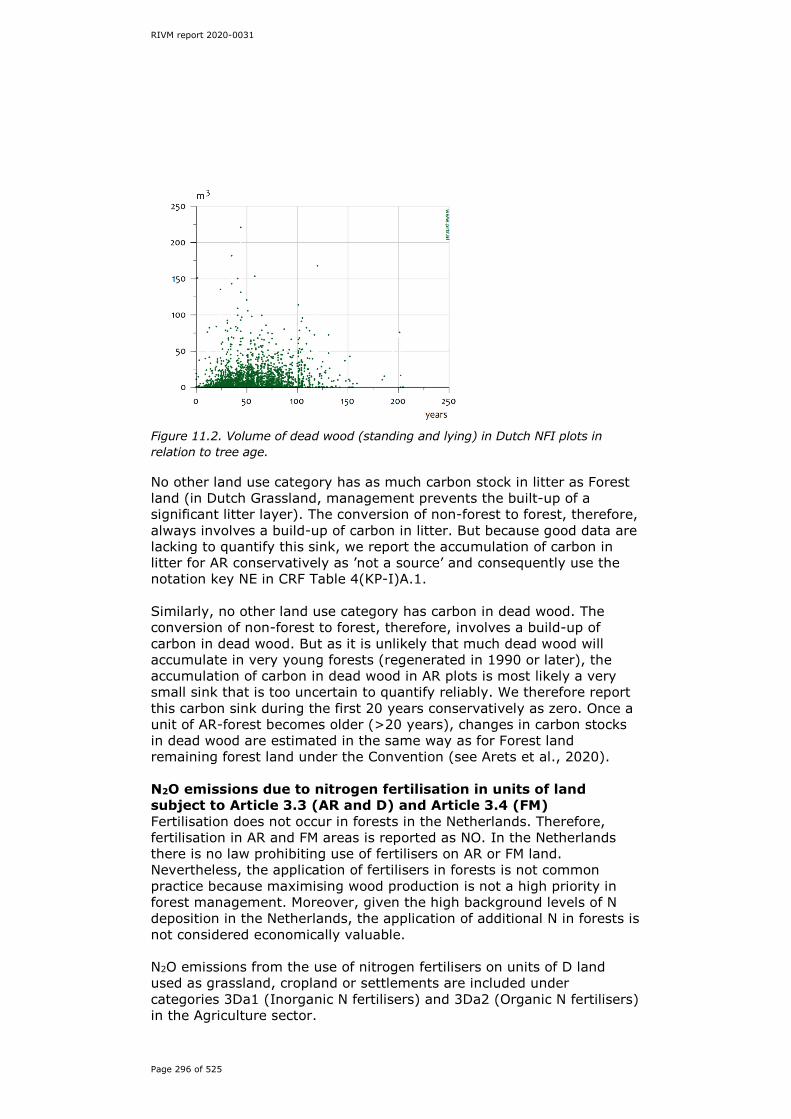
RIVM report 2020-0031
Page 296 of 525
Figure 11.2. Volume of dead wood (standing and lying) in Dutch NFI plots in relation to tree age. No other land use category has as much carbon stock in litter as Forest land (in Dutch Grassland, management prevents the built-up of a significant litter layer). The conversion of non-forest to forest, therefore, always involves a build-up of carbon in litter. But because good data are lacking to quantify this sink, we report the accumulation of carbon in litter for AR conservatively as ’not a source’ and consequently use the notation key NE in CRF Table 4(KP-I)A.1. Similarly, no other land use category has carbon in dead wood. The conversion of non-forest to forest, therefore, involves a build-up of carbon in dead wood. But as it is unlikely that much dead wood will accumulate in very young forests (regenerated in 1990 or later), the accumulation of carbon in dead wood in AR plots is most likely a very small sink that is too uncertain to quantify reliably. We therefore report this carbon sink during the first 20 years conservatively as zero. Once a unit of AR-forest becomes older (>20 years), changes in carbon stocks in dead wood are estimated in the same way as for Forest land remaining forest land under the Convention (see Arets et al., 2020). N2O emissions due to nitrogen fertilisation in units of land subject to Article 3.3 (AR and D) and Article 3.4 (FM) Fertilisation does not occur in forests in the Netherlands. Therefore, fertilisation in AR and FM areas is reported as NO. In the Netherlands there is no law prohibiting use of fertilisers on AR or FM land. Nevertheless, the application of fertilisers in forests is not common practice because maximising wood production is not a high priority in forest management. Moreover, given the high background levels of N deposition in the Netherlands, the application of additional N in forests is not considered economically valuable. N2O emissions from the use of nitrogen fertilisers on units of D land used as grassland, cropland or settlements are included under categories 3Da1 (Inorganic N fertilisers) and 3Da2 (Organic N fertilisers) in the Agriculture sector.

RIVM report 2020-0031
Page 297 of 525
11.3.1.3 Information on whether or not indirect and natural GHG emissions and removals have been factored out For all Article 3.3 AR activities, forests were created only after 1990 and the factoring-out of effects on age structure of practices and activities before 1990 are not relevant. For Article 3.3 D activities, the increase in mean carbon stocks since 1990 may be partly an effect of changes in management as well as a change in age structure resulting from activities and practices before 1990. However, it is not known to what extent each factor contributes. There has been no factoring-out of indirect GHG emissions and removals due to the effects of elevated CO2 concentrations or N deposition. This increase in mean carbon stocks results in higher carbon emissions due to deforestation. Thus, not factoring out the effect of age structure dynamics since 1990 results in a more conservative estimate of emissions due to Article 3.3 D activities.
11.3.2 Changes in data and methods since the previous submission (recalculations) This year, five methodological changes have been implemented, resulting in changes in various carbon stock changes and associated emissions and removals along the whole time series (see Chapter 6.1). These have also resulted in recalculations for AR, D and FM. Because the separate changes may interact with each other, the effects of the separate changes cannot be quantified. The changes are briefly explained below. More extensive descriptions are included in Chapter 6.1.
1. The 2014 soil map was included in the NIR 2019, which resulted in a gradually decreasing area of organic soils in the Netherlands between 1977 and 2014. The decreasing trend has now been extrapolated after 2014, in line with the provisional recommendation L.20 of the ERT in the 2019 review. In the NIR 2019 this was kept constant after 2014. This has resulted in a reduction of the areas of drained organic soils, and hence an overall reduction in emissions from organic soils in AR, D and FM. Because the area of mineral soils is increasing, emissions and removals in mineral soils that are associated with land use changes also change in AR and D.
2. The EFs for drainage of organic (peat and peaty) soils have been corrected to take into consideration the changed area of organic soils. EFs have decreased from an average 19 (peat) or 13 (peaty) ton CO2 per ha of drained organic soil in 2000 to 17.7 (peat) or 12 (peaty) ton CO2 per ha of drained organic soil in 2014. Between 2004 and 2014 the trend in decreasing EFs has been interpolated and after 2014, extrapolated. This has resulted in a further reduction in emissions from organic soils in AR, D and FM.
3. In addition to the calculations for CO2 emissions from the drainage of organic soils under Forest land that were included in the NIR 2019, in the present NIR the associated N2O emissions have been included. This conforms to the recommendation KL.10 of the ERT in the 2019 review. N2O emissions from potentially drained forest land are now included for AR and FM activities in CRF Table 4(KP-II)2.
4. In the NIR 2020 the total round wood harvest has been allocated to Forest land remaining forest land, to be more consistent with the data used for assessing round wood harvests. This is an

RIVM report 2020-0031
Page 298 of 525
addition to the approach introduced in the NIR 2019 for assessing wood harvests from forests. This has an effect on the carbon stock changes in HWP under FM.
5. Until the NIR 2019 the total area included on the 1990 land use map was used as the basis for all overlays. However, between 2008 and 2013 about 2,000 ha of land was reclaimed from the sea as an extension of the harbour in Rotterdam (Maasvlakte 2). Now the total area is determined with the 2017 land use map as a basis. This has no effect on emissions and removals from AR, D and FM, as the changes up to 2018 did not include changes to and from forest land.
11.3.3 Uncertainty estimates
The uncertainty analysis uses Monte Carlo simulations for combining different types of uncertainties and correctly representing the uncertainties in the land use matrix (see chapter 14 in Arets et al., 2020, for details). The analysis combines uncertainty estimates of forest statistics, land use and land use change data (topographical data) and the method used to calculate the yearly acceleration in carbon sequestration and removals. The uncertainty analysis is performed for Forest land and is based on the same data and calculations that were used for the KP Article 3.3 categories and FM. Thus, the uncertainty for total net emissions from units of land under Article 3.3 AR is estimated at +10% to -12%, which is equal to the uncertainty in Land converted to forest land. Similarly the uncertainty for total net removals from units of land under Article 3.4 FM is estimated at +26% to -21%, which is equal to the uncertainty of Forest land remaining forest land (see Section 6.4.3).
11.3.4 Information on other methodological issues There is no additional information on other methodological issues.
11.3.5 The year of the onset of an activity, if after 2013 The forestry activities under Article 3, paragraphs 3 and 4, are reported from the beginning of the commitment period.
11.4 Article 3.3 11.4.1 Information that demonstrates that activities under Article 3.3 began on
or after 1 January 1990 and before 31 December 2020 and are directly human-induced Land use and land use change is mapped using regularly updated land use maps covering the whole land area of the Netherlands. Land use maps dated 1 January 1990, 2004, 2009, 2013 and 2017 have been used to track changes in land use on units of land. All observed AR and D activities between 1 January 1990 and 31 December 2016 have been taken into account. Subsequent land use changes are extrapolated from changes in the last period for which maps are available (2013–2017). A new land use map and corresponding land use matrix are foreseen for 1 January 2021. By the end of the second commitment period this will allow all land use changes between 1 January 1990 and 31 December 2020 to be taken into account.

RIVM report 2020-0031
Page 299 of 525
In the Netherlands, forests are protected by the Forest Law (1961), which stipulates that ‘The owner of ground on which a forest stands, other than through pruning, [or] forest has been harvested or otherwise destroyed, is obliged to replant the forest stand within a period of three years after the harvest or destruction of the stand’. With the historic and current scarcity of land in the Netherlands, any land use is the result of deliberate human decisions.
11.4.2 Information on how harvesting or forest disturbance that is followed by the re-establishment of forest is distinguished from deforestation Following the forest definition and the mapping practice applied in the Netherlands, areas subject to harvesting or forest disturbance are still classified as Forest land and therefore there will be no change in land use in the overlay of the land use maps (Kramer et al., 2009; Arets et al., 2020).
11.4.3 Information on the size and geographical location of forest areas that have lost forest cover but are not yet classified as deforested The land use maps do not provide information on forest areas that have lost forest cover if they are not classified as deforested. From the NFIs, however, it can be estimated that approximately 0.3% of Forest land annually can be classified as ‘clear-cut area’, i.e. without tree cover.
11.4.4 Information related to the natural disturbances provision under Article 3.3 The Netherlands intends to apply the provisions to exclude emissions from natural disturbances for the accounting for AR under Article 3, paragraph 3, of the Kyoto Protocol and/or FM under Article 3, paragraph 4, of the Kyoto Protocol during the second commitment period. The Netherlands has established a background level and margin for natural disturbances as described below. Types of natural disturbances In the Netherlands natural disturbances in forests are relatively rare and therefore limited data are available. For AR the Netherlands includes wildfires as a disturbance type and for FM the Netherlands includes wildfires and wind storms (as an extreme weather event). Time series for the calibration period The time series of annual CO2 emissions from natural disturbances for the calibration period is provided in Table 11.5. Based on the total extent of forest fires, GHG emissions from forest fires are calculated for FM and AR land under KP-LULUCF (see Section 11.3.1.1 on forest fires). Information on wind storms is based on a proprietary database that is maintained at Wageningen Environmental Research in which damage from major storm events is collected. Part of this data set is available through Schelhaas et al. (2003). Salvage logging is estimated to remove 60% of the fallen tree volume. The remaining 40% is included under natural disturbances for calibration. Total areas of FM and AR land are provided in Table 11.6.
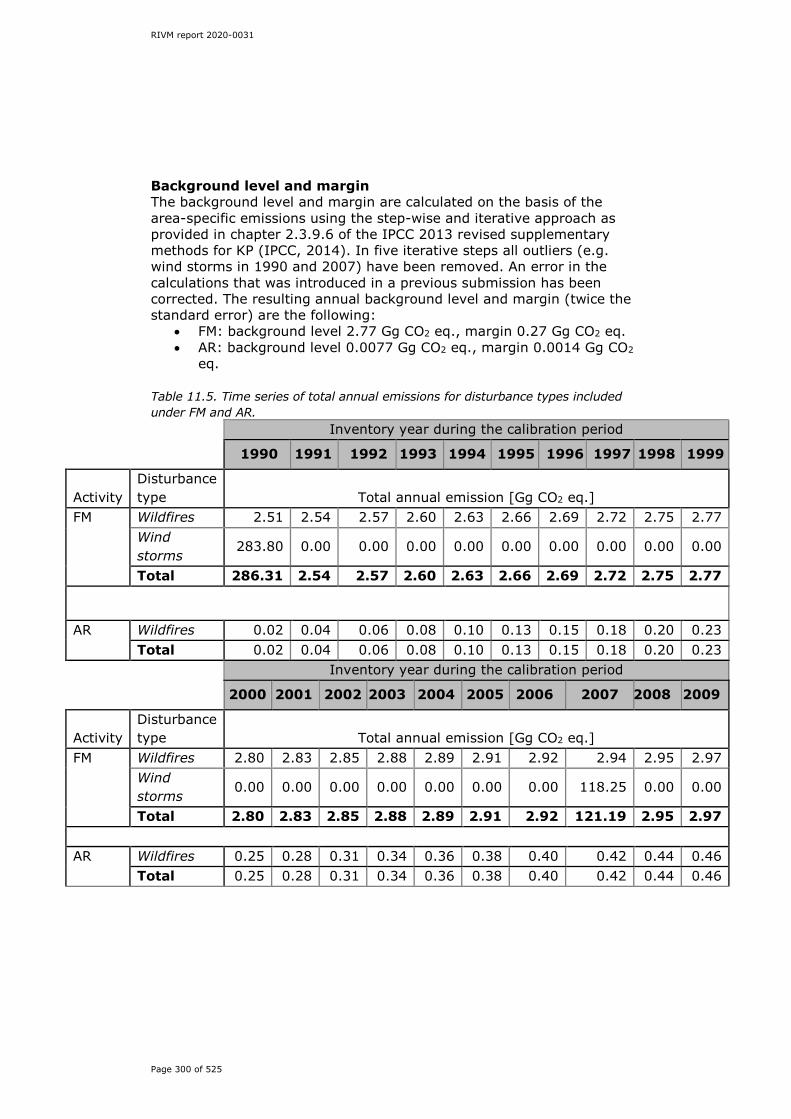
RIVM report 2020-0031
Page 300 of 525
Background level and margin The background level and margin are calculated on the basis of the area-specific emissions using the step-wise and iterative approach as provided in chapter 2.3.9.6 of the IPCC 2013 revised supplementary methods for KP (IPCC, 2014). In five iterative steps all outliers (e.g. wind storms in 1990 and 2007) have been removed. An error in the calculations that was introduced in a previous submission has been corrected. The resulting annual background level and margin (twice the standard error) are the following:
• FM: background level 2.77 Gg CO2 eq., margin 0.27 Gg CO2 eq. • AR: background level 0.0077 Gg CO2 eq., margin 0.0014 Gg CO2
eq. Table 11.5. Time series of total annual emissions for disturbance types included under FM and AR.
Inventory year during the calibration period
1990 1991 1992 1993 1994 1995 1996 1997 1998 1999
Activity Disturbance type Total annual emission [Gg CO2 eq.]
FM Wildfires 2.51 2.54 2.57 2.60 2.63 2.66 2.69 2.72 2.75 2.77
Wind storms
283.80 0.00 0.00 0.00 0.00 0.00 0.00 0.00 0.00 0.00
Total 286.31 2.54 2.57 2.60 2.63 2.66 2.69 2.72 2.75 2.77
AR Wildfires 0.02 0.04 0.06 0.08 0.10 0.13 0.15 0.18 0.20 0.23 Total 0.02 0.04 0.06 0.08 0.10 0.13 0.15 0.18 0.20 0.23
Inventory year during the calibration period
2000 2001 2002 2003 2004 2005 2006 2007 2008 2009
Activity Disturbance type Total annual emission [Gg CO2 eq.]
FM Wildfires 2.80 2.83 2.85 2.88 2.89 2.91 2.92 2.94 2.95 2.97
Wind storms
0.00 0.00 0.00 0.00 0.00 0.00 0.00 118.25 0.00 0.00
Total 2.80 2.83 2.85 2.88 2.89 2.91 2.92 121.19 2.95 2.97 AR Wildfires 0.25 0.28 0.31 0.34 0.36 0.38 0.40 0.42 0.44 0.46 Total 0.25 0.28 0.31 0.34 0.36 0.38 0.40 0.42 0.44 0.46
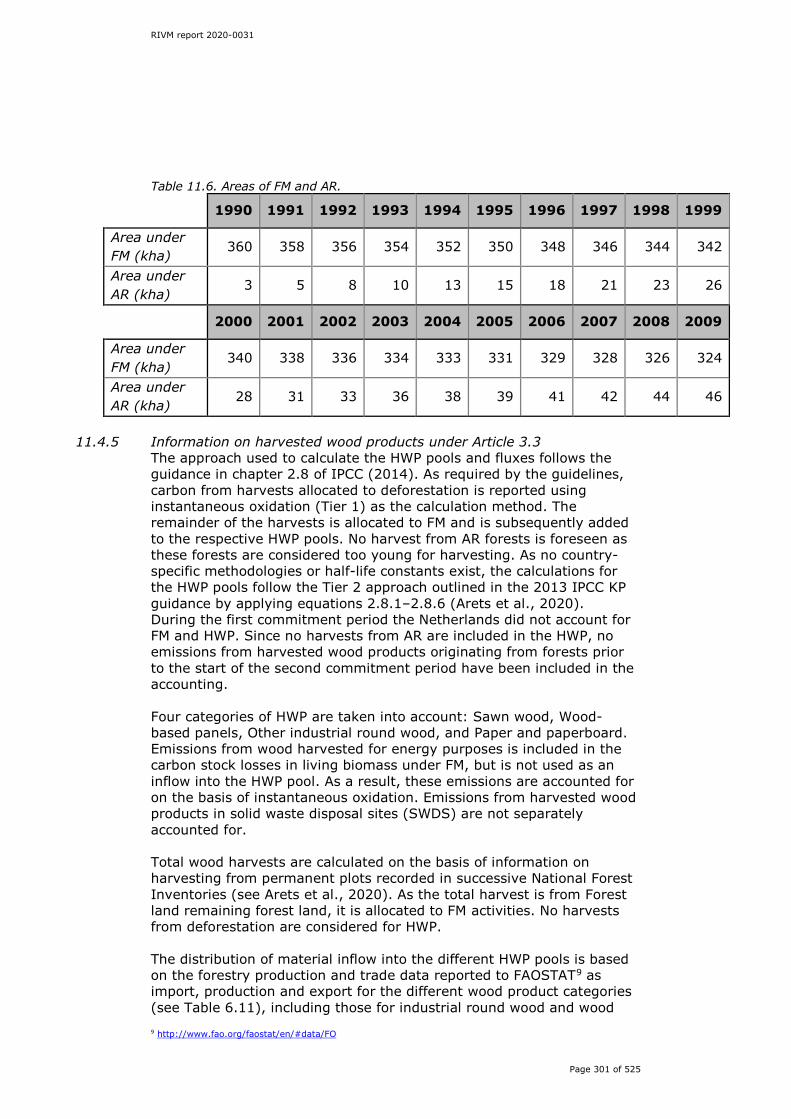
RIVM report 2020-0031
Page 301 of 525
Table 11.6. Areas of FM and AR.
1990 1991 1992 1993 1994 1995 1996 1997 1998 1999
Area under FM (kha)
360 358 356 354 352 350 348 346 344 342
Area under AR (kha)
3 5 8 10 13 15 18 21 23 26
2000 2001 2002 2003 2004 2005 2006 2007 2008 2009
Area under FM (kha)
340 338 336 334 333 331 329 328 326 324
Area under AR (kha)
28 31 33 36 38 39 41 42 44 46
11.4.5 Information on harvested wood products under Article 3.3
The approach used to calculate the HWP pools and fluxes follows the guidance in chapter 2.8 of IPCC (2014). As required by the guidelines, carbon from harvests allocated to deforestation is reported using instantaneous oxidation (Tier 1) as the calculation method. The remainder of the harvests is allocated to FM and is subsequently added to the respective HWP pools. No harvest from AR forests is foreseen as these forests are considered too young for harvesting. As no country-specific methodologies or half-life constants exist, the calculations for the HWP pools follow the Tier 2 approach outlined in the 2013 IPCC KP guidance by applying equations 2.8.1–2.8.6 (Arets et al., 2020). During the first commitment period the Netherlands did not account for FM and HWP. Since no harvests from AR are included in the HWP, no emissions from harvested wood products originating from forests prior to the start of the second commitment period have been included in the accounting. Four categories of HWP are taken into account: Sawn wood, Wood-based panels, Other industrial round wood, and Paper and paperboard. Emissions from wood harvested for energy purposes is included in the carbon stock losses in living biomass under FM, but is not used as an inflow into the HWP pool. As a result, these emissions are accounted for on the basis of instantaneous oxidation. Emissions from harvested wood products in solid waste disposal sites (SWDS) are not separately accounted for. Total wood harvests are calculated on the basis of information on harvesting from permanent plots recorded in successive National Forest Inventories (see Arets et al., 2020). As the total harvest is from Forest land remaining forest land, it is allocated to FM activities. No harvests from deforestation are considered for HWP. The distribution of material inflow into the different HWP pools is based on the forestry production and trade data reported to FAOSTAT9 as import, production and export for the different wood product categories (see Table 6.11), including those for industrial round wood and wood 9 http://www.fao.org/faostat/en/#data/FO

RIVM report 2020-0031
Page 302 of 525
pulp as a whole (equations 2.8.1–2.8.4.). Equation 2.8.4 from the 2013 IPCC KP guidance (IPCC, 2014) is used to obtain the annual fractions of HWP from domestic harvests and to exclude imported HWP. Material inflow is included from 1990 onwards. Consequently, inherited emissions since 1990 are taken into consideration in the accounting. The dynamics of the HWP pools are then calculated by applying equations 2.8.5 and 2.8.6 and the half-life constants reported in Table 2.8.2 of the 2013 IPCC KP guidance (see Arets et al., 2020). To assess carbon amounts in the different HWP categories, the default carbon conversion factors for the aggregated HWP categories Sawn wood, Wood-based panels, and Paper and paperboard were used from the 2013 IPCC KP guidance (see Table 11.7). For the category Other industrial round wood, the values for Sawn wood were used. This category includes a variety of round wood use, such as the use of whole stems as piles in building foundations, roads and waterworks, and as fences and poles. These are considered applications with a long to very long lifetime, for which the 35-year half-life is considered appropriate. Table 11.7. Tier 1 default carbon conversion factors and half-life factors for the HWP categories. HWP category C conversion factor
(Mg C per m3 air dry volume)
Half-lives
(years) Sawn wood 0.229 35 Wood-based panels 0.269 25 Other industrial round wood 0.229 35
Paper and paperboard 0.386 2 Because the statistics on the production, import and export of industrial round wood in 1990 appeared not to be correct in the FAO forestry statistics database, the data for the base year 1990 were adjusted on the basis of the statistics reported by PROBOS, the Dutch national correspondent to the Joint Forest Sector Questionnaire, reporting national forestry statistics to the FAO and other international organisations (see Arets et al., 2020).
11.5 Article 3.4 11.5.1 Information that demonstrates that activities under Article 3.4 have
occurred since 1 January 1990 and are human-induced The land use mapping approach used allows changes in Forest land to be monitored over time. All Forest land in the Netherlands is considered to be managed land. With the historic and current scarcity of land in the Netherlands (which has the highest population density of any country in Europe), any land use is the result of deliberate human decisions (as indicated in Section 11.4.1, too).
11.5.2 Information relating to Forest management 11.5.2.1 Conversion of natural forest to planted forest
The vast majority of forest in the Netherlands is planted and all of the forest area is considered managed forest. Conversion from (natural) forest to highly productive plantations is not common. Moreover, the

RIVM report 2020-0031
Page 303 of 525
effects of such conversions will already be factored into the information on carbon stocks in Forest land available from the NFIs. Therefore, emissions arising from the possible conversion of (natural) forest to plantations are already included in the carbon stock changes calculated from the NFIs and are already reported under FM.
11.5.2.2 Forest Management Reference Levels (FMRLs) The ‘Submission of information on forest management reference levels by the Netherlands’ of 20 April 2011 contains the information on the FMRLs as original submitted. It is published at https://unfccc.int/bodies/awg-kp/items/5896.php. After a correction in the calculation matrix of the HWP model, changes in the submission of information on FMRLs by the Netherlands were communicated on 20 May 2011. These are published at https://unfccc.int/files/meetings/ad_hoc_working_groups/kp/application/pdf/awgkp_netherlands_corr.pdf. These corrections contain updated values of the proposed reference levels. During the subsequent technical assessment of the submission mentioned above, the ERT noticed discrepancies in the area data used by the models. As result, the Netherlands reran the models with updated area data. This resulted in a revised FMRL of -1.464 Mt CO2 eq. per year (average 2013–2020) assuming instantaneous oxidation of HWP and a revised FMRL of -1.425 Mt CO2 eq. per year applying a first-order decay function to HWP. These numbers are included in the ‘Report of the technical assessment of the forest management reference level submission of the Netherlands submitted in 2011’, FCCC/TAR/2011/NLD, 19 September 2011, published at http://unfccc.int/resource/docs/2011/tar/nld01.pdf. The calculation of the cap on Forest management as required by paragraph 13 of the annex to decision 2/CMP.7 follows the guidance provided in paragraph 12 of decision 6/CMP.7. It is calculated as 3.5% of the base year GHG emissions excluding LULUCF, taking into account the corrected amount after the review of the NIR 2015 and the Initial Report. These total base year GHG emissions excluding LULUCF were 223,198.40 Gg CO2 eq., resulting in a 3.5% cap of 7,811.94 Gg CO2 eq. annually, or in total 62,495,511 Gg CO2 eq.
11.5.2.3 Technical corrections to FMRLs A number of changes in the Netherlands’ inventory caused methodological inconsistencies between the inventory and the FMRLs. This was partly because the accounting of HWP as agreed in decision 2/CMP.7 was not yet available at the time the FMRLs were submitted: natural disturbances were not yet included at the time of submission of the FMRLs. Moreover, new NFI statistics became available covering the period 2003–2012, resulting in recalculated historical data. As a result, before accounting at the end of the commitment period a technical correction of the FMRLs of the Netherlands will be necessary. The correction is currently being assessed and will be described in a forthcoming NIR.
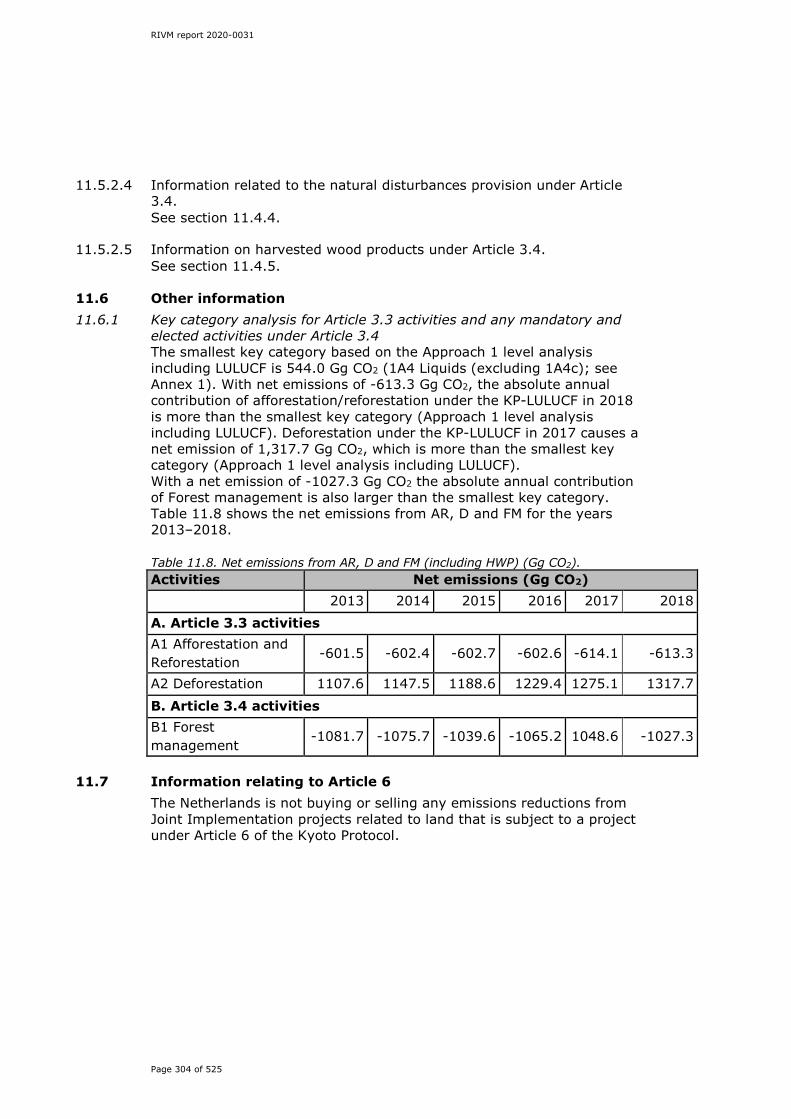
RIVM report 2020-0031
Page 304 of 525
11.5.2.4 Information related to the natural disturbances provision under Article 3.4. See section 11.4.4.
11.5.2.5 Information on harvested wood products under Article 3.4. See section 11.4.5.
11.6 Other information 11.6.1 Key category analysis for Article 3.3 activities and any mandatory and
elected activities under Article 3.4 The smallest key category based on the Approach 1 level analysis including LULUCF is 544.0 Gg CO2 (1A4 Liquids (excluding 1A4c); see Annex 1). With net emissions of -613.3 Gg CO2, the absolute annual contribution of afforestation/reforestation under the KP-LULUCF in 2018 is more than the smallest key category (Approach 1 level analysis including LULUCF). Deforestation under the KP-LULUCF in 2017 causes a net emission of 1,317.7 Gg CO2, which is more than the smallest key category (Approach 1 level analysis including LULUCF). With a net emission of -1027.3 Gg CO2 the absolute annual contribution of Forest management is also larger than the smallest key category. Table 11.8 shows the net emissions from AR, D and FM for the years 2013–2018. Table 11.8. Net emissions from AR, D and FM (including HWP) (Gg CO2). Activities Net emissions (Gg CO2) 2013 2014 2015 2016 2017 2018 A. Article 3.3 activities A1 Afforestation and Reforestation
-601.5 -602.4 -602.7 -602.6 -614.1 -613.3
A2 Deforestation 1107.6 1147.5 1188.6 1229.4 1275.1 1317.7 B. Article 3.4 activities B1 Forest management
-1081.7 -1075.7 -1039.6 -1065.2 1048.6 -1027.3
11.7 Information relating to Article 6
The Netherlands is not buying or selling any emissions reductions from Joint Implementation projects related to land that is subject to a project under Article 6 of the Kyoto Protocol.

RIVM report 2020-0031
Page 305 of 525
12 Information on accounting of Kyoto units
12.1 Background information The Netherlands’ Standard Electronic Format (SEF) report for 2019 containing the information required by paragraph 11 of the annex to decision 15/CMP.1, as updated by decision 3 CMP.11, paragraph 12, and adhering to the guidelines of the SEF, has been submitted to the UNFCCC Secretariat electronically (RREG1_NL_2019_2_1.xlsx) and (RREG1_NL_2019_2_1.xml).
12.2 Summary of information reported in the SEF tables There were 3,785,277 CERs in the registry at the end of 2019: 544,246 CERs were held in the Party holding accounts, 2,921,358 CERs were held in entity holding accounts and 319,673 CERs were held in the voluntary cancellation account. There were 10,000 Emission Reduction Units (ERUs) in the registry at the end of 2019. All 10,000 were held in the voluntary cancellation account. The total amount of the units (CERs and ERUs) in the registry corresponded to 3,795,277 tonnes CO2 eq.
12.3 Discrepancies and notifications
Annual submission item Submission 15/CMP.1 annex I.E paragraph 11: Standard electronic format (SEF)
The Standard Electronic Format report for 2019 has been submitted to the UNFCCC Secretariat electronically (RREG1_NL_2019_2_1.xlsx) and (RREG1_NL_2019_2_1.xml).
Annual submission item Submission 15/CMP.1 annex I.E paragraph 12: List of discrepant transactions
There were no discrepant transactions in 2019.
15/CMP.1 annex I.E paragraph 13 & 14: List of CDM notifications
No CDM notifications occurred in 2019.
15/CMP.1 annex I.E paragraph 15: List of non-replacements
No non-replacements occurred in 2019.
15/CMP.1 annex I.E paragraph 16: List of invalid units
No invalid units existed as at 31 December 2019.
15/CMP.1 annex I.E paragraph 17: Actions and changes to address discrepancies
No actions were taken or changes made to address discrepancies for the period under review.

RIVM report 2020-0031
Page 306 of 525
12.4 Publicly accessible information Annual submission item Submission 15/CMP.1 annex I.E Publicly accessible information
The information as described in 13/CMP.1 annex II.E paragraphs 44–48 is publicly available at the following internet addresses: www.emissionsauthority.nl/topics/public-information-kyoto and/or here: https://unionregistry.ec.europa.eu/euregistry/NL/public/reports/publicReports.xhtml All required information for a Party with an active Kyoto registry is provided, with the following exceptions: paragraph 46 Article 6 Project Information. The Netherlands does not host JI projects, as laid down in national legislation. This fact is stated in the information available at the above-mentioned internet address. That the Netherlands does not host JI projects is implied by Article 16.46c of the Environment Act (Wet milieubeheer) and explicitly stated in the explanatory memorandum to the act implementing the EC linking Directive (Directive 2004/101/EC, the Directive that links the ETS to the project-based activities under the Kyoto Protocol). As is explained in the memorandum, the government decided not to allow JI projects in the Netherlands since these would only increase the existing shortage of emissions allowances/assigned amount units. paragraph 47a/d/f/l in/out/current Holding and transaction information is provided on a holding type level, due to more detailed information being declared confidential by EU regulation. This follows from Article 110 of Commission Regulation (EU) no 389/2013. paragraph 47c The Netherlands does not host JI projects, as laid down in national legislation (ref. submission paragraph 46 above). paragraph 47e The Netherlands does not perform LULUCF activities and therefore does not issue RMUs. paragraph 47g No ERUs, CERs, AAUs or RMUs have been cancelled on the basis of activities under Article 3, paragraphs 3 and 4, to date. paragraph 47h No ERUs, CERs, AAUs or RMUs have been cancelled following determination by the Compliance Committee that the Party is not in compliance with its commitment under Article 3, paragraph 1, to date. paragraph 47i The number of other ERUs, CERs, AAUs and RMUs that have been cancelled is published by means of the SEF report. paragraph 47j The number of other ERUs, CERs, AAUs and RMUs that have been retired is published by means of the SEF report. paragraph 47k There is no previous commitment period to carry ERUs, CERs and AAUs over from. As suggested by the review team before, the Netherlands has included further information about carry-over and PPSR account below.
RIVM report 2020-0031
Page 307 of 525
12.5 Calculation of the commitment period reserve (CPR) The commitment period reserve equals the lower of either 90% of a Party’s assigned amount pursuant to Article 3(7bis), (8) and (8bis) or 100% of its most recently reviewed inventory, multiplied by 8. For the purposes of the joint fulfilment, the commitment period reserve (CPR) applies to the EU, its Member States individually and Iceland. The calculations of the CPR for the Netherlands are follows. Method 1 (90% of assigned amount) results in: 0.90 * 924,777,902 = 832,300,112 tonnes of CO2 equivalent. Method 2 (100% of most recently reviewed inventory): taking the 2019 submission as the most recently reviewed inventory and multiplying by 8 results in: 221,658,010 x 8 = 1,773,264,078 tonnes of CO2 equivalent. The CPR consequently amounts to 832,300,112 tonnes of CO2 equivalent.
12.6 KP-LULUCF accounting Not applicable, because the Netherlands has opted for end-of-period accounting for KP-LULUCF.
12.7 Carry-over and PPSR Carry-over The Netherlands will not make use of the carry-over possibility. It will not carry over any Kyoto Protocol Units from commitment period 1 to commitment period 2. PPSR Since 16 November 2016 the Union Registry has provided the technical facility to open a PPSR account. However, the PPSR account type must first be first introduced into the EU legislative framework. This was done by the Annex of Commission Delegated Regulation 2015/1844. According to Article 2 of the Delegated Regulation, however, this provision will become applicable on ‘the date of publication by the Commission in the Official Journal of the European Union of a communication on the entry into force of the Doha Amendment to the Kyoto Protocol’. Consequently, for the moment and until the Doha Amendment comes into force, we are not in a position to open the PPSR account in our National Registry. When the Doha Amendment comes into force, the Netherlands will open the PPSR account in our National Registry.

RIVM report 2020-0031
Page 308 of 525

RIVM report 2020-0031
Page 309 of 525
13 Information on changes in the National System
Extensive information on the National System is described in this National Inventory Report under the appropriate sections, as required by the UNFCCC Guidelines. More extensive background information on the National System is also included in the Netherlands’ 7th National Communication, the 4th Biennial Report and in the Initial Report. The initial review in 2007 concluded that the Netherlands’ National System had been established in accordance with the guidelines. The only changes in the National System since the Initial Report are the following:
• The coordination of the Emission Registration Project (NL-PRTR), in which emissions of about 350 substances are annually calculated, was performed until 1 January 2010 by the PBL. As of 1 January 2010, coordination has been assigned to the RIVM. Processes, protocols and methods remain unchanged. Many of the experts from the PBL have moved to the RIVM.
• The name of SenterNovem (single national entity/NIE) changed as of 1 January 2010 to NL Agency.
• The name of NL Agency (single national entity/NIE) changed as of 1 January 2014 to Netherlands Enterprise Agency (RVO).
• In 2010 the Ministry of Economic Affairs and the Ministry of Agriculture, Nature and Food Quality (LNV) merged into the Ministry of Economic Affairs, Agriculture and Innovation (EL&I). In 2012 the name of this ministry was changed to the Ministry of Economic Affairs (EZ).
• In 2015, the Netherlands replaced the 40 monitoring protocols (containing the methodology descriptions as part of the National System) by five methodology reports (one for each PRTR Task Force). The methodology reports are also part of the National System. From 2015 onwards the NIRs will be based on these methodology reports. The main reason for this change is that the update of five methodology reports is simpler than the update of 40 protocols. In addition, the administrative procedure is simplified because the updated methodology reports do not require an official announcement in the Government Gazette. For this reason, the Act on the Monitoring of Greenhouse Gases was updated in 2014. The methodology reports are checked by the National Inventory Entity and approved by the chairperson of the PRTR Task Force concerned. As part of the National System, the methodology reports are available at the National System website http://english.rvo.nl/nie;
• In 2017, the Ministry of Economic Affairs (EZ) was split into the Ministry of Economic Affairs and Climate Policy (EZK) and the Ministry of Agriculture, Nature and Food Quality (LNV). At the same time the responsibility for climate policy shifted from the (former) Ministry of Infrastructure and the Environment to the Ministry of Economic Affairs and Climate Policy.
• In 2017 the ERT recommended that more information should be provided on the methodologies used in the NIR. As a result of this recommendation, since 2018, the Netherlands has included
RIVM report 2020-0031
Page 310 of 525
methodology reports in the annual submission as an integral part of the NIR (see Annex 7).
These changes do not have any impact on the functions of the National System.

RIVM report 2020-0031
Page 311 of 525
14 Information on changes in national registry in 2018
The following changes to the national registry of the Netherlands occurred in 2019. Note that the 2019 SIAR confirms that previous recommendations have been implemented and included in the annual report.
Reporting item Description 15/CMP.1 annex II.E paragraph 32.(a) Change of name or contact
During the reported period, the alternative contact and release manager changed. No further changes occurred in the information below. Administrator Dutch Emissions Authority P.O. Box 91503 NL-2509 EC The Hague Tel.: +31 70 456 8050 Fax: +31 70 456 8247 Web: https://www.emissionsauthority.nl/ Main contact Mrs Maaike Breukels Manager Emissions Trading Dutch Emissions Authority P.O. Box 91503 NL-2509 EC The Hague Tel.: +31 70 456 8311 Fax: +31 70 456 8247 Email: [email protected] Alternative contact Mrs Renée Dubbeldeman Administrator registry Dutch Emissions Authority P.O. Box 91503 NL-2509 EC The Hague Tel.: +31 70 456 8050 Fax: +31 70 456 8247 Email: [email protected] Release Manager Mrs Renée Dubbeldeman Dutch Emissions Authority P.O. Box 91503 NL-2509 EC The Hague Tel.: +31 70 456 8050 Fax: +31 70 456 8247 Email: [email protected]
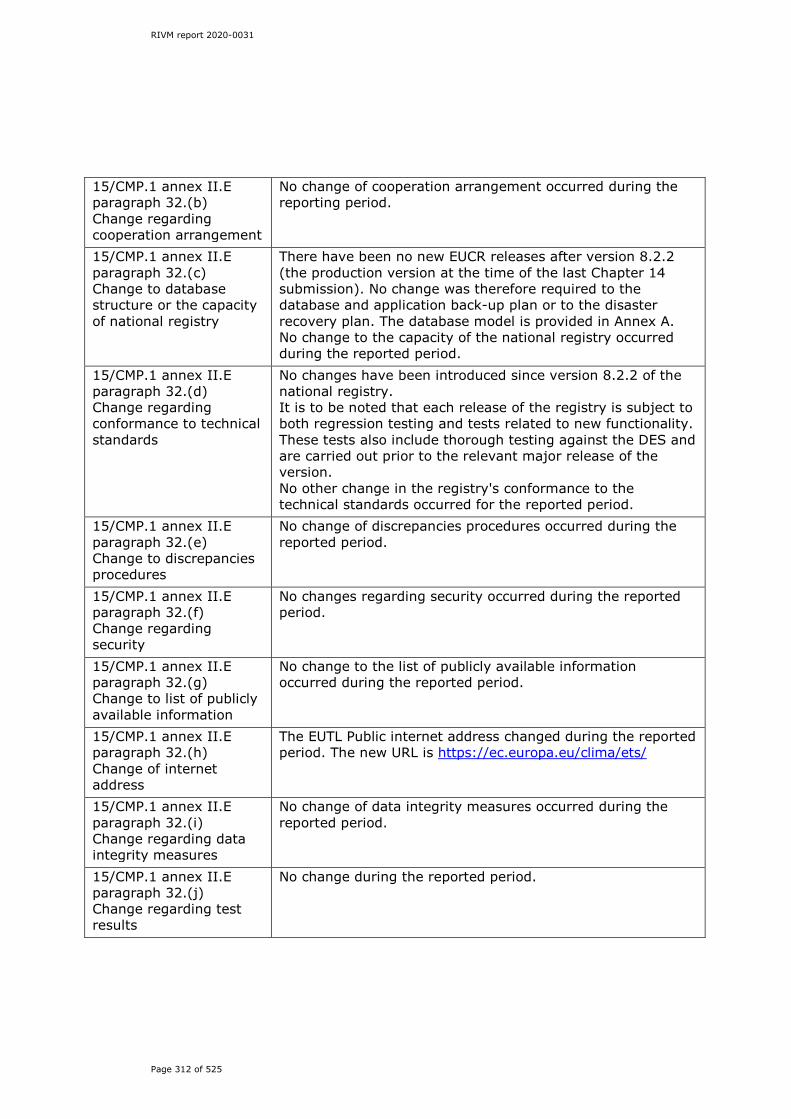
RIVM report 2020-0031
Page 312 of 525
15/CMP.1 annex II.E paragraph 32.(b) Change regarding cooperation arrangement
No change of cooperation arrangement occurred during the reporting period.
15/CMP.1 annex II.E paragraph 32.(c) Change to database structure or the capacity of national registry
There have been no new EUCR releases after version 8.2.2 (the production version at the time of the last Chapter 14 submission). No change was therefore required to the database and application back-up plan or to the disaster recovery plan. The database model is provided in Annex A. No change to the capacity of the national registry occurred during the reported period.
15/CMP.1 annex II.E paragraph 32.(d) Change regarding conformance to technical standards
No changes have been introduced since version 8.2.2 of the national registry. It is to be noted that each release of the registry is subject to both regression testing and tests related to new functionality. These tests also include thorough testing against the DES and are carried out prior to the relevant major release of the version. No other change in the registry's conformance to the technical standards occurred for the reported period.
15/CMP.1 annex II.E paragraph 32.(e) Change to discrepancies procedures
No change of discrepancies procedures occurred during the reported period.
15/CMP.1 annex II.E paragraph 32.(f) Change regarding security
No changes regarding security occurred during the reported period.
15/CMP.1 annex II.E paragraph 32.(g) Change to list of publicly available information
No change to the list of publicly available information occurred during the reported period.
15/CMP.1 annex II.E paragraph 32.(h) Change of internet address
The EUTL Public internet address changed during the reported period. The new URL is https://ec.europa.eu/clima/ets/
15/CMP.1 annex II.E paragraph 32.(i) Change regarding data integrity measures
No change of data integrity measures occurred during the reported period.
15/CMP.1 annex II.E paragraph 32.(j) Change regarding test results
No change during the reported period.

RIVM report 2020-0031
Page 313 of 525
15 Information on minimisation of adverse impacts in accordance with Article 3, paragraph 14
The Netherlands provided information on the minimisation of adverse impacts in accordance with Article 3, paragraph 14 in previous NIRs and national communications in accordance with the guidelines for the preparation of the information required under Article 7 of the Kyoto Protocol (Decision 15/CMP.1, Section I. H. and paragraph 36 in Section II. G.). The Netherlands strives to implement its commitments under the Kyoto Protocol in such a way that social, environmental and economic impacts on other countries, and on developing countries in particular, are minimised. Since the submission of the NIR 2019, there have been some changes in the activities on minimising adverse impacts. Policies are still in place and are being executed. Among the actions – a to f – listed in the Annex to Decision 15/CMP.1, Part I. H, ‘Minimisation of adverse impacts in accordance with Article 3, paragraph 14’, the Netherlands implemented national actions as well as actions to support and to assist developing countries. With regard to the progressive reduction or phasing-out of market imperfections, fiscal incentives, tax and duty exemptions, and subsidies in all greenhouse-gas-emitting sectors, taking into account the need for energy price reforms to reflect market prices and externalities (action a), energy prices have reflected market prices for many years. With (increasing) environmental taxation the externalities of energy use related to GHG emissions are increasingly reflected in energy prices. Examples are: environmental taxes on the use of natural gas up to 170,000 m3 increased from €0.1639 per m3 in 2011 to €0.1911 in 2015 and to €0.3331 in 2020; excise duty on gasoline increased in the same period from €0.71827 per litre, to €0.76607 and €0.80033 per litre in 2015 and 2020, respectively. An overview of all environmental taxes since 2013 is available at: https://www.belastingdienst.nl/wps/wcm/connect/bldcontentnl/belastingdienst/zakelijk/overige_belastingen/belastingen_op_milieugrondslag/tarieven_milieubelastingen/tabellen_tarieven_milieubelastingen?projectid=6750bae7-383b-4c97-bc7a-802790bd1110 and on excise duties at: https://download.belastingdienst.nl/douane/docs/tarievenlijst-accijns-acc0552z80fd.pdf For many years, there have been no subsidies in the Netherlands associated with the use of environmentally unsound and unsafe technologies, referred to as action b. There are only subsidies for environmentally friendly technologies or technologies that ensure increased sustainability. To promote Policy Coherence for Development, the Netherlands has adopted an Action Plan. One of its focus areas is climate change. In
RIVM report 2020-0031
Page 314 of 525
addition to integrating climate action into development cooperation, and increasing support for climate change adaptation and mitigation in developing countries, we have taken a number of other actions:
• We no longer provide public support, including export credits, to coal-fired power plants.
• In the international financial institutions we advocate more investment in renewable energy and support investment in fossil fuels only in exceptional circumstances, where no realistic alternatives are available.
• In climate funds such as the Green Climate Fund and the Climate Investment Funds we seek to ensure that funding benefits the poor.
• To halt deforestation in highly relevant supply chains such as timber, soy and palm oil, the Netherlands has initiated and promoted the Amsterdam Declarations. The two Declarations – one on stopping deforestation and one on sustainable production of palm oil – were launched on 7 December 2015 with the intention of achieving fully sustainable and deforestation-free agro-commodity supply chains in Europe by 2020. To date, in addition to the Netherlands; Denmark, Germany, Norway, the United Kingdom and France have signed. The Declarations are intended to stimulate private sector commitment and progress on agricultural commodities associated with deforestation (such as palm oil, soy and cocoa) for which Europe has a significant market share. By expanding market demand for sustainable commodities in the signatory European countries, the Declarations aim to incentivise sustainable production in producer countries.
The Netherlands also strives to accelerate the transition to renewable energy worldwide. The Netherlands is a founding member of the International Renewable Energy Agency (IRENA), an intergovernmental organisation that supports countries in their transition to a sustainable energy future. Through the Energy Sector Management Assistance Program (ESMAP) of the World Bank and the Friends of Fossil Fuel subsidy reform, the Netherlands supports countries (mostly) in the MENA region to reform fossil fuel subsidies while maintaining social safety nets. The Netherlands has decided to integrate development and climate action budgets, policies and activities for maximum impact and best results, especially for the poorest and most vulnerable. Committed to supporting developing countries in their climate action, we have been scaling up our climate finance. While public climate finance amounted in 2013 to €286 million, it increased to €416 million in 2015, €419 million in 2017 and €575 million in 2018. In addition, the Netherlands mobilised €73 million private finance in 2015, €335 million in 2017 and €411 million in 2018. We have provided support to multilateral climate funds such as the Least Developed Countries Fund, the Green Climate Fund, the GEF and the Scaling up Renewable Energy Program of the Strategic Climate Fund, one of the Climate Investment Funds. Furthermore, we focus our support on access to renewable energy, halting deforestation, climate-smart agriculture, integrated water resource management and the provision of climate-resilient water and sanitation (WASH) services. Disaster risk reduction is an integral part of our integrated water

RIVM report 2020-0031
Page 315 of 525
resource management programmes and receives support through Partners for Resilience. Gender is an important cross-cutting issue, as climate action is most effective when it builds on the capacities of both genders and addresses both their needs and their vulnerabilities. There is no Dutch policy related to cooperating in the technological development of non-energy uses of fossil fuels (action c). The Netherlands will continue to support and cooperate with developing country parties in relation to actions d–f. Examples from recent programmes include the following:
• The project Solar for Farms in Uganda/Milking the Sun makes high-quality and affordable solar lamps and solar home systems available to dairy cooperative members through the provision of financing, thereby increasing farm production, lowering household emissions (substituting solar for kerosene) and providing improved lighting for dairy and household activities.
• The African Biogas Partnership Program (ABPP) builds capacity in the biogas sector of five African countries: Ethiopia, Uganda, Burkina Faso, Kenya and Tanzania. The programme assists these countries in applying domestic biogas as a climate-friendly solution for energy, organic fertiliser and livestock keeping.
• The Netherlands funds capacity building in geothermal energy as delivered by both bilateral and multilateral programmes, in particular by the World Bank and the International Finance Corporation (IFC). These programmes share the common characteristic of being ‘upstream’ interventions, aimed at eliminating structural constraints such as feed-in tariff hurdles for electricity generated by geothermal sources.
• The National Geothermal Capacity-Building Programme in Indonesia works to develop Indonesia’s geothermic potential at various locations, calculated to be 27,000 MW, of which only 1,052 MW (4%) was being used in 2008. The objective of this public–private partnership is to develop and strengthen the structure of human resources development, which is needed to provide the workforce for the development and implementation of the planned infrastructure for geothermal energy in Indonesia.
• The Energy Sector Management Assistance Program (ESMAP) supports, among other things, reform of fossil fuel subsidies through South–South cooperation (support for targeted research, design and preparation, capacity development, political economy strategies and communication). South–South exchange demonstrates that many countries struggle with the challenge of reducing the fiscal burden of fossil fuel subsidies and are keen to learn from the experiences of front-runner countries in their region, like Egypt in the MENA region.
• The Ghana Climate Innovation Centre (GCIC), supported by the World Bank Group’s infoDev, helps local small and medium-sized enterprises (SMEs) in clean technology as well as helping climate innovators to commercialise and develop the most innovative private-sector solutions to climate change. It provides entrepreneurs in clean technology with the knowledge, capital and market access required to launch and grow their businesses. The success of these enterprises leads to emissions reductions

RIVM report 2020-0031
Page 316 of 525
and improved climate resilience, while also enabling developing countries to realise greater value in the innovation value chain, build competitive sectors and create jobs.
Public–private partnerships are an essential feature of Dutch climate policies. In recent years the Netherlands has also joined or initiated several alliances such as the Global Delta Coalition, the Climate Smart Agriculture Alliance and the Tropical Forest Alliance. Collaboration between authorities, business and knowledge institutions The Netherlands will be working more and more closely with companies and knowledge institutions to contribute to combating climate change and its consequences. The innovations and financial strength of these parties are essential to meet the challenges of climate change together. The Netherlands has, for example, a great deal of expertise in the fields of water, food security and energy and we are already collaborating with various countries in these fields: on water security, for instance, with Vietnam, Colombia and Indonesia. In the future, the private sector and knowledge institutions will be more closely involved and this is a key factor in the Dutch strategy. It is also in line with our ambitions for the new climate instrument: to offer customisation and to let everyone make an appropriate contribution. Market mechanisms The flexible mechanisms under the Protocol – (1) Emissions Trading (i.e. the European Union Emissions Trading Scheme, EU-ETS), (2) Joint Implementation and (3) Clean Development – are all tools incorporated into the Protocol in order to share efforts aimed at reducing greenhouse gases, ensuring that investments are made where the money has optimal GHG-reducing effects, and thus ensuring a minimum impact on the world economy. The Netherlands has made use of each of the flexible mechanisms. It has also signed MoUs regarding Clean Development Mechanism (CDM) projects with several countries worldwide. The Netherlands is supporting the World Bank’s Partnership for Market Readiness (PMR), which will help countries use the carbon market. The PMR will promote new market instruments as well as adjustments to or expansion of the CDM. To buy carbon credits under the CDM, the Dutch Ministry of Infrastructure spent €151 million between 2005 and 2008 and €132.6 million in the period 2009–2012. The Ministry of Economic Affairs purchased carbon credits under Joint Implementation for €53.4 million between 2005 and 2008 and for €109.1 million for the period 2009–2012. In total, the Netherlands has contracted 33.2 million tonnes of carbon credits from CDM projects, 17.1 million tonnes from JI projects, 3 million tonnes from Latvia (Green Investment Scheme) and 2.2 million tonnes from Participation in Carbon Funds (PCF). Minimising adverse effects of biofuel production All biofuels on the market in Europe and the Netherlands must be in compliance with the sustainability criteria laid down by the Renewable Energy Directive (2009/28/EG). Only if biofuels are sustainable are they allowed to be used to fulfil the blending target. Compliance with these

RIVM report 2020-0031
Page 317 of 525
criteria must be demonstrated through one of the adopted certification systems. These certification systems are controlled by an independent audit. All biofuels produced in the Netherlands fulfil these requirements.

RIVM report 2020-0031
Page 318 of 525

RIVM report 2020-0031
Page 319 of 525
Annex 1 Key categories
A1.1 Introduction As explained in the 2006 Guidelines (IPCC, 2006), a key source category is prioritized within the national inventory system because its estimate has a significant influence on a country’s total inventory of direct GHGs in terms of the absolute level of emissions, the trend in emissions or both. For the identification of key categories in the Netherlands’ inventory, we allocated national emissions to the Intergovernmental Panel on Climate Change’s potential key source list, as presented in table 4.1 in chapter 4 of the 2006 IPCC Guidelines (Volume 1). As suggested in the guidance, carbon dioxide (CO2) emissions from stationary combustion (1A1, 1A2 and 1A4) are aggregated by fuel type. CO2, methane (CH4) and nitrous oxide (N2O) emissions from mobile combustion – road vehicles (1A3) – are assessed separately. CH4 and N2O emissions from aircraft and ships are relatively small (about 1–2 Gg CO2 eq.). Other mobile sources are not assessed separately by gas. Fugitive emissions from oil and gas operations (1B) are important sources of GHG emissions in the Netherlands. The most important gas/source combinations in this category are separately assessed. Emissions in other IPCC sectors are disaggregated, as suggested by the IPCC. The IPCC Approach 1 method consists of ranking the list of source category/gas combinations according to their contribution to national total annual emissions and to the national total trend. The categories at the top of the tables in this annex are the key sources, the total of whose emissions add up to 95% of the national total (excluding LULUCF): 33 categories for annual level assessment (emissions in 2018) and 39 categories for the trend assessment out of a total of 119 source categories. The IPCC Approach 2 method for the identification of key categories requires the incorporation of the uncertainty in each of these source categories before ordering the list of shares. This has been carried out using the uncertainty estimates presented in Annex 2 (for details of the Approach 1 uncertainty analysis see Olivier et al., 2009). Here, a total contribution of up to 90% to the overall uncertainty has been used to avoid the inclusion of too many small sources. The results of the Approach 1 and Approach 2 level and trend assessments are summarized in Table A1.1. A combination of Approach 1 and 2 and level and trend assessments, shows a total of 52 key categories (excluding LULUCF) and 56 including LULUCF. As expected, the Approach 2 level and trend assessments increase the importance of highly uncertain sources. It can be concluded, that in using the results of an Approach 2 key category assessment, 12 categories are added to the list of 40 Approach 1 level and trend key categories (excluding LULUCF):
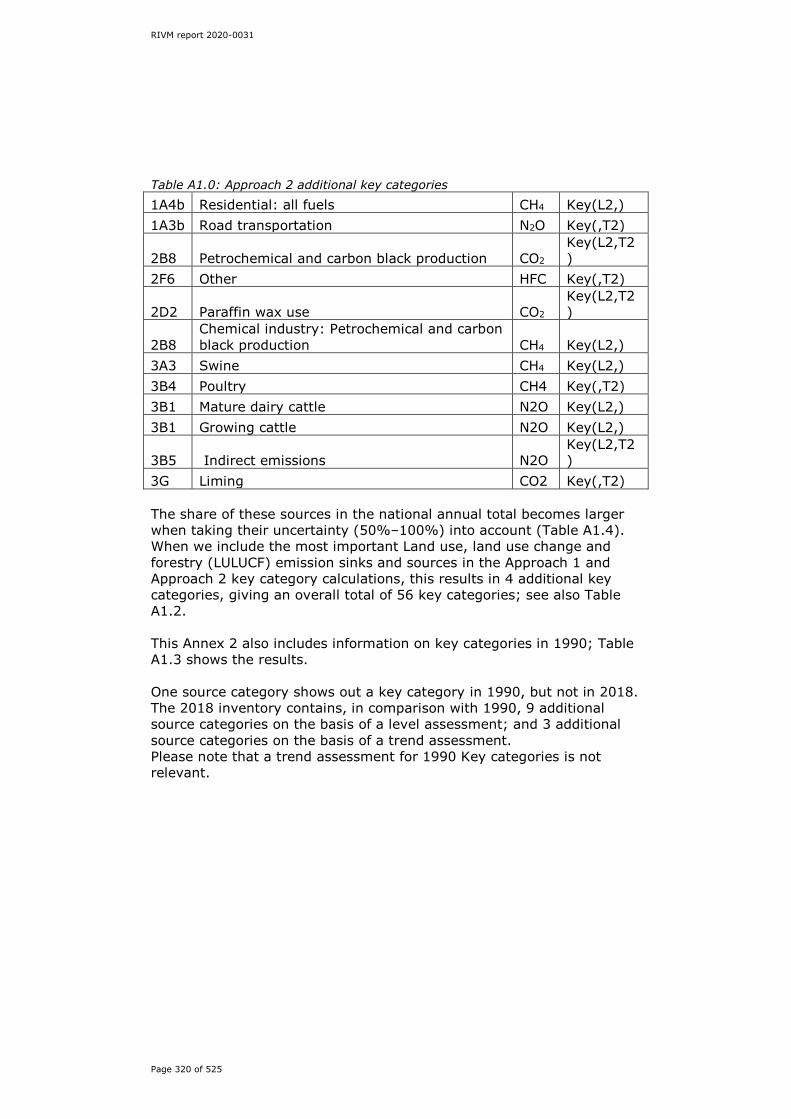
RIVM report 2020-0031
Page 320 of 525
Table A1.0: Approach 2 additional key categories
1A4b Residential: all fuels CH4 Key(L2,) 1A3b Road transportation N2O Key(,T2)
2B8 Petrochemical and carbon black production CO2 Key(L2,T2)
2F6 Other HFC Key(,T2)
2D2 Paraffin wax use CO2 Key(L2,T2)
2B8 Chemical industry: Petrochemical and carbon black production CH4 Key(L2,)
3A3 Swine CH4 Key(L2,) 3B4 Poultry CH4 Key(,T2) 3B1 Mature dairy cattle N2O Key(L2,) 3B1 Growing cattle N2O Key(L2,)
3B5 Indirect emissions N2O Key(L2,T2)
3G Liming CO2 Key(,T2) The share of these sources in the national annual total becomes larger when taking their uncertainty (50%–100%) into account (Table A1.4). When we include the most important Land use, land use change and forestry (LULUCF) emission sinks and sources in the Approach 1 and Approach 2 key category calculations, this results in 4 additional key categories, giving an overall total of 56 key categories; see also Table A1.2. This Annex 2 also includes information on key categories in 1990; Table A1.3 shows the results. One source category shows out a key category in 1990, but not in 2018. The 2018 inventory contains, in comparison with 1990, 9 additional source categories on the basis of a level assessment; and 3 additional source categories on the basis of a trend assessment. Please note that a trend assessment for 1990 Key categories is not relevant.
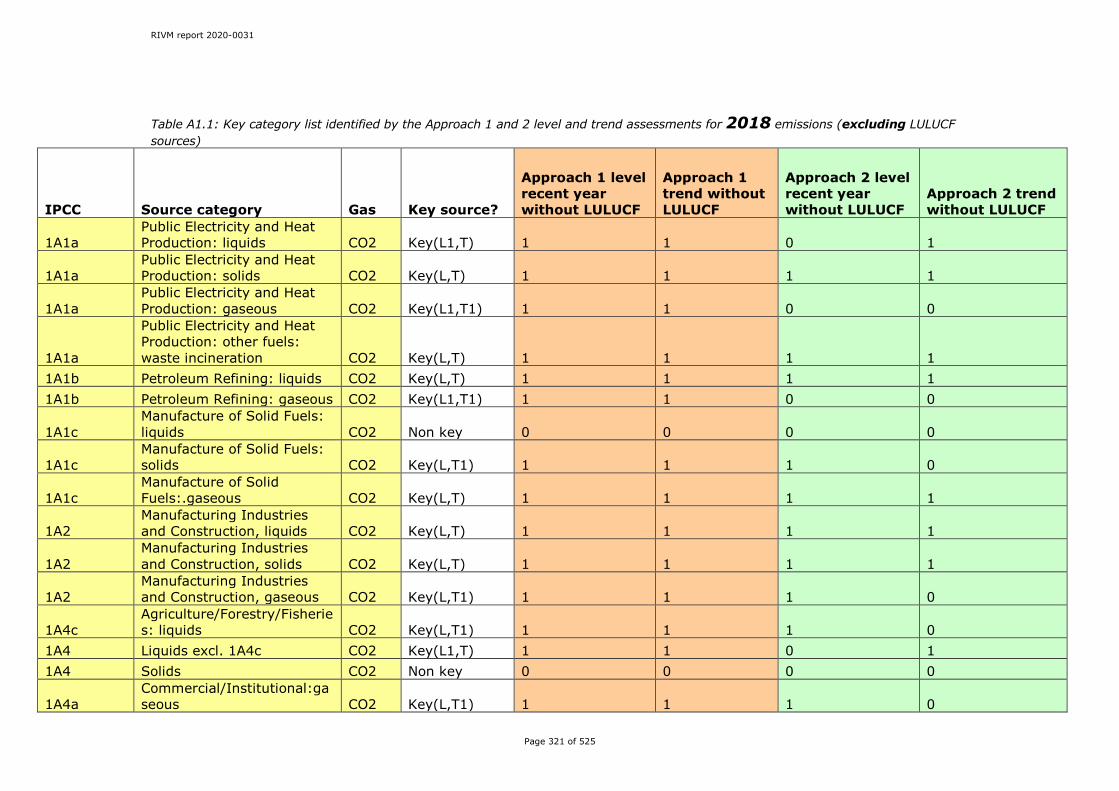
RIVM report 2020-0031
Page 321 of 525
Table A1.1: Key category list identified by the Approach 1 and 2 level and trend assessments for 2018 emissions (excluding LULUCF sources)
IPCC Source category Gas Key source?
Approach 1 level recent year without LULUCF
Approach 1 trend without LULUCF
Approach 2 level recent year without LULUCF
Approach 2 trend without LULUCF
1A1a Public Electricity and Heat Production: liquids CO2 Key(L1,T) 1 1 0 1
1A1a Public Electricity and Heat Production: solids CO2 Key(L,T) 1 1 1 1
1A1a Public Electricity and Heat Production: gaseous CO2 Key(L1,T1) 1 1 0 0
1A1a
Public Electricity and Heat Production: other fuels: waste incineration CO2 Key(L,T) 1 1 1 1
1A1b Petroleum Refining: liquids CO2 Key(L,T) 1 1 1 1 1A1b Petroleum Refining: gaseous CO2 Key(L1,T1) 1 1 0 0
1A1c Manufacture of Solid Fuels: liquids CO2 Non key 0 0 0 0
1A1c Manufacture of Solid Fuels: solids CO2 Key(L,T1) 1 1 1 0
1A1c Manufacture of Solid Fuels:.gaseous CO2 Key(L,T) 1 1 1 1
1A2 Manufacturing Industries and Construction, liquids CO2 Key(L,T) 1 1 1 1
1A2 Manufacturing Industries and Construction, solids CO2 Key(L,T) 1 1 1 1
1A2 Manufacturing Industries and Construction, gaseous CO2 Key(L,T1) 1 1 1 0
1A4c Agriculture/Forestry/Fisheries: liquids CO2 Key(L,T1) 1 1 1 0
1A4 Liquids excl. 1A4c CO2 Key(L1,T) 1 1 0 1 1A4 Solids CO2 Non key 0 0 0 0
1A4a Commercial/Institutional:gaseous CO2 Key(L,T1) 1 1 1 0

RIVM report 2020-0031
Page 322 of 525
IPCC Source category Gas Key source?
Approach 1 level recent year without LULUCF
Approach 1 trend without LULUCF
Approach 2 level recent year without LULUCF
Approach 2 trend without LULUCF
1A4b Residential gaseous CO2 Key(L,T1) 1 1 1 0
1A4c Agriculture/Forestry/Fisheries:gaseous CO2 Key(L,T) 1 1 1 1
1A5 Military use:liquids CO2 Non key 0 0 0 0 1A1 Energy Industries:all fuels CH4 Non key 0 0 0 0
1A2 Manufacturing Industries and Construction:all fuels CH4 Non key 0 0 0 0
1A4a Commercial/Institutional:all fuels CH4 Non key 0 0 0 0
1A4b Residential:all fuels CH4 Key(L2,) 0 0 1 0
1A4c Agriculture/Forestry/Fisheries:all fuels CH4 Key(L,T) 1 1 1 1
1A5 Military use:liquids CH4 Non key 0 0 0 0 1A1 Energy Industries:all fuels N2O Non key 0 0 0 0
1A2 Manufacturing Industries and Construction:all fuels N2O Non key 0 0 0 0
1A4 Other Sectors:all fuels N2O Non key 0 0 0 0 1A5 Military use:liquids N2O Non key 0 0 0 0
1A3b Road transportation: gasoline CO2 Key(L,T) 1 1 1 1
1A3b Road transportation: diesel oil CO2 Key(L,T) 1 1 1 1
1A3b Road transportation: LPG CO2 Key(,T) 0 1 0 1
1A3b Road transportation:gaseous CO2 Non key 0 0 0 0
1A3b Road transportation:other fuels CO2 Non key 0 0 0 0
1A3d Domestic navigation CO2 Key(L1,T1) 1 1 0 0 1A3a Domestic aviation CO2 Non key 0 0 0 0 1A3c Railways CO2 Non key 0 0 0 0

RIVM report 2020-0031
Page 323 of 525
IPCC Source category Gas Key source?
Approach 1 level recent year without LULUCF
Approach 1 trend without LULUCF
Approach 2 level recent year without LULUCF
Approach 2 trend without LULUCF
1A3e Other Transportation CO2 Non key 0 0 0 0 1A3 exl1A3b Other CH4 Non key 0 0 0 0 1A3 exl1A3b Other N2O Non key 0 0 0 0 1A3b Road transportation CH4 Non key 0 0 0 0 1A3b Road transportation N2O Key(L2,T2) 0 0 1 1 1B2c Venting and flaring CH4 Key(,T) 0 1 0 1 1B2b Natural gas CH4 Non key 0 0 0 0 1B2a Oil CH4 Non key 0 0 0 0 1B1b Solid fuel transformation CO2 Non key 0 0 0 0 1B1b Solid fuel transformation CH4 Non key 0 0 0 0
1B2 Fugitive emissions from oil and gas operations CO2 Key(L,T) 1 1 1 1
2A1 Cement production CO2 Non key 0 0 0 0 2A2 Lime production CO2 Non key 0 0 0 0 2A3 Glass production CO2 Non key 0 0 0 0 2A4a Ceramics CO2 Non key 0 0 0 0 2A4b Other uses of soda ash CO2 Non key 0 0 0 0 2A4d Other CO2 Key(L,T) 1 1 1 1 2B1 Ammonia production CO2 Key(L,T1) 1 1 1 0 2B2 Nitric acid production N2O Key(,T) 0 1 0 1 2B4 Caprolactam production N2O Key(L,) 1 0 1 0
2B8 Petrochemical and carbon black production CO2 Key(L2,T2) 0 0 1 1
2B10 Other N2O Non key 0 0 0 0 2C1 Iron and steel production CO2 Non key 0 0 0 0 2C3 Aluminium production CO2 Key(,T1) 0 1 0 0
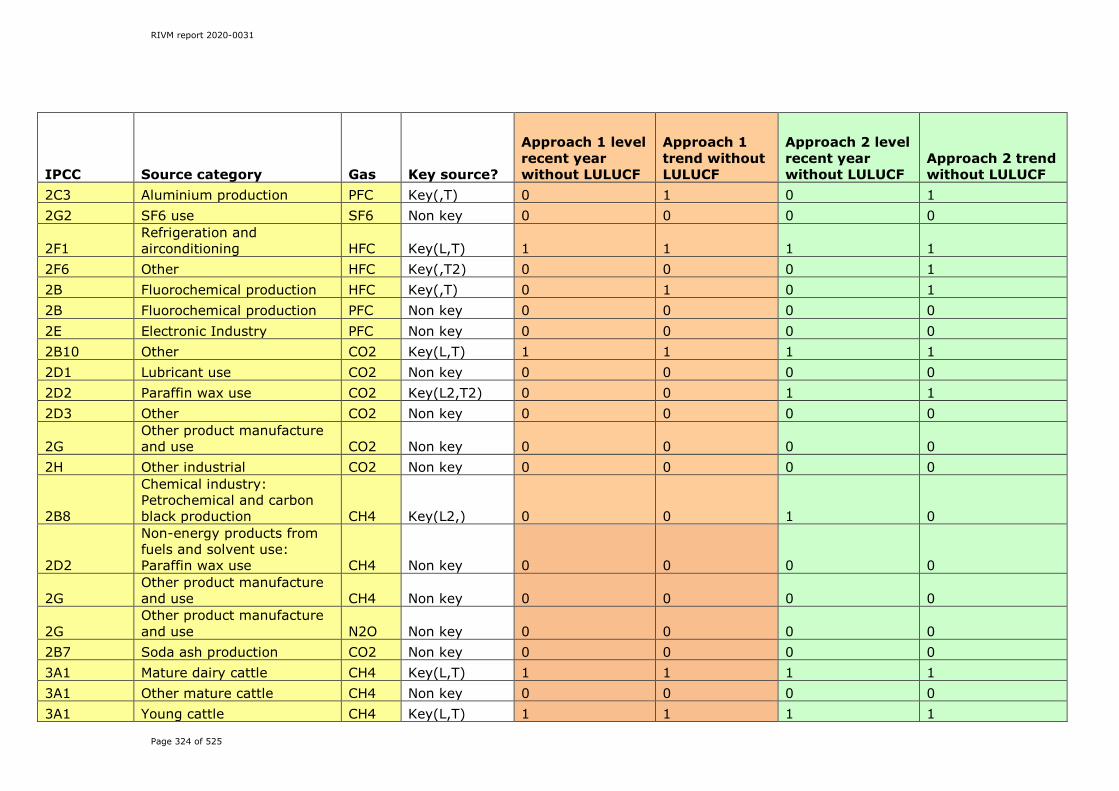
RIVM report 2020-0031
Page 324 of 525
IPCC Source category Gas Key source?
Approach 1 level recent year without LULUCF
Approach 1 trend without LULUCF
Approach 2 level recent year without LULUCF
Approach 2 trend without LULUCF
2C3 Aluminium production PFC Key(,T) 0 1 0 1 2G2 SF6 use SF6 Non key 0 0 0 0
2F1 Refrigeration and airconditioning HFC Key(L,T) 1 1 1 1
2F6 Other HFC Key(,T2) 0 0 0 1 2B Fluorochemical production HFC Key(,T) 0 1 0 1 2B Fluorochemical production PFC Non key 0 0 0 0 2E Electronic Industry PFC Non key 0 0 0 0 2B10 Other CO2 Key(L,T) 1 1 1 1 2D1 Lubricant use CO2 Non key 0 0 0 0 2D2 Paraffin wax use CO2 Key(L2,T2) 0 0 1 1 2D3 Other CO2 Non key 0 0 0 0
2G Other product manufacture and use CO2 Non key 0 0 0 0
2H Other industrial CO2 Non key 0 0 0 0
2B8
Chemical industry: Petrochemical and carbon black production CH4 Key(L2,) 0 0 1 0
2D2
Non-energy products from fuels and solvent use: Paraffin wax use CH4 Non key 0 0 0 0
2G Other product manufacture and use CH4 Non key 0 0 0 0
2G Other product manufacture and use N2O Non key 0 0 0 0
2B7 Soda ash production CO2 Non key 0 0 0 0 3A1 Mature dairy cattle CH4 Key(L,T) 1 1 1 1 3A1 Other mature cattle CH4 Non key 0 0 0 0 3A1 Young cattle CH4 Key(L,T) 1 1 1 1
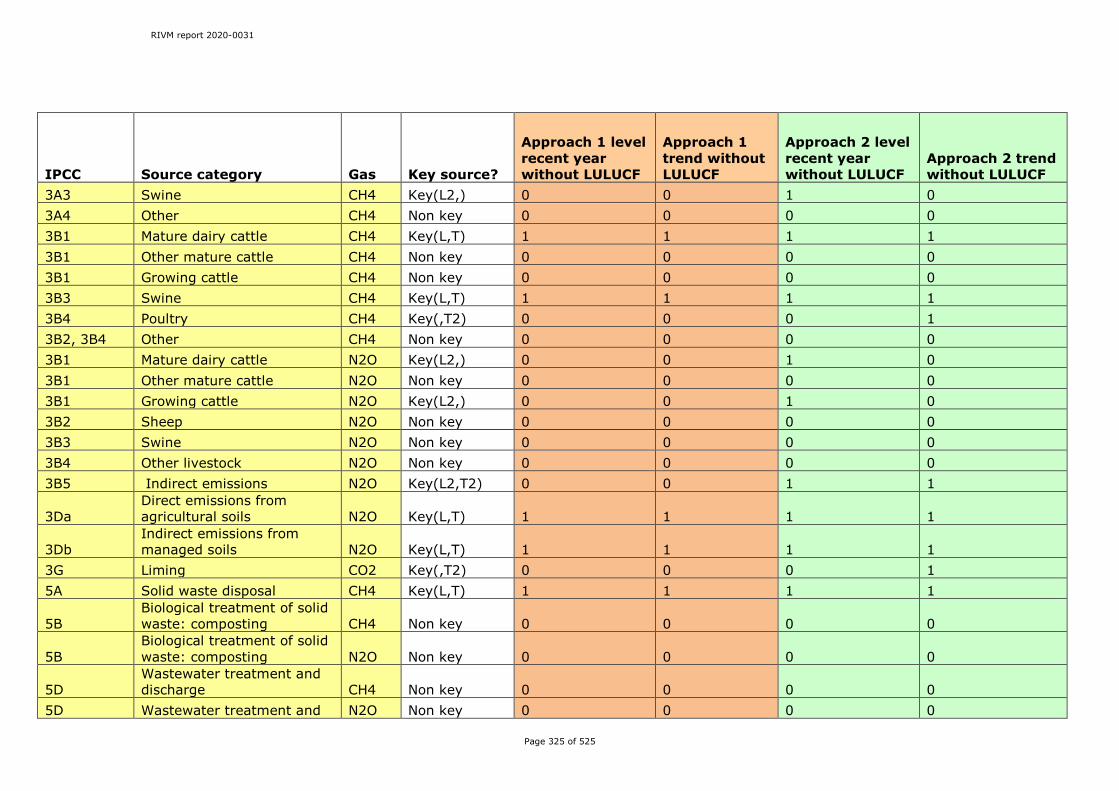
RIVM report 2020-0031
Page 325 of 525
IPCC Source category Gas Key source?
Approach 1 level recent year without LULUCF
Approach 1 trend without LULUCF
Approach 2 level recent year without LULUCF
Approach 2 trend without LULUCF
3A3 Swine CH4 Key(L2,) 0 0 1 0 3A4 Other CH4 Non key 0 0 0 0 3B1 Mature dairy cattle CH4 Key(L,T) 1 1 1 1 3B1 Other mature cattle CH4 Non key 0 0 0 0 3B1 Growing cattle CH4 Non key 0 0 0 0 3B3 Swine CH4 Key(L,T) 1 1 1 1 3B4 Poultry CH4 Key(,T2) 0 0 0 1 3B2, 3B4 Other CH4 Non key 0 0 0 0 3B1 Mature dairy cattle N2O Key(L2,) 0 0 1 0 3B1 Other mature cattle N2O Non key 0 0 0 0 3B1 Growing cattle N2O Key(L2,) 0 0 1 0 3B2 Sheep N2O Non key 0 0 0 0 3B3 Swine N2O Non key 0 0 0 0 3B4 Other livestock N2O Non key 0 0 0 0 3B5 Indirect emissions N2O Key(L2,T2) 0 0 1 1
3Da Direct emissions from agricultural soils N2O Key(L,T) 1 1 1 1
3Db Indirect emissions from managed soils N2O Key(L,T) 1 1 1 1
3G Liming CO2 Key(,T2) 0 0 0 1 5A Solid waste disposal CH4 Key(L,T) 1 1 1 1
5B Biological treatment of solid waste: composting CH4 Non key 0 0 0 0
5B Biological treatment of solid waste: composting N2O Non key 0 0 0 0
5D Wastewater treatment and discharge CH4 Non key 0 0 0 0
5D Wastewater treatment and N2O Non key 0 0 0 0

RIVM report 2020-0031
Page 326 of 525
IPCC Source category Gas Key source?
Approach 1 level recent year without LULUCF
Approach 1 trend without LULUCF
Approach 2 level recent year without LULUCF
Approach 2 trend without LULUCF
discharge
5D Open burning of waste CH4 Non key 0 0 0 0 5D Open burning of waste N2O Non key 0 0 0 0 6 Indirect CO2 CO2 Key(,T) 0 1 0 1 SUM 33 39 37 36

RIVM report 2020-0031
Page 327 of 525
Table A1.2 Key source list identified by the Approach 1 and Approach 2 level and trend assessments for 2018 emissions (including LULUCF sources)
IPCC Source category Gas Key source?
Approach 1 level recent year incl. LULUCF
Approach 1 trend incl. LULUCF
Approach 2 level recent year incl. LULUCF
Approach 2 trend incl. LULUCF
1A1a Public Electricity and Heat Production: liquids CO2 Key(L1,T) 1 1 0 1
1A1a Public Electricity and Heat Production: solids CO2 Key(L,T) 1 1 1 1
1A1a Public Electricity and Heat Production: gaseous CO2 Key(L1,T1) 1 1 0 0
1A1a Public Electricity and Heat Production: other fuels: waste incineration CO2 Key(L,T) 1 1 1 1
1A1b Petroleum Refining: liquids CO2 Key(L,T) 1 1 1 1 1A1b Petroleum Refining: gaseous CO2 Key(L1,T1) 1 1 0 0 1A1c Manufacture of Solid Fuels: liquids CO2 Non key 0 0 0 0 1A1c Manufacture of Solid Fuels: solids CO2 Key(L,T1) 1 1 0 0 1A1c Manufacture of Solid Fuels:.gaseous CO2 Key(L,T) 1 1 1 1
1A2 Manufacturing Industries and Construction, liquids CO2 Key(L,T) 1 1 1 1
1A2 Manufacturing Industries and Construction, solids CO2 Key(L,T) 1 1 1 1
1A2 Manufacturing Industries and Construction, gaseous CO2 Key(L,T1) 1 1 1 0
1A4c Agriculture/Forestry/Fisheries: liquids CO2 Key(L,T1) 1 1 1 0 1A4 Liquids excl. 1A4c CO2 Key(L1,T) 1 1 0 1 1A4 Solids CO2 Non key 0 0 0 0 1A4a Commercial/Institutional:gaseous CO2 Key(L,T1) 1 1 1 0 1A4b Residential gaseous CO2 Key(L,T1) 1 1 1 0 1A4c Agriculture/Forestry/Fisheries:gaseous CO2 Key(L,T) 1 1 1 1 1A5 Military use:liquids CO2 Non key 0 0 0 0 1A1 Energy Industries:all fuels CH4 Non key 0 0 0 0
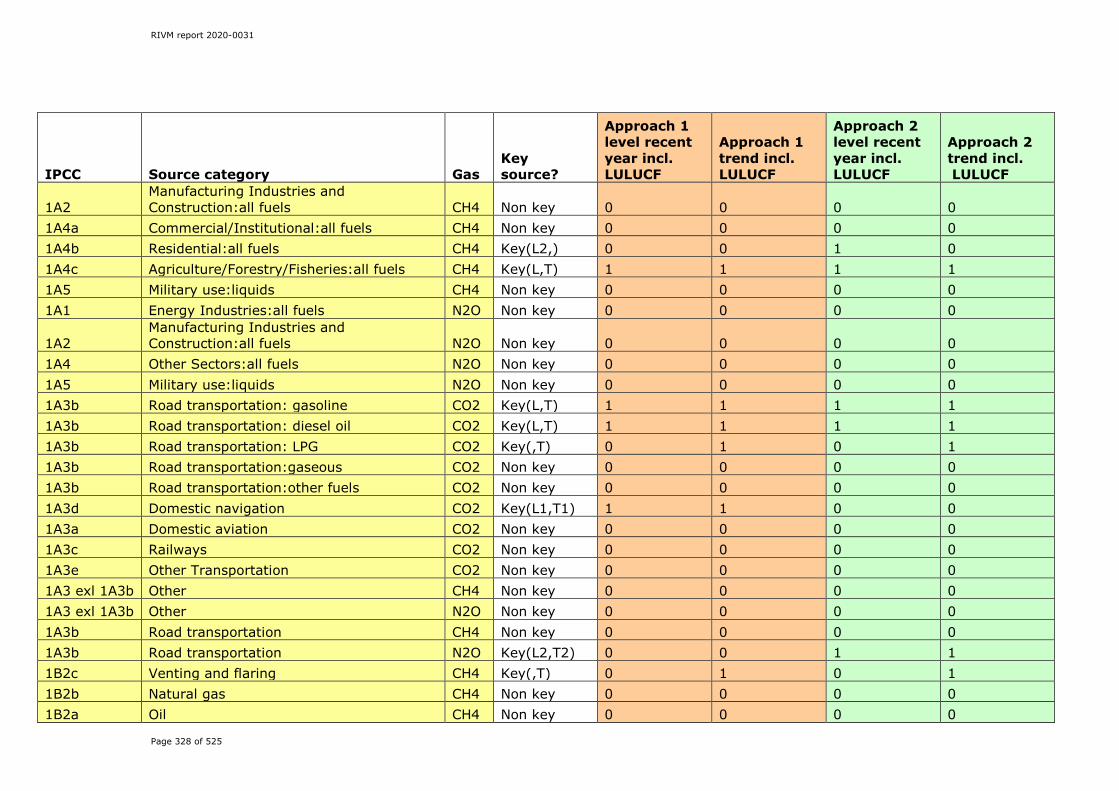
RIVM report 2020-0031
Page 328 of 525
IPCC Source category Gas Key source?
Approach 1 level recent year incl. LULUCF
Approach 1 trend incl. LULUCF
Approach 2 level recent year incl. LULUCF
Approach 2 trend incl. LULUCF
1A2 Manufacturing Industries and Construction:all fuels CH4 Non key 0 0 0 0
1A4a Commercial/Institutional:all fuels CH4 Non key 0 0 0 0 1A4b Residential:all fuels CH4 Key(L2,) 0 0 1 0 1A4c Agriculture/Forestry/Fisheries:all fuels CH4 Key(L,T) 1 1 1 1 1A5 Military use:liquids CH4 Non key 0 0 0 0 1A1 Energy Industries:all fuels N2O Non key 0 0 0 0
1A2 Manufacturing Industries and Construction:all fuels N2O Non key 0 0 0 0
1A4 Other Sectors:all fuels N2O Non key 0 0 0 0 1A5 Military use:liquids N2O Non key 0 0 0 0 1A3b Road transportation: gasoline CO2 Key(L,T) 1 1 1 1 1A3b Road transportation: diesel oil CO2 Key(L,T) 1 1 1 1 1A3b Road transportation: LPG CO2 Key(,T) 0 1 0 1 1A3b Road transportation:gaseous CO2 Non key 0 0 0 0 1A3b Road transportation:other fuels CO2 Non key 0 0 0 0 1A3d Domestic navigation CO2 Key(L1,T1) 1 1 0 0 1A3a Domestic aviation CO2 Non key 0 0 0 0 1A3c Railways CO2 Non key 0 0 0 0 1A3e Other Transportation CO2 Non key 0 0 0 0 1A3 exl 1A3b Other CH4 Non key 0 0 0 0 1A3 exl 1A3b Other N2O Non key 0 0 0 0 1A3b Road transportation CH4 Non key 0 0 0 0 1A3b Road transportation N2O Key(L2,T2) 0 0 1 1 1B2c Venting and flaring CH4 Key(,T) 0 1 0 1 1B2b Natural gas CH4 Non key 0 0 0 0 1B2a Oil CH4 Non key 0 0 0 0

RIVM report 2020-0031
Page 329 of 525
IPCC Source category Gas Key source?
Approach 1 level recent year incl. LULUCF
Approach 1 trend incl. LULUCF
Approach 2 level recent year incl. LULUCF
Approach 2 trend incl. LULUCF
1B1b Solid fuel transformation CO2 Non key 0 0 0 0 1B1b Solid fuel transformation CH4 Non key 0 0 0 0
1B2 Fugitive emissions from oil and gas operations CO2 Key(L,T) 1 1 1 1
2A1 Cement production CO2 Non key 0 0 0 0 2A2 Lime production CO2 Non key 0 0 0 0 2A3 Glass production CO2 Non key 0 0 0 0 2A4a Ceramics CO2 Non key 0 0 0 0 2A4b Other uses of soda ash CO2 Non key 0 0 0 0 2A4d Other CO2 Key(L,T) 1 1 1 1 2B1 Ammonia production CO2 Key(L,T1) 1 1 1 0 2B2 Nitric acid production N2O Key(,T) 0 1 0 1 2B4 Caprolactam production N2O Key(L,) 1 0 1 0 2B8 Petrochemical and carbon black production CO2 Key(L2,T2) 0 0 1 1 2B10 Other N2O Non key 0 0 0 0 2C1 Iron and steel production CO2 Non key 0 0 0 0 2C3 Aluminium production CO2 Key(,T1) 0 1 0 0 2C3 Aluminium production PFC Key(,T) 0 1 0 1 2G2 SF6 use SF6 Non key 0 0 0 0 2F1 Refrigeration and airconditioning HFC Key(L,T) 1 1 1 1 2F6 Other HFC Key(,T2) 0 0 0 1 2B Fluorochemical production HFC Key(,T) 0 1 0 1 2B Fluorochemical production PFC Non key 0 0 0 0 2E Electronic Industry PFC Non key 0 0 0 0 2B10 Other CO2 Key(L,T) 1 1 1 1 2D1 Lubricant use CO2 Non key 0 0 0 0
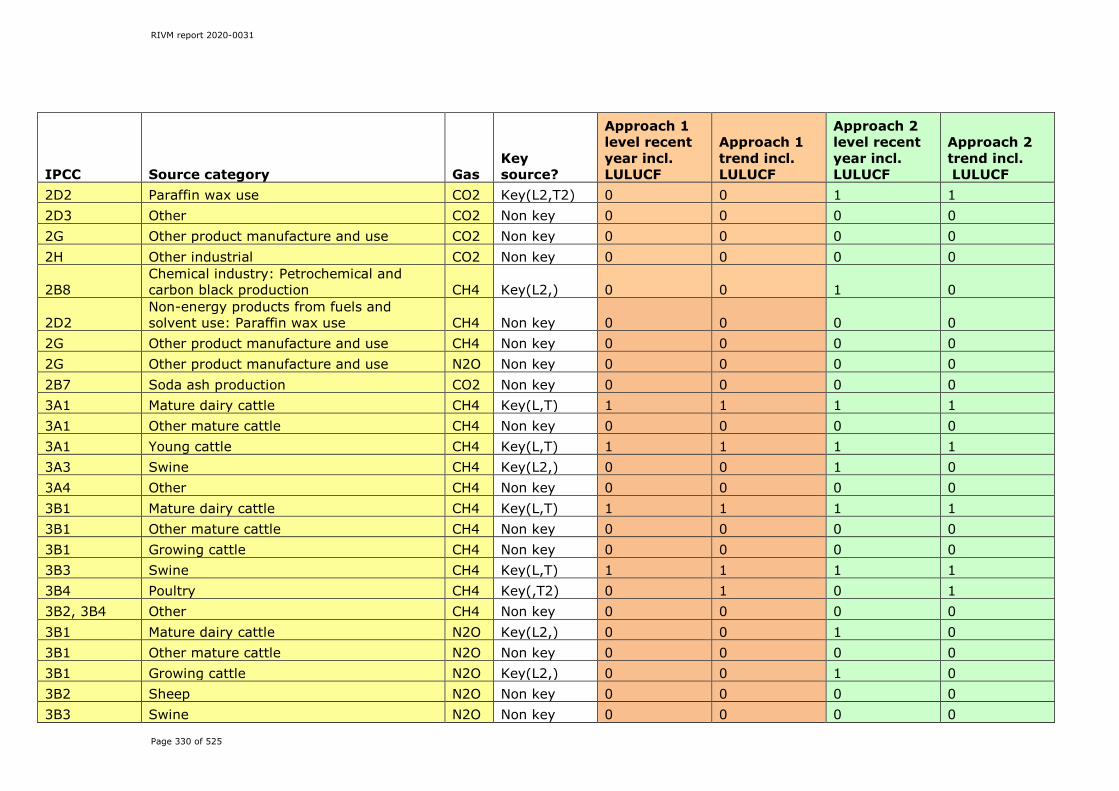
RIVM report 2020-0031
Page 330 of 525
IPCC Source category Gas Key source?
Approach 1 level recent year incl. LULUCF
Approach 1 trend incl. LULUCF
Approach 2 level recent year incl. LULUCF
Approach 2 trend incl. LULUCF
2D2 Paraffin wax use CO2 Key(L2,T2) 0 0 1 1 2D3 Other CO2 Non key 0 0 0 0 2G Other product manufacture and use CO2 Non key 0 0 0 0 2H Other industrial CO2 Non key 0 0 0 0
2B8 Chemical industry: Petrochemical and carbon black production CH4 Key(L2,) 0 0 1 0
2D2 Non-energy products from fuels and solvent use: Paraffin wax use CH4 Non key 0 0 0 0
2G Other product manufacture and use CH4 Non key 0 0 0 0 2G Other product manufacture and use N2O Non key 0 0 0 0 2B7 Soda ash production CO2 Non key 0 0 0 0 3A1 Mature dairy cattle CH4 Key(L,T) 1 1 1 1 3A1 Other mature cattle CH4 Non key 0 0 0 0 3A1 Young cattle CH4 Key(L,T) 1 1 1 1 3A3 Swine CH4 Key(L2,) 0 0 1 0 3A4 Other CH4 Non key 0 0 0 0 3B1 Mature dairy cattle CH4 Key(L,T) 1 1 1 1 3B1 Other mature cattle CH4 Non key 0 0 0 0 3B1 Growing cattle CH4 Non key 0 0 0 0 3B3 Swine CH4 Key(L,T) 1 1 1 1 3B4 Poultry CH4 Key(,T2) 0 1 0 1 3B2, 3B4 Other CH4 Non key 0 0 0 0 3B1 Mature dairy cattle N2O Key(L2,) 0 0 1 0 3B1 Other mature cattle N2O Non key 0 0 0 0 3B1 Growing cattle N2O Key(L2,) 0 0 1 0 3B2 Sheep N2O Non key 0 0 0 0 3B3 Swine N2O Non key 0 0 0 0

RIVM report 2020-0031
Page 331 of 525
IPCC Source category Gas Key source?
Approach 1 level recent year incl. LULUCF
Approach 1 trend incl. LULUCF
Approach 2 level recent year incl. LULUCF
Approach 2 trend incl. LULUCF
3B4 Other livestock N2O Non key 0 0 0 0 3B5 Indirect emissions N2O Key(L2,T2) 0 0 1 1 3Da Direct emissions from agricultural soils N2O Key(L,T) 1 1 1 1 3Db Indirect emissions from managed soils N2O Key(L,T) 1 1 1 1 3G Liming CO2 Key(,T2) 0 0 0 1 4 LULUCF: CH4 CH4 Non key 0 0 0 0 4A Forest Land CO2 Key(L,T) 1 1 1 1 4B Cropland N2O Non key 0 0 0 0 4B Cropland CO2 Key(L,) 1 0 1 0 4C Grassland CO2 Key(L,T) 1 1 1 1 4C Grassland N2O Non key 0 0 0 0 4G Harvested wood products CO2 Non key 0 0 0 0 4D Wetlands CO2 Non key 0 0 0 0 4E Settlements CO2 Key(L,T) 1 1 1 1 4F Other Land CO2 Non key 0 0 0 0 4H Other N2O Non key 0 0 0 0 5A Solid waste disposal CH4 Key(L,T) 1 1 1 1
5B Biological treatment of solid waste: composting CH4 Non key 0 0 0 0
5B Biological treatment of solid waste: composting N2O Non key 0 0 0 0
5D Wastewater treatment and discharge CH4 Non key 0 0 0 0 5D Wastewater treatment and discharge N2O Non key 0 0 0 0 5D Open burning of waste CH4 Non key 0 0 0 0 5D Open burning of waste N2O Non key 0 0 0 0 6 Indirect CO2 CO2 Key(,T) 0 1 0 1 SUM 37 43 40 39
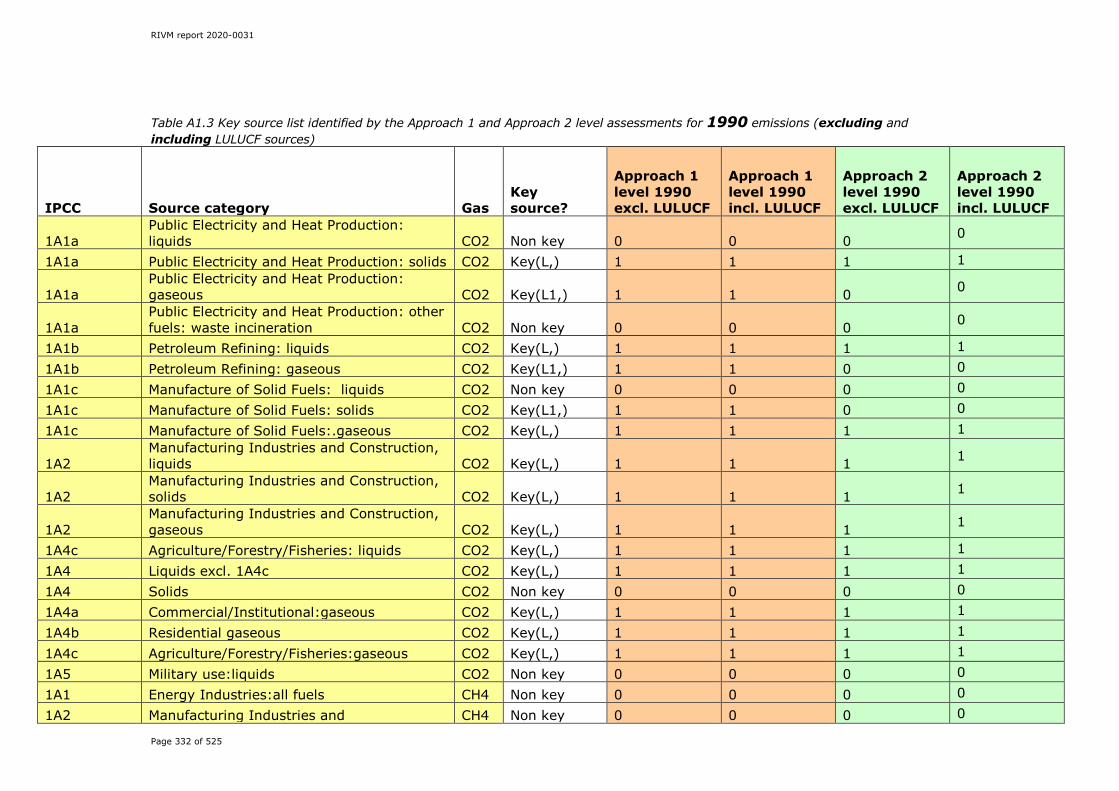
RIVM report 2020-0031
Page 332 of 525
Table A1.3 Key source list identified by the Approach 1 and Approach 2 level assessments for 1990 emissions (excluding and including LULUCF sources)
IPCC Source category Gas Key source?
Approach 1 level 1990 excl. LULUCF
Approach 1 level 1990 incl. LULUCF
Approach 2 level 1990 excl. LULUCF
Approach 2 level 1990 incl. LULUCF
1A1a Public Electricity and Heat Production: liquids CO2 Non key 0 0 0 0
1A1a Public Electricity and Heat Production: solids CO2 Key(L,) 1 1 1 1
1A1a Public Electricity and Heat Production: gaseous CO2 Key(L1,) 1 1 0 0
1A1a Public Electricity and Heat Production: other fuels: waste incineration CO2 Non key 0 0 0 0
1A1b Petroleum Refining: liquids CO2 Key(L,) 1 1 1 1
1A1b Petroleum Refining: gaseous CO2 Key(L1,) 1 1 0 0
1A1c Manufacture of Solid Fuels: liquids CO2 Non key 0 0 0 0
1A1c Manufacture of Solid Fuels: solids CO2 Key(L1,) 1 1 0 0
1A1c Manufacture of Solid Fuels:.gaseous CO2 Key(L,) 1 1 1 1
1A2 Manufacturing Industries and Construction, liquids CO2 Key(L,) 1 1 1 1
1A2 Manufacturing Industries and Construction, solids CO2 Key(L,) 1 1 1 1
1A2 Manufacturing Industries and Construction, gaseous CO2 Key(L,) 1 1 1 1
1A4c Agriculture/Forestry/Fisheries: liquids CO2 Key(L,) 1 1 1 1
1A4 Liquids excl. 1A4c CO2 Key(L,) 1 1 1 1
1A4 Solids CO2 Non key 0 0 0 0
1A4a Commercial/Institutional:gaseous CO2 Key(L,) 1 1 1 1
1A4b Residential gaseous CO2 Key(L,) 1 1 1 1
1A4c Agriculture/Forestry/Fisheries:gaseous CO2 Key(L,) 1 1 1 1
1A5 Military use:liquids CO2 Non key 0 0 0 0
1A1 Energy Industries:all fuels CH4 Non key 0 0 0 0
1A2 Manufacturing Industries and CH4 Non key 0 0 0 0
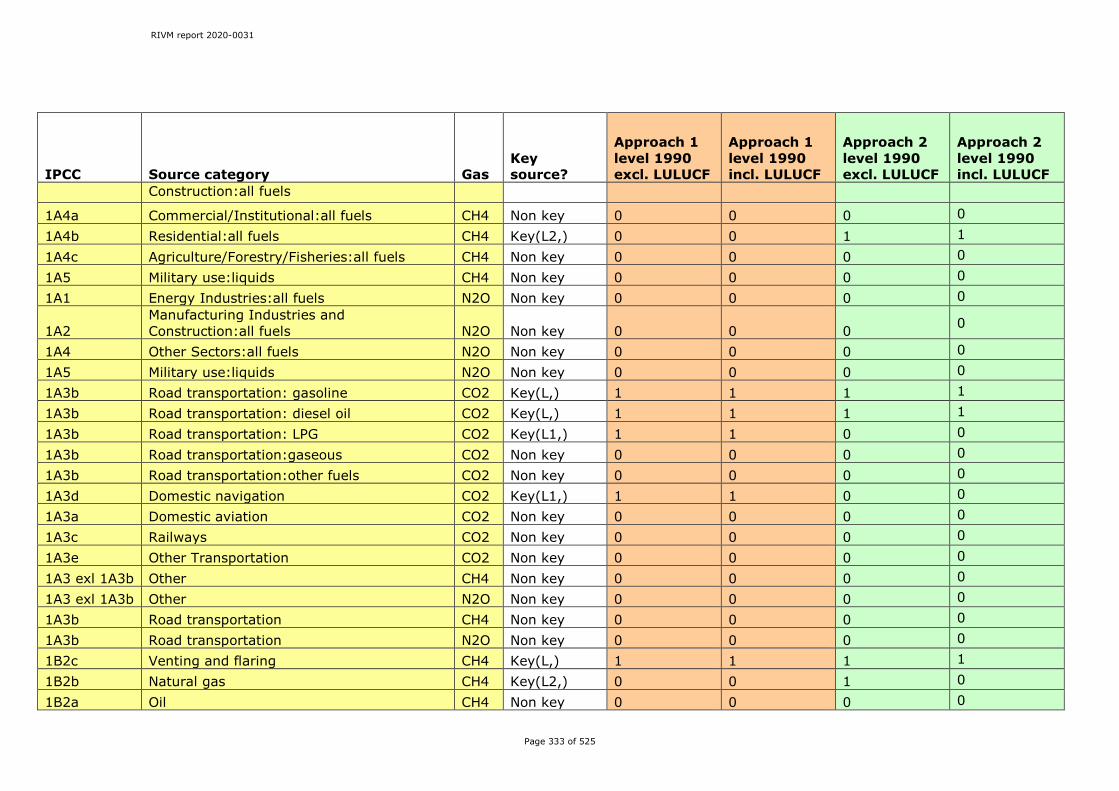
RIVM report 2020-0031
Page 333 of 525
IPCC Source category Gas Key source?
Approach 1 level 1990 excl. LULUCF
Approach 1 level 1990 incl. LULUCF
Approach 2 level 1990 excl. LULUCF
Approach 2 level 1990 incl. LULUCF
Construction:all fuels
1A4a Commercial/Institutional:all fuels CH4 Non key 0 0 0 0
1A4b Residential:all fuels CH4 Key(L2,) 0 0 1 1
1A4c Agriculture/Forestry/Fisheries:all fuels CH4 Non key 0 0 0 0
1A5 Military use:liquids CH4 Non key 0 0 0 0
1A1 Energy Industries:all fuels N2O Non key 0 0 0 0
1A2 Manufacturing Industries and Construction:all fuels N2O Non key 0 0 0 0
1A4 Other Sectors:all fuels N2O Non key 0 0 0 0
1A5 Military use:liquids N2O Non key 0 0 0 0
1A3b Road transportation: gasoline CO2 Key(L,) 1 1 1 1
1A3b Road transportation: diesel oil CO2 Key(L,) 1 1 1 1
1A3b Road transportation: LPG CO2 Key(L1,) 1 1 0 0
1A3b Road transportation:gaseous CO2 Non key 0 0 0 0
1A3b Road transportation:other fuels CO2 Non key 0 0 0 0
1A3d Domestic navigation CO2 Key(L1,) 1 1 0 0
1A3a Domestic aviation CO2 Non key 0 0 0 0
1A3c Railways CO2 Non key 0 0 0 0
1A3e Other Transportation CO2 Non key 0 0 0 0
1A3 exl 1A3b Other CH4 Non key 0 0 0 0
1A3 exl 1A3b Other N2O Non key 0 0 0 0
1A3b Road transportation CH4 Non key 0 0 0 0
1A3b Road transportation N2O Non key 0 0 0 0
1B2c Venting and flaring CH4 Key(L,) 1 1 1 1
1B2b Natural gas CH4 Key(L2,) 0 0 1 0
1B2a Oil CH4 Non key 0 0 0 0

RIVM report 2020-0031
Page 334 of 525
IPCC Source category Gas Key source?
Approach 1 level 1990 excl. LULUCF
Approach 1 level 1990 incl. LULUCF
Approach 2 level 1990 excl. LULUCF
Approach 2 level 1990 incl. LULUCF
1B1b Solid fuel transformation CO2 Non key 0 0 0 0
1B1b Solid fuel transformation CH4 Non key 0 0 0 0
1B2 Fugitive emissions from oil and gas operations CO2 Key(L,) 1 1 1 1
2A1 Cement production CO2 Non key 0 0 0 0 2A2 Lime production CO2 Non key 0 0 0 0 2A3 Glass production CO2 Non key 0 0 0 0 2A4a Ceramics CO2 Non key 0 0 0 0 2A4b Other uses of soda ash CO2 Non key 0 0 0 0 2A4d Other CO2 Key(L2,) 0 0 1 1 2B1 Ammonia production CO2 Key(L,) 1 1 1 1 2B2 Nitric acid production N2O Key(L,) 1 1 1 1 2B4 Caprolactam production N2O Key(L,) 1 1 1 0 2B8 Petrochemical and carbon black production CO2 Key(L2,) 0 0 1 1 2B10 Other N2O Non key 0 0 0 0 2C1 Iron and steel production CO2 Non key 0 0 0 0 2C3 Aluminium production CO2 Non key 0 0 0 0 2C3 Aluminium production PFC Key(L,) 1 1 1 1 2G2 SF6 use SF6 Non key 0 0 0 0 2F1 Refrigeration and airconditioning HFC Non key 0 0 0 0 2F6 Other HFC Non key 0 0 0 0 2B Fluorochemical production HFC Key(L,) 1 1 1 1 2B Fluorochemical production PFC Non key 0 0 0 0 2E Electronic Industry PFC Non key 0 0 0 0 2B10 Other CO2 Non key 0 0 0 0 2D1 Lubricant use CO2 Non key 0 0 0 0

RIVM report 2020-0031
Page 335 of 525
IPCC Source category Gas Key source?
Approach 1 level 1990 excl. LULUCF
Approach 1 level 1990 incl. LULUCF
Approach 2 level 1990 excl. LULUCF
Approach 2 level 1990 incl. LULUCF
2D2 Paraffin wax use CO2 Non key 0 0 0 0 2D3 Other CO2 Non key 0 0 0 0 2G Other product manufacture and use CO2 Non key 0 0 0 0 2H Other industrial CO2 Non key 0 0 0 0
2B8 Chemical industry: Petrochemical and carbon black production CH4 Non key 0 0 0 0
2D2 Non-energy products from fuels and solvent use: Paraffin wax use CH4 Non key 0 0 0 0
2G Other product manufacture and use CH4 Non key 0 0 0 0 2G Other product manufacture and use N2O Non key 0 0 0 0 2B7 Soda ash production CO2 Non key 0 0 0 0 3A1 Mature dairy cattle CH4 Key(L,) 1 1 1 1 3A1 Other mature cattle CH4 Non key 0 0 0 0 3A1 Young cattle CH4 Key(L,) 1 1 1 1 3A3 Swine CH4 Key(L2,) 0 0 1 1 3A4 Other CH4 Non key 0 0 0 0 3B1 Mature dairy cattle CH4 Key(L,) 1 1 1 1 3B1 Other mature cattle CH4 Non key 0 0 0 0 3B1 Growing cattle CH4 Non key 0 0 0 0 3B3 Swine CH4 Key(L,) 1 1 1 1 3B4 Poultry CH4 Non key 0 0 0 0 3B2, 3B4 Other CH4 Non key 0 0 0 0 3B1 Mature dairy cattle N2O Key(L2,) 0 0 1 1 3B1 Other mature cattle N2O Non key 0 0 0 0 3B1 Growing cattle N2O Non key 0 0 0 0 3B2 Sheep N2O Non key 0 0 0 0 3B3 Swine N2O Non key 0 0 0 0
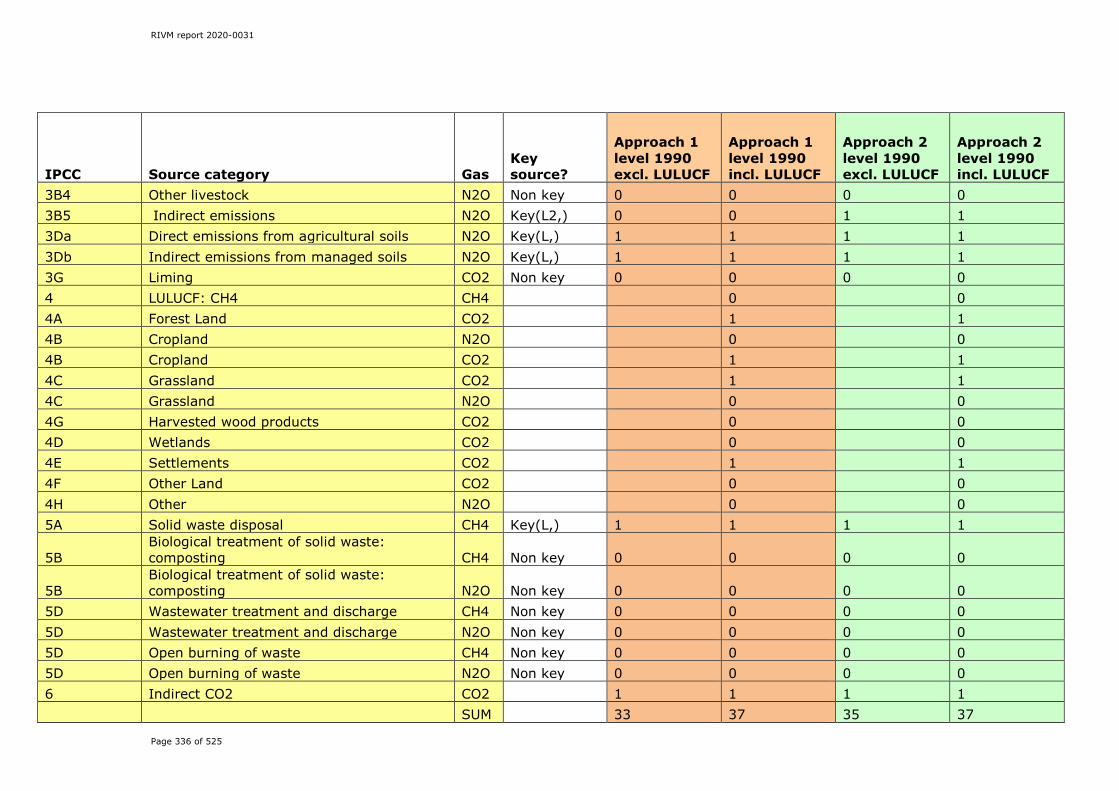
RIVM report 2020-0031
Page 336 of 525
IPCC Source category Gas Key source?
Approach 1 level 1990 excl. LULUCF
Approach 1 level 1990 incl. LULUCF
Approach 2 level 1990 excl. LULUCF
Approach 2 level 1990 incl. LULUCF
3B4 Other livestock N2O Non key 0 0 0 0 3B5 Indirect emissions N2O Key(L2,) 0 0 1 1 3Da Direct emissions from agricultural soils N2O Key(L,) 1 1 1 1 3Db Indirect emissions from managed soils N2O Key(L,) 1 1 1 1 3G Liming CO2 Non key 0 0 0 0 4 LULUCF: CH4 CH4 0 0 4A Forest Land CO2 1 1 4B Cropland N2O 0 0 4B Cropland CO2 1 1 4C Grassland CO2 1 1 4C Grassland N2O 0 0 4G Harvested wood products CO2 0 0 4D Wetlands CO2 0 0 4E Settlements CO2 1 1 4F Other Land CO2 0 0 4H Other N2O 0 0 5A Solid waste disposal CH4 Key(L,) 1 1 1 1
5B Biological treatment of solid waste: composting CH4 Non key 0 0 0 0
5B Biological treatment of solid waste: composting N2O Non key 0 0 0 0
5D Wastewater treatment and discharge CH4 Non key 0 0 0 0 5D Wastewater treatment and discharge N2O Non key 0 0 0 0 5D Open burning of waste CH4 Non key 0 0 0 0 5D Open burning of waste N2O Non key 0 0 0 0 6 Indirect CO2 CO2 1 1 1 1 SUM 33 37 35 37
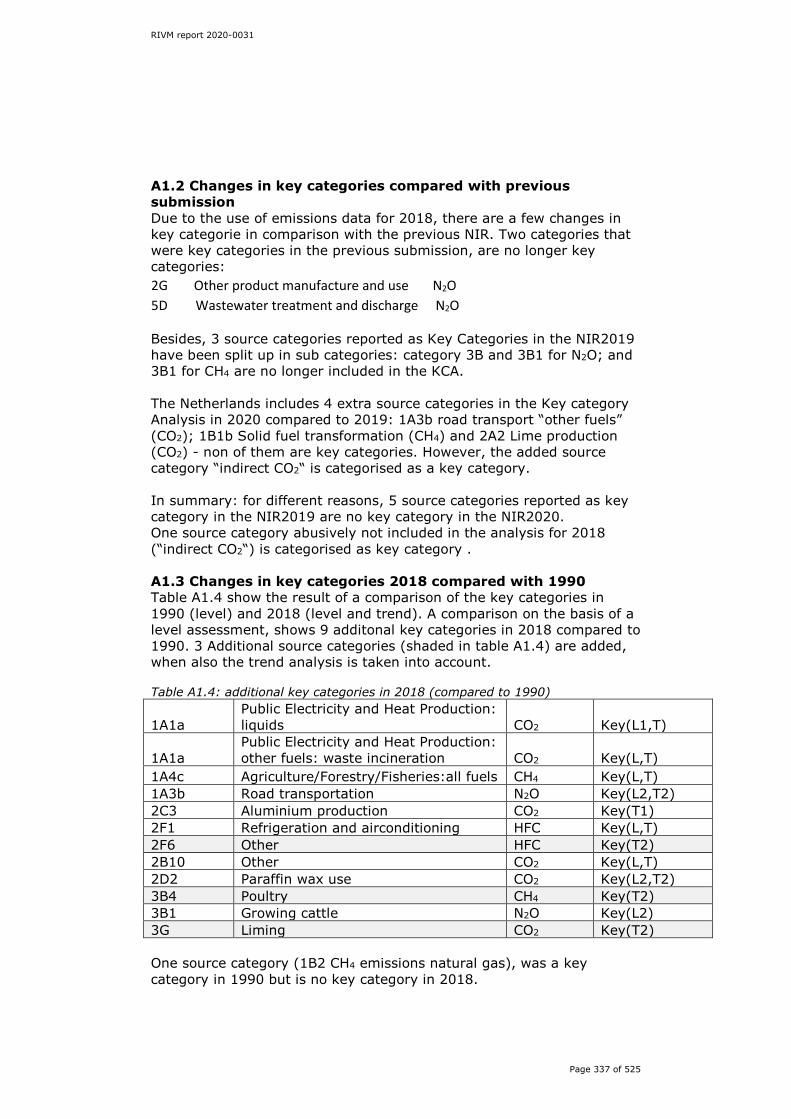
RIVM report 2020-0031
Page 337 of 525
A1.2 Changes in key categories compared with previous submission Due to the use of emissions data for 2018, there are a few changes in key categorie in comparison with the previous NIR. Two categories that were key categories in the previous submission, are no longer key categories: 2G Other product manufacture and use N2O 5D Wastewater treatment and discharge N2O Besides, 3 source categories reported as Key Categories in the NIR2019 have been split up in sub categories: category 3B and 3B1 for N2O; and 3B1 for CH4 are no longer included in the KCA. The Netherlands includes 4 extra source categories in the Key category Analysis in 2020 compared to 2019: 1A3b road transport “other fuels” (CO2); 1B1b Solid fuel transformation (CH4) and 2A2 Lime production (CO2) - non of them are key categories. However, the added source category “indirect CO2“ is categorised as a key category. In summary: for different reasons, 5 source categories reported as key category in the NIR2019 are no key category in the NIR2020. One source category abusively not included in the analysis for 2018 (“indirect CO2“) is categorised as key category . A1.3 Changes in key categories 2018 compared with 1990 Table A1.4 show the result of a comparison of the key categories in 1990 (level) and 2018 (level and trend). A comparison on the basis of a level assessment, shows 9 additonal key categories in 2018 compared to 1990. 3 Additional source categories (shaded in table A1.4) are added, when also the trend analysis is taken into account. Table A1.4: additional key categories in 2018 (compared to 1990)
1A1a Public Electricity and Heat Production: liquids CO2 Key(L1,T)
1A1a Public Electricity and Heat Production: other fuels: waste incineration CO2 Key(L,T)
1A4c Agriculture/Forestry/Fisheries:all fuels CH4 Key(L,T) 1A3b Road transportation N2O Key(L2,T2) 2C3 Aluminium production CO2 Key(T1) 2F1 Refrigeration and airconditioning HFC Key(L,T) 2F6 Other HFC Key(T2) 2B10 Other CO2 Key(L,T) 2D2 Paraffin wax use CO2 Key(L2,T2) 3B4 Poultry CH4 Key(T2) 3B1 Growing cattle N2O Key(L2) 3G Liming CO2 Key(T2) One source category (1B2 CH4 emissions natural gas), was a key category in 1990 but is no key category in 2018.
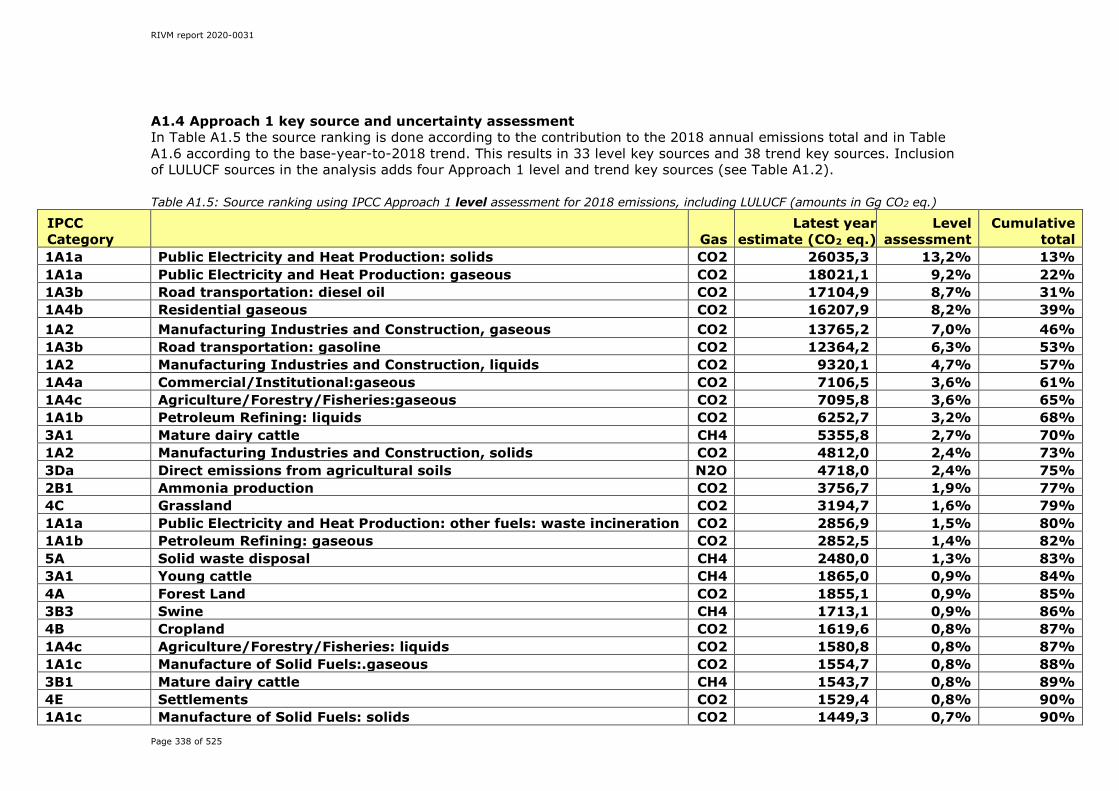
RIVM report 2020-0031
Page 338 of 525
A1.4 Approach 1 key source and uncertainty assessment In Table A1.5 the source ranking is done according to the contribution to the 2018 annual emissions total and in Table A1.6 according to the base-year-to-2018 trend. This results in 33 level key sources and 38 trend key sources. Inclusion of LULUCF sources in the analysis adds four Approach 1 level and trend key sources (see Table A1.2). Table A1.5: Source ranking using IPCC Approach 1 level assessment for 2018 emissions, including LULUCF (amounts in Gg CO2 eq.)
IPCC Category Gas
Latest year estimate (CO2 eq.)
Level assessment
Cumulative total
1A1a Public Electricity and Heat Production: solids CO2 26035,3 13,2% 13% 1A1a Public Electricity and Heat Production: gaseous CO2 18021,1 9,2% 22% 1A3b Road transportation: diesel oil CO2 17104,9 8,7% 31% 1A4b Residential gaseous CO2 16207,9 8,2% 39% 1A2 Manufacturing Industries and Construction, gaseous CO2 13765,2 7,0% 46% 1A3b Road transportation: gasoline CO2 12364,2 6,3% 53% 1A2 Manufacturing Industries and Construction, liquids CO2 9320,1 4,7% 57% 1A4a Commercial/Institutional:gaseous CO2 7106,5 3,6% 61% 1A4c Agriculture/Forestry/Fisheries:gaseous CO2 7095,8 3,6% 65% 1A1b Petroleum Refining: liquids CO2 6252,7 3,2% 68% 3A1 Mature dairy cattle CH4 5355,8 2,7% 70% 1A2 Manufacturing Industries and Construction, solids CO2 4812,0 2,4% 73% 3Da Direct emissions from agricultural soils N2O 4718,0 2,4% 75% 2B1 Ammonia production CO2 3756,7 1,9% 77% 4C Grassland CO2 3194,7 1,6% 79% 1A1a Public Electricity and Heat Production: other fuels: waste incineration CO2 2856,9 1,5% 80% 1A1b Petroleum Refining: gaseous CO2 2852,5 1,4% 82% 5A Solid waste disposal CH4 2480,0 1,3% 83% 3A1 Young cattle CH4 1865,0 0,9% 84% 4A Forest Land CO2 1855,1 0,9% 85% 3B3 Swine CH4 1713,1 0,9% 86% 4B Cropland CO2 1619,6 0,8% 87% 1A4c Agriculture/Forestry/Fisheries: liquids CO2 1580,8 0,8% 87% 1A1c Manufacture of Solid Fuels:.gaseous CO2 1554,7 0,8% 88% 3B1 Mature dairy cattle CH4 1543,7 0,8% 89% 4E Settlements CO2 1529,4 0,8% 90% 1A1c Manufacture of Solid Fuels: solids CO2 1449,3 0,7% 90%

RIVM report 2020-0031
Page 339 of 525
IPCC Category Gas
Latest year estimate (CO2 eq.)
Level assessment
Cumulative total
2B10 Other CO2 1415,7 0,7% 91% 2F1 Refrigeration and airconditioning HFC 1219,3 0,6% 92% 1B2 Fugitive emissions from oil and gas operations CO2 1027,2 0,5% 92% 1A3d Domestic navigation CO2 987,1 0,5% 93% 1A4c Agriculture/Forestry/Fisheries:all fuels CH4 907,8 0,5% 93% 1A1a Public Electricity and Heat Production: liquids CO2 744,9 0,4% 94% 2A4d Other CO2 730,0 0,4% 94% 2B4 Caprolactam production N2O 726,1 0,4% 94% 3Db Indirect emissions from managed soils N2O 628,2 0,3% 95% 1A4 Liquids excl. 1A4c CO2 544,0 0,3% 95% 3A3 Swine CH4 465,3 0,2% 95% 2B8 Petrochemical and carbon black production CO2 458,3 0,2% 95% 3A4 Other CH4 447,4 0,2% 96% 6 Indirect CO2 CO2 440,4 0,2% 96% 3B1 Growing cattle CH4 428,3 0,2% 96% 1A4b Residential:all fuels CH4 415,4 0,2% 96% 2B10 Other N2O 343,9 0,2% 97% 1A3b Road transportation: LPG CO2 309,5 0,2% 97% 2B8 Chemical industry: Petrochemical and carbon black production CH4 287,8 0,1% 97% 2B2 Nitric acid production N2O 282,2 0,1% 97% 1A1 Energy Industries:all fuels N2O 265,3 0,1% 97% 1B2b Natural gas CH4 256,7 0,1% 97% 1A3b Road transportation N2O 251,3 0,1% 97% 2B Fluorochemical production HFC 247,2 0,1% 97% 2A2 Lime production CO2 229,6 0,1% 98% 3B5 Indirect emissions N2O 226,7 0,1% 98% 5D Wastewater treatment and discharge CH4 221,3 0,1% 98% 2A1 Cement production CO2 220,4 0,1% 98% 2D2 Paraffin wax use CO2 209,7 0,1% 98% 1B2c Venting and flaring CH4 198,4 0,1% 98% 3B1 Mature dairy cattle N2O 195,4 0,1% 98% 2F6 Other HFC 175,1 0,1% 98%
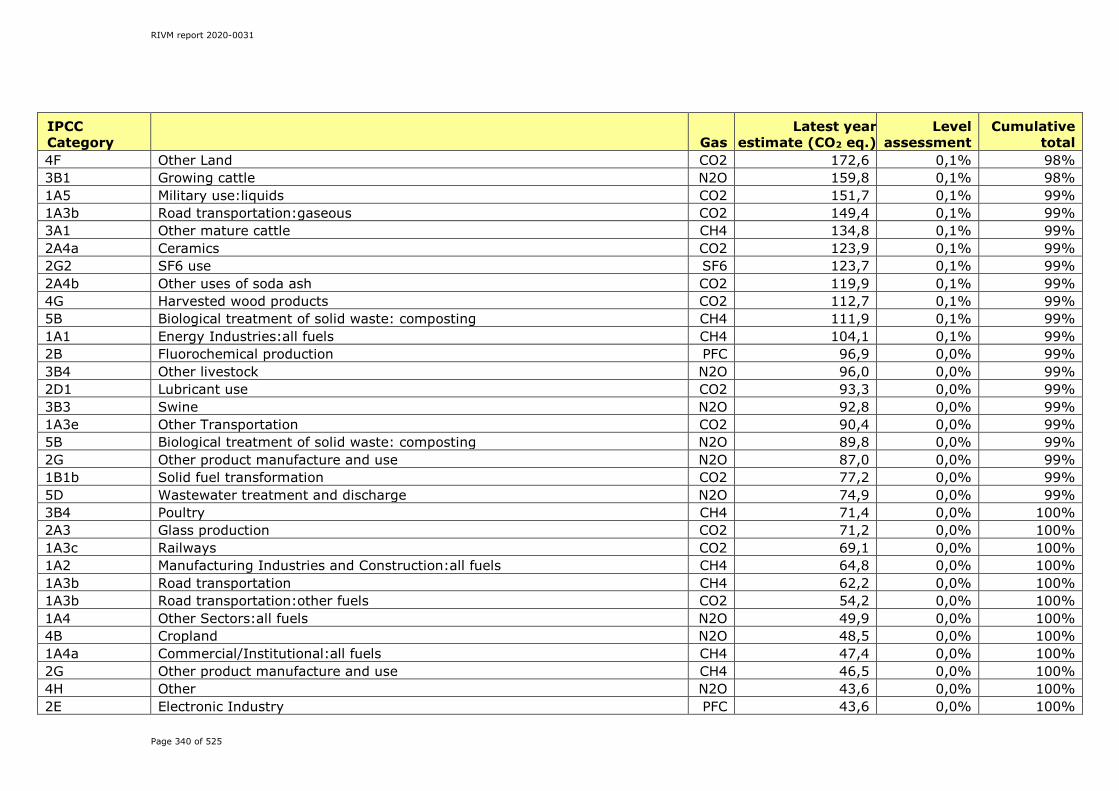
RIVM report 2020-0031
Page 340 of 525
IPCC Category Gas
Latest year estimate (CO2 eq.)
Level assessment
Cumulative total
4F Other Land CO2 172,6 0,1% 98% 3B1 Growing cattle N2O 159,8 0,1% 98% 1A5 Military use:liquids CO2 151,7 0,1% 99% 1A3b Road transportation:gaseous CO2 149,4 0,1% 99% 3A1 Other mature cattle CH4 134,8 0,1% 99% 2A4a Ceramics CO2 123,9 0,1% 99% 2G2 SF6 use SF6 123,7 0,1% 99% 2A4b Other uses of soda ash CO2 119,9 0,1% 99% 4G Harvested wood products CO2 112,7 0,1% 99% 5B Biological treatment of solid waste: composting CH4 111,9 0,1% 99% 1A1 Energy Industries:all fuels CH4 104,1 0,1% 99% 2B Fluorochemical production PFC 96,9 0,0% 99% 3B4 Other livestock N2O 96,0 0,0% 99% 2D1 Lubricant use CO2 93,3 0,0% 99% 3B3 Swine N2O 92,8 0,0% 99% 1A3e Other Transportation CO2 90,4 0,0% 99% 5B Biological treatment of solid waste: composting N2O 89,8 0,0% 99% 2G Other product manufacture and use N2O 87,0 0,0% 99% 1B1b Solid fuel transformation CO2 77,2 0,0% 99% 5D Wastewater treatment and discharge N2O 74,9 0,0% 99% 3B4 Poultry CH4 71,4 0,0% 100% 2A3 Glass production CO2 71,2 0,0% 100% 1A3c Railways CO2 69,1 0,0% 100% 1A2 Manufacturing Industries and Construction:all fuels CH4 64,8 0,0% 100% 1A3b Road transportation CH4 62,2 0,0% 100% 1A3b Road transportation:other fuels CO2 54,2 0,0% 100% 1A4 Other Sectors:all fuels N2O 49,9 0,0% 100% 4B Cropland N2O 48,5 0,0% 100% 1A4a Commercial/Institutional:all fuels CH4 47,4 0,0% 100% 2G Other product manufacture and use CH4 46,5 0,0% 100% 4H Other N2O 43,6 0,0% 100% 2E Electronic Industry PFC 43,6 0,0% 100%
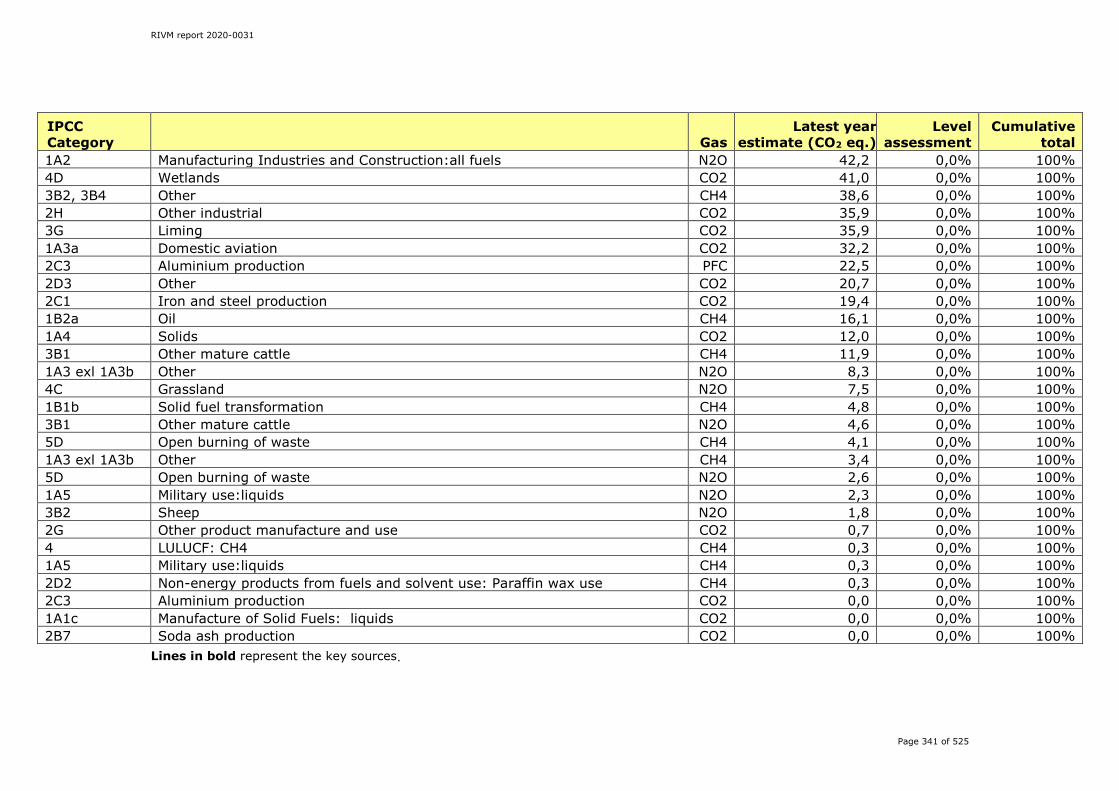
RIVM report 2020-0031
Page 341 of 525
IPCC Category Gas
Latest year estimate (CO2 eq.)
Level assessment
Cumulative total
1A2 Manufacturing Industries and Construction:all fuels N2O 42,2 0,0% 100% 4D Wetlands CO2 41,0 0,0% 100% 3B2, 3B4 Other CH4 38,6 0,0% 100% 2H Other industrial CO2 35,9 0,0% 100% 3G Liming CO2 35,9 0,0% 100% 1A3a Domestic aviation CO2 32,2 0,0% 100% 2C3 Aluminium production PFC 22,5 0,0% 100% 2D3 Other CO2 20,7 0,0% 100% 2C1 Iron and steel production CO2 19,4 0,0% 100% 1B2a Oil CH4 16,1 0,0% 100% 1A4 Solids CO2 12,0 0,0% 100% 3B1 Other mature cattle CH4 11,9 0,0% 100% 1A3 exl 1A3b Other N2O 8,3 0,0% 100% 4C Grassland N2O 7,5 0,0% 100% 1B1b Solid fuel transformation CH4 4,8 0,0% 100% 3B1 Other mature cattle N2O 4,6 0,0% 100% 5D Open burning of waste CH4 4,1 0,0% 100% 1A3 exl 1A3b Other CH4 3,4 0,0% 100% 5D Open burning of waste N2O 2,6 0,0% 100% 1A5 Military use:liquids N2O 2,3 0,0% 100% 3B2 Sheep N2O 1,8 0,0% 100% 2G Other product manufacture and use CO2 0,7 0,0% 100% 4 LULUCF: CH4 CH4 0,3 0,0% 100% 1A5 Military use:liquids CH4 0,3 0,0% 100% 2D2 Non-energy products from fuels and solvent use: Paraffin wax use CH4 0,3 0,0% 100% 2C3 Aluminium production CO2 0,0 0,0% 100% 1A1c Manufacture of Solid Fuels: liquids CO2 0,0 0,0% 100% 2B7 Soda ash production CO2 0,0 0,0% 100%
Lines in bold represent the key sources.

RIVM report 2020-0031
Page 342 of 525
Table A1.6: Source ranking using IPCC Approach 1 trend assessment for 2018 emissions compared to the base year, including LULUCF (Gg CO2 eq.)
IPCC Category Gas
Base Year Estimate (CO2 eq.)
Latest Year Estimate (CO2 eq.)
Trend Assessment
% Contribution to trend
Cumulative Total
5A Solid waste disposal CH4 13679 2480 5,5% 11,7% 12%
1A1a Public Electricity and Heat Production: gaseous CO2 13330 18021 4,0% 8,6% 20%
1A3b Road transportation: diesel oil CO2 13012 17105 3,6% 7,7% 28% 2B2 Nitric acid production N2O 6085 282 2,9% 6,2% 34% 2B Fluorochemical production HFC 5606 247 2,7% 5,8% 40%
1A1a Public Electricity and Heat Production: solids CO2 25862 26035 2,4% 5,2% 45%
1A3b Road transportation: gasoline CO2 10799 12364 1,9% 4,1% 49%
1A2 Manufacturing Industries and Construction, gaseous CO2 19046 13765 1,4% 3,1% 52%
1A1a Public Electricity and Heat Production: other fuels: waste incineration CO2 601 2857 1,4% 3,0% 55%
2C3 Aluminium production PFC 2638 22 1,3% 2,8% 58% 1A1b Petroleum Refining: liquids CO2 9968 6253 1,3% 2,8% 61% 1A1b Petroleum Refining: gaseous CO2 1042 2852 1,2% 2,5% 63% 1A3b Road transportation: LPG CO2 2640 309 1,2% 2,5% 66%
1A2 Manufacturing Industries and Construction, liquids CO2 8777 9320 1,1% 2,4% 68%
3Da Direct emissions from agricultural soils N2O 7650 4718 1,1% 2,3% 71% 4C Grassland CO2 5537 3195 0,9% 1,9% 73% 2F1 Refrigeration and airconditioning HFC 0 1219 0,7% 1,6% 74% 3B3 Swine CH4 3369 1713 0,7% 1,5% 76% 1B2c Venting and flaring CH4 1491 198 0,6% 1,4% 77% 3A1 Mature dairy cattle CH4 5183 5356 0,6% 1,2% 78% 2B10 Other CO2 583 1416 0,6% 1,2% 79% 1A4c Agriculture/Forestry/Fisheries:gaseous CO2 7329 7096 0,5% 1,1% 80% 1A4c Agriculture/Forestry/Fisheries:all fuels CH4 73 908 0,5% 1,1% 82%
1A2 Manufacturing Industries and Construction, solids CO2 6623 4812 0,5% 1,0% 83%

RIVM report 2020-0031
Page 343 of 525
IPCC Category Gas
Base Year Estimate (CO2 eq.)
Latest Year Estimate (CO2 eq.)
Trend Assessment
% Contribution to trend
Cumulative Total
4E Settlements CO2 911 1529 0,5% 1,0% 84% 3Db Indirect emissions from managed soils N2O 1623 628 0,4% 1,0% 84% 1A4b Residential gaseous CO2 19896 16208 0,4% 0,9% 85% 1A1c Manufacture of Solid Fuels: solids CO2 916 1449 0,4% 0,9% 86% 3B1 Mature dairy cattle CH4 1083 1544 0,4% 0,8% 87% 2B1 Ammonia production CO2 3730 3757 0,4% 0,8% 88% 1A1c Manufacture of Solid Fuels:.gaseous CO2 1184 1555 0,3% 0,7% 88%
1A1a Public Electricity and Heat Production: liquids CO2 233 745 0,3% 0,7% 89%
1A4c Agriculture/Forestry/Fisheries: liquids CO2 2507 1581 0,3% 0,7% 90% 1A4a Commercial/Institutional:gaseous CO2 7758 7107 0,3% 0,7% 91% 3A1 Young cattle CH4 2802 1865 0,3% 0,7% 91% 1A4 Liquids excl. 1A4c CO2 1211 544 0,3% 0,6% 92% 4A Forest Land CO2 1734 1855 0,2% 0,5% 92%
1B2 Fugitive emissions from oil and gas operations CO2 775 1027 0,2% 0,5% 93%
1A3d Domestic navigation CO2 743 987 0,2% 0,5% 93% 2C3 Aluminium production CO2 408 0 0,2% 0,4% 94% 6 Indirect CO2 CO2 917 440 0,2% 0,4% 94% 2A4d Other CO2 481 730 0,2% 0,4% 94% 3B4 Poultry CH4 432 71 0,2% 0,4% 95% 1A3e Other Transportation CO2 342 90 0,1% 0,3% 95% 2F6 Other HFC 0 175 0,1% 0,2% 95% 2B8 Petrochemical and carbon black production CO2 336 458 0,1% 0,2% 96% 1A3b Road transportation N2O 98 251 0,1% 0,2% 96% 4F Other Land CO2 26 173 0,1% 0,2% 96% 1A3b Road transportation:gaseous CO2 0 149 0,1% 0,2% 96% 1A1 Energy Industries:all fuels N2O 148 265 0,1% 0,2% 96% 2B10 Other N2O 244 344 0,1% 0,2% 97% 2A1 Cement production CO2 416 220 0,1% 0,2% 97% 1A4 Solids CO2 163 12 0,1% 0,2% 97% 2D2 Paraffin wax use CO2 103 210 0,1% 0,2% 97%
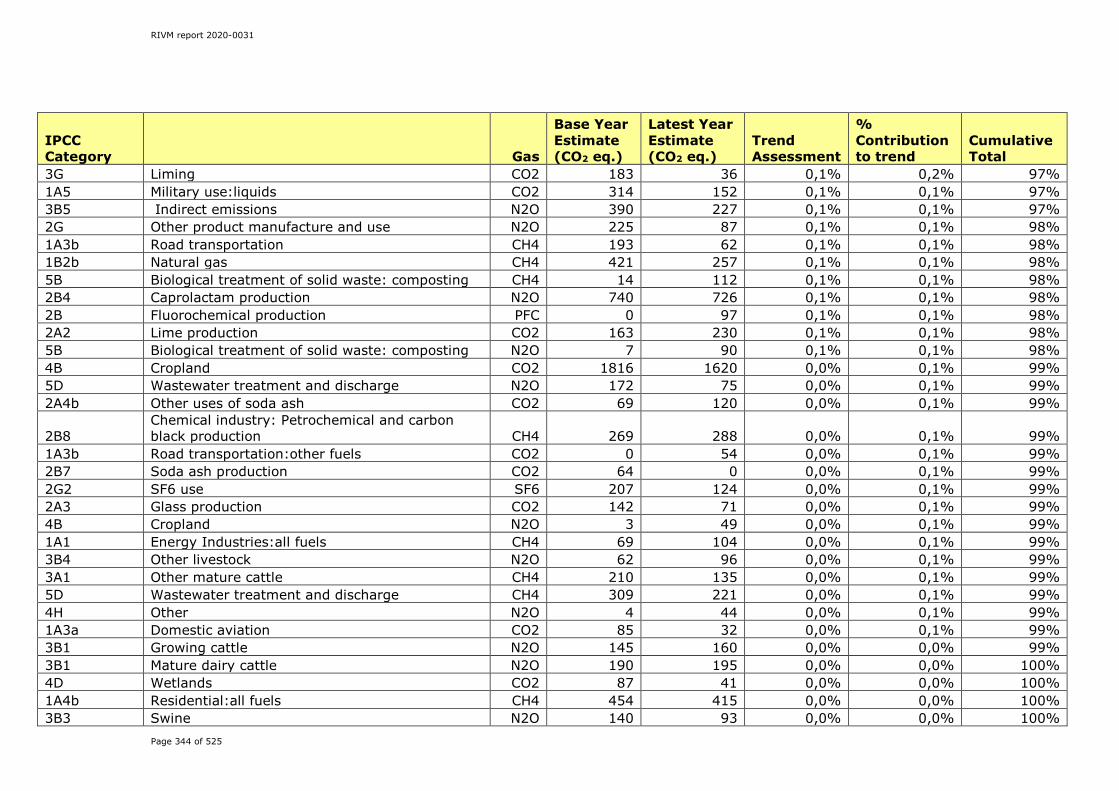
RIVM report 2020-0031
Page 344 of 525
IPCC Category Gas
Base Year Estimate (CO2 eq.)
Latest Year Estimate (CO2 eq.)
Trend Assessment
% Contribution to trend
Cumulative Total
3G Liming CO2 183 36 0,1% 0,2% 97% 1A5 Military use:liquids CO2 314 152 0,1% 0,1% 97% 3B5 Indirect emissions N2O 390 227 0,1% 0,1% 97% 2G Other product manufacture and use N2O 225 87 0,1% 0,1% 98% 1A3b Road transportation CH4 193 62 0,1% 0,1% 98% 1B2b Natural gas CH4 421 257 0,1% 0,1% 98% 5B Biological treatment of solid waste: composting CH4 14 112 0,1% 0,1% 98% 2B4 Caprolactam production N2O 740 726 0,1% 0,1% 98% 2B Fluorochemical production PFC 0 97 0,1% 0,1% 98% 2A2 Lime production CO2 163 230 0,1% 0,1% 98% 5B Biological treatment of solid waste: composting N2O 7 90 0,1% 0,1% 98% 4B Cropland CO2 1816 1620 0,0% 0,1% 99% 5D Wastewater treatment and discharge N2O 172 75 0,0% 0,1% 99% 2A4b Other uses of soda ash CO2 69 120 0,0% 0,1% 99%
2B8 Chemical industry: Petrochemical and carbon black production CH4 269 288 0,0% 0,1% 99%
1A3b Road transportation:other fuels CO2 0 54 0,0% 0,1% 99% 2B7 Soda ash production CO2 64 0 0,0% 0,1% 99% 2G2 SF6 use SF6 207 124 0,0% 0,1% 99% 2A3 Glass production CO2 142 71 0,0% 0,1% 99% 4B Cropland N2O 3 49 0,0% 0,1% 99% 1A1 Energy Industries:all fuels CH4 69 104 0,0% 0,1% 99% 3B4 Other livestock N2O 62 96 0,0% 0,1% 99% 3A1 Other mature cattle CH4 210 135 0,0% 0,1% 99% 5D Wastewater treatment and discharge CH4 309 221 0,0% 0,1% 99% 4H Other N2O 4 44 0,0% 0,1% 99% 1A3a Domestic aviation CO2 85 32 0,0% 0,1% 99% 3B1 Growing cattle N2O 145 160 0,0% 0,0% 99% 3B1 Mature dairy cattle N2O 190 195 0,0% 0,0% 100% 4D Wetlands CO2 87 41 0,0% 0,0% 100% 1A4b Residential:all fuels CH4 454 415 0,0% 0,0% 100% 3B3 Swine N2O 140 93 0,0% 0,0% 100%

RIVM report 2020-0031
Page 345 of 525
IPCC Category Gas
Base Year Estimate (CO2 eq.)
Latest Year Estimate (CO2 eq.)
Trend Assessment
% Contribution to trend
Cumulative Total
2H Other industrial CO2 72 36 0,0% 0,0% 100% 3A3 Swine CH4 522 465 0,0% 0,0% 100% 2E Electronic Industry PFC 25 44 0,0% 0,0% 100% 2D1 Lubricant use CO2 85 93 0,0% 0,0% 100% 4G Harvested wood products CO2 158 113 0,0% 0,0% 100% 2D3 Other CO2 0 21 0,0% 0,0% 100% 2C1 Iron and steel production CO2 44 19 0,0% 0,0% 100% 1B1b Solid fuel transformation CO2 110 77 0,0% 0,0% 100%
1A2 Manufacturing Industries and Construction:all fuels N2O 36 42 0,0% 0,0% 100%
3A4 Other CH4 514 447 0,0% 0,0% 100% 3B2, 3B4 Other CH4 34 39 0,0% 0,0% 100% 1A4a Commercial/Institutional:all fuels CH4 45 47 0,0% 0,0% 100% 1A1c Manufacture of Solid Fuels: liquids CO2 10 0 0,0% 0,0% 100% 1A4 Other Sectors:all fuels N2O 50 50 0,0% 0,0% 100%
1A2 Manufacturing Industries and Construction:all fuels CH4 67 65 0,0% 0,0% 100%
4C Grassland N2O 0 8 0,0% 0,0% 100% 3B1 Other mature cattle CH4 22 12 0,0% 0,0% 100% 1A3c Railways CO2 88 69 0,0% 0,0% 100% 2A4a Ceramics CO2 140 124 0,0% 0,0% 100% 1B1b Solid fuel transformation CH4 11 5 0,0% 0,0% 100% 3B2 Sheep N2O 7 2 0,0% 0,0% 100% 2G Other product manufacture and use CH4 50 46 0,0% 0,0% 100% 1A3 exl 1A3b Other N2O 7 8 0,0% 0,0% 100% 1A5 Military use:liquids N2O 6 2 0,0% 0,0% 100% 3B1 Growing cattle CH4 503 428 0,0% 0,0% 100% 3B1 Other mature cattle N2O 7 5 0,0% 0,0% 100% 1A3 exl 1A3b Other CH4 3 3 0,0% 0,0% 100% 1B2a Oil CH4 20 16 0,0% 0,0% 100% 5D Open burning of waste CH4 4 4 0,0% 0,0% 100% 5D Open burning of waste N2O 2 3 0,0% 0,0% 100%

RIVM report 2020-0031
Page 346 of 525
IPCC Category Gas
Base Year Estimate (CO2 eq.)
Latest Year Estimate (CO2 eq.)
Trend Assessment
% Contribution to trend
Cumulative Total
2G Other product manufacture and use CO2 0 1 0,0% 0,0% 100% 1A5 Military use:liquids CH4 1 0 0,0% 0,0% 100%
2D2 Non-energy products from fuels and solvent use: Paraffin wax use CH4 0 0 0,0% 0,0% 100%
4 LULUCF: CH4 CH4 0 0 0,0% 0,0% 100% Lines in bold represent the key sources. A1.5 Approach 2 key category assessment Using the uncertainty estimate for each key source as a weighting factor (see Annex 2), the key source assessment was performed again; both including and excluding LULUCF. This is called the Approach 2 key source assessment. The results of this assessment – only the results including LULUCF – are presented in Tables A1.7 (contribution to the 2018 annual emissions total) and A1.8 (contribution to the trend). Four LULUCF sources are identified as key sources: 4A Forest land, 4B Cropland, 4C Grassland and 4E Settlements.
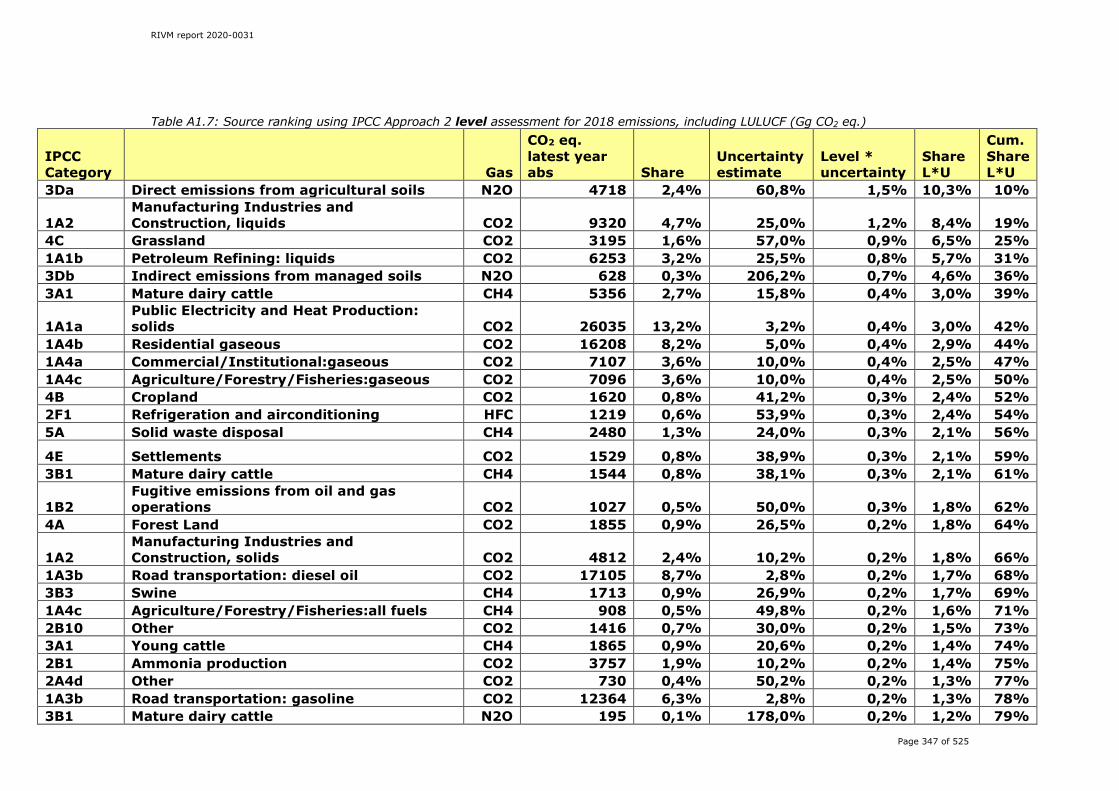
RIVM report 2020-0031
Page 347 of 525
Table A1.7: Source ranking using IPCC Approach 2 level assessment for 2018 emissions, including LULUCF (Gg CO2 eq.)
IPCC Category Gas
CO2 eq. latest year abs Share
Uncertainty estimate
Level * uncertainty
Share L*U
Cum. Share L*U
3Da Direct emissions from agricultural soils N2O 4718 2,4% 60,8% 1,5% 10,3% 10%
1A2 Manufacturing Industries and Construction, liquids CO2 9320 4,7% 25,0% 1,2% 8,4% 19%
4C Grassland CO2 3195 1,6% 57,0% 0,9% 6,5% 25% 1A1b Petroleum Refining: liquids CO2 6253 3,2% 25,5% 0,8% 5,7% 31% 3Db Indirect emissions from managed soils N2O 628 0,3% 206,2% 0,7% 4,6% 36% 3A1 Mature dairy cattle CH4 5356 2,7% 15,8% 0,4% 3,0% 39%
1A1a Public Electricity and Heat Production: solids CO2 26035 13,2% 3,2% 0,4% 3,0% 42%
1A4b Residential gaseous CO2 16208 8,2% 5,0% 0,4% 2,9% 44% 1A4a Commercial/Institutional:gaseous CO2 7107 3,6% 10,0% 0,4% 2,5% 47% 1A4c Agriculture/Forestry/Fisheries:gaseous CO2 7096 3,6% 10,0% 0,4% 2,5% 50% 4B Cropland CO2 1620 0,8% 41,2% 0,3% 2,4% 52% 2F1 Refrigeration and airconditioning HFC 1219 0,6% 53,9% 0,3% 2,4% 54% 5A Solid waste disposal CH4 2480 1,3% 24,0% 0,3% 2,1% 56%
4E Settlements CO2 1529 0,8% 38,9% 0,3% 2,1% 59% 3B1 Mature dairy cattle CH4 1544 0,8% 38,1% 0,3% 2,1% 61%
1B2 Fugitive emissions from oil and gas operations CO2 1027 0,5% 50,0% 0,3% 1,8% 62%
4A Forest Land CO2 1855 0,9% 26,5% 0,2% 1,8% 64%
1A2 Manufacturing Industries and Construction, solids CO2 4812 2,4% 10,2% 0,2% 1,8% 66%
1A3b Road transportation: diesel oil CO2 17105 8,7% 2,8% 0,2% 1,7% 68% 3B3 Swine CH4 1713 0,9% 26,9% 0,2% 1,7% 69% 1A4c Agriculture/Forestry/Fisheries:all fuels CH4 908 0,5% 49,8% 0,2% 1,6% 71% 2B10 Other CO2 1416 0,7% 30,0% 0,2% 1,5% 73% 3A1 Young cattle CH4 1865 0,9% 20,6% 0,2% 1,4% 74% 2B1 Ammonia production CO2 3757 1,9% 10,2% 0,2% 1,4% 75% 2A4d Other CO2 730 0,4% 50,2% 0,2% 1,3% 77% 1A3b Road transportation: gasoline CO2 12364 6,3% 2,8% 0,2% 1,3% 78% 3B1 Mature dairy cattle N2O 195 0,1% 178,0% 0,2% 1,2% 79%
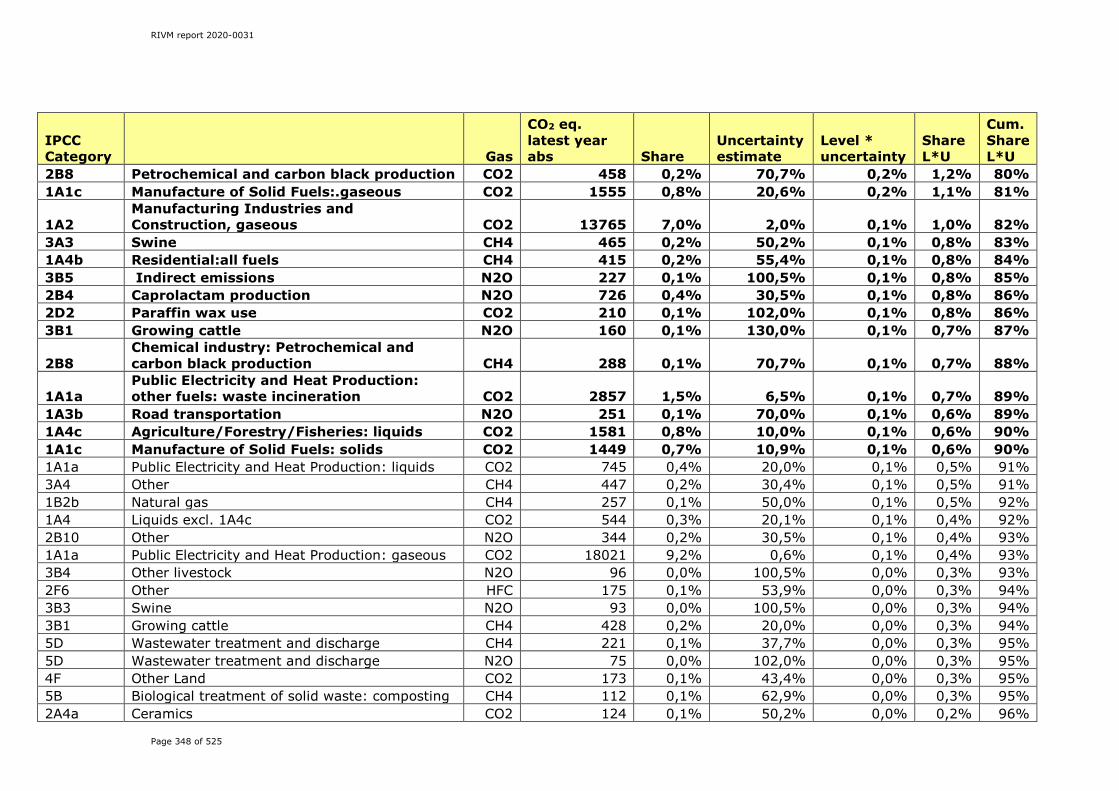
RIVM report 2020-0031
Page 348 of 525
IPCC Category Gas
CO2 eq. latest year abs Share
Uncertainty estimate
Level * uncertainty
Share L*U
Cum. Share L*U
2B8 Petrochemical and carbon black production CO2 458 0,2% 70,7% 0,2% 1,2% 80% 1A1c Manufacture of Solid Fuels:.gaseous CO2 1555 0,8% 20,6% 0,2% 1,1% 81%
1A2 Manufacturing Industries and Construction, gaseous CO2 13765 7,0% 2,0% 0,1% 1,0% 82%
3A3 Swine CH4 465 0,2% 50,2% 0,1% 0,8% 83% 1A4b Residential:all fuels CH4 415 0,2% 55,4% 0,1% 0,8% 84% 3B5 Indirect emissions N2O 227 0,1% 100,5% 0,1% 0,8% 85% 2B4 Caprolactam production N2O 726 0,4% 30,5% 0,1% 0,8% 86% 2D2 Paraffin wax use CO2 210 0,1% 102,0% 0,1% 0,8% 86% 3B1 Growing cattle N2O 160 0,1% 130,0% 0,1% 0,7% 87%
2B8 Chemical industry: Petrochemical and carbon black production CH4 288 0,1% 70,7% 0,1% 0,7% 88%
1A1a Public Electricity and Heat Production: other fuels: waste incineration CO2 2857 1,5% 6,5% 0,1% 0,7% 89%
1A3b Road transportation N2O 251 0,1% 70,0% 0,1% 0,6% 89% 1A4c Agriculture/Forestry/Fisheries: liquids CO2 1581 0,8% 10,0% 0,1% 0,6% 90% 1A1c Manufacture of Solid Fuels: solids CO2 1449 0,7% 10,9% 0,1% 0,6% 90% 1A1a Public Electricity and Heat Production: liquids CO2 745 0,4% 20,0% 0,1% 0,5% 91% 3A4 Other CH4 447 0,2% 30,4% 0,1% 0,5% 91% 1B2b Natural gas CH4 257 0,1% 50,0% 0,1% 0,5% 92% 1A4 Liquids excl. 1A4c CO2 544 0,3% 20,1% 0,1% 0,4% 92% 2B10 Other N2O 344 0,2% 30,5% 0,1% 0,4% 93% 1A1a Public Electricity and Heat Production: gaseous CO2 18021 9,2% 0,6% 0,1% 0,4% 93% 3B4 Other livestock N2O 96 0,0% 100,5% 0,0% 0,3% 93% 2F6 Other HFC 175 0,1% 53,9% 0,0% 0,3% 94% 3B3 Swine N2O 93 0,0% 100,5% 0,0% 0,3% 94% 3B1 Growing cattle CH4 428 0,2% 20,0% 0,0% 0,3% 94% 5D Wastewater treatment and discharge CH4 221 0,1% 37,7% 0,0% 0,3% 95% 5D Wastewater treatment and discharge N2O 75 0,0% 102,0% 0,0% 0,3% 95% 4F Other Land CO2 173 0,1% 43,4% 0,0% 0,3% 95% 5B Biological treatment of solid waste: composting CH4 112 0,1% 62,9% 0,0% 0,3% 95% 2A4a Ceramics CO2 124 0,1% 50,2% 0,0% 0,2% 96%

RIVM report 2020-0031
Page 349 of 525
IPCC Category Gas
CO2 eq. latest year abs Share
Uncertainty estimate
Level * uncertainty
Share L*U
Cum. Share L*U
2G Other product manufacture and use N2O 87 0,0% 70,7% 0,0% 0,2% 96% 2A4b Other uses of soda ash CO2 120 0,1% 50,2% 0,0% 0,2% 96% 2B Fluorochemical production HFC 247 0,1% 22,4% 0,0% 0,2% 96% 2D1 Lubricant use CO2 93 0,0% 57,9% 0,0% 0,2% 96% 1A3d Domestic navigation CO2 987 0,5% 5,4% 0,0% 0,2% 97% 1B2c Venting and flaring CH4 198 0,1% 25,1% 0,0% 0,2% 97% 1A1 Energy Industries:all fuels N2O 265 0,1% 18,6% 0,0% 0,2% 97% 5B Biological treatment of solid waste: composting N2O 90 0,0% 49,7% 0,0% 0,2% 97% 2G2 SF6 use SF6 124 0,1% 33,5% 0,0% 0,1% 97% 3G Liming CO2 36 0,0% 100,5% 0,0% 0,1% 97% 1A3b Road transportation CH4 62 0,0% 50,0% 0,0% 0,1% 97% 1A5 Military use:liquids CO2 152 0,1% 20,1% 0,0% 0,1% 98% 3B4 Poultry CH4 71 0,0% 41,2% 0,0% 0,1% 98% 4G Harvested wood products CO2 113 0,1% 25,3% 0,0% 0,1% 98% 3A1 Other mature cattle CH4 135 0,1% 20,6% 0,0% 0,1% 98% 2A2 Lime production CO2 230 0,1% 11,2% 0,0% 0,1% 98%
1A2 Manufacturing Industries and Construction:all fuels N2O 42 0,0% 58,7% 0,0% 0,1% 98%
4D Wetlands CO2 41 0,0% 60,2% 0,0% 0,1% 98% 2A1 Cement production CO2 220 0,1% 11,2% 0,0% 0,1% 98% 2G Other product manufacture and use CH4 46 0,0% 50,5% 0,0% 0,1% 98% 1A4 Other Sectors:all fuels N2O 50 0,0% 46,6% 0,0% 0,1% 98% 1A4a Commercial/Institutional:all fuels CH4 47 0,0% 48,7% 0,0% 0,1% 99% 2B2 Nitric acid production N2O 282 0,1% 7,8% 0,0% 0,1% 99% 2B Fluorochemical production PFC 97 0,0% 22,4% 0,0% 0,1% 99% 4B Cropland N2O 49 0,0% 41,2% 0,0% 0,1% 99% 1A1 Energy Industries:all fuels CH4 104 0,1% 18,6% 0,0% 0,1% 99% 2A3 Glass production CO2 71 0,0% 25,5% 0,0% 0,1% 99% 1A3b Road transportation: LPG CO2 309 0,2% 5,4% 0,0% 0,1% 99% 1A1b Petroleum Refining: gaseous CO2 2852 1,4% 0,6% 0,0% 0,1% 99% 5D Open burning of waste CH4 4 0,0% 316,2% 0,0% 0,0% 99% 3B2, 3B4 Other CH4 39 0,0% 33,5% 0,0% 0,0% 99%

RIVM report 2020-0031
Page 350 of 525
IPCC Category Gas
CO2 eq. latest year abs Share
Uncertainty estimate
Level * uncertainty
Share L*U
Cum. Share L*U
1B1b Solid fuel transformation CO2 77 0,0% 15,1% 0,0% 0,0% 99% 2E Electronic Industry PFC 44 0,0% 25,5% 0,0% 0,0% 99% 4H Other N2O 44 0,0% 25,0% 0,0% 0,0% 99%
1A2 Manufacturing Industries and Construction:all fuels CH4 65 0,0% 15,9% 0,0% 0,0% 99%
1A3a Domestic aviation CO2 32 0,0% 30,3% 0,0% 0,0% 99% 3B1 Other mature cattle N2O 5 0,0% 192,0% 0,0% 0,0% 99% 1B2a Oil CH4 16 0,0% 53,9% 0,0% 0,0% 99% 5D Open burning of waste N2O 3 0,0% 316,2% 0,0% 0,0% 99% 1A3b Road transportation:gaseous CO2 149 0,1% 5,4% 0,0% 0,0% 99% 1A4 Solids CO2 12 0,0% 51,0% 0,0% 0,0% 99% 1A3 exl 1A3b Other N2O 8 0,0% 70,0% 0,0% 0,0% 99% 2D3 Other CO2 21 0,0% 26,7% 0,0% 0,0% 99% 2C3 Aluminium production PFC 22 0,0% 20,1% 0,0% 0,0% 99% 4C Grassland N2O 8 0,0% 57,0% 0,0% 0,0% 99% 3B1 Other mature cattle CH4 12 0,0% 33,1% 0,0% 0,0% 100% 1A3c Railways CO2 69 0,0% 5,4% 0,0% 0,0% 100% 1A3b Road transportation:other fuels CO2 54 0,0% 5,4% 0,0% 0,0% 100% 2H Other industrial CO2 36 0,0% 5,7% 0,0% 0,0% 100% 1A5 Military use:liquids N2O 2 0,0% 82,3% 0,0% 0,0% 100% 3B2 Sheep N2O 2 0,0% 100,5% 0,0% 0,0% 100% 1A3 exl 1A3b Other CH4 3 0,0% 50,0% 0,0% 0,0% 100% 2C1 Iron and steel production CO2 19 0,0% 5,8% 0,0% 0,0% 100%
1B1b Solid fuel transformation CH4 5 0,0% 15,1% 0,0% 0,0% 100% 1A3e Other Transportation CO2 90 0,0% 0,6% 0,0% 0,0% 100% 2G Other product manufacture and use CO2 1 0,0% 53,9% 0,0% 0,0% 100%
2D2 Non-energy products from fuels and solvent use: Paraffin wax use CH4 0 0,0% 111,8% 0,0% 0,0% 100%
1A5 Military use: liquids CH4 0 0,0% 60,4% 0,0% 0,0% 100% 4 LULUCF: CH4 CH4 0 0,0% 17,0% 0,0% 0,0% 100%
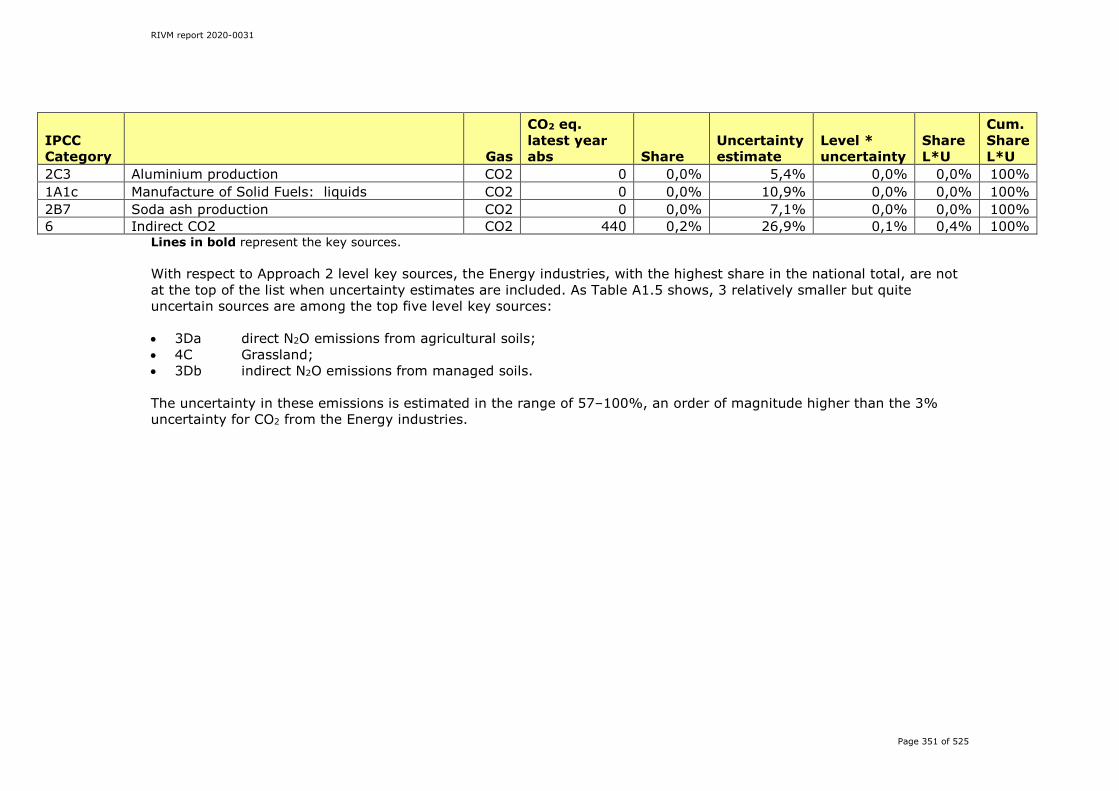
RIVM report 2020-0031
Page 351 of 525
IPCC Category Gas
CO2 eq. latest year abs Share
Uncertainty estimate
Level * uncertainty
Share L*U
Cum. Share L*U
2C3 Aluminium production CO2 0 0,0% 5,4% 0,0% 0,0% 100% 1A1c Manufacture of Solid Fuels: liquids CO2 0 0,0% 10,9% 0,0% 0,0% 100% 2B7 Soda ash production CO2 0 0,0% 7,1% 0,0% 0,0% 100% 6 Indirect CO2 CO2 440 0,2% 26,9% 0,1% 0,4% 100%
Lines in bold represent the key sources. With respect to Approach 2 level key sources, the Energy industries, with the highest share in the national total, are not at the top of the list when uncertainty estimates are included. As Table A1.5 shows, 3 relatively smaller but quite uncertain sources are among the top five level key sources: • 3Da direct N2O emissions from agricultural soils; • 4C Grassland; • 3Db indirect N2O emissions from managed soils. The uncertainty in these emissions is estimated in the range of 57–100%, an order of magnitude higher than the 3% uncertainty for CO2 from the Energy industries.

RIVM report 2020-0031
Page 352 of 525
Table A1.8: Source ranking using IPCC Approach 2 trend assessment for 2018 emissions compared to the base year, including LULUCF (Gg CO2 eq.)
IPC
C
Cat
egor
y
Gas
CO
2 e
q b
ase
year
ab
s
CO
2 e
q
late
st y
ear
abs
leve
l as
sess
men
t
late
st y
ear
tren
d
asse
ssm
ent
Un
cert
ain
ty
esti
mat
e
Tren
d *
u
nce
rtai
nty
% C
ontr
. to
tr
end
Cu
mu
lati
ve
5A Solid waste disposal CH4 13679 2480 1,3% 5,5% 24,0% 1,3% 14,3% 14%
3Db Indirect emissions from managed soils N2O 1623 628 0,3% 0,4% 206,2% 0,9% 10,1% 24%
3Da Direct emissions from agricultural soils N2O 7650 4718 2,4% 1,1% 60,8% 0,6% 7,0% 31%
2B Fluorochemical production HFC 5606 247 0,1% 2,7% 22,4% 0,6% 6,6% 38% 4C Grassland CO2 5537 3195 1,6% 0,9% 57,0% 0,5% 5,6% 44%
2F1 Refrigeration and airconditioning HFC 0 1219 0,6% 0,7% 53,9% 0,4% 4,3% 48%
1A1b Petroleum Refining: liquids CO2 9968 6253 3,2% 1,3% 25,5% 0,3% 3,7% 52%
1A2 Manufacturing Industries and Construction, liquids CO2 8777 9320 4,7% 1,1% 25,0% 0,3% 3,1% 55%
2C3 Aluminium production PFC 2638 22 0,0% 1,3% 20,1% 0,3% 2,9% 57%
1A4c Agriculture/Forestry/Fisheries:all fuels CH4 73 908 0,5% 0,5% 49,8% 0,3% 2,7% 60%
2B2 Nitric acid production N2O 6085 282 0,1% 2,9% 7,8% 0,2% 2,5% 63% 3B3 Swine CH4 3369 1713 0,9% 0,7% 26,9% 0,2% 2,0% 65% 4E Settlements CO2 911 1529 0,8% 0,5% 38,9% 0,2% 1,9% 67% 2B10 Other CO2 583 1416 0,7% 0,6% 30,0% 0,2% 1,8% 68% 1B2c Venting and flaring CH4 1491 198 0,1% 0,6% 25,1% 0,2% 1,7% 70% 3B1 Mature dairy cattle CH4 1083 1544 0,8% 0,4% 38,1% 0,1% 1,6% 72%
1B2 Fugitive emissions from oil and gas operations CO2 775 1027 0,5% 0,2% 50,0% 0,1% 1,2% 73%
1A3b Road transportation: diesel oil CO2 13012 17105 8,7% 3,6% 2,8% 0,1% 1,1% 74%
2A4d Other CO2 481 730 0,4% 0,2% 50,2% 0,1% 1,1% 75% 1A1a Public Electricity and Heat CO2 601 2857 1,5% 1,4% 6,5% 0,1% 1,0% 76%
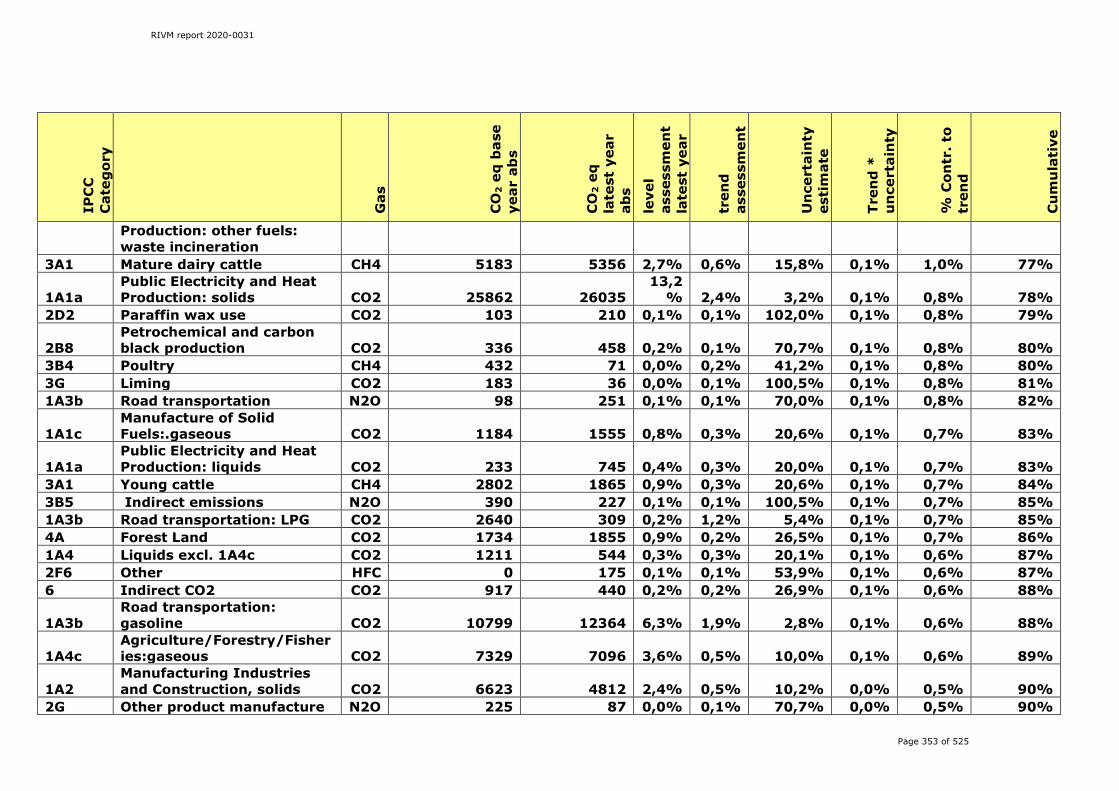
RIVM report 2020-0031
Page 353 of 525
IPC
C
Cat
egor
y
Gas
CO
2 e
q b
ase
year
ab
s
CO
2 e
q
late
st y
ear
abs
leve
l as
sess
men
t
late
st y
ear
tren
d
asse
ssm
ent
Un
cert
ain
ty
esti
mat
e
Tren
d *
u
nce
rtai
nty
% C
ontr
. to
tr
end
Cu
mu
lati
ve
Production: other fuels: waste incineration
3A1 Mature dairy cattle CH4 5183 5356 2,7% 0,6% 15,8% 0,1% 1,0% 77%
1A1a Public Electricity and Heat Production: solids CO2 25862 26035
13,2% 2,4% 3,2% 0,1% 0,8% 78%
2D2 Paraffin wax use CO2 103 210 0,1% 0,1% 102,0% 0,1% 0,8% 79%
2B8 Petrochemical and carbon black production CO2 336 458 0,2% 0,1% 70,7% 0,1% 0,8% 80%
3B4 Poultry CH4 432 71 0,0% 0,2% 41,2% 0,1% 0,8% 80% 3G Liming CO2 183 36 0,0% 0,1% 100,5% 0,1% 0,8% 81% 1A3b Road transportation N2O 98 251 0,1% 0,1% 70,0% 0,1% 0,8% 82%
1A1c Manufacture of Solid Fuels:.gaseous CO2 1184 1555 0,8% 0,3% 20,6% 0,1% 0,7% 83%
1A1a Public Electricity and Heat Production: liquids CO2 233 745 0,4% 0,3% 20,0% 0,1% 0,7% 83%
3A1 Young cattle CH4 2802 1865 0,9% 0,3% 20,6% 0,1% 0,7% 84% 3B5 Indirect emissions N2O 390 227 0,1% 0,1% 100,5% 0,1% 0,7% 85% 1A3b Road transportation: LPG CO2 2640 309 0,2% 1,2% 5,4% 0,1% 0,7% 85% 4A Forest Land CO2 1734 1855 0,9% 0,2% 26,5% 0,1% 0,7% 86% 1A4 Liquids excl. 1A4c CO2 1211 544 0,3% 0,3% 20,1% 0,1% 0,6% 87% 2F6 Other HFC 0 175 0,1% 0,1% 53,9% 0,1% 0,6% 87% 6 Indirect CO2 CO2 917 440 0,2% 0,2% 26,9% 0,1% 0,6% 88%
1A3b Road transportation: gasoline CO2 10799 12364 6,3% 1,9% 2,8% 0,1% 0,6% 88%
1A4c Agriculture/Forestry/Fisheries:gaseous CO2 7329 7096 3,6% 0,5% 10,0% 0,1% 0,6% 89%
1A2 Manufacturing Industries and Construction, solids CO2 6623 4812 2,4% 0,5% 10,2% 0,0% 0,5% 90%
2G Other product manufacture N2O 225 87 0,0% 0,1% 70,7% 0,0% 0,5% 90%
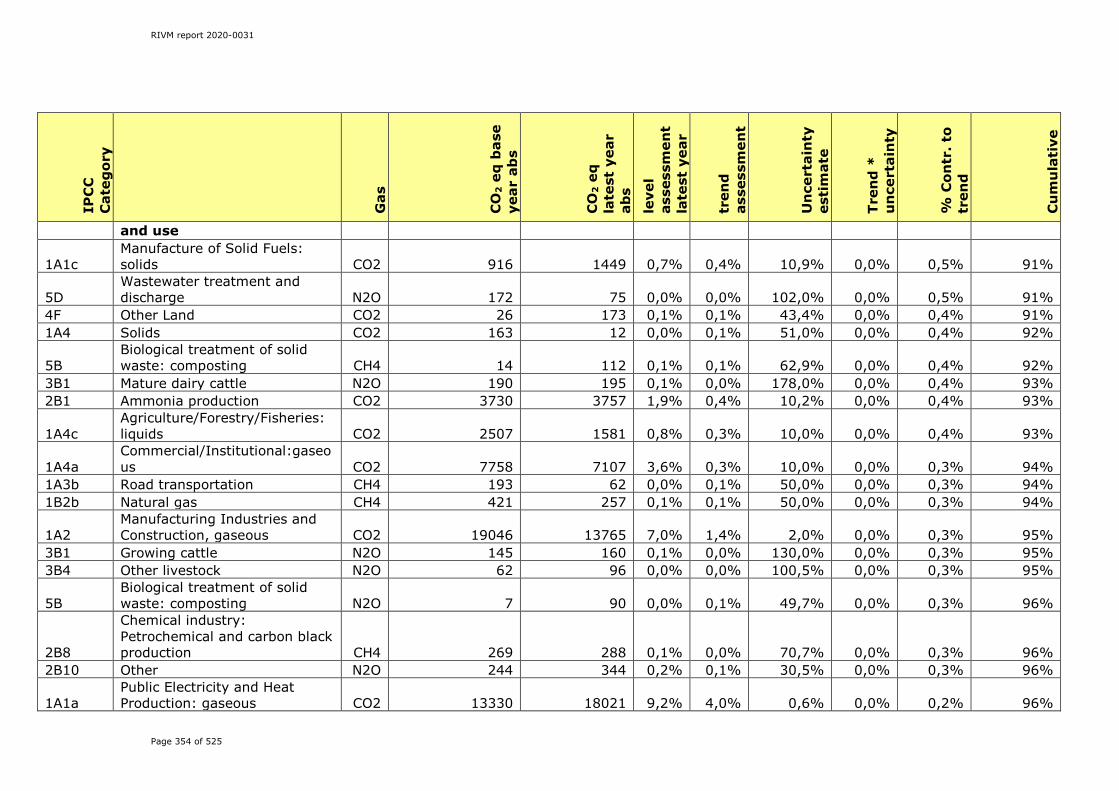
RIVM report 2020-0031
Page 354 of 525
IPC
C
Cat
egor
y
Gas
CO
2 e
q b
ase
year
ab
s
CO
2 e
q
late
st y
ear
abs
leve
l as
sess
men
t
late
st y
ear
tren
d
asse
ssm
ent
Un
cert
ain
ty
esti
mat
e
Tren
d *
u
nce
rtai
nty
% C
ontr
. to
tr
end
Cu
mu
lati
ve
and use
1A1c Manufacture of Solid Fuels: solids CO2 916 1449 0,7% 0,4% 10,9% 0,0% 0,5% 91%
5D Wastewater treatment and discharge N2O 172 75 0,0% 0,0% 102,0% 0,0% 0,5% 91%
4F Other Land CO2 26 173 0,1% 0,1% 43,4% 0,0% 0,4% 91% 1A4 Solids CO2 163 12 0,0% 0,1% 51,0% 0,0% 0,4% 92%
5B Biological treatment of solid waste: composting CH4 14 112 0,1% 0,1% 62,9% 0,0% 0,4% 92%
3B1 Mature dairy cattle N2O 190 195 0,1% 0,0% 178,0% 0,0% 0,4% 93% 2B1 Ammonia production CO2 3730 3757 1,9% 0,4% 10,2% 0,0% 0,4% 93%
1A4c Agriculture/Forestry/Fisheries: liquids CO2 2507 1581 0,8% 0,3% 10,0% 0,0% 0,4% 93%
1A4a Commercial/Institutional:gaseous CO2 7758 7107 3,6% 0,3% 10,0% 0,0% 0,3% 94%
1A3b Road transportation CH4 193 62 0,0% 0,1% 50,0% 0,0% 0,3% 94% 1B2b Natural gas CH4 421 257 0,1% 0,1% 50,0% 0,0% 0,3% 94%
1A2 Manufacturing Industries and Construction, gaseous CO2 19046 13765 7,0% 1,4% 2,0% 0,0% 0,3% 95%
3B1 Growing cattle N2O 145 160 0,1% 0,0% 130,0% 0,0% 0,3% 95% 3B4 Other livestock N2O 62 96 0,0% 0,0% 100,5% 0,0% 0,3% 95%
5B Biological treatment of solid waste: composting N2O 7 90 0,0% 0,1% 49,7% 0,0% 0,3% 96%
2B8
Chemical industry: Petrochemical and carbon black production CH4 269 288 0,1% 0,0% 70,7% 0,0% 0,3% 96%
2B10 Other N2O 244 344 0,2% 0,1% 30,5% 0,0% 0,3% 96%
1A1a Public Electricity and Heat Production: gaseous CO2 13330 18021 9,2% 4,0% 0,6% 0,0% 0,2% 96%
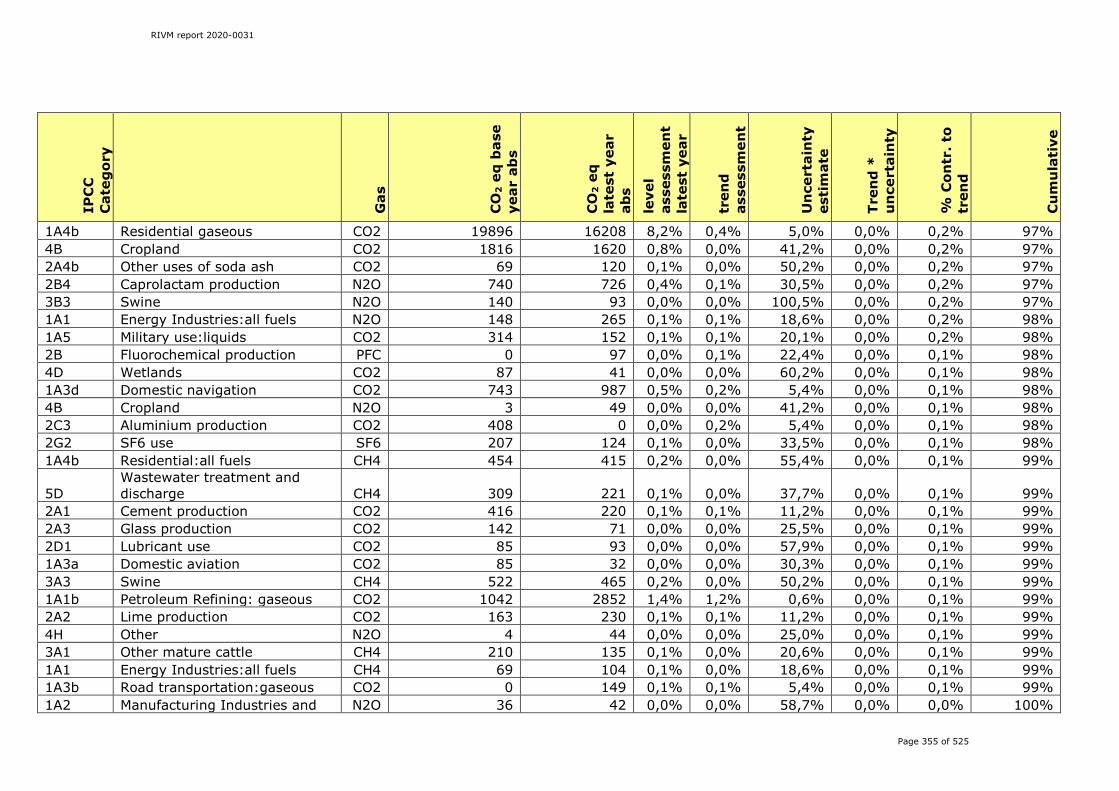
RIVM report 2020-0031
Page 355 of 525
IPC
C
Cat
egor
y
Gas
CO
2 e
q b
ase
year
ab
s
CO
2 e
q
late
st y
ear
abs
leve
l as
sess
men
t
late
st y
ear
tren
d
asse
ssm
ent
Un
cert
ain
ty
esti
mat
e
Tren
d *
u
nce
rtai
nty
% C
ontr
. to
tr
end
Cu
mu
lati
ve
1A4b Residential gaseous CO2 19896 16208 8,2% 0,4% 5,0% 0,0% 0,2% 97% 4B Cropland CO2 1816 1620 0,8% 0,0% 41,2% 0,0% 0,2% 97% 2A4b Other uses of soda ash CO2 69 120 0,1% 0,0% 50,2% 0,0% 0,2% 97% 2B4 Caprolactam production N2O 740 726 0,4% 0,1% 30,5% 0,0% 0,2% 97% 3B3 Swine N2O 140 93 0,0% 0,0% 100,5% 0,0% 0,2% 97% 1A1 Energy Industries:all fuels N2O 148 265 0,1% 0,1% 18,6% 0,0% 0,2% 98% 1A5 Military use:liquids CO2 314 152 0,1% 0,1% 20,1% 0,0% 0,2% 98% 2B Fluorochemical production PFC 0 97 0,0% 0,1% 22,4% 0,0% 0,1% 98% 4D Wetlands CO2 87 41 0,0% 0,0% 60,2% 0,0% 0,1% 98% 1A3d Domestic navigation CO2 743 987 0,5% 0,2% 5,4% 0,0% 0,1% 98% 4B Cropland N2O 3 49 0,0% 0,0% 41,2% 0,0% 0,1% 98% 2C3 Aluminium production CO2 408 0 0,0% 0,2% 5,4% 0,0% 0,1% 98% 2G2 SF6 use SF6 207 124 0,1% 0,0% 33,5% 0,0% 0,1% 98% 1A4b Residential:all fuels CH4 454 415 0,2% 0,0% 55,4% 0,0% 0,1% 99%
5D Wastewater treatment and discharge CH4 309 221 0,1% 0,0% 37,7% 0,0% 0,1% 99%
2A1 Cement production CO2 416 220 0,1% 0,1% 11,2% 0,0% 0,1% 99% 2A3 Glass production CO2 142 71 0,0% 0,0% 25,5% 0,0% 0,1% 99% 2D1 Lubricant use CO2 85 93 0,0% 0,0% 57,9% 0,0% 0,1% 99% 1A3a Domestic aviation CO2 85 32 0,0% 0,0% 30,3% 0,0% 0,1% 99% 3A3 Swine CH4 522 465 0,2% 0,0% 50,2% 0,0% 0,1% 99% 1A1b Petroleum Refining: gaseous CO2 1042 2852 1,4% 1,2% 0,6% 0,0% 0,1% 99% 2A2 Lime production CO2 163 230 0,1% 0,1% 11,2% 0,0% 0,1% 99% 4H Other N2O 4 44 0,0% 0,0% 25,0% 0,0% 0,1% 99% 3A1 Other mature cattle CH4 210 135 0,1% 0,0% 20,6% 0,0% 0,1% 99% 1A1 Energy Industries:all fuels CH4 69 104 0,1% 0,0% 18,6% 0,0% 0,1% 99% 1A3b Road transportation:gaseous CO2 0 149 0,1% 0,1% 5,4% 0,0% 0,1% 99% 1A2 Manufacturing Industries and N2O 36 42 0,0% 0,0% 58,7% 0,0% 0,0% 100%

RIVM report 2020-0031
Page 356 of 525
IPC
C
Cat
egor
y
Gas
CO
2 e
q b
ase
year
ab
s
CO
2 e
q
late
st y
ear
abs
leve
l as
sess
men
t
late
st y
ear
tren
d
asse
ssm
ent
Un
cert
ain
ty
esti
mat
e
Tren
d *
u
nce
rtai
nty
% C
ontr
. to
tr
end
Cu
mu
lati
ve
Construction:all fuels 2E Electronic Industry PFC 25 44 0,0% 0,0% 25,5% 0,0% 0,0% 100% 2D3 Other CO2 0 21 0,0% 0,0% 26,7% 0,0% 0,0% 100% 4G Harvested wood products CO2 158 113 0,1% 0,0% 25,3% 0,0% 0,0% 100%
1A4a Commercial/Institutional:all fuels CH4 45 47 0,0% 0,0% 48,7% 0,0% 0,0% 100%
3B2 Sheep N2O 7 2 0,0% 0,0% 100,5% 0,0% 0,0% 100% 4C Grassland N2O 0 8 0,0% 0,0% 57,0% 0,0% 0,0% 100% 2B7 Soda ash production CO2 64 0 0,0% 0,0% 7,1% 0,0% 0,0% 100% 1A4 Other Sectors:all fuels N2O 50 50 0,0% 0,0% 46,6% 0,0% 0,0% 100% 3B2, 3B4 Other CH4 34 39 0,0% 0,0% 33,5% 0,0% 0,0% 100% 3A4 Other CH4 514 447 0,2% 0,0% 30,4% 0,0% 0,0% 100% 5D Open burning of waste CH4 4 4 0,0% 0,0% 316,2% 0,0% 0,0% 100% 1A3b Road transportation:other fuels CO2 0 54 0,0% 0,0% 5,4% 0,0% 0,0% 100% 3B1 Other mature cattle N2O 7 5 0,0% 0,0% 192,0% 0,0% 0,0% 100% 1B1b Solid fuel transformation CO2 110 77 0,0% 0,0% 15,1% 0,0% 0,0% 100% 2A4a Ceramics CO2 140 124 0,1% 0,0% 50,2% 0,0% 0,0% 100% 3B1 Other mature cattle CH4 22 12 0,0% 0,0% 33,1% 0,0% 0,0% 100%
2G Other product manufacture and use CH4 50 46 0,0% 0,0% 50,5% 0,0% 0,0% 100%
1A5 Military use:liquids N2O 6 2 0,0% 0,0% 82,3% 0,0% 0,0% 100% 5D Open burning of waste N2O 2 3 0,0% 0,0% 316,2% 0,0% 0,0% 100% 1A3 exl 1A3b Other N2O 7 8 0,0% 0,0% 70,0% 0,0% 0,0% 100% 2H Other industrial CO2 72 36 0,0% 0,0% 5,7% 0,0% 0,0% 100%
1A2 Manufacturing Industries and Construction:all fuels CH4 67 65 0,0% 0,0% 15,9% 0,0% 0,0% 100%
1A3e Other Transportation CO2 342 90 0,0% 0,1% 0,6% 0,0% 0,0% 100%
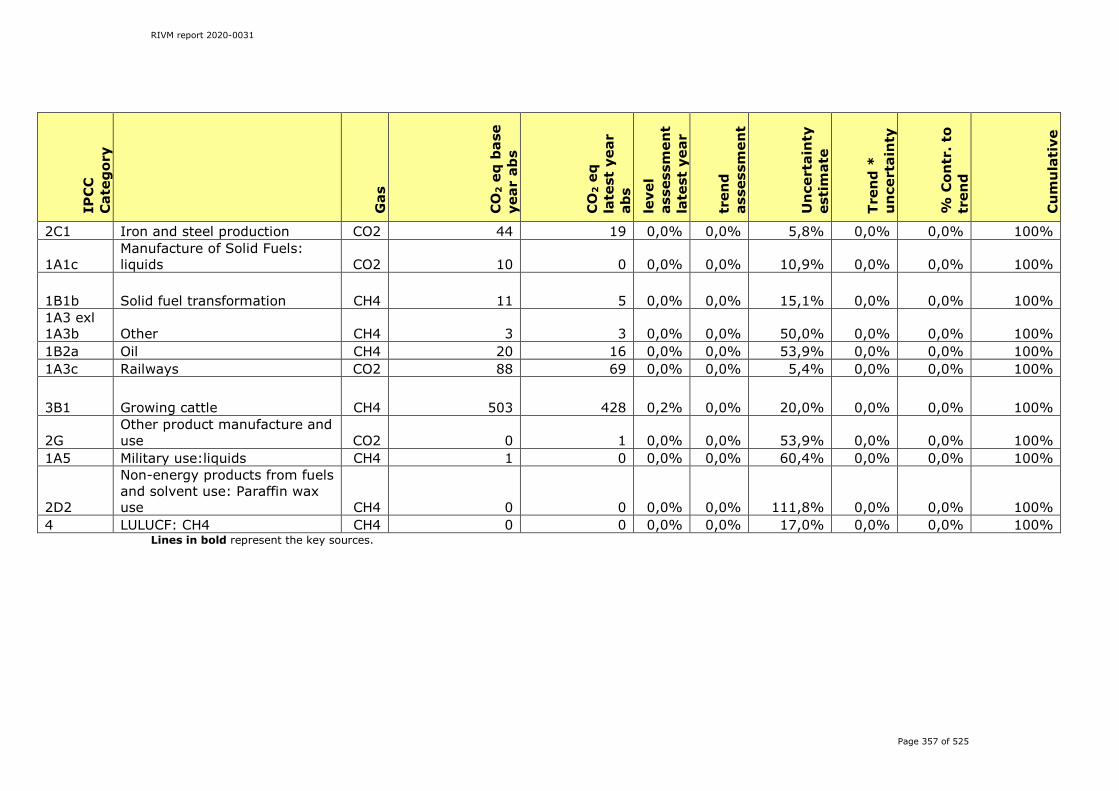
RIVM report 2020-0031
Page 357 of 525
IPC
C
Cat
egor
y
Gas
CO
2 e
q b
ase
year
ab
s
CO
2 e
q
late
st y
ear
abs
leve
l as
sess
men
t
late
st y
ear
tren
d
asse
ssm
ent
Un
cert
ain
ty
esti
mat
e
Tren
d *
u
nce
rtai
nty
% C
ontr
. to
tr
end
Cu
mu
lati
ve
2C1 Iron and steel production CO2 44 19 0,0% 0,0% 5,8% 0,0% 0,0% 100%
1A1c Manufacture of Solid Fuels: liquids CO2 10 0 0,0% 0,0% 10,9% 0,0% 0,0% 100%
1B1b Solid fuel transformation CH4 11 5 0,0% 0,0% 15,1% 0,0% 0,0% 100% 1A3 exl 1A3b Other CH4 3 3 0,0% 0,0% 50,0% 0,0% 0,0% 100% 1B2a Oil CH4 20 16 0,0% 0,0% 53,9% 0,0% 0,0% 100% 1A3c Railways CO2 88 69 0,0% 0,0% 5,4% 0,0% 0,0% 100%
3B1 Growing cattle CH4 503 428 0,2% 0,0% 20,0% 0,0% 0,0% 100%
2G Other product manufacture and use CO2 0 1 0,0% 0,0% 53,9% 0,0% 0,0% 100%
1A5 Military use:liquids CH4 1 0 0,0% 0,0% 60,4% 0,0% 0,0% 100%
2D2
Non-energy products from fuels and solvent use: Paraffin wax use CH4 0 0 0,0% 0,0% 111,8% 0,0% 0,0% 100%
4 LULUCF: CH4 CH4 0 0 0,0% 0,0% 17,0% 0,0% 0,0% 100% Lines in bold represent the key sources.
RIVM report 2020-0031
Page 358 of 525
Annex 2 Assessment of uncertainty
2.1 Description of methodology used for estimating uncertainty An Approach 1 uncertainty assessment (based on error propagation) has been performed to estimate the uncertainty in total national GHG emissions and in emissions trends as reported in this NIR 2020. An Approach 2 assessment has been done in 2019; and the outcome showed at the time very few differences in the outcome compeared to the Approach 1 assessment. Because there are only minor changes in sources and methodologies in the inevntroy for 2020, it has been decided to perform only an Approach 1 uncertainty assessment for 2020. The propagation of uncertainty in the emissions calculations was assessed using the IPCC Approach 1. In this method, uncertainty ranges are combined for all sectors or gases using the standard equations for error propagation. If sources are added, the total error is the root of the sum of the squares of the error in the underlying sources. Strictly speaking, this is valid only if the uncertainties meet the following conditions: (a) standard normal distribution (‘Gaussian’); (b) 2s smaller than 60%; (c) independent (not-correlated) sector-to-sector and substance-to-substance. It is clear, however, that for some sources, activity data or EFs are correlated, which may change the overall uncertainty of the sum to an unknown extent. It is also known that for some sources the uncertainty is not distributed normally; particularly when uncertainties are very high (of an order of 100%), it is clear that the distribution will be positively skewed. Even more important is the fact that, although the uncertainty estimates have been based on the documented uncertainties mentioned above, uncertainty estimates are ultimately – and unavoidably – based on the judgement of the expert. On occasion, only limited reference to actual data for the Netherlands is possible in support of these estimates. By focusing on the order of magnitude of the individual uncertainty estimates, it is expected that this dataset provides a reasonable assessment of the uncertainty of key sources. This is supported by the recent Approach 2 uncertainty assessment (Monte Carlo analysis), which reveals that the Approach 2 uncertainty is of the same order of magnitude as that found in the Approach 1 results (see Table 1.4). This is also in line with the 2006 Approach 2 uncertainty assessment as reported in former NIRs (Ramírez-Ramírez et al., 2006). As part of the 2006 study, the expert judgements and assumptions made for uncertainty ranges in EFs and activity data for the Netherlands were compared with the uncertainty assumptions (and their underpinning) used in Approach 2 studies carried out by other European countries, Finland, the United Kingdom, Norway, Austria and Flanders (Belgium). The correlations that were assumed in the various European Approach 2 studies were also mapped and compared. The comparisons of assumed uncertainty ranges led to a number of improvements in (and have increased the underpinning of) the Netherlands’ assumptions for the present Approach 1 approach.

RIVM report 2020-0031
Page 359 of 525
Although a one-to-one comparison was not possible, due to differences in the aggregation level at which the assumptions were made, results show that for CO2 the uncertainty estimates of the Netherlands are well within the range of the European studies. For non-CO2 gases, especially N2O from agriculture and soils, the Netherlands uses IPCC defaults, which are on the high side compared with the assumptions used in some of the other European studies. This seems quite realistic in view of the state of knowledge about the processes that lead to N2O emissions. Another finding was that correlations (covariance and dependencies in the emissions calculations) seem somewhat under-addressed in most recent European Approach 2 studies and may require more systematic attention in the future. In the assessments described above, only random errors were estimated, on the assumption that the methodology used for the calculations did not include systematic errors, which in practice can occur. The uncertainty estimates for the activity data and EFs listed in Table A2.4 were also used for an Approach 1 trend uncertainty assessment, as shown in Table A2.1. Uncertainties for the activity data and EFs are derived from a mixture of empirical data and expert judgement and are presented here as half the 95% confidence interval. The reason for halving the 95% confidence interval is that the value then corresponds to the familiar plus or minus value when uncertainties are loosely quoted as ‘plus or minus x%’. Since 2012, all data on uncertainty for each source have been included in the PRTR database. At the start of the NIR compilation, the Task Forces are asked to submit new uncertainty information, which is included in the annual key category assessment of the NIR. An Approach 2 uncertainty assessment (Monte Carlo) is performed as a check of the Approach 1 uncertainty assessment.The results are similar to the results from the Approach 1 uncertainty assessment (see Tables A2.1 and A2.2). Table A2.1: Approach 1 level and trend uncertainty estimates related to 2018 emissions (trend: 1990 – 2018)
Uncertainty in emissions level
Uncertainty in emissions trend
CO2 ±2% ±2% of 2% decrease CH4 ±9% ±5% of 46% decrease N2O ±38% ±6% of 54% decrease F-gases ±35% ±9% of 77% decrease Total ±3% ±2% of 15.1% decrease
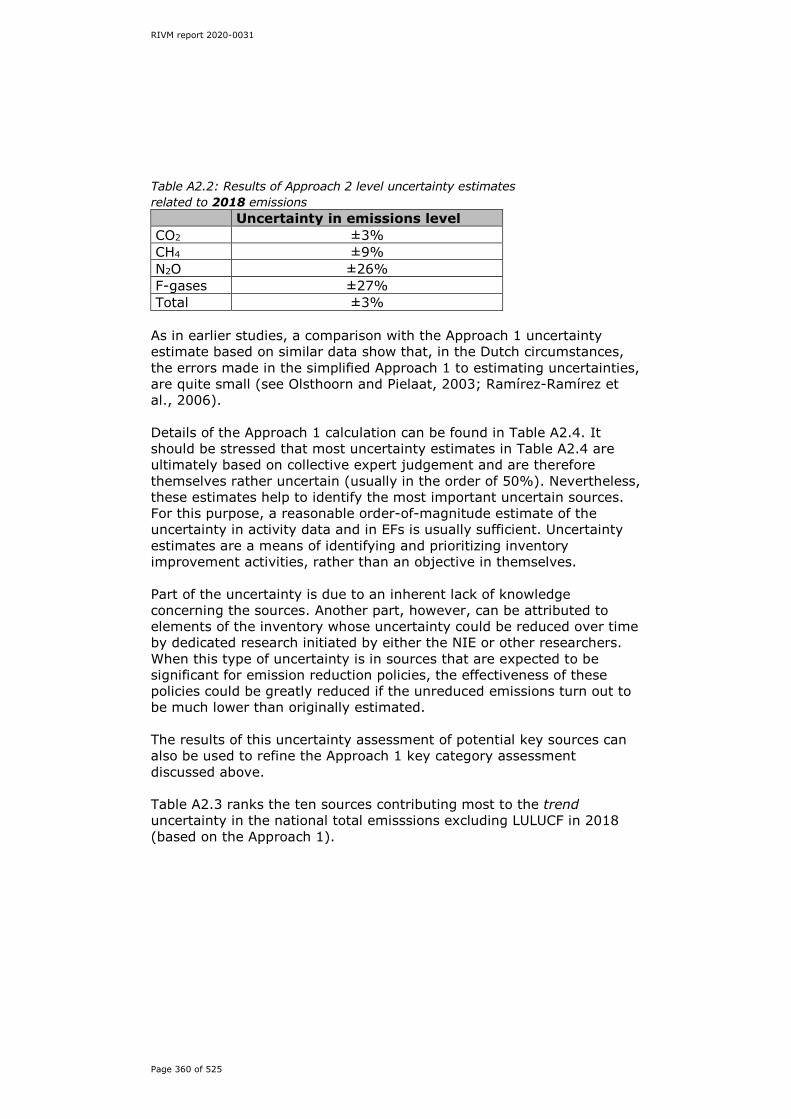
RIVM report 2020-0031
Page 360 of 525
Table A2.2: Results of Approach 2 level uncertainty estimates related to 2018 emissions Uncertainty in emissions level CO2 ±3% CH4 ±9% N2O ±26% F-gases ±27% Total ±3% As in earlier studies, a comparison with the Approach 1 uncertainty estimate based on similar data show that, in the Dutch circumstances, the errors made in the simplified Approach 1 to estimating uncertainties, are quite small (see Olsthoorn and Pielaat, 2003; Ramírez-Ramírez et al., 2006). Details of the Approach 1 calculation can be found in Table A2.4. It should be stressed that most uncertainty estimates in Table A2.4 are ultimately based on collective expert judgement and are therefore themselves rather uncertain (usually in the order of 50%). Nevertheless, these estimates help to identify the most important uncertain sources. For this purpose, a reasonable order-of-magnitude estimate of the uncertainty in activity data and in EFs is usually sufficient. Uncertainty estimates are a means of identifying and prioritizing inventory improvement activities, rather than an objective in themselves. Part of the uncertainty is due to an inherent lack of knowledge concerning the sources. Another part, however, can be attributed to elements of the inventory whose uncertainty could be reduced over time by dedicated research initiated by either the NIE or other researchers. When this type of uncertainty is in sources that are expected to be significant for emission reduction policies, the effectiveness of these policies could be greatly reduced if the unreduced emissions turn out to be much lower than originally estimated. The results of this uncertainty assessment of potential key sources can also be used to refine the Approach 1 key category assessment discussed above. Table A2.3 ranks the ten sources contributing most to the trend uncertainty in the national total emisssions excluding LULUCF in 2018 (based on the Approach 1).
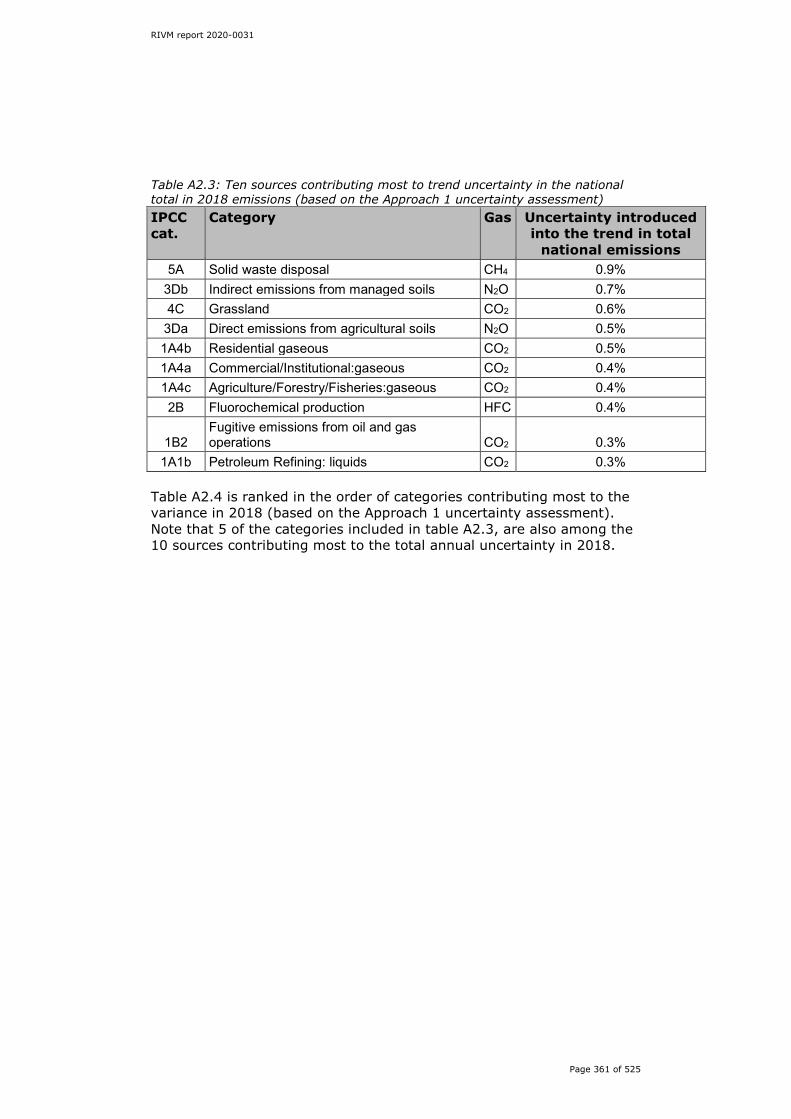
RIVM report 2020-0031
Page 361 of 525
Table A2.3: Ten sources contributing most to trend uncertainty in the national total in 2018 emissions (based on the Approach 1 uncertainty assessment) IPCC cat.
Category Gas Uncertainty introduced into the trend in total
national emissions 5A Solid waste disposal CH4 0.9%
3Db Indirect emissions from managed soils N2O 0.7% 4C Grassland CO2 0.6% 3Da Direct emissions from agricultural soils N2O 0.5% 1A4b Residential gaseous CO2 0.5% 1A4a Commercial/Institutional:gaseous CO2 0.4% 1A4c Agriculture/Forestry/Fisheries:gaseous CO2 0.4% 2B Fluorochemical production HFC 0.4%
1B2 Fugitive emissions from oil and gas operations CO2 0.3%
1A1b Petroleum Refining: liquids CO2 0.3% Table A2.4 is ranked in the order of categories contributing most to the variance in 2018 (based on the Approach 1 uncertainty assessment). Note that 5 of the categories included in table A2.3, are also among the 10 sources contributing most to the total annual uncertainty in 2018.
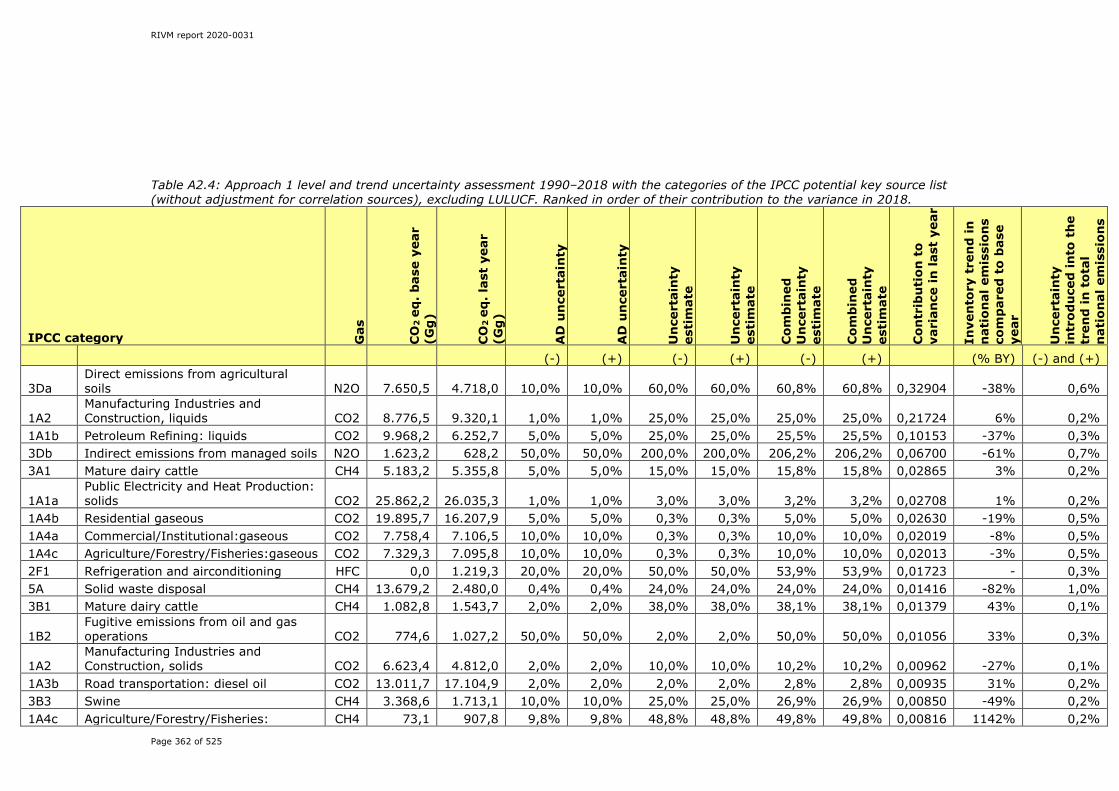
RIVM report 2020-0031
Page 362 of 525
Table A2.4: Approach 1 level and trend uncertainty assessment 1990–2018 with the categories of the IPCC potential key source list (without adjustment for correlation sources), excluding LULUCF. Ranked in order of their contribution to the variance in 2018.
IPCC category Gas
CO
2 e
q.
bas
e ye
ar
(Gg
)
CO
2 e
q.
last
yea
r (G
g)
AD
un
cert
ain
ty
AD
un
cert
ain
ty
Un
cert
ain
ty
esti
mat
e
Un
cert
ain
ty
esti
mat
e
Co
mb
ined
U
nce
rtai
nty
es
tim
ate
Co
mb
ined
U
nce
rtai
nty
es
tim
ate
Co
ntr
ibu
tio
n t
o
vari
ance
in
las
t ye
ar
Inve
nto
ry t
ren
d i
n
nat
ion
al e
mis
sio
ns
com
par
ed t
o b
ase
year
Un
cert
ain
ty
intr
od
uce
d i
nto
th
e tr
end
in
to
tal
nat
ion
al e
mis
sio
ns
(-) (+) (-) (+) (-) (+) (% BY) (-) and (+)
3Da Direct emissions from agricultural soils N2O 7.650,5 4.718,0 10,0% 10,0% 60,0% 60,0% 60,8% 60,8% 0,32904 -38% 0,6%
1A2 Manufacturing Industries and Construction, liquids CO2 8.776,5 9.320,1 1,0% 1,0% 25,0% 25,0% 25,0% 25,0% 0,21724 6% 0,2%
1A1b Petroleum Refining: liquids CO2 9.968,2 6.252,7 5,0% 5,0% 25,0% 25,0% 25,5% 25,5% 0,10153 -37% 0,3% 3Db Indirect emissions from managed soils N2O 1.623,2 628,2 50,0% 50,0% 200,0% 200,0% 206,2% 206,2% 0,06700 -61% 0,7% 3A1 Mature dairy cattle CH4 5.183,2 5.355,8 5,0% 5,0% 15,0% 15,0% 15,8% 15,8% 0,02865 3% 0,2%
1A1a Public Electricity and Heat Production: solids CO2 25.862,2 26.035,3 1,0% 1,0% 3,0% 3,0% 3,2% 3,2% 0,02708 1% 0,2%
1A4b Residential gaseous CO2 19.895,7 16.207,9 5,0% 5,0% 0,3% 0,3% 5,0% 5,0% 0,02630 -19% 0,5% 1A4a Commercial/Institutional:gaseous CO2 7.758,4 7.106,5 10,0% 10,0% 0,3% 0,3% 10,0% 10,0% 0,02019 -8% 0,5% 1A4c Agriculture/Forestry/Fisheries:gaseous CO2 7.329,3 7.095,8 10,0% 10,0% 0,3% 0,3% 10,0% 10,0% 0,02013 -3% 0,5% 2F1 Refrigeration and airconditioning HFC 0,0 1.219,3 20,0% 20,0% 50,0% 50,0% 53,9% 53,9% 0,01723 - 0,3% 5A Solid waste disposal CH4 13.679,2 2.480,0 0,4% 0,4% 24,0% 24,0% 24,0% 24,0% 0,01416 -82% 1,0% 3B1 Mature dairy cattle CH4 1.082,8 1.543,7 2,0% 2,0% 38,0% 38,0% 38,1% 38,1% 0,01379 43% 0,1%
1B2 Fugitive emissions from oil and gas operations CO2 774,6 1.027,2 50,0% 50,0% 2,0% 2,0% 50,0% 50,0% 0,01056 33% 0,3%
1A2 Manufacturing Industries and Construction, solids CO2 6.623,4 4.812,0 2,0% 2,0% 10,0% 10,0% 10,2% 10,2% 0,00962 -27% 0,1%
1A3b Road transportation: diesel oil CO2 13.011,7 17.104,9 2,0% 2,0% 2,0% 2,0% 2,8% 2,8% 0,00935 31% 0,2% 3B3 Swine CH4 3.368,6 1.713,1 10,0% 10,0% 25,0% 25,0% 26,9% 26,9% 0,00850 -49% 0,2% 1A4c Agriculture/Forestry/Fisheries: CH4 73,1 907,8 9,8% 9,8% 48,8% 48,8% 49,8% 49,8% 0,00816 1142% 0,2%
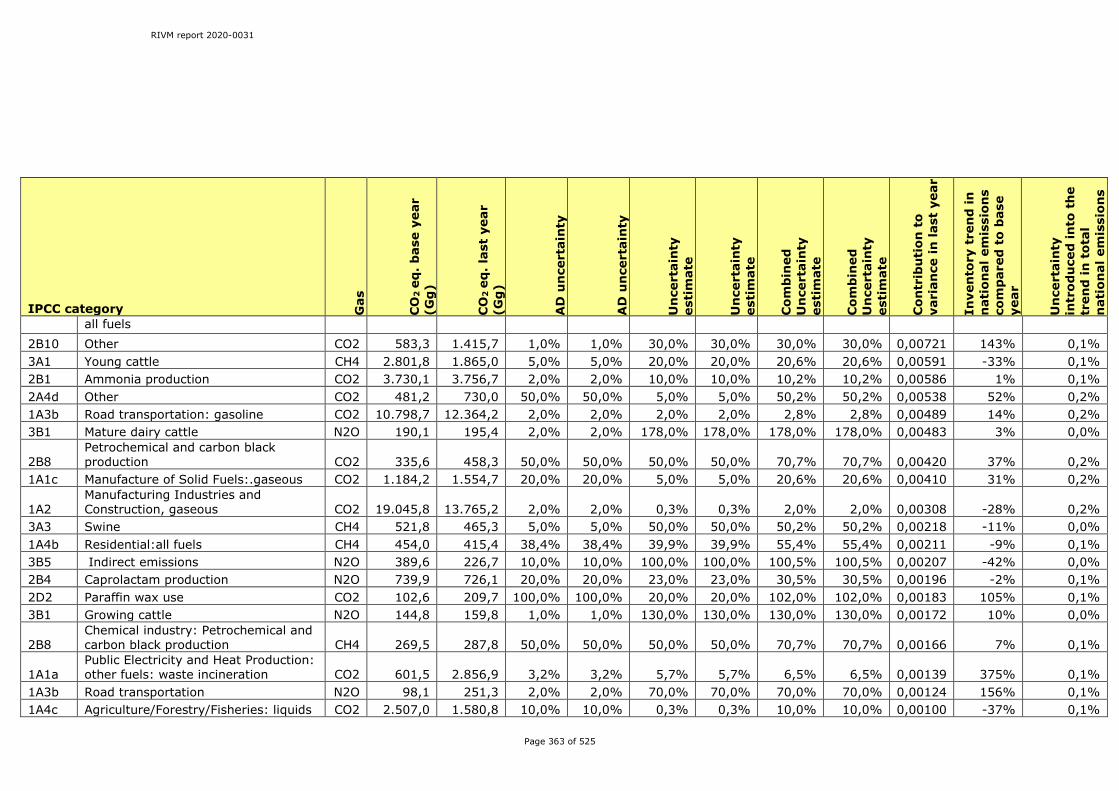
RIVM report 2020-0031
Page 363 of 525
IPCC category Gas
CO
2 e
q.
bas
e ye
ar
(Gg
)
CO
2 e
q.
last
yea
r (G
g)
AD
un
cert
ain
ty
AD
un
cert
ain
ty
Un
cert
ain
ty
esti
mat
e
Un
cert
ain
ty
esti
mat
e
Co
mb
ined
U
nce
rtai
nty
es
tim
ate
Co
mb
ined
U
nce
rtai
nty
es
tim
ate
Co
ntr
ibu
tio
n t
o
vari
ance
in
las
t ye
ar
Inve
nto
ry t
ren
d i
n
nat
ion
al e
mis
sio
ns
com
par
ed t
o b
ase
year
Un
cert
ain
ty
intr
od
uce
d i
nto
th
e tr
end
in
to
tal
nat
ion
al e
mis
sio
ns
all fuels 2B10 Other CO2 583,3 1.415,7 1,0% 1,0% 30,0% 30,0% 30,0% 30,0% 0,00721 143% 0,1% 3A1 Young cattle CH4 2.801,8 1.865,0 5,0% 5,0% 20,0% 20,0% 20,6% 20,6% 0,00591 -33% 0,1% 2B1 Ammonia production CO2 3.730,1 3.756,7 2,0% 2,0% 10,0% 10,0% 10,2% 10,2% 0,00586 1% 0,1% 2A4d Other CO2 481,2 730,0 50,0% 50,0% 5,0% 5,0% 50,2% 50,2% 0,00538 52% 0,2% 1A3b Road transportation: gasoline CO2 10.798,7 12.364,2 2,0% 2,0% 2,0% 2,0% 2,8% 2,8% 0,00489 14% 0,2% 3B1 Mature dairy cattle N2O 190,1 195,4 2,0% 2,0% 178,0% 178,0% 178,0% 178,0% 0,00483 3% 0,0%
2B8 Petrochemical and carbon black production CO2 335,6 458,3 50,0% 50,0% 50,0% 50,0% 70,7% 70,7% 0,00420 37% 0,2%
1A1c Manufacture of Solid Fuels:.gaseous CO2 1.184,2 1.554,7 20,0% 20,0% 5,0% 5,0% 20,6% 20,6% 0,00410 31% 0,2%
1A2 Manufacturing Industries and Construction, gaseous CO2 19.045,8 13.765,2 2,0% 2,0% 0,3% 0,3% 2,0% 2,0% 0,00308 -28% 0,2%
3A3 Swine CH4 521,8 465,3 5,0% 5,0% 50,0% 50,0% 50,2% 50,2% 0,00218 -11% 0,0% 1A4b Residential:all fuels CH4 454,0 415,4 38,4% 38,4% 39,9% 39,9% 55,4% 55,4% 0,00211 -9% 0,1% 3B5 Indirect emissions N2O 389,6 226,7 10,0% 10,0% 100,0% 100,0% 100,5% 100,5% 0,00207 -42% 0,0% 2B4 Caprolactam production N2O 739,9 726,1 20,0% 20,0% 23,0% 23,0% 30,5% 30,5% 0,00196 -2% 0,1% 2D2 Paraffin wax use CO2 102,6 209,7 100,0% 100,0% 20,0% 20,0% 102,0% 102,0% 0,00183 105% 0,1% 3B1 Growing cattle N2O 144,8 159,8 1,0% 1,0% 130,0% 130,0% 130,0% 130,0% 0,00172 10% 0,0%
2B8 Chemical industry: Petrochemical and carbon black production CH4 269,5 287,8 50,0% 50,0% 50,0% 50,0% 70,7% 70,7% 0,00166 7% 0,1%
1A1a Public Electricity and Heat Production: other fuels: waste incineration CO2 601,5 2.856,9 3,2% 3,2% 5,7% 5,7% 6,5% 6,5% 0,00139 375% 0,1%
1A3b Road transportation N2O 98,1 251,3 2,0% 2,0% 70,0% 70,0% 70,0% 70,0% 0,00124 156% 0,1% 1A4c Agriculture/Forestry/Fisheries: liquids CO2 2.507,0 1.580,8 10,0% 10,0% 0,3% 0,3% 10,0% 10,0% 0,00100 -37% 0,1%

RIVM report 2020-0031
Page 364 of 525
IPCC category Gas
CO
2 e
q.
bas
e ye
ar
(Gg
)
CO
2 e
q.
last
yea
r (G
g)
AD
un
cert
ain
ty
AD
un
cert
ain
ty
Un
cert
ain
ty
esti
mat
e
Un
cert
ain
ty
esti
mat
e
Co
mb
ined
U
nce
rtai
nty
es
tim
ate
Co
mb
ined
U
nce
rtai
nty
es
tim
ate
Co
ntr
ibu
tio
n t
o
vari
ance
in
las
t ye
ar
Inve
nto
ry t
ren
d i
n
nat
ion
al e
mis
sio
ns
com
par
ed t
o b
ase
year
Un
cert
ain
ty
intr
od
uce
d i
nto
th
e tr
end
in
to
tal
nat
ion
al e
mis
sio
ns
1A1c Manufacture of Solid Fuels: solids CO2 916,3 1.449,3 2,0% 2,0% 10,7% 10,7% 10,9% 10,9% 0,00099 58% 0,0%
1A1a Public Electricity and Heat Production: liquids CO2 233,2 744,9 0,5% 0,5% 20,0% 20,0% 20,0% 20,0% 0,00089 219% 0,0%
3A4 Other CH4 514,4 447,4 5,0% 5,0% 30,0% 30,0% 30,4% 30,4% 0,00074 -13% 0,0% 1B2b Natural gas CH4 421,1 256,7 2,0% 2,0% 50,0% 50,0% 50,0% 50,0% 0,00066 -39% 0,0% 6 Indirect CO2 CO2 917,2 440,4 19,0% 19,0% 19,0% 19,0% 26,9% 26,9% 0,00056 -52% 0,1% 1A4 Liquids excl. 1A4c CO2 1.211,2 544,0 20,0% 20,0% 2,0% 2,0% 20,1% 20,1% 0,00048 -55% 0,1% 2B10 Other N2O 244,2 343,9 20,0% 20,0% 23,0% 23,0% 30,5% 30,5% 0,00044 41% 0,0%
1A1a Public Electricity and Heat Production: gaseous CO2 13.330,2 18.021,1 0,5% 0,5% 0,3% 0,3% 0,6% 0,6% 0,00041 35% 0,1%
3B4 Other livestock N2O 61,5 96,0 10,0% 10,0% 100,0% 100,0% 100,5% 100,5% 0,00037 56% 0,0% 2F6 Other HFC 0,0 175,1 20,0% 20,0% 50,0% 50,0% 53,9% 53,9% 0,00036 - 0,0% 3B3 Swine N2O 140,2 92,8 10,0% 10,0% 100,0% 100,0% 100,5% 100,5% 0,00035 -34% 0,0% 3B1 Growing cattle CH4 502,9 428,3 1,0% 1,0% 20,0% 20,0% 20,0% 20,0% 0,00029 -15% 0,0% 5D Wastewater treatment and discharge CH4 308,8 221,3 20,0% 20,0% 32,0% 32,0% 37,7% 37,7% 0,00028 -28% 0,0% 5D Wastewater treatment and discharge N2O 172,1 74,9 20,0% 20,0% 100,0% 100,0% 102,0% 102,0% 0,00023 -56% 0,0%
5B Biological treatment of solid waste: composting CH4 13,7 111,9 5,0% 5,0% 62,7% 62,7% 62,9% 62,9% 0,00020 718% 0,0%
2A4a Ceramics CO2 140,1 123,9 50,0% 50,0% 5,0% 5,0% 50,2% 50,2% 0,00015 -12% 0,0% 2G Other product manufacture and use N2O 224,7 87,0 50,0% 50,0% 50,0% 50,0% 70,7% 70,7% 0,00015 -61% 0,0% 2A4b Other uses of soda ash CO2 68,6 119,9 50,0% 50,0% 5,0% 5,0% 50,2% 50,2% 0,00015 75% 0,0% 2B Fluorochemical production HFC 5.606,3 247,2 10,0% 10,0% 20,0% 20,0% 22,4% 22,4% 0,00012 -96% 0,4% 2D1 Lubricant use CO2 84,6 93,3 50,0% 50,0% 29,2% 29,2% 57,9% 57,9% 0,00012 10% 0,0% 1A3d Domestic navigation CO2 743,5 987,1 5,0% 5,0% 2,0% 2,0% 5,4% 5,4% 0,00011 33% 0,0%

RIVM report 2020-0031
Page 365 of 525
IPCC category Gas
CO
2 e
q.
bas
e ye
ar
(Gg
)
CO
2 e
q.
last
yea
r (G
g)
AD
un
cert
ain
ty
AD
un
cert
ain
ty
Un
cert
ain
ty
esti
mat
e
Un
cert
ain
ty
esti
mat
e
Co
mb
ined
U
nce
rtai
nty
es
tim
ate
Co
mb
ined
U
nce
rtai
nty
es
tim
ate
Co
ntr
ibu
tio
n t
o
vari
ance
in
las
t ye
ar
Inve
nto
ry t
ren
d i
n
nat
ion
al e
mis
sio
ns
com
par
ed t
o b
ase
year
Un
cert
ain
ty
intr
od
uce
d i
nto
th
e tr
end
in
to
tal
nat
ion
al e
mis
sio
ns
1B2c Venting and flaring CH4 1.490,9 198,4 2,0% 2,0% 25,0% 25,0% 25,1% 25,1% 0,00010 -87% 0,1% 1A1 Energy Industries:all fuels N2O 148,1 265,3 2,5% 2,5% 18,4% 18,4% 18,6% 18,6% 0,00010 79% 0,0%
5B Biological treatment of solid waste: composting N2O 6,5 89,8 5,0% 5,0% 49,4% 49,4% 49,7% 49,7% 0,00008 1277% 0,0%
2G2 SF6 use SF6 207 124 30,0% 30,0% 15,0% 15,0% 33,5% 33,5% 0,00007 -40% 0,0% 3G Liming CO2 183,2 35,9 10,0% 10,0% 100,0% 100,0% 100,5% 100,5% 0,00005 -80% 0,1% 1A3b Road transportation CH4 193,0 62,2 2,0% 2,0% 50,0% 50,0% 50,0% 50,0% 0,00004 -68% 0,0% 1A5 Military use:liquids CO2 314,0 151,7 20,0% 20,0% 2,0% 2,0% 20,1% 20,1% 0,00004 -52% 0,0% 3B4 Poultry CH4 432,1 71,4 10,0% 10,0% 40,0% 40,0% 41,2% 41,2% 0,00003 -83% 0,1% 3A1 Other mature cattle CH4 210,2 134,8 5,0% 5,0% 20,0% 20,0% 20,6% 20,6% 0,00003 -36% 0,0% 2A2 Lime production CO2 162,7 229,6 5,0% 5,0% 10,0% 10,0% 11,2% 11,2% 0,00003 41% 0,0%
1A2 Manufacturing Industries and Construction:all fuels N2O 35,9 42,2 3,3% 3,3% 58,6% 58,6% 58,7% 58,7% 0,00002 18% 0,0%
2A1 Cement production CO2 415,8 220,4 5,0% 5,0% 10,0% 10,0% 11,2% 11,2% 0,00002 -47% 0,0% 2G Other product manufacture and use CH4 50,1 46,5 9,9% 9,9% 49,5% 49,5% 50,5% 50,5% 0,00002 -7% 0,0% 1A4 Other Sectors:all fuels N2O 49,6 49,9 17,8% 17,8% 43,1% 43,1% 46,6% 46,6% 0,00002 1% 0,0% 1A4a Commercial/Institutional:all fuels CH4 45,2 47,4 10,4% 10,4% 47,6% 47,6% 48,7% 48,7% 0,00002 5% 0,0% 2B2 Nitric acid production N2O 6.084,7 282,2 5,0% 5,0% 6,0% 6,0% 7,8% 7,8% 0,00002 -95% 0,1% 2B Fluorochemical production PFC 0,0 96,9 10,0% 10,0% 20,0% 20,0% 22,4% 22,4% 0,00002 - 0,0%
1A1 Energy Industries:all fuels CH4 69,1 104,1 2,5% 2,5% 18,4% 18,4% 18,6% 18,6% 0,00001 51% 0,0% 2A3 Glass production CO2 142,4 71,2 25,0% 25,0% 5,0% 5,0% 25,5% 25,5% 0,00001 -50% 0,0% 1A3b Road transportation: LPG CO2 2.640,1 309,5 5,0% 5,0% 2,0% 2,0% 5,4% 5,4% 0,00001 -88% 0,0% 1A1b Petroleum Refining: gaseous CO2 1.042,3 2.852,5 0,5% 0,5% 0,3% 0,3% 0,6% 0,6% 0,00001 174% 0,0%
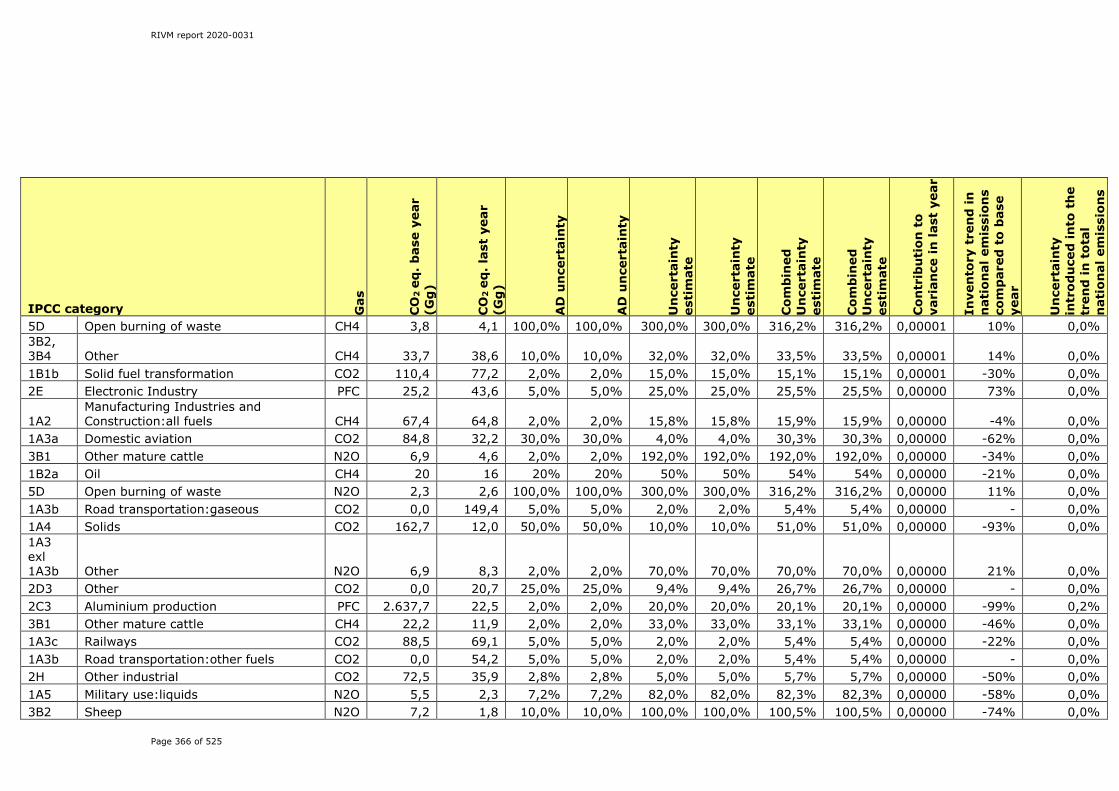
RIVM report 2020-0031
Page 366 of 525
IPCC category Gas
CO
2 e
q.
bas
e ye
ar
(Gg
)
CO
2 e
q.
last
yea
r (G
g)
AD
un
cert
ain
ty
AD
un
cert
ain
ty
Un
cert
ain
ty
esti
mat
e
Un
cert
ain
ty
esti
mat
e
Co
mb
ined
U
nce
rtai
nty
es
tim
ate
Co
mb
ined
U
nce
rtai
nty
es
tim
ate
Co
ntr
ibu
tio
n t
o
vari
ance
in
las
t ye
ar
Inve
nto
ry t
ren
d i
n
nat
ion
al e
mis
sio
ns
com
par
ed t
o b
ase
year
Un
cert
ain
ty
intr
od
uce
d i
nto
th
e tr
end
in
to
tal
nat
ion
al e
mis
sio
ns
5D Open burning of waste CH4 3,8 4,1 100,0% 100,0% 300,0% 300,0% 316,2% 316,2% 0,00001 10% 0,0% 3B2, 3B4 Other CH4 33,7 38,6 10,0% 10,0% 32,0% 32,0% 33,5% 33,5% 0,00001 14% 0,0% 1B1b Solid fuel transformation CO2 110,4 77,2 2,0% 2,0% 15,0% 15,0% 15,1% 15,1% 0,00001 -30% 0,0% 2E Electronic Industry PFC 25,2 43,6 5,0% 5,0% 25,0% 25,0% 25,5% 25,5% 0,00000 73% 0,0%
1A2 Manufacturing Industries and Construction:all fuels CH4 67,4 64,8 2,0% 2,0% 15,8% 15,8% 15,9% 15,9% 0,00000 -4% 0,0%
1A3a Domestic aviation CO2 84,8 32,2 30,0% 30,0% 4,0% 4,0% 30,3% 30,3% 0,00000 -62% 0,0% 3B1 Other mature cattle N2O 6,9 4,6 2,0% 2,0% 192,0% 192,0% 192,0% 192,0% 0,00000 -34% 0,0% 1B2a Oil CH4 20 16 20% 20% 50% 50% 54% 54% 0,00000 -21% 0,0% 5D Open burning of waste N2O 2,3 2,6 100,0% 100,0% 300,0% 300,0% 316,2% 316,2% 0,00000 11% 0,0% 1A3b Road transportation:gaseous CO2 0,0 149,4 5,0% 5,0% 2,0% 2,0% 5,4% 5,4% 0,00000 - 0,0% 1A4 Solids CO2 162,7 12,0 50,0% 50,0% 10,0% 10,0% 51,0% 51,0% 0,00000 -93% 0,0% 1A3 exl 1A3b Other N2O 6,9 8,3 2,0% 2,0% 70,0% 70,0% 70,0% 70,0% 0,00000 21% 0,0% 2D3 Other CO2 0,0 20,7 25,0% 25,0% 9,4% 9,4% 26,7% 26,7% 0,00000 - 0,0% 2C3 Aluminium production PFC 2.637,7 22,5 2,0% 2,0% 20,0% 20,0% 20,1% 20,1% 0,00000 -99% 0,2% 3B1 Other mature cattle CH4 22,2 11,9 2,0% 2,0% 33,0% 33,0% 33,1% 33,1% 0,00000 -46% 0,0% 1A3c Railways CO2 88,5 69,1 5,0% 5,0% 2,0% 2,0% 5,4% 5,4% 0,00000 -22% 0,0% 1A3b Road transportation:other fuels CO2 0,0 54,2 5,0% 5,0% 2,0% 2,0% 5,4% 5,4% 0,00000 - 0,0% 2H Other industrial CO2 72,5 35,9 2,8% 2,8% 5,0% 5,0% 5,7% 5,7% 0,00000 -50% 0,0% 1A5 Military use:liquids N2O 5,5 2,3 7,2% 7,2% 82,0% 82,0% 82,3% 82,3% 0,00000 -58% 0,0% 3B2 Sheep N2O 7,2 1,8 10,0% 10,0% 100,0% 100,0% 100,5% 100,5% 0,00000 -74% 0,0%
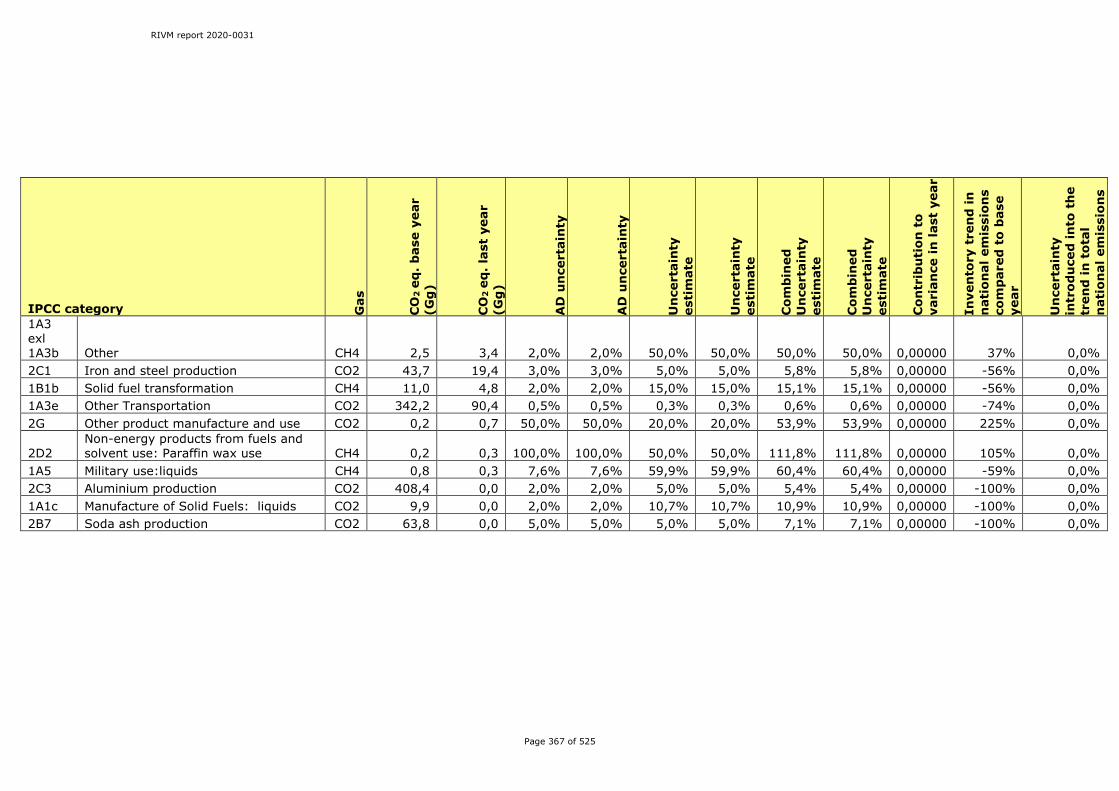
RIVM report 2020-0031
Page 367 of 525
IPCC category Gas
CO
2 e
q.
bas
e ye
ar
(Gg
)
CO
2 e
q.
last
yea
r (G
g)
AD
un
cert
ain
ty
AD
un
cert
ain
ty
Un
cert
ain
ty
esti
mat
e
Un
cert
ain
ty
esti
mat
e
Co
mb
ined
U
nce
rtai
nty
es
tim
ate
Co
mb
ined
U
nce
rtai
nty
es
tim
ate
Co
ntr
ibu
tio
n t
o
vari
ance
in
las
t ye
ar
Inve
nto
ry t
ren
d i
n
nat
ion
al e
mis
sio
ns
com
par
ed t
o b
ase
year
Un
cert
ain
ty
intr
od
uce
d i
nto
th
e tr
end
in
to
tal
nat
ion
al e
mis
sio
ns
1A3 exl 1A3b Other CH4 2,5 3,4 2,0% 2,0% 50,0% 50,0% 50,0% 50,0% 0,00000 37% 0,0% 2C1 Iron and steel production CO2 43,7 19,4 3,0% 3,0% 5,0% 5,0% 5,8% 5,8% 0,00000 -56% 0,0% 1B1b Solid fuel transformation CH4 11,0 4,8 2,0% 2,0% 15,0% 15,0% 15,1% 15,1% 0,00000 -56% 0,0% 1A3e Other Transportation CO2 342,2 90,4 0,5% 0,5% 0,3% 0,3% 0,6% 0,6% 0,00000 -74% 0,0% 2G Other product manufacture and use CO2 0,2 0,7 50,0% 50,0% 20,0% 20,0% 53,9% 53,9% 0,00000 225% 0,0%
2D2 Non-energy products from fuels and solvent use: Paraffin wax use CH4 0,2 0,3 100,0% 100,0% 50,0% 50,0% 111,8% 111,8% 0,00000 105% 0,0%
1A5 Military use:liquids CH4 0,8 0,3 7,6% 7,6% 59,9% 59,9% 60,4% 60,4% 0,00000 -59% 0,0% 2C3 Aluminium production CO2 408,4 0,0 2,0% 2,0% 5,0% 5,0% 5,4% 5,4% 0,00000 -100% 0,0% 1A1c Manufacture of Solid Fuels: liquids CO2 9,9 0,0 2,0% 2,0% 10,7% 10,7% 10,9% 10,9% 0,00000 -100% 0,0% 2B7 Soda ash production CO2 63,8 0,0 5,0% 5,0% 5,0% 5,0% 7,1% 7,1% 0,00000 -100% 0,0%

RIVM report 2020-0031
Page 368 of 525
2.2 Uncertainties 1990 emissions Late nineties, the Netherlands has set up a programme for improving the quality of the greenhousegas inventory. The set up of this programme was motivated by the requirements of the Kyoto Protocol. At the start of this programme, a workshop was held with all experts engaged in the inventory programme; at that time still under the lead of the ministry of housing, spatial planning and the environment (VROM). The results of this workshop are reported in van Amstel et al (2000). As far as can be recollected at this time, this was the first systematic attempt to assess the uncertainties of greenhousegas emissions in the Netherlands. Table A2.5 shows the assessment of the uncertainties in the respective gases at that time, based on expert judgement. To enable a comparison with the current Approach 1, the emissions per source category in 1990 combined with uncertainty insights per source category are added in a separate column. Table A2.5 Uncertainties Greenhouse Gas emissions in 1990 (Approach 1)
Gas activity Emission level base year (Gg)
Uncertainty 1990 (%) 2000
Uncertainty 1990 (%) 2020(1)
CO2 Fuel combustion
149.7 2
IPPU 11.7 25 (Land Use) (-1.5) (60)
subtotal 161.4 3 3 CH4 Energy 4.5 25 Agriculture 10.6 25 Waste 11.9 30
subtotal 27.0 17 21 N2O Energy use 2.3 75 IPPU 9.8 35 Agriculture 6.9 75
subtotal 19.0 34 70 HFC/SF6 Energy
sector 1.4 50
IPPU 5.1 50 subtotal 6.5 41
PFC IPPU 2.4 100
subtotal 2.4 100 70(2) Other sectors other 1.0 50
Total emissions
218.8 4.4 4.3
(1): uncertainty 1990 assessed with 2020 methodology (2) total F-gases

RIVM report 2020-0031
Page 369 of 525
Note that the assessment of uncertainties for 1990 is based on a first order expert judgement, whereas uncertainties nowadays result from a more systematic approach; looking more in depth to the uncertainties on a source category level. Table A2.5 shows that overall uncertainty for the 1990 emissions is at more or less the same level. However, according to the 2020 methodology, uncertainties for N2O are substantially higher than what we thought in 2000. The uncertainties in 2018 are substantially lower as a result of: (1) The inventory improvement programme over the years (especially
effective for and focused on non-CO2 gases); (2) The change in relative contribution to the total emissions in 2018
compared with 1990. The share of non-CO2 gases was substantially higher in 1990.

RIVM report 2020-0031
Page 370 of 525
Annex 3 Detailed methodological descriptions of individual sources or sink categories
A detailed description of methodologies per source/sink category, including a list of country-specific EFs, can be found in the relevant methodology reports on the website http://english.rvo.nl/nie. These methodology reports are also integral part of this submission (see Annex 7).

RIVM report 2020-0031
Page 371 of 525
Annex 4 CO2: the national energy balance for the most recent inventory year
The national energy balance for 2018 in the Netherlands (as used for this submission) can be found on the following pages. The national energy balance for other years is available online at: http://statline.cbs.nl/Statweb/publication/?DM=SLEN&PA=83140ENG&D1=a&D2=a&D3=l&LA=EN&HDR=G1,G2&STB=T&VW=T. Please note that because of the size, the table underneath has been split up in 2 parts, 4 pages each
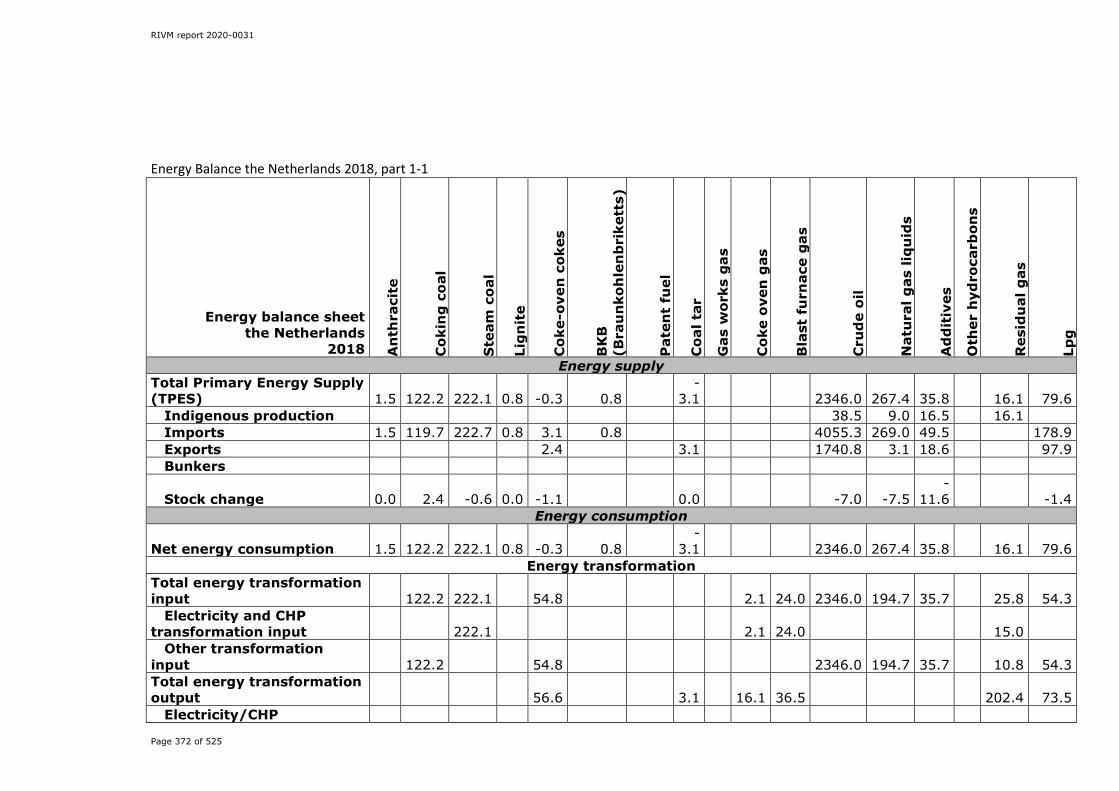
RIVM report 2020-0031
Page 372 of 525
Energy Balance the Netherlands 2018, part 1-1
Energy balance sheet the Netherlands
2018 An
thra
cite
Cok
ing
co
al
Ste
am c
oal
Lig
nit
e
Cok
e-ov
en c
okes
BK
B
(Bra
un
koh
len
bri
kett
s)
Pat
ent
fuel
Coa
l tar
Gas
wor
ks g
as
Cok
e o
ven
gas
Bla
st f
urn
ace
gas
Cru
de
oil
Nat
ura
l gas
liq
uid
s
Ad
dit
ives
Oth
er h
ydro
carb
ons
Res
idu
al g
as
Lpg
Energy supply Total Primary Energy Supply (TPES) 1.5 122.2 222.1 0.8 -0.3 0.8
-3.1 2346.0 267.4 35.8 16.1 79.6
Indigenous production 38.5 9.0 16.5 16.1 Imports 1.5 119.7 222.7 0.8 3.1 0.8 4055.3 269.0 49.5 178.9 Exports 2.4 3.1 1740.8 3.1 18.6 97.9 Bunkers
Stock change 0.0 2.4 -0.6 0.0 -1.1 0.0 -7.0 -7.5 -
11.6 -1.4 Energy consumption
Net energy consumption 1.5 122.2 222.1 0.8 -0.3 0.8 -
3.1 2346.0 267.4 35.8 16.1 79.6 Energy transformation
Total energy transformation input 122.2 222.1 54.8 2.1 24.0 2346.0 194.7 35.7 25.8 54.3
Electricity and CHP transformation input 222.1 2.1 24.0 15.0
Other transformation input 122.2 54.8 2346.0 194.7 35.7 10.8 54.3 Total energy transformation output 56.6 3.1 16.1 36.5 202.4 73.5
Electricity/CHP

RIVM report 2020-0031
Page 373 of 525
Energy balance sheet the Netherlands
2018 An
thra
cite
Cok
ing
co
al
Ste
am c
oal
Lig
nit
e
Cok
e-ov
en c
okes
BK
B
(Bra
un
koh
len
bri
kett
s)
Pat
ent
fuel
Coa
l tar
Gas
wor
ks g
as
Cok
e o
ven
gas
Bla
st f
urn
ace
gas
Cru
de
oil
Nat
ura
l gas
liq
uid
s
Ad
dit
ives
Oth
er h
ydro
carb
ons
Res
idu
al g
as
Lpg
transformation output Other transformation
output 56.6 3.1 16.1 36.5 202.4 73.5 Total net energy
transformation 122.2 222.1 -1.8 -
3.1 -
14.0 -
12.6 2346.0 194.7 35.7 -
176.6 -19.2 Net electricity/CHP
transformation 222.1 2.1 24.0 15.0
Net other transformation 122.2 -1.8 -
3.1 -
16.1 -
36.5 2346.0 194.7 35.7 -
191.6 -19.2 Energy sector own use
Total energy sector own use 5.9 2.1 75.0 0.8
Extraction of crude petroleum and gas 0.0
Coke-oven plants 5.9 2.1 Oil refineries 75.0 0.8 Electricity and gas supply
Distribution losses Distribution losses
Final consumption Total final consumption 1.5 0.8 1.4 0.8 8.1 10.5 72.6 0.1 117.7 98.0 Total final energy
consumption 1.3 0.8 1.3 0.8 8.1 10.5 117.7 10.7
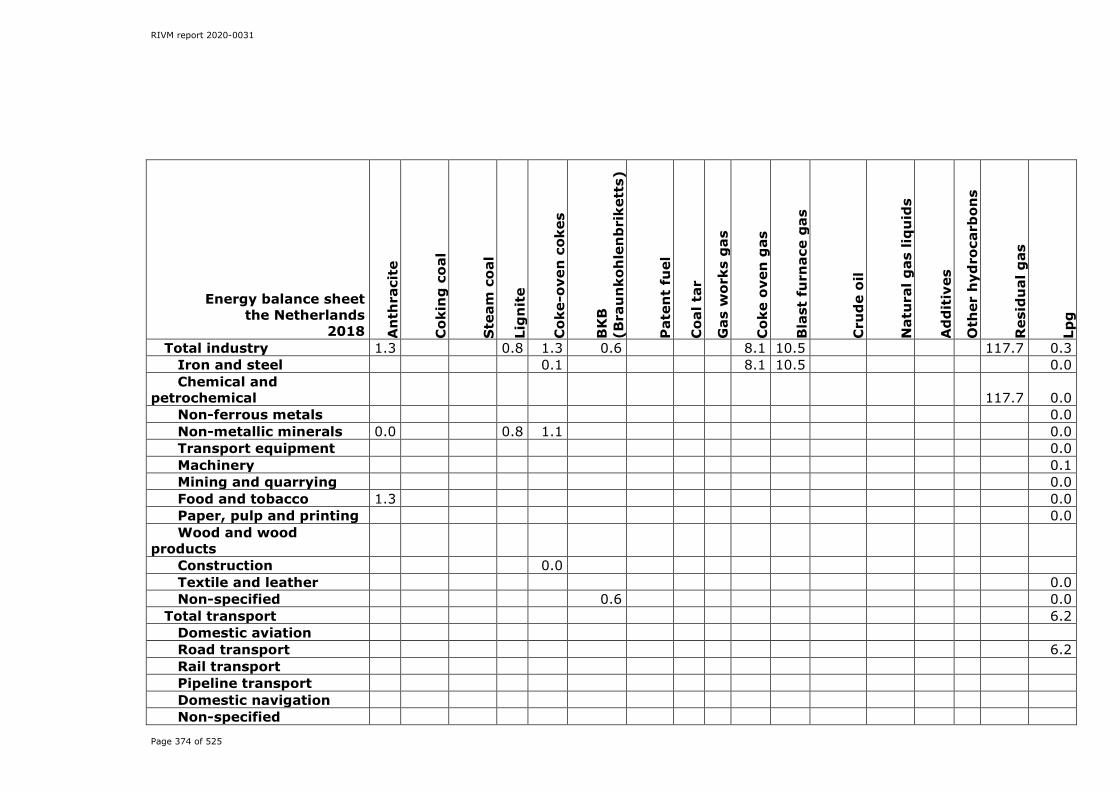
RIVM report 2020-0031
Page 374 of 525
Energy balance sheet the Netherlands
2018 An
thra
cite
Cok
ing
co
al
Ste
am c
oal
Lig
nit
e
Cok
e-ov
en c
okes
BK
B
(Bra
un
koh
len
bri
kett
s)
Pat
ent
fuel
Coa
l tar
Gas
wor
ks g
as
Cok
e o
ven
gas
Bla
st f
urn
ace
gas
Cru
de
oil
Nat
ura
l gas
liq
uid
s
Ad
dit
ives
Oth
er h
ydro
carb
ons
Res
idu
al g
as
Lpg
Total industry 1.3 0.8 1.3 0.6 8.1 10.5 117.7 0.3 Iron and steel 0.1 8.1 10.5 0.0 Chemical and
petrochemical 117.7 0.0 Non-ferrous metals 0.0 Non-metallic minerals 0.0 0.8 1.1 0.0 Transport equipment 0.0 Machinery 0.1 Mining and quarrying 0.0 Food and tobacco 1.3 0.0 Paper, pulp and printing 0.0 Wood and wood
products Construction 0.0 Textile and leather 0.0 Non-specified 0.6 0.0
Total transport 6.2 Domestic aviation Road transport 6.2 Rail transport Pipeline transport Domestic navigation Non-specified
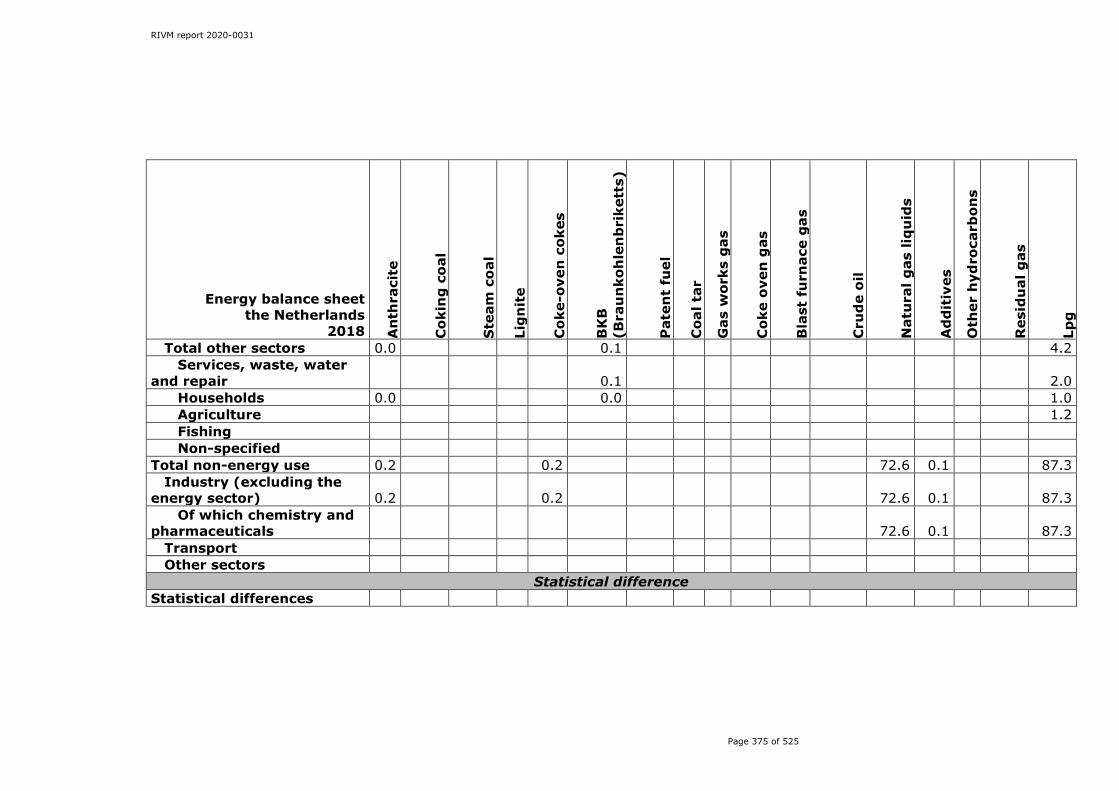
RIVM report 2020-0031
Page 375 of 525
Energy balance sheet the Netherlands
2018 An
thra
cite
Cok
ing
co
al
Ste
am c
oal
Lig
nit
e
Cok
e-ov
en c
okes
BK
B
(Bra
un
koh
len
bri
kett
s)
Pat
ent
fuel
Coa
l tar
Gas
wor
ks g
as
Cok
e o
ven
gas
Bla
st f
urn
ace
gas
Cru
de
oil
Nat
ura
l gas
liq
uid
s
Ad
dit
ives
Oth
er h
ydro
carb
ons
Res
idu
al g
as
Lpg
Total other sectors 0.0 0.1 4.2 Services, waste, water
and repair 0.1 2.0 Households 0.0 0.0 1.0 Agriculture 1.2 Fishing Non-specified
Total non-energy use 0.2 0.2 72.6 0.1 87.3 Industry (excluding the
energy sector) 0.2 0.2 72.6 0.1 87.3 Of which chemistry and
pharmaceuticals 72.6 0.1 87.3 Transport Other sectors
Statistical difference Statistical differences

RIVM report 2020-0031
Page 376 of 525
Energy Balance the Netherlands 2018, part 1-2
Energy balance sheet the Netherlands
2018 Nap
hth
a
Mot
or g
asol
ine
Gas
olin
e ty
pe
jet
fuel
Avi
atio
n g
aso
line
Ker
ose
ne
typ
e je
t fu
el
Oth
er k
ero
sen
e
Hea
tin
g a
nd
oth
er
gas
oil
Fuel
oil
Wh
ite
spir
it a
nd
in
du
stri
al s
pir
it (
SB
P)
Lub
rica
nts
Bit
um
en
Par
affi
n w
axes
Pet
role
um
cok
e
Oth
er p
etro
leu
m
pro
du
cts
Nat
ura
l gas
Mu
nic
ipal
was
te;
ren
ewab
le f
ract
ion
Sol
id a
nd
liq
uid
b
iom
ass
Bio
gas
Non
-ren
e.m
un
icip
al
was
te +
res
idu
al h
eat
Energy supply Total Primary Energy Supply (TPES) 359.4 -646.0 -1.7 -381.0 8.3 -539.2 -306.3 34.1 9.2 -9.9 1.5 19.4 -133.6 1286.4 38.7 78.6 13.7 40.2
Indigenous production 1162.7 31.3 126.3 13.7 33.4
Imports 977.7 322.2 145.4 22.3 519.5 534.9 87.8 87.3 10.3 5.7 45.3 782.3 1827.1 9.1 12.4 8.4 Exports 607.8 979.1 1.9 354.9 13.8 1003.2 463.9 51.8 73.0 20.6 4.6 25.9 930.5 1634.7 1.7 53.4 1.5 Bunkers 170.0 86.4 377.7 4.6 0.5 Stock change -10.5 10.8 0.1 -1.4 -0.2 30.9 0.4 -1.8 -0.5 0.4 0.4 -0.1 14.5 -68.2 -6.7
Energy consumption Net energy consumption 359.4 -646.0 -1.7 -381.0 8.3 -531.7 -306.3 34.1 9.2 -9.9 1.5 19.4 -133.6 1273.1 38.7 78.6 13.8 40.2
Energy transformation Total energy transformation input 677.2 0.6 5.3 19.1 92.8 335.6 58.9 5.9 0.1 2.2 122.4 499.5 38.7 51.3 12.5 40.2
Electricity and CHP transformation input 0.6 480.1 38.7 23.8 9.1 35.7
Other transformation input 677.2 0.6 5.3 19.1 92.2 335.6 58.9 5.9 0.1 2.2 122.4 19.4 27.5 3.4 4.5 Total energy transformation output 535.9 825.4 1.8 387.7 13.1 936.7 642.7 25.7 3.1 13.8 7.9 13.8 263.5 4.7
Electricity/CHP
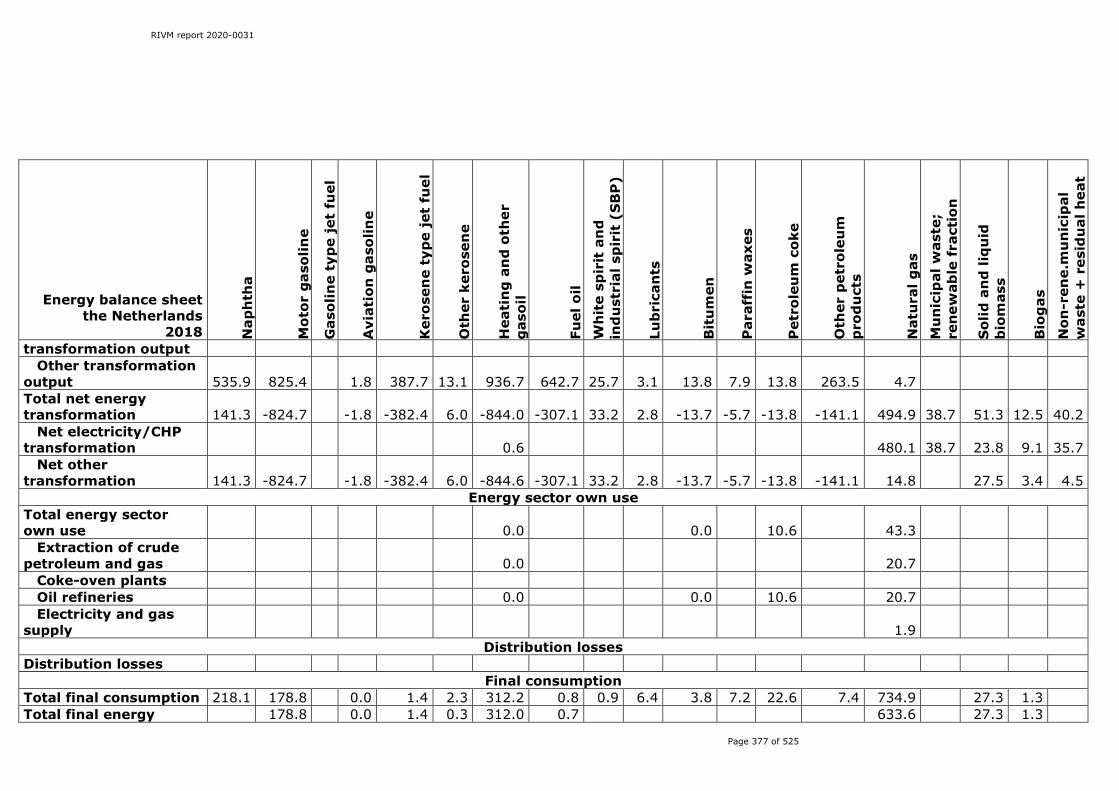
RIVM report 2020-0031
Page 377 of 525
Energy balance sheet the Netherlands
2018 Nap
hth
a
Mot
or g
asol
ine
Gas
olin
e ty
pe
jet
fuel
Avi
atio
n g
aso
line
Ker
ose
ne
typ
e je
t fu
el
Oth
er k
ero
sen
e
Hea
tin
g a
nd
oth
er
gas
oil
Fuel
oil
Wh
ite
spir
it a
nd
in
du
stri
al s
pir
it (
SB
P)
Lub
rica
nts
Bit
um
en
Par
affi
n w
axes
Pet
role
um
cok
e
Oth
er p
etro
leu
m
pro
du
cts
Nat
ura
l gas
Mu
nic
ipal
was
te;
ren
ewab
le f
ract
ion
Sol
id a
nd
liq
uid
b
iom
ass
Bio
gas
Non
-ren
e.m
un
icip
al
was
te +
res
idu
al h
eat
transformation output Other transformation
output 535.9 825.4 1.8 387.7 13.1 936.7 642.7 25.7 3.1 13.8 7.9 13.8 263.5 4.7 Total net energy transformation 141.3 -824.7 -1.8 -382.4 6.0 -844.0 -307.1 33.2 2.8 -13.7 -5.7 -13.8 -141.1 494.9 38.7 51.3 12.5 40.2
Net electricity/CHP transformation 0.6 480.1 38.7 23.8 9.1 35.7
Net other transformation 141.3 -824.7 -1.8 -382.4 6.0 -844.6 -307.1 33.2 2.8 -13.7 -5.7 -13.8 -141.1 14.8 27.5 3.4 4.5
Energy sector own use Total energy sector own use 0.0 0.0 10.6 43.3
Extraction of crude petroleum and gas 0.0 20.7
Coke-oven plants Oil refineries 0.0 0.0 10.6 20.7 Electricity and gas
supply 1.9 Distribution losses
Distribution losses Final consumption
Total final consumption 218.1 178.8 0.0 1.4 2.3 312.2 0.8 0.9 6.4 3.8 7.2 22.6 7.4 734.9 27.3 1.3 Total final energy 178.8 0.0 1.4 0.3 312.0 0.7 633.6 27.3 1.3
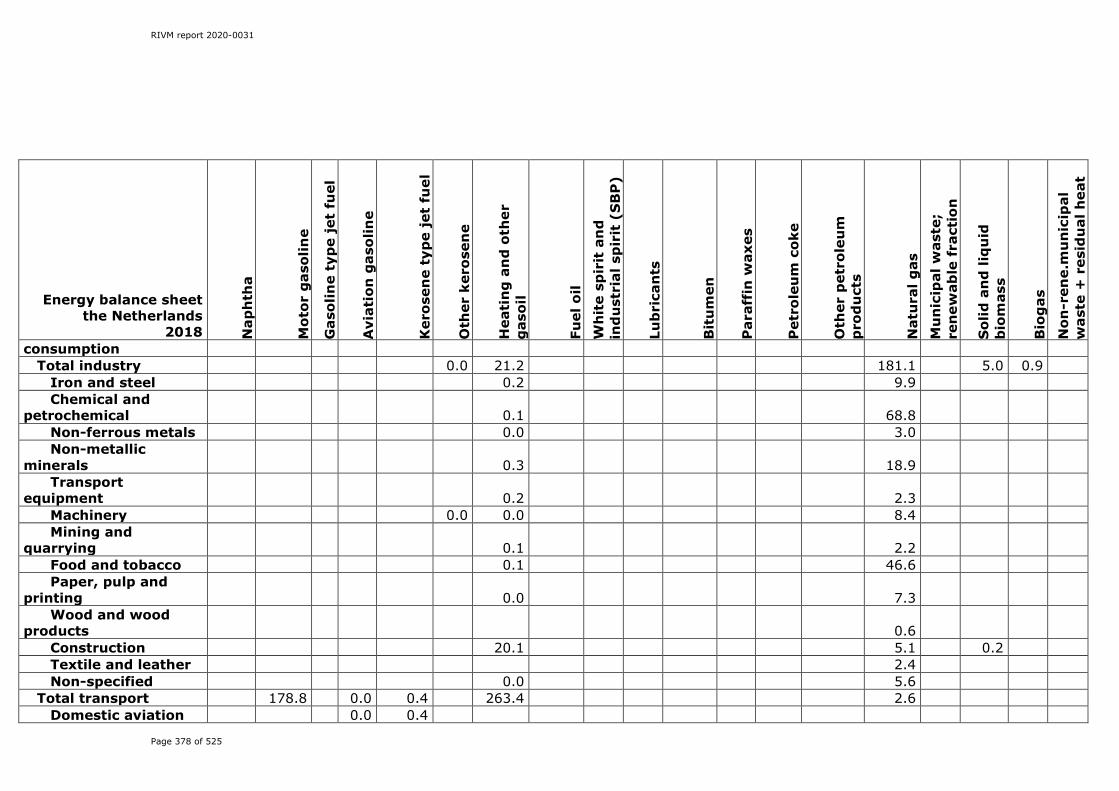
RIVM report 2020-0031
Page 378 of 525
Energy balance sheet the Netherlands
2018 Nap
hth
a
Mot
or g
asol
ine
Gas
olin
e ty
pe
jet
fuel
Avi
atio
n g
aso
line
Ker
ose
ne
typ
e je
t fu
el
Oth
er k
ero
sen
e
Hea
tin
g a
nd
oth
er
gas
oil
Fuel
oil
Wh
ite
spir
it a
nd
in
du
stri
al s
pir
it (
SB
P)
Lub
rica
nts
Bit
um
en
Par
affi
n w
axes
Pet
role
um
cok
e
Oth
er p
etro
leu
m
pro
du
cts
Nat
ura
l gas
Mu
nic
ipal
was
te;
ren
ewab
le f
ract
ion
Sol
id a
nd
liq
uid
b
iom
ass
Bio
gas
Non
-ren
e.m
un
icip
al
was
te +
res
idu
al h
eat
consumption Total industry 0.0 21.2 181.1 5.0 0.9
Iron and steel 0.2 9.9 Chemical and
petrochemical 0.1 68.8 Non-ferrous metals 0.0 3.0 Non-metallic
minerals 0.3 18.9 Transport
equipment 0.2 2.3 Machinery 0.0 0.0 8.4 Mining and
quarrying 0.1 2.2 Food and tobacco 0.1 46.6 Paper, pulp and
printing 0.0 7.3 Wood and wood
products 0.6 Construction 20.1 5.1 0.2 Textile and leather 2.4 Non-specified 0.0 5.6
Total transport 178.8 0.0 0.4 263.4 2.6 Domestic aviation 0.0 0.4

RIVM report 2020-0031
Page 379 of 525
Energy balance sheet the Netherlands
2018 Nap
hth
a
Mot
or g
asol
ine
Gas
olin
e ty
pe
jet
fuel
Avi
atio
n g
aso
line
Ker
ose
ne
typ
e je
t fu
el
Oth
er k
ero
sen
e
Hea
tin
g a
nd
oth
er
gas
oil
Fuel
oil
Wh
ite
spir
it a
nd
in
du
stri
al s
pir
it (
SB
P)
Lub
rica
nts
Bit
um
en
Par
affi
n w
axes
Pet
role
um
cok
e
Oth
er p
etro
leu
m
pro
du
cts
Nat
ura
l gas
Mu
nic
ipal
was
te;
ren
ewab
le f
ract
ion
Sol
id a
nd
liq
uid
b
iom
ass
Bio
gas
Non
-ren
e.m
un
icip
al
was
te +
res
idu
al h
eat
Road transport 178.8 249.6 2.6 Rail transport 1.0 Pipeline transport Domestic
navigation 12.7 Non-specified
Total other sectors 1.0 0.3 27.5 0.7 449.9 22.3 0.4 Services, waste,
water and repair 4.9 124.3 1.4 0.4 Households 0.2 0.3 286.4 16.4 Agriculture 15.2 39.1 4.5 Fishing 5.5 0.7 Non-specified 1.0 1.6 0.1
Total non-energy use 218.1 2.0 0.2 0.9 6.4 3.8 7.2 22.6 7.4 101.3 Industry (excluding
the energy sector) 218.1 2.0 0.2 0.9 2.2 3.8 7.2 22.6 7.4 101.3 Of which chemistry
and pharmaceuticals 218.1 2.0 0.2 0.5 0.0 6.6 22.6 7.4 101.3 Transport 2.7 Other sectors 0.1 1.5
Statistical difference Statistical differences -7.5 13.3 -0.2
RIVM report 2020-0031
Page 380 of 525
Annex 5 The Netherlands’ fuel list and standard CO2 emission factors. Version January 2020
Colophon
Project name Annual update of fuel list for the Netherlands Project number 113569/BL2020 Version number January 2020 Project leader P.J. Zijlema Enclosures 0 Author P.J. Zijlema
The initial version of this fuel list was approved by the Steering Committee Emission Registration (SCER) in 2004, and the list was subsequently updated on the basis of decisions of the Steering Committee concerning the CO2 emission factor for natural gas at meetings held on 25 April 2006 and 21 April 2009. The Steering Committee Emission Registration delegated the authority for approving this list to the PRTR/Working Group on Emission Monitoring (WEM) on 21 April 2009. The present document (the version of January 2020) is approved by WEM, after detailed discussions with the Dutch Emission Authority (NEa) and several institutes that participate in the Emission Register (ER/PRTR) project, a.o: • CBS, Statistics Netherlands, • PBL, Netherlands Environmental Assessment
Agency, • RIVM, National Institute for Public Health and the
Environment, • RWS, Rijkswaterstaat, an agency of the Dutch
Ministry of Infrastructure and the Environment responsible for the design, construction, management and maintenance of the main infrastructure facilities in the Netherlands,
• TNO, the Dutch organization for Applied Scientific Research (TNO).
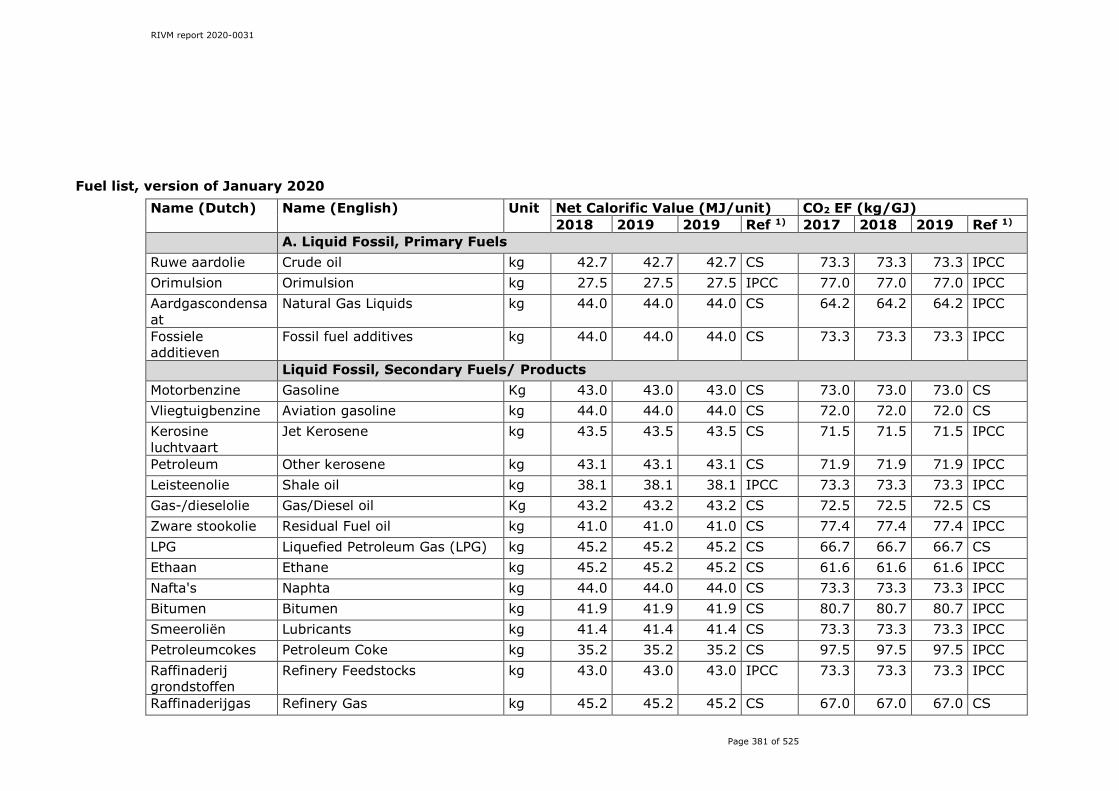
RIVM report 2020-0031
Page 381 of 525
Fuel list, version of January 2020 Name (Dutch) Name (English) Unit Net Calorific Value (MJ/unit) CO2 EF (kg/GJ)
2018 2019 2019 Ref 1) 2017 2018 2019 Ref 1) A. Liquid Fossil, Primary Fuels Ruwe aardolie Crude oil kg 42.7 42.7 42.7 CS 73.3 73.3 73.3 IPCC Orimulsion Orimulsion kg 27.5 27.5 27.5 IPCC 77.0 77.0 77.0 IPCC Aardgascondensaat
Natural Gas Liquids kg 44.0 44.0 44.0 CS 64.2 64.2 64.2 IPCC
Fossiele additieven
Fossil fuel additives kg 44.0 44.0 44.0 CS 73.3 73.3 73.3 IPCC
Liquid Fossil, Secondary Fuels/ Products Motorbenzine Gasoline Kg 43.0 43.0 43.0 CS 73.0 73.0 73.0 CS Vliegtuigbenzine Aviation gasoline kg 44.0 44.0 44.0 CS 72.0 72.0 72.0 CS Kerosine luchtvaart
Jet Kerosene kg 43.5 43.5 43.5 CS 71.5 71.5 71.5 IPCC
Petroleum Other kerosene kg 43.1 43.1 43.1 CS 71.9 71.9 71.9 IPCC Leisteenolie Shale oil kg 38.1 38.1 38.1 IPCC 73.3 73.3 73.3 IPCC Gas-/dieselolie Gas/Diesel oil Kg 43.2 43.2 43.2 CS 72.5 72.5 72.5 CS Zware stookolie Residual Fuel oil kg 41.0 41.0 41.0 CS 77.4 77.4 77.4 IPCC LPG Liquefied Petroleum Gas (LPG) kg 45.2 45.2 45.2 CS 66.7 66.7 66.7 CS Ethaan Ethane kg 45.2 45.2 45.2 CS 61.6 61.6 61.6 IPCC Nafta's Naphta kg 44.0 44.0 44.0 CS 73.3 73.3 73.3 IPCC Bitumen Bitumen kg 41.9 41.9 41.9 CS 80.7 80.7 80.7 IPCC Smeeroliën Lubricants kg 41.4 41.4 41.4 CS 73.3 73.3 73.3 IPCC Petroleumcokes Petroleum Coke kg 35.2 35.2 35.2 CS 97.5 97.5 97.5 IPCC Raffinaderij grondstoffen
Refinery Feedstocks kg 43.0 43.0 43.0 IPCC 73.3 73.3 73.3 IPCC
Raffinaderijgas Refinery Gas kg 45.2 45.2 45.2 CS 67.0 67.0 67.0 CS

RIVM report 2020-0031
Page 382 of 525
Name (Dutch) Name (English) Unit Net Calorific Value (MJ/unit) CO2 EF (kg/GJ) 2018 2019 2019 Ref 1) 2017 2018 2019 Ref 1)
Chemisch restgas Chemical Waste Gas kg 45.2 45.2 45.2 CS 62.4 62.4 62.4 CS Overige oliën Other oil kg 40.2 40.2 40.2 IPCC 73.3 73.3 73.3 IPCC Paraffine Paraffin Waxes kg 42.7 42.7 42.7 CS 73.3 73.3 73.3 IPCC Terpentine White Spirit and SBP kg 43.6 43.6 43.6 CS 73.3 73.3 73.3 IPCC Overige aardolie producten
Other Petroleum Products kg 42.7 42.7 42.7 CS 73.3 73.3 73.3 IPCC
B. Solid Fossil, Primary Fuels Antraciet Anthracite kg 29.3 29.3 29.3 CS 98.3 98.3 98.3 IPCC Cokeskolen Coking Coal kg 28.6 28.6 28.6 CS 94.0 94.0 94.0 CS Cokeskolen Coking Coal (used in coke oven) kg 28.6 28.6 28.6 CS 95.4 95.4 95.4 CS Cokeskolen Coking Coal (used in blast
furnaces) kg 28.6 28.6 28.6 CS 89.8 89.8 89.8 CS
Overige bitumineuze steenkool 2)
Other Bituminous Coal 2) Kg 25.3 25.3 2) 25.3 2) CS 94.7 94.7 94.7 CS
Sub-bitumineuze kool
Sub-Bituminous Coal kg 18.9 18.9 18.9 IPCC 96.1 96.1 96.1 IPCC
Bruinkool Lignite kg 20.0 20.0 20.0 CS 101.0 101.0 101.0 IPCC Bitumineuze Leisteen
Oil Shale kg 8.9 8.9 8.9 IPCC 107.0 107.0 107.0 IPCC
Turf Peat kg 9.76 9.76 9.76 IPCC 106.0 106.0 106.0 IPCC Solid Fossil, Secondary Fuels Steenkool- and bruinkoolbriketten
BKB & Patent Fuel kg 20.7 20.7 20.7 IPCC 97.5 97.5 97.5 IPCC
Cokesoven/ gascokes
Coke Oven/Gas Coke kg 28.5 28.5 28.5 CS 106.8 106.8 106.8 CS
Cokesovengas Coke Oven gas MJ 1.0 1.0 1.0 CS 42.8 42.8 42.8 CS Hoogovengas Blast Furnace Gas MJ 1.0 1.0 1.0 CS 247.4 247.4 247.4 CS

RIVM report 2020-0031
Page 383 of 525
Name (Dutch) Name (English) Unit Net Calorific Value (MJ/unit) CO2 EF (kg/GJ) 2018 2019 2019 Ref 1) 2017 2018 2019 Ref 1)
Oxystaalovengas Oxy Gas MJ 1.0 1.0 1.0 CS 191.9 191.9 191.9 CS Fosforovengas Fosfor Gas Nm3 11.0 11.0 11.0 CS 143.9 143.9 143.9 CS Steenkool bitumen
Coal tar kg 41.9 41.9 41.9 CS 80.7 80.7 80.7 IPCC
C. Gaseous Fossil Fuels Aardgas 3) Natural Gas (dry) 3) Nm3
ae 31.65 31.65 31.65 CS 56.63) 56.63) 56.43) CS
Compressed natural gas (CNG) 3)
Compressed natural gas (CNG) 3)
Nm3 ae
31.65 31.65 31.65 CS 56.63) 56.63) 56.43) CS
Liquified natural gas (LNG) 3)
Liquified natural gas (LNG) 3) Nm3 ae
31.65 31.65 31.65 CS 56.63) 56.63) 56.43) CS
Koolmonoxide Carbon Monoxide Nm3 12.6 12.6 12.6 CS 155.2 155.2 155.2 CS Methaan Methane Nm3 35.9 35.9 35.9 CS 54.9 54.9 54.9 CS Waterstof Hydrogen Nm3 10.8 10.8 10.8 CS 0 0 0 CS Biomass 4) Biomassa vast Solid Biomass kg 15.1 15.1 15.1 CS 109.6 109.6 109.6 IPCC Houtskool Charcoal kg 30.0 30.0 30.0 CS 112.0 112.0 112.0 IPCC Biobenzine Biogasoline kg 27.0 27.0 27.0 CS 70.7 70.7 70.7 CS Biodiesel Biodiesels kg 37.0 37.0 37.0 CS 76.8 76.8 76.8 CS Overige vloeibare biobrandstoffen
Other liquid biofuels kg 36.0 36.0 36.0 CS 79.6 79.6 79.6 IPCC
Biomassa gasvormig
Gas Biomass Nm3 21.8 21.8 21.8 CS 90.8 90.8 90.8 CS
RWZI biogas Wastewater biogas Nm3 23.3 23.3 23.3 CS 84.2 84.2 84.2 CS Stortgas Landfill gas Nm3 19.5 19.5 19.5 CS 100.7 100.7 100.7 CS Industrieel fermentatiegas
Industrial organic waste gas Nm3 23.3 23.3 23.3 CS 84.2 84.2 84.2 CS
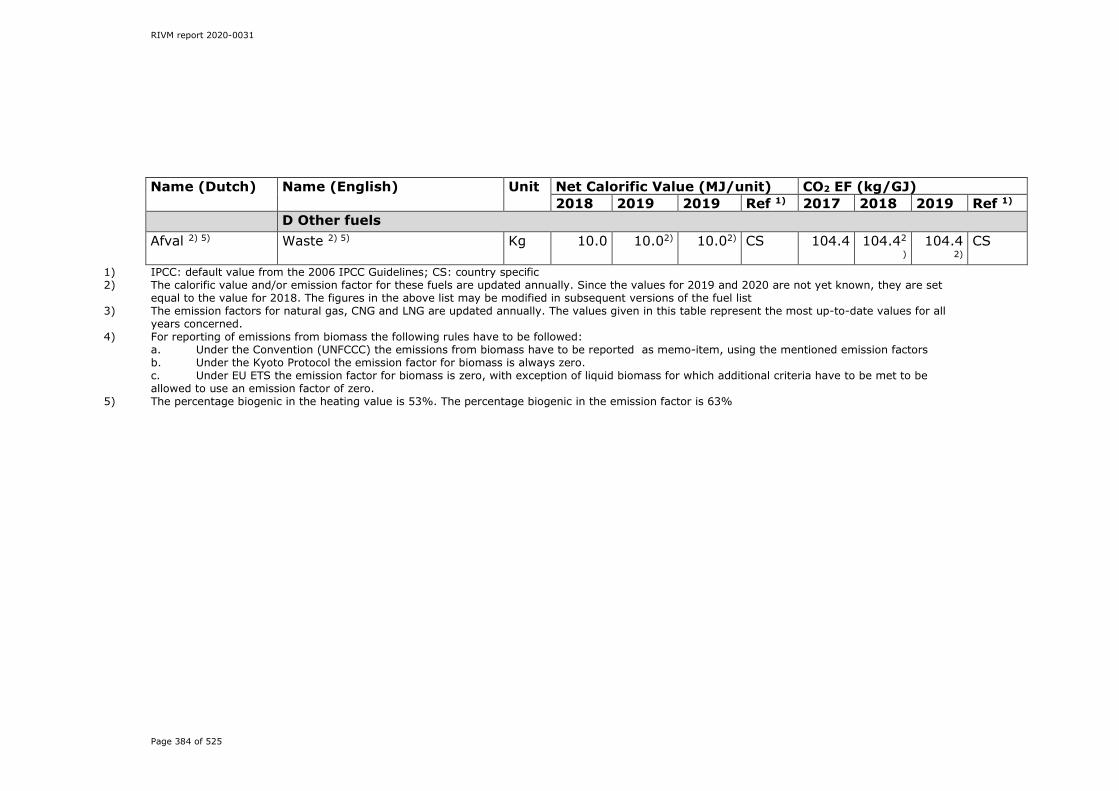
RIVM report 2020-0031
Page 384 of 525
Name (Dutch) Name (English) Unit Net Calorific Value (MJ/unit) CO2 EF (kg/GJ) 2018 2019 2019 Ref 1) 2017 2018 2019 Ref 1)
D Other fuels Afval 2) 5) Waste 2) 5) Kg 10.0 10.02) 10.02) CS 104.4 104.42
) 104.4
2) CS
1) IPCC: default value from the 2006 IPCC Guidelines; CS: country specific 2) The calorific value and/or emission factor for these fuels are updated annually. Since the values for 2019 and 2020 are not yet known, they are set
equal to the value for 2018. The figures in the above list may be modified in subsequent versions of the fuel list 3) The emission factors for natural gas, CNG and LNG are updated annually. The values given in this table represent the most up-to-date values for all
years concerned. 4) For reporting of emissions from biomass the following rules have to be followed:
a. Under the Convention (UNFCCC) the emissions from biomass have to be reported as memo-item, using the mentioned emission factors b. Under the Kyoto Protocol the emission factor for biomass is always zero. c. Under EU ETS the emission factor for biomass is zero, with exception of liquid biomass for which additional criteria have to be met to be allowed to use an emission factor of zero.
5) The percentage biogenic in the heating value is 53%. The percentage biogenic in the emission factor is 63%

RIVM report 2020-0031
Page 385 of 525
Notes on the fuel list Netherlands Enterprise Agency (RVO) has been publishing the list of fuels and standard CO2 emission factors for the Netherlands annually since 2004. This list was completely revised in 2015 as a result of the obligation to follow the 2006 IPCC Guidelines in all international reports compiled in or after 2015 (the first reporting year of the second Kyoto budget period). The list contains not only calorific values and emission factors taken from the 2006 IPCC Guidelines but also a number of country-specific values. The validity of values is governed by the following rules: • 2006 IPCC default emission factors are valid from 1990 • The country-specific calorific values and emission factors may be
divided into the following three categories: o Most country-specific calorific values and emission factors are
valid from 1990 o A limited number of country-specific factors have an old value
for the period 1990-2012 and are updated from 2013 o The country-specific calorific value and/or emission factor for
some fuels (natural gas, other bituminous coal and waste) are updated annually. In the present document (version January 2020) these values have been updated.
Readers are referred to the TNO report (Dröge, 2014) and the relevant factsheets for further details. Various relevant institutes, were consulted during the compilation of this list. One of the involved organisations was Statistics Netherlands (CBS), to ensure consistency with the Dutch Energy Balance Sheet. With effect from 2015, the lists of calorific values and of emission factors will both contain columns for three successive years. In the present version of the fuel list (that for January 2020), the years in question are 2018, 2019 and 2020. The values in these columns are used for the following purposes:
1. 2018: these values are used in 2020 for calculations concerning the calendar year 2018, which are required for international reports concerning greenhouse gas emissions pursuant to the UN Framework Convention on Climate Change (UNFCCC), the Kyoto Protocol and the European Regulation on the monitoring and reporting of greenhouse gas emissions (MMR, 525/2013/EU). The National Inventory Report for 2020 (NIR 2020) gives full details of greenhouse gas emissions in the Netherlands up to and including 2018. The fuel list forms an integral part of the NIR 2020.
2. 2019: these values are used in 2020 for reports on energy consumption and CO2 emission for the calendar year 2019 in the Electronic Environmental Annual Report (e-MJV), in the monitoring of MJA3/LTA3 (Long Term Agreement on energy efficiency for the period 2005-2020) and the monitoring of the MEE/LEE covenant (Long Term Agreement on Energy-Efficiency for ETS Companies).
3. 2020: these values will be used in 2021 in emission reports for the calendar year 2020 by companies participating in the EU Emission Trading Scheme (ETS) that are allowed to report the emission factor and calorific value for a given source flow in

RIVM report 2020-0031
Page 386 of 525
accordance with Tier 2a (country-specific values), as laid down in Art. 31-1, MRR EU No. 601/2012. The country-specific values in question may be taken from those quoted in the last-published National Inventory Report, in this case NIR 2020.
Table A5.2 CH4 and N2O emission factors
Name (Dutch) Name (English) Unit CH4 EF N2O
EF Notes
2017 Ref 2017 Ref
A. Liquid Fossil, Primary Fuels
Ruwe aardolie Crude oil g/GJ 1,4 Scheffer 1997 0,6 IPCC 2006
Orimulsion Orimulsion 1)
Aardgascondensaat Natural Gas Liquids g/GJ 1,9 Scheffer 1997 0,6 IPCC
2006
Fossiele additieven Fossil fuel additives g/GJ 3,4 Scheffer 1997 0,6 IPCC
2006 2)
Liquid Fossil, Secondary Fuels/ Products
Motorbenzine Gasoline g/GJ 3,4 Scheffer 1997 0,6 IPCC 2006 2)
Vliegtuigbenzine Aviation gasoline g/GJ 3,4 Scheffer 1997 0,6 IPCC 2006 2)
Kerosine luchtvaart Jet Kerosene g/GJ 3,4 Scheffer 1997 0,6 IPCC 2006 2)
Petroleum Other kerosene g/GJ 3,4 Scheffer 1997 0,6 IPCC 2006
Leisteenolie Shale oil 1)
Gas-/dieselolie Gas/Diesel oil g/GJ 3,4 Scheffer 1997 0,6 IPCC 2006 2)
Zware stookolie Residual Fuel oil g/GJ 1,6 Scheffer 1997 0,6 IPCC 2006
LPG Liquefied Petroleum Gas (LPG)
g/GJ 0,7 Scheffer 1997 0,1 IPCC 2006
Ethaan Ethane g/GJ 3,6 Scheffer 1997 0,1 IPCC 2006 8)
Nafta's Naphta g/GJ 3,4 Scheffer 1997 0,6 IPCC 2006
Bitumen Bitumen g/GJ 1,6 Scheffer 1997 0,6 IPCC 2006
Smeeroliën Lubricants g/GJ 1 Scheffer 1997 0,6 IPCC 2006 2)
Petroleumcokes Petroleum Coke g/GJ 3,8 Scheffer 1997 1,5 IPCC 2006
Raffinaderij grondstoffen
Refinery Feedstocks g/GJ 1,4 Scheffer 1997 0,6 IPCC
2006
Raffinaderijgas Refinery Gas g/GJ 3,6 Scheffer 1997 0,1 IPCC 2006

RIVM report 2020-0031
Page 387 of 525
Name (Dutch) Name (English) Unit CH4 EF N2O
EF Notes
2017 Ref 2017 Ref
Chemisch restgas Chemical Waste Gas g/GJ 3,6 Scheffer 1997 0,1 IPCC
2006
Overige oliën Other oil g/GJ 3,4 Scheffer 1997 0,6 IPCC 2006
Paraffine Paraffin Waxes g/GJ 1,5 Scheffer 1997 0,6 IPCC 2006
Terpentine White Spirit and SBP g/GJ 3,4 Scheffer 1997 0,6 IPCC
2006
Overige aardolie producten
Other Petroleum Products g/GJ
1,6 / 3,4 / 7,5
Scheffer 1997 0,6 IPCC 2006 4)
B. Solid Fossil, Primary Fuels
Antraciet Anthracite g/GJ 0,44 Scheffer 1997 1,5 IPCC 2006
Cokeskolen Coking Coal g/GJ 0,44 Scheffer 1997 1,5 IPCC 2006
Cokeskolen Coking Coal (used in coke oven) g/GJ 0,44 Scheffer 1997 1,5 IPCC
2006
Cokeskolen Coking Coal (used in blast furnaces) g/GJ 0,44 Scheffer 1997 1,5 IPCC
2006
Overige bitumineuze steenkool
Other Bituminous Coal g/GJ 0,44 Scheffer 1997 1,5 IPCC
2006
Sub-bitumineuze kool
Sub-Bituminous Coal g/GJ 0,44 Scheffer 1997 1,5 IPCC
2006
Bruinkool Lignite g/GJ 4,4 Scheffer 1997 1,5 IPCC 2006
Bitumineuze Leisteen Oil Shale 1)
Turf Peat 1)
Solid Fossil, Secondary Fuels
Steenkool- and bruinkoolbriketten BKB & Patent Fuel g/GJ 4,4 Scheffer 1997 1,5 IPCC
2006
Cokesoven/ gascokes
Coke Oven/Gas Coke g/GJ 44,4 Scheffer 1997 1,5 IPCC
2006
Cokesovengas Coke Oven gas g/GJ 2,8 Scheffer 1997 0,1 IPCC 2006
Hoogovengas Blast Furnace Gas g/GJ 0,35 Scheffer 1997 0,1 IPCC 2006
Oxystaalovengas Oxy Gas g/GJ 0,35 Scheffer 1997 0,1 IPCC 2006
Fosforovengas Fosfor Gas g/GJ 3,6 Scheffer 1997 0,1 IPCC 2006
Steenkool bitumen Coal tar g/GJ 1,6 Scheffer 1997 0,6 IPCC 2006
C. Gaseous
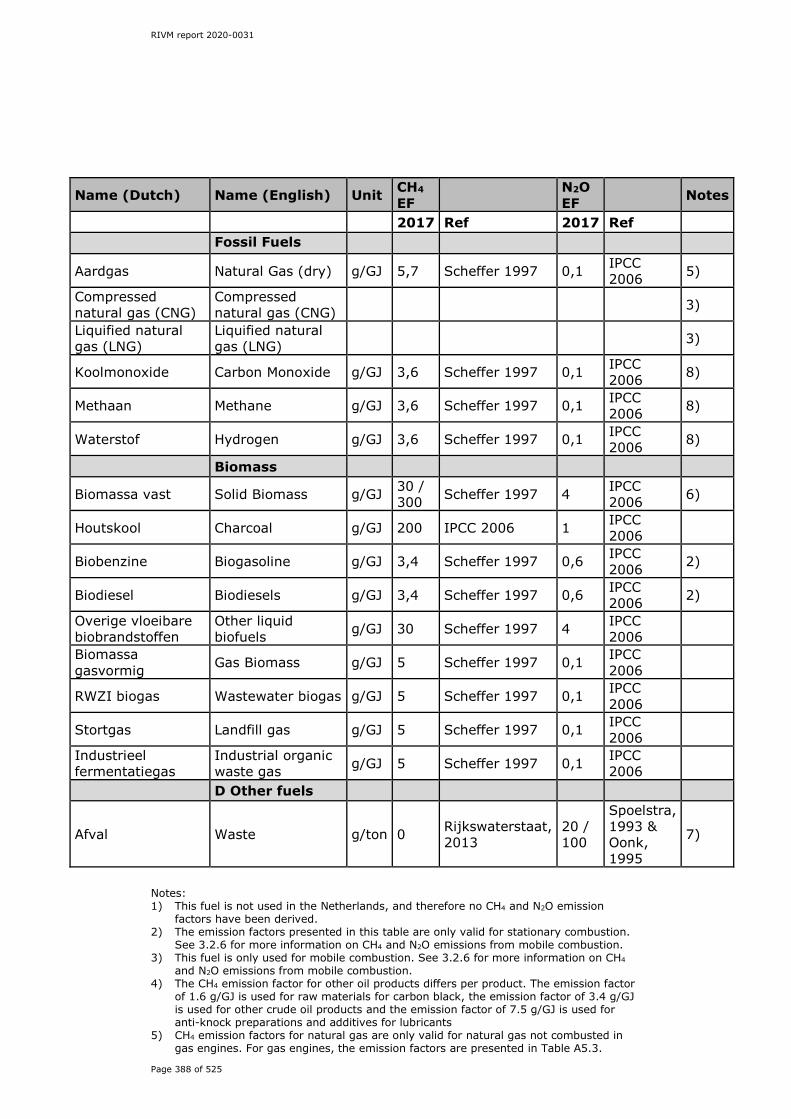
RIVM report 2020-0031
Page 388 of 525
Name (Dutch) Name (English) Unit CH4 EF N2O
EF Notes
2017 Ref 2017 Ref Fossil Fuels
Aardgas Natural Gas (dry) g/GJ 5,7 Scheffer 1997 0,1 IPCC 2006 5)
Compressed natural gas (CNG)
Compressed natural gas (CNG) 3)
Liquified natural gas (LNG)
Liquified natural gas (LNG) 3)
Koolmonoxide Carbon Monoxide g/GJ 3,6 Scheffer 1997 0,1 IPCC 2006 8)
Methaan Methane g/GJ 3,6 Scheffer 1997 0,1 IPCC 2006 8)
Waterstof Hydrogen g/GJ 3,6 Scheffer 1997 0,1 IPCC 2006 8)
Biomass
Biomassa vast Solid Biomass g/GJ 30 / 300 Scheffer 1997 4 IPCC
2006 6)
Houtskool Charcoal g/GJ 200 IPCC 2006 1 IPCC 2006
Biobenzine Biogasoline g/GJ 3,4 Scheffer 1997 0,6 IPCC 2006 2)
Biodiesel Biodiesels g/GJ 3,4 Scheffer 1997 0,6 IPCC 2006 2)
Overige vloeibare biobrandstoffen
Other liquid biofuels g/GJ 30 Scheffer 1997 4 IPCC
2006
Biomassa gasvormig Gas Biomass g/GJ 5 Scheffer 1997 0,1 IPCC
2006
RWZI biogas Wastewater biogas g/GJ 5 Scheffer 1997 0,1 IPCC 2006
Stortgas Landfill gas g/GJ 5 Scheffer 1997 0,1 IPCC 2006
Industrieel fermentatiegas
Industrial organic waste gas g/GJ 5 Scheffer 1997 0,1 IPCC
2006
D Other fuels
Afval Waste g/ton 0 Rijkswaterstaat, 2013
20 / 100
Spoelstra, 1993 & Oonk, 1995
7)
Notes: 1) This fuel is not used in the Netherlands, and therefore no CH4 and N2O emission
factors have been derived. 2) The emission factors presented in this table are only valid for stationary combustion.
See 3.2.6 for more information on CH4 and N2O emissions from mobile combustion. 3) This fuel is only used for mobile combustion. See 3.2.6 for more information on CH4
and N2O emissions from mobile combustion. 4) The CH4 emission factor for other oil products differs per product. The emission factor
of 1.6 g/GJ is used for raw materials for carbon black, the emission factor of 3.4 g/GJ is used for other crude oil products and the emission factor of 7.5 g/GJ is used for anti-knock preparations and additives for lubricants
5) CH4 emission factors for natural gas are only valid for natural gas not combusted in gas engines. For gas engines, the emission factors are presented in Table A5.3.

RIVM report 2020-0031
Page 389 of 525
Residential gas leakage before ignition in cooking, hot water and space heating are not included in the CH4 emission factor for natural gas; these are separately estimated to be 35 g/GJ.
6) CH4 emission factors for wood are 30 kg/TJ for CRF categories 1A1 and 1A2 and 300 kg/TJ for CRF category 1A4.
7) The N2O emission factor differs per DeNOx plant type. The emission factor of 20 g/GJ is used for SCR plants and the emission factor of 100 g/GJ s used for SNCR plants.
8) Ethane, carbon monoxide, methane and hydrogen are not reported separately, but as part of chemical waste gas.
Table A5.3: CH4 emission factors for natural gas combusted in gas engines (g/GJ).
Year EF CH4 gas engines in agriculture
EF CH4 gas engines in other sectors
1990 305.0 305.0 1991 305.0 305.0 1992 305.0 305.0 1993 305.0 305.0 1994 305.0 305.0 1995 305.0 305.0 1996 305.0 305.0 1997 305.0 305.0 1998 294.0 294.0 1999 283.0 283.0 2000 272.0 272.0 2001 261.0 261.0 2002 250.0 250.0 2003 250.0 250.0 2004 268.9 250.0 2005 301.5 250.0 2006 354.6 250.0 2007 382.3 250.0 2008 395.3 250.0 2009 403.9 250.0 2010 410.1 250.0 2011 416.0 250.0 2012 421.8 250.0 2013 427.0 250.0 2014 431.7 250.0 2015 436.5 250.0 2016 441.3 250.0 2017 446.1 250.0 2018 450.0 250.0
RIVM report 2020-0031
Page 390 of 525
Annex 6 Assessment of completeness and (potential) sources and sinks
The Netherlands’ emissions inventory focuses on completeness, and accuracy in the most relevant sources. This means that for all ‘NE’ sources, it was investigated what information was available and whether it could be assumed that a source was really (very) small/negligible. For those sources that turned out not to be small, methods for estimating the emissions were developed during the improvement programme. As a result of this process, it was decided to keep only a very few sources as ’NE’, where data for estimating emissions were not available and the source was very small. Of course, (developments in) data on NE sources that indicate any (major) increase in emissions and (new) data sources for estimating emissions are checked/re-assessed on a regular basis. The Netherlands GHG emissions inventory includes all sources identified by the 2006 IPCC Guidelines, with the exception of the following (very) minor sources:
• CO2 from asphalt roofing (2A4d) and CO2 from road paving (2A4d), both due to missing activity data: information on the use of bitumen is available only in a division into two groups: the chemical industry and all others. There is no information on the amount of asphalt roofing production and no information on road paving with asphalt. The statistical information on the sales (value) of asphalt roofing and asphalt for road paving ends in 2002. As a follow-up to the 2008 review, information was collected from the branch organization for roofing, indicating that the number of producers of asphalt roofing declined from about 15 in 1990 to fewer than 5 in 2008 and that the import of asphalt roofing increased during that period. Information has also been sourced on asphalt production (for road paving), as reported in the progress of the voluntary agreements for energy efficiency. A first estimate indicates that annual CO2 emissions could be approximately 0.5 kton. On the basis of the above, it was assumed that emissions related to these two categories are very low/undetectable and that the effort expended in generating activity data would, therefore, not be cost-effective. So not only the missing activity data, but also the very limited amount of emissions were the rationale behind the decision not to estimate these emissions.
• CH4 from Enteric fermentation: poultry (3A4), due to missing EFs: for this source category, no IPCC default EF is available.
• N2O emissions from industrial wastewater treatment (5D2): the IPCC 2006 Guidelines do not provide a method for estimating N2O emissions from industrial sources, except for industrial wastewater that is co-discharged with domestic wastewater into the sewerage system. N2O emissions from industrial sources are believed to be insignificant compared with emissions from domestic wastewater. In the Netherlands most industries discharge their wastewater into the sewerage system/WWTPs
RIVM report 2020-0031
Page 391 of 525
(emissions included in 5D1). Indirect emissions from surface water resulting from discharges of wastewater effluent are already included (IE) under 5D3 (Other, wastewater effluents).
• Direct N2O emissions from septic tanks (5D3, septic tanks): direct emissions of N2O from septic tanks are not calculated since they are unlikely to occur, given the anaerobic circumstances in these tanks. Indirect N2O emissions from septic tank effluent are included (IE) in CRF category 5D3 (Indirect N2O emission from surface water as a result of discharge of domestic and industrial effluents).
• CH4 emissions from industrial sludge treatment (5D2): data from the survey among IWWTPs conducted by Statistics Netherlands shows that only 2 out of a total of 160 IWWTPs are equipped with anaerobic sludge digestion reactors. These data are not published on www.cbs.statline.nl for reasons of confidentiality. Forthcoming CH4 emissions are not estimated (NE) because it is not known what sludge treatment capacity these plants have or how much sludge is digested. It is likely that these emissions are a very minor source and can be neglected.
• Precursor emissions (i.e. CO, NOx, NMVOC and SO2) from Memo item international bunkers (international transport) have not been included.
• In LULUCF category 4.A2 Land converted to forest Land, the accumulation of dead wood and litter in newly established forest plots is an uncertain carbon sink of unknown magnitude (see Arets et al., 2020). Therefore in order to be conservative this sink is reported as ‘NE’.
• No data are available to report CH4 emissions from drainage and rewetting of organic soils (LULUCF CRF Table 4(II)). Such emissions may occur from drainage ditches used in agriculture areas on organic soils. However, the extent of these ditches is not known and in therefore in the current methodology these ditches are included under the respective Cropland and Grassland areas. As a result also CO2 emissions for these areas are included, which are higher than potential CH4 emissions (in CO2 eq.). Therefore this is considered to be a conservative approach.
RIVM report 2020-0031
Page 392 of 525
Annex 7 Additional information to be considered as part of the NIR submission
List A7.1 contains the list of methodology reports that have been submitted to the UNFCCC (in a separate ZIP file) as part of the submission of 15 April 2020. These reports are to be considered as an integrated part of this NIR2020. A7.1 List of methodology reports ENINA: (Energy, IP, Waste) Methodologies on the calculations of emissions from the sectors Energy, Industry and Waste - Update 2020 RIVM Report 2020-0040 E. Honig, J.A. Montfoort, R. Dröge, B. Guis, C. Baas, B. van Huet, O.R. van Hunnik, A.C.W.M. van den Berghe Transport: Methods for calculating the emissions of transport in the Netherlands - 2020 G. Geilenkirchen, K. Roth, M. Sijstermans, J. Hulskotte, N. Ligterink, S. Dellaert, M. ’t Hoen IPPU Methods used for the Dutch Emission Inventory. Product usage by consumers, construction and services RIVM Report 2020-0041 A.J.H. Visschedijk, J.A.J. Meesters, M.M. Nijkamp, B.I. Jansen, B.I., W.W.R Koch, R. Dröge. Agriculture: Methodology for estimating emissions from agriculture in the Netherlands – 2019 (next update in 2021) Calculations of CH4, NH3, N2O, NOx, PM10, PM2.5 and CO2 with the National Emission Model for Agriculture (NEMA) L.A. Lagerwerf, A. Bannink, C. van Bruggen, C. Groenestein, J. Huijsmans, J. van der Kolk, H. Luesink, S. Sluis, G. Velthof, and J. Vonk LULUCF Greenhouse gas reporting for the LULUCF sector in the Netherlands Methodological background, update 2020, WOt-technical report 168 E.J.M.M. Arets, J.W.H van der Kolk, G.M. Hengeveld, J.P. Lesschen, H. Kramer, P.J. Kuikman & M.J. Schelhaas These reports are also available at the website http://english.rvo.nl/nie
RIVM report 2020-0031
Page 393 of 525
Annex 8 Chemical compounds, GWP, units and conversion factors
A8.1 Chemical compounds CF4 Perfluoromethane (tetrafluoromethane) C2F6 Perfluoroethane (hexafluoroethane) CH4 Methane CO Carbon monoxide CO2 Carbon dioxide HCFCs Hydrochlorofluorocarbons HFCs Hydrofluorocarbons HNO3 Nitric acid NF3 Nitrogen trifluoride NH3 Ammonia NOx Nitrogen oxide (NO and NO2), expressed as NO2
N2O Nitrous oxide NMVOC Non-methane volatile organic compounds PFCs Perfluorocarbons SF6 Sulphur hexafluoride SO2 Sulphur dioxide VOC Volatile organic compounds (may include or exclude
methane) A8.2 GWP of selected GHGs Table A8.1 lists the 100-year GWP of selected GHGs. Gases shown in italics are not emitted in the Netherlands.

RIVM report 2020-0031
Page 394 of 525
Table A8.1: 100-year GWP of selected GHGs Gas 100-year GWP 1) CO2 1 CH42) 25 N2O 298 HFCs3): HFC-23 14,800 HFC-32 675 HFC-125 3,500 HFC-134a 1,413 HFC-143a 4,470 HFC-152a 124 HFC-227ea 3,220 HFC-236fa 9,810 HFC-245ca 693 PFCs3): CF4 7,390 C2F6 12,200 C3F8 8,830 C4F10 8,860 C6F14 9,300 SF6 22,800 NF3 17,200
1) GWPs calculated with a 100-year time horizon in compliance with the UNFCCC Guidelines for reporting (UNFCCC, 2006).
2) The GWP of methane includes the direct effects and the indirect effects due to the production of tropospheric ozone and stratospheric water vapour; the indirect effect due to the production of CO2 is not included.
3) The GWP-100 of emissions reported as ‘HFC-unspecified’ and ‘PFC-unspecified’ differ per reported year. They are in the order of magnitude of 3,000 and 8,400, respectively.
Source: UNFCCC (2013). A8.3 Units MJ Mega Joule (106 Joule) GJ Giga Joule (109 Joule) TJ Tera Joule (1012 Joule) PJ Peta Joule (1015 Joule) Mg Mega gramme (106 gramme) Gg Giga gramme (109 gramme) Tg Tera gramme (1012 gramme) Pg Peta gramme (1015 gramme) ton metric ton (= 1,000 kilogramme = 1 Mg) kton kiloton (= 1,000 metric ton = 1 Gg) Mton Megaton (= 1,000,000 metric ton = 1 Tg) ha hectare (= 104 m2) kha kilo hectare (= 1,000 hectare = 107 m2 = 10 km2) mln million (= 106)

RIVM report 2020-0031
Page 395 of 525
A8.4 Conversion factors for emissions From element basis to full molecular mass:
From full molecular mass to element basis
C → CO2: x 44/12 = 3.67 CO2 →C: x 12/44 = 0.27 C → CH4: x 16/12 = 1.33 CH4 →C: x 12/16 = 0.75 C → CO: x 28/12 = 2.33 CO → C: x 12/28 = 0.43 N → N2O: x 44/28 = 1.57 N2O → N: x 28/44 = 0.64 N → NO: x 30/14 = 2.14 NO → N: x 14/30 = 0.47 N → NO2: x 46/14 = 3.29 NO2 → N: x 14/46 = 0.30 N → NH3: x 17/14 = 1.21 NH3 → N: x 14/17 = 0.82 N → HNO3: x 63/14 = 4.50 HNO3 → N: x 14/63 = 0.22 S → SO2: x 64/32 = 2.00 SO2 → S: x 32/64 = 0.50
RIVM report 2020-0031
Page 396 of 525
Annex 9 List of abbreviations
AD activity data AGB above-ground biomass AR afforestation and reforestation AER Annual Environmental Report BCEF biomass expansion function BF blast furnace gas BGB below-ground biomass BOD biological oxygen demand C Carbon or Confidential information(notation code in CRF) CO coke oven gas COD chemical oxygen demand CBS Statistics Netherlands CDM Clean Development Mechanism CHP combined heat and power CLRTAP Convention on Long-Range Transboundary Transport of
Air Pollutants COD chemical oxygen demand CPR commitment period reserve CRF Common Reporting Format (of emissions data files,
annexed to an NIR) CSC carbon stock changes D deforestation DM dry matter DOC degradable organic carbon DOCf degradable organic carbon fraction DOM dead organic matter DW dead wood e-AER electronic Annual Environmental Report EEA European Environment Agency EF emission factor ENINA Task Group Energy, Industry and Waste Handling ER Emission Registration (system) ERT Expert Review Team ERU Emission Reduction Unit ETS Emission Trading System EU European Union EWL European Waste List EZ Ministry of Economic Affairs EZK Minisery of Economic Affairs and Climate Policy (EZK) FAO Food and Agricultural Organization (UN) F-gases group of fluorinated compounds comprising HFCs, PFCs
and SF6 FGD flue gas desulphurization FM forest management FMRL Forest Management Reference Level GE gross energy GHG greenhouse gas GWP global warming potential HOSP Timber Production Statistics and Forecast (in Dutch: ‘Hout
Oogst Statistiek en Prognose oogstbaar hout’)
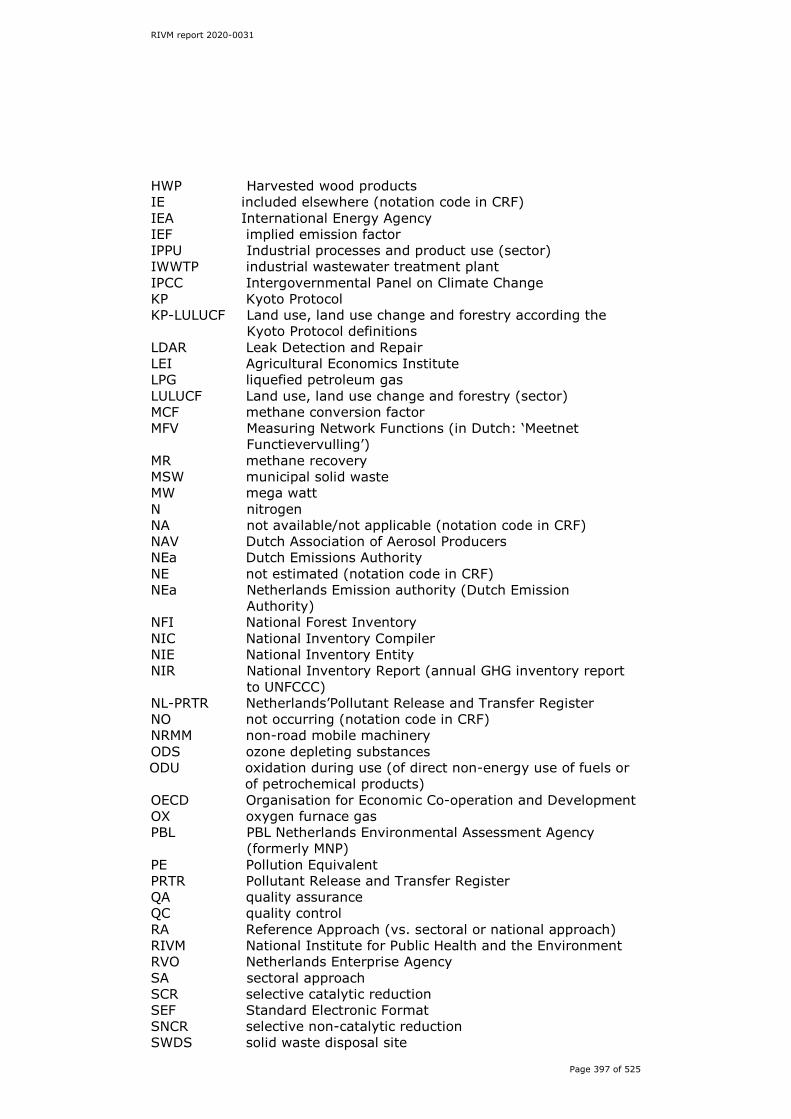
RIVM report 2020-0031
Page 397 of 525
HWP Harvested wood products IE included elsewhere (notation code in CRF) IEA International Energy Agency IEF implied emission factor IPPU Industrial processes and product use (sector) IWWTP industrial wastewater treatment plant IPCC Intergovernmental Panel on Climate Change KP Kyoto Protocol KP-LULUCF Land use, land use change and forestry according the
Kyoto Protocol definitions LDAR Leak Detection and Repair LEI Agricultural Economics Institute LPG liquefied petroleum gas LULUCF Land use, land use change and forestry (sector) MCF methane conversion factor MFV Measuring Network Functions (in Dutch: ‘Meetnet
Functievervulling’) MR methane recovery MSW municipal solid waste MW mega watt N nitrogen NA not available/not applicable (notation code in CRF) NAV Dutch Association of Aerosol Producers NEa Dutch Emissions Authority NE not estimated (notation code in CRF) NEa Netherlands Emission authority (Dutch Emission
Authority) NFI National Forest Inventory NIC National Inventory Compiler NIE National Inventory Entity NIR National Inventory Report (annual GHG inventory report
to UNFCCC) NL-PRTR Netherlands’Pollutant Release and Transfer Register NO not occurring (notation code in CRF) NRMM non-road mobile machinery ODS ozone depleting substances ODU oxidation during use (of direct non-energy use of fuels or
of petrochemical products) OECD Organisation for Economic Co-operation and Development OX oxygen furnace gas PBL PBL Netherlands Environmental Assessment Agency
(formerly MNP) PE Pollution Equivalent PRTR Pollutant Release and Transfer Register QA quality assurance QC quality control RA Reference Approach (vs. sectoral or national approach) RIVM National Institute for Public Health and the Environment RVO Netherlands Enterprise Agency SA sectoral approach SCR selective catalytic reduction SEF Standard Electronic Format SNCR selective non-catalytic reduction SWDS solid waste disposal site
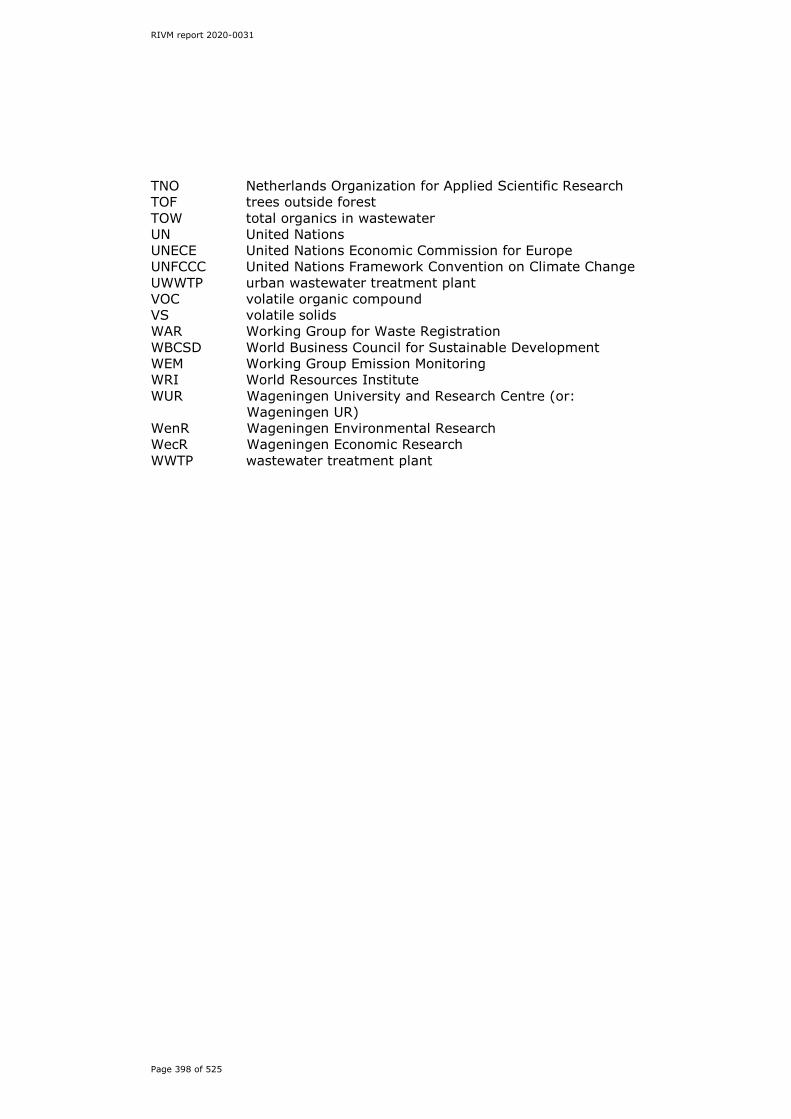
RIVM report 2020-0031
Page 398 of 525
TNO Netherlands Organization for Applied Scientific Research TOF trees outside forest TOW total organics in wastewater UN United Nations UNECE United Nations Economic Commission for Europe UNFCCC United Nations Framework Convention on Climate Change UWWTP urban wastewater treatment plant VOC volatile organic compound VS volatile solids WAR Working Group for Waste Registration WBCSD World Business Council for Sustainable Development WEM Working Group Emission Monitoring WRI World Resources Institute WUR Wageningen University and Research Centre (or:
Wageningen UR) WenR Wageningen Environmental Research WecR Wageningen Economic Research WWTP wastewater treatment plant

RIVM report 2020-0031
Page 399 of 525
Annex 10 Improvements made in response to the in-country UNFCCC review of September 2019
Sector ID# draft ARR
Adressing/Not resolved/ New from 2019 review
Issue and/or problem classificationa[, b]
ERT 2019 assessment and rationale from draft ARR 2019
NLD Response in NIR /CRF
Paragraph or table number in: NIR, CRF and or Methodology report (MR)
General G.10
Addressing Uncertainty analysis Provide the level and trend uncertainty assessment as required by paragraphs 15 and 42 of the UNFCCC Annex I inventory reporting guidelines. ===== The Netherlands reported in its NIR the uncertainty analysis for the latest reported year and the trend (annex 2, section 2.1, p.336). The Party reported that uncertainty levels in AD and EFs for the base year are equal to those in the data for the whole time series, but it did not report the uncertainty analysis for the base year, as requested by the previous ERT. During the review, the Party confirmed the information reported in the NIR without providing the analysis requested.
We now included the uncertainty analysis for the base year in Annex 2.
Annex 2
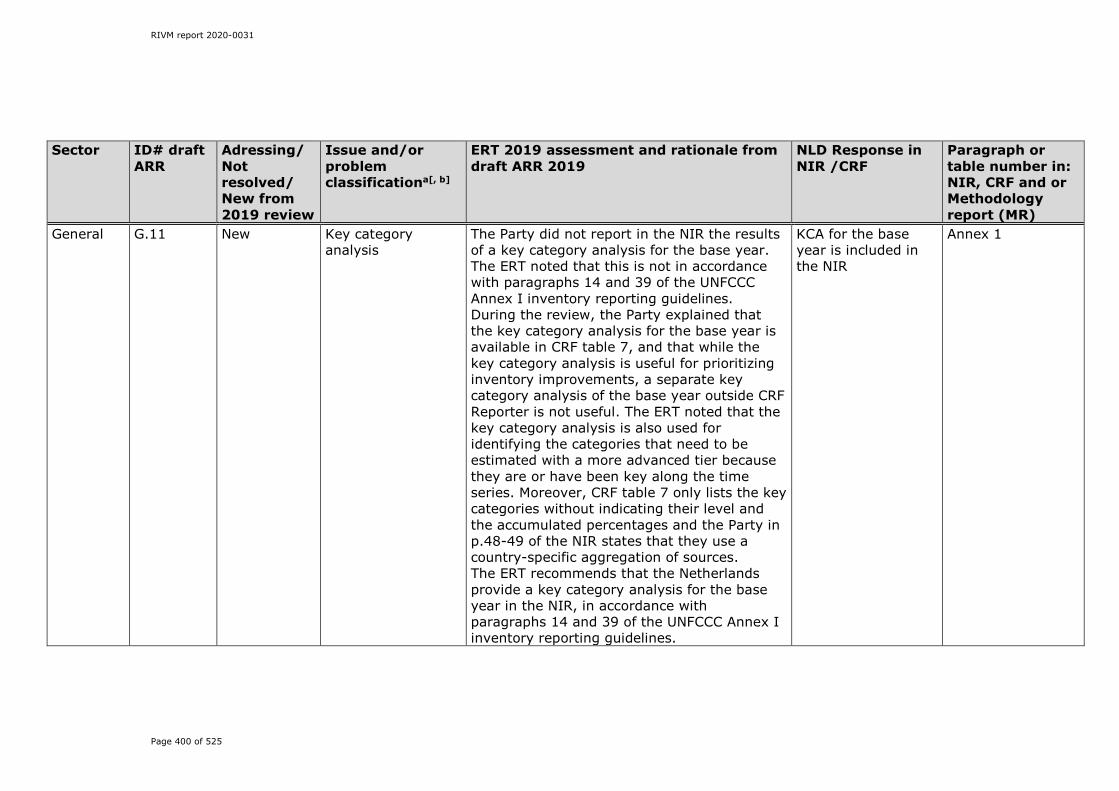
RIVM report 2020-0031
Page 400 of 525
Sector ID# draft ARR
Adressing/Not resolved/ New from 2019 review
Issue and/or problem classificationa[, b]
ERT 2019 assessment and rationale from draft ARR 2019
NLD Response in NIR /CRF
Paragraph or table number in: NIR, CRF and or Methodology report (MR)
General G.11 New Key category analysis
The Party did not report in the NIR the results of a key category analysis for the base year. The ERT noted that this is not in accordance with paragraphs 14 and 39 of the UNFCCC Annex I inventory reporting guidelines. During the review, the Party explained that the key category analysis for the base year is available in CRF table 7, and that while the key category analysis is useful for prioritizing inventory improvements, a separate key category analysis of the base year outside CRF Reporter is not useful. The ERT noted that the key category analysis is also used for identifying the categories that need to be estimated with a more advanced tier because they are or have been key along the time series. Moreover, CRF table 7 only lists the key categories without indicating their level and the accumulated percentages and the Party in p.48-49 of the NIR states that they use a country-specific aggregation of sources. The ERT recommends that the Netherlands provide a key category analysis for the base year in the NIR, in accordance with paragraphs 14 and 39 of the UNFCCC Annex I inventory reporting guidelines.
KCA for the base year is included in the NIR
Annex 1

RIVM report 2020-0031
Page 401 of 525
Sector ID# draft ARR
Adressing/Not resolved/ New from 2019 review
Issue and/or problem classificationa[, b]
ERT 2019 assessment and rationale from draft ARR 2019
NLD Response in NIR /CRF
Paragraph or table number in: NIR, CRF and or Methodology report (MR)
Energy E.6 Addressing 1.A.1.a Public electricity and heat production – liquid fuels – CO2, CH4 and N2O
Clarify, in the NIR, the allocation of emissions from incinerated waste oils and solvents and justify the applicable AD, EFs and emission trend. ===== The Netherlands reported in its NIR that combustion of waste oil and solvents was discontinued in the country for environmental reasons in 2002. Since then, most of the waste oil and solvents are exported for environmentally friendly processing; and emissions from the small amounts of waste oil and solvents recycled were included under this subcategory (1.A.1.a (public electricity and heat production)) (p.73). However, the Party has not addressed the recommendation to justify the applicable AD, EFs and emission trends.
In 3.2.4.1 of the NIR we changed the text: "Since the closure of this plant (which reported their emissions and activity data directly to the inventory) the residues have been exported for environmental friendly processing and the resulting foreign emissions are not included in the Dutch inventory".
3.2.4.1
Energy E.8 Addressing 1.A.1.c Manufacture of solid fuels and other energy industries – gaseous fuels – CO2
Provide in the NIR the reasons behind the fluctuations in the CO2 IEF throughout the gas combustion time series and explain how the consistency of the time series and EFs are ensured in estimating CO2 emissions from this category. ===== The Netherlands reported the reason for the fluctuation in the CO2 IEF as being the variation in the EF of the raw natural gas used (NIR, section 3.2.4.2, pp.77–78) and
We included explanatory text on time series concistancy in the NIR
3.2.4.3, 3.2.5.3 , 3.2.7.3

RIVM report 2020-0031
Page 402 of 525
Sector ID# draft ARR
Adressing/Not resolved/ New from 2019 review
Issue and/or problem classificationa[, b]
ERT 2019 assessment and rationale from draft ARR 2019
NLD Response in NIR /CRF
Paragraph or table number in: NIR, CRF and or Methodology report (MR)
described the uncertainties (NIR, section 3.2.4.3, pp.79–80). The ERT noted, however, that the Party did not provide information on how time-series consistency is ensured in estimating CO2 emissions for this category. During the review, the Party explained that time-series consistency is maintained by using a constant source for AD over the entire time series (the national energy balance). The ERT considers that the issue could be resolved if this information were included in the NIR.
Energy E.9 Addressing 1.A.1.c Manufacture of solid fuels and other energy industries – liquid fuels – CO2, CH4 and N2O
Include in the NIR the reason why emissions from liquid fuels are reported for 1990 only. ===== The Netherlands reported that a small amount of liquid fuel was used in 1990 only (NIR, p.75). However, the Party reported CO2 emissions from liquid fuels for 1990-2013 in CRF table 1.A(a)s1. CH4 and N2O emissions were reported in the same table but, inconsistently with CO2 emissions,only for 1990 (and as “NO” from 1991 onward).
In 3.2.4.1 of the NIR we changed the text: Only in 1990, a small amount of liquid fuels was used in this sector. From 1991 on no liquid fuel use was registred in the energy statistics for this sub-sector.

RIVM report 2020-0031
Page 403 of 525
Sector ID# draft ARR
Adressing/Not resolved/ New from 2019 review
Issue and/or problem classificationa[, b]
ERT 2019 assessment and rationale from draft ARR 2019
NLD Response in NIR /CRF
Paragraph or table number in: NIR, CRF and or Methodology report (MR)
Energy E.12
Addressing 1.A.2.c Chemicals – liquid fuels – CO2, CH4 and N2O
Use more up-to-date data from the most recently available data sources, such as annual environmental reports or EU ETS data, in order to improve the time-series consistency of CO2, CH4 and N2O emission estimates from chemical waste gases (if the data are suitable to use for previous years), or, if that is not possible, include in the NIR a detailed category-specific improvement plan and explain how the time-series consistency for the AD is ensured for the emission estimates for this category. ===== The Netherlands included checking and improving time-series consistency of emissions from chemical waste gases under planned improvements in its NIR (sections 3.2.4.2–3.2.4.3 and 3.2.4.6), but the ERT noted that the planned improvements are yet to be implemented. During the review, the Party informed the ERT that for the early years of the time series, EU ETS data may not be suitable.
Explanatory text included.
3.2.5.3 and 3.2.5.5

RIVM report 2020-0031
Page 404 of 525
Sector ID# draft ARR
Adressing/Not resolved/ New from 2019 review
Issue and/or problem classificationa[, b]
ERT 2019 assessment and rationale from draft ARR 2019
NLD Response in NIR /CRF
Paragraph or table number in: NIR, CRF and or Methodology report (MR)
Energy E.15 Not Resolved 1.A.3.e.i Pipeline transport – gaseous fuels – CH4
Allocate combustion emissions of CH4 from the natural gas transport network to subcategory 1.A.3.e.i (pipeline transport). ===== The Netherlands reported in its NIR that sufficient data are not available to ensure a consistent time series (p.378). During the review, the Party explained that it has no plans to investigate whether it is possible to disaggregate data on CH4 combustion emissions from the natural gas transport network because doing so would not change the total emissions but only reallocate the emissions. The ERT acknowledges that the split in emissions would not change the total emissions but notes that splitting the emissions would enhance the comparability of emission estimates in accordance with the 2006 IPCC Guidelines (vol. 2, table 3.1.1). The ERT also noted that the Party has reported CO2 and N2O emisssions from gaseous fuels
As explained the requested split can not be made. We do not consider this as a priority in our improvement plan as the emission data are correct. As we provided this explaination already multiple times, we kindly request to remove this issue from the list.
Energy E.19 Addressing 1.B.2.a Oil – liquid fuels – CO2 and CH4
Correct the CO2 and CH4 emission estimates for 2015 to remove the combustion-related CO2 and CH4 emissions, and enhance QA/QC procedures to ensure correct reporting. ===== For 2015, the Netherlands removed 356.17 kt CO2 emissions from 1.B.2.a.4 (refining/storage) but added only 308.98 kt
2015 data were checked and corrected. Trends in CO2 and CH4 emission over the total time series are now fully in line with the expectations.
CRF 1.B.2.a.4
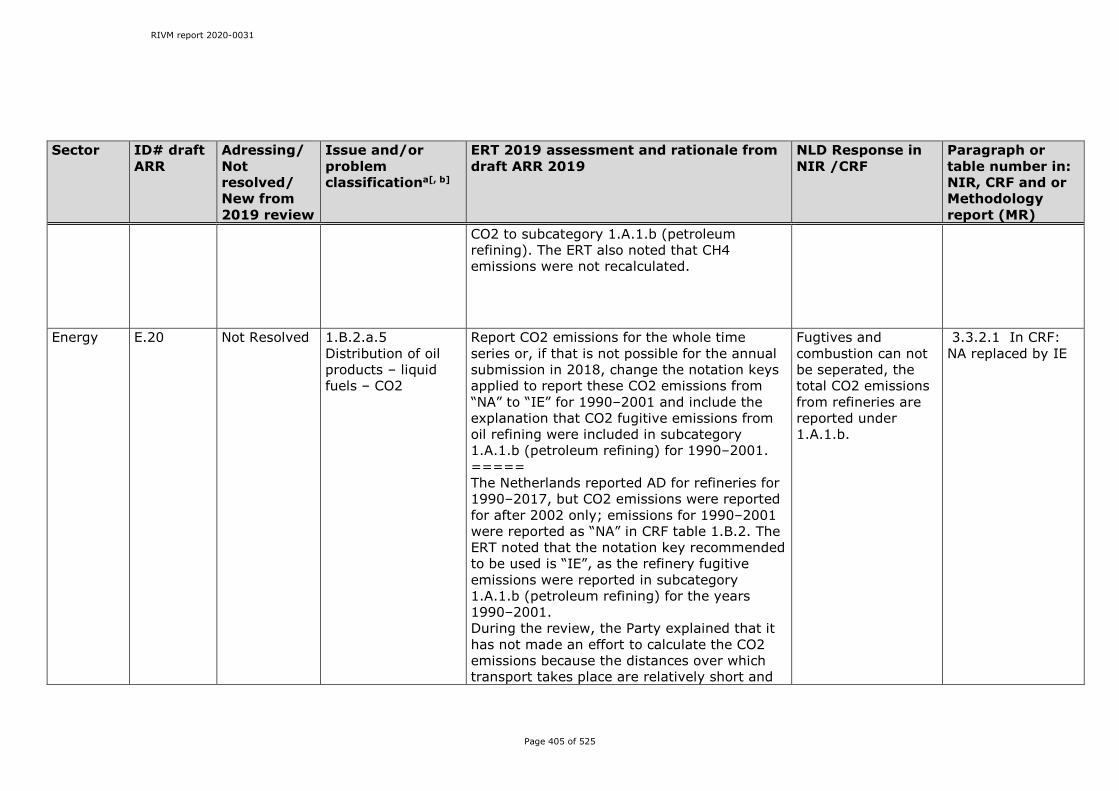
RIVM report 2020-0031
Page 405 of 525
Sector ID# draft ARR
Adressing/Not resolved/ New from 2019 review
Issue and/or problem classificationa[, b]
ERT 2019 assessment and rationale from draft ARR 2019
NLD Response in NIR /CRF
Paragraph or table number in: NIR, CRF and or Methodology report (MR)
CO2 to subcategory 1.A.1.b (petroleum refining). The ERT also noted that CH4 emissions were not recalculated.
Energy E.20 Not Resolved 1.B.2.a.5 Distribution of oil products – liquid fuels – CO2
Report CO2 emissions for the whole time series or, if that is not possible for the annual submission in 2018, change the notation keys applied to report these CO2 emissions from “NA” to “IE” for 1990–2001 and include the explanation that CO2 fugitive emissions from oil refining were included in subcategory 1.A.1.b (petroleum refining) for 1990–2001. ===== The Netherlands reported AD for refineries for 1990–2017, but CO2 emissions were reported for after 2002 only; emissions for 1990–2001 were reported as “NA” in CRF table 1.B.2. The ERT noted that the notation key recommended to be used is “IE”, as the refinery fugitive emissions were reported in subcategory 1.A.1.b (petroleum refining) for the years 1990–2001. During the review, the Party explained that it has not made an effort to calculate the CO2 emissions because the distances over which transport takes place are relatively short and
Fugtives and combustion can not be seperated, the total CO2 emissions from refineries are reported under 1.A.1.b.
3.3.2.1 In CRF: NA replaced by IE

RIVM report 2020-0031
Page 406 of 525
Sector ID# draft ARR
Adressing/Not resolved/ New from 2019 review
Issue and/or problem classificationa[, b]
ERT 2019 assessment and rationale from draft ARR 2019
NLD Response in NIR /CRF
Paragraph or table number in: NIR, CRF and or Methodology report (MR)
that under Dutch circumstances, “oil products” should be read as “fuels used in transport” (i.e. gasoline, diesel and liquefied petroleum gas). The Party also explained that as a result of the Dutch regulation on volatile organic compounds, all possible sources of fugitive emissions of a fuel (refineries, distributors and filling stations) have been equipped with abatement technologies to capture any fugitive emissions, which, according to the Party, justifies the use of “NA” for these emissions. The Netherlands informed the ERT that it considers the emissions to be negligible and therefore does not plan to invest effort or resources into estimating them in the future.
Energy E.21
Addressing 1.B.2.b Natural gas – gaseous fuels – CO2
Report the appropriate notation keys in CRF table 1.B.2 for AD and CO2 and CH4 emissions, ensuring time-series consistency. ===== The Netherlands reported in its NIR (annex 10, p.378) that sufficient data are not available for a consistent time series; however, the notation key “IE” for AD and “NO” for CO2 and CH4 emissions was used in CRF table 1.B.2 for the category 1.B.2.b.6. The ERT noted that information on how time-series consistency is maintained is not included in the NIR while the correct notation keys have been used. During the review, the Party informed the ERT
A consistent methodology is used to calculate emissions throughout the time series (relying on the same data sources such as the national energy balance).
3.3.2.3.

RIVM report 2020-0031
Page 407 of 525
Sector ID# draft ARR
Adressing/Not resolved/ New from 2019 review
Issue and/or problem classificationa[, b]
ERT 2019 assessment and rationale from draft ARR 2019
NLD Response in NIR /CRF
Paragraph or table number in: NIR, CRF and or Methodology report (MR)
that time-series consistency is maintained by using the same data sources for the entire time series (the national energy balance). The ERT considers that providing this explanation in relevant sections of the NIR would enhance its transparency and resolve the issue.
Energy E.26 New 1.A.2.a Iron and steel – solid fuels – CO2, CH4 and N2O
The Netherlands reported that because the oxidation of fuels in the manufacturing of iron and steel is accounted for under production and combustion in the energy statistics, the corresponding emissions are reported under category 1.A.2 (manufacturing industries and construction) in the energy sector and not in the IPPU sector. (NIR, p.83). The ERT noted that the 2006 IPCC Guidelines (vol. 2, chap. 1.6.2.1) require reporting the non-energy use of fuels in the IPPU sector. The ERT also noted that the Party did not provide an explanation for its allocation of emissions between the IPPU and energy sectors. During the review, the Party explained that residual gases are produced during the process of manufacturing iron and steel and these residual gases are combusted for energy purposes. The ERT recommends that the Netherlands
Explanatory text included.
3.2.5.1 just before Paragraph on 1.A.2.a
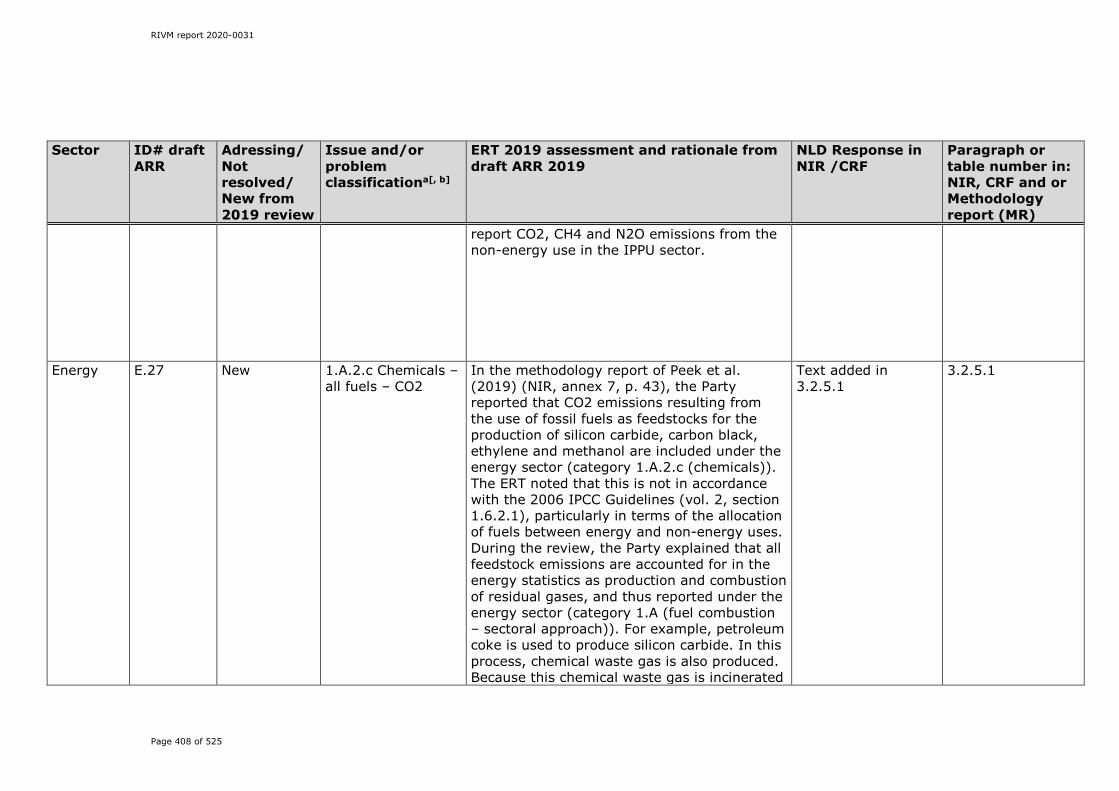
RIVM report 2020-0031
Page 408 of 525
Sector ID# draft ARR
Adressing/Not resolved/ New from 2019 review
Issue and/or problem classificationa[, b]
ERT 2019 assessment and rationale from draft ARR 2019
NLD Response in NIR /CRF
Paragraph or table number in: NIR, CRF and or Methodology report (MR)
report CO2, CH4 and N2O emissions from the non-energy use in the IPPU sector.
Energy E.27 New 1.A.2.c Chemicals – all fuels – CO2
In the methodology report of Peek et al. (2019) (NIR, annex 7, p. 43), the Party reported that CO2 emissions resulting from the use of fossil fuels as feedstocks for the production of silicon carbide, carbon black, ethylene and methanol are included under the energy sector (category 1.A.2.c (chemicals)). The ERT noted that this is not in accordance with the 2006 IPCC Guidelines (vol. 2, section 1.6.2.1), particularly in terms of the allocation of fuels between energy and non-energy uses. During the review, the Party explained that all feedstock emissions are accounted for in the energy statistics as production and combustion of residual gases, and thus reported under the energy sector (category 1.A (fuel combustion – sectoral approach)). For example, petroleum coke is used to produce silicon carbide. In this process, chemical waste gas is also produced. Because this chemical waste gas is incinerated
Text added in 3.2.5.1
3.2.5.1

RIVM report 2020-0031
Page 409 of 525
Sector ID# draft ARR
Adressing/Not resolved/ New from 2019 review
Issue and/or problem classificationa[, b]
ERT 2019 assessment and rationale from draft ARR 2019
NLD Response in NIR /CRF
Paragraph or table number in: NIR, CRF and or Methodology report (MR)
for energy purposes, the emissions are reported in category 1.A. The ERT recommends that the Netherlands provide in the NIR information on emissions resulting from the use of fossil fuels as feedstocks for the production of silicon carbide, carbon black, ethylene and methanol. The ERT also recommends the Party to allocate the non-energy use emissions to the IPPU category where they occur, if applicable.
Energy E.28 New 1.B.1.b Solid fuel transformation – solid fuels – CH4
The Netherlands revised the AD and recalculated CO2 emissions. However, CH4 emissions were not recalculated. The ERT recommends that the Netherlands recalculate CH4 emissions or explain that the revised AD used in the 2019 submission did not impact CH4 emissions.
Relevant data were checked and corrected. Trends in CO2 and CH4 emission over the total time series are now fully in line with the expectations.
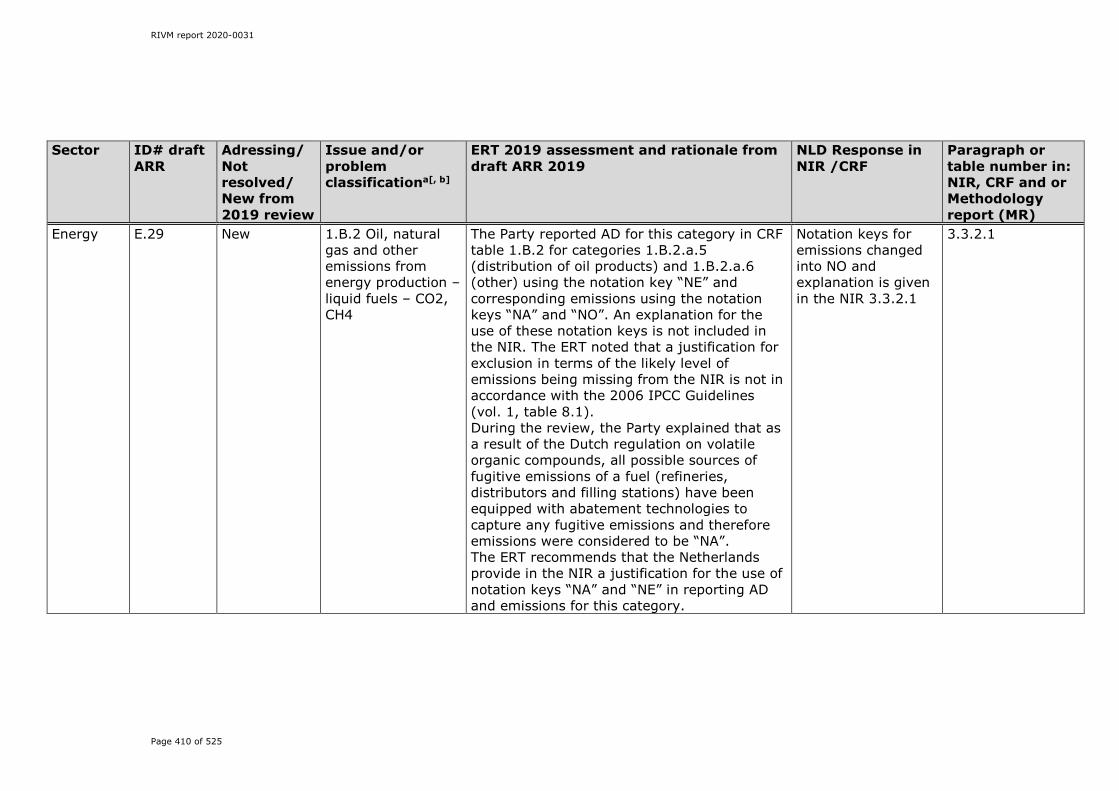
RIVM report 2020-0031
Page 410 of 525
Sector ID# draft ARR
Adressing/Not resolved/ New from 2019 review
Issue and/or problem classificationa[, b]
ERT 2019 assessment and rationale from draft ARR 2019
NLD Response in NIR /CRF
Paragraph or table number in: NIR, CRF and or Methodology report (MR)
Energy E.29 New 1.B.2 Oil, natural gas and other emissions from energy production – liquid fuels – CO2, CH4
The Party reported AD for this category in CRF table 1.B.2 for categories 1.B.2.a.5 (distribution of oil products) and 1.B.2.a.6 (other) using the notation key “NE” and corresponding emissions using the notation keys “NA” and “NO”. An explanation for the use of these notation keys is not included in the NIR. The ERT noted that a justification for exclusion in terms of the likely level of emissions being missing from the NIR is not in accordance with the 2006 IPCC Guidelines (vol. 1, table 8.1). During the review, the Party explained that as a result of the Dutch regulation on volatile organic compounds, all possible sources of fugitive emissions of a fuel (refineries, distributors and filling stations) have been equipped with abatement technologies to capture any fugitive emissions and therefore emissions were considered to be “NA”. The ERT recommends that the Netherlands provide in the NIR a justification for the use of notation keys “NA” and “NE” in reporting AD and emissions for this category.
Notation keys for emissions changed into NO and explanation is given in the NIR 3.3.2.1
3.3.2.1

RIVM report 2020-0031
Page 411 of 525
Sector ID# draft ARR
Adressing/Not resolved/ New from 2019 review
Issue and/or problem classificationa[, b]
ERT 2019 assessment and rationale from draft ARR 2019
NLD Response in NIR /CRF
Paragraph or table number in: NIR, CRF and or Methodology report (MR)
IPP U I.6 Not Resolved 2.A.4 Other process uses of carbonates (2.A.4.b soda ash)– CO2
Conduct further research and consultation with industry and/or statistical agencies on other process uses of carbonates to either access additional AD and EFs or seek verification of the current method and emission estimates in order to ensure the completeness and accuracy of the estimates. ===== The ERT noted that the description of the methodology for this category in the NIR (p. 123) is the same as that in previous NIRs and there is no information about actions taken to improve the completeness and accuracy of the estimates. The ERT also noted that the Netherlands uses a long extrapolation period to assess the latest emissions, which could decrease accuracy. The ERT believes that this issue should be considered further in future reviews to confirm that there is not an underestimation of emissions. The ERT considers that this issue could potentially be resolved by investigating EU ETS data.
The category makes only a minor contribution to the national total for the inventory (0,1%). However, we will try to find out in which chemical industry soda ash is used, and try to investigate EU ETS data
NIR paragraph 4.2.2 and 4.2.6

RIVM report 2020-0031
Page 412 of 525
Sector ID# draft ARR
Adressing/Not resolved/ New from 2019 review
Issue and/or problem classificationa[, b]
ERT 2019 assessment and rationale from draft ARR 2019
NLD Response in NIR /CRF
Paragraph or table number in: NIR, CRF and or Methodology report (MR)
IPP U I.8 Not Resolved 2.B.1 Ammonia production -CO2
Estimate emissions from ammonia production, taking into account CO2 emissions and sequestration from urea production by collecting new AD (annual urea production, urea imports and exports, and urea application to soils) through research and/or consultation with industry and statistical agencies in order to improve the accuracy and comparability of emission estimates. ===== The Netherlands reported in its NIR that data on urea production and use are still not available (p.131). During the review, the Party confirmed that it was not able to implement the recommendation because of the lack of available data on urea production and use. The ERT noted that the accuracy of the estimates has therefore not improved.
Data is still not available, some text added to paragraph 4.3.2. For the NIR 2021 it will be possible to perform this.
paragraph 4.3.2
IPP U I.10 Not Resolved 2.B.1 Ammonia production – CO2
Report CO2 emissions from ammonia production using a method that is consistent with the 2006 IPCC Guidelines, reporting emissions from all natural gas uses (i.e. both fuel and feedstock use) in this category. ===== The Netherlands reported in its NIR that no recalculations were made for this category (pp.134–136). The ERT noted that information in the NIR
Added extra text to paragraph 4.1
NIR paragraph 4.1
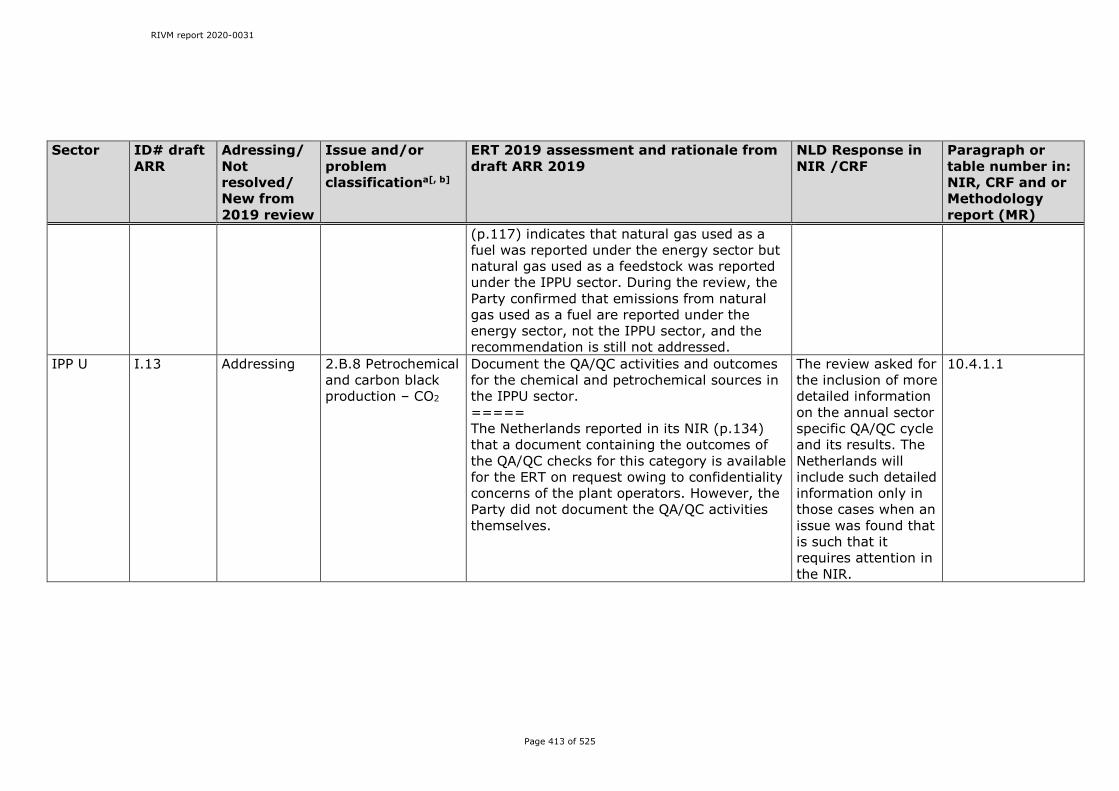
RIVM report 2020-0031
Page 413 of 525
Sector ID# draft ARR
Adressing/Not resolved/ New from 2019 review
Issue and/or problem classificationa[, b]
ERT 2019 assessment and rationale from draft ARR 2019
NLD Response in NIR /CRF
Paragraph or table number in: NIR, CRF and or Methodology report (MR)
(p.117) indicates that natural gas used as a fuel was reported under the energy sector but natural gas used as a feedstock was reported under the IPPU sector. During the review, the Party confirmed that emissions from natural gas used as a fuel are reported under the energy sector, not the IPPU sector, and the recommendation is still not addressed.
IPP U I.13 Addressing 2.B.8 Petrochemical and carbon black production – CO2
Document the QA/QC activities and outcomes for the chemical and petrochemical sources in the IPPU sector. ===== The Netherlands reported in its NIR (p.134) that a document containing the outcomes of the QA/QC checks for this category is available for the ERT on request owing to confidentiality concerns of the plant operators. However, the Party did not document the QA/QC activities themselves.
The review asked for the inclusion of more detailed information on the annual sector specific QA/QC cycle and its results. The Netherlands will include such detailed information only in those cases when an issue was found that is such that it requires attention in the NIR.
10.4.1.1

RIVM report 2020-0031
Page 414 of 525
Sector ID# draft ARR
Adressing/Not resolved/ New from 2019 review
Issue and/or problem classificationa[, b]
ERT 2019 assessment and rationale from draft ARR 2019
NLD Response in NIR /CRF
Paragraph or table number in: NIR, CRF and or Methodology report (MR)
IPP U I.15 Not Resolved 2.B.9 Fluorochemical production – HFCs
Report the HFC-23 load in the untreated flow based on flow meter results and stream composition in the NIR or in the ENINA report, and report the type of HFCs separately in the CRF tables, or, if it is difficult to implement this recommendation soon, investigate ways to present information on AD in the NIR that demonstrate the completeness of reporting until the recommendation can be implemented. ===== The Netherlands did not report in its NIR the flow meter results and stream composition. The ERT noted that the Party provided only total HFC-23 emissions from HCFC-22 production. The ERT also noted that AD were not reported in the NIR. During the review, the Party explained that it was not able to report HFC-23 load in the untreated flow based on flow meter results and stream composition in its NIR or in the ENINA report owing to confidentiality concerns of the plant operators.
The ERT also asked for inclusion of confidential information in the NIR. Although this is a recurring request, the Netherlands can and will not include such information in its NIR. We have a very good, long standing, track record for the timely and correct provision of such information during the UNFCCC reviews.
10.4.1.1
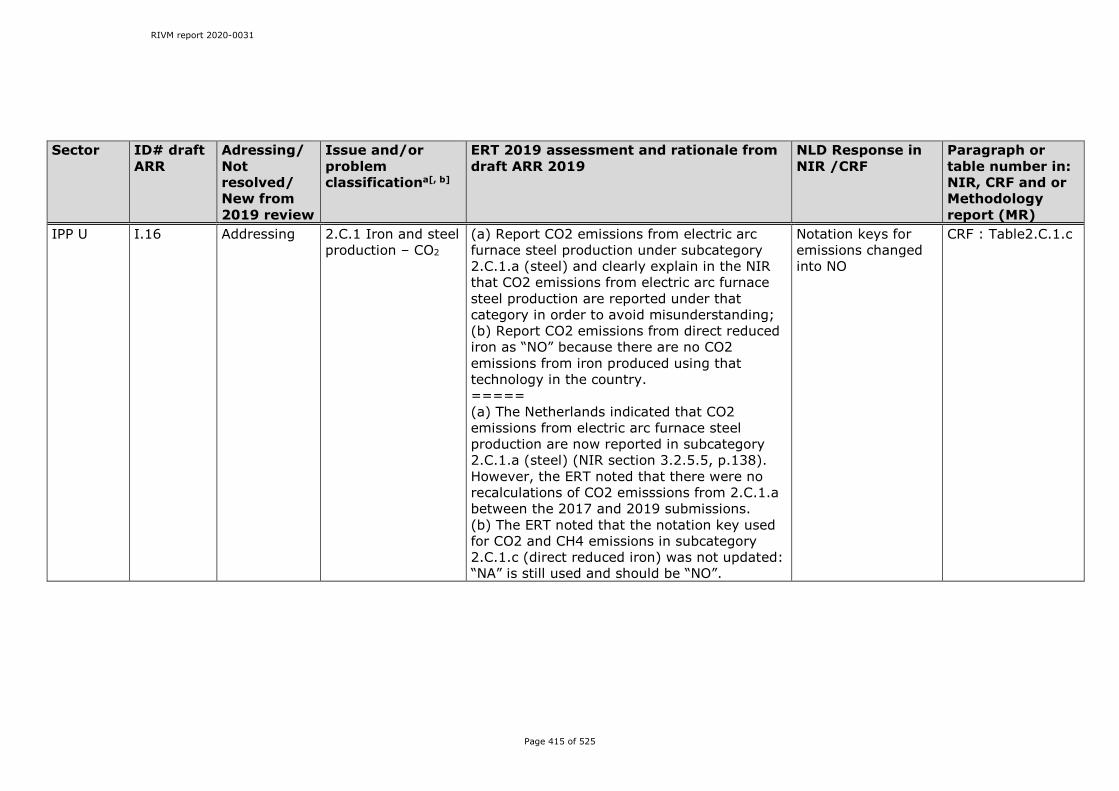
RIVM report 2020-0031
Page 415 of 525
Sector ID# draft ARR
Adressing/Not resolved/ New from 2019 review
Issue and/or problem classificationa[, b]
ERT 2019 assessment and rationale from draft ARR 2019
NLD Response in NIR /CRF
Paragraph or table number in: NIR, CRF and or Methodology report (MR)
IPP U I.16 Addressing 2.C.1 Iron and steel production – CO2
(a) Report CO2 emissions from electric arc furnace steel production under subcategory 2.C.1.a (steel) and clearly explain in the NIR that CO2 emissions from electric arc furnace steel production are reported under that category in order to avoid misunderstanding; (b) Report CO2 emissions from direct reduced iron as “NO” because there are no CO2 emissions from iron produced using that technology in the country. ===== (a) The Netherlands indicated that CO2 emissions from electric arc furnace steel production are now reported in subcategory 2.C.1.a (steel) (NIR section 3.2.5.5, p.138). However, the ERT noted that there were no recalculations of CO2 emisssions from 2.C.1.a between the 2017 and 2019 submissions. (b) The ERT noted that the notation key used for CO2 and CH4 emissions in subcategory 2.C.1.c (direct reduced iron) was not updated: “NA” is still used and should be “NO”.
Notation keys for emissions changed into NO
CRF : Table2.C.1.c
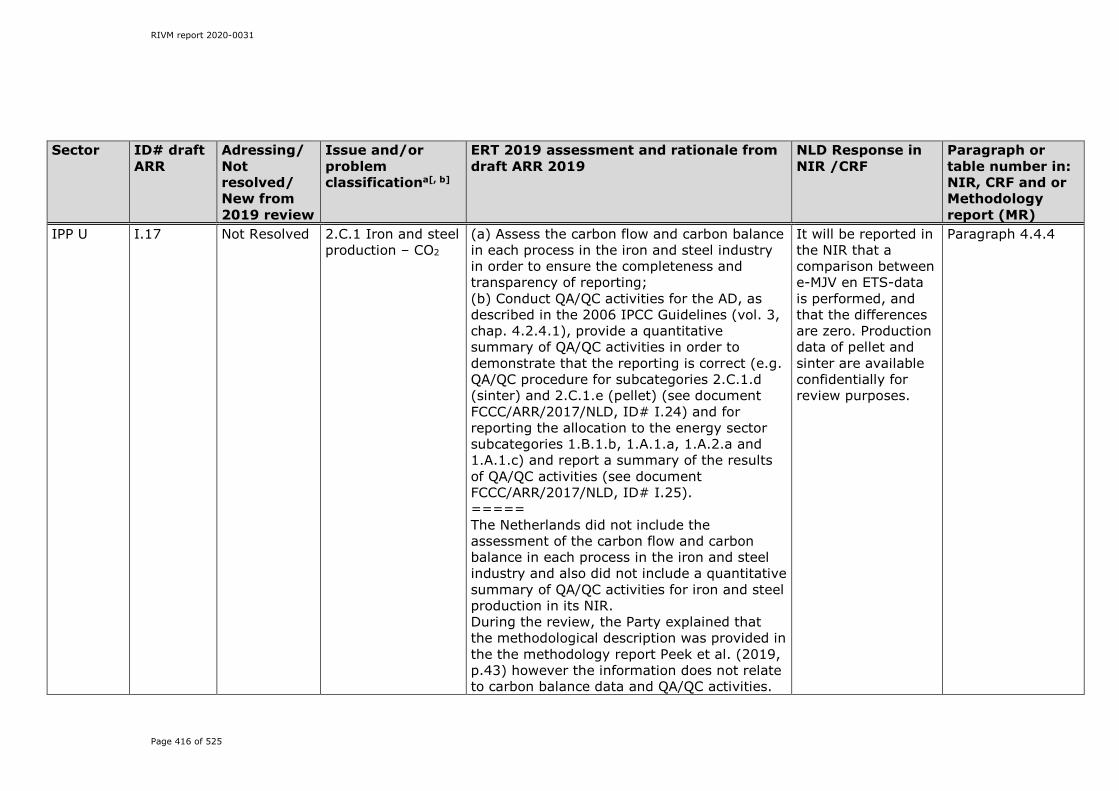
RIVM report 2020-0031
Page 416 of 525
Sector ID# draft ARR
Adressing/Not resolved/ New from 2019 review
Issue and/or problem classificationa[, b]
ERT 2019 assessment and rationale from draft ARR 2019
NLD Response in NIR /CRF
Paragraph or table number in: NIR, CRF and or Methodology report (MR)
IPP U I.17 Not Resolved 2.C.1 Iron and steel production – CO2
(a) Assess the carbon flow and carbon balance in each process in the iron and steel industry in order to ensure the completeness and transparency of reporting; (b) Conduct QA/QC activities for the AD, as described in the 2006 IPCC Guidelines (vol. 3, chap. 4.2.4.1), provide a quantitative summary of QA/QC activities in order to demonstrate that the reporting is correct (e.g. QA/QC procedure for subcategories 2.C.1.d (sinter) and 2.C.1.e (pellet) (see document FCCC/ARR/2017/NLD, ID# I.24) and for reporting the allocation to the energy sector subcategories 1.B.1.b, 1.A.1.a, 1.A.2.a and 1.A.1.c) and report a summary of the results of QA/QC activities (see document FCCC/ARR/2017/NLD, ID# I.25). ===== The Netherlands did not include the assessment of the carbon flow and carbon balance in each process in the iron and steel industry and also did not include a quantitative summary of QA/QC activities for iron and steel production in its NIR. During the review, the Party explained that the methodological description was provided in the the methodology report Peek et al. (2019, p.43) however the information does not relate to carbon balance data and QA/QC activities.
It will be reported in the NIR that a comparison between e-MJV en ETS-data is performed, and that the differences are zero. Production data of pellet and sinter are available confidentially for review purposes.
Paragraph 4.4.4
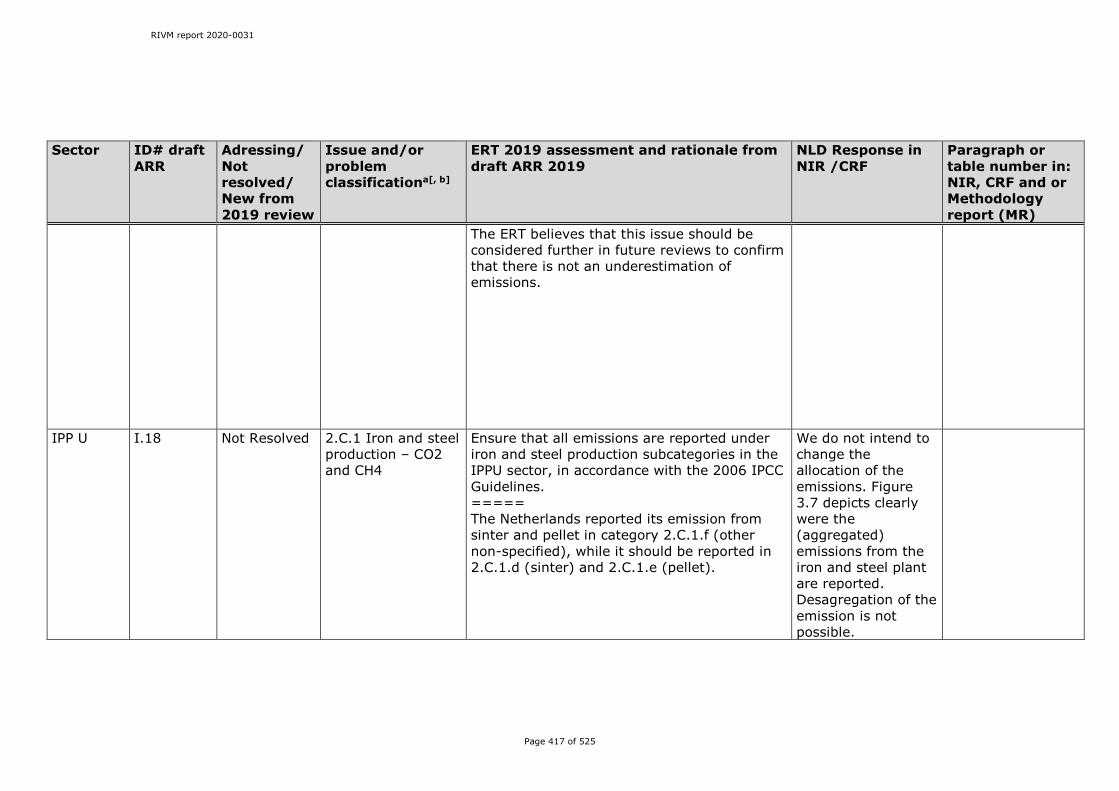
RIVM report 2020-0031
Page 417 of 525
Sector ID# draft ARR
Adressing/Not resolved/ New from 2019 review
Issue and/or problem classificationa[, b]
ERT 2019 assessment and rationale from draft ARR 2019
NLD Response in NIR /CRF
Paragraph or table number in: NIR, CRF and or Methodology report (MR)
The ERT believes that this issue should be considered further in future reviews to confirm that there is not an underestimation of emissions.
IPP U I.18 Not Resolved 2.C.1 Iron and steel production – CO2 and CH4
Ensure that all emissions are reported under iron and steel production subcategories in the IPPU sector, in accordance with the 2006 IPCC Guidelines. ===== The Netherlands reported its emission from sinter and pellet in category 2.C.1.f (other non-specified), while it should be reported in 2.C.1.d (sinter) and 2.C.1.e (pellet).
We do not intend to change the allocation of the emissions. Figure 3.7 depicts clearly were the (aggregated) emissions from the iron and steel plant are reported. Desagregation of the emission is not possible.

RIVM report 2020-0031
Page 418 of 525
Sector ID# draft ARR
Adressing/Not resolved/ New from 2019 review
Issue and/or problem classificationa[, b]
ERT 2019 assessment and rationale from draft ARR 2019
NLD Response in NIR /CRF
Paragraph or table number in: NIR, CRF and or Methodology report (MR)
IPP U I.22 Not Resolved 2.F.1 Refrigeration and air conditioning – HFCs
Correct the notation key “NA” to “IE” for industrial refrigeration and mobile air conditioning in accordance with paragraph 37 of the UNFCCC Annex I inventory reporting guidelines. ===== The Netherlands reported emissions from the manufacturing and disposal of industrial refrigeration and mobile air conditioning as “NA” in CRF table 2(II)B-Hs2. During the review, the Party explained that notation keys were revised for category 2.F; however, the ERT noted that the reported notation key for manufacture and disposal emissions is still “NA”, not “IE” as it should be.(also see I.27 and I.28 below)
Corrected in CRF
IPP U I.23 Not Resolved 2.F.1 Refrigeration and air conditioning – HFCs, PFCs and SF6
Conduct QA/QC and verification of the method used to estimate emissions from refrigeration and air conditioning, in accordance with paragraph 41 of the UNFCCC Annex I inventory reporting guidelines, and report on the outcomes thereof. ===== The Netherlands reported in its NIR that it was not able to conduct QA/QC of the method used for estimating emissions from refrigeration and air conditioning owing to the lack of available data (p.146). During the review, the Party explained that
There is simply no data available.
NIR paragraph 4.7.4
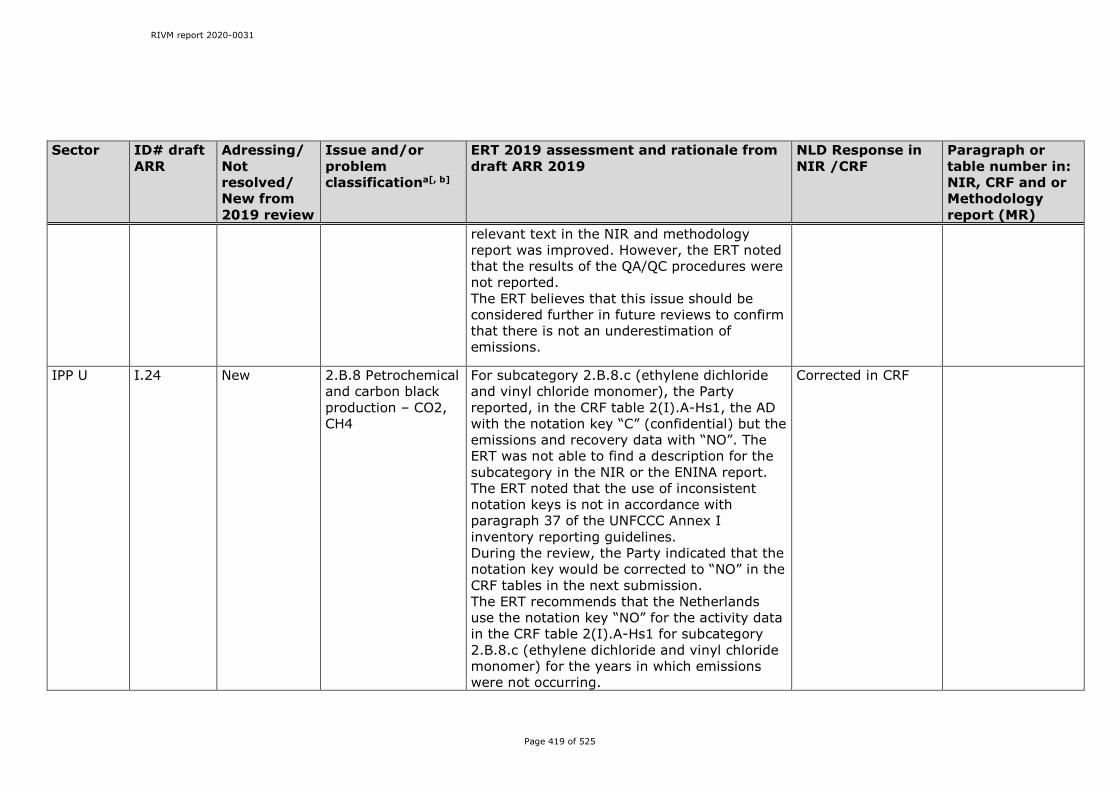
RIVM report 2020-0031
Page 419 of 525
Sector ID# draft ARR
Adressing/Not resolved/ New from 2019 review
Issue and/or problem classificationa[, b]
ERT 2019 assessment and rationale from draft ARR 2019
NLD Response in NIR /CRF
Paragraph or table number in: NIR, CRF and or Methodology report (MR)
relevant text in the NIR and methodology report was improved. However, the ERT noted that the results of the QA/QC procedures were not reported. The ERT believes that this issue should be considered further in future reviews to confirm that there is not an underestimation of emissions.
IPP U I.24
New 2.B.8 Petrochemical and carbon black production – CO2, CH4
For subcategory 2.B.8.c (ethylene dichloride and vinyl chloride monomer), the Party reported, in the CRF table 2(I).A-Hs1, the AD with the notation key “C” (confidential) but the emissions and recovery data with “NO”. The ERT was not able to find a description for the subcategory in the NIR or the ENINA report. The ERT noted that the use of inconsistent notation keys is not in accordance with paragraph 37 of the UNFCCC Annex I inventory reporting guidelines. During the review, the Party indicated that the notation key would be corrected to “NO” in the CRF tables in the next submission. The ERT recommends that the Netherlands use the notation key “NO” for the activity data in the CRF table 2(I).A-Hs1 for subcategory 2.B.8.c (ethylene dichloride and vinyl chloride monomer) for the years in which emissions were not occurring.
Corrected in CRF

RIVM report 2020-0031
Page 420 of 525
Sector ID# draft ARR
Adressing/Not resolved/ New from 2019 review
Issue and/or problem classificationa[, b]
ERT 2019 assessment and rationale from draft ARR 2019
NLD Response in NIR /CRF
Paragraph or table number in: NIR, CRF and or Methodology report (MR)
IPP U I.25
New 2.C.6 Zinc production – CO2
In CRF table 2(I).A-Hs2 , for category 2.C.6 (zinc production), the Party reported the AD with the notation key “C” (confidential) in the CRF tables whereas in the NIR it reported that this source is not occurring (p.137). Emissions and recovery data were reported as “NO”, while information on the IEF for CO2 was reported as “IE” and “NO”. The Party reported in the NIR it reported that this source is not occurring (p.137).The ERT noted that the use of inconsistent notation keys is not in accordance with paragraph 37 of the UNFCCC Annex I inventory reporting guidelines. During the review, the Party indicated that the notation key would be corrected to “NO” in the CRF tables in the next submission. The ERT recommends that the Netherlands use notation keys in a consistent manner and revise the notation key to “NO” for reporting AD and IEFs for this category in the CRF table 2(I).A-Hs2.
Corrected in CRF In CRF : consistant use of NO notation
IPP U I.26 New 2.F.1 Refrigeration and air conditioning – HFCs
The Party did not report the AD and emissions for subcategory 2.F.1.b (domestic refrigeration) in the CRF table 2(II).B-Hs2 (reported as blank), and did not provide an explanation for their absence in the NIR or methodology report of Peek et al. (2019) (NIR, annex 7). The ERT noted that domestic refrigeration is a potential source of emissions.
Corrected in CRF, text added to paragraph 4.7.1
NIR paragraph 4.7.1
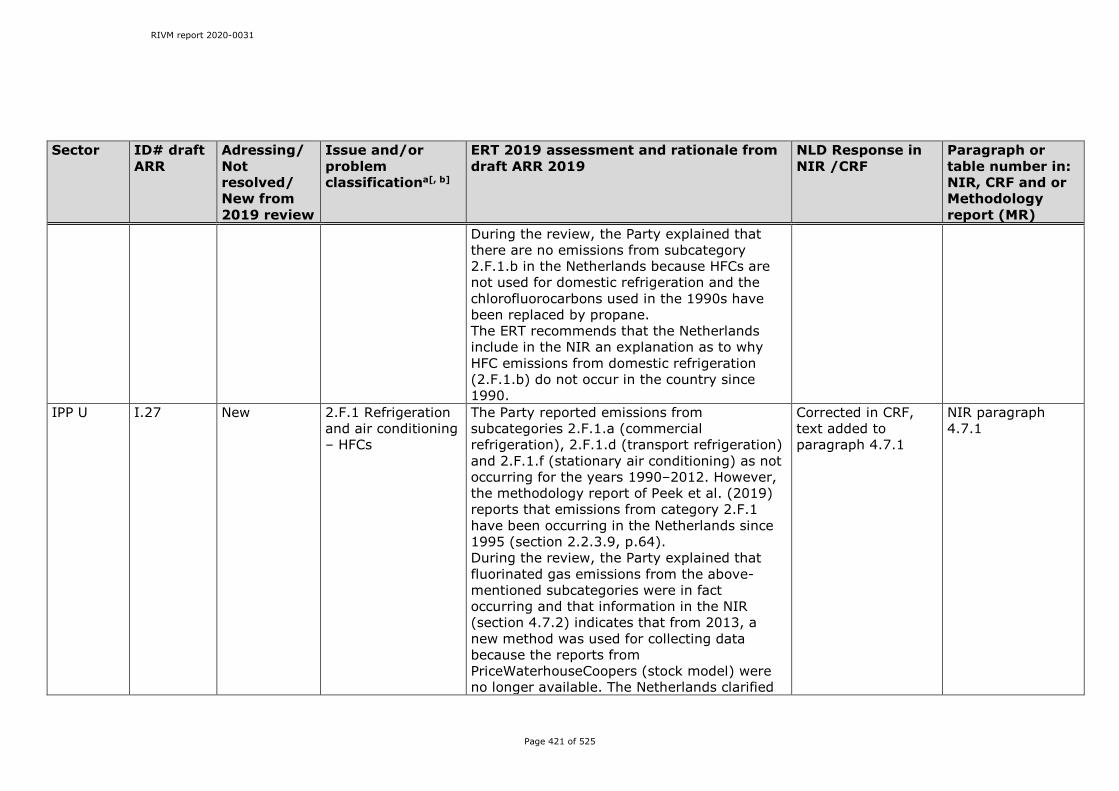
RIVM report 2020-0031
Page 421 of 525
Sector ID# draft ARR
Adressing/Not resolved/ New from 2019 review
Issue and/or problem classificationa[, b]
ERT 2019 assessment and rationale from draft ARR 2019
NLD Response in NIR /CRF
Paragraph or table number in: NIR, CRF and or Methodology report (MR)
During the review, the Party explained that there are no emissions from subcategory 2.F.1.b in the Netherlands because HFCs are not used for domestic refrigeration and the chlorofluorocarbons used in the 1990s have been replaced by propane. The ERT recommends that the Netherlands include in the NIR an explanation as to why HFC emissions from domestic refrigeration (2.F.1.b) do not occur in the country since 1990.
IPP U I.27 New 2.F.1 Refrigeration and air conditioning – HFCs
The Party reported emissions from subcategories 2.F.1.a (commercial refrigeration), 2.F.1.d (transport refrigeration) and 2.F.1.f (stationary air conditioning) as not occurring for the years 1990–2012. However, the methodology report of Peek et al. (2019) reports that emissions from category 2.F.1 have been occurring in the Netherlands since 1995 (section 2.2.3.9, p.64). During the review, the Party explained that fluorinated gas emissions from the above-mentioned subcategories were in fact occurring and that information in the NIR (section 4.7.2) indicates that from 2013, a new method was used for collecting data because the reports from PriceWaterhouseCoopers (stock model) were no longer available. The Netherlands clarified
Corrected in CRF, text added to paragraph 4.7.1
NIR paragraph 4.7.1
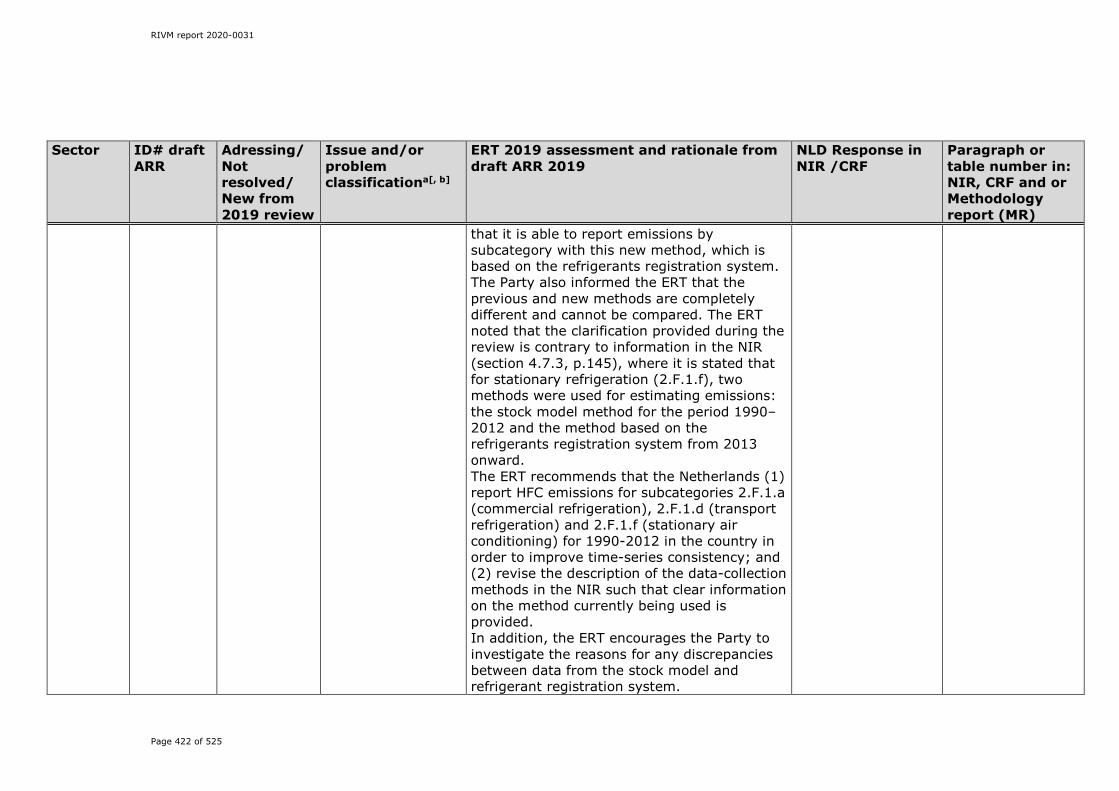
RIVM report 2020-0031
Page 422 of 525
Sector ID# draft ARR
Adressing/Not resolved/ New from 2019 review
Issue and/or problem classificationa[, b]
ERT 2019 assessment and rationale from draft ARR 2019
NLD Response in NIR /CRF
Paragraph or table number in: NIR, CRF and or Methodology report (MR)
that it is able to report emissions by subcategory with this new method, which is based on the refrigerants registration system. The Party also informed the ERT that the previous and new methods are completely different and cannot be compared. The ERT noted that the clarification provided during the review is contrary to information in the NIR (section 4.7.3, p.145), where it is stated that for stationary refrigeration (2.F.1.f), two methods were used for estimating emissions: the stock model method for the period 1990–2012 and the method based on the refrigerants registration system from 2013 onward. The ERT recommends that the Netherlands (1) report HFC emissions for subcategories 2.F.1.a (commercial refrigeration), 2.F.1.d (transport refrigeration) and 2.F.1.f (stationary air conditioning) for 1990-2012 in the country in order to improve time-series consistency; and (2) revise the description of the data-collection methods in the NIR such that clear information on the method currently being used is provided. In addition, the ERT encourages the Party to investigate the reasons for any discrepancies between data from the stock model and refrigerant registration system.

RIVM report 2020-0031
Page 423 of 525
Sector ID# draft ARR
Adressing/Not resolved/ New from 2019 review
Issue and/or problem classificationa[, b]
ERT 2019 assessment and rationale from draft ARR 2019
NLD Response in NIR /CRF
Paragraph or table number in: NIR, CRF and or Methodology report (MR)
IPP U I.28 New 2.F.1 Refrigeration and air conditioning – HFCs
The Party reported emissions from the manufacture and disposal for subcategories 2.F.1.a (commercial refrigeration), 2.F.1.d (transport refrigeration) and 2.F.1.f (stationary air conditioning) using the notation key “NA” in the CRF table 2(II).B-Hs2 whereas the methodology report of Peek et al. (2019) (NIR, annex 7) reports that these activities occur and are reported under operating stock. The ERT noted that not reporting emissions at the most disaggregated level of each source category is not in accordance with paragraph 36 of the UNFCCC Annex I inventory reporting guidelines. During the review, the Party explained that these emissions can be reported separately, but there are not enough potential cells in the CRF tables to present the 16 figures, namely, emissions from leakage from working systems, filling installations, dismantling installations and refrigerant management for each sector (commercial refrigeration, industrial refrigeration, transport refrigeration and stationary air conditioning). The Party clarified that there is no manufacture of equipment and that emissions from working systems form the largest share of the four components. According to information provided by the Party for commercial refrigeration, emissions of
Corrected in CRF Paragraph 4.7.3

RIVM report 2020-0031
Page 424 of 525
Sector ID# draft ARR
Adressing/Not resolved/ New from 2019 review
Issue and/or problem classificationa[, b]
ERT 2019 assessment and rationale from draft ARR 2019
NLD Response in NIR /CRF
Paragraph or table number in: NIR, CRF and or Methodology report (MR)
HFC-134a were 27,749 kg for leakage, 301 kg for filling, 172 kg for dismantling and 440 kg for refrigerant management for 2015; that is, leakage comprised 97 per cent of the total emissions. The Party indicated that similar shares are seen in the other sectors. The ERT recommends that the Netherlands (1) report emissions from operating stock and disposal separately in CRF table 2(II).B-Hs2 or (2) use the notation key “IE” rather than “NA” for years in which emissions occurred and “NO” for years in which emissions were not occurring, if reporting separate emissions from disposal is not possible owing to confidentiality concerns of the operators. In addition, the ERT encourages the Party to report the estimated emissions from refrigerant containers in the operating stock for category 2.F.6 (other) and provide in the NIR an explanation as to where these emissions are included.
IPP U I.29 New 2.G.3 N2O from product uses – N2O
The Party reported in the CRF table 2(I).A-Hs2 the AD for subcategory 2.G.3.b (other (N2O from aerosol cans)) as 27,710,000 kt for 2017. However, the methodology report of Jansen et al. (2019) submitted with the NIR provides the AD in numbers of N2O-containing aerosol cans sold (section 5.2, p.25) indicating that that AD reported in CRF tables is the
Activity data changed to: kt N2O in aerosol cans
CRF 2.G..3.
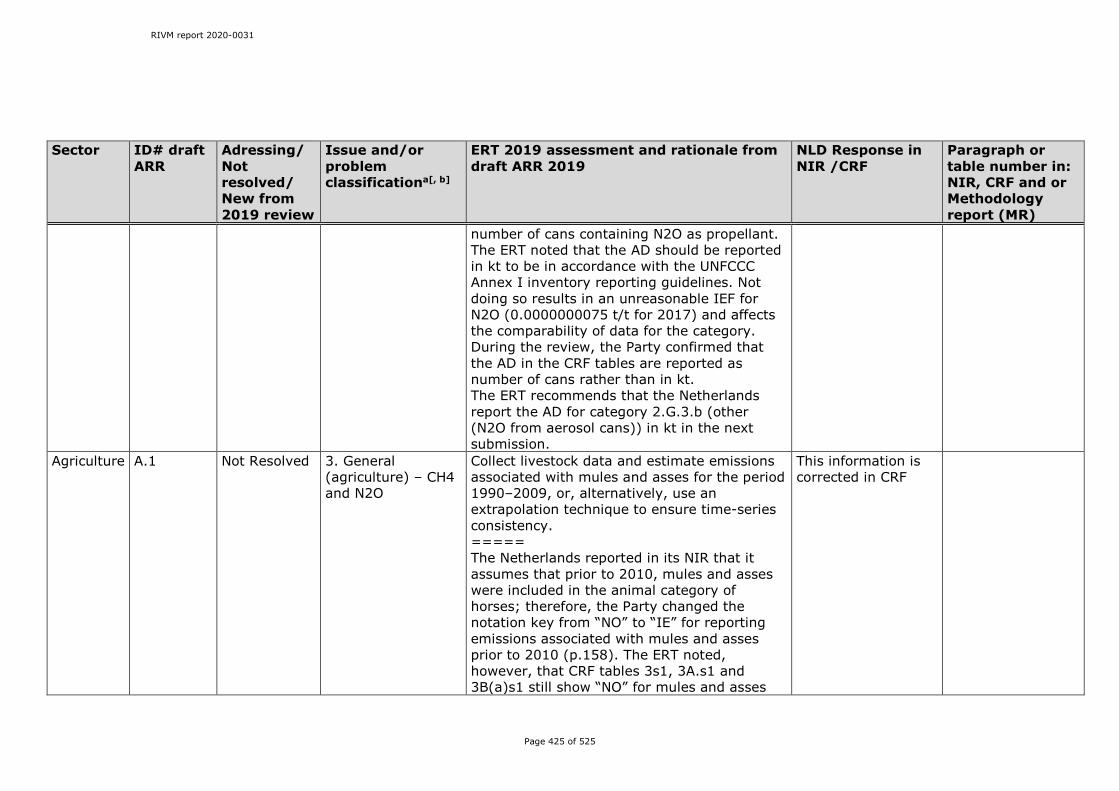
RIVM report 2020-0031
Page 425 of 525
Sector ID# draft ARR
Adressing/Not resolved/ New from 2019 review
Issue and/or problem classificationa[, b]
ERT 2019 assessment and rationale from draft ARR 2019
NLD Response in NIR /CRF
Paragraph or table number in: NIR, CRF and or Methodology report (MR)
number of cans containing N2O as propellant. The ERT noted that the AD should be reported in kt to be in accordance with the UNFCCC Annex I inventory reporting guidelines. Not doing so results in an unreasonable IEF for N2O (0.0000000075 t/t for 2017) and affects the comparability of data for the category. During the review, the Party confirmed that the AD in the CRF tables are reported as number of cans rather than in kt. The ERT recommends that the Netherlands report the AD for category 2.G.3.b (other (N2O from aerosol cans)) in kt in the next submission.
Agriculture A.1 Not Resolved 3. General (agriculture) – CH4 and N2O
Collect livestock data and estimate emissions associated with mules and asses for the period 1990–2009, or, alternatively, use an extrapolation technique to ensure time-series consistency. ===== The Netherlands reported in its NIR that it assumes that prior to 2010, mules and asses were included in the animal category of horses; therefore, the Party changed the notation key from “NO” to “IE” for reporting emissions associated with mules and asses prior to 2010 (p.158). The ERT noted, however, that CRF tables 3s1, 3A.s1 and 3B(a)s1 still show “NO” for mules and asses
This information is corrected in CRF
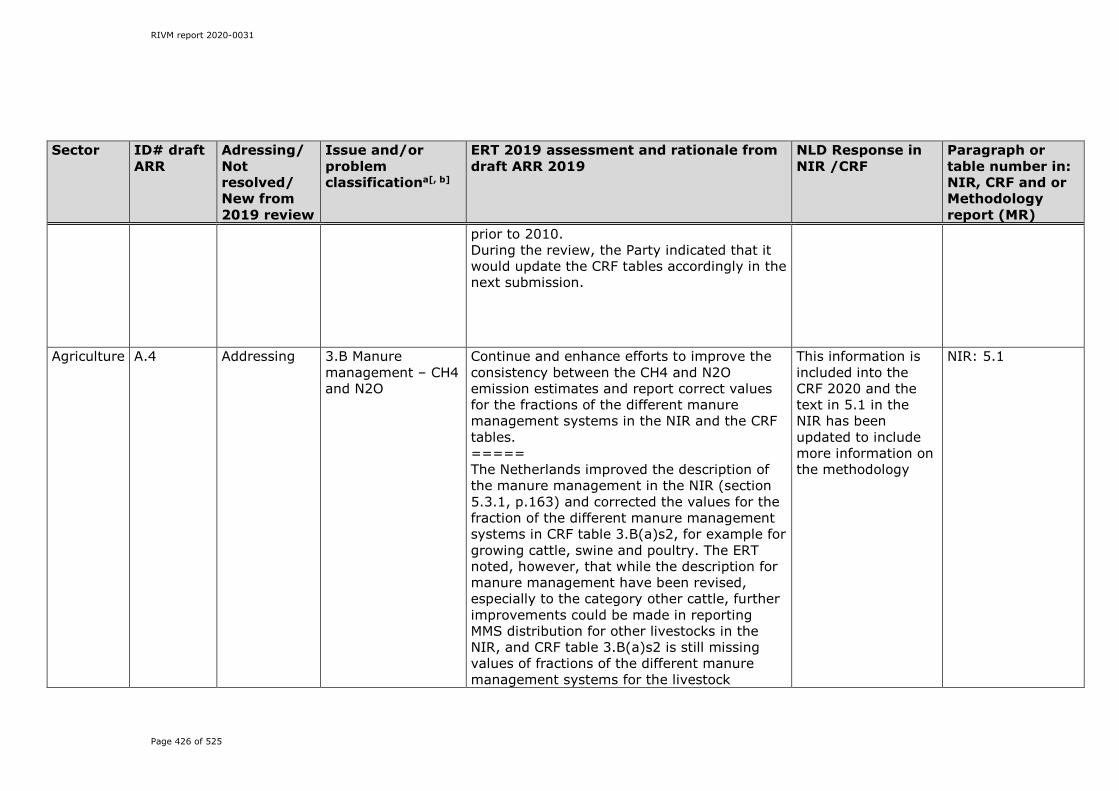
RIVM report 2020-0031
Page 426 of 525
Sector ID# draft ARR
Adressing/Not resolved/ New from 2019 review
Issue and/or problem classificationa[, b]
ERT 2019 assessment and rationale from draft ARR 2019
NLD Response in NIR /CRF
Paragraph or table number in: NIR, CRF and or Methodology report (MR)
prior to 2010. During the review, the Party indicated that it would update the CRF tables accordingly in the next submission.
Agriculture A.4 Addressing 3.B Manure management – CH4 and N2O
Continue and enhance efforts to improve the consistency between the CH4 and N2O emission estimates and report correct values for the fractions of the different manure management systems in the NIR and the CRF tables. ===== The Netherlands improved the description of the manure management in the NIR (section 5.3.1, p.163) and corrected the values for the fraction of the different manure management systems in CRF table 3.B(a)s2, for example for growing cattle, swine and poultry. The ERT noted, however, that while the description for manure management have been revised, especially to the category other cattle, further improvements could be made in reporting MMS distribution for other livestocks in the NIR, and CRF table 3.B(a)s2 is still missing values of fractions of the different manure management systems for the livestock
This information is included into the CRF 2020 and the text in 5.1 in the NIR has been updated to include more information on the methodology
NIR: 5.1
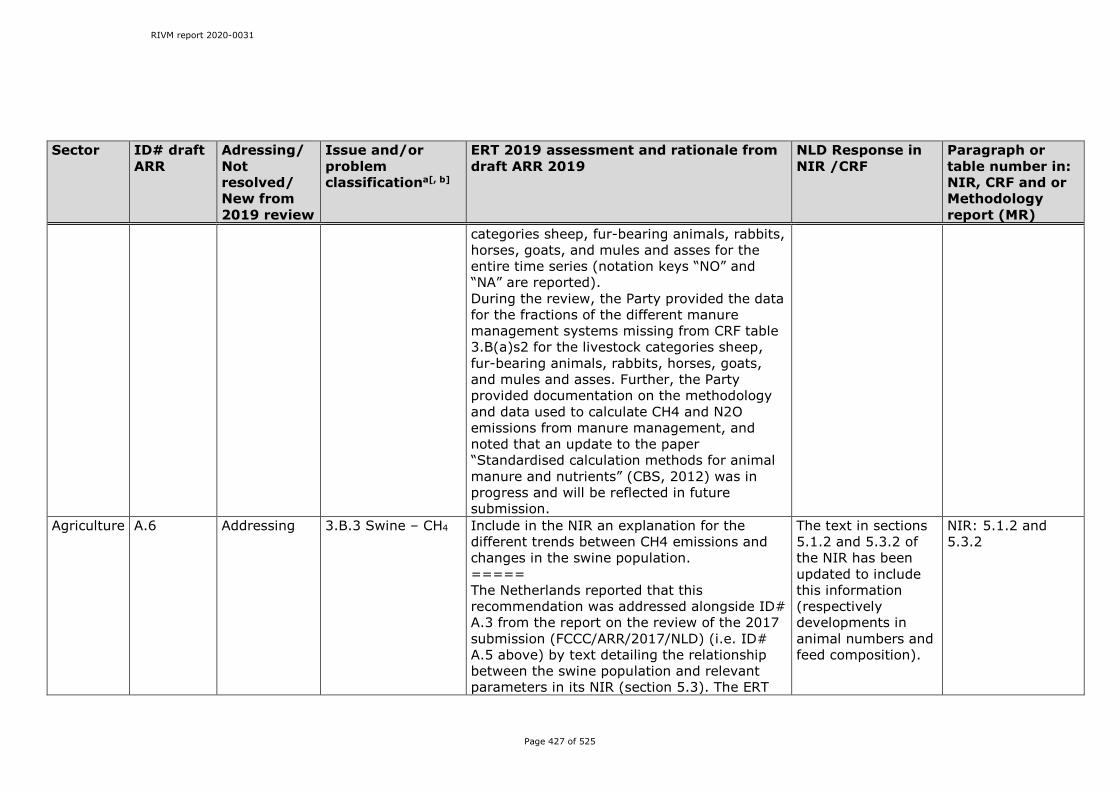
RIVM report 2020-0031
Page 427 of 525
Sector ID# draft ARR
Adressing/Not resolved/ New from 2019 review
Issue and/or problem classificationa[, b]
ERT 2019 assessment and rationale from draft ARR 2019
NLD Response in NIR /CRF
Paragraph or table number in: NIR, CRF and or Methodology report (MR)
categories sheep, fur-bearing animals, rabbits, horses, goats, and mules and asses for the entire time series (notation keys “NO” and “NA” are reported). During the review, the Party provided the data for the fractions of the different manure management systems missing from CRF table 3.B(a)s2 for the livestock categories sheep, fur-bearing animals, rabbits, horses, goats, and mules and asses. Further, the Party provided documentation on the methodology and data used to calculate CH4 and N2O emissions from manure management, and noted that an update to the paper “Standardised calculation methods for animal manure and nutrients” (CBS, 2012) was in progress and will be reflected in future submission.
Agriculture A.6 Addressing 3.B.3 Swine – CH4 Include in the NIR an explanation for the different trends between CH4 emissions and changes in the swine population. ===== The Netherlands reported that this recommendation was addressed alongside ID# A.3 from the report on the review of the 2017 submission (FCCC/ARR/2017/NLD) (i.e. ID# A.5 above) by text detailing the relationship between the swine population and relevant parameters in its NIR (section 5.3). The ERT
The text in sections 5.1.2 and 5.3.2 of the NIR has been updated to include this information (respectively developments in animal numbers and feed composition).
NIR: 5.1.2 and 5.3.2

RIVM report 2020-0031
Page 428 of 525
Sector ID# draft ARR
Adressing/Not resolved/ New from 2019 review
Issue and/or problem classificationa[, b]
ERT 2019 assessment and rationale from draft ARR 2019
NLD Response in NIR /CRF
Paragraph or table number in: NIR, CRF and or Methodology report (MR)
noted, however, that the information on the swine population does not fully explain the trend in CH4 emissions from swine. During the review, the Party explained that the adult swine population had remained stable, as indicated in the NIR, however, the number of piglets born has been increasing (by 8 per cent) and these piglets are accounted for in the calculation of the IEF which results in decreasing trend of the IEF results. The ERT considers that the issue could be resolved if this information were provided in the NIR.
Agriculture A.8 Not Resolved 3.D Direct and indirect N2O emissions from agricultural soils –N2O
Include in the NIR numeric data on annual removal of agricultural crop residues. ===== The Netherlands reported in its NIR (annex 10, p.388) that data on the removal of agricultural crop residues are in van Bruggen et al. (2017, table 3.4, p.45). The ERT noted, however, that the methodology report submitted with the NIR was Lagerwerf et al. (2019) and there is no table 3.4 on page 44 of Lagerwerf et al. (2019). Therefore, the information cannot be found. During the review, the Party provided the draft paper of van Bruggen et al. (2017), which contains the required numeric data on the annual removal of agricultural crop residues.
The text in 5.4.1 in the NIR has been updated to include this information. Please note the ammount of crop residues is reported in the CRF reporter
NIR: 5.4.1 CRF 3.D.1.4.

RIVM report 2020-0031
Page 429 of 525
Sector ID# draft ARR
Adressing/Not resolved/ New from 2019 review
Issue and/or problem classificationa[, b]
ERT 2019 assessment and rationale from draft ARR 2019
NLD Response in NIR /CRF
Paragraph or table number in: NIR, CRF and or Methodology report (MR)
The ERT considers that this issue could be resolved if the papers containing the data were correctly referenced in the NIR and the links between the van Bruggen et al. (2017) and Lagerwerf et al. (2019) papers described clearly in the NIR.
Agriculture A.9 Addressing 3.D.a Direct N2O emissions from managed soils – N2O
Include in the NIR the method and related parameters used to derive country-specific Nex and Fraction of livestock N excreted and deposited onto soil during grazing (FracGRAZ).\ ===== The Netherlands reported that the method and parameters used for deriving the country-specific Nex are described in CBS (2012), a yearly update of which is published (in Dutch), with van Bruggen et al. (2017) being the most recent update. The ERT noted that the method and parameters used for deriving the country-specific Nex are not in the NIR or the methodology report submitted with the Party’s submission, but some links describing the country specific method that is use to calculate the N-excretion are provided in annex 10 of the NIR. During the review, the Party supplied the link
The text in 5.1 in the NIR has been updated with references to the requested information. Please note that the CRF reporter also holds (part of this information)
NIR: 5.1
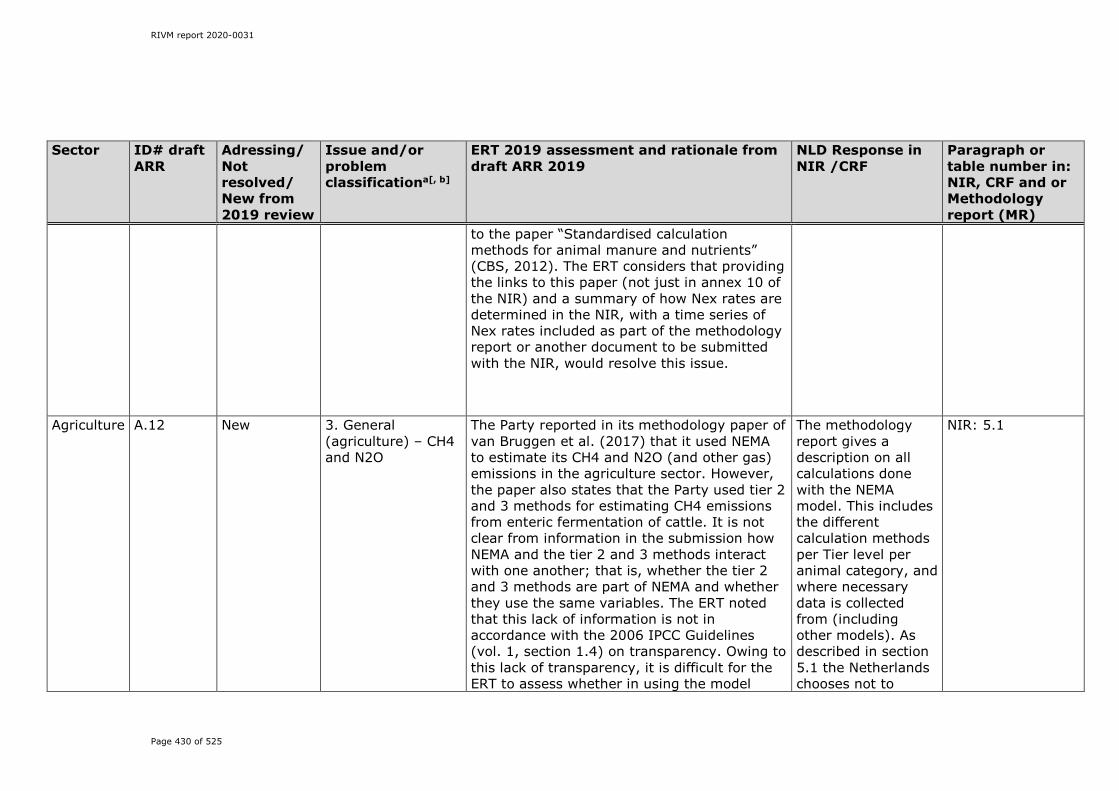
RIVM report 2020-0031
Page 430 of 525
Sector ID# draft ARR
Adressing/Not resolved/ New from 2019 review
Issue and/or problem classificationa[, b]
ERT 2019 assessment and rationale from draft ARR 2019
NLD Response in NIR /CRF
Paragraph or table number in: NIR, CRF and or Methodology report (MR)
to the paper “Standardised calculation methods for animal manure and nutrients” (CBS, 2012). The ERT considers that providing the links to this paper (not just in annex 10 of the NIR) and a summary of how Nex rates are determined in the NIR, with a time series of Nex rates included as part of the methodology report or another document to be submitted with the NIR, would resolve this issue.
Agriculture A.12 New 3. General (agriculture) – CH4 and N2O
The Party reported in its methodology paper of van Bruggen et al. (2017) that it used NEMA to estimate its CH4 and N2O (and other gas) emissions in the agriculture sector. However, the paper also states that the Party used tier 2 and 3 methods for estimating CH4 emissions from enteric fermentation of cattle. It is not clear from information in the submission how NEMA and the tier 2 and 3 methods interact with one another; that is, whether the tier 2 and 3 methods are part of NEMA and whether they use the same variables. The ERT noted that this lack of information is not in accordance with the 2006 IPCC Guidelines (vol. 1, section 1.4) on transparency. Owing to this lack of transparency, it is difficult for the ERT to assess whether in using the model
The methodology report gives a description on all calculations done with the NEMA model. This includes the different calculation methods per Tier level per animal category, and where necessary data is collected from (including other models). As described in section 5.1 the Netherlands chooses not to
NIR: 5.1
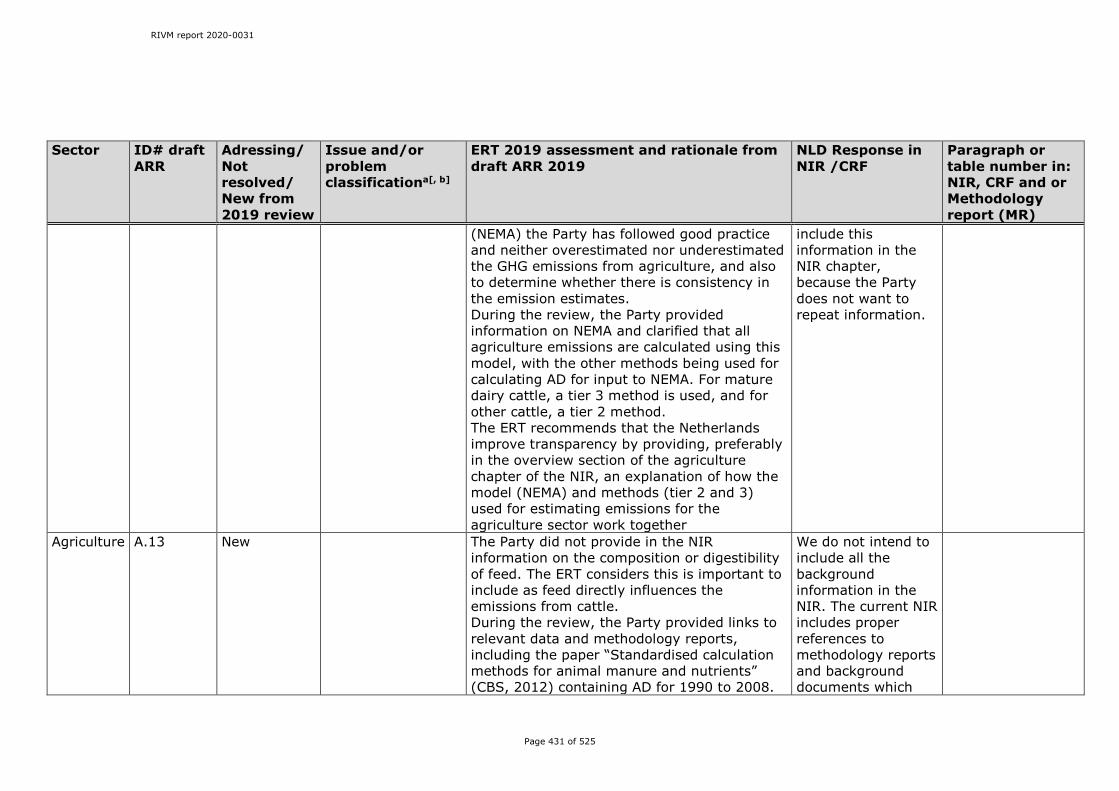
RIVM report 2020-0031
Page 431 of 525
Sector ID# draft ARR
Adressing/Not resolved/ New from 2019 review
Issue and/or problem classificationa[, b]
ERT 2019 assessment and rationale from draft ARR 2019
NLD Response in NIR /CRF
Paragraph or table number in: NIR, CRF and or Methodology report (MR)
(NEMA) the Party has followed good practice and neither overestimated nor underestimated the GHG emissions from agriculture, and also to determine whether there is consistency in the emission estimates. During the review, the Party provided information on NEMA and clarified that all agriculture emissions are calculated using this model, with the other methods being used for calculating AD for input to NEMA. For mature dairy cattle, a tier 3 method is used, and for other cattle, a tier 2 method. The ERT recommends that the Netherlands improve transparency by providing, preferably in the overview section of the agriculture chapter of the NIR, an explanation of how the model (NEMA) and methods (tier 2 and 3) used for estimating emissions for the agriculture sector work together
include this information in the NIR chapter, because the Party does not want to repeat information.
Agriculture A.13 New The Party did not provide in the NIR information on the composition or digestibility of feed. The ERT considers this is important to include as feed directly influences the emissions from cattle. During the review, the Party provided links to relevant data and methodology reports, including the paper “Standardised calculation methods for animal manure and nutrients” (CBS, 2012) containing AD for 1990 to 2008.
We do not intend to include all the background information in the NIR. The current NIR includes proper references to methodology reports and background documents which
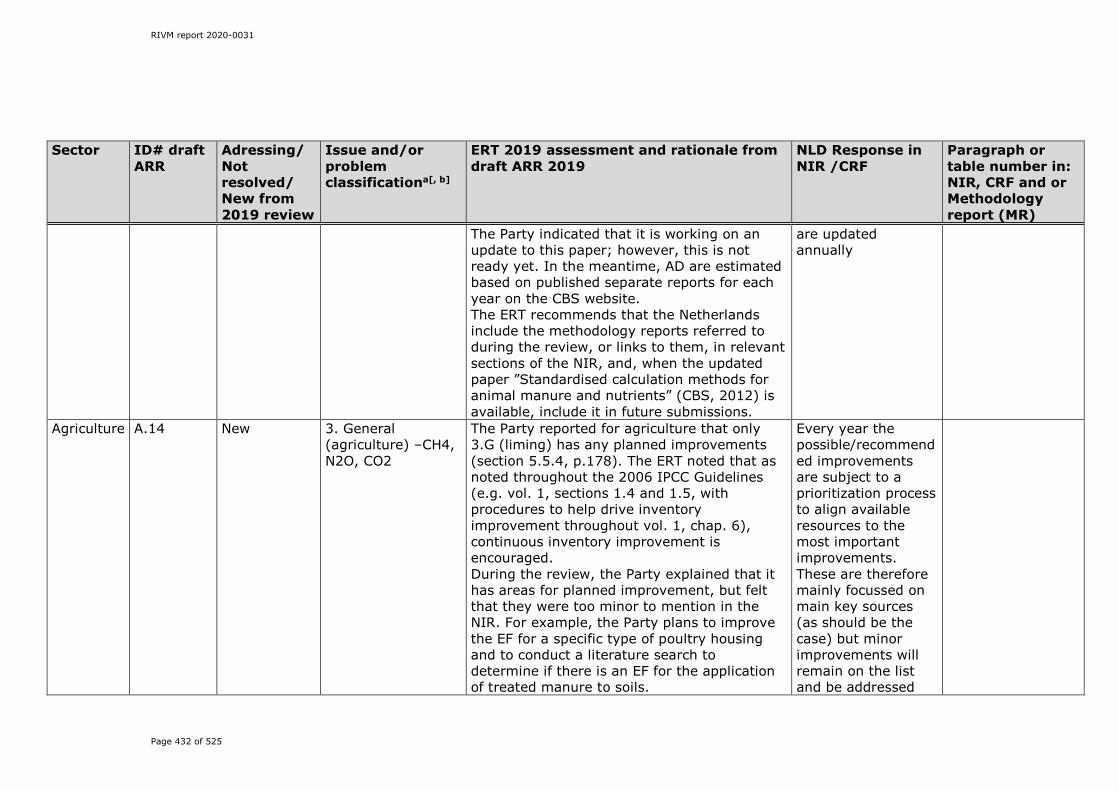
RIVM report 2020-0031
Page 432 of 525
Sector ID# draft ARR
Adressing/Not resolved/ New from 2019 review
Issue and/or problem classificationa[, b]
ERT 2019 assessment and rationale from draft ARR 2019
NLD Response in NIR /CRF
Paragraph or table number in: NIR, CRF and or Methodology report (MR)
The Party indicated that it is working on an update to this paper; however, this is not ready yet. In the meantime, AD are estimated based on published separate reports for each year on the CBS website. The ERT recommends that the Netherlands include the methodology reports referred to during the review, or links to them, in relevant sections of the NIR, and, when the updated paper ”Standardised calculation methods for animal manure and nutrients” (CBS, 2012) is available, include it in future submissions.
are updated annually
Agriculture A.14 New 3. General (agriculture) –CH4, N2O, CO2
The Party reported for agriculture that only 3.G (liming) has any planned improvements (section 5.5.4, p.178). The ERT noted that as noted throughout the 2006 IPCC Guidelines (e.g. vol. 1, sections 1.4 and 1.5, with procedures to help drive inventory improvement throughout vol. 1, chap. 6), continuous inventory improvement is encouraged. During the review, the Party explained that it has areas for planned improvement, but felt that they were too minor to mention in the NIR. For example, the Party plans to improve the EF for a specific type of poultry housing and to conduct a literature search to determine if there is an EF for the application of treated manure to soils.
Every year the possible/recommended improvements are subject to a prioritization process to align available resources to the most important improvements. These are therefore mainly focussed on main key sources (as should be the case) but minor improvements will remain on the list and be addressed
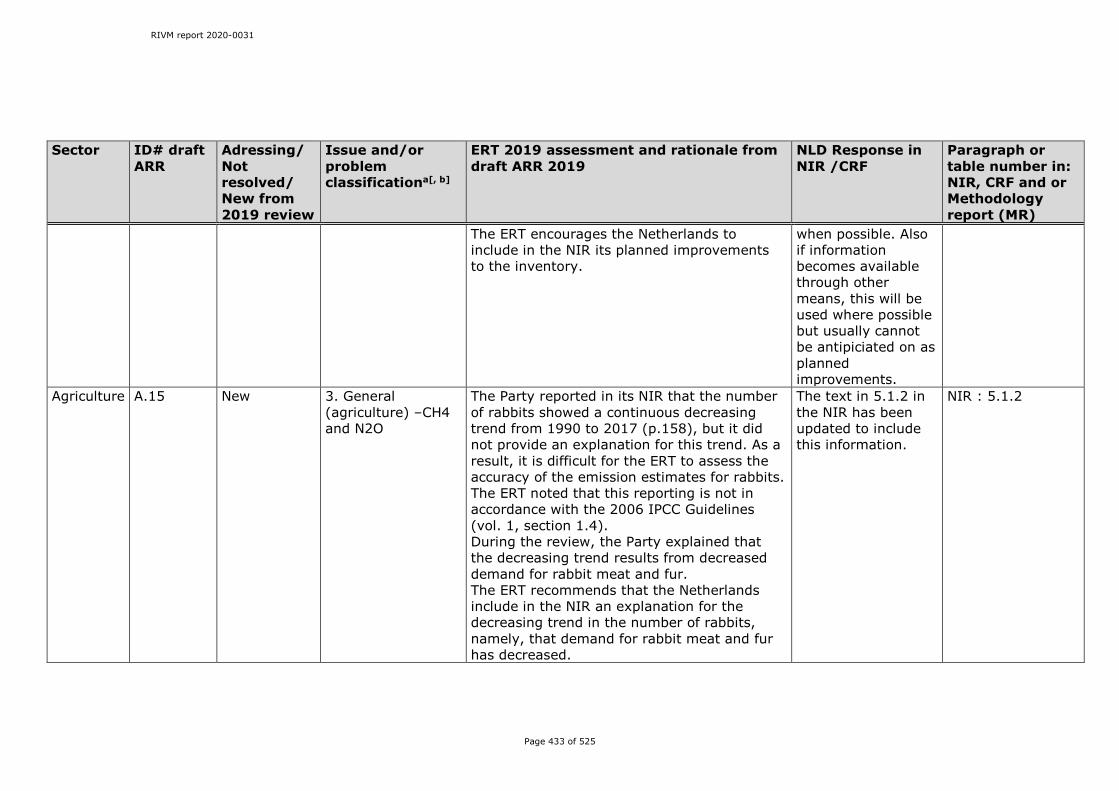
RIVM report 2020-0031
Page 433 of 525
Sector ID# draft ARR
Adressing/Not resolved/ New from 2019 review
Issue and/or problem classificationa[, b]
ERT 2019 assessment and rationale from draft ARR 2019
NLD Response in NIR /CRF
Paragraph or table number in: NIR, CRF and or Methodology report (MR)
The ERT encourages the Netherlands to include in the NIR its planned improvements to the inventory.
when possible. Also if information becomes available through other means, this will be used where possible but usually cannot be antipiciated on as planned improvements.
Agriculture A.15 New 3. General (agriculture) –CH4 and N2O
The Party reported in its NIR that the number of rabbits showed a continuous decreasing trend from 1990 to 2017 (p.158), but it did not provide an explanation for this trend. As a result, it is difficult for the ERT to assess the accuracy of the emission estimates for rabbits. The ERT noted that this reporting is not in accordance with the 2006 IPCC Guidelines (vol. 1, section 1.4). During the review, the Party explained that the decreasing trend results from decreased demand for rabbit meat and fur. The ERT recommends that the Netherlands include in the NIR an explanation for the decreasing trend in the number of rabbits, namely, that demand for rabbit meat and fur has decreased.
The text in 5.1.2 in the NIR has been updated to include this information.
NIR : 5.1.2
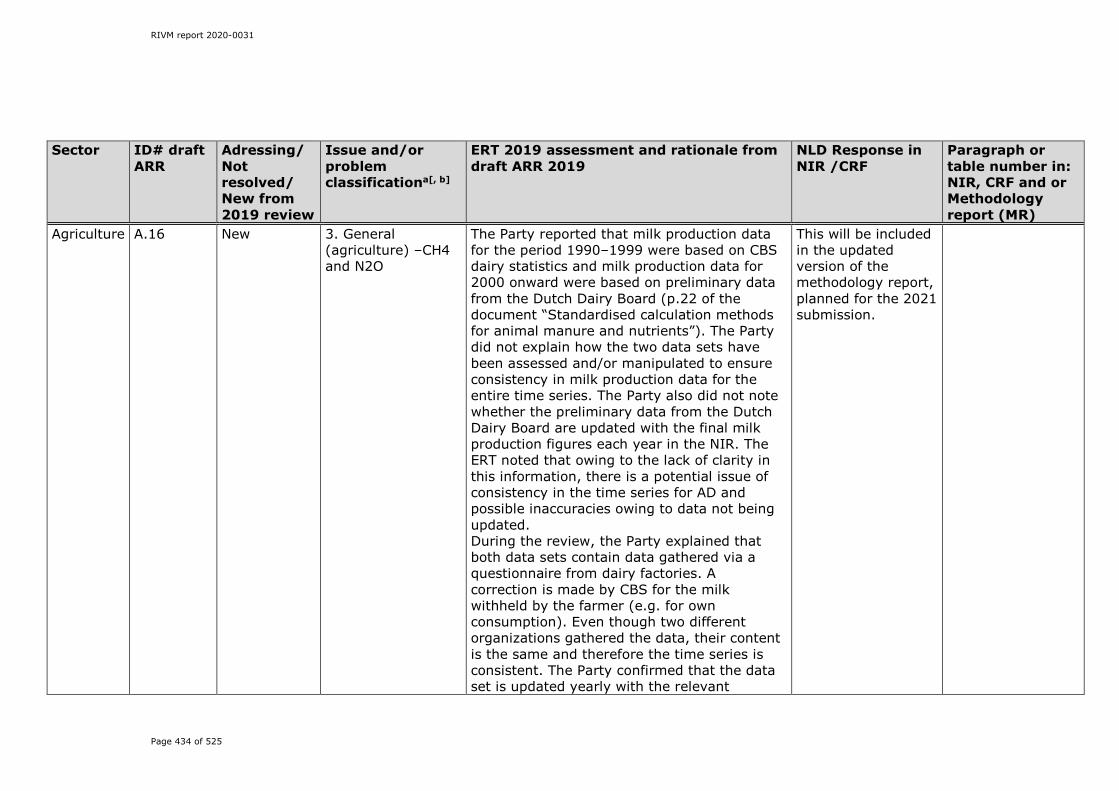
RIVM report 2020-0031
Page 434 of 525
Sector ID# draft ARR
Adressing/Not resolved/ New from 2019 review
Issue and/or problem classificationa[, b]
ERT 2019 assessment and rationale from draft ARR 2019
NLD Response in NIR /CRF
Paragraph or table number in: NIR, CRF and or Methodology report (MR)
Agriculture A.16 New 3. General (agriculture) –CH4 and N2O
The Party reported that milk production data for the period 1990–1999 were based on CBS dairy statistics and milk production data for 2000 onward were based on preliminary data from the Dutch Dairy Board (p.22 of the document “Standardised calculation methods for animal manure and nutrients”). The Party did not explain how the two data sets have been assessed and/or manipulated to ensure consistency in milk production data for the entire time series. The Party also did not note whether the preliminary data from the Dutch Dairy Board are updated with the final milk production figures each year in the NIR. The ERT noted that owing to the lack of clarity in this information, there is a potential issue of consistency in the time series for AD and possible inaccuracies owing to data not being updated. During the review, the Party explained that both data sets contain data gathered via a questionnaire from dairy factories. A correction is made by CBS for the milk withheld by the farmer (e.g. for own consumption). Even though two different organizations gathered the data, their content is the same and therefore the time series is consistent. The Party confirmed that the data set is updated yearly with the relevant
This will be included in the updated version of the methodology report, planned for the 2021 submission.

RIVM report 2020-0031
Page 435 of 525
Sector ID# draft ARR
Adressing/Not resolved/ New from 2019 review
Issue and/or problem classificationa[, b]
ERT 2019 assessment and rationale from draft ARR 2019
NLD Response in NIR /CRF
Paragraph or table number in: NIR, CRF and or Methodology report (MR)
production figures. The ERT recommends that the Netherlands include in the NIR the explanation on how the two data sets on milk production, that based on CBS dairy statistics and that based on Dutch Dairy Board data, have been assessed and/or manipulated to ensure consistency in milk production data for the entire time series. The ERT also recommends that the Party confirm that the data set on milk porduction is updated yearly with the final production figures and that the previous year’s estimates are recalculated accordingly, if appropriate.
Agriculture A.17 New 3. General (agriculture) –CH4 and N2O
The Party did not report any emissions from alpacas and lamas, and stated in the NIR that these animals are not kept commercially in the country (p.33). However, there are several sources of information indicating there are alpacas in the Netherlands; for example, https://www.alpaca-benelux.com/ (in Dutch), https://dutchreview.com/news/weird/number-of-alpacas-in-the-netherlands-has-doubled-in-five-years/ and https://gracielahuam.com/en/diary/the-alpaca-industry-in-the-netherlands/. During the review, the Party noted that according to CBS, there are no alpacas and lamas in the Netherlands.
The Party will not deviate from the national statistics, as is recommended in the guidelines. Therefore as long as the Statistics Netherlands (CBS) concludes that there are no alpaca's in the Netherlands for agricultural purpose, no alpaca's will be included into the CRF.

RIVM report 2020-0031
Page 436 of 525
Sector ID# draft ARR
Adressing/Not resolved/ New from 2019 review
Issue and/or problem classificationa[, b]
ERT 2019 assessment and rationale from draft ARR 2019
NLD Response in NIR /CRF
Paragraph or table number in: NIR, CRF and or Methodology report (MR)
The ERT, noting there is some evidence that there may now be alpaca farms in the Netherlands, recommends that the Party investigate the issue of the existence of alpacas and lamas in the country and, if relevant, estimate emissions or justify in accordance with para. 37(b) of the UNFCCC annex I inventory reporting GLs that the emissions are insignificant.
Agriculture A.18 New 3. General (agriculture) – CH4 and N2O
The Party reported “NE” and “NA” for typical animal mass (cattle) in CRF table 3.As2. During the review, the Party explained that it uses a country-specific calculation method for animal mass, which results in the use of multiple weights for more animal categories than are present in the CRF tables. The data used are too complex to average to a single value. Therefore an average value is not included in the CRF tables. However, the ERT notes the paper “Standardised calculation methods for animal manure and nutrients” (CBS, 2012) provided to the ERT during the review includes average weights for the three cattle categories. The ERT recognizes that in tier 2 and 3 methods the disaggregation of animal categories and the methodology used can be complex, meaning that averages are often not simple to obtain. However, the ERT noted that averages can be important for
See issue A.30, although likely this is an unintended repetition (the only CO2 emssions related to Agriculture are from 3.G Liming which has no direct relation to average animal weight).

RIVM report 2020-0031
Page 437 of 525
Sector ID# draft ARR
Adressing/Not resolved/ New from 2019 review
Issue and/or problem classificationa[, b]
ERT 2019 assessment and rationale from draft ARR 2019
NLD Response in NIR /CRF
Paragraph or table number in: NIR, CRF and or Methodology report (MR)
comparison with other countries, and for understanding the factors underlying the values of country-specific EFs. In response, the Party indicated that it would investigate whether it is possible to include these typical animal mass data in the CRF tables for the 2020 submission and whether the data are representative. The ERT recommends that the Netherlands investigate if representative averages of cattle weight can be estimated and if so, provide these estimates in the NIR and in CRF table 3.As2 in order to improve comparability.

RIVM report 2020-0031
Page 438 of 525
Sector ID# draft ARR
Adressing/Not resolved/ New from 2019 review
Issue and/or problem classificationa[, b]
ERT 2019 assessment and rationale from draft ARR 2019
NLD Response in NIR /CRF
Paragraph or table number in: NIR, CRF and or Methodology report (MR)
Agriculture A.19 New 3. General (agriculture)
The Party reported in its NIR (p.162, 170, 176, 178) that there are no category-specific QA/QC and verification procedures for the agriculture sector as all procedures are included in the general QA/QC procedures discussed in chapter 1. The ERT determined, however, there appear to be no category-specific procedures in chapter 1. The ERT noted that the lack of category-specific QA/QC procedures is not good practice and is not in accordance with the 2006 IPCC Guidelines (vol. 1, chap. 6). During the review, the Party explained that the Pollutant Release and Transfer Register has a general QA/QC approach, including verification of any methodology changes, data integrity checks and collegial cross-checking. The NIR and CRF tables are peer reviewed and subject to a system of audits performed by the national inventory entity. Both this entity and institutions contributing to the Pollutant Release and Transfer Register must approve the data set used in the estimations before its publication. The Party feels that given these mechanisms, additional category-specific procedures are not needed. The ERT, in part on the basis of the evidence provided by issues that have been raised during this review, does not agree with the Party’s assessment. The 2006 IPCC Guidelines define QC as “a system of routine technical activities to assess and maintain the quality of the inventory as it is being compiled. It is performed by personnel compiling the inventory” (vol. 1, section 6.5), and state that
Besides the general QA/QC described in section 1.2.3 of the NIR, annex 11 of the methodology report (Lagerwerf et al., 2019) gives some category-specific information. It will be considered whether this description can be expanded upon in the update foreseen for the 2021 submission.
NIR: 1.2.3 and MR: annex 11
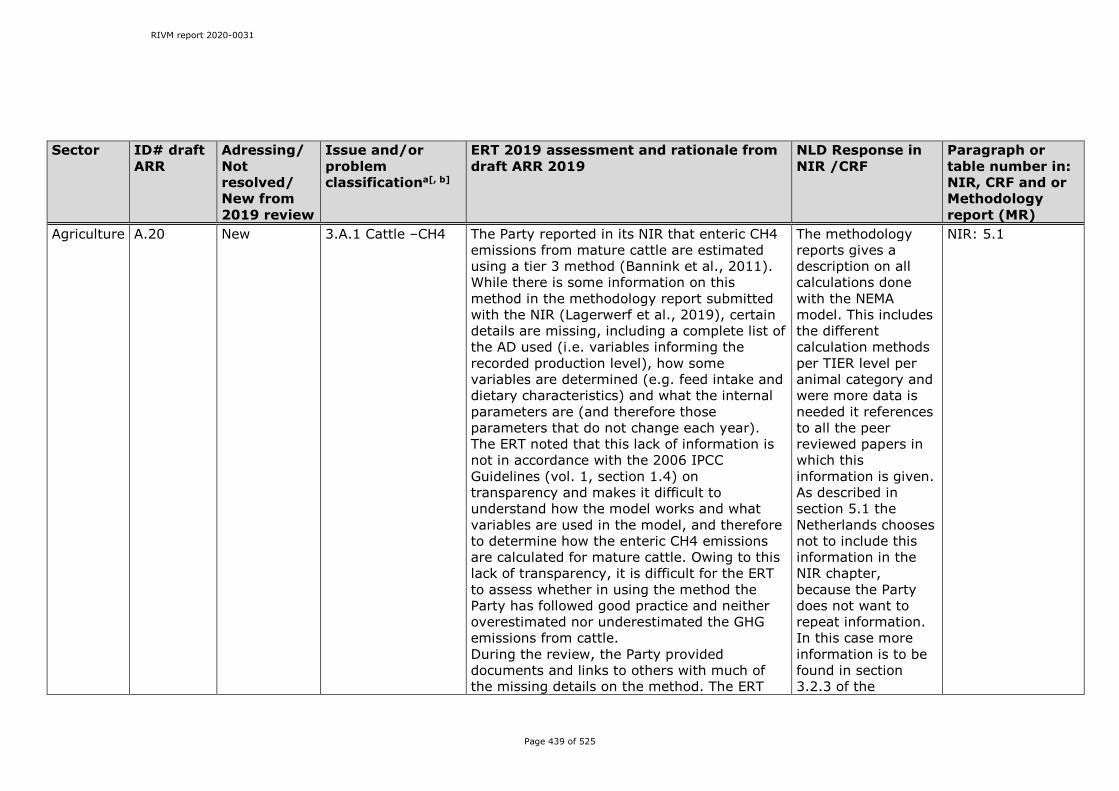
RIVM report 2020-0031
Page 439 of 525
Sector ID# draft ARR
Adressing/Not resolved/ New from 2019 review
Issue and/or problem classificationa[, b]
ERT 2019 assessment and rationale from draft ARR 2019
NLD Response in NIR /CRF
Paragraph or table number in: NIR, CRF and or Methodology report (MR)
Agriculture A.20 New 3.A.1 Cattle –CH4 The Party reported in its NIR that enteric CH4 emissions from mature cattle are estimated using a tier 3 method (Bannink et al., 2011). While there is some information on this method in the methodology report submitted with the NIR (Lagerwerf et al., 2019), certain details are missing, including a complete list of the AD used (i.e. variables informing the recorded production level), how some variables are determined (e.g. feed intake and dietary characteristics) and what the internal parameters are (and therefore those parameters that do not change each year). The ERT noted that this lack of information is not in accordance with the 2006 IPCC Guidelines (vol. 1, section 1.4) on transparency and makes it difficult to understand how the model works and what variables are used in the model, and therefore to determine how the enteric CH4 emissions are calculated for mature cattle. Owing to this lack of transparency, it is difficult for the ERT to assess whether in using the method the Party has followed good practice and neither overestimated nor underestimated the GHG emissions from cattle. During the review, the Party provided documents and links to others with much of the missing details on the method. The ERT
The methodology reports gives a description on all calculations done with the NEMA model. This includes the different calculation methods per TIER level per animal category and were more data is needed it references to all the peer reviewed papers in which this information is given. As described in section 5.1 the Netherlands chooses not to include this information in the NIR chapter, because the Party does not want to repeat information. In this case more information is to be found in section 3.2.3 of the
NIR: 5.1

RIVM report 2020-0031
Page 440 of 525
Sector ID# draft ARR
Adressing/Not resolved/ New from 2019 review
Issue and/or problem classificationa[, b]
ERT 2019 assessment and rationale from draft ARR 2019
NLD Response in NIR /CRF
Paragraph or table number in: NIR, CRF and or Methodology report (MR)
noted that while references to these documents were in the Party’s NIR, it is important that enough information be included in the NIR itself to allow readers a basic understanding of the more complex models and methods used. If readers require more technical information, they can consult the references. The ERT recommends that the Netherlands include details on the tier 3 method it uses for estimating emissions from mature dairy cattle in the methodology report submitted with its NIR, including: (a) The assumptions made concerning the degradation characteristics of starch, crude protein and fibre, and where any data used are sourced from; (b) The calculations prepared by working group on uniformity of calculations for manure and mineral data to determine dry matter intake, including the equations and variables and where these have been sourced from; (c) The variables informing the recorded production level and where these are sourced from; (d) The internal parameters (and therefore those parameters that do not change each year) and how they were determined; (e) How the variables used in the enteric
methodology report (Lagerwerf et al., 2019) and the background document by Bannink (2011).
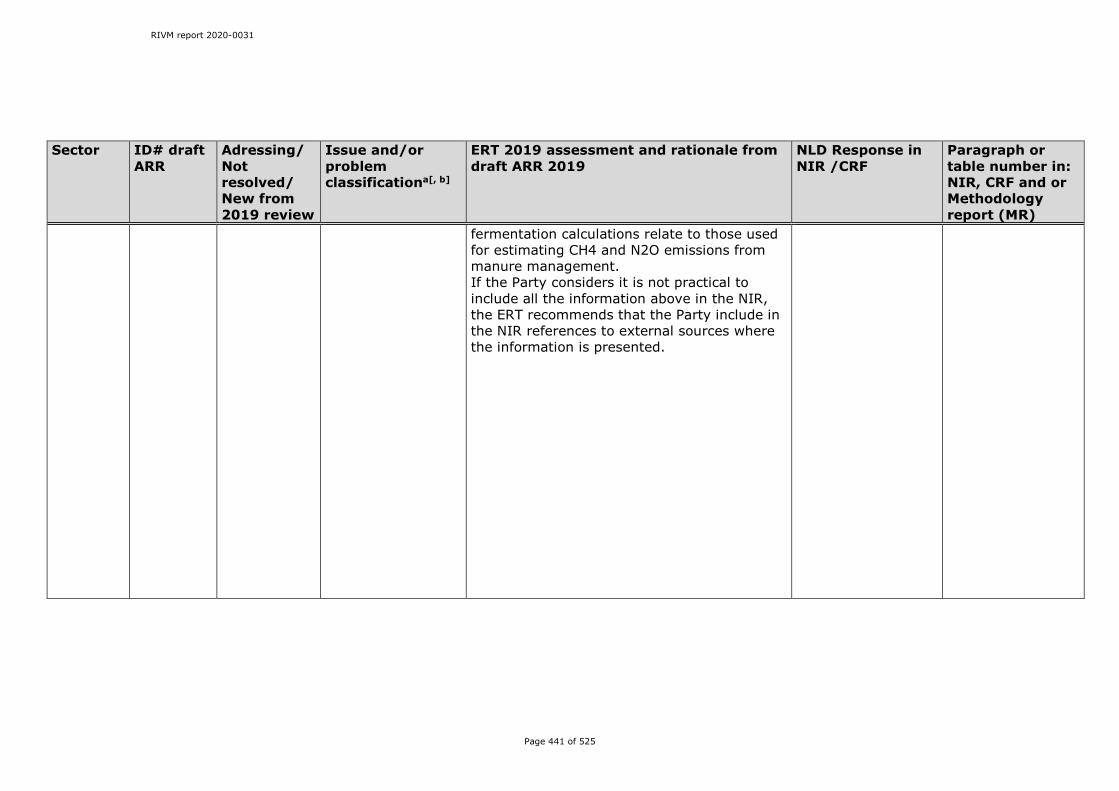
RIVM report 2020-0031
Page 441 of 525
Sector ID# draft ARR
Adressing/Not resolved/ New from 2019 review
Issue and/or problem classificationa[, b]
ERT 2019 assessment and rationale from draft ARR 2019
NLD Response in NIR /CRF
Paragraph or table number in: NIR, CRF and or Methodology report (MR)
fermentation calculations relate to those used for estimating CH4 and N2O emissions from manure management. If the Party considers it is not practical to include all the information above in the NIR, the ERT recommends that the Party include in the NIR references to external sources where the information is presented.
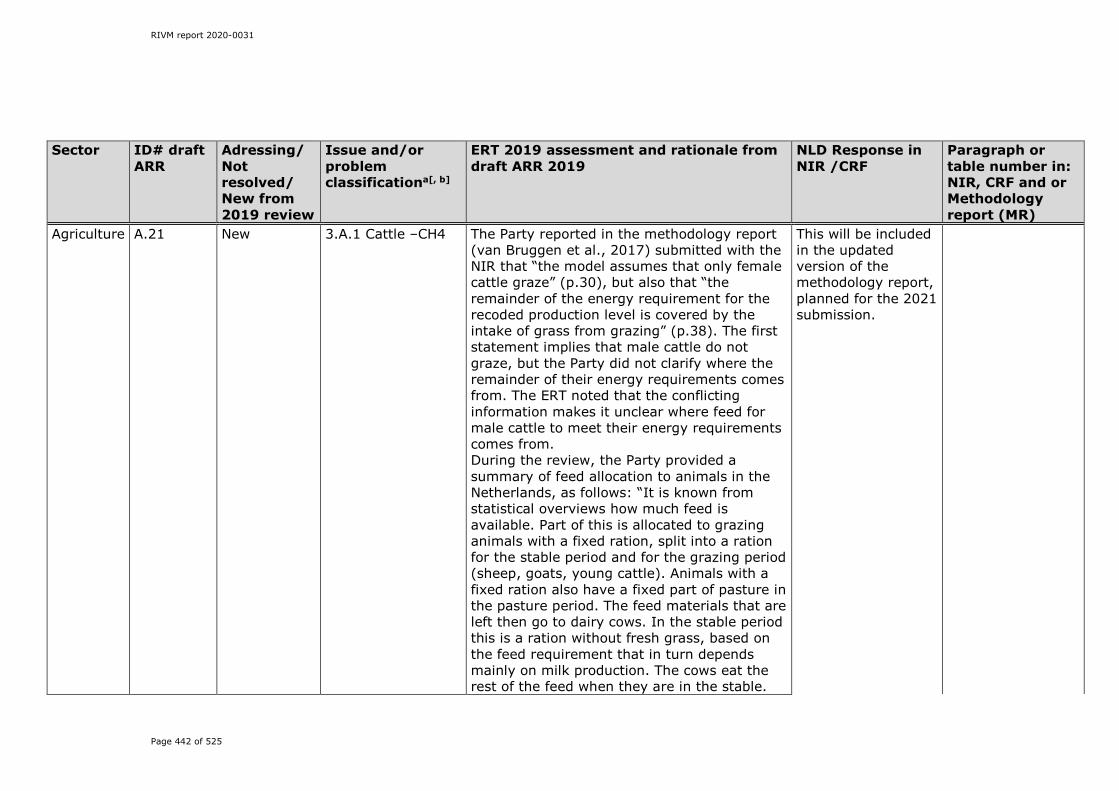
RIVM report 2020-0031
Page 442 of 525
Sector ID# draft ARR
Adressing/Not resolved/ New from 2019 review
Issue and/or problem classificationa[, b]
ERT 2019 assessment and rationale from draft ARR 2019
NLD Response in NIR /CRF
Paragraph or table number in: NIR, CRF and or Methodology report (MR)
Agriculture A.21 New 3.A.1 Cattle –CH4 The Party reported in the methodology report (van Bruggen et al., 2017) submitted with the NIR that “the model assumes that only female cattle graze” (p.30), but also that “the remainder of the energy requirement for the recoded production level is covered by the intake of grass from grazing” (p.38). The first statement implies that male cattle do not graze, but the Party did not clarify where the remainder of their energy requirements comes from. The ERT noted that the conflicting information makes it unclear where feed for male cattle to meet their energy requirements comes from. During the review, the Party provided a summary of feed allocation to animals in the Netherlands, as follows: “It is known from statistical overviews how much feed is available. Part of this is allocated to grazing animals with a fixed ration, split into a ration for the stable period and for the grazing period (sheep, goats, young cattle). Animals with a fixed ration also have a fixed part of pasture in the pasture period. The feed materials that are left then go to dairy cows. In the stable period this is a ration without fresh grass, based on the feed requirement that in turn depends mainly on milk production. The cows eat the rest of the feed when they are in the stable.
This will be included in the updated version of the methodology report, planned for the 2021 submission.
RIVM report 2020-0031
Page 443 of 525
Sector ID# draft ARR
Adressing/Not resolved/ New from 2019 review
Issue and/or problem classificationa[, b]
ERT 2019 assessment and rationale from draft ARR 2019
NLD Response in NIR /CRF
Paragraph or table number in: NIR, CRF and or Methodology report (MR)
The feed requirement that still remains (grazing time or feeding fresh grass in the stable) is provided in the form of fresh grass. For animals such as male cattle that are kept in the stables all year round, a fixed ration is used, which means there is no ‘remainder of the energy requirement’. The latter applies only to dairy cows in the pasture period.” The complete explanation can be found in the paper “Standardised calculation methods for animal manure and nutrients” (CBS, 2012). The ERT recommends that the Netherlands review the methodology report for agriculture submitted with the NIR to remove the ambiguity about feeding requirements for male cattle (the Party reported in the methodology report (van Bruggen et al., 2017) submitted with the 2019 NIR that “the model assumes that only female cattle graze” (p.30), but also that “the remainder of the energy requirement for the recoded production level is covered by the intake of grass from grazing” (p.38). The first statement implies that male cattle do not graze, but the Party did not clarify where the remainder of their energy requirements comes from. During the 2019 review, the Party provided a summary of feed allocation to animals in the Netherlands, as follows: “It is known from statistical

RIVM report 2020-0031
Page 444 of 525
Sector ID# draft ARR
Adressing/Not resolved/ New from 2019 review
Issue and/or problem classificationa[, b]
ERT 2019 assessment and rationale from draft ARR 2019
NLD Response in NIR /CRF
Paragraph or table number in: NIR, CRF and or Methodology report (MR)
overviews how much feed is available. Part of this is allocated to grazing animals with a fixed ration, split into a ration for the stable period and for the grazing period (sheep, goats, young cattle). Animals with a fixed ration also have a fixed part of pasture in the pasture period. The feed materials that are left then go to dairy cows. In the stable period this is a ration without fresh grass, based on the feed requirement that in turn depends mainly on milk production. The cows eat the rest of the feed when they are in the stable. The feed requirement that still remains (grazing time or feeding fresh grass in the stable) is provided in the form of fresh grass. For animals such as male cattle that are kept in the stables all year round, a fixed ration is used, which means there is no ‘remainder of the energy requirement’. The latter applies only to dairy cows in the pasture period.” The complete explanation can be found in the paper “Standardised calculation methods for animal manure and nutrients” (CBS, 2012)). In addition, the ERT encourages the Party to include in the NIR the summary provided to the ERT during the review to help readers understand how emissions from animals are estimated in the Netherlands.
RIVM report 2020-0031
Page 445 of 525
Sector ID# draft ARR
Adressing/Not resolved/ New from 2019 review
Issue and/or problem classificationa[, b]
ERT 2019 assessment and rationale from draft ARR 2019
NLD Response in NIR /CRF
Paragraph or table number in: NIR, CRF and or Methodology report (MR)
Agriculture A.22 New 3.A.1 Cattle – CH4 and N2O
The Party reported values for the average weight of dairy cows in table 3.10 of the paper “Standardised calculation methods for animal manure and nutrients” (CBS, 2012). These values are constant for the entire time series. The Party did not note whether since the publication of the paper this weight has been reassessed to determine if it has been increasing. The ERT noted that reporting a constant average weight of dairy cattle based on a 2012 study without reassing if the weight has changed in later years may impact the accuracy of the estimates of the later years. Owing to the lack of transparency in how average weight of dairy cows was calculated, it is difficult for the ERT to assess whether the Party has followed good practice and neither overestimated nor underestimated the GHG emissions from cattle. As dairy cattle are a key source of emissions, and animal weight influences these emissions, it is important that the data used for estimating the emissions are accurate. During the review, the Party did not provide any specific information on this finding, but in responding to another question did note that the paper “Standardised calculation methods for animal manure and nutrients” (CBS, 2012) is being updated.
Based on mentioned figures (CBS, 2009), average weights were added to the CRF 2020 for reference. It is again emphasized, that a Tier 3 method is used to derive feed intake and thus excretions as described there.
RIVM report 2020-0031
Page 446 of 525
Sector ID# draft ARR
Adressing/Not resolved/ New from 2019 review
Issue and/or problem classificationa[, b]
ERT 2019 assessment and rationale from draft ARR 2019
NLD Response in NIR /CRF
Paragraph or table number in: NIR, CRF and or Methodology report (MR)
The ERT recommends that the Netherlands reassess its dairy cow average weight to determine if it has increased over time, and either revise the weight data in its inventory or justify the applicability of the current values. The ERT further recommends that the Party include in the NIR the results of the assessment of average dairy cow weight as well as a description of how the weight was determined from such an assessment.
Agriculture A.23 New 3.B Manure management –CH4
The Party reported in its NIR that country-specific VS values are used in the tier 2 calculation of emissions from manure management for cattle, swine and poultry (pp.166–167). However, these values were not reported in either the NIR or the supporting methodology report (van Bruggen et al., 2017). The ERT noted that not stating the VS values used in the calculation is not in accordance with the 2006 IPCC Guidelines (vol. 4, section 10.4.5). Owing to this lack of transparency, it is difficult for the ERT to assess whether in using the tier 2 method the Party has followed good practice and neither overestimated nor underestimated the GHG emissions from manure management.
As is explained in 5.1 in the NIR 2020 and again in 5.2.2 the party choses to not include all activity data in the NIR, all activity data is summarized in Van Bruggen et al. 2020. All information on CS VS can be found there.
RIVM report 2020-0031
Page 447 of 525
Sector ID# draft ARR
Adressing/Not resolved/ New from 2019 review
Issue and/or problem classificationa[, b]
ERT 2019 assessment and rationale from draft ARR 2019
NLD Response in NIR /CRF
Paragraph or table number in: NIR, CRF and or Methodology report (MR)
During the review, the Party provided links to references containing the country-specific VS values and a copy of the draft paper (van Bruggen et al., 2018) that contains the most recent VS values used in the emission calculations. The ERT recommends that the Netherlands, if the methodology report with the most recent country-specific VS values is not publicly available at the time of the NIR submission, report the VS values for that year in the NIR. In addition, the ERT encourages the Party to produce tables of the time series of the country-specific VS values so that all values are in one place and trends can be assessed.
Agriculture A.24 New 3.B Manure management – CH4
The ERT noted that further improvements could be made to increase the transparency of the submission; for example, providing the country-specific VS values used in the tier 2 calculation of emissions from manure management for cattle, swine and poultry; reporting the VS and other values used in calculating CH4 emissions from manure management in the NIR or a methodology report; and providing further information on the different manure treatments. The ERT also noted MCF values are still missing from CRF table 3.B(a)s2. During the review, the Party provided the data
The text in 5.1 in the NIR has been updated with references to the requested information. Please note that the CRF reporter also holds (part of this information)
NIR paragraph 5.1 and 5.3.1
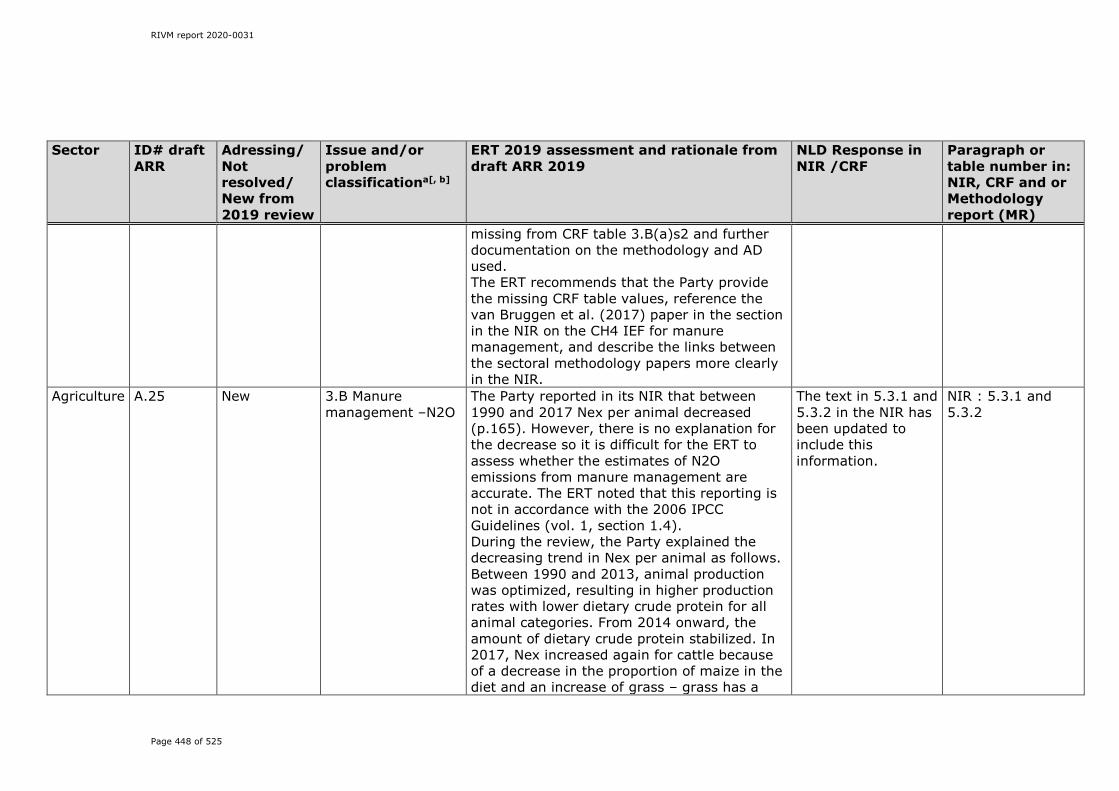
RIVM report 2020-0031
Page 448 of 525
Sector ID# draft ARR
Adressing/Not resolved/ New from 2019 review
Issue and/or problem classificationa[, b]
ERT 2019 assessment and rationale from draft ARR 2019
NLD Response in NIR /CRF
Paragraph or table number in: NIR, CRF and or Methodology report (MR)
missing from CRF table 3.B(a)s2 and further documentation on the methodology and AD used. The ERT recommends that the Party provide the missing CRF table values, reference the van Bruggen et al. (2017) paper in the section in the NIR on the CH4 IEF for manure management, and describe the links between the sectoral methodology papers more clearly in the NIR.
Agriculture A.25 New 3.B Manure management –N2O
The Party reported in its NIR that between 1990 and 2017 Nex per animal decreased (p.165). However, there is no explanation for the decrease so it is difficult for the ERT to assess whether the estimates of N2O emissions from manure management are accurate. The ERT noted that this reporting is not in accordance with the 2006 IPCC Guidelines (vol. 1, section 1.4). During the review, the Party explained the decreasing trend in Nex per animal as follows. Between 1990 and 2013, animal production was optimized, resulting in higher production rates with lower dietary crude protein for all animal categories. From 2014 onward, the amount of dietary crude protein stabilized. In 2017, Nex increased again for cattle because of a decrease in the proportion of maize in the diet and an increase of grass – grass has a
The text in 5.3.1 and 5.3.2 in the NIR has been updated to include this information.
NIR : 5.3.1 and 5.3.2
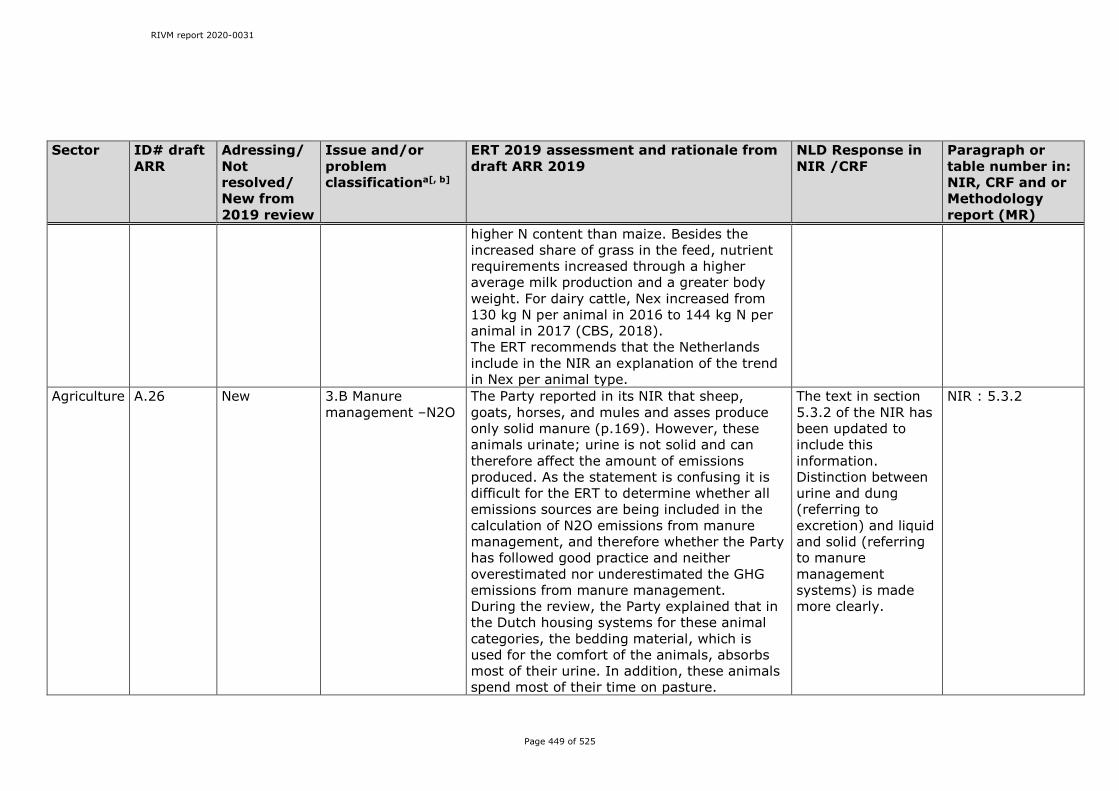
RIVM report 2020-0031
Page 449 of 525
Sector ID# draft ARR
Adressing/Not resolved/ New from 2019 review
Issue and/or problem classificationa[, b]
ERT 2019 assessment and rationale from draft ARR 2019
NLD Response in NIR /CRF
Paragraph or table number in: NIR, CRF and or Methodology report (MR)
higher N content than maize. Besides the increased share of grass in the feed, nutrient requirements increased through a higher average milk production and a greater body weight. For dairy cattle, Nex increased from 130 kg N per animal in 2016 to 144 kg N per animal in 2017 (CBS, 2018). The ERT recommends that the Netherlands include in the NIR an explanation of the trend in Nex per animal type.
Agriculture A.26 New 3.B Manure management –N2O
The Party reported in its NIR that sheep, goats, horses, and mules and asses produce only solid manure (p.169). However, these animals urinate; urine is not solid and can therefore affect the amount of emissions produced. As the statement is confusing it is difficult for the ERT to determine whether all emissions sources are being included in the calculation of N2O emissions from manure management, and therefore whether the Party has followed good practice and neither overestimated nor underestimated the GHG emissions from manure management. During the review, the Party explained that in the Dutch housing systems for these animal categories, the bedding material, which is used for the comfort of the animals, absorbs most of their urine. In addition, these animals spend most of their time on pasture.
The text in section 5.3.2 of the NIR has been updated to include this information. Distinction between urine and dung (referring to excretion) and liquid and solid (referring to manure management systems) is made more clearly.
NIR : 5.3.2
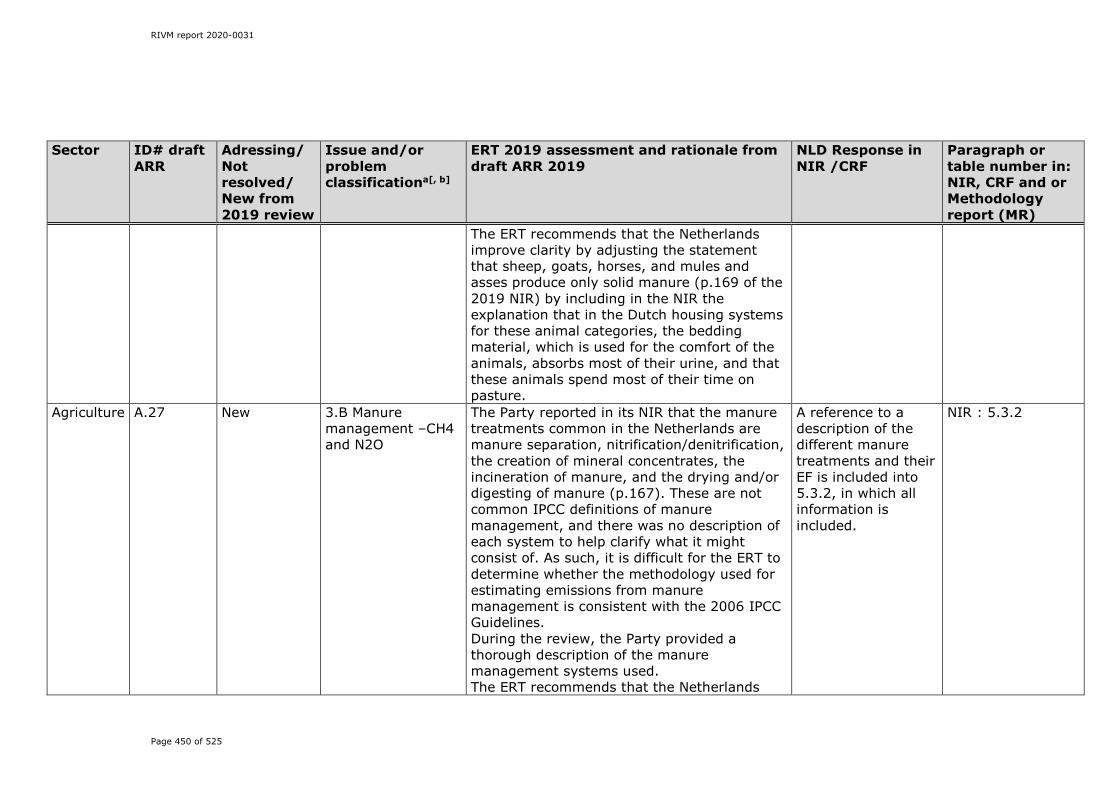
RIVM report 2020-0031
Page 450 of 525
Sector ID# draft ARR
Adressing/Not resolved/ New from 2019 review
Issue and/or problem classificationa[, b]
ERT 2019 assessment and rationale from draft ARR 2019
NLD Response in NIR /CRF
Paragraph or table number in: NIR, CRF and or Methodology report (MR)
The ERT recommends that the Netherlands improve clarity by adjusting the statement that sheep, goats, horses, and mules and asses produce only solid manure (p.169 of the 2019 NIR) by including in the NIR the explanation that in the Dutch housing systems for these animal categories, the bedding material, which is used for the comfort of the animals, absorbs most of their urine, and that these animals spend most of their time on pasture.
Agriculture A.27 New 3.B Manure management –CH4 and N2O
The Party reported in its NIR that the manure treatments common in the Netherlands are manure separation, nitrification/denitrification, the creation of mineral concentrates, the incineration of manure, and the drying and/or digesting of manure (p.167). These are not common IPCC definitions of manure management, and there was no description of each system to help clarify what it might consist of. As such, it is difficult for the ERT to determine whether the methodology used for estimating emissions from manure management is consistent with the 2006 IPCC Guidelines. During the review, the Party provided a thorough description of the manure management systems used. The ERT recommends that the Netherlands
A reference to a description of the different manure treatments and their EF is included into 5.3.2, in which all information is included.
NIR : 5.3.2

RIVM report 2020-0031
Page 451 of 525
Sector ID# draft ARR
Adressing/Not resolved/ New from 2019 review
Issue and/or problem classificationa[, b]
ERT 2019 assessment and rationale from draft ARR 2019
NLD Response in NIR /CRF
Paragraph or table number in: NIR, CRF and or Methodology report (MR)
include in the NIR a description of each of the manure management systems used in the country, those being manure separation, nitrification/denitrification, the creation of mineral concentrates, the incineration of manure, and the drying and/or digesting of manure.
Agriculture A.28 New 3.B Manure management –CH4 and N2O
The Party reported in its NIR that the methodologies used for calculating CH4 and N2O emissions from manure management are based on different AD (p.155). The ERT noted that this is not in accordance with the 2006 IPCC Guidelines (vol. 4, section 10.4.3) because the AD used should be consistent across livestock categories throughout the inventory. As there is no explanation of how consistency has been retained with the use of different AD, it is difficult for the ERT to determine if good practice has been followed. During the review, the Party clarified that for sheep, swine, goats and rabbits, when the proportion of manure (and therefore the amount of N) in each manure management system is estimated, data on all animals (adults and young) for each species are used in the calculation. Therefore, this calculated value is the absolute amount of all N excreted
The text in 5.1.2 in the NIR has been updated to include this information more clearly.
NIR : 5.1.2

RIVM report 2020-0031
Page 452 of 525
Sector ID# draft ARR
Adressing/Not resolved/ New from 2019 review
Issue and/or problem classificationa[, b]
ERT 2019 assessment and rationale from draft ARR 2019
NLD Response in NIR /CRF
Paragraph or table number in: NIR, CRF and or Methodology report (MR)
by that species that is managed in a system, and does not need to be multiplied by the animal population to calculate the absolute N2O emissions from manure management for that species. However, for CH4 emissions, a country-specific EF is used (kg CH4 per animal) and therefore needs to multiplied by the species population to calculate the absolute CH4 emissions from manure management for a species. So, while they have been used differently, the same AD on animal population (adults and young) have been used for calculating both CH4 and N2O emissions. For dairy cattle, all categories have their own values for Nex and VS. The Party noted that it would make this more clear in the NIR 2020. The ERT recommends that the Netherlands include in the NIR the information provided to the ERT during the review clarifying that the same animal population numbers are used to calculate CH4 and N2O emissions from manure management.
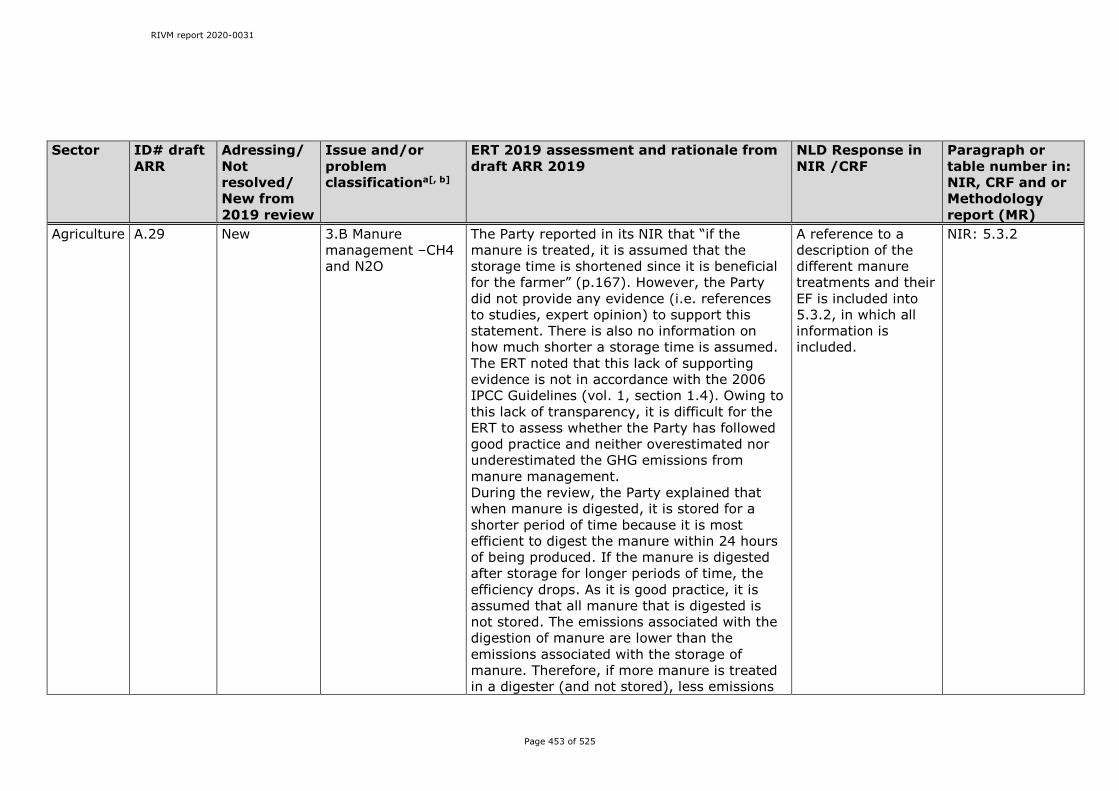
RIVM report 2020-0031
Page 453 of 525
Sector ID# draft ARR
Adressing/Not resolved/ New from 2019 review
Issue and/or problem classificationa[, b]
ERT 2019 assessment and rationale from draft ARR 2019
NLD Response in NIR /CRF
Paragraph or table number in: NIR, CRF and or Methodology report (MR)
Agriculture A.29 New 3.B Manure management –CH4 and N2O
The Party reported in its NIR that “if the manure is treated, it is assumed that the storage time is shortened since it is beneficial for the farmer” (p.167). However, the Party did not provide any evidence (i.e. references to studies, expert opinion) to support this statement. There is also no information on how much shorter a storage time is assumed. The ERT noted that this lack of supporting evidence is not in accordance with the 2006 IPCC Guidelines (vol. 1, section 1.4). Owing to this lack of transparency, it is difficult for the ERT to assess whether the Party has followed good practice and neither overestimated nor underestimated the GHG emissions from manure management. During the review, the Party explained that when manure is digested, it is stored for a shorter period of time because it is most efficient to digest the manure within 24 hours of being produced. If the manure is digested after storage for longer periods of time, the efficiency drops. As it is good practice, it is assumed that all manure that is digested is not stored. The emissions associated with the digestion of manure are lower than the emissions associated with the storage of manure. Therefore, if more manure is treated in a digester (and not stored), less emissions
A reference to a description of the different manure treatments and their EF is included into 5.3.2, in which all information is included.
NIR: 5.3.2
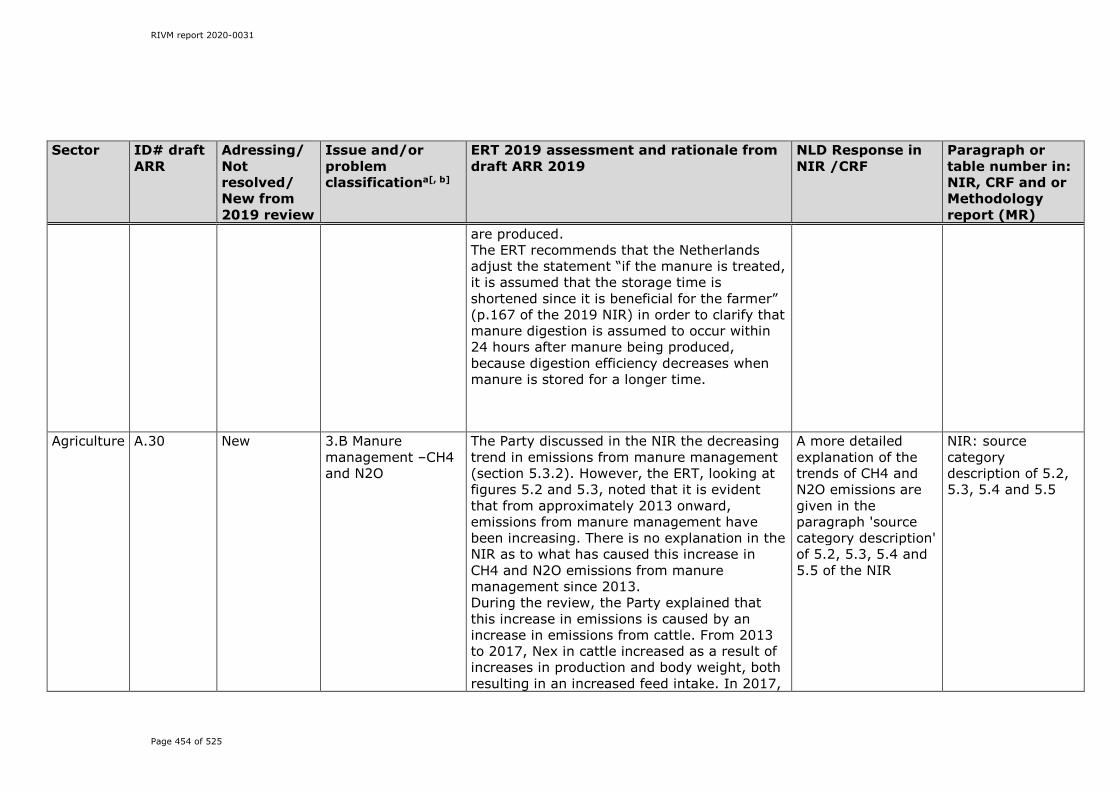
RIVM report 2020-0031
Page 454 of 525
Sector ID# draft ARR
Adressing/Not resolved/ New from 2019 review
Issue and/or problem classificationa[, b]
ERT 2019 assessment and rationale from draft ARR 2019
NLD Response in NIR /CRF
Paragraph or table number in: NIR, CRF and or Methodology report (MR)
are produced. The ERT recommends that the Netherlands adjust the statement “if the manure is treated, it is assumed that the storage time is shortened since it is beneficial for the farmer” (p.167 of the 2019 NIR) in order to clarify that manure digestion is assumed to occur within 24 hours after manure being produced, because digestion efficiency decreases when manure is stored for a longer time.
Agriculture A.30 New 3.B Manure management –CH4 and N2O
The Party discussed in the NIR the decreasing trend in emissions from manure management (section 5.3.2). However, the ERT, looking at figures 5.2 and 5.3, noted that it is evident that from approximately 2013 onward, emissions from manure management have been increasing. There is no explanation in the NIR as to what has caused this increase in CH4 and N2O emissions from manure management since 2013. During the review, the Party explained that this increase in emissions is caused by an increase in emissions from cattle. From 2013 to 2017, Nex in cattle increased as a result of increases in production and body weight, both resulting in an increased feed intake. In 2017,
A more detailed explanation of the trends of CH4 and N2O emissions are given in the paragraph 'source category description' of 5.2, 5.3, 5.4 and 5.5 of the NIR
NIR: source category description of 5.2, 5.3, 5.4 and 5.5
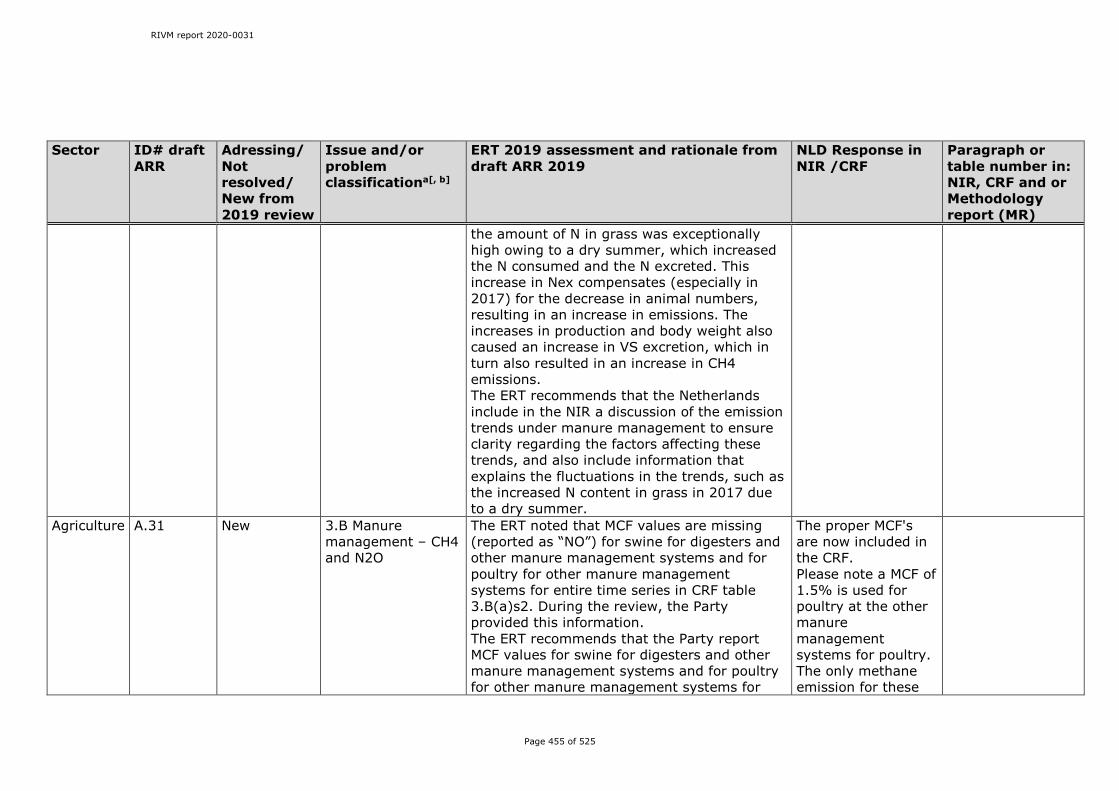
RIVM report 2020-0031
Page 455 of 525
Sector ID# draft ARR
Adressing/Not resolved/ New from 2019 review
Issue and/or problem classificationa[, b]
ERT 2019 assessment and rationale from draft ARR 2019
NLD Response in NIR /CRF
Paragraph or table number in: NIR, CRF and or Methodology report (MR)
the amount of N in grass was exceptionally high owing to a dry summer, which increased the N consumed and the N excreted. This increase in Nex compensates (especially in 2017) for the decrease in animal numbers, resulting in an increase in emissions. The increases in production and body weight also caused an increase in VS excretion, which in turn also resulted in an increase in CH4 emissions. The ERT recommends that the Netherlands include in the NIR a discussion of the emission trends under manure management to ensure clarity regarding the factors affecting these trends, and also include information that explains the fluctuations in the trends, such as the increased N content in grass in 2017 due to a dry summer.
Agriculture A.31 New 3.B Manure management – CH4 and N2O
The ERT noted that MCF values are missing (reported as “NO”) for swine for digesters and other manure management systems and for poultry for other manure management systems for entire time series in CRF table 3.B(a)s2. During the review, the Party provided this information. The ERT recommends that the Party report MCF values for swine for digesters and other manure management systems and for poultry for other manure management systems for
The proper MCF's are now included in the CRF. Please note a MCF of 1.5% is used for poultry at the other manure management systems for poultry. The only methane emission for these

RIVM report 2020-0031
Page 456 of 525
Sector ID# draft ARR
Adressing/Not resolved/ New from 2019 review
Issue and/or problem classificationa[, b]
ERT 2019 assessment and rationale from draft ARR 2019
NLD Response in NIR /CRF
Paragraph or table number in: NIR, CRF and or Methodology report (MR)
entire time series in CRF table 3.B(a)s2. systems occurs during storage of the manure.
Agriculture A.32 New 3.B.1 Cattle –CH4 and N2O
The Party reported in the methodology report (van Bruggen et al., 2017) accompanying the NIR that for cattle “all of the manure is produced in animal housing, including during the summer months” (p.25). However, on page 30, the paper indicates this applies only to female cattle. The conflicting information makes it unclear where manure was produced for male cattle. During the review, the Party provided an overview of the fractions of manure produced in animal housing and on pasture. This information clarified that all manure from male cattle was produced in a housing system, while some manure from female cattle was produced while they were grazing. The ERT recommends that the Netherlands review its methodology report for agriculture submitted with the NIR to ensure that information contained in it is internally consistent to ensure clarity, in particular when describing where manure was produced for cattle categories.
This will be included in the updated version of the methodology report, planned for the 2021 submission.

RIVM report 2020-0031
Page 457 of 525
Sector ID# draft ARR
Adressing/Not resolved/ New from 2019 review
Issue and/or problem classificationa[, b]
ERT 2019 assessment and rationale from draft ARR 2019
NLD Response in NIR /CRF
Paragraph or table number in: NIR, CRF and or Methodology report (MR)
The ERT also encourages that the Party include, in the NIR or the methodology report, the summary table provided to the ERT during the review detailing the time series of fractions of cattle manure produced in animal housing and on pasture.
Agriculture A.33 New 3.D Direct and indirect N2O emissions from agricultural soils –N2O
The Party reported in its NIR that in 2017, N2O emissions from grazing increased by about 1.3 per cent compared with 2016 and emissions from synthetic N fertilizer use increased by 3.5 per cent (p.172). Elsewhere in the NIR, however, there is a discussion of decreasing emission trends between 1990 and 2017 (p.173). There is no explanation of the increase in emissions between 2016 and 2017. During the review, the Party explained that the milk cooperatives in the country encourage farmers to have more animals on pasture, resulting in increased emissions from grazing. In addition, the summer of 2017 had extreme weather, which resulted in different uses of N fertilizer compared with other years. The Party noted that with an uncertainty of 66 per cent for grazing and 43 per cent for fertilizer use, fluctuations can be expected.
The text in 5.4.1 in the NIR has been updated to include the information about the grazing, because there a trend is emerging. However the emissions from synthetic N fertilizer decrease again, since the use of synthetic N fertilizer changes so much per year not trend can be found and there this is not included into the NIR.
NIR: 5.4.1
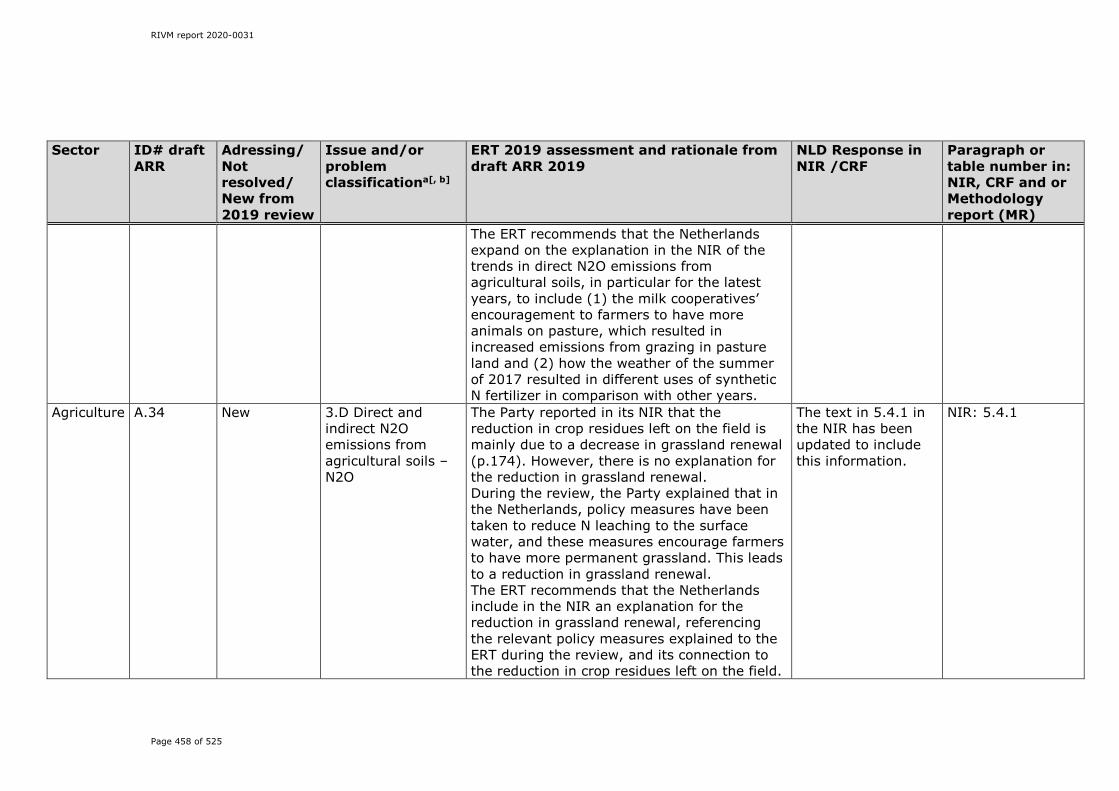
RIVM report 2020-0031
Page 458 of 525
Sector ID# draft ARR
Adressing/Not resolved/ New from 2019 review
Issue and/or problem classificationa[, b]
ERT 2019 assessment and rationale from draft ARR 2019
NLD Response in NIR /CRF
Paragraph or table number in: NIR, CRF and or Methodology report (MR)
The ERT recommends that the Netherlands expand on the explanation in the NIR of the trends in direct N2O emissions from agricultural soils, in particular for the latest years, to include (1) the milk cooperatives’ encouragement to farmers to have more animals on pasture, which resulted in increased emissions from grazing in pasture land and (2) how the weather of the summer of 2017 resulted in different uses of synthetic N fertilizer in comparison with other years.
Agriculture A.34 New 3.D Direct and indirect N2O emissions from agricultural soils –N2O
The Party reported in its NIR that the reduction in crop residues left on the field is mainly due to a decrease in grassland renewal (p.174). However, there is no explanation for the reduction in grassland renewal. During the review, the Party explained that in the Netherlands, policy measures have been taken to reduce N leaching to the surface water, and these measures encourage farmers to have more permanent grassland. This leads to a reduction in grassland renewal. The ERT recommends that the Netherlands include in the NIR an explanation for the reduction in grassland renewal, referencing the relevant policy measures explained to the ERT during the review, and its connection to the reduction in crop residues left on the field.
The text in 5.4.1 in the NIR has been updated to include this information.
NIR: 5.4.1

RIVM report 2020-0031
Page 459 of 525
Sector ID# draft ARR
Adressing/Not resolved/ New from 2019 review
Issue and/or problem classificationa[, b]
ERT 2019 assessment and rationale from draft ARR 2019
NLD Response in NIR /CRF
Paragraph or table number in: NIR, CRF and or Methodology report (MR)
Agriculture A.35 New 3.D Direct and indirect N2O emissions from agricultural soils –N2O
The Party reported in NIR table 5.12 the country-specific EFs and referenced their sources for direct N2O emissions from agricultural soils. However, there is no reference for the EF for compost or an explanation as to why this EF (0.004 kg N2O-N/kg N excreted) is so much lower than the IPCC default included in the 2006 IPCC Guidelines, vol. 4, table 10.21 (0.01 kg N2O-N/kg N excreted). Owing to this lack of transparency, it is difficult for the ERT to assess whether the Party has followed good practice and neither overestimated nor underestimated the GHG emissions from agricultural soils. During the review, the Party explained that the Netherlands developed a country-specific methodology for estimating N2O emissions from fertilizers and manure applied to soil (Velthof and Mosquera, 2011). For compost, no experimental data on emissions are available. The EF for compost was set as equal to that of surface-applied manure because compost is also surface-applied. Using the default IPCC EF for compost and country-specific EFs for manure would mean that the EF of compost is higher than that of manure. This is not plausible because most of the N in compost is present as organic N, whereas
The text in 5.4.2 in the NIR has been updated to include this information.
NIR: 5.4.2
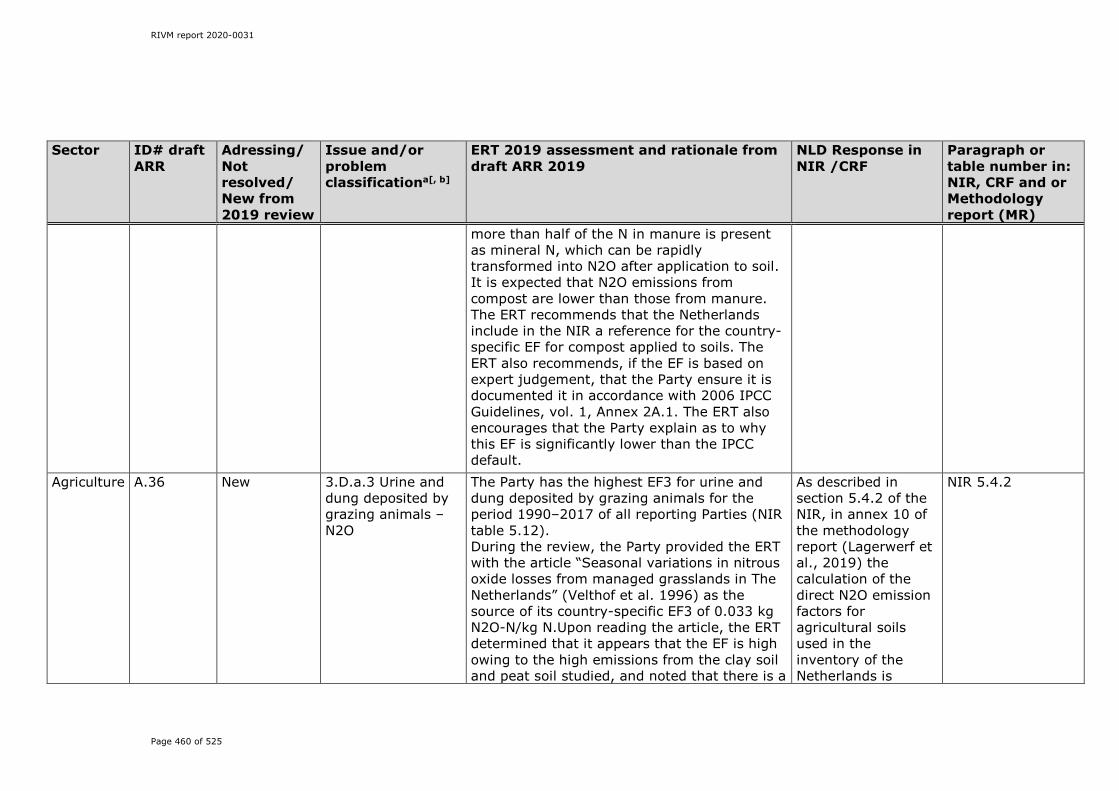
RIVM report 2020-0031
Page 460 of 525
Sector ID# draft ARR
Adressing/Not resolved/ New from 2019 review
Issue and/or problem classificationa[, b]
ERT 2019 assessment and rationale from draft ARR 2019
NLD Response in NIR /CRF
Paragraph or table number in: NIR, CRF and or Methodology report (MR)
more than half of the N in manure is present as mineral N, which can be rapidly transformed into N2O after application to soil. It is expected that N2O emissions from compost are lower than those from manure. The ERT recommends that the Netherlands include in the NIR a reference for the country-specific EF for compost applied to soils. The ERT also recommends, if the EF is based on expert judgement, that the Party ensure it is documented it in accordance with 2006 IPCC Guidelines, vol. 1, Annex 2A.1. The ERT also encourages that the Party explain as to why this EF is significantly lower than the IPCC default.
Agriculture A.36 New 3.D.a.3 Urine and dung deposited by grazing animals –N2O
The Party has the highest EF3 for urine and dung deposited by grazing animals for the period 1990–2017 of all reporting Parties (NIR table 5.12). During the review, the Party provided the ERT with the article “Seasonal variations in nitrous oxide losses from managed grasslands in The Netherlands” (Velthof et al. 1996) as the source of its country-specific EF3 of 0.033 kg N2O-N/kg N.Upon reading the article, the ERT determined that it appears that the EF is high owing to the high emissions from the clay soil and peat soil studied, and noted that there is a
As described in section 5.4.2 of the NIR, in annex 10 of the methodology report (Lagerwerf et al., 2019) the calculation of the direct N2O emission factors for agricultural soils used in the inventory of the Netherlands is
NIR 5.4.2

RIVM report 2020-0031
Page 461 of 525
Sector ID# draft ARR
Adressing/Not resolved/ New from 2019 review
Issue and/or problem classificationa[, b]
ERT 2019 assessment and rationale from draft ARR 2019
NLD Response in NIR /CRF
Paragraph or table number in: NIR, CRF and or Methodology report (MR)
high groundwater level in both soils compared with the other soils in general. The authors of the article note that the uncertainty and error in this and other studies are high, and would only be reduced by more research. The ERT also noted that this study was carried out 23 years ago and that there is no explanation in the article as to how the results were used to calculate the current EF3. The ERT, noting the fact that the Party has drained much of its soils over the years resulting in a potentially very low groundwater level, recommends that the Netherlands review the research on its EF3 for urine and dung deposited by grazing animals to determine if the current EF3 is still applicable to the Party’s agricultural systems, and, until such time as this review and any further research has been carried out, improve transparency by explaining in the NIR how research results were used to calculate the current EF3.
presented. These take into account country specific measurements and rationale is motivated there.

RIVM report 2020-0031
Page 462 of 525
Sector ID# draft ARR
Adressing/Not resolved/ New from 2019 review
Issue and/or problem classificationa[, b]
ERT 2019 assessment and rationale from draft ARR 2019
NLD Response in NIR /CRF
Paragraph or table number in: NIR, CRF and or Methodology report (MR)
Agriculture A.37 New 3.D.b Indirect N2O emissions from managed soils –N2O
The Party reported in its NIR that indirect N2O emissions from managed soils reduced owing to reduction measures (p.166). However, no explanation of these reduction measures is provided. During the review, the Party provided a link to a Ministry of Infrastructure and Water Management web page presenting an overview of the many reduction measures in place (https://rwsenvironment.eu/subjects/environmental-0/system-environmental/. The ERT recommends that the Netherlands include in the NIR the link to the Ministry of Infrastructure and Water Management web page presenting an overview of the measures in place to reduce indirect N2O emissions from managed soils (https://rwsenvironment.eu/subjects/environmental-0/system-environmental/).
In section 5.4.1 a general description is given, for further information regarding NH3 and NOx emissions and trends therein referral is made to the Netherlands' Informative Inventory Report (Wever et al., 2020) and corresponding parts of the methodology report (Lagerwerf et al., 2019).
NIR: 5.4.1

RIVM report 2020-0031
Page 463 of 525
Sector ID# draft ARR
Adressing/Not resolved/ New from 2019 review
Issue and/or problem classificationa[, b]
ERT 2019 assessment and rationale from draft ARR 2019
NLD Response in NIR /CRF
Paragraph or table number in: NIR, CRF and or Methodology report (MR)
LULUCF L.2 Addressing 4. General (LULUCF) – CO2
Correct the notation key “NE” to “NO” for those pools in which the Party considers no CSC occurs, provide estimates for those pools and categories for which it believes zero carbon change does not apply, or provide the justification for reporting “NE” for the pools in which the amount of CSC is insignificant in line with paragraph 37 of the UNFCCC Annex I inventory reporting guidelines. ===== The Netherlands significantly improved its use of notation keys by including references in Table 6.1 of the NIR (referring to the relevant sections of the NIR) and background paper where the justifications are provided. However, the ERT noted that the notation key used for CSC in litter under other land converted to forest land in CRF table 4.A was changed to “NO” rather than retained as a justified “NE”, which is inconsistent with NIR Table 6.1 and the other subcategories of land converted to forest land. During the review, the Party explained that the above-mentioned use of “NO” appeared to be an error and would be corrected in the next submission. The ERT notes that the 16th annual meeting of lead reviewers in 2019 recommended that the correct notation for a tier 1 assumption of carbon stock equilibrium
In the 2020 we will correct the error with CSC in litter under "other land converted to forets land" and additionally, we will change the notation keys for a tier 1 assumption of carbon stock in equilibrium to 'NA'
CRF tables 4A to 4F, NIR Table 6.1

RIVM report 2020-0031
Page 464 of 525
Sector ID# draft ARR
Adressing/Not resolved/ New from 2019 review
Issue and/or problem classificationa[, b]
ERT 2019 assessment and rationale from draft ARR 2019
NLD Response in NIR /CRF
Paragraph or table number in: NIR, CRF and or Methodology report (MR)
is “NA”; however, this is considered as a separate recommendation (see ID# L.18 in table 5).
LULUCF L.4 Addressing 4. General (LULUCF) – CO2
(a) Add to the NIR an explanation for the lack of AD before 1990, and extend the description by adding graphs showing the problem of extrapolation of the AD back from 1990; (b) Make further efforts or explore alternative ways to derive appropriate data (e.g. through extrapolation based on surrogate data). ===== The Netherlands partially explained the grounds on which pre-1990 AD are inadequate in the NIR (pp.194–195). However, the information and assertions are not supported by statistical data (e.g. graphs), and the ERT did not note any planned improvements regarding the derivation of appropriate data, as recommended. The ERT therefore reiterates the conclusions of previous ERTs, that the
As requested by the ERT, the Netherlands is now testing the inclusion of land-use map 1970 in order to take changes prior to 1990 into consideration. We expect to report on this in the NIR 2021.

RIVM report 2020-0031
Page 465 of 525
Sector ID# draft ARR
Adressing/Not resolved/ New from 2019 review
Issue and/or problem classificationa[, b]
ERT 2019 assessment and rationale from draft ARR 2019
NLD Response in NIR /CRF
Paragraph or table number in: NIR, CRF and or Methodology report (MR)
non-consideration of land use prior to 1990 is not consistent with the 2006 IPCC Guidelines (vol. 4, equation 2.5). During the review, the Party explained that older spatial information is available, including topographic maps, but previous attempts to include these maps in the inventory resulted in inconsistencies in the time series. The ERT considers that such data could still be of use as surrogate data, or that the Party could explore interpolation with Landsat observation data, which are available in a time series since 1972 on a 25 m grid, given that the Netherlands appears to have the geospatial capabilities to analyse and utilize a data set of this resolution.
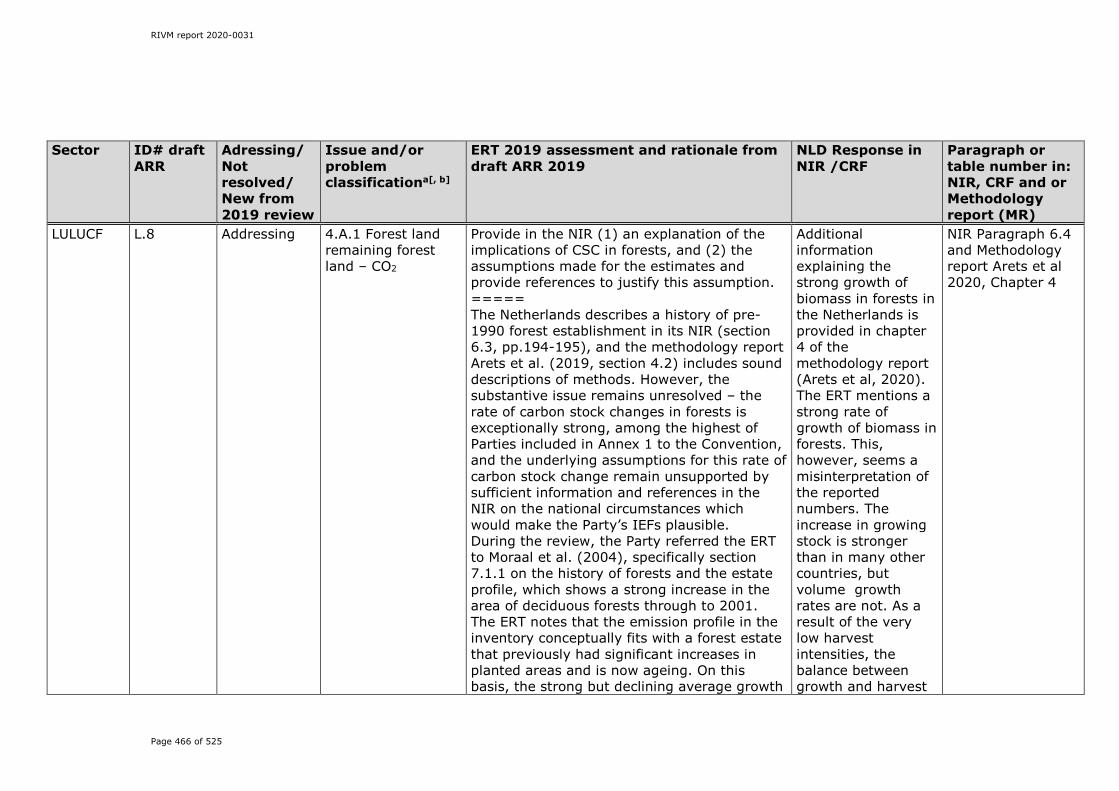
RIVM report 2020-0031
Page 466 of 525
Sector ID# draft ARR
Adressing/Not resolved/ New from 2019 review
Issue and/or problem classificationa[, b]
ERT 2019 assessment and rationale from draft ARR 2019
NLD Response in NIR /CRF
Paragraph or table number in: NIR, CRF and or Methodology report (MR)
LULUCF L.8 Addressing 4.A.1 Forest land remaining forest land – CO2
Provide in the NIR (1) an explanation of the implications of CSC in forests, and (2) the assumptions made for the estimates and provide references to justify this assumption. ===== The Netherlands describes a history of pre-1990 forest establishment in its NIR (section 6.3, pp.194-195), and the methodology report Arets et al. (2019, section 4.2) includes sound descriptions of methods. However, the substantive issue remains unresolved – the rate of carbon stock changes in forests is exceptionally strong, among the highest of Parties included in Annex 1 to the Convention, and the underlying assumptions for this rate of carbon stock change remain unsupported by sufficient information and references in the NIR on the national circumstances which would make the Party’s IEFs plausible. During the review, the Party referred the ERT to Moraal et al. (2004), specifically section 7.1.1 on the history of forests and the estate profile, which shows a strong increase in the area of deciduous forests through to 2001. The ERT notes that the emission profile in the inventory conceptually fits with a forest estate that previously had significant increases in planted areas and is now ageing. On this basis, the strong but declining average growth
Additional information explaining the strong growth of biomass in forests in the Netherlands is provided in chapter 4 of the methodology report (Arets et al, 2020). The ERT mentions a strong rate of growth of biomass in forests. This, however, seems a misinterpretation of the reported numbers. The increase in growing stock is stronger than in many other countries, but volume growth rates are not. As a result of the very low harvest intensities, the balance between growth and harvest
NIR Paragraph 6.4 and Methodology report Arets et al 2020, Chapter 4
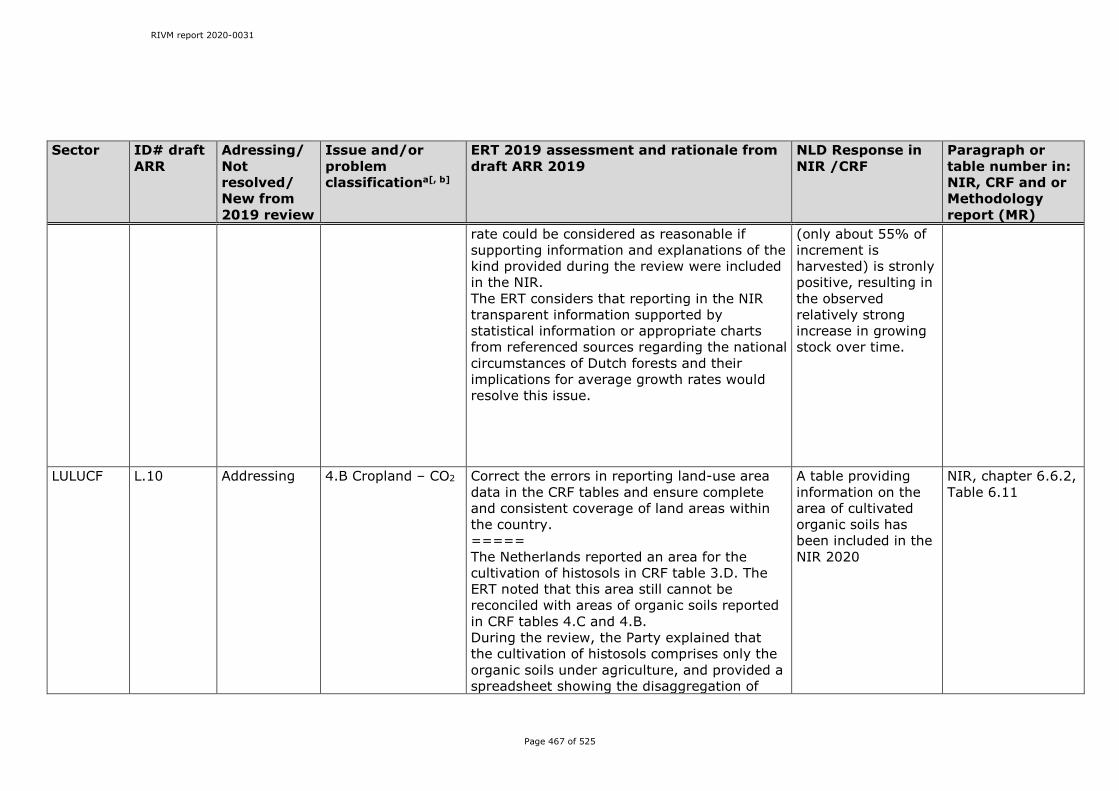
RIVM report 2020-0031
Page 467 of 525
Sector ID# draft ARR
Adressing/Not resolved/ New from 2019 review
Issue and/or problem classificationa[, b]
ERT 2019 assessment and rationale from draft ARR 2019
NLD Response in NIR /CRF
Paragraph or table number in: NIR, CRF and or Methodology report (MR)
rate could be considered as reasonable if supporting information and explanations of the kind provided during the review were included in the NIR. The ERT considers that reporting in the NIR transparent information supported by statistical information or appropriate charts from referenced sources regarding the national circumstances of Dutch forests and their implications for average growth rates would resolve this issue.
(only about 55% of increment is harvested) is stronly positive, resulting in the observed relatively strong increase in growing stock over time.
LULUCF L.10
Addressing 4.B Cropland – CO2 Correct the errors in reporting land-use area data in the CRF tables and ensure complete and consistent coverage of land areas within the country. ===== The Netherlands reported an area for the cultivation of histosols in CRF table 3.D. The ERT noted that this area still cannot be reconciled with areas of organic soils reported in CRF tables 4.C and 4.B. During the review, the Party explained that the cultivation of histosols comprises only the organic soils under agriculture, and provided a spreadsheet showing the disaggregation of
A table providing information on the area of cultivated organic soils has been included in the NIR 2020
NIR, chapter 6.6.2, Table 6.11
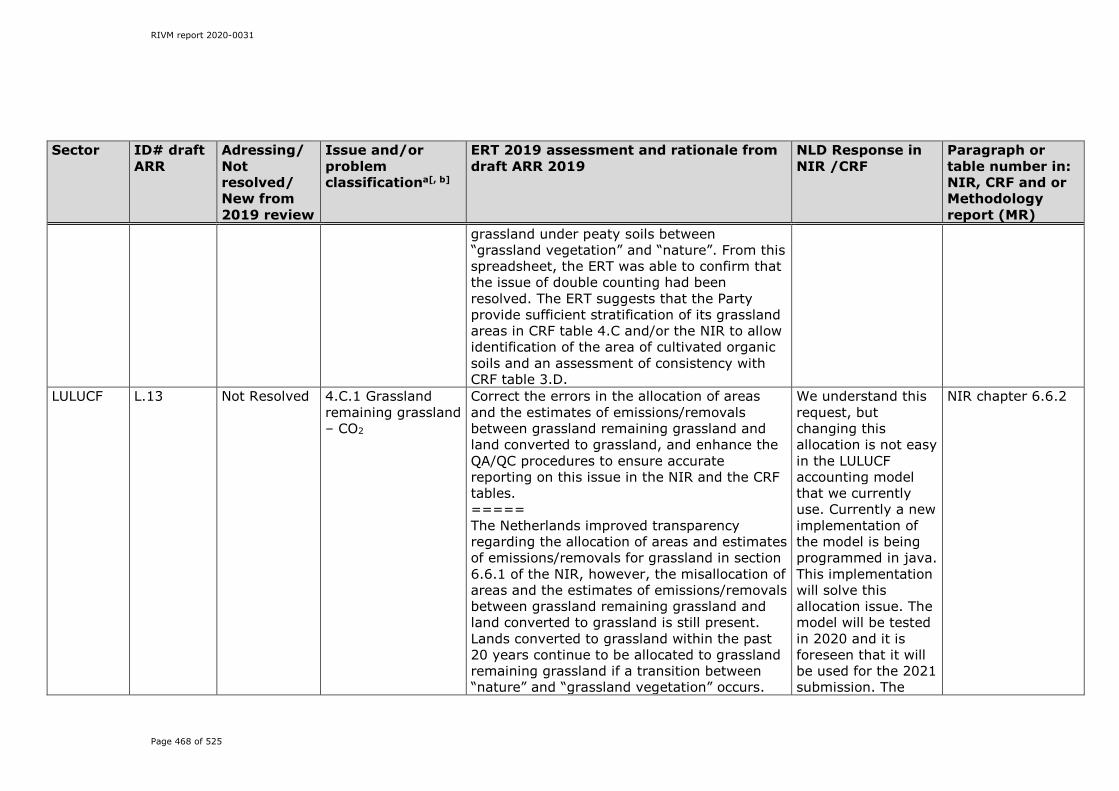
RIVM report 2020-0031
Page 468 of 525
Sector ID# draft ARR
Adressing/Not resolved/ New from 2019 review
Issue and/or problem classificationa[, b]
ERT 2019 assessment and rationale from draft ARR 2019
NLD Response in NIR /CRF
Paragraph or table number in: NIR, CRF and or Methodology report (MR)
grassland under peaty soils between “grassland vegetation” and “nature”. From this spreadsheet, the ERT was able to confirm that the issue of double counting had been resolved. The ERT suggests that the Party provide sufficient stratification of its grassland areas in CRF table 4.C and/or the NIR to allow identification of the area of cultivated organic soils and an assessment of consistency with CRF table 3.D.
LULUCF L.13
Not Resolved 4.C.1 Grassland remaining grassland – CO2
Correct the errors in the allocation of areas and the estimates of emissions/removals between grassland remaining grassland and land converted to grassland, and enhance the QA/QC procedures to ensure accurate reporting on this issue in the NIR and the CRF tables. ===== The Netherlands improved transparency regarding the allocation of areas and estimates of emissions/removals for grassland in section 6.6.1 of the NIR, however, the misallocation of areas and the estimates of emissions/removals between grassland remaining grassland and land converted to grassland is still present. Lands converted to grassland within the past 20 years continue to be allocated to grassland remaining grassland if a transition between “nature” and “grassland vegetation” occurs.
We understand this request, but changing this allocation is not easy in the LULUCF accounting model that we currently use. Currently a new implementation of the model is being programmed in java. This implementation will solve this allocation issue. The model will be tested in 2020 and it is foreseen that it will be used for the 2021 submission. The
NIR chapter 6.6.2
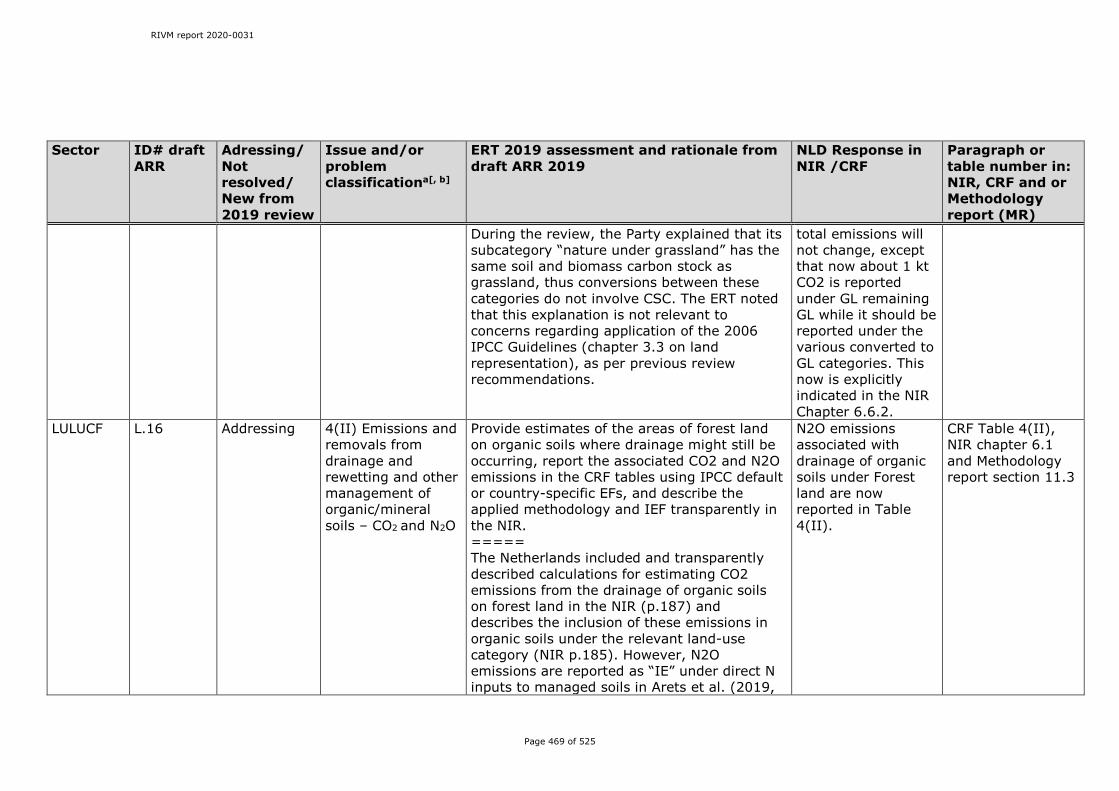
RIVM report 2020-0031
Page 469 of 525
Sector ID# draft ARR
Adressing/Not resolved/ New from 2019 review
Issue and/or problem classificationa[, b]
ERT 2019 assessment and rationale from draft ARR 2019
NLD Response in NIR /CRF
Paragraph or table number in: NIR, CRF and or Methodology report (MR)
During the review, the Party explained that its subcategory “nature under grassland” has the same soil and biomass carbon stock as grassland, thus conversions between these categories do not involve CSC. The ERT noted that this explanation is not relevant to concerns regarding application of the 2006 IPCC Guidelines (chapter 3.3 on land representation), as per previous review recommendations.
total emissions will not change, except that now about 1 kt CO2 is reported under GL remaining GL while it should be reported under the various converted to GL categories. This now is explicitly indicated in the NIR Chapter 6.6.2.
LULUCF L.16
Addressing 4(II) Emissions and removals from drainage and rewetting and other management of organic/mineral soils – CO2 and N2O
Provide estimates of the areas of forest land on organic soils where drainage might still be occurring, report the associated CO2 and N2O emissions in the CRF tables using IPCC default or country-specific EFs, and describe the applied methodology and IEF transparently in the NIR. ===== The Netherlands included and transparently described calculations for estimating CO2 emissions from the drainage of organic soils on forest land in the NIR (p.187) and describes the inclusion of these emissions in organic soils under the relevant land-use category (NIR p.185). However, N2O emissions are reported as “IE” under direct N inputs to managed soils in Arets et al. (2019,
N2O emissions associated with drainage of organic soils under Forest land are now reported in Table 4(II).
CRF Table 4(II), NIR chapter 6.1 and Methodology report section 11.3
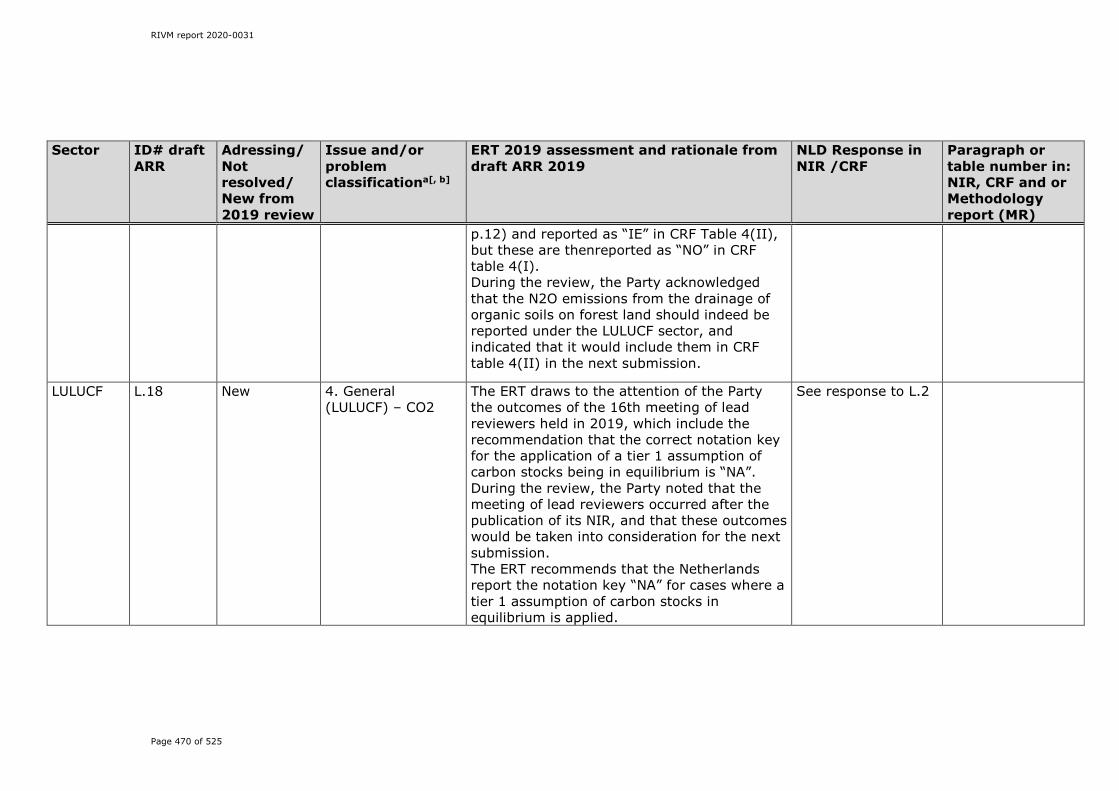
RIVM report 2020-0031
Page 470 of 525
Sector ID# draft ARR
Adressing/Not resolved/ New from 2019 review
Issue and/or problem classificationa[, b]
ERT 2019 assessment and rationale from draft ARR 2019
NLD Response in NIR /CRF
Paragraph or table number in: NIR, CRF and or Methodology report (MR)
p.12) and reported as “IE” in CRF Table 4(II), but these are thenreported as “NO” in CRF table 4(I). During the review, the Party acknowledged that the N2O emissions from the drainage of organic soils on forest land should indeed be reported under the LULUCF sector, and indicated that it would include them in CRF table 4(II) in the next submission.
LULUCF L.18 New 4. General (LULUCF) – CO2
The ERT draws to the attention of the Party the outcomes of the 16th meeting of lead reviewers held in 2019, which include the recommendation that the correct notation key for the application of a tier 1 assumption of carbon stocks being in equilibrium is “NA”. During the review, the Party noted that the meeting of lead reviewers occurred after the publication of its NIR, and that these outcomes would be taken into consideration for the next submission. The ERT recommends that the Netherlands report the notation key “NA” for cases where a tier 1 assumption of carbon stocks in equilibrium is applied.
See response to L.2
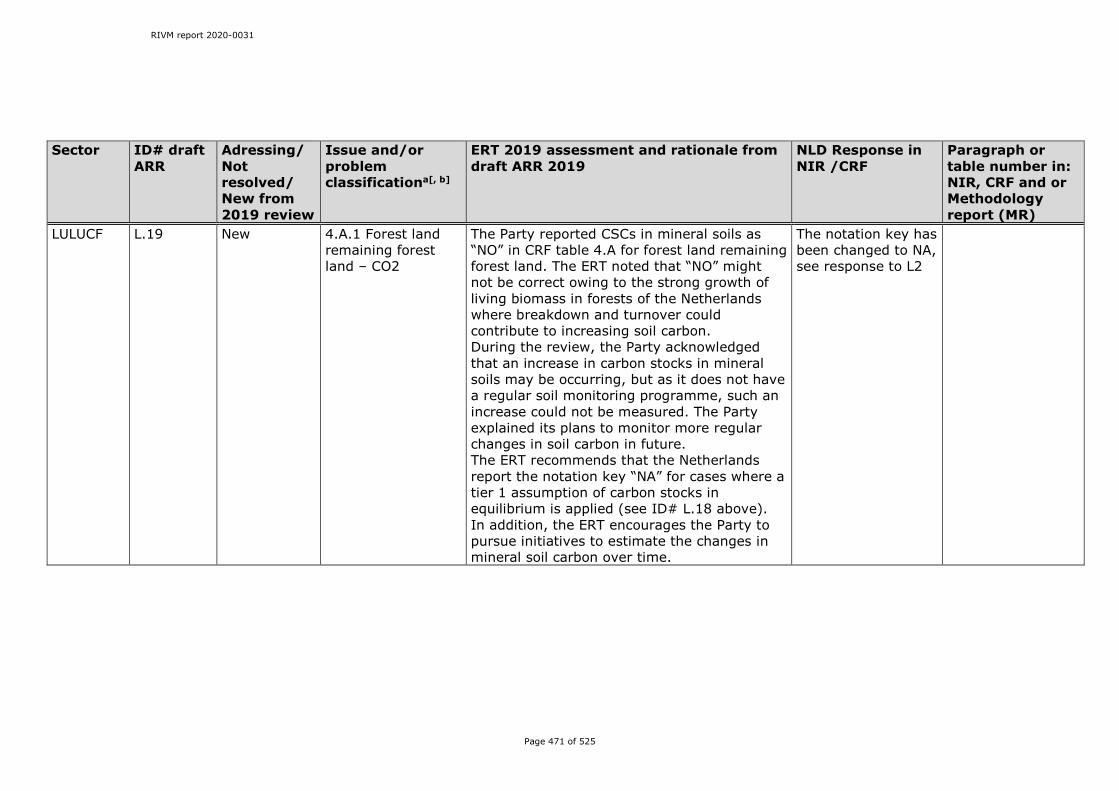
RIVM report 2020-0031
Page 471 of 525
Sector ID# draft ARR
Adressing/Not resolved/ New from 2019 review
Issue and/or problem classificationa[, b]
ERT 2019 assessment and rationale from draft ARR 2019
NLD Response in NIR /CRF
Paragraph or table number in: NIR, CRF and or Methodology report (MR)
LULUCF L.19 New 4.A.1 Forest land remaining forest land – CO2
The Party reported CSCs in mineral soils as “NO” in CRF table 4.A for forest land remaining forest land. The ERT noted that “NO” might not be correct owing to the strong growth of living biomass in forests of the Netherlands where breakdown and turnover could contribute to increasing soil carbon. During the review, the Party acknowledged that an increase in carbon stocks in mineral soils may be occurring, but as it does not have a regular soil monitoring programme, such an increase could not be measured. The Party explained its plans to monitor more regular changes in soil carbon in future. The ERT recommends that the Netherlands report the notation key “NA” for cases where a tier 1 assumption of carbon stocks in equilibrium is applied (see ID# L.18 above). In addition, the ERT encourages the Party to pursue initiatives to estimate the changes in mineral soil carbon over time.
The notation key has been changed to NA, see response to L2
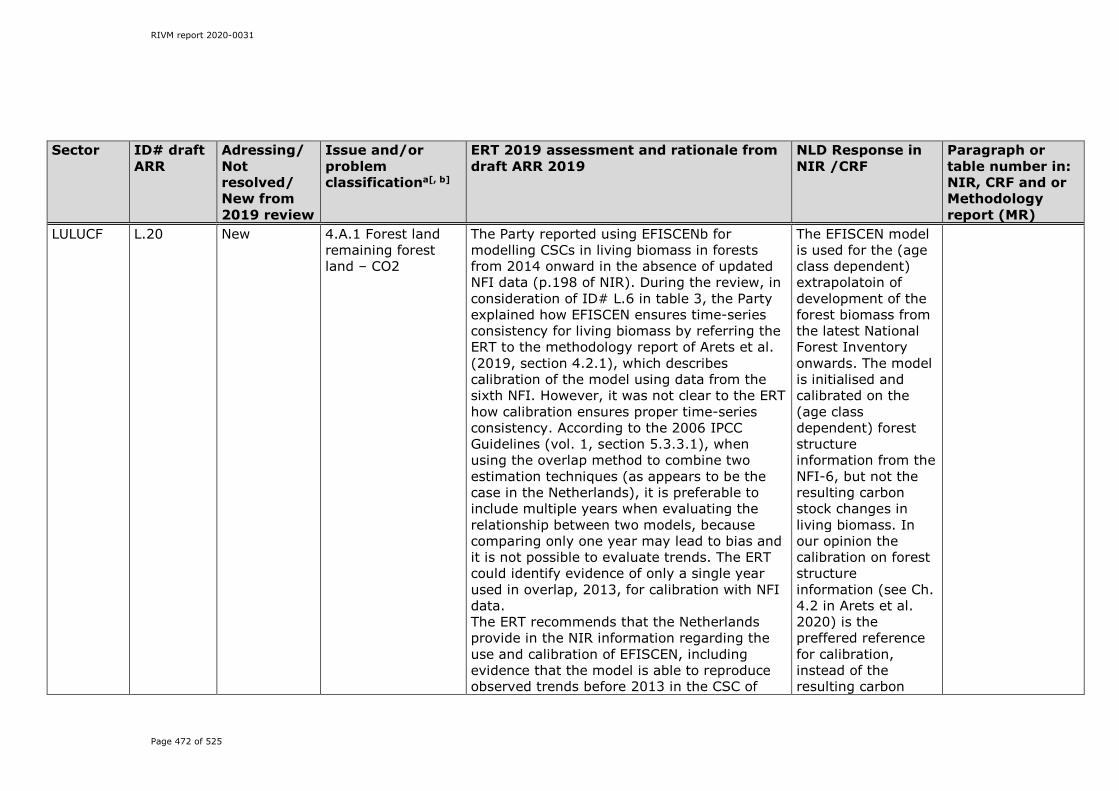
RIVM report 2020-0031
Page 472 of 525
Sector ID# draft ARR
Adressing/Not resolved/ New from 2019 review
Issue and/or problem classificationa[, b]
ERT 2019 assessment and rationale from draft ARR 2019
NLD Response in NIR /CRF
Paragraph or table number in: NIR, CRF and or Methodology report (MR)
LULUCF L.20 New 4.A.1 Forest land remaining forest land – CO2
The Party reported using EFISCENb for modelling CSCs in living biomass in forests from 2014 onward in the absence of updated NFI data (p.198 of NIR). During the review, in consideration of ID# L.6 in table 3, the Party explained how EFISCEN ensures time-series consistency for living biomass by referring the ERT to the methodology report of Arets et al. (2019, section 4.2.1), which describes calibration of the model using data from the sixth NFI. However, it was not clear to the ERT how calibration ensures proper time-series consistency. According to the 2006 IPCC Guidelines (vol. 1, section 5.3.3.1), when using the overlap method to combine two estimation techniques (as appears to be the case in the Netherlands), it is preferable to include multiple years when evaluating the relationship between two models, because comparing only one year may lead to bias and it is not possible to evaluate trends. The ERT could identify evidence of only a single year used in overlap, 2013, for calibration with NFI data. The ERT recommends that the Netherlands provide in the NIR information regarding the use and calibration of EFISCEN, including evidence that the model is able to reproduce observed trends before 2013 in the CSC of
The EFISCEN model is used for the (age class dependent) extrapolatoin of development of the forest biomass from the latest National Forest Inventory onwards. The model is initialised and calibrated on the (age class dependent) forest structure information from the NFI-6, but not the resulting carbon stock changes in living biomass. In our opinion the calibration on forest structure information (see Ch. 4.2 in Arets et al. 2020) is the preffered reference for calibration, instead of the resulting carbon
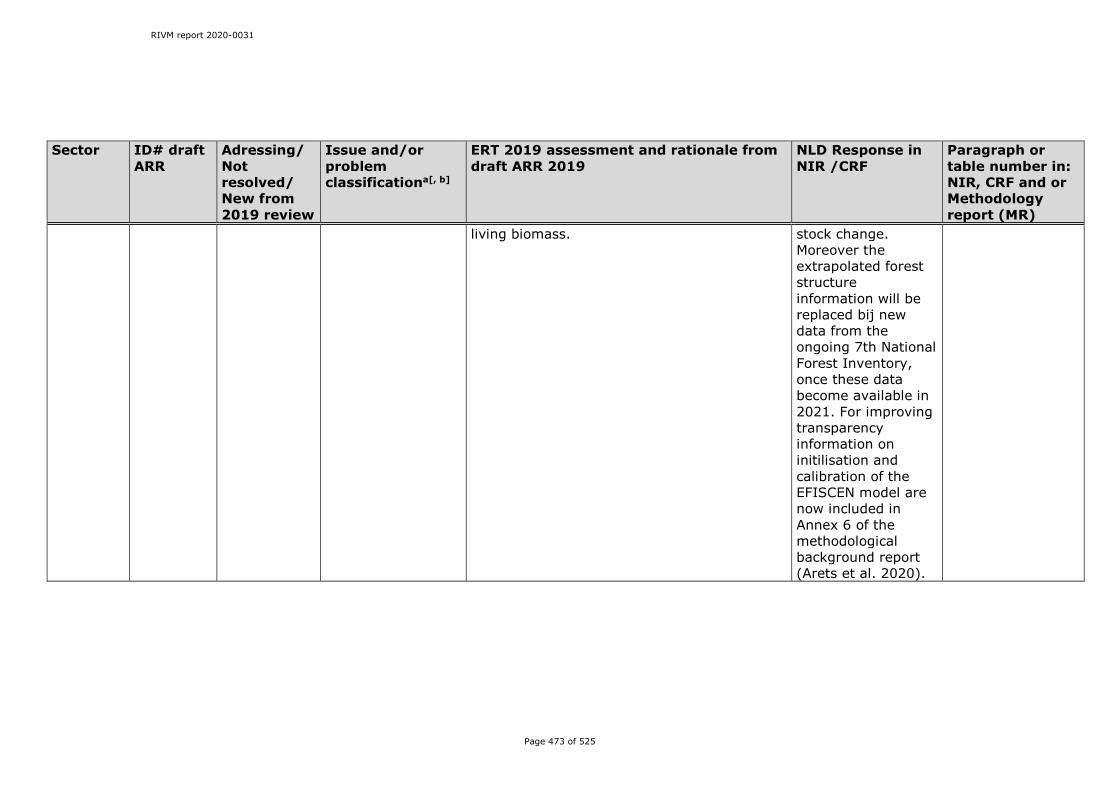
RIVM report 2020-0031
Page 473 of 525
Sector ID# draft ARR
Adressing/Not resolved/ New from 2019 review
Issue and/or problem classificationa[, b]
ERT 2019 assessment and rationale from draft ARR 2019
NLD Response in NIR /CRF
Paragraph or table number in: NIR, CRF and or Methodology report (MR)
living biomass. stock change. Moreover the extrapolated forest structure information will be replaced bij new data from the ongoing 7th National Forest Inventory, once these data become available in 2021. For improving transparency information on initilisation and calibration of the EFISCEN model are now included in Annex 6 of the methodological background report (Arets et al. 2020).

RIVM report 2020-0031
Page 474 of 525
Sector ID# draft ARR
Adressing/Not resolved/ New from 2019 review
Issue and/or problem classificationa[, b]
ERT 2019 assessment and rationale from draft ARR 2019
NLD Response in NIR /CRF
Paragraph or table number in: NIR, CRF and or Methodology report (MR)
LULUCF L.23 New 4.D.1.1 Peat extraction remaining peat extraction – CO2, N2O
The Party reported the current status of peat extraction in the Netherlands in the methodology report (Arets et al., 2019) accompanying the submission. However, the Party did not include information for the earlier years of the time-series. During the review, the Party explained that the last commercial peat extraction occurred in 1992 in the east of the country. However, the ERT noted that the Party reported emissions from all gases for peat extraction remaining peat extraction as in CRF table 4.D and for peat extraction lands in CRF table 4(II) as “NO” for the entire time series (including 1990-1992, where peat extraction occurred). The ERT recommends that the Netherlands estimate the emissions arising from peat extraction between 1990 and 1992 and report CO2 and N2O emissions in CRF table 4(II) under peat extraction lands and provide in the NIR information regarding the history of peat extraction practices in the country, including the date on which this practice is last known to have occurred.
The history of peat extraction in the Netherlands has been further explained in Arets et al 2020.
Methodology report Arets et al 2020, chapter 2.4.1

RIVM report 2020-0031
Page 475 of 525
Sector ID# draft ARR
Adressing/Not resolved/ New from 2019 review
Issue and/or problem classificationa[, b]
ERT 2019 assessment and rationale from draft ARR 2019
NLD Response in NIR /CRF
Paragraph or table number in: NIR, CRF and or Methodology report (MR)
LULUCF L.24 New 4.G Harvested wood products – CO2
The Party reported that emissions from HWP are calculated using the same methods as those used for HWP under the Kyoto Protocol using the Kyoto Protocol Supplement (NIR section 6.10.1). These calculations include removing the fraction of harvest allocated to deforestation and applying a tier 1 method of instant oxidation. The ERT noted that this reporting is incorrect because reporting under the Convention does not contain a provision for treating wood products arising from different sources using different method tiers. This is particularly relevant to the Netherlands, which applies the tier 2 methodology, and where areas of plantations with meaningful wood products established prior to 1990 are being deforested within the definitions of the Kyoto Protocol (NIR, p.197) and where the wood products arising from deforestation are taken to have the same material profile as those from other sources. During the review, the Party confirmed the ERT’s understanding of its calculation methods, including that it does not have specific information on the profile of products from deforestation sources. The Party highlighted footnote 12 to CRF table 4.Gs1 as the grounds on which to use the methods specified in the Kyoto Protocol Supplement.
In order to maintain consistency for the reported HWP emissions and removals between the UNFCCC and KP reporting, The Netherlands has decided to keep the methodologies the same following the approach in the KP LULUCF guidance. In the past this interpretation of footnote 12 to CRF Table 4.Gs1 was shared among peers in the EU and did not result in recommendations from UNFCCC reviews before. We will again discuss this within existing fora for exchange on technical LULUCF issues among EU member states.

RIVM report 2020-0031
Page 476 of 525
Sector ID# draft ARR
Adressing/Not resolved/ New from 2019 review
Issue and/or problem classificationa[, b]
ERT 2019 assessment and rationale from draft ARR 2019
NLD Response in NIR /CRF
Paragraph or table number in: NIR, CRF and or Methodology report (MR)
This footnote states that a Party should “refer to…volume 4 of the 2006 IPCC Guidelines or any other IPCC methodological guidance reflecting this production approach”. The ERT considers that the Party has overinterpreted the footnote and in turn draws the Party’s attention to section 2.8 of the Kyoto Protocol Supplement, which states that the Kyoto Protocol methods to be used are similar to those specified under the production approach of the 2006 IPCC Guidelines, “however decision 2/CMP.7 imposes some additional constraints and limits the extent of HWP which can be included in the [KP] estimates”. Figure 2.8.1 of the Kyoto Protocol Supplement is clear on the circumstances under which Parties are required to use the tier 1 approach where the 2006 IPCC Guidelines would advise otherwise. It follows that guidance from the Kyoto Protocol Supplement is in some places inconsistent with the 2006 IPCC Guidelines owing to decision 2/CMP.7 and so should be used with caution for reporting under the Convention. The ERT recommends that the Netherlands include, in its tier 2 methods and reporting for HWP under the Convention, the accumulation and decay of wood products in use arising from activities that would be defined as
RIVM report 2020-0031
Page 477 of 525
Sector ID# draft ARR
Adressing/Not resolved/ New from 2019 review
Issue and/or problem classificationa[, b]
ERT 2019 assessment and rationale from draft ARR 2019
NLD Response in NIR /CRF
Paragraph or table number in: NIR, CRF and or Methodology report (MR)
deforestation under the Kyoto Protocol.
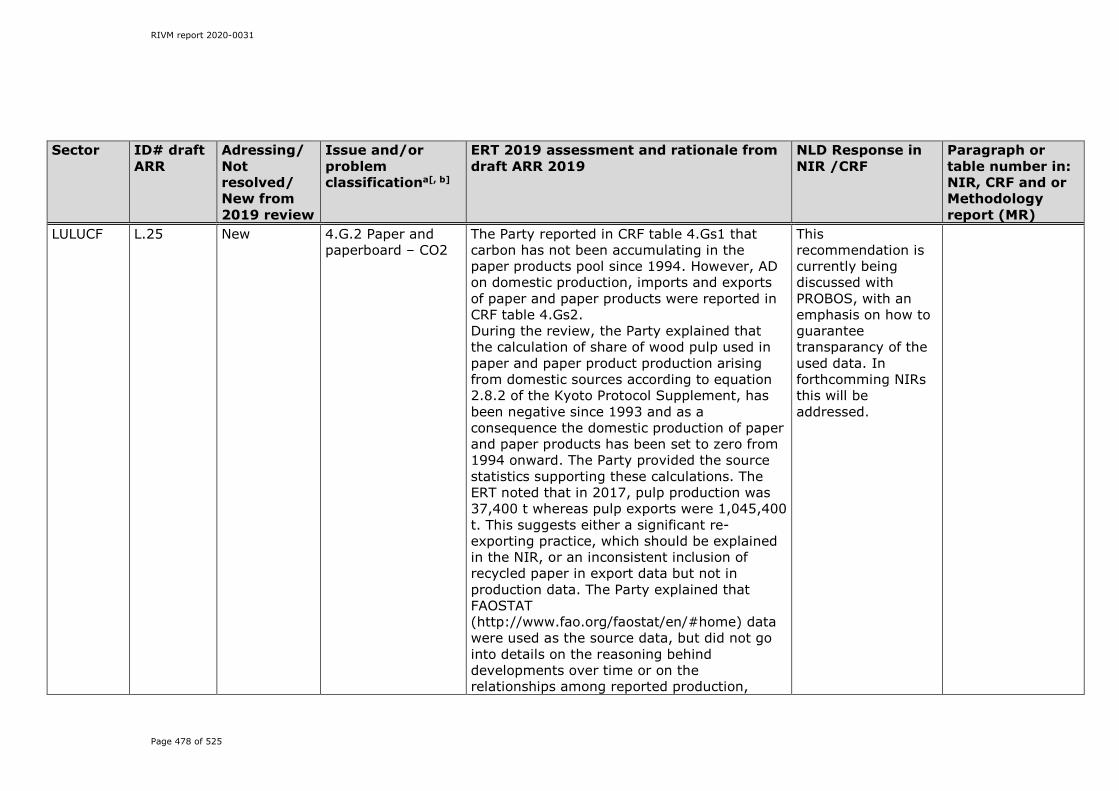
RIVM report 2020-0031
Page 478 of 525
Sector ID# draft ARR
Adressing/Not resolved/ New from 2019 review
Issue and/or problem classificationa[, b]
ERT 2019 assessment and rationale from draft ARR 2019
NLD Response in NIR /CRF
Paragraph or table number in: NIR, CRF and or Methodology report (MR)
LULUCF L.25 New 4.G.2 Paper and paperboard – CO2
The Party reported in CRF table 4.Gs1 that carbon has not been accumulating in the paper products pool since 1994. However, AD on domestic production, imports and exports of paper and paper products were reported in CRF table 4.Gs2. During the review, the Party explained that the calculation of share of wood pulp used in paper and paper product production arising from domestic sources according to equation 2.8.2 of the Kyoto Protocol Supplement, has been negative since 1993 and as a consequence the domestic production of paper and paper products has been set to zero from 1994 onward. The Party provided the source statistics supporting these calculations. The ERT noted that in 2017, pulp production was 37,400 t whereas pulp exports were 1,045,400 t. This suggests either a significant re-exporting practice, which should be explained in the NIR, or an inconsistent inclusion of recycled paper in export data but not in production data. The Party explained that FAOSTAT (http://www.fao.org/faostat/en/#home) data were used as the source data, but did not go into details on the reasoning behind developments over time or on the relationships among reported production,
This recommendation is currently being discussed with PROBOS, with an emphasis on how to guarantee transparancy of the used data. In forthcomming NIRs this will be addressed.
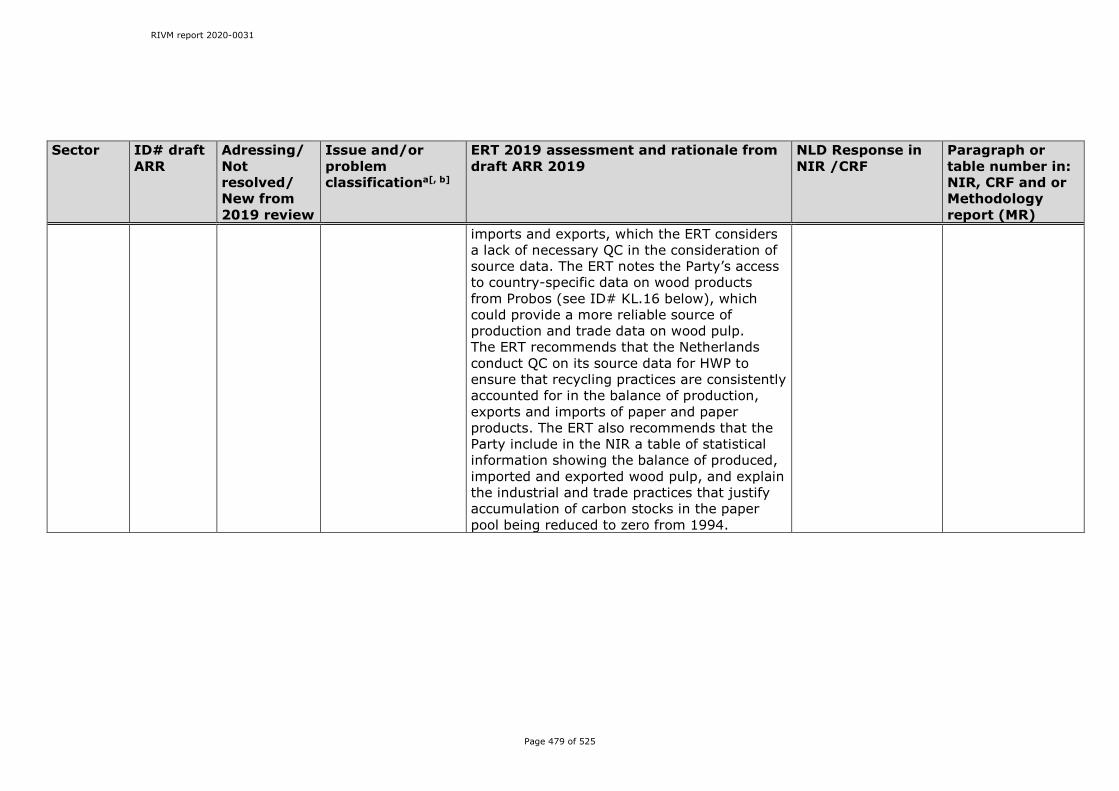
RIVM report 2020-0031
Page 479 of 525
Sector ID# draft ARR
Adressing/Not resolved/ New from 2019 review
Issue and/or problem classificationa[, b]
ERT 2019 assessment and rationale from draft ARR 2019
NLD Response in NIR /CRF
Paragraph or table number in: NIR, CRF and or Methodology report (MR)
imports and exports, which the ERT considers a lack of necessary QC in the consideration of source data. The ERT notes the Party’s access to country-specific data on wood products from Probos (see ID# KL.16 below), which could provide a more reliable source of production and trade data on wood pulp. The ERT recommends that the Netherlands conduct QC on its source data for HWP to ensure that recycling practices are consistently accounted for in the balance of production, exports and imports of paper and paper products. The ERT also recommends that the Party include in the NIR a table of statistical information showing the balance of produced, imported and exported wood pulp, and explain the industrial and trade practices that justify accumulation of carbon stocks in the paper pool being reduced to zero from 1994.

RIVM report 2020-0031
Page 480 of 525
Sector ID# draft ARR
Adressing/Not resolved/ New from 2019 review
Issue and/or problem classificationa[, b]
ERT 2019 assessment and rationale from draft ARR 2019
NLD Response in NIR /CRF
Paragraph or table number in: NIR, CRF and or Methodology report (MR)
LULUCF L.26 New 4(II) Emissions and removals from drainage and rewetting and other management of organic/mineral soils – CO2
In the 2019 submission, the Party revised its approach to the mapping of organic soils. It described in the methodology paper accompanying the submission that the area of organic soils is now recognized to be declining and that this is due to a combination of ongoing oxidation and disturbance (Arets et al., 2019, p.65). As the area of organic soils has been declining, the Netherlands reported the areas of organic soils constant at 2014 levels as a conservative assumption considering that smaller areas of organic soils produce less emissions. The ERT considers that this may not be a reasonable assumption in accordance with the 2006 IPCC Guidelines (vol. 1, section 5.2.3) on time-series consistency if the disturbance could result in the instant oxidation of lost organic soils, such as through excavation. The ERT notes that the information included with the NIR (Arets et al., 2019, section 11.3) is not sufficient to allow an accurate assessment of the estimates. During the review, the Party explained that disturbance of organic soils under agricultural use only includes commonly applied management practices such as ploughing, and that excavation of organic soils is not practised in the Netherlands. The Party also clarified that a reassessment of the EFs for drained
In response to the recommendations by the ERT decline of the area of organic soils now is being extrapolate from 2014 onwards. Changes in emission factors have been assessed and these are interpolated between 2000 and 2014 and the trend is extrapolated from 2014 onwards.
NIR, Chapter 6.1, Methodology report Arets et al 2020, chapter 11.3
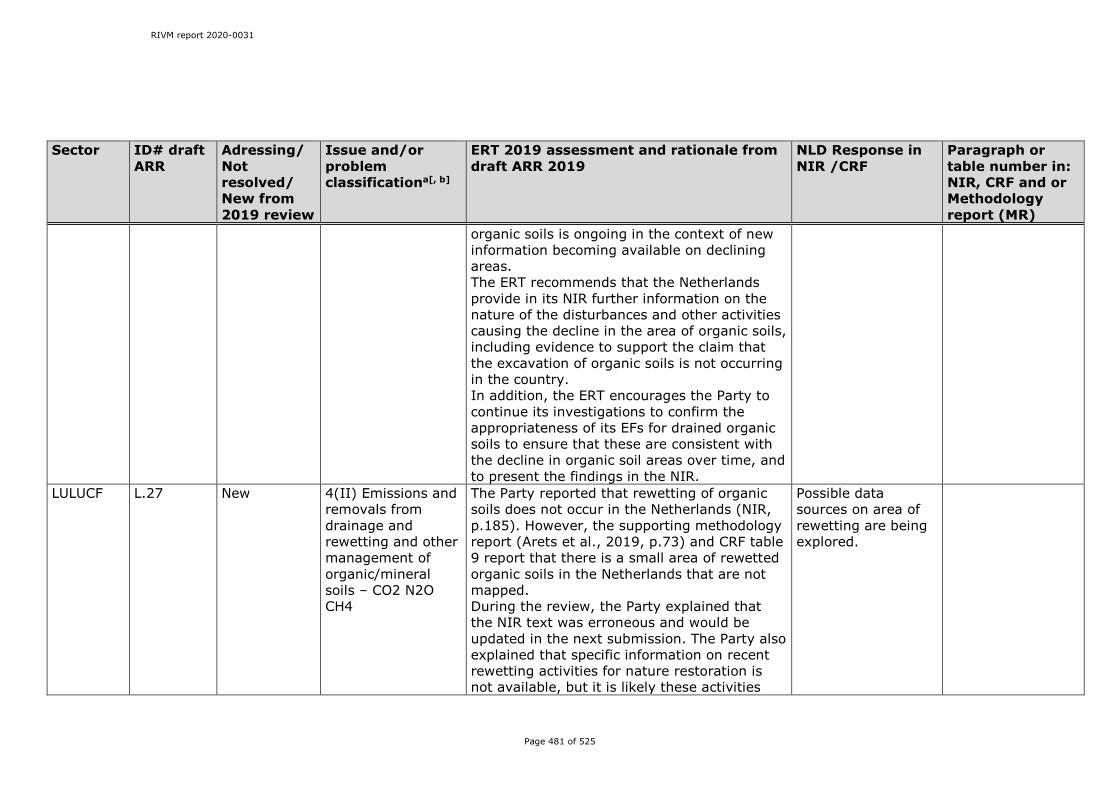
RIVM report 2020-0031
Page 481 of 525
Sector ID# draft ARR
Adressing/Not resolved/ New from 2019 review
Issue and/or problem classificationa[, b]
ERT 2019 assessment and rationale from draft ARR 2019
NLD Response in NIR /CRF
Paragraph or table number in: NIR, CRF and or Methodology report (MR)
organic soils is ongoing in the context of new information becoming available on declining areas. The ERT recommends that the Netherlands provide in its NIR further information on the nature of the disturbances and other activities causing the decline in the area of organic soils, including evidence to support the claim that the excavation of organic soils is not occurring in the country. In addition, the ERT encourages the Party to continue its investigations to confirm the appropriateness of its EFs for drained organic soils to ensure that these are consistent with the decline in organic soil areas over time, and to present the findings in the NIR.
LULUCF L.27 New 4(II) Emissions and removals from drainage and rewetting and other management of organic/mineral soils – CO2 N2O CH4
The Party reported that rewetting of organic soils does not occur in the Netherlands (NIR, p.185). However, the supporting methodology report (Arets et al., 2019, p.73) and CRF table 9 report that there is a small area of rewetted organic soils in the Netherlands that are not mapped. During the review, the Party explained that the NIR text was erroneous and would be updated in the next submission. The Party also explained that specific information on recent rewetting activities for nature restoration is not available, but it is likely these activities
Possible data sources on area of rewetting are being explored.

RIVM report 2020-0031
Page 482 of 525
Sector ID# draft ARR
Adressing/Not resolved/ New from 2019 review
Issue and/or problem classificationa[, b]
ERT 2019 assessment and rationale from draft ARR 2019
NLD Response in NIR /CRF
Paragraph or table number in: NIR, CRF and or Methodology report (MR)
involve less than 1,000 ha of previously drained soils for which estimates of emissions from drainage reported in the inventory are higher than the not reported emissions from the rewetted organic soils. The Party considers not estimating these emissions to be a conservative approach. The ERT recommends that the Netherlands update its NIR to include a correct description of rewetting activities in the Netherlands. The ERT also encourages that the Netherlands estimate the CO2 and CH4 emissions and removals from rewetted organic soils and report them in CRF table 4(II).
Waste W.1 Addressing 5.A Solid waste disposal on land – CH4
Include important AD, such as the amount and composition of disposed waste, in the NIR. ===== The Netherlands included the requested AD in NIR table 7.3. The ERT noted that the Party provided for 2016 the amount of waste landfilled and the DOC value for each waste group but did not provide these values for the entire time series. During the review, the Party provided the amount and composition of waste landfilled for the period 2005–2017. The Party explained that the section in the NIR “Fraction of degradable organic carbon” describes how the DOC value is calculated for an individual year
Table 7.3 is updated with the most recent relevant activity data (amount of landfilled waste groups and DOC values).
NIR table 7.3
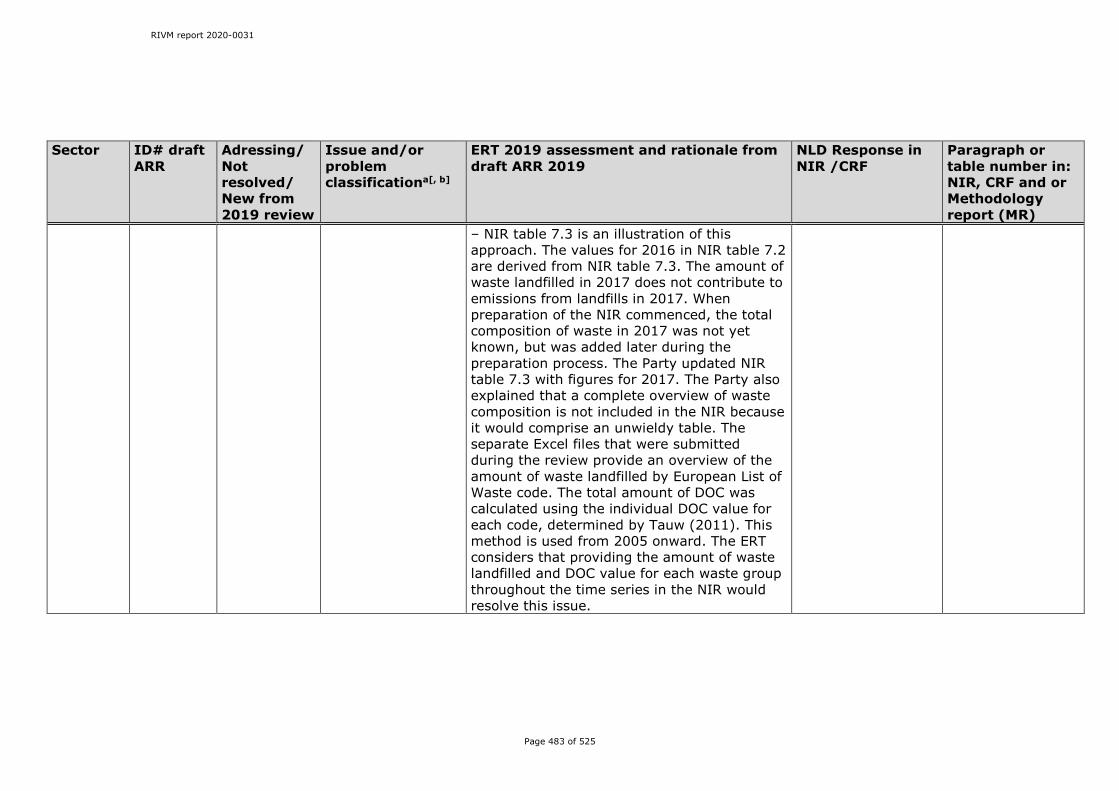
RIVM report 2020-0031
Page 483 of 525
Sector ID# draft ARR
Adressing/Not resolved/ New from 2019 review
Issue and/or problem classificationa[, b]
ERT 2019 assessment and rationale from draft ARR 2019
NLD Response in NIR /CRF
Paragraph or table number in: NIR, CRF and or Methodology report (MR)
– NIR table 7.3 is an illustration of this approach. The values for 2016 in NIR table 7.2 are derived from NIR table 7.3. The amount of waste landfilled in 2017 does not contribute to emissions from landfills in 2017. When preparation of the NIR commenced, the total composition of waste in 2017 was not yet known, but was added later during the preparation process. The Party updated NIR table 7.3 with figures for 2017. The Party also explained that a complete overview of waste composition is not included in the NIR because it would comprise an unwieldy table. The separate Excel files that were submitted during the review provide an overview of the amount of waste landfilled by European List of Waste code. The total amount of DOC was calculated using the individual DOC value for each code, determined by Tauw (2011). This method is used from 2005 onward. The ERT considers that providing the amount of waste landfilled and DOC value for each waste group throughout the time series in the NIR would resolve this issue.

RIVM report 2020-0031
Page 484 of 525
Sector ID# draft ARR
Adressing/Not resolved/ New from 2019 review
Issue and/or problem classificationa[, b]
ERT 2019 assessment and rationale from draft ARR 2019
NLD Response in NIR /CRF
Paragraph or table number in: NIR, CRF and or Methodology report (MR)
Waste W.4 Addressing 5.A Solid waste disposal on land – CH4
Provide justifications for (1) the default value of fraction of CH4 in generated landfill gas being used for the years 2005–2014; (2) the interpolation between country-specific and default values for fraction of CH4 in generated landfill gas for the years 2001–2004 being considered the best approach to estimate the CH4 emissions and to maintain time-series consistency; and (3) the correspondence of approaches to estimating CH4 emissions from solid waste disposal sites to the guidance provided in the 2006 IPCC Guidelines. If unable to provide the justifications and if unable to obtain a country-specific value for the fraction of CH4 in generated landfill gas for the period 2001–2014, continue to use the country-specific value (57.4 per cent) and recalculate the CH4 emissions from waste disposal on land using this country-specific value for the entire time series 1990–2014. ===== The Netherlands reported that explanation is provided in the NIR (sections 7.2.2 and 7.2.5). According to the information provided in section 7.2.2, the country specific value (57.4 per cent) is used for fraction of CH4 in generated landfill gas for the years 1990-2004 and IPCC default value (50 per cent) from 2005 onwards. The Netherlands provided
The information provided for the overview of recovered landfill gas, gives the percentage of methane in recovered landfill gas and not the methane percentage in formed landfill gas. The amount of methane in formed landfill gas has not been changed. We use the country specific percentage of 57.4 in formed landfill gas for the period 1990-2004 and 50 percent for the period from 2005 onwards.

RIVM report 2020-0031
Page 485 of 525
Sector ID# draft ARR
Adressing/Not resolved/ New from 2019 review
Issue and/or problem classificationa[, b]
ERT 2019 assessment and rationale from draft ARR 2019
NLD Response in NIR /CRF
Paragraph or table number in: NIR, CRF and or Methodology report (MR)
justifications for the use of values of fraction of CH4 in the NIR (p.229). During the review, the Party provided further information for CH4 recovery (see ID# W.18 below), in response to a question raised by the ERT. The ERT noted that the percentage of methane in recovered landfill gas for the whole time series provided with an excel file is different compared to the reported information in the NIR. According to this information, the Party is using a constant country specific value (57.4 per cent) for the years 1990-2001, and varying country specific values between 45.5 and 54.5 per cent in recovered landfill gas for the remaining time series between 2002-2017. The ERT considers that providing the consistent and clear information for the use of values for fraction of CH4 in landfill gas throughout the time series in the NIR would resolve this issue.
Waste W.9 Addressing 5.A.1 Managed waste disposal sites – CH4
Report in the NIR the reasons for the decrease in DOC values throughout the time series, in particular between 2000 and 2001, and explain the low values reported for the period 2000–2015. ===== The Netherlands provided an explanation for the reson of decrease in DOC values from 2005 onward in section 7.2.2 of the NIR under
Specific paragraph on the use of country specific DOC and k-values is added to section 7.2.2.
NIR paragraph 7.2.2.
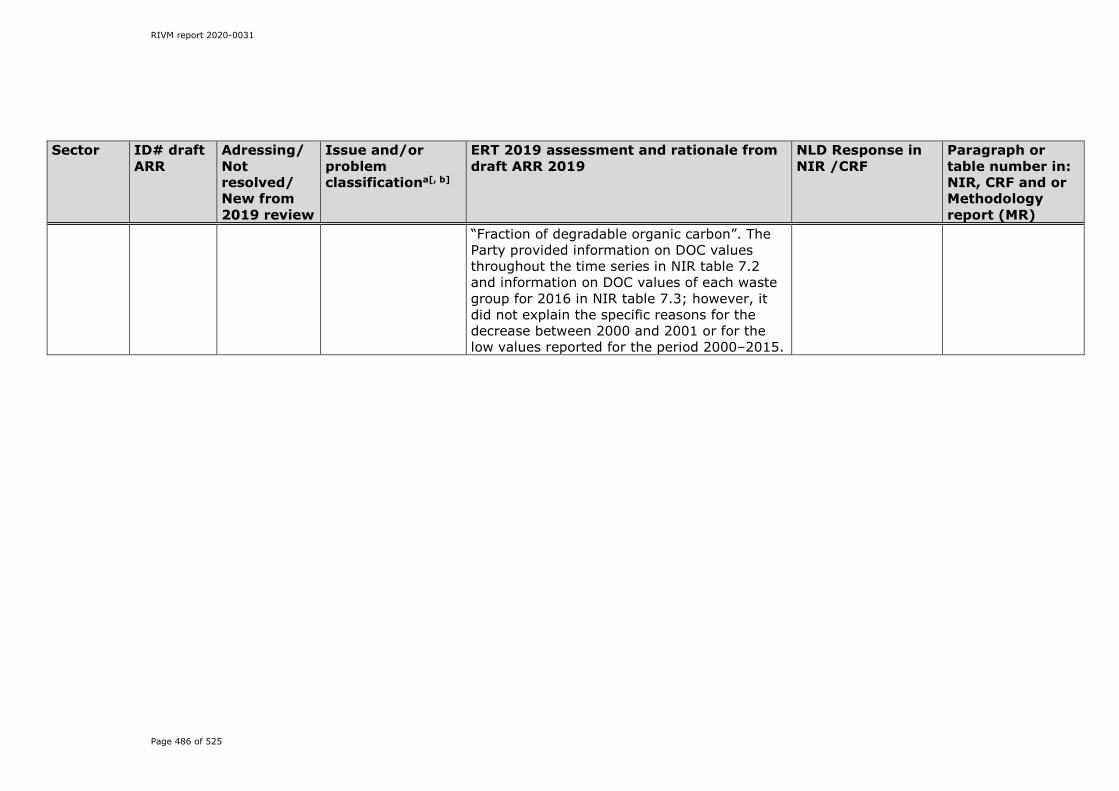
RIVM report 2020-0031
Page 486 of 525
Sector ID# draft ARR
Adressing/Not resolved/ New from 2019 review
Issue and/or problem classificationa[, b]
ERT 2019 assessment and rationale from draft ARR 2019
NLD Response in NIR /CRF
Paragraph or table number in: NIR, CRF and or Methodology report (MR)
“Fraction of degradable organic carbon”. The Party provided information on DOC values throughout the time series in NIR table 7.2 and information on DOC values of each waste group for 2016 in NIR table 7.3; however, it did not explain the specific reasons for the decrease between 2000 and 2001 or for the low values reported for the period 2000–2015.
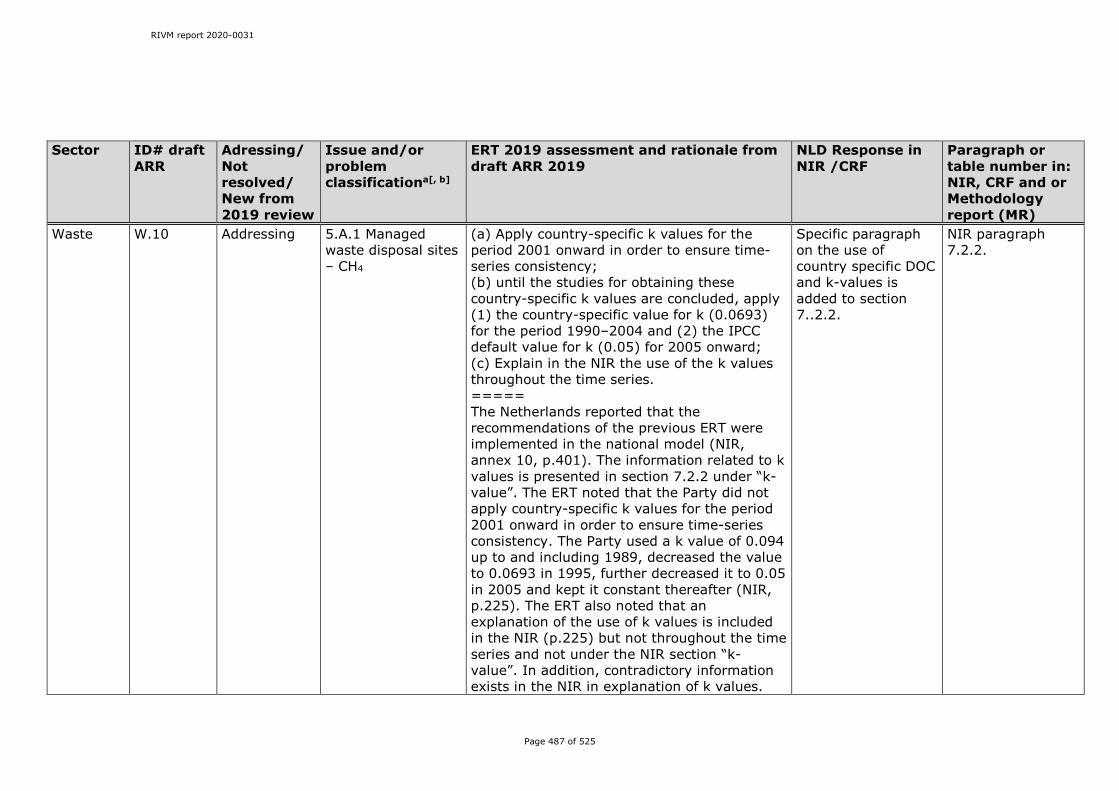
RIVM report 2020-0031
Page 487 of 525
Sector ID# draft ARR
Adressing/Not resolved/ New from 2019 review
Issue and/or problem classificationa[, b]
ERT 2019 assessment and rationale from draft ARR 2019
NLD Response in NIR /CRF
Paragraph or table number in: NIR, CRF and or Methodology report (MR)
Waste W.10
Addressing 5.A.1 Managed waste disposal sites – CH4
(a) Apply country-specific k values for the period 2001 onward in order to ensure time-series consistency; (b) until the studies for obtaining these country-specific k values are concluded, apply (1) the country-specific value for k (0.0693) for the period 1990–2004 and (2) the IPCC default value for k (0.05) for 2005 onward; (c) Explain in the NIR the use of the k values throughout the time series. ===== The Netherlands reported that the recommendations of the previous ERT were implemented in the national model (NIR, annex 10, p.401). The information related to k values is presented in section 7.2.2 under “k-value”. The ERT noted that the Party did not apply country-specific k values for the period 2001 onward in order to ensure time-series consistency. The Party used a k value of 0.094 up to and including 1989, decreased the value to 0.0693 in 1995, further decreased it to 0.05 in 2005 and kept it constant thereafter (NIR, p.225). The ERT also noted that an explanation of the use of k values is included in the NIR (p.225) but not throughout the time series and not under the NIR section “k-value”. In addition, contradictory information exists in the NIR in explanation of k values.
Specific paragraph on the use of country specific DOC and k-values is added to section 7..2.2.
NIR paragraph 7.2.2.

RIVM report 2020-0031
Page 488 of 525
Sector ID# draft ARR
Adressing/Not resolved/ New from 2019 review
Issue and/or problem classificationa[, b]
ERT 2019 assessment and rationale from draft ARR 2019
NLD Response in NIR /CRF
Paragraph or table number in: NIR, CRF and or Methodology report (MR)
According to page 228, “The k-value is a value for slowly degrading waste (wood, paper, textiles) in a wet and temperate climate zone. The IPCC default value (2006 IPCC Guidelines, vol. 5, table 3.3) is between 0.03 and 0.06, but a k-value of 0.05 is used in the Dutch model”. In NIR table 7.4, the k value is presented as 0.09 for 1990, 0.07 for 1995 and 2000, and 0.05 from 2005 onward. The ERT considers that the recommendation (b) is resolved but (a) and (c) are still not resolved. During the review, the Party confirmed that all the parameters used in the national model are described in the NIR (p.225). The Party also explained that it used a landfill gas model with country-specific values between 1990 and 2004. The country-specific k values were derived from a study by Oonk et al. in 1994. The k value was later adjusted in a study by Spakman (Spakman et al., 2003) owing to changes in the composition and degradability of waste. In 2010, the Netherlands tried to validate the country-specific values but the study concluded that it was not possible (Tauw, 2011). Therefore, the landfill model uses the IPCC default k values from 2005 onward. The assumption was made that the country-specific values are applicable until 2004.

RIVM report 2020-0031
Page 489 of 525
Sector ID# draft ARR
Adressing/Not resolved/ New from 2019 review
Issue and/or problem classificationa[, b]
ERT 2019 assessment and rationale from draft ARR 2019
NLD Response in NIR /CRF
Paragraph or table number in: NIR, CRF and or Methodology report (MR)
Waste W.11
Addressing 5.A.1 Managed waste disposal sites – CH4
(a) Derive country-specific DOCf values for the period 2001 onward in order to ensure time-series consistency; (b) Until the studies for obtaining these country-specific DOCf values are concluded, apply (1) the country-specific value for DOCf (0.58) for the period 1990–2004 and (2) the IPCC default value for DOCf (0.5) for 2005 onward; (c) Explain in the NIR the use of the DOCf values throughout the time series. ===== The Netherlands reported that the recommendations of the previous ERT were implemented in the national model (NIR, annex 10, p.401). The information related to DOCf values is presented in section 7.2.2 under “Degradable organic carbon that decomposes (DOCf)”. The ERT noted that the Party did not derive country-specific DOCf values for the period 2001 onward in order to ensure time-series consistency. The Party used a DOCf value of 0.58 for 1990–2004 and 0.5 for 2005 onward (NIR, p.225). The ERT also noted that an explanation of the use of DOCf values is included in the NIR (p.225) but not throughout the time series and not under the section “DOCf”. In addition, it is not clear in the NIR whether the previous ERT’s
Specific paragraph on the use of country specific DOC and k-values is added to section 7.2.2.
NIR section 7.2.2.

RIVM report 2020-0031
Page 490 of 525
Sector ID# draft ARR
Adressing/Not resolved/ New from 2019 review
Issue and/or problem classificationa[, b]
ERT 2019 assessment and rationale from draft ARR 2019
NLD Response in NIR /CRF
Paragraph or table number in: NIR, CRF and or Methodology report (MR)
recommendations have been implemented. The ERT noted inconsistent information between pages 225 and 227 of the NIR e.g., it is understood from the NIR (p.227) that the Party is using the IPCC default value of 0.5 for the whole time series. The ERT considers that the recommendation (b) is resolved but (a) and (c) are still not resolved. During the review, the Party confirmed that all the parameters used in the national model are described in the NIR (p.225): “Fraction of DOC actually dissimilated (DOCF): 0.58 until 2004 (see Oonk et al., 1994); decreasing to 0.5 in 2005 (IPCC parameter) and remaining constant thereafter”. The Party also explained that it used a landfill gas model with country-specific values between 1990 and 2004. The country-specific DOCf values were derived from a study by Oonk et al. in 1994. In 2010, the Netherlands tried to validate the country-specific values but the study concluded that it was not possible (Tauw, 2011). Therefore, the landfill model uses the IPCC default DOCf values from 2005 onward. The assumption was made that the country-specific values are applicable until 2004.
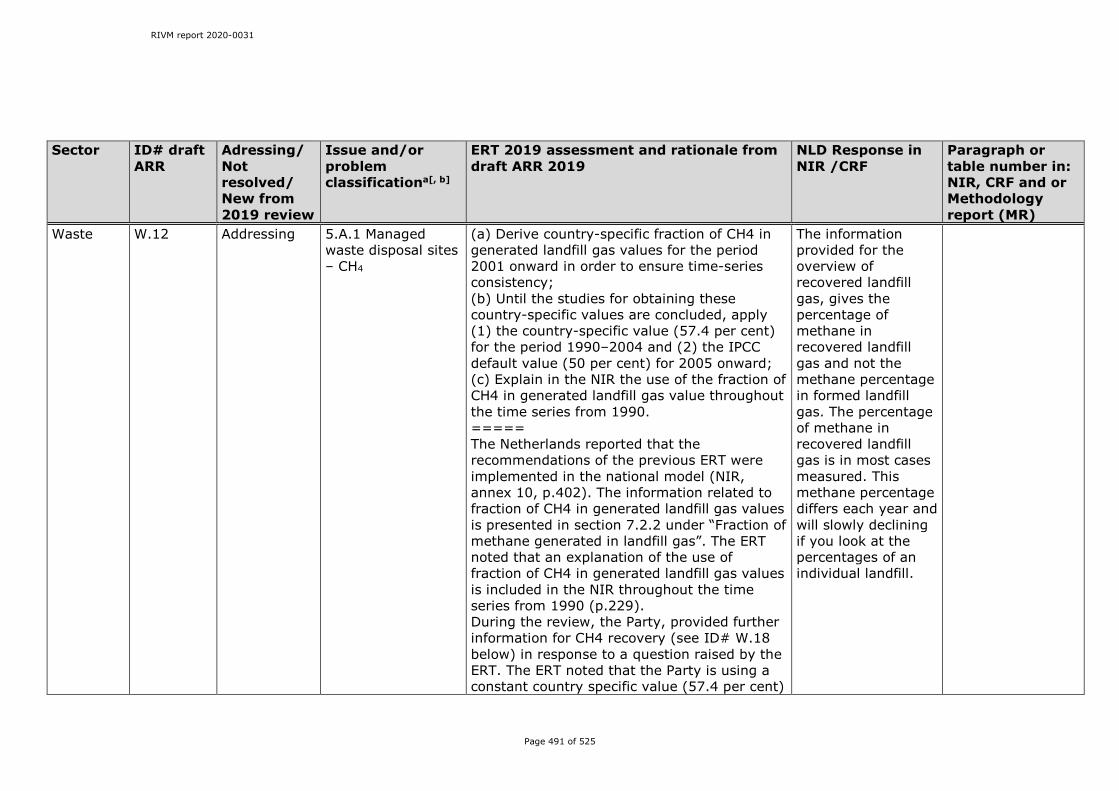
RIVM report 2020-0031
Page 491 of 525
Sector ID# draft ARR
Adressing/Not resolved/ New from 2019 review
Issue and/or problem classificationa[, b]
ERT 2019 assessment and rationale from draft ARR 2019
NLD Response in NIR /CRF
Paragraph or table number in: NIR, CRF and or Methodology report (MR)
Waste W.12 Addressing 5.A.1 Managed waste disposal sites – CH4
(a) Derive country-specific fraction of CH4 in generated landfill gas values for the period 2001 onward in order to ensure time-series consistency; (b) Until the studies for obtaining these country-specific values are concluded, apply (1) the country-specific value (57.4 per cent) for the period 1990–2004 and (2) the IPCC default value (50 per cent) for 2005 onward; (c) Explain in the NIR the use of the fraction of CH4 in generated landfill gas value throughout the time series from 1990. ===== The Netherlands reported that the recommendations of the previous ERT were implemented in the national model (NIR, annex 10, p.402). The information related to fraction of CH4 in generated landfill gas values is presented in section 7.2.2 under “Fraction of methane generated in landfill gas”. The ERT noted that an explanation of the use of fraction of CH4 in generated landfill gas values is included in the NIR throughout the time series from 1990 (p.229). During the review, the Party, provided further information for CH4 recovery (see ID# W.18 below) in response to a question raised by the ERT. The ERT noted that the Party is using a constant country specific value (57.4 per cent)
The information provided for the overview of recovered landfill gas, gives the percentage of methane in recovered landfill gas and not the methane percentage in formed landfill gas. The percentage of methane in recovered landfill gas is in most cases measured. This methane percentage differs each year and will slowly declining if you look at the percentages of an individual landfill.

RIVM report 2020-0031
Page 492 of 525
Sector ID# draft ARR
Adressing/Not resolved/ New from 2019 review
Issue and/or problem classificationa[, b]
ERT 2019 assessment and rationale from draft ARR 2019
NLD Response in NIR /CRF
Paragraph or table number in: NIR, CRF and or Methodology report (MR)
for the years 1990-2001, and varying country specific values for methane in recovered landfill gas between 45.5 and 54.5 per cent for the remaining time series between 2002-2017. The ERT considers that providing the consistent and clear information for the use of values for fraction of CH4 in landfill gas throughout the time series in the NIR would resolve this issue.
Waste W.14
Addressing 5.B.1 Composting – CH4
Ensure the consistency of the reported time series for the CH4 EF and include in the NIR the reason for the decrease in the CH4 EF after 2009. ===== The Netherlands in its annex 10 of NIR (p.399) referred to section 7.3.2 (pp.231–232) of NIR where the reason for decrease in the EF could be found. In the section 7.3.2 of the NIR, the Party explained that in 2010, an independent study on the CH4 EFs for composting was carried out in which it was compared with EFs in other, predominantly European, countries (DHV, 2010). The Party further explained that
As said the EF's for the years earlier can not be modified. Since 2009 the EF is kept at the same level.
NIR section 7.3.2.

RIVM report 2020-0031
Page 493 of 525
Sector ID# draft ARR
Adressing/Not resolved/ New from 2019 review
Issue and/or problem classificationa[, b]
ERT 2019 assessment and rationale from draft ARR 2019
NLD Response in NIR /CRF
Paragraph or table number in: NIR, CRF and or Methodology report (MR)
the CH4 EF for composting was modified as of the NIR of 2011 (on the basis of 2009 data) and the EF could not be modified retroactively on the basis of the DHV (2010) study and all other EFs are unchanged. The ERT noted that the reason for the decrease in the CH4 EF after 2009 was not included in the NIR as requested by the previous ERT. The ERT suggests using one of the recalculation techniques in 2006 IPCC Guidelines (vol. 1, ch. 5) to ensure time series consistency, noting that the use of such recalculation techniques may involve expert judgement regarding any changes (or lack of changes) in the practice of composting in the country.
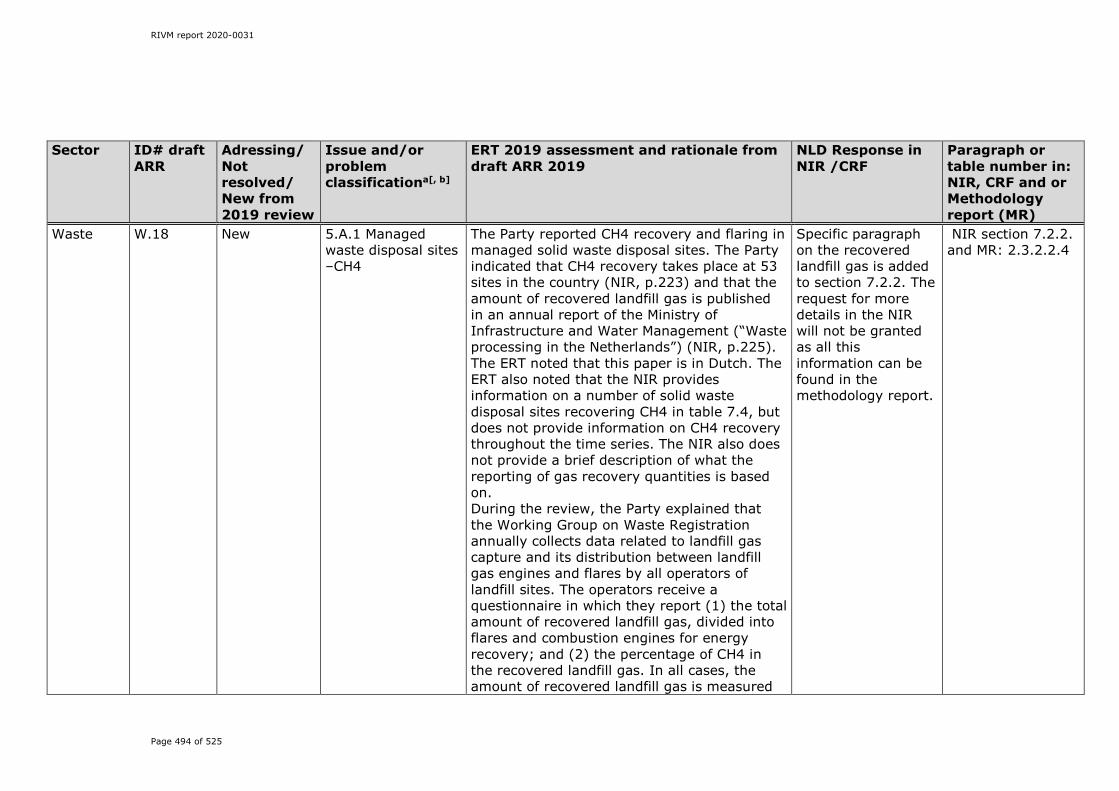
RIVM report 2020-0031
Page 494 of 525
Sector ID# draft ARR
Adressing/Not resolved/ New from 2019 review
Issue and/or problem classificationa[, b]
ERT 2019 assessment and rationale from draft ARR 2019
NLD Response in NIR /CRF
Paragraph or table number in: NIR, CRF and or Methodology report (MR)
Waste W.18
New 5.A.1 Managed waste disposal sites –CH4
The Party reported CH4 recovery and flaring in managed solid waste disposal sites. The Party indicated that CH4 recovery takes place at 53 sites in the country (NIR, p.223) and that the amount of recovered landfill gas is published in an annual report of the Ministry of Infrastructure and Water Management (“Waste processing in the Netherlands”) (NIR, p.225). The ERT noted that this paper is in Dutch. The ERT also noted that the NIR provides information on a number of solid waste disposal sites recovering CH4 in table 7.4, but does not provide information on CH4 recovery throughout the time series. The NIR also does not provide a brief description of what the reporting of gas recovery quantities is based on. During the review, the Party explained that the Working Group on Waste Registration annually collects data related to landfill gas capture and its distribution between landfill gas engines and flares by all operators of landfill sites. The operators receive a questionnaire in which they report (1) the total amount of recovered landfill gas, divided into flares and combustion engines for energy recovery; and (2) the percentage of CH4 in the recovered landfill gas. In all cases, the amount of recovered landfill gas is measured
Specific paragraph on the recovered landfill gas is added to section 7.2.2. The request for more details in the NIR will not be granted as all this information can be found in the methodology report.
NIR section 7.2.2. and MR: 2.3.2.2.4

RIVM report 2020-0031
Page 495 of 525
Sector ID# draft ARR
Adressing/Not resolved/ New from 2019 review
Issue and/or problem classificationa[, b]
ERT 2019 assessment and rationale from draft ARR 2019
NLD Response in NIR /CRF
Paragraph or table number in: NIR, CRF and or Methodology report (MR)
and only the percentage of CH4 in older landfill sites is sometimes estimated. In 2017, the CH4 content of recovered landfill gas was estimated for 13 landfill sites. The results of the questionnaire, by location, are published yearly in table B-5 of the above-mentioned report. For historical years, data on the amounts of extracted landfill gas were supplied up to 1998 by the Landfill Gas Advice Centre. There are no data available on the amounts of extracted landfill gas for the years 1999 and 2000. The amounts of extracted landfill gas for these years were estimated by ENINA on the basis of the figures from previous years. Since 2001, data on recovered landfill gas have been supplied by the Working Group on Waste Registration. The Party provided a table that gives an overview of the amounts recovered landfill gas, the average CH4 content and the amount flared for energy purposes. The Party also provided the ERT with an Excel file containing the amounts for the entire time series. The ERT recommends that the Netherlands provide in the NIR more detailed information on the sources of CH4 recovery and flaring data for the entire time series, as well as explanatory information on the amount of recovered CH4 that is estimated, calculated or
RIVM report 2020-0031
Page 496 of 525
Sector ID# draft ARR
Adressing/Not resolved/ New from 2019 review
Issue and/or problem classificationa[, b]
ERT 2019 assessment and rationale from draft ARR 2019
NLD Response in NIR /CRF
Paragraph or table number in: NIR, CRF and or Methodology report (MR)
measured.
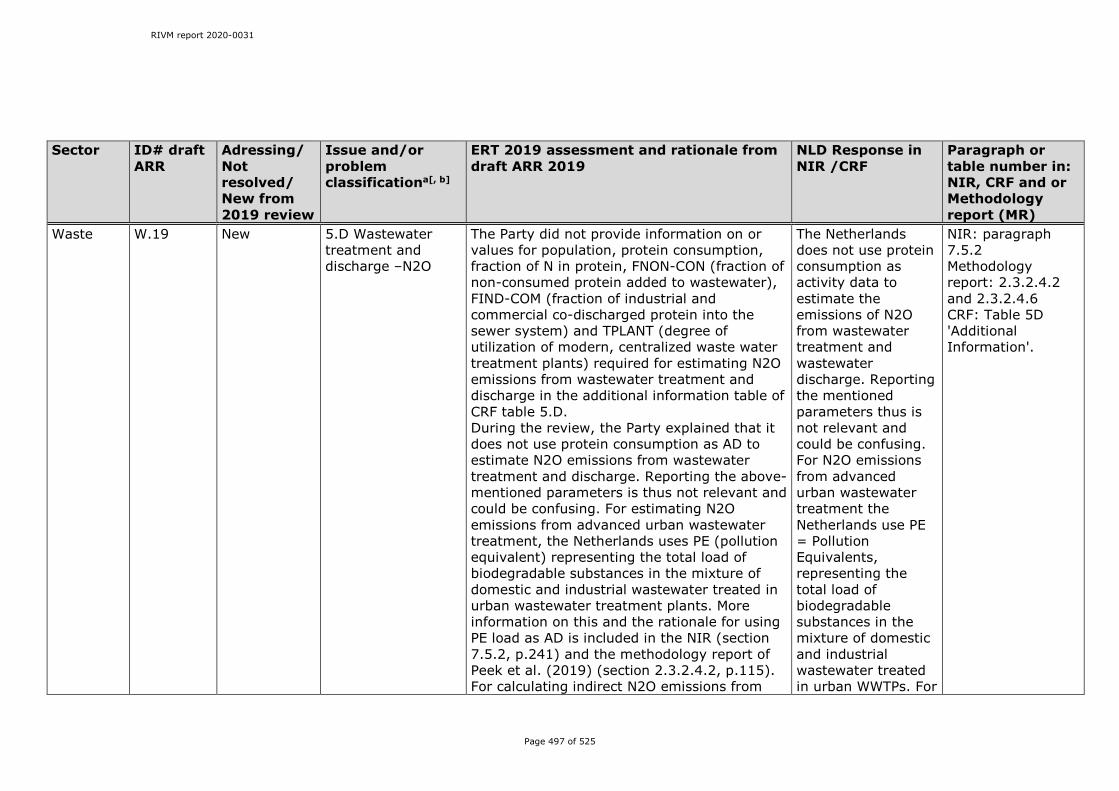
RIVM report 2020-0031
Page 497 of 525
Sector ID# draft ARR
Adressing/Not resolved/ New from 2019 review
Issue and/or problem classificationa[, b]
ERT 2019 assessment and rationale from draft ARR 2019
NLD Response in NIR /CRF
Paragraph or table number in: NIR, CRF and or Methodology report (MR)
Waste W.19 New 5.D Wastewater treatment and discharge –N2O
The Party did not provide information on or values for population, protein consumption, fraction of N in protein, FNON-CON (fraction of non-consumed protein added to wastewater), FIND-COM (fraction of industrial and commercial co-discharged protein into the sewer system) and TPLANT (degree of utilization of modern, centralized waste water treatment plants) required for estimating N2O emissions from wastewater treatment and discharge in the additional information table of CRF table 5.D. During the review, the Party explained that it does not use protein consumption as AD to estimate N2O emissions from wastewater treatment and discharge. Reporting the above-mentioned parameters is thus not relevant and could be confusing. For estimating N2O emissions from advanced urban wastewater treatment, the Netherlands uses PE (pollution equivalent) representing the total load of biodegradable substances in the mixture of domestic and industrial wastewater treated in urban wastewater treatment plants. More information on this and the rationale for using PE load as AD is included in the NIR (section 7.5.2, p.241) and the methodology report of Peek et al. (2019) (section 2.3.2.4.2, p.115). For calculating indirect N2O emissions from
The Netherlands does not use protein consumption as activity data to estimate the emissions of N2O from wastewater treatment and wastewater discharge. Reporting the mentioned parameters thus is not relevant and could be confusing. For N2O emissions from advanced urban wastewater treatment the Netherlands use PE = Pollution Equivalents, representing the total load of biodegradable substances in the mixture of domestic and industrial wastewater treated in urban WWTPs. For
NIR: paragraph 7.5.2 Methodology report: 2.3.2.4.2 and 2.3.2.4.6 CRF: Table 5D 'Additional Information'.
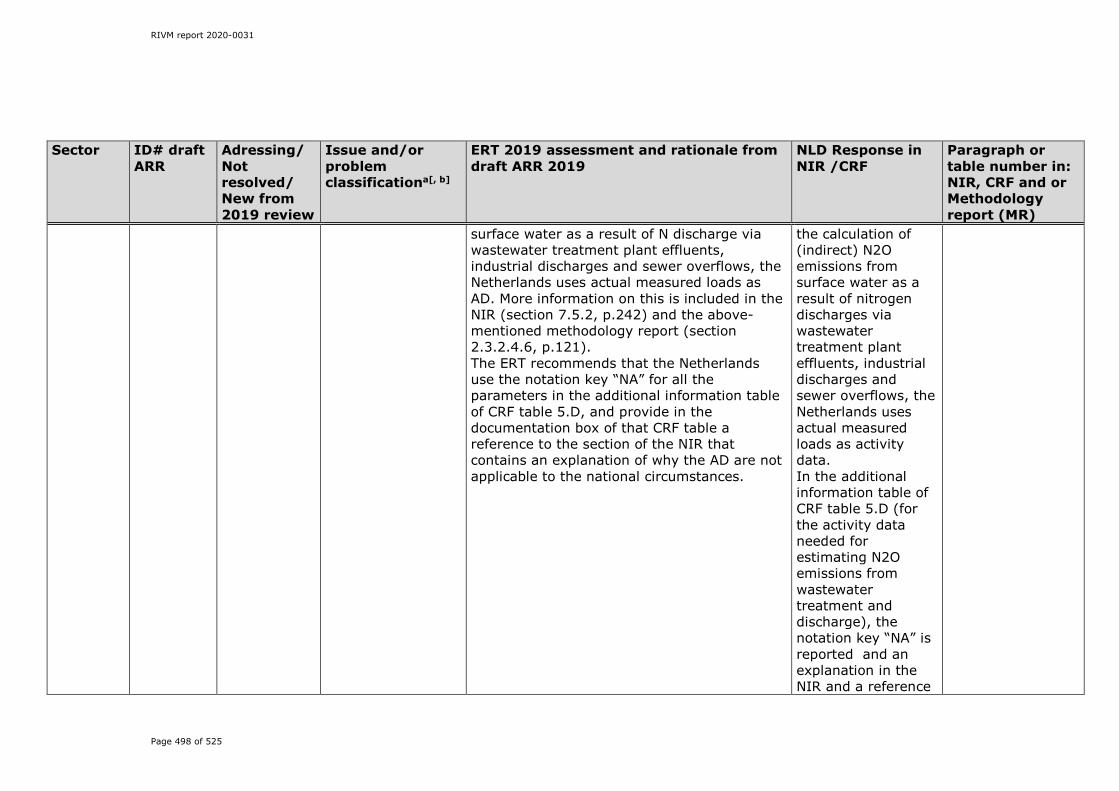
RIVM report 2020-0031
Page 498 of 525
Sector ID# draft ARR
Adressing/Not resolved/ New from 2019 review
Issue and/or problem classificationa[, b]
ERT 2019 assessment and rationale from draft ARR 2019
NLD Response in NIR /CRF
Paragraph or table number in: NIR, CRF and or Methodology report (MR)
surface water as a result of N discharge via wastewater treatment plant effluents, industrial discharges and sewer overflows, the Netherlands uses actual measured loads as AD. More information on this is included in the NIR (section 7.5.2, p.242) and the above-mentioned methodology report (section 2.3.2.4.6, p.121). The ERT recommends that the Netherlands use the notation key “NA” for all the parameters in the additional information table of CRF table 5.D, and provide in the documentation box of that CRF table a reference to the section of the NIR that contains an explanation of why the AD are not applicable to the national circumstances.
the calculation of (indirect) N2O emissions from surface water as a result of nitrogen discharges via wastewater treatment plant effluents, industrial discharges and sewer overflows, the Netherlands uses actual measured loads as activity data. In the additional information table of CRF table 5.D (for the activity data needed for estimating N2O emissions from wastewater treatment and discharge), the notation key “NA” is reported and an explanation in the NIR and a reference

RIVM report 2020-0031
Page 499 of 525
Sector ID# draft ARR
Adressing/Not resolved/ New from 2019 review
Issue and/or problem classificationa[, b]
ERT 2019 assessment and rationale from draft ARR 2019
NLD Response in NIR /CRF
Paragraph or table number in: NIR, CRF and or Methodology report (MR)
to the relevant section of the NIR is added in CRF table 5.D.
KP-LULUCF activities
KL.2
Addressing Afforestation and reforestation – CO2
(a) Ensure consistency between the values provided in the CRF tables and the NIR and correct errors, as necessary; (b) Correct the use of the notation keys and use them consistently throughout the NIR (i.e. use “NR” (“not reported”) for pools where the tier 1 “not a source principle” applies and for which a justification has been given in the NIR). ===== The Netherlands reported CSCs in litter as
Notation keys have been corrected in the CRF and NIR
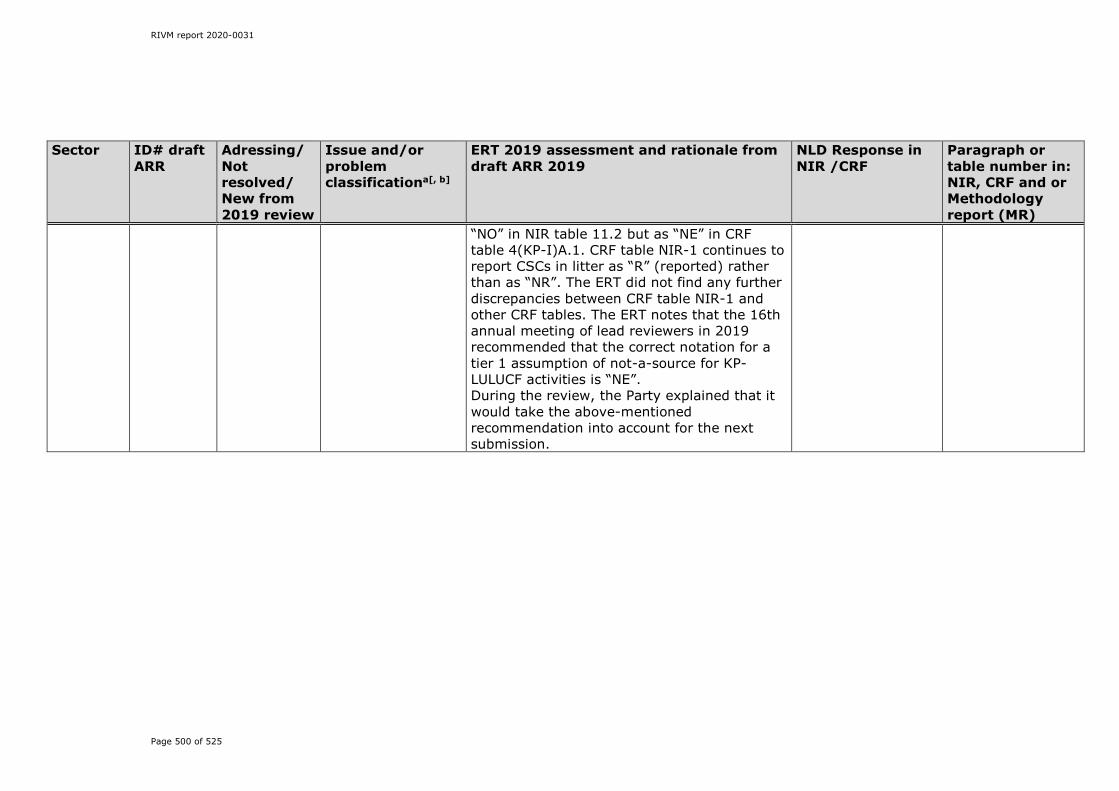
RIVM report 2020-0031
Page 500 of 525
Sector ID# draft ARR
Adressing/Not resolved/ New from 2019 review
Issue and/or problem classificationa[, b]
ERT 2019 assessment and rationale from draft ARR 2019
NLD Response in NIR /CRF
Paragraph or table number in: NIR, CRF and or Methodology report (MR)
“NO” in NIR table 11.2 but as “NE” in CRF table 4(KP-I)A.1. CRF table NIR-1 continues to report CSCs in litter as “R” (reported) rather than as “NR”. The ERT did not find any further discrepancies between CRF table NIR-1 and other CRF tables. The ERT notes that the 16th annual meeting of lead reviewers in 2019 recommended that the correct notation for a tier 1 assumption of not-a-source for KP-LULUCF activities is “NE”. During the review, the Party explained that it would take the above-mentioned recommendation into account for the next submission.
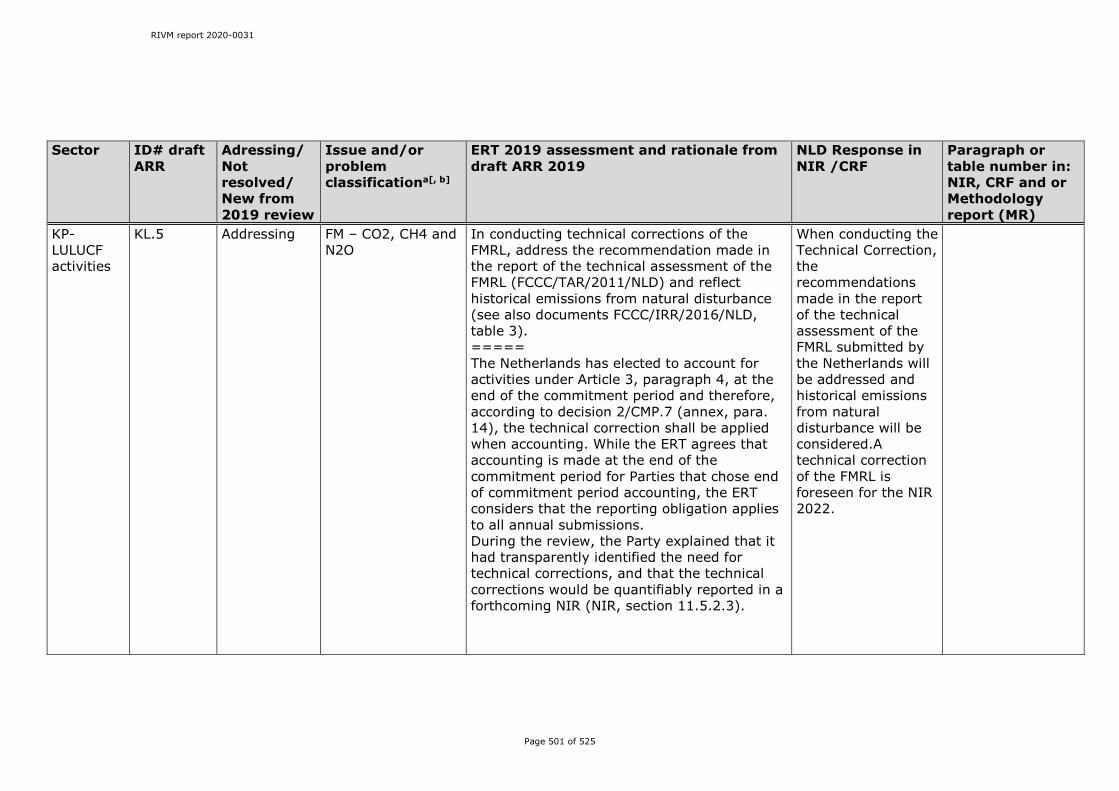
RIVM report 2020-0031
Page 501 of 525
Sector ID# draft ARR
Adressing/Not resolved/ New from 2019 review
Issue and/or problem classificationa[, b]
ERT 2019 assessment and rationale from draft ARR 2019
NLD Response in NIR /CRF
Paragraph or table number in: NIR, CRF and or Methodology report (MR)
KP-LULUCF activities
KL.5 Addressing FM – CO2, CH4 and N2O
In conducting technical corrections of the FMRL, address the recommendation made in the report of the technical assessment of the FMRL (FCCC/TAR/2011/NLD) and reflect historical emissions from natural disturbance (see also documents FCCC/IRR/2016/NLD, table 3). ===== The Netherlands has elected to account for activities under Article 3, paragraph 4, at the end of the commitment period and therefore, according to decision 2/CMP.7 (annex, para. 14), the technical correction shall be applied when accounting. While the ERT agrees that accounting is made at the end of the commitment period for Parties that chose end of commitment period accounting, the ERT considers that the reporting obligation applies to all annual submissions. During the review, the Party explained that it had transparently identified the need for technical corrections, and that the technical corrections would be quantifiably reported in a forthcoming NIR (NIR, section 11.5.2.3).
When conducting the Technical Correction, the recommendations made in the report of the technical assessment of the FMRL submitted by the Netherlands will be addressed and historical emissions from natural disturbance will be considered.A technical correction of the FMRL is foreseen for the NIR 2022.

RIVM report 2020-0031
Page 502 of 525
Sector ID# draft ARR
Adressing/Not resolved/ New from 2019 review
Issue and/or problem classificationa[, b]
ERT 2019 assessment and rationale from draft ARR 2019
NLD Response in NIR /CRF
Paragraph or table number in: NIR, CRF and or Methodology report (MR)
KP-LULUCF activities
KL.7
Addressing Harvested wood products – CO2
Provide in the NIR (1) information on the methodologies, parameters (e.g. half-lives) and assumptions used for the estimation of CO2 emissions from HWP; (2) an explanation of the treatment of HWP, including what is included or excluded as the emissions from HWP, and on which assumption their estimation is based in accounting those emissions; and, in particular, (3) information on the adherence to IPCC guidance in terms of the exclusion of imports and deforestation, inherent HWP, and the relationship between reporting under the Convention and the projection of HWP in the FMRL. ===== The Netherlands has provided the description of the calculation of HWP in the NIR (section 6.10) which resolved the issue (1) and (2), however the ERT noted that information was missing, specifically related to decision 2/CMP.8 on inherited emissions, emissions accounted for in the first commitment period, and the exclusion of imported HWP. The Netherlands has now provided in the NIR an explanation for HWP emissions being accounted for in the first commitment period and for the exclusion of imported HWP (section 11.4.5). However, the Party did not explain how inherited emissions are consistent
We disagree with the observation of the ERT that we misread the KP supplement on HWP from FM. We agree that the KP Supplement indicates that inherited emissions for AR need to be included starting from 1990. However, we also think the supplementary guidance is clear that for FM parties that projected the FMRL representing a BAU scenario may choose whether or not to include inherited emissions, and that parties need to indicate from which date the inherited emissions are considered - in

RIVM report 2020-0031
Page 503 of 525
Sector ID# draft ARR
Adressing/Not resolved/ New from 2019 review
Issue and/or problem classificationa[, b]
ERT 2019 assessment and rationale from draft ARR 2019
NLD Response in NIR /CRF
Paragraph or table number in: NIR, CRF and or Methodology report (MR)
with the projection of HWP in the FMRL. The NIR states that “material inflow is included from 1990 onwards” (p.282), which suggests that inherited emissions for products produced prior to 1990 have not been taken into account. The ERT noted the lack of AD on pre-1990 production in CRF table 4.Gs2. During the review, the Party explained that guidance in the Kyoto Protocol Supplement (section 2.8.3) identifies that data for FM must begin in 1990. The ERT considers that the provision for commencing in 1990 is only relevant to AR. For FM, the means of accounting for inherited emissions depends upon the construction of the FMRL and, unless an approach is taken that permits the exclusion of inherited emissions prior to the commencement of the commitment period, methods should make the best use of available AD, such as by using FAO data, which commences in 1961, or country-specific data, if available. The Party acknowledged that there is a methodological inconsistency between inherited emissions and the projection of HWP in the FMRL and that this would be addressed in a future technical correction. The ERT considers that this planned improvement should be either implemented or more transparently explained in the next NIR (see
our case 1990. Decision 2/CMP.7 indicates that in the case the forest management reference level is based on a projection, a Party may choose not to account for the emissions from harvested wood products originating from forests prior to the start of the second commitment period, and shall ensure consistency in the treatment of the harvested wood products pool in the second commitment period in accordance with paragraph 14 of 2/CMP.7. Since the FMRL of the Netherlands is based on a projection in our understanding it
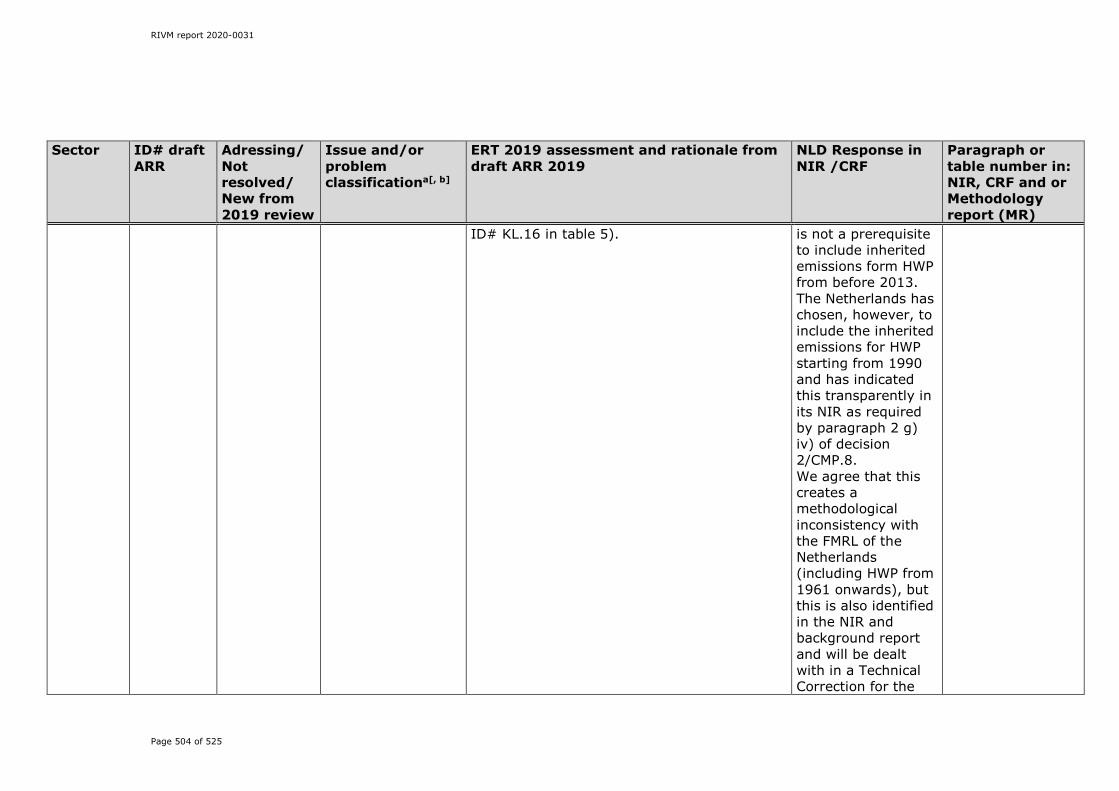
RIVM report 2020-0031
Page 504 of 525
Sector ID# draft ARR
Adressing/Not resolved/ New from 2019 review
Issue and/or problem classificationa[, b]
ERT 2019 assessment and rationale from draft ARR 2019
NLD Response in NIR /CRF
Paragraph or table number in: NIR, CRF and or Methodology report (MR)
ID# KL.16 in table 5). is not a prerequisite to include inherited emissions form HWP from before 2013. The Netherlands has chosen, however, to include the inherited emissions for HWP starting from 1990 and has indicated this transparently in its NIR as required by paragraph 2 g) iv) of decision 2/CMP.8. We agree that this creates a methodological inconsistency with the FMRL of the Netherlands (including HWP from 1961 onwards), but this is also identified in the NIR and background report and will be dealt with in a Technical Correction for the

RIVM report 2020-0031
Page 505 of 525
Sector ID# draft ARR
Adressing/Not resolved/ New from 2019 review
Issue and/or problem classificationa[, b]
ERT 2019 assessment and rationale from draft ARR 2019
NLD Response in NIR /CRF
Paragraph or table number in: NIR, CRF and or Methodology report (MR)
FMRL that will be reported in a forthcoming NIR.

RIVM report 2020-0031
Page 506 of 525
Sector ID# draft ARR
Adressing/Not resolved/ New from 2019 review
Issue and/or problem classificationa[, b]
ERT 2019 assessment and rationale from draft ARR 2019
NLD Response in NIR /CRF
Paragraph or table number in: NIR, CRF and or Methodology report (MR)
KP-LULUCF activities
KL.11 Not Resolved CH4 and N2O emissions from drained and rewetted organic soils – N2O
Provide estimates of the areas of afforestation and FM on organic soils where drainage might still be active, report the associated CO2 and N2O emissions in the CRF tables using IPCC default or country-specific EFs, and describe the applied methodology and IEF transparently in the NIR. ===== The Netherlands have reported that the N2O emissions are reported as “NE” in CRF table 4(KP-II)2 for AR, D and FM. During the review, the Party acknowledged that N2O emissions for organic soils under forest land should be reported under LULUCF and consequently also under AR and FM under KP-LULUCF, and indicated it would report the N2O emissions in CRF table 4(KP-II)2 in the next submission.
N2O emissions associated with drainage of organic soils under forest are now reported in Table 4(KP-II)2.
CRF Table 4(KP-II)2, NIR chapter 11.3 and Methodology report section 11.3

RIVM report 2020-0031
Page 507 of 525
Sector ID# draft ARR
Adressing/Not resolved/ New from 2019 review
Issue and/or problem classificationa[, b]
ERT 2019 assessment and rationale from draft ARR 2019
NLD Response in NIR /CRF
Paragraph or table number in: NIR, CRF and or Methodology report (MR)
KP-LULUCF activities
KL.12
New General (KP-LULUCF) – CO2, CH4, N2O
The ERT draws to the attention of the Party the outcomes of the 16th meeting of lead reviewers held in 2019, which include the recommendation that the correct notation key for reporting carbon pools for which the Party has reported verifiable information that the pool is “not a net source” under KP-LULUCF activities is “NE”. During the review, the Party noted that the meeting of lead reviewers occurred after the publication of its NIR, and that these outcomes would be taken into consideration for the next submission. The ERT recommends that the Netherlands use the notation key “NE” for cases where emissions are not reported on the basis of the justification that they are not a net source.
In those cases were notation keys were used to indicate not a source, the notation key was changed to 'NE'
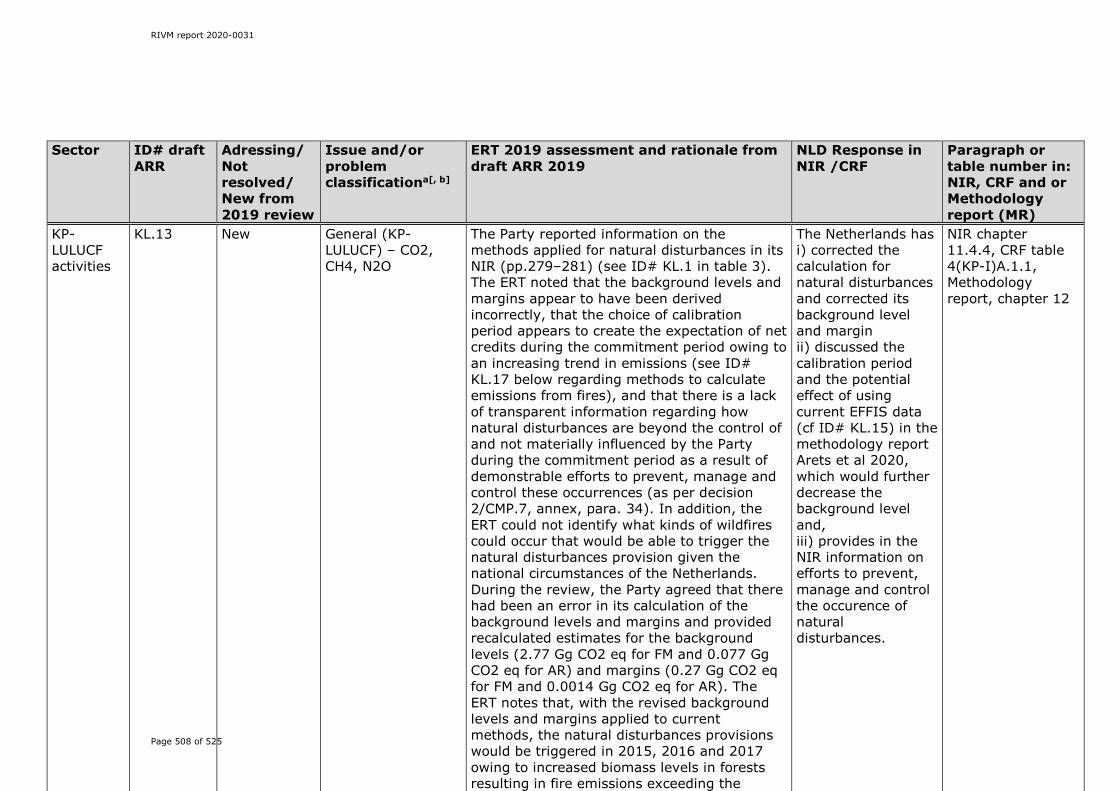
RIVM report 2020-0031
Page 508 of 525
Sector ID# draft ARR
Adressing/Not resolved/ New from 2019 review
Issue and/or problem classificationa[, b]
ERT 2019 assessment and rationale from draft ARR 2019
NLD Response in NIR /CRF
Paragraph or table number in: NIR, CRF and or Methodology report (MR)
KP-LULUCF activities
KL.13 New General (KP-LULUCF) – CO2, CH4, N2O
The Party reported information on the methods applied for natural disturbances in its NIR (pp.279–281) (see ID# KL.1 in table 3). The ERT noted that the background levels and margins appear to have been derived incorrectly, that the choice of calibration period appears to create the expectation of net credits during the commitment period owing to an increasing trend in emissions (see ID# KL.17 below regarding methods to calculate emissions from fires), and that there is a lack of transparent information regarding how natural disturbances are beyond the control of and not materially influenced by the Party during the commitment period as a result of demonstrable efforts to prevent, manage and control these occurrences (as per decision 2/CMP.7, annex, para. 34). In addition, the ERT could not identify what kinds of wildfires could occur that would be able to trigger the natural disturbances provision given the national circumstances of the Netherlands. During the review, the Party agreed that there had been an error in its calculation of the background levels and margins and provided recalculated estimates for the background levels (2.77 Gg CO2 eq for FM and 0.077 Gg CO2 eq for AR) and margins (0.27 Gg CO2 eq for FM and 0.0014 Gg CO2 eq for AR). The ERT notes that, with the revised background levels and margins applied to current methods, the natural disturbances provisions would be triggered in 2015, 2016 and 2017 owing to increased biomass levels in forests resulting in fire emissions exceeding the
The Netherlands has i) corrected the calculation for natural disturbances and corrected its background level and margin ii) discussed the calibration period and the potential effect of using current EFFIS data (cf ID# KL.15) in the methodology report Arets et al 2020, which would further decrease the background level and, iii) provides in the NIR information on efforts to prevent, manage and control the occurence of natural disturbances.
NIR chapter 11.4.4, CRF table 4(KP-I)A.1.1, Methodology report, chapter 12

RIVM report 2020-0031
Page 509 of 525
Sector ID# draft ARR
Adressing/Not resolved/ New from 2019 review
Issue and/or problem classificationa[, b]
ERT 2019 assessment and rationale from draft ARR 2019
NLD Response in NIR /CRF
Paragraph or table number in: NIR, CRF and or Methodology report (MR)
KP-LULUCF activities
KL.14 New Deforestation – CO2 The Party reported that it does not estimate the carbon accumulation in litter and, where the forest is less than 20 years old in deadwood, for lands under AR and consider this a conservative assumption given the lack of reliable data and the high uncertainties (NIR, section 11.3.1.2). The ERT noted that, where lands under AR are subsequently deforested during the commitment period, that assumpion may cease to be a conservative assumption as emissions from deforestation would be underestimated owing to the carbon accumulated in DOM prior to the commitment period not being included. During the review, the Party confirmed that no build-up of DOM is calculated or reported under AR in this way, and thus no emissions from DOM are calculated or reported when these lands are deforested. The ERT recommends that the Netherlands estimate and report the CO2 emissions associated with the loss of DOM from deforested lands previously classified under AR, or if this is not possible, justify why the exclusion of these emissions would not result in an underestimation of emissions from deforestation for the litter and deadwood pools.
Due to lack of data and the high uncertainties associated with it, the built-up of carbon in litter and dead wood is not estimated for lands under AR. As long as these units of land are considered land converted to forest lands under the UNFCCC reporting (i.e. the first 20 years after afforestation) deforestation of these units of land also does not result in losses of carbon from litter and dead wood. However, if deforestation occurs more than 20 years after deforestation, these units of land (which under the UNFCCC reporting
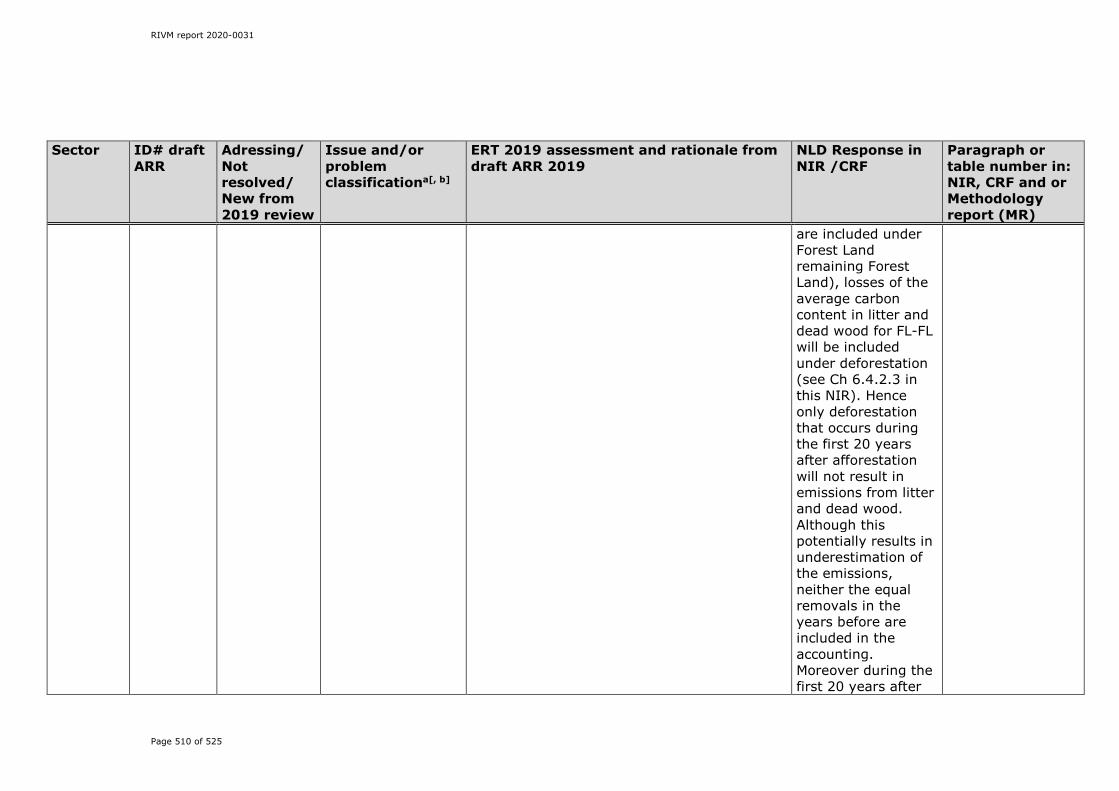
RIVM report 2020-0031
Page 510 of 525
Sector ID# draft ARR
Adressing/Not resolved/ New from 2019 review
Issue and/or problem classificationa[, b]
ERT 2019 assessment and rationale from draft ARR 2019
NLD Response in NIR /CRF
Paragraph or table number in: NIR, CRF and or Methodology report (MR)
are included under Forest Land remaining Forest Land), losses of the average carbon content in litter and dead wood for FL-FL will be included under deforestation (see Ch 6.4.2.3 in this NIR). Hence only deforestation that occurs during the first 20 years after afforestation will not result in emissions from litter and dead wood. Although this potentially results in underestimation of the emissions, neither the equal removals in the years before are included in the accounting. Moreover during the first 20 years after

RIVM report 2020-0031
Page 511 of 525
Sector ID# draft ARR
Adressing/Not resolved/ New from 2019 review
Issue and/or problem classificationa[, b]
ERT 2019 assessment and rationale from draft ARR 2019
NLD Response in NIR /CRF
Paragraph or table number in: NIR, CRF and or Methodology report (MR)
afforestsion carbon content in litter and dead wood is expected to be still limited.
KP-LULUCF activities
KL.15 New FM – CO2, CH4, N2O
In the CRF accounting table, the Party reported its FM cap as 7,811.94 kt CO2 eq. According to the report on the review of the report to facilitate the calculation of the assigned amount for the second commitment period of the Kyoto Protocol of the Netherlands, this value represents “3.5% of the total base-year GHG emissions excluding LULUCF, and including indirect CO2 emissions, final value, as calculated by the ERT based on the revised base-year GHG emissions” (FCCC/IRR/2016/NLD, table 4). In order to
The Netherlands has corrected the forest management cap provided in the CRF accounting table
CRF accounting table

RIVM report 2020-0031
Page 512 of 525
Sector ID# draft ARR
Adressing/Not resolved/ New from 2019 review
Issue and/or problem classificationa[, b]
ERT 2019 assessment and rationale from draft ARR 2019
NLD Response in NIR /CRF
Paragraph or table number in: NIR, CRF and or Methodology report (MR)
obtain the FM cap, this value needs to be multiplied by eight for the eight years of the commitment period, giving a value of 62,495.51 kt CO2 eq and it shall remain fixed for the second commitment period in accordance with the para 12 of decision 6/CMP.9. The ERT recommends that the Netherlands correctly report its FM cap as 62,495.51 kt CO2 eq, consistent with the information in the report on the review of the report to facilitate the calculation of the assigned amount for the second commitment period of the Kyoto Protocol of the Netherlands.
KP-LULUCF activities
KL.16 New Harvested wood products – CO2
The Party identified errors in the FAO forest products statistics (http://www.fao.org/forestry/statistics/en/) and made corrections to them using statistics provided by Probos, a Dutch source of statistics that provides information to FAO (NIR, p.283). The ERT notes that in accordance with the 2006 IPCC Guidelines (vol. 4, figure 12.1), Parties should use country-specific data sources and methods wherever possible. During the review, the Party explained that it uses FAO data as they are available in English and stored in a single database, and because Probos supplies FAO with the data.
This recommendation is currently being discussed with PROBOS, with an emphasis on how to guarantee transparancy of the used data. In forthcomming NIRs this will be addressed.

RIVM report 2020-0031
Page 513 of 525
Sector ID# draft ARR
Adressing/Not resolved/ New from 2019 review
Issue and/or problem classificationa[, b]
ERT 2019 assessment and rationale from draft ARR 2019
NLD Response in NIR /CRF
Paragraph or table number in: NIR, CRF and or Methodology report (MR)
The ERT recommends that the Netherlands consider full implementation of Probos as a country-specific data source or explain in the NIR why it has concluded that FAO data remain the superior source.

RIVM Report 2020-0031
Page 514 of 525
References
AgentschapNL, (2010): Nederlands afval in cijfers: gegevens 2000-2008 (Dutch waste statistics, data on 2000-2008), Agentschap NL Uitvoering Afvalbeheer, Utrecht. ISBN 978-90-5748-084-3. (In Dutch). Amstel, A.R. van et al., (1993): Methane, the other greenhouse gas. Research and policy in the Netherlands. RIVM report 481507-001, Bilthoven, the Netherlands, 1993 Amstel van, A.R., J.G.J. Olivier & P.G. Ruyssenaars (eds), (2000): Monitoring of greenhouse gases in the Netherlands: Uncertainty and priorities for improvement. Proceedings of a national workshop held in Bilthoven, the Netherlands, 1 September 1999. WIMEK report/RIVM report 773201003. Bilthoven. Arets, E. J. M. M., J. W. H. van der Kolk, G. M. Hengeveld, J. P. Lesschen, H. Kramer, P. J. Kuikman and M. J. Schelhaas, (2019): Greenhouse gas reporting of the LULUCF sector in the Netherlands. Methodological background, update 2019. WOt Technical report 146. Statutory Research Tasks Unit for Nature & the Environment (WOT Natuur & Milieu), Wageningen UR, Wageningen Arets, E. J. M. M., J. W. H. van der Kolk, G. M. Hengeveld, J. P. Lesschen, H. Kramer, P. J. Kuikman and M. J. Schelhaas, (2020): Greenhouse gas reporting of the LULUCF sector in the Netherlands. Methodological background, update 2020. WOt Technical report 168 Statutory Research Tasks Unit for Nature & the Environment (WOT Natuur & Milieu), Wageningen UR, Wageningen Baedts de, E.E.A. et al., (2001): Koudemiddelgebruik in Nederland. STEK, Baarn (in Dutch). Bannink, A., J. Dijkstra, J.A.N. Mills, E. Kebreab & J. France, (2005): Nutritional strategies to reduce enteric methane formation in dairy cows. Pp. 367–376. In: T. Kuczynski, U. Dämmgen, J. Webb and A. Myczko (eds), Emissions from European agriculture. Wageningen Academic Publishers, Wageningen. Bannink, A., (2011): Methane emissions from enteric fermentation by dairy cows, 1990–2008. Background document on the calculation method and uncertainty analysis for the Dutch National Inventory Report on Greenhouse Gas emissions. ASG report, Lelystad. Bannink, A., W.J. Spek, J. Dijkstra, and L.B.J. Šebek, (2018): A Tier 3 Method for Enteric Methane in Dairy Cows Applied for Fecal N Digestibility in the Ammonia Inventory, Frontiers in Sustainable Food Systems, 2.

RIVM Report 2020-0031
Page 515 of 525
Berdowski, J.J.M., G.P.J. Draaijers, L.H.J.M. Janssen, J.C.T. Hollander, M. van Loon, M.G.M. Roemer, A.T. Vermeulen, M. Vosbeek & H. Visser, (2001): Sources, regional scaling and validation of methane emissions from the Netherlands and Northwest Europe. NOP, NOP-MLK Series, RIVM report 410200084. Bilthoven Bikker, P., L.B. Šebek, C. van Bruggen, and O. Oenema, (2019): Stikstof- en fosfaatexcretie van gangbaar en biologisch gehouden landbouwhuisdieren. Herziening excretieforfaits Meststoffenwet 2019. Wettelijke Onderzoekstaken Natuur & Milieu, Wageningen, WOttechnical report 152 (draft). Boonekamp, P.G.M., H. Mannaerts, H.H.J. Vreuls & B. Wesselink, (2001): Protocol Monitoring Energiebesparing. ECN, ECN Report ECN-C-01-129, Petten; RIVM report 408137005. Bilthoven (in Dutch). Bruggen, C. van, A. Bannink, C.M. Groenestein, B.J. De Haan, J.F.M. Huijsmans, H.H. Luesink, S.M. Van der Sluis, G.L. Velthof, and J. Vonk, (2014): Emissies naar lucht uit de landbouw in 2012: Berekeningen met het model NEMA (in Dutch). WOt-technincal report 3. Wettelijke Onderzoekstaken Natuur & Milieu, Wageningen UR, Wageningen, the Netherlands. Van Bruggen, C., A. Bannink, C.M. Groenestein, J.M. Huijsmans, L.A. Lagerwerf, H.H. Luesink, S.M. van der Sluis, G.L. Velthof, and J. Vonk, (2019): Emissies naar lucht uit de landbouw in 2017: Berekeningen met het model NEMA (in Dutch). WOt-technical report 147. Wettelijke Onderzoekstaken Natuur & Milieu, Wageningen UR, Wageningen, the Netherlands Bruggen, C. van, A. Bannink, C.M. Groenestein, J.M. Huijsmans, L.A. Lagerwerf, H.H. Luesink, G.L. Velthof, and J. Vonk, (2020): Emissies naar lucht uit de landbouw in 2018: Berekeningen met het model NEMA (in Dutch). WOt-technical report ... (in prep). Wettelijke Onderzoekstaken Natuur & Milieu, Wageningen UR, Wageningen, the Netherlands CBS, (1988): Bedrijfsafvalstoffen, 1986. Kwartaalbericht Milieustatistieken (CBS), 5:14-18.
CBS, (1989): Bedrijfsafvalstoffen 1986. Voorburg, the Netherlands. CBS, (2011-2019): Dierlijke mest en mineralen 2009 t/m 2018 (C. van Bruggen; in Dutch). Statistics Netherlands, Den Haag/Heerlen, the Netherlands. CBS, (2012): Standardised calculation methods for animal manure and nutrients. Standard data 1990-2008. Statistics Netherlands, The Hague/Heerlen, the Netherlands. CBS, (2012a): Uncertainty analysis of mineral excretion and manure production. CBS, The Hague.

RIVM Report 2020-0031
Page 516 of 525
CBS, (2017a): Statline. Landbouw; gewassen, dieren en grondgebruik naar regio. Website, accessed 1 December 2017 (in Dutch). CBS, (2017b): O. Swertz, S. Brummelkamp (team Energy), J. Klein (team Environment), Norbert Ligterink (TNO): Adjustment of heating values and CO2 emission factors of petrol and diesel, 13 December 2017 CBS (2018): Statline. Afvalwaterzuivering bij bedrijven en instellingen (In Dutch). CBS, Den Haag. CBS, (2019): Dierlijke mest en mineralen 2018 (C. van Bruggen; in Dutch). Statistics Netherlands, Den Haag/Heerlen, the Netherlands. CBS (2019a): Statline. Urban waste water treatment per province and river basin district. CBS, Den Haag. CE Delft, (2014): Sample check of transport chapter of Netherlands National Inventory Report (NIR), Delft CE Delft, (2018): Peer review Dutch NIR 2018 (Focus on Reference Approach and waste incineration). Coop et al, (1995): Emissies van stortplaatsen (Emissions from landfill sites). VROM Hoofdinspectie Milieuhygiëne, Publicatie Emissieregistratie 28, Den Haag, (In Dutch). Daamen, W. & G.M. Dirkse, (2005): Veldinstructie. Meetnet Functie Vervulling (in Dutch). Deltares & TNO, (2016): Engine emissions from recreational boats (in Dutch), Utrecht. DHV, (2010): Update of emission factors for N2O and CH4 for composting, anaerobic digestion and waste incineration. Report MD-AF20100263/mk, July. DHV, Amersfoort. Dirkse, G.M., W.P. Daamen, H. Schoonderwoerd & J.M. Paasman, (2003): Meetnet Functievervulling bos – Het Nederlandse bos 2001–2002. Expertisecentrum LNV, Report EC-LNV 2003/231. Ede (in Dutch) Dijkstra, J., H.D.St.C. Neal, D.E. Beever & J. France, (1992): Simulation of nutrient digestion, absorption and outflow in the rumen: model description. Journal of Nutrition, 122: 2239–2256. Dröge, R, (2014): Update of the Netherlands list of fuels for the National Inventory Report 2015 and later. TNO 2014 R11919 EZK (Ministry of Economic Affairs and Climate Change), (2017a): Seventh Netherlands national communication under the United Nations Framework Convention on Climate Change (NC7). The Hague. EZK (Ministry of Economic Affairs and Climate Change), (2019a): The Netherlands fourth biennial report under the United Nations Framework Convention on Climate Change (BR4), The Hague

RIVM Report 2020-0031
Page 517 of 525
EZK, 2019b (Ministry of Economic Affairs and Climate Change): National energy and Climate Plan 2021-2030 (NECP) Finke, P.A., J.J. de Gruijter and R. Visschers, (2001): Status 2001 landelijke steekproef kaarteenheden en toepassingen. Alterra-rapport 389. Alterra, Wageningen. http://edepot.wur.nl/27713. (In Dutch) Geilenkirchen, G., M. ’t Hoen & M. Traa, (2017): Verkeer en vervoer in de Nationale Energieverkenning 2016. PBL Environmental Assessment Agency Netherlands, The Hague (in Dutch) Geilenkirchen, G., K. Roth, M. Sijstermans, J. Hulskotte, N. Ligterink, S. Dellaert, M. ’t Hoen, 2020: Methods for calculating the emissions of transport in the Netherlands. PBL Environmental Assessment Agency Netherlands, The Hague Groenestein, C.M., J. Mosquera & R.W. Melse, (2016): Methaanemissie uit mest. Schatters voor biochemisch methaan potentieel (BMP) en methaanconversiefactor (MCF). Livestock Research Report 961. Wageningen UR Livestock Research, Wageningen (in Dutch) Groot, W. J. M. de, R. Visschers, E. Kiestra, P. J. Kuikman and G. J. Nabuurs, (2005a): Nationaal systeem voor de rapportage van voorraad en veranderingen in bodem-C in relatie tot landgebruik en landgebruikveranderingen in Nederland aan de UNFCCC. Alterra-rapport 1035.3. Alterra, Wageningen, The Netherlands. http://edepot.wur.nl/21950. Groot, W.J.M. de, E. Kiestra, F. de Vries & P.J. Kuikman, (2005b): National system of greenhouse gas reporting for land use and land use change: Carbon stock changes in the Netherlands due to land use changes 1990–2000. Alterra report 1035-III. Alterra, Wageningen GWRC, (2011): N2O and CH4 emission from wastewater collection and treatment systems, Technical report 30-2011, STOWA/GWRC, London. ISBN 978.90.77622.24.7 Hanschke, C.B. et al., (2010): Peer review of the Dutch NIR 2010 for the category transport. ECN_BS—10-06, February. ECN, Petten. Harmelen, A.K. van & W.W.R. Koch, (2002): CO2 emission factors for fuels in the Netherlands. TNO report R2002/174 Heslinga, D.C. & A.K. van Harmelen, (2006): Vaststellingsmethodieken CO2 emissiefactoren voor aardgas in Nederland. TNO, Rapport no. R.2006/ Project no. 64101, Apeldoorn Hoek van der, K.W. & M.W. van Schijndel, (2006): Methane and nitrous oxide emissions from animal manure management, 1990–2003. Background document on the calculation method for the Dutch NIR. RIVM report 680125002; MNP report 500080002. Bilthoven
RIVM Report 2020-0031
Page 518 of 525
Hoek van der, K.W., M.W. van Schijndel & P.J. Kuikman, (2007): Direct and indirect nitrous oxide emissions from agricultural soils, 1990–2003. Background document on the calculation method for the Dutch NIR. RIVM report 680125003; MNP report 500080003. Bilthoven Honig E., Montfoort, J.A., Dröge, R., Guis, B., Baas, C., van Huet, B., van Hunnik O.R. & van den Berghe, A.C.W.M., (2020): Methodologies on the calculations of emissions from the sectors Energy, Industry and Waste - Update 2020, RIVM Report 2020-0040. Bilthoven Hulskotte, J., (2004): Protocol voor de jaarlijkse bepaling van de emissies van specifieke defensie-activiteiten conform de IPCC-richtlijnen. TNO-MEP, Apeldoorn (in Dutch) Hulskotte, J.H.J. & R.P. Verbeek, (2009): Emissiemodel Mobiele Machines gebaseerd op machineverkopen in combinatie met brandstof Afzet (EMMA). TNO-034-UT-2009-01782_RPT-MNL. TNO Bouw en Ondergrond, Utrecht (in Dutch) Huurman, J.W.F., (2005): Recalculation of Dutch stationary greenhouse gas emissions based on sectoral energy statistics 1990–2002. CBS, Voorburg IPCC, (2003a): LUCF sector good practice guidance. In: Penman, J. (ed.), IPCC Good Practice Guidance for Land Use, Land Use Change and Forestry. IPCC NGGIP Programme. IGES, Japan IPCC, (2006): 2006 IPCC Guidelines for national greenhouse gas inventories, prepared by the National Greenhouse Gas Inventories Programme. H.S. Eggleston, L. Buendia, K. Miwa, T. Ngara & K. Tanabe (eds). IGES, Japan IPCC, (2014): 2013 Revised supplementary methods and good practice guidance arising from the Kyoto Protocol. T. Hiraishi, T. Krug, K. Tanabe, N. Srivastava, J. Baasansuren, M. Fukuda & T.G. Troxler (eds). IPCC, Switzerland Jansen et al, (2019): Methods used for the Dutch Emission Inventory. Product usage by consumers, construction and services. RIVM Report 2019-0017. Bilthoven KIWA, (2015): Evaluatie emissiefactoren, GT-1402019. Evaluation of emission factors Gas distribution commissioned by Netbeheer Nederland. (In Dutch) Klein J., G. Geilenkirchen, J. Hulskotte, A. Hensema, P. Fortuin & H. Molnár-in ’t Veld, (2019): Methods for calculating the emissions of transport in the Netherlands. PBL Environmental Assessment Agency Netherlands, The Hague Kramer, H., (2019): Basiskaart Natuur 2017; Een landsdekkend basisbestand voor de terrestrische natuur in Nederland. WOt-technical report. Wettelijke Onderzoekstaken Natuur & Milieu Wageningen, The Netherlands.

RIVM Report 2020-0031
Page 519 of 525
Kramer, H. & J. Clement, (2015): Basiskaart Natuur 2013; Een landsdekkend basisbestand voor de terrestrische natuur in Nederland. WOt-technical report 41. Wettelijke Onderzoekstaken Natuur & Milieu Wageningen. Available via: http://edepot.wur.nl/356218. Kramer, H. and J. Clement, (2016): Basiskaart Natuur 2009 : een landsdekkend basisbestand voor de terrestrische natuur in Nederland. 2352-2739. Wettelijke Onderzoekstaken Natuur & Milieu, Wageningen. http://edepot.wur.nl/392811 Kramer, H. & G. van Dorland, (2009): Historisch Grondgebruik Nederland 1990. Een landelijke reconstructie van het grondgebruik rond 1990. Alterrarapport 1327. Alterra, Wageningen. Kramer, H., G.W. Hazeu & J. Clement, (2007): Basiskaart Natuur 2004. Vervaardiging van een landsdekkend basisbestand terrestrische natuur in Nederland. WOt-werkdocument 40. WOt Natuur & Milieu, Wageningen. Available via: http://edepot.wur.nl/39219. Kramer, H., G.J. van den Born, J.P. Lesschen, J. Oldengarm & I.J.J. van den Wyngaert, (2009): Land Use and Land Use Change for LULUCF-reporting under the Convention on Climate Change and the Kyoto Protocol. Alterra report 1916. Alterra, Wageningen. Kuikman, P. J., W. J. M. de Groot, R. F. A. Hendriks, J. Verhagen and F. de Vries, (2003): Stocks of C in soils and emissions of CO2 from agricultural soils in the Netherlands. Alterra-rapport 561. Alterra, Wageningen. http://edepot.wur.nl/85839. Kuikman, P.J., J.J.H. van den Akker & F. de Vries, (2005): Emissions of N2O and CO2 from organic agricultural soils. Alterra report 1035-2. Alterra, Wageningen. Kuiper, E. & A. Hensema, (2012): N2O emissies van wegverkeer. TNO-060-DTM-2012-02977. TNO, Delft (in Dutch). Lagerwerf, L.A., A. Bannink, C. van Bruggen, C. Groenestein, J. Huijsmans, J. van der Kolk, H. Luesink, S. Sluis, G. Velthof, and J. Vonk, (2019): Methodology for estimating emissions from agriculture in the Netherlands. Wettelijke Onderzoekstaken Natuur & Milieu, Wageningen UR, Wageningen, the Netherlands. Lampert et al, (2011): Klimarelevanz und Energieeffizienz der verwertung biogener Abfälle (KEVBA). Umwelbundesamt report 0353, Umweltbundesamt, Vienna (in German). Lesschen, J. P., H. I. M. Heesman, J. P. Mol-Dijkstra, A. M. van Doorn, E. Verkaik, I. J. J. van den Wyngaert and P. J. Kuikman, (2012): Mogelijkheden voor koolstofvastlegging in de Nederlandse landbouw en natuur. Alterra-rapport 2396. Alterra Wageningen UR, Wageningen, The Netherlands http://edepot.wur.nl/247683. Marin (2019) Sea shipping emissions (2017): Netherlands Continental Shelf, 12 Mile Zone and Port Areas, Wageningen: Marin.

RIVM Report 2020-0031
Page 520 of 525
Melse, R., and C. Groenestein (2016): Emissiefactoren mestbewerking: inschatting van emissiefactoren voor ammoniak en lachgas uit mestbewerking. Wageningen UR, Livestock Research Mills, J.A.N., J. Dijkstra, A. Bannink, S.B. Cammell, E. Kebreab & J. France, (2001): A mechanistic model of whole-tract digestion and methanogenesis in the lactating dairy cow: Model development, evaluation and application. Journal of Animal Science, 79: 1584–1597. Minnesota Pollution Control Agency, (2009): Minnesota air conditioner leak rate database, Model Year 2009. Minnesota Pollution Control Agency, September. Minnesota. Monteny, G.J. (Monteny Milieu Advies), (2008): Peer review Dutch NIR 2008. Renkum, March. Nagelhout, D., Wieringa, K. and Joosten, J.M. (1989): Afval 2000. National Institute of Public Health and Environment (RIVM), the Netherlands. NEa (2019): Rapportage Energie voor Vervoer in Nederland 2018. Nederlandse Emissieautoriteit, Den Haag. Neelis, M. & P. Blinde, (2009): Emission from industrial processes: Expert review of the draft Dutch NIR 2009. Ecofys International BV, Utrecht. Neelis, M.L., M.K. Patel, P.W. Bach & W.G. Haije, (2005): Analysis of energy use and carbon losses in the chemical and refinery industries. Report ECN-I-05-008. Energy Research Centre of the Netherlands, Unit Energy Efficiency in Industry, Petten, August. NL Agency (S. te Buck, B. van Keulen, L. Bosselaar & T. Gerlagh), (2010): Renewable Energy Monitoring Protocol Update 2010 (Methodology for the calculation and recording of the amounts of energy produced from renewable sources in the Netherlands), July. 2DENB1014. Utrecht. Olivier, J.G.J., L.J. Brandes & R.A.B. te Molder, (2009): Estimate of annual and trend uncertainty for Dutch sources of GHG emissions using the IPCC Tier 1 approach. PBL report 500080013. PBL, Bilthoven. Olsthoorn, X. & A. Pielaat, (2003): Tier 2 uncertainty analysis of the Dutch GHG emissions 1999. IVM report R03-06. Institute for Environmental Studies (IVM), Free University, Amsterdam. Oonk, H. (2004): Methaan- en lachgasemissies uit afvalwater [Methane and nitrous oxide emissions from wastewater], TNO report R2004/486 (in Dutch). Oonk, H. (2011): Peer review 2011 Dutch NIR. Apeldoorn. Oonk, H. (2016): Correction factor F for adsorption CO2 in leachate. Oonkay, Apeldoorn.
RIVM Report 2020-0031
Page 521 of 525
Oonk, H. (2020): Peer review 2020 Dutch National Inventory Report (NIR) on waste, Apeldoorn Oonk, H., A. Weenk, O. Coops & L. Luning, (1994): Validation of landfill gas formation models, TNO Institute of Environmental and Energy Technology, December, reference number 94-315. Os, J. van, L.J.J. Jeurissen, and H.H. Ellen (2019): Rekenregels pluimvee voor de Landbouwtelling : verantwoording van het gebruik van het Identificatie- & Registratiesysteem. WOt-technical report; No. 154 Wageningen: Wettelijke Onderzoekstaken Natuur & Milieu PBL, (2018): Balans van de Leefomgeving 2018. Nederland duurzaam vernieuwen. Den Haag: PBL (in Dutch). www. pbl.nl Productschappen Vee Vlees en Eieren, (2005): Productie en afvoer van paardenmest in Nederland (in Dutch). PWC, (2014): Handelstromenonderzoek 2013. Onderzoek naar het gebruik van fluorverbindingen in Nederland [Trade flow study 2013: Research into the use of fluor-based compounds in the Netherlands]. Utrecht, the Netherlands (in Dutch). Rail Cargo, (2007): Spoor in Cijfers 2007. Statistisch overzicht railgoederenvervoer. Rail Cargo, Hoogvliet (in Dutch). Rail Cargo, (2013): Spoor in Cijfers 2013. Rail Cargo, Hoogvliet (in Dutch). Ramírez-Ramírez, A., C. de Keizer & J.P. van der Sluijs, (2006): Monte Carlo analysis of uncertainties in the Netherlands’ greenhouse gas emission inventory for 1990–2004. Report NWS-E-2006-58. Department of Science, Technology and Society, Copernicus Institute for Sustainable Development and Innovation, Utrecht University, Utrecht, July. Reumermann, P.J. & B. Frederiks, B., (2002): Proceedings 12th European conference on Biomass for Energy, Industry and Climate protection. Amsterdam. Rijkswaterstaat, (2014): Onzekerheid emissies afval, voor stortplaatsen, AVI's en composteren en vergisten. - Utrecht : RWS Water, Verkeer en Leefomgeving, 2014. Rapport 978-94-91750-08-3. (Dutch only). Rijkswaterstaat, (2017): Afvalverwerking in Nederland, gegevens 2016, Werkgroep Afvalregistratie, Utrecht (ISBN 978-94-91750-18-2) (in Dutch). Rijkswaterstaat, (2018): Afvalverwerking in Nederland, gegevens 2017, Werkgroep Afvalregistratie, Utrecht (ISBN 978-94-91750-21-2) (in Dutch). Rijkswaterstaat, (2020): Afvalverwerking in Nederland, gegevens 2018, Werkgroep Afvalregistratie, Utrecht (in Dutch), in prep.

RIVM Report 2020-0031
Page 522 of 525
Rioned, (2001): Riool in cijfers 2000-2001 (Urban Drainage Statistics 2000-2001). Stichting Rioned, Ede. Available via www.riool.net. In Dutch Rioned, (2009): Urban drainage statistics 2009–2010. Available via: http://www.riool.net/riool/binary/retrieveFile?itemid=1089. Rioned, (2016): Het nut van stedelijk waterbeheer; Monitor gemeentelijke watertaken. Stichting Rioned, November (ISBN 97-890-73645-57-8, in Dutch). RIVM, (1999): Meten, rekenen en onzekerheden. De werkwijze van het RIVM Milieuonderzoek. RIVM report 408129 005 (main report and addendum). Bilthoven (in Dutch). RIVM, (2019): Werkplan Emissieregistratie 2019–2020. RIVM, Bilthoven (in Dutch). Roemer, M. & O. Tarasova, (2002): Methane in the Netherlands – an exploratory study to separate time scales. TNO report R2002/215. TNO, Apeldoorn. Roemer, M., Th. Thijsse & T. van der Meulen, (2003): Verificatie van methaan emissies. ArenA, Journal of the Netherlands Association of Environmental Professionals (VVM), Den Bosch (in Dutch). Roerink, G. J. & E.J.M.M. Arets, (2016): Detectie en monitoring van natuurbranden met behulp van satellietbeelden. Verkenning van mogelijke benaderingen. Wageningen University and Research, Wageningen, The Netherlands. (https://edepot.wur.nl/512717) Royal HaskoningDHV, (2013): Greenhouse gas emissions industrial processes NIR 2013, Peer review, BB4392-100-100/R/900425/Rott. Ruijter, F. de, and J. Huijsmans (2019): A methodology for estimating the ammonia emission from crop residues at a national scale, Atmospheric Environment: X: 100028. Ruyssenaars P.G, P.W.H.G. Coenen, P.J. Zijlema, E.J.M.M. Arets, K. Baas, R. Dröge, G. Geilenkirchen, M. ’t Hoen, E. Honig, B. van Huet, E.P. van Huis, W.W.R. Koch, L.A. Lagerwerf, R.M. te Molder, J.A. Montfoort, C.J. Peek, J. Vonk, M.C. van Zanten, (2019): Greenhouse gas emissions in the Netherlands 1990 – 2017. National Inventory Report 2019, RIVM, Bilthoven. RVO, (2018): Handreiking bedrijfsspecifieke excretie melkvee RVO, Utrecht RVO, (2019): The Netherlands National System: QA/QC programme 2019/2020, version 14.0, December 2019 (available at Netherlands Enterprise Agency (RVO) for review purposes).

RIVM Report 2020-0031
Page 523 of 525
Scheffer, C.B. & W.J. Jonker, (1997): Uittreksel van interne TNO-handleiding voor het vaststellen van verbrandingsemissies, herziening January 1997 (in Dutch). Schelhaas M.J., A. Schuck, S. Varis, S. Zudin, (2003): Database on Forest Disturbances in Europe (DFDE) – Technical Description. European Forest Institute, Joensuu Finland. Internal report 14. Available via: http://dataservices.efi.int/dfde/. Schelhaas, M., A.P.P.M. Clerkx, W.P. Daamen, J.F. Oldenburger, G. Velema, P. Schnitger, H. Schoonderwoerd & H. Kramer, (2014): Zesde Nederlandse bosinventarisatie: methoden en basisresultaten. Alterra-rapport 2545. Alterra Wageningen UR, Wageningen. Available via: http://edepot.wur.nl/307709 (in Dutch). Schelhaas, M. J., S. Clerkx, H. Schoonderwoerd, W. Daamen and J. Oldenburger. (2018): Meer hout uit het Nederlandse bos. Vakblad Natuur Bos Landschap. April 2018:14-17. Schijndel, M. van & Van der Sluis, S., (2011): Emissiefactoren voor de berekening van directe lachgasemissies uit landbouwbodems en als gevolg van beweiding. Achtergrondnotitie bij de National Inventory Report 2011 (in Dutch). Schoonderwoerd, H. & W.P. Daamen, (1999): Houtoogst en bosontwikkeling in het Nederlandse bos: 1984–1997. Reeks: HOSP, Bosdata nr 3. Stichting Bosdata, Wageningen (in Dutch). Schoots, K. & P. Hammingh (2019): Climate and Energy Outlook 2019. PBL Netherlands Environmental Assessment Agency, The Hague. Schulp, C.J.E., G.-J. Nabuurs, P.H. Verburg & R.W. de Waal, (2008): Effect of tree species on carbon stocks in forest floor and mineral soil and implications for soil carbon inventories. Forest Ecology and Management 256:482-490. Available via: http://dx.doi.org/10.1016/j.foreco.2008.05.007. Sempos, I. (2018): Note on fossil carbon content in biofuels. IPCC Working Group I, 10 October 2018 Smink, W., (2005): Calculated methane production from enteric fermentation in cattle excluding dairy cows. FIS background document. SenterNovem, Utrecht. Spakman, J., M.M.J. Van Loon, R.J.K. Van der Auweraert, D.J. Gielen, J.G.J. Olivier & E.A. Zonneveld, (2003): Method for calculating GHG emissions. Emission Registration Report 37b, March, electronic update of original report 37 of July 1997. VROM-HIMH, The Hague (only available electronically in Dutch and in English at: http://english.rvo.nl/nie). Spoelstra, H., (1993): N2O emissions from combustion processes used in the generation of electricity. NOP report 410100049KEMA. Arnhem/RIVM, Bilthoven.

RIVM Report 2020-0031
Page 524 of 525
STOWA, (2014): Luchtgerelateerde emissies vanuit rwzi’s in het kader van i-PRTR. STOWA report 2014-09. Amersfoort, 2014 (in Dutch). SVA, (1973): Inventarisatie benodigde stortruimte. Amersfoort. Swertz, O., S. Brummelkamp, J. Klein & N. Ligterink, (2018): Adjustment of heating values and CO2 emission factors of petrol and diesel, Statistics Netherlands, The Hague. Tauw, (2005): Achtergronden bij het advise Nazorg Voormalige Stortplaatsen (NAVOS). Deventer, 2005 (in Dutch).
Tauw, (2011): Validatie van het nationale stortgas emissiemodel (Validation of the national landfill gas emission model). Deventer, 2011. (In Dutch. UNFCCC, (2013): Decision 24/CP.19 Annex III Global Warming Potential Values VITO, (2019): Peer review 2019 GHG emissions transport, Mol: VITO. Velthof, G., A. Brader, and O. Oenema (1996): Seasonal variations in nitrous oxide losses from managed grasslands in The Netherlands, Plant and Soil, 181: 263-274. Velthof, G.L., J. Mosquera, and E.W.J. Hummelink (2010): Effect of manure application technique on nitrous oxide emission from agricultural soils. Alterra report 1992. Alterra Wageningen UR, Wageningen, the Netherlands. Velthof, G.L. & J. Mosquera, (2011): Calculation of nitrous oxide emission from agriculture in the Netherlands. Update of emission factors and leaching fraction. Alterra report 2151. Alterra, Wageningen. Visschedijk, A.J.H., Meesters, J.A.J., Nijkamp, M.M., Jansen, B.I., Koch, W.W.R., Dröge, R., (2020): Methods used for the Dutch Emission Inventory. Product usage by consumers, construction and services. RIVM Report 2020-0041. Bilthoven. Visser, H., (2005): The significance of climate change in the Netherlands. An analysis of historical and future trends (1901–2020) in weather conditions, weather extremes and temperature-related impacts. MNP report 550002007. Bilthoven. Vries, F. de, W. J. M. de Groot, T. Hoogland and J. Denneboom. (2003): De Bodemkaart van Nederland digitaal; toelichting bij inhoud, actualiteit en methodiek en korte beschrijving van additionele informatie. Alterra-rapport 811. Alterra, Wageningen. http://edepot.wur.nl/21850. Vries, F. de, (2004): The expansion of peat soils (In Dutch: De verbreiding van veengronden). In: A.J. van Kekem (ed.), Veengronden en stikstofleverend vermogen. Alterra report 965. Alterra, Wageningen.

RIVM Report 2020-0031
Page 525 of 525
Vries, F. de, D. J. Brus, B. Kempen, F. Brouwer and A. H. Heidema. (2014): Actualisatie bodemkaart veengebieden : deelgebied en 2 in Noord Nederland. 1566-7197. Alterra, Wageningen-UR, Wageningen. http://edepot.wur.nl/314315 Vries F. de, J.P. Lesschen & J. van der Kolk, (2016): Conditie van moerige gronden in Nederland - Broeikasgasemissies door het verdwijnen van veenlagen. Alterra rapport. Alterra Wageningen UR, Wageningen (in Dutch). Waal de, R.W., F.K. van Evert, J.G.J. Olivier, B. van Putten, C.J.E. Schulp and G.J. Nabuurs, (2012): Soil carbon dynamics and variability at the landscape scale: its relation to aspects of spatial distribution in national emission databases. Programme office Climate changes Spation Planning http://edepot.wur.nl/289947. WBCSD/WRI (World Business Council for Sustainable Development/World Resources Institute), (2004): Calculating direct GHG emissions from primary aluminium metal production. Guide to calculation worksheets. Available at GHG Protocol Initiative website: www.ghgprotocol.org/standard/tools.htm. Wever, D., (2011): QA/QC of outside agencies in the Greenhouse Gas Emission Inventory. Update of the background information in the Netherlands National System. RIVM report 680355005/2011. Bilthoven. Wever, D., P.W.H.G. Coenen, R. Dröge, G.P. Geilenkirchen, M.t. Hoen E. Honig, W.W.R. Koch, A.J. Leekstra, L.A. Lagerwerf, R.A.B.t. Molder, C.J. Peek, W.L.M. Smeets, and J. Vonk (2020): Informative Inventory Report 2020: Emissions of transboundary air pollutants in the Netherlands 1990-2018. RIVM report 2018-0013 National Institute for Public Health and the Environment, Bilthoven, the Netherlands Wijdeven, S.M.J., M.J. Schelhaas, A.F.M. Olsthoorn, R.J. Bijlsma & K. Kramer, (2006): Bosbrand en terreinbeheer – een verkenning. Alterra, Wageningen (in Dutch). Wyngaert, I.J.J. van den, E.J.M.M. Arets, H. Kramer, P.J. Kuikman and J.P. Lesschen. (2012). Greenhouse gas reporting of the LULUCF sector: background to the Dutch NIR 2012. Alterra-report 1035.9. Alterra, Wageningen UR, Wageningen. YU & CLODIC, (2008): Generic approach of refrigerant HFC-134a emission modes from MAC systems. Laboratory tests, fleet tests and correlation factor. Centre for energy and processes, Ecole des Mines de Paris. 23 October. Zijlema, P.J., (2020): The Netherlands: list of fuels and standard CO2 emission factors, version January 2020, RVO, Utrecht.

0119
42
Committed to health and sustainability
Published by
National Institute for Public Healthand the Environment, RIVMP.O. Box 1 | 3720 BA BilthovenThe Netherlandswww.rivm.nl/en
April 2020
RIVM Report 2020-0031
P.G. Ruyssenaars | P.W.H.G. Coenen1 | J.D. Rienstra² | P.J. Zijlema² | E.J.M.M. Arets⁶ | K. Baas³ | R. Dröge¹ | G. Geilenkirchen⁵ | M. ’t Hoen⁵ | E. Honig | B. van Huet⁷ | E.P. van Huis⁴| W.W.R. Koch¹ |L.L. Lagerwerf | R.A. te Molder | J.A. Montfoort | C.J. Peek | J. Vonk | M.C. van Zanten
¹ Netherlands Organization for Applied Scientific Research (TNO), P.O. Box 80015, NL-3508 TA Utrecht² Netherlands Enterprise Agency (RVO.nl), P.O. Box 8242, NL-3503 RE Utrecht³ Statistics Netherlands (in Dutch: ‘Centraal Bureau voor de Statistiek’, CBS), P.O. Box 24500, NL-2490 HA Den Haag⁴ Dutch Emissions Authority (NEa), P.O. Box 91503, NL-2509 EC Den Haag⁵ PBL Netherlands Environmental Assessment Agency, P.O. Box 30314 NL-2500 GH Den Haag⁶ Wageningen Environmental Research (Alterra) Wageningen UR, P.O. Box 47 NL-6700 AA Wageningen⁷ Rijkswaterstaat, P.O. Box 2232, NL-3500 GE Utrecht
Greenhouse gas emissions inthe Netherlands 1990–2018National Inventory Report 2020
draft15 January 2020


