Second Quarter Results 2021
34
Second Quarter Results 2021 July 2021
Transcript of Second Quarter Results 2021
Second Quarter Results 2021July 2021
Disclaimer
Disclaimer
This presentation may contain forward-looking information and statements
2
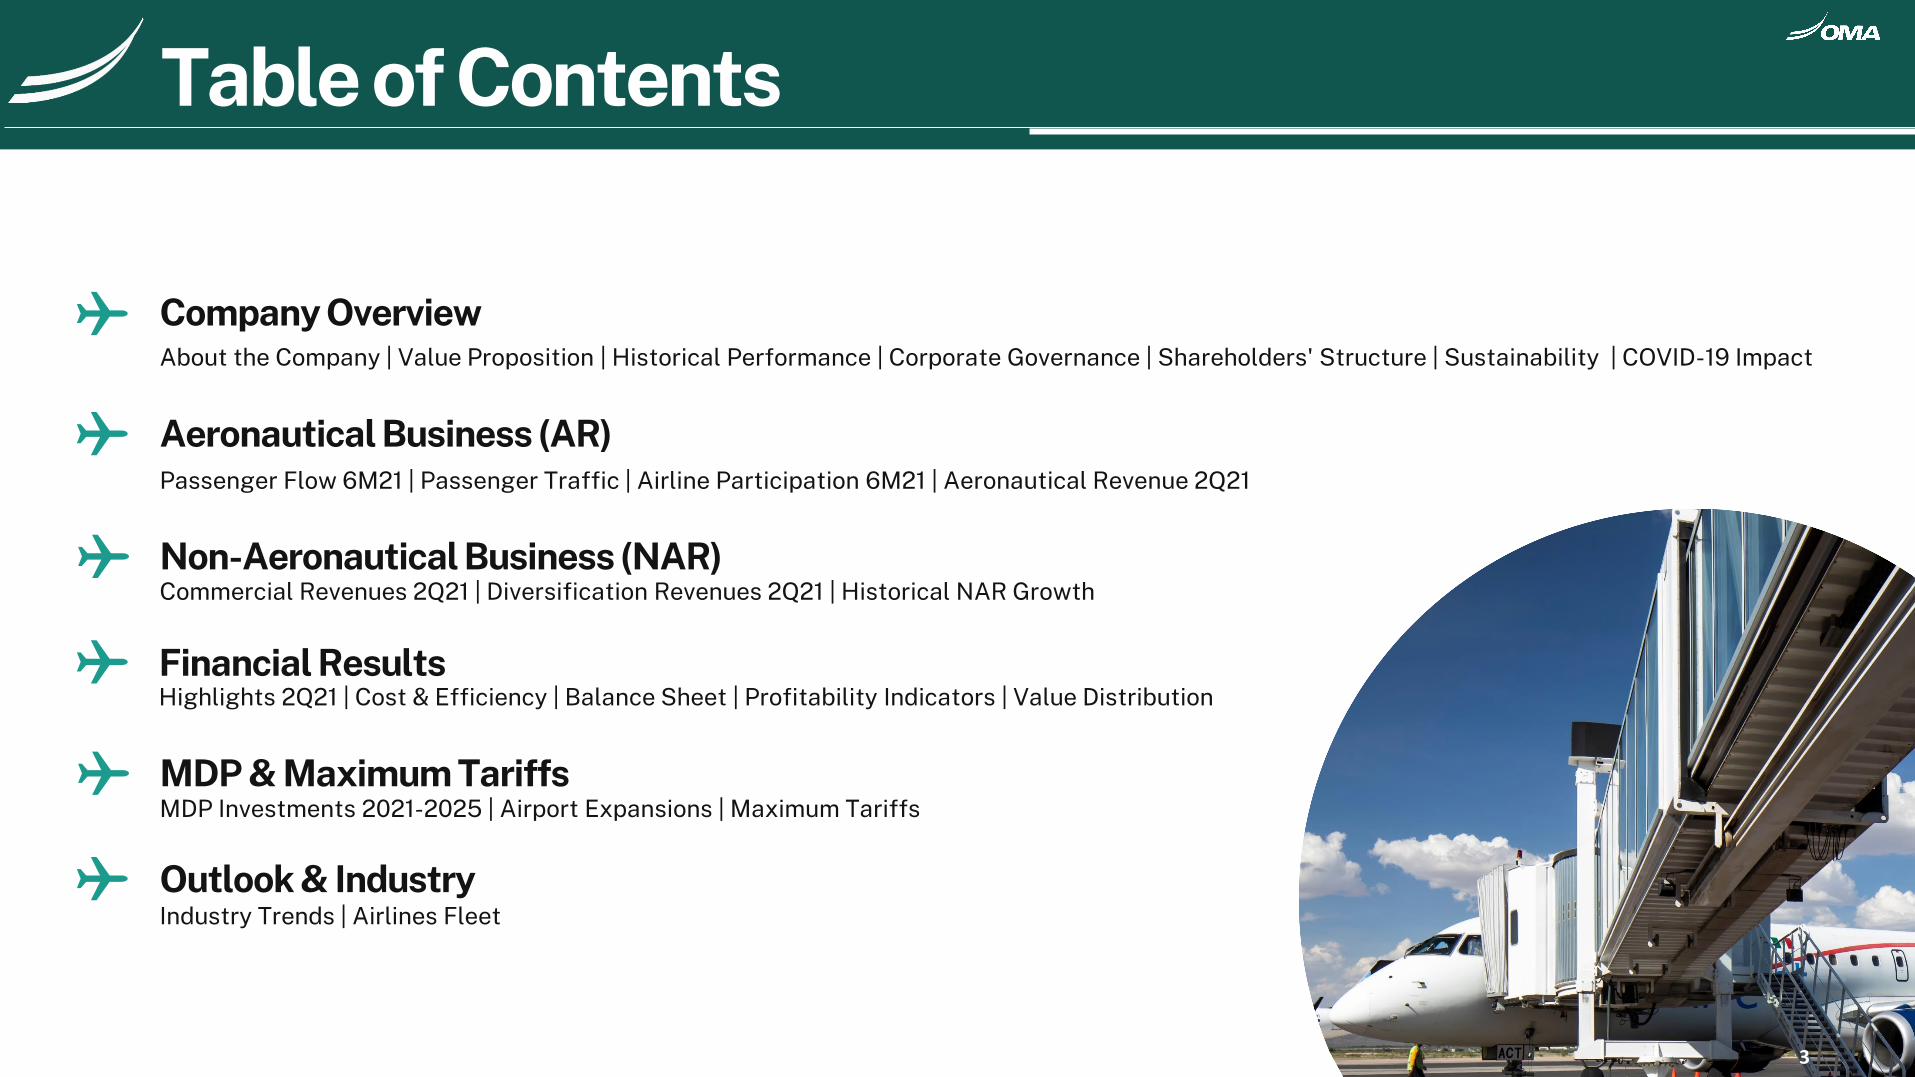
Company OverviewAbout the Company | Value Proposition | Historical Performance | Corporate Governance | Shareholders' Structure | Sustainability | COVID-19 Impact
Aeronautical Business (AR)Passenger Flow 6M21 | Passenger Traffic | Airline Participation 6M21 | Aeronautical Revenue 2Q21
Non-Aeronautical Business (NAR)Commercial Revenues 2Q21 | Diversification Revenues 2Q21 | Historical NAR Growth
MDP & Maximum TariffsMDP Investments 2021-2025 | Airport Expansions | Maximum Tariffs
Financial ResultsHighlights 2Q21 | Cost & Efficiency | Balance Sheet | Profitability Indicators | Value Distribution
Outlook & IndustryIndustry Trends | Airlines Fleet
Table of Contents
3
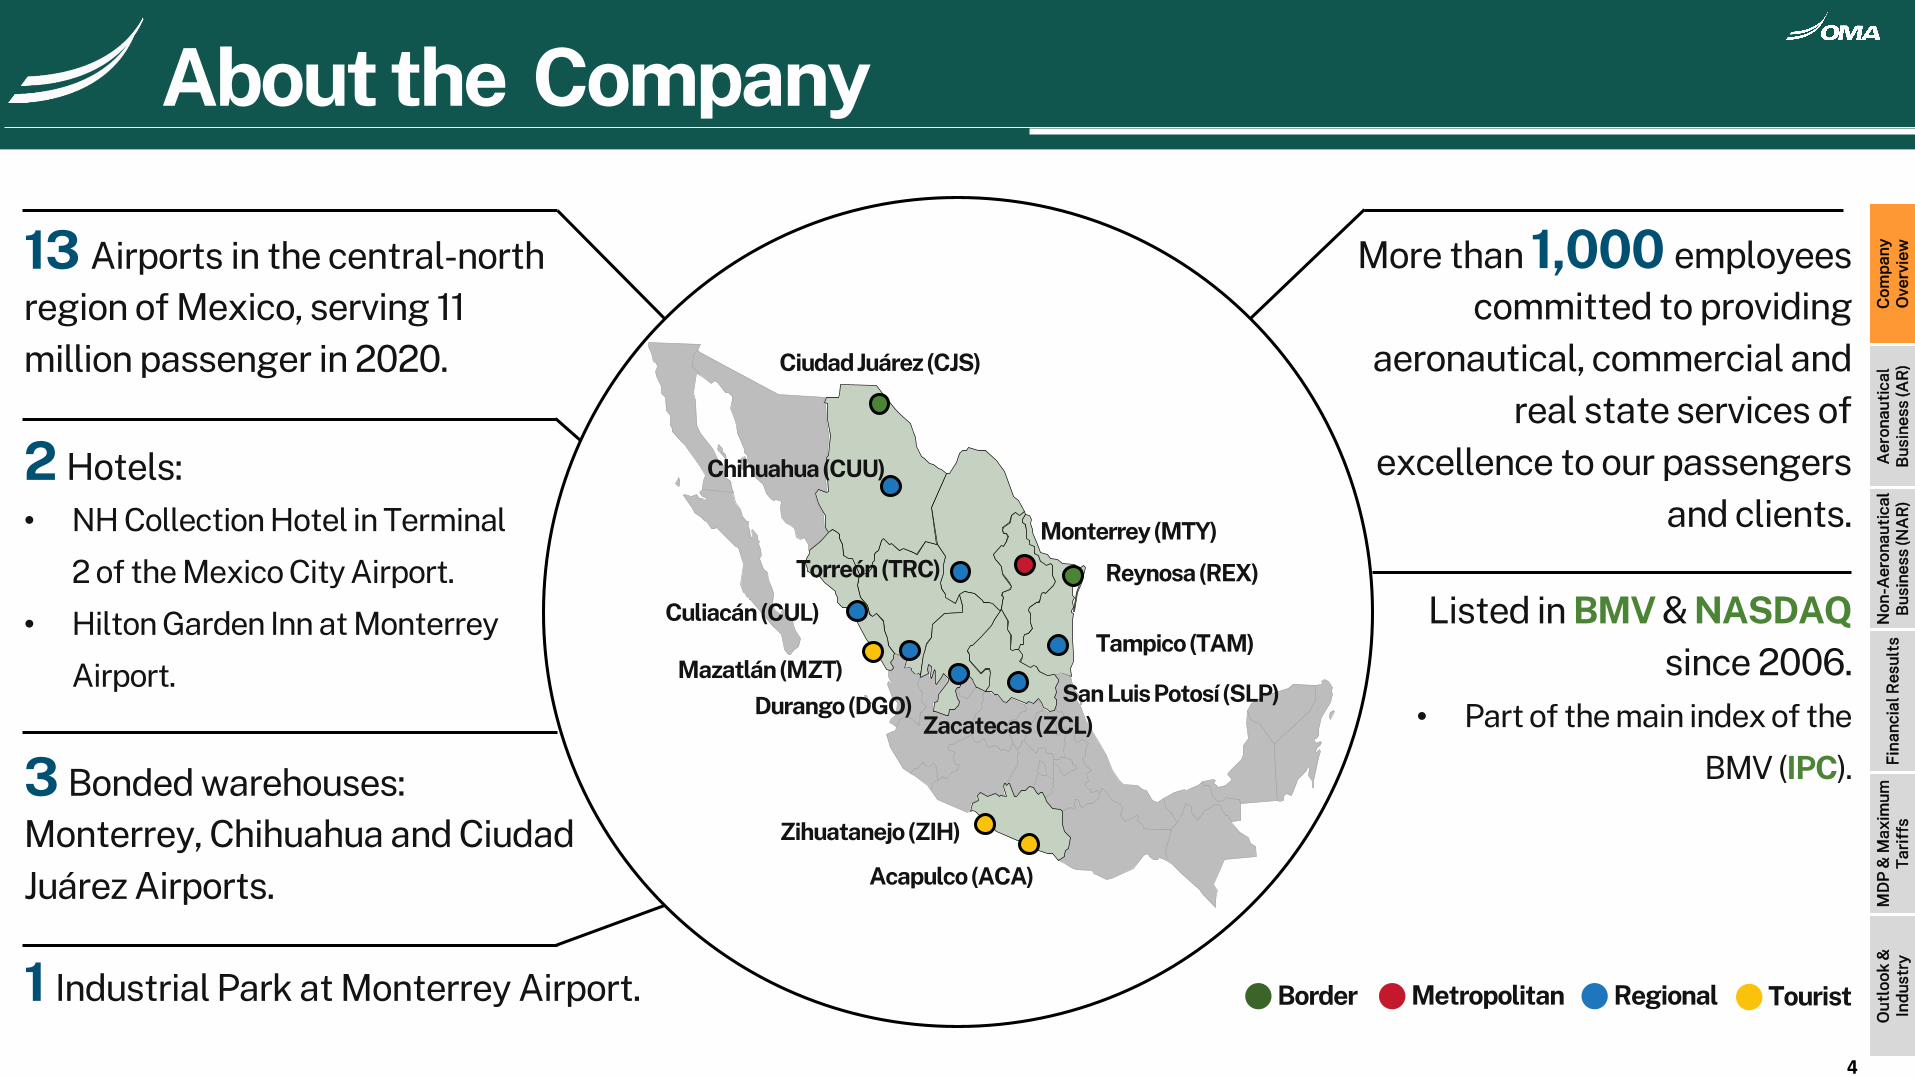
13 Airports in the central-north region of Mexico, serving 11 million passenger in 2020. Ciudad Juárez (CJS)
Chihuahua (CUU)
Culiacán (CUL)
Durango (DGO)Zacatecas (ZCL)
Torreón (TRC)
Monterrey (MTY)
Reynosa (REX)
Tampico (TAM)
San Luis Potosí (SLP)
Acapulco (ACA)
Zihuatanejo (ZIH)
Mazatlán (MZT)
2 Hotels: • NH Collection Hotel in Terminal
2 of the Mexico City Airport.
• Hilton Garden Inn at Monterrey
Airport.
3 Bonded warehouses: Monterrey, Chihuahua and Ciudad Juárez Airports.
1 Industrial Park at Monterrey Airport.
More than 1,000 employees committed to providing
aeronautical, commercial and real state services of
excellence to our passengers and clients.
Listed in BMV & NASDAQsince 2006.
• Part of the main index of the
BMV (IPC).
About the Company
RegionalBorder Metropolitan Tourist
Com
pan
yO
verv
iew
Aer
onau
tica
lB
usin
ess
(AR
)N
on-A
eron
auti
cal
Bus
ines
s (N
AR
)F
inan
cial
Res
ults
MD
P &
Max
imum
Tar
iffs
Out
look
&In
dus
try
4
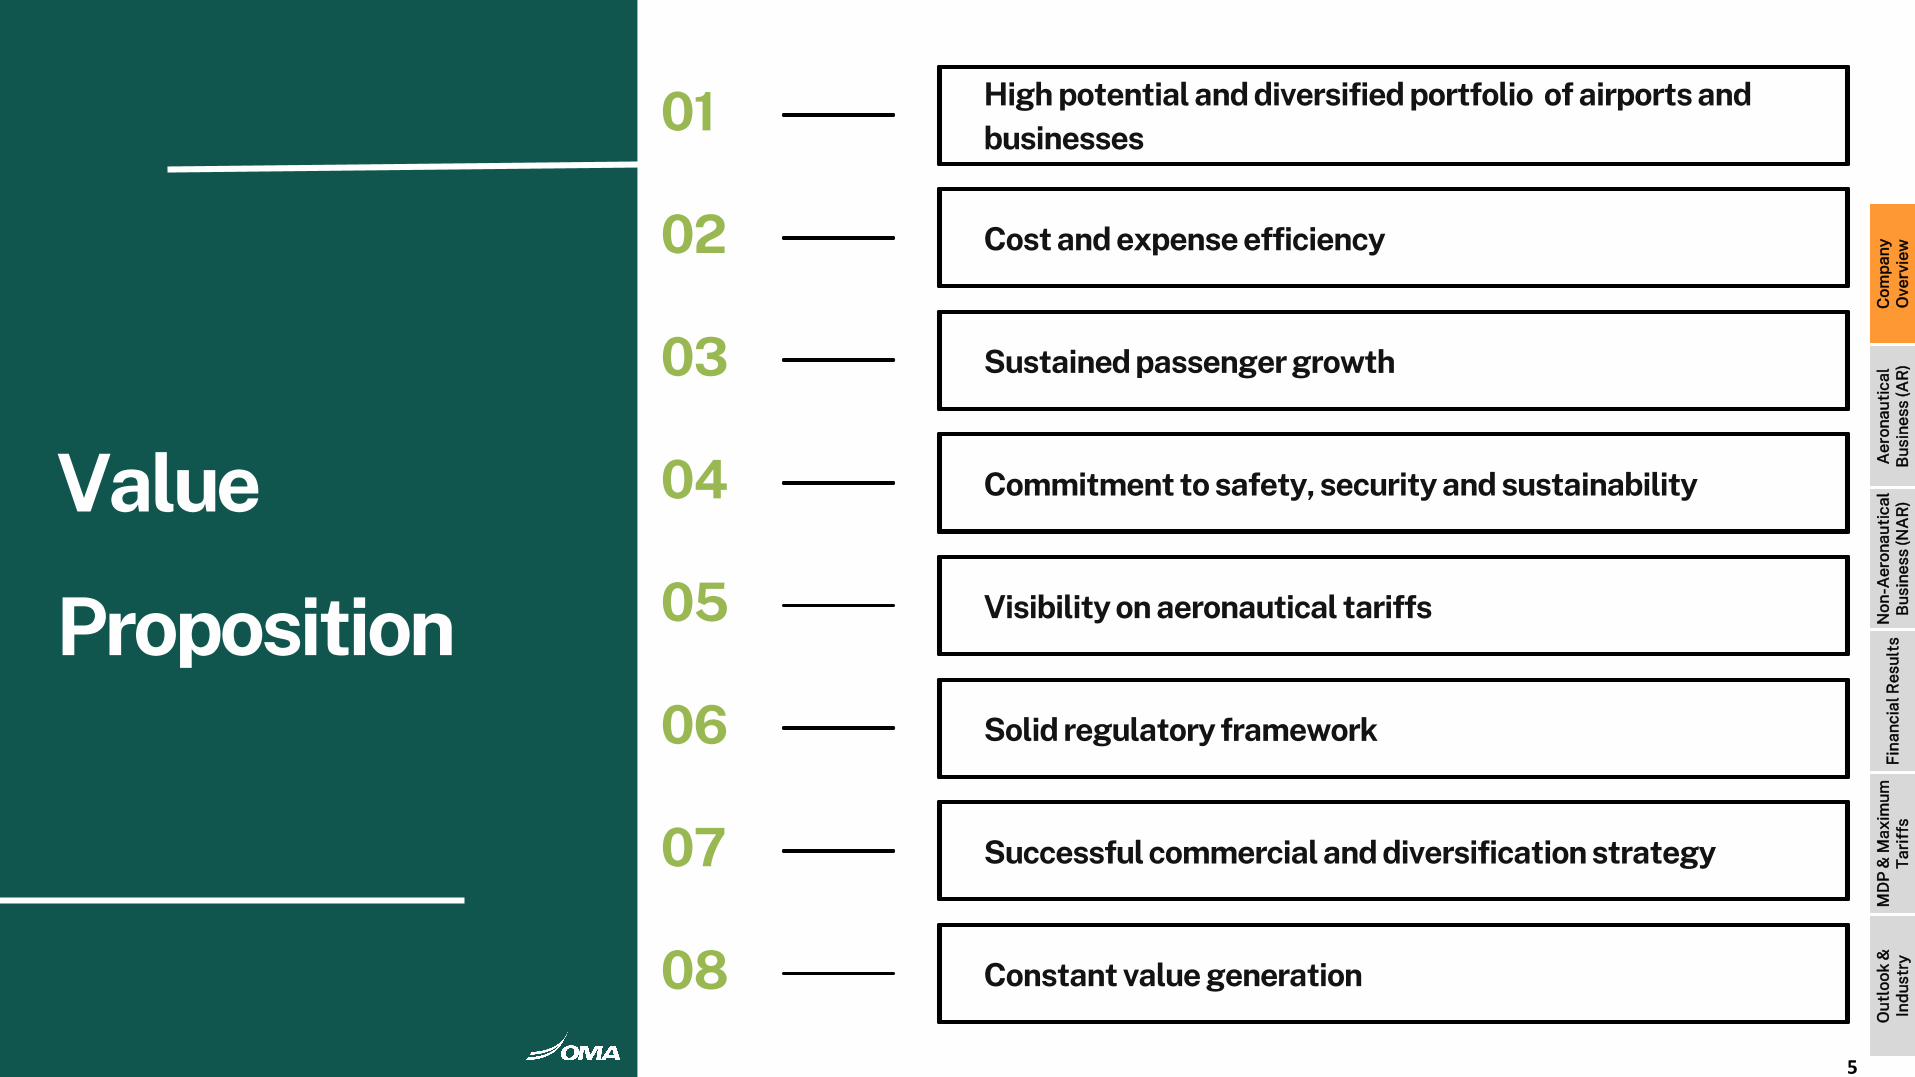
Value
Proposition
01 High potential and diversified portfolio of airports and businesses
02 Cost and expense efficiency
03 Sustained passenger growth
04 Commitment to safety, security and sustainability
05 Visibility on aeronautical tariffs
06 Solid regulatory framework
07 Successful commercial and diversification strategy
08 Constant value generation
5
Com
pan
yO
verv
iew
Aer
onau
tica
lB
usin
ess
(AR
)N
on-A
eron
auti
cal
Bus
ines
s (N
AR
)F
inan
cial
Res
ults
MD
P &
Max
imum
Tar
iffs
Out
look
&In
dus
try
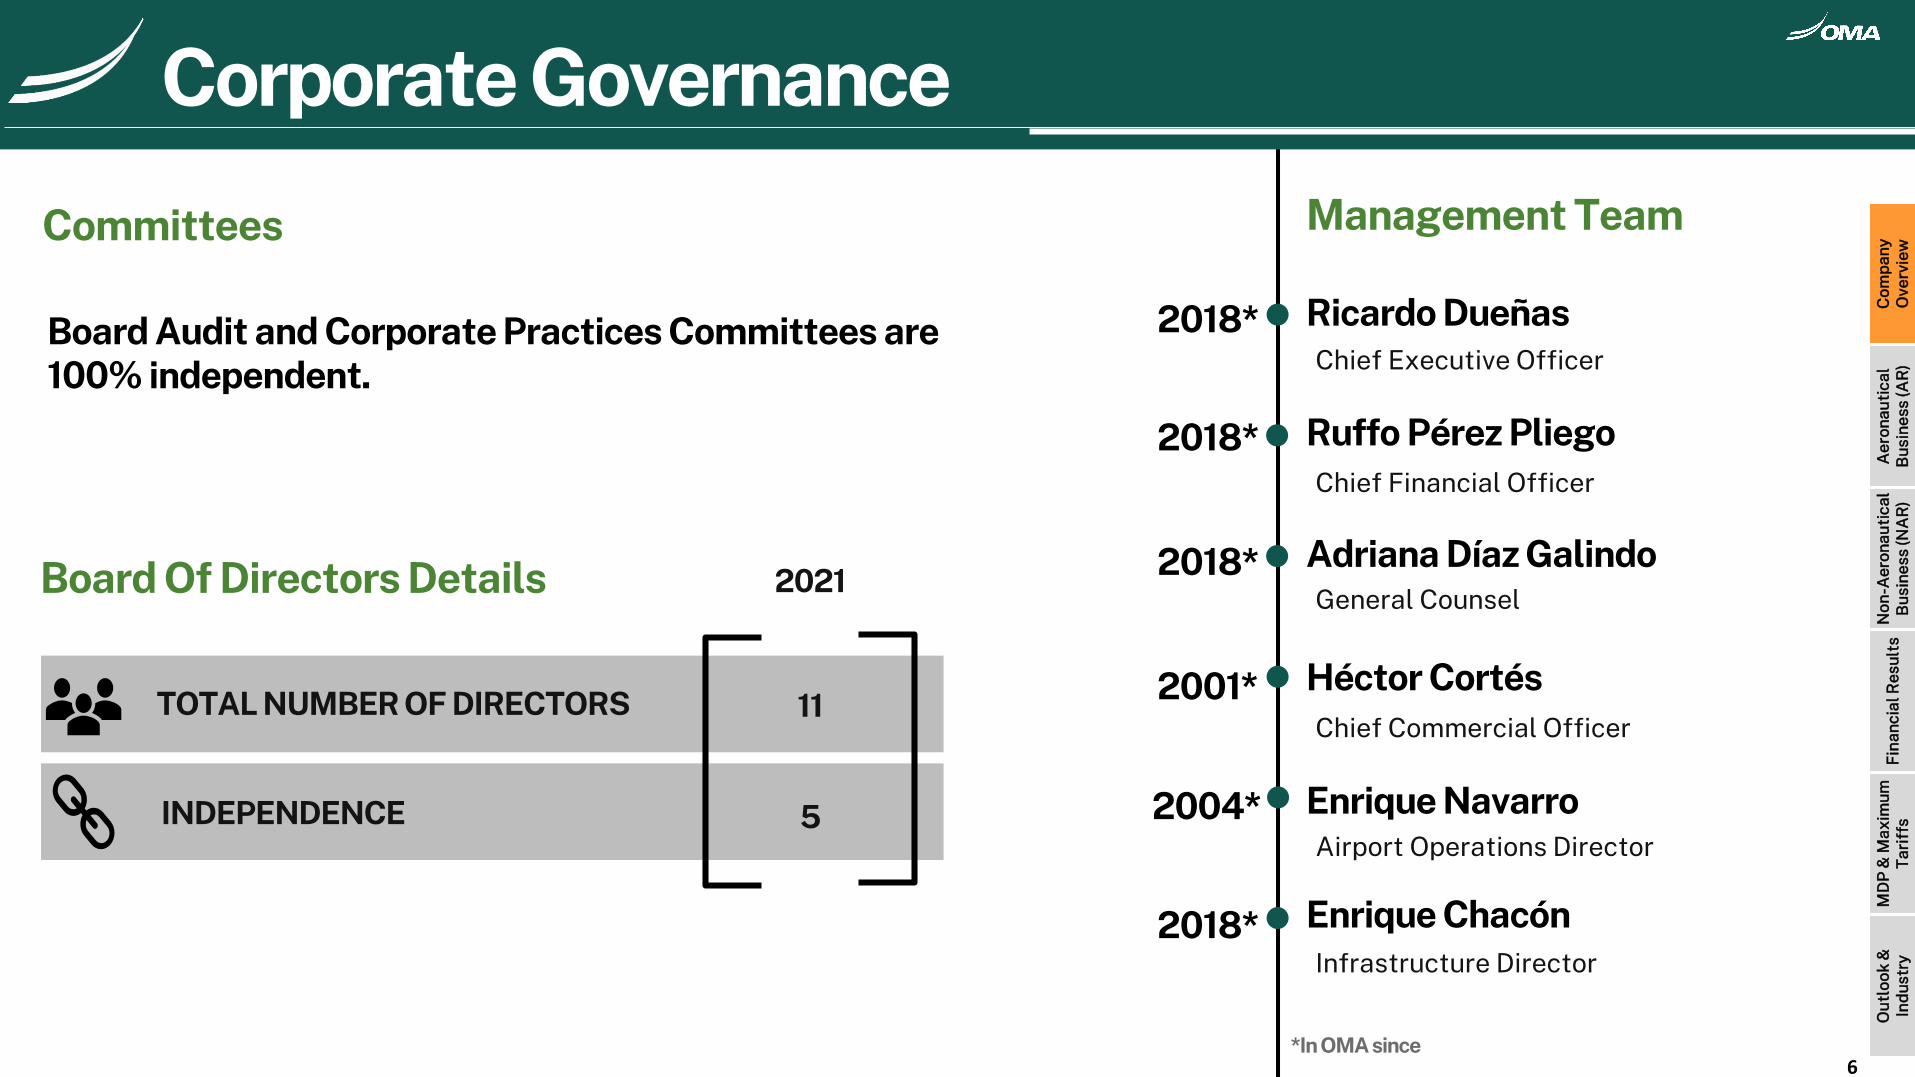
TOTAL NUMBER OF DIRECTORS
INDEPENDENCE
11
5
2021Board Of Directors Details
Management TeamCommittees
Ricardo Dueñas
Ruffo Pérez Pliego
Adriana Díaz Galindo
Héctor Cortés
Enrique Navarro
Enrique Chacón
Board Audit and Corporate Practices Committees are 100% independent. Chief Executive Officer
Chief Financial Officer
General Counsel
Chief Commercial Officer
Airport Operations Director
Infrastructure Director
2018*
2018*
2018*
2001*
2004*
2018*
*In OMA since
Historical PerformanceCorporate Governance
6
Com
pan
yO
verv
iew
Aer
onau
tica
lB
usin
ess
(AR
)N
on-A
eron
auti
cal
Bus
ines
s (N
AR
)F
inan
cial
Res
ults
MD
P &
Max
imum
Tar
iffs
Out
look
&In
dus
try
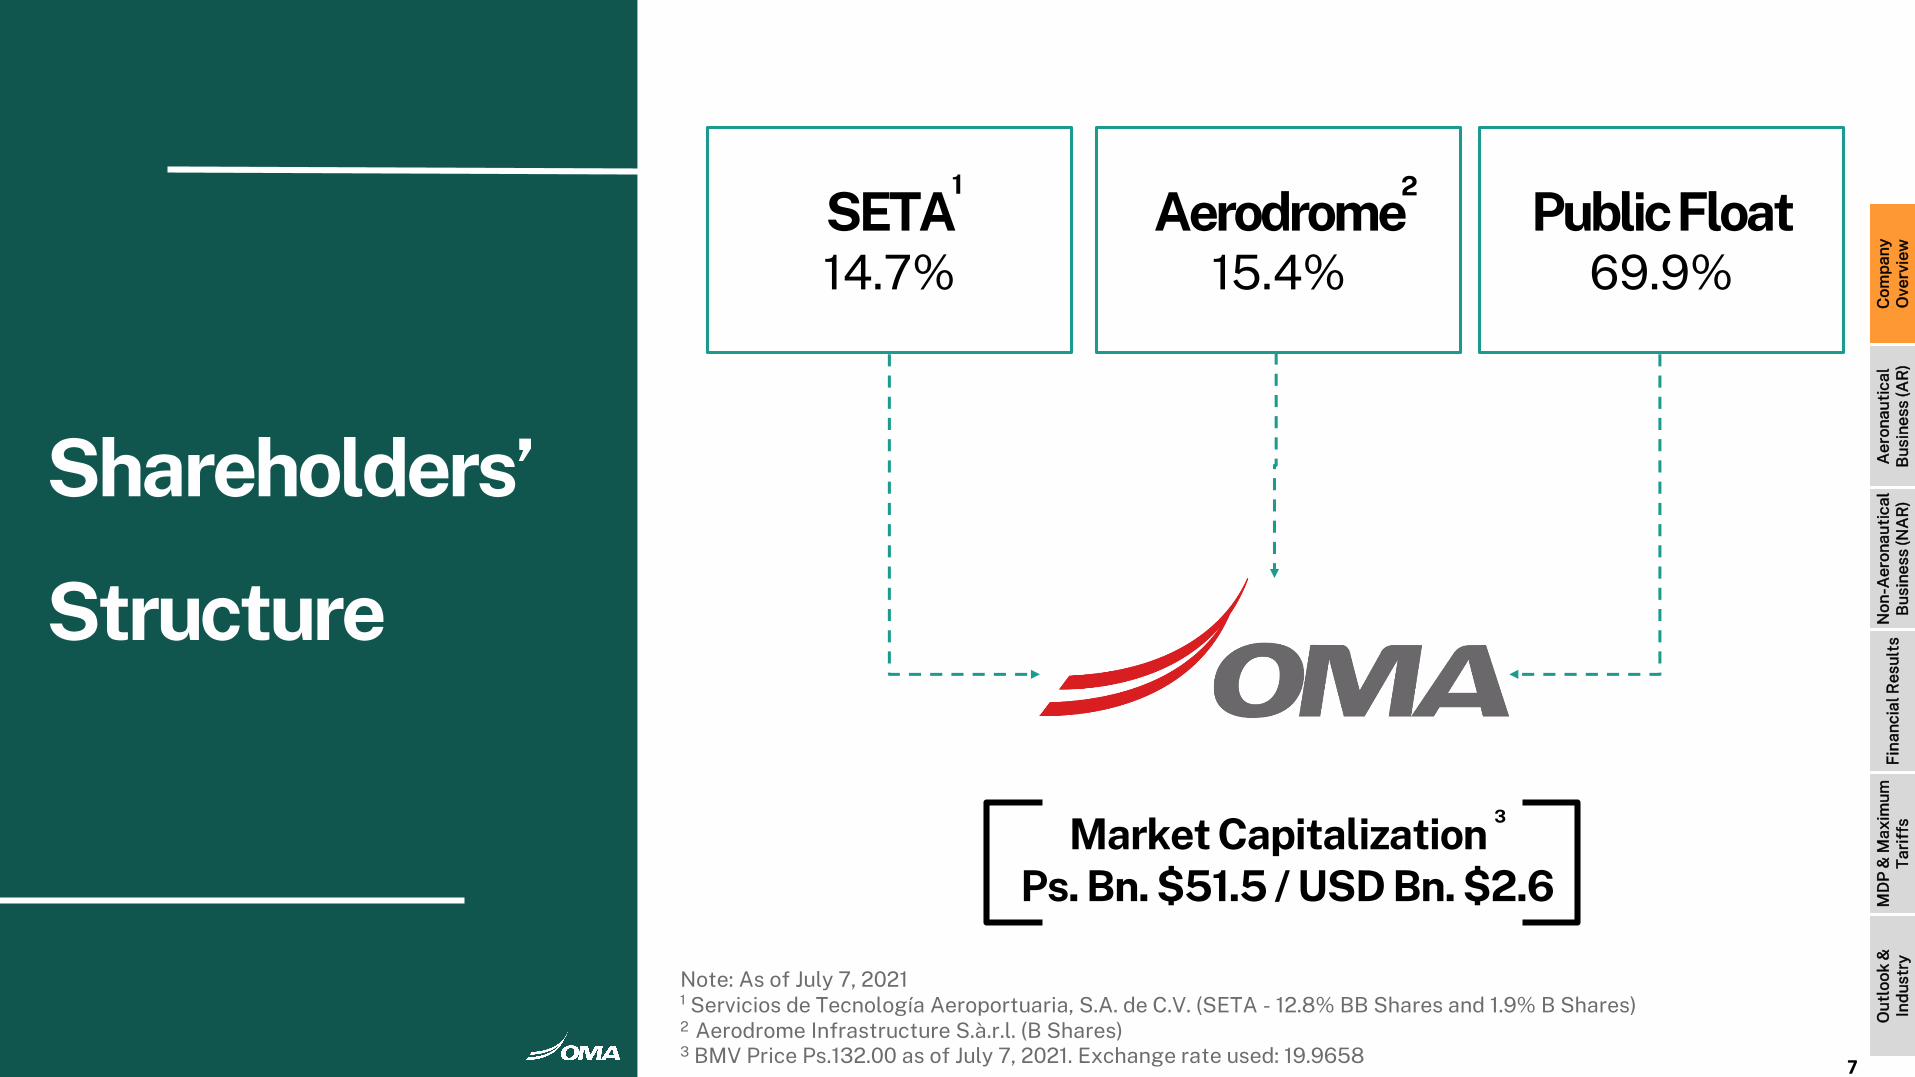
Shareholders’ Structure
Shareholders’
Structure
Shareholders’
Structure
Market Capitalization 3
Ps. Bn. $51.5 / USD Bn. $2.6
PublicFloat69.9%
Note: As of July 7, 2021¹ Servicios de Tecnología Aeroportuaria, S.A. de C.V. (SETA - 12.8% BB Shares and 1.9% B Shares)2 Aerodrome Infrastructure S.à.r.l. (B Shares)3 BMV Price Ps.132.00 as of July 7, 2021. Exchange rate used: 19.9658
Aerodrome15.4%
SETA14.7%
1 2
7
Com
pan
yO
verv
iew
Aer
onau
tica
lB
usin
ess
(AR
)N
on-A
eron
auti
cal
Bus
ines
s (N
AR
)F
inan
cial
Res
ults
MD
P &
Max
imum
Tar
iffs
Out
look
&In
dus
try
Historical PerformanceNon-Aeronautical Revenue
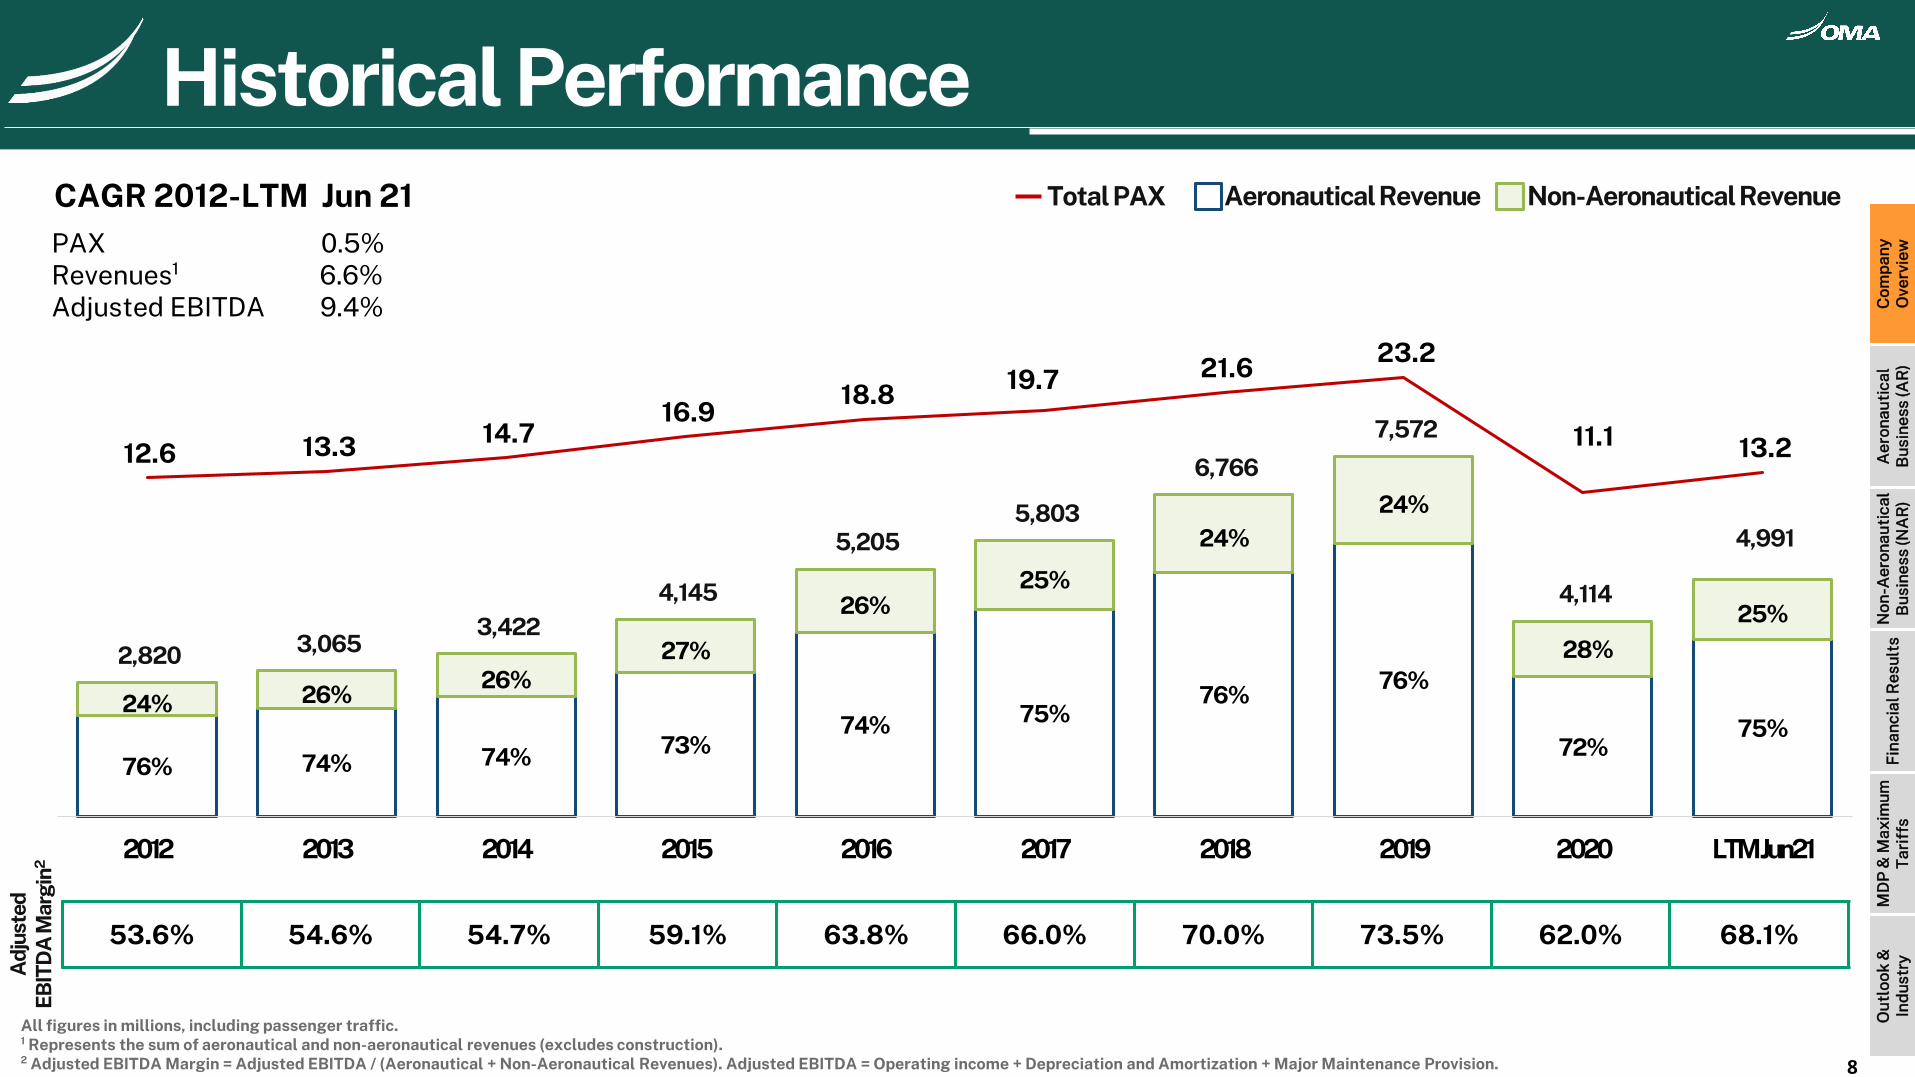
PAX 0.5%Revenues¹ 6.6% Adjusted EBITDA 9.4%
All figures in millions, including passenger traffic.¹ Represents the sum of aeronautical and non-aeronautical revenues (excludes construction).² Adjusted EBITDA Margin = Adjusted EBITDA / (Aeronautical + Non-Aeronautical Revenues). Adjusted EBITDA = Operating income + Depreciation and Amortization + Major Maintenance Provision.
CAGR 2012-LTM Jun 21
53.6% 54.6% 54.7% 59.1% 63.8% 66.0% 70.0% 73.5% 62.0% 68.1%
Total PAX Aeronautical Revenue
Historical Performance
8
76% 74% 74% 73%74% 75%
76%76%
72%75%
24% 26%26%
27%
26%25%
24%24%
28%
25%
2,820 3,065 3,422
4,145
5,205 5,803
6,766
7,572
4,114
4,991
12.6 13.3 14.7 16.9
18.8 19.7 21.6 23.2
11.1 13.2
-23.0
-21.0
-19.0
-17.0
-15.0
-13.0
-11.0
-9.0
-7.0
-5.0
-3.0
-1.0
1.0
3.0
5.0
7.0
9.0
11.0
13.0
15.0
17.0
19.0
21.0
23.0
25.0
27.0
-
2,000
4,000
6,000
8,000
10,000
2012 2013 2014 2015 2016 2017 2018 2019 2020 LTMJun21
Adj
uste
d EB
ITD
A M
argi
n2
Com
pan
yO
verv
iew
Aer
onau
tica
lB
usin
ess
(AR
)N
on-A
eron
auti
cal
Bus
ines
s (N
AR
)F
inan
cial
Res
ults
MD
P &
Max
imum
Tar
iffs
Out
look
&In
dus
try
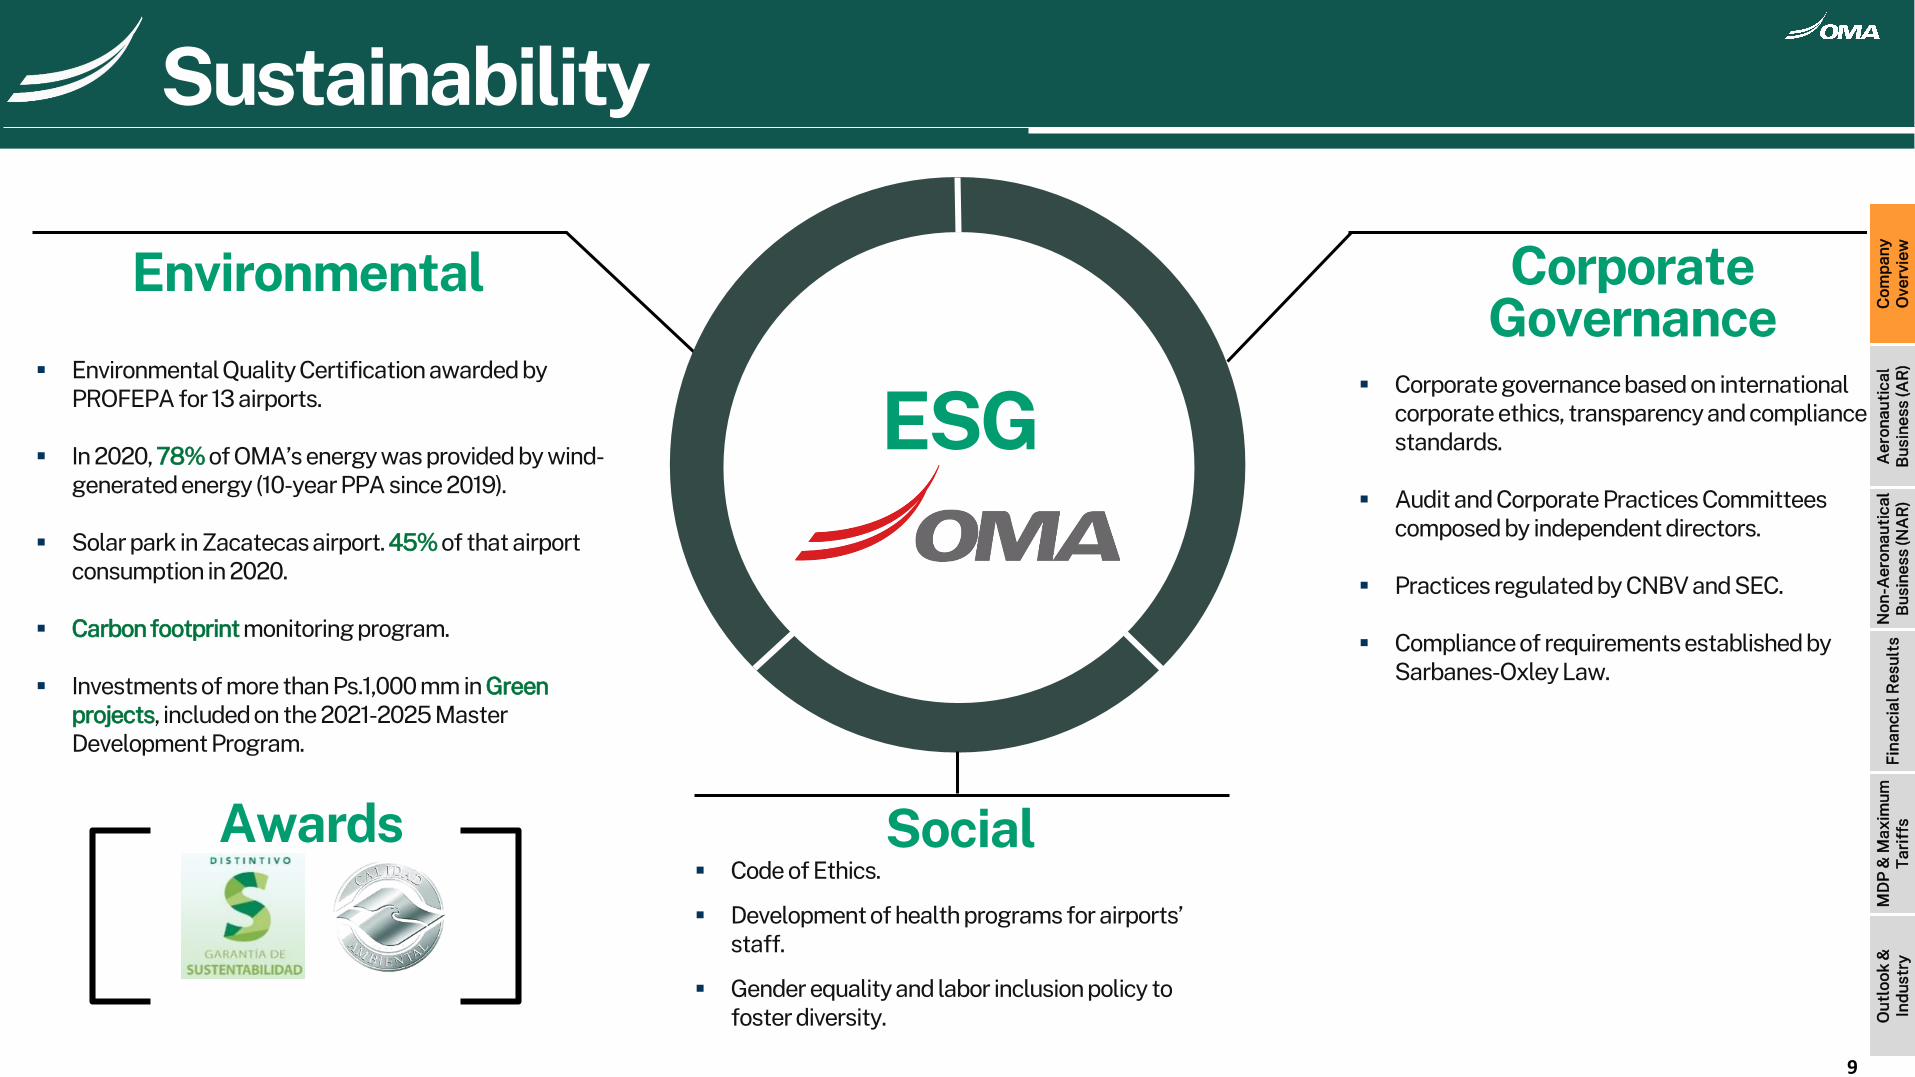
ESG
Environmental Corporate Governance
Social
▪ Environmental Quality Certification awarded by PROFEPA for 13 airports.
▪ In 2020, 78%of OMA’s energy was provided by wind-generated energy (10-year PPA since 2019).
▪ Solar park in Zacatecas airport. 45% of that airport consumption in 2020.
▪ Carbon footprint monitoring program.
▪ Investments of more than Ps.1,000 mm in Green projects, included on the 2021-2025 Master Development Program.
▪ Corporate governance based on international corporate ethics, transparency and compliance standards.
▪ Audit and Corporate Practices Committees composed by independent directors.
▪ Practices regulated by CNBV and SEC.
▪ Compliance of requirements established by Sarbanes-Oxley Law.
▪ Code of Ethics.
▪ Development of health programs for airports’ staff.
▪ Gender equality and labor inclusion policy to foster diversity.
Awards
Sustainability
9
Com
pan
yO
verv
iew
Aer
onau
tica
lB
usin
ess
(AR
)N
on-A
eron
auti
cal
Bus
ines
s (N
AR
)F
inan
cial
Res
ults
MD
P &
Max
imum
Tar
iffs
Out
look
&In
dus
try
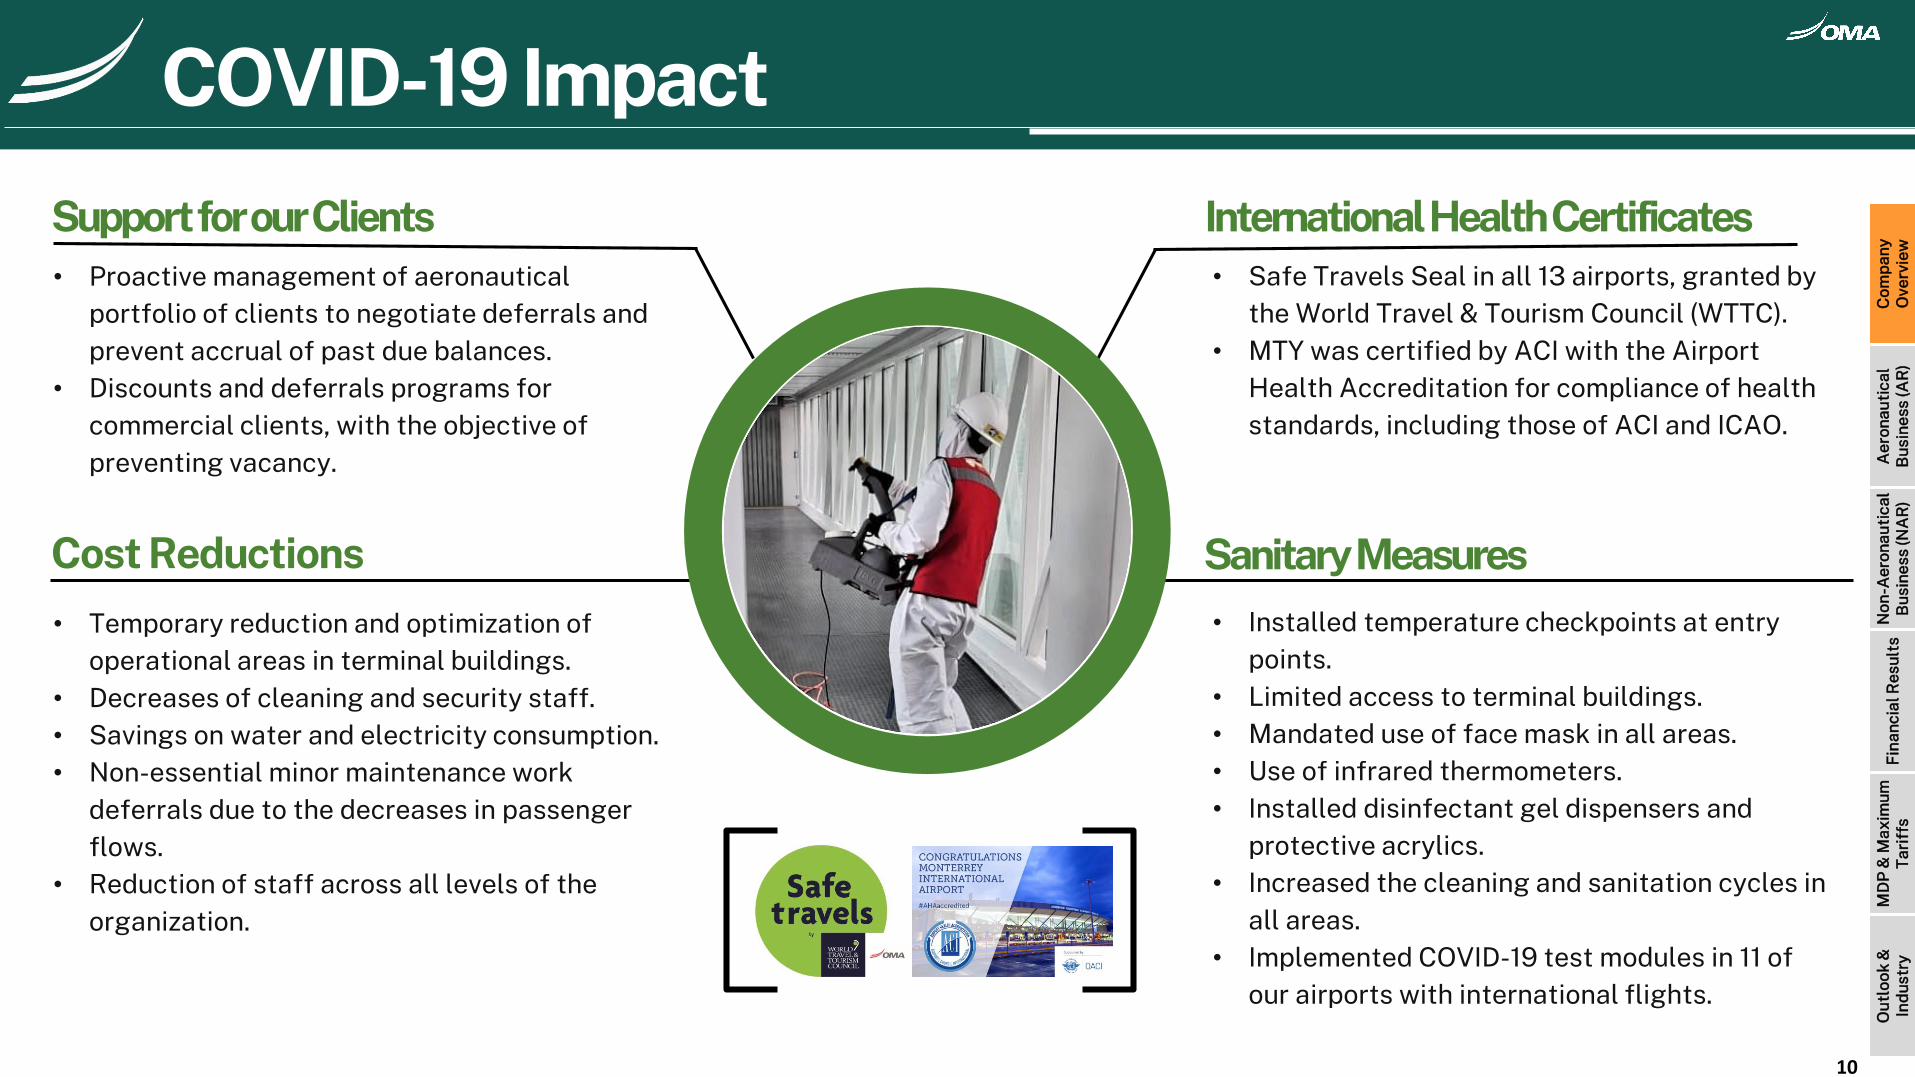
• Installed temperature checkpoints at entry points.
• Limited access to terminal buildings.• Mandated use of face mask in all areas.• Use of infrared thermometers.• Installed disinfectant gel dispensers and
protective acrylics.• Increased the cleaning and sanitation cycles in
all areas.• Implemented COVID-19 test modules in 11 of
our airports with international flights.
• Safe Travels Seal in all 13 airports, granted by the World Travel & Tourism Council (WTTC).
• MTY was certified by ACI with the Airport Health Accreditation for compliance of health standards, including those of ACI and ICAO.
Sanitary MeasuresCost Reductions
Support for our Clients International Health Certificates• Proactive management of aeronautical
portfolio of clients to negotiate deferrals and prevent accrual of past due balances.
• Discounts and deferrals programs for commercial clients, with the objective of preventing vacancy.
• Temporary reduction and optimization of operational areas in terminal buildings.
• Decreases of cleaning and security staff.• Savings on water and electricity consumption.• Non-essential minor maintenance work
deferrals due to the decreases in passenger flows.
• Reduction of staff across all levels of the organization.
COVID-19
Historical PerformanceCOVID-19 Impact
10
Com
pan
yO
verv
iew
Aer
onau
tica
lB
usin
ess
(AR
)N
on-A
eron
auti
cal
Bus
ines
s (N
AR
)F
inan
cial
Res
ults
MD
P &
Max
imum
Tar
iffs
Out
look
&In
dus
try
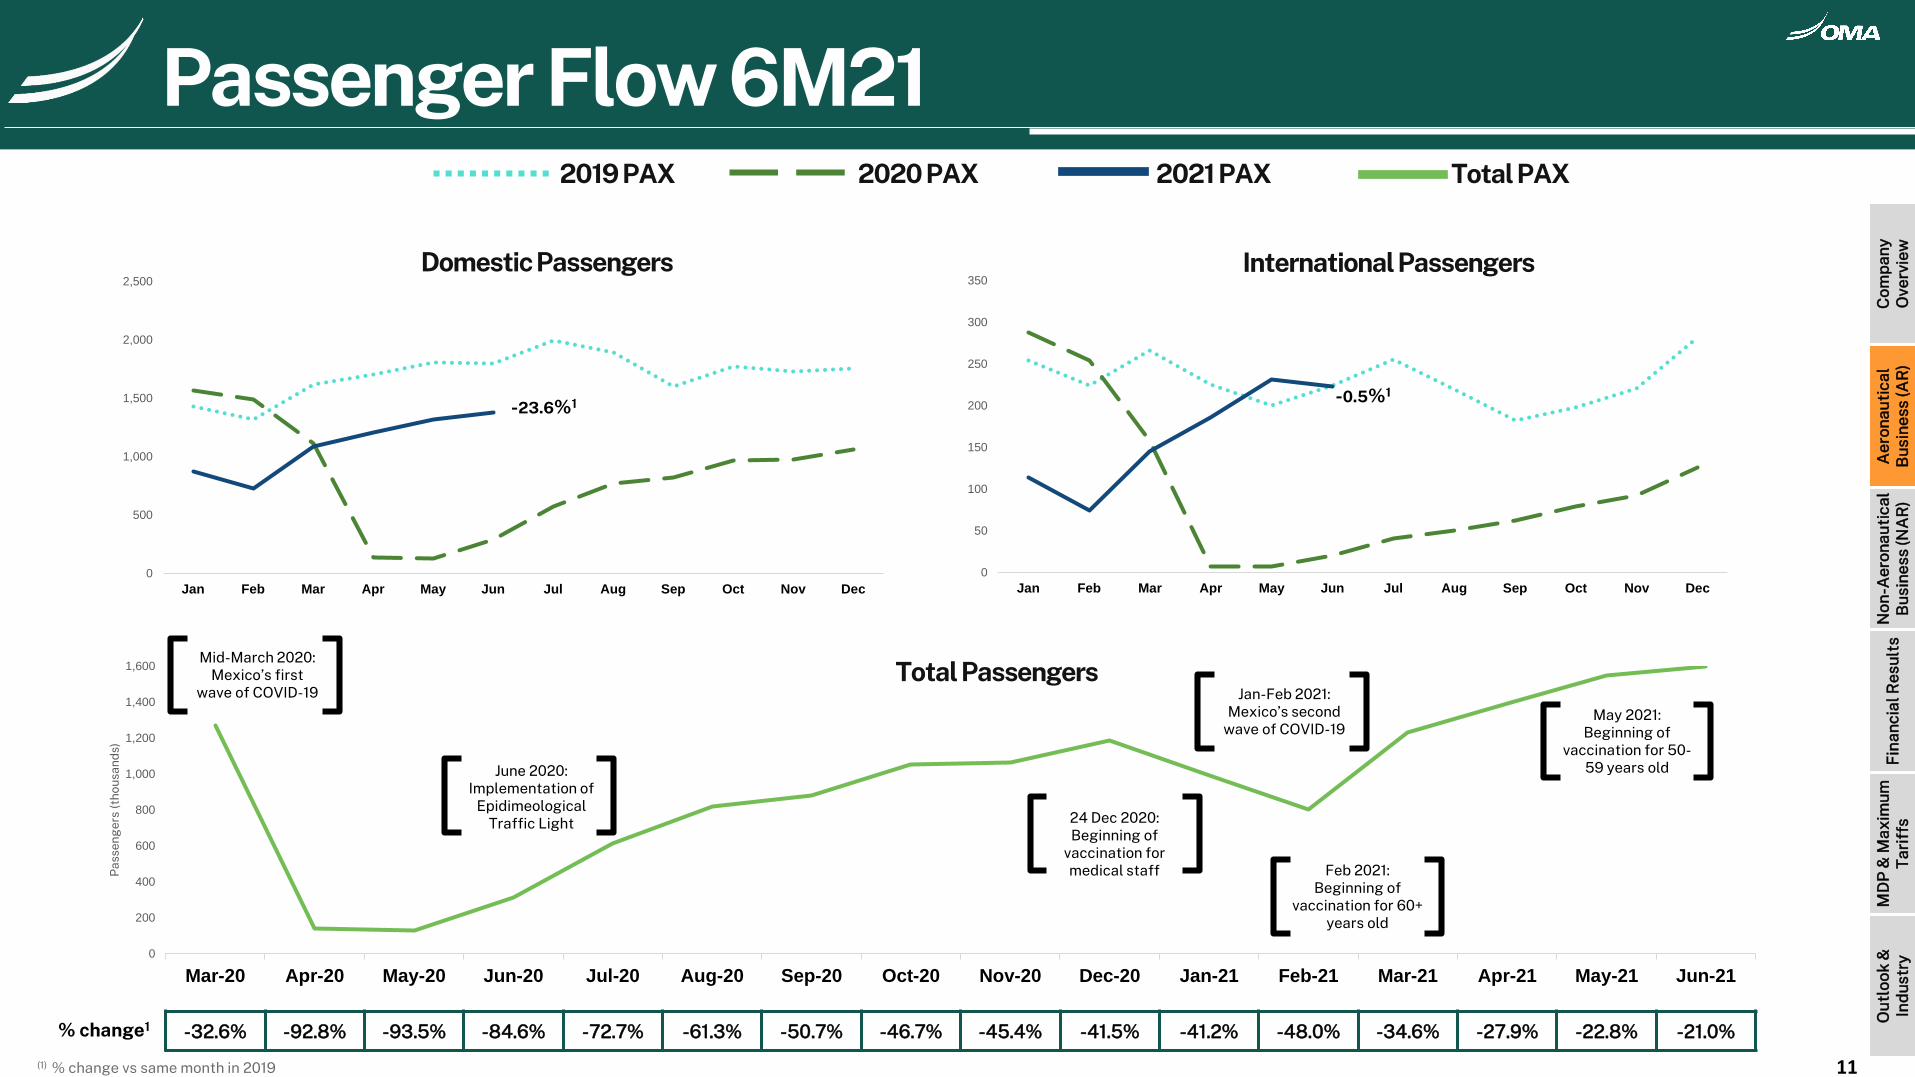
0
200
400
600
800
1,000
1,200
1,400
1,600
Mar-20 Apr-20 May-20 Jun-20 Jul-20 Aug-20 Sep-20 Oct-20 Nov-20 Dec-20 Jan-21 Feb-21 Mar-21 Apr-21 May-21 Jun-21
Pas
seng
ers
(tho
usan
ds)
Passenger Flows and Top Routes 5M21
Domestic Passengers
-32.6% -92.8% -93.5% -84.6% -72.7% -61.3% -50.7% -46.7% -45.4% -41.5% -41.2% -48.0% -34.6% -27.9% -22.8% -21.0%
Mid-March 2020: Mexico’s first
wave of COVID-19 Jan-Feb 2021: Mexico’s second
wave of COVID-19
June 2020: Implementation of
EpidimeologicalTraffic Light
Historical PerformancePassenger Flow 5M210
500
1,000
1,500
2,000
2,500
Jan Feb Mar Apr May Jun Jul Aug Sep Oct Nov Dec
0
50
100
150
200
250
300
350
Jan Feb Mar Apr May Jun Jul Aug Sep Oct Nov Dec
International Passengers
Total Passengers
24 Dec 2020: Beginning of
vaccination formedical staff Feb 2021:
Beginning ofvaccination for 60+
years old
May 2021: Beginning of
vaccination for 50-59 years old
Passenger Flow 6M21
11
-23.6%1 -0.5%1
% change1
(1) % change vs same month in 2019
Com
pan
yO
verv
iew
Aer
onau
tica
lB
usin
ess
(AR
)N
on-A
eron
auti
cal
Bus
ines
s (N
AR
)F
inan
cial
Res
ults
MD
P &
Max
imum
Tar
iffs
Out
look
&In
dus
try
Total PAX 2019 PAX 2020 PAX 2021 PAX
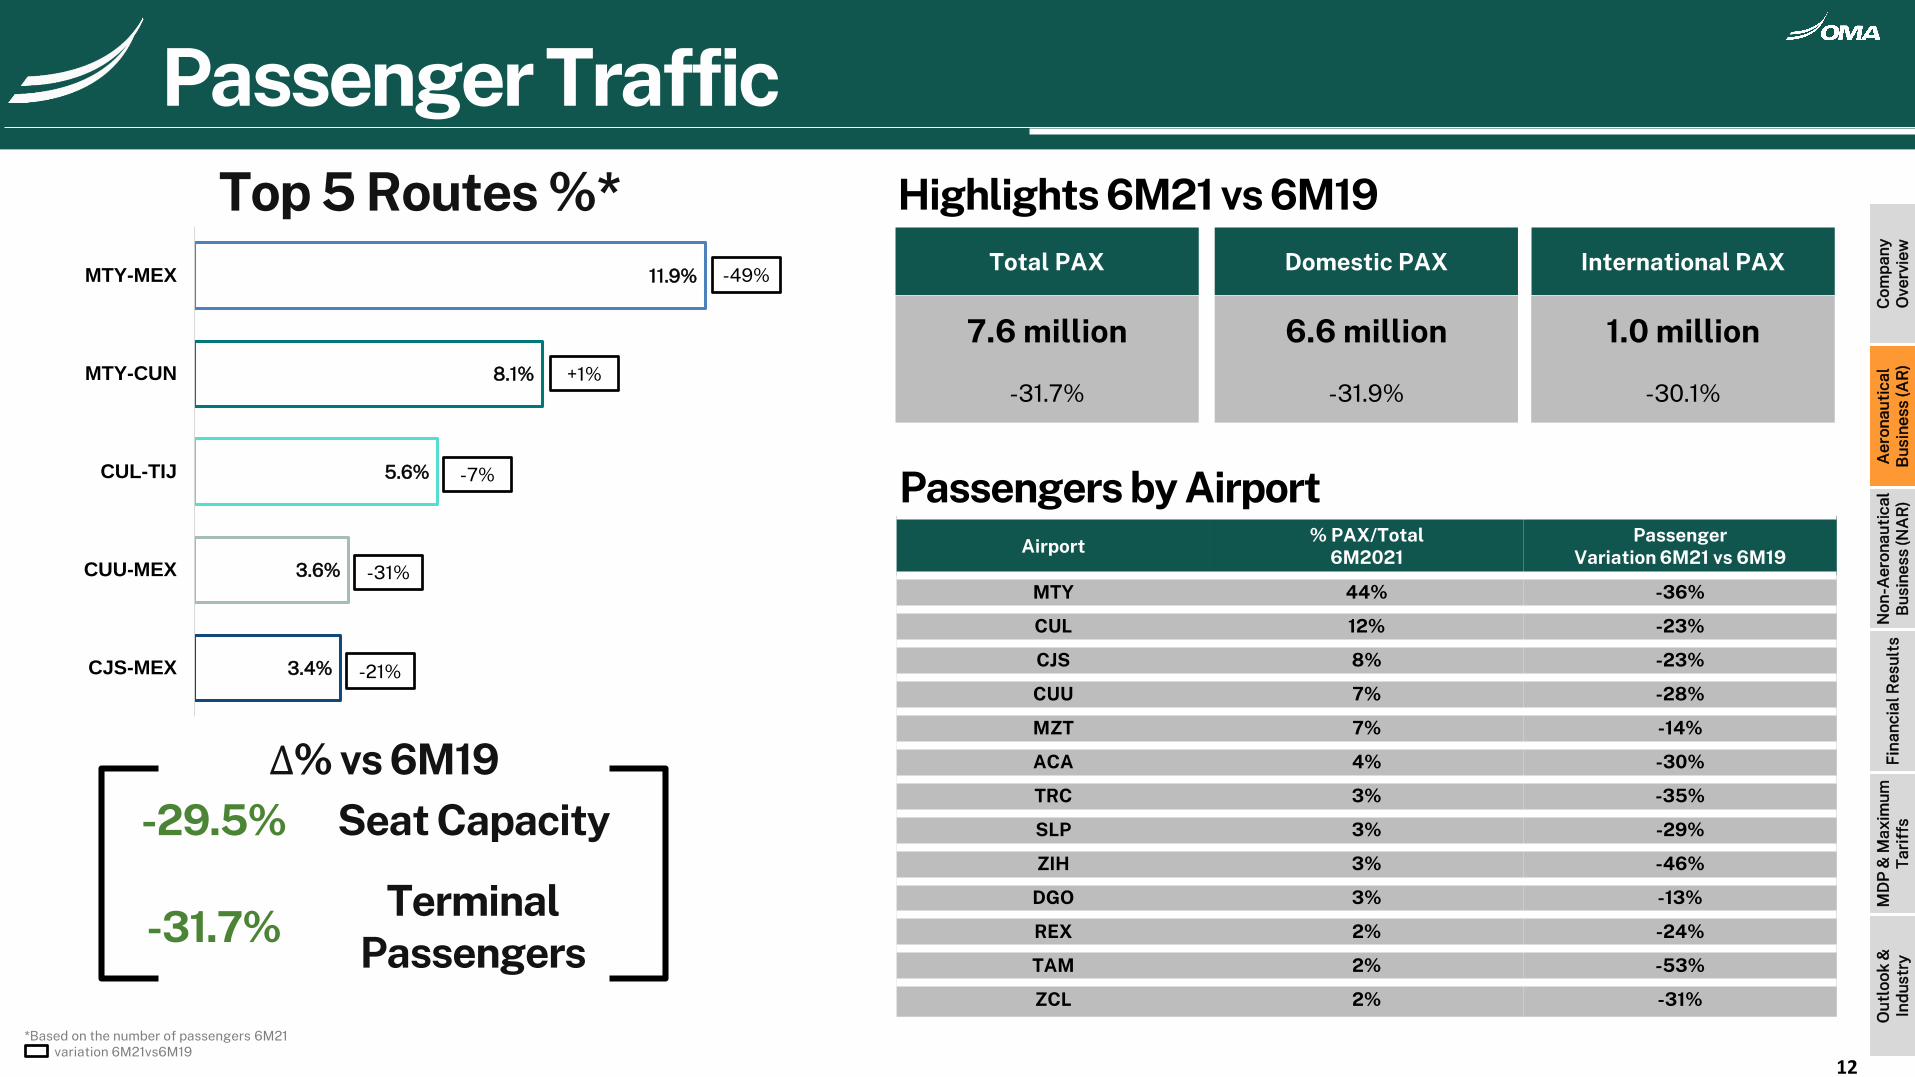
Passenger Flows and Top Routes 5M21Top 5 Routes %*
Seat Capacity
-31.7%Terminal
Passengers
-29.5%
Historical PerformancePassenger Traffic
*Based on the number of passengers 6M21variation 6M21vs6M19
Δ% vs 6M19
3.4%
3.6%
5.6%
8.1%
11.9%
CJS-MEX
CUU-MEX
CUL-TIJ
MTY-CUN
MTY-MEX
12
Highlights 6M21 vs 6M19Total PAX Domestic PAX International PAX
7.6 million
-31.7%
6.6 million
-31.9%
1.0 million
-30.1%
Airport% PAX/Total
6M2021Passenger
Variation 6M21 vs 6M19
MTY 44% -36%
CUL 12% -23%
CJS 8% -23%
CUU 7% -28%
MZT 7% -14%
ACA 4% -30%
TRC 3% -35%
SLP 3% -29%
ZIH 3% -46%
DGO 3% -13%
REX 2% -24%
TAM 2% -53%
ZCL 2% -31%
Passengers by Airport
Com
pan
yO
verv
iew
Aer
onau
tica
lB
usin
ess
(AR
)N
on-A
eron
auti
cal
Bus
ines
s (N
AR
)F
inan
cial
Res
ults
MD
P &
Max
imum
Tar
iffs
Out
look
&In
dus
try
-49%
+1%
-7%
-31%
-21%
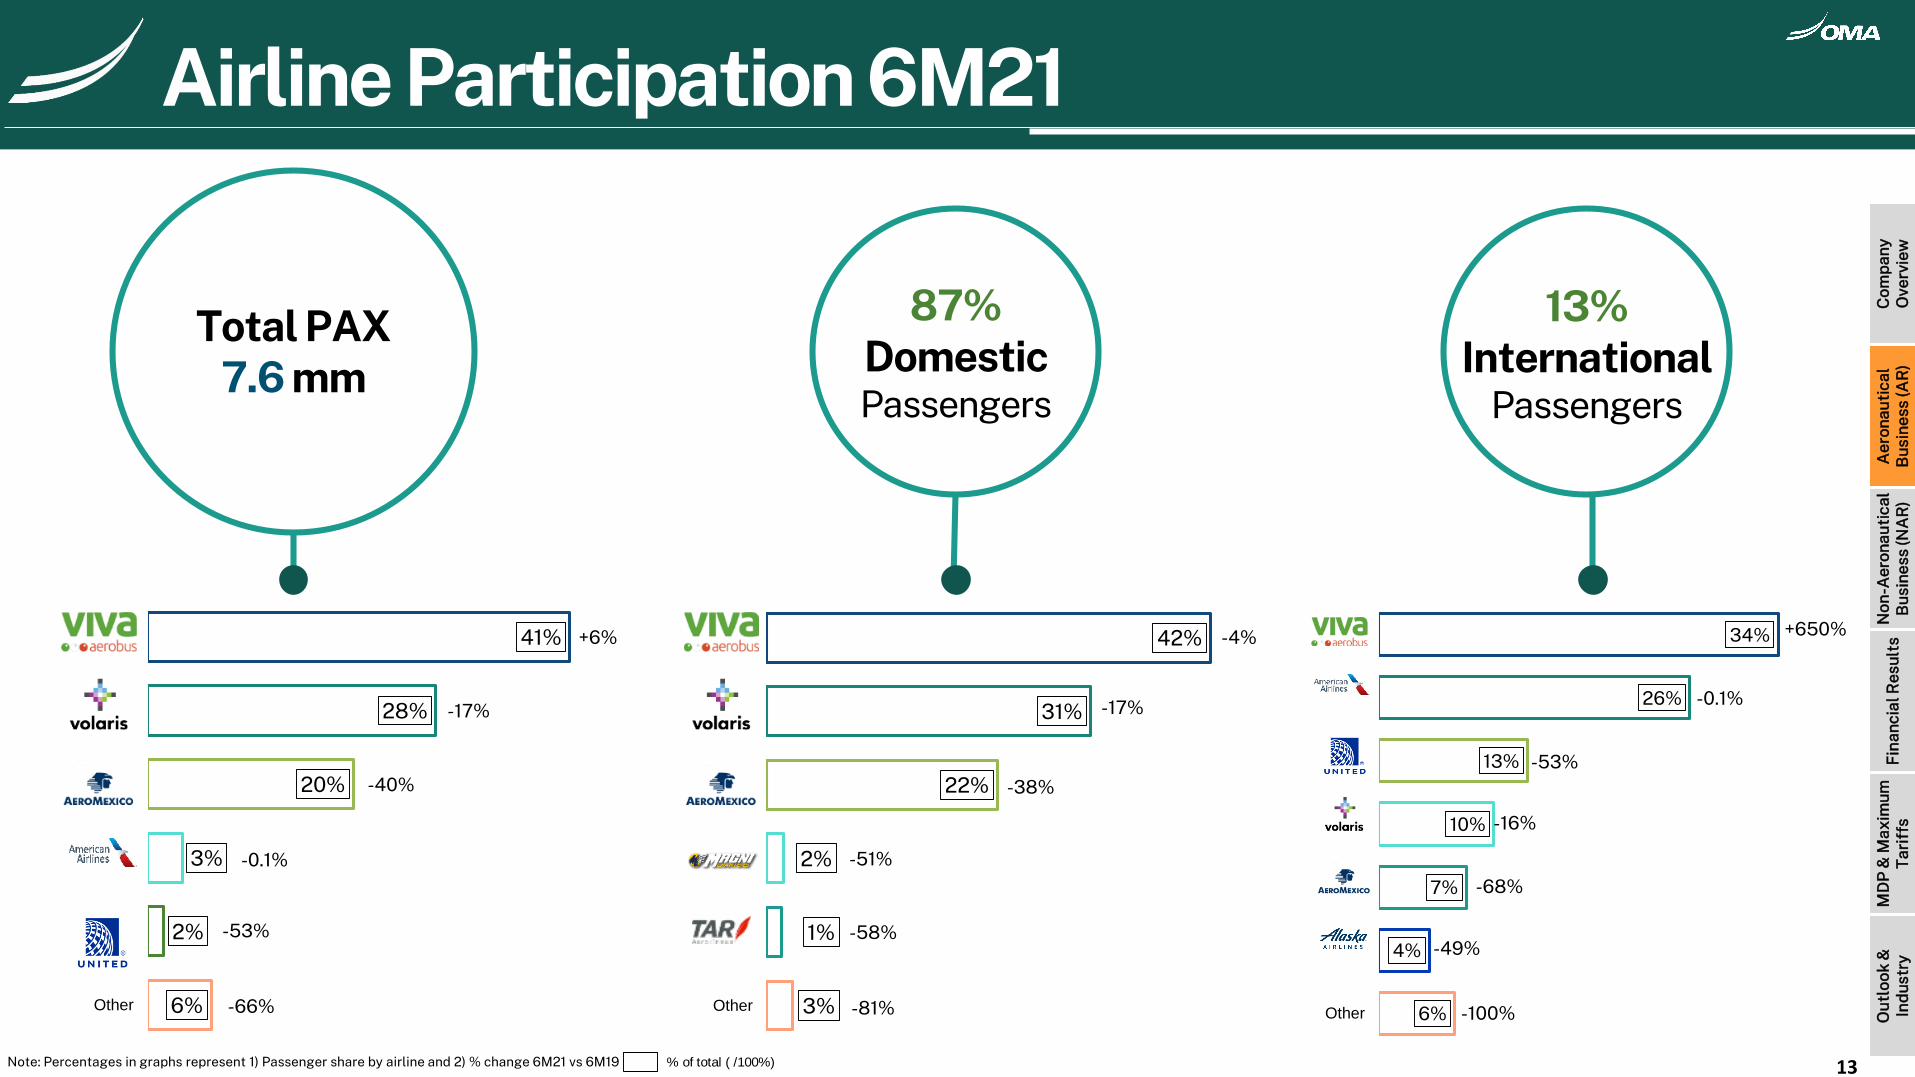
6%
4%
7%
10%
13%
26%
34%
Other
Alaska Airlines
GrupoAeroméxico
Volaris
United Airlines
AmericanAirlines
Viva Aerobus
3%
1%
2%
22%
31%
42%
Other
TAR Aerolíneas
Magnicharters
GrupoAeroméxico
Volaris
Viva Aerobus
Note: Percentages in graphs represent 1) Passenger share by airline and 2) % change 6M21 vs 6M19 % of total ( /100%)
-4%
-17%
-38%
-51%
-58%
-81%
+650%
-0.1%
-53%
-16%
-68%
-49%
-100%
87%DomesticPassengers
13%International
Passengers
Total PAX7.6 mm
6%
2%
3%
20%
28%
41%
Other
UnitedAirlines
AmericanAirlines
GrupoAeroméxico
Volaris
Viva Aerobus +6%
-40%
-17%
-0.1%
-53%
-66%
13
Passenger Flows and Top Routes 5M21Historical PerformanceAirline Participation 6M21
Com
pan
yO
verv
iew
Aer
onau
tica
lB
usin
ess
(AR
)N
on-A
eron
auti
cal
Bus
ines
s (N
AR
)F
inan
cial
Res
ults
MD
P &
Max
imum
Tar
iffs
Out
look
&In
dus
try
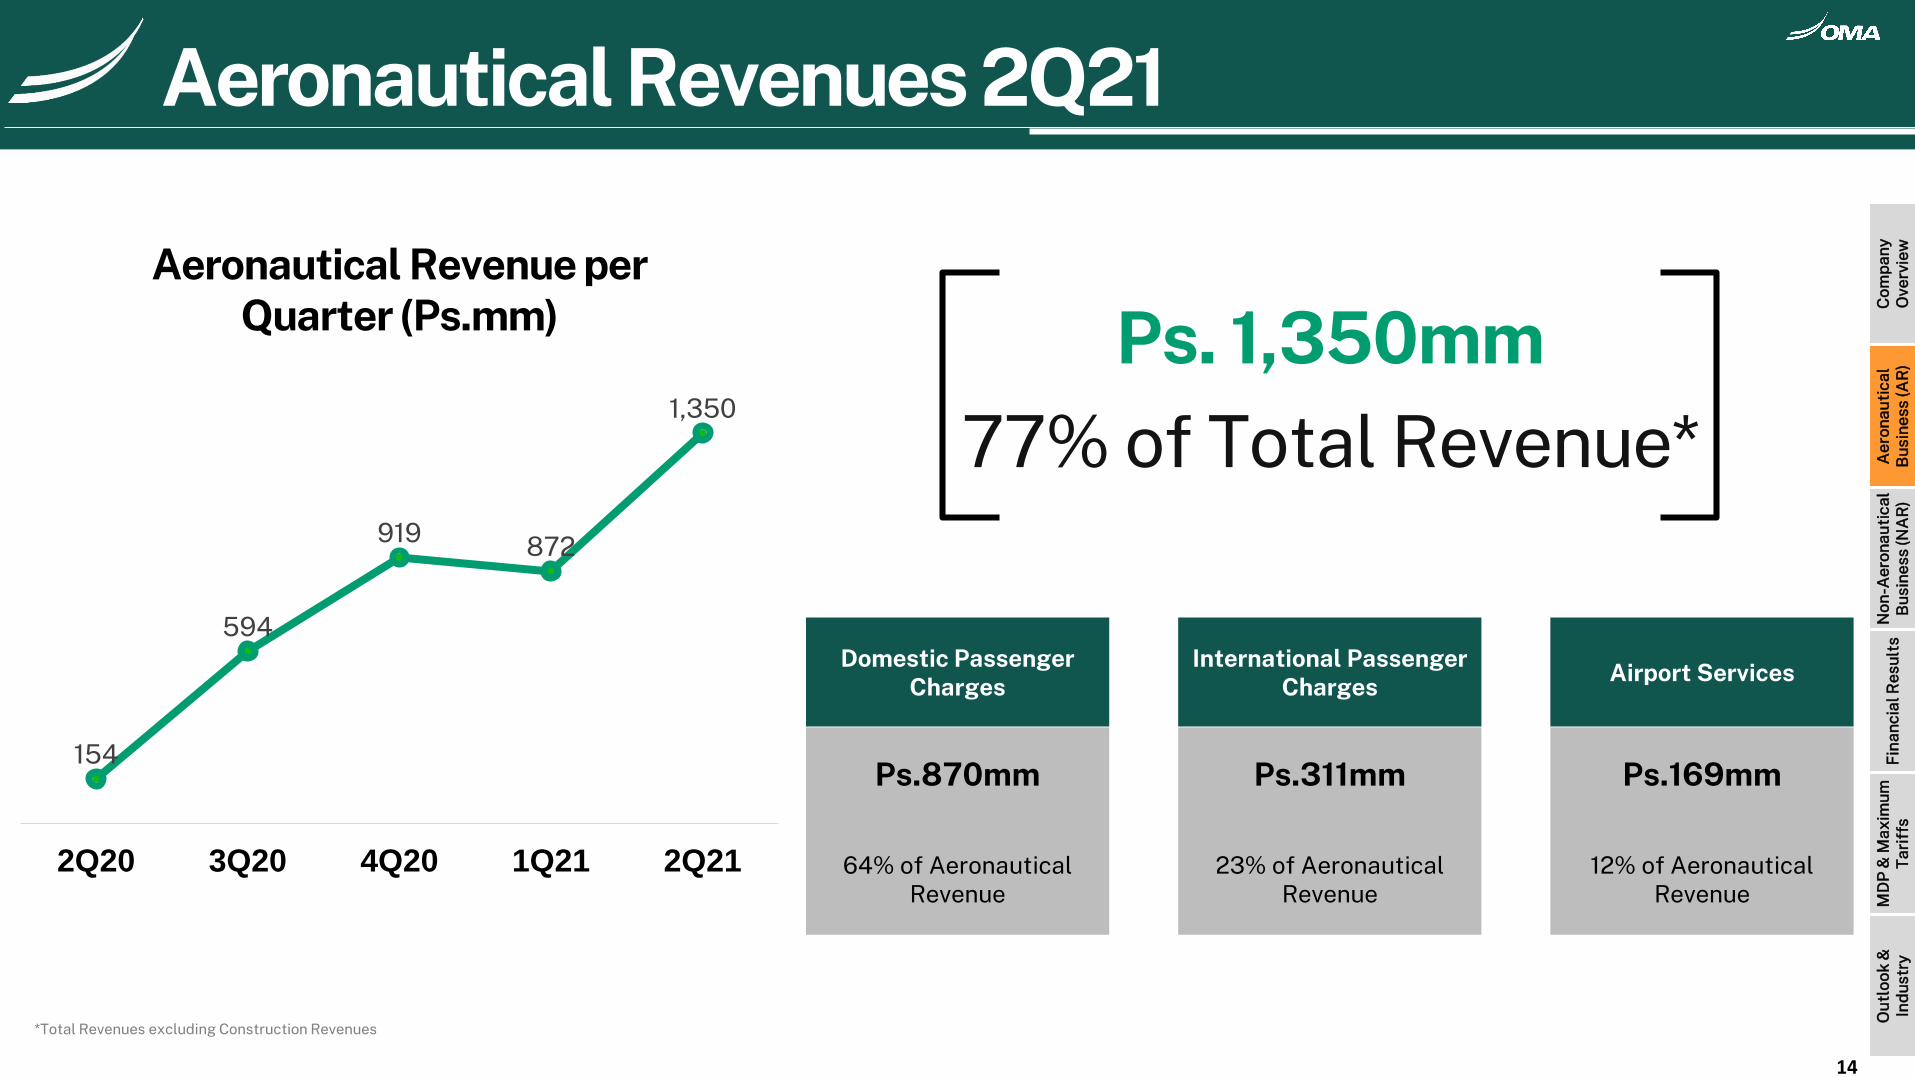
Ps. 1,350mm77% of Total Revenue*
Domestic Passenger Charges
International Passenger Charges
Airport Services
Ps.870mm
64% of Aeronautical Revenue
Ps.311mm
23% of AeronauticalRevenue
Ps.169mm
12% of Aeronautical Revenue
154
594
919 872
1,350
2Q20 3Q20 4Q20 1Q21 2Q21
*Total Revenues excluding Construction Revenues
Aeronautical Revenue per Quarter (Ps.mm)
Aeronautical Revenues 2Q21
14
Com
pan
yO
verv
iew
Aer
onau
tica
lB
usin
ess
(AR
)N
on-A
eron
auti
cal
Bus
ines
s (N
AR
)F
inan
cial
Res
ults
MD
P &
Max
imum
Tar
iffs
Out
look
&In
dus
try
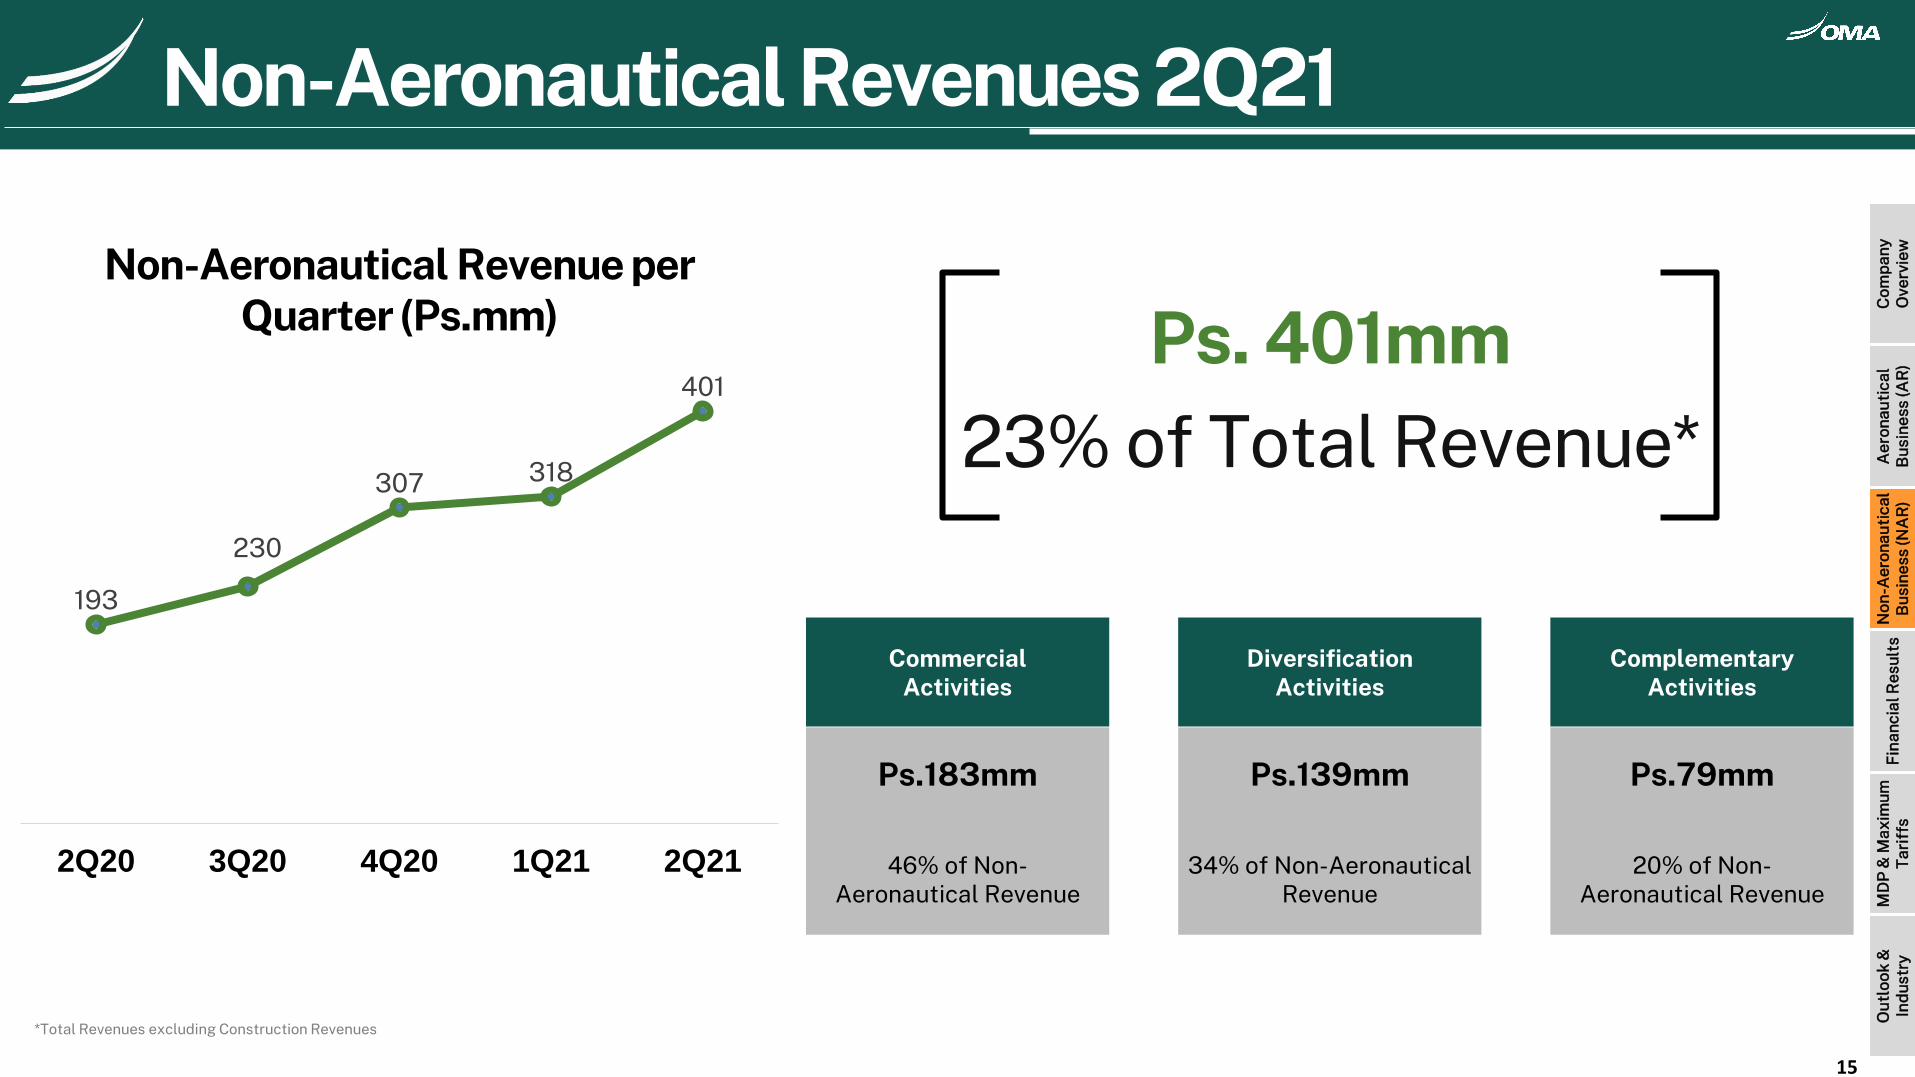
193
230
307 318
401
2Q20 3Q20 4Q20 1Q21 2Q21
Ps. 401mm23% of Total Revenue*
CommercialActivities
DiversificationActivities
ComplementaryActivities
Ps.183mm
46% of Non-Aeronautical Revenue
Ps.139mm
34% of Non-AeronauticalRevenue
Ps.79mm
20% of Non-Aeronautical Revenue
*Total Revenues excluding Construction Revenues
Non-Aeronautical Revenue per Quarter (Ps.mm)
Non-Aeronautical Revenues 2Q21
15
Com
pan
yO
verv
iew
Aer
onau
tica
lB
usin
ess
(AR
)N
on-A
eron
auti
cal
Bus
ines
s (N
AR
)F
inan
cial
Res
ults
MD
P &
Max
imum
Tar
iffs
Out
look
&In
dus
try
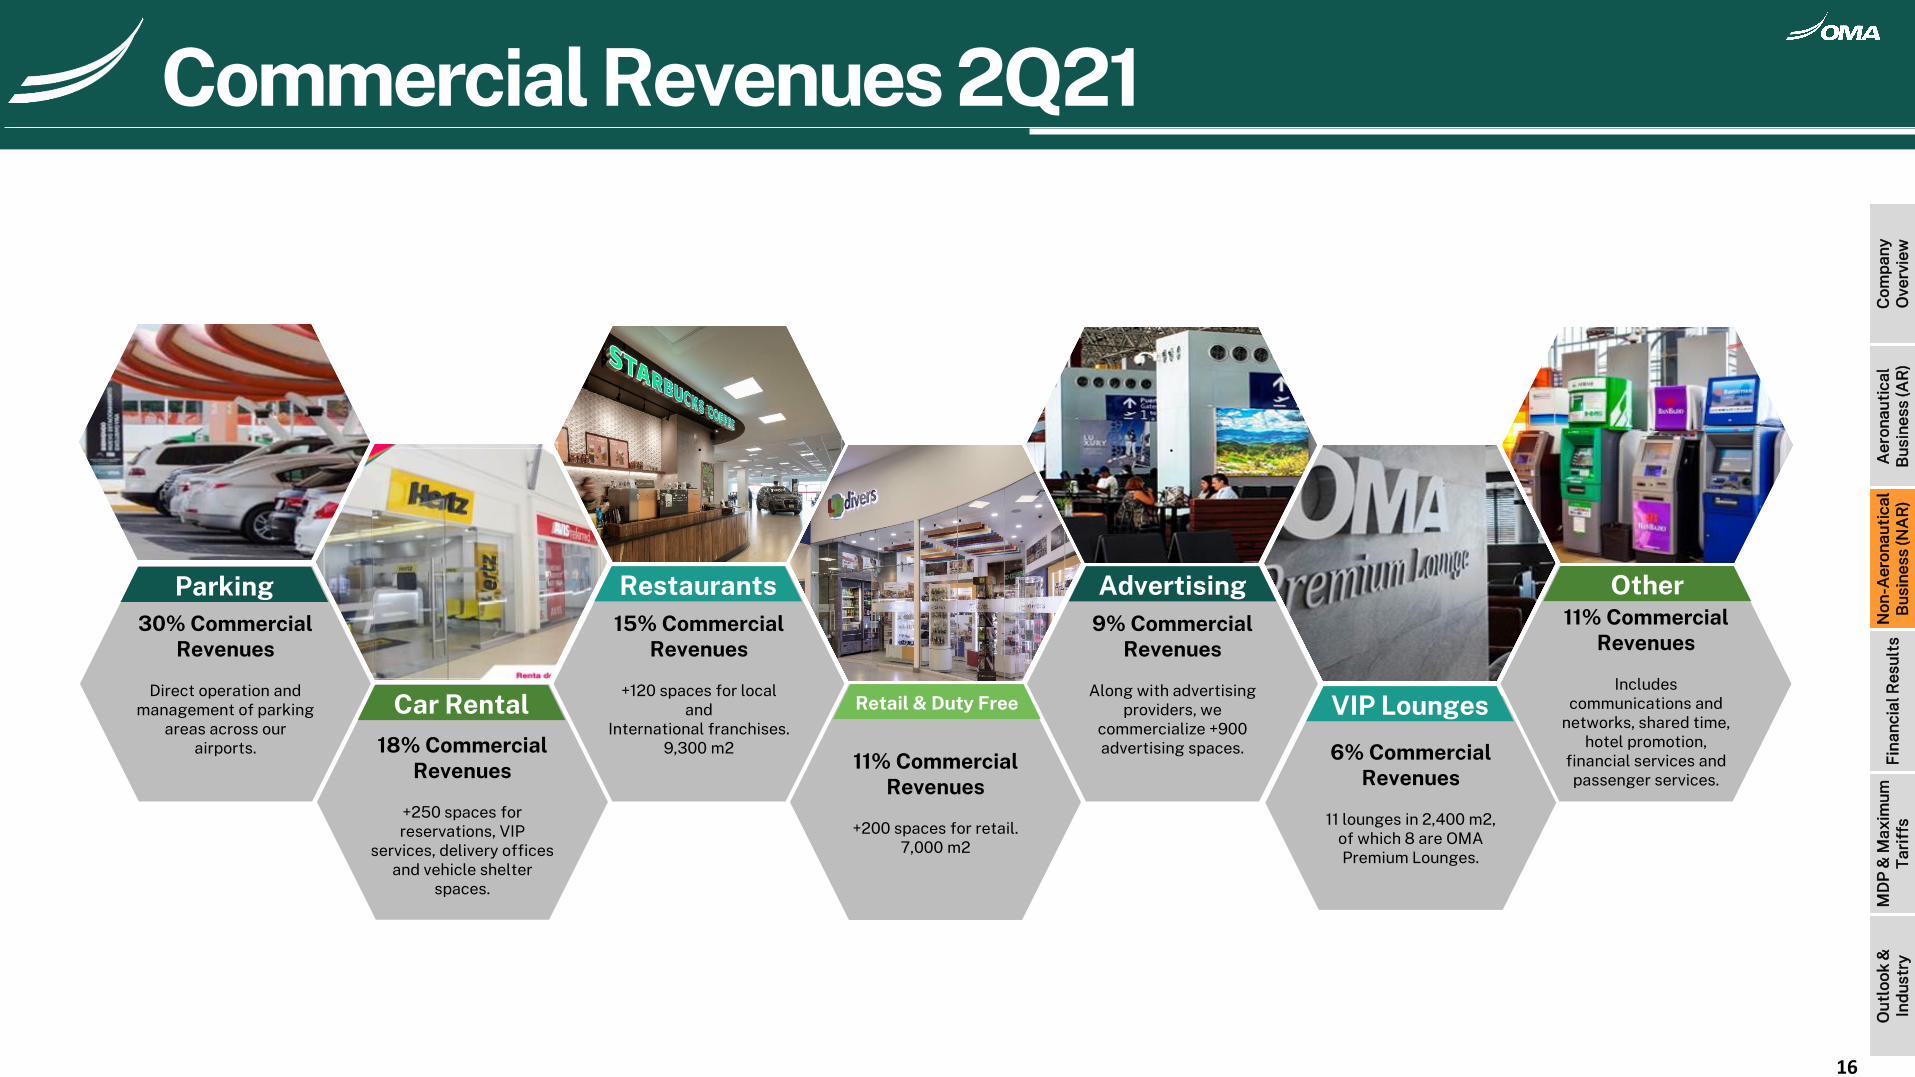
.
30% CommercialRevenues
Direct operation and management of parking
areas across our airports.
Parking
18% CommercialRevenues
+250 spaces for reservations, VIP
services, delivery offices and vehicle shelter
spaces.
Car Rental
11% CommercialRevenues
+200 spaces for retail.7,000 m2
Retail & Duty Free
.
9% CommercialRevenues
Along with advertising providers, we
commercialize +900 advertising spaces.
Advertising15% Commercial
Revenues
+120 spaces for local and
International franchises.9,300 m2
Restaurants
6% CommercialRevenues
11 lounges in 2,400 m2, of which 8 are OMA Premium Lounges.
VIP Lounges
11% CommercialRevenues
Includes communications and
networks, shared time, hotel promotion,
financial services andpassenger services.
Other
Commercial Revenues 2Q21
16
Com
pan
yO
verv
iew
Aer
onau
tica
lB
usin
ess
(AR
)N
on-A
eron
auti
cal
Bus
ines
s (N
AR
)F
inan
cial
Res
ults
MD
P &
Max
imum
Tar
iffs
Out
look
&In
dus
try
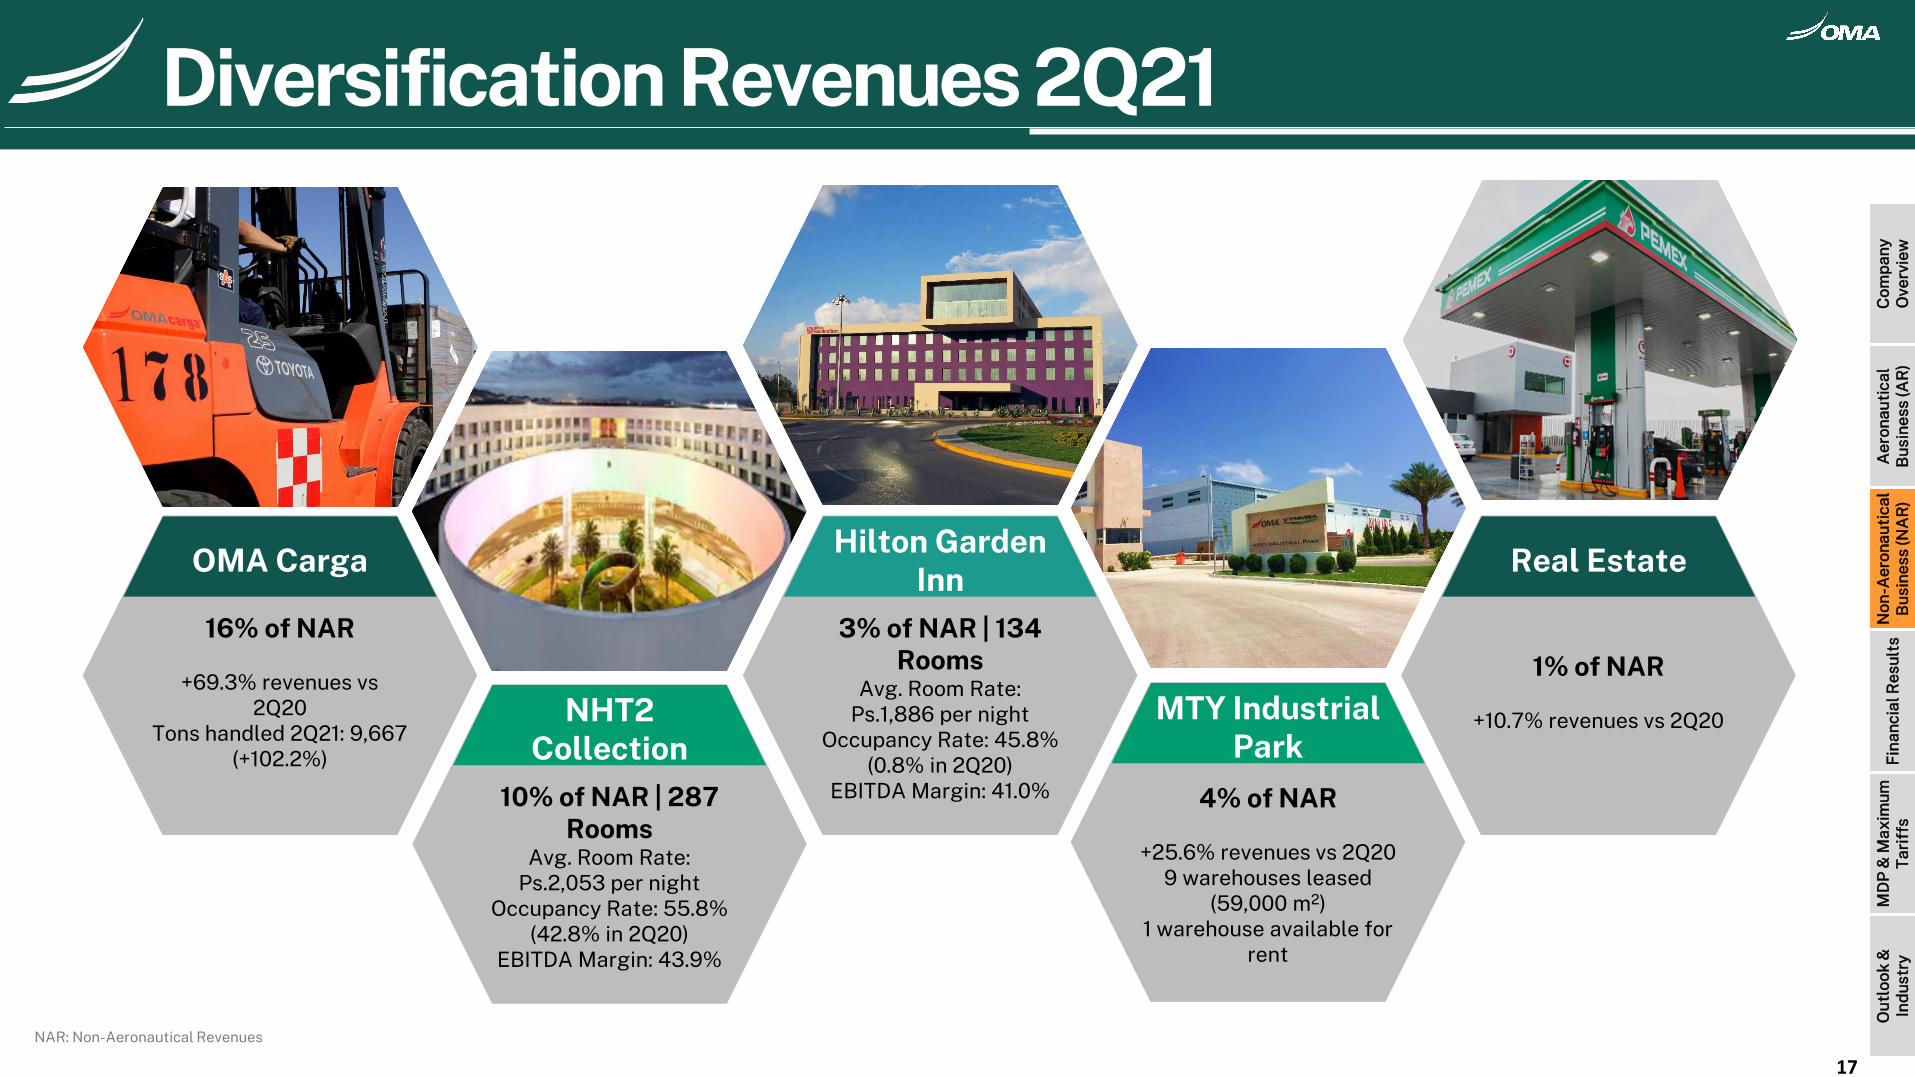
10% of NAR | 287 Rooms
Avg. Room Rate:Ps.2,053 per night
Occupancy Rate: 55.8%(42.8% in 2Q20)
EBITDA Margin: 43.9%
NHT2 Collection
3% of NAR | 134 Rooms
Avg. Room Rate:Ps.1,886 per night
Occupancy Rate: 45.8%(0.8% in 2Q20)
EBITDA Margin: 41.0%
Hilton Garden Inn
16% of NAR
+69.3% revenues vs 2Q20
Tons handled 2Q21: 9,667(+102.2%)
OMA Carga
4% of NAR
+25.6% revenues vs 2Q209 warehouses leased
(59,000 m2)1 warehouse available for
rent
MTY Industrial Park
1% of NAR
+10.7% revenues vs 2Q20
Real Estate
Diversification Revenues 2Q21
17
NAR: Non-Aeronautical Revenues
Com
pan
yO
verv
iew
Aer
onau
tica
lB
usin
ess
(AR
)N
on-A
eron
auti
cal
Bus
ines
s (N
AR
)F
inan
cial
Res
ults
MD
P &
Max
imum
Tar
iffs
Out
look
&In
dus
try
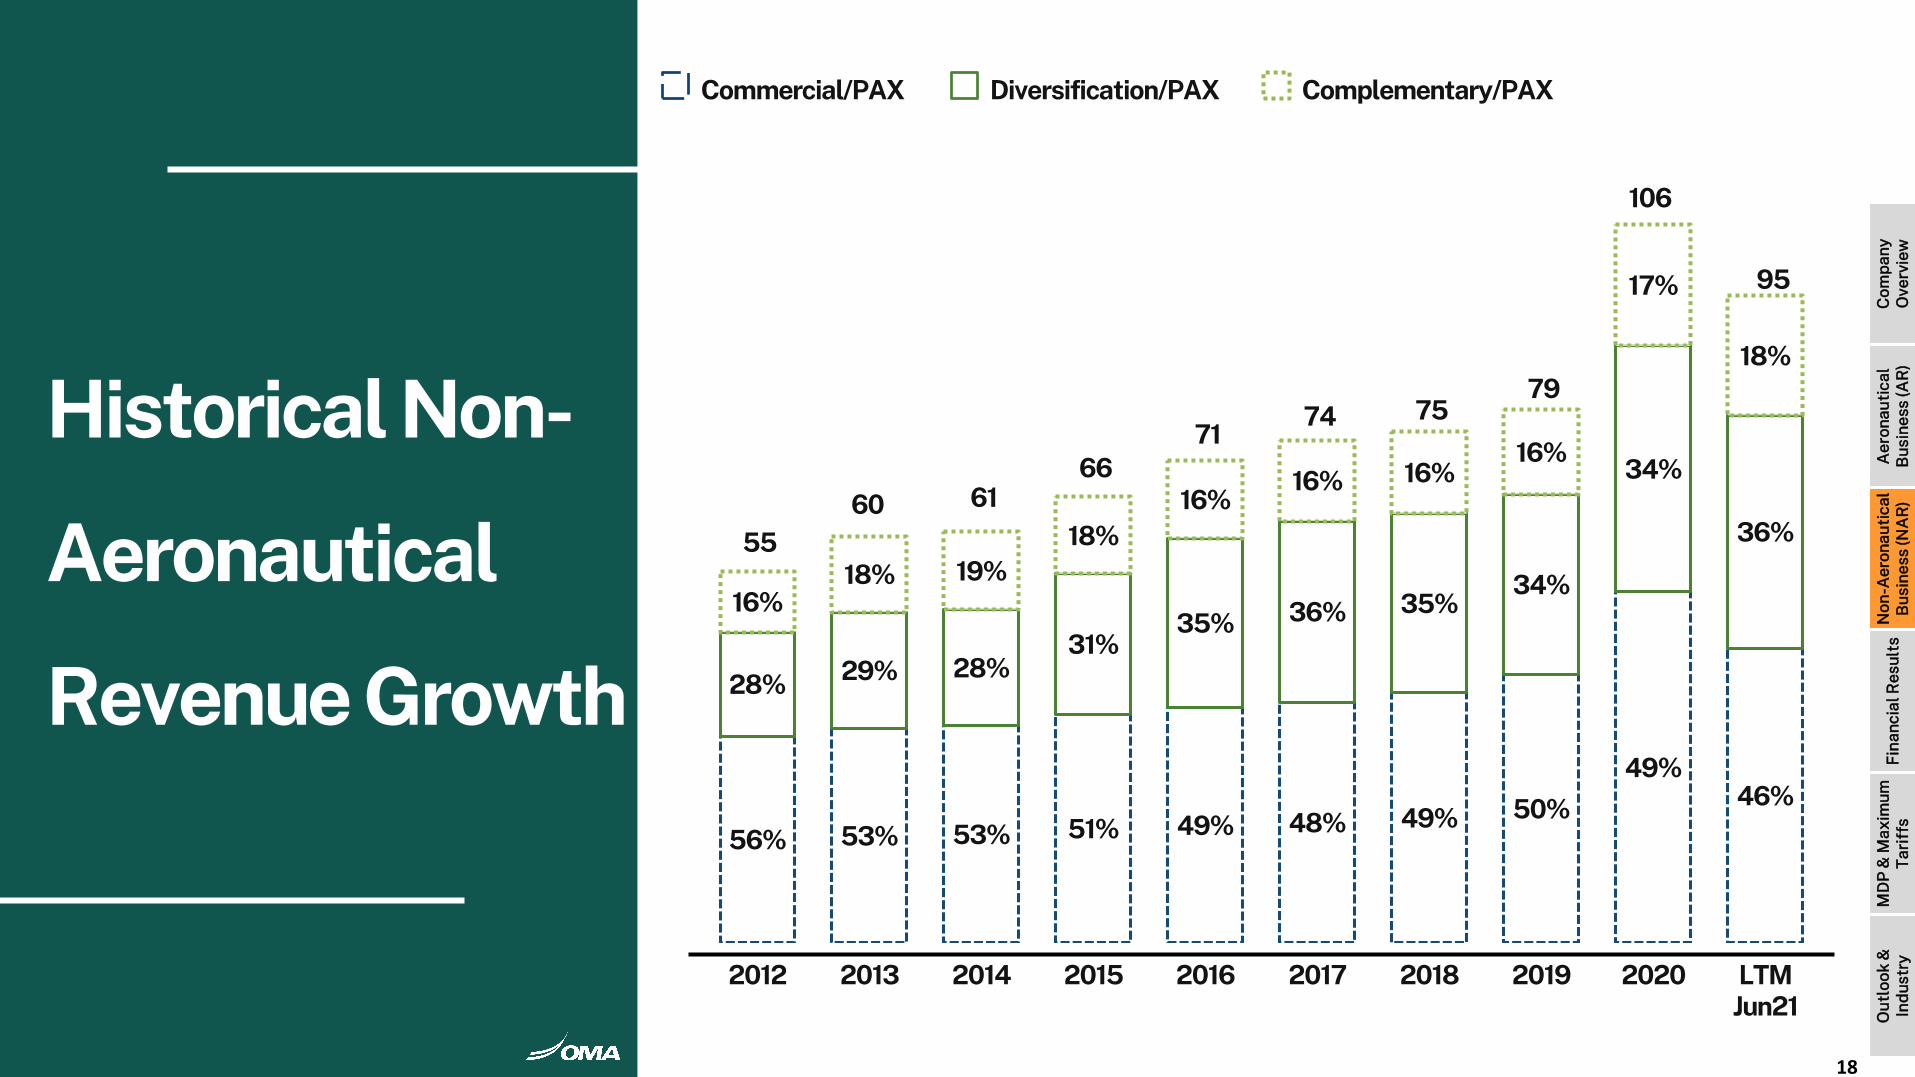
56% 53% 53% 51% 49% 48% 49% 50%
49%46%
28% 29% 28%31%
35% 36% 35%34%
34%
36%
16%18% 19%
18%16%
16% 16%16%
17%
18%
55 60 61
66 71
74 75 79
106
95
2012 2013 2014 2015 2016 2017 2018 2019 2020 LTM Jun21
Historical Non-
Aeronautical
Revenue Growth
Commercial/PAX Diversification/PAX Complementary/PAX
18
Com
pan
yO
verv
iew
Aer
onau
tica
lB
usin
ess
(AR
)N
on-A
eron
auti
cal
Bus
ines
s (N
AR
)F
inan
cial
Res
ults
MD
P &
Max
imum
Tar
iffs
Out
look
&In
dus
try
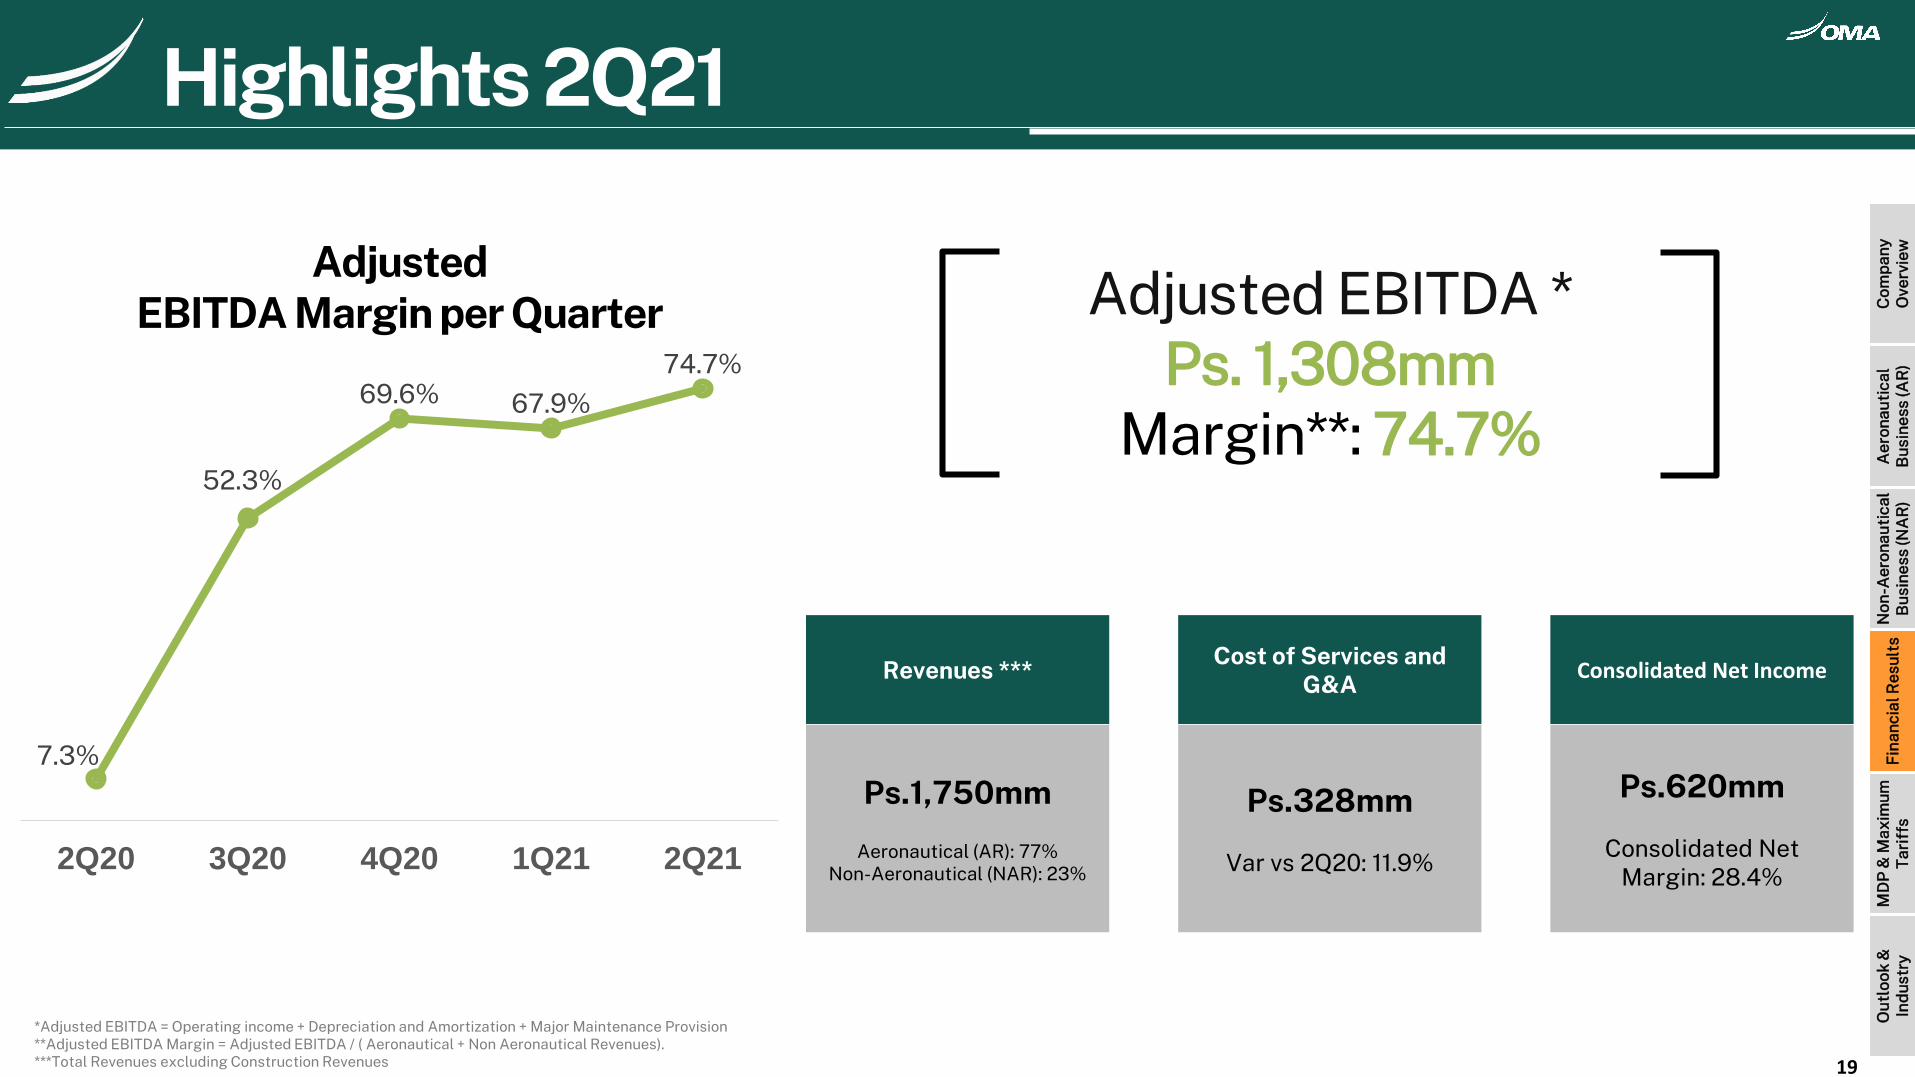
Adjusted EBITDA *Ps. 1,308mm
Margin**: 74.7%
Revenues ***Cost of Services and
G&AConsolidated Net Income
Ps.1,750mm
Aeronautical (AR): 77%Non-Aeronautical (NAR): 23%
Ps.328mm
Var vs 2Q20: 11.9%
Ps.620mm
Consolidated Net Margin: 28.4%
*Adjusted EBITDA = Operating income + Depreciation and Amortization + Major Maintenance Provision**Adjusted EBITDA Margin = Adjusted EBITDA / ( Aeronautical + Non Aeronautical Revenues).***Total Revenues excluding Construction Revenues
AdjustedEBITDA Margin per Quarter
7.3%
52.3%
69.6% 67.9%
74.7%
2Q20 3Q20 4Q20 1Q21 2Q21
Highlights 2Q21
19
Com
pan
yO
verv
iew
Aer
onau
tica
lB
usin
ess
(AR
)N
on-A
eron
auti
cal
Bus
ines
s (N
AR
)F
inan
cial
Res
ults
MD
P &
Max
imum
Tar
iffs
Out
look
&In
dus
try
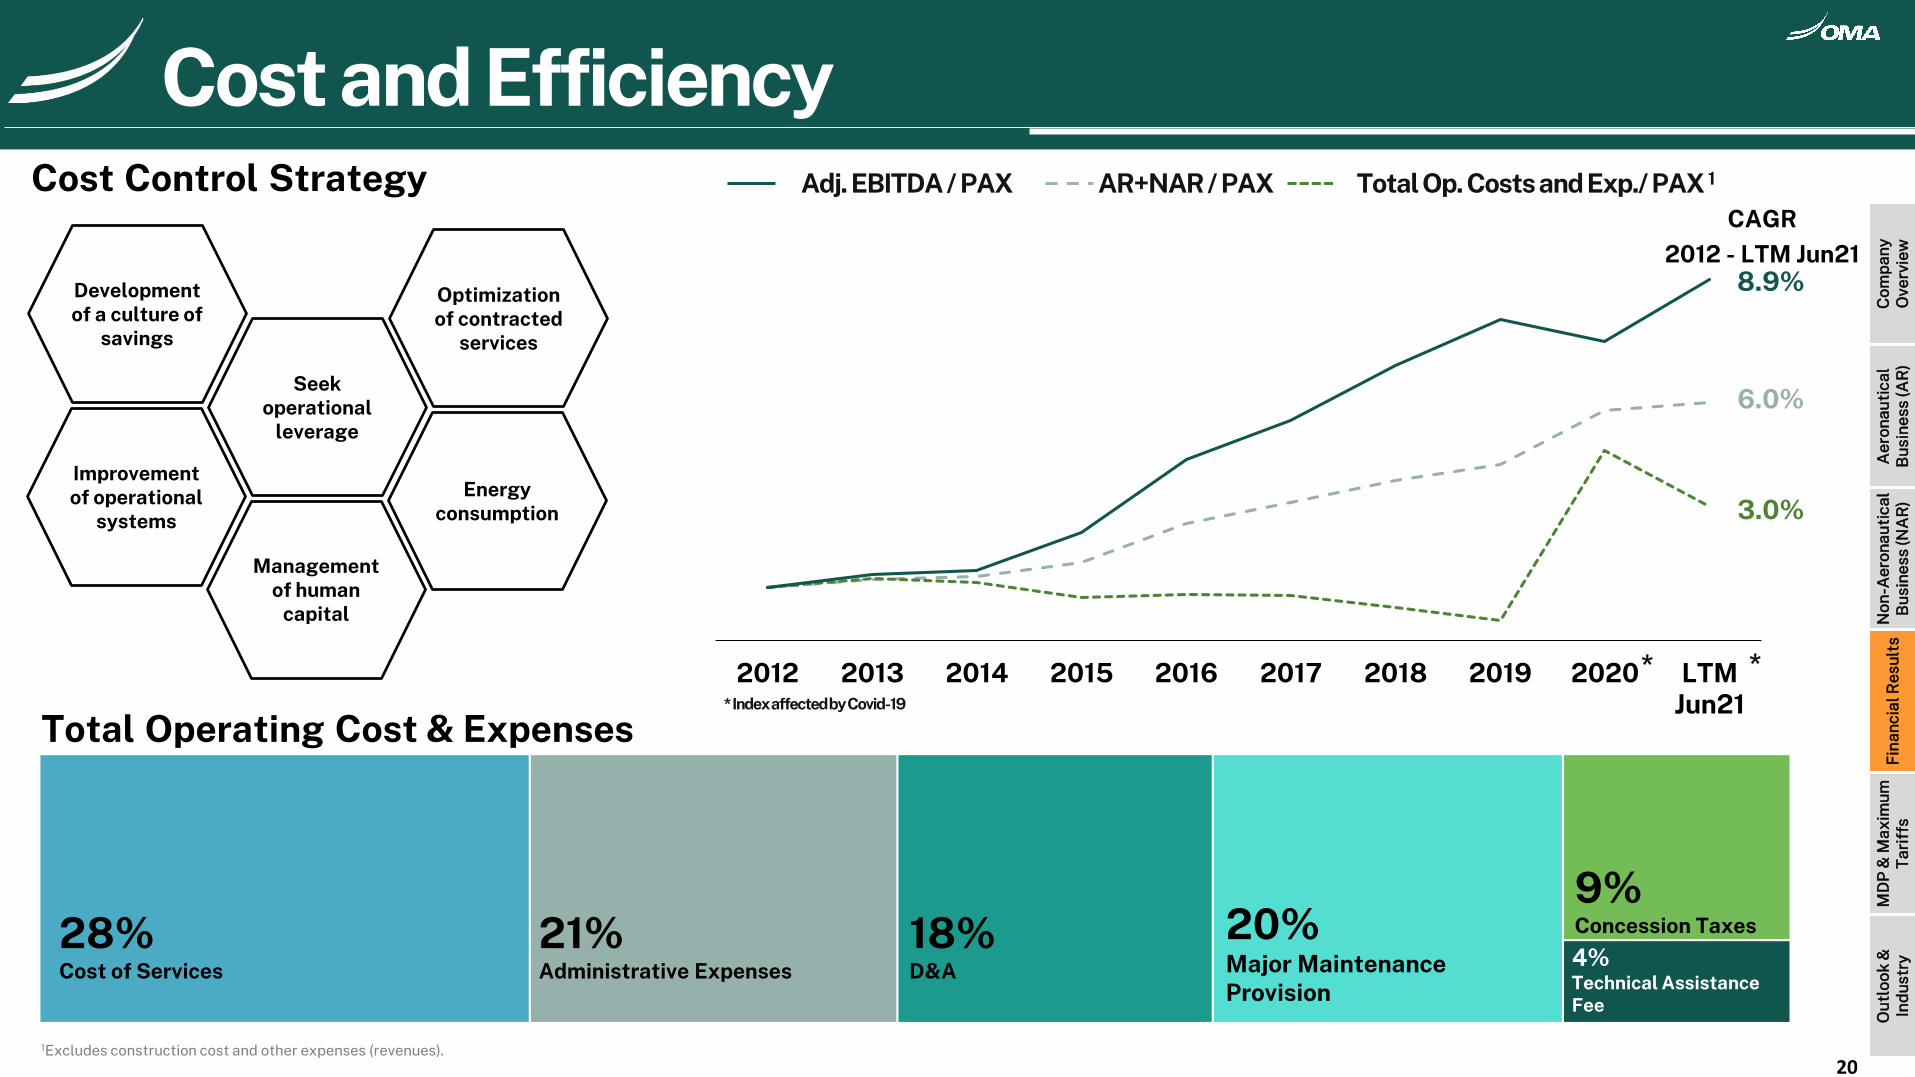
Seekoperational
leverage
Development of a culture of
savings
Improvement of operational
systems
Energy consumption
Optimizationof contracted
services
Management of human
capital 80.0 0
100 .00
120 .00
140 .00
160 .00
180 .00
200 .00
220 .00
240 .00
2012 2013 2014 2015 2016 2017 2018 2019 2020 LTM Jun21
CAGR
2012 - LTM Jun21
6.0%
8.9%
3.0%
Cost Control Strategy
Total Operating Cost & Expenses
AR+NAR / PAXAdj. EBITDA / PAX Total Op. Costs and Exp./ PAX 1
1Excludes construction cost and other expenses (revenues).
Cost and Efficiency
* ** Index affected by Covid-19
20
Com
pan
yO
verv
iew
Aer
onau
tica
lB
usin
ess
(AR
)N
on-A
eron
auti
cal
Bus
ines
s (N
AR
)F
inan
cial
Res
ults
MD
P &
Max
imum
Tar
iffs
Out
look
&In
dus
try
28%Cost of Services
21%Administrative Expenses
18%D&A
20%Major Maintenance Provision
9%Concession Taxes
4%Technical Assistance Fee
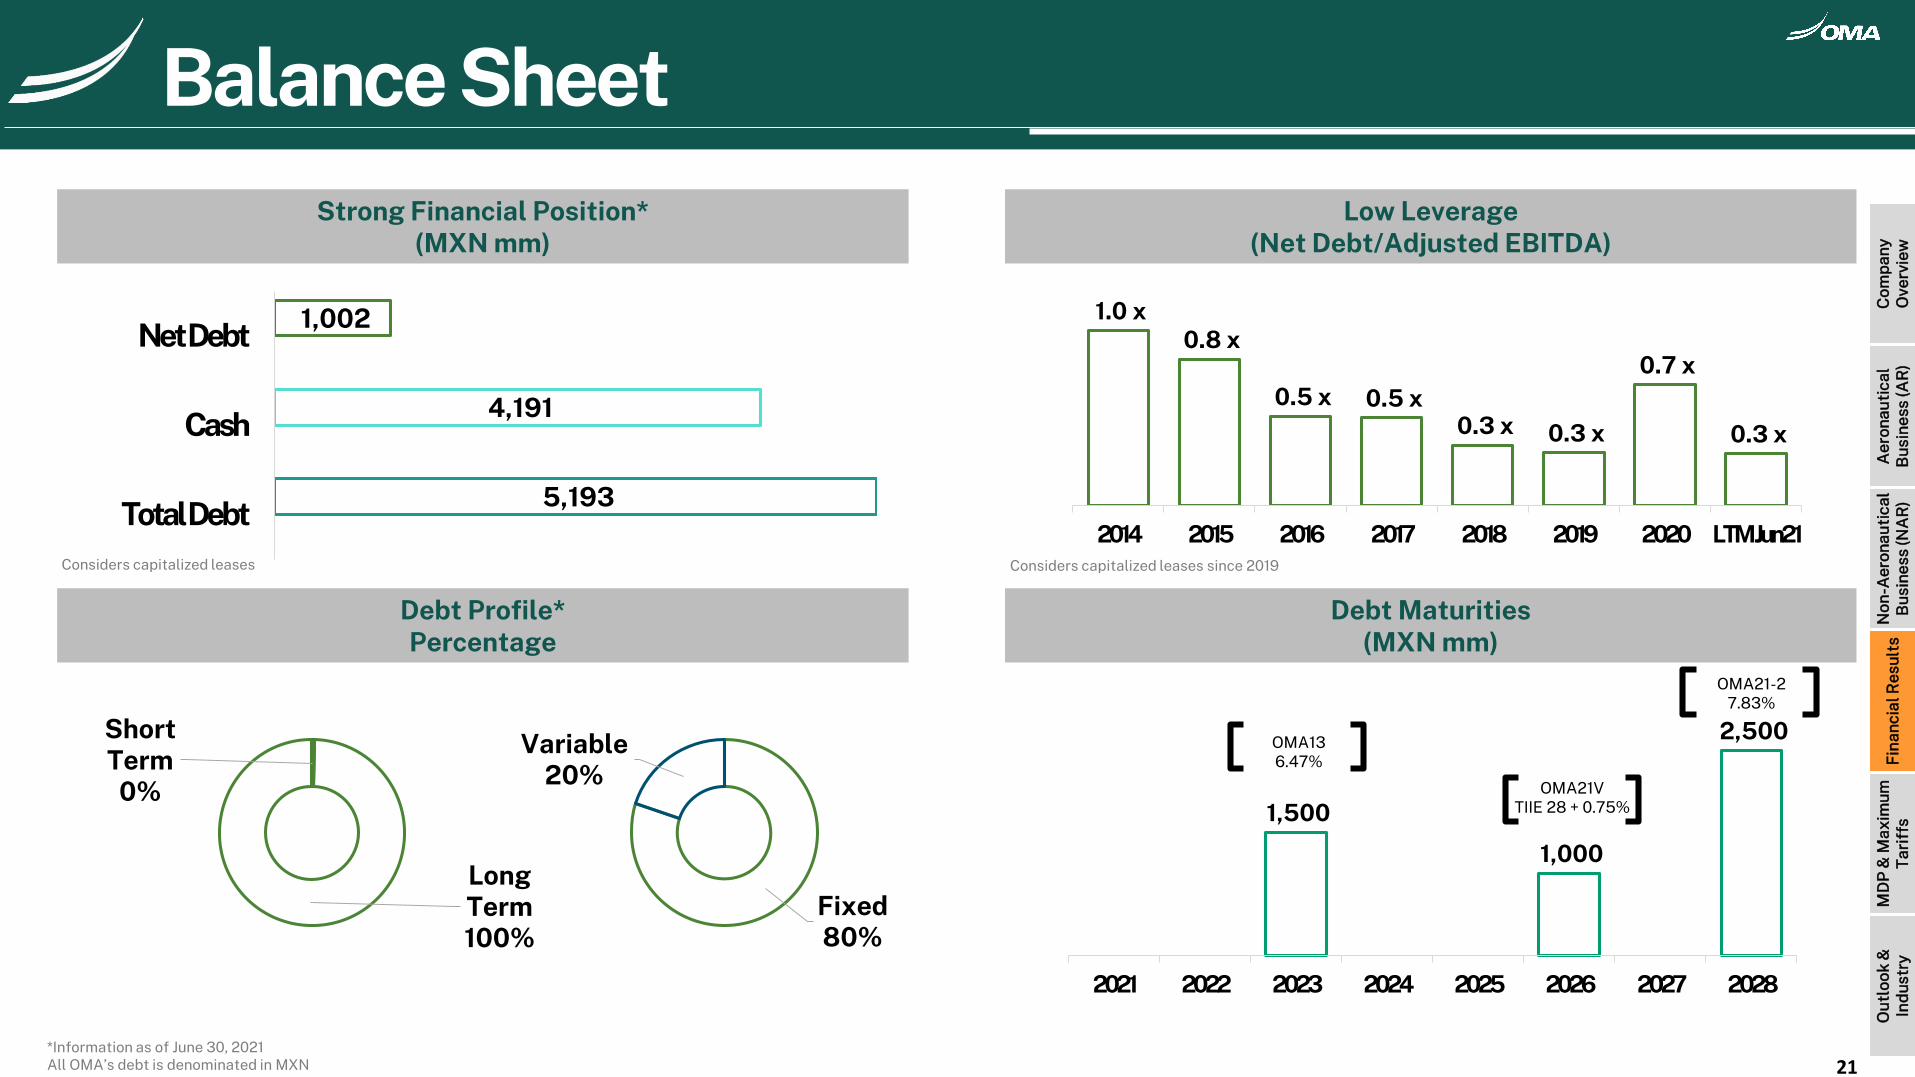
Strong Financial Position*(MXN mm)
Low Leverage(Net Debt/Adjusted EBITDA)
Debt Profile*Percentage
Debt Maturities(MXN mm)
5,193
4,191
1,002
Total Debt
Cash
Net Debt
Short Term
0%
Long Term100%
1.0 x0.8 x
0.5 x 0.5 x0.3 x 0.3 x
0.7 x
0.3 x
2014 2015 2016 2017 2018 2019 2020 LTM Jun21
1,500
1,000
2,500
2021 2022 2023 2024 2025 2026 2027 2028
*Information as of June 30, 2021All OMA’s debt is denominated in MXN
Considers capitalized leases since 2019
Balance Sheet
OMA136.47%
OMA21VTIIE 28 + 0.75%
OMA21-27.83%
Fixed80%
Variable20%
21
Considers capitalized leases
Com
pan
yO
verv
iew
Aer
onau
tica
lB
usin
ess
(AR
)N
on-A
eron
auti
cal
Bus
ines
s (N
AR
)F
inan
cial
Res
ults
MD
P &
Max
imum
Tar
iffs
Out
look
&In
dus
try
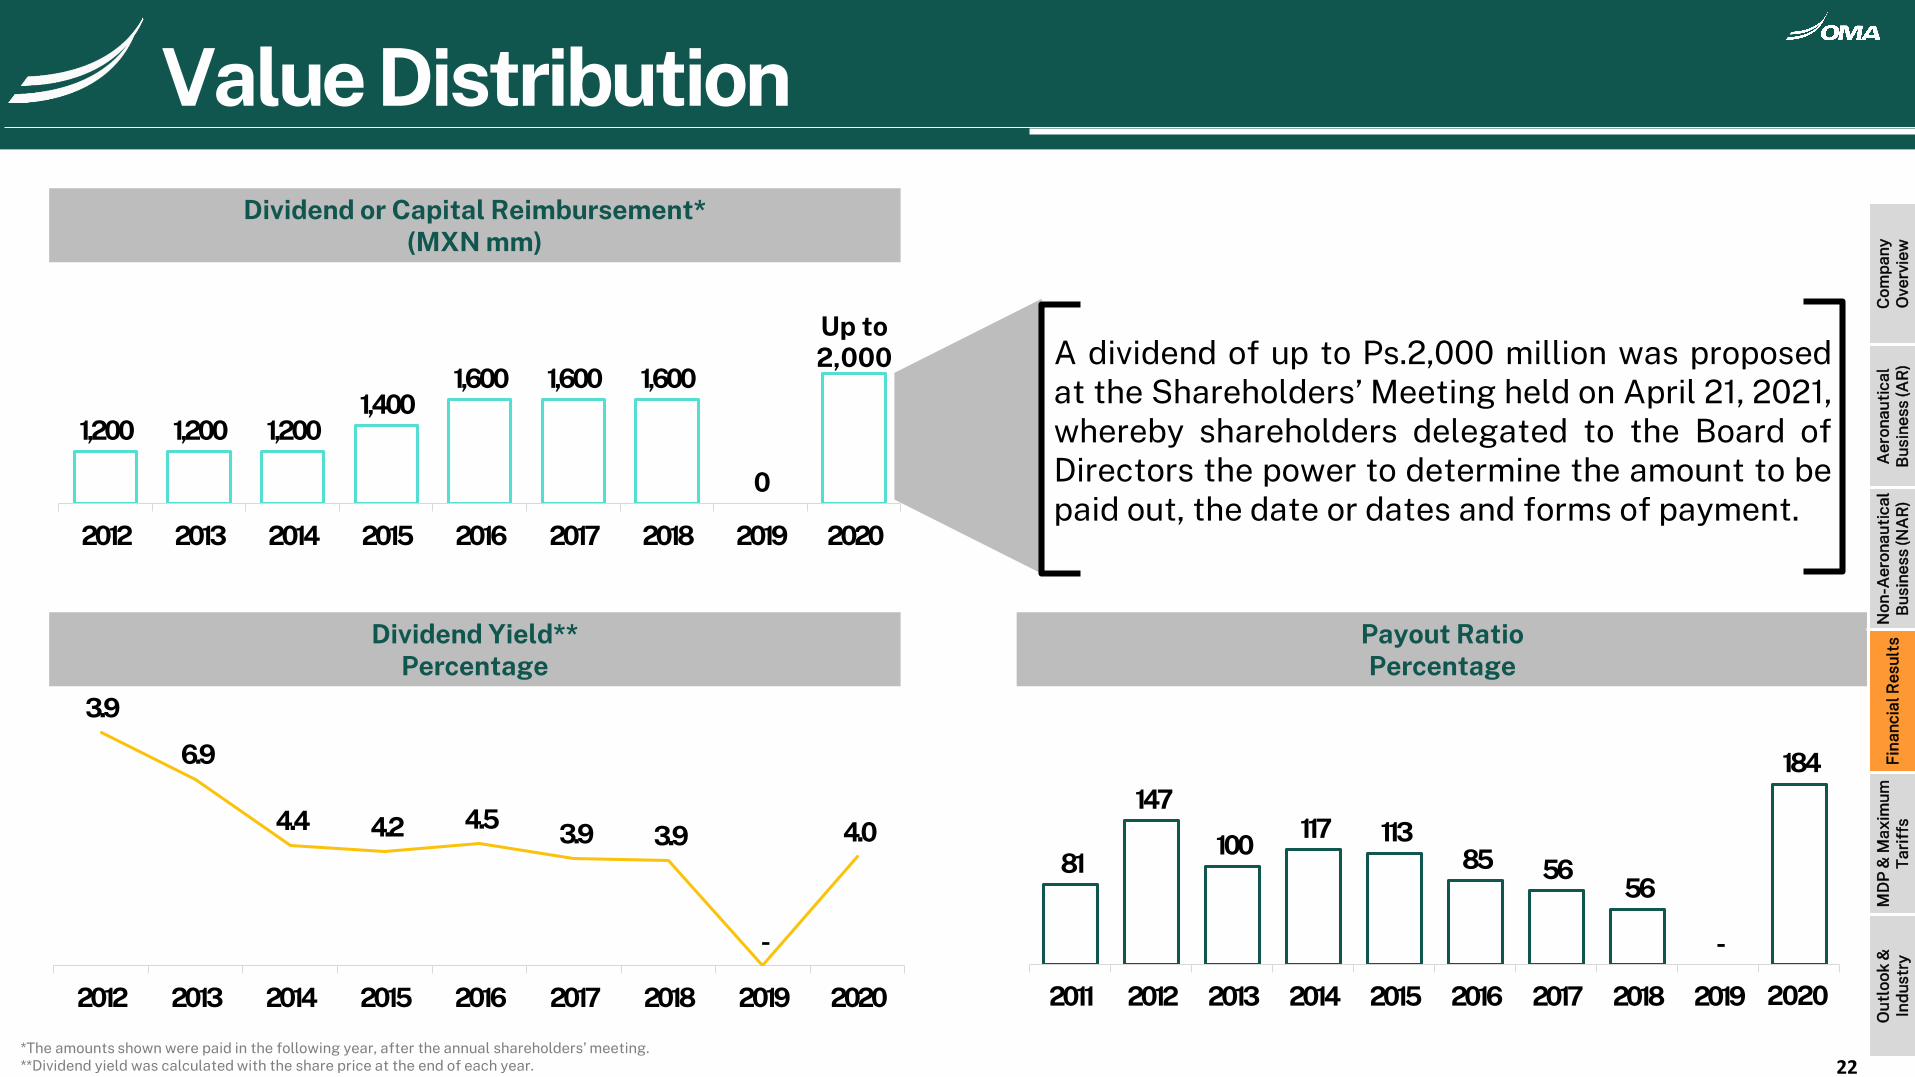
Value Distribution
1,200 1,200 1,2001,400
1,600 1,600 1,600
0
Up to 2,000
2012 2013 2014 2015 2016 2017 2018 2019 2020
Dividend or Capital Reimbursement*(MXN mm)
Dividend Yield**Percentage
3.9
6.9
4.4 4.2 4.5 3.9 3.9
-
4.0
2012 2013 2014 2015 2016 2017 2018 2019 2020
Payout Ratio Percentage
A dividend of up to Ps.2,000 million was proposedat the Shareholders’ Meeting held on April 21, 2021,whereby shareholders delegated to the Board ofDirectors the power to determine the amount to bepaid out, the date or dates and forms of payment.
81
147
100 117 113
85 5656
-
184
2011 2012 2013 2014 2015 2016 2017 2018 2019
*The amounts shown were paid in the following year, after the annual shareholders’ meeting.**Dividend yield was calculated with the share price at the end of each year.
2020
22
Com
pan
yO
verv
iew
Aer
onau
tica
lB
usin
ess
(AR
)N
on-A
eron
auti
cal
Bus
ines
s (N
AR
)F
inan
cial
Res
ults
MD
P &
Max
imum
Tar
iffs
Out
look
&In
dus
try
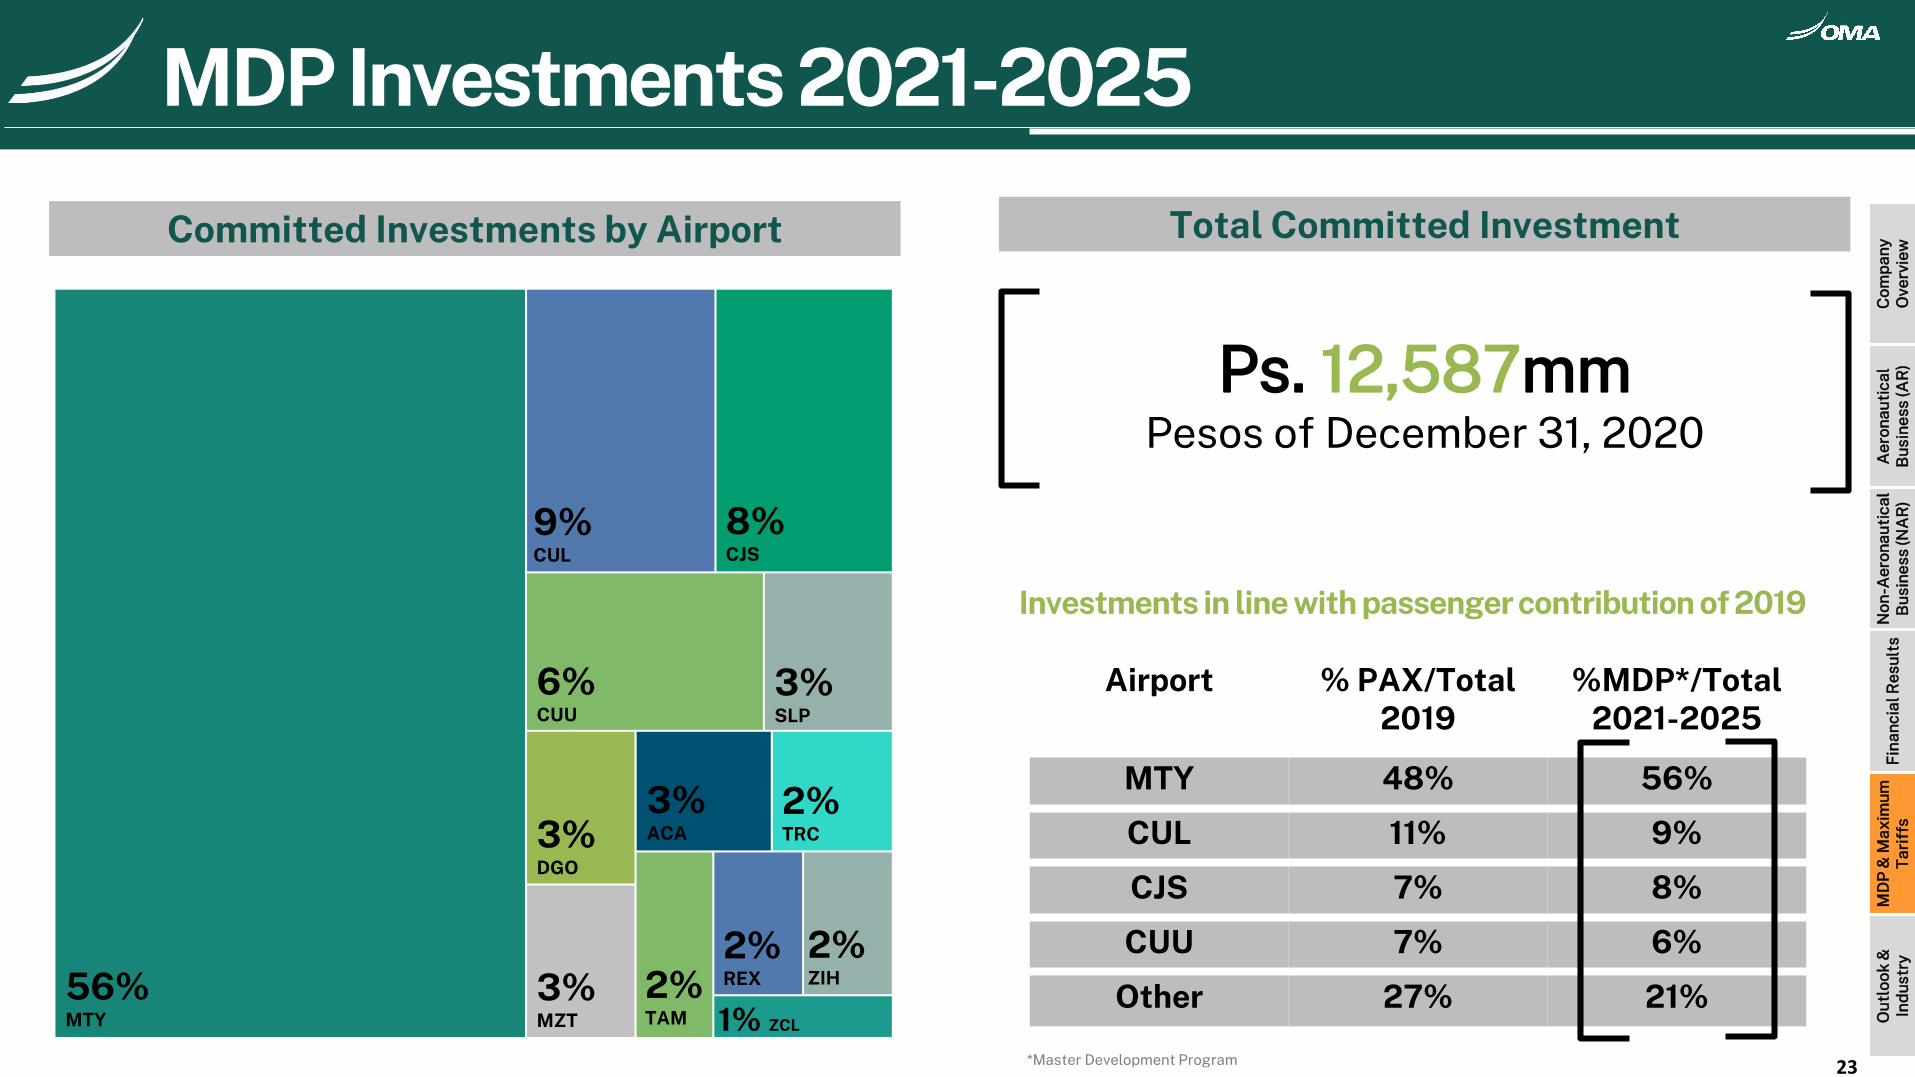
Investments in line with passenger contribution of 2019
MDP Investments 2021-2025
Airport % PAX/Total 2019
%MDP*/Total2021-2025
MTY 48% 56%
CUL 11% 9%
CJS 7% 8%
CUU 7% 6%
Other 27% 21%
Total Committed InvestmentCommitted Investments by Airport
Ps. 12,587mmPesos of December 31, 2020
56%MTY
9%CUL
8%CJS
6%CUU
3%SLP
3%DGO
3%ACA
2%TRC
3%MZT
2%TAM
2%REX
2%ZIH
1% ZCL
23*Master Development Program
Com
pan
yO
verv
iew
Aer
onau
tica
lB
usin
ess
(AR
)N
on-A
eron
auti
cal
Bus
ines
s (N
AR
)F
inan
cial
Res
ults
MD
P &
Max
imum
Tar
iffs
Out
look
&In
dus
try
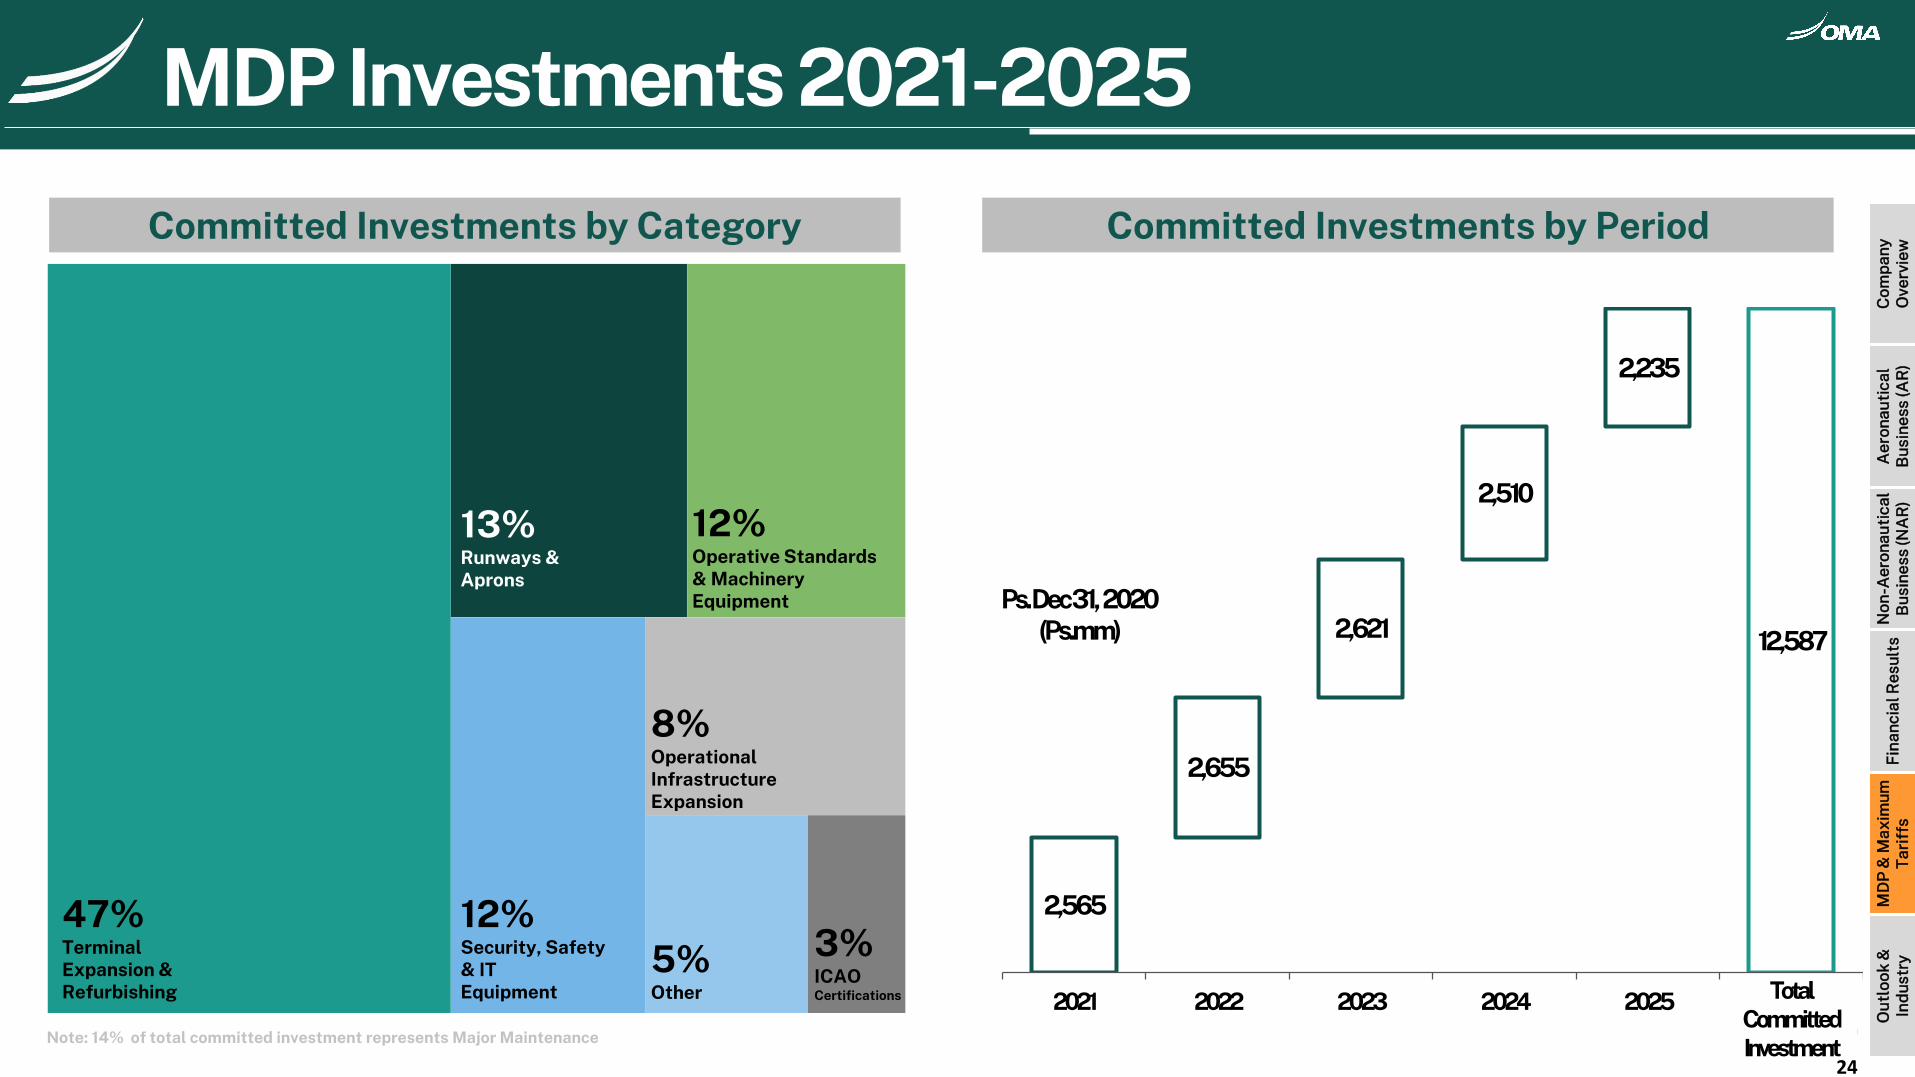
Note: 14% of total committed investment represents Major Maintenance
2,565
2,655
2,621
2,510
2,235
12,587
2021 2022 2023 2024 2025 Total Comprometido
Ps. Dec 31, 2020 (Ps.mm)
Total Committed Investment
MDP Investments 2021-2025
Committed Investments by Category
47%TerminalExpansion &Refurbishing
13%Runways &Aprons
12%Operative Standards & Machinery Equipment
8%Operational Infrastructure Expansion
12%Security, Safety & ITEquipment
5%Other
3%ICAO Certifications
Committed Investments by Period
24
Com
pan
yO
verv
iew
Aer
onau
tica
lB
usin
ess
(AR
)N
on-A
eron
auti
cal
Bus
ines
s (N
AR
)F
inan
cial
Res
ults
MD
P &
Max
imum
Tar
iffs
Out
look
&In
dus
try
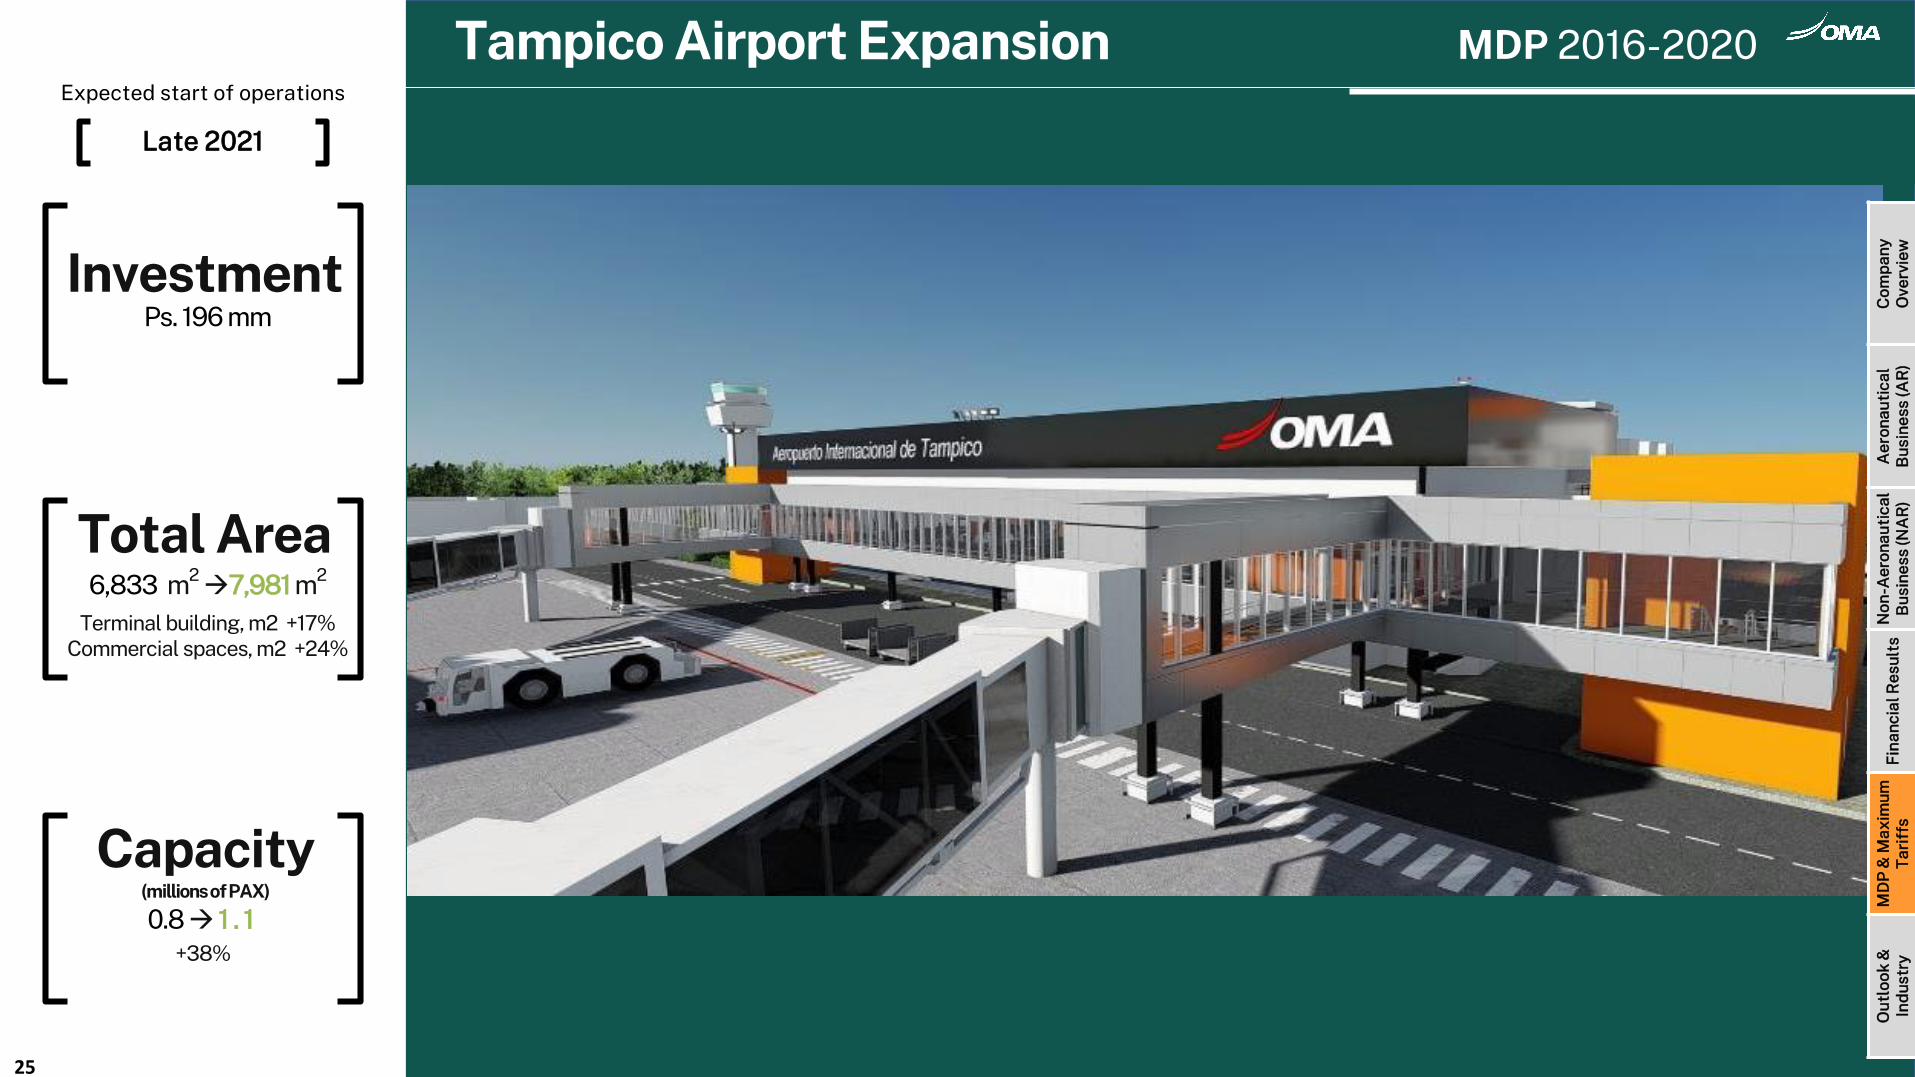
Tampico Airport Expansion MDP 2016-2020
25
Expected start of operations
Late 2021
Total Area6,833 m2
→7,981 m2
Terminal building, m2 +17% Commercial spaces, m2 +24%
0.8→ 1 . 1+38%
InvestmentPs. 196 mm
Capacity(millions of PAX)
Com
pan
yO
verv
iew
Aer
onau
tica
lB
usin
ess
(AR
)N
on-A
eron
auti
cal
Bus
ines
s (N
AR
)F
inan
cial
Res
ults
MD
P &
Max
imum
Tar
iffs
Out
look
&In
dus
try
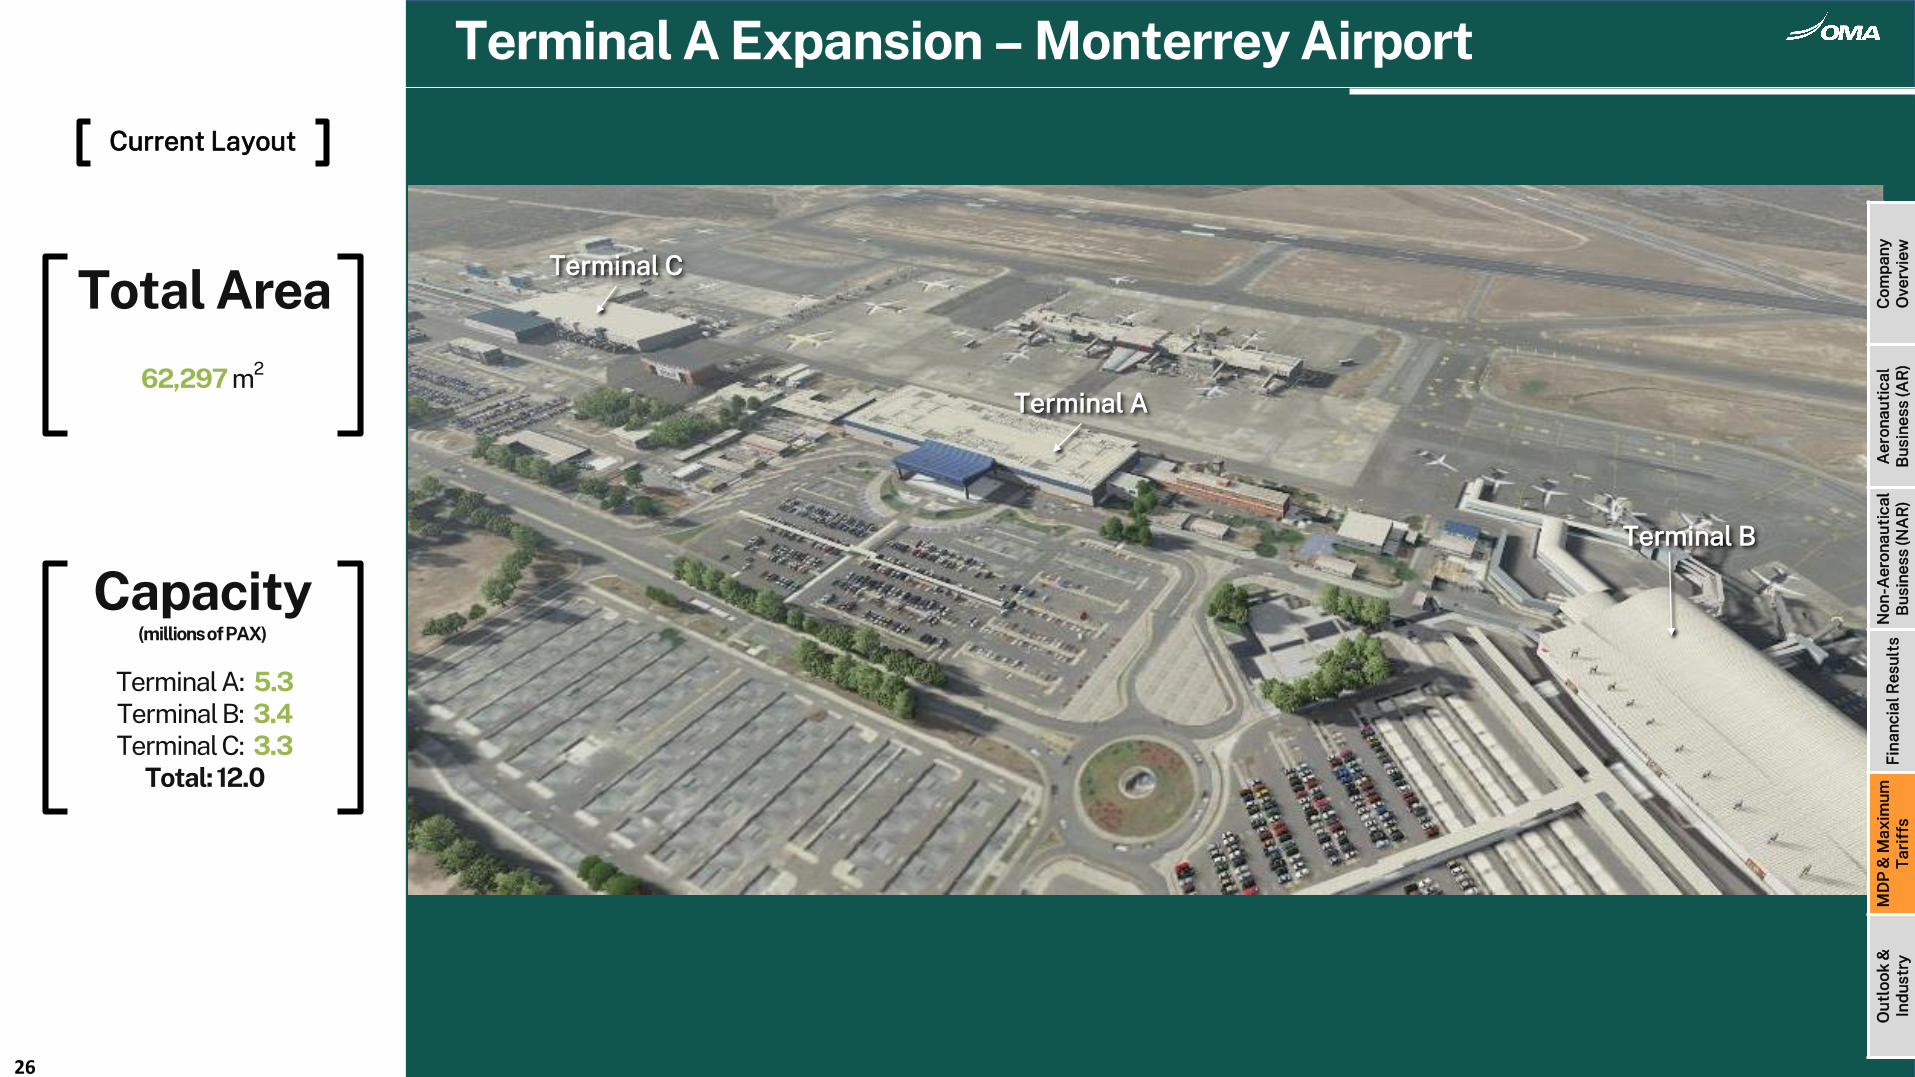
Total Area
62,297 m2
Capacity(millions of PAX)
Terminal A: 5.3Terminal B: 3.4Terminal C: 3.3
Total: 12.0
Terminal A Expansion – Monterrey Airport
Terminal C
Terminal A
Terminal B
26
Com
pan
yO
verv
iew
Aer
onau
tica
lB
usin
ess
(AR
)N
on-A
eron
auti
cal
Bus
ines
s (N
AR
)F
inan
cial
Res
ults
MD
P &
Max
imum
Tar
iffs
Out
look
&In
dus
try
Current Layout
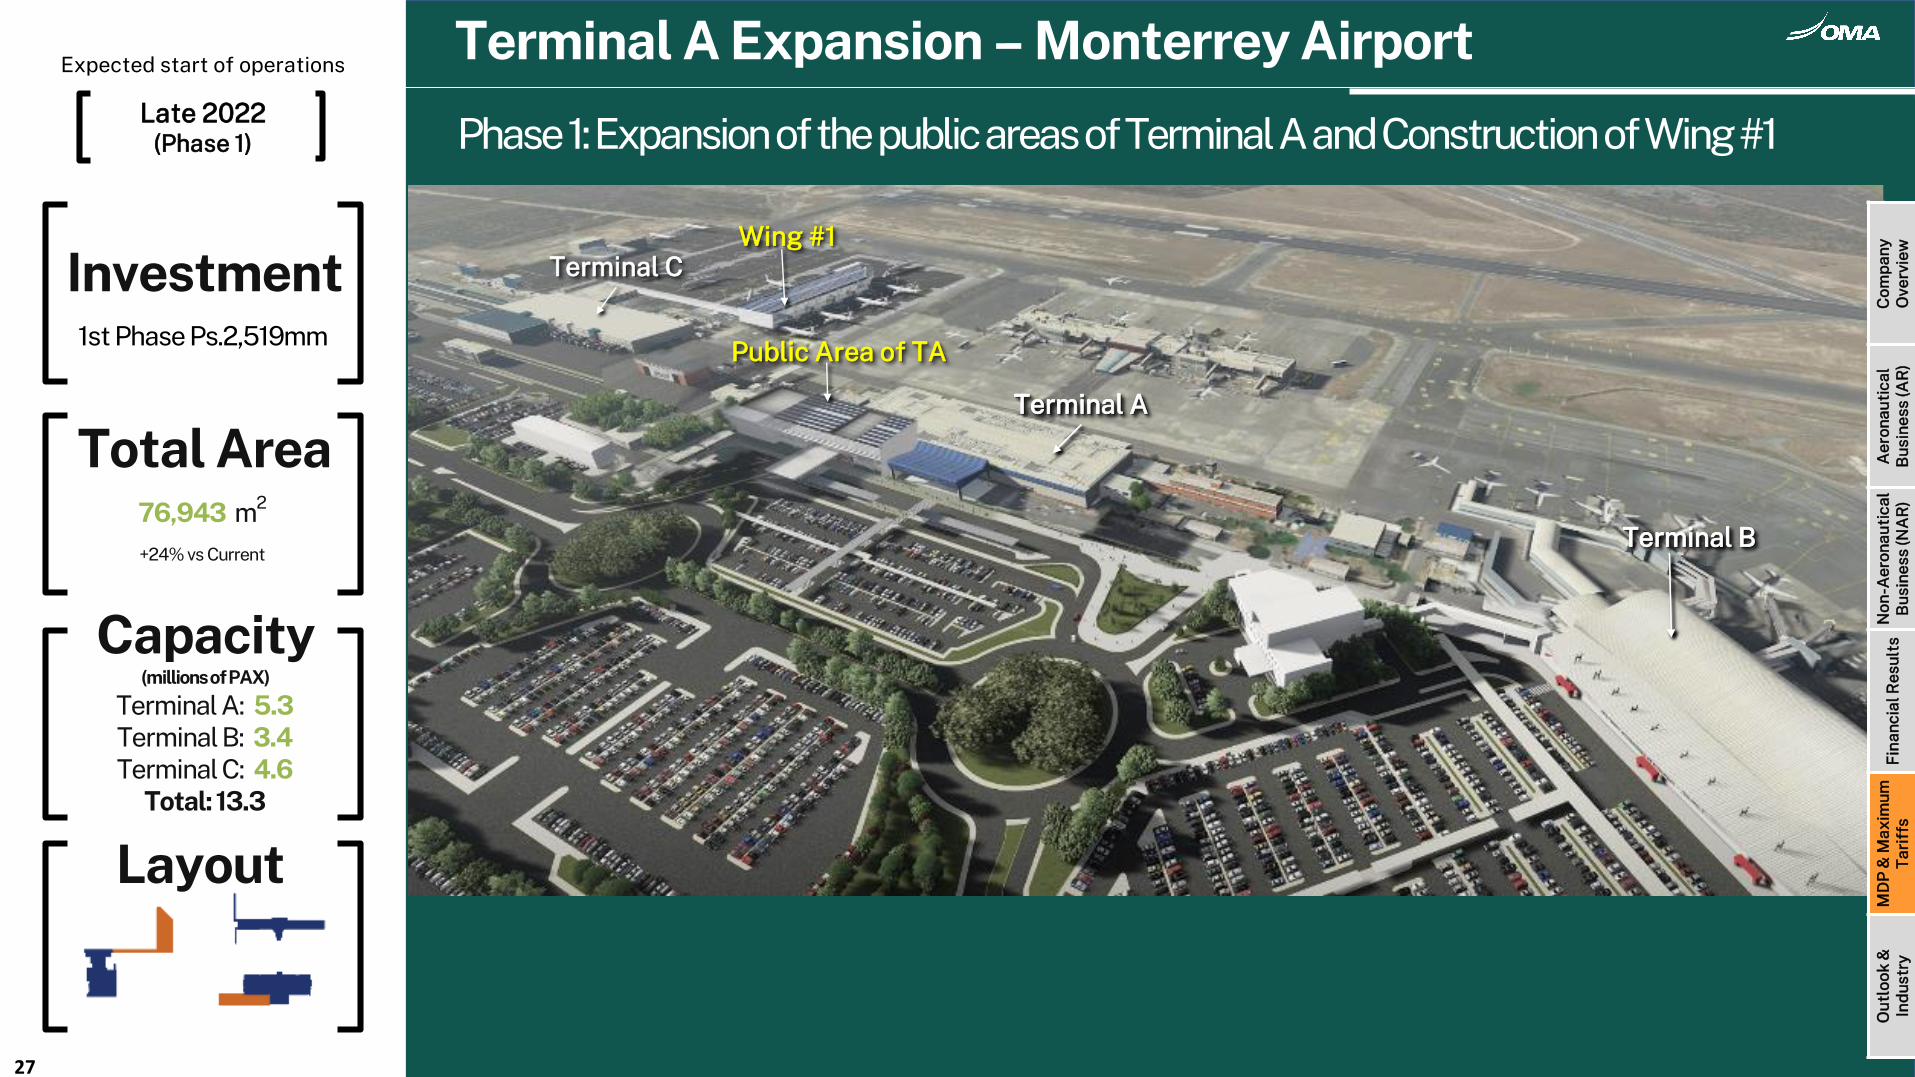
Terminal A Expansion – Monterrey Airport
Terminal C
Terminal A
Terminal B
Wing #1
Public Area of TA
Terminal A
Terminal B
27
Phase 1: Expansion of the public areas of Terminal A and Construction of Wing #1
Com
pan
yO
verv
iew
Aer
onau
tica
lB
usin
ess
(AR
)N
on-A
eron
auti
cal
Bus
ines
s (N
AR
)F
inan
cial
Res
ults
MD
P &
Max
imum
Tar
iffs
Out
look
&In
dus
try
Total Area76,943 m2
+24% vs Current
Investment1st Phase Ps.2,519mm
Layout
Terminal A: 5.3Terminal B: 3.4Terminal C: 4.6
Total: 13.3
Capacity(millions of PAX)
Expected start of operations
Late 2022(Phase 1)
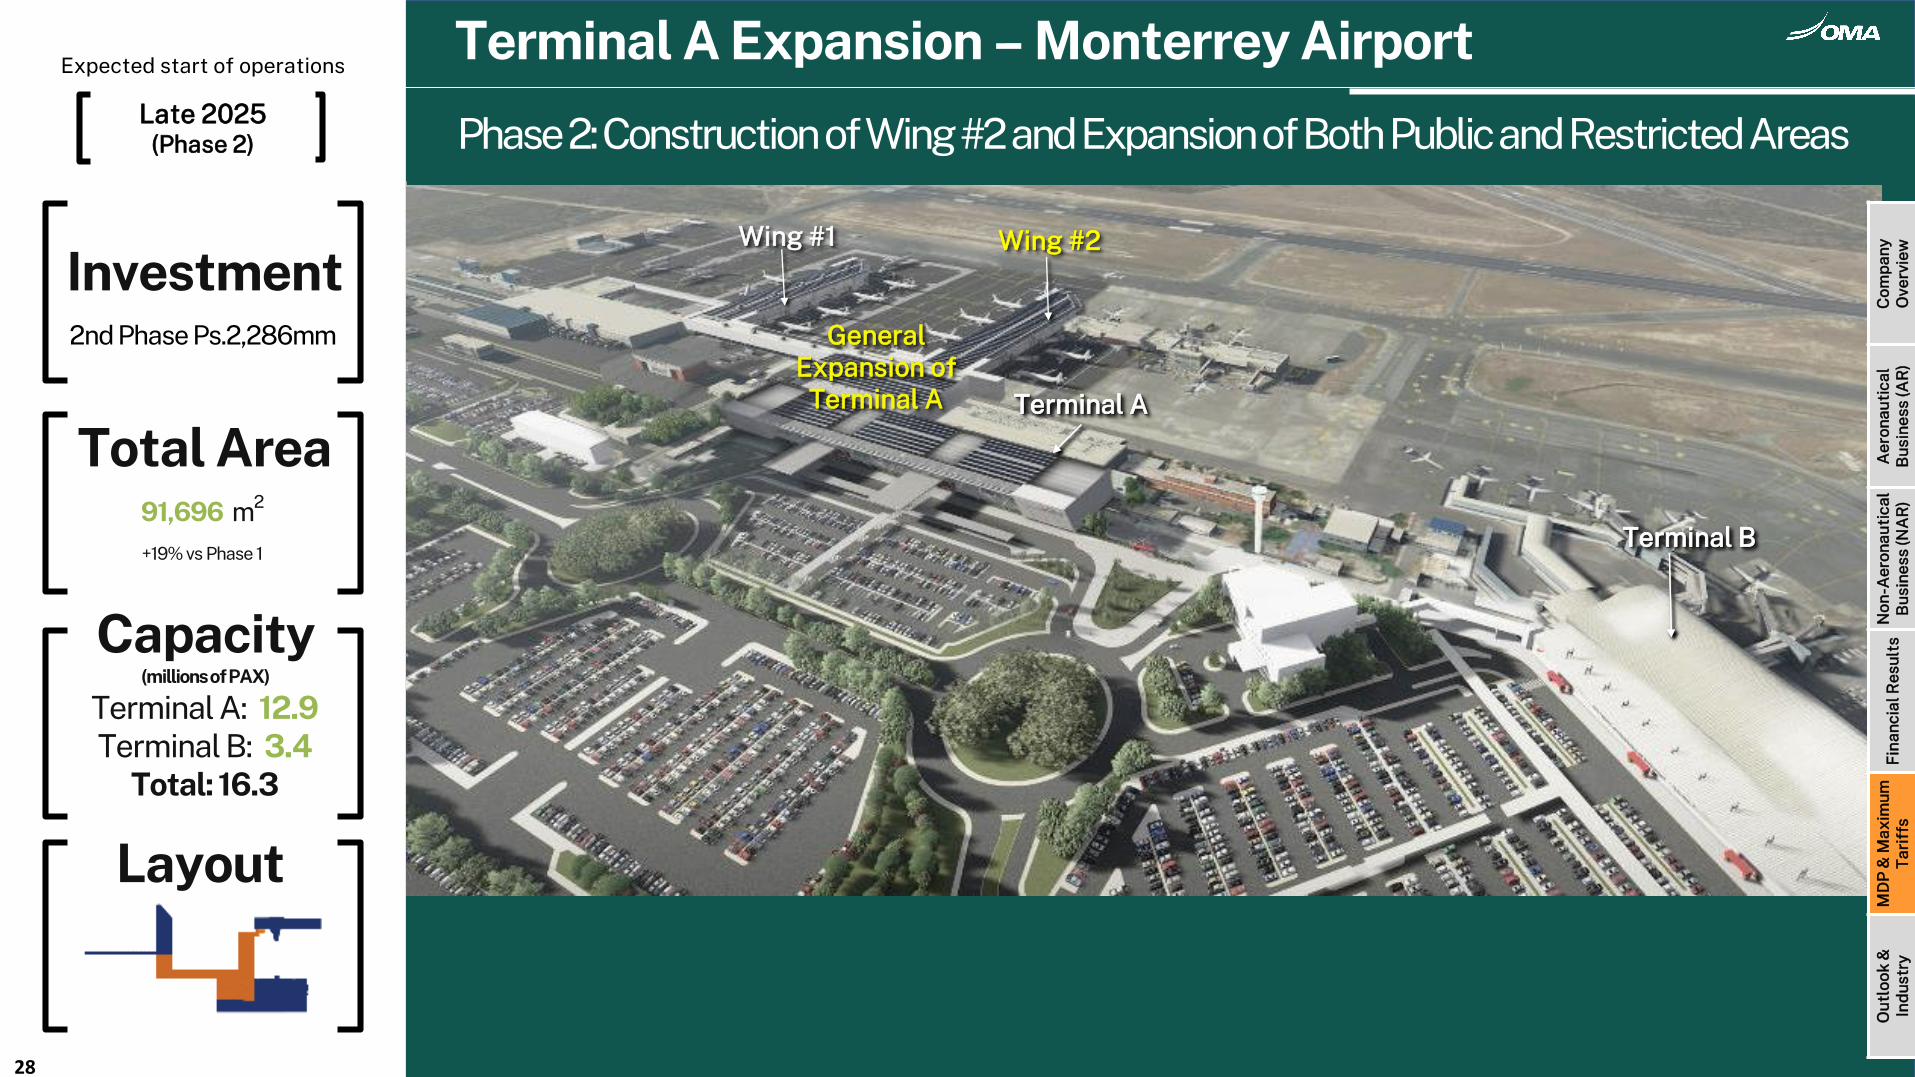
Terminal A Expansion – Monterrey Airport
Terminal A
Terminal B
Terminal A
Terminal B
Wing #2
General Expansion of
Terminal A
Wing #1
28
Phase 2: Construction of Wing #2 and Expansion of Both Public and Restricted Areas
Com
pan
yO
verv
iew
Aer
onau
tica
lB
usin
ess
(AR
)N
on-A
eron
auti
cal
Bus
ines
s (N
AR
)F
inan
cial
Res
ults
MD
P &
Max
imum
Tar
iffs
Out
look
&In
dus
try
Total Area91,696 m2
+19% vs Phase 1
Investment2nd Phase Ps.2,286mm
Layout
Terminal A: 12.9Terminal B: 3.4
Total: 16.3
Capacity(millions of PAX)
Expected start of operations
Late 2025(Phase 2)
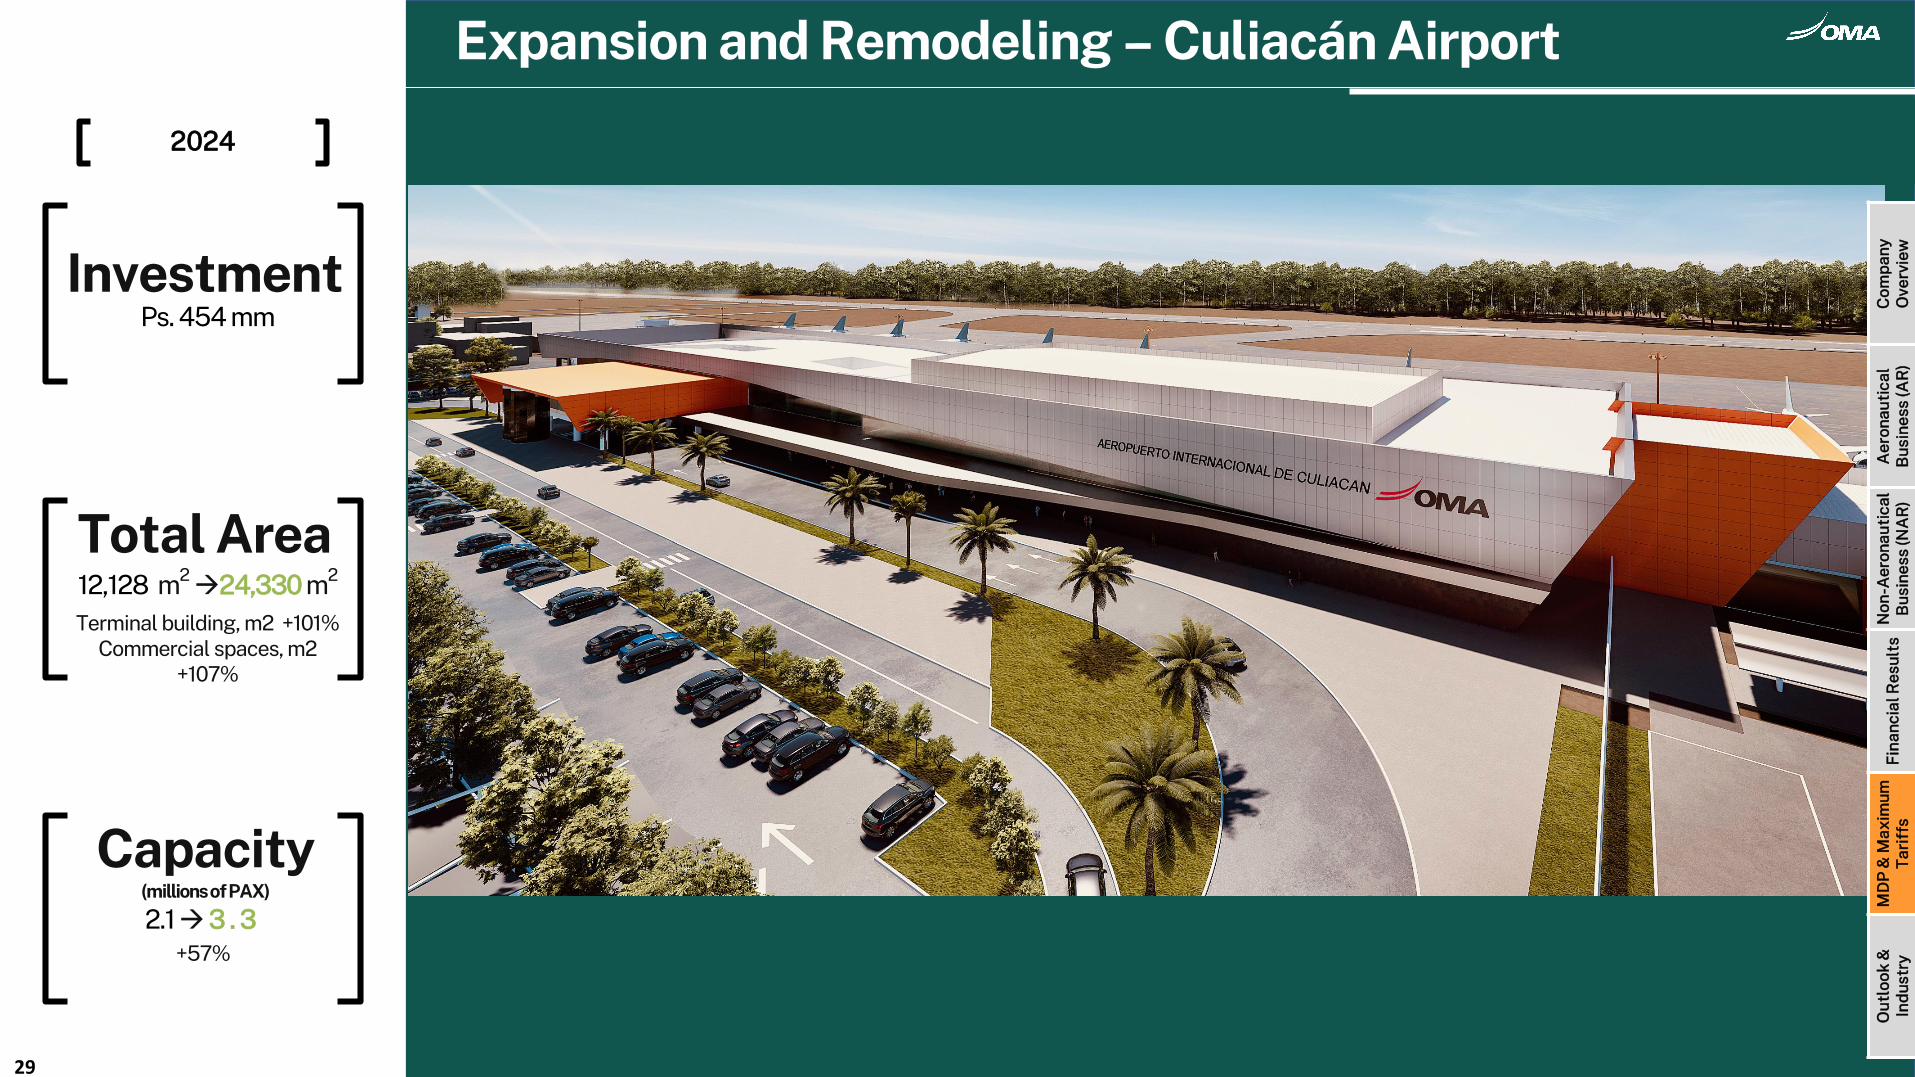
Expansion and Remodeling – Culiacán Airport
29
Com
pan
yO
verv
iew
Aer
onau
tica
lB
usin
ess
(AR
)N
on-A
eron
auti
cal
Bus
ines
s (N
AR
)F
inan
cial
Res
ults
MD
P &
Max
imum
Tar
iffs
Out
look
&In
dus
try
2024
Total Area12,128 m2
→24,330 m2
Terminal building, m2 +101% Commercial spaces, m2
+107%
2.1→3 . 3+57%
InvestmentPs. 454 mm
Capacity(millions of PAX)
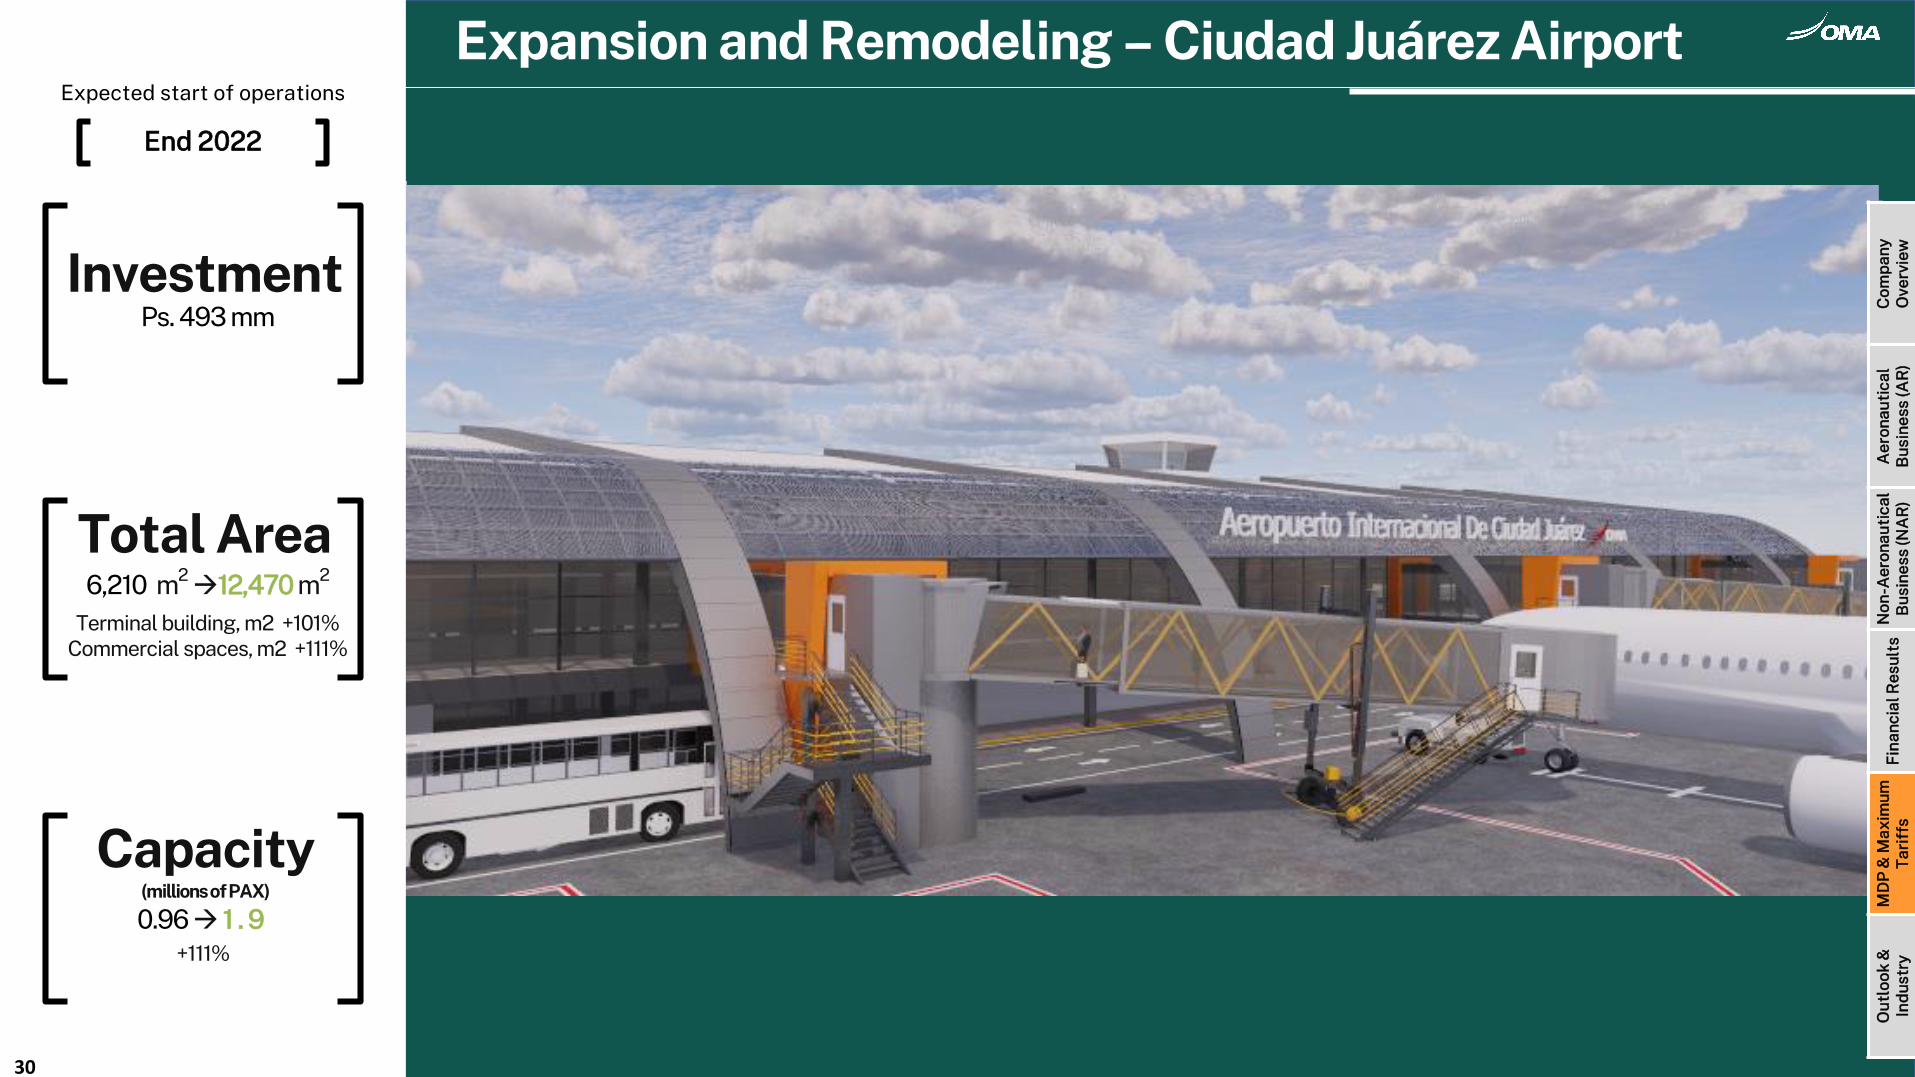
Expansion and Remodeling – Ciudad Juárez Airport
30
Com
pan
yO
verv
iew
Aer
onau
tica
lB
usin
ess
(AR
)N
on-A
eron
auti
cal
Bus
ines
s (N
AR
)F
inan
cial
Res
ults
MD
P &
Max
imum
Tar
iffs
Out
look
&In
dus
try
Expected start of operations
End 2022
Total Area6,210 m2
→12,470 m2
Terminal building, m2 +101% Commercial spaces, m2 +111%
0.96→ 1 . 9+111%
InvestmentPs. 493 mm
Capacity(millions of PAX)
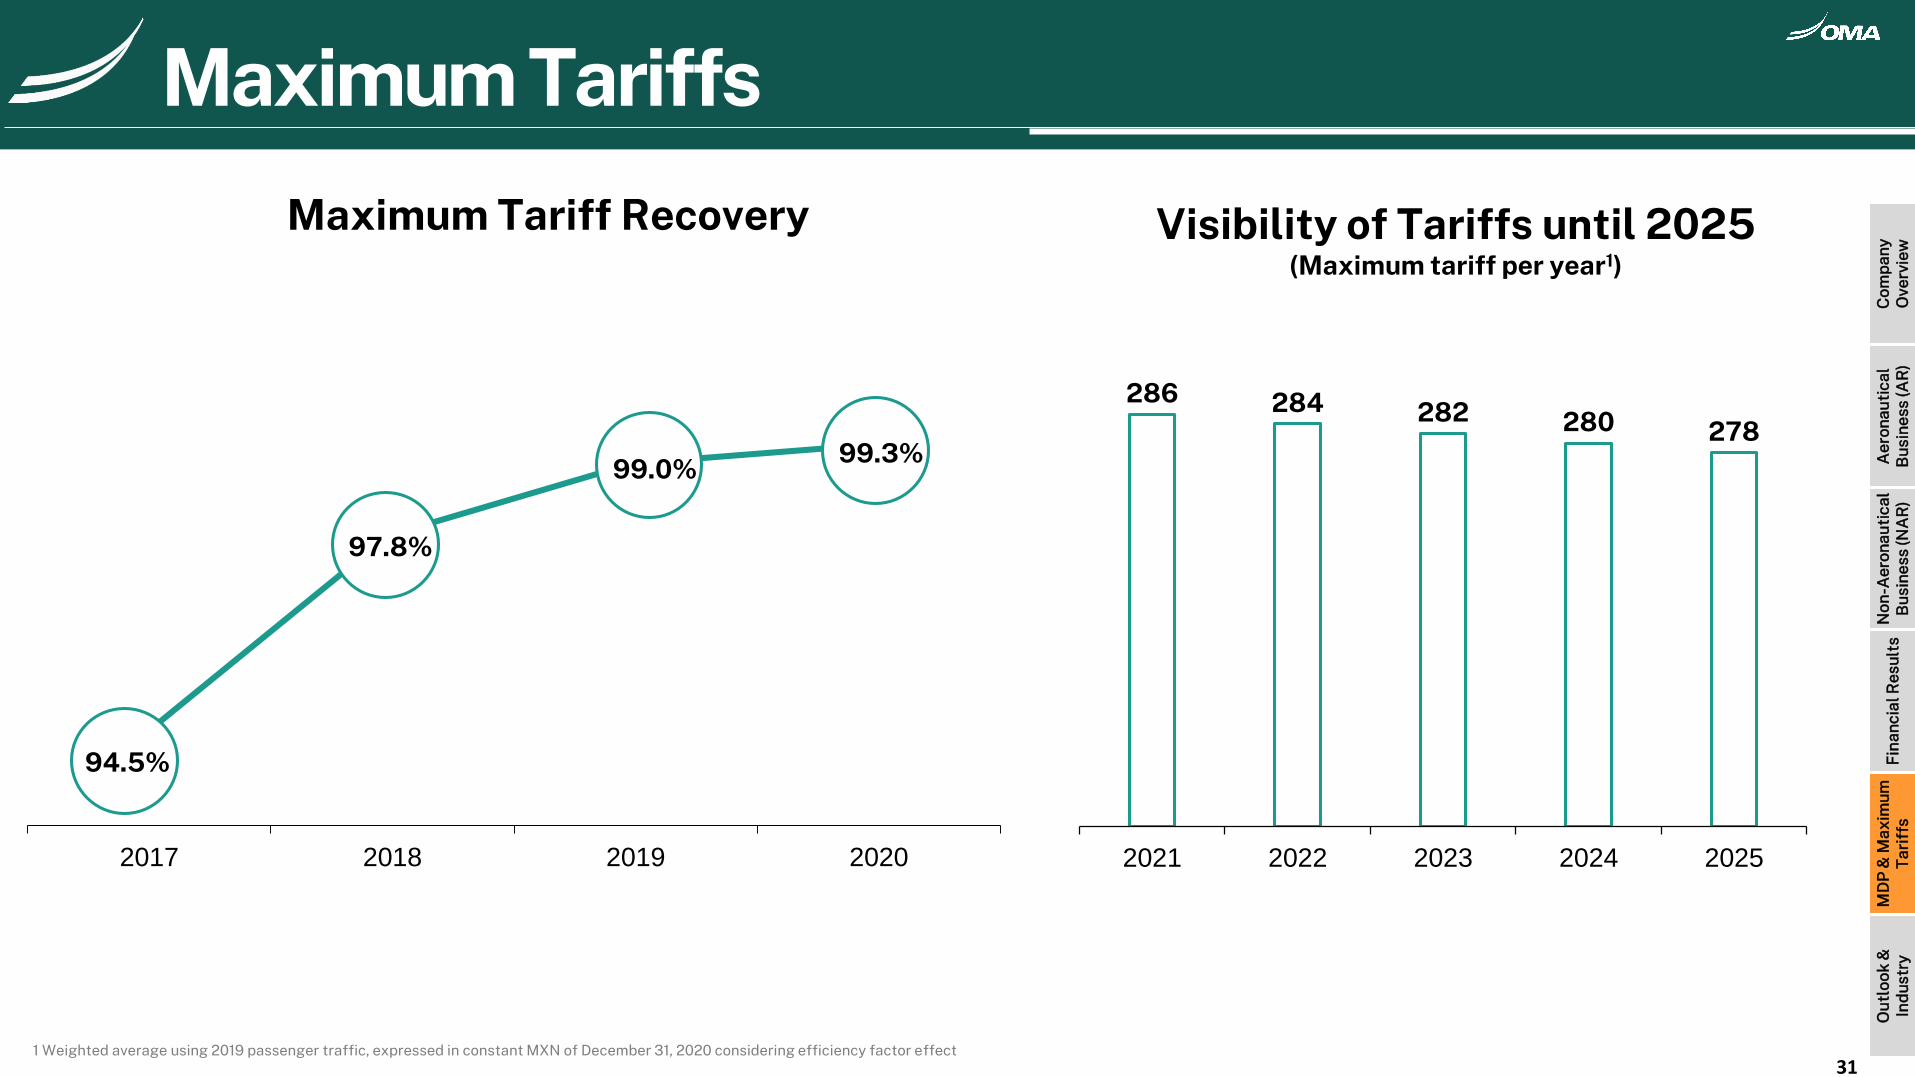
94.5%
97.8%
99.0%99.3%
2017 2018 2019 2020
Maximum Tariff Recovery
1 Weighted average using 2019 passenger traffic, expressed in constant MXN of December 31, 2020 considering efficiency factor effect
Maximum Tariffs
31
286 284 282 280 278
2021 2022 2023 2024 2025
Visibility of Tariffs until 2025(Maximum tariff per year1)
Com
pan
yO
verv
iew
Aer
onau
tica
lB
usin
ess
(AR
)N
on-A
eron
auti
cal
Bus
ines
s (N
AR
)F
inan
cial
Res
ults
MD
P &
Max
imum
Tar
iffs
Out
look
&In
dus
try
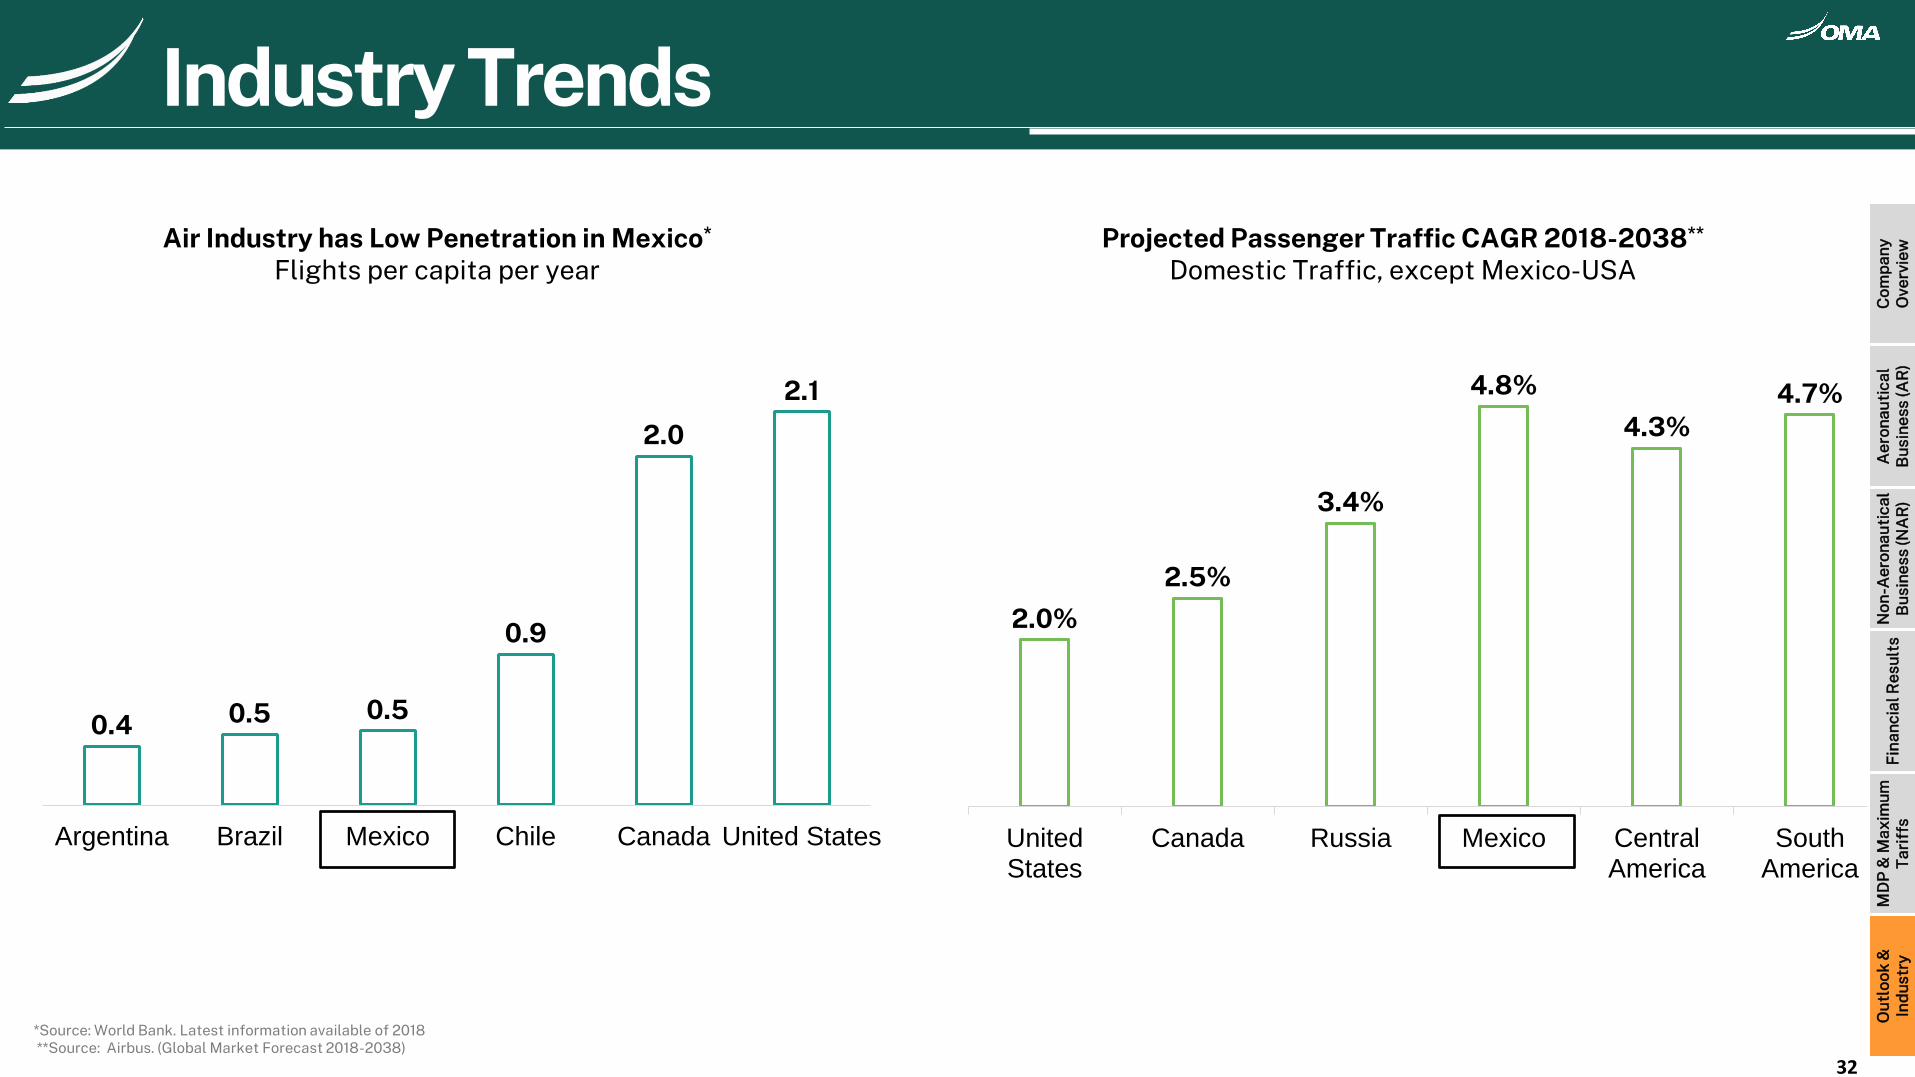
Air Industry has Low Penetration in Mexico*
Flights per capita per yearProjected Passenger Traffic CAGR 2018-2038**
Domestic Traffic, except Mexico-USA
*Source: World Bank. Latest information available of 2018**Source: Airbus. (Global Market Forecast 2018-2038)
0.4 0.5 0.5
0.9
2.0
2.1
Argentina Brazil Mexico Chile Canada United States
Industry Trends
2.0%
2.5%
3.4%
4.8%
4.3%4.7%
UnitedStates
Canada Russia Mexico CentralAmerica
SouthAmerica
32
Com
pan
yO
verv
iew
Aer
onau
tica
lB
usin
ess
(AR
)N
on-A
eron
auti
cal
Bus
ines
s (N
AR
)F
inan
cial
Res
ults
MD
P &
Max
imum
Tar
iffs
Out
look
&In
dus
try
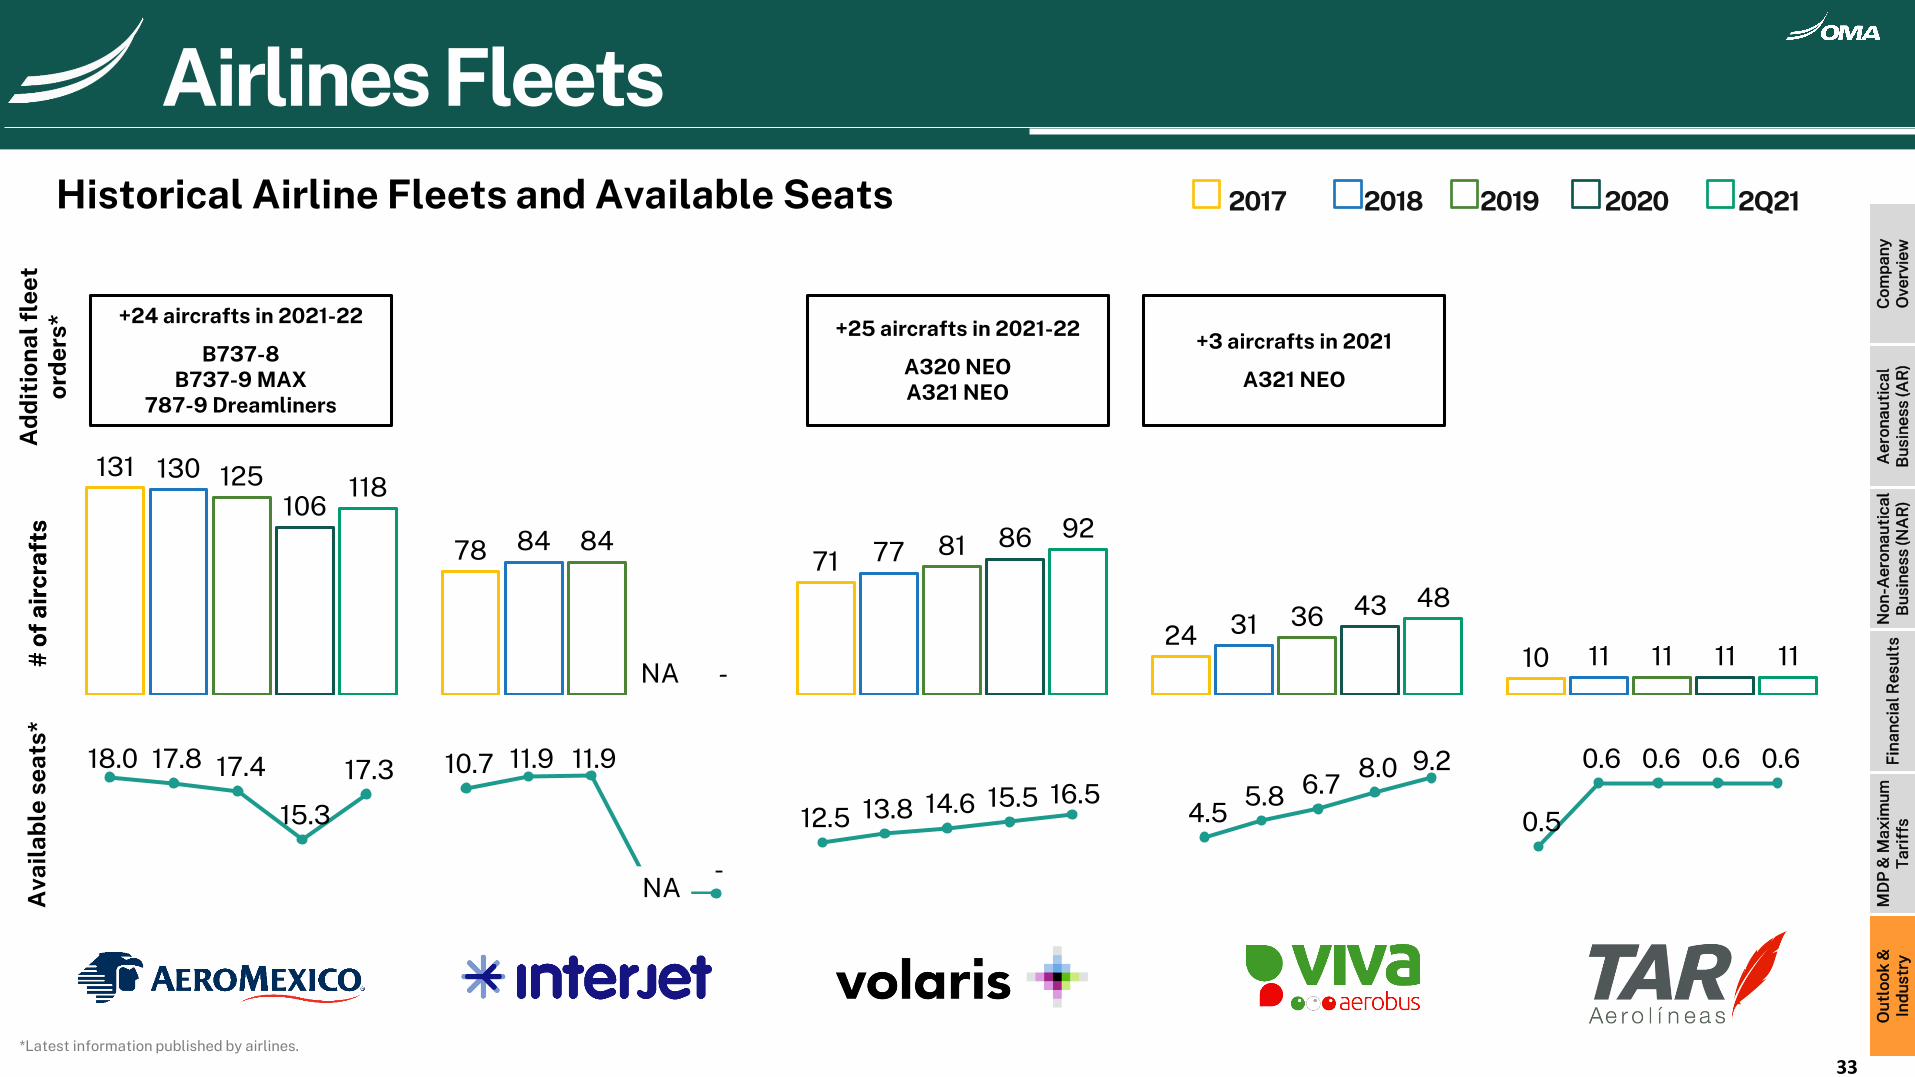
Historical Airline Fleets and Available Seats
131
78 71
2410
130
84 77
3111
125
84 81
36
11
106
NA
86
43
11
118
-
92
48
11
2017 2018 2019 2020 2Q21
Ava
ilab
lese
ats*
10.7 11.9 11.9
- -
18.0 17.8 17.4
15.3
17.3
12.5 13.8 14.6 15.5 16.5 4.5
5.8 6.7 8.0 9.2
-
2.0
4.0
6.0
8.0
10.0
0.5
0.6 0.6 0.6 0.6
NA
Airlines Fleets
+25 aircrafts in 2021-22
A320 NEOA321 NEO
+24 aircrafts in 2021-22
B737-8B737-9 MAX
787-9 Dreamliners
+3 aircrafts in 2021
A321 NEO
*Latest information published by airlines.
33
# o
fai
rcra
fts
# o
fai
rcra
fts
Ad
dit
ion
alfl
eet
ord
ers*
Com
pan
yO
verv
iew
Aer
onau
tica
lB
usin
ess
(AR
)N
on-A
eron
auti
cal
Bus
ines
s (N
AR
)F
inan
cial
Res
ults
MD
P &
Max
imum
Tar
iffs
Out
look
&In
dus
try
Chief Financial OfficerRuffoPérez Pliego del Castillo
[email protected]+52.81.8625.4300
Investor RelationsLuis Emmanuel Camacho Thierry
[email protected]+52.81.8625.4308
Follow us on:
Contact
GRUPO AEROPORTUARIO DEL CENTRO NORTE, S.A.B. DE C.V.