Second Quarter 2014 Results
31
Second Quarter 2014 Results ING posts 2Q14 underlying net profit of EUR 1,181 mln Ralph Hamers CEO Amsterdam – 6 August 2014 www.ing.com
-
Upload
ing-group -
Category
Investor Relations
-
view
1.547 -
download
2
Transcript of Second Quarter 2014 Results

Do not put content
on the brand signature area
Orange
RGB= 255,102,000
Light blue
RGB= 180,195,225
Dark blue
RGB= 000,000,102
Grey
RGB= 150,150,150
ING colour balance
Guideline
www.ing-presentations.intranet
Do not put content
on the brand signature area
Second Quarter 2014 Results ING posts 2Q14 underlying net profit of EUR 1,181 mln
Ralph Hamers
CEO
Amsterdam – 6 August 2014
www.ing.com

Do not put content
on the brand signature area
Do not put content
on the brand signature area
Orange
RGB= 255,102,000
Light blue
RGB= 180,195,225
Dark blue
RGB= 000,000,102
Grey
RGB= 150,150,150
ING colour balance
Guideline
www.ing-presentations.intranet Key points
Second Quarter 2014 Results 2
• Successful IPO of NN Group has substantially completed the repositioning of ING as a Bank
• IPO NN Group successfully completed
• EUR 8.1 bln combined market value of NN Group and Voya Financial comfortably exceeds remaining double leverage
• ING Group posts underlying net profit of EUR 1,181 mln, up 31.1% from 2Q13 and 19.5% from 1Q14, due to improved results of both ING Bank and NN Group
• Bank posted a strong quarter, with an underlying pre-tax result of EUR 1,278 mln, up 11.4% from 2Q13 and 8.7% from 1Q14
• Strong volume growth in lending and deposits
• Healthy income development
• Lower risk costs
• Capital position further strengthened
• The pre-tax result of NN Group improved to EUR 310 mln from EUR 113 mln in 2Q13

Do not put content
on the brand signature area
Do not put content
on the brand signature area
Orange
RGB= 255,102,000
Light blue
RGB= 180,195,225
Dark blue
RGB= 000,000,102
Grey
RGB= 150,150,150
ING colour balance
Guideline
www.ing-presentations.intranet
4.8
2.2
5.1
2.4
at IPO at 1 August
Successful IPO of NN Group has substantially completed the repositioning of ING as a leading European Bank
Second Quarter 2014 Results 3
Final payment to the Dutch State
• Final payment of EUR 1,025 mln to the Dutch State ultimately in May 2015
• Possible early repayment will be considered after outcome of AQR and stress test
ING completed sale SulAmerica; Remaining stake Voya 43.2%
• Sale SulAmerica completed in June
• Remaining stake Voya 43.2%
IPO NN Group successfully completed
• NN Group successfully listed on 2 July
• ING’s remaining stake is 68.1%
Remaining 68.1%
ING Group
Share price NN Group since IPO
Market capitalisation NN Group (in EUR bln)
7.0 7.5
21.3
20.0
IPO 8 Jul 15 Jul 22 Jul 29 Jul 5 Aug1 Aug

Do not put content
on the brand signature area
Do not put content
on the brand signature area
Orange
RGB= 255,102,000
Light blue
RGB= 180,195,225
Dark blue
RGB= 000,000,102
Grey
RGB= 150,150,150
ING colour balance
Guideline
www.ing-presentations.intranet EUR 8.1 bln combined market value of NN Group and Voya Financial comfortably exceeds remaining double leverage
Second Quarter 2014 Results 4
5.1
2.1-4.60.2-0.9-3.8
3.0 5.7
1Q14 Capital injection
NN Group
Sale of 10% stake
SulAm
2Q14 Net proceeds IPO
NN Group (incl.
green shoe)
MV 68.1%
NN Group
MV 43.2% Voya Pro-forma net value
surplus
Group core debt and pro-forma net value surplus (in EUR bln)
• Group core debt was EUR 4.6 bln at the end of the second quarter
• The net proceeds from the IPO of NN Group totalled EUR 2.1 bln, including exchange of first tranche of notes and the over-allotment option
• Combined market value of remaining 68.1% stake NN Group and 43.2% stake Voya Financial (on 1 August) amounts to EUR 8.1 bln
• Consequently, pro-forma net value surplus amounts to approximately EUR 5.7 bln

Do not put content
on the brand signature area
Do not put content
on the brand signature area
Orange
RGB= 255,102,000
Light blue
RGB= 180,195,225
Dark blue
RGB= 000,000,102
Grey
RGB= 150,150,150
ING colour balance
Guideline
www.ing-presentations.intranet
Second Quarter 2014 Results 5
Second quarter 2014 results

Do not put content
on the brand signature area
Do not put content
on the brand signature area
Orange
RGB= 255,102,000
Light blue
RGB= 180,195,225
Dark blue
RGB= 000,000,102
Grey
RGB= 150,150,150
ING colour balance
Guideline
www.ing-presentations.intranet
Net result 2Q14 ING Group negatively impacted by SNS levy (in EUR mln)
1,0671,181 21
-16-101-18
Underlying
net result
2Q14
Discontinued
operations
Special
items NN
Group
Special
items Bank
SNS levy
Special
items Bank
other
Net result
2Q14
Underlying net profit ING Group significantly up from 2Q13 and 1Q14
Second Quarter 2014 Results 6
9011,005
493
988
1,181
2Q13 3Q13 4Q13 1Q14 2Q14
• ING Group posted underlying net profit of EUR 1,181 mln, up 31.1% from 2Q13 and 19.5% from 1Q14, due to improved results of both ING Bank and NN Group
• Net result amounts to EUR 1,067 mln, EUR 114 mln lower than the underlying net result. The difference can mainly be explained by the second payment of EUR 101 mln related to the nationalisation of SNS
Underlying net result ING Group (in EUR mln)
+31.1%

Do not put content
on the brand signature area
Do not put content
on the brand signature area
Orange
RGB= 255,102,000
Light blue
RGB= 180,195,225
Dark blue
RGB= 000,000,102
Grey
RGB= 150,150,150
ING colour balance
Guideline
www.ing-presentations.intranet ING Bank posted a strong second quarter…
Second Quarter 2014 Results 7
• Underlying pre-tax result was EUR 1,278 mln in 2Q14, up 11.4% from 2Q13 and 8.7% from 1Q14
• Strong volume growth in lending and deposits
• Healthy income development
• Lower risk costs
• Capital position further strengthened
553461
361525
652
2Q13 3Q13 4Q13 1Q14 2Q14
Pre-tax result ING Bank (in EUR mln)
Pre-tax result Retail Banking (in EUR mln)
Pre-tax result Commercial Banking, excluding CVA/DVA (in EUR mln)
* Pre-tax result Commercial Banking including CVA/DVA was EUR 605 mln in 2Q14, EUR 471 mln in 1Q14 and EUR 632 mln in 2Q13
664745
542
771870
2Q13 3Q13 4Q13 1Q14 2Q14
1,147 1,103
904
1,1761,278
2Q13 3Q13 4Q13 1Q14 2Q14
+11.4%
+31.0% +17.9%

Do not put content
on the brand signature area
Do not put content
on the brand signature area
Orange
RGB= 255,102,000
Light blue
RGB= 180,195,225
Dark blue
RGB= 000,000,102
Grey
RGB= 150,150,150
ING colour balance
Guideline
www.ing-presentations.intranet
ING committed to deliver target RoE* of 10-13% in 2017
…resulting in a Return on Equity of 11.1% in 2Q14 and 10.7% YTD
Second Quarter 2014 Results 8
7.0%
9.0%
10.7%10-13%
2012 2013 1H14 Ambition 2017
• The underlying return on IFRS-EU equity was 11.1% in 2Q14 and 10.7% year-to-date
• Increased RoE versus last year driven by Retail Banking, particularly Retail Banking International
• ING committed to deliver target RoE of 10-13%
• New business must be RoE accretive
• Normalisation of risk costs supports RoE growth
• Capital buffer to withstand volatility will impact RoE
* Based on IFRS-EU Equity

Do not put content
on the brand signature area
Do not put content
on the brand signature area
Orange
RGB= 255,102,000
Light blue
RGB= 180,195,225
Dark blue
RGB= 000,000,102
Grey
RGB= 150,150,150
ING colour balance
Guideline
www.ing-presentations.intranet Underlying income showed a healthy development
Second Quarter 2014 Results 9
Underlying income excluding CVA/DVA and deconsolidation Vysya (in EUR mln)
3,716 3,702 3,764 3,797 3,830
2Q13 3Q13 4Q13 1Q14 2Q14
• Total underlying income showed a healthy development despite negative CVA/DVA impacts and deconsolidation of ING Vysya Bank
• Excluding these items, income rose by 3.1% from 2Q13 and 0.9% from 1Q14, supported by strong volume growth in both lending and funds entrusted
• Total income dominated by net interest income, reflecting a relatively stable and predictable income stream, in line with our differentiated client proposition.
• The underlying interest result excluding the impact of the deconsolidation of Vysya increased slightly versus 1Q14 despite lower interest results in Financial Markets and Corporate Line
Net interest income excluding deconsolidation Vysya (in EUR mln)
+3.1%
2,945 2,878 2,894 2,962 2,985
2Q13 3Q13 4Q13 1Q14 2Q14
+1.4%
* Reporting underlying income was EUR 3,781 mln in 2Q14, EUR 3,818 mln in 1Q14 and EUR 3,853 mln in 2Q13

Do not put content
on the brand signature area
Do not put content
on the brand signature area
Orange
RGB= 255,102,000
Light blue
RGB= 180,195,225
Dark blue
RGB= 000,000,102
Grey
RGB= 150,150,150
ING colour balance
Guideline
www.ing-presentations.intranet
-3
0
-2
5
-2
Net interest margin on client balances remained stable as lower savings margins were offset by higher lending margins
Second Quarter 2014 Results 10
• Net interest margin down from 150 bps in 1Q14 to 146 bps in 2Q14, driven by the deconsolidation of ING Vysya Bank and lower net interest results in Financial Markets and Corporate Line
• Lending margins increased from 1Q14 driven by higher margins on mortgages and other lending in Retail Benelux as well as higher margins in Industry Lending
• Savings margins down from 1Q14, reflecting the low interest rate environment
• ING reduced the client savings rates in July 2014 in Germany, Netherlands and Belgium.
142
144
145
150
146
2Q13 3Q13 4Q13 1Q14 2Q14
NIM ING Bank (based on avg Balance Sheet)
NIM lending (based on avg Client Balances)
NIM savings & Deposits/PCM (based on avg Client Balances)
1Q14 2Q14 2Q13 3Q13 4Q13
Financial Markets contribution to change in NIM can be volatile
Financial markets impact on NIM Q-on-Q (in bps)
Underlying interest margin by quarter (in bps)

Do not put content
on the brand signature area
Do not put content
on the brand signature area
Orange
RGB= 255,102,000
Light blue
RGB= 180,195,225
Dark blue
RGB= 000,000,102
Grey
RGB= 150,150,150
ING colour balance
Guideline
www.ing-presentations.intranet Consistent customer focus has enabled us to increase net lending by EUR 7.4 bln, funded through a EUR 7.4 bln inflow of customer deposits
Strong deposit gathering ability
Net inflow in funds entrusted (Client Balances, in EUR bln)
Increase in net lending growth
Net lending growth (Client Balances, in EUR bln)
6.5
1.92.4
8.3
7.4
2Q13 3Q13 4Q13 1Q14 2Q14
1.42.1
5.1
7.4
-0.4
2Q13 3Q13 4Q13 1Q14 2Q14
• Good commercial momentum continued in the second quarter of 2014, with EUR 7.4 billion of net lending growth (adjusted for currency impacts and additional transfers of WUB mortgages to NN Bank) and EUR 7.4 billion of net funds entrusted inflow
Second Quarter 2014 Results 11
Do not put content
on the brand signature area
Do not put content
on the brand signature area
Orange
RGB= 255,102,000
Light blue
RGB= 180,195,225
Dark blue
RGB= 000,000,102
Grey
RGB= 150,150,150
ING colour balance
Guideline
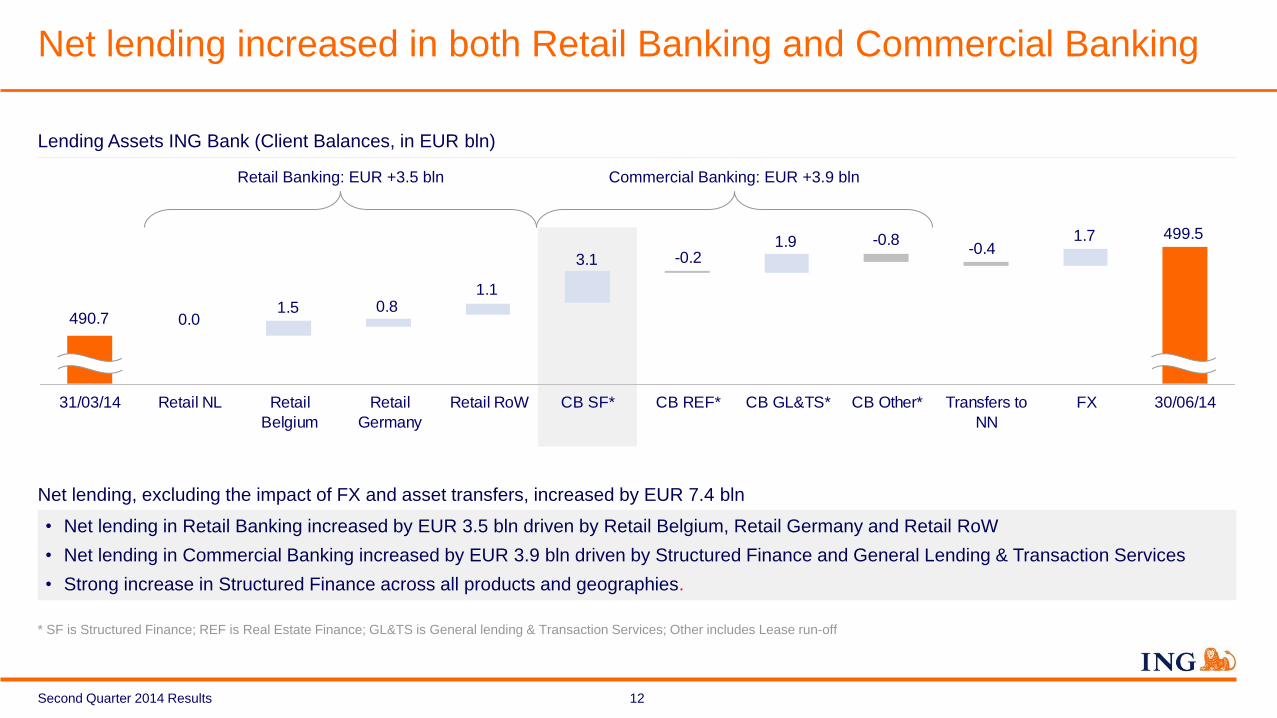
www.ing-presentations.intranet Net lending increased in both Retail Banking and Commercial Banking
Second Quarter 2014 Results 12
490.7
499.51.7
1.5 0.81.1
3.11.9
0.0
-0.8-0.2
-0.4
31/03/14 Retail NL Retail
Belgium
Retail
Germany
Retail RoW CB SF* CB REF* CB GL&TS* CB Other* Transfers to
NN
FX 30/06/14
Lending Assets ING Bank (Client Balances, in EUR bln)
Net lending, excluding the impact of FX and asset transfers, increased by EUR 7.4 bln
• Net lending in Retail Banking increased by EUR 3.5 bln driven by Retail Belgium, Retail Germany and Retail RoW
• Net lending in Commercial Banking increased by EUR 3.9 bln driven by Structured Finance and General Lending & Transaction Services
• Strong increase in Structured Finance across all products and geographies.
Retail Banking: EUR +3.5 bln Commercial Banking: EUR +3.9 bln
* SF is Structured Finance; REF is Real Estate Finance; GL&TS is General lending & Transaction Services; Other includes Lease run-off

Do not put content
on the brand signature area
Do not put content
on the brand signature area
Orange
RGB= 255,102,000
Light blue
RGB= 180,195,225
Dark blue
RGB= 000,000,102
Grey
RGB= 150,150,150
ING colour balance
Guideline
www.ing-presentations.intranet ING on track to deliver flat costs
Second Quarter 2014 Results 13
• Underlying expenses reported were up 0.4% from 2Q13, but down 3.5% from 1Q14
• Excluding the deconsolidation impact of ING Vysya Bank and the Belgian bank taxes, operating expenses rose 3.3% from 2Q13, mainly due to higher pension costs, increased IT spending, and business growth in Retail International and Industry Lending
• Restructuring on track to reach cost savings of EUR 880 mln by 2015 and EUR 955 mln by 2017
Restructuring programmes on track (in EUR mln)
Cost savings achieved
Cost savings by 2015
Cost savings by 2017
Retail Banking NL
304 460 480
ING Bank Belgium
60 160 160
Commercial Banking
157 260 315
Total Bank
521 880 955
ING on track to deliver flat costs (in EUR bln)
8.7 8.7 8.7
4.3
8.6
2011 2012 2013 1H14 Ambition 2015

Do not put content
on the brand signature area
Do not put content
on the brand signature area
Orange
RGB= 255,102,000
Light blue
RGB= 180,195,225
Dark blue
RGB= 000,000,102
Grey
RGB= 150,150,150
ING colour balance
Guideline
www.ing-presentations.intranet Risk costs continue their downward trend
Second Quarter 2014 Results 14
4131 49
36
142
178192218
73112
172
245
2Q13 1Q14 2Q14
Retail Netherlands Retail Belgium
Retail International Commercial Banking
• Risk costs decreased from both 2Q13 and 1Q14 to EUR 405 mln, driven by lower risk costs in most segments and countries
• Risk costs Commercial Banking continue their downward trend. We expect risk costs Commercial Banking to decline further gradually over time, though quarter-on-quarter comparisons may be somewhat volatile.
• Risk costs Retail Banking Netherlands slightly down from 1Q14, but expected to remain elevated
616552 560
468405
89
80
55
65
81
2Q13 3Q13 4Q13 1Q14 2Q14
EUR mln Percentage of avg RWA (annualised)
616
Underlying additions to loan loss provisions (in EUR mln and bps of avg RWA)
Underlying additions to loan loss provisions (in EUR mln)
405
468

Do not put content
on the brand signature area
Do not put content
on the brand signature area
Orange
RGB= 255,102,000
Light blue
RGB= 180,195,225
Dark blue
RGB= 000,000,102
Grey
RGB= 150,150,150
ING colour balance
Guideline
www.ing-presentations.intranet NPL ratio slightly up to 2.9%
Second Quarter 2014 Results 15
• The NPL ratio rose slightly to 2.9% in 2Q14, driven by Commercial Banking and Business Lending Netherlands within Retail Banking
• Increase in NPL ratio Commercial Banking driven by a few major files in different products and different geographies
NPL ratio (in %)
2Q14 1Q14
Retail Banking
- Dutch Mortgages 2.0 2.0
- Business Lending NL 7.8 7.7
- Retail Belgium 3.2 3.2
- Retail International 1.4 1.4
Commercial Banking
- Structured Finance 2.0 1.8
- RE Finance 11.1 10.9
- General Lending & TS 2.0 1.8
- Lease run-off 18.1 16.7
Other Retail and Commercial Banking
- Other RB and CB 2.5 2.0
Total / average 2.9 2.8
16.2 16.415.915.915.7
2.8 2.7 2.8 2.82.9
2Q13 3Q13 4Q13 1Q14* 2Q14
Non-performing loans (in EUR bln)
Non-performing loans (in %)
Non-performing loans (in EUR bln and %)
* 1Q14 is restated for the deconsolidation of ING Vysya:
Do not put content
on the brand signature area
Do not put content
on the brand signature area
Orange
RGB= 255,102,000
Light blue
RGB= 180,195,225
Dark blue
RGB= 000,000,102
Grey
RGB= 150,150,150
ING colour balance
Guideline
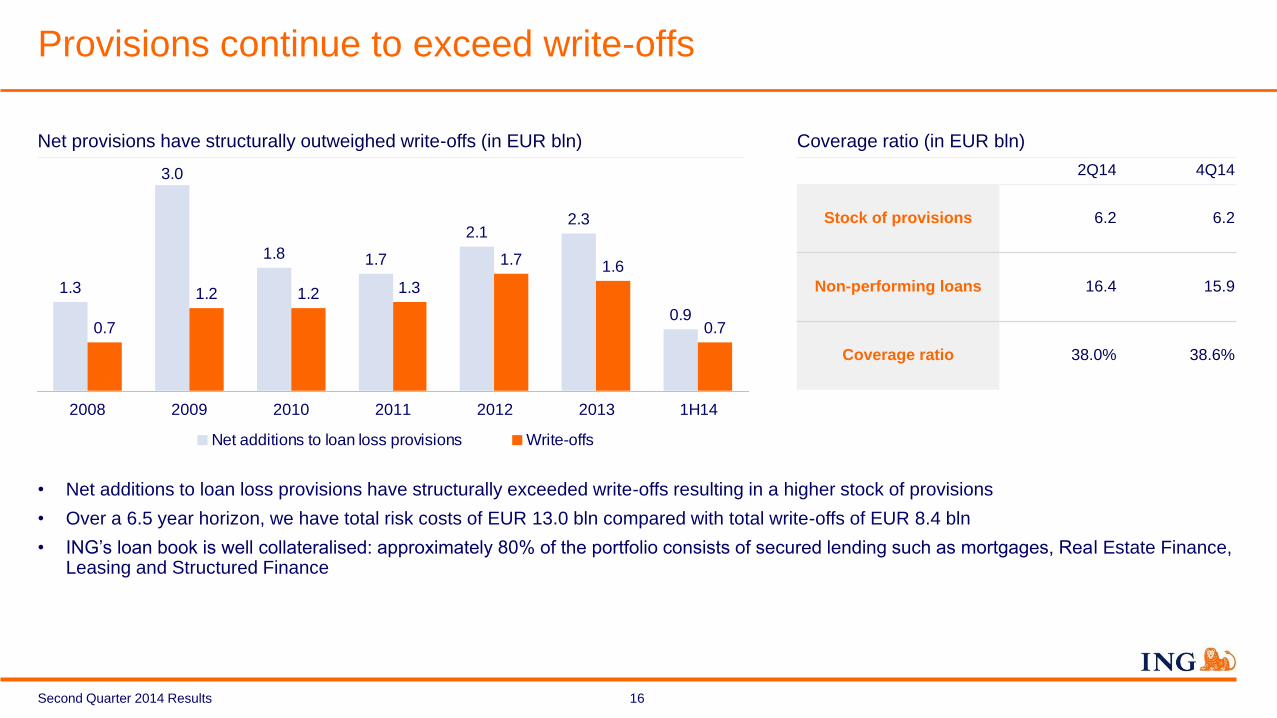
www.ing-presentations.intranet Provisions continue to exceed write-offs
16
• Net additions to loan loss provisions have structurally exceeded write-offs resulting in a higher stock of provisions
• Over a 6.5 year horizon, we have total risk costs of EUR 13.0 bln compared with total write-offs of EUR 8.4 bln
• ING’s loan book is well collateralised: approximately 80% of the portfolio consists of secured lending such as mortgages, Real Estate Finance, Leasing and Structured Finance
Coverage ratio (in EUR bln)
2Q14 4Q14
Stock of provisions 6.2 6.2
Non-performing loans 16.4 15.9
Coverage ratio 38.0% 38.6%
Second Quarter 2014 Results
Net provisions have structurally outweighed write-offs (in EUR bln)
1.3
3.0
1.8 1.7
2.12.3
0.90.7
1.2 1.2 1.3
1.7 1.6
0.7
2008 2009 2010 2011 2012 2013 1H14
Net additions to loan loss provisions Write-offs

Do not put content
on the brand signature area
Do not put content
on the brand signature area
Orange
RGB= 255,102,000
Light blue
RGB= 180,195,225
Dark blue
RGB= 000,000,102
Grey
RGB= 150,150,150
ING colour balance
Guideline
www.ing-presentations.intranet
664
745
542
771
870
2Q13 3Q13 4Q13 1Q14 2Q14
Retail Banking posted strong results, up from both 2Q13 and 1Q14
Second Quarter 2014 Results 17
• The underlying pre-tax result from Retail Banking was strong at EUR 870 mln, up significantly from 2Q13 and 1Q14
• Retail Germany is growing fast and reported a record high quarterly result, driven by strong income growth and lower risk costs
25%
23%
19%
33%
Retail NL Retail Belgium
Retail Germany Retail Rest of the World
Pre-tax result Retail Bank (in EUR mln) Pre-tax result by segment (in EUR mln) Pre-tax result Retail Germany (in EUR mln)
159 165174
163
201
2Q13 3Q13 4Q13 1Q14 2Q14
+31.0% +26.4%
EUR
870 mln

Do not put content
on the brand signature area
Do not put content
on the brand signature area
Orange
RGB= 255,102,000
Light blue
RGB= 180,195,225
Dark blue
RGB= 000,000,102
Grey
RGB= 150,150,150
ING colour balance
Guideline
www.ing-presentations.intranet
553
461
361
525
652
2Q13 3Q13 4Q13 1Q14 2Q14
Second Quarter 2014 Results 18
• Excluding CVA/DVA, underlying pre-tax result was up from both 2Q13 and 1Q14, driven by lower risk costs and healthy income growth
• Structured Finance performed well in 2Q14. Income up 9.6% from 2Q13 and 19.5% from 1Q14, supported by strong volume growth and higher margins
• Financial Markets income excluding CVA/DVA slightly up due to strong client flow despite challenging market conditions
Commercial Banking reported a strong quarter, driven by Structured Finance
Pre-tax result Commercial Banking excluding CVA/DVA* (in EUR mln)
Underlying income Structured Finance (in EUR mln)
Underlying income Financial Markets excluding CVA/DVA** (in EUR mln)
+17.9%
* Pre-tax result Commercial Banking including CVA/DVA was EUR 605 mln in 2Q14, EUR 471 mln in 1Q14 and EUR 632 mln in 2Q13
** Underlying income Financial Markets including CVA/DVA was EUR 274 mln in 2Q14, EUR 262 mln in 1Q14 and EUR 391 mln in 2Q13
363 341372
333
398
2Q13 3Q13 4Q13 1Q14 2Q14
+9.6%
312 293249
316 322
2Q13 3Q13 4Q13 1Q14 2Q14
+3.2%

Do not put content
on the brand signature area
Do not put content
on the brand signature area
Orange
RGB= 255,102,000
Light blue
RGB= 180,195,225
Dark blue
RGB= 000,000,102
Grey
RGB= 150,150,150
ING colour balance
Guideline
www.ing-presentations.intranet Fully loaded CET1 ratio rose to 10.5%, mainly due to retained earnings
Second Quarter 2014 Results 19
10.1%>10.0%
1Q14 2Q14 Ambition 2017
3.7%~4.0%
3.7%
1Q14 2Q14 Ambition 2017
• ING Bank’s pro-forma CET1 ratio on a fully loaded basis increased to 10.5% due to retained earnings and higher revaluation and FX reserves
• As communicated at the Investor Day on 31 March, ING Bank targets a CET1 ratio of more than 10%, including a comfortable buffer
• ING Bank’s leverage ratio remained stable at 3.7% as retained earnings were offset by negative impact of calling 8% perpetual hybrid in April
10.5% 10%
* Leverage ratio defined as Tier 1 capital divided by IFRS-EU balance sheet total including off-balance sheet items; AT1 capital to be replaced in coming years in line with grandfathering rules
Fully-loaded CET1 ratio increased to 10.5% Leverage ratio broadly in line with Ambition 2017 level*
Do not put content
on the brand signature area
Do not put content
on the brand signature area
Orange
RGB= 255,102,000
Light blue
RGB= 180,195,225
Dark blue
RGB= 000,000,102
Grey
RGB= 150,150,150
ING colour balance
Guideline
www.ing-presentations.intranet
Second Quarter 2014 Results 20
NN Group

Do not put content
on the brand signature area
Do not put content
on the brand signature area
Orange
RGB= 255,102,000
Light blue
RGB= 180,195,225
Dark blue
RGB= 000,000,102
Grey
RGB= 150,150,150
ING colour balance
Guideline
www.ing-presentations.intranet
Sound capital ratios
IGD ratio NN Group Solvency 1 ratio NN Life
• The IGD ratio rose to 272% due to capital injection of EUR 850 mln by ING Group and the positive net result for NN Group in 2Q14
• Solvency NN Life rose to 250% due to the subordinated debt issued to NN Group
245%272%
1Q14 2Q14
Result before tax (in EUR mln)
• The result before tax improved significantly on both comparable quarters to EUR 310 mln
Operating result ongoing business (in EUR mln)
• The operating result for the ongoing business was EUR 249 million, down 7.1% from 2Q13 and down 9.1% from 1Q14
268
230214
274249
2Q13 3Q13 4Q13 1Q14 2Q14
310
-372-312
113
-650
2Q13 3Q13 4Q13 1Q14 2Q14
NN Group reported solid pre-tax result of EUR 310 mln
Second Quarter 2014 Results 21
235%250%
1Q14 2Q14

Do not put content
on the brand signature area
Do not put content
on the brand signature area
Orange
RGB= 255,102,000
Light blue
RGB= 180,195,225
Dark blue
RGB= 000,000,102
Grey
RGB= 150,150,150
ING colour balance
Guideline
www.ing-presentations.intranet
Second Quarter 2014 Results 22
Wrap up

Do not put content
on the brand signature area
Do not put content
on the brand signature area
Orange
RGB= 255,102,000
Light blue
RGB= 180,195,225
Dark blue
RGB= 000,000,102
Grey
RGB= 150,150,150
ING colour balance
Guideline
www.ing-presentations.intranet Wrap up
Second Quarter 2014 Results 23
• Successful IPO of NN Group has substantially completed the repositioning of ING as a Bank
• IPO NN Group successfully completed
• EUR 8.1 bln combined market value of NN Group and Voya Financial comfortably exceeds remaining double leverage
• ING Group posts underlying net profit of EUR 1,181 mln, up 31.1% from 2Q13 and 19.5% from 1Q14, due to improved results of both ING Bank and NN Group
• Bank posted a strong quarter, with an underlying pre-tax result of EUR 1,278 mln, up 11.4% from 2Q13 and 8.7% from 1Q14
• Strong volume growth in lending and deposits
• Healthy income development
• Lower risk costs
• Capital position further strengthened
• The pre-tax result of NN Group improved to EUR 310 mln from EUR 113 mln in 2Q13

Do not put content
on the brand signature area
Do not put content
on the brand signature area
Orange
RGB= 255,102,000
Light blue
RGB= 180,195,225
Dark blue
RGB= 000,000,102
Grey
RGB= 150,150,150
ING colour balance
Guideline
www.ing-presentations.intranet
Second Quarter 2014 Results 24
Appendix

Do not put content
on the brand signature area
Do not put content
on the brand signature area
Orange
RGB= 255,102,000
Light blue
RGB= 180,195,225
Dark blue
RGB= 000,000,102
Grey
RGB= 150,150,150
ING colour balance
Guideline
www.ing-presentations.intranet
• Pro-forma capital structure reflects NN Group IPO including exchange of first tranche of subordinated notes into NN Group shares and the
exercise of the green shoe
• The EUR 1 bln hybrid debt issued in July 2014 by NN Group is not reflected in the pro-forma numbers
NN Group 30 June 2014
NN Group 20.6 Equity 16.9
Equity for 3rd party 0.0
Hybrids (ING Group) 1.8
Hybrids (external) 1.5
Financial debt 0.4
20.6 20.6
Reported and pro-forma ING Group capital structure at 30 June 2014
Second Quarter 2014 Results 25
ING Group 30 June 2014
ING Bank 34 Equity 48
NN Group 17 Minority interest NN Group 0
Voya 3 CT1 securities 1
HybridsB 4 Core Debt 5
HybridsI 2 Hybrids 6
60 60
Pro-forma - ING Group 30 June 2014
ING Bank 34 Equity 44
NN Group 17 Minority interest NN Group 5
Voya 3 CT1 securities 1
HybridsB 4 Core Debt 2
HybridsI 2 Hybrids 6
Provision loss exchangeable* 1
60 60
Pro-forma - NN Group 30 June 2014
NN Group 20.6 Equity 11.5
Equity for 3rd party 5.4
Hybrids (ING Group) 1.8
Hybrids (external) 1.5
Financial debt 0.4
20.6 20.6
* The IPO had a negative impact on shareholders’ equity of ING Group of EUR 4,264 mln, of which EUR 1,012 mln for the 2nd and 3rd tranche of the mandatorily exchangeable notes
in 2015/16. The difference between the market value and estimated IFRS carrying value of these notes has been deducted from pro forma Group equity through a provision.

Do not put content
on the brand signature area
Do not put content
on the brand signature area
Orange
RGB= 255,102,000
Light blue
RGB= 180,195,225
Dark blue
RGB= 000,000,102
Grey
RGB= 150,150,150
ING colour balance
Guideline
www.ing-presentations.intranet CRD IV Common equity Tier 1 ratio fully-loaded 10.5%
Second Quarter 2014 Results 26
Impact CRD IV 2Q2014 (in EUR bln)
Common equity Tier 1 capital RWAs Common equity Tier 1 ratio
30 June 2014 (Phased-in) 31.6 293.4 10.8%
Defined benefit pension fund assets -0.3
Intangibles -1.3
DTA -0.2
Other -1.6
Revaluation reserve debt securities +1.3
Revaluation reserve equity securities +1.1
Revaluation reserve real estate own use +0.3
Pro-forma common equity Tier 1 ratio (fully loaded) 30.9 293.4 10.5%
• ING Bank’s common equity Tier 1 ratio (CET1 ratio) on a fully-loaded basis rose to 10.5% from 10.1% at the end of March, mainly due to
retained earnings and higher revaluation and FX reserves
• ING Bank’s CET1 ratio (phased-in) rose to 10.8% in 2Q14 from 10.0% at the end of March 2014, mainly due to the revised interpretation of the
CRD IV phase-in impact, which increased the ratio by 0.6%-point. Elements adjusted were significant investments in financial institutions,
shortfall of loan loss provision, goodwill and intangibles. The fully loaded CET1 ratio was not affected by the revised regulation

Do not put content
on the brand signature area
Do not put content
on the brand signature area
Orange
RGB= 255,102,000
Light blue
RGB= 180,195,225
Dark blue
RGB= 000,000,102
Grey
RGB= 150,150,150
ING colour balance
Guideline
www.ing-presentations.intranet Risk costs Commercial Banking continued their downward trend, but can be volatile quarter-on-quarter
Second Quarter 2014 Results 27
245227
177 172142
2Q13 3Q13 4Q13 1Q14 2Q14
42
94
30
4
6144
13
47
101
58
2Q13 3Q13 4Q13 1Q14 2Q14
Structured Finance General Lending & Transaction Services
Risk costs Commercial Banking trending down… (in EUR mln)
Risk cost development can be volatile due to provisioning or releases for a few large files in Structured Finance and/or General Lending (in EUR mln)
…driven by lower risk costs Real Estate Finance, partly as a result of releases (in EUR mln)
The NPL ratio increased slightly, mainly due to a few major files
11283 71
49
2
2Q13 3Q13 4Q13 1Q14 2Q14
6.6 6.46.06.05.9
3.93.4 3.6 3.4 3.6
2Q13 3Q13 4Q13 1Q14 2Q14
Non-performing loans (in EUR bln) Non-performing loans (in %)

Do not put content
on the brand signature area
Do not put content
on the brand signature area
Orange
RGB= 255,102,000
Light blue
RGB= 180,195,225
Dark blue
RGB= 000,000,102
Grey
RGB= 150,150,150
ING colour balance
Guideline
www.ing-presentations.intranet Risk costs Retail Banking Netherlands slightly down, but expected to remain elevated
Second Quarter 2014 Results 28
112 126 138103 103
8182
82
74 68
2Q13 3Q13 4Q13 1Q14 2Q14
Business Lending Mortgages
2.0
1.5
7.8
0
5
10
2Q13 3Q13 4Q13 1Q14 2Q14
NPL Dutch Mortgages 90+ days arrears Dutch mortgages
Business Lending NL
Risk costs Retail Banking NL expected to remain elevated
• Risk costs for Dutch mortgages declined slightly versus both 2Q13 and 1Q14
• Risk costs for Business Lending stable at EUR 103 mln, while the NPL ratio edged up slightly in 2Q14
• Despite some early signs of economic improvement in the Netherlands, we expect the NPLs and risk costs at Retail Banking Netherlands to
remain elevated due to the relatively subdued domestic economy
Risk costs Dutch mortgages and Business Lending NL (in EUR mln)
Non-performing loans (NPL) ratio Dutch mortgages and Business Lending NL (in %)

Do not put content
on the brand signature area
Do not put content
on the brand signature area
Orange
RGB= 255,102,000
Light blue
RGB= 180,195,225
Dark blue
RGB= 000,000,102
Grey
RGB= 150,150,150
ING colour balance
Guideline
www.ing-presentations.intranet
Dutch Purchasing Managers Index (PMI) was 52.3 in June 2014. Above 50 indicates positive growth
30
40
50
60
70
-8
-6
-4
-2
0
2
4
6
4Q09 4Q10 4Q11 4Q12 4Q13
Dutch economy and housing market gradually improving
Second Quarter 2014 Results 29
5.0
7.5
10.0
12.5
15.0
Sep.
2012
Dec.
2012
Mar.
2013
Jun.
2013
Sep.
2013
Dec.
2013
Mar.
2014
Jun.
2014
Netherlands Eurozone
6.8%
3.5%
11.5%
-50
-40
-30
-20
-10
0
* Source: CBS data
** Source: NVM
2009 2010 2011 2012 2013 July
2014
Dutch consumer confidence* at highest level since 2007
Unemployment rate (%) down to 6.8%
Dutch house prices in 2Q14 up 3.5% y-o-y**
2009 2010 2011 2012 2013 July
2014
51.8

Do not put content
on the brand signature area
Do not put content
on the brand signature area
Orange
RGB= 255,102,000
Light blue
RGB= 180,195,225
Dark blue
RGB= 000,000,102
Grey
RGB= 150,150,150
ING colour balance
Guideline
www.ing-presentations.intranet
• Total outstanding to Russia and Ukraine combined has been reduced by EUR 742 mln or 7.4% from 1Q14
• We will continue to manage exposure down in close cooperation with our clients, protecting their interests and our franchise as much as
reasonably possible
• The lending exposure to Russia covered by Export Credit Agencies (ECA) is approximately EUR 1 bln
67%
11%
22%
USD
EUR
Local currency
Total Lending outstanding per currency
Russia (EUR 7.3 bln)
Ukraine (EUR 1.4 bln)
Exposure ING Bank to Russia and Ukraine has been reduced
Second Quarter 2014 Results 30
Exposure ING Bank to Russia and Ukraine (in EUR mln)
Exposure, 30 June 2014
Russia Ukraine
Total Lending Credit O/S 7,256 1,369
Other* 700 13
Total outstanding 7,956 1,382
Undrawn committed Facilities 1,032 161
Note: data is based on country of residence
NPL ratio and Coverage ratio Russia and Ukraine, 30 June 2014
Russia Ukraine
NPL ratio 0.1% 19.9%
Coverage ratio** >100% 35%
69%
15%
16%
USD
EUR
Local currency
* Other includes Investment, trading exposure and pre-settlement
** Coverage ratio is defined as total provisions divided by total non performing loans

Do not put content
on the brand signature area
Do not put content
on the brand signature area
Orange
RGB= 255,102,000
Light blue
RGB= 180,195,225
Dark blue
RGB= 000,000,102
Grey
RGB= 150,150,150
ING colour balance
Guideline
www.ing-presentations.intranet
ING Group’s Annual Accounts are prepared in accordance with International Financial Reporting Standards as adopted by the European Union (‘IFRS-EU’).
In preparing the financial information in this document, the same accounting principles are applied as in the 2Q2014 ING Group Interim Accounts. All figures in this document are unaudited. Small differences are possible in the tables due to rounding.
Certain of the statements contained herein are not historical facts, including, without limitation, certain statements made of future expectations and other forward-looking statements that are based on management’s current views and assumptions and involve known and unknown risks and uncertainties that could cause actual results, performance or events to differ materially from those expressed or implied in such statements. Actual results, performance or events may differ materially from those in such statements due to, without limitation: (1) changes in general economic conditions, in particular economic conditions in ING’s core markets, (2) changes in performance of financial markets, including developing markets, (3) consequences of a potential (partial) break-up of the euro, (4) the implementation of ING’s restructuring plan to separate banking and insurance operations, (5) changes in the availability of, and costs associated with, sources of liquidity such as interbank funding, as well as conditions in the credit markets generally, including changes in borrower and counterparty creditworthiness, (6) the frequency and severity of insured loss events, (7) changes affecting mortality and morbidity levels and trends, (8) changes affecting persistency levels, (9) changes affecting interest rate levels, (10) changes affecting currency exchange rates, (11) changes in investor, customer and policyholder behaviour, (12) changes in general competitive factors, (13) changes in laws and regulations, (14) changes in the policies of governments and/or regulatory authorities, (15) conclusions with regard to purchase accounting assumptions and methodologies, (16) changes in ownership that could affect the future availability to us of net operating loss, net capital and built-in loss carry forwards, (17) changes in credit ratings, (18) ING’s ability to achieve projected operational synergies and (19) the other risks and uncertainties detailed in the Risk Factors section contained in the most recent annual report of ING Groep N.V. Any forward-looking statements made by or on behalf of ING speak only as of the date they are made, and, ING assumes no obligation to publicly update or revise any forward-looking statements, whether as a result of new information or for any other reason.
This document does not constitute an offer to sell, or a solicitation of an offer to purchase, any securities in the United States or any other jurisdiction. The securities of NN Group have not been and will not be registered under the U.S. Securities Act of 1933, as amended (the “Securities Act”), and may not be offered or sold within the United States absent registration or an applicable exemption from the registration requirements of the Securities Act.
www.ing.com
Important legal information
Second Quarter 2014 Results 31