Atlanta Industrial Market Second Quarter 2004 Atlanta Industrial Market Second Quarter 2004.
23
Atlanta Industrial Market Second Quarter 2004
-
Upload
elwin-stevenson -
Category
Documents
-
view
216 -
download
0
Transcript of Atlanta Industrial Market Second Quarter 2004 Atlanta Industrial Market Second Quarter 2004.

Atlanta Industrial Market Second Quarter 2004
Atlanta Industrial Market Second Quarter 2004
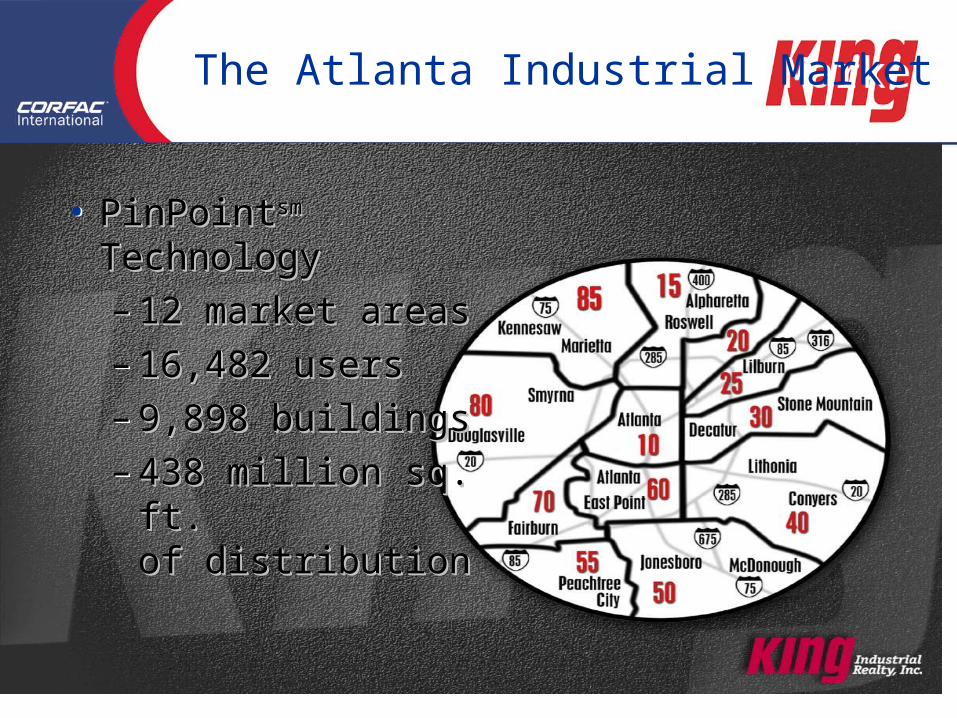
The Atlanta Industrial MarketThe Atlanta Industrial Market
• PinPointPinPointsmsm TechnologyTechnology– 12 market areas12 market areas– 16,482 users16,482 users– 9,898 buildings9,898 buildings– 438 million sq. 438 million sq.
ft. ft. of distributionof distribution
• PinPointPinPointsmsm TechnologyTechnology– 12 market areas12 market areas– 16,482 users16,482 users– 9,898 buildings9,898 buildings– 438 million sq. 438 million sq.
ft. ft. of distributionof distribution
Behind KIR Team Behind KIR Team
• Twenty four years• PinPoint Database
– Custom designed– Inventory every quarter– Shared information by everyone
• Atlanta’s industrial experts – 3,428 transactions since 1995– 48.9 million sq. ft. of Leases and Sales – 3,601 acres of land
• Twenty four years• PinPoint Database
– Custom designed– Inventory every quarter– Shared information by everyone
• Atlanta’s industrial experts – 3,428 transactions since 1995– 48.9 million sq. ft. of Leases and Sales – 3,601 acres of land
Defining TermsDefining Terms
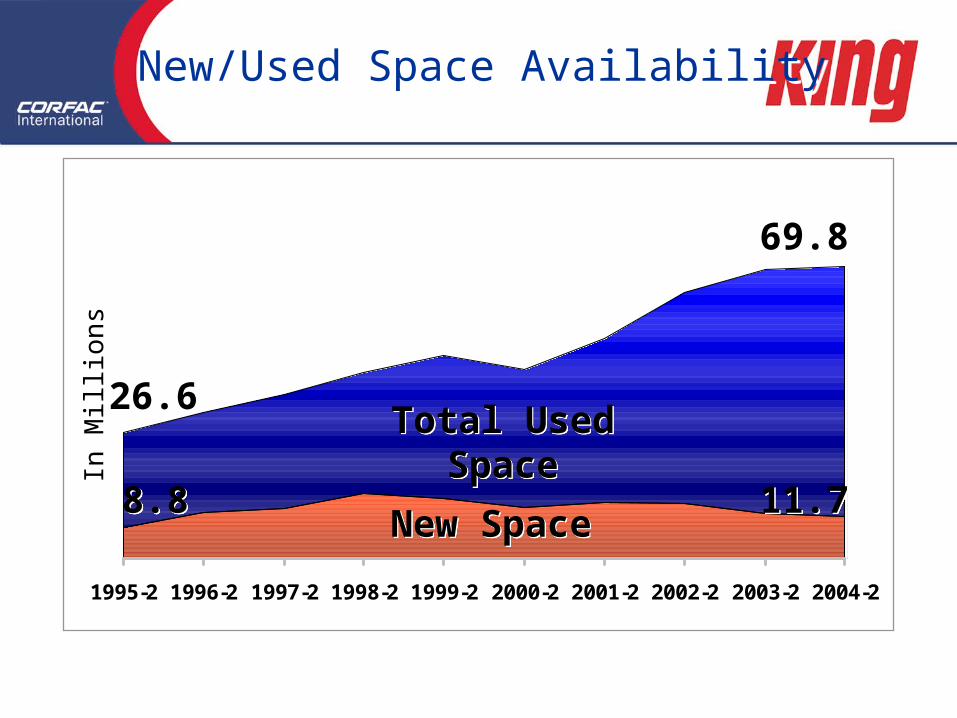
• Availability – Vacant or available space
• Activity – Square feet of signed leases
• Net Absorption – Net results of activity (calculated
by spaces vacated and spaces leased)
• Deals – Actual number of transactions
• Availability – Vacant or available space
• Activity – Square feet of signed leases
• Net Absorption – Net results of activity (calculated
by spaces vacated and spaces leased)
• Deals – Actual number of transactions
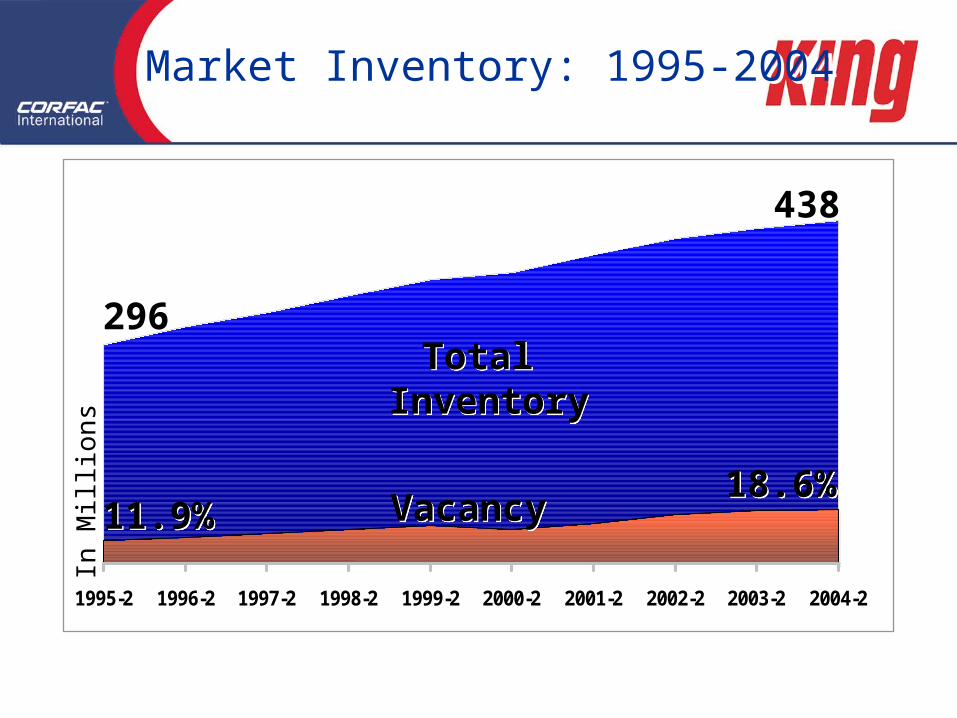
Market Inventory: 1995-2004Market Inventory: 1995-2004
1995-2 1996-2 1997-2 1998-2 1999-2 2000-2 2001-2 2002-2 2003-2 2004-21995-2 1996-2 1997-2 1998-2 1999-2 2000-2 2001-2 2002-2 2003-2 2004-2
296296
438438
Total InventoryTotal Inventory
11.9%11.9%18.6%18.6%
VacancyVacancy
In M
illio
ns
In M
illio
ns
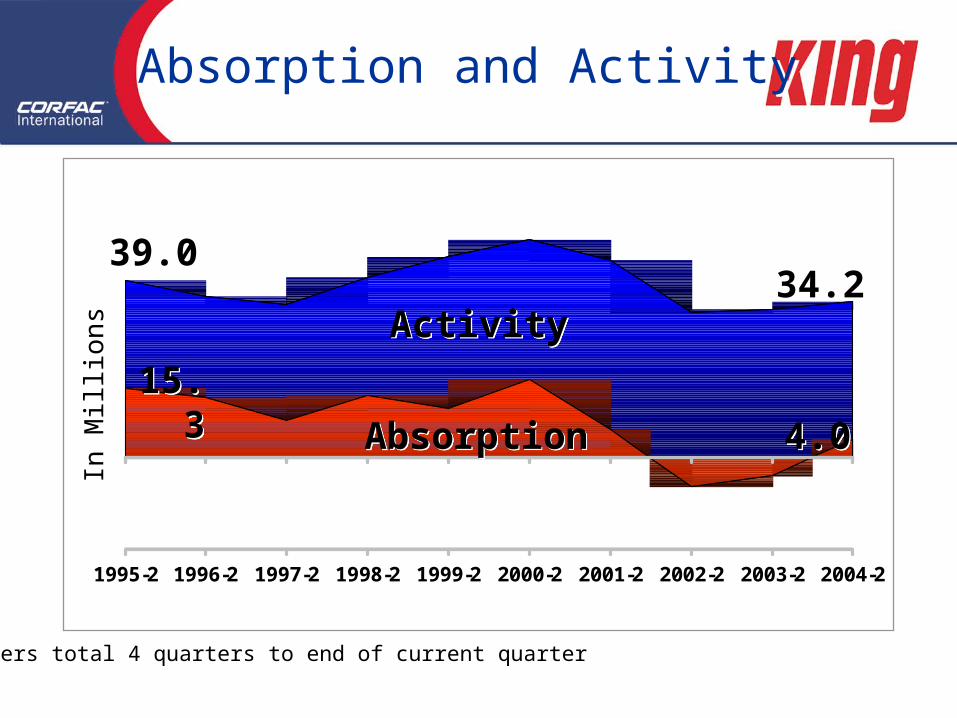
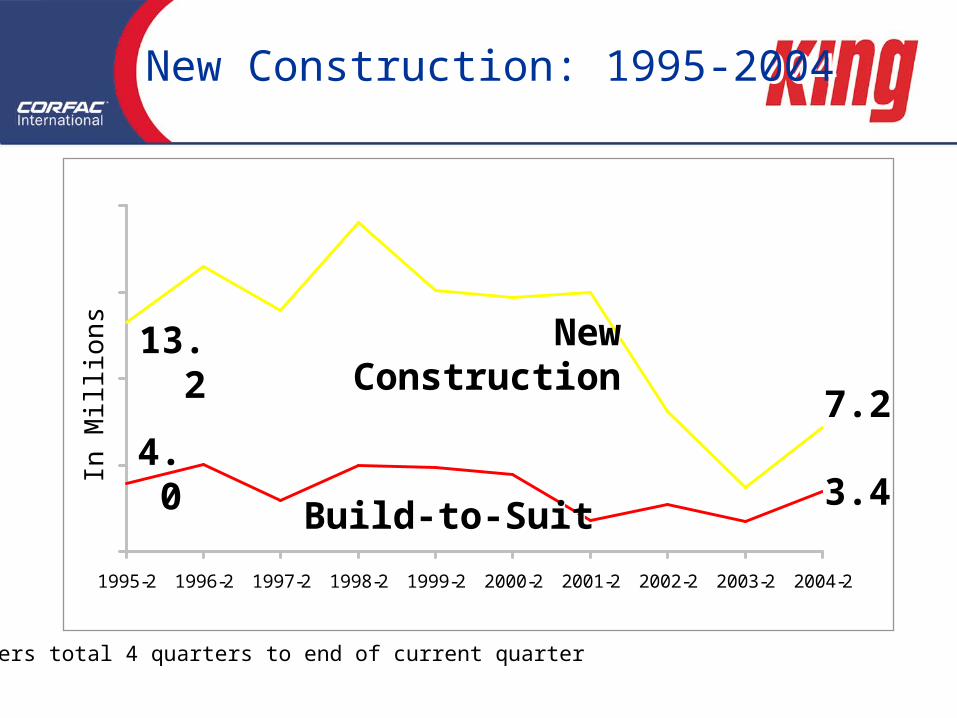
Numbers total 4 quarters to end of current quarterNumbers total 4 quarters to end of current quarter
Absorption and ActivityAbsorption and Activity
1995-2 1996-2 1997-2 1998-2 1999-2 2000-2 2001-2 2002-2 2003-2 2004-2
ActivityActivity
39.039.0
15.3
15.3 AbsorptionAbsorption 4.04.0
34.234.2
In M
illio
ns
1995-2 1996-2 1997-2 1998-2 1999-2 2000-2 2001-2 2002-2 2003-2 2004-21995-2 1996-2 1997-2 1998-2 1999-2 2000-2 2001-2 2002-2 2003-2 2004-2
In M
illio
ns
26.626.6
69.869.8
Total Used Space
Total Used Space
8.88.8 11.711.7New SpaceNew Space
New/Used Space AvailabilityNew/Used Space Availability
Numbers total 4 quarters to end of current quarterNumbers total 4 quarters to end of current quarter
New Construction: 1995-2004New Construction: 1995-2004
1995-2 1996-2 1997-2 1998-2 1999-2 2000-2 2001-2 2002-2 2003-2 2004-21995-2 1996-2 1997-2 1998-2 1999-2 2000-2 2001-2 2002-2 2003-2 2004-2
13.2
13.2 7.27.2
New Construction
New Construction
Build-to-SuitBuild-to-Suit3.43.4
4.0
4.0
In M
illio
ns
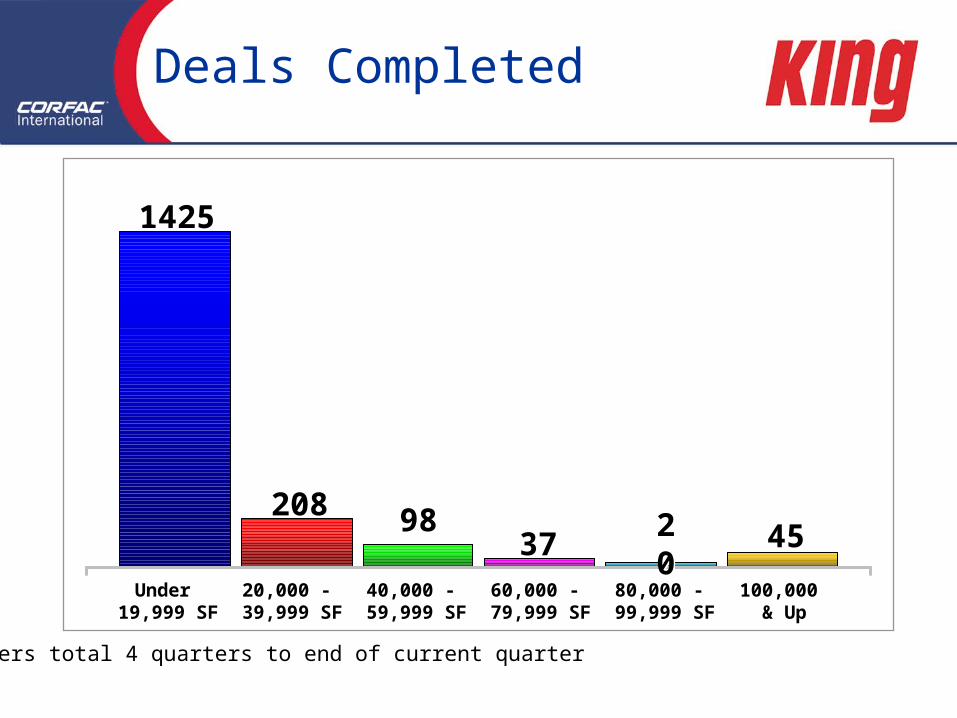
Deals CompletedDeals Completed
454598982082083737 2
020
1425
1425
Under 19,999 SF
Under 19,999 SF
20,000 - 39,999 SF20,000 - 39,999 SF
40,000 - 59,999 SF40,000 - 59,999 SF
60,000 - 79,999 SF60,000 - 79,999 SF
80,000 - 99,999 SF80,000 - 99,999 SF
100,000 & Up
100,000 & Up
Numbers total 4 quarters to end of current quarterNumbers total 4 quarters to end of current quarter
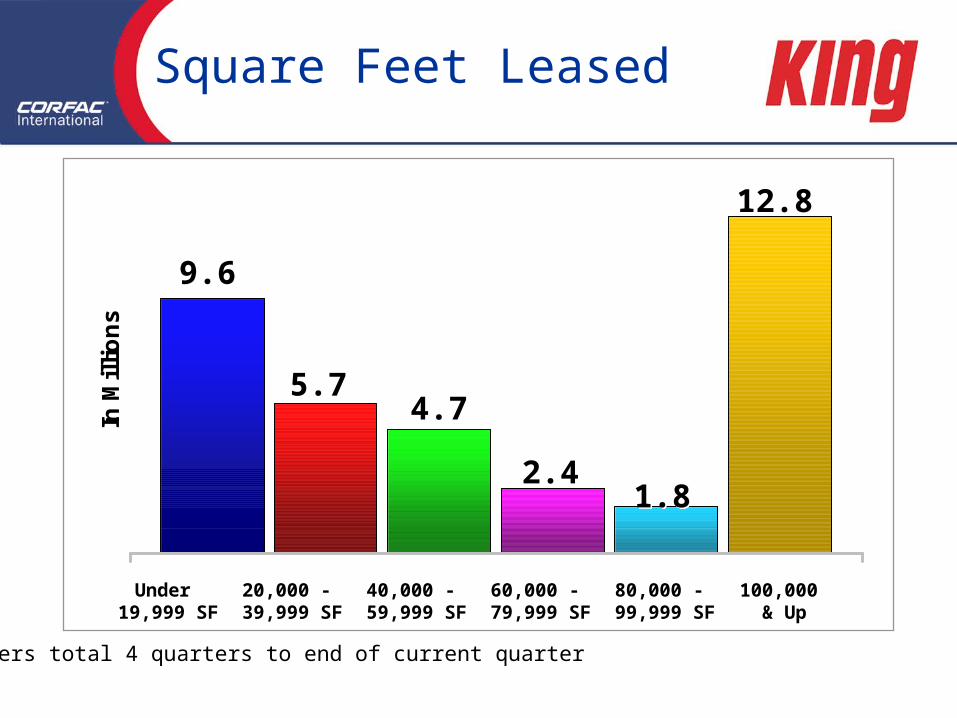
In M
illi
on
sIn
Mil
lio
ns
1.81.8
5.75.74.74.7
2.42.4
12.812.8
9.69.6
Square Feet LeasedSquare Feet Leased
Under 19,999 SF
Under 19,999 SF
20,000 - 39,999 SF20,000 - 39,999 SF
40,000 - 59,999 SF40,000 - 59,999 SF
60,000 - 79,999 SF60,000 - 79,999 SF
80,000 - 99,999 SF80,000 - 99,999 SF
100,000 & Up
100,000 & Up
Numbers total 4 quarters to end of current quarterNumbers total 4 quarters to end of current quarter
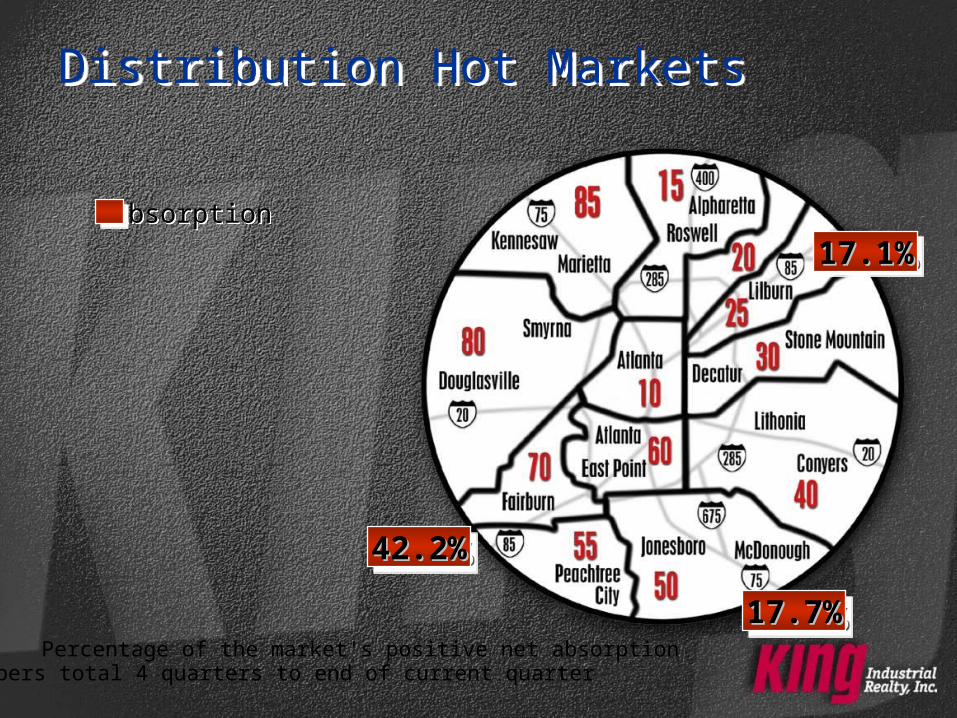
Distribution Hot MarketsDistribution Hot Markets
AbsorptionAbsorption
17.1%17.1%17.1%17.1%
17.7%17.7%17.7%17.7%
42.2%42.2%42.2%42.2%
Percentage of the market's positive net absorption Numbers total 4 quarters to end of current quarter
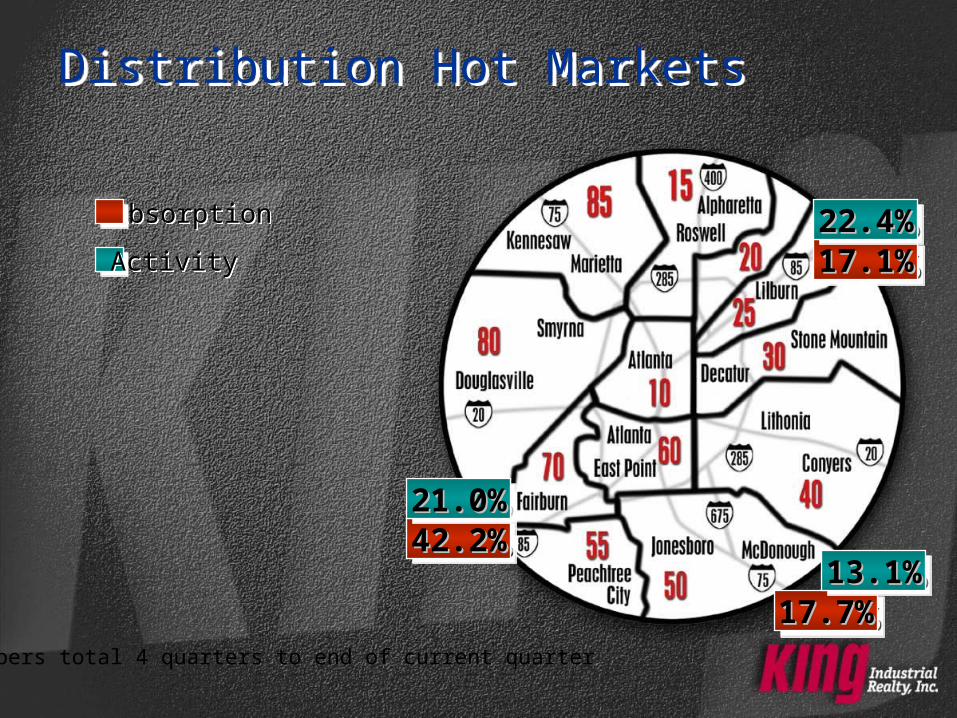
Distribution Hot MarketsDistribution Hot Markets
AbsorptionAbsorption
42.2%42.2%42.2%42.2%
17.7%17.7%17.7%17.7%
17.1%17.1%17.1%17.1%ActivityActivity22.4%22.4%22.4%22.4%
13.1%13.1%13.1%13.1%
21.0%21.0%21.0%21.0%
Numbers total 4 quarters to end of current quarter
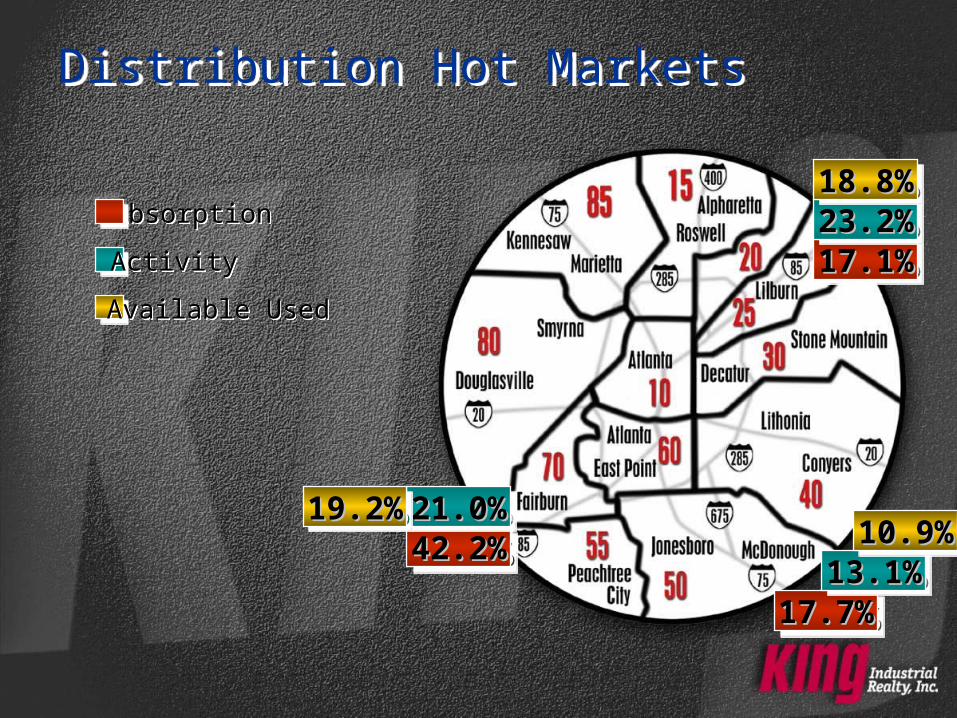
Distribution Hot MarketsDistribution Hot Markets
AbsorptionAbsorption
17.1%17.1%17.1%17.1%
42.2%42.2%42.2%42.2%
17.7%17.7%17.7%17.7%
ActivityActivity23.2%23.2%23.2%23.2%
13.1%13.1%13.1%13.1%
21.0%21.0%21.0%21.0%
Available UsedAvailable Used
18.8%18.8%18.8%18.8%
10.9%10.9%10.9%10.9%19.2%19.2%19.2%19.2%
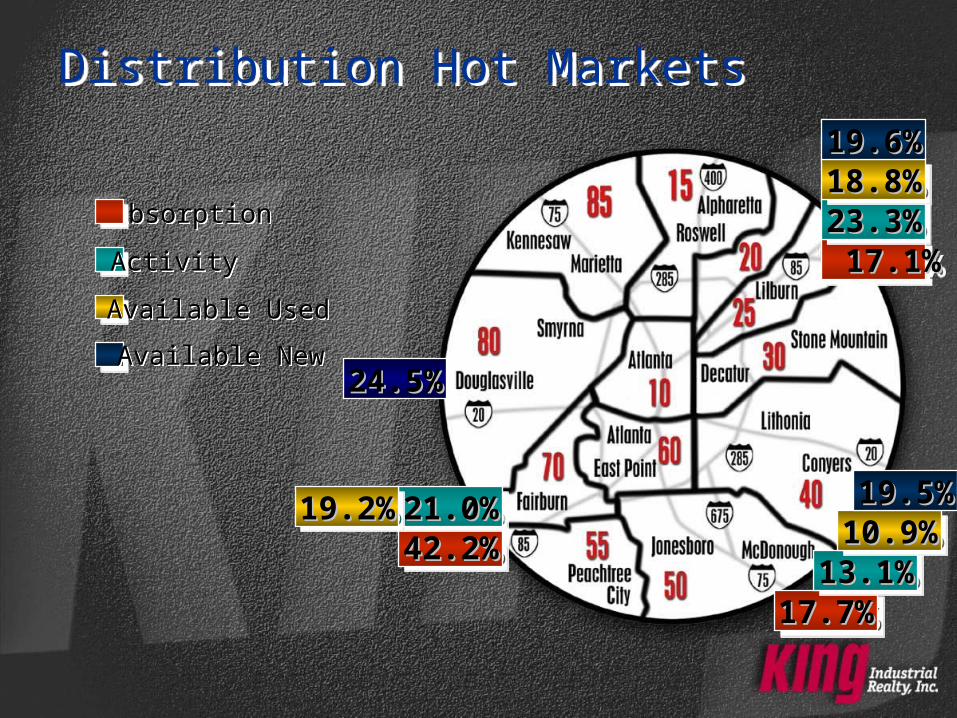
Distribution Hot MarketsDistribution Hot Markets
AbsorptionAbsorption
42.2%42.2%42.2%42.2%
17.7%17.7%17.7%17.7%
17.1%17.1% 17.1%17.1%ActivityActivity 23.3% 23.3% 23.3% 23.3%
13.1%13.1%13.1%13.1%
21.0%21.0%21.0%21.0%
Available UsedAvailable Used
18.8%18.8%18.8%18.8%
19.2%19.2%19.2%19.2%10.9%10.9%10.9%10.9%
24.5%24.5%Available NewAvailable New
19.5%19.5%
19.6%19.6%
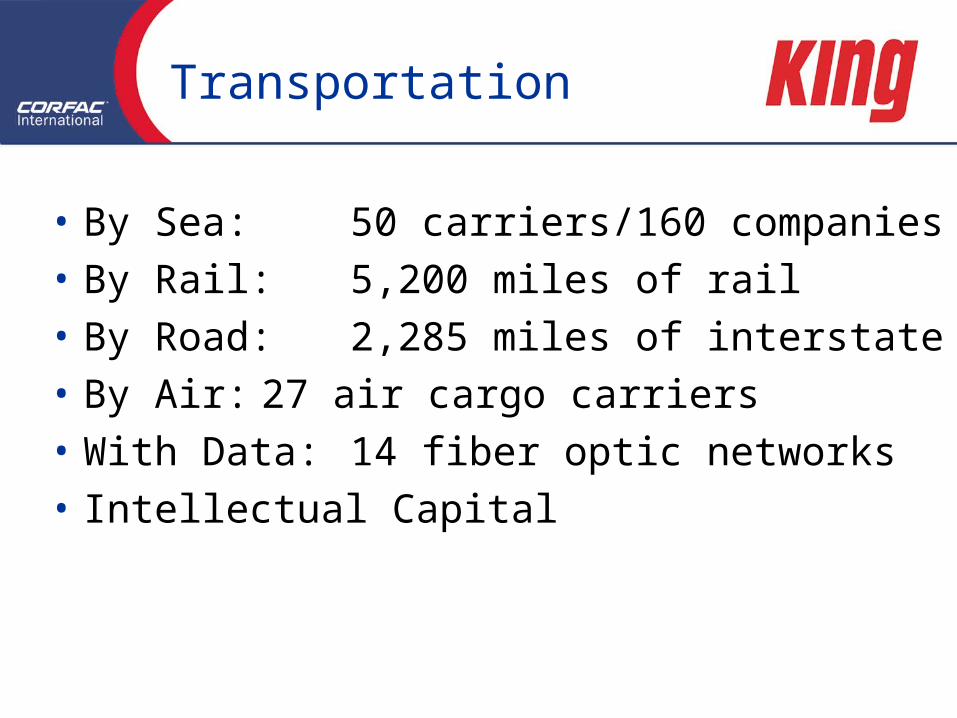
Transportation
• By Sea: 50 carriers/160 companies• By Rail: 5,200 miles of rail• By Road:2,285 miles of interstate• By Air: 27 air cargo carriers• With Data: 14 fiber optic networks• Intellectual Capital
• By Sea: 50 carriers/160 companies• By Rail: 5,200 miles of rail• By Road:2,285 miles of interstate• By Air: 27 air cargo carriers• With Data: 14 fiber optic networks• Intellectual Capital
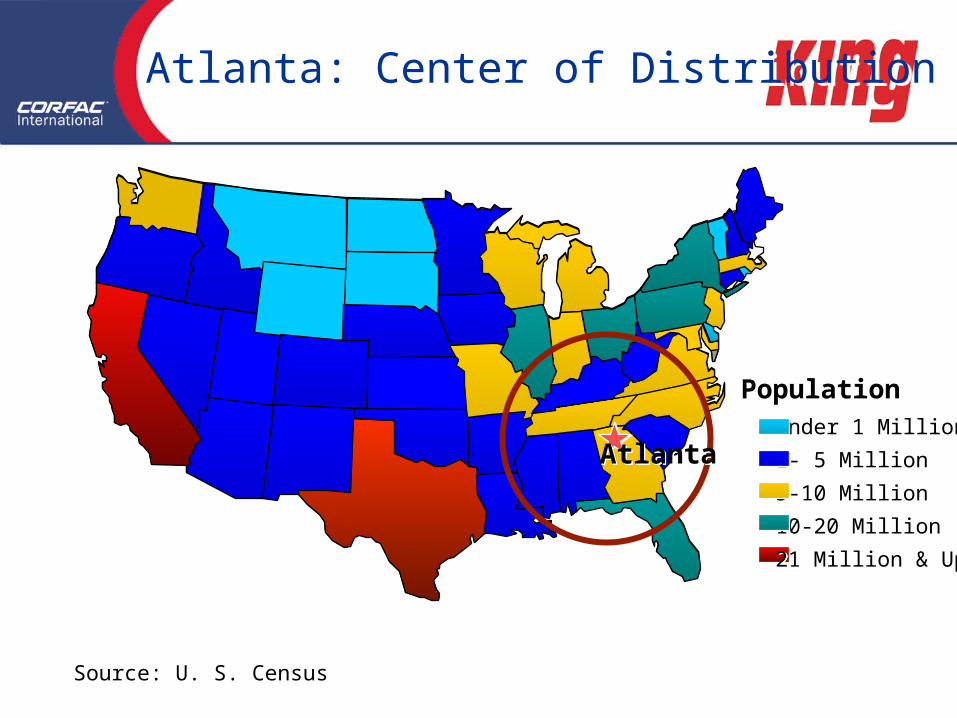
Atlanta: Center of Distribution Atlanta: Center of Distribution
Source: U. S. Census Source: U. S. Census
Under 1 Million
1- 5 Million
5-10 Million
10-20 Million
21 Million & Up
Under 1 Million
1- 5 Million
5-10 Million
10-20 Million
21 Million & Up
PopulationPopulation
AtlantaAtlanta

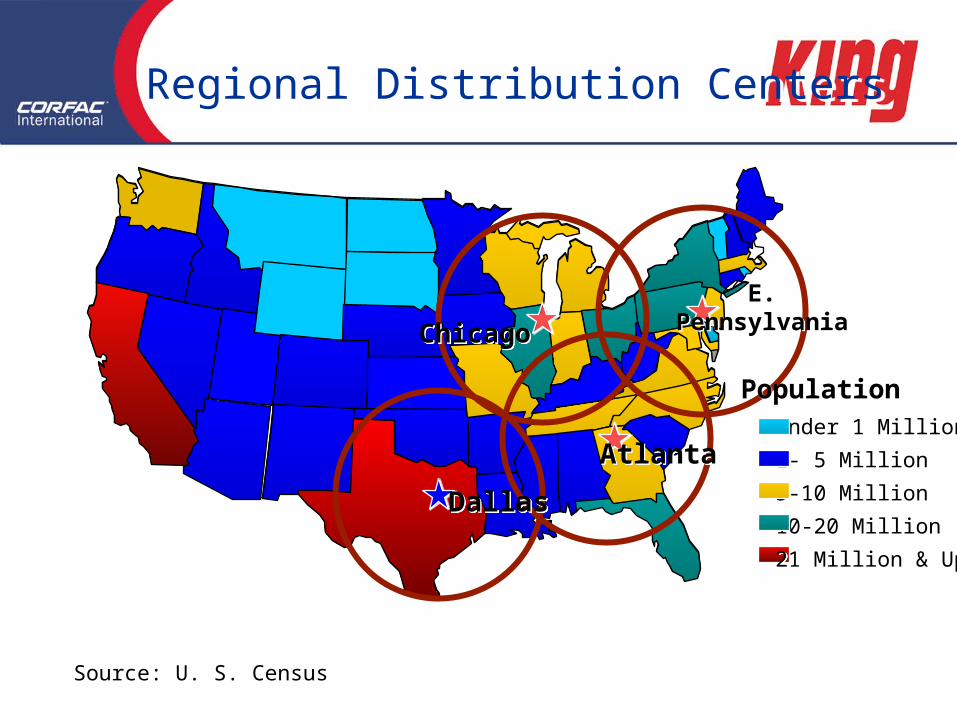
Regional Distribution Centers Regional Distribution Centers
Source: U. S. Census Source: U. S. Census
Under 1 Million
1- 5 Million
5-10 Million
10-20 Million
21 Million & Up
Under 1 Million
1- 5 Million
5-10 Million
10-20 Million
21 Million & Up
AtlantaAtlanta
E. Pennsylvania
E. Pennsylvania
PopulationPopulation

Regional Distribution Centers Regional Distribution Centers
Source: U. S. Census Source: U. S. Census
Under 1 Million
1- 5 Million
5-10 Million
10-20 Million
21 Million & Up
Under 1 Million
1- 5 Million
5-10 Million
10-20 Million
21 Million & Up
AtlantaAtlanta
ChicagoChicago
E. Pennsylvania
E. Pennsylvania
PopulationPopulation
Regional Distribution Centers Regional Distribution Centers
Source: U. S. Census Source: U. S. Census
Under 1 Million
1- 5 Million
5-10 Million
10-20 Million
21 Million & Up
Under 1 Million
1- 5 Million
5-10 Million
10-20 Million
21 Million & Up
AtlantaAtlanta
DallasDallas
ChicagoChicago
E. Pennsylvania
E. Pennsylvania
PopulationPopulation

Regional Distribution Centers Regional Distribution Centers
Source: U. S. Census Source: U. S. Census
Under 1 Million
1- 5 Million
5-10 Million
10-20 Million
21 Million & Up
Under 1 Million
1- 5 Million
5-10 Million
10-20 Million
21 Million & Up
AtlantaAtlanta
DallasDallasLos AngelesLos Angeles
ChicagoChicago
E. Pennsylvania
E. Pennsylvania
PopulationPopulation
Developments Impacting Distribution Facilities
• Governmental Regulations - Trucking regulations
- Fire code issues
• Technological changes-RFID tracking device-Supply-chain management systems
• Governmental Regulations - Trucking regulations
- Fire code issues
• Technological changes-RFID tracking device-Supply-chain management systems
ConclusionConclusion
• Transportation infrastructure
• Largest industrial inventory in southeast
• Trends- Population Growth- Growth in Intermodal Hubs
- Governmental changes
- Technological advances
• Transportation infrastructure
• Largest industrial inventory in southeast
• Trends- Population Growth- Growth in Intermodal Hubs
- Governmental changes
- Technological advances

Q & A