Second quarter earnings
13
1 FOR IMMEDIATE RELEASE May 10, 2016 THE WALT DISNEY COMPANY REPORTS SECOND QUARTER AND SIX MONTHS EARNINGS FOR FISCAL 2016 BURBANK, Calif. – The Walt Disney Company today reported quarterly earnings of $2.1 billion for its second fiscal quarter ended April 2, 2016, an increase of $35 million over the prior-year quarter. Diluted earnings per share (EPS) for the quarter increased 6% to $1.30 from $1.23 in the prior-year quarter. Excluding certain items affecting comparability (1) , EPS for the quarter increased 11% to $1.36. EPS for the six months ended April 2, 2016 increased 22% to $3.04 from $2.50 in the prior-year period. Excluding certain items affecting comparability (1) , EPS for the six months increased 20%. “We’re very pleased with our overall results in Q2, which marks our 11th consecutive quarter of double-digit growth in adjusted EPS,” said Robert A. Iger, chairman and chief executive officer, The Walt Disney Company. “Our Studio’s unprecedented winning streak at the box office underscores the incredible appeal of our branded content, which we continue to leverage across the entire company to drive significant value. Looking forward, we are thrilled with the Studio’s slate and tremendously excited about the June 16th grand opening of the spectacular Shanghai Disney Resort.” The following table summarizes the second quarter and six-month results for fiscal 2016 and 2015 (in millions, except per share amounts): Quarter Ended Six Months Ended April 2, 2016 March 28, 2015 Change April 2, 2016 March 28, 2015 Change Revenues $ 12,969 $ 12,461 4 % $ 28,213 $ 25,852 9 % Segment operating income (2) $ 3,822 $ 3,482 10 % $ 8,089 $ 7,027 15 % Net income (3) $ 2,143 $ 2,108 2 % $ 5,023 $ 4,290 17 % Diluted EPS (3) $ 1.30 $ 1.23 6 % $ 3.04 $ 2.50 22 % Cash provided by operations $ 3,400 $ 2,918 17 % $ 5,762 $ 4,773 21 % Free cash flow (2) $ 2,250 $ 2,011 12 % $ 3,206 $ 2,868 12 % (1) Items affecting comparability during the quarter ended April 2, 2016 included a $147 million charge in connection with the discontinuation of our self-published console games business, principally Infinity (Infinity Charge). For the six months ended April 2, 2016, items affecting comparability included the Company’s share of a net gain recognized by A&E Television Networks (A&E) in connection with an acquisition of an interest in Vice Group Holding, Inc. (Vice Gain) ($332 million), the Infinity Charge, an investment impairment ($54 million) and contract termination and severance costs ($27 million). These items had a net favorable impact of $104 million. See the reconciliation of reported EPS to EPS excluding certain items affecting comparability on page 8. (2) Segment operating income and free cash flow are non-GAAP financial measures. See the discussion on page 7 and 8. (3) Reflects amounts attributable to shareholders of The Walt Disney Company, i.e. after deduction of noncontrolling interests.
Transcript of Second quarter earnings
1
FOR IMMEDIATE RELEASEMay 10, 2016
THE WALT DISNEY COMPANY REPORTS SECOND QUARTER AND SIX MONTHS EARNINGS FOR FISCAL 2016
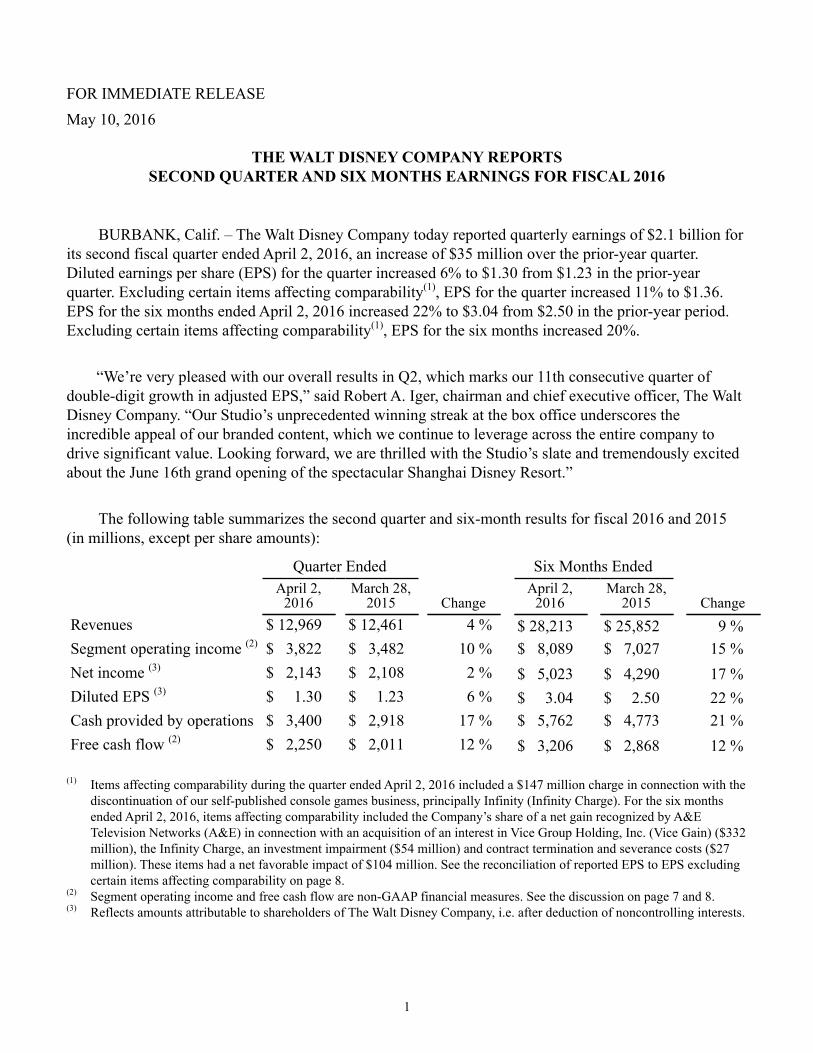
BURBANK, Calif. – The Walt Disney Company today reported quarterly earnings of $2.1 billion for its second fiscal quarter ended April 2, 2016, an increase of $35 million over the prior-year quarter. Diluted earnings per share (EPS) for the quarter increased 6% to $1.30 from $1.23 in the prior-year quarter. Excluding certain items affecting comparability(1), EPS for the quarter increased 11% to $1.36. EPS for the six months ended April 2, 2016 increased 22% to $3.04 from $2.50 in the prior-year period. Excluding certain items affecting comparability(1), EPS for the six months increased 20%.
“We’re very pleased with our overall results in Q2, which marks our 11th consecutive quarter of double-digit growth in adjusted EPS,” said Robert A. Iger, chairman and chief executive officer, The Walt Disney Company. “Our Studio’s unprecedented winning streak at the box office underscores the incredible appeal of our branded content, which we continue to leverage across the entire company to drive significant value. Looking forward, we are thrilled with the Studio’s slate and tremendously excited about the June 16th grand opening of the spectacular Shanghai Disney Resort.”
The following table summarizes the second quarter and six-month results for fiscal 2016 and 2015 (in millions, except per share amounts):
Quarter Ended Six Months EndedApril 2,
2016March 28,
2015 ChangeApril 2,
2016March 28,
2015 ChangeRevenues $ 12,969 $ 12,461 4 % $ 28,213 $ 25,852 9 %Segment operating income (2) $ 3,822 $ 3,482 10 % $ 8,089 $ 7,027 15 %Net income (3) $ 2,143 $ 2,108 2 % $ 5,023 $ 4,290 17 %Diluted EPS (3) $ 1.30 $ 1.23 6 % $ 3.04 $ 2.50 22 %Cash provided by operations $ 3,400 $ 2,918 17 % $ 5,762 $ 4,773 21 %Free cash flow (2) $ 2,250 $ 2,011 12 % $ 3,206 $ 2,868 12 %
(1) Items affecting comparability during the quarter ended April 2, 2016 included a $147 million charge in connection with the discontinuation of our self-published console games business, principally Infinity (Infinity Charge). For the six months ended April 2, 2016, items affecting comparability included the Company’s share of a net gain recognized by A&E Television Networks (A&E) in connection with an acquisition of an interest in Vice Group Holding, Inc. (Vice Gain) ($332 million), the Infinity Charge, an investment impairment ($54 million) and contract termination and severance costs ($27 million). These items had a net favorable impact of $104 million. See the reconciliation of reported EPS to EPS excluding certain items affecting comparability on page 8.
(2) Segment operating income and free cash flow are non-GAAP financial measures. See the discussion on page 7 and 8.(3) Reflects amounts attributable to shareholders of The Walt Disney Company, i.e. after deduction of noncontrolling interests.

2
SEGMENT RESULTSThe following table summarizes the second quarter and six-month segment operating results for
fiscal 2016 and 2015 (in millions):
Quarter Ended Six Months EndedApril 2,
2016March 28,
2015 ChangeApril 2,
2016March 28,
2015 ChangeRevenues:
Media Networks $ 5,793 $ 5,810 — % $ 12,125 $ 11,670 4 %Parks and Resorts 3,928 3,760 4 % 8,209 7,670 7 %Studio Entertainment 2,062 1,685 22 % 4,783 3,543 35 %Consumer Products & Interactive Media 1,186 1,206 (2)% 3,096 2,969 4 %
$ 12,969 $ 12,461 4 % $ 28,213 $ 25,852 9 %
Segment operating income:Media Networks $ 2,299 $ 2,101 9 % $ 3,711 $ 3,596 3 %Parks and Resorts 624 566 10 % 1,605 1,371 17 %Studio Entertainment 542 427 27 % 1,556 971 60 %Consumer Products & Interactive Media 357 388 (8)% 1,217 1,089 12 %
$ 3,822 $ 3,482 10 % $ 8,089 $ 7,027 15 %
Media Networks
Media Networks revenues for the quarter were relatively flat at $5.8 billion and segment operating income increased 9% to $2.3 billion.
The following table provides further detail of the Media Networks results (in millions):
Quarter Ended Six Months Ended
April 2,
2016March 28,
2015 ChangeApril 2,
2016March 28,
2015 ChangeRevenues:
Cable Networks $ 3,955 $ 4,030 (2)% $ 8,476 $ 8,196 3 %Broadcasting 1,838 1,780 3 % 3,649 3,474 5 %
$ 5,793 $ 5,810 — % $ 12,125 $ 11,670 4 %Segment operating income:
Cable Networks $ 2,021 $ 1,799 12 % $ 3,210 $ 3,054 5 %Broadcasting 278 302 (8)% 501 542 (8)%
$ 2,299 $ 2,101 9 % $ 3,711 $ 3,596 3 %
Cable Networks
Cable Networks revenues for the quarter decreased 2% to $4.0 billion and operating income increased 12% to $2.0 billion due to an increase at ESPN, partially offset by lower equity income from A&E.

3
The increase at ESPN was due to the benefit of lower programming costs and higher affiliate revenues, partially offset by a decrease in advertising revenue. Results for the quarter benefited from the timing of our fiscal quarter end relative to when College Football Playoff (CFP) bowl games were played, which resulted in a decrease in programming costs and advertising revenue. One CFP game was aired in the current quarter, whereas seven CFP games were aired in the second quarter of the prior year. Affiliate revenue growth was due to contractual rate increases, partially offset by a decline in subscribers. Lower advertising revenue was due to lower ratings and rates, which were negatively impacted by the timing of CFP bowl games, partially offset by higher units sold.
Lower equity income from A&E was due to a decrease in advertising revenue, higher programming costs and a negative impact from the conversion of the H2 channel to Viceland as Viceland is in a start-up phase.
Broadcasting
Broadcasting revenues for the quarter increased 3% to $1.8 billion and operating income decreased 8% to $278 million due to lower operating income from program sales and higher programming and marketing costs, partially offset by advertising and affiliate revenue growth. Lower operating income from program sales was due to a significant SVOD sale in the prior-year quarter and a higher cost mix of programs sold in the current quarter. The increase in programming costs was due to a higher average cost of new scripted programming and increased program cost write-offs. The increase in network advertising revenue was due to higher rates, partially offset by lower ratings. Affiliate revenue growth was primarily due to contractual rate increases.
Parks and Resorts
Parks and Resorts revenues for the quarter increased 4% to $3.9 billion and segment operating income increased 10% to $624 million. Operating income growth for the quarter was due to an increase at our domestic operations, partially offset by a decrease at our international operations. The current quarter reflected an offsetting impact from a shift in the timing of the New Year’s and Easter holidays relative to our fiscal periods. The current quarter was adversely impacted by the absence of several days of the New Year’s holiday, which occurred in the second quarter of the prior year. This impact was essentially offset by the benefit of the two-week Easter holiday, which occurred in the second quarter of the current year compared to the third quarter of the prior year.
Higher operating income at our domestic operations was due to guest spending growth, partially offset by higher costs. The increase in guest spending was due to higher average ticket prices at our theme parks and cruise line, increased food, beverage and merchandise spending and higher average hotel room rates. Cost increases were due to labor and other cost inflation and higher depreciation associated with new attractions. Attendance at our domestic theme parks was relatively flat, as an increase at Disneyland Resort was offset by a modest decrease at Walt Disney World Resort.
Lower operating income at our international operations was due to higher pre-opening expenses at Shanghai Disney Resort, increased operating costs at Disneyland Paris and lower volume at Hong Kong Disneyland Resort, partially offset by higher guest spending at Disneyland Paris.

4
Studio Entertainment
Studio Entertainment revenues for the quarter increased 22% to $2.1 billion and segment operating income increased 27% to $542 million. Higher operating income was due to an increase in theatrical distribution results and growth in TV/SVOD distribution, partially offset by the impact of foreign currency translation due to the strengthening of the U.S. dollar against major currencies, decreased home entertainment results and higher film cost impairments.
The increase in theatrical distribution results was due to the strong performance of Star Wars: The Force Awakens and Zootopia in the current quarter compared to the continuing performance in the prior-year quarter of Big Hero 6 and Into the Woods, both of which were released domestically in the first quarter of the prior year. Higher TV/SVOD distribution results were driven by international growth. The decrease in home entertainment results was primarily due to lower unit sales reflecting the performance of Big Hero 6, Frozen and Marvel’s Guardians of the Galaxy in the prior-year quarter compared to The Good Dinosaur, Inside Out and Marvel’s Ant-Man in the current quarter. The decrease from lower unit sales was partially offset by the benefit from Star Wars Classic titles that are distributed by a third party.
Consumer Products & Interactive Media
Consumer Products & Interactive Media revenues for the quarter decreased 2% to $1.2 billion and segment operating income decreased 8% to $357 million. Lower operating income was primarily due to the impact of foreign currency translation due to the strengthening of the U.S. dollar against major currencies, lower operating margins and comparable store sales at our retail business and lower results for Infinity. These decreases were partially offset by higher licensing revenues.
Increased licensing revenues were driven by higher revenue from Star Wars merchandise, partially offset by an adverse impact from the timing of minimum guarantee shortfall recognition and a decrease in revenue from merchandise based on Frozen.
OTHER FINANCIAL INFORMATION
Corporate and Unallocated Shared Expenses
Corporate and unallocated shared expenses decreased $8 million to $162 million in the current quarter primarily due to the timing of allocations to operating segments.
Interest income/(expense), net
Interest income/(expense), net was as follows (in millions):
Quarter Ended
April 2,
2016March 28,
2015 ChangeInterest expense $ (81) $ (66) (23) %Interest and investment income 14 74 (81) %Interest income/(expense), net $ (67) $ 8 nm
The increase in interest expense for the quarter was due to higher average debt balances, partially offset by higher capitalized interest driven by the continued development of the Shanghai Disney Resort.

5
The decrease in interest and investment income for the quarter was due to gains on sales of investments in the prior-year quarter.
Income Taxes
The effective income tax rate was as follows:
Quarter Ended
April 2,
2016March 28,
2015 ChangeEffective income tax rate 34.0% 32.9% (1.1) ppt
The increase in the effective income tax rate for the quarter was due to a shift in the mix of earnings between domestic and foreign tax jurisdictions, including foreign losses for which we cannot recognize a tax benefit.
Noncontrolling Interests
Quarter Ended
(in millions)April 2,
2016March 28,
2015 ChangeNet income attributable to noncontrolling interests $ 133 $ 120 (11) %
The increase in net income attributable to noncontrolling interests for the quarter was primarily due to higher results at ESPN, partially offset by higher pre-opening expenses at Shanghai Disney Resort.
Net income attributable to noncontrolling interests is determined on income after royalties and management fees, financing costs and income taxes.
Cash Flow
Cash provided by operations and free cash flow were as follows (in millions):
Six Months Ended
April 2,
2016March 28,
2015 ChangeCash provided by operations $ 5,762 $ 4,773 $ 989Investments in parks, resorts and other property (2,556) (1,905) (651)Free cash flow (1) $ 3,206 $ 2,868 $ 338
(1) Free cash flow is not a financial measure defined by GAAP. See the discussion of non-GAAP financial measures that
follows.
Cash provided by operations for the first six months of fiscal 2016 increased 21% or $1.0 billion to $5.8 billion compared to the first six months of fiscal 2015. The increase in cash provided by operations reflected higher segment operating results, partially offset by higher pension and postretirement medical contributions, an increase in receivables at Studio Entertainment driven by higher revenues in the current period due to Zootopia and Star Wars: The Force Awakens compared to Big Hero 6 and Cinderella in the prior-year period and higher television production spending.

6
Capital Expenditures and Depreciation Expense
Investments in parks, resorts and other property were as follows (in millions):
Six Months Ended
April 2,
2016March 28,
2015Media Networks
Cable Networks $ 33 $ 26Broadcasting 44 20
Total Media Networks 77 46Parks and Resorts
Domestic 1,131 606International 1,172 1,054
Total Parks and Resorts 2,303 1,660Studio Entertainment 44 52Consumer Products & Interactive Media 20 26Corporate 112 121Total investments in parks, resorts and other property $ 2,556 $ 1,905
Capital expenditures increased from $1.9 billion to $2.6 billion primarily due to higher construction spending at Walt Disney World Resort, Hong Kong Disneyland Resort and Disneyland Resort.
Depreciation expense was as follows (in millions):
Six Months Ended
April 2,
2016March 28,
2015Media Networks
Cable Networks $ 74 $ 75Broadcasting 45 47
Total Media Networks 119 122Parks and Resorts
Domestic 636 586International 170 174
Total Parks and Resorts 806 760Studio Entertainment 24 28Consumer Products & Interactive Media 30 33Corporate 124 122Total depreciation expense $ 1,103 $ 1,065

7
Non-GAAP Financial Measures
This earnings release presents EPS excluding the impact of certain items affecting comparability, free cash flow and aggregate segment operating income, all of which are important financial measures for the Company, but are not financial measures defined by GAAP.
These measures should be reviewed in conjunction with the relevant GAAP financial measures and are not presented as alternative measures of EPS, cash flow or net income as determined in accordance with GAAP. EPS excluding certain items affecting comparability, free cash flow and aggregate segment operating income as we have calculated them may not be comparable to similarly titled measures reported by other companies.
EPS excluding certain items affecting comparability – The Company uses EPS excluding certain items to evaluate the performance of the Company’s operations exclusive of certain items affecting comparability of results from period to period. The Company believes that information about EPS exclusive of these items is useful to investors, particularly where the impact of the excluded items is significant in relation to reported earnings, because the measure allows for comparability between periods of the operating performance of the Company’s business and allows investors to evaluate the impact of the excluded items separately from the impact of the operations of the business.
The following table reconciles reported EPS to EPS excluding certain items affecting comparability:
Quarter Ended Six Months Ended
April 2,
2016March 28,
2015 ChangeApril 2,
2016March 28,
2015 ChangeEPS as reported $ 1.30 $ 1.23 6 % $ 3.04 $ 2.50 22 %Exclude:
Vice Gain — — nm (0.13) — nmInfinity Charge 0.06 — nm 0.06 — nmRestructuring and
impairment charges(1) — — nm 0.03 — nmEPS excluding certain items
affecting comparability(2) $ 1.36 $ 1.23 11 % $ 3.00 $ 2.50 20 %
(1) Charges for the six month period totaled $81 million (pre-tax), driven by an investment impairment ($54 million pre-tax) and contract termination and severance costs ($27 million pre-tax) at our Media Networks segment.
(2) May not equal the sum of the rows due to rounding.
Free cash flow – The Company uses free cash flow (cash provided by operations less investments in parks, resorts and other property), among other measures, to evaluate the ability of its operations to generate cash that is available for purposes other than capital expenditures. Management believes that information about free cash flow provides investors with an important perspective on the cash available to service debt, make strategic acquisitions and investments and pay dividends or repurchase shares.
Aggregate segment operating income – The Company evaluates the performance of its operating segments based on segment operating income, and management uses aggregate segment operating income as a measure of the performance of operating businesses separate from non-operating factors. The Company believes that information about aggregate segment operating income assists investors by allowing them to evaluate changes in the operating results of the Company’s portfolio of businesses separate from non-operational factors that affect net income, thus providing separate insight into both operations and the other factors that affect reported results.

8
A reconciliation of segment operating income to net income is as follows (in millions):
Quarter Ended Six Months Ended
April 2,
2016March 28,
2015April 2,
2016March 28,
2015Segment operating income $ 3,822 $ 3,482 $ 8,089 $ 7,027Corporate and unallocated shared expenses (162) (170) (298) (295)Restructuring and impairment charges — — (81) —Interest income/(expense), net (67) 8 (91) (50)Vice Gain — — 332 —Infinity Charge(1) (147) — (147) —Income before income taxes 3,446 3,320 7,804 6,682Income taxes (1,170) (1,092) (2,618) (2,210)Net income $ 2,276 $ 2,228 $ 5,186 $ 4,472
(1) The Infinity Charge was primarily due to an inventory write-down. The charge also included severance and other asset impairments and was reported in "Cost of products" in the Condensed Consolidated Statement of Income.
CONFERENCE CALL INFORMATIONIn conjunction with this release, The Walt Disney Company will host a conference call today,
May 10, 2016, at 5:00 PM EDT/2:00 PM PDT via a live Webcast. To access the Webcast go to www.disney.com/investors. The discussion will be available via replay through May 24, 2016 at 7:00 PM EDT/4:00 PM PDT.

9
FORWARD-LOOKING STATEMENTS
Management believes certain statements in this earnings release may constitute “forward-looking statements” within the meaning of the Private Securities Litigation Reform Act of 1995. These statements are made on the basis of management’s views and assumptions regarding future events and business performance as of the time the statements are made. Management does not undertake any obligation to update these statements.
Actual results may differ materially from those expressed or implied. Such differences may result from actions taken by the Company, including restructuring or strategic initiatives (including capital investments or asset acquisitions or dispositions), as well as from developments beyond the Company’s control, including:
• changes in domestic and global economic conditions, competitive conditions and consumer preferences;
• adverse weather conditions or natural disasters;• health concerns;• international, political, or military developments; and• technological developments.
Such developments may affect travel and leisure businesses generally and may, among other things, affect:
• the performance of the Company’s theatrical and home entertainment releases;• the advertising market for broadcast and cable television programming;• expenses of providing medical and pension benefits;• demand for our products; and• performance of some or all company businesses either directly or through their impact on those
who distribute our products.
Additional factors are set forth in the Company’s Annual Report on Form 10-K for the year ended October 3, 2015 under Item 1A, “Risk Factors,” and subsequent reports.
10
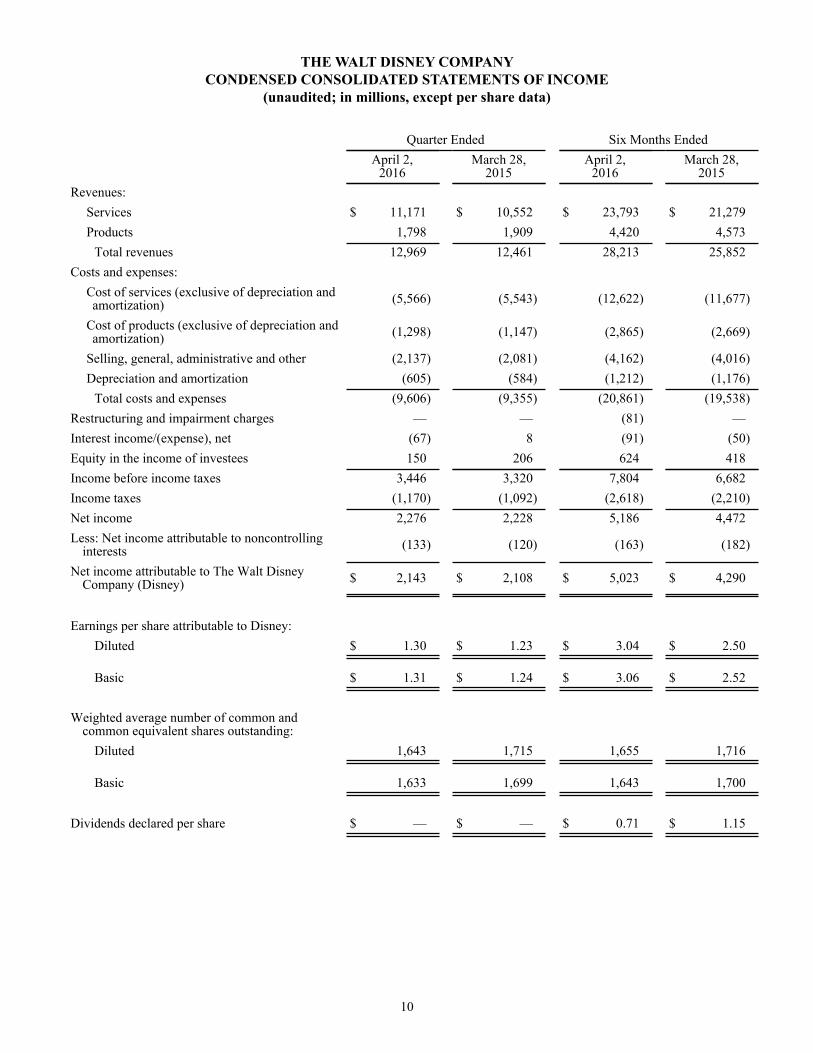
THE WALT DISNEY COMPANYCONDENSED CONSOLIDATED STATEMENTS OF INCOME
(unaudited; in millions, except per share data)
Quarter Ended Six Months Ended
April 2,
2016March 28,
2015April 2,
2016March 28,
2015Revenues:
Services $ 11,171 $ 10,552 $ 23,793 $ 21,279Products 1,798 1,909 4,420 4,573
Total revenues 12,969 12,461 28,213 25,852Costs and expenses:
Cost of services (exclusive of depreciation andamortization) (5,566) (5,543) (12,622) (11,677)
Cost of products (exclusive of depreciation andamortization) (1,298) (1,147) (2,865) (2,669)
Selling, general, administrative and other (2,137) (2,081) (4,162) (4,016)Depreciation and amortization (605) (584) (1,212) (1,176)
Total costs and expenses (9,606) (9,355) (20,861) (19,538)Restructuring and impairment charges — — (81) —Interest income/(expense), net (67) 8 (91) (50)Equity in the income of investees 150 206 624 418Income before income taxes 3,446 3,320 7,804 6,682Income taxes (1,170) (1,092) (2,618) (2,210)Net income 2,276 2,228 5,186 4,472Less: Net income attributable to noncontrolling
interests (133) (120) (163) (182)
Net income attributable to The Walt DisneyCompany (Disney) $ 2,143 $ 2,108 $ 5,023 $ 4,290
Earnings per share attributable to Disney:Diluted $ 1.30 $ 1.23 $ 3.04 $ 2.50
Basic $ 1.31 $ 1.24 $ 3.06 $ 2.52
Weighted average number of common andcommon equivalent shares outstanding:
Diluted 1,643 1,715 1,655 1,716
Basic 1,633 1,699 1,643 1,700
Dividends declared per share $ — $ — $ 0.71 $ 1.15

11
THE WALT DISNEY COMPANYCONDENSED CONSOLIDATED BALANCE SHEETS
(unaudited; in millions, except per share data)
April 2,2016
October 3,2015
ASSETSCurrent assets
Cash and cash equivalents $ 5,015 $ 4,269Receivables 8,874 8,019Inventories 1,352 1,571Television costs and advances 977 1,170Deferred income taxes — 767Other current assets 781 962
Total current assets 16,999 16,758Film and television costs 6,484 6,183Investments 3,247 2,643Parks, resorts and other property
Attractions, buildings and equipment 43,577 42,745Accumulated depreciation (25,857) (24,844)
17,720 17,901Projects in progress 7,454 6,028Land 1,247 1,250
26,421 25,179Intangible assets, net 7,052 7,172Goodwill 27,817 27,826Other assets 2,244 2,421
Total assets $ 90,264 $ 88,182
LIABILITIES AND EQUITYCurrent liabilities
Accounts payable and other accrued liabilities $ 7,252 $ 7,844Current portion of borrowings 5,755 4,563Unearned royalties and other advances 4,066 3,927
Total current liabilities 17,073 16,334
Borrowings 15,367 12,773Deferred income taxes 4,044 4,051Other long-term liabilities 5,770 6,369Commitments and contingenciesEquity
Preferred stock, $.01 par value, Authorized – 100 million shares, Issued – none — —Common stock, $.01 par value, Authorized – 4.6 billion shares, Issued – 2.9 billion shares at April 2, 2016 and 2.8 billion shares at October 3, 2015 35,448 35,122Retained earnings 62,870 59,028Accumulated other comprehensive loss (2,599) (2,421)
95,719 91,729Treasury stock, at cost, 1.2 billion shares (51,595) (47,204)
Total Disney Shareholders’ equity 44,124 44,525Noncontrolling interests 3,886 4,130
Total equity 48,010 48,655Total liabilities and equity $ 90,264 $ 88,182

12
THE WALT DISNEY COMPANYCONDENSED CONSOLIDATED STATEMENTS OF CASH FLOWS
(unaudited; in millions)
Six Months Ended
April 2,
2016March 28,
2015OPERATING ACTIVITIES
Net income $ 5,186 $ 4,472Depreciation and amortization 1,212 1,176Gains on sales of investments (27) (56)Deferred income taxes 797 202Equity in the income of investees (624) (418)Cash distributions received from equity investees 383 349Net change in film and television costs and advances 35 (33)Equity-based compensation 205 213Other 124 175Changes in operating assets and liabilities:
Receivables (542) (208)Inventories 218 129Other assets 63 (110)Accounts payable and other accrued liabilities (746) (847)Income taxes (522) (271)
Cash provided by operations 5,762 4,773
INVESTING ACTIVITIESInvestments in parks, resorts and other property (2,556) (1,905)Sales of investments 42 81Acquisitions (400) —Other (124) (3)Cash used in investing activities (3,038) (1,827)
FINANCING ACTIVITIESCommercial paper borrowings, net 709 1,954Borrowings 3,766 117Reduction of borrowings (626) (1,953)Dividends (1,168) (1,948)Repurchases of common stock (4,391) (1,788)Proceeds from exercise of stock options 160 235Contributions from noncontrolling interest holders — 829Other (431) 209Cash used in financing activities (1,981) (2,345)
Impact of exchange rates on cash and cash equivalents 3 (277)
Change in cash and cash equivalents 746 324Cash and cash equivalents, beginning of period 4,269 3,421Cash and cash equivalents, end of period $ 5,015 $ 3,745

13
Contacts:
Zenia MuchaCorporate Communications818-560-5300
Lowell SingerInvestor Relations818-560-6601