
Drought and the French Revolution: The effects of … and the French...Drought and the French...
25
1 Drought and the French Revolution: The effects of adverse weather conditions on peasant revolts in 1789 Maria Waldinger (London School of Economics) 1 This paper examines the role of adverse climatic conditions on political protest and institutional development. In particular, it assesses the role of adverse climate on the eve of the French Revolution on peasant uprisings in 1789. Historians have argued that crop failure in 1788 and cold weather in the winter of 1788/89 led to peasant revolts in various parts of France. To test this hypothesis, I construct a cross section data set with information on temperature in 1788 and 1789 and on the precise location of peasant revolts. Results show that adverse weather conditions significantly increased the likelihood of peasant uprisings, in particular in areas that depended especially on agriculture. 1. Introduction Recent research has shown that recessions may trigger revolutions because they decrease people’s opportunity costs of contesting power (Acemoglu and Robinson, 2001, 2006; Berger and Spoerer, 2001, for the European Revolutions in 1848; Brueckner and Ciccone, 2011, for regime change in Africa). People have “nothing to lose” and protest against the government, even if the recession’s causes are known to be exogenous and transitory (Burke and Leigh, 2010: 126, Acemoglu and Robinson, 2006). Protesters will uphold the threat of revolution until institutional changes ensure more redistributive policies in the future (Acemoglu and Robinson, 2006: 31f.) In 1788, on the eve of the French Revolution, a drought hit France and caused severe crop failure (Neumann 1977). By 1789, grain prices had increased steeply and common people 1 Contact: [email protected]
Transcript of Drought and the French Revolution: The effects of … and the French...Drought and the French...

1
Drought and the French Revolution:
The effects of adverse weather conditions on
peasant revolts in 1789
Maria Waldinger (London School of Economics)1
This paper examines the role of adverse climatic conditions on political
protest and institutional development. In particular, it assesses the role of
adverse climate on the eve of the French Revolution on peasant uprisings
in 1789. Historians have argued that crop failure in 1788 and cold
weather in the winter of 1788/89 led to peasant revolts in various parts of
France. To test this hypothesis, I construct a cross section data set with
information on temperature in 1788 and 1789 and on the precise location
of peasant revolts. Results show that adverse weather conditions
significantly increased the likelihood of peasant uprisings, in particular in
areas that depended especially on agriculture.
1. Introduction
Recent research has shown that recessions may trigger revolutions because they decrease
people’s opportunity costs of contesting power (Acemoglu and Robinson, 2001, 2006; Berger
and Spoerer, 2001, for the European Revolutions in 1848; Brueckner and Ciccone, 2011, for
regime change in Africa). People have “nothing to lose” and protest against the government,
even if the recession’s causes are known to be exogenous and transitory (Burke and Leigh,
2010: 126, Acemoglu and Robinson, 2006). Protesters will uphold the threat of revolution
until institutional changes ensure more redistributive policies in the future (Acemoglu and
Robinson, 2006: 31f.)
In 1788, on the eve of the French Revolution, a drought hit France and caused severe crop
failure (Neumann 1977). By 1789, grain prices had increased steeply and common people
1 Contact: [email protected]
2
spent 88 percent of their income on bread compared to 50 percent in normal times (Neelly
2008: 72f.). The dry and hot summer was followed by a particularly cold winter. Ice blocked
navigable rivers and prevented the transportation of cereals. Heating material became scarce
and expensive. Living costs soared. The share of famished people grew rapidly. “On the eve
of the Revolution, hunger was the great enemy for the majority of Frenchmen,” (Lefebvre
1973: 7). Famished peasants turned to protest and violence. Their anger was especially
directed against the feudal system that imposed heavy cash and labour obligations on the
common population and severely reduced their incomes (Lefebvre 1973: 118). After weeks
of persistent and violent protests, in August 1789, “[...] in an effort to appease the peasants
and to forestall further rural disorders, the National Assembly formally abolished the “feudal
regime,” including seigneurial rights,” (Merriman 2010: 447, Neely 2008: 80).
I use variation in climatic conditions in the summer of 1788 and in the winter of 1788/89 to
test whether economic downturn on the eve of the French Revolution triggered political
protest. To my knowledge, this study provides the first econometric test of the economic
origins of the French Revolution.
Economic theory predicts that adverse climatic conditions affect the likelihood of revolt if
adverse climatic conditions affect income (Acemoglu and Robinson, 2001, 2006). To test this
hypothesis, I construct a community level data set that contains information on the precise
locations of peasant revolts (Lefebvre 1973) and gridded data on temperatures in the summer
of 1788 and the winter of 1788/89 (Luterbacher et al. 2004). I digitise and geo-reference
information on the locations of peasant revolts, where they first broke out, which areas they
later spread to and which areas remained completely untouched.
Results indicate that a one degree increase in summer temperatures during the drought
summer 1788 significantly increased the likelihood of revolt by about 2.5 percentage points.
A one degree decrease in temperatures in the severe winter of 1788/89 significantly increased
the likelihood of revolt by about 2.7 percentage point. Temperature also affected the revolt’s
timing. Conditional on having a revolt, areas with higher summer temperatures in 1788 and
lower winter temperatures in 1788/89 experienced earlier uprisings. These results are robust
to the inclusion of county (département) level fixed effects.
I also show evidence that temperature affected the likelihood of peasant revolt through its
effect on peasant’s income as the effect of temperature on the likelihood of revolt was
significantly higher in areas with a higher share of agriculture.

3
In a placebo test I also investigate the effect of adverse conditions on revolt in manufacturing
areas. Adverse weather conditions should only affect income from agriculture but not from
manufacturing.2 Historians have documented that a crisis in the French manufacturing sector
in the 1780s added to the economic crisis (Lefebvre 1973: 12). My results indicate a positive
correlation between the share of manufacturing and the frequency of revolts which is
consistent with the crisis in manufacturing. Adverse weather conditions, however, did not
increase the likelihood of revolt in manufacturing areas. This suggests that the effect of
climate on the likelihood of revolt operates solely through its effect on the living conditions
of farmers.
Overall, the empirical results suggest that the mechanisms highlighted in theoretical models
on the economic origins of political protest, such as Acemoglu and Robinson (2001, 2006),
played an important role in the outbreak of peasant revolts across France during the French
Revolution. Adverse negative economic shocks in the form of adverse climatic conditions
decreased people’s incomes, especially income from agriculture. They decreased people’s
opportunity costs of contesting power and increased the incidences of political protests,
especially in areas with a high share of agriculture. Persistent violent peasant protests formed
a credible threat of revolution. In response to this threat feudal obligations and privileges of
the nobility, the fundamental characteristics of the ancient regime, were abolished.
This paper contributes to various strands of literature, especially to the literature on the effect
of negative economic shocks on political protest and subsequent institutional change. This
literature has shown that within country variation in climatic conditions Africa had positive
effects on the development of democratic institutions (see Brückner and Ciccone, 2011 for
sub-Saharan; Burke and Leigh, 2010, for a study on 150 countries). Analysing another
historical episode, Berger and Spoerer (2001) provide evidence that the European
Revolutions of 1848 were triggered by economic crisis and a shortfall in food supply. Others
have estimated the effects of climate on other political outcome variables, such as civil
conflict (Miguel et al., 2004; Hsiang et al. 2013), and historical uprisings in China (Jia, 2013).
A related strand of literature examines the effects of climatic events on economic growth
(Burgess et al., 2011 and Dell, Jones, and Olken, 2012), and agricultural output (Deschenes
and Greenstone 2007, 2012) and health (Barreca et al., 2012).
2 Burgess et al. (2011) show that adverse weather conditions in present-day India only affect income from
agriculture, not income from manufacturing.

4
This paper also contributes to the historical literature that assesses the role of climate as a
trigger of the French Revolution. Various historians have documented the relationship
between adverse climatic conditions and the outbreak of the French Revolution (Neumann,
1977; Dettwiller, 1990; Le Roy Ladurie, 1972; Fagan, 2000). To my knowledge, this paper is
the first to provide an econometric assessment of this hypothesis.
The paper proceeds as follows: Section 2 provides the theoretical and historical framework. I
describe the empirical strategy and data in section 3 I present results in section 4 and
conclude in section 5.
5
2. Theoretical and Historical Framework
In this paper, I test predictions of a theory on political transitions by Acemoglu and Robinson
(2001, 2006). In the model, a nondemocratic society consists of two groups, a small rich elite
and a large group of the poor and disenfranchised. The rich elite controls society and
possesses all de jure political power.
The poor and disenfranchised do not hold any de jure political power, but they are the
majority and hold de facto political power if they can solve the collective-action problem in a
moment when the elite is “unable to use the military to effectively suppress the uprising,”
(Acemoglu and Robinson, 2006: 25).
The disenfranchised population gains de facto political power if they overcome collective-
action problem and are able to “create significant social unrest and turbulence, or even pose a
serious revolutionary threat,” (Acemoglu and Robinson, 2006: 25).
The theory predicts that revolutions are more likely during times of economic crises, for
example after harvest failure (Acemoglu and Robinson, 2006: 31f.). During economic crises,
people’s opportunity costs. They have less to lose and are more likely to contest power. As a
result, economic recession increases the likelihood of uprisings even if the crisis’ causes are
known to be exogenous and transitory.
If the poor are able to overcome collective action problems and pose a credible revolutionary
threat that the elite is unable to suppress, then the elite has to make concessions to avoid costs
of revolution. The elite is likely to promise more redistributive policies in the future. Yet, the
poor are aware of the transitory nature of their revolutionary threat. They will not be able to
enforce such policies in the future, once their threat has passed. If possible, the poor will
uphold the revolutionary threat until institutional changes are made that will ensure more
redistributive policies in the future and are costly to reverse (Acemoglu and Robinson, 2006:
25f.).
2.1. The elite and the disenfranchised in French society in 1789
In French society in 1789 the rich, small elite consisted of the king, the nobility, and part of
the clergy. The formed the first two privileged estates and comprised about two percent of the
population. The vast majority of the population, about 98 percent of the population, consisted

6
of people with limited economic means (Neely, 2007: 7). Many of them had difficulties
reaching subsistence level (Lefebvre, 1973: 8). The part of society consisted of rural and
urban wage-labourers, free peasants, the urban bourgeoisie, craftsmen, and others.
The political power of the king and the first two estates was reflected in the highly
inequitable tax system. The king exempted the nobility and the church from most taxes while
imposing a crushing tax burden on the third estate that normally did not have enough power
to negotiate exemptions (Neely, 2008: 7). The third estate paid taxes to the king and had
feudal obligations in cash and labour towards their local landlord.
2.2. Collective action by the disenfranchised
In 18th
century France, the third estate formed the vast majority of the population, but did not
hold any de jure political power. Bread riots in larger towns sometimes led to state provision
of bread, but these riots were never coordinated and strong enough to enforce more profound
institutional changes. In the 1780s, however, a severe financial crisis occurred in France and
changed the balance of power. After decades of constant warfare and high military
expenditure the government had exhausted its resources. To raise further taxes the king was
compelled to convoke the Estates-General, an assembly of representatives of the first two
estates, the clergy and the nobility, and of the third estates, the common people (Merriman,
2010: 441). It was an opportunity for the third estate to coordinate and to unify their political
power. In preparation of the Estates-General, they had been asked by the king to
democratically elect representatives and list their requests in cahiers de doléances (Merriman,
2010: 443). Their representatives advocated these requests at the Estates-General in Paris
starting in May 1789.
2.3. The de facto political power of the disenfranchised vs. the elite’s military
force
The king was unable to simply suppress these requests because his military power had been
limited by the severe financial crisis. Parts of his troops defected in 1789 after not being paid
and joined popular protests. Meanwhile, people of the third estate demonstrated violently in

7
support of their representatives on the streets of Paris. When the population noticed an
increase in royal troops in mid-July 1789, they feared that the king intended to subdue their
representatives by force. In response, they stormed the Bastille (Neely, 2008: 66f). The
people of the third estate gained de facto political power through their representatives at the
Estates General in Paris and their own protests. They demanded in particular reform of the
highly inequitable tax system and the abolition of the feudal regime.
Since May 1789, after three months, the representatives in Paris had still not been able to
enforce changes in the feudal system that had been one of the main requests of the rural
population in the cahiers de doléances. The population of rural France was disappointed with
the slow progress. In July 1789, shortly after the fall of the Bastille, they organised armed
protests against their landlords and against the feudal obligations that they owed them. “’none
of them was moved by any motive other than that of the pillage and the licence which the
exaggeration of their so-called rights appeared to allow them: they seem to have gathered by
common consent with the intention of laying waste chateaux and houses and freeing
themselves from their rents by burning their charters [...]’,” (cited in Lefebvre, 1973: 118).
Their anger against the feudal system had been a concern of the rural population for a long
time. An immediate trigger of the peasant protests in July and August 1789 was the
population’s economic hardship that the drought of 1788 and the harsh winter of 1789 had
still exacerbated. Besides, rumours had spread that the aristocracy planned to exploit the fact
their economically difficult situation to make them give up on their political requests. The
rumour said that the aristocracy had sent out brigands to destroy the much needed harvest of
1789 to “[starve] the country people into submission,” (Merriman, 2010: 447). These
rumours quickly spread from one village to the next, via messengers, travellers, or official
circulars sent out by the authorities (Lefebvre, 1973: 14).
To defend themselves against increased number of brigands and the supposed aristocratic plot,
in July 1789, villages and rural towns in various parts of France started organising groups of
armed men. After the storming of the Bastille in July 1789, landowners’ estates were stormed
(Merriman, 2010: 438, 446).

8
2.4. Revolution during Recession
Historians have argued that peasant revolts in revolutionary France against the aristocracy
were spurred by severe economic crisis (e.g. Lefebvre, 1973; Merriman, 2010). Hot and dry
weather in the summer of 1788 had caused crop failure and especially cold weather in the
winter of 1788/89 further increased people’s survival costs. In normal years, people spent
about 50 percent of their income on bread. After the crop failure of 1788, the share rose to 88
percent in 1789 (Neely, 2008: 72f.). The number of famished people rose. The harsh winter
conditions of 1788/89 further increased food prices and living costs in general because
navigable rivers froze and prevented the transportation of cereals. Heating material also
became scarce and expensive. The situation was made worse by the peasants’ obligations and
the nobility’s rights that were enshrined in the feudal system. The peasants’ owed cash and
labour to their local landlords. The nobility’s exclusive rights to exploit forests, streams, and
lakes made it illegal for common people to augment their diets with fish and game and to
collect fire wood. (Merriman, 2010: 438). They were not even allowed to protect their fields
from deer or from the lord’s pigeons that trampled on their fields or fed on the seeds. Besides,
many nobles still held judiciary rights over peasants. Feudal obligations had always been a
heavy burden for the peasants but especially after the crop failure of 1788 and the harsh
conditions of the following winter.
2.5. Peasant Revolt and Institutional Reform
The king tried to calm the revolts by promising tax reform but insisted on feudal obligations
and privileges of the first estates. “To the radicalised members of the third estate, [these]
concessions were not enough,” (Merriman, 2010: 444).
In August 1789, after weeks of persistent and violent peasant revolts, all members of the
National Assembly, that comprised representatives of the nobility, the clergy, and the third
estate, were concerned about the situation and wished to re-establish public order. Many
sympathised with the peasants’ request to abolish feudal obligations and nobles’ privileges.
But even the privileged members of the assembly who did not sympathise with the peasants
requests’ were willing to make concessions in order to end the revolts because many of them

9
owned property that the peasants were attacking (Neely, 2008: 80). The persistent revolts and
the scale of the violence had shown the peasants’ ability to organise resistance and to do
lasting damage. “On August 4, 1789, in an effort to appease the peasants and to forestall
further rural disorders, the National Assembly formally abolished the “feudal regime,”
including seigneurial rights,” (Merriman, 2010: 447). In particular, personal labour and cash
obligations were eliminated. Afterwards, the freedom of worship, the nobles’ judiciary rights,
and their exclusive right to hunt were also eliminated. Provinces and cities also had to give up
privileges. “The members of the National Assembly thus renounced privilege, the
fundamental organizing principle of French society,” (Merriman, 2010; 447).
3. Empirical Strategy and Data
3.1. Data Description
The basic dataset is a cross section of 3596 cantons. They cover the entire territory of
mainland France in 1789. The canton is a territorial subdivision of the French state, one level
above the communes, the lowest administrative division. The main components of the data
set are the geographic locations of rural uprisings in 1789 and gridded temperature data for
the summer of 1788 and the winter of 1788/89.
I collected information on the locations of rural uprisings in 1789 from Lefebvre (1973: 4). I
digitised a map of all localities in France that had rural revolts in the summer of the French
Revolution. I also collected information on the starting points of revolts and their gradual
spread to other localities. I define two variables that describe the likelihood of revolt and the
timing of revolt. The main outcome variable is a dummy variable that is 1 if an uprising took
place in a canton and 0 otherwise. I also define the variable revolt delay as a number between
0 and 20. This number indicates how many steps lie between a canton’s peasant revolt and
the original uprising. I assign a value of 0 to the localities of the original uprising. I assign a
value of 1 if an arrow directly connects a locality to an original uprising, a value of 2 if an
arrow is connected to an original uprising via one other locality and so forth.
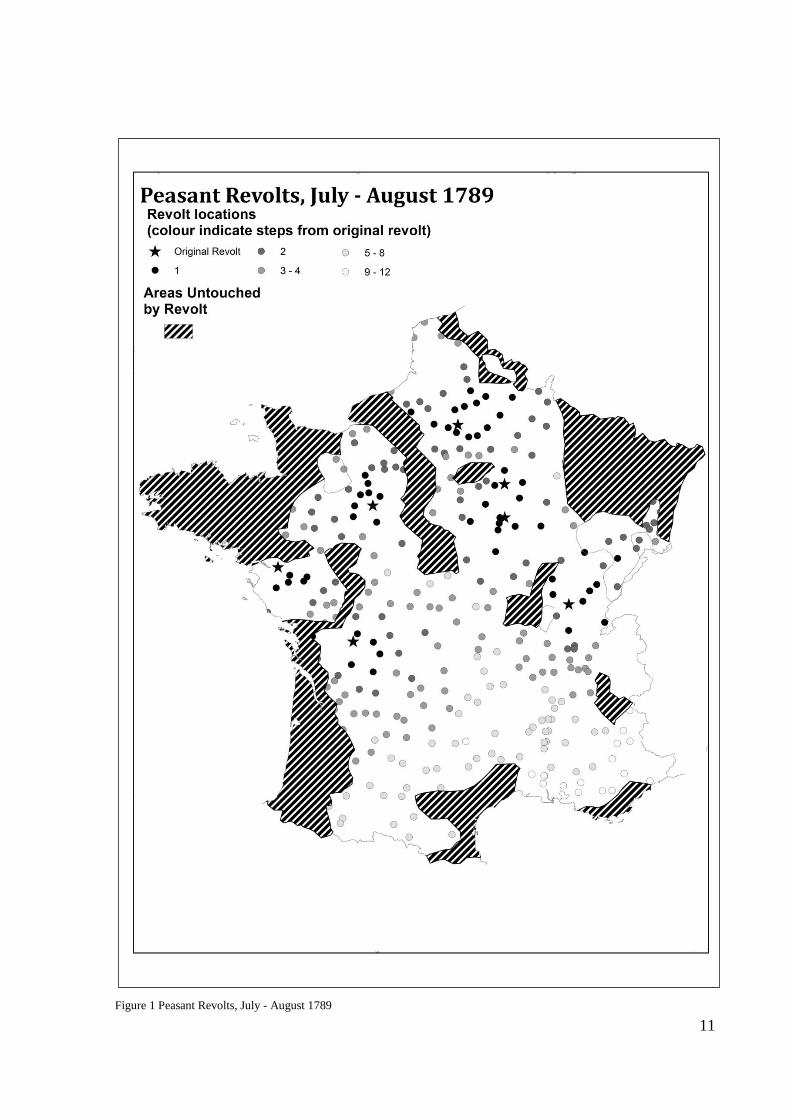
The map below shows the distribution of localities with uprisings across France. The star
symbols represent localities where the first original uprisings broke out. Colours indicate an
uprising’s timing compared to the original uprisings.

10
Information on temperature in 1788/89 is taken from Luterbacher et al. (2004). The data is
reconstructed seasonal and gridded temperature. It provides yearly ‘temperature maps’ that
show variation within France for grid cells of about 50 by 50 kilometres. For this data set,
climatologists have reconstructed temperatures based on proxy indicators such as tree ring
series and ice cores and based on historical records. For the years 1788/89, directly measured
monthly temperature from ten weather stations in France is available (Garnier, 1974).
Summer temperature 1788 is the average temperature in the months June, July, and August of
the year 1788. Winter temperature 1789 is the average temperature in the months December
1788, January 1789, and February 1789.
I also collected information on population density in 1789, the routes of communication in
1789, on salt tax rates in 1789, the share of the labour force that works in agriculture in 1789
and the share of the population that works in manufacturing in 1789. I digitised these data
and assign to each canton the value of the area that applies to the largest part of the canton.
Information on population density in 1789 (Clout, 1977: 217) is provided in the unit
‘population density per square league’. It is provided in seven categories: below 500
inhabitants per square league, between 500 and 750 inhabitants per square league, between
750 and 1000 inhabitants per square league, and so forth, until above 1750 inhabitants per
square league.
Information on the routes of communication in 1789 (Bonin et al., 1987: 15) is available for
four categories: postal routes, navigable rivers, canals, and other important routes. I digitise
the map and assign to each canton the routes that intersect it. I create a variable that counts
the number of routes that intersects a canton.
I obtain information on the salt tax rate in 1789 from Shepherd (1926). Tax rates varied
substantially across provinces within France in 1789. The highest tax rate applied to the
northern centre of France. Other provinces, such as Brittany, were exempt from tax rate.
These tax rates are reflected in the salt prices that are about thirty times higher in northern
central France compared to Brittany.
11
Figure 1 Peasant Revolts, July - August 1789

12
I collect data on the share of the labour force that works in agriculture in 1789 from Planhol
(1994: 157f.) is provided in five categories. The lowest category is assigned to areas where
less than 43.4% of men are employed in agriculture. The next category is assigned to areas
where between 43.4 and 51.57% of men are employed in agriculture. Each higher category is
assigned to areas with an increase in the share by about 10 percentage points. The highest
categories assigned to areas with more than 72.85% of men working in agriculture.
The share of the population that works in industry in 1789 (Planhol, 1994: 157f.) comprises
workers in the manufacturing of leather, wood, iron and other metals. These categories range
from the lowest (under 11.88%) to the highest (over 21.74%) with three categories in
between (11.88-15.39%, 15.40-18.29%, and 18.3-21.74%)
In my dataset, I create variables for population density, share of workers in agriculture, and
share of workers in manufacturing. The average of the highest and lowest value of the
relevant category is assigned to the canton.
Table 1 Summary Statistics
Cantons with
uprisings Cantons without
uprisings Untouched areas
Number 298 3,298 1317
Population density 1115 1147 1184
Share of Labour Force
in Agriculture 0.52 0.48 0.48
Share of Labour Force
in Industry 0.10 0.11 0.11
Share of canton in
heavily taxed area 0.41 0.36 0.27
canton area 4.26 3.95 3.95
distance to
communication routes 2.45 2.13 1.73
Table 11 shows summary statistics for cantons with and without uprisings, and for cantons in
areas that Lefebvre (1973: 4) described as completely untouched (see page 53 for a map). It
shows that cantons with uprisings that population density in cantons with uprisings is lower
than in cantons without uprisings. The share of labour force in agriculture is slightly higher
and the share of labour force in manufacturing is slightly lower. 41 percent of cantons with
uprisings lie in areas with especially high taxes compared to 36 percent of cantons without

13
uprisings. Distance to communication routes is slightly larger than in the other cantons. In
sum, the table shows some but rather small differences between cantons with and without
uprisings.
3.2. Empirical Strategy
In this paper, I test the theory’s prediction that uprisings are more likely to occur during
economic downturn. The model predicts that areas with worse economic conditions are more
likely to experience uprisings. Economic conditions in France in 1789 were affected by the
drought in the summer of 1788 and by the cold winter of 1788/89. The theory’s prediction in
this case is that areas with especially hot temperatures during the summer of 1788 and with
especially cold temperatures during the winter of 1788/89 are more likely to experience
uprisings.
To investigate this hypothesis, I use cross-section data set for 3596 French cantons (see
section 3.1 for a detailed description). It contains information on the locations of peasant
uprising in the summer of 1789, on mean temperature in the summer of 1788, and on mean
temperature in the winter of 1788/89. I test whether uprisings were more likely in areas with
especially high summer temperature in 1788 and especially low winter temperature 1788/89.
I propose the following regression specification:
(1) PeasantRevoltcr = α + β SummerTemp1788cr + γ WinterTemp1789cr + fr + εcr
PeasantRevoltcr is a dummy variable that is 1 if canton c in region r has experienced peasant
revolt during the French Revolution. SummerTemp1788cr is the mean temperature in canton c
and region r during the months June, July, and August in 1788. WinterTemp1789cr is the
mean temperature in canton c and department r during the months December 1788, January
1789, and February 1789. fr is a full set of region fixed effects; and εcr is the error term.
Standard errors are adjusted for 94 clusters at the department level.
The main coefficients of interest are β and γ. β captures the effect of a one degree increase in
summer temperature on the likelihood that a canton experiences peasant revolt. γ captures the
effect of a one degree increase in winter temperature on the likelihood that a canton
14
experience peasant revolt. Both coefficients are estimated based on variation in temperature
and peasant revolt within each region. In other words, they estimate whether a canton with
different summer and winter temperatures compared to the other cantons in the same region
also has a different likelihood of experiencing peasant revolt. The main prediction of the
model is that β should be positive and that γ should be negative.
4. Empirical Results
4.1. Basic Specifications
Table 2 contains basic results. I estimate the baseline regression without region fixed effects
in column 1, with region fixed effects in column 2, and with department fixed effects in
column 3. Results in column 1 of Table 2 show that the coefficient β on SummerTemp1788cr
is positive and significant at the ten percent level. The coefficient γ on WinterTemp1789cr is
negative and significant at the five percent level. This is consistent with the model’s
prediction. It indicates that cantons with higher temperatures during the summer 1788 and
with lower temperatures during the winter of 1788/89 are more likely to have peasant revolts.
The specification in column 1 estimates the relationship between temperature and peasant
revolt based on variation in both variables within all of France. One might be concerned that
areas in France with relatively extreme temperatures share certain characteristics that also
affect the likelihood of revolt. If areas with extreme temperature are on average worse off
than areas with more moderate temperature these results could reflect that particularly poor
areas were more likely to revolt. In the following column, I therefore introduce region fixed
effects and estimate specification (1).
Column 2 shows results. This time, region fixed effects control for unobserved regional
characteristics that may affect temperature’s effect on the outbreak of peasant revolt. They
capture, for example, the effects of any geographic, political, or economic characteristics that
cantons within one region share. The main coefficients of interest β and γ are estimated based
on variation in temperature and peasant revolt within each region. In other words, they
estimate whether a canton with different summer and winter temperatures compared to the
other cantons in the same region has a different likelihood to experience peasant revolt.

15
The main coefficients of interest β and γ are about three times larger as in the previous
estimation. Both are significant at the one percent level. This result indicates that cantons
with higher summer temperature 1788 and lower winter temperature 1789 are more likely to
experience peasant revolt than the other cantons in their region.
Table 2 Peasant Revolts and Extreme Temperatures – Basic Results
Likelihood of Peasant Revolt Revolt Delay
(1) (2) (3) (4) (5) (6) (7)
Summer
Temperature 0.00762* 0.0245*** 0.0474*** -0.107 -0.439*** -0.790*** -0.885*
(0.00451) (0.00857) (0.0139) (0.0719) (0.145) (0.222) (0.450)
Winter
Temperature -0.00709** -0.0271*** -0.0491*** 0.121** 0.454*** 0.777*** 0.727*
(0.00345) (0.00760) (0.0140) (0.0592) (0.132) (0.221) (0.416)
Sample All All All All All All Revolt
towns
only
Region Fixed
Effects
yes
yes
Department
Fixed Effects
yes
yes yes
Observations 3,596 3,596 3,596 3,596 3,596 3,596 298
R-squared 0.003 0.024 0.102 0.002 0.027 0.103 0.971
Robust standard errors in parentheses, clustered at department level
*** p<0.01, ** p<0.05, * p<0.1
In column 3, I estimate the baseline specification but replace region fixed effects with
department fixed effects. The department fixed effects control for all department level
characteristics that affect the likelihood of revolt and are correlated with temperature. Results
could be biased if a department within a region has a certain economic structure because of
its climatic conditions and also experiences more peasant revolt because of this economic
structure. I therefore introduce department fixed effects into the regression.
16
Column 3 of Table 2 shows that the coefficient on summer temperature remains positive and
highly significant. The coefficient on winter temperature also remains negative and highly
significant. These results indicate a significant effect of temperature on peasant uprisings
even when only taking into account variation in temperatures and uprisings within each
department.
In columns 4 to 7, I use an alternative outcome variable to indicate revolt delay. Revolt delay
is an indicator of revolt timing. It is a number between 0 and 20. The higher the value the
longer it took a revolt to break out compared to the first revolt. The value 20 is assigned to
cantons that were untouched by revolt. The value is assigned based on information on revolt
delay from Lefebvre (1973: 4) that provides detailed information on the spread of revolt
across France.
Results in column 4 to 6 indicate that higher summer temperature in 1788 and lower winter
temperature 1789 decreased a canton’s delay in joining the revolts. The higher summer
temperature and the lower winter temperature the sooner revolt broke out.
One might be concerned that these results are driven by certain systematic differences
between towns that revolted and the others that did not. To investigate this concern I limit the
sample in column 7 to those towns that were affected by peasant revolts. Results show that,
conditional on having a revolt, summer and winter temperature affected a town’s revolt delay.
4.2. Augmented Specifications
In this section, I introduce further controls to specification (1). Column 1 of Table 3 is the
estimate of the baseline regression equation (1) and identical to column 2 of Table 2. In
column 2 and 3, I add the control variables population density and canton area to the equation.
In preindustrial times, population density is a useful proxy for an area’s affluence. It is also
important to control for a canton’s area. It is thinkable that larger cantons are located in more
agricultural areas with lower population density. Columns 2 and 3 of Table 3 show that the
control variables hardly change the coefficients.
News availability, it has been argued, was pivotal to the spread of uprisings to other areas.
The historian Georges Lefebvre (1973) argues that the fear of an aristocratic plot broke out in
seven points across France and then spread from there to other localities. Lefebvre suggest

17
Table 3 Peasant Revolts and Extreme Temperatures – Augmented Specifications
Likelihood of Peasant Revolt
(1) (2) (3) (4) (5)
Summer Temperature 0.0245*** 0.0242*** 0.0249*** 0.0188** 0.0188**
(0.00857) (0.00869) (0.00868) (0.00848) (0.00871)
Winter Temperature -0.0271*** -0.0269*** -0.0268*** -0.0234*** -0.0231***
(0.00760) (0.00770) (0.00766) (0.00764) (0.00768)
News Availability
0.0263*** 0.0263***
(0.00493) (0.00494)
Heavy Tax
0.0635
(0.182)
Heavy Tax*Summer
Temperature
-0.0115
(0.0109)
Heavy Tax*Winter
Temperature
-0.00220
(0.0100)
Region Fixed Effects yes yes yes yes yes Population Density
yes yes yes yes
Canton Area
yes yes yes
Observations 3,596 3,596 3,596 3,596 3,596
R-squared 0.024 0.024 0.026 0.036 0.036
Robust standard errors in parentheses, clustered at department level
*** p<0.01, ** p<0.05, * p<0.1
that messengers were sent out to warn other communities, that travellers transmitted the
rumours on their journey and that the postal service distributed warnings of an
aristocratic plot to other regions (Lefebvre, 1973: 150-152). To test this hypothesis, I add
the variable News Availability to the specification. It is defined as the number of news
18
routes that intersected a canton in 1789. News routes include postal routes, navigable
rivers, canals, or other important routes like well-paved roads. Results in column 4 of
Table 3 show a highly significant positive relationship between news routes and peasant
uprisings. This corroborates Lefebvre’s hypothesis that peasant revolts spread through
France via news routes. At the same time, News Availability is also an important control
variable for a place’s economic situation. Relatively affluent areas are likely to be better
connected than relatively poor areas. Results show that adding this control variable
hardly affects the estimated effects of summer and winter temperature on peasant
uprisings. Both coefficients remain highly statistically significant with only a slight
decrease in size.
As mentioned before, the high tax burden was a main concern of the protesting French
people. In column 5, I add a dummy variable to the equation that is 1 for all cantons with
the highest tax rates. This tax rate was around 30 times as high as the lowest tax rate and
around double the rate of the second highest tax rate. The theory predicts that cantons
with especially high taxation were more likely to revolt than cantons with lower taxation.
Column 5 shows a positive relationship between being in the highest salt tax class and
experiencing revolt, but it is not significant. The coefficient on the interactions of being
in the highest salt tax class and the temperature variables are both negative and not
significant. This may indicate that high taxes did not spur revolt. It could also be the case
that the effect of taxes, that were determined at the regional level, on revolt are already
captured by the region fixed effect. The main coefficients of summer and winter
temperature hardly change.
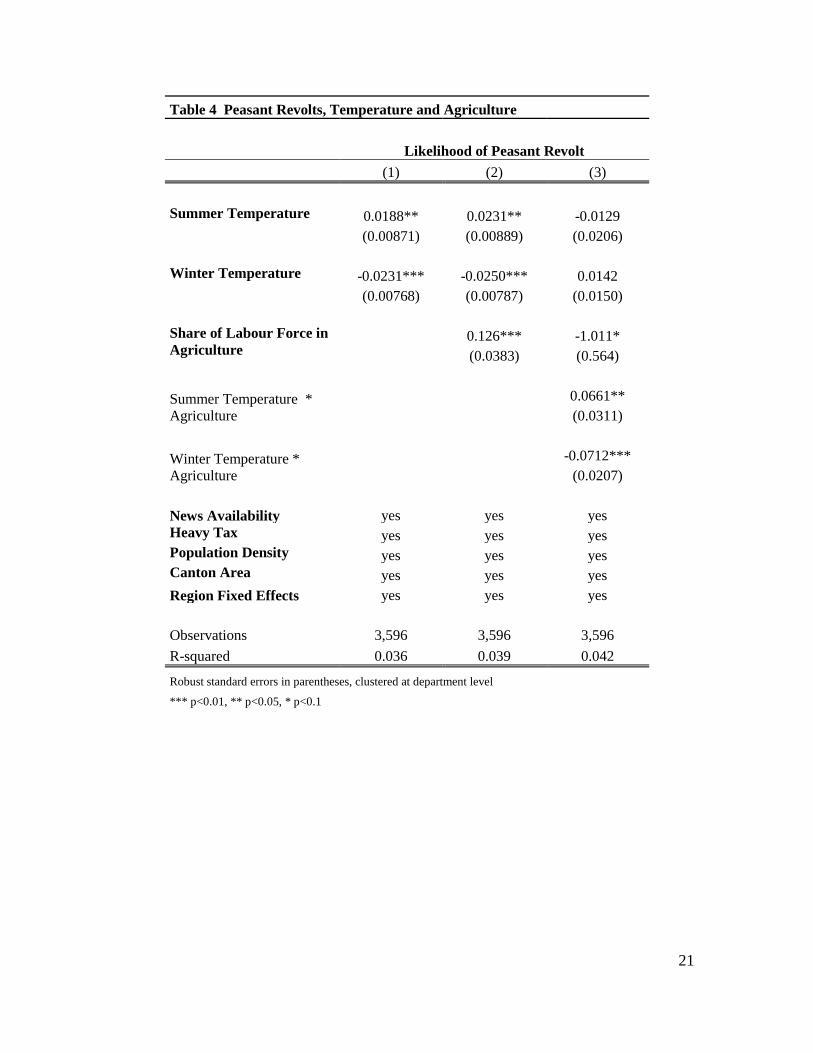
4.3. Temperature, Peasant Revolt, and Different Economic Sectors
In the following, I examine heterogeneity in the effect of temperature on peasant
uprisings in different economic sectors. I start by investigating the relationship between
the share of the labour force that works in agriculture in 1789 and the likelihood of
peasant uprisings. Results in column 2 of Table 4 show a positive and significant
relationship between the share of the labour force in agriculture and peasant uprisings.

19
Areas with a higher share of workers in agriculture had on average more peasant
uprisings.
In column 3, I investigate whether the effect of temperature on peasant revolts is different
in areas where the share of the labour force in agriculture is higher. I introduce two
interaction terms: an interaction term of summer temperature and the share of the labour
force that works in agriculture and an interaction term of winter temperature and the
share of the labour force that work in agriculture. Column 3 shows results. Interestingly,
results change substantially with the introduction of these interaction terms. The main
coefficients on summer temperature, winter temperature and the share of the labour force
in agriculture become much smaller and insignificant while the coefficients on the
interaction terms are significant and higher than the estimated coefficients on the summer
and winter temperature variables in Table 2. The coefficients on the first interaction term
indicates that the effect of a one degree increase in summer temperature in areas with a
high share of labour force in agriculture is significantly higher compared to the effect of a
one degree increase in summer temperature in non-agricultural areas. The effect of a one
degree increase in summer temperature on the likelihood of peasant revolts in non-
agricultural areas is close to zero and insignificant. The coefficient on the second
interaction term indicates that the effect of a one degree increase in winter temperature is
significantly lower in agricultural areas compared to non-agricultural areas. In other
words, a decrease in winter temperature increases the likelihood of peasant revolt in
agricultural areas but not in non-agricultural areas.
Finally, I investigate the relationship between the share of the labour force that works in
manufacturing and peasant revolt. As described in the previous section, the French
manufacturing sector was hit by a crisis in the years after 1786 because it was
outcompeted by English manufacturing imports. As a result, unemployment in
manufacturing rose steeply and decreased people’s incomes. The theory predicts a
positive relationship between the share of the manufacturing sector and peasant
revolution because cantons with a high share of workers in manufacturing were
especially affected by the crisis in manufacturing. One would not expect a significant
relationship between manufacturing and temperatures because this sector’s productivity
and income depends very little on weather conditions (see e.g. Burgess et al., 2011).

20
Column 2 shows a relatively high coefficient on the share of manufacturing that is
significant at the ten percent level. The sign of the coefficient on the interaction of
manufacturing and summer temperature is negative, indicating that adverse climatic
conditions, i.e. higher summer temperature and lower winter temperature, have not
increased the likelihood of revolt in manufacturing areas.
21
Table 4 Peasant Revolts, Temperature and Agriculture
Likelihood of Peasant Revolt
(1) (2) (3)
Summer Temperature 0.0188** 0.0231** -0.0129
(0.00871) (0.00889) (0.0206)
Winter Temperature -0.0231*** -0.0250*** 0.0142
(0.00768) (0.00787) (0.0150)
Share of Labour Force in
Agriculture 0.126*** -1.011*
(0.0383) (0.564)
Summer Temperature *
Agriculture 0.0661**
(0.0311)
Winter Temperature *
Agriculture -0.0712***
(0.0207)
News Availability yes yes yes Heavy Tax yes yes yes Population Density yes yes yes Canton Area yes yes yes
Region Fixed Effects yes yes yes
Observations 3,596 3,596 3,596
R-squared 0.036 0.039 0.042
Robust standard errors in parentheses, clustered at department level
*** p<0.01, ** p<0.05, * p<0.1

22
Table 5 Peasant Revolts, Temperature and Manufacturing
Likelihood of Peasant Revolt
(1) (2)
Summer Temperature -0.0129 0.0150
(0.0206) (0.0242)
Winter Temperature 0.0142 0.0105
(0.0150) (0.0209)
Share of Labour Force in Agriculture -1.011* -0.713
(0.564) (0.539)
Summer Temperature * Agriculture 0.0661** 0.0507*
(0.0311) (0.0297)
Winter Temperature * Agriculture -0.0712*** -0.0688***
(0.0207) (0.0227)
Share of Labour Force in Manufacturing
4.356*
(2.374)
Summer Temperature * Manufacturing
-0.236*
(0.134)
Winter Temperature * Manufacturing
0.0149
(0.0962)
News Availability yes yes Heavy Tax yes yes Population Density yes yes Canton Area yes yes
Region Fixed Effects yes yes
Observations 3,596 3,596
R-squared 0.042 0.044
Robust standard errors in parentheses, clustered at department level
*** p<0.01, ** p<0.05, * p<0.1

23
5. Conclusion
In the summer of 1788, a year before the French Revolution, severe drought led to crop
failure. Crop failure was followed by peasant uprisings that finally led to the abolishment
of the French feudal system in the summer of 1789. In this paper, I use variation in
climatic conditions in 1788 to test whether economic hardship, even when its causes are
known to be transitory and exogenous, may lead to long term institutional improvements
by spurring political protest. I show that adverse climatic conditions in the year preceding
the French Revolution had a significant effect on peasant uprisings, especially in areas
with a high share of the labour force working in agriculture. Besides the likelihood of
uprising, climatic conditions also affected its timing.

24
Bibliography
Acemoglu, D. and J. Robinson. 2001. A Theory of Political Transitions. American
Economic Review 91: 938-963.
Berger, H. and M. Spoerer. 2001. Economic Crises and the European Revolutions of
1848. Journal of Economic History 61(2): 293-326.
Bonin, S. and C. Langlois. 1987. Atlas de la Révolution française, Nr. 1, Routes et
communications. Paris: cole des autes tudes en ciences ociales, 1987
Brückner, M. and A. Ciccone. 2011. Rain and the Democratic Window of Opportunity.
Econometrica (79), 3: 923-947.
Clout, Hugh D. 1977. Themes in the Historical Geography of France. London: Academic
Press.
Fagan, Brian. 2000. The Little Ice Age: how climate made history, 1300-1850. Basic
Books: New York.
Garnier, M. 1974. Longues Séries de Mesures de Précipitations en France. Zone 1, Zone
2, Zone 3, Zone 4. Mémorial de la Météorologie Nationale, No. 53, Fascicules No. 1, No.
2, No. 3, No. 4. Paris: Météorologie Nationale.
Le Roy Ladurie, Emmanuel. 1972. Times of Feast, Times of Famine: A history of climate
since the year 1000. London: George Allen & Unwin Ltd.
Lefebvre, Georges. 1973. The Great Fear of 1789 – Rural Panic in Revolutionary France.
London: NLB.
Luterbacher, J., D. Dietrich, E. Xoplaki, M. Grosjean, and H. Wanner. 2004. European
seasonal and annual temperature variability, trends, and extremes since 1500, Science
303, 1499-1503.
Merriman, John. 2010. A History of Modern Europe: from the Renaissance to the present.
New York and London: W. W. Norton & Company.
Neely, Sylvia. 2008. A Concise History of the French Revolution. Plymouth: Rowman &
Littlefield Publishers.
Neumann, J. 1977. Great historical events that were significantly affected by the weather:
2, The year leading to the Revolution of 1789 in France. Bull. Amer. Meteor. Soc. 58:
163-167.

25
Planhol, Xavier de, Claval, Paul and Janet Lloyd. 1994. An historical geography of
France. Cambridge: Cambridge University Press.
Shepherd, William R. 1926. Historical Atlas. Holt: New York.
Weeks, Benjamin and I. Edward Alcamo. 2007. Microbes and Society. Jones and Bartlett
Publishers.