Non-Revenue Water (NRW) and Cost Recovery in Urban · PDF file1 Non-Revenue Water (NRW) and...
31
1 Non-Revenue Water (NRW) and Cost Recovery in Urban India: Case of Bangalore Maitreyee Mukherjee a Namrata Chindarkar b Jenny Grönwall c a Corresponding Author: Institute of Water Policy, National University of Singapore, 469C Bukit Timah Road, Singapore 259772; Email: [email protected] b Lee Kuan Yew School of Public Policy, National University of Singapore, 469C Bukit Timah Road, Singapore 259772 c Stockholm International Water Institute, Linnégatan 87A, Box 101 87, 100 55 Stockholm, Sweden ABSTRACT This paper examines the issue of non-revenue water (NRW) in urban India taking the city of Bangalore as a case study. Using empirical evidence from a survey conducted among 601 low- income households in Bangalore, we investigate the major sources of NRW for water utilities and propose policy recommendations based on the analysis. Our key finding is that public stand posts and public wells, which supply free water, are a non-trivial source of NRW. In addition, we find that revenue generation from metered tap connections is sub-optimal. Further, we observe potential revenue being shifted away from the public water utilities towards private providers as several households pay for water obtained from neighbors, tankers, or other private sources. Drawing upon our findings, we propose a new tariff structure for urban water utilities to consider. We also review the implementation of pre-payment metering (PPM) for public stand posts in other developing countries and its feasibility in Bangalore. Key words | Increasing block tariff; Non-revenue water; Pre-payment metering; Urban water; Volumetric pricing
Transcript of Non-Revenue Water (NRW) and Cost Recovery in Urban · PDF file1 Non-Revenue Water (NRW) and...

1
Non-Revenue Water (NRW) and Cost Recovery in Urban India: Case of Bangalore
Maitreyee Mukherjeea
Namrata Chindarkarb
Jenny Grönwallc
aCorresponding Author: Institute of Water Policy, National University of Singapore, 469C Bukit
Timah Road, Singapore 259772; Email: [email protected]
bLee Kuan Yew School of Public Policy, National University of Singapore, 469C Bukit Timah
Road, Singapore 259772
cStockholm International Water Institute, Linnégatan 87A, Box 101 87, 100 55 Stockholm,
Sweden
ABSTRACT
This paper examines the issue of non-revenue water (NRW) in urban India taking the city of
Bangalore as a case study. Using empirical evidence from a survey conducted among 601 low-
income households in Bangalore, we investigate the major sources of NRW for water utilities
and propose policy recommendations based on the analysis. Our key finding is that public stand
posts and public wells, which supply free water, are a non-trivial source of NRW. In addition, we
find that revenue generation from metered tap connections is sub-optimal. Further, we observe
potential revenue being shifted away from the public water utilities towards private providers as
several households pay for water obtained from neighbors, tankers, or other private sources.
Drawing upon our findings, we propose a new tariff structure for urban water utilities to
consider. We also review the implementation of pre-payment metering (PPM) for public stand
posts in other developing countries and its feasibility in Bangalore.
Key words | Increasing block tariff; Non-revenue water; Pre-payment metering; Urban water;
Volumetric pricing
2
1. INTRODUCTION
The Planning Commission of India (2012) estimates that the country’s urban population
comprising 380 million people (as per 2011 census) is predicted to increase to 600 million by
2030. Rapid urbanization in India has been accompanied with severe resource constraints,
especially water. This poses a tough challenge for policymakers. While water demand
management has been at the core of most urban policy discussions, an issue that has not been
sufficiently addressed is that of non-revenue water (NRW). Formally, NRW is the ‘difference
between the volume of water put in the distribution system and the volume that is ultimately
billed to consumers’ (Kingdom et al., 2006). It comprises of real and apparent losses to the water
utilities. Real losses are caused by poor infrastructure, which results in losses from the raw water
source to the final consumer. Apparent losses on the other hand are associated with inadequate
metering, incompetent tariff structure, and unauthorized consumption (Alegre et al., 2000;
Frauendorfer et al., 2010).
In developing countries such as India, NRW is associated with ageing infrastructure, apparent
losses, and corruption (Gonzalez-Gomez et al., 2011). It is argued that poor management
capacity and weak institutions augment the losses for water utilities in these countries. Reducing
NRW requires skilled staff such as engineers and a crew of plumbers as well as managers with
autonomy and decision-making ability (Kingdom et al., 2006). Often, the decisions that need to
be made are politically unfavorable such as disconnecting unauthorized connections in urban
slums, which in India form critical vote banks. Moreover, it is argued that the water utilities are
particularly prone to corruption and political manipulation. As water utilities in India are
monopolistic government agencies, they suffer from problems of non-transparency and imperfect
information (Elshorst & O’Leary, 2005).
A further issue pertaining to NRW in urban India is that of tariff structure and cost recovery. The
main sources of revenue for water utilities are water taxes that are based on property values and
water user charges that are based on volumetric consumption (Singh et al., 2005). A study by the
World Bank and the National Institute of Urban Affairs (NIUA) found that of 260 cities and
towns surveyed in India, 36% implemented the fixed rate per household per month tariff
structure, which was the highest proportion. Only 6% implemented increasing block tariff (IBT),
3
while only 2% implemented a combination of fixed rate and IBT (NIUA, 2001). In addition,
pricing or optimal tariff rate is also an issue. The NIUA study found that tariff structures set in
most cities do not reflect actual costs incurred. The average operating and maintenance (O&M)
cost in metropolitan cities is INR 15/m3. However, the typical water user charge is between INR
1.50 - 2.00/m3.1 The figures highlight the inefficient tariff structure and low cost recovery by
water utilities in urban India.
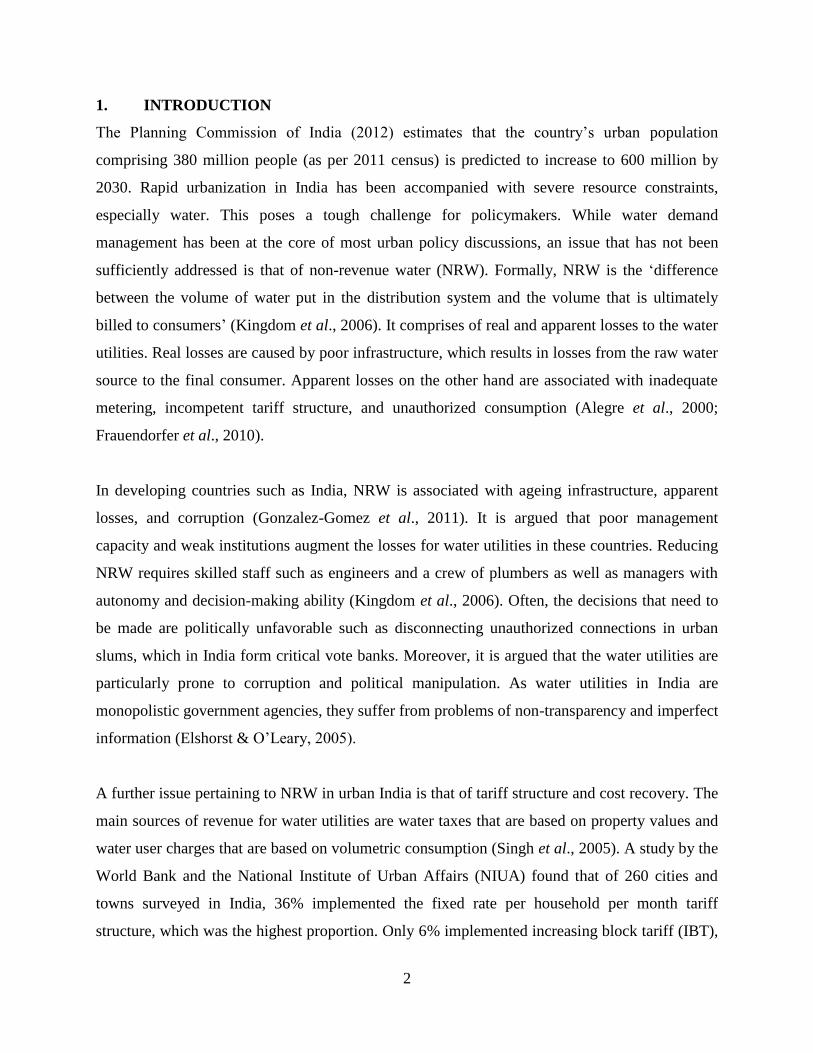
Even though the problem of NRW in urban India is acknowledged by policymakers, a significant
gap is the lack of empirical evidence at the household-level on the extent of NRW due to
apparent losses. In this paper, we aim to address this gap using the case study of Bangalore.
Using a household survey conducted by the Institute of Water Policy (IWP), National University
of Singapore in the urban slums of Bangalore in 2012-13 we examine whether public stand posts
and public wells are notable sources of NRW. We also assess whether water utilities are losing
revenue due to insufficient metering. To delve into other plausible reasons for NRW, we
examine whether revenue is being shifted away from water utilities towards private providers,
due to the poor quality or absence of supply.
The survey consists of a sample of 601 households in six wards. It focused only on households
residing in urban slums. This was because these households depend largely on public stand posts
and public wells, for which there are no water user charges.2 Further, these areas tend to have
inadequate metering and a high proportion of unauthorized connections. Our findings suggest
that public stand posts and public wells, which are provided by the water utility for free, are non-
trivial sources of NRW. In addition, we find that revenue generation from metered tap
connections is sub-optimal. We also observe potential revenue being shifted away from the
public water utility towards private providers as several households pay for water obtained from
neighbors, tankers, or other private sources.
1 The figures in the study reflect 2001 prices but are nevertheless useful for purposes of illustration. 1 Indian Rupee (INR) = 0.0169 USD as of May 30, 2014. 2 As will be discussed in subsequent sections, water provided through public stand posts and public wells has a high cost of production. While making explicit normative arguments is beyond the scope of this paper, we propose policy recommendations taking the equity aspect into consideration.

4
Drawing upon our findings we propose policy options which can potentially help reduce NRW in
urban India more generally, as slum settlements and inadequate metering are common across
cities. Specifically, we propose a revised volumetric pricing model for domestic consumers,
which would recover the cost of production of water and ensure that the low-income households
are not burdened. In addition, we provide a review of pre-paid smart card water metering policies
from developing countries, which have been used for public stand posts. We argue that in
addition to generating revenue, these policy options are likely to induce conservation among
consumers.
Our recommendations are based on our findings from the survey and are plausibly different from
the course of action proposed by Bangalore’s water utility board. Interviews with officials from
the Bangalore Water Supply and Sewerage Board (BWSSB) suggested that there might be
eventual phasing out of public stand posts, replacing them with private metered connections for
each slum household, which would be billed under a new tariff structure. The feasibility of this
policy is unknown in the light of issues pertaining to illegal squatting and lack of proper home
ownership titles. While we acknowledge these concerns, we consider them beyond the purview
of our data and analysis.
This paper is organized as follows. Section 2 provides a brief overview of NRW in Bangalore
due to real losses, current tariff structure, and status of metering. Sections 3.1 and 3.2 present the
empirical analysis of NRW and discuss the results. Section 4 proposes policy options and section
5 concludes.
2. CURRENT UNDERSTANDING OF NRW IN BANGALORE
Over the past couple of decades, Bangalore has experienced rapid urbanization and population
growth, stressing its available water resources. Presently, the city’s water supply is largely
dependent on the Cauvery Water Supply Scheme, which was first commissioned in 1974, and
subsequently improved through stages I, II, III and IV (Table 1). Water is pumped to the city,
through a distance of around 100 kilometers and at an elevation of 500 meters. The water is
stored at T.K Halli reservoir, treated, and distributed to the city. This involves significant
expenditure on electricity, costing nearly INR 5 billion (109) (USD 82.4 million) annually

5
(Central Groundwater Board, 2008). According to the Cauvery River Water Disputes Tribunal,
Bangalore can withdraw a maximum of 538 million m3 of water per year. At this level, the
average daily extraction limit is about 1425 MLD.3 With completion of the ‘Cauvery Stage IV
Phase II’ infrastructure scheme in 2012, the city is already pumping around 1410 MLD each day,
of which about 30% is lost to leakage, designated as NRW due to real losses (The Times of
India, 22 Feb 2013). Hence only about 900 MLD are received by the city, which is much less
than the current demand of about 1700 MLD (BWSSB, 2013).
Table 1. Projected provision of Cauvery Water Supply Scheme (CWSS) for Bangalore
Year of commissioning Stage of CWSS Potential supply (MLD)
1974 I 135
1983 II 135
1993 III 270
2002 IV, Phase I 270
2008 IV, Phase I 100
2012 IV, Phase II 500
Source: BWSSB
The city’s main water utility is the Bangalore Water Supply and Sewerage Board (BWSSB),
which is a government agency. Though the networks for surface water and sewage distribution
have gradually expanded beyond the city core, the BWSSB service area is essentially limited to
the city core and former city municipal councils (CMCs) under the Greater Bangalore Water and
Sewerage Project (GBWASP). About 110 former villages at the fringes remain under the
jurisdiction of Bruhat Bangalore Mahanagara Palike (BBMP), which is also a government
agency. The IWP survey revealed that the core area of the city receives better service with
regular Cauvery water supply, with the frequency being daily or every other day. However, the
situation changes as one moves towards the newly added non-core areas, where the supply by the
water utility board is unreliable.
3 1 MLD (million liters per day) = 1000 m3 per day.

6
All BWSSB tap connections are claimed to be metered and water deliveries are charged
according to a fixed rate4. The tariff structure is different for domestic and commercial
consumers. Moreover, apart from the piped connections, there are monthly charges for bore
wells dug by individual households or commercial enterprises. The current domestic tariff
structure includes five consumption blocks and a separate flat tariff for apartments (Table 2).
This volumetric block tariff was last revised in February 2005.5 Since then, there have been two
electricity tariff hikes, resulting in a 46% increase in BWSSB’s power expenditures. Moreover, it
is estimated that the real incurred cost of production and distribution of Cauvery water to the city
is INR 32 per m3 (Times of India, 7 Jul 2013). A simple comparison of the cost of production
with the current tariff structure reveals that the revenue generated is inadequate to meet
BWSSB’s expenditure and deficits.
It is estimated that not increasing its water charges in accordance with electricity tariff hikes has
resulted in a loss of nearly INR 24 million from 2008-09 to 2011-12 for BWSSB. In spite of this
loss, BWSSB has undertaken several capital investments in developing infrastructure for
extension of the Cauvery Drinking Water project, Cauvery Stage IV Phase II project, and others6
(The New Indian Express, 11 May 2013).
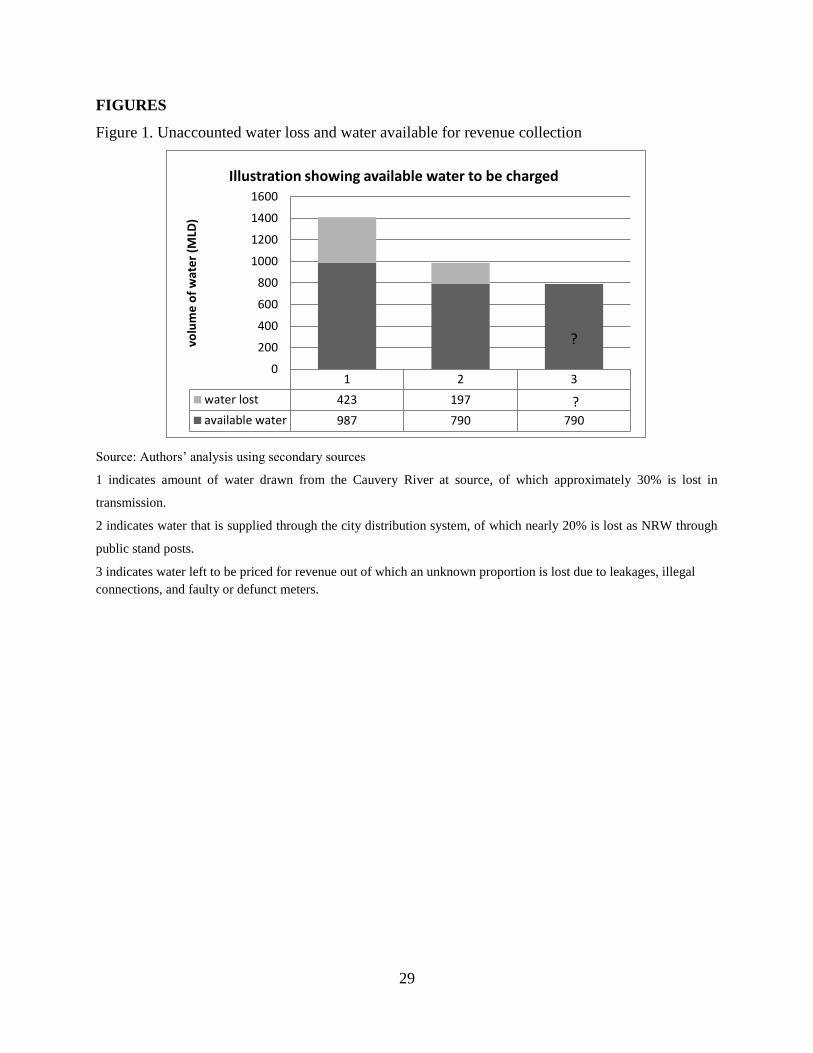
Figure 1 graphically summarizes our preliminary analysis using secondary sources of total water
loss starting from extraction of raw water from Cauvery to its delivery to households in the city.
While transferring raw water (approximately 1410 MLD) from Cauvery to Bangalore city, 30%
is estimated to be lost in transaction (The Times of India, 22 Feb 2013). Provision of water, at no
charge through public stand posts and public wells, accounts for about 20% of the water
distributed in Bangalore (Connors & Brocklehurst, 2006). Hence, public stand posts seem to be
potential sources of NRW, which we will examine further. Additional sources of unaccounted
4 It is estimated that BWSSB has about 800,000 connections currently. From these, it generates INR 450 million in revenue, of which INR 350 million it has to spend as electricity costs and INR 100 million are other operating costs (The New Indian Express, 17 Oct 2013). 5 A revised tariff only for apartments was announced on July 7, 2013. However, the price blocks for the majority of consumers have not been revised. 6 The funds to offset deficit (due to subsidies and insufficient revenue collection) and undertake new projects have mostly come from government grants, BCC (Beneficiary Capital Contribution), market borrowings, and other international agency loans like those from Japan International Cooperation Agency (JICA), Japan Bank for International Cooperation (JBIC), World Bank etc. [BWSSB website: http://bwssb.org/current-projects-2/ ; http://bwssb.org/cwss-stage-iv-phase-2/] [AQ2]

7
losses during distribution include leakage, illegal connections, and faulty or defunct meters for
which there is no official estimate available. Further, there is the issue of the inefficient tariff
structure that fails to ensure minimum cost recovery. In subsequent sections of this paper, we
examine in detail the revenue losses from different water supply sources.
Table 2. Current domestic water tariff structure of BWSSB
Water delivered (m3/month) Rate (INR per m3)
0-8 6
8-25 9
25-50 15
50-75 30
>75 36
High rise building/apartments residents 19*
Source: BWSSB
Note: There is a minimum monthly charge of INR 48, which is collected from all domestic customers.
*Revised tariff for apartments as announced on July 7, 2013. Tariff charged as flat rate per m3 of water.
<Figure 1 about here>
3. EMPIRICAL ANALYSIS OF NRW
3.1 Data and results
The IWP survey was conducted in six wards of Bangalore city to ensure representation of urban
low-income households from the city core as well as the non-core areas. A sample of 100
households was randomly drawn from each of the six wards - Halsoor, Hebbal, Vijinapura,
Kengeri, Shettihalli, and Bellanduru (Figure 2 and Table 3).
<Figure 2 about here>

8
Table 3. Characteristics of the six wards included in the IWP survey
Ward Estimated
population
Area
(sq.kms) Level of urbanization
Water Utility
Board
Bellandur 20,576 26.4 former villages BBMP
Halsoor 35,891 1.7 core city area BWSSB
Hebbal 24,161 1.2 core city area BWSSB
Vijinapura 35,087 2.0 former CMC BWSSB
Shettihalli
28309
9.0
partly former villages
and partly former CMC
BBMP &
BWSSB
Kengeri 24,870 4.8 former TMC BWSSB
Source: BBMP website
Note: BWSSB- Bangalore Water and Sewerage Supply Board; BBMP- Bruhat Bengaluru Mahanagara Palike;
CMC- City Municipal Corporation; TMC- Town Municipal Corporation.
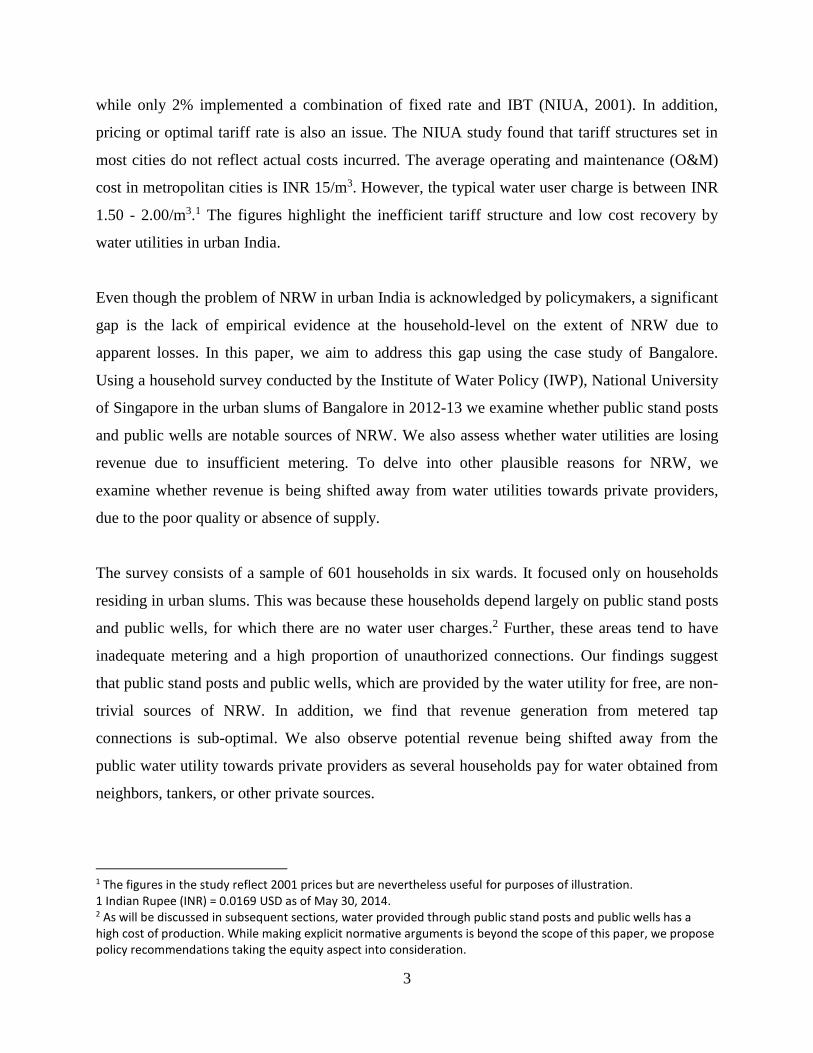
Table 4 summarizes the various sources of water reported by the households. More than half of
the survey respondents in Halsoor, and almost two thirds of those in Hebbal, report having
access to an individual tap connection, providing them with water from the Cauvery River. The
rest of the wards are mostly supplied by groundwater from bore wells (either through public
stand posts or individual connections). The proportion of households obtaining water from a
public stand post is highest in Kengeri (60%) and lowest in Vijinapura (4%). Although fair
proportions of the Vijinapura households (22%) report obtaining water from tap connections
supplied by a bore well, the public supply system at the time of the survey was poor (being
supplied once or twice a month), forcing respondents to buy water from private wells or tankers.
Another distinct water supply source found only in Vijinapura was private tankers sent by
politicians. Respondents reported getting water free of charge from tankers supplied by
politicians contesting the May 2013 state assembly elections.
9
Table 4. Sources of water reported by respondents
Ward Households
with bore well
supplied tap
connection (%)
Households with
Cauvery water
supplied tap
connection (%)
Households
depending
upon public
stand posts (%)
Households
depending
upon private
suppliers (%)
Halsoor 0 58 42 0
Hebbal 7 64 20 12
Vijinapura 22 5 4 92
Kengeri 17 16 60 15
Bellandur 5 2 31 65
Shettihalli 24 2 30 33
Source: IWP survey of households, N=601
Note: The water sources are not unique and therefore the numbers may not add up to 100%.
Table 5 summarizes the extent of metering among households connected to the Cauvery water
tap connections while the primary water source for the households and whether they pay for it is
summarized in Table 6. Proportion of metered tap connections is highest in Hebbal (87%) and
Vijinapura (81%). However, it is relatively low in Halsoor (66%) and much lower in Kengeri
(39%), Bellandur (29%), and Shettihalli (12%).
The three main primary sources of daily water supply that emerged were individual tap
connections (192 households), public stand posts (176), and private providers (180). Of those
households relying primarily on an individual tap connection, 63% report paying for water, while
61% of those relying on private providers pay for their water. It is important to highlight here
that the 63% who reported paying for individual tap connection are the ones who regularly pay
water bills.7 Only 2.3% of the households relying primarily on a public stand post report paying
for water, while a small number relying on public wells did not pay for water at all. It was noted
that a substantial proportion of households relying on private sources did not have to pay for
7 The remaining households in the sample were either yet to get a metered connection or had faulty meters and therefore were not paying water bills. There were also respondents who were receiving monthly bills but complained that the water supply was insufficient and too irregular. Residents paying bills reported the value to be ranging from INR 50-200. Taken as a proportion of the total sample of 601 households, approximately 20% were paying regular water bills for their individual metered connections.

10
water as they were land owners themselves and owned private bore wells inside their household
premises. Another category of households depending on private sources were tenants, who
reported that water charges were incorporated in their rents. A few households also reported
receiving water from neighbors, temples, or construction sites for free as a gesture of goodwill
and therefore did not pay for it.
Table 5. Proportion of metered tap connections
Ward % Metered % Non-metered
Halsoor 66 34
Hebbal 87 13
Vijinapura 81 19
Kengeri 39 61
Bellandur 29 71
Shettihalli 12 88
Total 63 37
Source: IWP survey of households, N=601.
Table 6. Primary water sources and payment status
Primary source of daily water supply Number of respondents reporting the source as
primary, and the proportion of those respondents
who pay for water from that source
Number Proportion who pay
(%)
Individual tap connection 192 63.0
Public stand post 176 2.3
Public well 8 0
Private provider 180 61.1
Combination 43 46.5
Total 599

11
Source: IWP survey of households, N=599. Of the 601 households interviewed, two households in Bellandur report
a nearby lake as their primary water source. Combination refers to those households which access water from both
public as well as private sources
In Table 7 we examine the distribution of households by income category and whether they pay
for accessing water from public sources, that is, water supplied by water utility boards. We
observe that within each income category a majority of the households do not pay for accessing
water from public sources. This is true even for households with income of INR 30,000 and
above. Interestingly, the proportion of households paying for water from public sources
decreases as we move to higher income categories. A plausible reason could be that many
households in the higher income categories own private bore wells and therefore may not be
accessing water from public sources. However, the relationship between income category and
paying for public water sources is not statistically significant as the chi-squared statistic is 9.12
with a p-value of 0.17.
Table 7. Distribution of households obtaining water from public sources by income and their
payment status
Income category
(INR per month)
Number of respondents in each income category, and the
proportion of those respondents who pay for water from
a public water source
Number Proportion who pay (%)
0 to 5,000 88 36.4
5,000 to 10,000 175 37.7
10,000 to 15,000 78 37.2
15,000 to 20,000 37 18.9
20,000 to 25,000 8 12.5
25,000 to 30,000 11 18.2
More than 30,000 10 20.0
Source: IWP survey of households, N=407. These data pertain to households with access to public water sources,
which include individual connections, public stand posts, and public wells.

12
In Table 8, we look at the distribution of households by income category and whether they pay
for accessing water from private providers like tankers, neighbors, and other sources.
Interestingly, we observe that even in the lowest income categories the proportion of households
paying for water from private providers is either higher or nearly the same as that of those paying
for accessing public water supply. Therefore, there is some evidence that in the absence of public
water supply, lower income households are likely to pay to access water from private providers.
Table 8. Distribution of households obtaining water from private sources by income and their
payment status
Income category
(INR per month)
Number of respondents in each income category, and the
proportion of those respondents who pay for water from
a private water source
Number Proportion who pay (%)
0 to 5,000 38 55.3
5,000 to 10,000 105 47.6
10,000 to 15,000 60 55.0
15,000 to 20,000 18 38.9
20,000 to 25,000 10 50.0
25,000 to 30,000 6 33.3
More than 30,000 12 25.0
Source: IWP survey of households, N=249. These data pertain to households with access to a private water supply.
3.2 Discussion
Our findings reveal that only 63% of all households with individual connections are metered.
Among the six surveyed wards, Halsoor and Hebbal have the highest proportion of households
with tap connections supplying Cauvery water. The other four wards have less than 10% of
households with access to Cauvery water tap connections (except Kengeri, with 16%).
Vijinapura, which lies just at the border of the core area, was found to be the most water scarce
with inadequate public water supply through tap connections and even the public stand posts
(through bore wells) provided water to the residents only once or twice a month, leading to high
dependency on private providers.
13
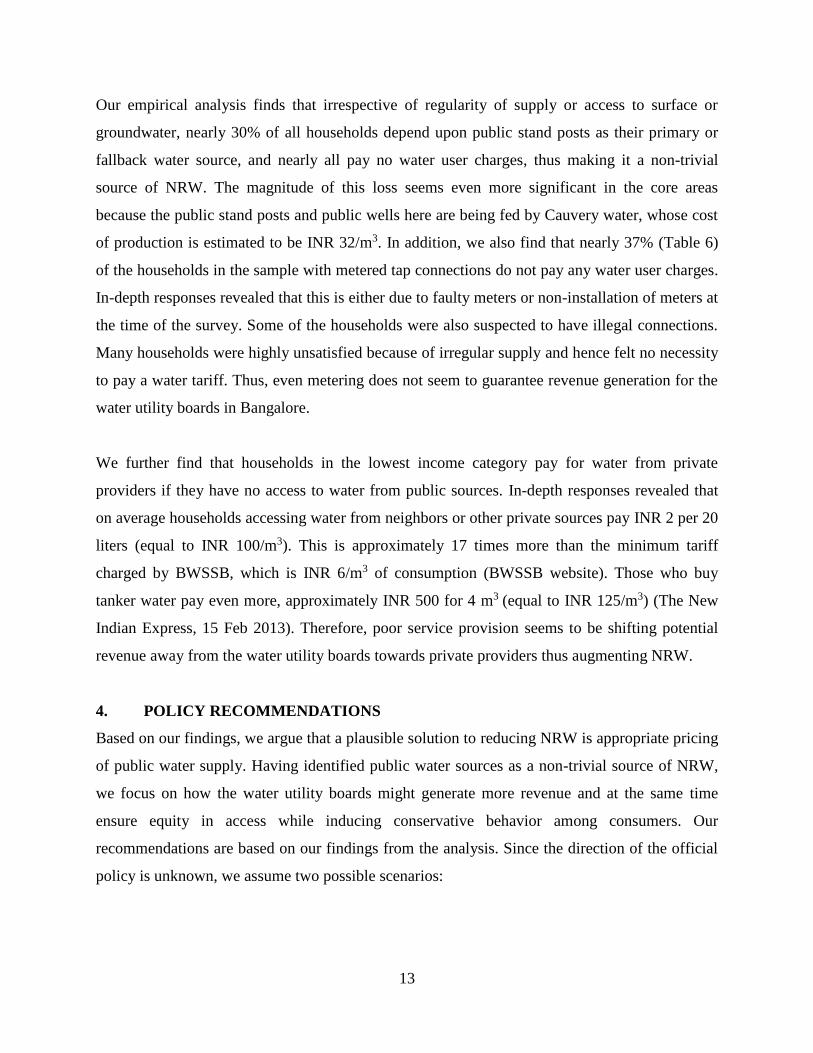
Our empirical analysis finds that irrespective of regularity of supply or access to surface or
groundwater, nearly 30% of all households depend upon public stand posts as their primary or
fallback water source, and nearly all pay no water user charges, thus making it a non-trivial
source of NRW. The magnitude of this loss seems even more significant in the core areas
because the public stand posts and public wells here are being fed by Cauvery water, whose cost
of production is estimated to be INR 32/m3. In addition, we also find that nearly 37% (Table 6)
of the households in the sample with metered tap connections do not pay any water user charges.
In-depth responses revealed that this is either due to faulty meters or non-installation of meters at
the time of the survey. Some of the households were also suspected to have illegal connections.
Many households were highly unsatisfied because of irregular supply and hence felt no necessity
to pay a water tariff. Thus, even metering does not seem to guarantee revenue generation for the
water utility boards in Bangalore.
We further find that households in the lowest income category pay for water from private
providers if they have no access to water from public sources. In-depth responses revealed that
on average households accessing water from neighbors or other private sources pay INR 2 per 20
liters (equal to INR 100/m3). This is approximately 17 times more than the minimum tariff
charged by BWSSB, which is INR 6/m3 of consumption (BWSSB website). Those who buy
tanker water pay even more, approximately INR 500 for 4 m3 (equal to INR 125/m3) (The New
Indian Express, 15 Feb 2013). Therefore, poor service provision seems to be shifting potential
revenue away from the water utility boards towards private providers thus augmenting NRW.
4. POLICY RECOMMENDATIONS
Based on our findings, we argue that a plausible solution to reducing NRW is appropriate pricing
of public water supply. Having identified public water sources as a non-trivial source of NRW,
we focus on how the water utility boards might generate more revenue and at the same time
ensure equity in access while inducing conservative behavior among consumers. Our
recommendations are based on our findings from the analysis. Since the direction of the official
policy is unknown, we assume two possible scenarios:

14
Scenario 1: the water utility board decides to phase out all public stand posts and replace them
with individual connections under a new tariff structure that covers the cost of production and
generates a fair profit.
Scenario 2: the stand posts remain but the water purveyor decides to meter them to generate
revenue, along with individual metered connections for those who can afford.
4.1 Scenario 1: revised volumetric pricing structure
Previous studies suggest that subsidized water prices fail to benefit the low-income households
for whom the subsidy was originally designed. This is because very few of these households
have metered tap connections. Therefore, it is the middle and higher income households who
enjoy the subsidy (Mathur & Thakur, 2003). Further, low-income households tend to have lower
levels of water consumption. Therefore, broad consumption blocks turn out to be inefficient for
volumetric pricing as broader consumption blocks with lower tariffs means that most of the
consumers, including the middle and higher income households would fall within the first or
second block. When households, which can otherwise afford to pay more, are supplied with
highly subsidized water, the water utility does not generate adequate revenue as most consumers
fall under subsidized broad consumption blocks. This results in inefficiencies for the water
utility, and can consequently have an adverse effect on its service quality (Komives et al., 2005).
Broad consumption blocks are also inefficient from the water conservation perspective as there is
no monetary incentive to utilize less water. The purpose of our proposed volumetric water
pricing model therefore is to generate enough revenue for the water utility to cover cost of
production while also having enough funds for maintenance and expansion works. At the same
time, we bear in mind the affordability of water prices for low-income households and their
ability to pay. A graphical representation of our model is provided in Figure 3.
Our volumetric pricing model heavily draws upon the model proposed by Wichelns (2012). The
salient feature of the model is the differentiation of blocks for low and higher income
households. Under this model, the water utility’s revenue is estimated to be:
𝑇𝑜𝑡𝑎𝑙 𝑅𝑒𝑣𝑒𝑛𝑢𝑒 = 𝑃1𝑉1 + 𝑃2𝑉2 + 𝑃3𝑉3

15
where, 𝑉1 is the volume of water consumed by low-income households in Block 1, 𝑉2 is volume
of water consumed by higher-income households in Block 2, and 𝑉3 is the volume of water
consumed by higher-income households in Block 3. 𝑃1, 𝑃2, and 𝑃3 are prices of water in each
block. As against the current block pricing implemented by BWSSB, this model is designed to
restrict only low-income households within parameters of Block 1, while others pay (at non-
subsidized rates) accordingly for their higher consumption.
It is critical that the volume of water consumption as well as the price under Block 1 be optimal
for the low-income households. The optimal value of 𝑃1 is computed as:
𝑃1 = 𝐶𝑜𝑠𝑡 𝑜𝑓 𝑃𝑟𝑜𝑑𝑢𝑐𝑡𝑖𝑜𝑛 𝑜𝑓 𝑊𝑎𝑡𝑒𝑟 𝑖𝑛 𝐵𝑙𝑜𝑐𝑘 1 − 𝑆𝑢𝑏𝑠𝑖𝑑𝑦
The optimal value of 𝑃2 then requires that the water utility be able to cover the cost of production
as well as the subsidy offered under Block 1. We term this the recovery block. Therefore, the
optimal value of 𝑃2 is computed as:
𝑃2 = 𝑆𝑢𝑏𝑠𝑖𝑑𝑖𝑒𝑠 𝑖𝑛 𝐵𝑙𝑜𝑐𝑘 1 + 𝐶𝑜𝑠𝑡 𝑜𝑓 𝑃𝑟𝑜𝑑𝑢𝑐𝑡𝑖𝑜𝑛 𝑜𝑓 𝑊𝑎𝑡𝑒𝑟 𝑖𝑛 𝐵𝑙𝑜𝑐𝑘 2
As the water utility needs to generate revenue enough to cover cost of production as well as
generate profits to support maintenance and expansion works, the optimal value of 𝑃3 is
computed as:
𝑃3 = 𝐶𝑜𝑠𝑡 𝑜𝑓 𝑃𝑟𝑜𝑑𝑢𝑐𝑡𝑖𝑜𝑛 𝑜𝑓 𝑊𝑎𝑡𝑒𝑟 𝑖𝑛 𝐵𝑙𝑜𝑐𝑘 3
+ 𝑃𝑟𝑜𝑓𝑖𝑡𝑠 𝑅𝑒𝑞𝑢𝑖𝑟𝑒𝑑 𝑡𝑜 𝐹𝑎𝑐𝑖𝑙𝑖𝑡𝑎𝑡𝑒 𝑀𝑎𝑖𝑛𝑒𝑛𝑎𝑛𝑐𝑒 𝑎𝑛𝑑 𝐸𝑥𝑝𝑎𝑛𝑠𝑖𝑜𝑛
<Figure 3 about here>
We draw upon our empirical findings, which suggest that there is revenue collection potential
even among the low-income households, to simulate different tariff structures. For designing the
appropriate blocks, we extrapolate that these low-income households, who currently pay nearly
INR 100/m3 to private providers would have the ability to pay at least INR 16/m3, which is 50%
of the INR 32/m3 cost of production. Using these figures and applying our proposed model, we
generate revenue collection simulations for the water utility boards using subsidy levels of 40%,
50%, and 60%.

16
From the IWP survey it was found that the average monthly water consumption of low-income
households is approximately 43.2 LPCD.8 For the purposes of our model, we assume average
monthly water consumption of low-income households to be 50 LPCD. Extrapolating from this,
the total households average monthly consumption would be between 6 to 9 m3, depending on
household size of 4 or 6 members. We use 0-8 m3 as the volume of water that would be
subsidized under Block 1 as this justifies our calculations and is also the lowest block being used
in the current BWSSB tariff model.
To determine the volume of water under Block 2, we draw upon the guidelines prescribed by
Central Public Health and Environmental Engineering Organization (CPHEEO), which falls
under the purview of the Ministry of Urban Development of the Government of India. According
to CPHEEO (1999), each urban Indian consumer is entitled to 135 LPCD of water, which goes
up to 150 LPCD for metro cities with full sewerage coverage. Using these limits, the average
household water requirements for 4 and 6 member families have been estimated in Table 9. For
an average 4-member family we estimate 16.2 m3 as the optimum requirement. Therefore, we
determine the volume of water under Block 2 to be 9-16 m3. Beyond 16 m3, the household would
be over-consuming as per CPHEEO guidelines and therefore we estimate 𝑃3 as twice the cost of
production, that is, INR 64. This would enable the water utility to generate a profit for
maintenance and expansion as well as induce conservation. Table 10 presents the simulated
prices under our volumetric pricing model. It is important to highlight that the tariff blocks in our
proposed model are based on basic consumption levels and not on income levels. Therefore, the
high-consumption households would cross-subsidize the low-consumption households. While
our model is not income-based, we argue that it would still benefit a large proportion of the low-
income households as they tend to consume less water in comparison to high-income
households.9
8 LPCD- Litres per Capita per Day 9 Low-income families who may not necessarily benefit from the subsidy are those with a large family size or multiple low-income families residing in the same dwelling.

17
Table 9. Estimated levels of optimal monthly water consumption for 4 and 6-member households
depending on their daily requirements
Water requirement
(LPCD)
4 member family
(m3/month)
6 member family
(m3/month)
50 6 9
135 16.2 24.3
150 18 27
Source: Authors’ calculations
Table 10. Simulated prices per m3 under each block for proposed volumetric pricing model
Source: Authors’ calculations
Note:
All prices are estimated using INR 32/m3 as the cost of production.
𝑷𝟏 denotes water price (in INR per cubic meter) in Block 1 with subsidized rates.
𝑷𝟐 denotes water price (in INR per cubic meter) in Block 2 which covers cost of production of Block 2 and the
subsidy given in first block. So this is the recovery block.
𝑷𝟑 denotes water price (in INR per cubic meter) in Block 3 which is twice the cost of production and covers cost of
production of Block 3 and also generates profits for maintenance and expansion.
The argument underlying our revised pricing structure is that if water tariffs cannot cover the
minimum cost of provision, then there is little incentive and lesser resources for the water utility
to maintain and expand its infrastructure resulting in poor service-delivery. This augments the
real losses for the water utility. Li (2013) observes that when the deficit incurred due to subsidies
extended to low-income households is not totally covered by external or government agencies,
utilities tend to lower service quality to cut costs. This in turn discourages households to invest in
metered connections and to pay water bills regularly. As a result, even the apparent losses
Proposed
Scheme
Subsidy given under Block
1
𝑷𝟏(0-8 m3)
[in INR]
𝑷𝟐(9-16 m3)
[in INR]
𝑷𝟑(>16 m3)
[in INR]
Block 1 Block 2 Block 3
Scheme I 60% 13 51 64
Scheme II 50% 16 48 64
Scheme III 40% 20 44 64

18
increase. Proper pricing of water also serves to encourage consumers to use water judiciously
and reduce wastage. This would result in decreased demand thus reducing pressures on supply,
curtail energy expenditure thus decreasing cost of production, and consequently generate more
savings for the water utility.
The survey also found that as many as 15-18 households were sharing water and bill charges
from metered tap connections. This essentially means that a large volume of water is being
consumed but only one meter is being charged at a flat rate providing no incentive for optimally
using or conserving water. The proposed pricing model would also discourage such sharing of
connections as households will not get subsidized rates if their consumption is higher.
Based on the proposed pricing in Table 10, we simulate the revenue generated per household
under each block in Table 11. As is observed, from Block 3 onwards, our model is able to raise
sufficient revenue to cover costs and generate profits for the water utility. In terms of pricing
water for the middle and higher income groups, our model is a lot more economically efficient as
compared to the current (revised) tariff for apartment blocks, which is a flat tariff of INR 19/m3
for apartments. At the current rate, the water utility would still not be able to cover the cost of
production, let alone generate profits.

19
Table 11. Simulated per household cost of production of water and revenue collected under each
block
Block 1 Block 2 Block 3
8 m3/month 16 m3/month 18 m3/month 24 m3/month 27 m3/month
Calculation 8*𝑷𝟏 8*𝑷𝟏+8*𝑷𝟐 8*𝑷𝟏+8*𝑷𝟐+2*𝑷𝟑 8*𝑷𝟏+8*𝑷𝟐+8*𝑷𝟑 8*𝑷𝟏+8*𝑷𝟐+11*𝑷𝟑
Cost of
production10 256 512 576 768 864
60% subsidy 102 512 640 1024 1216
50% subsidy 128 512 640 1024 1216
40% subsidy 154 512 640 1024 1216
Source: Authors’ calculations
4.1.1 Calculating the effectiveness of the proposed volumetric pricing model
In order to determine whether our proposed pricing model would be effective, we use the
following population distribution in the city of Bangalore – 20% urban poor or low income, 50%
middle income, and 30% higher income (Connors & Brocklehurst, 2006) – and extrapolate the
revenue that would be generated, against the simulated per household cost of production of water
and monthly bills collected. Interviews with BWSSB officials revealed the number of metered
tap connections in Bangalore to be 0.7 million. For purposes of simplicity, we assume that there
are 1 million connections under BWSSB. Since we do not know the exact monthly water
consumption of these households, we assume that the low-income households consume within
the volume under Block 1 while the middle and higher income groups consume a mean value
between the volume ranges of Block 2 and Block 3. The estimated total revenue generated can
therefore be computed as shown in Appendix 1. The net revenue generated under each of the
subsidy schemes is positive and ranges from INR 33.2 million to INR 43.6 million. Thus, in
terms of positive returns, our proposed model does seem to be effective.
10 Cost of production is taken to be INR 32/m3, which is the current cost of production to get Cauvery water.

20
4.2 Scenario 2: pre-payment metering (PPM): an option to consider
If the water utility decides not to phase out public stand posts and public wells, it is essential to
consider alternative policy options especially given our empirical finding that public stand posts
and public wells contribute significantly to NRW. One such option is the pre-payment meter
(PPM), where the public or community water source is also metered. As there is no evidence
from urban India on metering community water sources, we draw upon cases from other
developing countries and evaluate its feasibility.
PPMs for electricity, gas, telecom and water, have been widely utilized by governments in the
developing world as an effective tool to recover costs, shorten realization time of profit, and
induce conservational attitudes among customers. PPM with its smart metering technology has
dual benefits. First, it avoids non-payment and consumer debts as consumers pay upfront for the
water. And second, it captures and stores the water usage information of each registered
consumer in its data logging system thus enabling the water utility to monitor and benchmark
consumption (Stewart et al., 2010).
PPM is being actively adopted in many developing countries such as South Africa, Uganda,
Brazil, and Bangladesh. Under this technology, consumers are provided with a registered card,
which needs to be topped up with cash balance. Each time they want to draw water from a tap,
they swipe their card and enter the amount of water they wish to draw. Water is then dispensed
and charged accordingly. Given the technology, a third benefit of this system that we identify is
disqualification of illegal connections and prevention of meter tampering.
In South Africa, PPM for public standpipes has been in operation since 1996. In 2003, PPM was
introduced for urban households in Johannesburg. The main purpose of the policy intervention
was to cope with the problem of over-supply and lack of ownership of water consumption by
residents. Here the residents were entitled to a monthly free supply of 6 m3, after which they
were required to pay for every additional m3 of water consumed. This indeed led to much less
usage of water by households, as many tried to consume within the free limit. Similarly in
Palmas, Brazil, installation of PPM lead to a 38% decrease in water consumption and 56% dip in
monthly water bill (Ruiters, 2007).

21
Berg and Mugisha (2010) use optimization models to show that in Kampala, Uganda, PPM
public stand posts have been successful in meeting financial limitations (low investment) and
social objectives (serving larger populations) while ensuring regular revenue collection for the
water utility. They conclude that PPM is an effective technological tool for serving the urban
poor. In Barind district of Bangladesh, Barind Multi-purpose Development Authority (BMDA)
has introduced PPM for irrigation water. Though it is mainly an energy measuring unit, this
scheme has helped in proper management of groundwater draft. The user pays upfront for
electricity consumption and hence tends to use optimal amount of water (Saiful, 2013).
Even though there are definite advantages to PPM, in South Africa specifically, it has received
some criticism due to procedural lapses in poor neighborhoods such as Orange Farm and Phiri.
The cause of discontent was that each household was entitled to only 6 m3 of water per month
irrespective of the number of people sharing one smart card. The Johannesburg High Court ruled
that as per basic human rights, each person within a household should be entitled to 1.5
m3/month and ordered changes in the policy accordingly (Bond & Dugard, 2008). Therefore, the
issue of fair distribution is critical for successful implementation of PPM.
4.2.1 Feasibility of PPM for public stand posts in Bangalore
As suggested by our findings, a significant portion of the water supplied to the city of Bangalore
is in fact NRW distributed through free public stand posts and public wells. As a measure to
control these losses, BWSSB started a new service delivery scheme in slums in 2000. With the
help of local NGOs and support from donor funds, they are attempting to bring every slum
household under their coverage of metered tap connections (Connors & Brocklehurst, 2006). Our
interviews with BWSSB officials revealed that once this project is completed, all public stand
posts in the city would be sealed and shutdown.
While the project undertaken by BWSSB is rational from the revenue generation perspective, it
seems less feasible in view of land legalization issues. We found in our survey that many of the
households in the slums are non-notified. Many are merely temporary settlements of laborers
clustered in tents (without permanent walls and roof), which do not fall under the category of
slums. Such temporary laborers often rely either on public stand posts or private tanker supply.

22
The question that therefore arises is how the water utility board would provide individual
metered connections to these illegal and temporary settlements.
A further issue with the BWSSB metering project for slums is the application and installation fee
that the urban low-income households need to pay. Currently, BWSSB charges INR 5000 to
install a new metered connection. Moreover, the cost of laying out and extending the metered
pipeline inside the house has to be borne by the household. From the in-depth responses in the
IWP survey, we found that households expressed discontent as even after getting the metered
connection they could not draw water. This was because they needed a pump to generate the
necessary water pressure and it was not affordable for them to invest in a pump. Raghupati and
Foster (2002) observe that in many Indian cities the average official connection cost is USD 20,
while practically the expenditure needed for expansion of services per household is around USD
150. But even after receiving considerable subsidies, many low-income households cannot afford
to bear charges of individual piped connections. Therefore, the question of affordability for
metered tap connections among the urban low-income households is a critical issue that the
water utility boards need to consider.
In comparison, PPM might be a more feasible option. The stand posts are already installed in
several urban slum settlements. Drawing upon similar interventions in Africa, the estimated cost
of installing a PPM is approximately USD 100. The tariff structure for PPMs could be similar or
lower than our proposed volumetric pricing for metered tap connections. PPM would lessen the
burden of paying for individual connections for the urban low-income households. Instead, they
can share the costs with their neighbors and the community while having individual registered
smart cards. From the perspective of the water utility board, they would be relieved from their
task of legalizing several slum households so that they can be brought under the piped network
expansion scheme (Connors & Brocklehurst, 2006).
5. CONCLUSION
Cities in India are facing complex water supply and allocation problems. Reducing NRW is the
biggest challenge faced by the water utility boards. In this paper, we examined whether public
stand posts and public wells are notable sources of NRW in Bangalore. Our analysis using a

23
survey of 601 low-income urban households indicates that public stand posts and public wells,
which supply free water to the poor, indeed are non-trivial sources of NRW. Around 30% of the
households in our sample depend upon public stand posts as their primary or fallback water
source, and nearly all pay no water user charges. While it might be assumed that metering will
ensure revenue collection, we find that nearly 37% of the households in our sample with metered
tap connections do not pay any user charges owing to faulty or absence of metering.
Further, we also observe that potential revenue from low-income households is being shifted
away towards private providers. Households living in wards where water service delivery was
very poor depended on neighbors, tankers, and other private suppliers and paid nearly 17 times
more than the BWSSB water tariff for the same amount of water.
To enable water utility boards to recover cost more effectively, we propose a volumetric pricing
model that would likely reduce NRW. As the water utility is able to reduce apparent losses,
consequently they would be able to invest in infrastructure effective in reducing real losses too.
The current tariff structure is insufficient to cover the minimum cost of provision. Therefore, our
proposed model is designed in a way to reduce the price burden on the urban low-income
households while discouraging the middle and higher income households from free-riding on the
water subsidy. The key feature of our model is that since low-income households consume less
water, the subsidy is levied only on a narrow block of water consumption so as to prevent the
better off households from consuming water under the subsidized block. We also recommend
narrowing subsequent blocks of consumption so that wasteful consumption of water is
discouraged. Thus, the model satisfies the goals of efficiency, equity, and sustainability (both
from a resources as well as financial perspective). We also test the efficiency of our pricing
model and find that it is likely to generate a profit under different subsidy scenarios.
Further, we propose that instead of sealing off public stand posts and naively moving towards
metering every urban poor household, the urban water utility boards in India could consider
metering the stand posts on a pre-payment basis, taking lessons from other developing countries
such as South Africa, Uganda, Brazil, and Bangladesh. This would enable cost-sharing among
the low-income households while generating necessary revenue for the water utility. Ultimately,

24
the effectiveness of these policies hinges upon institutional reform as well as service
improvements.

25
APPENDIX
Appendix 1. Computation of total revenue generated from proposed pricing model
Income
group
Number of
connections
Average monthly
bill
Average cost of
production
Total
Revenue Total Cost Net
(millions) (million
INR)
(million
INR)
(million
INR)
60% subsidy
Low-income .2 102 256 20.4 51.2 (30.8)
Middle-
income .5 (512+640)/2=576 (512+576)/2=544 288 272 16
Higher-
income .3 (640+1024)/2=832 (576+768)/2=672 249.6 201.6 48
Net revenue
(million INR) 33.2
50% subsidy
Low-income .2 128 256 25.6 51.2 (25.6)
Middle-
income .5 (512+640)/2=576 (512+576)/2=544 288 272 16
Higher-
income .3 (640+1024)/2=832 (576+768)/2=672 249.6 201.6 48
Net revenue
(million INR) 38.4
40% subsidy
Low-income .2 154 256 30.8 51.2 (20.4)
Middle-
income .5 (512+640)/2=576 (512+576)/2=544 288 272 16
Higher-
income .3 (640+1024)/2=832 (576+768)/2=672 249.6 201.6 48
Net revenue
(million INR) 43.6
Source: Authors’ calculations
Note: We assume a maximum average consumption of higher-income households, who typically have larger living
spaces and modern sanitation, to be 24 m3/month.

26
REFERENCES
Alegre, H., Baptista, J. M., Jr., E. C., Cubillo, F., Duarte, P., Hirner, W., Merkel, W., & Parena,
R. (2006). Performance Indicators for Water Supply Services. IWA Publishing, London.
Bangalore Water Supply and Sewerage Board. (2013). Available at: http://bwssb.org/ (Accessed
August 10, 2014).
Berg, S. V. & Mugisha, S. (2010). Pro-poor water service strategies in developing countries:
Promoting justice in Uganda’s urban project. Water Policy, 12(4), 589-601.
Bond, P. & Dugard, J. (2008). The case of Johannesburg Water: What really happened at the pre-
paid ‘parish pump’? Law, Democracy, and Development, 12(1), 1-28.
Bruhat Bengaluru Mahanagara Palika. (2013). Available at:
http://www.vigeyegpms.in/bbmp/?module=public&action=wards (Accessed July 15, 2013).
Central Groundwater Board. (2008). Groundwater Information Booklet - Bangalore Urban
District, Karnataka. Ministry of Water Resources, Government of India, New Delhi.
Central Public Health and Environmental Engineering Organization. (1999). Manual on Water
Supply and Treatment. Ministry of Urban Development, Government of India, New Delhi.
Connors, G. & Brocklehurst, C. (2006). Connecting the Slums: A Utility's Pro-Poor Approach in
Bangalore. Water and Sanitation Program - South Asia, The World Bank, New Delhi.
Elshorst, H. & Leary, D. O. (2005). Corruption in the water sector: Opportunities for addressing
a pervasive problem. Paper Presented at the World Water Week, Stockholm, August 21-27.
Frauendorfer, R. & Liemberger, R. (2010). The Issues and Challenges of Reducing Non-Revenue
Water. Asian Development Bank, vii-42, Metro Manila.

27
González-Gómez, F., García-Rubio, M. A., & Guardiola, J. (2011). Why is non-revenue water so
high in so many cities? International Journal of Water Resources Development, 27(2), 345-360.
Kingdom, B., Liemberger, R., & Marin, P. (2006). The Challenge of Reducing Non-Revenue
Water (NRW) in Developing Countries How the Private Sector Can Help: A Look at
Performance-Based Service Contracting. Water Supply and Sanitation Sector Board Discussion
Paper Series: The World Bank, Washington, D.C.
Komives, K., Foster, V., Halpern, J., & Wodon, Q. (2005). Water, Electricity, and the Poor:
Who Benefits from Utility Subsidies? World Bank, Washington, D.C.
Kumar, N. S. (2013). Water Woes of Bangalore. Times of India.
Li, F. (2013). Do subsidized households receive low quality utility services? Electricity sector
cross-subsidies in Colombia. (Unpublished).
Madhusudhan, N. R. (2013). BWSSB plans water tariff hike. The New Indian Express.
Madhusudhan, N. R. (2013). BWSSB to sell tankers directly to households. The New Indian
Express.
Madhusudhan, N. R. (2013). Fund starved BWSSB wants 3 fold hike in water tariffs. The New
Indian Express.
Mathur, O. P., & Thakur, S. (2003). Urban Water Pricing: Setting the Stage for Reforms.
National Institute of Public Finance and Policy, New Delhi.
NIUA (2001). Tariffs and Subsidies. National Institute of Urban Affairs, Mumbai.
Planning Commission of India. (2012). Faster, More Inclusive and Sustainable Growth: Volume
1. Government of India, New Delhi.

28
Raghupati, U. P. & Foster, V. (2002). Water Tariffs & Subsidies in South Asia: A Scorecard for
India. Water and Sanitation Program - South Asia, The World Bank, Washington, D.C.
Ruiters, G. (2007). Contradictions in municipal services in contemporary South Africa:
Disciplinary commodification and self-disconnection. Critical Social Policy, 27(4), 487-508.
Saiful (2013). Prepaid Metering System in Irrigation. Agro and Farming blog site. Available
online: http://agricultureandfarming.wordpress.com/2013/01/01/prepaid-metering-system-in-
irrigation/ (Accessed October 14, 2014).
Singh, M. R., Upadhyay, V., & Mittal, A. K. (2005). Urban water tariff structure and cost
recovery: Opportunities in India. Water Science & Technology, 52(12), 43-51.
Stewart, R. A., Willis, R., Giurco, D., Panuwatwanich, K., & Capati, G. (2010). Web-based
knowledge management system: Linking smart metering to the future of urban water planning.
Australian Planner, 47(2), 66-74.
Times News Network. (2013). BWSSB hikes water rates for apartment residents. Times of India.
Wichelns, D. (2013). Enhancing the performance of water prices and tariff structures in
achieving socially desirable outcomes. International Journal of Water Resources Development,
29(3), 310-326.
Received 30 May 2014; accepted in revised form 21 September 2014. Available online
29
FIGURES
Figure 1. Unaccounted water loss and water available for revenue collection
Source: Authors’ analysis using secondary sources
1 indicates amount of water drawn from the Cauvery River at source, of which approximately 30% is lost in
transmission.
2 indicates water that is supplied through the city distribution system, of which nearly 20% is lost as NRW through
public stand posts.
3 indicates water left to be priced for revenue out of which an unknown proportion is lost due to leakages, illegal
connections, and faulty or defunct meters.
1 2 3
water lost 423 197
available water 987 790 790
0
200
400
600
800
1000
1200
1400
1600vo
lum
e o
f w
ate
r (M
LD)
Illustration showing available water to be charged
?
?

30
Figure 2. Location of survey wards
Source: Adapted from BBMP zone map

31
Figure 3. Graphical representation of increasing volumetric water pricing model
Source: Adapted from Wichelns (2012)
Note: Price 𝑃 is a step function of the volume of water consumed, 𝑄. 𝐶𝑃 is the cost of production which remains the
same for all blocks. 𝑃1, 𝑃2, and 𝑃3 represent the water tariff charged at each subsequent block of consumption. The
shaded area provides the total loss or gain