Michigan Greenhouse Gas Inventory 1990 and 2002
125
Michigan Greenhouse Gas Inventory 1990 and 2002 PREPARED FOR Michigan Department of Environmental Quality PREPARED BY Center for Sustainable Systems School of Natural Resources and Environment University of Michigan April 2005 Center for Sustainable Systems
Transcript of Michigan Greenhouse Gas Inventory 1990 and 2002
Michigan Greenhouse Gas Inventory 1990 and 2002
PREPARED FOR Michigan Department of Environmental Quality
PREPARED BY Center for Sustainable Systems
School of Natural Resources and Environment
University of Michigan
April 2005
Center for Sustainable Systems
PROJECT FUNDING This project was made possible through grants provided by these organizations: Energy Foundation DTE Energy Foundation Center for Sustainable Systems State of Michigan, Pollution Prevention Retired Engineer Technical Assistance Program (RETAP)
Student Internship Program Education Foundation of America RESEARCH PARTICIPANTS and ACKNOWLEDGEMENTS
Student Research Team: Colin McMillan, Master of Science in Engineering U-M Civil and Environmental Engineering Asako Yamamoto, Master of Science candidate U-M School of Natural Resources and Environment Pierre Bull, Master of Science candidate U-M School of Natural Resources and Environment Academic Project Advisor: Dr. Gregory A. Keoleian, Co-Director, Center for Sustainable Systems and Professor, U-M School of Natural Resources and Environment Center for Sustainable Systems: Helaine Hunscher, Center for Sustainable Systems Program Coordinator Michigan DEQ: David Mason, Environmental Quality Analyst, Modeling and Meteorology Unit, Air Quality Division Michigan Environmental Council: David Gard, Energy Policy Specialist U.S. EPA: Andrea Denny, Environmental Protection Specialist, State & Local Capacity Building Branch Acknowledgements Dr. David Ellsworth, Assistant Professor of Plant Ecophysiology, U-M School of Natural Resources and Environment
MICHIGAN GREENHOUSE GAS INVENTORY 1990 AND 2002
I
Table of Contents
Executive Summary ES 1
Methodology ES 2
Key Limitations ES 3
Key Findings ES 3
Conclusions ES 6
1. Introduction 1
1.1 Global Climate Change and the Role of Greenhouse Gases 2
1.2 Greenhouse Gases Inventoried 4
1.3 State-level Greenhouse Gas Inventories 6
1.4 Report Organization 7
2. Methodology 9
2.1 Emission Inventory Improvement Program 9
2.2 State Greenhouse Gas Inventory Tool 9
2.3 Quality Assurance / Quality Control Procedures 10
3. Energy 12
3.1 Carbon Dioxide Emissions from the Combustion of Fossil Fuels 14
End-Use Sector Consumption 21
Residential and Commercial End-Use Sectors 25
Industrial End-Use Sector 26
Transportation End-Use Sector 27
Electric Utility End-Use Sector 28
3.2 Methane and Nitrous Oxide Emissions from Mobile Combustion 29
3.3 Natural Gas and Oil Systems 35
MICHIGAN GREENHOUSE GAS INVENTORY 1990 AND 2002
II
3.4 Methane and Nitrous Oxide Emissions from Stationary Combustion 38
Residential Methane and Nitrous Oxide Emissions 43
Commercial Methane and Nitrous Oxide Emissions 44
Industrial Methane and Nitrous Oxide Emissions 44
Electric Utility Methane and Nitrous Oxide Emissions 44
4. Industrial Processes 45
4.1 Emissions Summary 46
4.2 Greenhouse Gas Intensity Analysis 51
4.3 Industrial Process Emissions Description 53
Iron and Steel 53
Cement Manufacture 54
Lime Manufacture 55
Limestone and Dolomite Use 56
Soda Ash Consumption 57
Semiconductor Manufacture 58
Substitution of Ozone Depleting Substances (ODS) 59
Magnesium Production and Casting 60
Electric Power Transmission and Distribution 61
Other Industrial Processes 62
5. Agriculture 63
5.1 Methane Emissions from Domesticated Animals 65
5.2 Manure Management 67
5.3 Agricultural Soil Management 71
5.4 Field Burning of Agricultural Residues 76
MICHIGAN GREENHOUSE GAS INVENTORY 1990 AND 2002
III
6. Land-Use Change 78
6.1 Liming of Agricultural Soils 78
6.2 Yard Trimmings 78
7. Waste 80
7.1 Municipal Solid Waste 82
7.2 Wastewater Treatment 88
8. Results and Conclusion 91
8.1 Michigan Greenhouse Gas Emissions 91
8.2 Emissions by Greenhouse Gas Type 92
8.3 Emissions by Economic Sectors 95
8.4 Comparisons with the United States 100
8.5 Recommendations for Future Action 104
References 106
MICHIGAN GREENHOUSE GAS INVENTORY 1990 AND 2002 EXECUTIVE SUMMARY
ES 1
Executive Summary
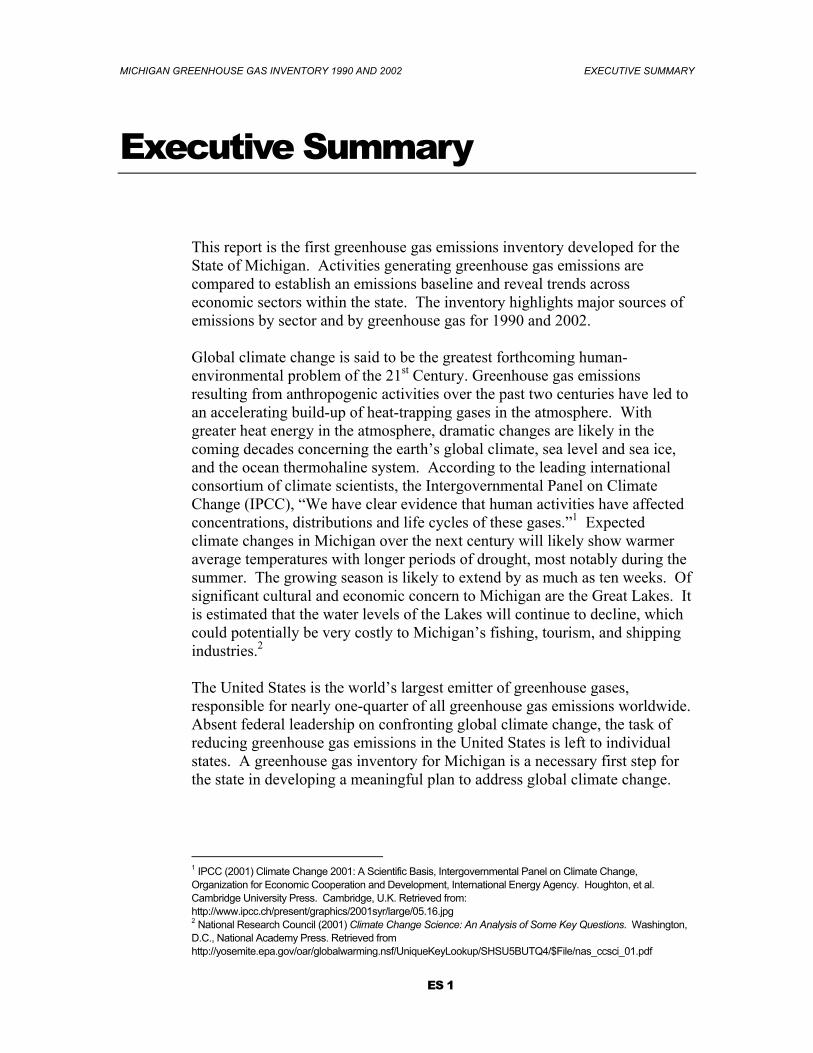
This report is the first greenhouse gas emissions inventory developed for the State of Michigan. Activities generating greenhouse gas emissions are compared to establish an emissions baseline and reveal trends across economic sectors within the state. The inventory highlights major sources of emissions by sector and by greenhouse gas for 1990 and 2002. Global climate change is said to be the greatest forthcoming human-environmental problem of the 21st Century. Greenhouse gas emissions resulting from anthropogenic activities over the past two centuries have led to an accelerating build-up of heat-trapping gases in the atmosphere. With greater heat energy in the atmosphere, dramatic changes are likely in the coming decades concerning the earth’s global climate, sea level and sea ice, and the ocean thermohaline system. According to the leading international consortium of climate scientists, the Intergovernmental Panel on Climate Change (IPCC), “We have clear evidence that human activities have affected concentrations, distributions and life cycles of these gases.”1 Expected climate changes in Michigan over the next century will likely show warmer average temperatures with longer periods of drought, most notably during the summer. The growing season is likely to extend by as much as ten weeks. Of significant cultural and economic concern to Michigan are the Great Lakes. It is estimated that the water levels of the Lakes will continue to decline, which could potentially be very costly to Michigan’s fishing, tourism, and shipping industries.2 The United States is the world’s largest emitter of greenhouse gases, responsible for nearly one-quarter of all greenhouse gas emissions worldwide. Absent federal leadership on confronting global climate change, the task of reducing greenhouse gas emissions in the United States is left to individual states. A greenhouse gas inventory for Michigan is a necessary first step for the state in developing a meaningful plan to address global climate change.
1 IPCC (2001) Climate Change 2001: A Scientific Basis, Intergovernmental Panel on Climate Change, Organization for Economic Cooperation and Development, International Energy Agency. Houghton, et al. Cambridge University Press. Cambridge, U.K. Retrieved from: http://www.ipcc.ch/present/graphics/2001syr/large/05.16.jpg 2 National Research Council (2001) Climate Change Science: An Analysis of Some Key Questions. Washington, D.C., National Academy Press. Retrieved from http://yosemite.epa.gov/oar/globalwarming.nsf/UniqueKeyLookup/SHSU5BUTQ4/$File/nas_ccsci_01.pdf
MICHIGAN GREENHOUSE GAS INVENTORY 1990 AND 2002 EXECUTIVE SUMMARY
ES 2
Methodology
This inventory report provides estimates of anthropogenic greenhouse gas emission sources and sinks in the State of Michigan in the years 1990 and 2002. It considers the most important anthropogenic greenhouse gases, which include carbon dioxide (CO2), methane (CH4), nitrous oxide (N2O), sulfur hexafluoride (SF6), perfluorocarbons (PFCs), and hydrofluorocarbons (HFCs). These gases have a wide range of relative radiative forcing effects3 once they are emitted to the earth’s atmosphere. Using CO2 as the standard unit, the other greenhouse gases measured in this inventory have relative radiative forcing coefficients ranging from twenty-one for CH4 to over three hundred for N2O to as high as twenty-four thousand for SF6 when compared to an equivalent amount of carbon dioxide. For accounting purposes, all gases were converted to the common metric known as the carbon equivalent. Data were acquired in accordance with methodologies outlined by the U.S. EPA’s State and Local Capacity Building Branch and the Emission Inventory Improvement Program (EIIP). The inventory research team employed the use of a Microsoft Excel spreadsheet-based emissions calculation tool, the State Greenhouse Gas Inventory Tool (SIT),4 as a means to organize collected data and thoroughly check the accuracy of the data. The SIT is divided into ten source-specific modules and includes a “synthesis module”, which is used to compile emissions estimates from the individual modules.
The State of Michigan Greenhouse Gas Inventory report is organized around the basic format identified by the IPCC.5 This framework groups source and sink categories into the following five sectors:
• Energy (Chapter 3): Total emissions from stationary and mobile energy activities.
• Industrial Processes (Chapter 4): Emissions from industrial processes, which are not associated with fuel combustion for energy.
• Agriculture (Chapter 5): Emissions from agricultural activities. • Land-Use Change (Chapter 6): Emissions and sequestration of CO2
resulting from land-use change, excluding forestry (addressed in Appendix I).
• Waste (Chapter 7): Emissions from solid waste and wastewater management activities.
3 Radiative forcing can be thought of as ‘heat-trapping ability’ of a particular greenhouse gas. 4 U.S. EPA, ICF Consulting (2004) State Greenhouse Gas Inventory Tool (8/3/2004 Version) [Computer software]. Washington, DC: U.S. EPA State and Local Climate Change Program 5 IPCC (1997) Revised 1996 IPCC Guidelines for National Greenhouse Gas Inventories: Reporting Instructions. Intergovernmental Panel on Climate Change, Organization for Economic Cooperation and Development, International Energy Agency.
MICHIGAN GREENHOUSE GAS INVENTORY 1990 AND 2002 EXECUTIVE SUMMARY
ES 3
Key Limitations
• The majority of emissions calculations relied on a combination of data specific to Michigan and data approximated from national data and trends. Key assumptions are defined in the report text and discussed in further detail in the Appendices. The accuracy of future greenhouse gas inventories could be improved by developing Michigan-specific data sources instead of relying on national data and trends.
• Since 1999, Michigan has imported roughly 10 percent of the electricity it
consumes annually. It was not possible to calculate with certainty the emissions from imported electricity for 2002 because an accurate figure was not yet available. An estimate was made, however, but was not included in the baseline inventory due to its uncertainty.
• Carbon sequestration by land use activities is included in this report;
however, forest activities were not included in the inventory results due to large uncertainties. A discussion of this issue is provided in Appendix I.
Key Findings
• Total Michigan greenhouse gas emissions amounted to 62.59 million metric tons carbon equivalent (MMTCE) in 2002 (Table ES-1). This represented an increase of 9.0 percent over the 1990 emissions baseline of 57.42 MMTCE.
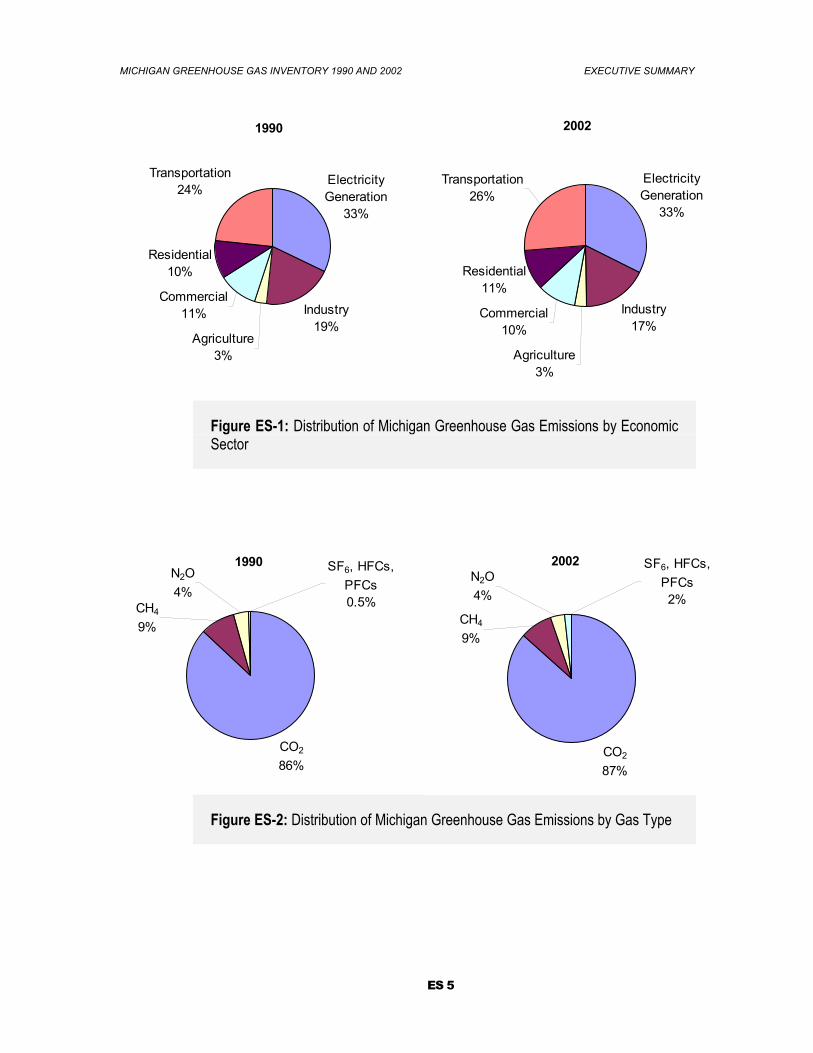
• The largest contributor to total emissions in 2002 and 1990 was the
electricity generation sector. Electricity generation accounted for 33 percent of total emissions in 2002 and 1990 (Figure ES-1). The second largest contributor for both years was the transportation sector. In 2002, industry contributed 17 percent to total emissions, a slight decline from a 19 percent contribution in 1990.
• Michigan greenhouse gas emissions were dominated by CO2 in both 2002
and 1990 (Figure ES-2). Emissions of high global warming potential gases (SF6, HFCs, and PFCs) were two percent of total emissions in 2002, an increase from the 1990 value of 0.5 percent. The contribution of these gases is expected to continuously increase in the coming decade.
MICHIGAN GREENHOUSE GAS INVENTORY 1990 AND 2002 EXECUTIVE SUMMARY
ES 4
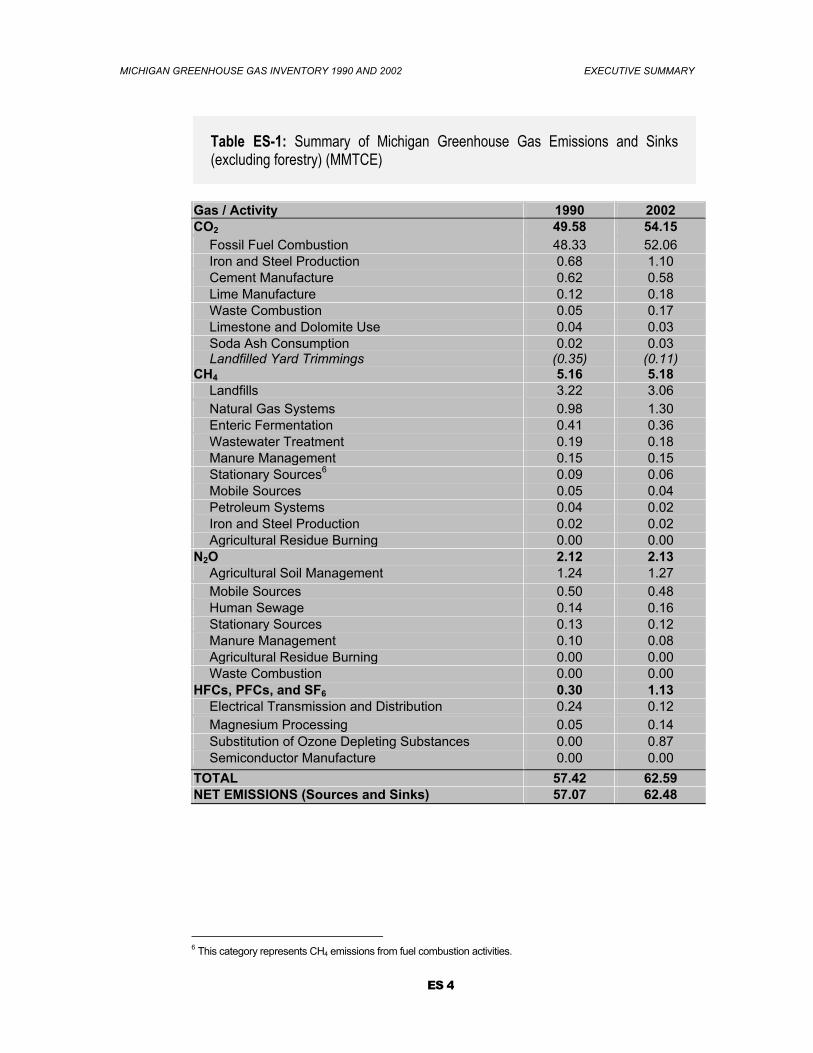
Table ES-1: Summary of Michigan Greenhouse Gas Emissions and Sinks (excluding forestry) (MMTCE)
Gas / Activity 1990 2002 CO2 49.58 54.15
Fossil Fuel Combustion 48.33 52.06 Iron and Steel Production 0.68 1.10 Cement Manufacture 0.62 0.58 Lime Manufacture 0.12 0.18 Waste Combustion 0.05 0.17 Limestone and Dolomite Use 0.04 0.03 Soda Ash Consumption 0.02 0.03 Landfilled Yard Trimmings (0.35) (0.11)
CH4 5.16 5.18 Landfills 3.22 3.06 Natural Gas Systems 0.98 1.30 Enteric Fermentation 0.41 0.36 Wastewater Treatment 0.19 0.18 Manure Management 0.15 0.15 Stationary Sources6 0.09 0.06 Mobile Sources 0.05 0.04 Petroleum Systems 0.04 0.02 Iron and Steel Production 0.02 0.02 Agricultural Residue Burning 0.00 0.00
N2O 2.12 2.13 Agricultural Soil Management 1.24 1.27 Mobile Sources 0.50 0.48 Human Sewage 0.14 0.16 Stationary Sources 0.13 0.12 Manure Management 0.10 0.08 Agricultural Residue Burning 0.00 0.00 Waste Combustion 0.00 0.00
HFCs, PFCs, and SF6 0.30 1.13 Electrical Transmission and Distribution 0.24 0.12 Magnesium Processing 0.05 0.14 Substitution of Ozone Depleting Substances 0.00 0.87 Semiconductor Manufacture 0.00 0.00
TOTAL 57.42 62.59 NET EMISSIONS (Sources and Sinks) 57.07 62.48
6 This category represents CH4 emissions from fuel combustion activities.
MICHIGAN GREENHOUSE GAS INVENTORY 1990 AND 2002 EXECUTIVE SUMMARY
ES 5
Electricity Generation
33%
Industry19%
Agriculture3%
Commercial11%
Residential10%
Transportation24%
1990
Figure ES-1: Distribution of Michigan Greenhouse Gas Emissions by Economic Sector
CO2
86%
N2O4%
CH4
9%
SF6, HFCs, PFCs0.5%
1990
Figure ES-2: Distribution of Michigan Greenhouse Gas Emissions by Gas Type
CO2
87%
N2O4%
CH4
9%
SF6, HFCs, PFCs2%
2002
Electricity Generation
33%
Industry17%
Agriculture3%
Commercial10%
Residential11%
Transportation26%
2002
MICHIGAN GREENHOUSE GAS INVENTORY 1990 AND 2002 EXECUTIVE SUMMARY
ES 6
• Michigan greenhouse gas emissions per capita increased from 6.17 MTCE in 1990 to 6.23 MTCE in 2002. As a point of reference, the national average was 6.57 MTCE per capita in 2002; however, this figure represents a more comprehensive inventory of emissions that estimates on the state level (please refer to Key Limitations).
• Michigan greenhouse gas emissions intensity was nearly equal to the national greenhouse gas emissions intensity of 0.19 kg carbon equivalent per dollar gross state product in 2002. Overall, Michigan emissions intensity has decreased 24.5 percent from 1990 to 2002. In 1990 the emissions intensity of Michigan was 0.24 kg carbon equivalent per dollar gross state product.
• Michigan greenhouse gas emissions accounted for 3.3 percent of total U.S. greenhouse gas emissions in 2002 and 3.4 percent of total U.S. greenhouse gas emissions in 1990.
Conclusions
This inventory was developed as a resource for government, the public, and businesses in the state to assist in developing policies and implementing strategies to reduce greenhouse gas emissions. Our results show that Michigan had a 9.0 percent increase in greenhouse gas emissions between 1990 and 2002 (Table ES-1). Understanding the differences in emissions between these two years is complex due to simultaneous changes in economic activity and the technology mix that affects carbon intensity. A major portion of this report disaggregates emissions into economic-delineated categories to allow for more in-depth analysis of emission trends over this twelve-year period. Table ES-1 shows that emissions of CO2 from fossil fuel combustion dominated all other categories, responsible for over 85 percent of the state’s total. Within the category of CO2 emissions from fossil fuel combustion, electricity production made up the largest percentage for both 1990 and 2002. Mobile combustion of fossil fuels made up the largest absolute gain in emissions over this period. The growing prevalence of lower fuel-efficient vehicles such as sport-utility vehicles and light-duty trucks along with an increasing rate of vehicle miles traveled per capita likely explains much of the rise in emissions from mobile combustion. Industry showed the largest absolute decline in emissions, which likely reflects energy efficiency and carbon intensity improvements in some industries. The category that exhibited the largest percentage gain in emissions was from industrial manufacture of substitute chemicals of Ozone Depleting Substances (ODS). Even though emissions from industrial output accounted for less than
MICHIGAN GREENHOUSE GAS INVENTORY 1990 AND 2002 EXECUTIVE SUMMARY
ES 7
two percent of the state’s total emissions, these ODS substitutes have very high individual global warming potentials. Unless a set of non-ODS substitutes are found with benign global warming potentials, then it is expected that emissions from ODS substitutes will continue to rise. CH4 emissions from landfill solid waste was the highest non-CO2, non-fossil fuel based emission category. Despite a 40 percent increase in landfill waste from 1990 to 2002, the emissions of CH4 from Michigan solid waste actually showed a slight decrease over this time period. Viewed as a win-win action toward mitigating Michigan solid waste emissions, the increase in landfill gas flaring and landfill gas-to-energy projects (recognized as a source of green power) have proven to be an economically profitable method to reduce the environmental burden associated with the release of landfill CH4. Land use activities and forestry practices also have significant potential as an offset of carbon emissions in the state. Results from the forestry sector were not included in this inventory due to uncertainty surrounding accounting methods and estimates of carbon sequestration rates by forestry activities. Despite the lack of national policy to address greenhouse gas emissions and climate change to this point, state and local governments have stepped up efforts to take action to reduce emissions. It is important to consider that most climate scientists think that the emissions reductions called for by the Kyoto Protocol will not be enough to prevent a significant rise in global temperature. The Protocol calls for a reduction of 7 percent reduction of U.S. greenhouse gas emissions by 2012, yet climate models show that a 50 percent reduction in global emissions by the middle of the next decade is required in order to stabilize global climate warming by 2100.7 Results from this report should foster the logical next step to formulate a state-level greenhouse gas reduction plan. As of May 2004, 29 states had developed State Action Plans specifically targeting greenhouse gas emissions reductions.8 Such a plan could simultaneously move Michigan toward a cleaner, more secure energy infrastructure and contribute towards mitigating greenhouse gas emissions on a global scale. Additionally, a strong economic argument can be made for the state to confront greenhouse gas emissions today as a hedge against the likelihood of future national and international policies that could impact some of Michigan’s most vital industries.
7 IPCC (1997) Revised 1996 IPCC Guidelines for National Greenhouse Gas Inventories: Reporting Instructions. Intergovernmental Panel on Climate Change, Organization for Economic Cooperation and Development, International Energy Agency. 8 U.S. EPA (2004) State Greenhouse Gas Inventories. Retrieved Jan. 2005 from http://yosemite.epa.gov/OAR/globalwarming.nsf/content/EmissionsStateGHGInventories.html
MICHIGAN GREENHOUSE GAS INVENTORY 1990 AND 2002 1 - INTRODUCTION
1
1. Introduction
This inventory report provides estimates of anthropogenic greenhouse gas emission sources and sinks in the State of Michigan from the years 1990 and 2002. The inventory was conducted in accordance with methods and reporting standards established by the U.S. Environmental Protection Agency. The U.S. EPA has adopted the guidelines set forth by the internationally recognized Intergovernmental Panel on Climate Change (IPCC) Revised 1996 IPCC Guidelines for National Greenhouse Gas Inventories, as well as the Good Practice Guidance and Uncertainty Management in National Greenhouse Gas Inventories. State of Michigan greenhouse gas emissions estimates are reported in the following ways:
Statewide: Estimates of total emissions for the entire State of Michigan IPCC-Delineated Sectors: Emission estimates from five sectors – energy, industrial processes, agriculture, forestry, and waste. Each of these sectors is further categorized into smaller source categories that served as organizing units for data collection purposes. Economic-Delineated Sectors: Emissions estimates categorized by electricity generation, agriculture, commercial, industry, residential, transportation, and land-use change and forestry. By Greenhouse Gas Type: Six major greenhouse gas emissions are required by the 1992 United Nations Framework on Climate Change (NFCCC) Agreement to be included in national emissions inventories: carbon dioxide (CO2), methane (CH4), nitrous oxide (N2O), perfluorocarbons (PFCs), hydrofluorocarbons (HFCs), and sulfur hexafluoride (SF6). Temporal Scale: The report presents emission estimates from 1990 and 2002.
MICHIGAN GREENHOUSE GAS INVENTORY 1990 AND 2002 1 - INTRODUCTION
2
1.1 Global Climate Change and the Role of Greenhouse Gases
According to the National Academy of Sciences, climate can be described as:
…the average state of the atmosphere and the underlying land or water, on time scales of seasons or longer. Climate is typically described by the statistics of a set of atmospheric and surface variables such as temperature, precipitation, wind, humidity, cloudiness, soil moisture, sea surface temperature, and the concentration and thickness of sea ice.1
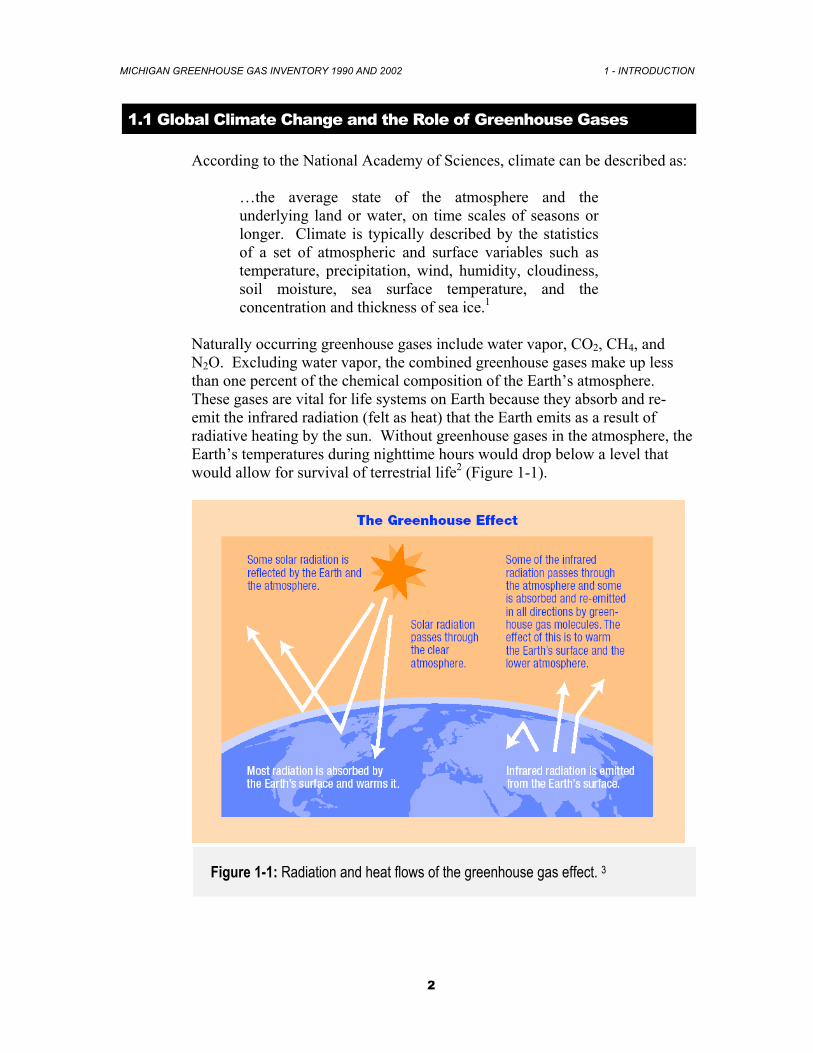
Naturally occurring greenhouse gases include water vapor, CO2, CH4, and N2O. Excluding water vapor, the combined greenhouse gases make up less than one percent of the chemical composition of the Earth’s atmosphere. These gases are vital for life systems on Earth because they absorb and re-emit the infrared radiation (felt as heat) that the Earth emits as a result of radiative heating by the sun. Without greenhouse gases in the atmosphere, the Earth’s temperatures during nighttime hours would drop below a level that would allow for survival of terrestrial life2 (Figure 1-1).
Figure 1-1: Radiation and heat flows of the greenhouse gas effect. 3
MICHIGAN GREENHOUSE GAS INVENTORY 1990 AND 2002 1 - INTRODUCTION
3
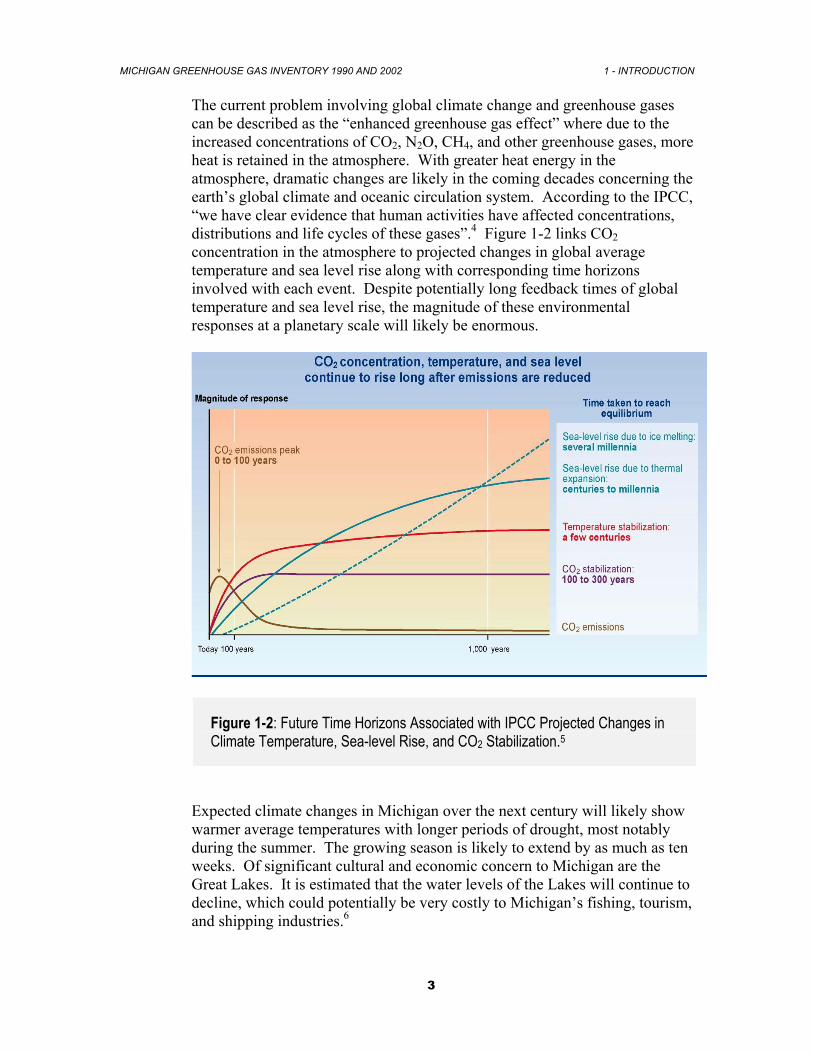
The current problem involving global climate change and greenhouse gases can be described as the “enhanced greenhouse gas effect” where due to the increased concentrations of CO2, N2O, CH4, and other greenhouse gases, more heat is retained in the atmosphere. With greater heat energy in the atmosphere, dramatic changes are likely in the coming decades concerning the earth’s global climate and oceanic circulation system. According to the IPCC, “we have clear evidence that human activities have affected concentrations, distributions and life cycles of these gases”.4 Figure 1-2 links CO2 concentration in the atmosphere to projected changes in global average temperature and sea level rise along with corresponding time horizons involved with each event. Despite potentially long feedback times of global temperature and sea level rise, the magnitude of these environmental responses at a planetary scale will likely be enormous.
Figure 1-2: Future Time Horizons Associated with IPCC Projected Changes in Climate Temperature, Sea-level Rise, and CO2 Stabilization.5
Expected climate changes in Michigan over the next century will likely show warmer average temperatures with longer periods of drought, most notably during the summer. The growing season is likely to extend by as much as ten weeks. Of significant cultural and economic concern to Michigan are the Great Lakes. It is estimated that the water levels of the Lakes will continue to decline, which could potentially be very costly to Michigan’s fishing, tourism, and shipping industries.6
MICHIGAN GREENHOUSE GAS INVENTORY 1990 AND 2002 1 - INTRODUCTION
4
1.2 Greenhouse Gases Inventoried
For accounting purposes, all gases were converted to the common metric known as the carbon equivalent. The second column of Table 1-1, “100-year GWP” shows the coefficient values used to convert non-CO2 gases to a carbon equivalent.1 This report uses the international metric scale and commonly refers to carbon equivalents as million metric tons of carbon equivalent (MMTCE). For this report, the carbon equivalent weights factored into each type of greenhouse gas were acquired from the IPCC Second Assessment Report (SAR). In 2001, the IPCC released an updated version of carbon equivalent weights in its Third Assessment Report (TAR) that adjusted for the radiative forcing of a number of greenhouse gases including carbon dioxide, which was lowered by twelve percent from SAR values. Using the SAR values is consistent with the U.S. EPA greenhouse gas reporting measures. Each of the gases listed below are accounted for in this report. Carbon dioxide (CO2): Atmospheric CO2 is part of the global carbon cycle and its concentration represents a steady state of dynamic flows that occur from natural biogeochemical processes. Since the industrial revolution of the 19th Century, global concentration of carbon dioxide has increased from 280 parts per million (ppm) in pre-industrial times to 372.3 ppm in 2001, representing a 33 percent increase. The IPCC has attributed this increase almost entirely to anthropogenic emissions as a result of combustion of fossil fuels and other sources including forest clearing, burning of biomass, and production of cement. Methane (CH4): Naturally occurring CH4 emissions to the atmosphere result from the anaerobic decomposition of organic matter in biological systems. Agricultural processes in Michigan that contribute to CH4 emissions include enteric fermentation in domesticated animals, manure management, decomposition of municipal solid wastes, fugitive emissions from natural gas and petroleum production and distribution, and a small amount from incomplete combustion of fossil fuels. IPCC estimates that over half the amount of total current CH4 in the atmosphere is from human activities. Pre-industrial atmospheric concentration of CH4 was at 0.722 ppm and has increased nearly 150 percent to 1.786 ppm.
1Referred to as the “global warming potential” (GWP), non-CO2 gases are assigned a coefficient multiplier value to reflect the differences in radiative forcing of each type of greenhouse gas over a 100-year period. Radiative forcing refers to the magnitude of heat energy capture specific to each of the atmospheric greenhouse gases.
MICHIGAN GREENHOUSE GAS INVENTORY 1990 AND 2002 1 - INTRODUCTION
5
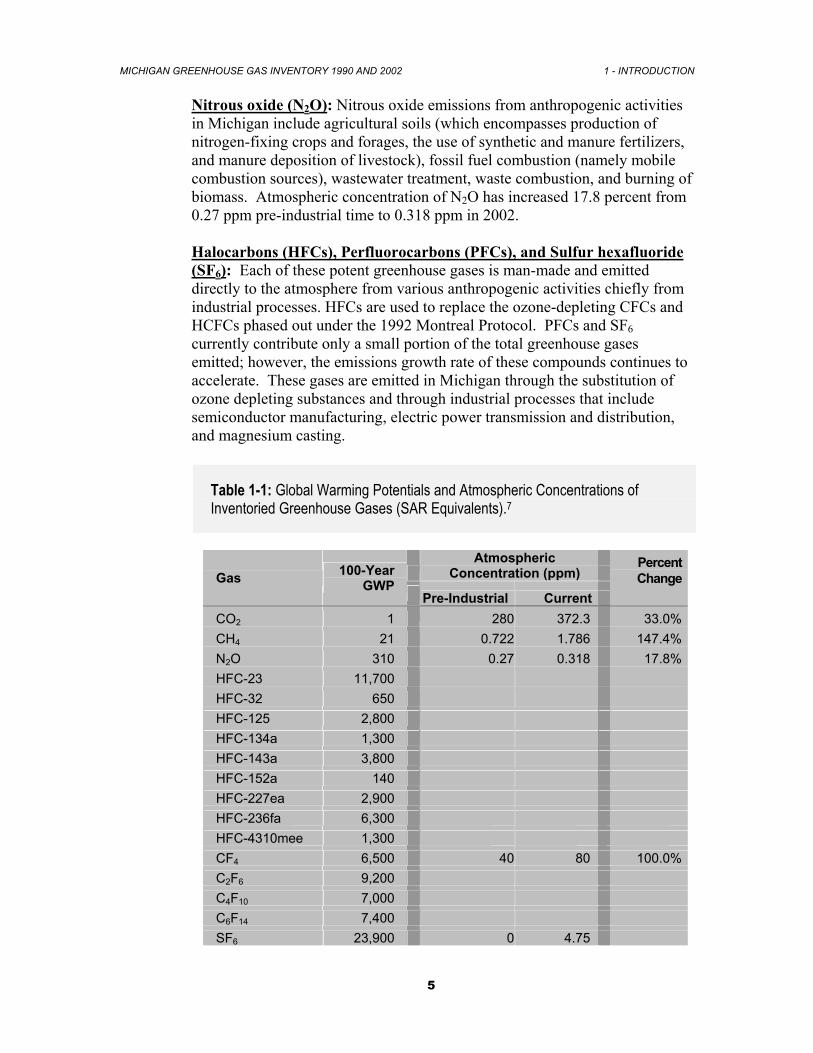
Nitrous oxide (N2O): Nitrous oxide emissions from anthropogenic activities in Michigan include agricultural soils (which encompasses production of nitrogen-fixing crops and forages, the use of synthetic and manure fertilizers, and manure deposition of livestock), fossil fuel combustion (namely mobile combustion sources), wastewater treatment, waste combustion, and burning of biomass. Atmospheric concentration of N2O has increased 17.8 percent from 0.27 ppm pre-industrial time to 0.318 ppm in 2002. Halocarbons (HFCs), Perfluorocarbons (PFCs), and Sulfur hexafluoride (SF6): Each of these potent greenhouse gases is man-made and emitted directly to the atmosphere from various anthropogenic activities chiefly from industrial processes. HFCs are used to replace the ozone-depleting CFCs and HCFCs phased out under the 1992 Montreal Protocol. PFCs and SF6 currently contribute only a small portion of the total greenhouse gases emitted; however, the emissions growth rate of these compounds continues to accelerate. These gases are emitted in Michigan through the substitution of ozone depleting substances and through industrial processes that include semiconductor manufacturing, electric power transmission and distribution, and magnesium casting.
Table 1-1: Global Warming Potentials and Atmospheric Concentrations of Inventoried Greenhouse Gases (SAR Equivalents).7
Atmospheric Concentration (ppm) Gas 100-Year
GWP Pre-Industrial Current
Percent Change
CO2 1 280 372.3 33.0%CH4 21 0.722 1.786 147.4%N2O 310 0.27 0.318 17.8%HFC-23 11,700 HFC-32 650 HFC-125 2,800 HFC-134a 1,300 HFC-143a 3,800 HFC-152a 140 HFC-227ea 2,900 HFC-236fa 6,300 HFC-4310mee 1,300 CF4 6,500 40 80 100.0%C2F6 9,200 C4F10 7,000 C6F14 7,400 SF6 23,900 0 4.75
MICHIGAN GREENHOUSE GAS INVENTORY 1990 AND 2002 1 - INTRODUCTION
6
1.3 State-level Greenhouse Gas Inventories
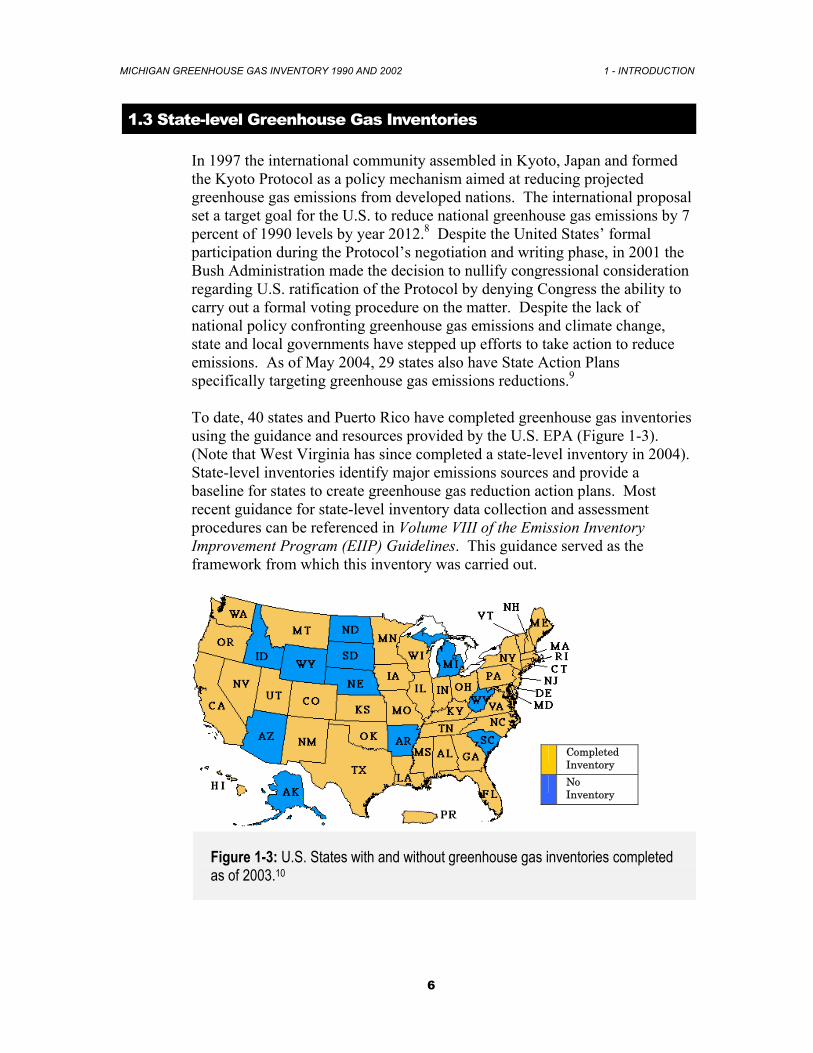
In 1997 the international community assembled in Kyoto, Japan and formed the Kyoto Protocol as a policy mechanism aimed at reducing projected greenhouse gas emissions from developed nations. The international proposal set a target goal for the U.S. to reduce national greenhouse gas emissions by 7 percent of 1990 levels by year 2012.8 Despite the United States’ formal participation during the Protocol’s negotiation and writing phase, in 2001 the Bush Administration made the decision to nullify congressional consideration regarding U.S. ratification of the Protocol by denying Congress the ability to carry out a formal voting procedure on the matter. Despite the lack of national policy confronting greenhouse gas emissions and climate change, state and local governments have stepped up efforts to take action to reduce emissions. As of May 2004, 29 states also have State Action Plans specifically targeting greenhouse gas emissions reductions.9 To date, 40 states and Puerto Rico have completed greenhouse gas inventories using the guidance and resources provided by the U.S. EPA (Figure 1-3). (Note that West Virginia has since completed a state-level inventory in 2004). State-level inventories identify major emissions sources and provide a baseline for states to create greenhouse gas reduction action plans. Most recent guidance for state-level inventory data collection and assessment procedures can be referenced in Volume VIII of the Emission Inventory Improvement Program (EIIP) Guidelines. This guidance served as the framework from which this inventory was carried out.
Figure 1-3: U.S. States with and without greenhouse gas inventories completed as of 2003.10
Completed Inventory No Inventory
MICHIGAN GREENHOUSE GAS INVENTORY 1990 AND 2002 1 - INTRODUCTION
7
1.4 Report Organization
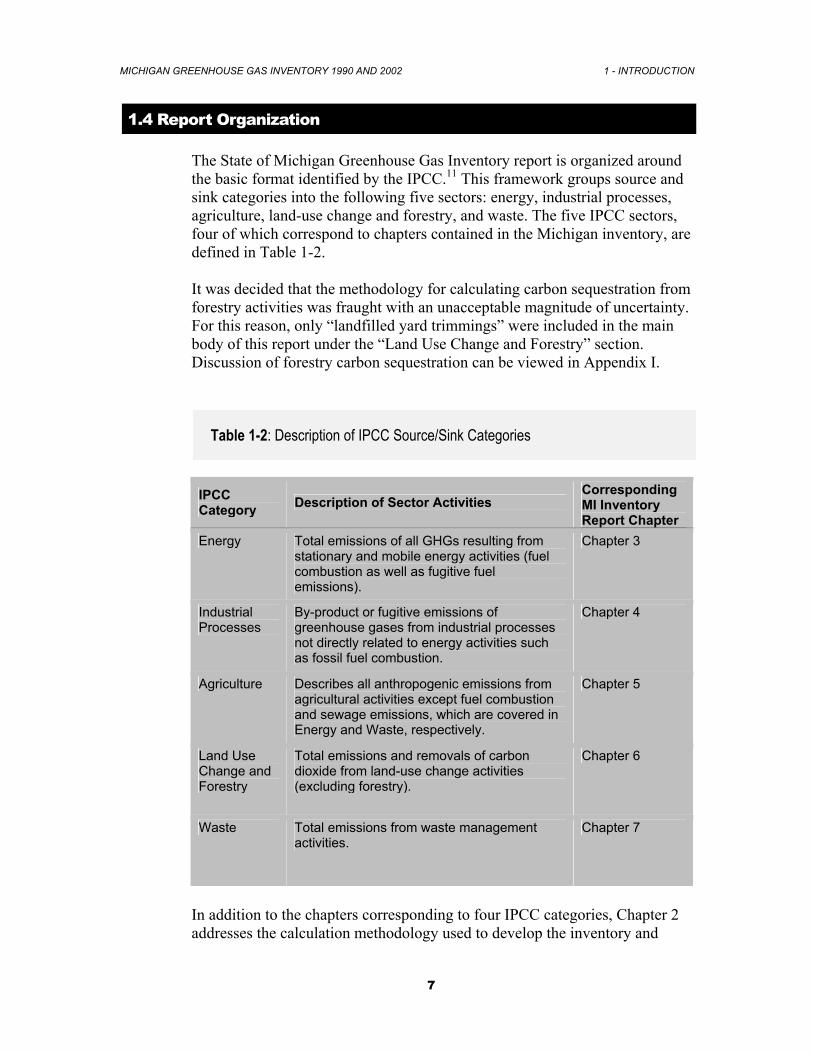
The State of Michigan Greenhouse Gas Inventory report is organized around the basic format identified by the IPCC.11 This framework groups source and sink categories into the following five sectors: energy, industrial processes, agriculture, land-use change and forestry, and waste. The five IPCC sectors, four of which correspond to chapters contained in the Michigan inventory, are defined in Table 1-2. It was decided that the methodology for calculating carbon sequestration from forestry activities was fraught with an unacceptable magnitude of uncertainty. For this reason, only “landfilled yard trimmings” were included in the main body of this report under the “Land Use Change and Forestry” section. Discussion of forestry carbon sequestration can be viewed in Appendix I.
Table 1-2: Description of IPCC Source/Sink Categories
IPCC Category Description of Sector Activities
Corresponding MI Inventory Report Chapter
Energy Total emissions of all GHGs resulting from stationary and mobile energy activities (fuel combustion as well as fugitive fuel emissions).
Chapter 3
Industrial Processes
By-product or fugitive emissions of greenhouse gases from industrial processes not directly related to energy activities such as fossil fuel combustion.
Chapter 4
Agriculture Describes all anthropogenic emissions from agricultural activities except fuel combustion and sewage emissions, which are covered in Energy and Waste, respectively.
Chapter 5
Land Use Change and Forestry
Total emissions and removals of carbon dioxide from land-use change activities (excluding forestry).
Chapter 6
Waste Total emissions from waste management activities.
Chapter 7
In addition to the chapters corresponding to four IPCC categories, Chapter 2 addresses the calculation methodology used to develop the inventory and

MICHIGAN GREENHOUSE GAS INVENTORY 1990 AND 2002 1 - INTRODUCTION
8
Chapter 7 contains inventory summary and conclusions. Lastly, the report appendices include additional details on calculation methodology, as well as the quality assurance/quality control plan and list of acronyms and chemical formulas.
MICHIGAN GREENHOUSE GAS INVENTORY 1990 AND 2002 2 - METHODOLOGY
9
2. Methodology
2.1 Emission Inventory Improvement Program
The State of Michigan’s greenhouse gas inventory employed a set of methodologies outlined by the U.S. EPA’s State and Local Capacity Building Branch and the Emission Inventory Improvement Program (EIIP). Known as Volume VIII: Estimating Greenhouse Gas Emissions, the purpose of the guidance document is to “present estimation techniques for greenhouse gas (GHG) sources and sinks in a clear and unambiguous manner and to provide concise calculations to aid in the preparation of emission inventories.”12
The methodologies contained in the EIIP guidance were adapted from Volumes 1-3 of the Revised 1996 IPCC Guidelines for National Greenhouse gas Inventories, the IPPC Good Practice Guidance, and the Inventory of U.S. Greenhouse Gas Emissions and Sinks: 1990 – 2000. Many of the methodologies in the EIIP guidance document are consistent with IPCC methodology and, where possible, default IPCC methodologies have been expanded into more comprehensive, U.S.-specific methods. Where EIIP methodologies do differ from the U.S. inventory and the IPCC, it is because “the data needed to follow the U.S. or IPCC methods are unavailable at the state level.”13 In this inventory report, detailed descriptions of the calculation methodologies used, as well as presentations of activity data and emissions factors, are contained in the Appendices.
2.2 State Greenhouse Gas Inventory Tool
Accompanying the EIIP guidance document is a Microsoft Excel spreadsheet-based emissions calculation tool, the State Greenhouse Gas Inventory Tool (SIT).14 Meant to improve the ease and accuracy of estimating state GHG emissions, the SIT calculates annual emissions based on imbedded, default data or user-imputed, state-specific data. Wherever possible, the GHG emissions inventory for the State of Michigan attempted to maximize the use of state-specific data.
The SIT is divided into ten source-specific modules and includes a “synthesis module”, which is used to compile emissions estimates from the individual modules. Since neither coal mining, nor rice cultivation activities occur in Michigan, the Methane Emissions from Coal Mining and Methane Emissions
MICHIGAN GREENHOUSE GAS INVENTORY 1990 AND 2002 2 - METHODOLOGY
10
from Rice Cultivation SIT modules were not utilized. Lastly, the SIT does not address GHG emissions from the iron and steel industry. It was believed that emissions from this source would represent a significant portion of industry-related emissions. Separate calculation methodologies were adapted from the U.S. EPA and the IPCC.
2.3 Quality Assurance / Quality Control Procedures
Quality assurance (QA) activities are essential to the development of comprehensive, high-quality emissions inventories of any purpose. The QA program for the State of Michigan greenhouse gas inventory is comprised of two components: quality control (QC) and external quality assurance. The complete QA / QC plan is provided as Appendix A.
The first component is that of QC, which is “a system of routine technical activities implemented by inventory development personnel to measure and control the quality of the inventory as it is being developed.”15 The QC system is designed to:
Provide routine and consistent checks and documentation points in the
inventory development process to verify data integrity, correctness, and completeness;
Identify and reduce errors and omissions; Maximize consistency within the inventory preparation and
documentation process; and Facilitate internal and external inventory review processes.16
QC activities include technical reviews, accuracy checks, and the use of approved standardized procedures for emission calculations. These activities should be included in inventory development planning, data collection and analysis, emission calculations, and reporting.
The second component of a QA program consists of external QA activities, which include a planned system of review and audit procedures conducted by personnel not actively involved in the inventory development process. The key concept of this component is independent, objective review by a third party to assess the effectiveness of the internal QC program and the quality of the inventory, and to reduce or eliminate any inherent bias in the inventory processes. In addition to promoting the objectives of the QC system, a comprehensive QA review program provides the best available indication of the inventory’s overall quality completeness, accuracy, precision, representativeness, and comparability of data gathered.
For the purposes of this inventory, specific QC procedures were implemented for the following project stages: data collection and handling; emission calculations; and final report writing. The majority of these procedures

MICHIGAN GREENHOUSE GAS INVENTORY 1990 AND 2002 2 - METHODOLOGY
11
address documentation and data verification practices. Of particular importance to the project were documentation procedures. One of the major goals of this project was that after completing the initial inventory, archived documentation would be of sufficient detail to allow outside parties to fully recreate the inventory.
MICHIGAN GREENHOUSE GAS INVENTORY 1990 AND 2002 3 - ENERGY
12
3. Energy
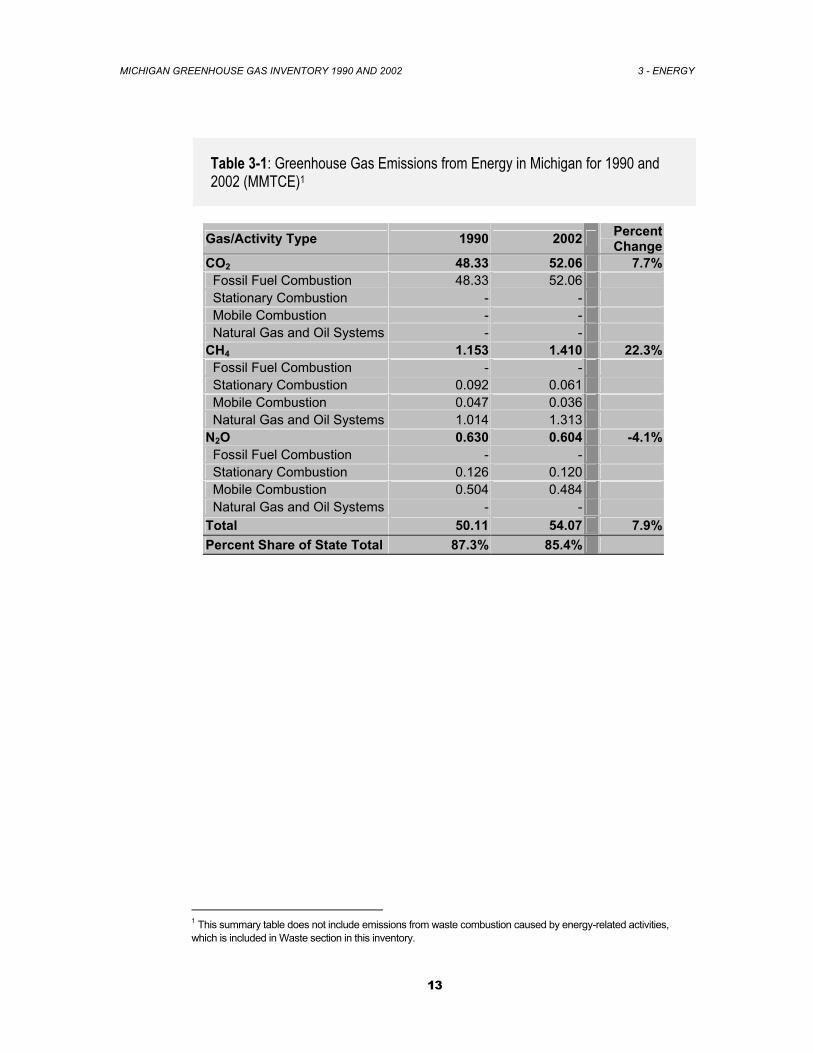
Energy-related activities were the largest sources of the state’s anthropogenic greenhouse gas emissions, accounting for more than 85 percent of total emissions on a carbon equivalent basis in 1990 and 2002 (Table 3-1). This included more than 95 percent of the state’s carbon dioxide (CO2), 22-27 percent of methane (CH4) and 28-30 percent of nitrous oxide (N2O) emissions. Energy-related CO2 emissions alone constituted more than 80 percent of the state’s emissions from all sources, while the non-CO2 emissions from energy related activities represented a much smaller portion of total state emissions (approximately three percent collectively). Table 3-1 summarizes emissions from energy-related activities in units of MMTCE. Overall emissions from these activities increased 7.9 percent from 50.11 MMTCE in 1990 to 54.07 MMTCE in 2002.
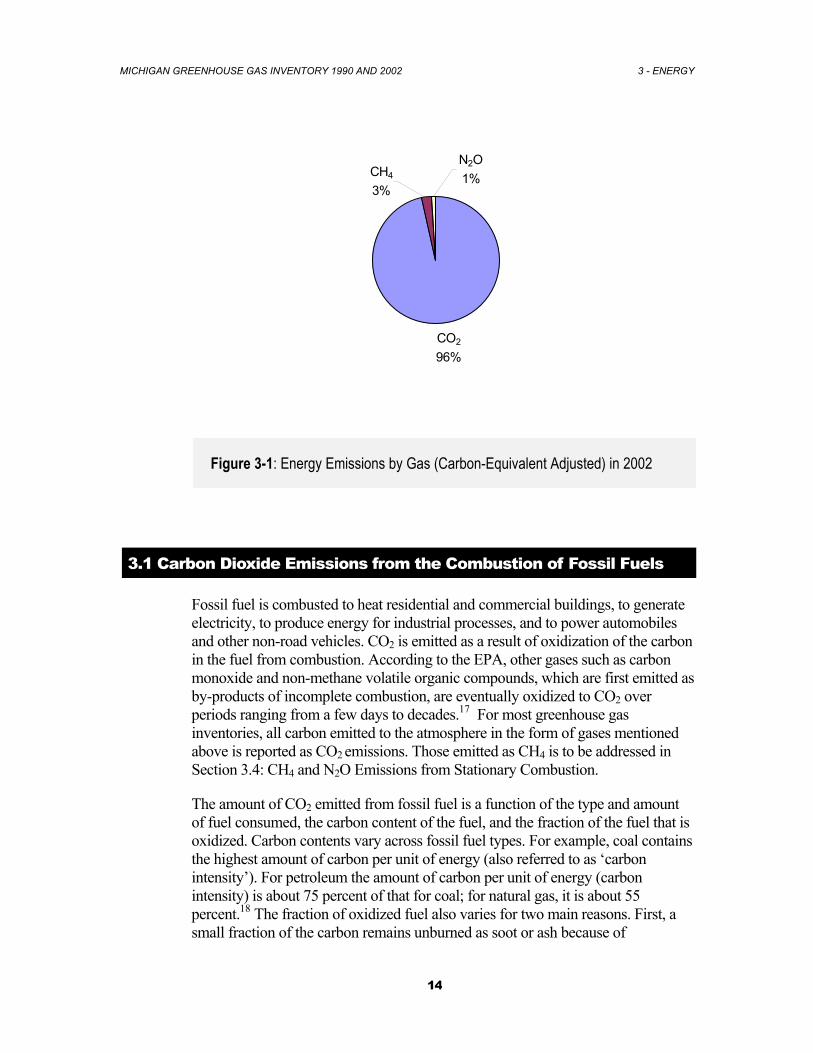
Emissions from fossil fuel combustion comprised the vast majority of energy-related emissions. As the Figure 3-1 shows, CO2 was the primary gas emitted, while CH4 and N2O accounted for less than five percent collectively of the total greenhouse gas emissions from this source category. Due to the relative importance of fossil fuel combustion-related CO2 emissions, they are considered separately from other energy-related emissions in Section 3.1. Fossil fuel combustion also emits CH4 and N2O, which are to be addressed in Section 3.2 for mobile combustion (emissions of these gases from the transportation sector) and Section 3.4 for stationary combustion (those from all the other end-use sectors). Energy-related activities other than fuel combustion, such as the production, transmission, storage, and distribution of fossil fuels, also emit greenhouse gases. These emissions consist primarily of fugitive CH4 from natural gas systems and petroleum systems, which is to be discussed in Section 3.3, Natural Gas and Oil Systems.
MICHIGAN GREENHOUSE GAS INVENTORY 1990 AND 2002 3 - ENERGY
13
Table 3-1: Greenhouse Gas Emissions from Energy in Michigan for 1990 and 2002 (MMTCE)1
Gas/Activity Type 1990 2002 Percent Change
CO2 48.33 52.06 7.7% Fossil Fuel Combustion 48.33 52.06 Stationary Combustion - - Mobile Combustion - - Natural Gas and Oil Systems - - CH4 1.153 1.410 22.3% Fossil Fuel Combustion - - Stationary Combustion 0.092 0.061 Mobile Combustion 0.047 0.036 Natural Gas and Oil Systems 1.014 1.313 N2O 0.630 0.604 -4.1% Fossil Fuel Combustion - - Stationary Combustion 0.126 0.120 Mobile Combustion 0.504 0.484 Natural Gas and Oil Systems - - Total 50.11 54.07 7.9%Percent Share of State Total 87.3% 85.4%
1 This summary table does not include emissions from waste combustion caused by energy-related activities, which is included in Waste section in this inventory.
MICHIGAN GREENHOUSE GAS INVENTORY 1990 AND 2002 3 - ENERGY
14
CO2
96%
N2O1%CH4
3%
Figure 3-1: Energy Emissions by Gas (Carbon-Equivalent Adjusted) in 2002
3.1 Carbon Dioxide Emissions from the Combustion of Fossil Fuels
Fossil fuel is combusted to heat residential and commercial buildings, to generate electricity, to produce energy for industrial processes, and to power automobiles and other non-road vehicles. CO2 is emitted as a result of oxidization of the carbon in the fuel from combustion. According to the EPA, other gases such as carbon monoxide and non-methane volatile organic compounds, which are first emitted as by-products of incomplete combustion, are eventually oxidized to CO2 over periods ranging from a few days to decades.17 For most greenhouse gas inventories, all carbon emitted to the atmosphere in the form of gases mentioned above is reported as CO2 emissions. Those emitted as CH4 is to be addressed in Section 3.4: CH4 and N2O Emissions from Stationary Combustion.
The amount of CO2 emitted from fossil fuel is a function of the type and amount of fuel consumed, the carbon content of the fuel, and the fraction of the fuel that is oxidized. Carbon contents vary across fossil fuel types. For example, coal contains the highest amount of carbon per unit of energy (also referred to as ‘carbon intensity’). For petroleum the amount of carbon per unit of energy (carbon intensity) is about 75 percent of that for coal; for natural gas, it is about 55 percent.18 The fraction of oxidized fuel also varies for two main reasons. First, a small fraction of the carbon remains unburned as soot or ash because of
MICHIGAN GREENHOUSE GAS INVENTORY 1990 AND 2002 3 - ENERGY
15
inefficiencies in combustion. Second, fossil fuels are also used for non-energy purposes, primarily as a feedstock for such products as petrochemicals, plastics fertilizer, lubricants, and asphalt. In some cases, as in fertilizer production, the carbon from the fuels is oxidized immediately to CO2. In other cases, as in asphalt production, the carbon is sequestered in the product for centuries.19
Required Data
CO2 emissions from fossil fuel combustion are influenced by the type and amount of fuel consumed, the carbon content of the fuel, and the fraction of the fuel that is oxidized. Therefore, less accuracy and precision in these parameters increases uncertainty in the overall estimate of CO2. The EPA indicates, however, that the uncertainties associated with carbon contents and oxidation efficiencies are lower than those associated with fuel consumption data.20
To calculate CO2 emissions from fossil fuel combustion for 1990, state-level fuel consumption for five end-use categories (residential, commercial, industrial, transportation and electric utilities) were collected from the Department of Energy, Energy Information Administration (EIA)’s consumption data.21 Due to the timing of the research for this project, no comprehensive energy data for Michigan in 2002 had been compiled by EIA. Therefore, the Annual Coal Report 200222 and Annual Natural Gas Report 2002 23were referred to as data sources for coal and natural gas consumption figures. For petroleum-based fuels and wood, the EIA’s historical consumption data for 1990-2001 were used to estimate values for 2002. Although we could obtain a very likely figure for 2002 CO2 emission from the estimation process, it should be corrected in a future research when more accurate data are published by the EIA.
According to the EPA, there is more uncertainty within data on total fossil fuel and other energy consumption at the state level, than those at the national level, which are considered relatively accurate. In particular, “the allocation of this consumption to individual end-use sectors (i.e., residential, commercial, industrial, and transportation)” introduces more uncertainty at the state level than at the national level.24
The absence of emission estimates from international bunker fuels may also have some impacts on the emission estimation from this source category. International inventory practices recommend that emissions from international bunkers may be calculated and reported separately from the state’s total emission by the state of origin, if state-level data are available. However, due to practical difficulty in doing this calculation at the state level, this inventory does not include a report on emissions from international bunker fuel, which could overestimate or underestimate emissions of these fuels.25
In addition, we have not incorporated emissions from net electricity import/export, which should be another contributor to uncertainty. According
MICHIGAN GREENHOUSE GAS INVENTORY 1990 AND 2002 3 - ENERGY
16
to the EPA’s eGRID database, Michigan has turned to be a net electricity importer since 1997, importing constantly around 10 percent of total consumption from 1999 to 2000. Although 2001 and 2002 data are not available, the trend presumably continued also in 2002. If the net imported amount were accurately known, that would increase the state’s CO2 emissions from the electricity sector.
Methodology
Carbon emissions from fossil fuels for 1990 and 2002 were calculated using the EIIP guidelines and the State Inventory Tool (SIT). Consumption data that were originally provided in physical units such as barrels and short tons were converted to British thermal units (Btu) by factors supplied by the EIIP guidelines and EIA. After converting the state-level fuel consumption data to Btu, the total carbon content for each fuel was calculated by multiplying the consumption of each fuel type (in Btu) by a carbon content coefficient (C/Btu) provided by the EIIP guidelines and the EIA’s Documentation for Emissions of Greenhouse Gases in the United States 2002.26 It should be noted that these coefficients were national averages and may not accurately represent the energy content of fuels combusted in Michigan. Some fuel types were used in part for non-fuel purposes (i.e. asphalt and road oil) that would sequester the carbon for 20 years or more. To obtain the net carbon available for immediate release, the percentage of stored carbon for the specific non-fuel use was calculated for each fuel type. For the purpose of this inventory, the non-fuel use amount was subtracted from total consumption (for fuel use and non-fuel use) data to obtain a CO2 amount immediately released to the atmosphere. Fuel use for non-energy purposes is another cause of uncertainty in emission estimation. We used national figures as default values for the amount of non-energy fuel use and percentage of carbon stored by fuel types. State-specific data, if available, can reduce these uncertainties. To account for fraction of carbon that did not oxidize immediately during fossil fuel combustion, the EIIP guidelines as well as U.S. Greenhouse Gas Emissions and Sinks 1990-2002, provided fraction estimate factors for each given fuel type. The resulting fraction oxidized was multiplied by the tons of carbon available and resulted in total oxidized carbon or CO2.
MICHIGAN GREENHOUSE GAS INVENTORY 1990 AND 2002 3 - ENERGY
17
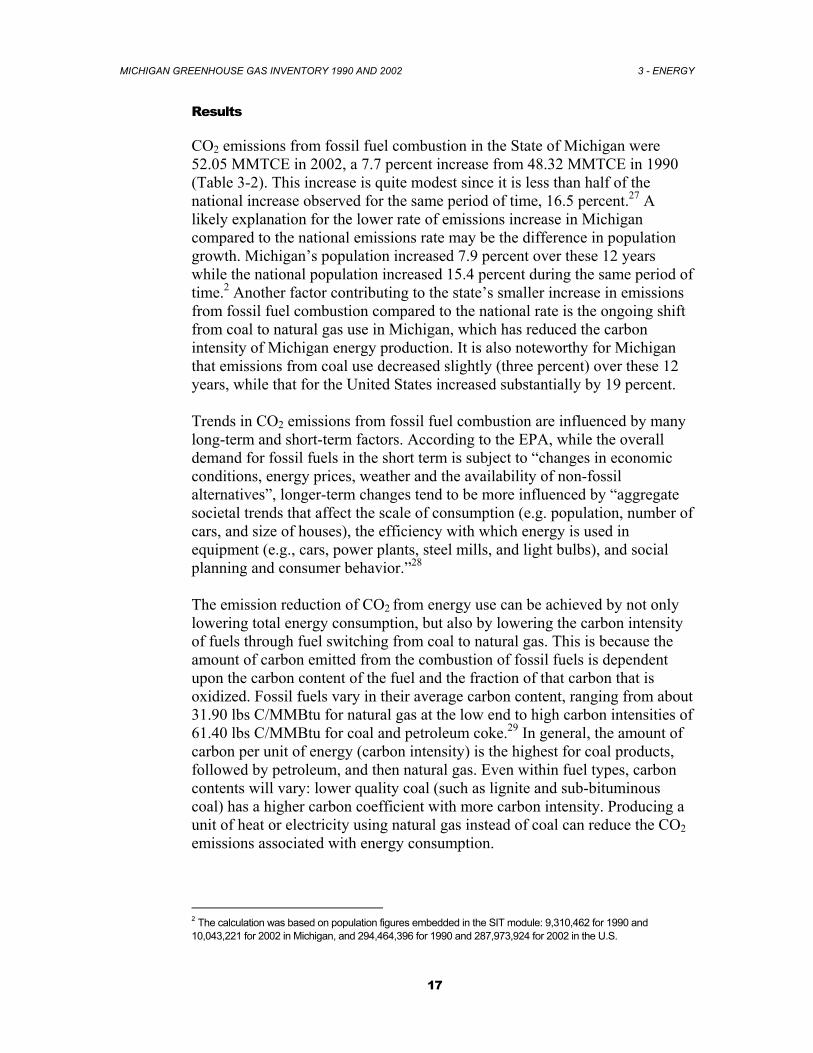
Results
CO2 emissions from fossil fuel combustion in the State of Michigan were 52.05 MMTCE in 2002, a 7.7 percent increase from 48.32 MMTCE in 1990 (Table 3-2). This increase is quite modest since it is less than half of the national increase observed for the same period of time, 16.5 percent.27 A likely explanation for the lower rate of emissions increase in Michigan compared to the national emissions rate may be the difference in population growth. Michigan’s population increased 7.9 percent over these 12 years while the national population increased 15.4 percent during the same period of time.2 Another factor contributing to the state’s smaller increase in emissions from fossil fuel combustion compared to the national rate is the ongoing shift from coal to natural gas use in Michigan, which has reduced the carbon intensity of Michigan energy production. It is also noteworthy for Michigan that emissions from coal use decreased slightly (three percent) over these 12 years, while that for the United States increased substantially by 19 percent. Trends in CO2 emissions from fossil fuel combustion are influenced by many long-term and short-term factors. According to the EPA, while the overall demand for fossil fuels in the short term is subject to “changes in economic conditions, energy prices, weather and the availability of non-fossil alternatives”, longer-term changes tend to be more influenced by “aggregate societal trends that affect the scale of consumption (e.g. population, number of cars, and size of houses), the efficiency with which energy is used in equipment (e.g., cars, power plants, steel mills, and light bulbs), and social planning and consumer behavior.”28 The emission reduction of CO2 from energy use can be achieved by not only lowering total energy consumption, but also by lowering the carbon intensity of fuels through fuel switching from coal to natural gas. This is because the amount of carbon emitted from the combustion of fossil fuels is dependent upon the carbon content of the fuel and the fraction of that carbon that is oxidized. Fossil fuels vary in their average carbon content, ranging from about 31.90 lbs C/MMBtu for natural gas at the low end to high carbon intensities of 61.40 lbs C/MMBtu for coal and petroleum coke.29 In general, the amount of carbon per unit of energy (carbon intensity) is the highest for coal products, followed by petroleum, and then natural gas. Even within fuel types, carbon contents will vary: lower quality coal (such as lignite and sub-bituminous coal) has a higher carbon coefficient with more carbon intensity. Producing a unit of heat or electricity using natural gas instead of coal can reduce the CO2 emissions associated with energy consumption.
2 The calculation was based on population figures embedded in the SIT module: 9,310,462 for 1990 and 10,043,221 for 2002 in Michigan, and 294,464,396 for 1990 and 287,973,924 for 2002 in the U.S.
MICHIGAN GREENHOUSE GAS INVENTORY 1990 AND 2002 3 - ENERGY
18
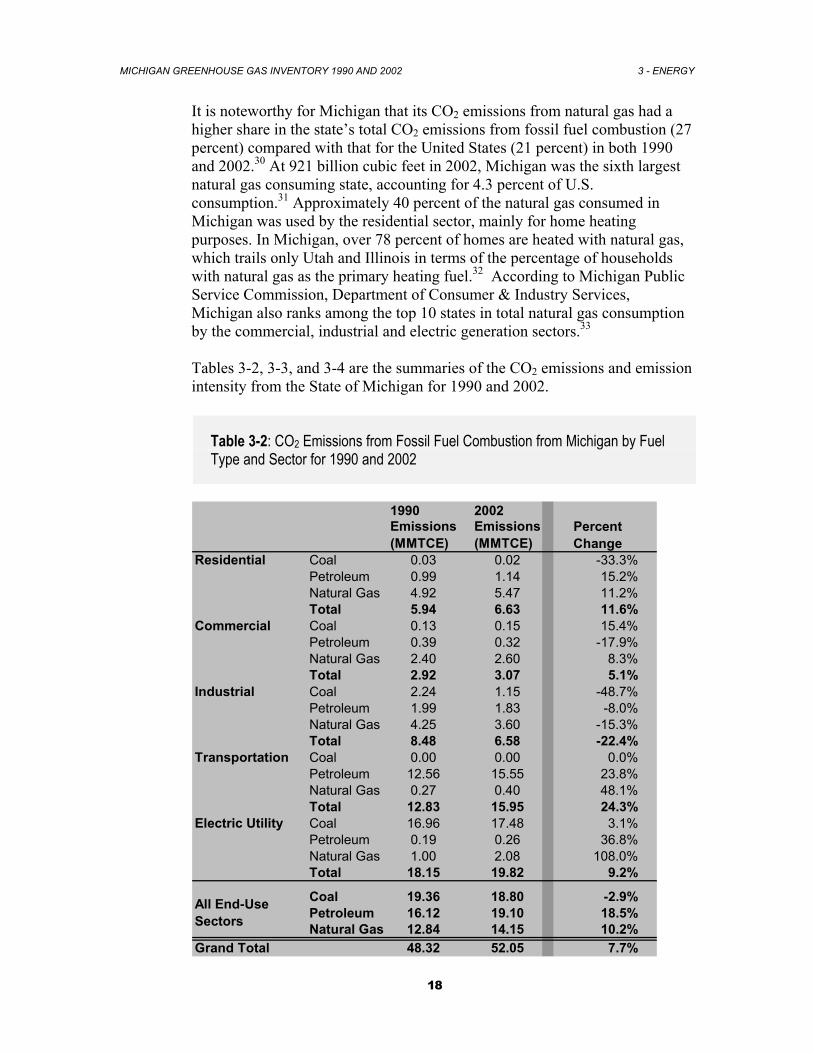
It is noteworthy for Michigan that its CO2 emissions from natural gas had a higher share in the state’s total CO2 emissions from fossil fuel combustion (27 percent) compared with that for the United States (21 percent) in both 1990 and 2002.30 At 921 billion cubic feet in 2002, Michigan was the sixth largest natural gas consuming state, accounting for 4.3 percent of U.S. consumption.31 Approximately 40 percent of the natural gas consumed in Michigan was used by the residential sector, mainly for home heating purposes. In Michigan, over 78 percent of homes are heated with natural gas, which trails only Utah and Illinois in terms of the percentage of households with natural gas as the primary heating fuel.32 According to Michigan Public Service Commission, Department of Consumer & Industry Services, Michigan also ranks among the top 10 states in total natural gas consumption by the commercial, industrial and electric generation sectors.33 Tables 3-2, 3-3, and 3-4 are the summaries of the CO2 emissions and emission intensity from the State of Michigan for 1990 and 2002.
Table 3-2: CO2 Emissions from Fossil Fuel Combustion from Michigan by Fuel Type and Sector for 1990 and 2002
1990 2002Emissions (MMTCE)
Emissions (MMTCE)
Residential Coal 0.03 0.02 -33.3%Petroleum 0.99 1.14 15.2%Natural Gas 4.92 5.47 11.2%Total 5.94 6.63 11.6%
Commercial Coal 0.13 0.15 15.4%Petroleum 0.39 0.32 -17.9%Natural Gas 2.40 2.60 8.3%Total 2.92 3.07 5.1%
Industrial Coal 2.24 1.15 -48.7%Petroleum 1.99 1.83 -8.0%Natural Gas 4.25 3.60 -15.3%Total 8.48 6.58 -22.4%
Transportation Coal 0.00 0.00 0.0%Petroleum 12.56 15.55 23.8%Natural Gas 0.27 0.40 48.1%Total 12.83 15.95 24.3%
Electric Utility Coal 16.96 17.48 3.1%Petroleum 0.19 0.26 36.8%Natural Gas 1.00 2.08 108.0%Total 18.15 19.82 9.2%
Coal 19.36 18.80 -2.9%Petroleum 16.12 19.10 18.5%Natural Gas 12.84 14.15 10.2%
Grand Total 48.32 52.05 7.7%
All End-Use Sectors
Percent Change
MICHIGAN GREENHOUSE GAS INVENTORY 1990 AND 2002 3 - ENERGY
19
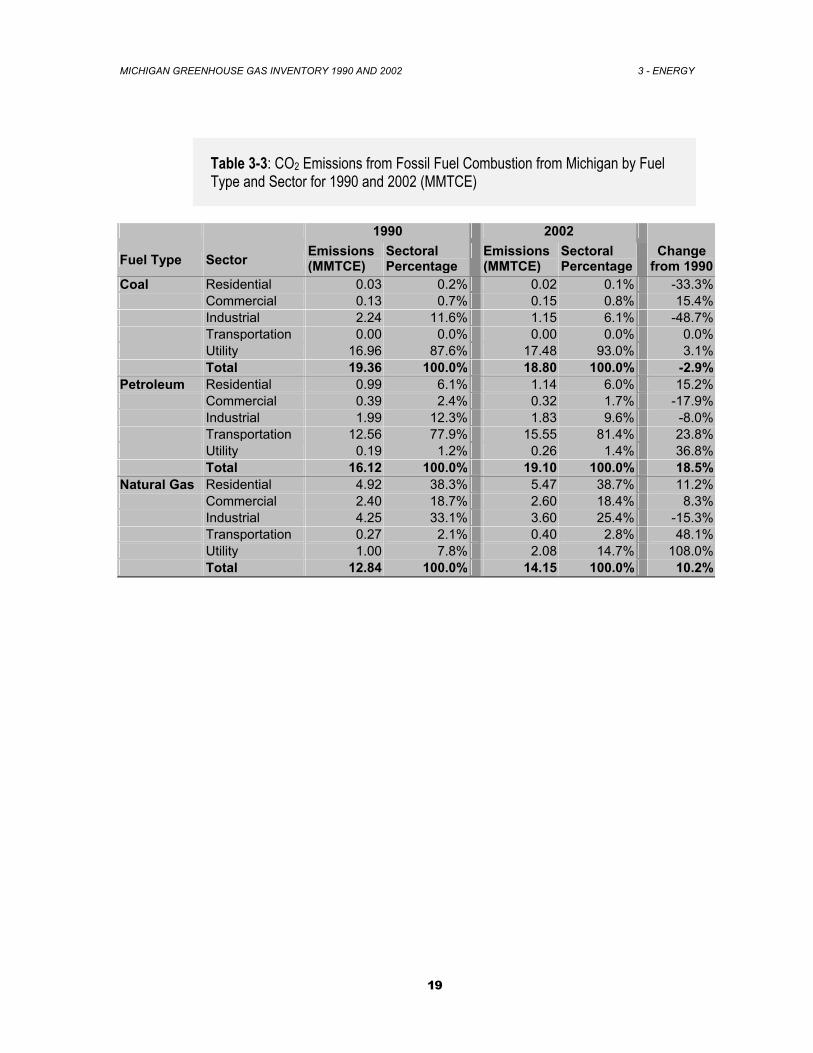
Table 3-3: CO2 Emissions from Fossil Fuel Combustion from Michigan by Fuel Type and Sector for 1990 and 2002 (MMTCE)
1990 2002
Fuel Type Sector Emissions (MMTCE)
Sectoral Percentage
Emissions (MMTCE)
Sectoral Percentage
Change from 1990
Coal Residential 0.03 0.2% 0.02 0.1% -33.3% Commercial 0.13 0.7% 0.15 0.8% 15.4% Industrial 2.24 11.6% 1.15 6.1% -48.7% Transportation 0.00 0.0% 0.00 0.0% 0.0% Utility 16.96 87.6% 17.48 93.0% 3.1% Total 19.36 100.0% 18.80 100.0% -2.9%
Petroleum Residential 0.99 6.1% 1.14 6.0% 15.2% Commercial 0.39 2.4% 0.32 1.7% -17.9% Industrial 1.99 12.3% 1.83 9.6% -8.0% Transportation 12.56 77.9% 15.55 81.4% 23.8% Utility 0.19 1.2% 0.26 1.4% 36.8% Total 16.12 100.0% 19.10 100.0% 18.5%
Natural Gas Residential 4.92 38.3% 5.47 38.7% 11.2% Commercial 2.40 18.7% 2.60 18.4% 8.3% Industrial 4.25 33.1% 3.60 25.4% -15.3% Transportation 0.27 2.1% 0.40 2.8% 48.1% Utility 1.00 7.8% 2.08 14.7% 108.0% Total 12.84 100.0% 14.15 100.0% 10.2%
MICHIGAN GREENHOUSE GAS INVENTORY 1990 AND 2002 3 - ENERGY
20
19.3616.12
12.84
18.8 19.1
14.15
0
5
10
15
20
25
Coal Petroleum Natural Gas
Fuel
Em
issi
ons
(MM
TCE
)
19902002
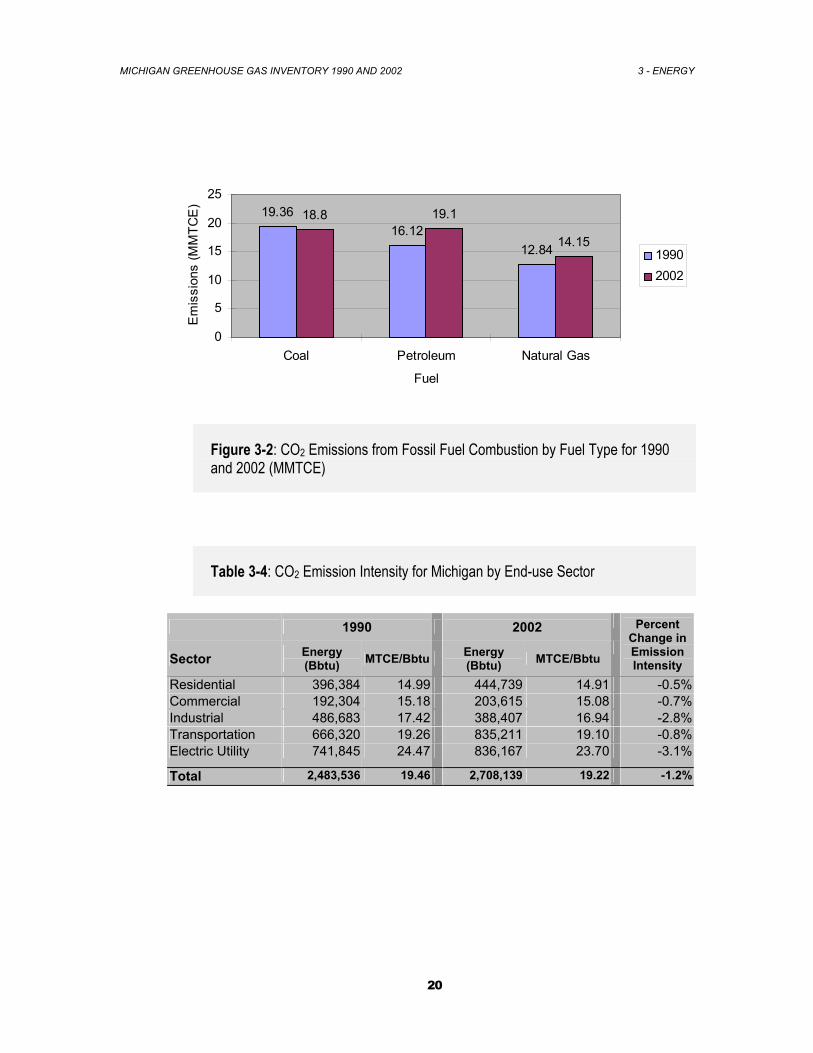
Figure 3-2: CO2 Emissions from Fossil Fuel Combustion by Fuel Type for 1990 and 2002 (MMTCE)
Table 3-4: CO2 Emission Intensity for Michigan by End-use Sector
1990 2002
Sector Energy (Bbtu) MTCE/Bbtu Energy
(Bbtu) MTCE/Bbtu
Percent Change in Emission Intensity
Residential 396,384 14.99 444,739 14.91 -0.5%Commercial 192,304 15.18 203,615 15.08 -0.7%Industrial 486,683 17.42 388,407 16.94 -2.8%Transportation 666,320 19.26 835,211 19.10 -0.8%Electric Utility 741,845 24.47 836,167 23.70 -3.1%
Total 2,483,536 19.46 2,708,139 19.22 -1.2%
MICHIGAN GREENHOUSE GAS INVENTORY 1990 AND 2002 3 - ENERGY
21
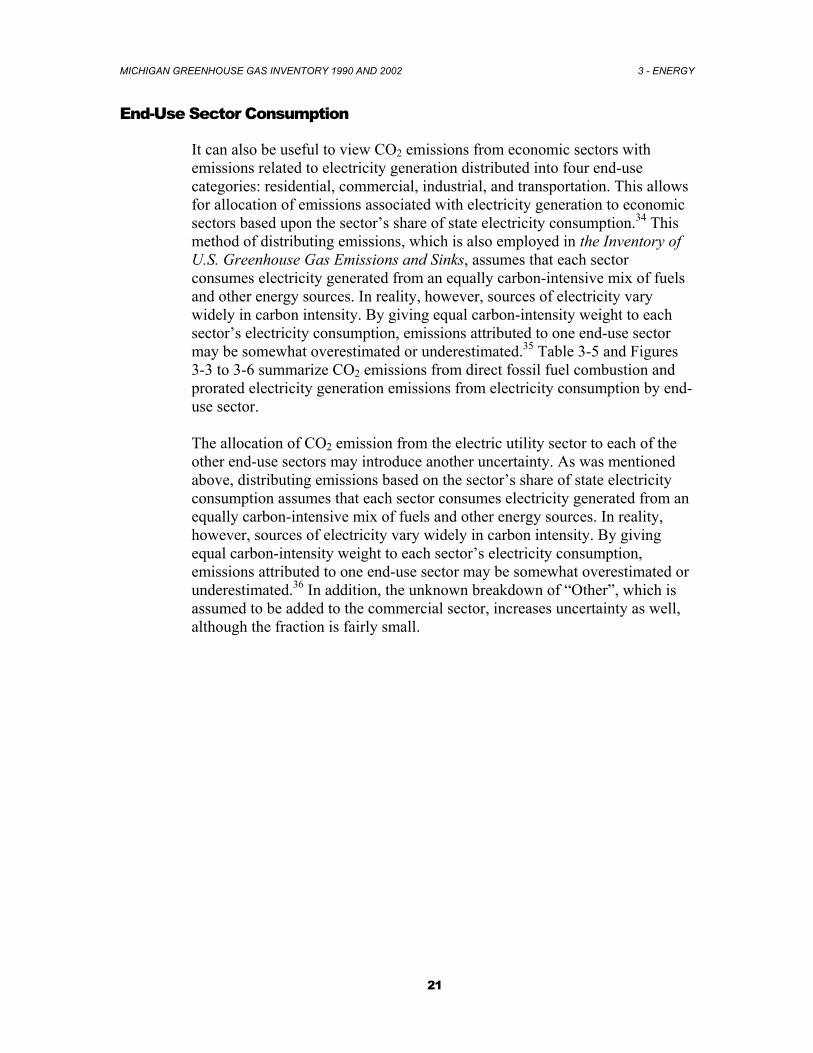
End-Use Sector Consumption
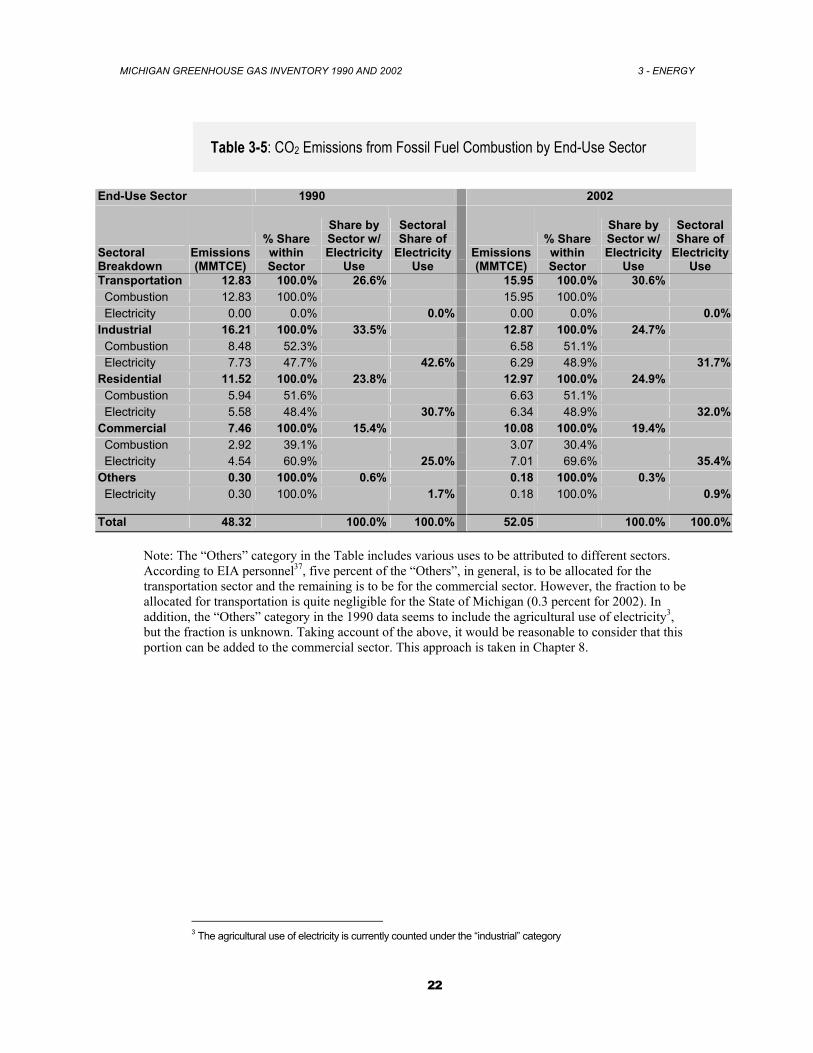
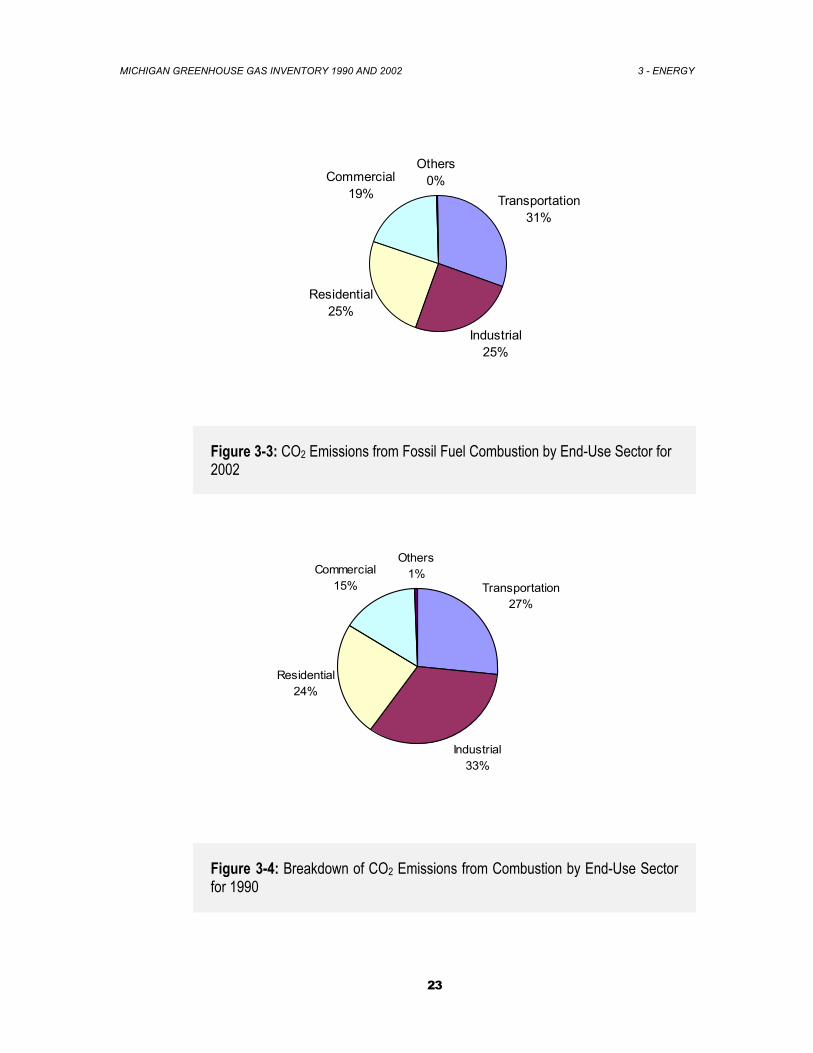
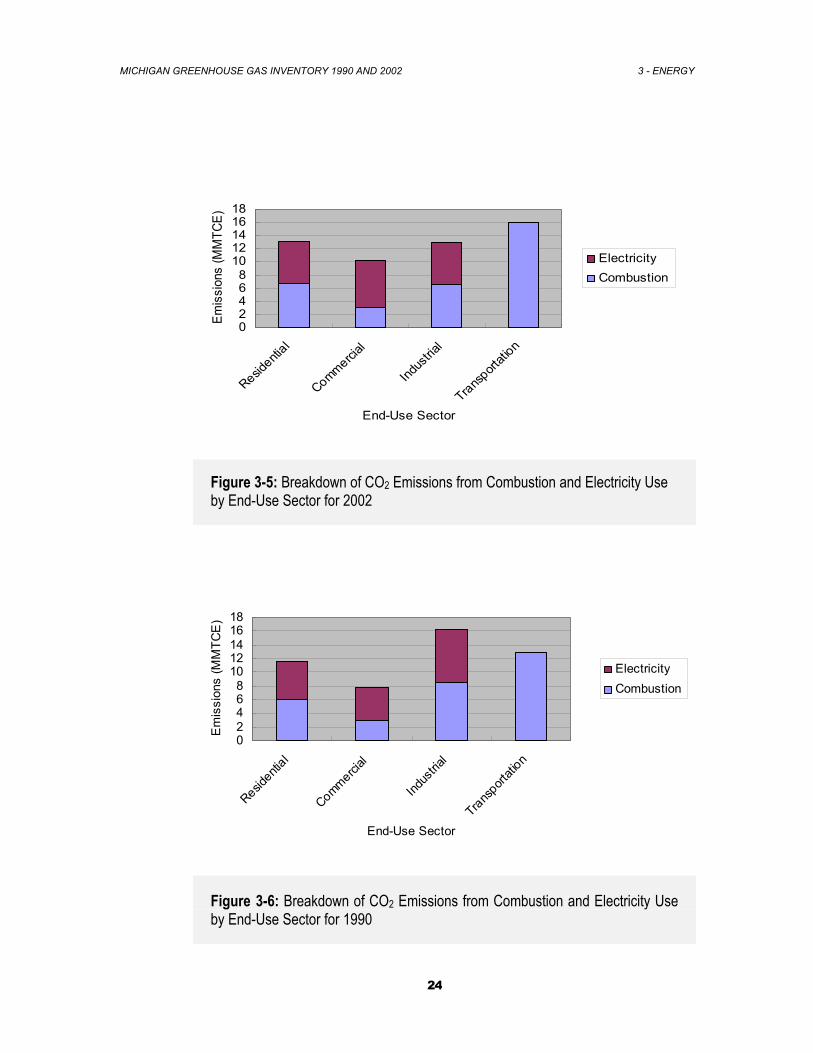
It can also be useful to view CO2 emissions from economic sectors with emissions related to electricity generation distributed into four end-use categories: residential, commercial, industrial, and transportation. This allows for allocation of emissions associated with electricity generation to economic sectors based upon the sector’s share of state electricity consumption.34 This method of distributing emissions, which is also employed in the Inventory of U.S. Greenhouse Gas Emissions and Sinks, assumes that each sector consumes electricity generated from an equally carbon-intensive mix of fuels and other energy sources. In reality, however, sources of electricity vary widely in carbon intensity. By giving equal carbon-intensity weight to each sector’s electricity consumption, emissions attributed to one end-use sector may be somewhat overestimated or underestimated.35 Table 3-5 and Figures 3-3 to 3-6 summarize CO2 emissions from direct fossil fuel combustion and prorated electricity generation emissions from electricity consumption by end-use sector.
The allocation of CO2 emission from the electric utility sector to each of the other end-use sectors may introduce another uncertainty. As was mentioned above, distributing emissions based on the sector’s share of state electricity consumption assumes that each sector consumes electricity generated from an equally carbon-intensive mix of fuels and other energy sources. In reality, however, sources of electricity vary widely in carbon intensity. By giving equal carbon-intensity weight to each sector’s electricity consumption, emissions attributed to one end-use sector may be somewhat overestimated or underestimated.36 In addition, the unknown breakdown of “Other”, which is assumed to be added to the commercial sector, increases uncertainty as well, although the fraction is fairly small.
MICHIGAN GREENHOUSE GAS INVENTORY 1990 AND 2002 3 - ENERGY
22
Table 3-5: CO2 Emissions from Fossil Fuel Combustion by End-Use Sector
End-Use Sector 1990 2002
Sectoral Breakdown
Emissions (MMTCE)
% Share within Sector
Share by Sector w/ Electricity
Use
Sectoral Share of
Electricity Use
Emissions (MMTCE)
% Share within Sector
Share by Sector w/ Electricity
Use
Sectoral Share of
Electricity Use
Transportation 12.83 100.0% 26.6% 15.95 100.0% 30.6% Combustion 12.83 100.0% 15.95 100.0% Electricity 0.00 0.0% 0.0% 0.00 0.0% 0.0%Industrial 16.21 100.0% 33.5% 12.87 100.0% 24.7% Combustion 8.48 52.3% 6.58 51.1% Electricity 7.73 47.7% 42.6% 6.29 48.9% 31.7%Residential 11.52 100.0% 23.8% 12.97 100.0% 24.9% Combustion 5.94 51.6% 6.63 51.1% Electricity 5.58 48.4% 30.7% 6.34 48.9% 32.0%Commercial 7.46 100.0% 15.4% 10.08 100.0% 19.4% Combustion 2.92 39.1% 3.07 30.4% Electricity 4.54 60.9% 25.0% 7.01 69.6% 35.4%Others 0.30 100.0% 0.6% 0.18 100.0% 0.3% Electricity 0.30 100.0% 1.7% 0.18 100.0% 0.9%
Total 48.32 100.0% 100.0% 52.05 100.0% 100.0% Note: The “Others” category in the Table includes various uses to be attributed to different sectors. According to EIA personnel37, five percent of the “Others”, in general, is to be allocated for the transportation sector and the remaining is to be for the commercial sector. However, the fraction to be allocated for transportation is quite negligible for the State of Michigan (0.3 percent for 2002). In addition, the “Others” category in the 1990 data seems to include the agricultural use of electricity3, but the fraction is unknown. Taking account of the above, it would be reasonable to consider that this portion can be added to the commercial sector. This approach is taken in Chapter 8.
3 The agricultural use of electricity is currently counted under the “industrial” category
MICHIGAN GREENHOUSE GAS INVENTORY 1990 AND 2002 3 - ENERGY
23
Transportation31%
Industrial25%
Residential25%
Commercial19%
Others0%
Figure 3-3: CO2 Emissions from Fossil Fuel Combustion by End-Use Sector for 2002
Transportation27%
Industrial33%
Residential24%
Commercial15%
Others1%
Figure 3-4: Breakdown of CO2 Emissions from Combustion by End-Use Sector for 1990
MICHIGAN GREENHOUSE GAS INVENTORY 1990 AND 2002 3 - ENERGY
24
02468
1012141618
Residenti
al
Commercial
Indus
trial
Transport
ation
End-Use Sector
Emis
sion
s (M
MTC
E)
ElectricityCombustion
Figure 3-5: Breakdown of CO2 Emissions from Combustion and Electricity Use by End-Use Sector for 2002
02468
1012141618
Residenti
al
Commercial
Indus
trial
Transport
ation
End-Use Sector
Em
issi
ons
(MM
TCE
)
ElectricityCombustion
Figure 3-6: Breakdown of CO2 Emissions from Combustion and Electricity Use by End-Use Sector for 1990
MICHIGAN GREENHOUSE GAS INVENTORY 1990 AND 2002 3 - ENERGY
25
Residential and Commercial End-Use Sectors
In 2002, CO2 emissions from fossil fuel combustion and electricity use within the residential and commercial end-use sectors were 12.97 MMTCE and 10.08 MMTCE, accounting for 25 percent and 19 percent respectively of the state total (Table 3-5). While, in 1990, they were 11.52 MMTCE and 7.46 MMTCE respectively, accounting for 24 percent and 15 percent of the state total. As presented in Table 3-5 and Figures 3-5 and 3-6, both sectors were heavily reliant on electricity for meeting energy needs. The electricity consumption for lighting, heating, air conditioning, and operating appliances accounted for 49 percent of emissions from the residential and 70 percent from the commercial sectors in 2002.
The remaining emissions were largely due to the direct consumption of natural gas and petroleum products, primarily for heating and cooking needs. It is noteworthy that the emissions from combustion were higher than that from electricity for the residential sector for both 1990 and 2002 in Michigan, whereas emissions from electricity have always taken a larger share in the residential sector for the whole United States.4 This might be due to the climate conditions of Michigan538, where there is higher natural gas combustion occurring in winter for heating purposes. Emissions from natural gas consumption represent over 80 percent of the direct (not including electricity) fossil fuel emissions from the residential and commercial sectors for both years. In terms of the U.S., the value is consistently around 70 percent. In Michigan and throughout the Midwest, a much higher percentage of natural gas is used as a winter heating fuel, compared with warmer climates in the U.S., where natural gas is used primarily as a year-round industrial and electric generation fuel.39 Compared to natural gas, coal consumption was a minor component of energy use in both of these end-use sectors. According to the EPA, it seems to be a national trend that emissions from these two end-use sectors have “increased steadily since 1990, unlike those from the industrial sector, which experienced substantial reductions during the economic downturns of 1991 and 2002.”40 The EPA suggests that, in a shorter term, the residential and commercial sectors are more subjective to weather than to economic conditions. Considering this 12-year time period, however, it is also possible that these sectors might be affected by other longer-term factors suggested by the EPA in Inventory of U.S. Greenhouse Gas Emissions and Sinks 1990-2002, such as population growth, regional migration trends, and changes in housing and building attributes (e.g., size and insulation).41
4 According to the Inventory of U.S. Greenhouse Gas Emissions and Sinks: 1990-2002, the share of emissions from electricity use in the residential sector was 63 percent in 1990 and 68 percent in 2002 for the whole United States. 5 Average winter temperature (Dec-Feb) in Michigan from 1990 to 2002 was 23.48 deg F, while the average for the United States for the same period of time was 34.63 deg F.
MICHIGAN GREENHOUSE GAS INVENTORY 1990 AND 2002 3 - ENERGY
26
However, as noted by the EIA, given that commercial activity is a factor of the larger economy, emissions from the commercial sector in the long run are more influenced by economic trends and less influenced by population growth than are emissions from the residential sector.42 From 1990 to 2002, electricity sales (in megawatt hours) to the residential and commercial end-use sectors increased by 36 and 84 percent, respectively.43 Compared with such a big increase in electricity consumption from both sectors, electricity-related emissions show a relatively lower increase for both sectors (14 and 54 percent, respectively) as the decline in carbon intensity of electricity generation outweighed the increase in electricity demand.
Industrial End-Use Sector
The industrial end-use sector is the only sector that showed a decrease in greenhouse gas emissions from fossil fuel combustion for 1990 and 2002 in the State of Michigan, unlike the federal trend for the sector that showed a slight increase.6, 44 Emissions from this sector were 12.87 MMTCE in 2002, accounting for 25 percent of the state’s CO2 emissions from fossil fuel combustion. This represents a decrease by 21 percent from 16.21 in 1990. The industrial end-use sector accounted for 34 percent share of the state’s CO2 emissions in 1990 (Table 3-5). According to the definition by the EPA, the industrial end-use sector includes manufacturing, construction, and agriculture, of which the largest activity in terms of energy consumption is manufacturing.45 For Michigan, the largest manufacturing industries, as measured by output, are transportation equipment (auto parts, and auto and truck production), machinery, especially metalworking machinery, and fabricated metal.46 For both years, slightly over 50 percent of these emissions resulted from the direct consumption of fossil fuels for steam and process heat production. The remaining was associated with the consumption of electricity for uses such as motors, electric furnaces, ovens, and lighting. As stated by the EPA, “in theory, emissions from the industrial end-use sector should be highly correlated with economic growth and industrial output.”47 The reasons for the disparity between substantial growth in Gross State Product (GSP)7,48 and the significant decrease in industrial emissions are not clear. The EPA indicates on a national scale that possible factors that may have influenced industrial emission trends are as follows: “1) more rapid 6 The emissions from the industrial sector (both from fossil fuel combustion and electricity use) for the whole United States increased approximately by 2 percent from 446.86 MMTCE in 1990 to 457.39 MMTCE. 7 According to the Bureau of Economic Analysis in U.S. DOC, the Total Gross State Product in Michigan was 234,181 millions dollars in 1990 and 337,708 million dollars in 2002 (both in 2000 dollars). In Quality Indexes for Real GSP with GSP in Year 2000 as 100.0, 1990 GSP was 71.8 and 2002 GSP was 99.9.
MICHIGAN GREENHOUSE GAS INVENTORY 1990 AND 2002 3 - ENERGY
27
growth in less energy-intensive industries than in traditional manufacturing industries; 2) improvements in energy efficiency; and 3) a lowering of the carbon intensity of fossil fuel consumption by fuel switching from coal and coke to natural gas, etc.”49 In addition, a nation-wide concern over outsourcing jobs has been developed. It is suspected that the movement of Michigan’s manufacturing facilities to foreign countries contributed to lower CO2 emissions from this sector in 2002.8, 50 It should be noted that industry is the largest user of fossil fuels for non-energy applications. Fossil fuels can be used for producing products such as fertilizers, plastics, asphalt, or lubricants that can sequester or store carbon for long periods of time. Asphalt used in road construction, for example, stores carbon essentially indefinitely. Similarly, fossil fuels used in the manufacture of materials like plastics can also store carbon, if the material is not burned.
Transportation End-Use Sector
CO2 emissions from fossil fuel combustion for transportation in 2002 were 15.95 MMTCE, representing the largest share of CO2 emissions from fossil fuel combustion (Figures 3-3 and 3-5). In 1990, emissions from this sector were 12.83 MMTCE, accounting for the second largest share of 27 percent (Figures 3-4 and 3-6). This trend is quite similar to the national trend (32 percent for 2002 and 31 percent for 1990).51 Over these 12 years, the emissions from this sector increased by 24 percent (Table 3-5). Like overall energy demand, transportation fuel demand is a function of many short and long-term factors. In the short term only minor adjustments can generally be made through consumer behavior (e.g., not driving as far for summer vacations). However, long-term adjustments such as vehicle purchase choices, transport mode choice and access (i.e., trains versus planes), and urban planning can have a significant impact on fuel demand.52 Since 1990, travel activity in the United States has grown more rapidly than the population, with a 16 percent increase in vehicle miles traveled per capita.53 For Michigan, the increase is 14.5 percent54, slightly lower than the national average. This increase is partly due to an increase in the number of motor vehicles, which is significant for all vehicle types except automobiles. It is noteworthy that the number of automobiles registered decreased during these 12 years by 4.7 percent, but that the number for trucks (including passenger vans/minivans and utility-type vehicles) increased by 75.6 percent.55 An increase in the number of cars per person is also another contributor of an increase in vehicle miles traveled (VMT) per capita. This
8 According to Detroit New Business (June 4, 2004), the study by Center for Automotive Research in Ann Arbor shows “the state has lost 168,200 manufacturing jobs due largely to rising productivity” and “ that one in eight manufacturing jobs lost since 2001 were due to outsourcing or competition from fast-growing countries like China and India.
MICHIGAN GREENHOUSE GAS INVENTORY 1990 AND 2002 3 - ENERGY
28
increased from 0.77 for 1990 to 0.85 for 2002 for the State of Michigan.9, 56 Furthermore, an increase in driving hours per capita could be another possible factor to increase the state VMT, although we have not yet collected data that could support this hypothesis. In addition to an increase in VMT, longer commute times due to traffic congestion could be another factor to increase fuel consumption. According to Michigan’s Transportation System by the Road Information Program, the typical commuter in Michigan in 2002 spent on average an additional 24 hours a year on the road than 10 years before. 57 Not only an increase in VMT, but the composition of vehicle types could also be another factor that increased the state’s emissions from transportation. As mentioned above, the sales of trucks, vans and utility-type vehicles significantly increased over these 12 years, despite a slight decrease in the sales of automobiles. The increasing dominance of vehicles with less fuel efficiency can contribute higher emissions from this sector.
Electric Utility End-Use Sector
According to the EPA’s new definition, the electric power industry includes all power producers, both regulated utilities and nonutilities (e.g. independent power producers, qualifying cogenerators, and other small power producers). The EPA includes the following definitions: “utilities primarily generate power for the U.S. electric grid for sale to retail customers, while nonutilites produce electricity for their own use to sell to large consumers, or to sell on the wholesale electric market (e.g., to utilities for distribution and resale customers).”58 The process of generating electricity is the single largest source of CO2 emissions in the State of Michigan as well as in the United States. As we have seen, electricity is consumed primarily in the residential, commercial, and industrial end-use sectors for lighting, heating, electric motors, appliances, electronics, and air conditioning. Electricity generation also accounted for the largest share of CO2 emissions from fossil fuel combustion, 38 percent in both 1990 and 2002. The inventory does not incorporate emissions from net electricity import/export, which should contribute to calculation uncertainty. According to the EPA’s eGRID database, Michigan has become a net electricity importer since 1997, importing consistently around 10 percent of total consumption from 1999 to 2000. Although 2001 and 2002 data are not available, if the trend continued for 2002 it would increase the state’s CO2 emissions from the electricity sector by 10 percent. 9 Per capita VMT was calculated by dividing all motor vehicles total by the State population.
MICHIGAN GREENHOUSE GAS INVENTORY 1990 AND 2002 3 - ENERGY
29
Electricity sales in the State of Michigan were 107,311 thousand megawatt-hours (Mwh) in 2002, an increase of 30 percent from 82,367 thousand Mwh in 1990.59 However, CO2 emissions from this sector increased only nine percent during the same period of time (Table 3-2). This lower rate of emission increase compared with electricity consumption is partly due to the increased shares of petroleum and natural gas in the fuel mix. Although coal is consumed primarily by the electric power sector in Michigan (93 and 88 percent of total coal consumption in 2002 and 1990) as well as the whole United States (Table 3-3) coal consumption for electricity generation increased only by three percent over these 12 years (Table 3-2). On the other hand, natural gas consumption for electricity generation, which accounted for only 1 MMTCE in 1990, grew at a higher rate to 2.08 MMTCE in 2002 (Table 3-2).
3.2 Methane and Nitrous Oxide Emissions from Mobile Combustion
Although there is virtually no CH4 in either gasoline or diesel fuel, CH4 is emitted as a combustion by-product. The production of CH4 is influenced by fuel composition, combustion conditions and efficiency, and any post-combustion control of hydrocarbon emissions, such as catalytic converters. According to the EPA, CH4 emissions would be higher especially in aggressive driving, low speed operation, and cold start operation. Poorly tuned highway vehicle engines may also increase CH4 emissions. For modern highway vehicles equipped with a three-way closed loop catalyst, emissions would be lowest when the right combination of hydrogen, carbon, and oxygen is achieved for complete combustion. On the other hand, the formation of N2O in internal combustion engines is not yet fully understood, due to a limited amount of data on these emissions.60 It is believed that N2O emissions come from two distinct processes: first, during combustion in the cylinder, and second, during catalytic aftertreatment of exhaust gases.61 Based on the EPA’s methodology, emissions from mobile combustion were estimated by transport mode (e.g., highway and non-highway (air, rail, marine), fuel type (e.g., motor gasoline, diesel fuel, jet fuel), and vehicle type (e.g., passenger cars, light-duty trucks, motorcycles).62 Road transport accounted for more than 90 percent of mobile source fuel consumption, and thus, the majority of mobile combustion emissions.
Required Data
CH4 and N2O emission estimates for highway vehicles are calculated from two primary inputs: activity data (i.e., vehicle miles traveled (VMT)) and emission factors. Although other factors (e.g., the breakdown of vehicle
MICHIGAN GREENHOUSE GAS INVENTORY 1990 AND 2002 3 - ENERGY
30
control technology, vehicle age, etc.) affect emission estimates, the uncertainty associated with them has a much smaller impact on estimates than the uncertainty related to the activity data and emission factors.63 Data for the road category were collected from Federal Highway Administration’s Highway Statistics Summary to 199564 and Highway Statistics 2002.65 Data for the non-road category were collected from various sources including EIA Fuel Oil and Kerosene.66 Given that most of non-road data are not compiled at the state level, estimates were derived from the national consumption and sales data. Emission estimates for non-highway sources are also driven by fuel consumption data and emission factors. Given that state-specific fuel consumption data for this category are not available, the data gathered at the national level were apportioned to states based on state-specific sales data or on a historical ratio, etc. This apportionment introduces some uncertainty. Emission factors recommended by the EIIP were also taken from the IPCC67, and with significant uncertainties, since research has not been conducted fully for emissions from these modes.68 The EIIP also cautions that technologies and vehicle characteristics have changed since the factors were initially developed, which may introduce additional uncertainties.69 The uncertainty related to emission factors is relatively high for mobile combustion. According to the EIIP guidelines, most CH4 emission factors they use were taken from IPCC70, and were developed using EPA’s MOBILE5a, which computes these factors based on inputs such as ambient temperature, vehicle speeds, gasoline volatility, and other variables.71 The values for these factors can change significantly, depending on driving conditions and vehicle characteristics, etc. Emission factors for N2O were developed by the EPA, using a variety of sources (described in U.S. Greenhouse Gas Emissions and Sinks 1990-200272), through a scaling process based on ratios of fuel economy. This process also increases the level of uncertainty.73 Methodology
Emissions of CH4 and N2O from mobile sources were calculated for 1990 and 2002 from both road and non-road categories by using the EIIP guidelines and the State Inventory Tool (SIT). Road sources were vehicles that travel primarily on highways. Non-road sources included gasoline-fueled aircraft, jet aircraft, farm, industrial and construction equipment, boats, and ships. Except for gasoline-fueled aircraft, all of these non-road sources were typically equipped with diesel engines.
MICHIGAN GREENHOUSE GAS INVENTORY 1990 AND 2002 3 - ENERGY
31
A methodology recommended by the EIIP guidelines apportions state VMT totals among different vehicle types based on national averages instead of state-specific data. As the guidelines point out, these percentages have relatively low uncertainty at the national level, but the uncertainty increases when applied at the state level because state-specific differences in consumer preferences for vehicle types and a variety of social, legal, and economic factors cannot be well captured.74
Results
From 1990 to 2002, mobile combustion had been responsible for less than one percent of the state’s CH4 emissions, but had been the second largest source of N2O (23-24 percent) in the State of Michigan. Over these 12 years, CH4 emissions declined by 24 percent, from 47,087 MTCE to 35,575 MTCE (Table 3-6), due largely to control technologies employed on highway vehicles nationwide that reduce CO, NOx, non-methane volatile organic compounds (NMVOC), and CH4 emissions. The same technologies, however, resulted in higher N2O emissions, with only a four percent decrease from 503,738 MTCE to 483,549 MTCE in N2O emissions from mobile sources for the same period of time (Table 3-7). Overall, CH4 and N2O emissions were predominantly from gasoline-fueled passenger cars and light-duty gasoline trucks (Figures 3-7 and 3-8).
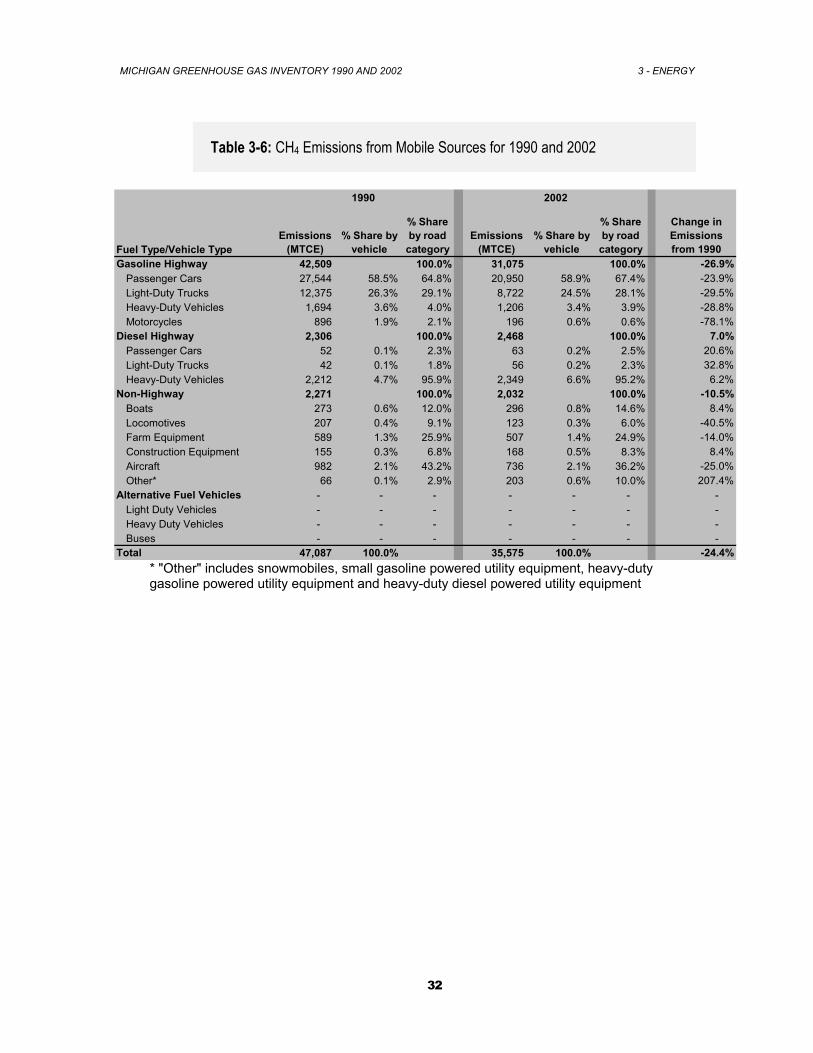
MICHIGAN GREENHOUSE GAS INVENTORY 1990 AND 2002 3 - ENERGY
32
Table 3-6: CH4 Emissions from Mobile Sources for 1990 and 2002
Emissions (MTCE)
% Share by vehicle
% Share by road
categoryEmissions
(MTCE)% Share by
vehicle
% Share by road
category
Change in Emissions from 1990
Gasoline Highway 42,509 100.0% 31,075 100.0% -26.9%Passenger Cars 27,544 58.5% 64.8% 20,950 58.9% 67.4% -23.9%Light-Duty Trucks 12,375 26.3% 29.1% 8,722 24.5% 28.1% -29.5%Heavy-Duty Vehicles 1,694 3.6% 4.0% 1,206 3.4% 3.9% -28.8%Motorcycles 896 1.9% 2.1% 196 0.6% 0.6% -78.1%
Diesel Highway 2,306 100.0% 2,468 100.0% 7.0%Passenger Cars 52 0.1% 2.3% 63 0.2% 2.5% 20.6%Light-Duty Trucks 42 0.1% 1.8% 56 0.2% 2.3% 32.8%Heavy-Duty Vehicles 2,212 4.7% 95.9% 2,349 6.6% 95.2% 6.2%
Non-Highway 2,271 100.0% 2,032 100.0% -10.5%Boats 273 0.6% 12.0% 296 0.8% 14.6% 8.4%Locomotives 207 0.4% 9.1% 123 0.3% 6.0% -40.5%Farm Equipment 589 1.3% 25.9% 507 1.4% 24.9% -14.0%Construction Equipment 155 0.3% 6.8% 168 0.5% 8.3% 8.4%Aircraft 982 2.1% 43.2% 736 2.1% 36.2% -25.0%Other* 66 0.1% 2.9% 203 0.6% 10.0% 207.4%
Alternative Fuel Vehicles - - - - - - - Light Duty Vehicles - - - - - - - Heavy Duty Vehicles - - - - - - - Buses - - - - - - -
Total 47,087 100.0% 35,575 100.0% -24.4%
Fuel Type/Vehicle Type
1990 2002
* "Other" includes snowmobiles, small gasoline powered utility equipment, heavy-duty gasoline powered utility equipment and heavy-duty diesel powered utility equipment
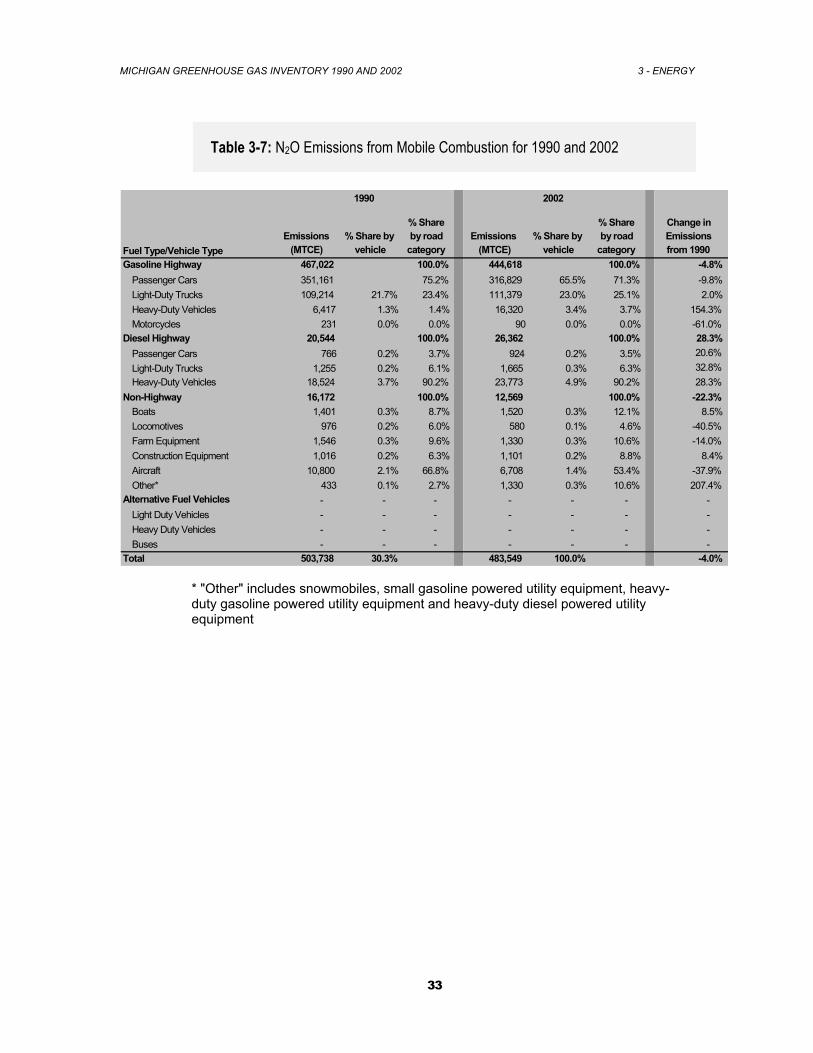
MICHIGAN GREENHOUSE GAS INVENTORY 1990 AND 2002 3 - ENERGY
33
Table 3-7: N2O Emissions from Mobile Combustion for 1990 and 2002
Emissions (MTCE)
% Share by vehicle
% Share by road
categoryEmissions
(MTCE)% Share by
vehicle
% Share by road
category
Change in Emissions from 1990
Gasoline Highway 467,022 100.0% 444,618 100.0% -4.8%Passenger Cars 351,161 75.2% 316,829 65.5% 71.3% -9.8%Light-Duty Trucks 109,214 21.7% 23.4% 111,379 23.0% 25.1% 2.0%Heavy-Duty Vehicles 6,417 1.3% 1.4% 16,320 3.4% 3.7% 154.3%Motorcycles 231 0.0% 0.0% 90 0.0% 0.0% -61.0%
Diesel Highway 20,544 100.0% 26,362 100.0% 28.3%Passenger Cars 766 0.2% 3.7% 924 0.2% 3.5% 20.6%Light-Duty Trucks 1,255 0.2% 6.1% 1,665 0.3% 6.3% 32.8%Heavy-Duty Vehicles 18,524 3.7% 90.2% 23,773 4.9% 90.2% 28.3%
Non-Highway 16,172 100.0% 12,569 100.0% -22.3%Boats 1,401 0.3% 8.7% 1,520 0.3% 12.1% 8.5%Locomotives 976 0.2% 6.0% 580 0.1% 4.6% -40.5%Farm Equipment 1,546 0.3% 9.6% 1,330 0.3% 10.6% -14.0%Construction Equipment 1,016 0.2% 6.3% 1,101 0.2% 8.8% 8.4%Aircraft 10,800 2.1% 66.8% 6,708 1.4% 53.4% -37.9%Other* 433 0.1% 2.7% 1,330 0.3% 10.6% 207.4%
Alternative Fuel Vehicles - - - - - - - Light Duty Vehicles - - - - - - - Heavy Duty Vehicles - - - - - - - Buses - - - - - - -
Total 503,738 30.3% 483,549 100.0% -4.0%
Fuel Type/Vehicle Type
1990 2002
* "Other" includes snowmobiles, small gasoline powered utility equipment, heavy-duty gasoline powered utility equipment and heavy-duty diesel powered utility equipment
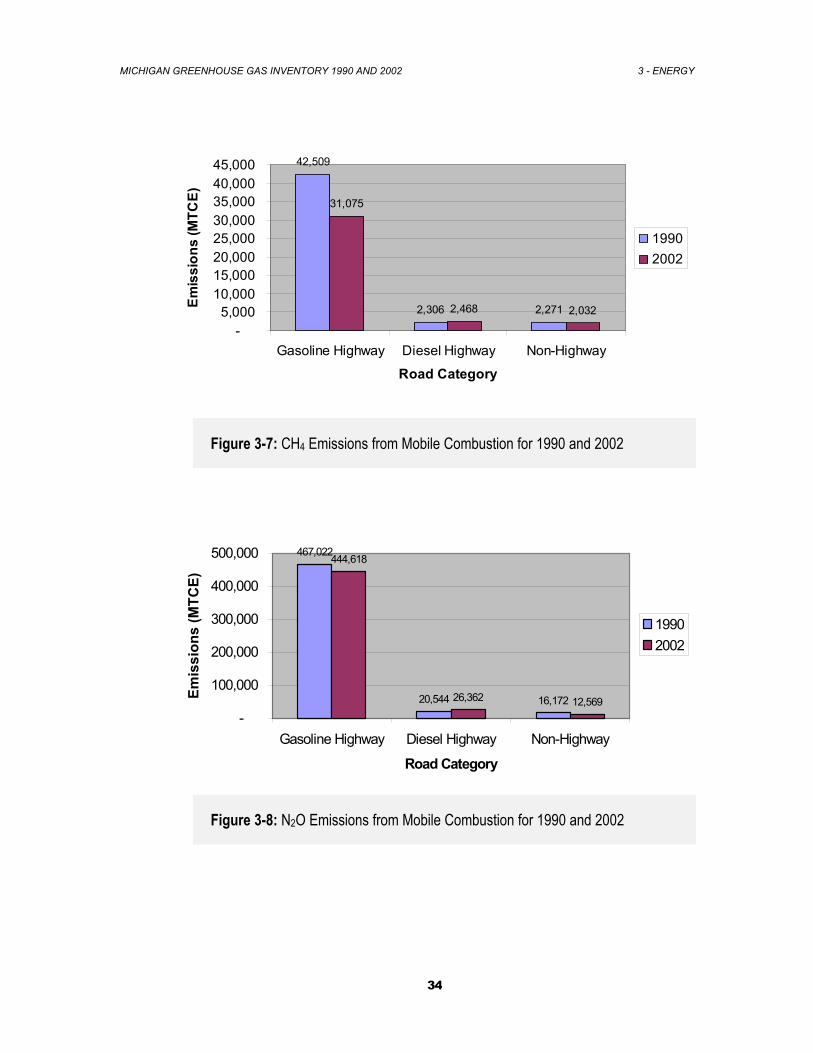
MICHIGAN GREENHOUSE GAS INVENTORY 1990 AND 2002 3 - ENERGY
34
42,509
2,306 2,271
31,075
2,468 2,032
-5,000
10,00015,00020,00025,00030,00035,00040,00045,000
Gasoline Highway Diesel Highway Non-Highway
Road Category
Emis
sion
s (M
TCE)
19902002
Figure 3-7: CH4 Emissions from Mobile Combustion for 1990 and 2002
467,022
20,544 16,172
444,618
26,362 12,569-
100,000
200,000
300,000
400,000
500,000
Gasoline Highway Diesel Highway Non-Highway
Road Category
Emis
sion
s (M
TCE)
19902002
Figure 3-8: N2O Emissions from Mobile Combustion for 1990 and 2002
MICHIGAN GREENHOUSE GAS INVENTORY 1990 AND 2002 3 - ENERGY
35
Emissions from non-highway vehicles are a small portion of total emissions from mobile sources, representing less than 10 percent of both CH4 emissions and N2O emissions from mobile sources during 2002 and 1990. Given that they comprise a small share of mobile source emissions, even large uncertainties in these estimates will have a relatively small impact on the total emission estimate for mobile sources.
3.3 Natural Gas and Oil Systems
Natural gas and oil systems are the second largest source of CH4 emissions in the United States.75 As previously mentioned, CH4 has a global warming potential of 21, which indicates that the gas’ ability to trap heat in the atmosphere is 21 times greater than that of CO2.76 As a part of both natural gas and oil systems, CH4 is emitted throughout the processes of production, storage, transportation, and distribution. Fugitive emissions occur during normal production and maintenance processes and as a result of leaks in distribution pipelines. CH4 emissions from natural gas systems occur during the following three activities: processing, transmission, and distribution. During processing, liquid constituents and condensate are removed before the natural gas is introduced into transmission pipelines. Major sources of CH4 emissions include compressor equipment and venting practices. The natural gas transmission infrastructure is composed of large diameter, high pressure pipelines that transport natural gas from production wells to processing plants, storage facilities, and, eventually, to distribution companies or large consumers. Along the length of transmission pipelines, compressor stations maintain the pipeline pressure. The major sources of CH4 emissions include pipeline leaks, system vents, and compressor station equipment. Compared to the transmission infrastructure, natural gas distribution pipelines are much smaller and are not as pressurized. As natural gas is transferred from the transmission system to the distribution system, the pressure is reduced before delivery to individual customers. The major sources of CH4 emissions include leaks from pipeline, meters, and regulators. The majority of CH4 emissions from oil systems occur during crude oil extraction, transportation, and storage. The geologic formations that contain crude oil are often accompanied by natural gas. As oil is extracted from the subsurface, the associated natural gas is separated and transferred via
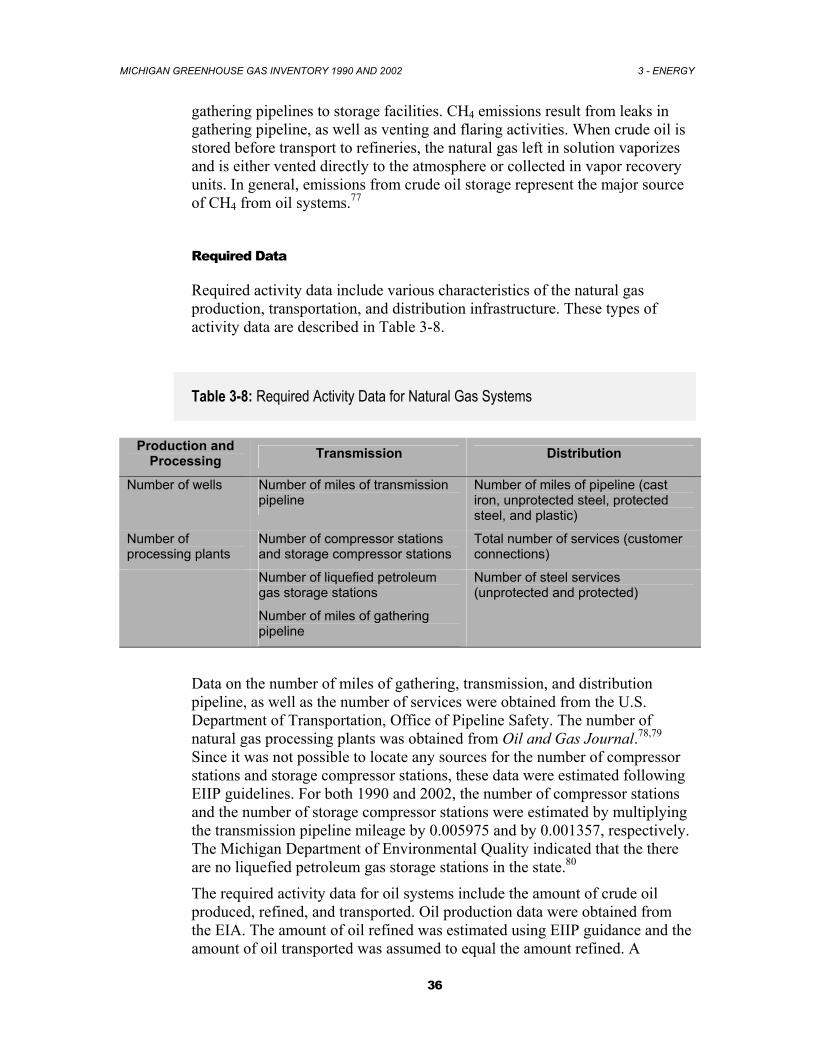
MICHIGAN GREENHOUSE GAS INVENTORY 1990 AND 2002 3 - ENERGY
36
gathering pipelines to storage facilities. CH4 emissions result from leaks in gathering pipeline, as well as venting and flaring activities. When crude oil is stored before transport to refineries, the natural gas left in solution vaporizes and is either vented directly to the atmosphere or collected in vapor recovery units. In general, emissions from crude oil storage represent the major source of CH4 from oil systems.77
Required Data
Required activity data include various characteristics of the natural gas production, transportation, and distribution infrastructure. These types of activity data are described in Table 3-8.
Table 3-8: Required Activity Data for Natural Gas Systems
Production and Processing Transmission Distribution
Number of wells Number of miles of transmission pipeline
Number of miles of pipeline (cast iron, unprotected steel, protected steel, and plastic)
Number of processing plants
Number of compressor stations and storage compressor stations
Total number of services (customer connections)
Number of liquefied petroleum gas storage stations
Number of steel services (unprotected and protected)
Number of miles of gathering pipeline
Data on the number of miles of gathering, transmission, and distribution pipeline, as well as the number of services were obtained from the U.S. Department of Transportation, Office of Pipeline Safety. The number of natural gas processing plants was obtained from Oil and Gas Journal.78,79 Since it was not possible to locate any sources for the number of compressor stations and storage compressor stations, these data were estimated following EIIP guidelines. For both 1990 and 2002, the number of compressor stations and the number of storage compressor stations were estimated by multiplying the transmission pipeline mileage by 0.005975 and by 0.001357, respectively. The Michigan Department of Environmental Quality indicated that the there are no liquefied petroleum gas storage stations in the state.80
The required activity data for oil systems include the amount of crude oil produced, refined, and transported. Oil production data were obtained from the EIA. The amount of oil refined was estimated using EIIP guidance and the amount of oil transported was assumed to equal the amount refined. A
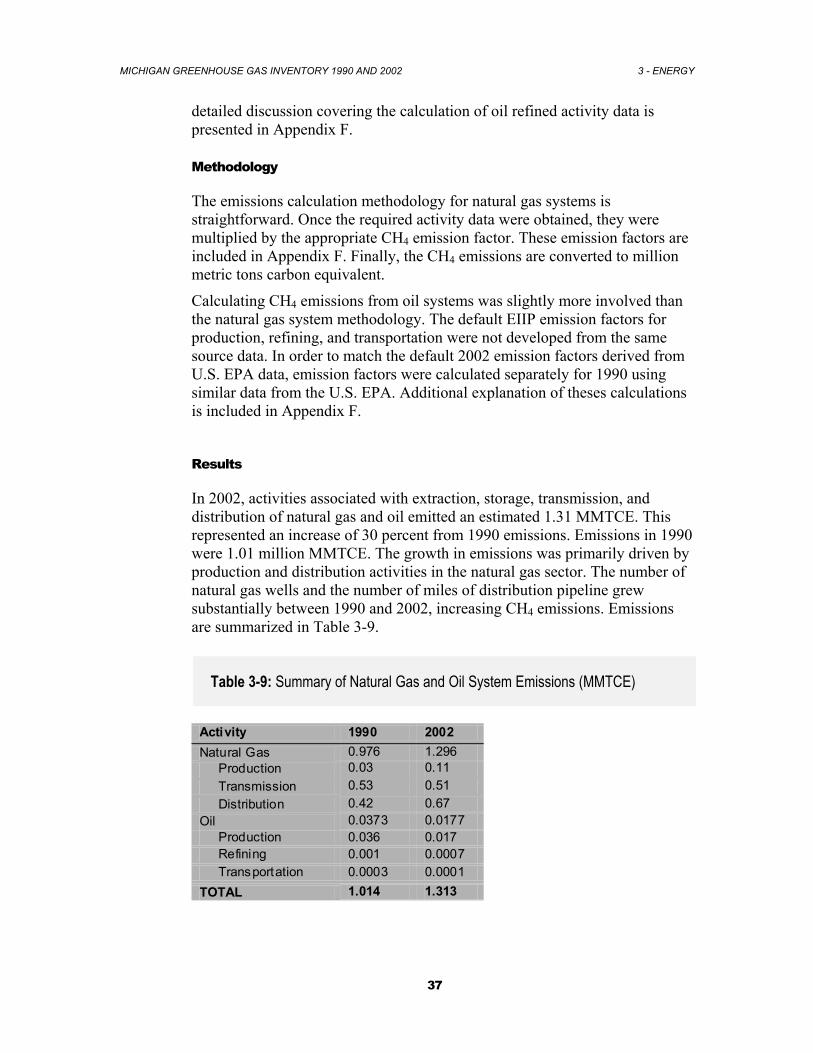
MICHIGAN GREENHOUSE GAS INVENTORY 1990 AND 2002 3 - ENERGY
37
detailed discussion covering the calculation of oil refined activity data is presented in Appendix F.
Methodology
The emissions calculation methodology for natural gas systems is straightforward. Once the required activity data were obtained, they were multiplied by the appropriate CH4 emission factor. These emission factors are included in Appendix F. Finally, the CH4 emissions are converted to million metric tons carbon equivalent.
Calculating CH4 emissions from oil systems was slightly more involved than the natural gas system methodology. The default EIIP emission factors for production, refining, and transportation were not developed from the same source data. In order to match the default 2002 emission factors derived from U.S. EPA data, emission factors were calculated separately for 1990 using similar data from the U.S. EPA. Additional explanation of theses calculations is included in Appendix F.
Results
In 2002, activities associated with extraction, storage, transmission, and distribution of natural gas and oil emitted an estimated 1.31 MMTCE. This represented an increase of 30 percent from 1990 emissions. Emissions in 1990 were 1.01 million MMTCE. The growth in emissions was primarily driven by production and distribution activities in the natural gas sector. The number of natural gas wells and the number of miles of distribution pipeline grew substantially between 1990 and 2002, increasing CH4 emissions. Emissions are summarized in Table 3-9.
Table 3-9: Summary of Natural Gas and Oil System Emissions (MMTCE)
Activity 1990 2002 Natural Gas 0.976 1.296
Production 0.03 0.11 Transmission 0.53 0.51 Distribution 0.42 0.67
Oil 0.0373 0.0177 Production 0.036 0.017 Refining 0.001 0.0007 Transportation 0.0003 0.0001
TOTAL 1.014 1.313
MICHIGAN GREENHOUSE GAS INVENTORY 1990 AND 2002 3 - ENERGY
38
3.4 Methane and Nitrous Oxide Emissions from Stationary Combustion
The EPA defines stationary combustion as “all fuel combustion activities except those related to transportation (i.e. mobile combustion).”81 Other than CO2, emissions from stationary combustion include the greenhouse gases such as CH4 and N2O and various other air pollutants, carbon monoxide (CO), nitrogen oxides (NOx), and non-methane volatile organic compounds (NMVOC), as the result of incomplete combustion.82 Emissions of these gases from this source category are influenced by fuel characteristics, size and vintage of equipment, combustion technology, pollution control equipment, operation and maintenance practices, and surrounding environmental conditions.83 N2O emissions from stationary combustion are “closely related to air-fuel mixes and combustion temperatures, as well as the characteristics of any pollution control equipment that is employed”. 84 CH4 emissions from this source category are more a function of CH4 content of the fuel and combustion efficiency. Emissions of these gases may range several orders of magnitude, much higher for facilities under poor maintenance and operation, as well as for those during start-up periods, when combustion efficiency is lowest.85
Required Data
The emissions of CH4 and N2O from stationary combustion depend on the amount and type of fuel used, combustion technologies, and the type of emission control. As the EIIP indicates, uncertainties exist in both the emission factors and activity data used to calculate emission estimates. Therefore, the more detailed information available on these factors related to combustion activity will lower uncertainty in emission estimation.86 To calculate CH4 and N2O emissions from stationary combustion for 1990, state-level fuel consumption data for five end-use categories (residential, commercial, industrial, transportation and electric utilities) were collected from the Department of Energy, Energy Information Administration (EIA)’s consumption data87. For uncertainties related to activity data, the EPA identifies difficulties in calculating emissions from wood combustion and the EIIP guidelines also state that the EIA State Energy Data does not fully capture the amount of wood used in fireplaces, wood stoves, and campfires. 88,
89
MICHIGAN GREENHOUSE GAS INVENTORY 1990 AND 2002 3 - ENERGY
39
Due to the timing of the research for this project, no comprehensive energy data for Michigan in 2002 had been compiled by EIA. Therefore, the Annual Coal Report 200290 and Annual Natural Gas Report 200291 were referred to as data sources for coal and natural gas consumption figures. For petroleum-based fuels and wood, the EIA’s historical consumption data for 1990-2001 were used to estimate values for 2002. Although we could obtain a very likely figure for 2002 CH4 and N2O emissions from the estimation process, it should be corrected in a future research when more accurate data are published by the EIA. The EPA states that “the uncertainties associated with the emission estimates of CH4 and N2O are greater than those associated with estimates of CO2 from fossil fuel combustion, which mainly rely on the carbon content of fuel combusted.”92 Inherent uncertainties for the emission factors of these gases are mainly derived from the fact that they cover only a limited subset of combustion conditions. In this inventory, the estimates of CH4 and N2O emissions are based on fuel use multiplied by an aggregate emission factor for different sectors, rather than taking account of combustion technology and type of emission control.93 However, because of “the combined difficulty in obtaining specific combustion technology information and the relatively low contribution of this source to a state’s total emissions”, the EIIP guidelines support the IPCC Tier 1 approach (the methodology employed here) as a recommended approach for a state’s inventory purpose.94 Methodology
Emissions of CH4 and N2O from stationary combustion for 1990 and 2002 were calculated using the EIIP guidelines and the State Inventory Tool (SIT). Consumption data that were originally provided in physical units such as barrels and short tons were converted to British thermal units (Btu) by factors supplied by the EIIP guidelines and EIA. For some fuel types used in part for non-fuel purposes (i.e. asphalt and road oil), the percentage of stored carbon for that non-fuel use was calculated for each fuel type to obtain use the net carbon available for immediate release. We subtracted the non-fuel amount from consumption data to obtain the CH4 and N2O amounts immediately released to the atmosphere. Results
Overall, stationary combustion is a small source of CH4 and N2O in the State of Michigan as well as in the United States. However, there have been some interesting changes over the last 12 years. The economic sector that contributed most to CH4 emissions was the residential sector, accounting for more than half, or 51 percent for 2002 and 64 percent for 1990 (Table 3-10). The second biggest contributor was the industrial sector, accounting for 29
MICHIGAN GREENHOUSE GAS INVENTORY 1990 AND 2002 3 - ENERGY
40
and 21 percent, respectively, for 2002 and 1990. The industrial sector was followed by minor contributions from the commercial and electric utility sectors. The higher CH4 emission from the residential sector is mainly due to this sectors’ relative dependency on wood (Table 3-10), which has a higher emission factor for CH4 compared with other fuels.10 Higher dependency on wood made the emission intensity of this sector the highest among all economic sectors despite its relatively small energy consumption (Table 3-11).
On the contrary, the emission shares by sector were different for N2O emissions. For both years, the electric utility sector was by far the largest emitter with over 60 percent of the state’s total N2O emissions from stationary combustion, followed by the industrial, residential and commercial sectors (Table 3-12). This is because the utility sector depends heavily on coal for electricity generation, and coal has a higher emission factor for N2O compared with other fuels (Table 3-13). Emissions of CH4 were 0.061 MMTCE in 2002, showing a decrease of 34 percent from 0.0924 MMTCE in 1990 (Table 3-10) despite growing energy consumption over these twelve years (Table 3-11). This decrease in CH4 emissions was primarily due to less wood consumption in the residential sector. N2O emissions decreased slightly, by four percent from 0.1256 MMTCE in 1990 to 0.1204 MMTCE in 2002 (Table 3-12). The largest source of N2O emissions was coal combustion by electricity generators, which alone accounted for over 60 percent of total N2O emissions from stationary combustion in both years.
10 For CH4 Emission Factors, see Appendix E.
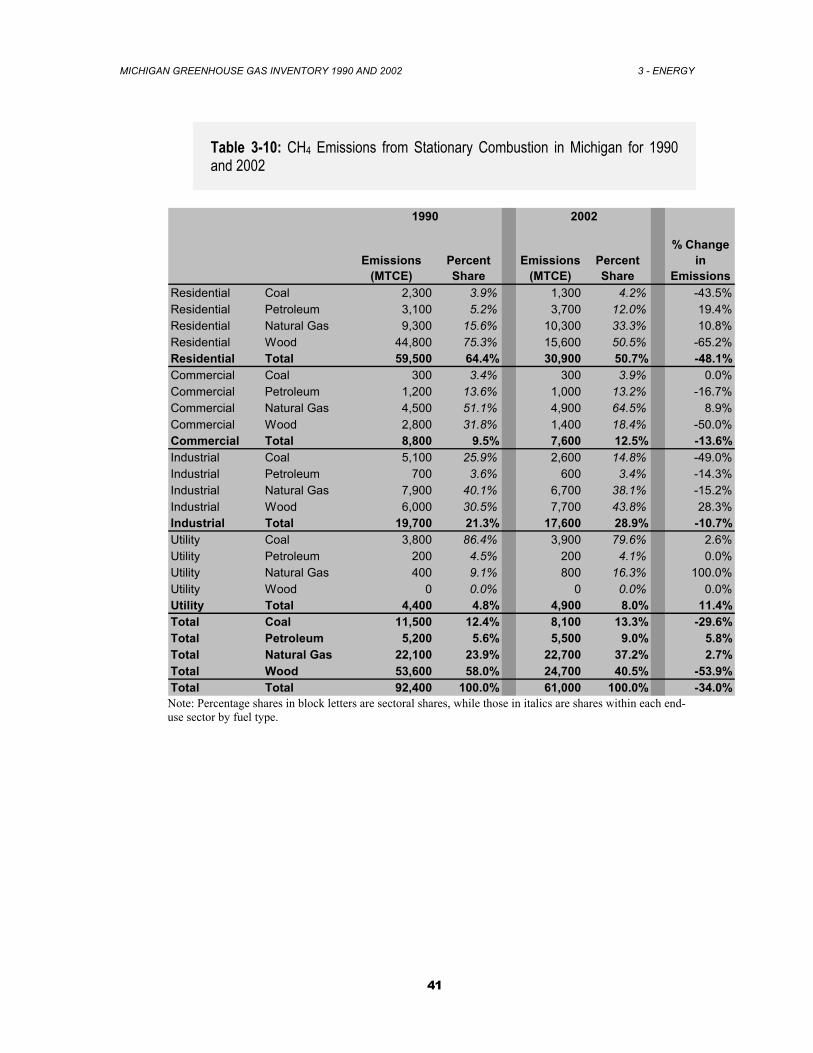
MICHIGAN GREENHOUSE GAS INVENTORY 1990 AND 2002 3 - ENERGY
41
Table 3-10: CH4 Emissions from Stationary Combustion in Michigan for 1990 and 2002
Emissions (MTCE)
Percent Share
Emissions (MTCE)
Percent Share
% Change in
EmissionsResidential Coal 2,300 3.9% 1,300 4.2% -43.5%Residential Petroleum 3,100 5.2% 3,700 12.0% 19.4%Residential Natural Gas 9,300 15.6% 10,300 33.3% 10.8%Residential Wood 44,800 75.3% 15,600 50.5% -65.2%Residential Total 59,500 64.4% 30,900 50.7% -48.1%Commercial Coal 300 3.4% 300 3.9% 0.0%Commercial Petroleum 1,200 13.6% 1,000 13.2% -16.7%Commercial Natural Gas 4,500 51.1% 4,900 64.5% 8.9%Commercial Wood 2,800 31.8% 1,400 18.4% -50.0%Commercial Total 8,800 9.5% 7,600 12.5% -13.6%Industrial Coal 5,100 25.9% 2,600 14.8% -49.0%Industrial Petroleum 700 3.6% 600 3.4% -14.3%Industrial Natural Gas 7,900 40.1% 6,700 38.1% -15.2%Industrial Wood 6,000 30.5% 7,700 43.8% 28.3%Industrial Total 19,700 21.3% 17,600 28.9% -10.7%Utility Coal 3,800 86.4% 3,900 79.6% 2.6%Utility Petroleum 200 4.5% 200 4.1% 0.0%Utility Natural Gas 400 9.1% 800 16.3% 100.0%Utility Wood 0 0.0% 0 0.0% 0.0%Utility Total 4,400 4.8% 4,900 8.0% 11.4%Total Coal 11,500 12.4% 8,100 13.3% -29.6%Total Petroleum 5,200 5.6% 5,500 9.0% 5.8%Total Natural Gas 22,100 23.9% 22,700 37.2% 2.7%Total Wood 53,600 58.0% 24,700 40.5% -53.9%Total Total 92,400 100.0% 61,000 100.0% -34.0%
20021990
Note: Percentage shares in block letters are sectoral shares, while those in italics are shares within each end-use sector by fuel type.
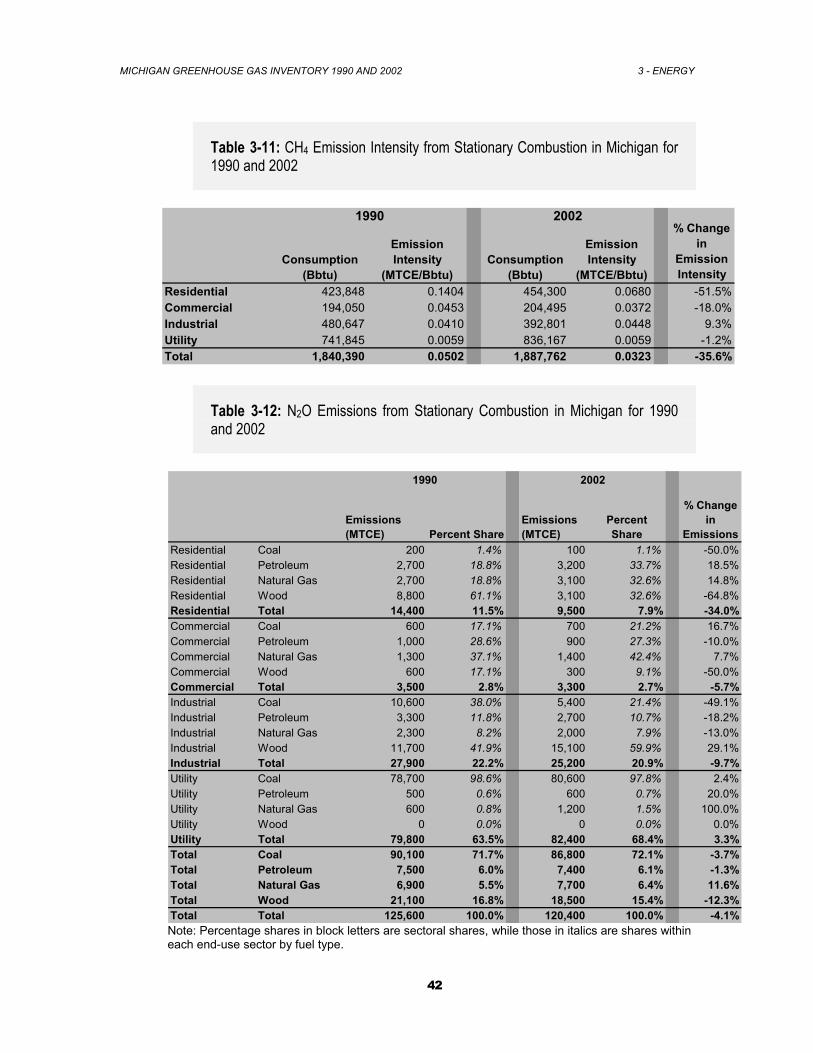
MICHIGAN GREENHOUSE GAS INVENTORY 1990 AND 2002 3 - ENERGY
42
Table 3-11: CH4 Emission Intensity from Stationary Combustion in Michigan for 1990 and 2002
Consumption (Bbtu)
Emission Intensity
(MTCE/Bbtu)Consumption
(Bbtu)
Emission Intensity
(MTCE/Bbtu)Residential 423,848 0.1404 454,300 0.0680 -51.5%Commercial 194,050 0.0453 204,495 0.0372 -18.0%Industrial 480,647 0.0410 392,801 0.0448 9.3%Utility 741,845 0.0059 836,167 0.0059 -1.2%Total 1,840,390 0.0502 1,887,762 0.0323 -35.6%
% Change in
Emission Intensity
1990 2002
Table 3-12: N2O Emissions from Stationary Combustion in Michigan for 1990 and 2002
Emissions (MTCE) Percent Share
Emissions (MTCE)
Percent Share
% Change in
EmissionsResidential Coal 200 1.4% 100 1.1% -50.0%Residential Petroleum 2,700 18.8% 3,200 33.7% 18.5%Residential Natural Gas 2,700 18.8% 3,100 32.6% 14.8%Residential Wood 8,800 61.1% 3,100 32.6% -64.8%Residential Total 14,400 11.5% 9,500 7.9% -34.0%Commercial Coal 600 17.1% 700 21.2% 16.7%Commercial Petroleum 1,000 28.6% 900 27.3% -10.0%Commercial Natural Gas 1,300 37.1% 1,400 42.4% 7.7%Commercial Wood 600 17.1% 300 9.1% -50.0%Commercial Total 3,500 2.8% 3,300 2.7% -5.7%Industrial Coal 10,600 38.0% 5,400 21.4% -49.1%Industrial Petroleum 3,300 11.8% 2,700 10.7% -18.2%Industrial Natural Gas 2,300 8.2% 2,000 7.9% -13.0%Industrial Wood 11,700 41.9% 15,100 59.9% 29.1%Industrial Total 27,900 22.2% 25,200 20.9% -9.7%Utility Coal 78,700 98.6% 80,600 97.8% 2.4%Utility Petroleum 500 0.6% 600 0.7% 20.0%Utility Natural Gas 600 0.8% 1,200 1.5% 100.0%Utility Wood 0 0.0% 0 0.0% 0.0%Utility Total 79,800 63.5% 82,400 68.4% 3.3%Total Coal 90,100 71.7% 86,800 72.1% -3.7%Total Petroleum 7,500 6.0% 7,400 6.1% -1.3%Total Natural Gas 6,900 5.5% 7,700 6.4% 11.6%Total Wood 21,100 16.8% 18,500 15.4% -12.3%Total Total 125,600 100.0% 120,400 100.0% -4.1%
1990 2002
Note: Percentage shares in block letters are sectoral shares, while those in italics are shares within each end-use sector by fuel type.
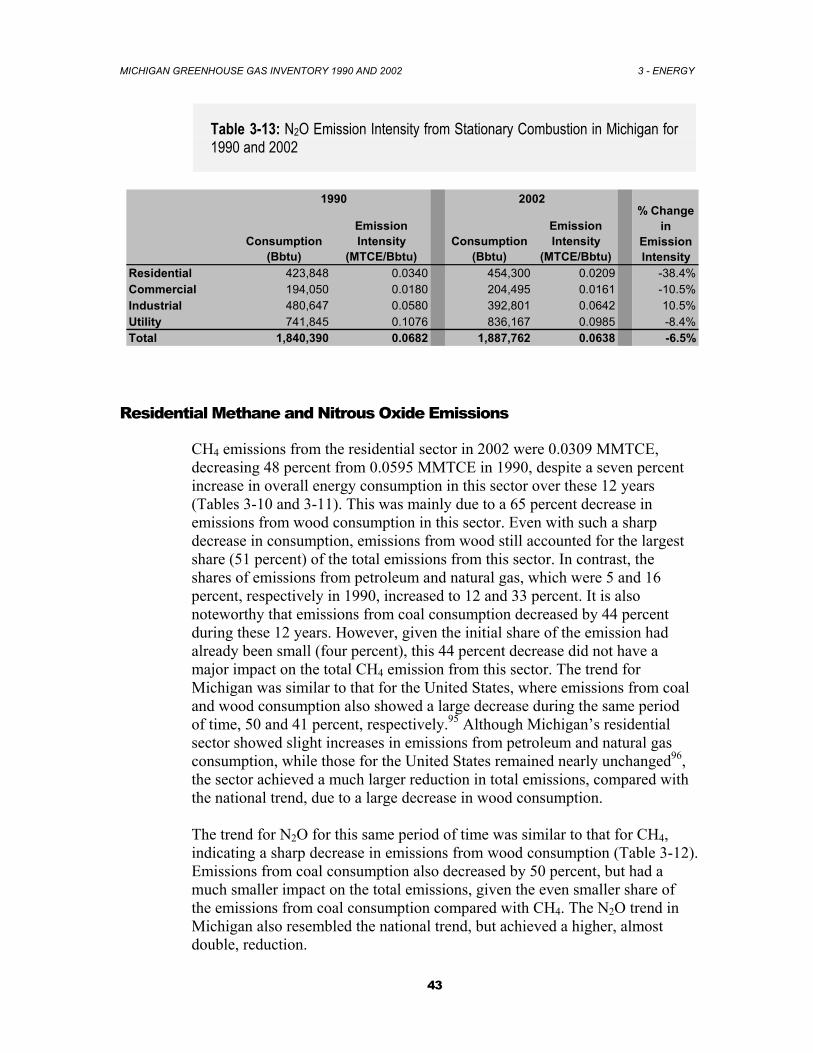
MICHIGAN GREENHOUSE GAS INVENTORY 1990 AND 2002 3 - ENERGY
43
Table 3-13: N2O Emission Intensity from Stationary Combustion in Michigan for 1990 and 2002
Consumption (Bbtu)
Emission Intensity
(MTCE/Bbtu)Consumption
(Bbtu)
Emission Intensity
(MTCE/Bbtu)Residential 423,848 0.0340 454,300 0.0209 -38.4%Commercial 194,050 0.0180 204,495 0.0161 -10.5%Industrial 480,647 0.0580 392,801 0.0642 10.5%Utility 741,845 0.1076 836,167 0.0985 -8.4%Total 1,840,390 0.0682 1,887,762 0.0638 -6.5%
% Change in
Emission Intensity
20021990
Residential Methane and Nitrous Oxide Emissions
CH4 emissions from the residential sector in 2002 were 0.0309 MMTCE, decreasing 48 percent from 0.0595 MMTCE in 1990, despite a seven percent increase in overall energy consumption in this sector over these 12 years (Tables 3-10 and 3-11). This was mainly due to a 65 percent decrease in emissions from wood consumption in this sector. Even with such a sharp decrease in consumption, emissions from wood still accounted for the largest share (51 percent) of the total emissions from this sector. In contrast, the shares of emissions from petroleum and natural gas, which were 5 and 16 percent, respectively in 1990, increased to 12 and 33 percent. It is also noteworthy that emissions from coal consumption decreased by 44 percent during these 12 years. However, given the initial share of the emission had already been small (four percent), this 44 percent decrease did not have a major impact on the total CH4 emission from this sector. The trend for Michigan was similar to that for the United States, where emissions from coal and wood consumption also showed a large decrease during the same period of time, 50 and 41 percent, respectively.95 Although Michigan’s residential sector showed slight increases in emissions from petroleum and natural gas consumption, while those for the United States remained nearly unchanged96, the sector achieved a much larger reduction in total emissions, compared with the national trend, due to a large decrease in wood consumption. The trend for N2O for this same period of time was similar to that for CH4, indicating a sharp decrease in emissions from wood consumption (Table 3-12). Emissions from coal consumption also decreased by 50 percent, but had a much smaller impact on the total emissions, given the even smaller share of the emissions from coal consumption compared with CH4. The N2O trend in Michigan also resembled the national trend, but achieved a higher, almost double, reduction.
MICHIGAN GREENHOUSE GAS INVENTORY 1990 AND 2002 3 - ENERGY
44
Commercial Methane and Nitrous Oxide Emissions
Despite a five percent increase in energy consumption (Table 3-11), CH4 emission from this sector decreased 14 percent from 0.0088 MMTCE in 1990 to 0.0076 MMTCE in 2002. This is because of emission reductions from petroleum and wood consumption (Table 3-10). The same trend could be observed for N2O emissions, where the sharp decrease in emissions from wood consumption by 50 percent contributed to a six percent reduction in this sector (Table 3-12). However, the change in absolute amounts was very small, from 0.0035 MMTCE in 1990 to 0.0033 MMTCE in 2002.
Industrial Methane and Nitrous Oxide Emissions
Unlike the residential and commercial sectors, CH4 emissions from wood consumption in the industrial sector slightly increased by 0.0017 MMTCE from 1990 to 2002. However, the sector as a whole achieved a total emission reduction of 11 percent, largely due to a 49 percent emission reduction from coal consumption as well as reductions from other types of fuel consumption (Table 3-10). A similar scenario took place for N2O emissions from wood consumption increased by 0.0034 MMTCE from 1990 to 2002, but the reduced emissions from the other types of fuel consumption, notably from coal, contributed to a total reduction of 10 percent for this sector in these 12 years (Table 3-12).
Electric Utility Methane and Nitrous Oxide Emissions
The share of CH4 emissions from the electric utility sector was small, eight percent for 2002 and five percent for 1990 (Table 3-10). This was because the sector did not depend on wood. On the other hand, the utility sector was the largest contributor for N2O emissions, responsible for 68 percent for 2002 and 64 percent for 1990 – due to its higher coal dependency for power generation (Table 3-12). The N2O emission from coal consumption in this sector was 98 and 99 percent in 2002 and 1990, respectively.
MICHIGAN GREENHOUSE GAS INVENTORY 1990 AND 2002 4 - INDUSTRIAL PROCESSES
45
4. Industrial Processes
Industry emits greenhouse gases in two basic ways: through the combustion of fossil fuels for energy production and through a variety of raw material transformation and production processes. The emissions associated with fossil fuel combustion have already been accounted for and discussed in the previous energy section, Chapter 3.1: Carbon Dioxide Emissions from Fossil Fuel Combustion. This section of the report will focus on the various industrial processes that are major contributors of greenhouse gas emissions. The specific sources of emissions are as follows: Iron and Steel Production Cement Manufacture Lime Manufacture Limestone and Dolomite Use Nitric Acid Production Adipic Acid Production Ozone Depleting Substances Substitution Semiconductor Manufacture Magnesium Production Electric Power Transmission and Distribution Systems HCFC-22 Production Aluminum Production
In addition to contributing to carbon dioxide (CO2), methane (CH4), and nitrous oxide (N2O) emissions, certain industrial processes are major sources of emissions of GHGs with high global warming potentials. These gasses include sulfur hexafluoride (SF6), perfluorocarbons (PFCs), and hydrofluorocarbons (HFCs).
Research revealed that a number of industrial processes that have the potential for contributing significant amounts of greenhouse gases do not actually occur in Michigan and emissions calculations were not needed. These industries are: nitric acid production, adipic acid production, HCFC-22 production, and aluminum production.
The general methodology to estimate industrial process greenhouse gas emissions involves multiplying production data for each process by an emission factor per unit production. The emission factors used were either derived using calculations that assume precise and efficient chemical reactions or were based upon empirical data in published references.
MICHIGAN GREENHOUSE GAS INVENTORY 1990 AND 2002 4 - INDUSTRIAL PROCESSES
46
4.1 Emissions Summary
Over the period of 1990 to 2002, Michigan’s industrial process greenhouse emissions increased to 3.04 million metric tons carbon equivalent (MMTCE) in 2002 from 1.77 MMTCE in 1990, an increase of approximately 72 percent. A summary of all industrial process emissions is presented as Table 4-1. The iron and steel sector was the largest emitter in both 1990 and 2002. In 2002, CO2 emissions increased to 1.08 MMTCE, nearly a 66 percent increase over 1990 emissions. Iron and steel CH4 emissions decreased to 0.022 MMTCE, a decrease of 6.8 percent from 1990 levels. In 1990, this sector contributed emissions of CO2 on the order of 0.65 MMTCE and CH4 emissions totaling 0.024 MMTCE. Figure 4-1 presents industrial process CO2 and CH4 emissions.
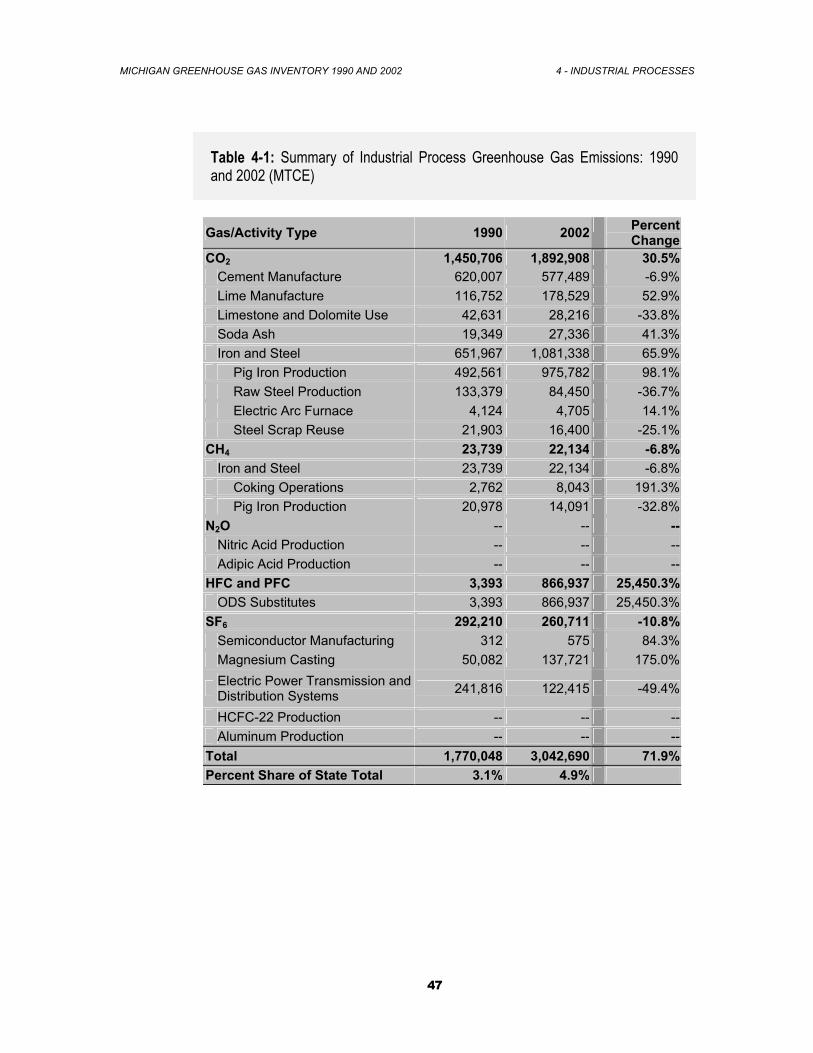
MICHIGAN GREENHOUSE GAS INVENTORY 1990 AND 2002 4 - INDUSTRIAL PROCESSES
47
Table 4-1: Summary of Industrial Process Greenhouse Gas Emissions: 1990 and 2002 (MTCE)
Gas/Activity Type 1990 2002 Percent Change
CO2 1,450,706 1,892,908 30.5% Cement Manufacture 620,007 577,489 -6.9% Lime Manufacture 116,752 178,529 52.9% Limestone and Dolomite Use 42,631 28,216 -33.8% Soda Ash 19,349 27,336 41.3% Iron and Steel 651,967 1,081,338 65.9% Pig Iron Production 492,561 975,782 98.1% Raw Steel Production 133,379 84,450 -36.7% Electric Arc Furnace 4,124 4,705 14.1% Steel Scrap Reuse 21,903 16,400 -25.1%CH4 23,739 22,134 -6.8% Iron and Steel 23,739 22,134 -6.8% Coking Operations 2,762 8,043 191.3% Pig Iron Production 20,978 14,091 -32.8%N2O -- -- -- Nitric Acid Production -- -- -- Adipic Acid Production -- -- --HFC and PFC 3,393 866,937 25,450.3% ODS Substitutes 3,393 866,937 25,450.3%SF6 292,210 260,711 -10.8% Semiconductor Manufacturing 312 575 84.3% Magnesium Casting 50,082 137,721 175.0%
Electric Power Transmission and Distribution Systems 241,816 122,415 -49.4%
HCFC-22 Production -- -- -- Aluminum Production -- -- --Total 1,770,048 3,042,690 71.9%Percent Share of State Total 3.1% 4.9%
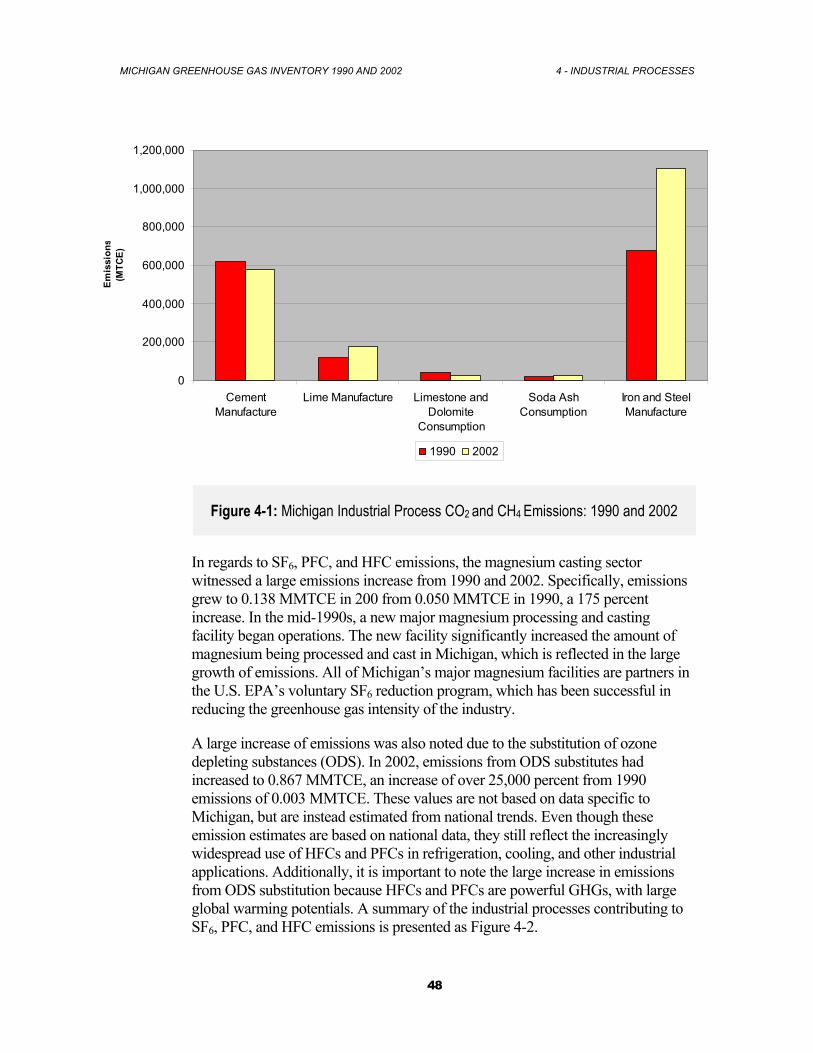
MICHIGAN GREENHOUSE GAS INVENTORY 1990 AND 2002 4 - INDUSTRIAL PROCESSES
48
0
200,000
400,000
600,000
800,000
1,000,000
1,200,000
CementManufacture
Lime Manufacture Limestone andDolomite
Consumption
Soda AshConsumption
Iron and SteelManufacture
Emis
sion
s(M
TCE)
1990 2002
Figure 4-1: Michigan Industrial Process CO2 and CH4 Emissions: 1990 and 2002
In regards to SF6, PFC, and HFC emissions, the magnesium casting sector witnessed a large emissions increase from 1990 and 2002. Specifically, emissions grew to 0.138 MMTCE in 200 from 0.050 MMTCE in 1990, a 175 percent increase. In the mid-1990s, a new major magnesium processing and casting facility began operations. The new facility significantly increased the amount of magnesium being processed and cast in Michigan, which is reflected in the large growth of emissions. All of Michigan’s major magnesium facilities are partners in the U.S. EPA’s voluntary SF6 reduction program, which has been successful in reducing the greenhouse gas intensity of the industry.
A large increase of emissions was also noted due to the substitution of ozone depleting substances (ODS). In 2002, emissions from ODS substitutes had increased to 0.867 MMTCE, an increase of over 25,000 percent from 1990 emissions of 0.003 MMTCE. These values are not based on data specific to Michigan, but are instead estimated from national trends. Even though these emission estimates are based on national data, they still reflect the increasingly widespread use of HFCs and PFCs in refrigeration, cooling, and other industrial applications. Additionally, it is important to note the large increase in emissions from ODS substitution because HFCs and PFCs are powerful GHGs, with large global warming potentials. A summary of the industrial processes contributing to SF6, PFC, and HFC emissions is presented as Figure 4-2.
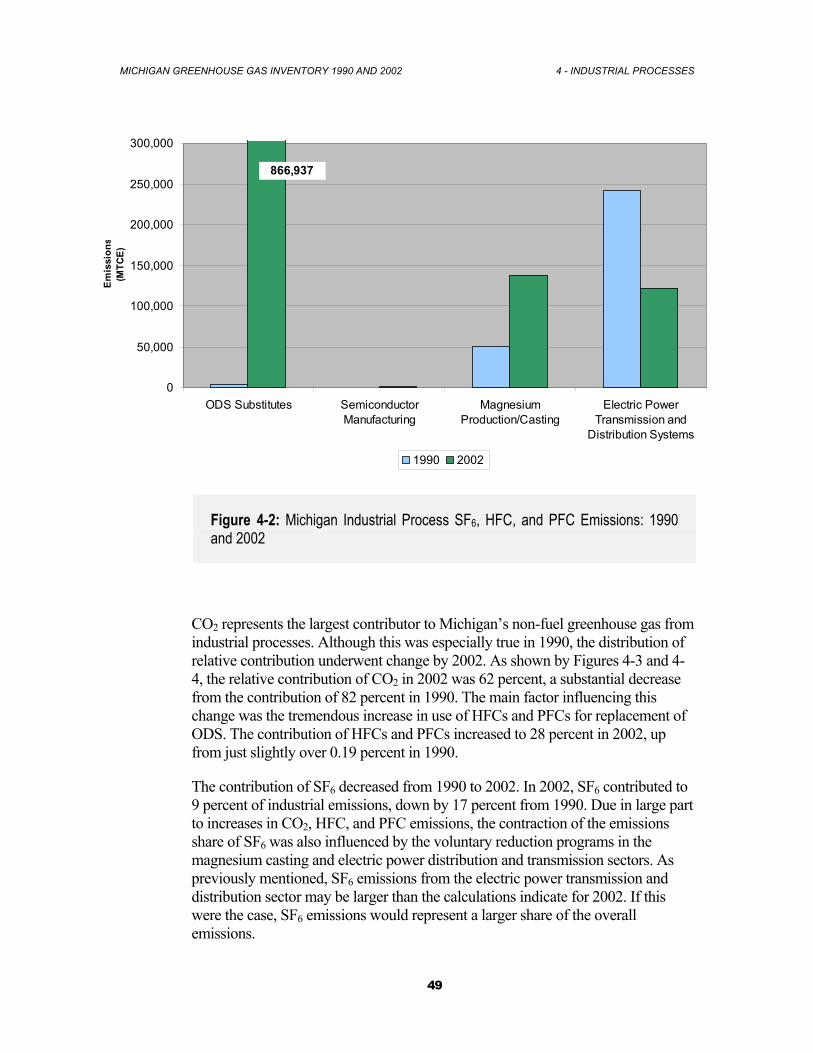
MICHIGAN GREENHOUSE GAS INVENTORY 1990 AND 2002 4 - INDUSTRIAL PROCESSES
49
0
50,000
100,000
150,000
200,000
250,000
300,000
ODS Substitutes SemiconductorManufacturing
MagnesiumProduction/Casting
Electric PowerTransmission and
Distribution Systems
Emis
sion
s(M
TCE)
1990 2002
866,937
Figure 4-2: Michigan Industrial Process SF6, HFC, and PFC Emissions: 1990 and 2002
CO2 represents the largest contributor to Michigan’s non-fuel greenhouse gas from industrial processes. Although this was especially true in 1990, the distribution of relative contribution underwent change by 2002. As shown by Figures 4-3 and 4-4, the relative contribution of CO2 in 2002 was 62 percent, a substantial decrease from the contribution of 82 percent in 1990. The main factor influencing this change was the tremendous increase in use of HFCs and PFCs for replacement of ODS. The contribution of HFCs and PFCs increased to 28 percent in 2002, up from just slightly over 0.19 percent in 1990.
The contribution of SF6 decreased from 1990 to 2002. In 2002, SF6 contributed to 9 percent of industrial emissions, down by 17 percent from 1990. Due in large part to increases in CO2, HFC, and PFC emissions, the contraction of the emissions share of SF6 was also influenced by the voluntary reduction programs in the magnesium casting and electric power distribution and transmission sectors. As previously mentioned, SF6 emissions from the electric power transmission and distribution sector may be larger than the calculations indicate for 2002. If this were the case, SF6 emissions would represent a larger share of the overall emissions.
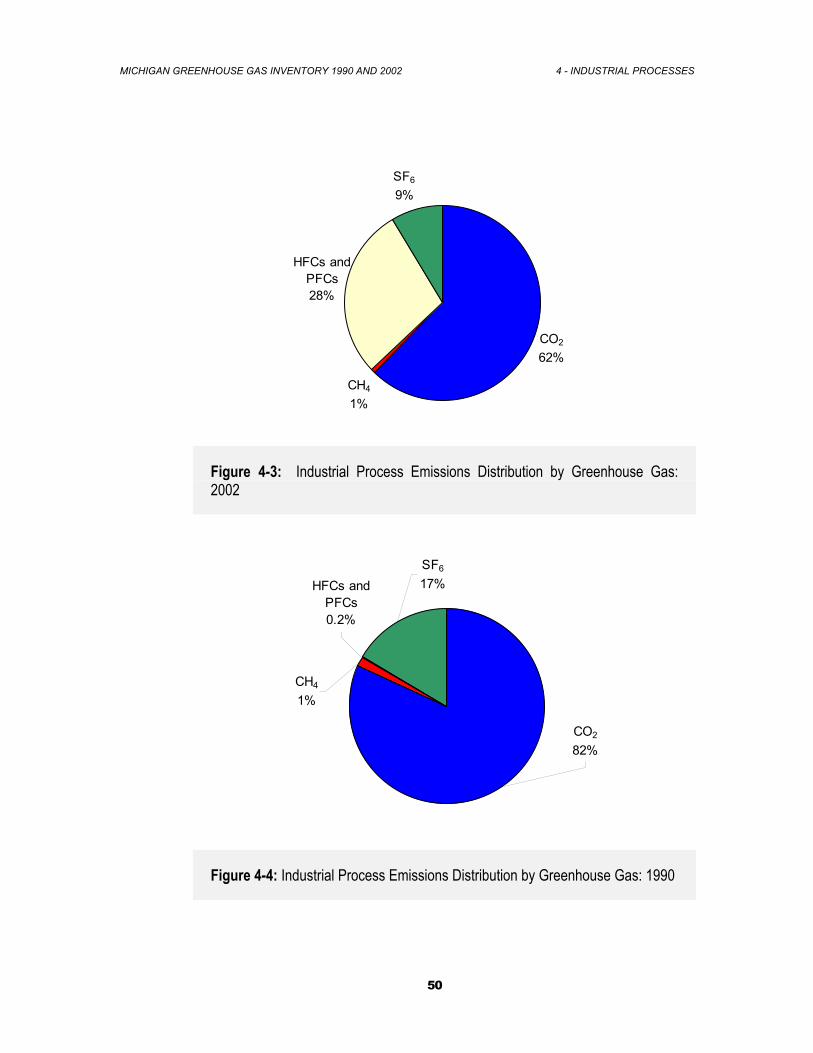
MICHIGAN GREENHOUSE GAS INVENTORY 1990 AND 2002 4 - INDUSTRIAL PROCESSES
50
CO2
62%
CH4
1%
SF6
9%
HFCs and PFCs28%
Figure 4-3: Industrial Process Emissions Distribution by Greenhouse Gas: 2002
HFCs and PFCs0.2%
CO2
82%
CH4
1%
SF6
17%
Figure 4-4: Industrial Process Emissions Distribution by Greenhouse Gas: 1990
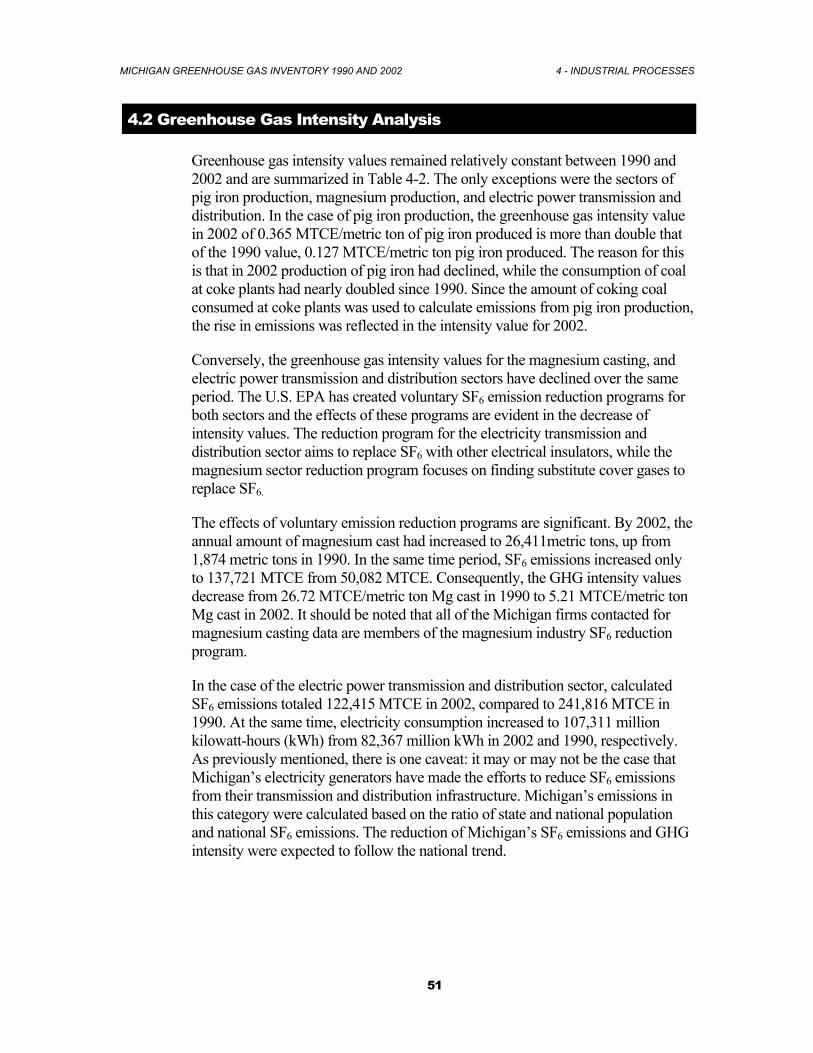
MICHIGAN GREENHOUSE GAS INVENTORY 1990 AND 2002 4 - INDUSTRIAL PROCESSES
51
4.2 Greenhouse Gas Intensity Analysis
Greenhouse gas intensity values remained relatively constant between 1990 and 2002 and are summarized in Table 4-2. The only exceptions were the sectors of pig iron production, magnesium production, and electric power transmission and distribution. In the case of pig iron production, the greenhouse gas intensity value in 2002 of 0.365 MTCE/metric ton of pig iron produced is more than double that of the 1990 value, 0.127 MTCE/metric ton pig iron produced. The reason for this is that in 2002 production of pig iron had declined, while the consumption of coal at coke plants had nearly doubled since 1990. Since the amount of coking coal consumed at coke plants was used to calculate emissions from pig iron production, the rise in emissions was reflected in the intensity value for 2002.
Conversely, the greenhouse gas intensity values for the magnesium casting, and electric power transmission and distribution sectors have declined over the same period. The U.S. EPA has created voluntary SF6 emission reduction programs for both sectors and the effects of these programs are evident in the decrease of intensity values. The reduction program for the electricity transmission and distribution sector aims to replace SF6 with other electrical insulators, while the magnesium sector reduction program focuses on finding substitute cover gases to replace SF6.
The effects of voluntary emission reduction programs are significant. By 2002, the annual amount of magnesium cast had increased to 26,411metric tons, up from 1,874 metric tons in 1990. In the same time period, SF6 emissions increased only to 137,721 MTCE from 50,082 MTCE. Consequently, the GHG intensity values decrease from 26.72 MTCE/metric ton Mg cast in 1990 to 5.21 MTCE/metric ton Mg cast in 2002. It should be noted that all of the Michigan firms contacted for magnesium casting data are members of the magnesium industry SF6 reduction program.
In the case of the electric power transmission and distribution sector, calculated SF6 emissions totaled 122,415 MTCE in 2002, compared to 241,816 MTCE in 1990. At the same time, electricity consumption increased to 107,311 million kilowatt-hours (kWh) from 82,367 million kWh in 2002 and 1990, respectively. As previously mentioned, there is one caveat: it may or may not be the case that Michigan’s electricity generators have made the efforts to reduce SF6 emissions from their transmission and distribution infrastructure. Michigan’s emissions in this category were calculated based on the ratio of state and national population and national SF6 emissions. The reduction of Michigan’s SF6 emissions and GHG intensity were expected to follow the national trend.
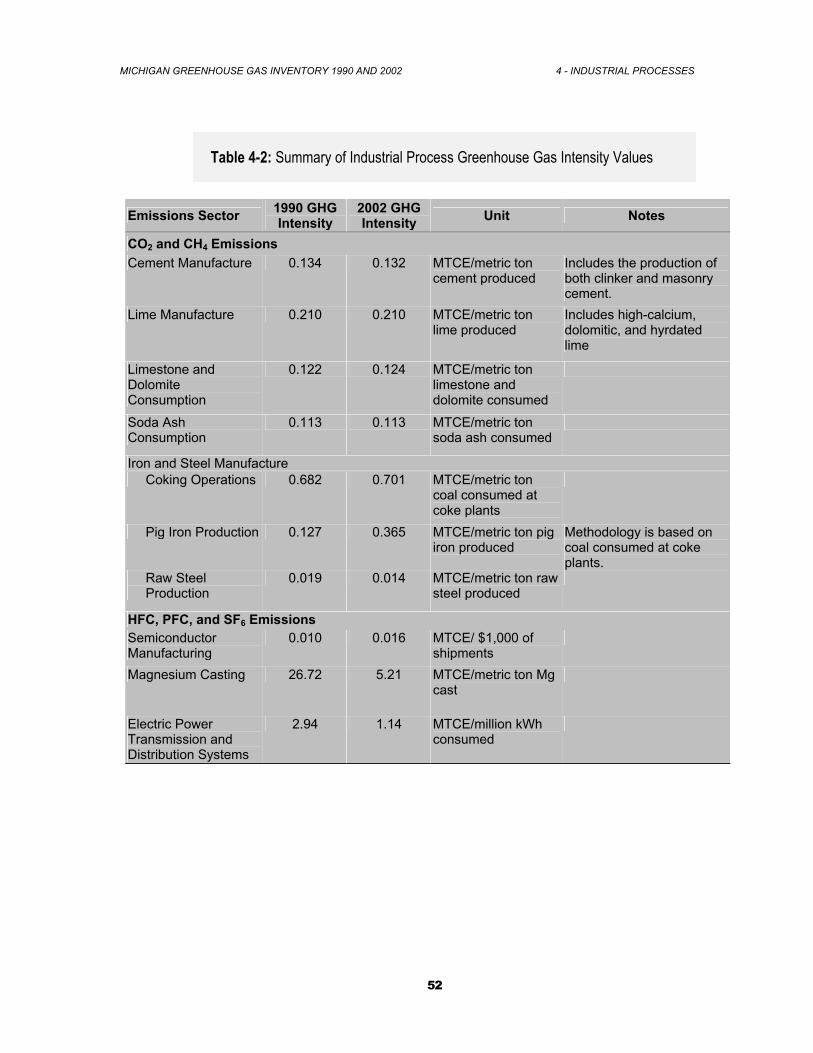
MICHIGAN GREENHOUSE GAS INVENTORY 1990 AND 2002 4 - INDUSTRIAL PROCESSES
52
Table 4-2: Summary of Industrial Process Greenhouse Gas Intensity Values
Emissions Sector 1990 GHG Intensity
2002 GHG Intensity Unit Notes
CO2 and CH4 Emissions Cement Manufacture 0.134 0.132 MTCE/metric ton
cement produced Includes the production of both clinker and masonry cement.
Lime Manufacture 0.210 0.210 MTCE/metric ton lime produced
Includes high-calcium, dolomitic, and hyrdated lime
Limestone and Dolomite Consumption
0.122 0.124 MTCE/metric ton limestone and dolomite consumed
Soda Ash Consumption
0.113 0.113 MTCE/metric ton soda ash consumed
Iron and Steel Manufacture Coking Operations 0.682 0.701 MTCE/metric ton
coal consumed at coke plants
Pig Iron Production 0.127 0.365 MTCE/metric ton pig iron produced
Methodology is based on coal consumed at coke plants.
Raw Steel Production
0.019 0.014 MTCE/metric ton raw steel produced
HFC, PFC, and SF6 Emissions Semiconductor Manufacturing
0.010 0.016 MTCE/ $1,000 of shipments
Magnesium Casting 26.72 5.21 MTCE/metric ton Mg cast
Electric Power Transmission and Distribution Systems
2.94 1.14 MTCE/million kWh consumed
MICHIGAN GREENHOUSE GAS INVENTORY 1990 AND 2002 4 - INDUSTRIAL PROCESSES
53
4.3 Industrial Process Emissions Description
Iron and Steel
The production of raw steel begins with heating iron ore in the presence of a reducing agent, usually metallurgical coal coke, to produce pig iron. The majority of CO2 emissions from iron and steel production occur when metallurgical coke is oxidized during the production of pig iron. Metallurgical coke is produced by carbonizing coking coal. During this process, coal is heated in the absence of air, which removes moisture and volatile organic constituents. Coking operations also produce carbon byproducts of coke oven gas, which is burned as fuel by the coking plant, and coal tar.
Steel is produced by heating pig iron, scrap steel or iron, and alloying elements in a furnace. This process removes much of the carbon contained in pig iron, which results in CO2 emissions.
Required Data
The activity data required to calculate iron and steel emissions include the amount of coal consumed for coal coke production at Michigan coking plants and the amount of raw steel, pig iron, and electric arc furnace steel produced in Michigan. The amounts of pig iron and electric arc furnace steel produced were not available for Michigan. Therefore, these data were estimated based on national data. A more detailed description of the estimation methods is presented in Appendix G. Additionally, the amounts of scrap pig iron and scrap steel consumed were required for emissions calculations.
Except for the emission factors for coking coal, which were back calculated based on EIA data, all emission factors were obtained from the U.S. EPA.
Methodology
Since the SIT modules do not include calculations for emissions from the iron and steel industry, a separate methodology had to be pursued. Calculation methodologies from both the U.S. EPA and the IPCC were evaluated for applicability to Michigan. It was discovered that although the U.S. EPA methodology provides a more complete accounting of emissions, the Intergovernmental Panel on Climate Change (IPCC) methodology was a better fit for the available data. Use of the U.S. EPA methodology would have necessitated numerous estimations of Michigan data, based only on national trends. For
MICHIGAN GREENHOUSE GAS INVENTORY 1990 AND 2002 4 - INDUSTRIAL PROCESSES
54
example, the amount of metallurgical coke imported and exported from Michigan was not available.
However, when possible, certain portions of the U.S. EPA methodology were incorporated into the approach used for Michigan. For instance, the U.S. EPA’s practice of accounting for the release of CO2 from scrap steel and scrap pig iron consumption was used in the emissions calculations. This practice included the assumption that the entire carbon content of the scrap steel and scrap pig iron is released on combustion. Also, the U.S. EPA methodology includes CH4 emission factors for coking operations and pig iron production, whereas the IPCC methodology does not.
Results
The increase in total greenhouse emissions from the iron and steel sector was driven by the significant increase in coal consumed at coking plants. Although the production of both pig iron and steel decreased between 1990 and 2002, coking plants consumed nearly twice the amount of coal in 2002, which is reflected in the near doubling of emissions from the sector. Greenhouse gas emissions from the iron and steel sector totaled 1.10 MMTCE in 2002 and 0.676 MMTCE in 1990.
Cement Manufacture
Cement manufacture, an energy and raw material intensive process, is one of the largest sources of industrial CO2 emissions in the U.S. Cement is produced by combining clinker with gypsum. Clinker production begins in a cement kiln, where limestone (calcium carbonate, CaCO3) is heated at a temperature of about 2,400° F to form lime (calcium oxide, CaO) and CO2. This process, known as calcination, is responsible for CO2 emissions. Calcination is represented by the following equation:
23 COCaOheatCaCO +→+ After calcining, the lime is mixed with silica-containing materials to produce clinker. After cooling, clinker is mixed with a small amount of gypsum and is used to make Portland cement. The production of masonry cement requires mixing Portland cement with additional lime, which results in additional CO2 emissions.
Required Data
In order to calculate CO2 emissions from cement manufacture, activity data for annual clinker and masonry cement production are required. Both types of
MICHIGAN GREENHOUSE GAS INVENTORY 1990 AND 2002 4 - INDUSTRIAL PROCESSES
55
data were obtained from USGS sources, including the 1990 and 2002 Minerals Yearbook.97
Methodology
In order to calculate the CO2 emissions from clinker production, the emission factor for clinker was multiplied by the total annual clinker production. After the calcination process is complete, the cement kiln typically contains remnants of non-, partially, and fully-calcinated material, known as cement kiln dust (CKD). The calcinated portions of CKD are not accounted for in the clinker emissions calculations. Accordingly, the IPCC recommended methodology states that the CO2 emissions due to CKD are approximately 2 percent of the total clinker production emissions.98
Since additional lime is required for the production of masonry cement, an emission factor for masonry cement was multiplied by the total annual masonry cement production. The sum of emissions from the clinker, CKD, and masonry cement categories represents the total CO2 emissions for the cement industry.
Results
In 2002, CO2 emissions from cement manufacture were 0.577 MMTCE, a 7 percent decrease from 1990 emissions. In 1990, CO2 emissions totaled 0.620 MMTCE. The emissions decrease is a result of a modest drop in clinker production from 4.39 million metric tons in 1990 to 4.08 million metric tons in 2002.
Lime Manufacture
The term “lime” refers to six types of chemicals produced by calcining calcinic or dolomitic limestone. These include quicklime (CaO), hydrated quicklime (Ca(OH)2), dolomitic quicklime (CaOMgO), and dolomitic hydrate (Ca(OH)2MgO and Ca(OH)2(MgO)2), and dead-burned dolomite. Lime is used in a variety of applications, including steel making, flue gas desulfurization, water purification, construction, and pulp and paper manufacturing.
The production of lime involves three main steps: stone preparation, calcination, and hydration. Like the initial step of cement production, calcining limestone, or a mixture of limestone and magnesium carbonate in a kiln produces lime. This process produces quicklime (CaO), and CO2. The CaO can either remain as is or undergo the process of slaking, which produces hydrated lime.
MICHIGAN GREENHOUSE GAS INVENTORY 1990 AND 2002 4 - INDUSTRIAL PROCESSES
56
Required Data
In order to calculate the greenhouse gas emissions from lime manufacture it was necessary to collect annual production data for the following: high-calcium quicklime and hydrated lime; dolomitic quicklime and hydrated lime; and dead-burned dolomite. When available, production data were obtained from the USGS’ Minerals Yearbook.99
Methodology
The basic calculation methodology for lime manufacture involves multiplying the amounts of high-calcium and dolomitic produced by their respective emission factors. Since the USGS only reports total quicklime and hydrated lime production for individual states, to account for the high calcium and dolomitic lime production it was necessary to disaggregate the Michigan lime data based on the distribution of national production.
Additionally, Michigan’s total lime production for 2002 was not available. Instead, the value was estimated from a linear trend analysis of 1988 – 1999 production data.
Since water comprises a portion of hydrated lime it is necessary to correct for this fraction, which does not produce any CO2. In order to correct for the water portion of hydrated lime, a water content percentage is applied to the annual hydrated lime production. The SIT uses water contents of 27 percent and 24 percent for high-calcium quicklime and dolomitic quicklime, respectively.100
Results
CO2 emissions from lime manufacture increased from 1990 and 2002. In 2002, emissions were 0.179 MMTCE, while 1990 emissions were 0.117 MMTCE. This represents an increase of approximately 53 percent, which was driven by a rise in quicklime production. Conversely, the amount of hydrated lime produced in the state decreased between 1990 and 2002. Since hydrated lime production is a small fraction of the state’s overall lime manufacture, the drop in production did not significantly affect CO2 emissions.
Limestone and Dolomite Use
In addition to use as feedstocks for lime production, limestone and dolomite are used in a wide range of industries. These include construction, agriculture, metallurgy, pollution control, glass manufacturing, and chemical manufacturing. CO2 emissions occur once either limestone or dolomite is
MICHIGAN GREENHOUSE GAS INVENTORY 1990 AND 2002 4 - INDUSTRIAL PROCESSES
57
heated sufficiently, as in the case of flue gas desulfurization and use as a flux in metallurgical furnaces.
Required Data
The required data include limestone and dolomite consumed for flux stone, chemical stone, glass making, and flue gas desulfurization. These data were obtained from the USGS’ Minerals Yearbook.
Methodology
The basic method for calculating emissions involves multiplying the amount of limestone and dolomite consumed by the average carbon content for each type of stone. Assuming that all of this carbon is oxidized and released into the atmosphere as CO2, the appropriate emission factor was then multiplied by the total annual amount of flux stone, chemical stone, glass making, and flue gas desulfurization consumed to calculate emissions.
Unfortunately, state-level data are not disaggregated into the required industrial sectors of limestone and dolomite use. It became necessary to apply national consumption patterns to the total amounts of limestone and dolomite used in Michigan.
Results
In 2002, the amount of CO2 emitted from the use of limestone and dolomite had decreased to 0.028 MMTCE, a decrease of approximately 34 percent from 1990 emissions of 0.043 MMTCE. Although the total use of limestone and dolomite did not decrease in Michigan, the fraction of national consumption for industrial uses did decline from 1990 to 2002. The decrease in Michigan emissions reflected this national trend.
Soda Ash Consumption
Soda ash (sodium carbonate, Na2CO3) is consumed primarily in glass, alkali chemical, and soap and detergent production and is used for water treatment and flue gas desulphurization. CO2 emissions can occur from soda ash consumption and production of natural soda ash. Since soda ash is not produced in Michigan, only soda ash consumption is considered to be a source of emissions. For every mole of soda ash consumed in these uses, one mole of CO2 is evolved.
MICHIGAN GREENHOUSE GAS INVENTORY 1990 AND 2002 4 - INDUSTRIAL PROCESSES
58
Required Data
In order to calculate CO2 emissions from soda ash consumption, state level soda ash consumption data are required. When these data are not available, national soda ash consumption data and national and Michigan population estimates are needed. National soda ash consumption data were obtained from the U.S.G.S.’ Minerals Yearbook.101
Methodology
Since consumption data are not available on a state-level basis, the SIT calculation methodology uses a ratio of Michigan and national population multiplied by national consumption as an estimate. Instead of following this approach, value of shipments economic data for the soap and detergent, chemical, and glass manufacturing segments were collected for both Michigan and the U.S. from the U.S. Census Bureau. Specifically, value of shipments data were obtained for year 1992 for SIC codes 32, 284, and 2819.1, 102 Value of shipments data for 1997 were obtained for NAICS codes 3272, 3256, 32518, and 325188. These data were used to calculate value of shipment ratios, which were multiplied by national soda ash consumption data to arrive at Michigan consumption estimates. Lastly, Michigan’s total soda ash consumption was multiplied by the emission factor and converted to MMTCE.
Results
In 2002, CO2 emissions from soda ash consumption were 0.027 MMTCE. This represents an increase of 41 percent over 1990 emissions of 0.019 MMTCE. The rise in emissions was due to an increase in estimated soda ash consumption.
Semiconductor Manufacture
The plasma etching and chemical vapor deposition processes of semiconductor manufacturing utilize a number of fluorinated gases, including SF6, HFCs, and PFCs. Continued industry growth and the introduction of increasingly complex semiconductor products have driven rapid emissions increases. Recently, however, the industry has begun implementing PFC emission reduction methods, including process optimization.
1 “’Value of Shipments’ refers to the value of all primary products produced by an industry; the value of secondary products, which are primary to other industries; … and the value of products purchased and resold without further processing” (U.S. Department of Commerce (2000)).
MICHIGAN GREENHOUSE GAS INVENTORY 1990 AND 2002 4 - INDUSTRIAL PROCESSES
59
Required Data
In order to calculate emissions, value of shipments data for the semiconductor industries of Michigan and the U.S. were obtained from the U.S. Census Bureau. National SF6, PFC, and HFC emissions from semiconductor manufacture were obtained from the U.S. EPA. Methods
As with the consumption of soda ash, state level SF6 consumption data were not available and economic data were collected as surrogates. Specifically, the value of semiconductor shipments data (SIC 3674 and NAICS 334413) for both the U.S. and Michigan were used to calculate a ratio, which was then multiplied by the total U.S. SF6 emissions for 1990 and 2002. The SIT methodology applied the same 1997 Economic Census data for 1990 and 2002. Instead of using the 1990 emissions estimates from the SIT module, a separate calculation was made using Economic Census data from 1992.
Results
Emissions from Michigan’s semiconductor industry totaled 575 MTCE in 2002 and 312 MTCE in 1990. Although this represents an increase from 1990 emissions of over 84 percent, Michigan’s semiconductor industry changed very little between the 1992 and 1997 Economic Census. Compared to national data, the increase in value of shipments for Michigan was slight.
Substitution of Ozone Depleting Substances (ODS)
As certain classes of ozone depleting substances (ODS) are phased out by requirements in the Montreal Protocol and the Clean Air Act Amendments of 1990, HFCs have been chosen as replacements. Although these categories of chemicals do not add to the destruction of the ozone layer, they are potent greenhouse gases.
The principle applications for ODS substitutes include refrigeration and air conditioning, solvent cleaning, fire extinguishing agents, and foam production. The U.S. EPA has developed a tool for estimating the rise in consumption and emissions of HFCs and the decline of ODS consumption and emissions.
Required Data
The calculation of emissions from ODS substitution requires national emissions data from ODS substitution, as well as population estimates for
MICHIGAN GREENHOUSE GAS INVENTORY 1990 AND 2002 4 - INDUSTRIAL PROCESSES
60
Michigan and the United States. National emissions data from ODS substitution were obtained from the U.S. EPA. The SIT module contained default population data from the U.S. Census Bureau. Methodology
Michigan-specific data do not exist for the consumption of HFCs for substitution of ODS. Consequently, emissions were calculated on a per-capita basis, by multiplying the national HFC emissions from ODS substitution by the ratio of Michigan population to United States population.
Results
In 2002, emissions from ODS substitution had increased from to 0.867 MMTCE, up from 0.003 MMTCE in 1990. This dramatic jump in emissions mirrors the national trend of greatly increased use of HFC-containing ODS substitutes. Until these interim substitutes are eventually phased out, the emissions trend is expected to continue and will likely accelerate in the coming decade.
Magnesium Production and Casting
Three types of emission sources are addressed in this category: primary magnesium production (i.e. producing metal from either magnesium oxide or magnesium chloride); secondary magnesium production (i.e. production using recycled material); and casting. In all three types of emission sources, a cover gas containing a small concentration of SF6 is spread over molten magnesium in order to prevent violent oxidation. Since primary magnesium production does not occur in Michigan, and data sources indicated that all secondary magnesium processed is made into castings, emissions from casting operations are the primary focus of this sector.
Required Data
Calculating SF6 emissions from magnesium casting requires the annual tonnage of magnesium cast. These data were obtained via personal communication with Michigan’s two major magnesium processing facilities.
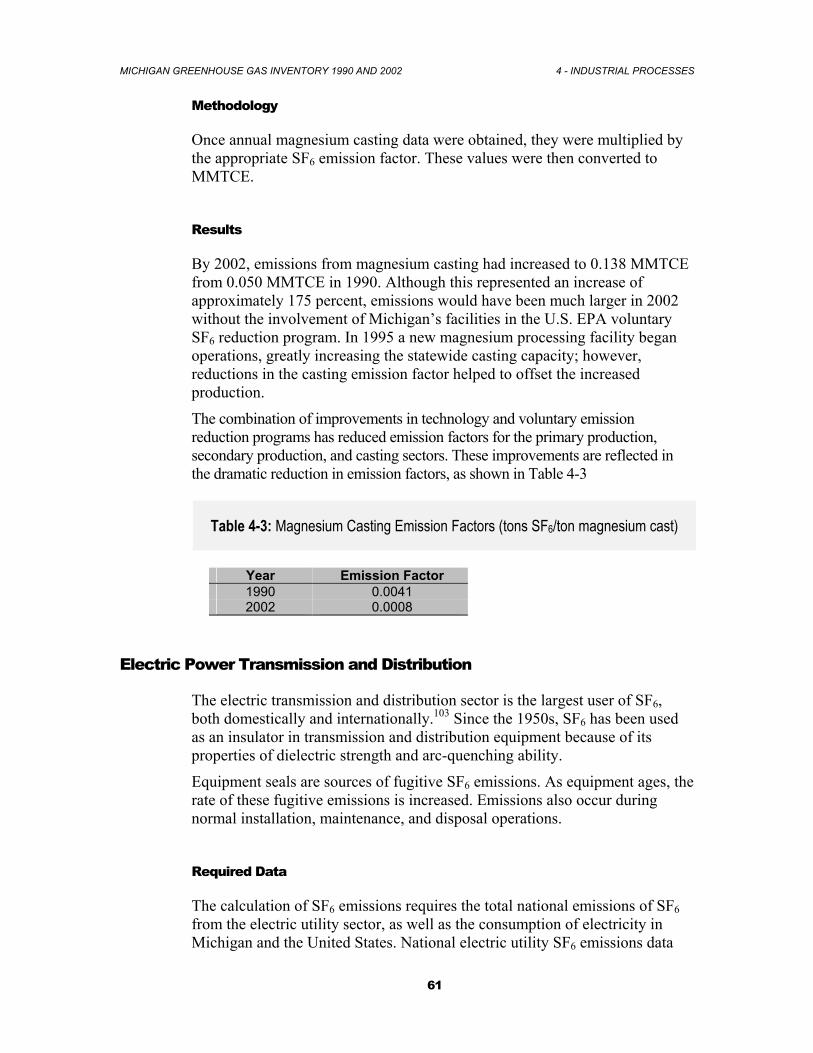
MICHIGAN GREENHOUSE GAS INVENTORY 1990 AND 2002 4 - INDUSTRIAL PROCESSES
61
Methodology
Once annual magnesium casting data were obtained, they were multiplied by the appropriate SF6 emission factor. These values were then converted to MMTCE.
Results
By 2002, emissions from magnesium casting had increased to 0.138 MMTCE from 0.050 MMTCE in 1990. Although this represented an increase of approximately 175 percent, emissions would have been much larger in 2002 without the involvement of Michigan’s facilities in the U.S. EPA voluntary SF6 reduction program. In 1995 a new magnesium processing facility began operations, greatly increasing the statewide casting capacity; however, reductions in the casting emission factor helped to offset the increased production.
The combination of improvements in technology and voluntary emission reduction programs has reduced emission factors for the primary production, secondary production, and casting sectors. These improvements are reflected in the dramatic reduction in emission factors, as shown in Table 4-3
Table 4-3: Magnesium Casting Emission Factors (tons SF6/ton magnesium cast)
Year Emission Factor 1990 0.0041 2002 0.0008
Electric Power Transmission and Distribution
The electric transmission and distribution sector is the largest user of SF6, both domestically and internationally.103 Since the 1950s, SF6 has been used as an insulator in transmission and distribution equipment because of its properties of dielectric strength and arc-quenching ability.
Equipment seals are sources of fugitive SF6 emissions. As equipment ages, the rate of these fugitive emissions is increased. Emissions also occur during normal installation, maintenance, and disposal operations.
Required Data
The calculation of SF6 emissions requires the total national emissions of SF6 from the electric utility sector, as well as the consumption of electricity in Michigan and the United States. National electric utility SF6 emissions data
MICHIGAN GREENHOUSE GAS INVENTORY 1990 AND 2002 4 - INDUSTRIAL PROCESSES
62
were obtained from the U.S. EPA. Electricity consumption data were obtained from the EIA.
Methodology
Electric utility SF6 emissions were obtained by first calculating the ratio of Michigan electricity consumption to national electricity consumption. These ratios were then multiplied by the total national emissions of SF6 from the electric utility sector. Electricity consumption data were gathered from the EIA.
Results
Sulfur hexafluoride emissions from electric power transmission and distribution decreased from 1990 to 2002. In 2002, emissions totaled 0.122 MMTCE, compared to 0.242 MMTCE in 1990. It is expected that the emissions reduction is a result of the U.S. EPA’s voluntary SF6 reduction program. This program involves many major electricity producers across the U.S. Since the lack of Michigan-specific data forced the use of national SF6 data, Michigan’s calculated emissions reflect only national trends. It is unclear whether or not Michigan’s electricity providers have taken steps to reduce their SF6 emissions and not a single electricity provider is listed as a partner in the SF6 reduction program.104 Electricity consumption did increase between 1990 and 2002 and, consequently, it is questionable whether or not GHG emissions from this sector actually decreased during the same time period.
Other Industrial Processes
Greenhouse gas emissions from the following industries are addressed by the SIT, but were found not to occur in Michigan: adipic acid production, primary aluminum production, and HCFC-22 production. Additionally, research did not yield definitive evidence as to whether or not nitric acid was produced in Michigan in 1990.2 One source indicated that nitric acid production facilities were not located in Michigan by 2002.105
2 As a surrogate for data, point source and fugitive nitric acid emissions obtained from the U.S. EPA’s Toxic Release Inventory (TRI) data were analyzed. The total nitric acid releases in 1990 are less than in 1998, a year which a source indicates that nitric acid was not produced in Michigan, which lead to the conclusion that nitric acid was not produced in Michigan in 1990 and 2002.
MICHIGAN GREENHOUSE GAS INVENTORY 1990 AND 2002 5 - AGRICULTURE
63
5. Agriculture
Greenhouse gas emissions from agriculture are subdivided into the following sources: methane (CH4) emissions from domesticated animals, livestock manure management, and agricultural residue burning; and nitrous oxide (N2O) emissions from agricultural soil management practices, livestock manure management, and agricultural residue burning. Table 5-1 and Figure 5-2 show that emissions from agricultural soil management practices, which include addition of manure and fertilizers, made up the largest portion of agricultural emissions for 1990 and 2002. Nitrous oxide contributed nearly three-quarters of the total emissions (carbon-equivalent adjusted) from agriculture with methane contributing the other quarter in 2002 (Figure 5-1). Agriculture in Michigan accounted for 3 percent (1.867 MMTCE) of the state’s total greenhouse gas emissions in 2002. From 1990 to 2002, agricultural emissions fell by 2.7 percent from 1.92 MMTCE to 1.87 MMTCE. Nationally, agricultural emissions accounted for 6.7 percent of U.S. emissions. Two reasons help explain why Michigan’s agricultural emissions are only 3 percent to the state’s total, which is less than half of the 6.7 percent that agriculture contributed to the national greenhouse gas emission total in 2002. One reason is that Michigan does not produce rice, which is a major contributor of CH4 for much of the agricultural activity in the Southeastern U.S. region. Second, Michigan lies along the northern border of the continental U.S., where climate north of 44 degrees latitude (dividing the state roughly where the City of Saginaw lies) does not have a long enough growing season, on average, to allow for nutrient-intensive row crops such as corn and soybeans.106 Nutrient-intensive crops emit the largest portion of N2O from application of nitrogen into the soil (see Part 5.3, “Agricultural Soil Management”).
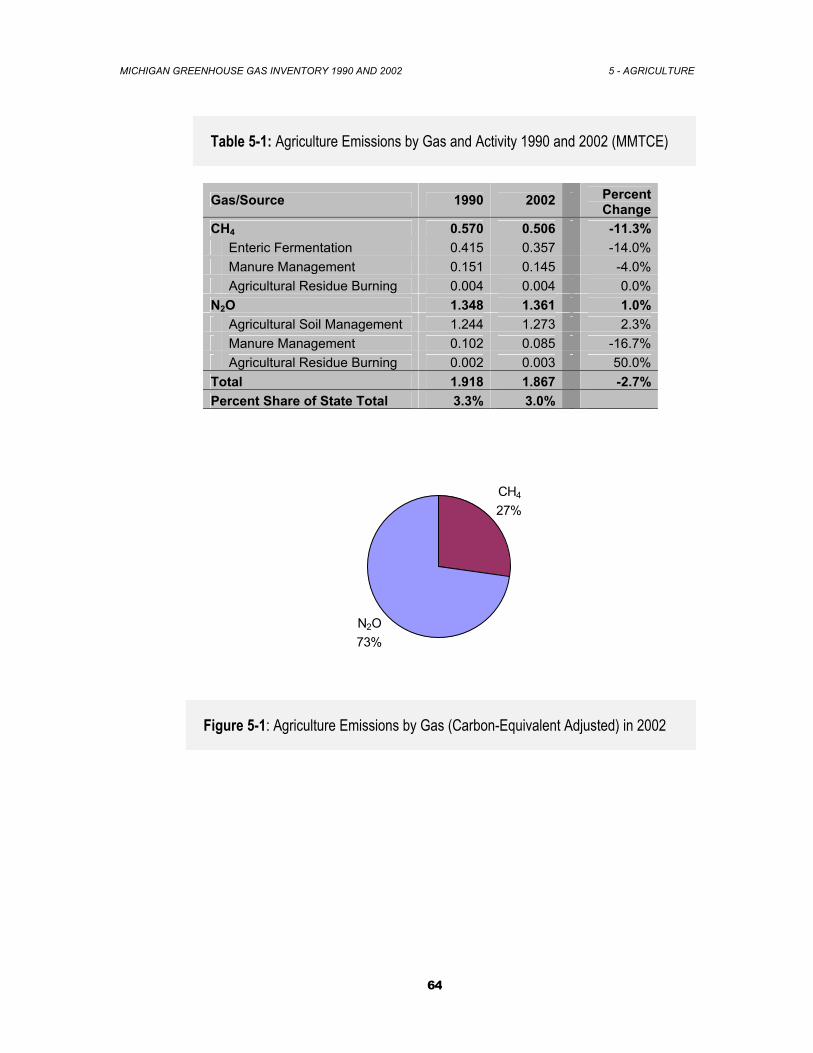
MICHIGAN GREENHOUSE GAS INVENTORY 1990 AND 2002 5 - AGRICULTURE
64
Table 5-1: Agriculture Emissions by Gas and Activity 1990 and 2002 (MMTCE)
Gas/Source 1990 2002 Percent Change
CH4 0.570 0.506 -11.3% Enteric Fermentation 0.415 0.357 -14.0% Manure Management 0.151 0.145 -4.0% Agricultural Residue Burning 0.004 0.004 0.0% N2O 1.348 1.361 1.0% Agricultural Soil Management 1.244 1.273 2.3% Manure Management 0.102 0.085 -16.7% Agricultural Residue Burning 0.002 0.003 50.0% Total 1.918 1.867 -2.7% Percent Share of State Total 3.3% 3.0%
N2O73%
CH4
27%
Figure 5-1: Agriculture Emissions by Gas (Carbon-Equivalent Adjusted) in 2002
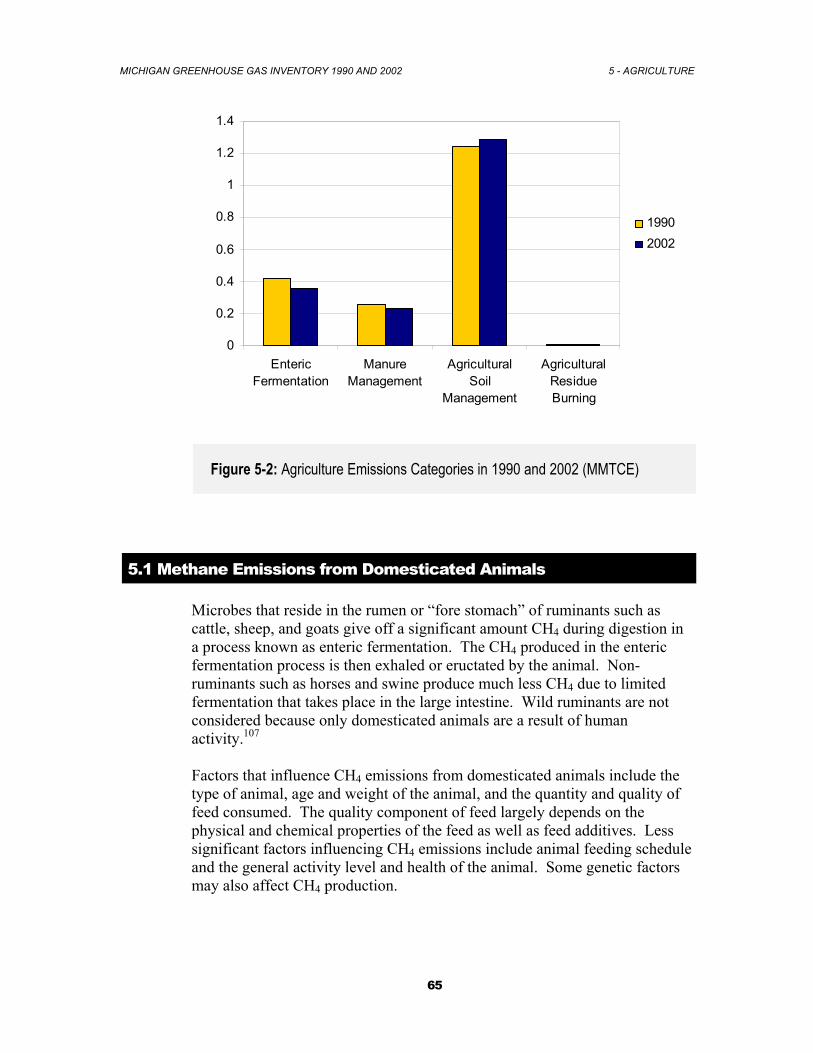
MICHIGAN GREENHOUSE GAS INVENTORY 1990 AND 2002 5 - AGRICULTURE
65
0
0.2
0.4
0.6
0.8
1
1.2
1.4
EntericFermentation
ManureManagement
AgriculturalSoil
Management
AgriculturalResidueBurning
19902002
Figure 5-2: Agriculture Emissions Categories in 1990 and 2002 (MMTCE)
5.1 Methane Emissions from Domesticated Animals
Microbes that reside in the rumen or “fore stomach” of ruminants such as cattle, sheep, and goats give off a significant amount CH4 during digestion in a process known as enteric fermentation. The CH4 produced in the enteric fermentation process is then exhaled or eructated by the animal. Non-ruminants such as horses and swine produce much less CH4 due to limited fermentation that takes place in the large intestine. Wild ruminants are not considered because only domesticated animals are a result of human activity.107 Factors that influence CH4 emissions from domesticated animals include the type of animal, age and weight of the animal, and the quantity and quality of feed consumed. The quality component of feed largely depends on the physical and chemical properties of the feed as well as feed additives. Less significant factors influencing CH4 emissions include animal feeding schedule and the general activity level and health of the animal. Some genetic factors may also affect CH4 production.
MICHIGAN GREENHOUSE GAS INVENTORY 1990 AND 2002 5 - AGRICULTURE
66
Required Data
Given the distribution and number of domesticated animals throughout the state it was not practical to take direct measurements. Instead, specific categorical emission factors were coupled with state animal population estimates to provide a reasonably accurate measure of CH4 emissions from enteric fermentation. Data on animal population were obtained from the National Agricultural Statistics Service (NASS), USDA Internet database.108 Cattle, sheep, and swine population estimates for years 1990 and 2002 were used from the NASS database using Michigan-specific data. Due to the fluctuation of animal populations within a given year, the average animal population across each animal type for the year was used.
Methodology
The estimated population of each animal type was multiplied by the given emission factor provided by the EIIP Inventory Guidance, which was based on estimated annual CH4 emissions per animal type from the Midwest region. See Appendix H for greater detail on specific factors and calculations used to estimate emissions data.
Results
Table 5-2 shows that in 2002, total CH4 emitted from domestic animals was 0.357 MMTCE, which represented a 14 percent decrease from 1990 emissions. The magnitude of emissions change from this category dropped from 1990 to 2002 by 0.058 MMTCE. Within this category, milk cows made up the largest portion of CH4 emissions in both 1990 (0.207 MMTCE) and 2002 (0.197 MMTCE). Sheep represented the greatest percent decrease in emissions from 1990 to 2002 dropping 41 percent and goats had the greatest percent increase of 76 percent.
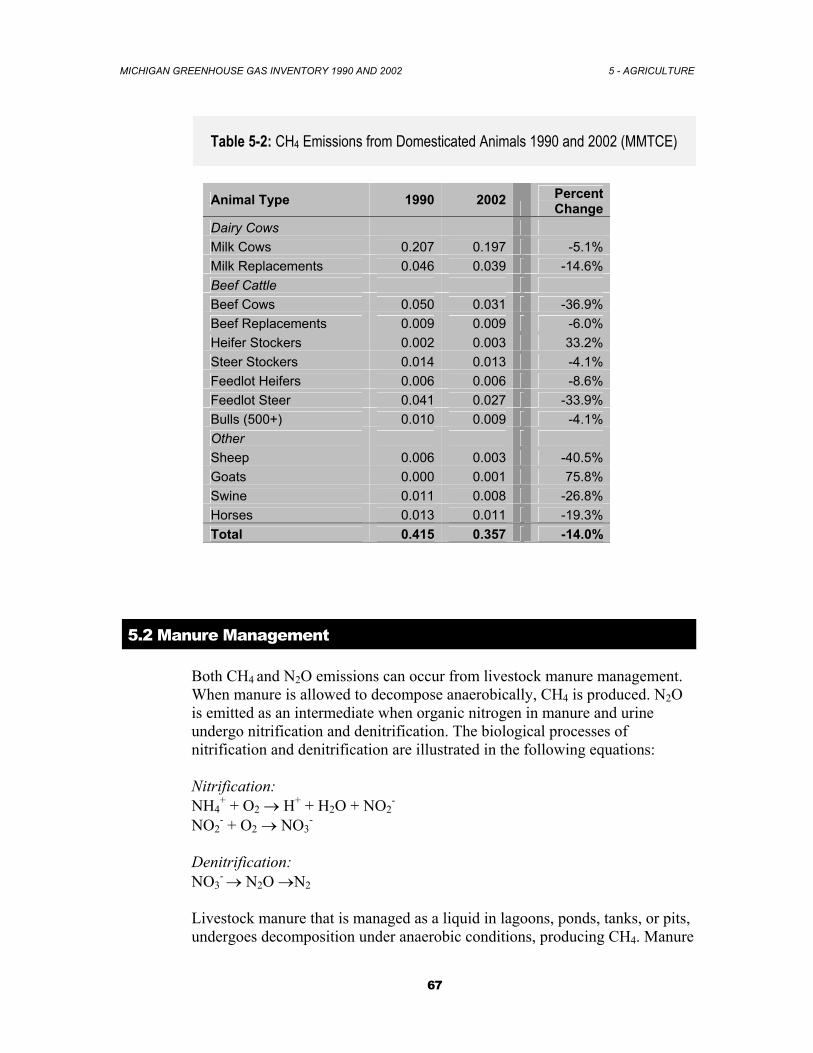
MICHIGAN GREENHOUSE GAS INVENTORY 1990 AND 2002 5 - AGRICULTURE
67
Table 5-2: CH4 Emissions from Domesticated Animals 1990 and 2002 (MMTCE)
Animal Type 1990 2002 Percent Change
Dairy Cows Milk Cows 0.207 0.197 -5.1% Milk Replacements 0.046 0.039 -14.6% Beef Cattle Beef Cows 0.050 0.031 -36.9% Beef Replacements 0.009 0.009 -6.0% Heifer Stockers 0.002 0.003 33.2% Steer Stockers 0.014 0.013 -4.1% Feedlot Heifers 0.006 0.006 -8.6% Feedlot Steer 0.041 0.027 -33.9% Bulls (500+) 0.010 0.009 -4.1% Other Sheep 0.006 0.003 -40.5% Goats 0.000 0.001 75.8% Swine 0.011 0.008 -26.8% Horses 0.013 0.011 -19.3% Total 0.415 0.357 -14.0%
5.2 Manure Management
Both CH4 and N2O emissions can occur from livestock manure management. When manure is allowed to decompose anaerobically, CH4 is produced. N2O is emitted as an intermediate when organic nitrogen in manure and urine undergo nitrification and denitrification. The biological processes of nitrification and denitrification are illustrated in the following equations: Nitrification: NH4
+ + O2 → H+ + H2O + NO2-
NO2- + O2 → NO3
- Denitrification: NO3
- → N2O →N2 Livestock manure that is managed as a liquid in lagoons, ponds, tanks, or pits, undergoes decomposition under anaerobic conditions, producing CH4. Manure
MICHIGAN GREENHOUSE GAS INVENTORY 1990 AND 2002 5 - AGRICULTURE
68
that is managed as a solid and is deposited on fields or stored in stacks or pits is decomposed aerobically and produces little if no CH4. Although manure is still primarily managed in solid form, there is a growing trend of liquid management, particularly among large swine and dairy producers. Concurrently, land application of manure is decreasing on smaller farms due to new nutrient regulations.109 A variety of factors can influence the amount of CH4 produced from manure management. These factors include environmental conditions like ambient temperature, pH, and moisture. Other factors include the characteristics of the manure management system, such as residency time of the manure. The amount of CH4 produced is also dependent on the composition of the manure itself. The digestive systems and diets of livestock vary and these differences are expressed in the amount of volatile solids produced and the CH4 producing potential of volatile solids for each animal type. For example, cattle with diets of high-energy grain produce manure with a larger CH4 producing capacity than cattle with low energy forage material diets. In addition to the composition of manure, the amount of N2O produced from manure management is also dependent on the composition of urine. N2O production also depends on the amounts of oxygen and moisture in the manure system. Emissions are most likely to occur from a manure management system where dry, aerobic conditions are found with moist, anaerobic conditions. The methodologies for calculating N2O emissions from manure management and agricultural soils encompass similar sources of emissions. The distinction between the two categories is that manure management includes manure that is systematically managed in liquid or solid form, while agricultural soil management addresses manure applied directly to soil. Figure 5-2 further clarifies the distinctions between these categories.
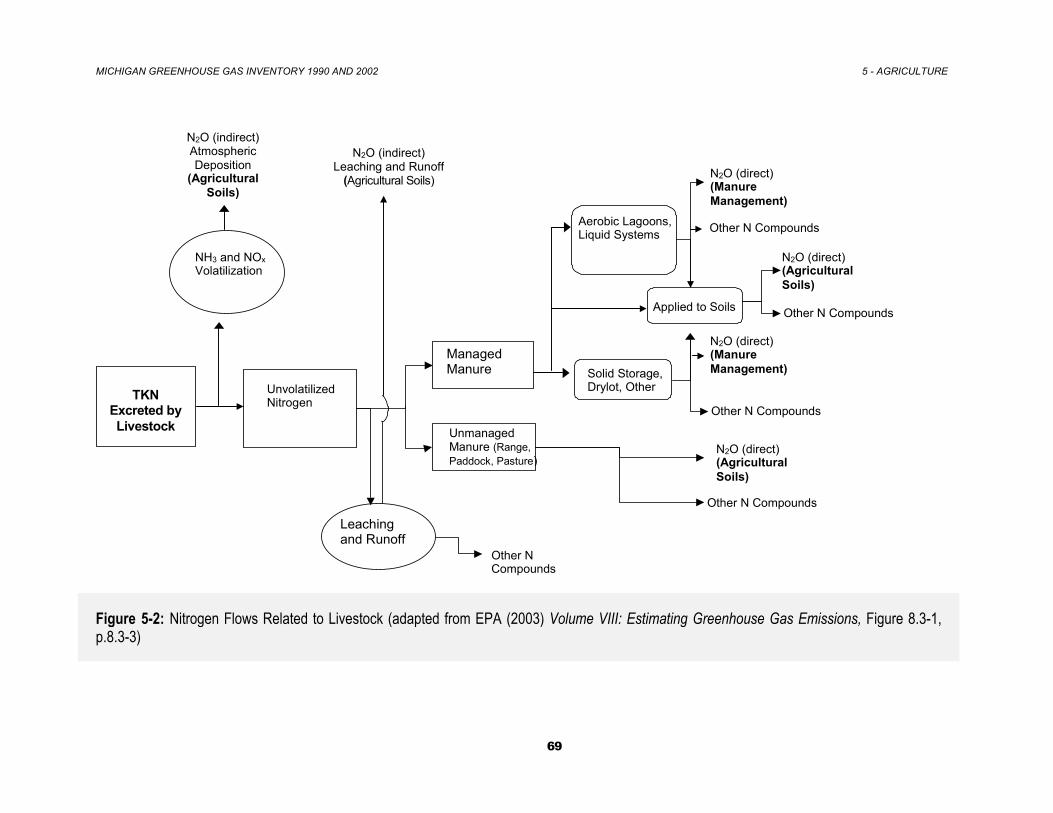
MICHIGAN GREENHOUSE GAS INVENTORY 1990 AND 2002 5 - AGRICULTURE
69
TKN Excreted by Livestock
Unvolatilized Nitrogen
NH3 and NOx Volatilization
Leaching and Runoff
Unmanaged Manure (Range, Paddock, Pasture)
Aerobic Lagoons, Liquid Systems
Other N Compounds
N2O (indirect) Atmospheric Deposition
(Agricultural Soils)
N2O (direct) (Manure Management)
Other N Compounds
Other N Compounds
N2O (indirect) Leaching and Runoff
(Agricultural Soils)
Applied to Soils Other N Compounds
Other N Compounds
Solid Storage, Drylot, Other
N2O (direct) (Agricultural Soils)
N2O (direct) (Manure Management)
N2O (direct) (Agricultural Soils)
Managed Manure
Figure 5-2: Nitrogen Flows Related to Livestock (adapted from EPA (2003) Volume VIII: Estimating Greenhouse Gas Emissions, Figure 8.3-1, p.8.3-3)
MICHIGAN GREENHOUSE GAS INVENTORY 1990 AND 2002 5 - AGRICULTURE
70
Required Data
The types of animals included in the emissions analysis for manure management are limited to cattle, swine, poultry, sheep, goats, and horses. In order to calculate the greenhouse gas emissions for manure management, it was necessary to collect the following data:
• Animal population;
• Rate of volatile solids produced per animal type;
• CH4-producing potential of volatile solids for each animal type;
• Rate of nitrogen produced per animal type;
• Portion of manure managed in each type of manure management system; and
• Portion of manure deposited on land or used in daily spread systems.
The average annual populations for all appropriate animals were obtained from a variety of documents published by the U.S. Department of Agriculture and the Michigan Department of Agriculture’s Michigan Agricultural Statistics Service. Values for maximum CH4 producing capacity of manure, volatile solids production, rate of total Kjeldahl nitrogen1 emitted, and types of manure management systems utilized were all obtained from the U.S. EPA’s Inventory of U.S. Greenhouse Gas Emissions and Sinks: 1990 – 2002.
Methodology
Once the activity data were collected, the calculation of CH4 emissions began with calculating the total amount of volatile solids produced annually for each animal type. The amount of volatile solids was then multiplied by the maximum CH4 production potential and CH4 conversion factor for each type of manure management system to arrive at the amount of CH4 emitted. The amount of CH4 is then summed across all animal types and converted to million metric tons carbon equivalent. A more detailed description of the methodology used to calculate CH4 emissions is presented in Appendix H.
The calculation of N2O emissions began with multiplying the typical animal mass for each animal type by the appropriate rate of Kjeldahl nitrogen excreted. It was then necessary to determine the amount of Kjeldahl nitrogen managed in liquid and solid manure management systems. Once these values were calculated for each animal type, they were multiplied by the N2O emission factors for each type of manure management system. Lastly, these values were summed and converted to MMTCE. A more detailed description 1 Total Kjeldahl nitrogen is defined as the measure of organically bound nitrogen and nitrogen as ammonia.
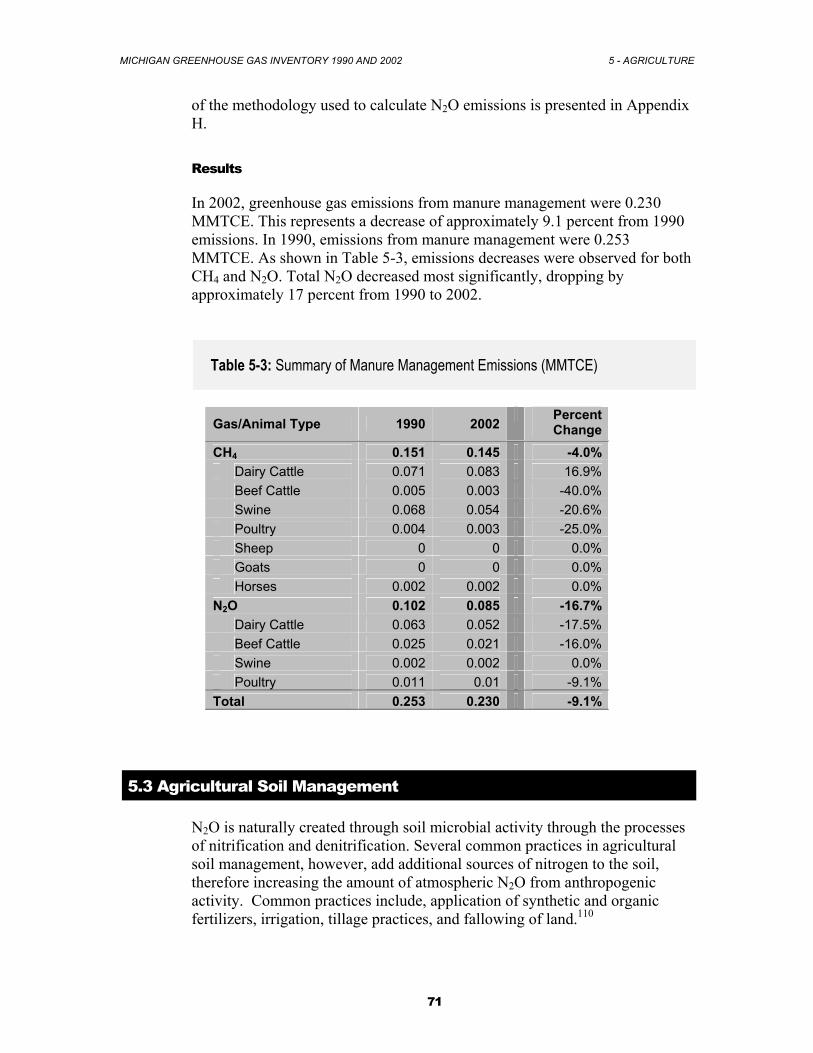
MICHIGAN GREENHOUSE GAS INVENTORY 1990 AND 2002 5 - AGRICULTURE
71
of the methodology used to calculate N2O emissions is presented in Appendix H.
Results
In 2002, greenhouse gas emissions from manure management were 0.230 MMTCE. This represents a decrease of approximately 9.1 percent from 1990 emissions. In 1990, emissions from manure management were 0.253 MMTCE. As shown in Table 5-3, emissions decreases were observed for both CH4 and N2O. Total N2O decreased most significantly, dropping by approximately 17 percent from 1990 to 2002.
Table 5-3: Summary of Manure Management Emissions (MMTCE)
Gas/Animal Type 1990 2002 Percent
Change CH4 0.151 0.145 -4.0% Dairy Cattle 0.071 0.083 16.9% Beef Cattle 0.005 0.003 -40.0% Swine 0.068 0.054 -20.6% Poultry 0.004 0.003 -25.0% Sheep 0 0 0.0% Goats 0 0 0.0% Horses 0.002 0.002 0.0% N2O 0.102 0.085 -16.7% Dairy Cattle 0.063 0.052 -17.5% Beef Cattle 0.025 0.021 -16.0% Swine 0.002 0.002 0.0% Poultry 0.011 0.01 -9.1% Total 0.253 0.230 -9.1%
5.3 Agricultural Soil Management
N2O is naturally created through soil microbial activity through the processes of nitrification and denitrification. Several common practices in agricultural soil management, however, add additional sources of nitrogen to the soil, therefore increasing the amount of atmospheric N2O from anthropogenic activity. Common practices include, application of synthetic and organic fertilizers, irrigation, tillage practices, and fallowing of land.110
MICHIGAN GREENHOUSE GAS INVENTORY 1990 AND 2002 5 - AGRICULTURE
72
N2O emissions are divided into three categories: (1) direct emissions from agricultural soils due to cropping practices; (2) direct emissions from agricultural soils due to animal production; (3) emissions from soils indirectly induced by agricultural applications of nitrogen.
Required Data
Following EIIP guidance, N2O emissions sources within agricultural soil management were divided into direct and indirect emissions of N2O. Direct sources were further subdivided into fertilizer use, crop residues, n-fixing crops, manure applied to soils, and pasture, range, and paddock. Likewise indirect emission sources were subdivided into animal waste and leaching and runoff.
Methodology
Note: see Appendix H for greater detail on specific factors and calculations used to estimate emissions data. Direct Emissions
Fertilizer Use (Synthetic and Organic) Synthetic Fertilizers: Data on synthetic and organic fertilizer consumed in 1990 and 2002 were obtained from the Fertilizer Institute.2 Data were confirmed with the Michigan Department of Agriculture.111,112 According to EIIP, 10 percent of the total nitrogen content of fertilizers upon application volatilizes as various forms of nitrogen oxide (NOx) and ammonia (NH3). This 10 percent is accounted for as indirect emissions. The remaining 90 percent of nitrogen applied to soils not taken up by plants is emitted to the atmosphere in the direct form as N2O. Organic Fertilizers: This category consisted of dried blood, compost, and peat applied to soils. Organic manure is not counted in this category to avoid double counting as stated in the IPCC Good Practice Guidelines. Instead, it is listed in the category below titled “Manure Applied to Soils”.113 According to EIIP, on the average, the bulk content of nitrogen in organic fertilizers is 4.1 percent. Similar to calculating N2O in synthetic fertilizers, there were calculations involved in estimating both direct and indirect emissions. For organic fertilizers, 80 percent of the nitrogen remained unvolatilized and emitted directly as N2O. The other 20 percent volatilized as NH3 and NOx and were accounted through indirect emissions.
2 Organic fertilizer data were obtained from the Fertilizer Institute and subsequent interview with April Hunt of the Michigan Department of Agriculture, June 2004.
MICHIGAN GREENHOUSE GAS INVENTORY 1990 AND 2002 5 - AGRICULTURE
73
Crop Residues Crop residue that is not harvested for food nor burned contains some nitrogen that is eventually emitted as N2O. The crops in Michigan for 1990 and 2002 that contributed to these emissions included corn, wheat, barley, oats, rye, soybeans, and dry edible beans. Production estimates were obtained from the Michigan Department of Agriculture annual agriculture reports. To estimate the amount of N2O emitted, crop production values were multiplied by the N2O crop residue constants specific for each type of crop. Nitrogen-Fixing Crops Three N-fixing crops were included in the inventory. These were alfalfa, soybeans, and dry edible beans. Production data were obtained from the Michigan Agricultural Statistics Service annual reports. These reports listed crop production data in tons, bushels, and hundredweight, respectively, and were all converted to metric tons. EIIP Guidance provided necessary constants for each crop including the residue to product mass ratio, fraction of dry matter in above ground biomass, and the fraction of nitrogen in the crops. Manure Applied to Soils Animal types that were included in the analysis were dairy cows, dairy heifers, feedlot heifers, feedlot steers, swine, and poultry. To obtain the amount of nitrogen from this category, referred to as Kjedahl nitrogen, four data figures were required. 1) annual average population of each animal type, 2) percentage of each animal type’s manure used as daily spread, 3) each animal type’s Typical Animal Mass (TAM), and 4) amount of Kjedahl nitrogen produced each year per animal. Similar to organic fertilizer, 20 percent of the nitrogen volatilized as NH3 and NOx and calculated as indirect emissions. 80 percent of the nitrogen content in the manure volatilized as direct emissions of N2O. Pasture, Range, and Paddock This category included all types of dairy and beef cattle (excluding feedlots), swine, turkeys, sheep, goats, and horses. It required an identical calculation as the “manure applied to soils” category, except it included EIIP Guidance-provided factors on the percentage of manure deposited on pasture, range, and paddock systems from each animal type.
Indirect Emissions Volatilized nitrogen from fertilizers (leaching and runoff) and animal wastes were included in this category. Indirect emissions include the nitrogen that volatilized into the atmosphere as NH3 and NOx in which a small portion subsequently became chemically altered in the atmosphere and equilibrated as N2O.
MICHIGAN GREENHOUSE GAS INVENTORY 1990 AND 2002 5 - AGRICULTURE
74
Animal Waste This includes the volatilized fraction of nitrogen in both manure applied to soils and pasture, range, and paddock systems. The calculation includes the same four data figures and steps that were used to calculate Kjedahl nitrogen, except in this category it is multiplied by 0.20 to reflect the 20 percent volatilized N. Leaching and Runoff This category includes all categories listed in direct N2O emissions, accounting for the volatilized N2O fraction from synthetic fertilizers, organic fertilizers, and animal waste that leached into streams and waterways. EIIP Guidance provided an estimate that 30 percent of all applied fertilizers and animal wastes leached out of the soil.
Results
This category accounted for largest portion of agricultural emissions making up 67 percent of the total emissions from agriculture. Table 5-4 and Figure 5-3 show that total emissions of N2O emissions from agricultural soil management showed an increase of 2 percent from 1990 to 2002. Direct Emissions
Fertilizer Use (Synthetic and Organic) Fertilizer use contributed 17 percent toward the total agricultural soil emissions in 2002 and was 4 percent lower in 2002 from 1990. Synthetic fertilizers contributed around 85 percent of the N2O emissions for 1990 and 2002. Crop Residues Crop residue emissions increased the most from 1990 to 2002 with a 38 percent increase. On the whole, emissions from this category rose from a 12 percent share in 1990 of agricultural soil emissions to a 16 percent share in 2002.
Nitrogen-Fixing Crops N-fixing crops saw a substantial increase of 15 percent from 1990 to 2002. This category also contributes the largest share of total agricultural N2O emissions in Michigan with a 34 percent share in 2002. Manure Applied to Soils Manure applied to soils contributed 10 percent of agricultural soil emissions in 2002. This category decreased by 19 percent from 1990 to 2002.
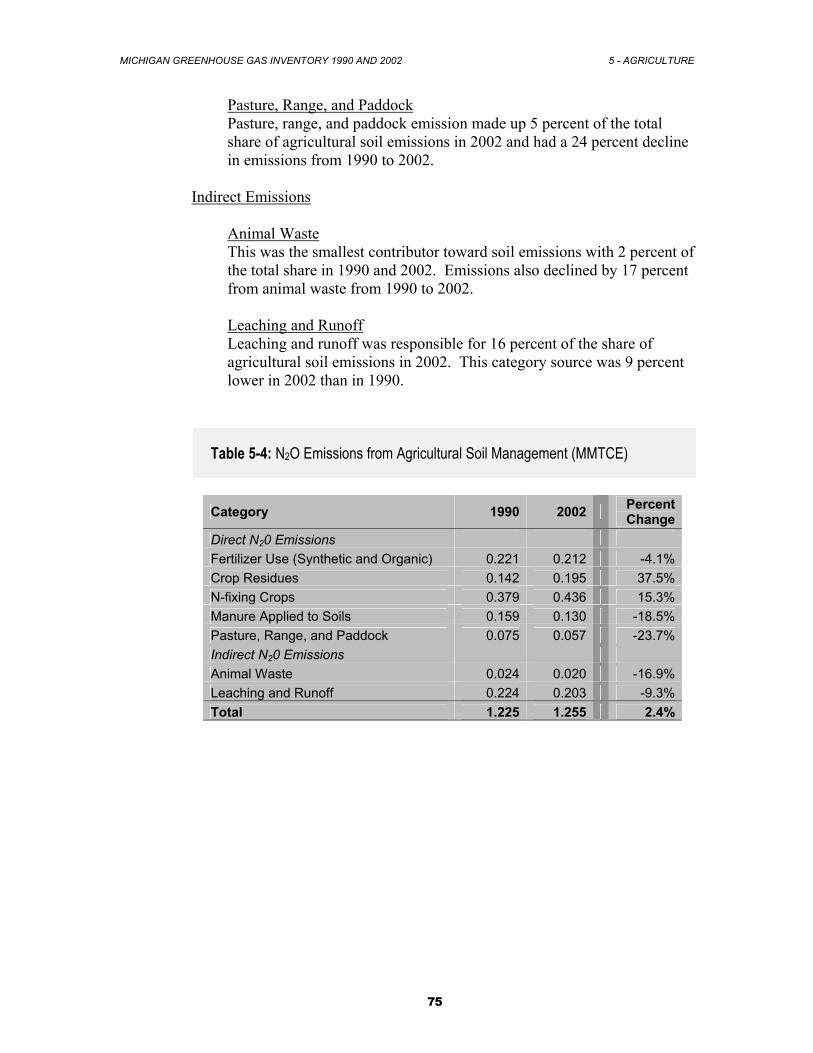
MICHIGAN GREENHOUSE GAS INVENTORY 1990 AND 2002 5 - AGRICULTURE
75
Pasture, Range, and Paddock Pasture, range, and paddock emission made up 5 percent of the total share of agricultural soil emissions in 2002 and had a 24 percent decline in emissions from 1990 to 2002.
Indirect Emissions
Animal Waste This was the smallest contributor toward soil emissions with 2 percent of the total share in 1990 and 2002. Emissions also declined by 17 percent from animal waste from 1990 to 2002. Leaching and Runoff Leaching and runoff was responsible for 16 percent of the share of agricultural soil emissions in 2002. This category source was 9 percent lower in 2002 than in 1990.
Table 5-4: N2O Emissions from Agricultural Soil Management (MMTCE)
Category 1990 2002 Percent Change
Direct N20 Emissions Fertilizer Use (Synthetic and Organic) 0.221 0.212 -4.1%Crop Residues 0.142 0.195 37.5%N-fixing Crops 0.379 0.436 15.3%Manure Applied to Soils 0.159 0.130 -18.5%Pasture, Range, and Paddock 0.075 0.057 -23.7%Indirect N20 Emissions Animal Waste 0.024 0.020 -16.9%Leaching and Runoff 0.224 0.203 -9.3%Total 1.225 1.255 2.4%
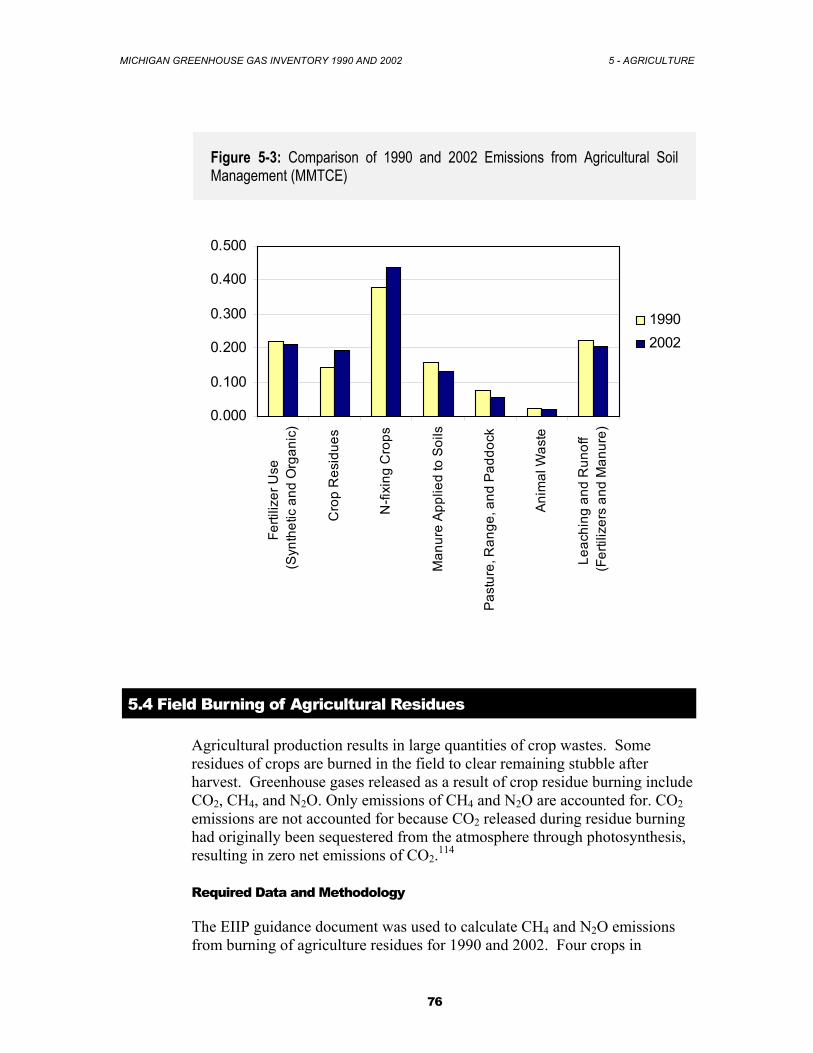
MICHIGAN GREENHOUSE GAS INVENTORY 1990 AND 2002 5 - AGRICULTURE
76
Figure 5-3: Comparison of 1990 and 2002 Emissions from Agricultural Soil Management (MMTCE)
0.000
0.100
0.200
0.300
0.400
0.500
Ferti
lizer
Use
(S
ynth
etic
and
Org
anic
)
Cro
p R
esid
ues
N-fi
Cro
ps
Man
ure
Appl
ied
to S
oils
Past
ure,
Ran
ge, a
nd P
addo
ck
Anim
al W
aste
Leac
hing
and
Run
off
(Fer
tiliz
ers
and
Man
ure)
19902002
5.4 Field Burning of Agricultural Residues
Agricultural production results in large quantities of crop wastes. Some residues of crops are burned in the field to clear remaining stubble after harvest. Greenhouse gases released as a result of crop residue burning include CO2, CH4, and N2O. Only emissions of CH4 and N2O are accounted for. CO2 emissions are not accounted for because CO2 released during residue burning had originally been sequestered from the atmosphere through photosynthesis, resulting in zero net emissions of CO2.114
Required Data and Methodology
The EIIP guidance document was used to calculate CH4 and N2O emissions from burning of agriculture residues for 1990 and 2002. Four crops in
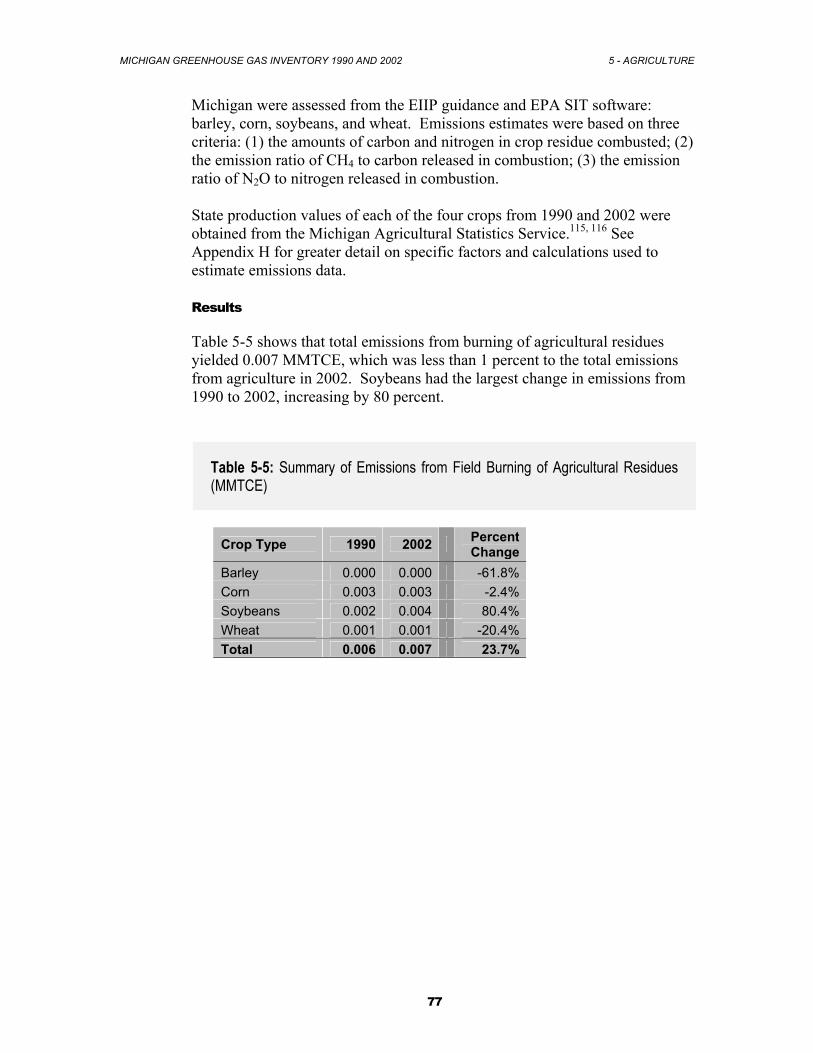
MICHIGAN GREENHOUSE GAS INVENTORY 1990 AND 2002 5 - AGRICULTURE
77
Michigan were assessed from the EIIP guidance and EPA SIT software: barley, corn, soybeans, and wheat. Emissions estimates were based on three criteria: (1) the amounts of carbon and nitrogen in crop residue combusted; (2) the emission ratio of CH4 to carbon released in combustion; (3) the emission ratio of N2O to nitrogen released in combustion. State production values of each of the four crops from 1990 and 2002 were obtained from the Michigan Agricultural Statistics Service.115, 116 See Appendix H for greater detail on specific factors and calculations used to estimate emissions data. Results
Table 5-5 shows that total emissions from burning of agricultural residues yielded 0.007 MMTCE, which was less than 1 percent to the total emissions from agriculture in 2002. Soybeans had the largest change in emissions from 1990 to 2002, increasing by 80 percent.
Table 5-5: Summary of Emissions from Field Burning of Agricultural Residues (MMTCE)
Crop Type 1990 2002 Percent Change
Barley 0.000 0.000 -61.8%Corn 0.003 0.003 -2.4%Soybeans 0.002 0.004 80.4%Wheat 0.001 0.001 -20.4%Total 0.006 0.007 23.7%

MICHIGAN GREENHOUSE GAS INVENTORY 1990 AND 2002 6 - LAND USE/LAND CHANGE
78
6. Land-Use Change
Note: Carbon sequestration from forestry activities was not included in the inventory results due to large uncertainties. A discussion of this issue is provided as an appendix to the inventory report.
6.1 Liming of Agricultural Soils
Agricultural row crops in Michigan are grown upon rich calcareous soils in the lower half of the state’s Lower Peninsula. Soil liming is done in very small quantities in the state and therefore has negligible effects on emissions. Soil liming data in Michigan can be obtained from the National Fertilizer Institute.
6.2 Yard Trimmings
Landfilled yard trimmings are considered an emission sink category because CO2 is fixed in the cellulose fibers of the grass, leaves, and small tree branches through photosynthesis. Once discarded, the carbon is stored indefinitely within municipal landfill waste sites.
Required Data and Methodology
Yard trimmings emissions estimates were calculated using total Michigan solid waste data for 1990 and 2002 (see Appendix J, Table J-2 for Biocycle citations) and multiplying the annual waste amounts by the estimated fraction of yard trimmings taken from national level estimates for each respective year (listed in EIIP Guidance). See Appendix J, Table J-1 for further details on data and calculations used.
Results
As shown in Table 6-1, landfilled yard trimmings sequestered 0.111 MMTCE in 2002, which was 67 percent less than in 1990 with 0.351 MMTCE. Despite the fact that total solid waste disposal increased from 1990 to 2002 (see Section 7.1, “Municipal Solid Waste”), the overall amount of yard trimmings has continually decreased over the same period. The decrease in national level disposal rate of
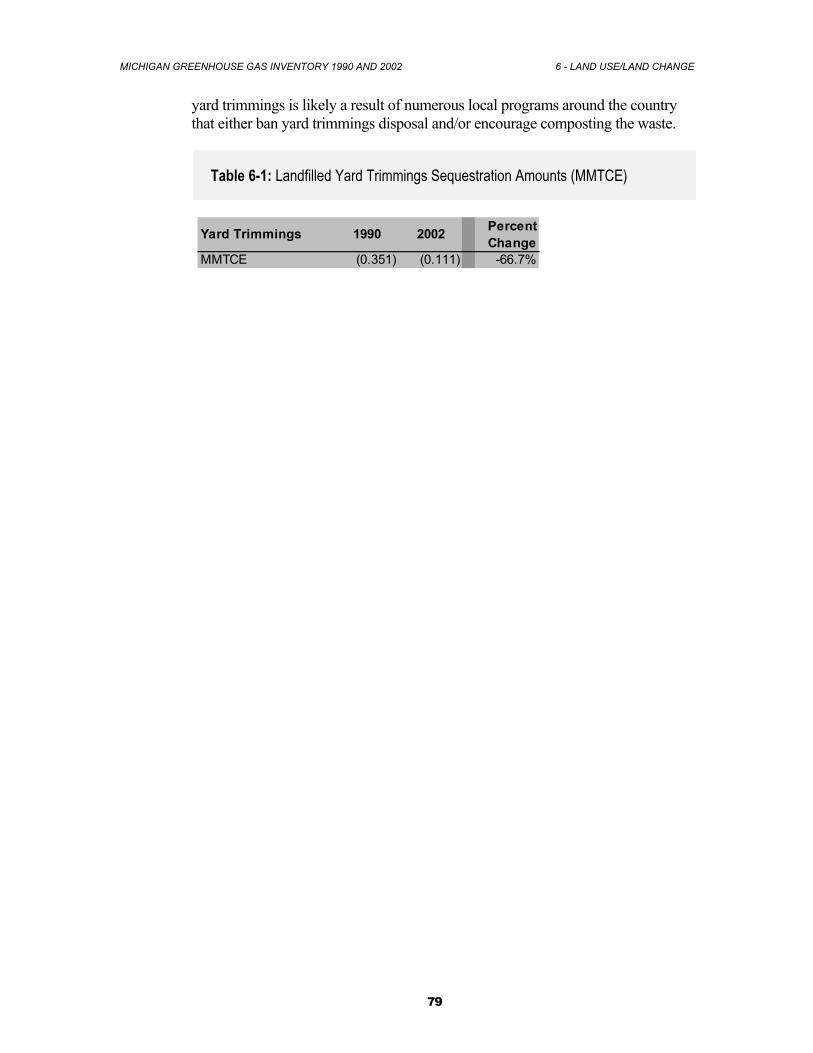
MICHIGAN GREENHOUSE GAS INVENTORY 1990 AND 2002 6 - LAND USE/LAND CHANGE
79
yard trimmings is likely a result of numerous local programs around the country that either ban yard trimmings disposal and/or encourage composting the waste.
Table 6-1: Landfilled Yard Trimmings Sequestration Amounts (MMTCE)
Yard Trimmings 1990 2002 Percent Change
MMTCE (0.351) (0.111) -66.7%
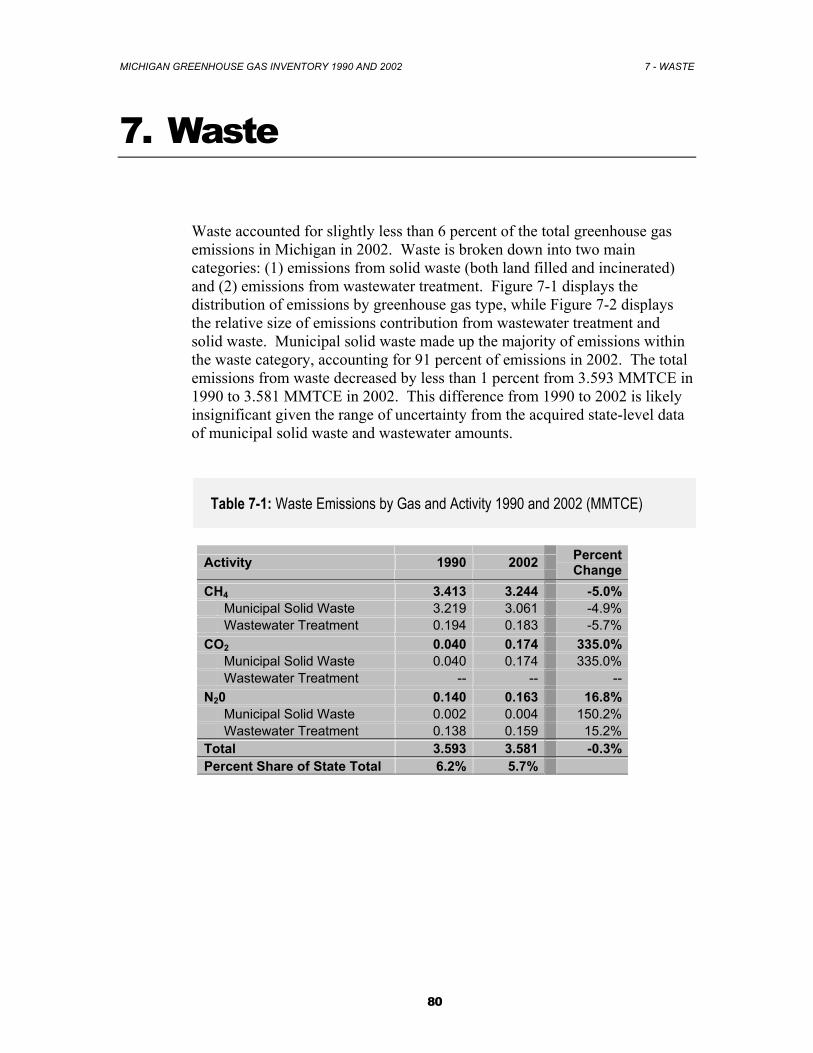
MICHIGAN GREENHOUSE GAS INVENTORY 1990 AND 2002 7 - WASTE
80
7. Waste
Waste accounted for slightly less than 6 percent of the total greenhouse gas emissions in Michigan in 2002. Waste is broken down into two main categories: (1) emissions from solid waste (both land filled and incinerated) and (2) emissions from wastewater treatment. Figure 7-1 displays the distribution of emissions by greenhouse gas type, while Figure 7-2 displays the relative size of emissions contribution from wastewater treatment and solid waste. Municipal solid waste made up the majority of emissions within the waste category, accounting for 91 percent of emissions in 2002. The total emissions from waste decreased by less than 1 percent from 3.593 MMTCE in 1990 to 3.581 MMTCE in 2002. This difference from 1990 to 2002 is likely insignificant given the range of uncertainty from the acquired state-level data of municipal solid waste and wastewater amounts.
Table 7-1: Waste Emissions by Gas and Activity 1990 and 2002 (MMTCE)
Activity 1990 2002 Percent Change
CH4 3.413 3.244 -5.0% Municipal Solid Waste 3.219 3.061 -4.9% Wastewater Treatment 0.194 0.183 -5.7% CO2 0.040 0.174 335.0% Municipal Solid Waste 0.040 0.174 335.0% Wastewater Treatment -- -- -- N20 0.140 0.163 16.8% Municipal Solid Waste 0.002 0.004 150.2% Wastewater Treatment 0.138 0.159 15.2% Total 3.593 3.581 -0.3% Percent Share of State Total 6.2% 5.7%
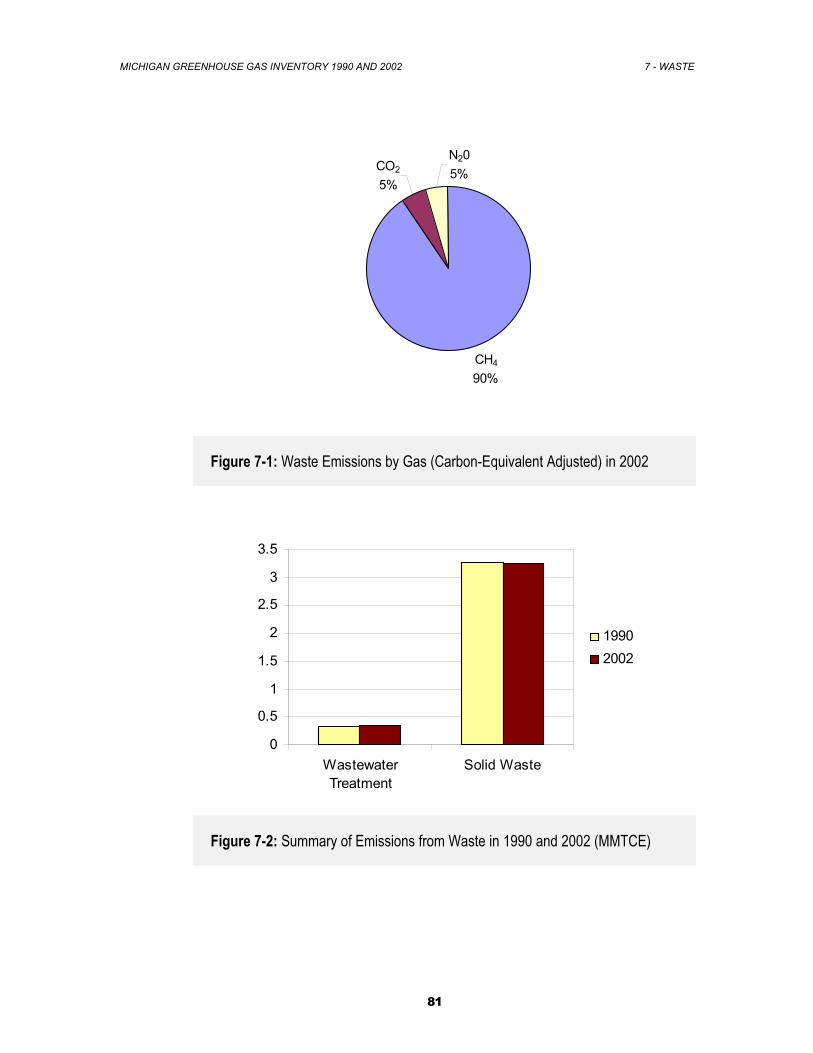
MICHIGAN GREENHOUSE GAS INVENTORY 1990 AND 2002 7 - WASTE
81
CH4
90%
CO2
5%
N205%
Figure 7-1: Waste Emissions by Gas (Carbon-Equivalent Adjusted) in 2002
0
0.5
1
1.5
2
2.5
3
3.5
WastewaterTreatment
Solid Waste
19902002
Figure 7-2: Summary of Emissions from Waste in 1990 and 2002 (MMTCE)
MICHIGAN GREENHOUSE GAS INVENTORY 1990 AND 2002 7 - WASTE
82
7.1 Municipal Solid Waste
In landfills, methane (CH4) and carbon dioxide (CO2) are produced from anaerobic decomposition of organic matter by methanogenic bacteria. Organic waste first decomposes aerobically (in the presence of oxygen) and is then decomposed by anaerobic non-methanogenic bacteria, which convert organic material to simpler forms like cellulose, amino acids, sugars, and fats. These simple substances are further broken down to gases and short-chain organic compounds (H2, CO2, CH3COOH, HCOOH, and CH3OH), which support the growth of methanogenic bacteria. The bacteria further metabolize these fermentation products into stabilized organic materials and “biogas,” which consists of approximately 50 percent CO2 and 50 percent CH4 by volume. Additionally, some landfills flare recovered landfill gas, which converts the CH4 portion of the gas to CO2. Neither the CO2 emitted directly as biogas nor the CO2 emitted from combusting CH4 is counted as an anthropogenic greenhouse gas emission. The source of the CO2 is primarily the decomposition of organic materials derived from biomass sources (e.g., crops, forests). Much of the carbon in landfills that is not converted to CO2 or CH4 is stored indefinitely and removed from the pool of carbon available to cycle to the atmosphere, i.e., it is sequestered (Note: landfilled yard trimmings are not accounted for in this sector, see “Land-Use Change”). In accordance with the Intergovernmental panel on Climate Change (IPCC) guidelines on greenhouse gas accounting only biogenic carbon (i.e., carbon from plant or animal matter) is counted as sequestered. Plastics that are landfilled represent a transfer of carbon from one long-term carbon pool (oil or natural gas reserves) to another (landfills), and thus are not counted as incremental carbon sequestered. Waste combustion emits both CO2 and nitrous oxide (N2O). CO2 is produced from oxidation of organic materials in waste, such as paper, food scraps, yard trimmings, and plastic. As with CO2 from biogas and oxidation of CH4, CO2 emissions from biogenic sources (e.g., paper and food scraps) are not counted as greenhouse gas emissions because they simply return CO2 that plants previously absorbed through photosynthesis to the atmosphere. However, some CO2 is from nonbiogenic sources (e.g., plastic and rubber made from petroleum), and is thus counted as a greenhouse gas emission. N2O is produced at the high temperature found in waste combustors by the combination of nitrogen (both nitrogen contained in the waste and nitrogen gas in the air) and oxygen gas in the air.117
Required Data
(1) The total amount of MSW in landfills. While the duration that landfilled waste generates CH4 varies by landfill, it is generally accepted that this period is approximately 30 years. In other words,
MICHIGAN GREENHOUSE GAS INVENTORY 1990 AND 2002 7 - WASTE
83
waste that was deposited up to 30 years ago is assumed to still generate CH4 today.
(2) The composition of the waste entering landfills. Municipal solid waste supplies the necessary starting material for CH4 generation in landfills by providing degradable organic carbon (DOC), which is metabolized by methanogenic bacteria to produce landfill gas. Food waste has a high DOC content, as do some grades of paper (e.g., office paper). Wastes such as metal and glass have no DOC.
(3) The characteristics of landfills receiving waste. In particular, a landfill’s size, moisture content, pH level, and temperature can all influence the amount of CH4 that is generated.
(4) The amount of CH4 that is recovered and either flared or used for energy. Due to a 1996 U.S. EPA rule that requires gas recovery at large municipal solid waste landfills, the number of landfill gas recovery systems is increasing and the CH4 generated from landfills is being captured and flared or used as an energy source. (The rule requires a well-designed and well-operated landfill gas collection system at landfills that (1) have a design capacity of at least 2.5 million metric tons and 2.5 million cubic meters, and (2) emit more than 50 metric tons of nonmethane organic compounds per year.)
(5) The amount of CH4 oxidized instead of being released into the atmosphere. While the extent to which CH4 is oxidized at the landfill surface varies by landfill, an assumption of 10 percent oxidation is currently being used for the Inventory of U.S. Greenhouse Gas Emissions and Sinks.118
Methodology
Emissions of CH4, CO2, and N2O from municipal solid waste, industrial waste, and waste combustion were calculated for years 1990 and 2002 using EIIP guidance. EIIP guidance used the method of acquiring state-level landfill data and applying U.S. EPA region-specific field measurements and statistical models to estimate CH4 emissions. For more details on the calculations and factors used see Appendix J. The following data sources were required to estimate CH4 emissions:
(1) 30-year Waste-in-Place data using: a. State population estimates from 1961 to 1989. b. Annual amount of landfilled waste from 1989 to 2002.
(2) Number of landfills, large and small, operating in 1990 and 2002. (3) Rainfall amount in the state. According to EIIP Guidance, Michigan is
considered non-arid. (4) Amount of CH4 flared or recovered from landfills.
MICHIGAN GREENHOUSE GAS INVENTORY 1990 AND 2002 7 - WASTE
84
Waste-in-place data is necessary to estimate the amount and age of waste across Michigan landfills. Size and age of garbage, along with its composition are the three main factors that determine how much landfill CH4 is produced. Due to lack of information regarding state waste estimates prior to 1990, state population data and annual waste per capita were used to estimate the amount of waste landfilled in Michigan from 1961 to 1989. This assumed that net imports and exports of waste in Michigan were zero and that national averages of annual waste amounts per capita best represented the municipal solid waste stream in the state during that time period. Michigan DEQ Solid Waste Program has tracked waste imports since 1996. 1990 through 2002 landfill estimates were obtained from Biocycle and Michigan DEQ Annual Reports of Solid Waste in Michigan.1 Large and small landfill estimates were acquired from EIIP Guidance, which assumed the EPA Upper Midwest region had 81 percent of state waste in large landfills and 19 percent in small landfills. This ratio was used for both 1990 and 2002.2 Industrial and commercial construction wastes were assumed to be 7 percent of the total solid waste stream.119 The amount of CH4 flared or recovered from landfills was obtained from the U.S. EPA Landfill Methane Outreach Program, which tracks when and how much methane is flared or recovered for heat and/or energy from specific landfills that are catalogued on a statewide basis. 120 Municipal Small Landfills Taking the total waste-in-place in Michigan for 1990 and 2002 and multiplying by 0.19 to reflect that 19 percent of Michigan waste went to small landfills. A CH4 conversion factor provided by EIIP guidance for small landfills was used to obtain CH4 emissions estimates. Municipal Large Landfills Similar to calculating solid waste CH4 emissions from small landfills, the total waste-in-place for 1990 and 2002 were multiplied by 0.81 to reflect that 81 percent of waste disposed went to large landfills. A CH4 conversion factor provided by EIIP guidance for large landfills was used to obtain CH4 emissions estimates. Industrial Landfills According to EIIP, the U.S. EPA estimates that 7 percent of solid waste in municipal landfills comes from industrial and construction waste. Therefore, to account for industrial waste, solid waste-in-place figures for both 1990 and
1 1990-2002 data were obtained from MDEQ Solid Waste and Biocycle. See Appendix I, Table I-2 for all cited references used in this category. 2 Provided by EIIP guidance from U.S. EPA region-specific estimates of the ratio of landfill waste in small versus large landfills for 1990 and 2002
MICHIGAN GREENHOUSE GAS INVENTORY 1990 AND 2002 7 - WASTE
85
2002 were multiplied by 0.07. A CH4 conversion factor provided by EIIP guidance for industrial landfills was used to obtain CH4 emissions estimates. Flared and Recovered CH4 In both 1990 and 2002, a number of landfills flared excess CH4 that reduced emissions. In addition, some landfills recovered CH4 for energy use and sale. The amount of CH4 that is flared or recovered represents a reduction in greenhouse gas emissions because the avoided emissions of CH4 through CH4 combustion causing subsequent emissions of CO2 represents a 1/21 reduction ratio since CH4 has a global warming potential that is 21 times more potent than CO2. Oxidized CH4 Oxidation of CH4 naturally occurs when some CH4 from within a landfill rises to the surface and comes in contact with atmospheric oxygen. Oxidation of CH4 forms H2O and CO2. Since CO2 is a factor 1/21 less potent of a greenhouse gas than CH4, oxidation of CH4 represents a reduction in emissions. According to EIIP guidance, approximately 10 percent of CH4 produced in landfills oxidizes from this process. 10 percent of total waste-in-place not flared or recovered for 1990 and 2002 was subtracted from the total CH4 landfill emissions. Combustion CO2 Emissions Plastics, Synthetic Rubber and Synthetic Fibers This source category was calculated using EIIP guidance from national estimations of percent of solid waste that was combusted in 1990 and 2002. Plastics, synthetic rubber, and synthetic fibers were each multiplied by CO2 emission factors provided by EIIP guidance per given amount combusted. In 1990, 4 percent of municipal solid waste was combusted. In 2002 this factor increased to an average of 7 percent solid waste combusted. Combustion N2O Emissions The estimation of N2O emissions only accounted for emissions resulting from combustion of plastics, synthetic rubber and synthetic fibers. The same amounts of combusted waste that were calculated in CO2 emissions were used to estimate N2O emissions. N2O emission factors for combusted plastics, synthetic rubber, and synthetic fibers were obtained from EIIP Guidance. Results
Table 7-2 and Figure 7-3 show that in 2002 Michigan municipal solid waste emitted 3.418 MMTCE, which represented 6 percent of the state’s total emissions. Despite an increase of 40 percent of solid waste-in-place over this twelve year period, emissions from solid waste actually decreased a slightly. The rapid increase in flared and recovered CH4 projects at Michigan landfills is the main reason that landfill emissions did not increase proportionately with the increase of waste-in-place over this time period.
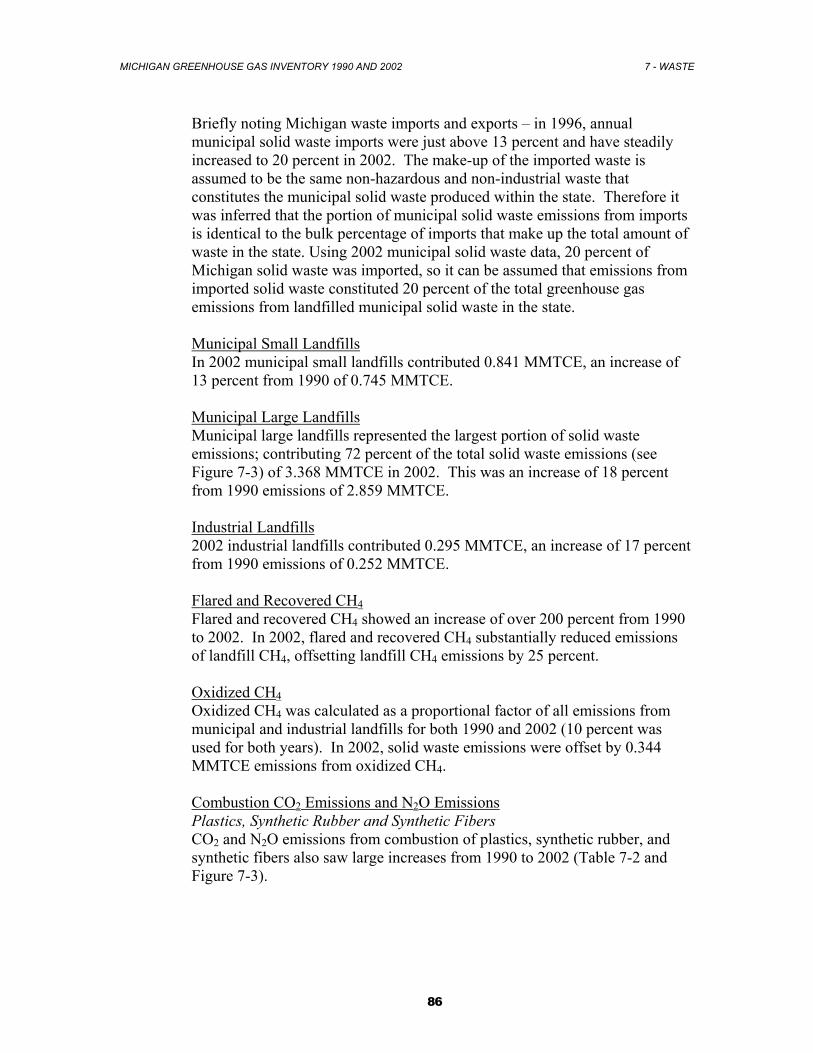
MICHIGAN GREENHOUSE GAS INVENTORY 1990 AND 2002 7 - WASTE
86
Briefly noting Michigan waste imports and exports – in 1996, annual municipal solid waste imports were just above 13 percent and have steadily increased to 20 percent in 2002. The make-up of the imported waste is assumed to be the same non-hazardous and non-industrial waste that constitutes the municipal solid waste produced within the state. Therefore it was inferred that the portion of municipal solid waste emissions from imports is identical to the bulk percentage of imports that make up the total amount of waste in the state. Using 2002 municipal solid waste data, 20 percent of Michigan solid waste was imported, so it can be assumed that emissions from imported solid waste constituted 20 percent of the total greenhouse gas emissions from landfilled municipal solid waste in the state.
Municipal Small Landfills In 2002 municipal small landfills contributed 0.841 MMTCE, an increase of 13 percent from 1990 of 0.745 MMTCE. Municipal Large Landfills Municipal large landfills represented the largest portion of solid waste emissions; contributing 72 percent of the total solid waste emissions (see Figure 7-3) of 3.368 MMTCE in 2002. This was an increase of 18 percent from 1990 emissions of 2.859 MMTCE. Industrial Landfills 2002 industrial landfills contributed 0.295 MMTCE, an increase of 17 percent from 1990 emissions of 0.252 MMTCE. Flared and Recovered CH4 Flared and recovered CH4 showed an increase of over 200 percent from 1990 to 2002. In 2002, flared and recovered CH4 substantially reduced emissions of landfill CH4, offsetting landfill CH4 emissions by 25 percent. Oxidized CH4 Oxidized CH4 was calculated as a proportional factor of all emissions from municipal and industrial landfills for both 1990 and 2002 (10 percent was used for both years). In 2002, solid waste emissions were offset by 0.344 MMTCE emissions from oxidized CH4. Combustion CO2 Emissions and N2O Emissions Plastics, Synthetic Rubber and Synthetic Fibers CO2 and N2O emissions from combustion of plastics, synthetic rubber, and synthetic fibers also saw large increases from 1990 to 2002 (Table 7-2 and Figure 7-3).
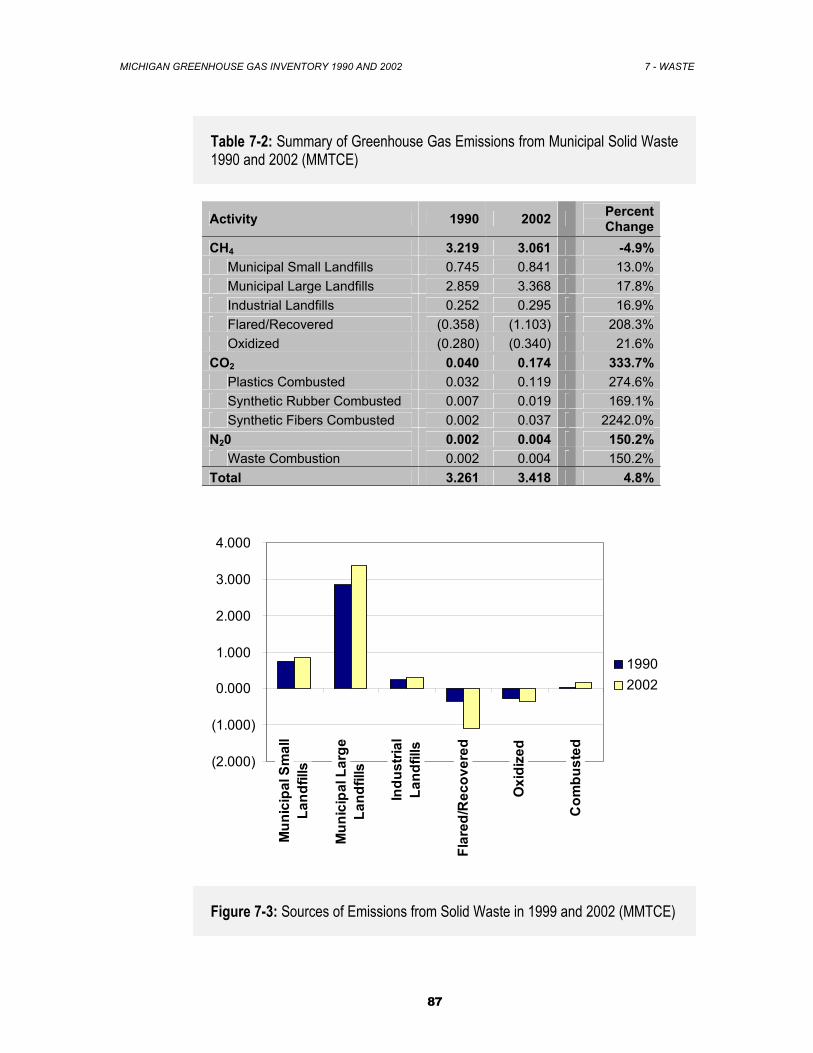
MICHIGAN GREENHOUSE GAS INVENTORY 1990 AND 2002 7 - WASTE
87
Table 7-2: Summary of Greenhouse Gas Emissions from Municipal Solid Waste 1990 and 2002 (MMTCE)
Activity 1990 2002 Percent Change
CH4 3.219 3.061 -4.9% Municipal Small Landfills 0.745 0.841 13.0% Municipal Large Landfills 2.859 3.368 17.8% Industrial Landfills 0.252 0.295 16.9% Flared/Recovered (0.358) (1.103) 208.3% Oxidized (0.280) (0.340) 21.6%CO2 0.040 0.174 333.7% Plastics Combusted 0.032 0.119 274.6% Synthetic Rubber Combusted 0.007 0.019 169.1% Synthetic Fibers Combusted 0.002 0.037 2242.0%N20 0.002 0.004 150.2% Waste Combustion 0.002 0.004 150.2%Total 3.261 3.418 4.8%
(2.000)
(1.000)
0.000
1.000
2.000
3.000
4.000
Mun
icip
al S
mal
lLa
ndfil
ls
Mun
icip
al L
arge
Land
fills
Indu
stria
lLa
ndfil
ls
Flar
ed/R
ecov
ered
Oxi
dize
d
Com
bust
ed
19902002
Figure 7-3: Sources of Emissions from Solid Waste in 1999 and 2002 (MMTCE)
MICHIGAN GREENHOUSE GAS INVENTORY 1990 AND 2002 7 - WASTE
88
7.2 Wastewater Treatment
The treatment and disposal of domestic and industrial wastewater can result in CH4 emissions. Whether or not CH4 is emitted depends on the presence of oxygen. Wastewater can be treated under aerobic or anaerobic conditions. When wastewater does not undergo treatment, it may degrade naturally through aerobic and anaerobic processes. With anaerobic treatment processes, CH4 is produced as a byproduct of microbial degradation of organic material. Industrial wastewater streams containing high amounts of organics, such as the effluents from the pulp and paper industry, fruit and vegetable processing, and red meat and poultry slaughter, are the main focus of industrial wastewater treatment emissions accounting. In addition to CH4, N2O is emitted from municipal and industrial wastewater treatment. For wastewater containing nitrogen-rich organic material, the microbial processes of nitrification and denitrification convert ammonia to N2O. During the two stages of nitrification, ammonia is aerobically converted to nitrite then nitrate. In the subsequent process of denitrification, nitrate is anaerobically converted to N2O. It is believed that human sewage is responsible for a significant portion of the N2O emissions from wastewater treatment.121 Currently, industrial wastewater streams and the other portions of domestic wastewater are not considered in the estimation of N2O emissions from wastewater treatment. In both municipal and industrial systems, the amount of CH4 produced is dependent on a variety of factors, including temperature, biological oxygen demand (BOD) loading, retention time, and fraction of wastewater treated anaerobically. The amount of N2O produced is related to similar factors, in addition to pH and nitrogen concentration. Required Data
In order to calculate CH4 from municipal wastewater treatment, the following activity data are required: state population, kilograms of BOD per capita per day, and the fraction of total wastewater that undergoes anaerobic treatment. With the exception of state population estimates, all data were obtained from the U.S. EPA. The calculation of N2O emissions from municipal wastewater treatment required the following data: annual per capita protein consumption and the fraction of nitrogen in protein. Both categories of data were obtained from the U.S. EPA. Ideally, wastewater production data would be used to calculate CH4 emissions from the pulp and paper, fruits and vegetables, and red meat and poultry industries. Since these data were not available, annual production and
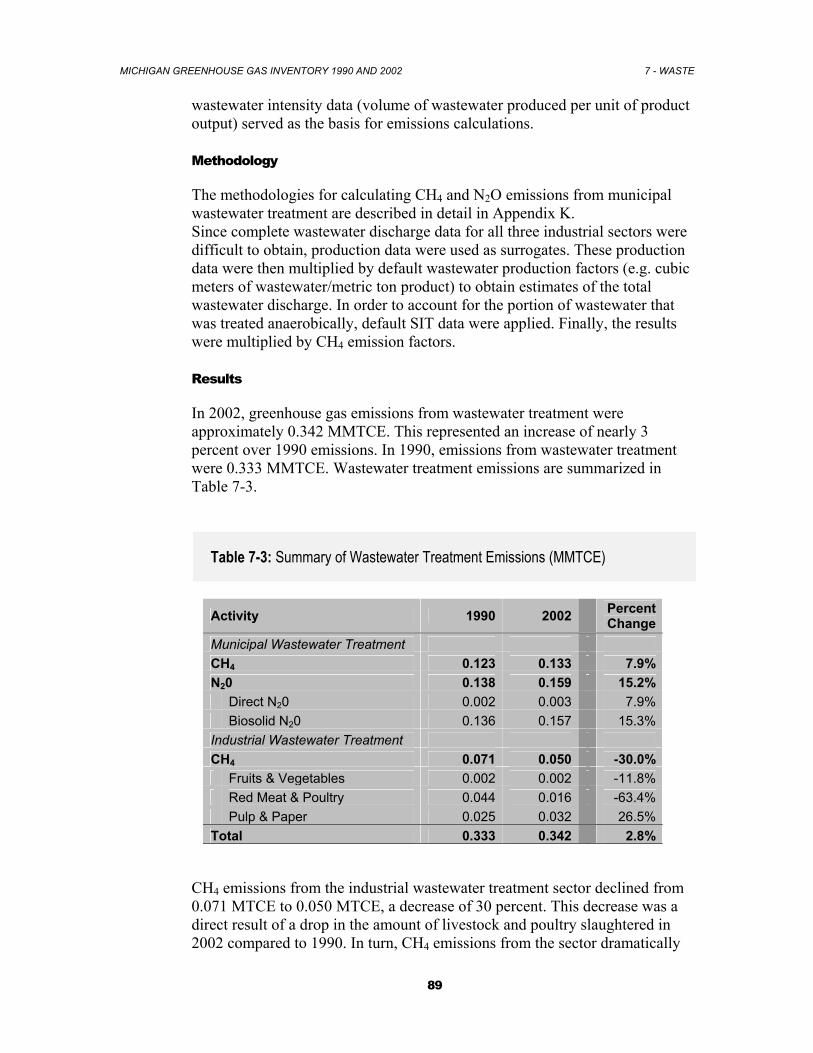
MICHIGAN GREENHOUSE GAS INVENTORY 1990 AND 2002 7 - WASTE
89
wastewater intensity data (volume of wastewater produced per unit of product output) served as the basis for emissions calculations. Methodology
The methodologies for calculating CH4 and N2O emissions from municipal wastewater treatment are described in detail in Appendix K. Since complete wastewater discharge data for all three industrial sectors were difficult to obtain, production data were used as surrogates. These production data were then multiplied by default wastewater production factors (e.g. cubic meters of wastewater/metric ton product) to obtain estimates of the total wastewater discharge. In order to account for the portion of wastewater that was treated anaerobically, default SIT data were applied. Finally, the results were multiplied by CH4 emission factors. Results
In 2002, greenhouse gas emissions from wastewater treatment were approximately 0.342 MMTCE. This represented an increase of nearly 3 percent over 1990 emissions. In 1990, emissions from wastewater treatment were 0.333 MMTCE. Wastewater treatment emissions are summarized in Table 7-3.
Table 7-3: Summary of Wastewater Treatment Emissions (MMTCE)
Activity 1990 2002 Percent Change
Municipal Wastewater Treatment CH4 0.123 0.133 7.9%N20 0.138 0.159 15.2% Direct N20 0.002 0.003 7.9% Biosolid N20 0.136 0.157 15.3%Industrial Wastewater Treatment CH4 0.071 0.050 -30.0% Fruits & Vegetables 0.002 0.002 -11.8% Red Meat & Poultry 0.044 0.016 -63.4% Pulp & Paper 0.025 0.032 26.5%Total 0.333 0.342 2.8%
CH4 emissions from the industrial wastewater treatment sector declined from 0.071 MTCE to 0.050 MTCE, a decrease of 30 percent. This decrease was a direct result of a drop in the amount of livestock and poultry slaughtered in 2002 compared to 1990. In turn, CH4 emissions from the sector dramatically

MICHIGAN GREENHOUSE GAS INVENTORY 1990 AND 2002 7 - WASTE
90
shrunk by 63 percent, from 0.044 MMTCE in 1990 to nearly 0.016 MMTCE in 2002. A slight decrease in emissions of 12 percent was noted for the pulp and paper sector, while the fruit and vegetable sector increased emissions on the order of 27 percent from 0.025 MMTCE in 1990 to 0.032 MMTCE in 2002.
MICHIGAN GREENHOUSE GAS INVENTORY 1990 AND 2002 8 – RESULTS AND CONCULSION
91
8. Results and Conclusion
8.1 Michigan Greenhouse Gas Emissions
In 2002, the State of Michigan emitted an estimated 62.59 million metric tons carbon equivalent (MMTCE). This represented an increase of 9.0 percent over the 1990 emissions baseline of 57.42 MMTCE. Briefly consider that the Kyoto Protocol called for the U.S. to reduce greenhouse emissions by 7 percent over 1990 baseline levels. In just twelve years, Michigan’s emissions are estimated to have grown by 9 percent over its 1990 baseline. Michigan’s greenhouse gas emissions and sinks, summarized by Intergovernmental Panel on Climate Change (IPCC) Category, are presented as Table 8-1.
The IPCC methodology for calculating greenhouse gas emissions is divided into six categories: Energy, Industrial Processes, Solvent Use, Agriculture, Land-Use Change and Forestry, and Waste.122 When emissions are viewed in terms of IPCC categories, the energy category was the largest contributor to overall emissions in both 1990 and 2002. In 2002, this category was responsible for 86.7 percent of total emissions, or 54.22 MMTCE. In 1990, energy-related emissions contributed 87 percent of total emissions, or 50.16 MMTCE. Overall, energy-related emissions increased by over 8 percent from 1990 to 2002. Carbon dioxide (CO2) emissions from fossil fuel combustion are the major contributor to energy-related emissions, as well as the state’s total emissions. Additional increases in emissions were the result of construction of new natural gas transmission and distribution pipelines and associated infrastructure. As described in Section 3.1 of the Energy Chapter, CO2 emissions are influenced by a myriad of short- and long-term factors. On a year-to-year basis, seasonal temperatures, population and economic growth, and general economic conditions are among the dominant drivers for fossil fuel combustion and subsequent CO2 emissions.
Second in contribution to total emissions was the IPCC category of waste. In 2002, emissions resulting from waste management activities totaled 3.40 MMTCE and were responsible for nearly 5.4 percent of total state emissions. Waste-related emissions decreased by 4.2 percent from 1990 to 2002. An explanation of this decrease is that although the amount of solid waste placed in landfills increased substantially in the mid- to late 1990s, the effect was offset by increased amount of CH4 flared at large landfills.
The largest increase between 1990 and 2002 levels was exhibited by industrial process emissions. In 2002, emissions from industrial processes contributed 3.06 MMTCE, or 4.9 percent of total state emissions. Overall, industrial
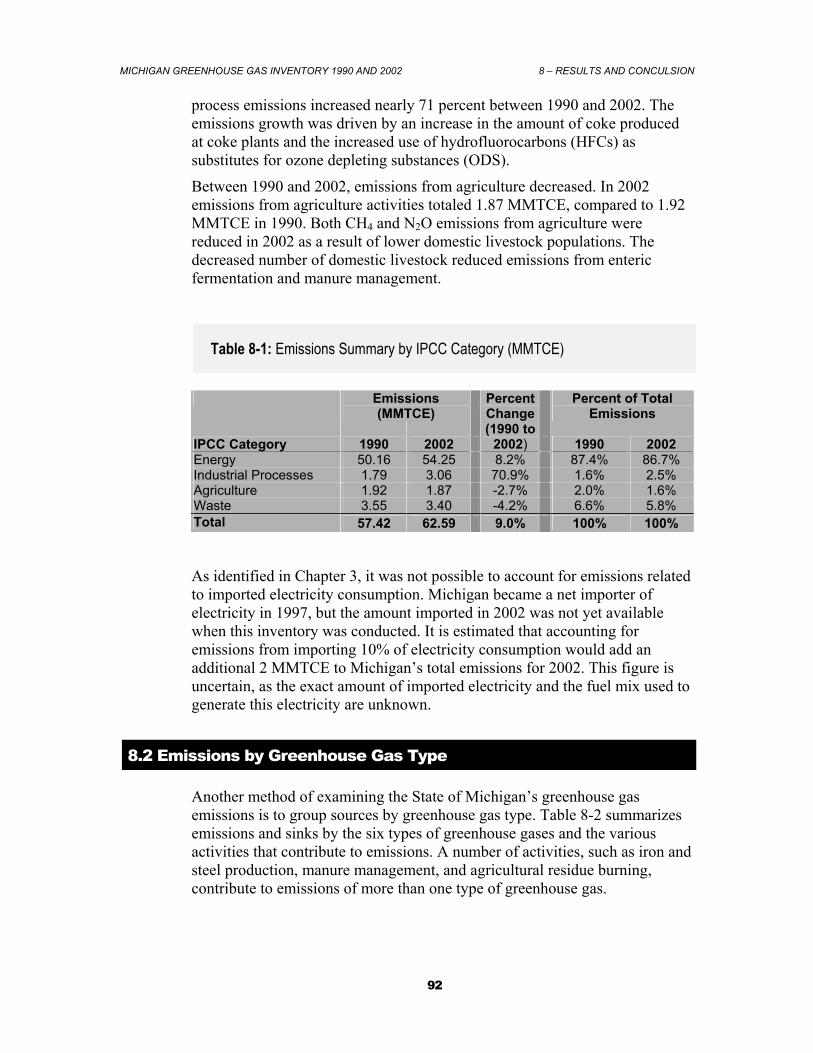
MICHIGAN GREENHOUSE GAS INVENTORY 1990 AND 2002 8 – RESULTS AND CONCULSION
92
process emissions increased nearly 71 percent between 1990 and 2002. The emissions growth was driven by an increase in the amount of coke produced at coke plants and the increased use of hydrofluorocarbons (HFCs) as substitutes for ozone depleting substances (ODS).
Between 1990 and 2002, emissions from agriculture decreased. In 2002 emissions from agriculture activities totaled 1.87 MMTCE, compared to 1.92 MMTCE in 1990. Both CH4 and N2O emissions from agriculture were reduced in 2002 as a result of lower domestic livestock populations. The decreased number of domestic livestock reduced emissions from enteric fermentation and manure management.
Table 8-1: Emissions Summary by IPCC Category (MMTCE)
Emissions (MMTCE)
Percent of Total Emissions
IPCC Category 1990 2002
Percent Change (1990 to
2002) 1990 2002 Energy 50.16 54.25 8.2% 87.4% 86.7% Industrial Processes 1.79 3.06 70.9% 1.6% 2.5% Agriculture 1.92 1.87 -2.7% 2.0% 1.6% Waste 3.55 3.40 -4.2% 6.6% 5.8% Total 57.42 62.59 9.0% 100% 100%
As identified in Chapter 3, it was not possible to account for emissions related to imported electricity consumption. Michigan became a net importer of electricity in 1997, but the amount imported in 2002 was not yet available when this inventory was conducted. It is estimated that accounting for emissions from importing 10% of electricity consumption would add an additional 2 MMTCE to Michigan’s total emissions for 2002. This figure is uncertain, as the exact amount of imported electricity and the fuel mix used to generate this electricity are unknown.
8.2 Emissions by Greenhouse Gas Type
Another method of examining the State of Michigan’s greenhouse gas emissions is to group sources by greenhouse gas type. Table 8-2 summarizes emissions and sinks by the six types of greenhouse gases and the various activities that contribute to emissions. A number of activities, such as iron and steel production, manure management, and agricultural residue burning, contribute to emissions of more than one type of greenhouse gas.
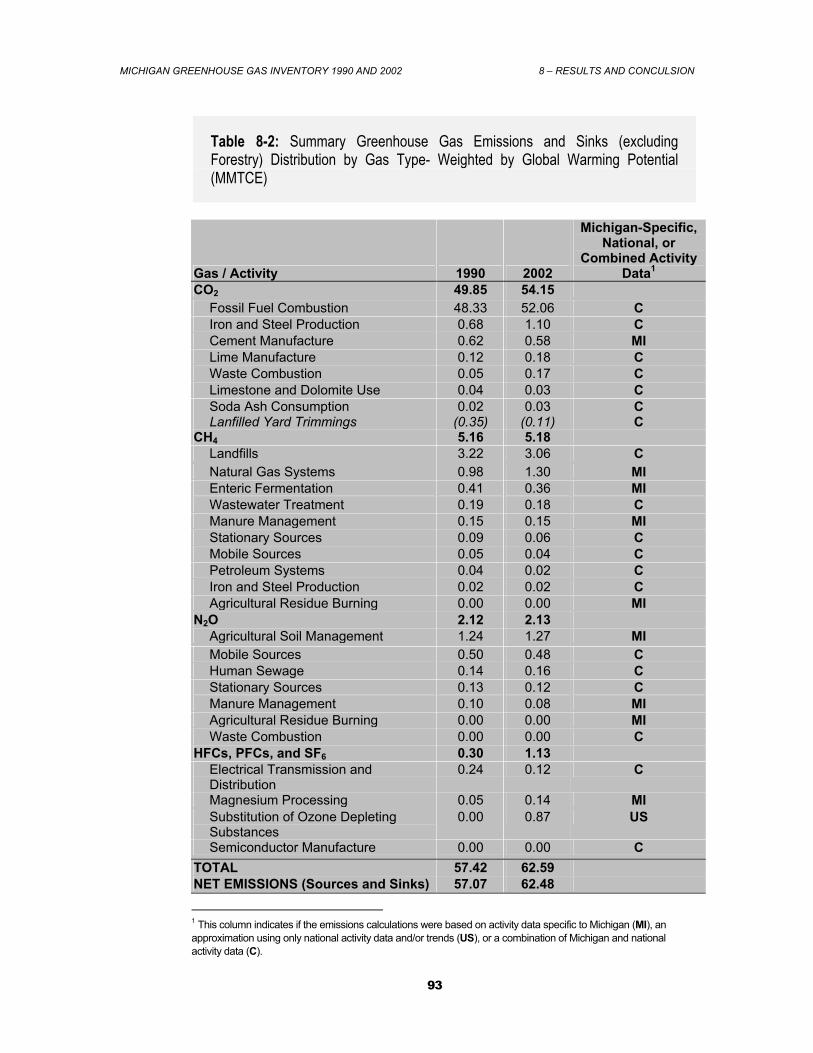
MICHIGAN GREENHOUSE GAS INVENTORY 1990 AND 2002 8 – RESULTS AND CONCULSION
93
Table 8-2: Summary Greenhouse Gas Emissions and Sinks (excluding Forestry) Distribution by Gas Type- Weighted by Global Warming Potential (MMTCE)
Gas / Activity 1990 2002
Michigan-Specific, National, or
Combined Activity Data1
CO2 49.85 54.15 Fossil Fuel Combustion 48.33 52.06 C Iron and Steel Production 0.68 1.10 C Cement Manufacture 0.62 0.58 MI Lime Manufacture 0.12 0.18 C Waste Combustion 0.05 0.17 C Limestone and Dolomite Use 0.04 0.03 C Soda Ash Consumption 0.02 0.03 C Lanfilled Yard Trimmings (0.35) (0.11) C
CH4 5.16 5.18 Landfills 3.22 3.06 C Natural Gas Systems 0.98 1.30 MI Enteric Fermentation 0.41 0.36 MI Wastewater Treatment 0.19 0.18 C Manure Management 0.15 0.15 MI Stationary Sources 0.09 0.06 C Mobile Sources 0.05 0.04 C Petroleum Systems 0.04 0.02 C Iron and Steel Production 0.02 0.02 C Agricultural Residue Burning 0.00 0.00 MI
N2O 2.12 2.13 Agricultural Soil Management 1.24 1.27 MI Mobile Sources 0.50 0.48 C Human Sewage 0.14 0.16 C Stationary Sources 0.13 0.12 C Manure Management 0.10 0.08 MI Agricultural Residue Burning 0.00 0.00 MI Waste Combustion 0.00 0.00 C
HFCs, PFCs, and SF6 0.30 1.13 Electrical Transmission and Distribution
0.24 0.12 C
Magnesium Processing 0.05 0.14 MI Substitution of Ozone Depleting Substances
0.00 0.87 US
Semiconductor Manufacture 0.00 0.00 C TOTAL 57.42 62.59 NET EMISSIONS (Sources and Sinks) 57.07 62.48
1 This column indicates if the emissions calculations were based on activity data specific to Michigan (MI), an approximation using only national activity data and/or trends (US), or a combination of Michigan and national activity data (C).
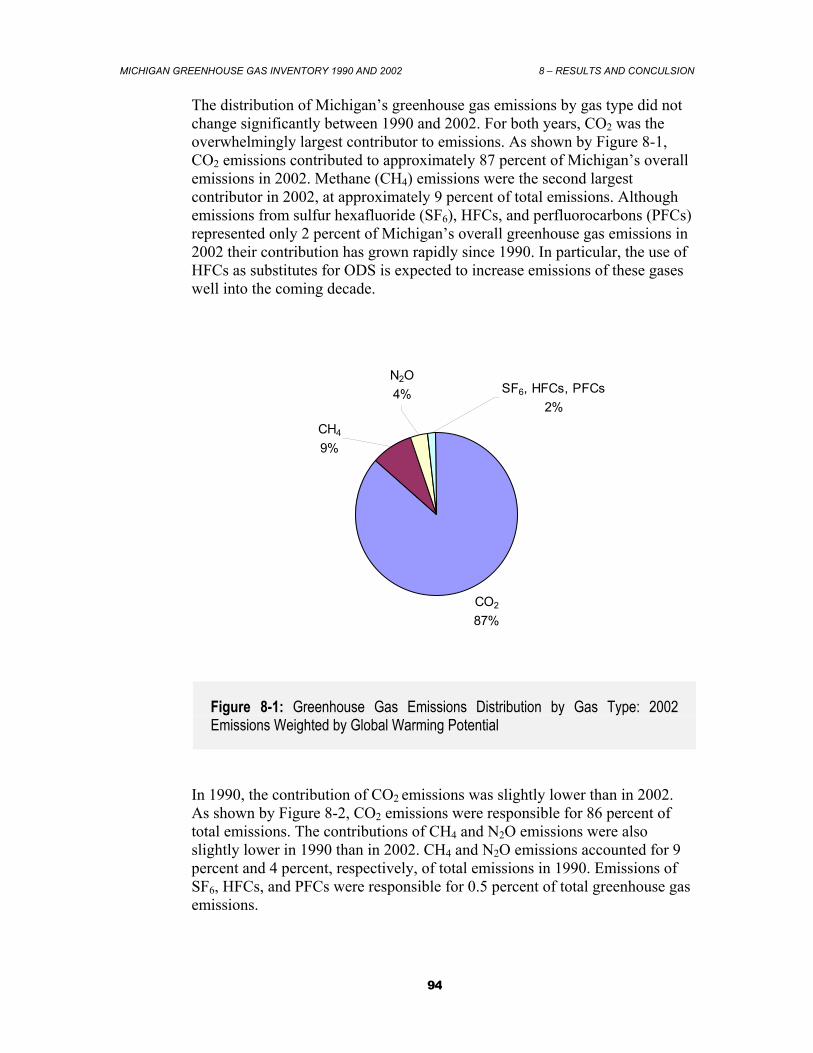
MICHIGAN GREENHOUSE GAS INVENTORY 1990 AND 2002 8 – RESULTS AND CONCULSION
94
The distribution of Michigan’s greenhouse gas emissions by gas type did not change significantly between 1990 and 2002. For both years, CO2 was the overwhelmingly largest contributor to emissions. As shown by Figure 8-1, CO2 emissions contributed to approximately 87 percent of Michigan’s overall emissions in 2002. Methane (CH4) emissions were the second largest contributor in 2002, at approximately 9 percent of total emissions. Although emissions from sulfur hexafluoride (SF6), HFCs, and perfluorocarbons (PFCs) represented only 2 percent of Michigan’s overall greenhouse gas emissions in 2002 their contribution has grown rapidly since 1990. In particular, the use of HFCs as substitutes for ODS is expected to increase emissions of these gases well into the coming decade.
SF6, HFCs, PFCs2%
CH4
9%
N2O4%
CO2
87%
Figure 8-1: Greenhouse Gas Emissions Distribution by Gas Type: 2002 Emissions Weighted by Global Warming Potential
In 1990, the contribution of CO2 emissions was slightly lower than in 2002. As shown by Figure 8-2, CO2 emissions were responsible for 86 percent of total emissions. The contributions of CH4 and N2O emissions were also slightly lower in 1990 than in 2002. CH4 and N2O emissions accounted for 9 percent and 4 percent, respectively, of total emissions in 1990. Emissions of SF6, HFCs, and PFCs were responsible for 0.5 percent of total greenhouse gas emissions.
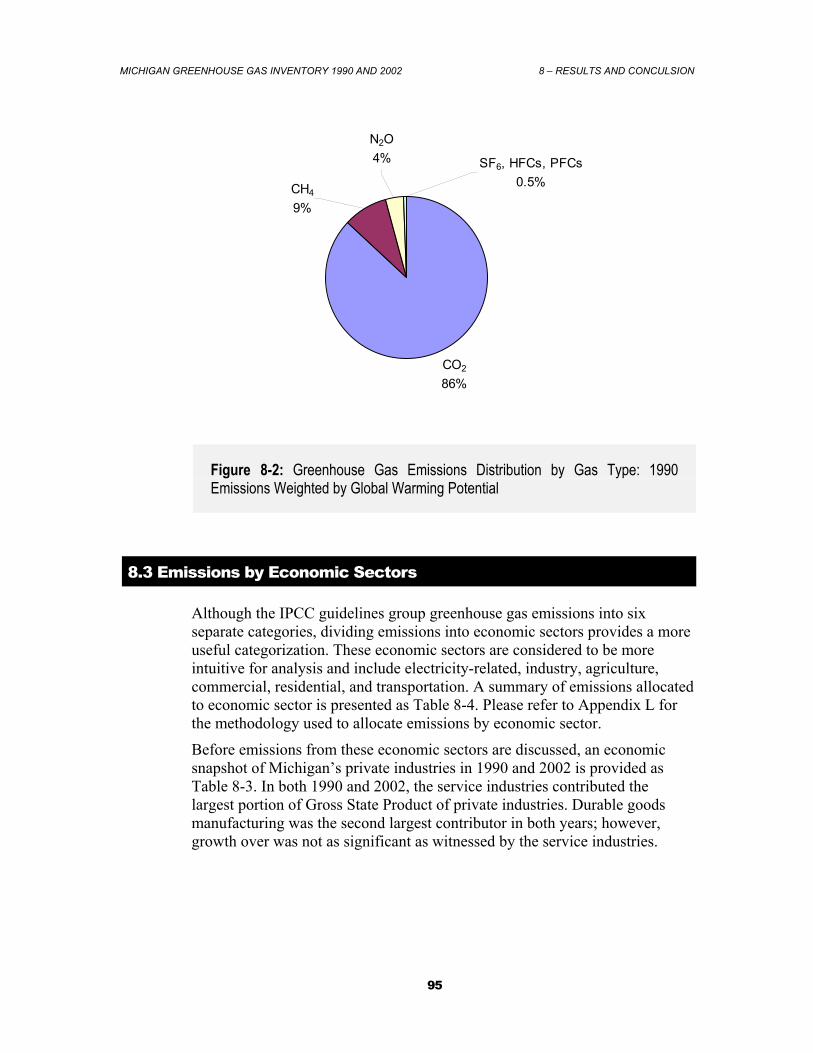
MICHIGAN GREENHOUSE GAS INVENTORY 1990 AND 2002 8 – RESULTS AND CONCULSION
95
CO2
86%
N2O4%
CH4
9%
SF6, HFCs, PFCs0.5%
Figure 8-2: Greenhouse Gas Emissions Distribution by Gas Type: 1990 Emissions Weighted by Global Warming Potential
8.3 Emissions by Economic Sectors
Although the IPCC guidelines group greenhouse gas emissions into six separate categories, dividing emissions into economic sectors provides a more useful categorization. These economic sectors are considered to be more intuitive for analysis and include electricity-related, industry, agriculture, commercial, residential, and transportation. A summary of emissions allocated to economic sector is presented as Table 8-4. Please refer to Appendix L for the methodology used to allocate emissions by economic sector.
Before emissions from these economic sectors are discussed, an economic snapshot of Michigan’s private industries in 1990 and 2002 is provided as Table 8-3. In both 1990 and 2002, the service industries contributed the largest portion of Gross State Product of private industries. Durable goods manufacturing was the second largest contributor in both years; however, growth over was not as significant as witnessed by the service industries.
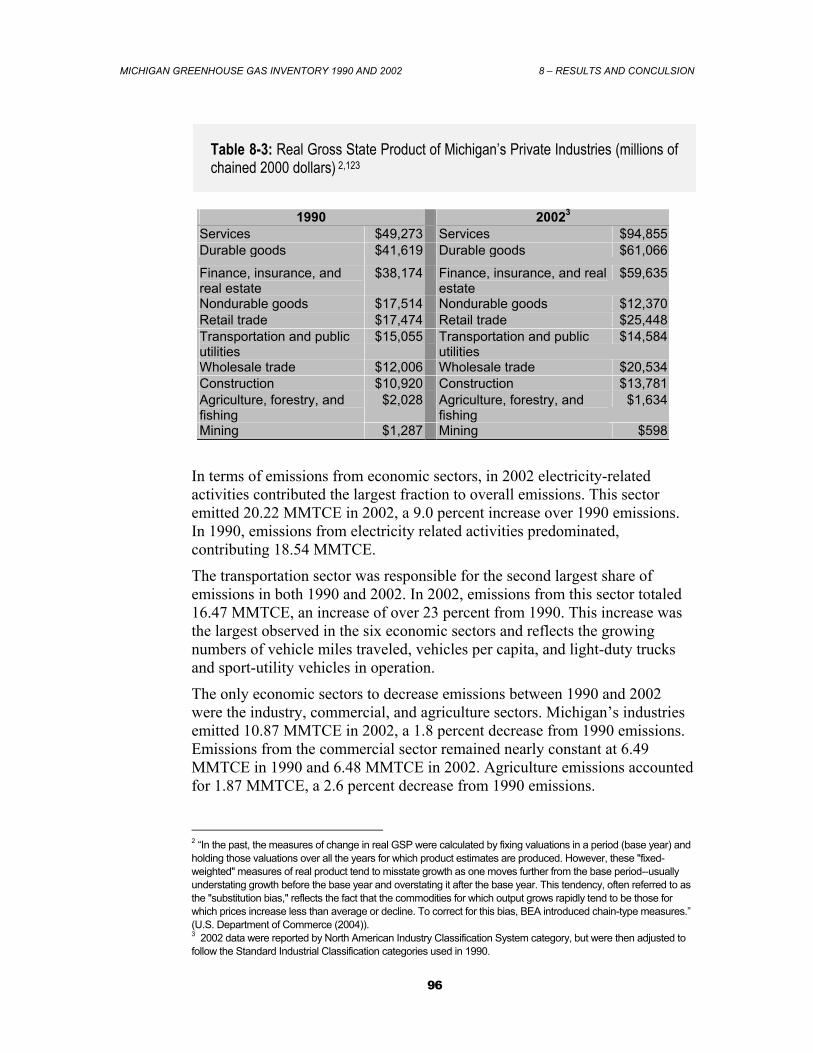
MICHIGAN GREENHOUSE GAS INVENTORY 1990 AND 2002 8 – RESULTS AND CONCULSION
96
Table 8-3: Real Gross State Product of Michigan’s Private Industries (millions of chained 2000 dollars) 2,123
1990 20023 Services $49,273 Services $94,855Durable goods $41,619 Durable goods $61,066
Finance, insurance, and real estate
$38,174 Finance, insurance, and real estate
$59,635
Nondurable goods $17,514 Nondurable goods $12,370Retail trade $17,474 Retail trade $25,448Transportation and public utilities
$15,055 Transportation and public utilities
$14,584
Wholesale trade $12,006 Wholesale trade $20,534Construction $10,920 Construction $13,781Agriculture, forestry, and fishing
$2,028 Agriculture, forestry, and fishing
$1,634
Mining $1,287 Mining $598
In terms of emissions from economic sectors, in 2002 electricity-related activities contributed the largest fraction to overall emissions. This sector emitted 20.22 MMTCE in 2002, a 9.0 percent increase over 1990 emissions. In 1990, emissions from electricity related activities predominated, contributing 18.54 MMTCE.
The transportation sector was responsible for the second largest share of emissions in both 1990 and 2002. In 2002, emissions from this sector totaled 16.47 MMTCE, an increase of over 23 percent from 1990. This increase was the largest observed in the six economic sectors and reflects the growing numbers of vehicle miles traveled, vehicles per capita, and light-duty trucks and sport-utility vehicles in operation.
The only economic sectors to decrease emissions between 1990 and 2002 were the industry, commercial, and agriculture sectors. Michigan’s industries emitted 10.87 MMTCE in 2002, a 1.8 percent decrease from 1990 emissions. Emissions from the commercial sector remained nearly constant at 6.49 MMTCE in 1990 and 6.48 MMTCE in 2002. Agriculture emissions accounted for 1.87 MMTCE, a 2.6 percent decrease from 1990 emissions.
2 “In the past, the measures of change in real GSP were calculated by fixing valuations in a period (base year) and holding those valuations over all the years for which product estimates are produced. However, these "fixed-weighted" measures of real product tend to misstate growth as one moves further from the base period--usually understating growth before the base year and overstating it after the base year. This tendency, often referred to as the "substitution bias," reflects the fact that the commodities for which output grows rapidly tend to be those for which prices increase less than average or decline. To correct for this bias, BEA introduced chain-type measures.” (U.S. Department of Commerce (2004)). 3 2002 data were reported by North American Industry Classification System category, but were then adjusted to follow the Standard Industrial Classification categories used in 1990.
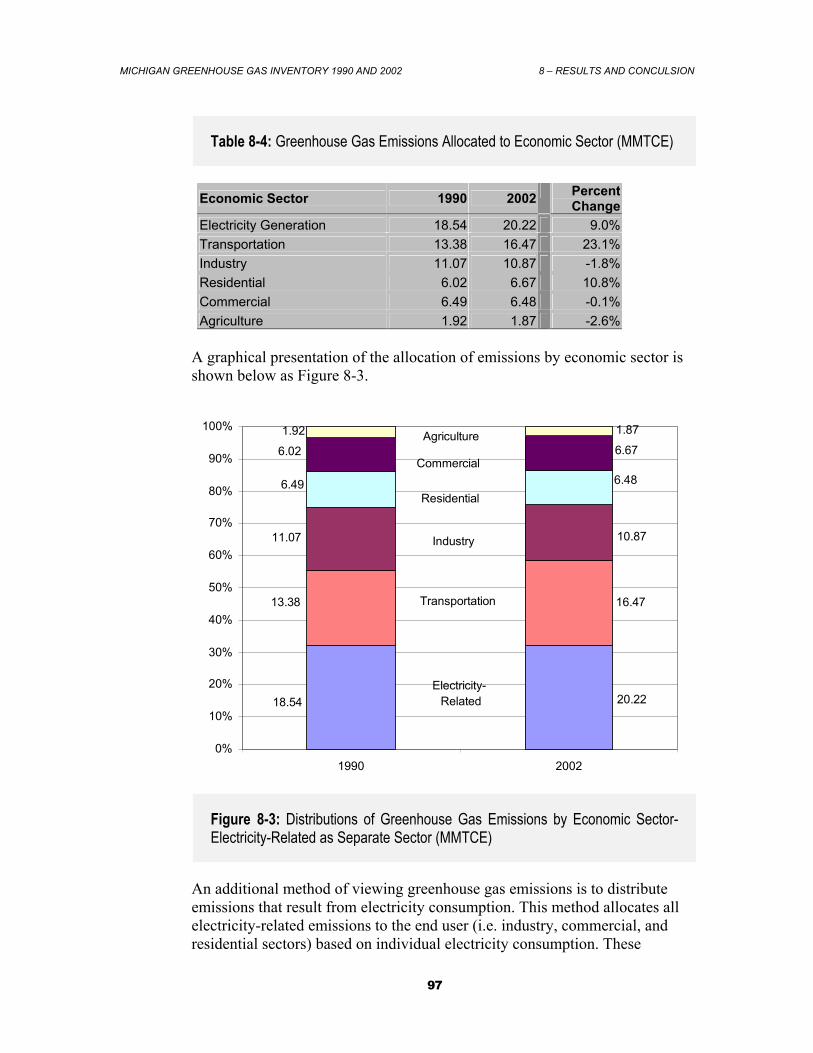
MICHIGAN GREENHOUSE GAS INVENTORY 1990 AND 2002 8 – RESULTS AND CONCULSION
97
Table 8-4: Greenhouse Gas Emissions Allocated to Economic Sector (MMTCE)
Economic Sector 1990 2002 Percent Change
Electricity Generation 18.54 20.22 9.0% Transportation 13.38 16.47 23.1% Industry 11.07 10.87 -1.8% Residential 6.02 6.67 10.8% Commercial 6.49 6.48 -0.1% Agriculture 1.92 1.87 -2.6%
A graphical presentation of the allocation of emissions by economic sector is shown below as Figure 8-3.
20.22 18.54
16.47 13.38
10.87 11.07
6.48 6.49
6.02 6.67 1.92 1.87
0%
10%
20%
30%
40%
50%
60%
70%
80%
90%
100%
1990 2002
Agriculture
Commercial
Residential
Transportation
Electricity-Related
Industry
Figure 8-3: Distributions of Greenhouse Gas Emissions by Economic Sector- Electricity-Related as Separate Sector (MMTCE)
An additional method of viewing greenhouse gas emissions is to distribute emissions that result from electricity consumption. This method allocates all electricity-related emissions to the end user (i.e. industry, commercial, and residential sectors) based on individual electricity consumption. These
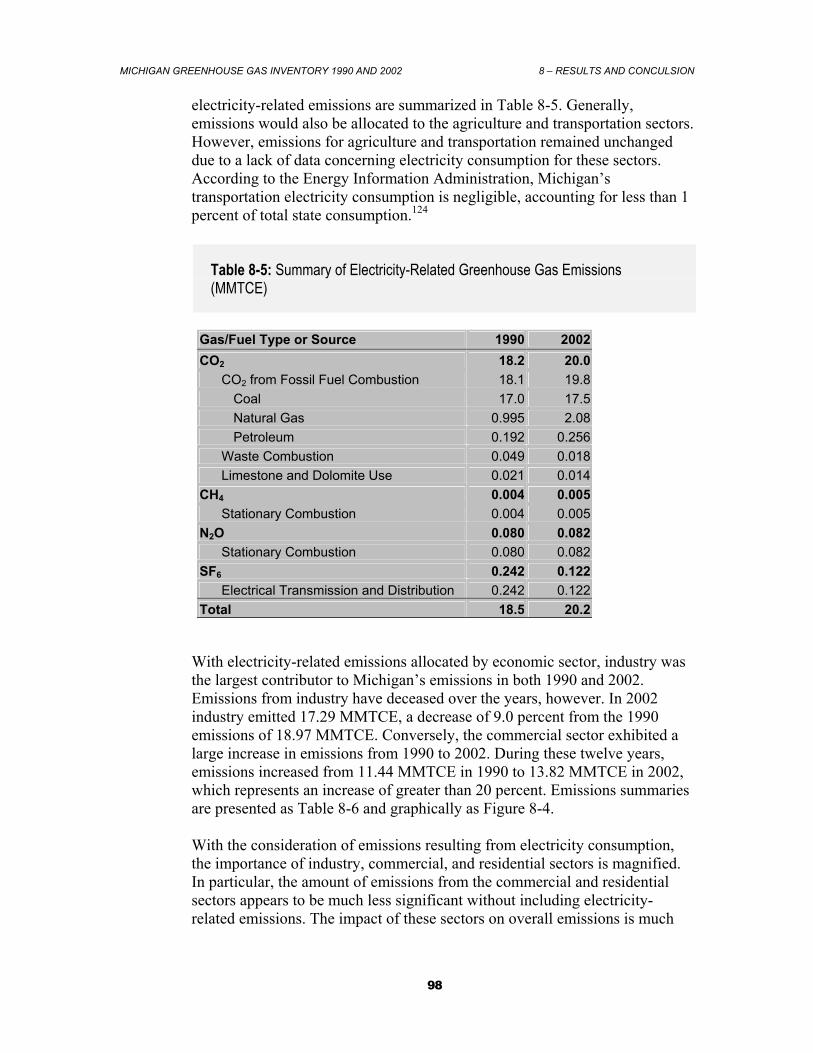
MICHIGAN GREENHOUSE GAS INVENTORY 1990 AND 2002 8 – RESULTS AND CONCULSION
98
electricity-related emissions are summarized in Table 8-5. Generally, emissions would also be allocated to the agriculture and transportation sectors. However, emissions for agriculture and transportation remained unchanged due to a lack of data concerning electricity consumption for these sectors. According to the Energy Information Administration, Michigan’s transportation electricity consumption is negligible, accounting for less than 1 percent of total state consumption.124
Table 8-5: Summary of Electricity-Related Greenhouse Gas Emissions (MMTCE)
Gas/Fuel Type or Source 1990 2002 CO2 18.2 20.0
CO2 from Fossil Fuel Combustion 18.1 19.8 Coal 17.0 17.5 Natural Gas 0.995 2.08 Petroleum 0.192 0.256
Waste Combustion 0.049 0.018 Limestone and Dolomite Use 0.021 0.014
CH4 0.004 0.005 Stationary Combustion 0.004 0.005
N2O 0.080 0.082 Stationary Combustion 0.080 0.082
SF6 0.242 0.122 Electrical Transmission and Distribution 0.242 0.122
Total 18.5 20.2
With electricity-related emissions allocated by economic sector, industry was the largest contributor to Michigan’s emissions in both 1990 and 2002. Emissions from industry have deceased over the years, however. In 2002 industry emitted 17.29 MMTCE, a decrease of 9.0 percent from the 1990 emissions of 18.97 MMTCE. Conversely, the commercial sector exhibited a large increase in emissions from 1990 to 2002. During these twelve years, emissions increased from 11.44 MMTCE in 1990 to 13.82 MMTCE in 2002, which represents an increase of greater than 20 percent. Emissions summaries are presented as Table 8-6 and graphically as Figure 8-4. With the consideration of emissions resulting from electricity consumption, the importance of industry, commercial, and residential sectors is magnified. In particular, the amount of emissions from the commercial and residential sectors appears to be much less significant without including electricity-related emissions. The impact of these sectors on overall emissions is much
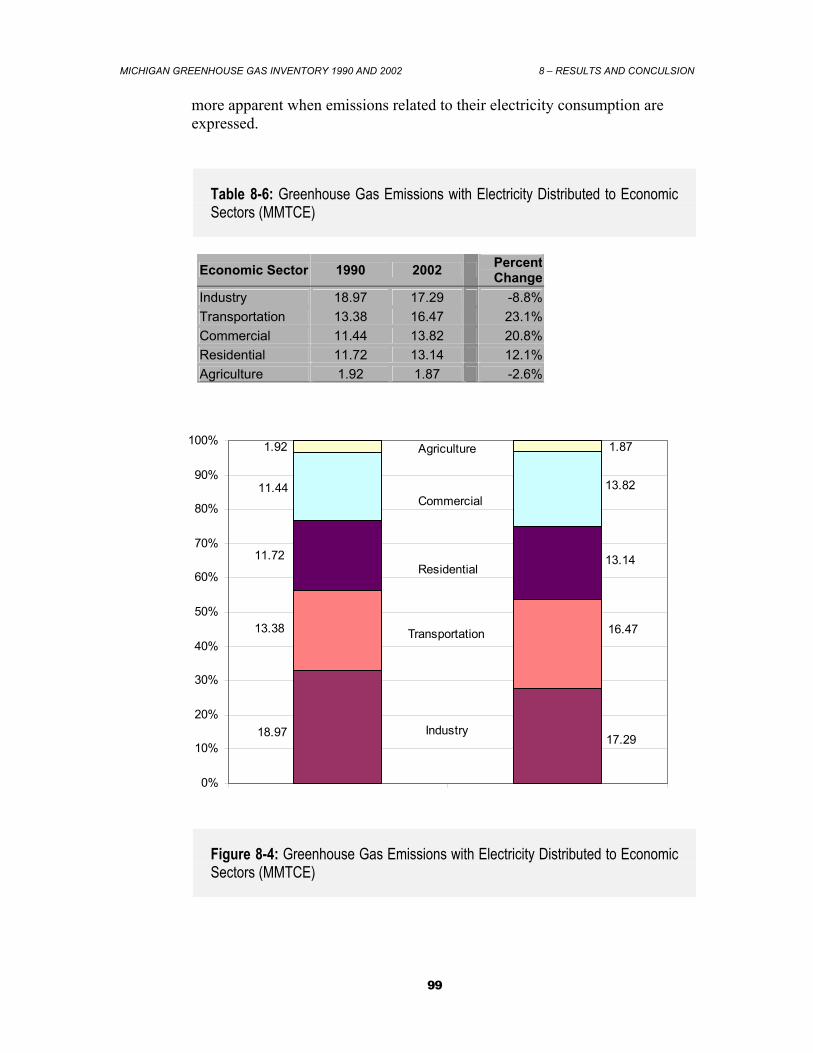
MICHIGAN GREENHOUSE GAS INVENTORY 1990 AND 2002 8 – RESULTS AND CONCULSION
99
more apparent when emissions related to their electricity consumption are expressed.
Table 8-6: Greenhouse Gas Emissions with Electricity Distributed to Economic Sectors (MMTCE)
Economic Sector 1990 2002 Percent Change
Industry 18.97 17.29 -8.8%Transportation 13.38 16.47 23.1%Commercial 11.44 13.82 20.8%Residential 11.72 13.14 12.1%Agriculture 1.92 1.87 -2.6%
18.97 17.29
13.38 16.47
13.1411.72
11.44 13.82
1.871.92
0%
10%
20%
30%
40%
50%
60%
70%
80%
90%
100%
Industry
Transportation
Residential
Commercial
Agriculture
Figure 8-4: Greenhouse Gas Emissions with Electricity Distributed to Economic Sectors (MMTCE)
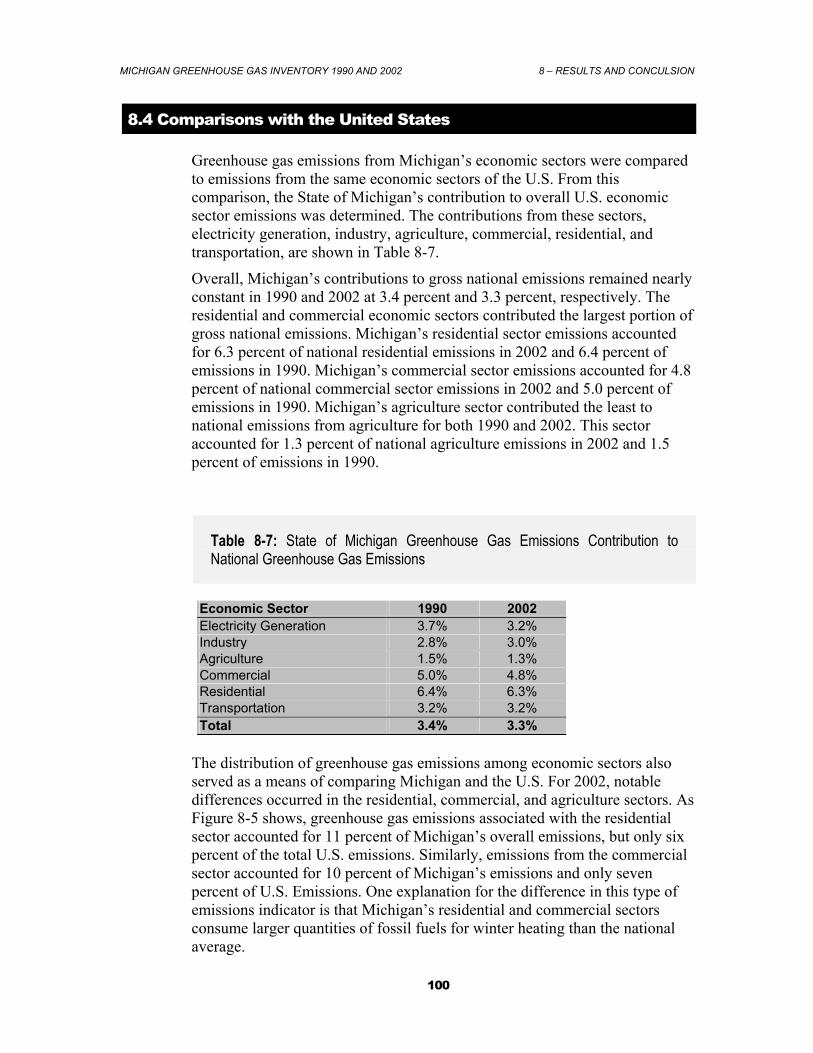
MICHIGAN GREENHOUSE GAS INVENTORY 1990 AND 2002 8 – RESULTS AND CONCULSION
100
8.4 Comparisons with the United States
Greenhouse gas emissions from Michigan’s economic sectors were compared to emissions from the same economic sectors of the U.S. From this comparison, the State of Michigan’s contribution to overall U.S. economic sector emissions was determined. The contributions from these sectors, electricity generation, industry, agriculture, commercial, residential, and transportation, are shown in Table 8-7.
Overall, Michigan’s contributions to gross national emissions remained nearly constant in 1990 and 2002 at 3.4 percent and 3.3 percent, respectively. The residential and commercial economic sectors contributed the largest portion of gross national emissions. Michigan’s residential sector emissions accounted for 6.3 percent of national residential emissions in 2002 and 6.4 percent of emissions in 1990. Michigan’s commercial sector emissions accounted for 4.8 percent of national commercial sector emissions in 2002 and 5.0 percent of emissions in 1990. Michigan’s agriculture sector contributed the least to national emissions from agriculture for both 1990 and 2002. This sector accounted for 1.3 percent of national agriculture emissions in 2002 and 1.5 percent of emissions in 1990.
Table 8-7: State of Michigan Greenhouse Gas Emissions Contribution to National Greenhouse Gas Emissions
Economic Sector 1990 2002 Electricity Generation 3.7% 3.2% Industry 2.8% 3.0% Agriculture 1.5% 1.3% Commercial 5.0% 4.8% Residential 6.4% 6.3% Transportation 3.2% 3.2% Total 3.4% 3.3%
The distribution of greenhouse gas emissions among economic sectors also served as a means of comparing Michigan and the U.S. For 2002, notable differences occurred in the residential, commercial, and agriculture sectors. As Figure 8-5 shows, greenhouse gas emissions associated with the residential sector accounted for 11 percent of Michigan’s overall emissions, but only six percent of the total U.S. emissions. Similarly, emissions from the commercial sector accounted for 10 percent of Michigan’s emissions and only seven percent of U.S. Emissions. One explanation for the difference in this type of emissions indicator is that Michigan’s residential and commercial sectors consume larger quantities of fossil fuels for winter heating than the national average.
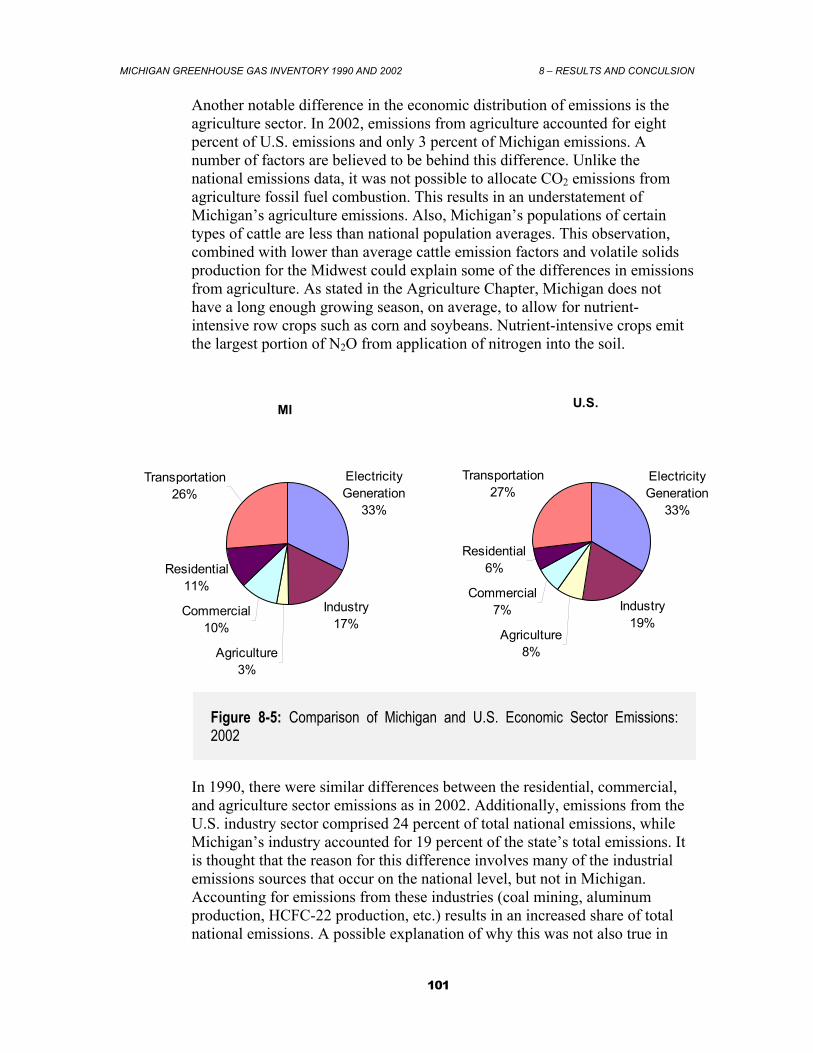
MICHIGAN GREENHOUSE GAS INVENTORY 1990 AND 2002 8 – RESULTS AND CONCULSION
101
Another notable difference in the economic distribution of emissions is the agriculture sector. In 2002, emissions from agriculture accounted for eight percent of U.S. emissions and only 3 percent of Michigan emissions. A number of factors are believed to be behind this difference. Unlike the national emissions data, it was not possible to allocate CO2 emissions from agriculture fossil fuel combustion. This results in an understatement of Michigan’s agriculture emissions. Also, Michigan’s populations of certain types of cattle are less than national population averages. This observation, combined with lower than average cattle emission factors and volatile solids production for the Midwest could explain some of the differences in emissions from agriculture. As stated in the Agriculture Chapter, Michigan does not have a long enough growing season, on average, to allow for nutrient-intensive row crops such as corn and soybeans. Nutrient-intensive crops emit the largest portion of N2O from application of nitrogen into the soil.
Electricity Generation
33%
Industry17%
Agriculture3%
Commercial10%
Residential11%
Transportation26%
MI
Electricity Generation
33%
Industry19%
Agriculture8%
Commercial7%
Residential6%
Transportation27%
U.S.
Figure 8-5: Comparison of Michigan and U.S. Economic Sector Emissions: 2002
In 1990, there were similar differences between the residential, commercial, and agriculture sector emissions as in 2002. Additionally, emissions from the U.S. industry sector comprised 24 percent of total national emissions, while Michigan’s industry accounted for 19 percent of the state’s total emissions. It is thought that the reason for this difference involves many of the industrial emissions sources that occur on the national level, but not in Michigan. Accounting for emissions from these industries (coal mining, aluminum production, HCFC-22 production, etc.) results in an increased share of total national emissions. A possible explanation of why this was not also true in
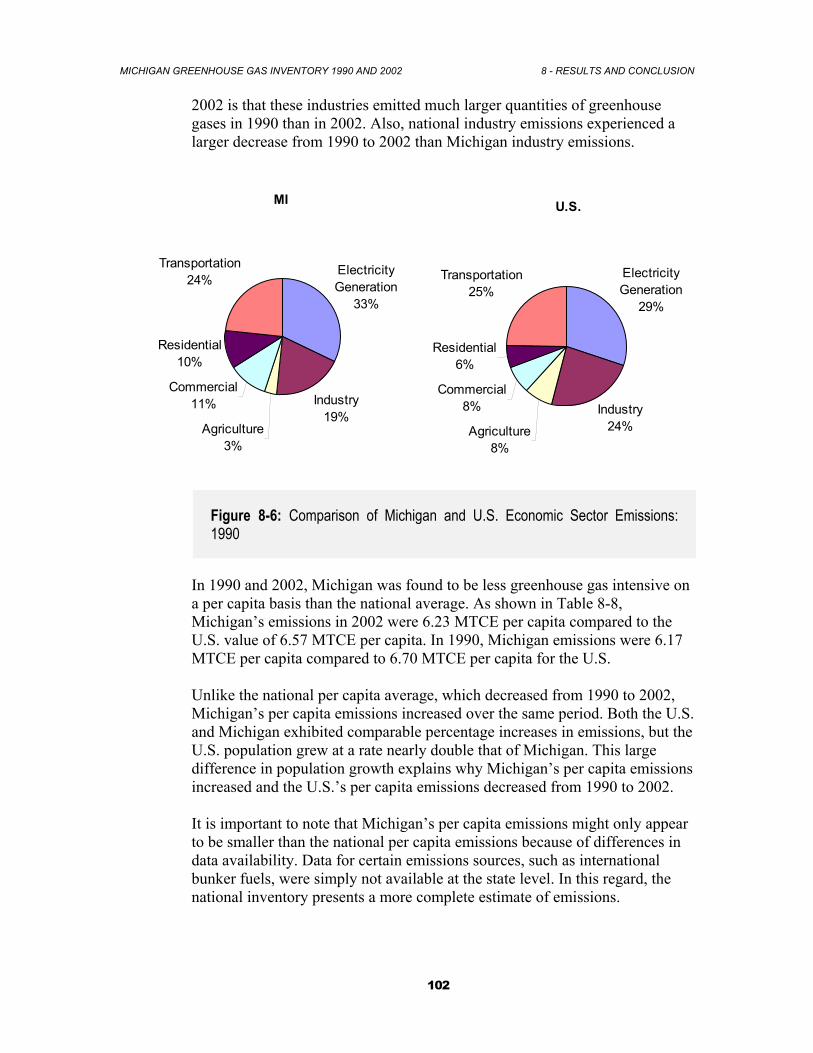
MICHIGAN GREENHOUSE GAS INVENTORY 1990 AND 2002 8 - RESULTS AND CONCLUSION
102
2002 is that these industries emitted much larger quantities of greenhouse gases in 1990 than in 2002. Also, national industry emissions experienced a larger decrease from 1990 to 2002 than Michigan industry emissions.
Electricity Generation
33%
Industry19%
Agriculture3%
Commercial11%
Residential10%
Transportation24%
MI
Figure 8-6: Comparison of Michigan and U.S. Economic Sector Emissions: 1990
In 1990 and 2002, Michigan was found to be less greenhouse gas intensive on a per capita basis than the national average. As shown in Table 8-8, Michigan’s emissions in 2002 were 6.23 MTCE per capita compared to the U.S. value of 6.57 MTCE per capita. In 1990, Michigan emissions were 6.17 MTCE per capita compared to 6.70 MTCE per capita for the U.S. Unlike the national per capita average, which decreased from 1990 to 2002, Michigan’s per capita emissions increased over the same period. Both the U.S. and Michigan exhibited comparable percentage increases in emissions, but the U.S. population grew at a rate nearly double that of Michigan. This large difference in population growth explains why Michigan’s per capita emissions increased and the U.S.’s per capita emissions decreased from 1990 to 2002. It is important to note that Michigan’s per capita emissions might only appear to be smaller than the national per capita emissions because of differences in data availability. Data for certain emissions sources, such as international bunker fuels, were simply not available at the state level. In this regard, the national inventory presents a more complete estimate of emissions.
Electricity Generation
29%
Industry24%Agriculture
8%
Commercial8%
Residential6%
Transportation25%
U.S.
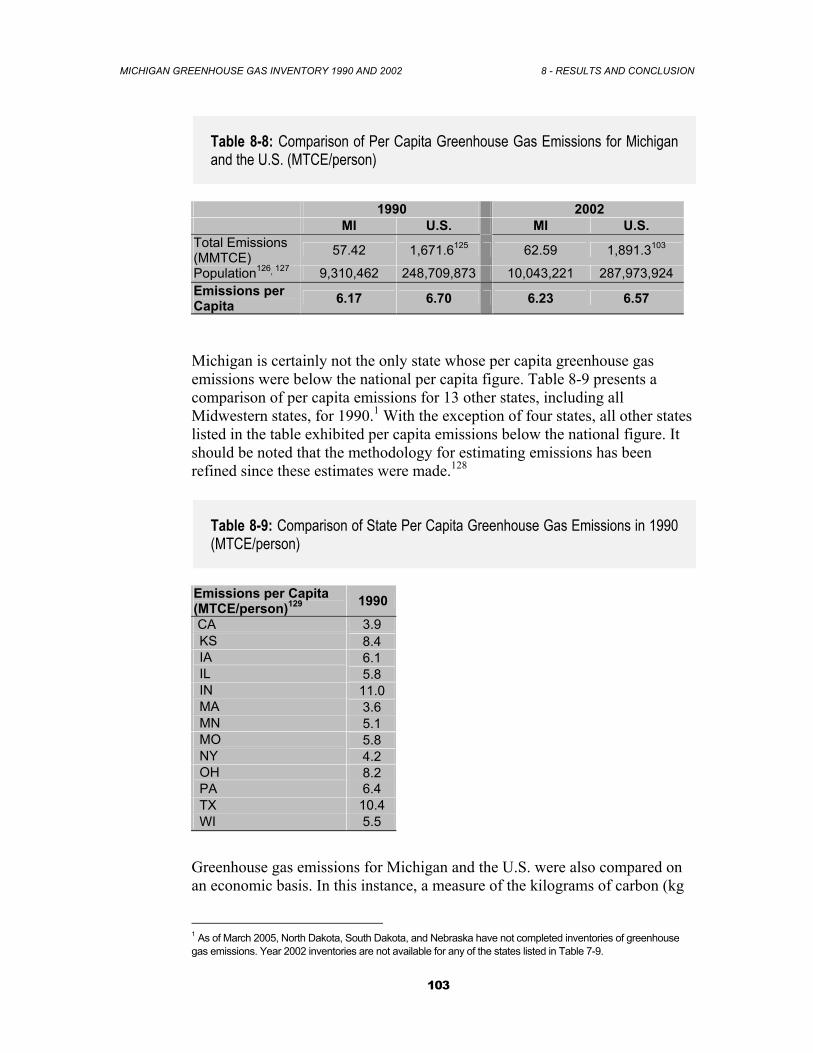
MICHIGAN GREENHOUSE GAS INVENTORY 1990 AND 2002 8 - RESULTS AND CONCLUSION
103
Table 8-8: Comparison of Per Capita Greenhouse Gas Emissions for Michigan and the U.S. (MTCE/person)
1990 2002 MI U.S. MI U.S.
Total Emissions (MMTCE) 57.42 1,671.6125 62.59 1,891.3103
Population126’ 127
9,310,462 248,709,873 10,043,221 287,973,924 Emissions per Capita 6.17 6.70 6.23 6.57
Michigan is certainly not the only state whose per capita greenhouse gas emissions were below the national per capita figure. Table 8-9 presents a comparison of per capita emissions for 13 other states, including all Midwestern states, for 1990.1 With the exception of four states, all other states listed in the table exhibited per capita emissions below the national figure. It should be noted that the methodology for estimating emissions has been refined since these estimates were made.128
Table 8-9: Comparison of State Per Capita Greenhouse Gas Emissions in 1990 (MTCE/person)
Emissions per Capita (MTCE/person)129 1990
CA 3.9 KS 8.4 IA 6.1 IL 5.8 IN 11.0 MA 3.6 MN 5.1 MO 5.8 NY 4.2 OH 8.2 PA 6.4 TX 10.4 WI 5.5
Greenhouse gas emissions for Michigan and the U.S. were also compared on an economic basis. In this instance, a measure of the kilograms of carbon (kg
1 As of March 2005, North Dakota, South Dakota, and Nebraska have not completed inventories of greenhouse gas emissions. Year 2002 inventories are not available for any of the states listed in Table 7-9.
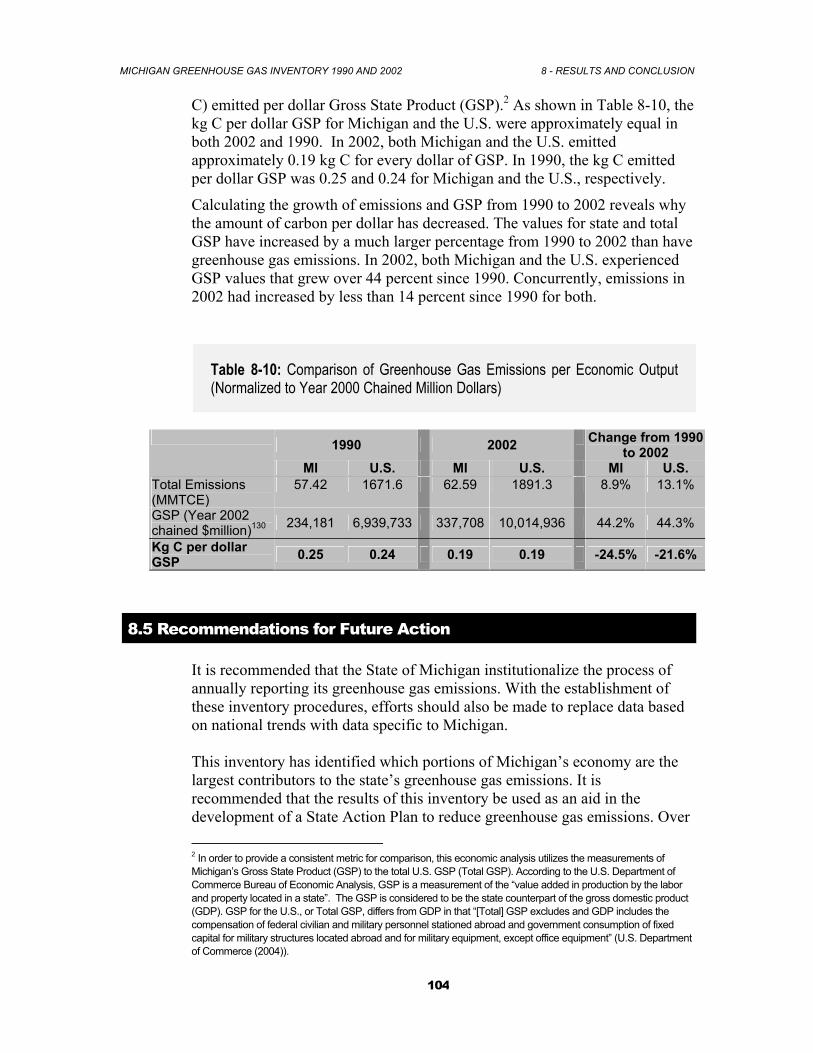
MICHIGAN GREENHOUSE GAS INVENTORY 1990 AND 2002 8 - RESULTS AND CONCLUSION
104
C) emitted per dollar Gross State Product (GSP).2 As shown in Table 8-10, the kg C per dollar GSP for Michigan and the U.S. were approximately equal in both 2002 and 1990. In 2002, both Michigan and the U.S. emitted approximately 0.19 kg C for every dollar of GSP. In 1990, the kg C emitted per dollar GSP was 0.25 and 0.24 for Michigan and the U.S., respectively.
Calculating the growth of emissions and GSP from 1990 to 2002 reveals why the amount of carbon per dollar has decreased. The values for state and total GSP have increased by a much larger percentage from 1990 to 2002 than have greenhouse gas emissions. In 2002, both Michigan and the U.S. experienced GSP values that grew over 44 percent since 1990. Concurrently, emissions in 2002 had increased by less than 14 percent since 1990 for both.
Table 8-10: Comparison of Greenhouse Gas Emissions per Economic Output (Normalized to Year 2000 Chained Million Dollars)
1990 2002 Change from 1990 to 2002
MI U.S. MI U.S. MI U.S. Total Emissions (MMTCE)
57.42 1671.6 62.59 1891.3 8.9% 13.1%
GSP (Year 2002 chained $million)130 234,181 6,939,733 337,708 10,014,936 44.2% 44.3%
Kg C per dollar GSP 0.25 0.24 0.19 0.19 -24.5% -21.6%
8.5 Recommendations for Future Action
It is recommended that the State of Michigan institutionalize the process of annually reporting its greenhouse gas emissions. With the establishment of these inventory procedures, efforts should also be made to replace data based on national trends with data specific to Michigan. This inventory has identified which portions of Michigan’s economy are the largest contributors to the state’s greenhouse gas emissions. It is recommended that the results of this inventory be used as an aid in the development of a State Action Plan to reduce greenhouse gas emissions. Over 2 In order to provide a consistent metric for comparison, this economic analysis utilizes the measurements of Michigan’s Gross State Product (GSP) to the total U.S. GSP (Total GSP). According to the U.S. Department of Commerce Bureau of Economic Analysis, GSP is a measurement of the “value added in production by the labor and property located in a state”. The GSP is considered to be the state counterpart of the gross domestic product (GDP). GSP for the U.S., or Total GSP, differs from GDP in that “[Total] GSP excludes and GDP includes the compensation of federal civilian and military personnel stationed abroad and government consumption of fixed capital for military structures located abroad and for military equipment, except office equipment” (U.S. Department of Commerce (2004)).
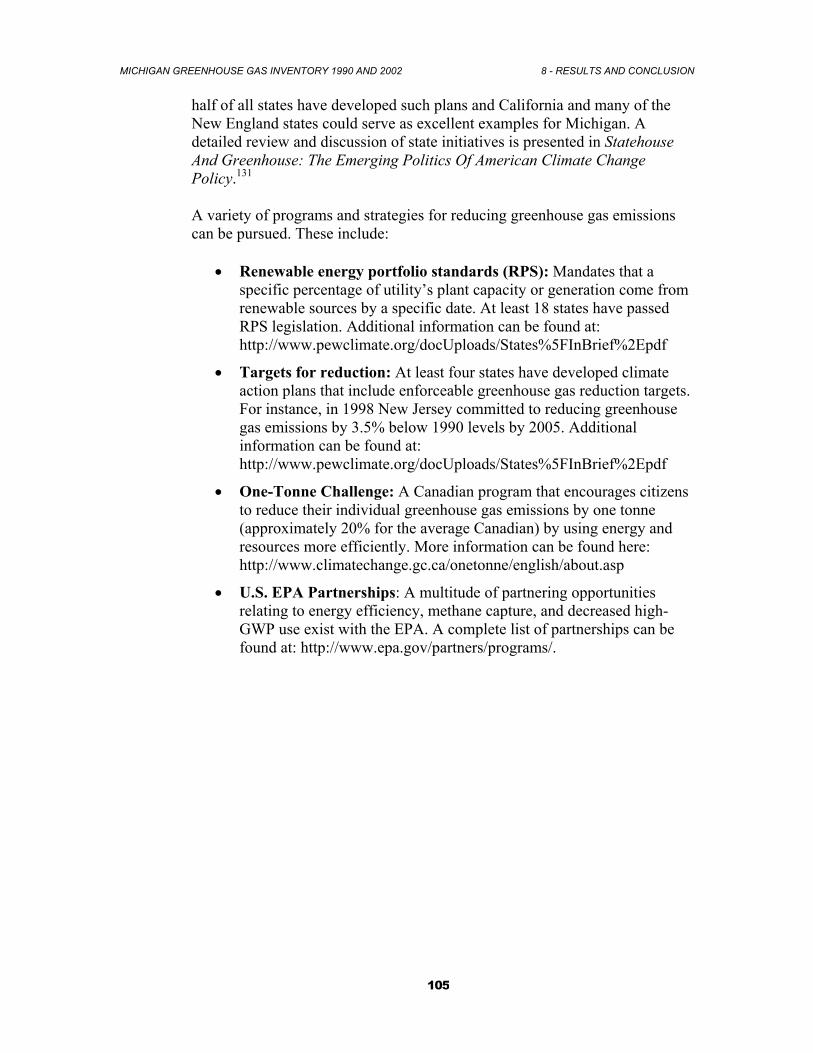
MICHIGAN GREENHOUSE GAS INVENTORY 1990 AND 2002 8 - RESULTS AND CONCLUSION
105
half of all states have developed such plans and California and many of the New England states could serve as excellent examples for Michigan. A detailed review and discussion of state initiatives is presented in Statehouse And Greenhouse: The Emerging Politics Of American Climate Change Policy.131 A variety of programs and strategies for reducing greenhouse gas emissions can be pursued. These include:
• Renewable energy portfolio standards (RPS): Mandates that a specific percentage of utility’s plant capacity or generation come from renewable sources by a specific date. At least 18 states have passed RPS legislation. Additional information can be found at: http://www.pewclimate.org/docUploads/States%5FInBrief%2Epdf
• Targets for reduction: At least four states have developed climate action plans that include enforceable greenhouse gas reduction targets. For instance, in 1998 New Jersey committed to reducing greenhouse gas emissions by 3.5% below 1990 levels by 2005. Additional information can be found at: http://www.pewclimate.org/docUploads/States%5FInBrief%2Epdf
• One-Tonne Challenge: A Canadian program that encourages citizens to reduce their individual greenhouse gas emissions by one tonne (approximately 20% for the average Canadian) by using energy and resources more efficiently. More information can be found here: http://www.climatechange.gc.ca/onetonne/english/about.asp
• U.S. EPA Partnerships: A multitude of partnering opportunities relating to energy efficiency, methane capture, and decreased high-GWP use exist with the EPA. A complete list of partnerships can be found at: http://www.epa.gov/partners/programs/.
MICHIGAN GREENHOUSE GAS INVENTORY 1990 AND 2002 REFERENCES
106
References
Introduction
1 National Research Council (2001) Climate Change Science: An Analysis of Some Key Questions. Washington, D.C., National Academy Press. Retrieved from http://yosemite.epa.gov/oar/globalwarming.nsf/UniqueKeyLookup/SHSU5BUTQ4/$File/nas_ccsci_01.pdf 2 U.S. Environmental Protection Agency (2004a) Inventory of U.S. Greenhouse Gas Emissions and Sinks: 1990 – 2002. U.S. EPA Office of Atmospheric Programs. Washington, DC. 3 IPCC (2001) Climate Change 2001: A Scientific Basis, Intergovernmental Panel on Climate Change, Organization for Economic Cooperation and Development, International Energy Agency. Houghton, et al. Cambridge University Press. Cambridge, U.K. Retrieved from: http://www.ipcc.ch/present/graphics/2001syr/large/05.16.jpg 4 IPCC (2001) 5 IPCC (2001) 6 Union of Concerned Scientists (2003) Confronting Climate Change in the Great Lakes Region. Retrieved from: http://www.ucsusa.org/greatlakes/pdf/confronting_climate_change_in_the_great_lakes.pdf 7 U.S. EPA (2004a) 8 UNFCC (2004) Kyoto Protocol. United Nations Framework Convention on Climate Change. Retrieved December 2004 from: http://unfccc.int/essential_background/kyoto_protocol/items/3145.php 9 U.S. EPA (2004) State Greenhouse Gas Inventories. Retrieved Jan. 2005 from http://yosemite.epa.gov/OAR/globalwarming.nsf/content/EmissionsStateGHGInventories.html 10 US EPA (2004) State Greenhouse Gas Inventories. Retrieved Jan. 2005 from http://yosemite.epa.gov/OAR/globalwarming.nsf/content/EmissionsStateGHGInventories.html 11 IPCC (1997) Revised 1996 IPCC Guidelines for National Greenhouse Gas Inventories: Reporting Instructions. Intergovernmental Panel on Climate Change, Organization for Economic Cooperation and Development, International Energy Agency.
MICHIGAN GREENHOUSE GAS INVENTORY 1990 AND 2002 REFERENCES
107
Methodology
12 U.S. EPA (2004b) Volume VIII: Estimating Greenhouse Gas Emissions. U.S. Environmental Protection Agency, State and Local Climate Change Program, Emission Inventory Improvement Program (EIIP). Washington, D.C. 13 U.S. EPA (2004b) 14 U.S. EPA, ICF Consulting (2004) State Greenhouse Gas Inventory Tool (8/3/2004 Version) [Computer software]. Washington, DC: U.S. EPA State and Local Climate Change Program 15 IPCC (2000) Good Practice Guidance and Uncertainty Management in National Greenhouse Gas Inventories. Intergovernmental Panel on Climate Change, National Greenhouse Gas Inventories Programme, Technical Support Unit, Kanagawa, Japan Energy
16 IPCC (2000) 17 U.S. EPA (2004b) 18 U.S. EPA (2004b) 19 U.S. EPA (2004b) 20 U.S. EPA (2004b) 21 U.S. EIA. Revised Historical Data. Retrieved June 2004 from http://www.eia.doe.gov/emeu/states/sep_fuel/notes/_fuelnotes_multistate.html#use_ 22 U.S. EIA (2003). Annual Coal Report 2002. Retrieved July 7, 2004 from http://tonto.eia.doe.gov/FTPROOT/coal/05842002.pdf 23 U.S. EIA (2004). Natural Gas Annual 2002, Retrieved June 23, 2004 from http://www.eia.doe.gov/pub/oil_gas/natural_gas/data_publications/natural_gas_annual/historical/2002/nga_2002.html 24 U.S. EPA (2004b) 25 U.S. EPA (2004b) 26 U.S. EIA (2004). Documentation for Emissions of Greenhouse Gases in the United States 2002. U.S. Energy Information Administration, Office of Integrated Analysis Forecasting, U.S. Department of Energy. Washington, D.C. 27 U.S. EPA (2004a) 28 U.S. EPA (2004a) 29 U.S. EPA (2004a) 30 U.S. EPA (2004a)
MICHIGAN GREENHOUSE GAS INVENTORY 1990 AND 2002 REFERENCES
108
31 Michigan Public Service Commission, Department of Consumer & Industrial Services (July 29, 2003). Natural Gas Price and Supply Update. Retrieved January 2005 from http://www.michigan.gov/mpsc/ 32 Michigan Public Service Commission, Department of Consumer & Industrial Services (July 29, 2003). Natural Gas Price and Supply Update. 33 Michigan Public Service Commission, Department of Consumer & Industrial Services (July 29, 2003). Natural Gas Price and Supply Update. 34 U.S. EIA. State Electricity Profiles 2002. Retrieved November 2004 from http://www.eia.doe.gov/cneaf/electricity/st_profiles/michigan.pdf 35 U.S. EPA (2004a) 36 U.S. EPA (2004a) 37 Hutchins, Julia (2004). Email communication with Julia Hutchins and others, U.S. Department of Energy, Energy Information Administration (May-Nov) 38 National Climatic Data Center. Climate at a Glance. Retrieved January 2005 from http://lwf.ncdc.noaa.gov/oa/climate/research/cag3/cag3.html 39 Michigan Public Service Commission, Department of Consumer & Industrial Services (July 29, 2003). Natural Gas Price and Supply Update. 40 U.S. EPA (2004a) 41 U.S. EPA (2004a) 42 U.S. EIA. Emissions of Greenhouse Gases in the United States 2002. Retrieved May 5, 2004 from http://www.eia.doe.gov/oiaf/1605/gg03rpt/index.html 43 Leckey, Thomas (2004) Email communication with Thomas Leckey, U.S. EIA (November) U.S. EIA. State Electricity Profiles 2002. Retrieved November 2004 from http://www.eia.doe.gov/cneaf/electricity/st_profiles/michigan.pdf 44 U.S. EPA (2004a) 45 U.S. EPA (2004a) 46 Kane, M. and Huxley, O. (2002). Northeast-Midwest Institute Manufacturing in the Northeast-Midwest (Oct 2002). Retrieved February 2005 from http://www.nemw.org/MfgStateFactSheet.pdf 47 U.S. EPA (2004a) 48 U.S. DOC, the Bureau of Economic Analysis, Retrieved January 2005 from http://www.bea.doc.gov/bea/regional/gsp/ 49 U.S. EPA (2004a)
MICHIGAN GREENHOUSE GAS INVENTORY 1990 AND 2002 REFERENCES
109
50 The Detroit News Business. 46,000 Michigan jobs headed overseas (June4, 2004). Retrieved Feb 16, 2004 from: http://www.detnews.com/2004/bisomess/0406/04/a01-173736.htm 51 U.S. EPA (2004a) 52 U.S. EPA (2004a) 53 U.S. EPA (2004a) 54 U.S. DOT. Highway Statistics Summary to 1995 and Highway Statistics 2002. Retrieved November 2004 from http://www.fhwa.dot.gov/policy/ohpi/hss/index.htm 55 U.S. DOT. Highway Statistics Summary to 1995 and Highway Statistics 2002. Retrieved November 2004 from http://www.fhwa.dot.gov/policy/ohpi/hss/index.htm 56 U.S. DOT. Highway Statistics Summary to 1995 and Highway Statistics 2002. Retrieved November 2004 from http://www.fhwa.dot.gov/policy/ohpi/hss/index.htm 57 The Road Information Program (TRIP). Retrieved January 2005 from http://www.tripnet.org/ 58 U.S. EPA (2004a) 59 Leckey, Thomas (2004). Email communication with Thomas Leckey, U.S. EIA (November). U.S. EIA. State Electricity Profiles 2002. Retrieved November 2004 from http://www.eia.doe.gov/cneaf/electricity/st_profiles/michigan.pdf 60 U.S. EPA (2004b) 61 U.S. EPA (2004b) 62 U.S. EPA (2004a) 63 U.S. EPA (2004b) 64 U.S. DOT. Highway Statistics Summary to 1995. Retrieved June 2004 from http://www.fhwa.dot.gov/policy/ohpi/hss/index.htm 65 U.S. DOT. Highway Statistics 2002. Retrieved June 2004 from http://www.fhwa.dot.gov/policy/ohpi/hss/index.htm 66 U.S. EIA, Fuel Oil and Kerosene. Retrieved from June 2004. http://www.eia.doe.gov/pub/oil_gas/petroleum/data_publications/fuel_oil_and_kerosene_sales/historical/2002/foks_2002.html 67 U.S. EPA (2004b) 68 U.S. EPA (2004b) 69 U.S. EPA (2004b) 70 U.S. EPA (2004b)
MICHIGAN GREENHOUSE GAS INVENTORY 1990 AND 2002 REFERENCES
110
71 U.S. EPA (2004b) 72 U.S. EPA (2004a) 73 U.S. EPA (2004b) 74 U.S. EPA (2004b) 75 U.S. EPA (2004a) 76 IPCC (1996) Climate Change 1995: The Science of Climate Change. Intergovernmental Panel on Climate Change; J.T. Houghton, L.G. Meria Filho, B.A. Callander, N. Harris, A. Keattenberg, and K. Maskell, eds.: Cambridge University Press. Cambridge, U.K. 77 U.S. EPA (2004b) 78 Oil and Gas Journal (2003) June 30, 2003. Vol. 101, Iss. 2, 57. 79 Oil & Gas Journal (1991) July 22, 1991. Vol. 89, Iss. 29, 54. 80 Zaja, Andrea (2004) Email communication with Andrea Zajac, Storage Tank Division Chief, Michigan Department of Environmental Quality, 20 July. 81U.S. EPA (2004a) 82 U.S. EPA (2004a)
83 U.S. EPA (2004a)
84 U.S. EPA (2004a)
85 U.S. EPA (2004b) 86 U.S. EPA (2004b) 87 U.S. EIA. Revised Historical Data. Retrieved June 2004 from http://www.eia.doe.gov/emeu/states/sep_fuel/notes/_fuelnotes_multistate.html#use_ 88 U.S. EPA (2004a) 89 U.S. EPA (2004b) 90 U.S. EIA. Annual Coal Report 2002. Retrieved July 7, 2004 from http://tonto.eia.doe.gov/FTPROOT/coal/05842002.pdf 91 U.S. EIA. Natural Gas Annual 2002, Retrieved June 23, 2004 from http://www.eia.doe.gov/pub/oil_gas/natural_gas/data_publications/natural_gas_annual/historical/2002/nga_2002.html 92 U.S. EPA (2004a) 93 U.S. EPA (2004a) 94 U.S. EPA (2004b)
MICHIGAN GREENHOUSE GAS INVENTORY 1990 AND 2002 REFERENCES
111
95 U.S. EPA (2004a) 96 U.S. EPA (2004a)
Industrial Processes
97 U.S. Geological Survey (USGS) (2002, 1990) Cement: Minerals Yearbook. USGS Minerals Information Service. Reston, VA. Retrieved April 3, 2004 from http://minerals.usgs.gov/minerals/pubs/commodity/cement/ 98 IPCC (2000) 99 USGS (2002, 1990) Lime: Minerals Yearbook. USGS Minerals Information Service. Reston, VA. Retrieved June 3, 2004 from http://minerals.usgs.gov/minerals/pubs/commodity/lime/ 100 U.S. EPA (2004b) 101 USGS (2002, 1990) Soda Ash: Minerals Yearbook. USGS Minerals Information Service. Reston, VA. Retrieved July 13, 2004 from http://minerals.usgs.gov/minerals/pubs/commodity/soda_ash/ 102 U.S. Department of Commerce (2000, 1996). Economic Census. Bureau of the Census. Retrieved July 19, 2004 from http://www.census.gov/econ/www/index.html. 103 RAND (2000) Katie D. Smythe, RAND Environmental Science and Policy Center, “Production and Distribution of SF6 by End-Use Application” November, 2000. 104 U.S. EPA (2003). SF6 Emissions Reduction Program for Electric Power Systems: 2002 Partnership Report. U.S. EPA Office of Air and Radiation. Washington, DC. Retrieved August 2, 2004 from http://www.epa.gov/highgwp/electricpower-sf6/pdf/2002-partnership-report.pdf 105 National Safety Council (2004). Nitric Acid Chemical Backgrounder. Retrieved July 6, 2004 from http://www.nsc.org/library/chemical/Nitric_A.htm Agriculture
106 MSU (2000) Michigan State University. Corn. Retried December 2004 from: http://www.geo.msu.edu/geo333/corn.html. (Referenced from United States Department of Agriculture National Agricultural Statistics Service.) 107 U.S. EPA (2004b) 108 National Agricultural Statistics Service (2004). Retrieved June 2004 from: http://www.usda.gov/nass/ 109 U.S. EPA (2004a) 110 U.S. EPA (2004b) 111 Michigan Agricultural Statistics Service (1994) Michigan Agriculture Statistics 1993-1994. Michigan Department of Agriculture.
MICHIGAN GREENHOUSE GAS INVENTORY 1990 AND 2002 REFERENCES
112
112 Michigan Agricultural Statistics Service (2003) Michigan Agriculture Statistics 2002-2003. Michigan Department of Agricutlure. 113 IPCC (2000) 114 U.S. EPA (2004b) 115 Michigan Agricultural Statistics Service (1994) 116 Michigan Agricultural Statistics Service (2003) Waste
117 US EPA (2004b) 118 Liptay, K. et al. (1998) “Use of Stable Isotopes to Determine Methane Oxidation in Landfill Cover Soils,” JGR Atmospheres, 103D, 8243 – 8250 pp. 119 U.S. EPA (2004b) 120 U.S. EPA (2004) Landfill Methane Outreach Program - Landfill Database Retrieved from http://www.epa.gov/lmop/proj/index.htm#1. 121 Spector, M. (1997) “Production and Decomposition of Nitrous Oxide During Biological Denitrification.” Unpublished, Lehigh University. Bethlehem, PA. Results and Conclusion
122 IPCC (1997) 123 U.S. Department of Commerce (2004) Gross State Product. Bureau of Economic Activity. Retrieved December 21, 2004 from http://www.bea.doc.gov/bea/regional/gsp/default.cfm. 124 Hutchins, Julia (2004) 125 U.S. EPA (2004a) 126 U.S. Census Bureau (2004). Population Estimates. Population Division. Retrieved December 21, 2004 from http://www.census.gov/popest/estimates.php 127 U.S. Census Bureau (2004). Population Estimates. Population Division. Retrieved December 21, 2004 from http://www.census.gov/popest/estimates.php 128 U.S. EPA (1992).Comparison of EPA State Inventory Summaries and State-Authored Inventories. Retrieved March 17, 2005 from http://yosemite.epa.gov/OAR/globalwarming.nsf/UniqueKeyLookup/JSIN5DTQKG/$File/pdfB-comparison1.pdf 129 U.S. EPA (1992). State GHG Inventories. Retrieved March 17, 2005 from http://yosemite.epa.gov/OAR/globalwarming.nsf/content/EmissionsStateGHGInventories.html 130 U.S. Department of Commerce (2004)

MICHIGAN GREENHOUSE GAS INVENTORY 1990 AND 2002 REFERENCES
113
131 Rabe, B. (2004) Statehouse And Greenhouse: The Emerging Politics Of American Climate Change Policy Brookings Institution Press.