Austria’sAnnual Greenhouse Gas Inventory 1990–2006 fileA USTRIA'S ANNUAL GREENHOUSE GAS...
43
Austria’s Annual Greenhouse Gas Inventory 1990–2006 Submission under Decision 280/2004/EC
Transcript of Austria’sAnnual Greenhouse Gas Inventory 1990–2006 fileA USTRIA'S ANNUAL GREENHOUSE GAS...
Austria’s Annual Greenhouse Gas Inventory
1990–2006
Submission under Decision 280/2004/EC
AUSTRIA'S ANNUAL GREENHOUSE GAS INVENTORY
1990–2006
Submission under Decision 280/2004/EC
REPORTREP-0127
Wien, 2008
Project manager Barbara Muik
Authors Michael Anderl Alexandra Freudenschuß Elisabeth Kampel Traute Köther Barbara Muik Stephan Poupa Barbara Schodl Peter Weiss
Editing Manfred Ritter
Layout and typesetting Elisabeth Riss
For further information about the publications of the Umweltbundesamt please go to: http://www.umweltbundesamt.at/
Imprint
Owner and Editor: Umweltbundesamt GmbH Spittelauer Lände 5, 1090 Vienna/Austria
Available only electronically on the following website: http://www.umweltbundesamt.at
© Umweltbundesamt GmbH, Vienna, 2008 All rights reserved ISBN 3-85457-926-8
Austria's Annual Greenhouse Gas Inventory 1990–2006 – Table of Contents
3
TABLE OF CONTENTS
VORWORT ..................................................................................................................... 5
1 INTRODUCTION........................................................................................................... 7
2 EMISSION TRENDS .................................................................................................... 8 2.1 Energy (IPCC Category 1) ........................................................................................... 10 2.2 Industrial Processes (IPCC Category 2) .................................................................... 11 2.3 Solvent and Other Product Use (IPCC Category 3) .................................................. 11 2.4 Agriculture (IPCC Category 4) .................................................................................... 12 2.5 LULUCF (IPCC Category 5) ......................................................................................... 12 2.6 Waste (IPCC Category 6) ............................................................................................. 12
3 METHOD OF REPORTING AND DATA BASIS ................................................... 13 3.1 Relation with data reported earlier ............................................................................. 13 3.2 Information on Completeness .................................................................................... 14 3.3 National Inventory System Austria (NISA) ................................................................ 15 3.4 Sources of data ............................................................................................................ 16 3.5 Recalculations.............................................................................................................. 17 3.5.1 Energy (IPCC Category 1) ............................................................................................. 17 3.5.2 Industrial Processes (IPCC Category 2) ........................................................................ 19 3.5.3 Solvent and other Product Use (IPCC Category 3) ....................................................... 20 3.5.4 Agriculture (IPCC Category 4) ....................................................................................... 20 3.5.5 LULUCF (IPCC Category 5) .......................................................................................... 20 3.5.6 Waste (IPCC Category 6) .............................................................................................. 20 3.6 Quality Assurance and Quality Control (QA/QC)...................................................... 21 3.7 Uncertainty Assessment ............................................................................................. 22 3.8 Comparison of the Sectoral Approach with the Reference Approach ................... 22 3.8.1 Explanation of differences.............................................................................................. 23 3.8.2 Quantification of differences .......................................................................................... 24
4 ADDITIONAL REPORTING UNDER ARTICLE 3 ................................................. 26 4.1 Article 3 (1) g ................................................................................................................ 26 4.2 Article 3 (1) h ................................................................................................................ 26 4.3 Article 3 (1) j.................................................................................................................. 26 4.4 Article 3 (1) k................................................................................................................. 26
ANNEX I: EMISSION TRENDS ............................................................................................. 27
ANNEX II: TIER 1 UNCERTAINTY ASSESSMENT .......................................................... 35
ANNEX III: INDICATORS ....................................................................................................... 37

Austria's Annual Greenhouse Gas Inventory 1990–2006 – Vorwort
5
VORWORT
Dieser Bericht
Der vorliegende Bericht präsentiert die neuesten Daten zu den Treibhausgas (THG)-emissionen in Österreich. Er folgt in Format und Inhalt den verbindlichen Anforderungen des THG-Über-wachungssystems 280/2004/EG1 der EU zur Umsetzung des Kyoto-Protokolls. Dieses System umfasst die jährliche Übermittlung von aktualisierten THG-Emissionsdaten mit 15. Jänner an die Europäische Kommission. Mit diesem Bericht wird der dafür notwendige Emissionsbericht in englischer Sprache im dafür geforderten CRF2-Berichtsformat wiedergegeben. Eine detaillierte Darstellung der Daten wird der Europäischen Kommission in digitaler Form übermittelt3.
Der THG-Trend
Die Gesamtmenge an Treibhausgasemissionen liegt im Jahr 2006 bei 91,1 Millionen Tonnen CO2 Äquivalente. Dies entspricht einer Verminderung um 2,2 Millionen oder 2,3 % gegenüber dem Vorjahr und einem Anstieg von 15,1 % gegenüber dem Kyoto-Basisjahr 1990.
Eine detaillierte Analyse des Trends und der treibenden Kräfte der Zeitreihe wird im Klimaschutz-bericht des Umweltbundesamts zu finden sein (voraussichtliche April 2008).
Rechtlicher Hintergrund
Diese Daten wurden entsprechend den Beschlüssen der Vertragstaatenkonferenzen des Rahmenübereinkommens der Vereinten Nationen über Klimaänderungen (UN Framework Convention on Climate Change – UNFCCC, BGBl. Nr. 414/1994) erhoben. Sie umfassen Emis-sionen und Senken bezüglich der direkten Treibhausgase CO2, CH4, N2O, HFC, PFC und SF6, sowie der indirekten Treibhausgase NOx, NMVOC, CO und SO2.
Die Erhebung der Daten berücksichtigt außerdem die Ergebnisse der jährlichen Überprüfung durch die UNFCCC im Rahmen der so genannten UNFCCC-Tiefenprüfung. Im Februar 2007 fand die letzte dieser Tiefenprüfungen der Österreichischen Treibhausgas-Inventur durch inter-nationale Fachexperten statt. Die Ergebnisse dieser Prüfung liegen vollständig vor und flossen bereits teilweise in das Inventurverbesserungsprogramm 2007 ein.
1 Entscheidung Nr. 280/2004/EG des Europäischen Parlaments und des Rates vom 11. Februar 2004 über ein System
zur Überwachung der Treibhausgasemissionen in der Gemeinschaft und zur Umsetzung des Kyoto-Protokolls. 2 Common Reporting Format der UNFCCC. 3 Der vorliegende Bericht beinhaltet die folgenden Elemente des THG-Überwachungssystems 280/2004/EG: Zusammen-
fassung des Nationalen Inventur-Berichtes im Sinne des Artikels 3 (1) f; Artikel 3 (1) i: methodische Verbesserungen („Recalculations“); Artikel 3 (1) j: Indikatoren; Artikel 3 (1) k: Informationen zu Änderungen des Nationalen Inventur-systems; Artikel 3 (1) g: Informationen des Registers; und Artikel 3 (1) h: Informationen über juristische Personen, die befugt sind, sich an den Mechanismen nach den Artikeln 6, 12 und 17 des Kyoto-Protokolls unter Beachtung der ein-schlägigen nationalen oder gemeinschaftlichen Bestimmungen zu beteiligen.
Austria's Annual Greenhouse Gas Inventory 1990–2006 – Vorwort
6
Das Umweltbundesamt bereitete sich auf die Anforderungen vor, die sich aus der Klimarah-menkonvention und vor allem aus dem Inkrafttreten des Kyoto-Protokolls am 16. Februar 2005 ergeben. Entsprechend Artikel 5.1 des Kyoto-Protokolls wurde ein Nationales System eingerich-tet, dessen Ziel es u. a. ist, die Qualität der Inventur sicherzustellen und kontinuierlich zu verbes-sern. Dazu wurde ein Gesamtkonzept für das Nationale Inventur System Austria (NISA) entwi-ckelt, das auf der Österreichischen Luftschadstoff-Inventur (OLI) als zentralem Kern aufbaut. Ein umfassendes Inventurverbesserungsprogramm und ein Qualitätsmanagementsystem ent-sprechend ISO 17020 sind integrierter Teil des NISA.
Der vorliegende Bericht wurde vom Umweltbundesamt auf Grundlage des Umweltkontrollgeset-zes BGBl. Nr. 152/1998 erstellt. Dem Umweltbundesamt wird in diesem Bundesgesetz in § 6 (2) Z.15 unter anderem die Aufgabe übertragen, fachliche Grundlagen zur Erfüllung des Rahmen-übereinkommens der Vereinten Nationen über Klimaänderungen zu erstellen. In § 6 (2) Z.20 werden die Entwicklung und Führung von Inventuren und Bilanzen zur Dokumentation des Zu-standes und der Entwicklung der Umwelt sowie der Umweltbelastungen und ihrer Ursachen aus-drücklich als besondere Aufgaben des Umweltbundesamtes genannt.
Dieser Aufgabe wird mit der Erstellung sowie der jährlichen Aktualisierung der Österreichischen Luftschadstoff-Inventur (OLI) gemäß den in den relevanten internationalen Übereinkommen vereinbarten Richtlinien vom Umweltbundesamt nachgekommen. Die OLI deckt sowohl Treib-hausgasemissionen, als auch Emissionen sonstiger Luftschadstoffe ab und ist damit u. a. die Datenbasis für die Erstellung des vorliegenden Berichts.
Datengrundlage
Das Umweltbundesamt führt jährlich eine Inventur des Ausstoßes von Luftschadstoffen durch, die als Grundlage für die Erfüllung der nationalen und internationalen Berichtspflichten herange-zogen wird. Diese Österreichische Luftschadstoff-Inventur (OLI) wird erforderlichenfalls auch für zurückliegende Jahre aktualisiert, um eine vergleichbare Zeitreihe zur Verfügung zu haben. Die in diesem Bericht dargestellten Emissionsdaten ersetzen somit die publizierten Daten vorherge-hender Berichte.
Der vorliegende Bericht hat folgende Datengrundlagen:
Inventur Datenstand Berichtsformat
OLI 2007 Dezember 2007 IPCC Common Reporting Format (CRF)
Austria's Annual Greenhouse Gas Inventory 1990–2006 – Introduction
7
1 INTRODUCTION
This report updates the Austrian greenhouse gas inventory data for the years up to 2006.
The greenhouse gas inventory is submitted to the European Commission by the Austrian Federal Government in fulfilment of Austria’s obligations under Article 3 of Decision 280/2004/EC (“Moni-toring Decision”; replacing Decision 389/1992/EEC amended by Decision 296/1999/EEC) con-cerning a mechanism for monitoring Community greenhouse gas emissions and for implement-ing the Kyoto Protocol. The purpose of this decision is to monitor all anthropogenic greenhouse gas emissions not controlled by the Montreal Protocol and to evaluate the progress towards meeting the greenhouse gas reduction commitments under the UNFCCC and the Kyoto Protocol.
According to the above mentioned decision and guidelines and the reporting requirements, which are the same as under the United Nations Framework Convention on Climate Change (UNFCCC), Member States are obliged to determine their anthropogenic emissions by sour-ces and removals by sinks in accordance with the methodologies accepted by the IPCC and agreed upon by the Conference of the Parties to the UNFCCC.
The greenhouse gas inventory has to be submitted to the Commission every year no later than 15 January. Furthermore, Member States have to submit by 15 January elements of their National Inventory Reports (NIR) relevant for preparation of the community inventory report (Article 3 (1) f). The elements of the so called ”Short-NIR” are further specified in Article 4 of the Implementing Provisions to 280/2004/EC (Commission Decision 2005/166/EC).
This report was prepared to fulfil the reporting obligations of Article 3 (1) f (”Short-NIR”) and of Article 3 (1) i-k (Information on recalculations, reporting on indicators and information on chan-ges of the national systems) of the Monitoring Decision. Since 2008 the reporting under Article 3 (1) g (information from the national registry) and 3 (1) h (information on legal entities authorised to participate in mechanisms of the Kyoto Protocol) has been obligatory and is included in this report.
Austria's Annual Greenhouse Gas Inventory 1990–2006 – Emission Trends
8
2 EMISSION TRENDS
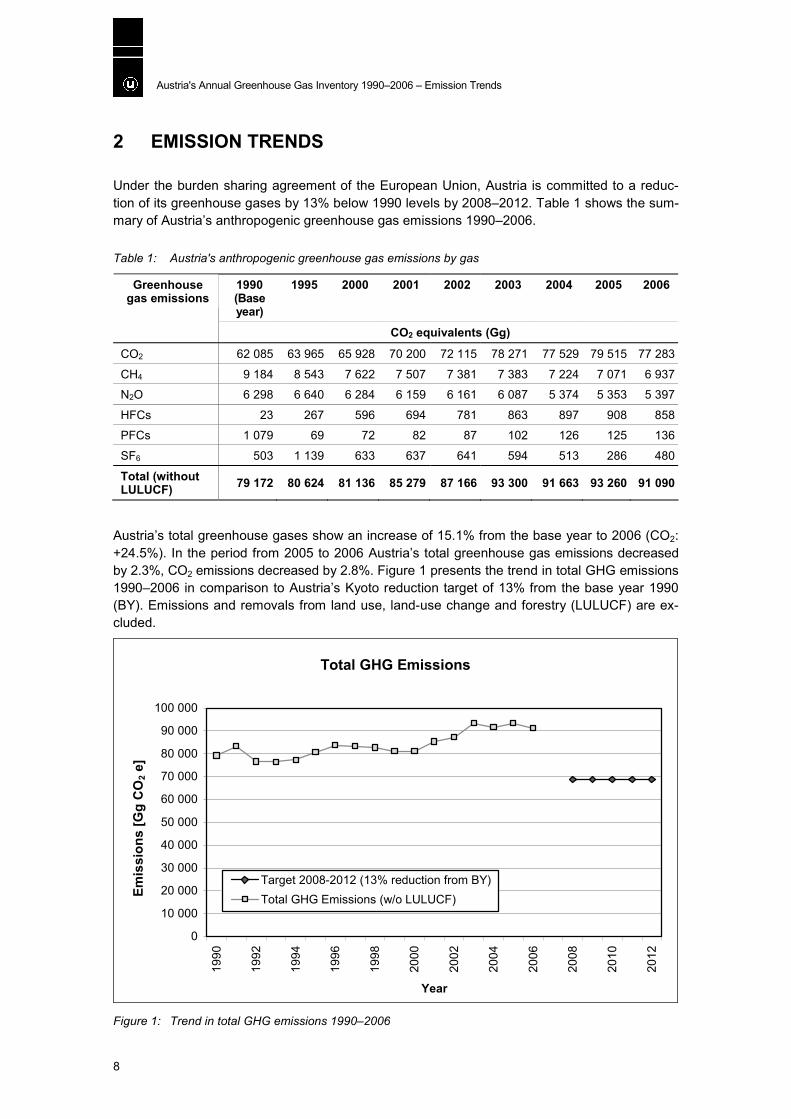
Under the burden sharing agreement of the European Union, Austria is committed to a reduc-tion of its greenhouse gases by 13% below 1990 levels by 2008–2012. Table 1 shows the sum-mary of Austria’s anthropogenic greenhouse gas emissions 1990–2006.
Table 1: Austria's anthropogenic greenhouse gas emissions by gas
1990 (Base year)
1995 2000 2001 2002 2003 2004 2005 2006 Greenhouse gas emissions
CO2 equivalents (Gg)
CO2 62 085 63 965 65 928 70 200 72 115 78 271 77 529 79 515 77 283
CH4 9 184 8 543 7 622 7 507 7 381 7 383 7 224 7 071 6 937
N2O 6 298 6 640 6 284 6 159 6 161 6 087 5 374 5 353 5 397
HFCs 23 267 596 694 781 863 897 908 858
PFCs 1 079 69 72 82 87 102 126 125 136
SF6 503 1 139 633 637 641 594 513 286 480
Total (without LULUCF) 79 172 80 624 81 136 85 279 87 166 93 300 91 663 93 260 91 090
Austria’s total greenhouse gases show an increase of 15.1% from the base year to 2006 (CO2: +24.5%). In the period from 2005 to 2006 Austria’s total greenhouse gas emissions decreased by 2.3%, CO2 emissions decreased by 2.8%. Figure 1 presents the trend in total GHG emissions 1990–2006 in comparison to Austria’s Kyoto reduction target of 13% from the base year 1990 (BY). Emissions and removals from land use, land-use change and forestry (LULUCF) are ex-cluded.
Total GHG Emissions
0
10 000
20 000
30 000
40 000
50 000
60 000
70 000
80 000
90 000
100 000
1990
1992
1994
1996
1998
2000
2002
2004
2006
2008
2010
2012
Year
Emis
sion
s [G
g C
O2
e]
Target 2008-2012 (13% reduction from BY)Total GHG Emissions (w/o LULUCF)
Figure 1: Trend in total GHG emissions 1990–2006
Emis
sion
s [G
g C
O2 e
]
Austria's Annual Greenhouse Gas Inventory 1990–2006 – Emission Trends
9
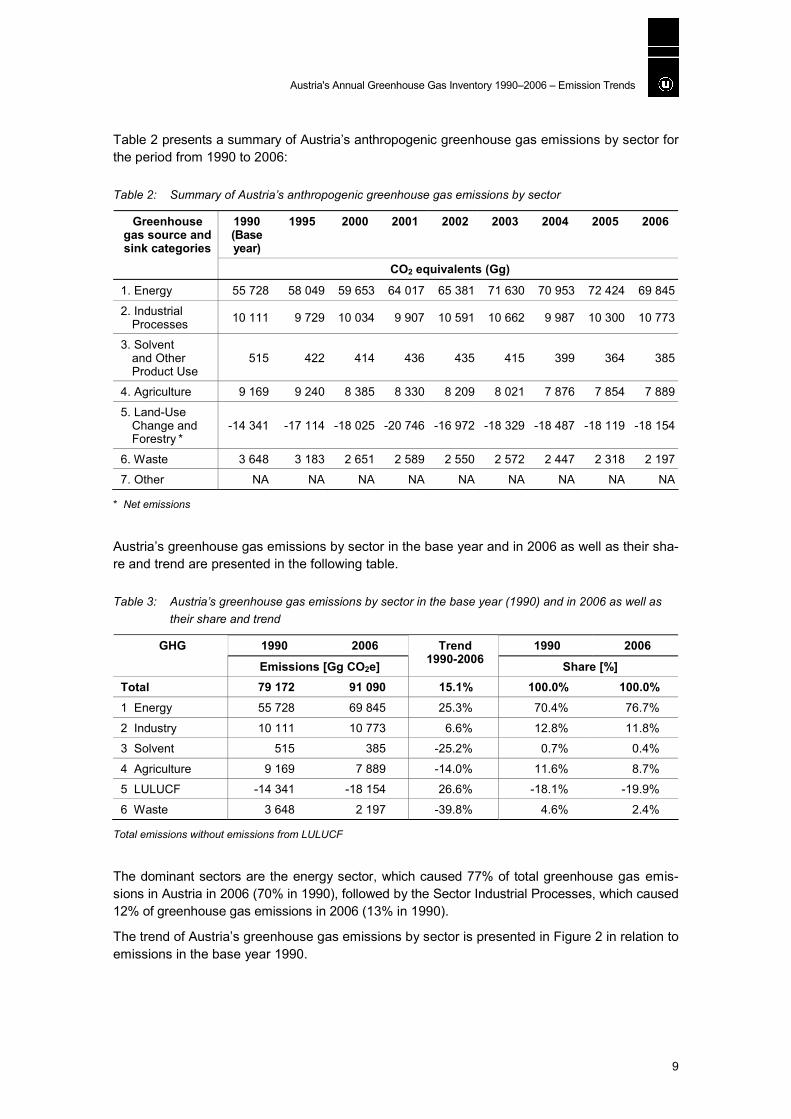
Table 2 presents a summary of Austria’s anthropogenic greenhouse gas emissions by sector for the period from 1990 to 2006:
Table 2: Summary of Austria’s anthropogenic greenhouse gas emissions by sector
1990 (Base year)
1995 2000 2001 2002 2003 2004 2005 2006 Greenhouse gas source and sink categories
CO2 equivalents (Gg)
1. Energy 55 728 58 049 59 653 64 017 65 381 71 630 70 953 72 424 69 845
2. Industrial Processes 10 111 9 729 10 034 9 907 10 591 10 662 9 987 10 300 10 773
3. Solvent and Other Product Use
515 422 414 436 435 415 399 364 385
4. Agriculture 9 169 9 240 8 385 8 330 8 209 8 021 7 876 7 854 7 889
5. Land-Use Change and Forestry *
-14 341 -17 114 -18 025 -20 746 -16 972 -18 329 -18 487 -18 119 -18 154
6. Waste 3 648 3 183 2 651 2 589 2 550 2 572 2 447 2 318 2 197
7. Other NA NA NA NA NA NA NA NA NA
* Net emissions
Austria’s greenhouse gas emissions by sector in the base year and in 2006 as well as their sha-re and trend are presented in the following table.
Table 3: Austria’s greenhouse gas emissions by sector in the base year (1990) and in 2006 as well as their share and trend
1990 2006 1990 2006 GHG
Emissions [Gg CO2e]
Trend 1990-2006 Share [%]
Total 79 172 91 090 15.1% 100.0% 100.0% 1 Energy 55 728 69 845 25.3% 70.4% 76.7%
2 Industry 10 111 10 773 6.6% 12.8% 11.8%
3 Solvent 515 385 -25.2% 0.7% 0.4%
4 Agriculture 9 169 7 889 -14.0% 11.6% 8.7%
5 LULUCF -14 341 -18 154 26.6% -18.1% -19.9%
6 Waste 3 648 2 197 -39.8% 4.6% 2.4%
Total emissions without emissions from LULUCF
The dominant sectors are the energy sector, which caused 77% of total greenhouse gas emis-sions in Austria in 2006 (70% in 1990), followed by the Sector Industrial Processes, which caused 12% of greenhouse gas emissions in 2006 (13% in 1990).
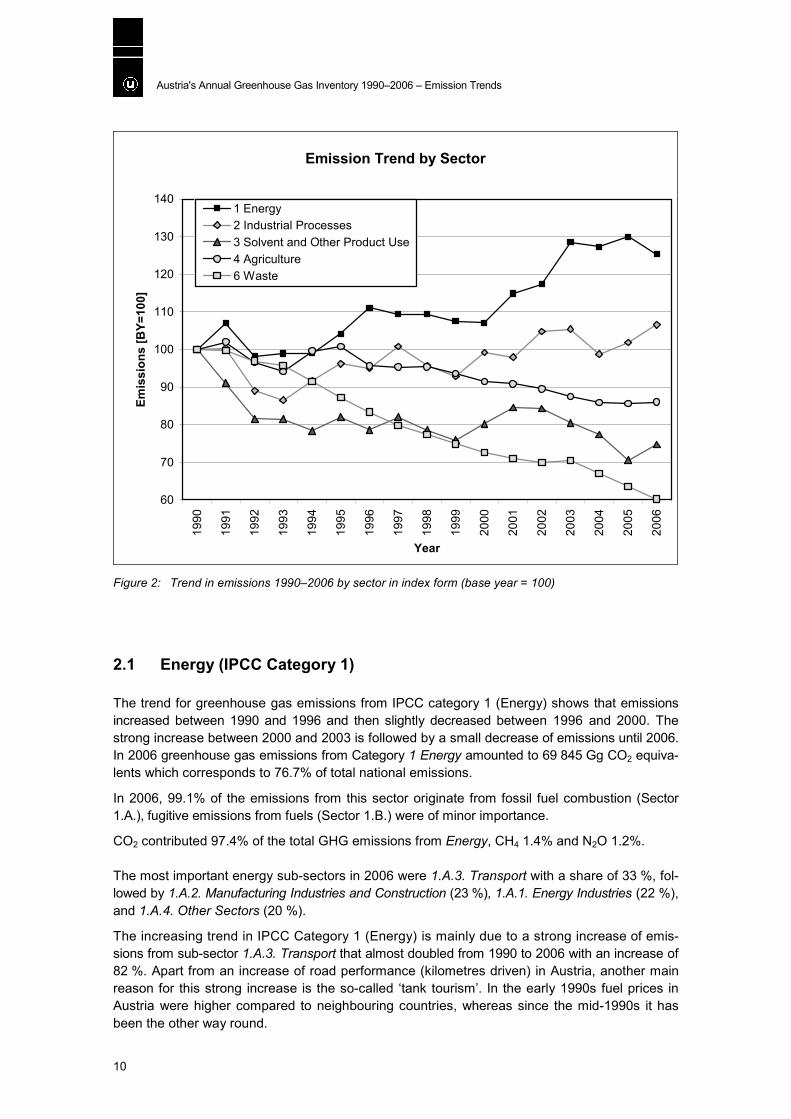
The trend of Austria’s greenhouse gas emissions by sector is presented in Figure 2 in relation to emissions in the base year 1990.
Austria's Annual Greenhouse Gas Inventory 1990–2006 – Emission Trends
10
Emission Trend by Sector
60
70
80
90
100
110
120
130
14019
90
1991
1992
1993
1994
1995
1996
1997
1998
1999
2000
2001
2002
2003
2004
2005
2006
Year
Emis
sion
s [B
Y=10
0]
1 Energy 2 Industrial Processes3 Solvent and Other Product Use4 Agriculture 6 Waste
Figure 2: Trend in emissions 1990–2006 by sector in index form (base year = 100)
2.1 Energy (IPCC Category 1)
The trend for greenhouse gas emissions from IPCC category 1 (Energy) shows that emissions increased between 1990 and 1996 and then slightly decreased between 1996 and 2000. The strong increase between 2000 and 2003 is followed by a small decrease of emissions until 2006. In 2006 greenhouse gas emissions from Category 1 Energy amounted to 69 845 Gg CO2 equiva-lents which corresponds to 76.7% of total national emissions.
In 2006, 99.1% of the emissions from this sector originate from fossil fuel combustion (Sector 1.A.), fugitive emissions from fuels (Sector 1.B.) were of minor importance.
CO2 contributed 97.4% of the total GHG emissions from Energy, CH4 1.4% and N2O 1.2%. The most important energy sub-sectors in 2006 were 1.A.3. Transport with a share of 33 %, fol-lowed by 1.A.2. Manufacturing Industries and Construction (23 %), 1.A.1. Energy Industries (22 %), and 1.A.4. Other Sectors (20 %).
The increasing trend in IPCC Category 1 (Energy) is mainly due to a strong increase of emis-sions from sub-sector 1.A.3. Transport that almost doubled from 1990 to 2006 with an increase of 82 %. Apart from an increase of road performance (kilometres driven) in Austria, another main reason for this strong increase is the so-called ‘tank tourism’. In the early 1990s fuel prices in Austria were higher compared to neighbouring countries, whereas since the mid-1990s it has been the other way round.
Austria's Annual Greenhouse Gas Inventory 1990–2006 – Emission Trends
11
Emissions from 1.A.2. Manufacturing Industries and Construction increased by 17% from 1990 to 2006, due to the increase in fuel consumption (increase of natural gas and fuel waste con-sumption, whereas consumption of liquid fossil fuels decreased). Between 2005 and 2006 emis-sions decreased slightly by 0.6 %.
Emissions from sub-sector 1.A.1. Energy Industries show an increase of 12 % from the base year to 2006. The main drivers for emissions from this sector are total electricity production (which increased about 23% from 1990 to 2006) and an increase in heat production, which tripled over this period due to an increase in the demand for district heating in the residential and commer-cial sector. Furthermore, the share of biomass used as a fuel in this sector and the contribution of hydro plants to total electricity production, which is generally about 72 % and varied from 65 % to 78 % in the period under observation (depending on the annual water situation), are important drivers. Also the climatic circumstances influence emissions from this sector: a cold winter leads to an increase of heat production.
The increase of heating, demand for hot water generation, climatic circumstances and the change of fuel mix are the most important drivers for emissions from 1.A.4. Other Sectors. E-missions in 2006 are 6 % lower than in the base year, and 4 % lower than in 2005.
2.2 Industrial Processes (IPCC Category 2)
Greenhouse gas emissions from the industrial processes sector fluctuated during the period 1990–2006 and show a minimum in 1993. In 2006 they were 6.6 % above the level of the base year. In 2006 greenhouse gas emissions from Category 2 Industrial Processes amounted to 10 773 Gg CO2 equivalents, which corresponds to 11.8% of total national emissions.
The main sources of greenhouse gas emissions in the industrial processes sector are Metal Production and Mineral Products, which caused 47 % and 31 % of the emissions from this sec-tor in 2006. The emission trend in this sector follows more or less production figures.
The most important GHG of the industry sector was carbon dioxide with 83.5 % of emissions from this category, followed by HFCs with 8.0 %, SF6 with 4.5 %, N2O with 2.6 %, PFCs with 1.3 % and finally CH4 with 0.2 %.
2.3 Solvent and Other Product Use (IPCC Category 3)
In 2006, 0.4% of total GHG emissions in Austria (385 Gg CO2 equivalents) originated from Sol-vent and Other Product Use. Greenhouse gas emissions in this sector decreased by 25.2 % from 1990 to 2006 due to decreasing solvent and N2O use.
57 % of these emissions were indirect CO2 emissions, 43 % were accounted for by N2O emissions.
Austria's Annual Greenhouse Gas Inventory 1990–2006 – Emission Trends
12
2.4 Agriculture (IPCC Category 4)
Greenhouse gas emissions from the agricultural sector fluctuated in the early 1990s, since 1995 they have shown a steady downward trend. In 2006 emissions from this category were 14 % be-low the base year level. The decrease is mainly due to decreasing livestock numbers. The fluc-tuations result from changes in mineral fertilizer sales data which were used as activity data for calculating N2O emissions from agricultural soils, an important sub-source.
Emissions from Agriculture amounted to 7 889 Gg CO2 equivalents in 2006, which corresponds to 8.7 % of total national emissions. In 2006 the most important sub-sector Enteric Fermentation contributed 41 % of total greenhouse gas emissions from the agricultural sector; the second larg-est sub-source Agricultural Soils has a share of 37 %.
In the Austrian GHG inventory Agriculture is the largest source for both N2O and CH4 emissions: in 2006 70 % of total N2O emissions and 59 % (195 Gg) of total CH4 emissions in Austria origi-nated from this sector. N2O emissions from Agriculture amounted to 12.2 Gg in 2006 (3 794 Gg CO2 equivalents), which corresponds to 48 % of the GHG emissions from this sector. The share of methane was 52 %.
2.5 LULUCF (IPCC Category 5)
The Category Land use, land-use change and forestry is a net sink in Austria. Net removals from this category amounted to 14 341 Gg CO2 equivalents in the base year, which corresponds to 18 % of national total GHG emissions (without LULUCF) compared to 20 % in the year 2006. The trend in net removals from LULUCF is plus 26.6 % over the observed period.
The main sink is subcategory 5.A. Forest Land with net removals of 19 729 Gg CO2 in 2006. Small CO2 and N2O emissions arise from the other subcategories, where total net emissions amounted to 1 575 Gg CO2 equivalents in 2006.
2.6 Waste (IPCC Category 6)
Greenhouse gas emissions from Category 6 Waste decreased steadily during the period 1990–2002, mainly as a result of waste management policies: the amount of landfilled waste has de-creased and methane recovery improved. The slight increase from 2002 to 2003 was followed by a decrease until 2006. The trend between 2002 and 2006 is influenced by the amount of deposited waste. In 2006 emissions from this category were 39.8 % below the base year level.
In 2006 the greenhouse gas emissions from the waste sector amounted to 2 197 Gg CO2 equiva-lents, which corresponds to 2.4% of total national emissions.
The main source of greenhouse gas emissions in the waste sector is solid waste disposal on land, which caused 80.1 % of the emissions from this sector in 2006; the second largest source is waste water handling with 14.6 %.
In 2006 the most important GHG of the Waste sector was CH4 with 83.5 % of emissions from this category, followed by N2O with 15.9 %, and CO2 with 0.6 %.
Austria's Annual Greenhouse Gas Inventory 1990–2006 – Method of Reporting and Data Basis
13
3 METHOD OF REPORTING AND DATA BASIS
The Austrian greenhouse gas inventory for the period 1990 to 2006 was compiled according to the recommendations for inventories set out in the UNFCCC reporting guidelines according to Decision 18/CP.8, the Common Reporting Format (CRF), Decision 13/CP.9, the new CRF for the Land Use Change and Forestry Sector, the IPCC 1996 Guidelines for National Greenhouse Gas Inventories, which specify the reporting obligations according to Articles 4 and 12 of the UNFCCC as well as the IPCC Good Practice Guidance and Uncertainty Management in National Greenhouse Gas Inventories.
Regulations under the UNFCCC and the Kyoto Protocol define the new standards for national emission inventories. These standards include more stringent requirements related to transpar-ency, consistency, comparability, completeness and accuracy of inventories. Each Party shall ha-ve in place a national system, no later than one year prior to the start of the first commitment pe-riod (2008–2012). This national system shall include all institutional, legal and procedural ar-rangements made within a Party for estimating anthropogenic emissions by sources and re-movals by sinks of all greenhouse gases not controlled by the Montreal Protocol, and for report-ing and archiving inventory information.
In Austria, emissions of greenhouse gases are estimated together with emissions of air pollut-ants in a database based on the CORINAIR (CORe INventory AIR)/SNAP (Selected Nomencla-ture for sources of Air Pollution) system. This nomenclature is designed to estimate not only e-missions of greenhouse gases but all kinds of air pollutants. To comply with the reporting obliga-tions under the UNFCCC, emissions are transformed according to the IPCC Guidelines into the UNFCCC Common Reporting Format.
The Austrian greenhouse gas inventory is subject to continuous improvement, resulting in recal-culations as outlined in Chapters 3.1 and 3.5. Issues identified in the inventory reviews by the UNFCCC are considered in the inventory improvement programme. The last in-depth review took place in February 2007.
Annex 1 to this report presents Austria's greenhouse gas inventory data (CO2 emissions, CO2 removals, CH4, N2O, HFC, PFC and SF6) in the format of the CRF Summary Table 10 (Emission Trends).
The complete tables of the Common Reporting Format, including in particular Sectoral Reports, Sectoral Background Tables and a Reference Approach for CO2 are submitted separately in di-gital form only (xml file and excel files).
The following table summarises the status of the present report:
Table 4: Status of the present report
Reporting Obligation Format Inventory Version
Mechanism for monitoring Community greenhouse gas emissions
Common Reporting Format (CRF)
OLI 2007 December 2007
3.1 Relation with data reported earlier
As a result of the continuous improvement of Austria’s GHG inventory, emissions of some sour-ces have been recalculated on the basis of updated data or revised methodologies, thus emission data for 1990 to 2005 which are submitted this year differ slightly from data reported previously.
Austria's Annual Greenhouse Gas Inventory 1990–2006 – Method of Reporting and Data Basis
14
The following table presents the recalculation difference with respect to last year’s submission for each gas (positive values indicate that this year’s estimate is higher).
Table 5: Recalculation difference of Austria’s greenhouse gas emissions compared to the previous submission
1990 (Base year) 2005
Recalculation Difference [%]
TOTAL 0.15% -0.02%
CO2 0.25% -0.17%
CH4 0.04% 0.20%
N2O -0.62% 1.86%
HFC, PFC, SF6 0.00% 0.24%
Emissions without LULUCF
CO2 emissions in all years were recalculated by including combustion related GHG emissions from the gas suppliers 'own usage' in the sectoral approach (1.A.1.c/natural gas). This is the main reason for the increase of reported CO2 emissions in 1990.
The main reason for the decrease of reported CO2 emissions in 2005 is correction of fuel con-sumption double counting in the sector 1.A.2.a Iron and Steel.
The main reason for the increase of reported methane emissions in 2005 is the update of activity data in the sector 6.A.1. Managed Waste Disposal on Land.
The main reason for the changes of reported N2O emissions is the update of N2O emission fac-tors in 1.A.3.b Road Transport. In 2005 the revision of N-content of crops in sector 4.D.1. Direct Soil Emissions leads to an additional increase of N2O emissions.
The main reason for the increase of reported emissions of fluorinated compounds is the update of potential emissions in several 2 F subcategories.
A description of these and other recalculations by sector is given in Chapter 3.5.
The UNFCCC review process of the last submission (NIR 2007) is just about to start. This is why no particular improvements in this submission can be identified in response to issues raised in the UNFCCC review of the last submission.
The figures presented in this report replace data reported earlier by Austria under the reporting framework of the UNFCCC, in particular data which had been included in the inventory chapter of the Fourth National Communication of the Austrian Federal Government (2006) and in Austria's 2006 and 2007 submissions to the UNFCCC (Austrian Greenhouse Gas Emissions 1990–2004 and 1990–2005).
3.2 Information on Completeness
Geographical coverage is complete. There is no part of the Austrian territory that has not been covered by the inventory.
Emissions from most sources specified in the CRF have been estimated. For information on sour-ces not estimated („NE”) and emissions included with sources other than those stipulated in the CRF („IE”) please refer to Table 9 Completeness of the CRF.

Austria's Annual Greenhouse Gas Inventory 1990–2006 – Method of Reporting and Data Basis
15
3.3 National Inventory System Austria (NISA)
A Party to the Kyoto Protocol must provide a description of its national system, reported in ac-cordance with the guidelines for the preparation of the information, as set down in Decision 15/CMP.1, part II (“Reporting of supplementary information under Article 7, paragraph 2”, D. Na-tional systems in accordance with Article 5, paragraph 1). This section provides a short sum-mary of the most important items; a detailed description of the NISA can be found in the Austrian Initial Report4, in Austria’s NIR 20075 and in the NISA Implementation Report6.
Austria has a centralized inventory system, with all the work related to inventory preparation be-ing carried out at the single national entity. The most important legal arrangement is the Aus-trian Environmental Control Act (Umweltkontrollgesetz7), which defines the main responsibility for inventory preparation and identifies the Umweltbundesamt as the one single national entity with overall responsibility for inventory preparation. The “Inspection body for GHG inventory“ within the Umweltbundesamt is responsible for the compilation of the greenhouse gas inventory.
As far as the process for collecting activity data, for selecting emission factors and methods, and for the development of emission estimates is concerned, specific responsibilities for the dif-ferent emission source/sink categories (“sector experts”) are defined within the inventory sys-tem, as well as for all activities related to the preparation of the inventory, including QA/QC, data management and reporting.
Sector experts collect activity data, emission factors and all relevant information needed for finally estimating emissions. The sector experts also have specific responsibilities regarding the choice of methods, data processing and archiving and for contracting studies, if needed. As part of the quality management system the head of the “Inspection body for GHG inventory“ approves the methodological choices. Sector experts are also responsible for performing Quality Control (QC) activities that are incorporated in the Quality Management System (QMS).
During the inventory preparation process, all data collected together with emission estimates are fed into a database, where data sources are well documented for future reconstruction of the inventory. The Austrian Inventory is based on the SNAP nomenclature and has to be trans-formed into the UNFCCC Common Reporting Format to comply with the reporting obligations under the UNFCCC. In addition to the actual emission data, the background tables of the CRF are filled in by the sector experts, and finally QA/QC procedures as defined in the inventory planning process are carried out before the data are submitted to the UNFCCC.
For inventory management reliable data management has been established to fulfil the data col-lecting and reporting requirements. This ensures the necessary documentation and archiving for future reconstruction of the inventory and consequently enables easy access to up-to-date and previously submitted data for the quantitative evaluation of recalculations.
As part of the QMS (Corrective and Preventive Actions) an efficient process is established to grant transparency when collecting and analyzing findings by UNFCCC review experts or any other issues concerning the quality of activity data, emission factors, methods and other rele-
4 BMLFUW (2006) Austria’s Initial Report under Article 7, paragraph 4, of the Kyoto Protocol, Federal Ministry of Agri-
culture and Forestry, Environment and Water Management, Vienna 5 UMWELTBUNDESAMT (2007) Austria’s National Inventory Report, Submission under the United Nations Framework Con-
vention on Climate Change, REP-0084; Umweltbundesamt, Vienna 6 UMWELTBUNDESAMT (2005) NISA National Inventory System Austria, Implementation Report, REP-0004; Umweltbun-
desamt, Vienna 7 „Umweltkontrollgesetz”; Federal Law Gazette 152/1998
Austria's Annual Greenhouse Gas Inventory 1990–2006 – Method of Reporting and Data Basis
16
vant technical elements of inventories. Any findings and discrepancies are documented; re-sponsibilities, resources and a time schedule are attributed to each of these in the improvement plan. Measures, which include possible recalculations, are taken by the sector experts.
Parts of the legal and institutional arrangements in place are relevant for data availability for the annual compilation of the GHG inventory. The main data sources used, as well as information on who did the actual calculations, are presented in the following chapter.
3.4 Sources of data
The national energy balance is the most important data basis for the Austrian Air Emissions In-ventory. The Austrian statistical office (Statistik Austria) is required by contract with the Federal Ministry of Agriculture, Forestry, Environment and Water Management and with the Federal Ministry of Economics and Labour to annually prepare the national energy balance. The compila-tion of several other relevant statistics is regulated by law; other data sources include reporting obligations under national and European regulations and reports of companies and associa-tions.
The following table presents the main data sources used for activity data as well as information on who did the actual calculations:
Table 6: Main data sources for activity data and emission values
Sector Data Sources for Activity Data Emission Calculation
Energy Energy Balance from Statistik Austria; EU-ETS; Steam boiler database;
Umweltbundesamt, plant operators
Industry National production statistics, import/export statistics; EU-ETS; direct information from industry or associations of industry;
Umweltbundesamt, plant operators
F-gases based on a study by: EcoEfficient Technologies, Vienna
Solvent Import/export statistics, production statistics, consumption statistics;
Umweltbundesamt
based on a study by: Forschungsinstitut für Energie und Umweltplanung, Wirtschaft und Marktanalysen GmbH and Institut für industrielle Ökologie8
Agriculture National Studies, national agricultural statistics obtained from Statistik Austria;
Umweltbundesamt
based on a study by: University of Natural Resources and Applied Life Sciences, Research Center Seibersdorf
LULUCF National forest inventory obtained from the Austrian Federal Office and Research Centre for Forest
Umweltbundesamt
Waste Database on landfills Umweltbundesamt
8 Research Institute for Energy and Environmental Planning, Economy and Market Analysis Ltd./Institute for Industrial
Ecology
Austria's Annual Greenhouse Gas Inventory 1990–2006 – Method of Reporting and Data Basis
17
The main sources for emission factors are: national studies for country specific emission factors plant-specific data reported by plant operators IPCC GPG Revised IPCC 1996 Guidelines EMEP/CORINAIR Guidebook.
A complete list of data sources for activity and emission data or emission factors used by sector can be found in the National Inventory Report 2008 to be published in spring 2008.
Table Summary 3 of the CRF (Summary Report for Methods and Emission Factors Used) pre-sents the methods applied and the origin of emission factors used in the present Austrian GHG inventory. The description of methodologies and data sources used for the Community’s key sources can be found in the separate file AT_AnnexI_ KS2008.xls. This file follows in structure and content the latest version provided by the Commission to the member states on November 20, 2007.
3.5 Recalculations
This chapter describes the changes made to the inventory since the last submission to the UNFCCC (April 2007). Further background information and a complete description of the 2007 inventory are given in Austria’s National Inventory Report 2008, which will be published in spring 2008.
3.5.1 Energy (IPCC Category 1)
Combustion Activities (1 A) Update of activity data:
Updates of activity data and NCVs follow the updates of the IEA compliant energy balance com-piled by the federal office for national statistics Statistik Austria.
Energy balance update and corrections: Correction of residual fuel oil NCVs from 1995 to 2005 (e.g. +2% in 1999, +1% in 2005). Correction of hard coal NCVs from 1999 to 2001 and from 2004 to 2005 (e.g -4.5% in 2000; -0.2% in 2005).
Correction of brown coal NCVs from 1999 to 2001 and for 2005 (e.g +0.2% in 1999; +3.9% in 2001).
Correction of petrol coke and 'other oil products' NCVs 1994 to 1996 (+0.2%).
Correction of NCVs affects fuel consumption calculation (conversion of tonnes or cubic metres to TJ) and therefore leads to changes in GHG emission calculations for the respective fuels and pe-riods as mentioned above.
Update of activity data (in 'tonnes' or 'cubic metres' per category) mainly affects the period 1999 to 2004. Transformation input has been revised to improve the compliance between transforma-tion input and electricity and heat production (more reliable efficiencies). National fossil fuel consumption and total CO2 emissions are not affected by this update but consumption and emis-sions have been shifted between categories 1.A.1 (public energy plants) and 1.A.2 (auto pro-ducer plants) and/or between final energy consumption and transformation input.
Austria's Annual Greenhouse Gas Inventory 1990–2006 – Method of Reporting and Data Basis
18
Improvement of Reference Approach
Naphtha, anthracite and sub-bituminous coal are now considered separate fuels/flows.
Improved methodology of ETS data input
Improved allocation of ETS reported fuels to IEA fuel definition. Fuel classification is more com-pliant with energy statistics definitions (e.g. coal reported as 'lignite' with an NCV > 20 GJ/t has been shifted to bituminous coal).
Changes in Allocation
Sinter magnesite plants 2002 to 2005 have been shifted from category 1.A.2.b Non Ferrous Me-tals to category 1.A.2.f. Other Industry.
1.A.3.b Transport – Road: Update of statistical energy data, particularly the biodiesel consump-
tion.
1.A.3.e Pipeline compressors: Update of 2004 natural gas consumption according to the up-dated national energy balance.
1.A.4. Mobile Sources: Update of statistical energy data for railways (coal, diesel, electricity) up to 2000.
Improvements of methodologies and emission factors:
1.A.1.c Other Energy Industries – natural gas: New information from E-Control clarified that 'natural gas distribution losses' in the Energy Balance also includes the natural gas suppliers’ 'own usage' of natural gas. Previously it was assumed that 'distribution losses' included statistical differences and therefore no emissions had been calculated from this quantity. The energy balance has been revised from 1990 on and 'own usage' has been shifted to the oil/gas extraction sector. The remaining quantity of distribution losses is now much lower and represents a more reliable quantity of real fugitive losses.
The sectoral approach considers now combustion related GHG emissions from the gas sup-pliers 'own usage'. This leads to higher consumption (1990: 2382 TJ) and GHG emissions (1990: + 132 Gg CO2) of category 1.A.1.c/natural gas.
1.A.2.a Iron and Steel: Updated natural gas activity data from 2004 to 2005 has been submitted by the integrated steel plants operator. The plant operator affirms that updated activity data is more consistent with reported CO2 emissions. This leads to up to -105 Gg less CO2 emissions for the respec-tive years due to the avoidance of fuel consumption 'double counting'.
1.A.2.f Cement Production: Update of 2003 to 2004 activity data and emissions according to a 'bottom up' approach (un-published national study).
1.A.3.b Road Transport: All emission factors for passenger cars, light goods vehicles and motorcycles have been up-dated. The source of the new emission factors is the EU project ARTEMIS. In ARTEMIS a new set of real world driving cycles was developed (CADC, Common ARTEMIS Driving Cy-cle; http://www.trl.co.uk/artemis/introduction.htm). This CADC results for most exhaust gas components in emission factors that are clearly different compared to the former ones (HBEFA; 2004, www.hbefa.net).
Austria's Annual Greenhouse Gas Inventory 1990–2006 – Method of Reporting and Data Basis
19
1.A.4.b Residential: Update of heating type split from 2001 onwards by means of 2004 household census data. This affects calculation of CH4 emissions from residential heating.
Fuel consumption of new biomass heating has been revised from the year 2000 onwards by means of new boiler sales statistics. This affects calculation of CH4 emissions from residen-tial biomass heating.
Fugitive Emissions (1 B) Update of activity data:
1.B.1.a Coal Mining: Activity data for 2005 was updated according to information from the Asso-ciation of Mining and Steel.
1.B.2.a Refining/Storage: Activity data for 2005 was updated according to data from the national energy balance
1.B.2.b Distribution: Length of Distribution Network for 2005 was updated according to updated data from E-Control.
3.5.2 Industrial Processes (IPCC Category 2)
Update of activity data:
2.A.7.a Bricks: Activity data for 2005 was updated.
2.B.1. Ammonia: Natural gas consumption was updated according to data from the national en-ergy balance.
2.C.1. Iron and Steel: Process-specific CO2 emissions from pig iron production for 2005 were recalculated as the underlying activity data used for the calculation (non-energy use of coke) was updated in the national energy balance.
2.C.2. Ferroalloys: Activity data for 2005 was updated.
2.F.3. Fire Extinguishers: the stocks of C4F10 and HFC 23 were updated. 2.F.4. Aerosols and 2.F.5 Solvents:
Potential emissions have been updated for the years 2003–2005 according to recalculations of the Austrian GDP in these years.
2.F.7. Semiconductor Manufacture: Potential emissions were updated for 2003 to 2005. 2.F.8. Electrical equipment: Potential emissions were updated for 2005.
Improvements of methodologies and emission factors:
2.F.2. Foam Blowing: HFC 245fa and HFC 365mfc emissions, previously reported as unspeci-fied mix of HFC, were excluded from the GHG Inventory totals, because they are not fluori-nated gases as defined in the CRF. They are now reported in CRF Table 9(b) as additional GHG.
Austria's Annual Greenhouse Gas Inventory 1990–2006 – Method of Reporting and Data Basis
20
3.5.3 Solvent and other Product Use (IPCC Category 3)
Update of activity data:
3.A, 3.B, 3.C and 3.D.5.: NMVOC emissions from solvent use have been updated using short-term economic data provided by Statistik Austria.
3.5.4 Agriculture (IPCC Category 4)
Improvements of methodologies and emission factors:
The revision of the share of dairy cattle held in loose (32%) and tied housing systems (68%) within the NH3 inventory resulted in slightly lower direct N2O emissions from animal manure ap-plied to soils and slightly higher indirect N2O emissions.
The new data on housing system distribution is based on the following study:
AMON, B., FRÖHLICH, M., WEIßENSTEINER, R, ZABLATNIK, B., AMON. T. (2007): Tierhaltung und Wirtschaftsdüngermanagement in Österreich. Endbericht Projekt Nr. 1441 Auftraggeber: Bundes-ministerium für Land- und Forstwirtschaft, Umwelt- und Wasserwirtschaft, Wien.
4.D.1. Direct Soil Emissions – Crop Residue: N contents of crops were revised, resulting in hig-her N2O emissions from 1990 onwards.
3.5.5 LULUCF (IPCC Category 5)
General improvements:
For all LUC categories the areas undergoing conversion are followed up and reported for 20 years. After these 20 years they are accounted for in the remaining categories. Consequently, the whole time series on activity data (consistent area table for land use and land use changes) has been revised.
Update of activity data:
5.B. Cropland: For the area of perennial cropland national data sources from Statistik Austria since 1960 are used. For annual cropland a national emission factor for C-stock in biomass was calculated which replaces the IPCC default value.
5.C. Grassland: For grassland national emission factors for C-stock in biomass ( ∆C growth) and below ground biomass were calculated which replace the IPCC default values.
3.5.6 Waste (IPCC Category 6)
Update of activity data
6.A.1. Managed waste disposal on land: Activity data (1998 to 2005) has been updated. According to the Austrian Landfill Ordinance, the operators of landfill sites have to report their activity data annually. Based on reports re-ceived after the due date and updates, the amount of deposited waste changed slightly (<10 %) compared to the previous submission.
Austria's Annual Greenhouse Gas Inventory 1990–2006 – Method of Reporting and Data Basis
21
According to the recommendation of the ERT, the double counting of deposited waste due to the clean-up of former waste deposits was corrected and resulted in lower amounts of de-posited waste in 2002 and 2003.
6.B. Waste Water Handling: The interpolation of the connection rate was corrected and affected N2O emissions over the whole time series.
6.D. Other: Sewage sludge is no longer considered a separate waste fraction for composting as it can be assumed that it is already accounted for in the waste fraction undergoing mechanical-biological treatment. Emissions from mechanical-biological treatment are considered in this source category.
Activity Data for mechanical-biological treatment have been updated for the years 2003-2005, as new data were available.
Activity Data for separately collected bio-waste were updated from 2001-2005, because new data from the waste Management Concepts and Plans of the nine Federal Provinces (Bun-desländer) were available.
Improvements of methodologies and emission factors:
6.A.1. Managed waste disposal on land: The DOC values for residual waste were updated for the years 2000-2005.
6.B. Waste Water Handling: A new value for the denitrification rate was available so the 2005 value was updated (interpolation between 2004 and 2006) accordingly.
3.6 Quality Assurance and Quality Control (QA/QC)
A quality management system (QMS) has been designed to achieve to the objectives of good practice guidance, namely to improve transparency, consistency, comparability, completeness and confidence in national inventories of emissions estimates. The QMS is based on the Inter-national Standard ISO 17020 General Criteria for the operation of various types of bodies per-forming inspections. The QMS ensures that all requirements of a type A inspection body as stipulated in ISO 17020 are met, which include strict independence, impartiality and integrity. Since December 2005 the Umweltbundesamt has been accredited as inspection body (Id.No.241) in accordance with the Austrian Accreditation Law.
The implementation of QA/QC procedures as required by the IPCC-GPG support the develop-ment of national greenhouse gas inventories that can be readily assessed in terms of quality and completeness. The QMS as implemented in the Austrian inventory includes all elements of the QA/QC system outlined in IPCC-GPG Chapter 8 ”Quality Assurance and Quality Control”, and goes beyond. It also comprises supporting and management processes in addition to the QA/QC procedures in inventory compilation and thus ensures agreed standards not only within (i) the inventory compilation process and (ii) supporting processes (e.g. archiving), but also for (iii) management processes (e.g. annual management reviews, internal audits, regular training of personnel, error prevention).
The Austrian Quality Management System is described in detail in Austria’s NIR 20075.
Austria's Annual Greenhouse Gas Inventory 1990–2006 – Method of Reporting and Data Basis
22
3.7 Uncertainty Assessment
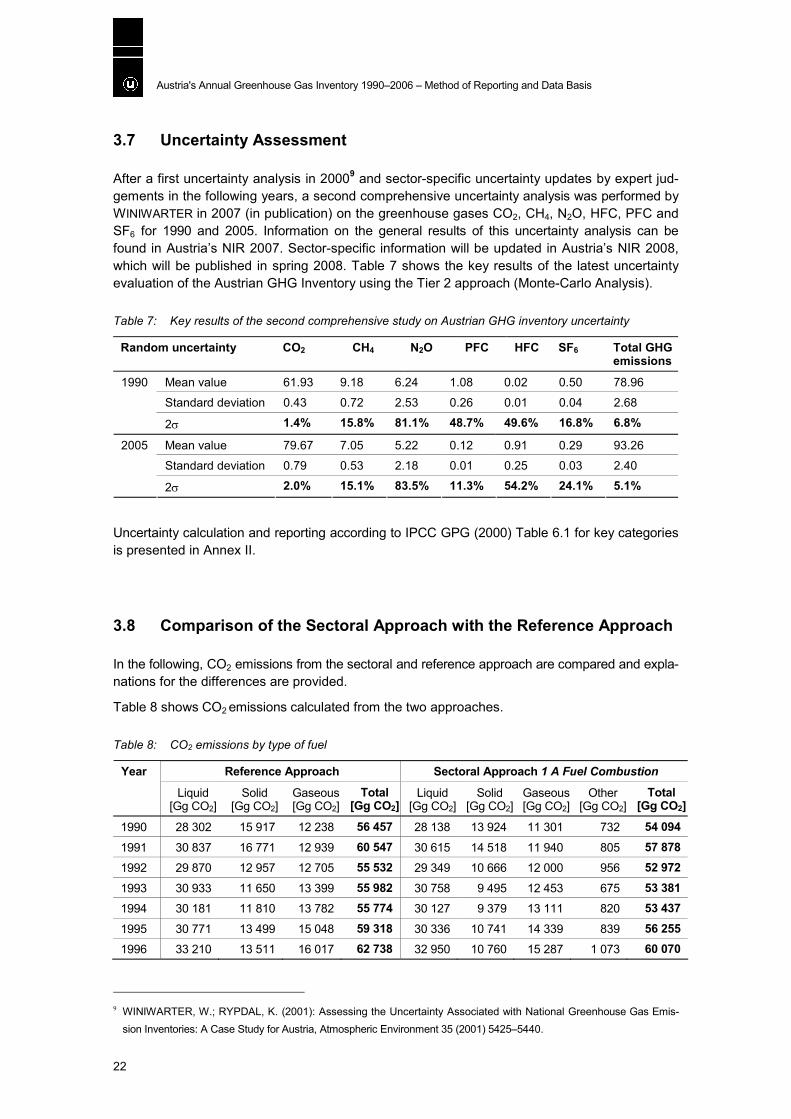
After a first uncertainty analysis in 20009 and sector-specific uncertainty updates by expert jud-gements in the following years, a second comprehensive uncertainty analysis was performed by WINIWARTER in 2007 (in publication) on the greenhouse gases CO2, CH4, N2O, HFC, PFC and SF6 for 1990 and 2005. Information on the general results of this uncertainty analysis can be found in Austria’s NIR 2007. Sector-specific information will be updated in Austria’s NIR 2008, which will be published in spring 2008. Table 7 shows the key results of the latest uncertainty evaluation of the Austrian GHG Inventory using the Tier 2 approach (Monte-Carlo Analysis).
Table 7: Key results of the second comprehensive study on Austrian GHG inventory uncertainty
Random uncertainty CO2 CH4 N2O PFC HFC SF6 Total GHG emissions
Mean value 61.93 9.18 6.24 1.08 0.02 0.50 78.96
Standard deviation 0.43 0.72 2.53 0.26 0.01 0.04 2.68
1990
2σ 1.4% 15.8% 81.1% 48.7% 49.6% 16.8% 6.8%
Mean value 79.67 7.05 5.22 0.12 0.91 0.29 93.26
Standard deviation 0.79 0.53 2.18 0.01 0.25 0.03 2.40
2005
2σ 2.0% 15.1% 83.5% 11.3% 54.2% 24.1% 5.1%
Uncertainty calculation and reporting according to IPCC GPG (2000) Table 6.1 for key categories is presented in Annex II.
3.8 Comparison of the Sectoral Approach with the Reference Approach
In the following, CO2 emissions from the sectoral and reference approach are compared and expla-nations for the differences are provided.
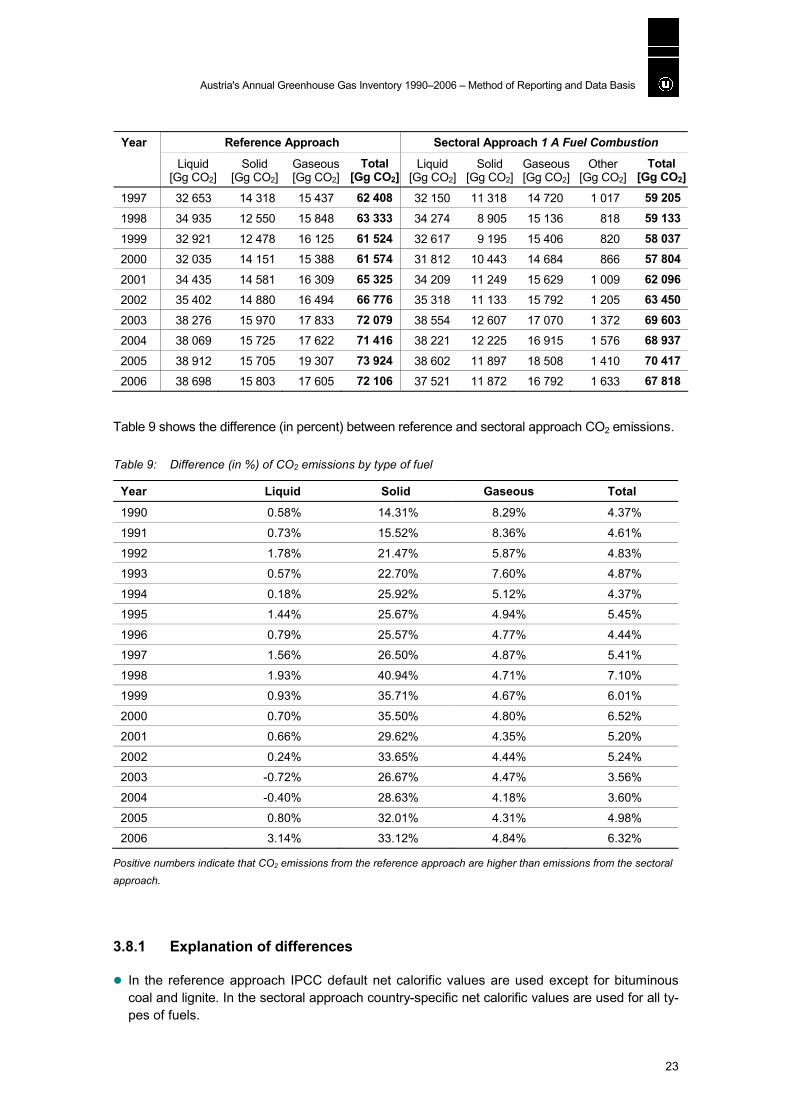
Table 8 shows CO2 emissions calculated from the two approaches.
Table 8: CO2 emissions by type of fuel
Reference Approach Sectoral Approach 1 A Fuel Combustion Year
Liquid [Gg CO2]
Solid [Gg CO2]
Gaseous [Gg CO2]
Total [Gg CO2]
Liquid [Gg CO2]
Solid[Gg CO2]
Gaseous [Gg CO2]
Other [Gg CO2]
Total [Gg CO2]
1990 28 302 15 917 12 238 56 457 28 138 13 924 11 301 732 54 094
1991 30 837 16 771 12 939 60 547 30 615 14 518 11 940 805 57 878 1992 29 870 12 957 12 705 55 532 29 349 10 666 12 000 956 52 972
1993 30 933 11 650 13 399 55 982 30 758 9 495 12 453 675 53 381 1994 30 181 11 810 13 782 55 774 30 127 9 379 13 111 820 53 437
1995 30 771 13 499 15 048 59 318 30 336 10 741 14 339 839 56 255 1996 33 210 13 511 16 017 62 738 32 950 10 760 15 287 1 073 60 070
9 WINIWARTER, W.; RYPDAL, K. (2001): Assessing the Uncertainty Associated with National Greenhouse Gas Emis-
sion Inventories: A Case Study for Austria, Atmospheric Environment 35 (2001) 5425–5440.
Austria's Annual Greenhouse Gas Inventory 1990–2006 – Method of Reporting and Data Basis
23
Reference Approach Sectoral Approach 1 A Fuel Combustion Year
Liquid [Gg CO2]
Solid [Gg CO2]
Gaseous [Gg CO2]
Total [Gg CO2]
Liquid [Gg CO2]
Solid[Gg CO2]
Gaseous [Gg CO2]
Other [Gg CO2]
Total [Gg CO2]
1997 32 653 14 318 15 437 62 408 32 150 11 318 14 720 1 017 59 205
1998 34 935 12 550 15 848 63 333 34 274 8 905 15 136 818 59 133
1999 32 921 12 478 16 125 61 524 32 617 9 195 15 406 820 58 037 2000 32 035 14 151 15 388 61 574 31 812 10 443 14 684 866 57 804
2001 34 435 14 581 16 309 65 325 34 209 11 249 15 629 1 009 62 096 2002 35 402 14 880 16 494 66 776 35 318 11 133 15 792 1 205 63 450
2003 38 276 15 970 17 833 72 079 38 554 12 607 17 070 1 372 69 603 2004 38 069 15 725 17 622 71 416 38 221 12 225 16 915 1 576 68 937
2005 38 912 15 705 19 307 73 924 38 602 11 897 18 508 1 410 70 417 2006 38 698 15 803 17 605 72 106 37 521 11 872 16 792 1 633 67 818
Table 9 shows the difference (in percent) between reference and sectoral approach CO2 emissions.
Table 9: Difference (in %) of CO2 emissions by type of fuel
Year Liquid Solid Gaseous Total
1990 0.58% 14.31% 8.29% 4.37%
1991 0.73% 15.52% 8.36% 4.61%
1992 1.78% 21.47% 5.87% 4.83%
1993 0.57% 22.70% 7.60% 4.87%
1994 0.18% 25.92% 5.12% 4.37%
1995 1.44% 25.67% 4.94% 5.45%
1996 0.79% 25.57% 4.77% 4.44%
1997 1.56% 26.50% 4.87% 5.41%
1998 1.93% 40.94% 4.71% 7.10%
1999 0.93% 35.71% 4.67% 6.01%
2000 0.70% 35.50% 4.80% 6.52%
2001 0.66% 29.62% 4.35% 5.20%
2002 0.24% 33.65% 4.44% 5.24%
2003 -0.72% 26.67% 4.47% 3.56%
2004 -0.40% 28.63% 4.18% 3.60%
2005 0.80% 32.01% 4.31% 4.98%
2006 3.14% 33.12% 4.84% 6.32%
Positive numbers indicate that CO2 emissions from the reference approach are higher than emissions from the sectoral approach.
3.8.1 Explanation of differences
In the reference approach IPCC default net calorific values are used except for bituminous coal and lignite. In the sectoral approach country-specific net calorific values are used for all ty-pes of fuels.
Austria's Annual Greenhouse Gas Inventory 1990–2006 – Method of Reporting and Data Basis
24
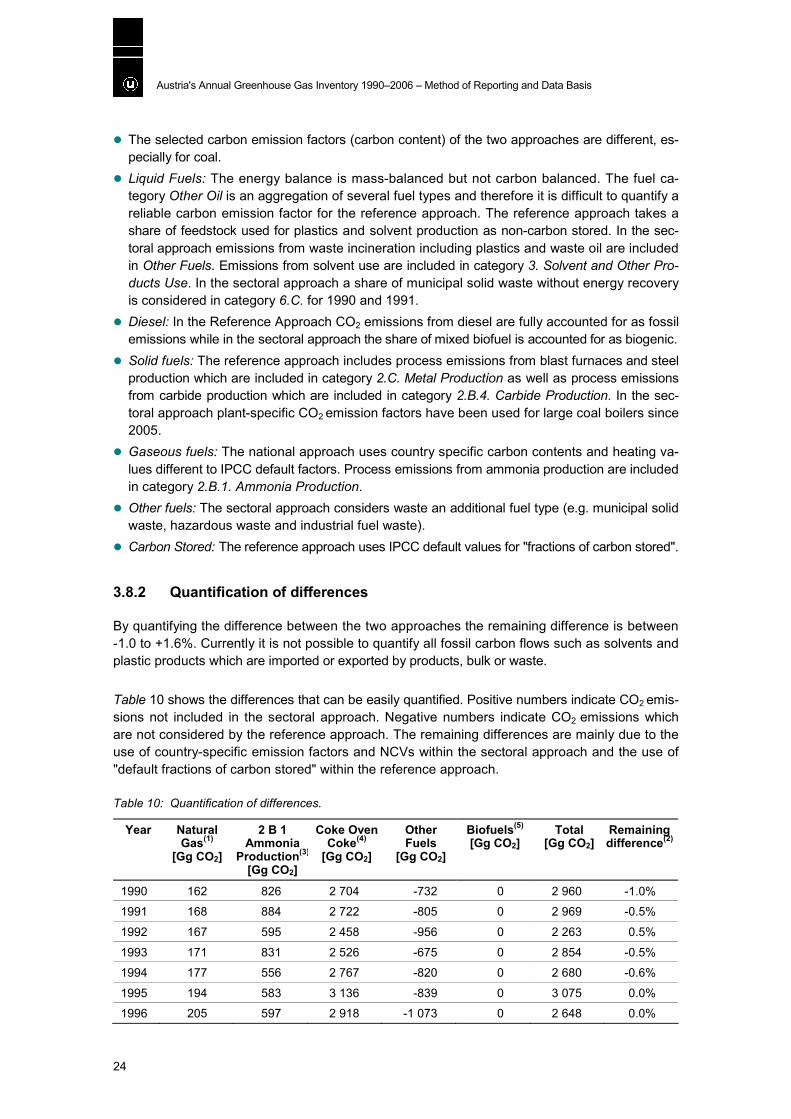
The selected carbon emission factors (carbon content) of the two approaches are different, es-pecially for coal.
Liquid Fuels: The energy balance is mass-balanced but not carbon balanced. The fuel ca-tegory Other Oil is an aggregation of several fuel types and therefore it is difficult to quantify a reliable carbon emission factor for the reference approach. The reference approach takes a share of feedstock used for plastics and solvent production as non-carbon stored. In the sec-toral approach emissions from waste incineration including plastics and waste oil are included in Other Fuels. Emissions from solvent use are included in category 3. Solvent and Other Pro-ducts Use. In the sectoral approach a share of municipal solid waste without energy recovery is considered in category 6.C. for 1990 and 1991.
Diesel: In the Reference Approach CO2 emissions from diesel are fully accounted for as fossil emissions while in the sectoral approach the share of mixed biofuel is accounted for as biogenic.
Solid fuels: The reference approach includes process emissions from blast furnaces and steel production which are included in category 2.C. Metal Production as well as process emissions from carbide production which are included in category 2.B.4. Carbide Production. In the sec-toral approach plant-specific CO2 emission factors have been used for large coal boilers since 2005.
Gaseous fuels: The national approach uses country specific carbon contents and heating va-lues different to IPCC default factors. Process emissions from ammonia production are included in category 2.B.1. Ammonia Production.
Other fuels: The sectoral approach considers waste an additional fuel type (e.g. municipal solid waste, hazardous waste and industrial fuel waste).
Carbon Stored: The reference approach uses IPCC default values for "fractions of carbon stored".
3.8.2 Quantification of differences
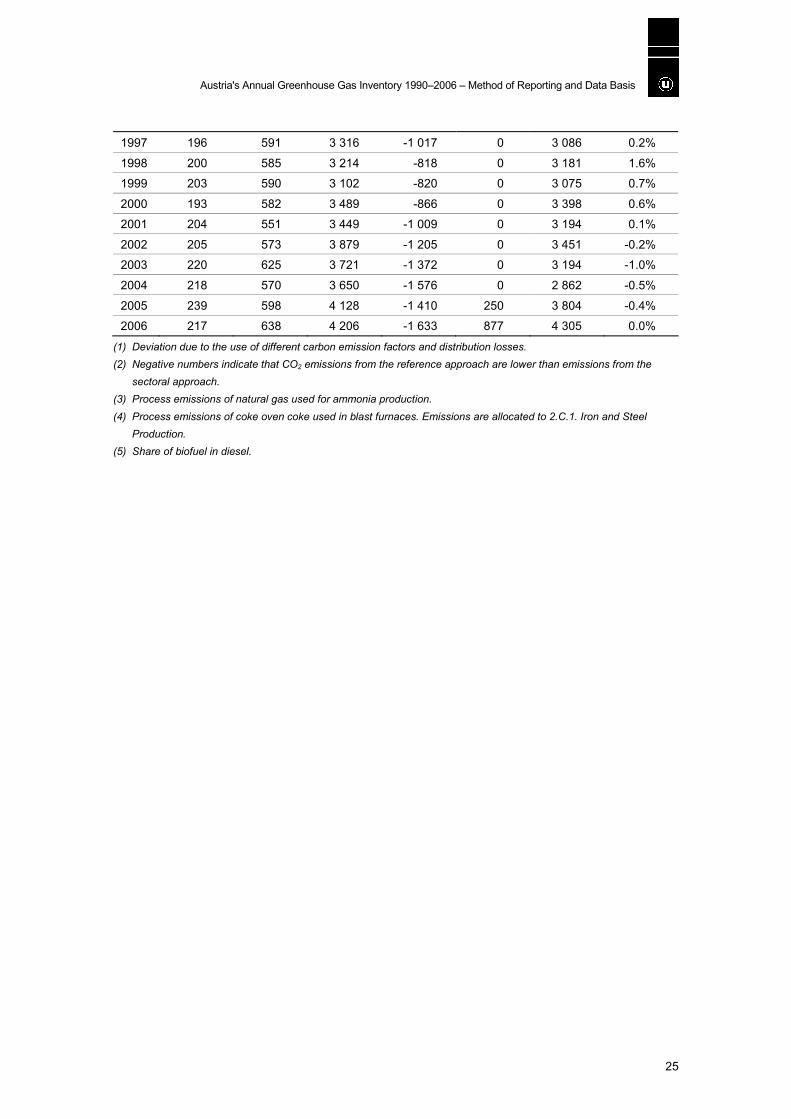
By quantifying the difference between the two approaches the remaining difference is between -1.0 to +1.6%. Currently it is not possible to quantify all fossil carbon flows such as solvents and plastic products which are imported or exported by products, bulk or waste. Table 10 shows the differences that can be easily quantified. Positive numbers indicate CO2 emis-sions not included in the sectoral approach. Negative numbers indicate CO2 emissions which are not considered by the reference approach. The remaining differences are mainly due to the use of country-specific emission factors and NCVs within the sectoral approach and the use of "default fractions of carbon stored" within the reference approach.
Table 10: Quantification of differences.
Year Natural Gas(1)
[Gg CO2]
2 B 1 Ammonia
Production(3)
[Gg CO2]
Coke Oven Coke(4)
[Gg CO2]
Other Fuels
[Gg CO2]
Biofuels(5)
[Gg CO2] Total
[Gg CO2] Remaining difference(2)
1990 162 826 2 704 -732 0 2 960 -1.0%
1991 168 884 2 722 -805 0 2 969 -0.5%
1992 167 595 2 458 -956 0 2 263 0.5%
1993 171 831 2 526 -675 0 2 854 -0.5%
1994 177 556 2 767 -820 0 2 680 -0.6%
1995 194 583 3 136 -839 0 3 075 0.0%
1996 205 597 2 918 -1 073 0 2 648 0.0%
Austria's Annual Greenhouse Gas Inventory 1990–2006 – Method of Reporting and Data Basis
25
1997 196 591 3 316 -1 017 0 3 086 0.2%
1998 200 585 3 214 -818 0 3 181 1.6%
1999 203 590 3 102 -820 0 3 075 0.7%
2000 193 582 3 489 -866 0 3 398 0.6%
2001 204 551 3 449 -1 009 0 3 194 0.1%
2002 205 573 3 879 -1 205 0 3 451 -0.2%
2003 220 625 3 721 -1 372 0 3 194 -1.0%
2004 218 570 3 650 -1 576 0 2 862 -0.5%
2005 239 598 4 128 -1 410 250 3 804 -0.4%
2006 217 638 4 206 -1 633 877 4 305 0.0%
(1) Deviation due to the use of different carbon emission factors and distribution losses. (2) Negative numbers indicate that CO2 emissions from the reference approach are lower than emissions from the
sectoral approach. (3) Process emissions of natural gas used for ammonia production. (4) Process emissions of coke oven coke used in blast furnaces. Emissions are allocated to 2.C.1. Iron and Steel
Production. (5) Share of biofuel in diesel.
Austria's Annual Greenhouse Gas Inventory 1990–2006 – Additional reporting under Article 3 of Decision 280/2004/EC
26
4 ADDITIONAL REPORTING UNDER ARTICLE 3 OF DECISION 280/2004/EC
4.1 Article 3 (1) g
Not applicable because no AAUs, RMUs, ERUs or CERs have been issued or transferred to the Austrian registry.
4.2 Article 3 (1) h
Austria has authorised Kommunalkredit Public Consulting GmbH (Türkenstraße 9, 1092 Vienna) to participate in the mechanisms according to Article 6 and 12 of the Kyoto Protocol.
4.3 Article 3 (1) j
Indicators pursuant to Article 3 (1) j of the Monitoring Decision are reported in Annex III. Emis-sion data are consistent with the CRF; denominators are taken from official Austrian statistics.
4.4 Article 3 (1) k
The national inventory system is unchanged compared to the description given in chapter 3.3 and in the Austrian Initial Report under the Kyoto Protocol10.
10 http://unfccc.int/files/national_reports/initial_reports_under_the_kyoto_protocol/application/pdf/at-initial-
report-200611-corr.pdf
Austria's Annual Greenhouse Gas Inventory 1990–2006 – Annex I: Emission Trends
27
ANNEX I: EMISSION TRENDS
This Annex presents emission trends for CO2, CH4, N2O and FCs.
This report uses the following UNFCCC notation keys for all tables: NE (not estimated): ..............for existing emissions by sources and removals by sinks of
greenhouse gases which have not been estimated.
IE (included elsewhere): .......for emissions by sources and removals by sinks of greenhouse ga-ses estimated but included elsewhere in the inventory instead of the expected source/sink category.
NO (not occurring): ...............for emissions by sources and removals by sinks of greenhouse ga-ses that do not occur for a particular gas or source/sink category.
NA (not applicable):..............for activities in a given source/sink category that do not result in emissions or removals of a specific gas.
C (confidential): ....................for emissions which could lead to the disclosure of confidential information if reported at the most disaggregated level. In this case a minimum of aggregation is required to protect business informa-tion.
Austria's A
nnual Greenhouse G
as Inventory 1990–2006 – Annex I: E
mission Trends
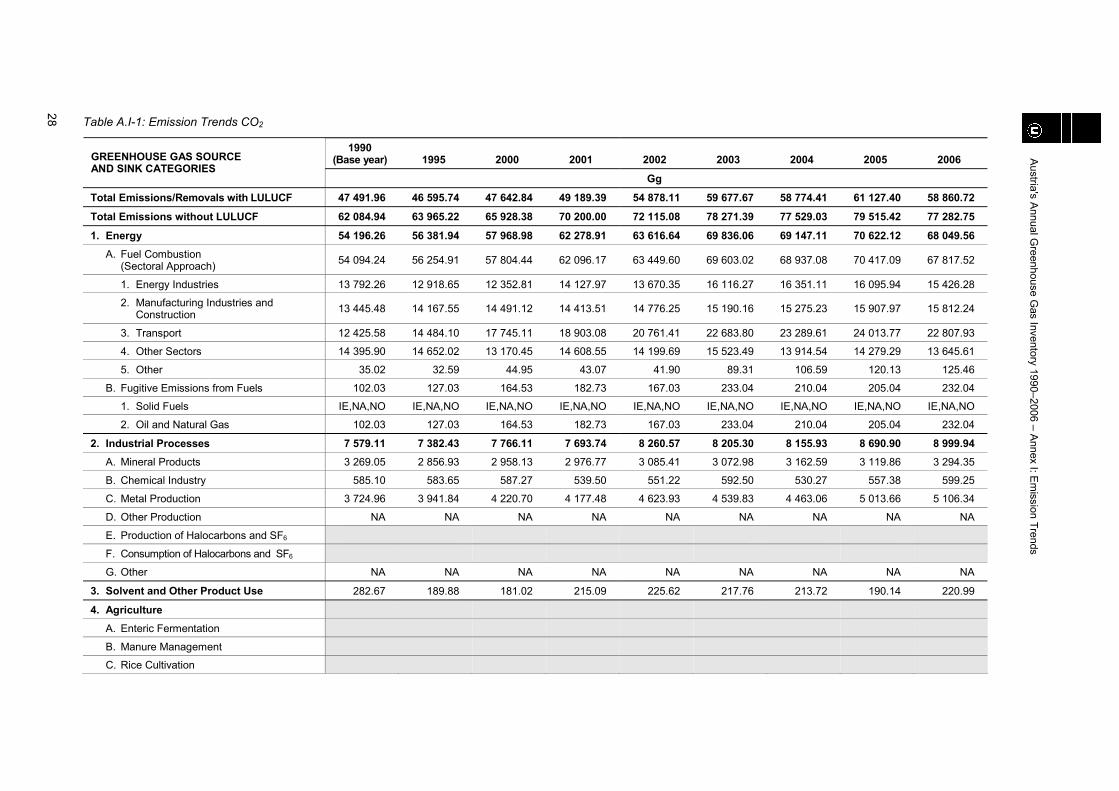
28 Table A.I-1: Emission Trends CO2
1990 (Base year) 1995 2000 2001 2002 2003 2004 2005 2006 GREENHOUSE GAS SOURCE
AND SINK CATEGORIES Gg
Total Emissions/Removals with LULUCF 47 491.96 46 595.74 47 642.84 49 189.39 54 878.11 59 677.67 58 774.41 61 127.40 58 860.72
Total Emissions without LULUCF 62 084.94 63 965.22 65 928.38 70 200.00 72 115.08 78 271.39 77 529.03 79 515.42 77 282.75
1. Energy 54 196.26 56 381.94 57 968.98 62 278.91 63 616.64 69 836.06 69 147.11 70 622.12 68 049.56 A. Fuel Combustion
(Sectoral Approach) 54 094.24 56 254.91 57 804.44 62 096.17 63 449.60 69 603.02 68 937.08 70 417.09 67 817.52
1. Energy Industries 13 792.26 12 918.65 12 352.81 14 127.97 13 670.35 16 116.27 16 351.11 16 095.94 15 426.28
2. Manufacturing Industries and Construction 13 445.48 14 167.55 14 491.12 14 413.51 14 776.25 15 190.16 15 275.23 15 907.97 15 812.24
3. Transport 12 425.58 14 484.10 17 745.11 18 903.08 20 761.41 22 683.80 23 289.61 24 013.77 22 807.93
4. Other Sectors 14 395.90 14 652.02 13 170.45 14 608.55 14 199.69 15 523.49 13 914.54 14 279.29 13 645.61
5. Other 35.02 32.59 44.95 43.07 41.90 89.31 106.59 120.13 125.46
B. Fugitive Emissions from Fuels 102.03 127.03 164.53 182.73 167.03 233.04 210.04 205.04 232.04
1. Solid Fuels IE,NA,NO IE,NA,NO IE,NA,NO IE,NA,NO IE,NA,NO IE,NA,NO IE,NA,NO IE,NA,NO IE,NA,NO
2. Oil and Natural Gas 102.03 127.03 164.53 182.73 167.03 233.04 210.04 205.04 232.04
2. Industrial Processes 7 579.11 7 382.43 7 766.11 7 693.74 8 260.57 8 205.30 8 155.93 8 690.90 8 999.94 A. Mineral Products 3 269.05 2 856.93 2 958.13 2 976.77 3 085.41 3 072.98 3 162.59 3 119.86 3 294.35
B. Chemical Industry 585.10 583.65 587.27 539.50 551.22 592.50 530.27 557.38 599.25
C. Metal Production 3 724.96 3 941.84 4 220.70 4 177.48 4 623.93 4 539.83 4 463.06 5 013.66 5 106.34
D. Other Production NA NA NA NA NA NA NA NA NA
E. Production of Halocarbons and SF6
F. Consumption of Halocarbons and SF6
G. Other NA NA NA NA NA NA NA NA NA
3. Solvent and Other Product Use 282.67 189.88 181.02 215.09 225.62 217.76 213.72 190.14 220.99
4. Agriculture
A. Enteric Fermentation
B. Manure Management
C. Rice Cultivation
Austria's A
nnual Greenhouse G
as Inventory 1990–2006 – Annex I: E
mission Trends
29
1990 (Base year) 1995 2000 2001 2002 2003 2004 2005 2006 GREENHOUSE GAS SOURCE
AND SINK CATEGORIES Gg
D. Agricultural Soils (2)
E. Prescribed Burning of Savannas
F. Field Burning of Agricultural Residues
G. Other
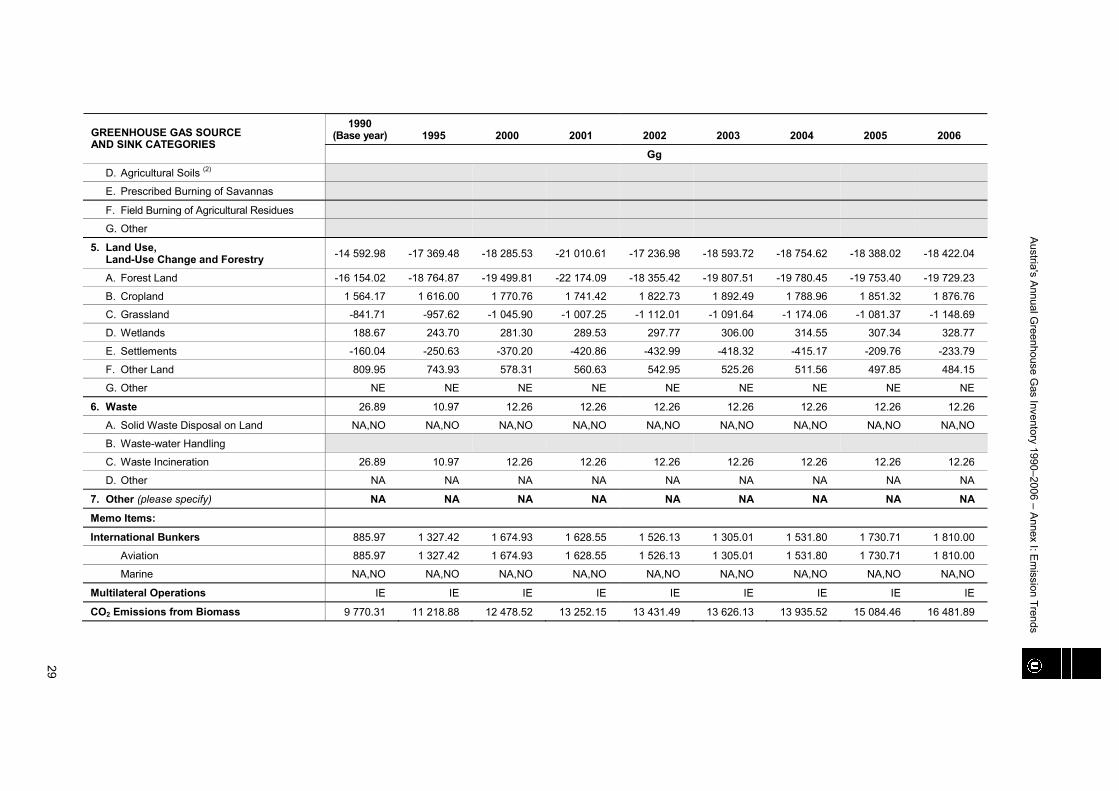
5. Land Use, Land-Use Change and Forestry -14 592.98 -17 369.48 -18 285.53 -21 010.61 -17 236.98 -18 593.72 -18 754.62 -18 388.02 -18 422.04
A. Forest Land -16 154.02 -18 764.87 -19 499.81 -22 174.09 -18 355.42 -19 807.51 -19 780.45 -19 753.40 -19 729.23
B. Cropland 1 564.17 1 616.00 1 770.76 1 741.42 1 822.73 1 892.49 1 788.96 1 851.32 1 876.76
C. Grassland -841.71 -957.62 -1 045.90 -1 007.25 -1 112.01 -1 091.64 -1 174.06 -1 081.37 -1 148.69
D. Wetlands 188.67 243.70 281.30 289.53 297.77 306.00 314.55 307.34 328.77
E. Settlements -160.04 -250.63 -370.20 -420.86 -432.99 -418.32 -415.17 -209.76 -233.79
F. Other Land 809.95 743.93 578.31 560.63 542.95 525.26 511.56 497.85 484.15
G. Other NE NE NE NE NE NE NE NE NE
6. Waste 26.89 10.97 12.26 12.26 12.26 12.26 12.26 12.26 12.26
A. Solid Waste Disposal on Land NA,NO NA,NO NA,NO NA,NO NA,NO NA,NO NA,NO NA,NO NA,NO
B. Waste-water Handling
C. Waste Incineration 26.89 10.97 12.26 12.26 12.26 12.26 12.26 12.26 12.26
D. Other NA NA NA NA NA NA NA NA NA
7. Other (please specify) NA NA NA NA NA NA NA NA NA
Memo Items:
International Bunkers 885.97 1 327.42 1 674.93 1 628.55 1 526.13 1 305.01 1 531.80 1 730.71 1 810.00
Aviation 885.97 1 327.42 1 674.93 1 628.55 1 526.13 1 305.01 1 531.80 1 730.71 1 810.00
Marine NA,NO NA,NO NA,NO NA,NO NA,NO NA,NO NA,NO NA,NO NA,NO
Multilateral Operations IE IE IE IE IE IE IE IE IE
CO2 Emissions from Biomass 9 770.31 11 218.88 12 478.52 13 252.15 13 431.49 13 626.13 13 935.52 15 084.46 16 481.89
Austria's A
nnual Greenhouse G
as Inventory 1990–2006 – Annex I: E
mission Trends
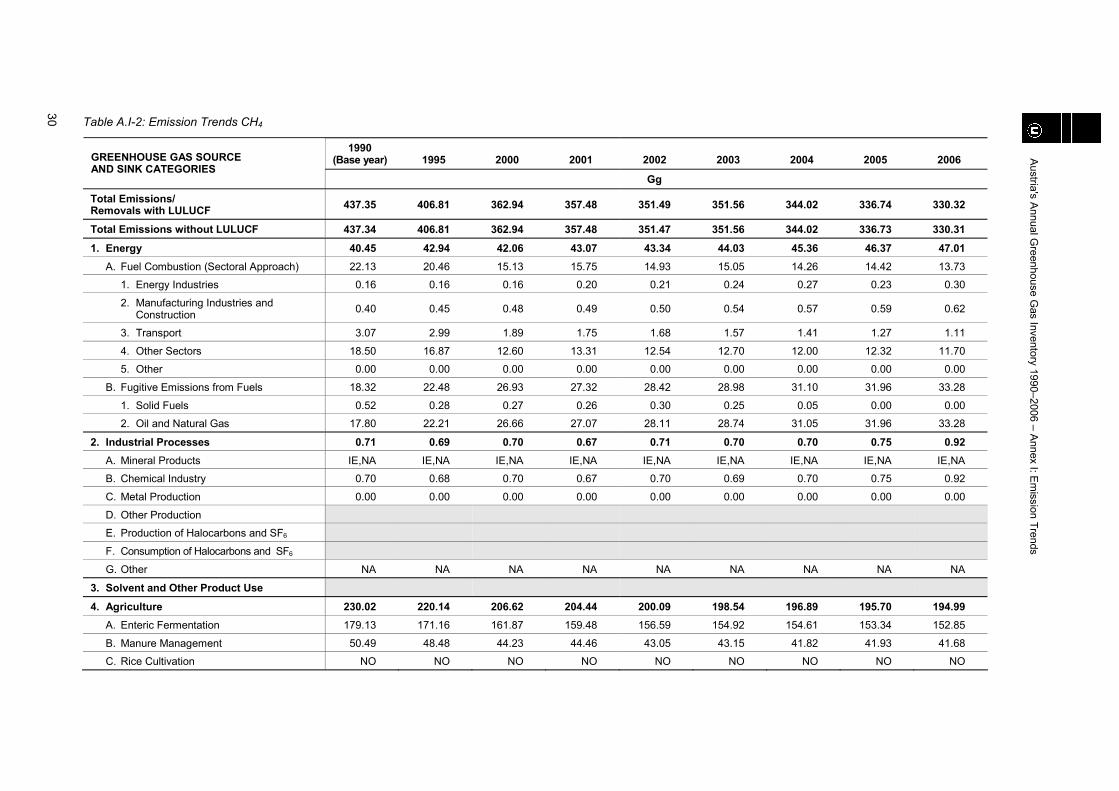
30 Table A.I-2: Emission Trends CH4
1990 (Base year) 1995 2000 2001 2002 2003 2004 2005 2006 GREENHOUSE GAS SOURCE
AND SINK CATEGORIES Gg
Total Emissions/ Removals with LULUCF 437.35 406.81 362.94 357.48 351.49 351.56 344.02 336.74 330.32
Total Emissions without LULUCF 437.34 406.81 362.94 357.48 351.47 351.56 344.02 336.73 330.31
1. Energy 40.45 42.94 42.06 43.07 43.34 44.03 45.36 46.37 47.01 A. Fuel Combustion (Sectoral Approach) 22.13 20.46 15.13 15.75 14.93 15.05 14.26 14.42 13.73
1. Energy Industries 0.16 0.16 0.16 0.20 0.21 0.24 0.27 0.23 0.30
2. Manufacturing Industries and Construction 0.40 0.45 0.48 0.49 0.50 0.54 0.57 0.59 0.62
3. Transport 3.07 2.99 1.89 1.75 1.68 1.57 1.41 1.27 1.11
4. Other Sectors 18.50 16.87 12.60 13.31 12.54 12.70 12.00 12.32 11.70
5. Other 0.00 0.00 0.00 0.00 0.00 0.00 0.00 0.00 0.00
B. Fugitive Emissions from Fuels 18.32 22.48 26.93 27.32 28.42 28.98 31.10 31.96 33.28
1. Solid Fuels 0.52 0.28 0.27 0.26 0.30 0.25 0.05 0.00 0.00
2. Oil and Natural Gas 17.80 22.21 26.66 27.07 28.11 28.74 31.05 31.96 33.28
2. Industrial Processes 0.71 0.69 0.70 0.67 0.71 0.70 0.70 0.75 0.92 A. Mineral Products IE,NA IE,NA IE,NA IE,NA IE,NA IE,NA IE,NA IE,NA IE,NA
B. Chemical Industry 0.70 0.68 0.70 0.67 0.70 0.69 0.70 0.75 0.92
C. Metal Production 0.00 0.00 0.00 0.00 0.00 0.00 0.00 0.00 0.00
D. Other Production
E. Production of Halocarbons and SF6
F. Consumption of Halocarbons and SF6
G. Other NA NA NA NA NA NA NA NA NA
3. Solvent and Other Product Use
4. Agriculture 230.02 220.14 206.62 204.44 200.09 198.54 196.89 195.70 194.99 A. Enteric Fermentation 179.13 171.16 161.87 159.48 156.59 154.92 154.61 153.34 152.85
B. Manure Management 50.49 48.48 44.23 44.46 43.05 43.15 41.82 41.93 41.68
C. Rice Cultivation NO NO NO NO NO NO NO NO NO
Austria's A
nnual Greenhouse G
as Inventory 1990–2006 – Annex I: E
mission Trends
31
1990 (Base year) 1995 2000 2001 2002 2003 2004 2005 2006 GREENHOUSE GAS SOURCE
AND SINK CATEGORIES Gg
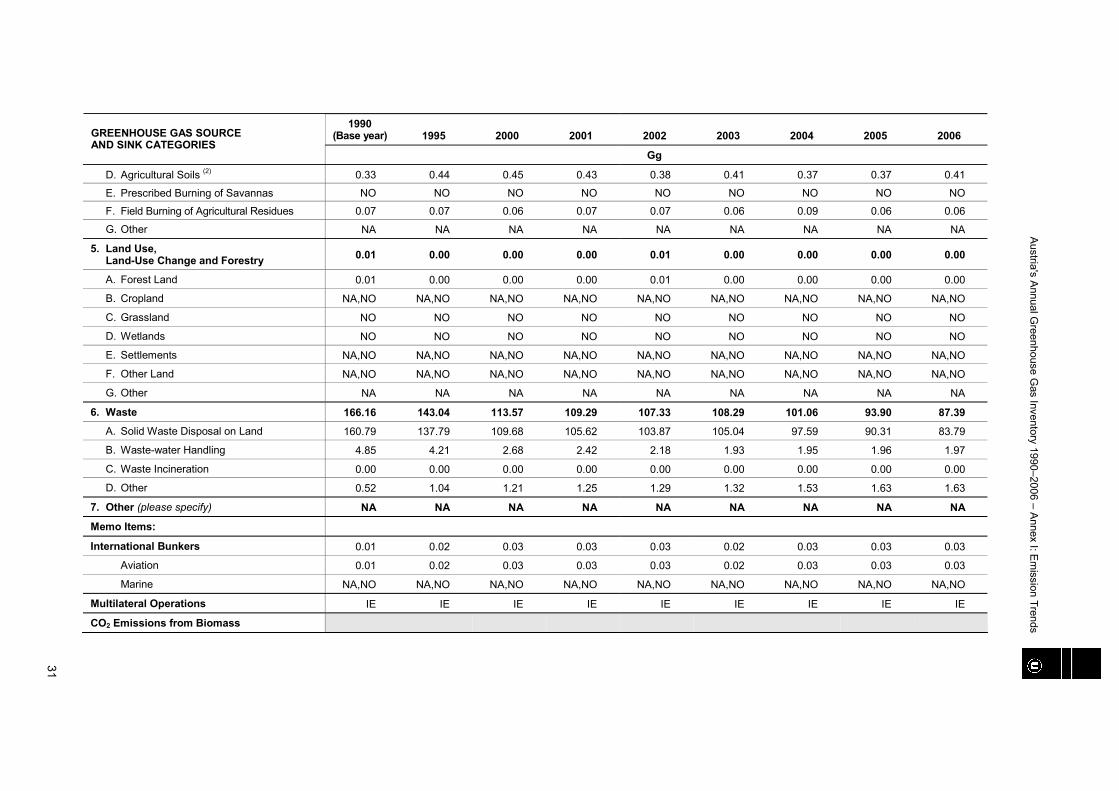
D. Agricultural Soils (2) 0.33 0.44 0.45 0.43 0.38 0.41 0.37 0.37 0.41
E. Prescribed Burning of Savannas NO NO NO NO NO NO NO NO NO
F. Field Burning of Agricultural Residues 0.07 0.07 0.06 0.07 0.07 0.06 0.09 0.06 0.06
G. Other NA NA NA NA NA NA NA NA NA
5. Land Use, Land-Use Change and Forestry 0.01 0.00 0.00 0.00 0.01 0.00 0.00 0.00 0.00
A. Forest Land 0.01 0.00 0.00 0.00 0.01 0.00 0.00 0.00 0.00
B. Cropland NA,NO NA,NO NA,NO NA,NO NA,NO NA,NO NA,NO NA,NO NA,NO
C. Grassland NO NO NO NO NO NO NO NO NO
D. Wetlands NO NO NO NO NO NO NO NO NO
E. Settlements NA,NO NA,NO NA,NO NA,NO NA,NO NA,NO NA,NO NA,NO NA,NO
F. Other Land NA,NO NA,NO NA,NO NA,NO NA,NO NA,NO NA,NO NA,NO NA,NO
G. Other NA NA NA NA NA NA NA NA NA
6. Waste 166.16 143.04 113.57 109.29 107.33 108.29 101.06 93.90 87.39
A. Solid Waste Disposal on Land 160.79 137.79 109.68 105.62 103.87 105.04 97.59 90.31 83.79
B. Waste-water Handling 4.85 4.21 2.68 2.42 2.18 1.93 1.95 1.96 1.97
C. Waste Incineration 0.00 0.00 0.00 0.00 0.00 0.00 0.00 0.00 0.00
D. Other 0.52 1.04 1.21 1.25 1.29 1.32 1.53 1.63 1.63
7. Other (please specify) NA NA NA NA NA NA NA NA NA
Memo Items:
International Bunkers 0.01 0.02 0.03 0.03 0.03 0.02 0.03 0.03 0.03
Aviation 0.01 0.02 0.03 0.03 0.03 0.02 0.03 0.03 0.03
Marine NA,NO NA,NO NA,NO NA,NO NA,NO NA,NO NA,NO NA,NO NA,NO
Multilateral Operations IE IE IE IE IE IE IE IE IE
CO2 Emissions from Biomass

Austria's A
nnual Greenhouse G
as Inventory 1990–2006 – Annex I: E
mission Trends
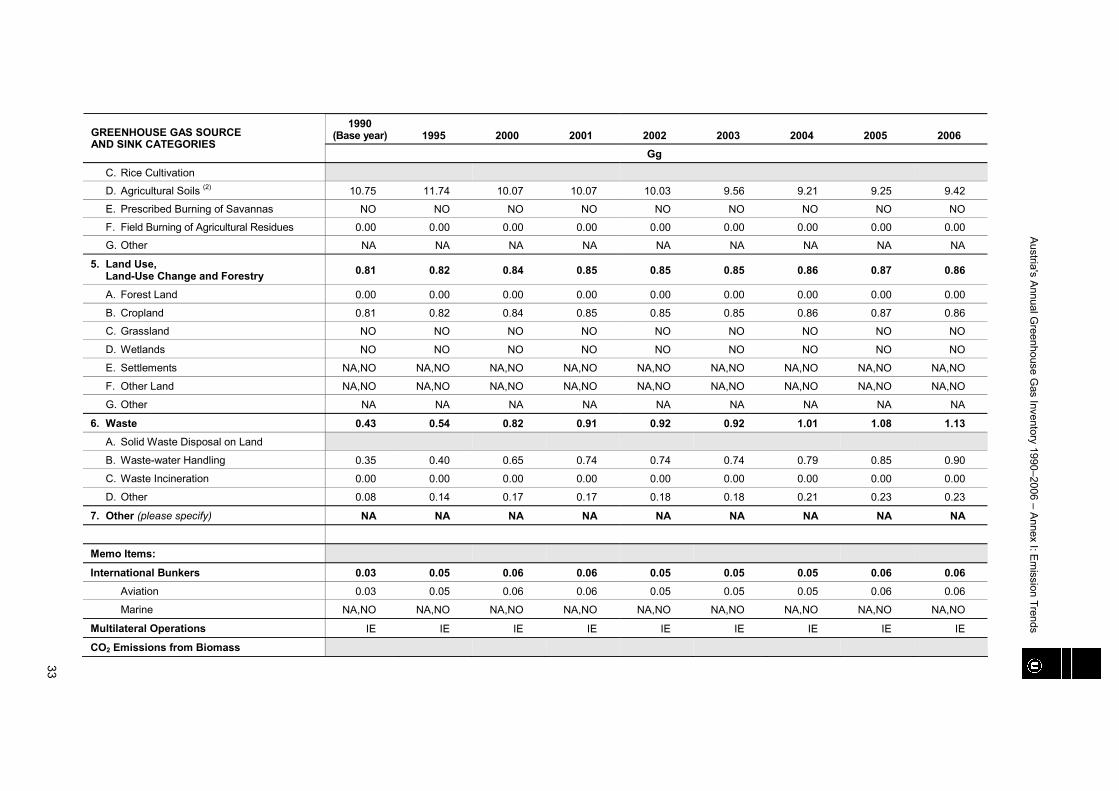
32 Table A.I-3: Emission Trends N2O
1990 (Base year) 1995 2000 2001 2002 2003 2004 2005 2006 GREENHOUSE GAS SOURCE
AND SINK CATEGORIES Gg
Total Emissions/ Removals with LULUCF 21.13 22.25 21.11 20.72 20.73 20.49 18.20 18.14 18.27
Total Emissions without LULUCF 20.32 21.42 20.27 19.87 19.88 19.64 17.33 17.27 17.41
1. Energy 2.20 2.47 2.58 2.69 2.75 2.80 2.75 2.67 2.61 A. Fuel Combustion
(Sectoral Approach) 2.20 2.47 2.58 2.69 2.75 2.80 2.75 2.67 2.61
1. Energy Industries 0.15 0.16 0.17 0.20 0.20 0.23 0.25 0.22 0.24
2. Manufacturing Industries and Construction 0.52 0.55 0.57 0.56 0.55 0.52 0.50 0.49 0.51
3. Transport 0.58 0.81 0.91 0.94 1.02 1.06 1.03 1.00 0.93
4. Other Sectors 0.95 0.94 0.93 0.99 0.97 0.99 0.96 0.95 0.92
5. Other 0.00 0.00 0.00 0.00 0.00 0.01 0.01 0.01 0.01
B. Fugitive Emissions from Fuels IE,NA IE,NA IE,NA IE,NA IE,NA IE,NA IE,NA IE,NA IE,NA
1. Solid Fuels IE,NA IE,NA IE,NA IE,NA IE,NA IE,NA IE,NA IE,NA IE,NA
2. Oil and Natural Gas IE,NA IE,NA IE,NA IE,NA IE,NA IE,NA IE,NA IE,NA IE,NA
2. Industrial Processes 2.94 2.77 3.07 2.54 2.60 2.85 0.91 0.88 0.90 A. Mineral Products IE,NA IE,NA IE,NA IE,NA IE,NA IE,NA IE,NA IE,NA IE,NA
B. Chemical Industry 2.94 2.77 3.07 2.54 2.60 2.85 0.91 0.88 0.90
C. Metal Production NA NA NA NA NA NA NA NA NA
D. Other Production
E. Production of Halocarbons and SF6
F. Consumption of Halocarbons and SF6
G. Other NA NA NA NA NA NA NA NA NA
3. Solvent and Other Product Use 0.75 0.75 0.75 0.71 0.67 0.64 0.60 0.56 0.53
4. Agriculture 13.99 14.89 13.05 13.02 12.93 12.43 12.07 12.08 12.24 A. Enteric Fermentation B. Manure Management 3.24 3.16 2.98 2.95 2.89 2.87 2.86 2.83 2.82
Austria's A
nnual Greenhouse G
as Inventory 1990–2006 – Annex I: E
mission Trends
33
1990 (Base year) 1995 2000 2001 2002 2003 2004 2005 2006 GREENHOUSE GAS SOURCE
AND SINK CATEGORIES Gg
C. Rice Cultivation D. Agricultural Soils (2) 10.75 11.74 10.07 10.07 10.03 9.56 9.21 9.25 9.42
E. Prescribed Burning of Savannas NO NO NO NO NO NO NO NO NO
F. Field Burning of Agricultural Residues 0.00 0.00 0.00 0.00 0.00 0.00 0.00 0.00 0.00
G. Other NA NA NA NA NA NA NA NA NA
5. Land Use, Land-Use Change and Forestry 0.81 0.82 0.84 0.85 0.85 0.85 0.86 0.87 0.86
A. Forest Land 0.00 0.00 0.00 0.00 0.00 0.00 0.00 0.00 0.00
B. Cropland 0.81 0.82 0.84 0.85 0.85 0.85 0.86 0.87 0.86
C. Grassland NO NO NO NO NO NO NO NO NO
D. Wetlands NO NO NO NO NO NO NO NO NO
E. Settlements NA,NO NA,NO NA,NO NA,NO NA,NO NA,NO NA,NO NA,NO NA,NO
F. Other Land NA,NO NA,NO NA,NO NA,NO NA,NO NA,NO NA,NO NA,NO NA,NO
G. Other NA NA NA NA NA NA NA NA NA
6. Waste 0.43 0.54 0.82 0.91 0.92 0.92 1.01 1.08 1.13 A. Solid Waste Disposal on Land B. Waste-water Handling 0.35 0.40 0.65 0.74 0.74 0.74 0.79 0.85 0.90
C. Waste Incineration 0.00 0.00 0.00 0.00 0.00 0.00 0.00 0.00 0.00
D. Other 0.08 0.14 0.17 0.17 0.18 0.18 0.21 0.23 0.23
7. Other (please specify) NA NA NA NA NA NA NA NA NA
Memo Items:
International Bunkers 0.03 0.05 0.06 0.06 0.05 0.05 0.05 0.06 0.06 Aviation 0.03 0.05 0.06 0.06 0.05 0.05 0.05 0.06 0.06
Marine NA,NO NA,NO NA,NO NA,NO NA,NO NA,NO NA,NO NA,NO NA,NO
Multilateral Operations IE IE IE IE IE IE IE IE IE
CO2 Emissions from Biomass
Austria's A
nnual Greenhouse G
as Inventory 1990–2006 – Annex I: E
mission Trends
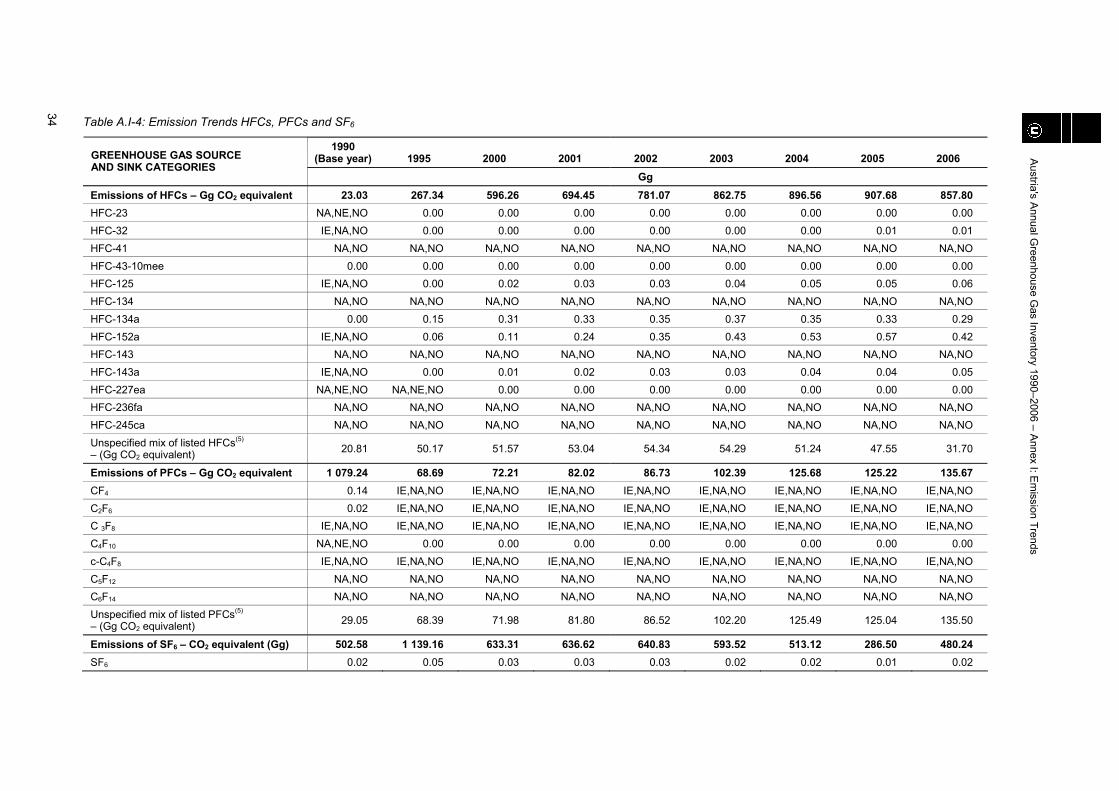
34 Table A.I-4: Emission Trends HFCs, PFCs and SF6
1990 (Base year) 1995 2000 2001 2002 2003 2004 2005 2006 GREENHOUSE GAS SOURCE
AND SINK CATEGORIES Gg
Emissions of HFCs – Gg CO2 equivalent 23.03 267.34 596.26 694.45 781.07 862.75 896.56 907.68 857.80 HFC-23 NA,NE,NO 0.00 0.00 0.00 0.00 0.00 0.00 0.00 0.00 HFC-32 IE,NA,NO 0.00 0.00 0.00 0.00 0.00 0.00 0.01 0.01 HFC-41 NA,NO NA,NO NA,NO NA,NO NA,NO NA,NO NA,NO NA,NO NA,NO HFC-43-10mee 0.00 0.00 0.00 0.00 0.00 0.00 0.00 0.00 0.00 HFC-125 IE,NA,NO 0.00 0.02 0.03 0.03 0.04 0.05 0.05 0.06 HFC-134 NA,NO NA,NO NA,NO NA,NO NA,NO NA,NO NA,NO NA,NO NA,NO HFC-134a 0.00 0.15 0.31 0.33 0.35 0.37 0.35 0.33 0.29 HFC-152a IE,NA,NO 0.06 0.11 0.24 0.35 0.43 0.53 0.57 0.42 HFC-143 NA,NO NA,NO NA,NO NA,NO NA,NO NA,NO NA,NO NA,NO NA,NO HFC-143a IE,NA,NO 0.00 0.01 0.02 0.03 0.03 0.04 0.04 0.05 HFC-227ea NA,NE,NO NA,NE,NO 0.00 0.00 0.00 0.00 0.00 0.00 0.00 HFC-236fa NA,NO NA,NO NA,NO NA,NO NA,NO NA,NO NA,NO NA,NO NA,NO HFC-245ca NA,NO NA,NO NA,NO NA,NO NA,NO NA,NO NA,NO NA,NO NA,NO Unspecified mix of listed HFCs(5) – (Gg CO2 equivalent) 20.81 50.17 51.57 53.04 54.34 54.29 51.24 47.55 31.70
Emissions of PFCs – Gg CO2 equivalent 1 079.24 68.69 72.21 82.02 86.73 102.39 125.68 125.22 135.67 CF4 0.14 IE,NA,NO IE,NA,NO IE,NA,NO IE,NA,NO IE,NA,NO IE,NA,NO IE,NA,NO IE,NA,NO C2F6 0.02 IE,NA,NO IE,NA,NO IE,NA,NO IE,NA,NO IE,NA,NO IE,NA,NO IE,NA,NO IE,NA,NO C 3F8 IE,NA,NO IE,NA,NO IE,NA,NO IE,NA,NO IE,NA,NO IE,NA,NO IE,NA,NO IE,NA,NO IE,NA,NO C4F10 NA,NE,NO 0.00 0.00 0.00 0.00 0.00 0.00 0.00 0.00 c-C4F8 IE,NA,NO IE,NA,NO IE,NA,NO IE,NA,NO IE,NA,NO IE,NA,NO IE,NA,NO IE,NA,NO IE,NA,NO C5F12 NA,NO NA,NO NA,NO NA,NO NA,NO NA,NO NA,NO NA,NO NA,NO C6F14 NA,NO NA,NO NA,NO NA,NO NA,NO NA,NO NA,NO NA,NO NA,NO Unspecified mix of listed PFCs(5) – (Gg CO2 equivalent) 29.05 68.39 71.98 81.80 86.52 102.20 125.49 125.04 135.50
Emissions of SF6 – CO2 equivalent (Gg) 502.58 1 139.16 633.31 636.62 640.83 593.52 513.12 286.50 480.24 SF6 0.02 0.05 0.03 0.03 0.03 0.02 0.02 0.01 0.02
Austria's Annual Greenhouse Gas Inventory 1990–2006 – Annex II: Tier 1 Uncertainty Assessment
35
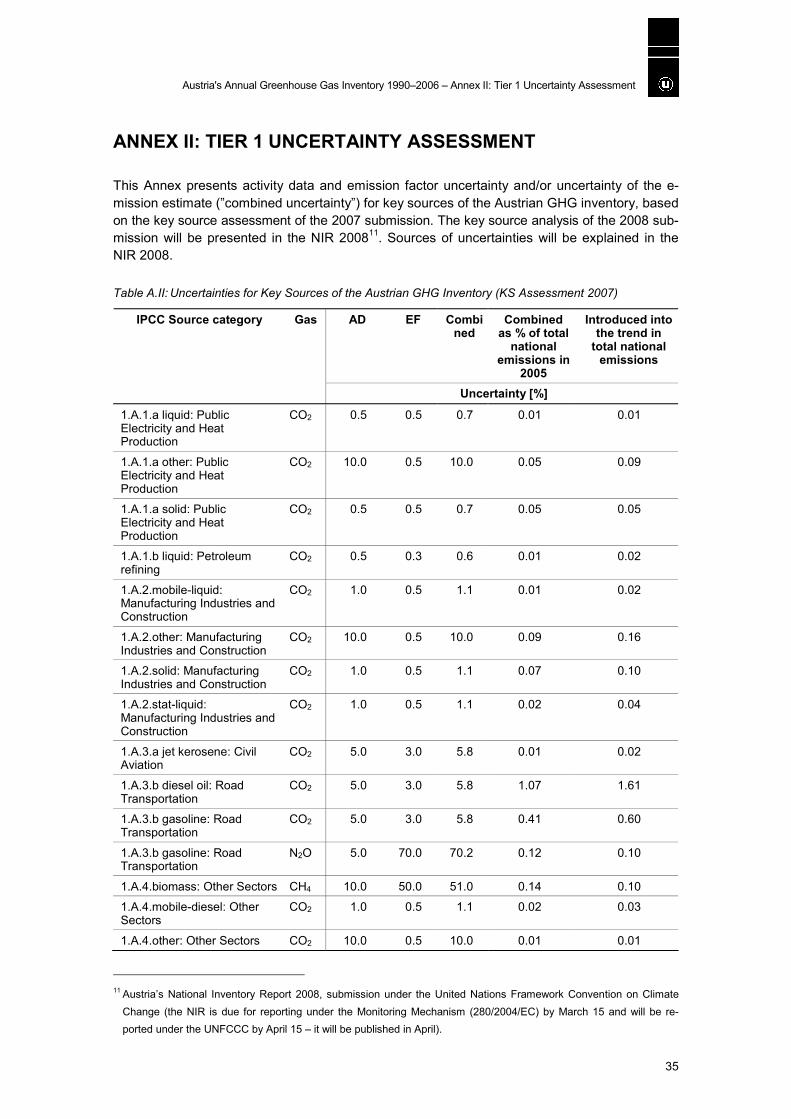
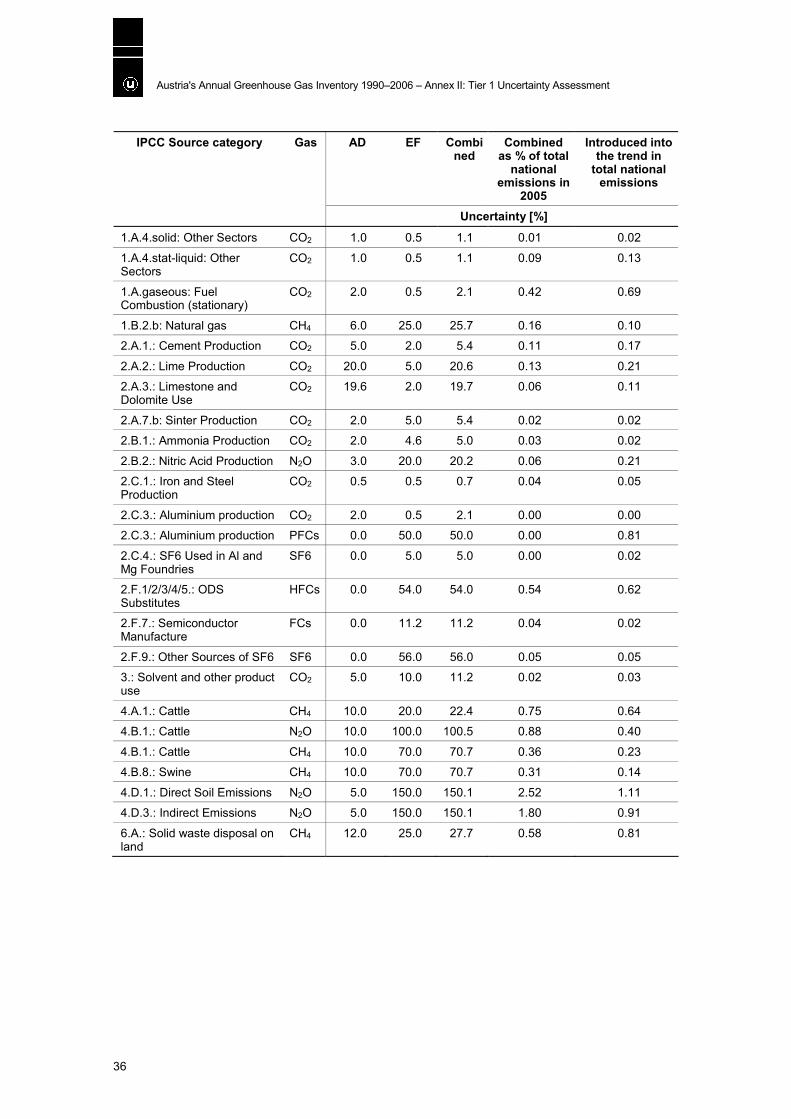
ANNEX II: TIER 1 UNCERTAINTY ASSESSMENT
This Annex presents activity data and emission factor uncertainty and/or uncertainty of the e-mission estimate (”combined uncertainty”) for key sources of the Austrian GHG inventory, based on the key source assessment of the 2007 submission. The key source analysis of the 2008 sub-mission will be presented in the NIR 200811. Sources of uncertainties will be explained in the NIR 2008.
Table A.II: Uncertainties for Key Sources of the Austrian GHG Inventory (KS Assessment 2007)
AD EF Combined
Combined as % of total
national emissions in
2005
Introduced into the trend in
total national emissions
IPCC Source category Gas
Uncertainty [%]
1.A.1.a liquid: Public Electricity and Heat Production
CO2 0.5 0.5 0.7 0.01 0.01
1.A.1.a other: Public Electricity and Heat Production
CO2 10.0 0.5 10.0 0.05 0.09
1.A.1.a solid: Public Electricity and Heat Production
CO2 0.5 0.5 0.7 0.05 0.05
1.A.1.b liquid: Petroleum refining
CO2 0.5 0.3 0.6 0.01 0.02
1.A.2.mobile-liquid: Manufacturing Industries and Construction
CO2 1.0 0.5 1.1 0.01 0.02
1.A.2.other: Manufacturing Industries and Construction
CO2 10.0 0.5 10.0 0.09 0.16
1.A.2.solid: Manufacturing Industries and Construction
CO2 1.0 0.5 1.1 0.07 0.10
1.A.2.stat-liquid: Manufacturing Industries and Construction
CO2 1.0 0.5 1.1 0.02 0.04
1.A.3.a jet kerosene: Civil Aviation
CO2 5.0 3.0 5.8 0.01 0.02
1.A.3.b diesel oil: Road Transportation
CO2 5.0 3.0 5.8 1.07 1.61
1.A.3.b gasoline: Road Transportation
CO2 5.0 3.0 5.8 0.41 0.60
1.A.3.b gasoline: Road Transportation
N2O 5.0 70.0 70.2 0.12 0.10
1.A.4.biomass: Other Sectors CH4 10.0 50.0 51.0 0.14 0.10
1.A.4.mobile-diesel: Other Sectors
CO2 1.0 0.5 1.1 0.02 0.03
1.A.4.other: Other Sectors CO2 10.0 0.5 10.0 0.01 0.01
11 Austria’s National Inventory Report 2008, submission under the United Nations Framework Convention on Climate
Change (the NIR is due for reporting under the Monitoring Mechanism (280/2004/EC) by March 15 and will be re-ported under the UNFCCC by April 15 – it will be published in April).
Austria's Annual Greenhouse Gas Inventory 1990–2006 – Annex II: Tier 1 Uncertainty Assessment
36
AD EF Combined
Combined as % of total
national emissions in
2005
Introduced into the trend in
total national emissions
IPCC Source category Gas
Uncertainty [%]
1.A.4.solid: Other Sectors CO2 1.0 0.5 1.1 0.01 0.02
1.A.4.stat-liquid: Other Sectors
CO2 1.0 0.5 1.1 0.09 0.13
1.A.gaseous: Fuel Combustion (stationary)
CO2 2.0 0.5 2.1 0.42 0.69
1.B.2.b: Natural gas CH4 6.0 25.0 25.7 0.16 0.10
2.A.1.: Cement Production CO2 5.0 2.0 5.4 0.11 0.17
2.A.2.: Lime Production CO2 20.0 5.0 20.6 0.13 0.21
2.A.3.: Limestone and Dolomite Use
CO2 19.6 2.0 19.7 0.06 0.11
2.A.7.b: Sinter Production CO2 2.0 5.0 5.4 0.02 0.02
2.B.1.: Ammonia Production CO2 2.0 4.6 5.0 0.03 0.02
2.B.2.: Nitric Acid Production N2O 3.0 20.0 20.2 0.06 0.21
2.C.1.: Iron and Steel Production
CO2 0.5 0.5 0.7 0.04 0.05
2.C.3.: Aluminium production CO2 2.0 0.5 2.1 0.00 0.00
2.C.3.: Aluminium production PFCs 0.0 50.0 50.0 0.00 0.81
2.C.4.: SF6 Used in Al and Mg Foundries
SF6 0.0 5.0 5.0 0.00 0.02
2.F.1/2/3/4/5.: ODS Substitutes
HFCs 0.0 54.0 54.0 0.54 0.62
2.F.7.: Semiconductor Manufacture
FCs 0.0 11.2 11.2 0.04 0.02
2.F.9.: Other Sources of SF6 SF6 0.0 56.0 56.0 0.05 0.05
3.: Solvent and other product use
CO2 5.0 10.0 11.2 0.02 0.03
4.A.1.: Cattle CH4 10.0 20.0 22.4 0.75 0.64
4.B.1.: Cattle N2O 10.0 100.0 100.5 0.88 0.40
4.B.1.: Cattle CH4 10.0 70.0 70.7 0.36 0.23
4.B.8.: Swine CH4 10.0 70.0 70.7 0.31 0.14
4.D.1.: Direct Soil Emissions N2O 5.0 150.0 150.1 2.52 1.11
4.D.3.: Indirect Emissions N2O 5.0 150.0 150.1 1.80 0.91
6.A.: Solid waste disposal on land
CH4 12.0 25.0 27.7 0.58 0.81
Austria's Annual Greenhouse Gas Inventory 1990–2006 – ANNEX III: Indicators
37
ANNEX III: INDICATORS
This Annex presents data on indicators pursuant to Article 3 (1) j of the Monitoring Decision (280/2004/EC), a detailed description of the indicators can be found in Annex II of the ”Imple-menting Provisions” (Commission Decision 2005/166/EC).
Information on all Priority Indicators (including Additional Priority Indicators) is provided; however, data for some Supplementary Indicators was not available (indicated by NA in the cells).
Footnotes are used if the indicators presented below are not fully in line with the definitions as laid down in the Implementing Provisions, and for further explanations.
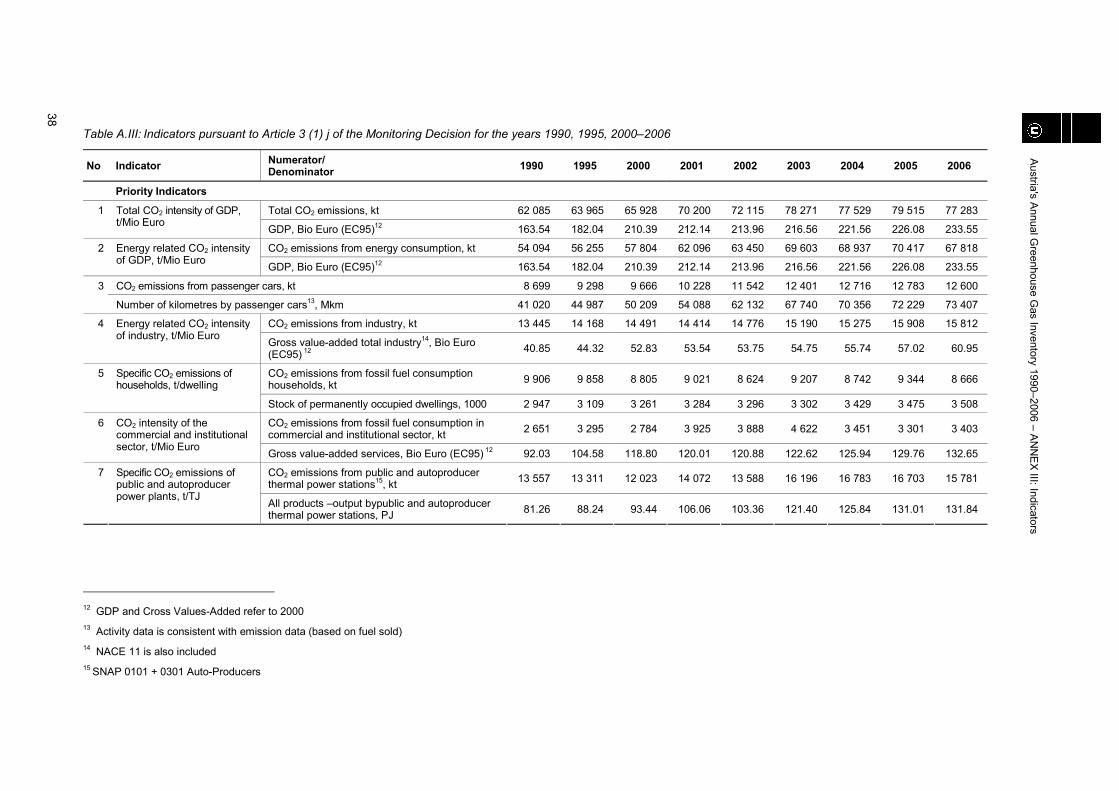
Austria's A
nnual Greenhouse G
as Inventory 1990–2006 – AN
NE
X III: Indicators
38
Table A.III: Indicators pursuant to Article 3 (1) j of the Monitoring Decision for the years 1990, 1995, 2000–2006
No Indicator Numerator/ Denominator 1990 1995 2000 2001 2002 2003 2004 2005 2006
Priority Indicators
Total CO2 emissions, kt 62 085 63 965 65 928 70 200 72 115 78 271 77 529 79 515 77 283 1 Total CO2 intensity of GDP, t/Mio Euro GDP, Bio Euro (EC95)12 163.54 182.04 210.39 212.14 213.96 216.56 221.56 226.08 233.55
CO2 emissions from energy consumption, kt 54 094 56 255 57 804 62 096 63 450 69 603 68 937 70 417 67 818 2 Energy related CO2 intensity of GDP, t/Mio Euro GDP, Bio Euro (EC95)12 163.54 182.04 210.39 212.14 213.96 216.56 221.56 226.08 233.55
CO2 emissions from passenger cars, kt 8 699 9 298 9 666 10 228 11 542 12 401 12 716 12 783 12 600 3
Number of kilometres by passenger cars13, Mkm 41 020 44 987 50 209 54 088 62 132 67 740 70 356 72 229 73 407
CO2 emissions from industry, kt 13 445 14 168 14 491 14 414 14 776 15 190 15 275 15 908 15 812 4 Energy related CO2 intensity of industry, t/Mio Euro Gross value-added total industry14, Bio Euro
(EC95) 12 40.85 44.32 52.83 53.54 53.75 54.75 55.74 57.02 60.95
CO2 emissions from fossil fuel consumption households, kt 9 906 9 858 8 805 9 021 8 624 9 207 8 742 9 344 8 666 5 Specific CO2 emissions of
households, t/dwelling
Stock of permanently occupied dwellings, 1000 2 947 3 109 3 261 3 284 3 296 3 302 3 429 3 475 3 508
CO2 emissions from fossil fuel consumption in commercial and institutional sector, kt 2 651 3 295 2 784 3 925 3 888 4 622 3 451 3 301 3 403 6 CO2 intensity of the
commercial and institutional sector, t/Mio Euro Gross value-added services, Bio Euro (EC95) 12 92.03 104.58 118.80 120.01 120.88 122.62 125.94 129.76 132.65
CO2 emissions from public and autoproducer thermal power stations15, kt 13 557 13 311 12 023 14 072 13 588 16 196 16 783 16 703 15 781 7 Specific CO2 emissions of
public and autoproducer power plants, t/TJ All products –output bypublic and autoproducer
thermal power stations, PJ 81.26 88.24 93.44 106.06 103.36 121.40 125.84 131.01 131.84
12 GDP and Cross Values-Added refer to 2000 13 Activity data is consistent with emission data (based on fuel sold) 14 NACE 11 is also included 15 SNAP 0101 + 0301 Auto-Producers
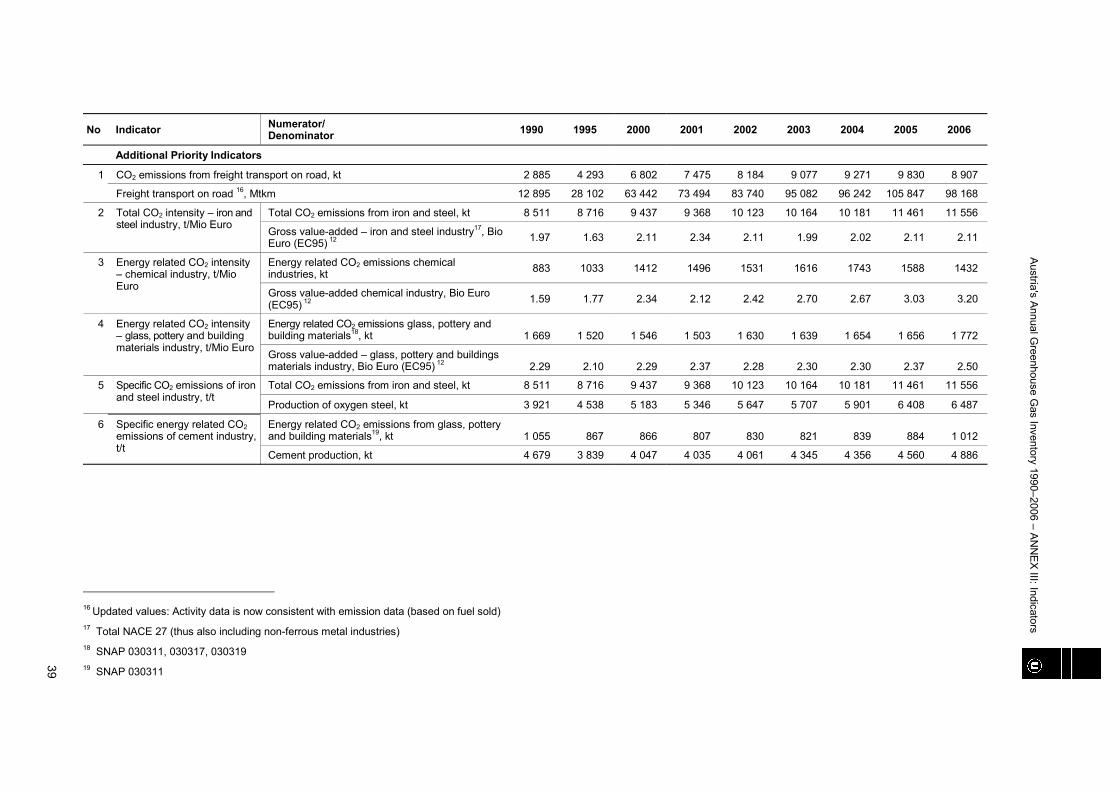
Austria's A
nnual Greenhouse G
as Inventory 1990–2006 – AN
NE
X III: Indicators
39
No Indicator Numerator/ Denominator 1990 1995 2000 2001 2002 2003 2004 2005 2006
Additional Priority Indicators
CO2 emissions from freight transport on road, kt 2 885 4 293 6 802 7 475 8 184 9 077 9 271 9 830 8 907 1
Freight transport on road 16, Mtkm 12 895 28 102 63 442 73 494 83 740 95 082 96 242 105 847 98 168
Total CO2 emissions from iron and steel, kt 8 511 8 716 9 437 9 368 10 123 10 164 10 181 11 461 11 556 2 Total CO2 intensity – iron and steel industry, t/Mio Euro Gross value-added – iron and steel industry17, Bio
Euro (EC95) 12 1.97 1.63 2.11 2.34 2.11 1.99 2.02 2.11 2.11
Energy related CO2 emissions chemical industries, kt 883 1033 1412 1496 1531 1616 1743 1588 1432 3 Energy related CO2 intensity
– chemical industry, t/Mio Euro Gross value-added chemical industry, Bio Euro
(EC95) 12 1.59 1.77 2.34 2.12 2.42 2.70 2.67 3.03 3.20
Energy related CO2 emissions glass, pottery and building materials18, kt 1 669 1 520 1 546 1 503 1 630 1 639 1 654 1 656 1 772
4 Energy related CO2 intensity – glass, pottery and building materials industry, t/Mio Euro Gross value-added – glass, pottery and buildings
materials industry, Bio Euro (EC95) 12 2.29 2.10 2.29 2.37 2.28 2.30 2.30 2.37 2.50
Total CO2 emissions from iron and steel, kt 8 511 8 716 9 437 9 368 10 123 10 164 10 181 11 461 11 556 5 Specific CO2 emissions of iron and steel industry, t/t
Production of oxygen steel, kt 3 921 4 538 5 183 5 346 5 647 5 707 5 901 6 408 6 487
Energy related CO2 emissions from glass, pottery and building materials19, kt 1 055 867 866 807 830 821 839 884 1 012
6 Specific energy related CO2 emissions of cement industry, t/t Cement production, kt 4 679 3 839 4 047 4 035 4 061 4 345 4 356 4 560 4 886
16 Updated values: Activity data is now consistent with emission data (based on fuel sold) 17 Total NACE 27 (thus also including non-ferrous metal industries) 18 SNAP 030311, 030317, 030319 19 SNAP 030311
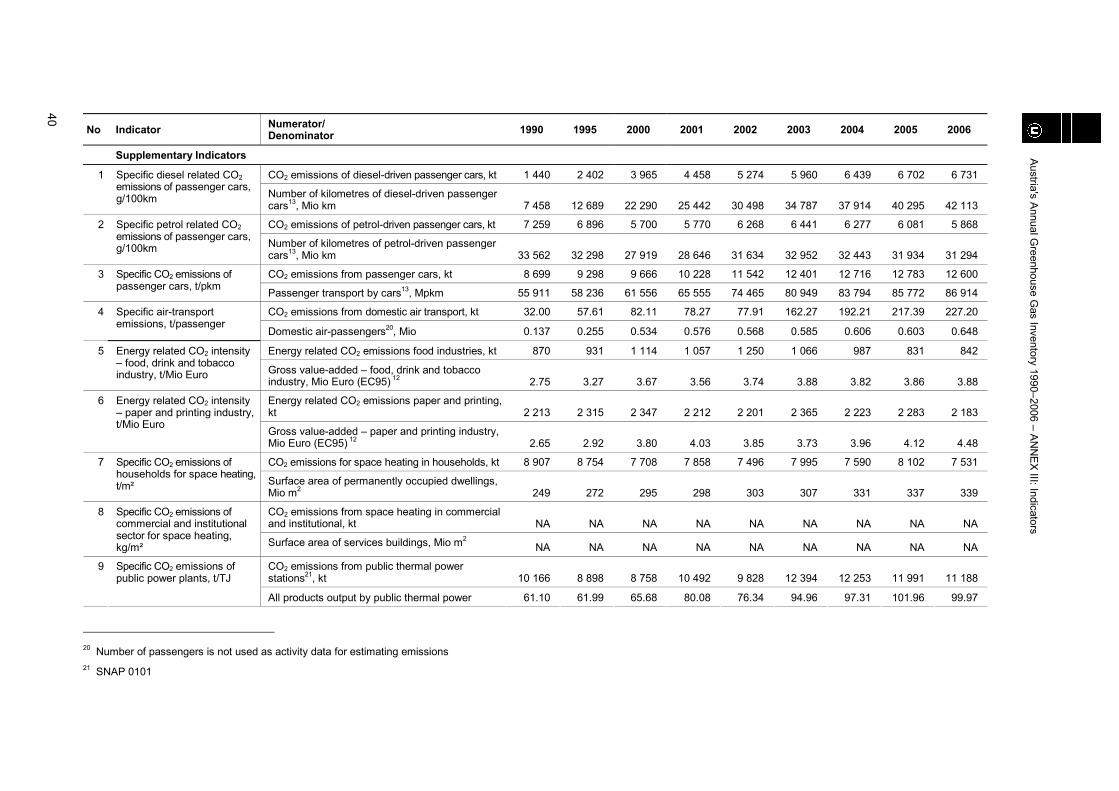
Austria's A
nnual Greenhouse G
as Inventory 1990–2006 – AN
NE
X III: Indicators
40 No Indicator Numerator/ Denominator 1990 1995 2000 2001 2002 2003 2004 2005 2006
Supplementary Indicators
CO2 emissions of diesel-driven passenger cars, kt 1 440 2 402 3 965 4 458 5 274 5 960 6 439 6 702 6 731 1 Specific diesel related CO2 emissions of passenger cars, g/100km Number of kilometres of diesel-driven passenger
cars13, Mio km 7 458 12 689 22 290 25 442 30 498 34 787 37 914 40 295 42 113
CO2 emissions of petrol-driven passenger cars, kt 7 259 6 896 5 700 5 770 6 268 6 441 6 277 6 081 5 868 2 Specific petrol related CO2 emissions of passenger cars, g/100km Number of kilometres of petrol-driven passenger
cars13, Mio km 33 562 32 298 27 919 28 646 31 634 32 952 32 443 31 934 31 294
CO2 emissions from passenger cars, kt 8 699 9 298 9 666 10 228 11 542 12 401 12 716 12 783 12 600 3 Specific CO2 emissions of passenger cars, t/pkm Passenger transport by cars13, Mpkm 55 911 58 236 61 556 65 555 74 465 80 949 83 794 85 772 86 914
CO2 emissions from domestic air transport, kt 32.00 57.61 82.11 78.27 77.91 162.27 192.21 217.39 227.20 4 Specific air-transport emissions, t/passenger
Domestic air-passengers20, Mio 0.137 0.255 0.534 0.576 0.568 0.585 0.606 0.603 0.648
Energy related CO2 emissions food industries, kt 870 931 1 114 1 057 1 250 1 066 987 831 842 5 Energy related CO2 intensity – food, drink and tobacco industry, t/Mio Euro Gross value-added – food, drink and tobacco
industry, Mio Euro (EC95) 12 2.75 3.27 3.67 3.56 3.74 3.88 3.82 3.86 3.88
Energy related CO2 emissions paper and printing, kt 2 213 2 315 2 347 2 212 2 201 2 365 2 223 2 283 2 183
6 Energy related CO2 intensity – paper and printing industry, t/Mio Euro Gross value-added – paper and printing industry,
Mio Euro (EC95) 12 2.65 2.92 3.80 4.03 3.85 3.73 3.96 4.12 4.48
CO2 emissions for space heating in households, kt 8 907 8 754 7 708 7 858 7 496 7 995 7 590 8 102 7 531 7 Specific CO2 emissions of households for space heating, t/m² Surface area of permanently occupied dwellings,
Mio m2 249 272 295 298 303 307 331 337 339
CO2 emissions from space heating in commercial and institutional, kt NA NA NA NA NA NA NA NA NA
8 Specific CO2 emissions of commercial and institutional sector for space heating, kg/m² Surface area of services buildings, Mio m2 NA NA NA NA NA NA NA NA NA
CO2 emissions from public thermal power stations21, kt 10 166 8 898 8 758 10 492 9 828 12 394 12 253 11 991 11 188
9 Specific CO2 emissions of public power plants, t/TJ
All products output by public thermal power 61.10 61.99 65.68 80.08 76.34 94.96 97.31 101.96 99.97
20 Number of passengers is not used as activity data for estimating emissions 21 SNAP 0101

Austria's A
nnual Greenhouse G
as Inventory 1990–2006 – AN
NE
X III: Indicators
41
No Indicator Numerator/ Denominator 1990 1995 2000 2001 2002 2003 2004 2005 2006
stations, PJ
CO2 emissions from autoproducers, kt 3 391 4 413 3 265 3 580 3 761 3 803 4 530 4 713 4 593 10 Specific CO2 emissions of autoproducer plants, t/TJ All products output by autoproducer thermal
power stations, PJ 20.16 26.24 27.76 25.97 27.02 26.44 28.54 29.05 31.86
CO2 emissions from classical power production, kt 5 771 4 266 6 137 7 214 6 587 8 634 8 013 8 071 7 008
11 Carbon intensity of total power generation, t/TJ
All products output by public and autoproducer power stations, PJ 32.89 27.24 43.98 51.72 44.20 56.25 51.13 58.18 48.88
CO2 emissions from transport, kt 12 426 14 484 17 745 18 903 20 761 22 684 23 290 24 014 22 808 12 Carbon intensity of transport, t/TJ Total final energy consumption from transport22,
PJ 195.31 225.52 268.23 280.17 298.78 318.36 329.85 343.81 336.72
Energy related CO2 emissions paper and printing industries, kt 2 213 2 315 2 347 2 212 2 201 2 365 2 223 2 283 2 183
13 Specific energy related CO2 emissions of paper industry, t/t Physical output of paper, kt 2 932 3 599 4 385 4 250 4 419 4 564 4 852 4 950 5 213
CO2 emissions from the industry sector, kt 13 445 14 168 14 491 14 414 14 776 15 190 15 275 15 908 15 812 14
Total final energy consumption from industry23, PJ 228.67 235.52 283.73 284.73 289.61 292.82 304.02 309.80 318.54
CO2 emissions from households, kt 9 906 9 858 8 805 9 021 8 624 9 207 8 742 9 344 8 666 15
Total final energy consumption from households24, PJ 242.43 262.94 258.94 272.03 264.98 278.67 269.31 284.82 276.13
22 Including Off-Road Transport, Pipelines and International Aviation 23 Including Heat 24 Including District heating and Solar thermal
ISBN 3-85457-926-8
Umweltbundesamt GmbHSpittelauer Lände 51090 Wien/Österreich
Tel.: +43-(0)1-313 04Fax: +43-(0)1-313 04/[email protected]
Im Bericht “Austria's annual greenhouse gas inventory 1990–2006”präsentiert das Umweltbundesamt die neueste Entwicklung derTreibhausgasemissionen in Österreich.
Die Menge an Treibhausgasemissionen liegt im Jahr 2006 bei 91,1 Mio.Tonnen CO2-Äquivalenten. Dies entspricht einer Verminderung um2,2 Mio. Tonnen oder 2,3 % gegenüber 2005 und einem Anstieg von15,1 % gegenüber dem Kyoto-Basisjahr 1990. Treibende Kräfte gegen-über 2005 sind der Rückgang der Kohlendioxid-Emissionen in denSektoren Verkehr, Energieaufbringung und Raumwärme.
Der englische Bericht folgt in Format und Inhalt den verbindlichenAnforderungen des Treibhausgas-Überwachungssystems 280/2004/EGder EU zur Umsetzung des Kyoto-Protokolls. Darin ist die jährlicheÜbermittlung von aktualisierten Treibhausgas-Emissionsdaten mit15. Jänner an die Europäische Kommission verankert.