Localiza institucional eng versao final
48
1 June, 2013
Transcript of Localiza institucional eng versao final
1June, 2013
2
1. Company overview
2. Main business divisions
� Car rental
� Fleet rental
� Seminovos
3. Consolidated
4. Debt and cash
5. Appendix
� Earnings release 1Q13
Agenda
3
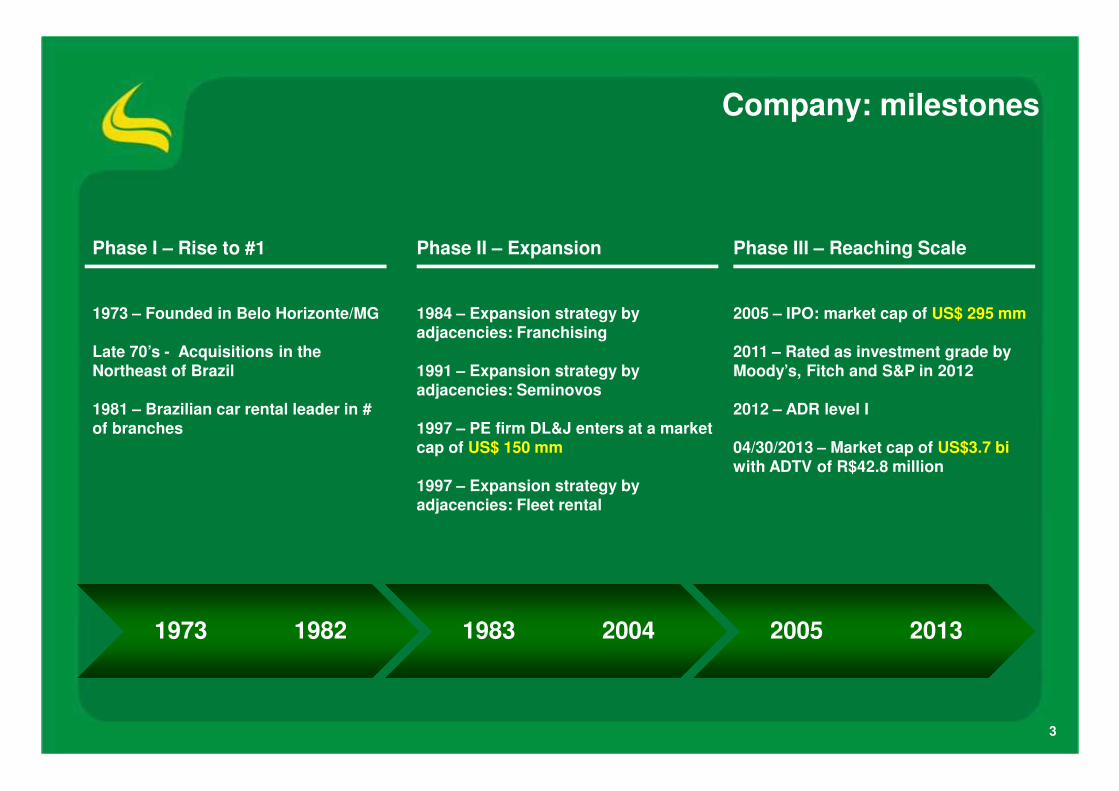
Company: milestones
Phase I – Rise to #1
1973 – Founded in Belo Horizonte/MG
Late 70’s - Acquisitions in the Northeast of Brazil
1981 – Brazilian car rental leader in # of branches
Phase II – Expansion
1984 – Expansion strategy by adjacencies: Franchising
1991 – Expansion strategy by adjacencies: Seminovos
1997 – PE firm DL&J enters at a market cap of US$ 150 mm
1997 – Expansion strategy by adjacencies: Fleet rental
Phase III – Reaching Scale
2005 – IPO: market cap of US$ 295 mm
2011 – Rated as investment grade by Moody’s, Fitch and S&P in 2012
2012 – ADR level I
04/30/2013 – Market cap of US$3.7 biwith ADTV of R$42.8 million
1973 1982 1983 2004 2005 2013

4
Company: integrated business platform
This integrated business platform gives Localiza flexibility and superior performance.
Based on the 1Q13
Synergies:
bargaining power
cost reduction
cross selling
� 15,103 cars
� 200 locations in Brazil
� 55 locations in South America
� 41 employees
� 61.3% sold to final consumer
� 74 stores
� 1,015 employees
�64,043 cars
�3.5 million clients
�278 locations
�4,448 employees
� 32,212 cars
� 741 clients
� 358 employees
5
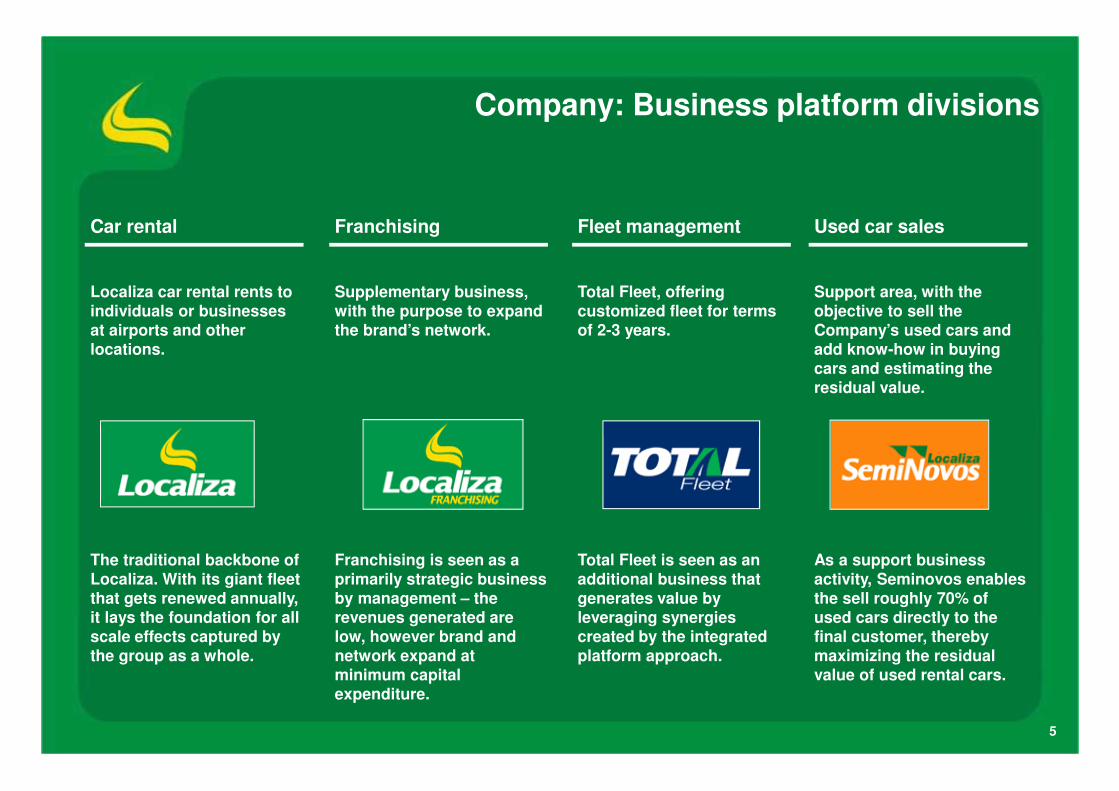
Company: Business platform divisions
Car rental
Localiza car rental rents to individuals or businesses at airports and other locations.
The traditional backbone of Localiza. With its giant fleet that gets renewed annually, it lays the foundation for all scale effects captured by the group as a whole.
Fleet management
Total Fleet, offering customized fleet for terms of 2-3 years.
Total Fleet is seen as an additional business that generates value by leveraging synergies created by the integrated platform approach.
Used car sales
Support area, with the objective to sell the Company’s used cars and add know-how in buying cars and estimating the residual value.
As a support business activity, Seminovos enables the sell roughly 70% of used cars directly to the final customer, thereby maximizing the residual value of used rental cars.
Franchising
Supplementary business, with the purpose to expand the brand’s network.
Franchising is seen as a primarily strategic business by management – the revenues generated are low, however brand and network expand at minimum capital expenditure.
6
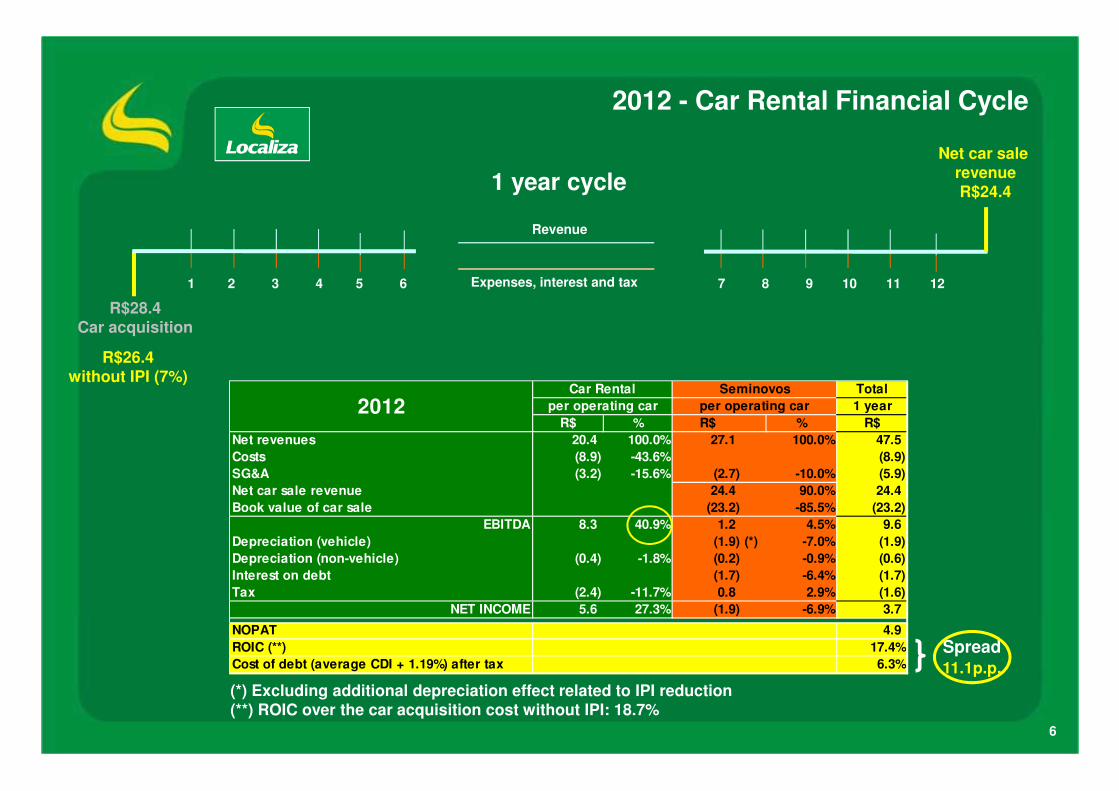
R$28.4Car acquisition
Net car salerevenue R$24.41 year cycle
2012 - Car Rental Financial Cycle
R$26.4without IPI (7%)
1 2 3 4 5 6 7 8 9 10 11 12Expenses, interest and tax
Revenue
(*) Excluding additional depreciation effect related to IPI reduction(**) ROIC over the car acquisition cost without IPI: 18.7%
Spread11.1p.p.
Total
1 year
R$ % R$ % R$
Net revenues 20.4 100.0% 27.1 100.0% 47.5
Costs (8.9) -43.6% (8.9)
SG&A (3.2) -15.6% (2.7) -10.0% (5.9)
Net car sale revenue 24.4 90.0% 24.4
Book value of car sale (23.2) -85.5% (23.2)
EBITDA 8.3 40.9% 1.2 4.5% 9.6
Depreciation (vehicle) (1.9) (*) -7.0% (1.9)
Depreciation (non-vehicle) (0.4) -1.8% (0.2) -0.9% (0.6)
Interest on debt (1.7) -6.4% (1.7)
Tax (2.4) -11.7% 0.8 2.9% (1.6)
NET INCOME 5.6 27.3% (1.9) -6.9% 3.7
NOPAT 4.9
ROIC (**) 17.4%
Cost of debt (average CDI + 1.19%) after tax 6.3%
per operating car per operating car2012Car Rental Seminovos
7
R$36.1Car acquisition
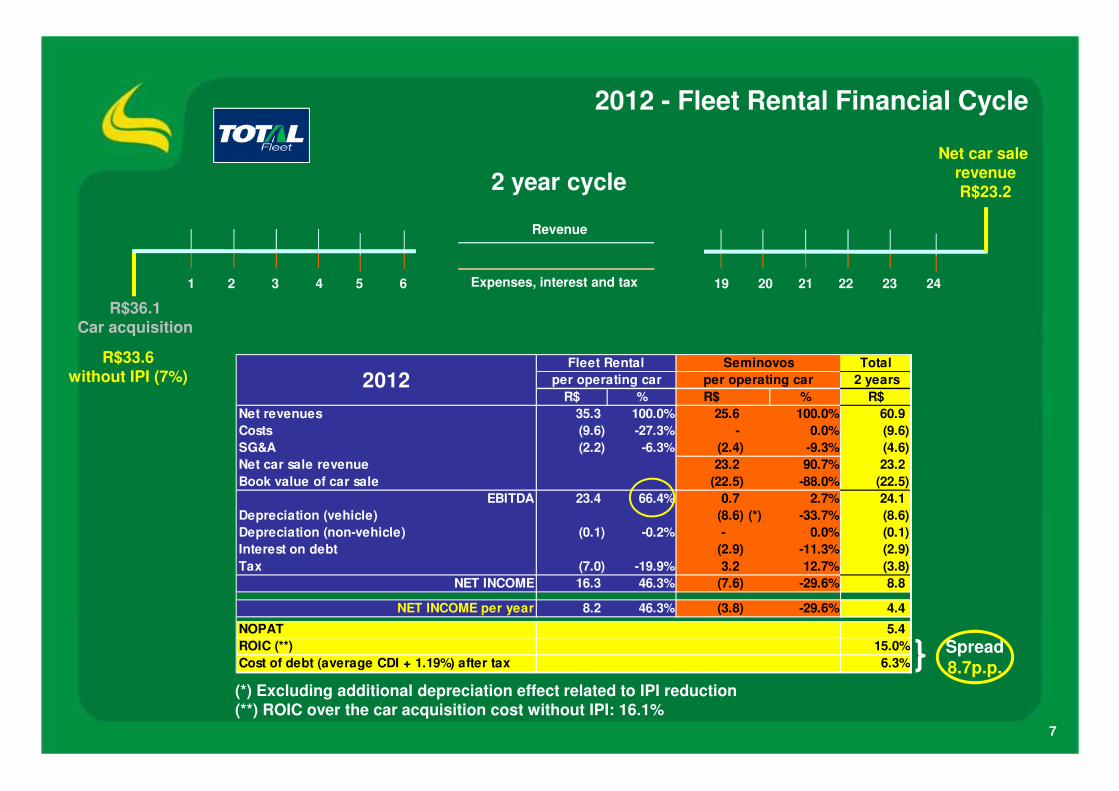
Net car salerevenue R$23.22 year cycle
2012 - Fleet Rental Financial Cycle
Spread8.7p.p.
R$33.6without IPI (7%)
1 2 3 4 5 6 19 20 21 22 23 24Expenses, interest and tax
Revenue
(*) Excluding additional depreciation effect related to IPI reduction(**) ROIC over the car acquisition cost without IPI: 16.1%
Total
2 years
R$ % R$ % R$
Net revenues 35.3 100.0% 25.6 100.0% 60.9
Costs (9.6) -27.3% - 0.0% (9.6)
SG&A (2.2) -6.3% (2.4) -9.3% (4.6)
Net car sale revenue 23.2 90.7% 23.2
Book value of car sale (22.5) -88.0% (22.5)
EBITDA 23.4 66.4% 0.7 2.7% 24.1
Depreciation (vehicle) (8.6) (*) -33.7% (8.6)
Depreciation (non-vehicle) (0.1) -0.2% - 0.0% (0.1)
Interest on debt (2.9) -11.3% (2.9)
Tax (7.0) -19.9% 3.2 12.7% (3.8)
NET INCOME 16.3 46.3% (7.6) -29.6% 8.8
NET INCOME per year 8.2 46.3% (3.8) -29.6% 4.4
NOPAT 5.4
ROIC (**) 15.0%
Cost of debt (average CDI + 1.19%) after tax 6.3%
2012Fleet Rental Seminovos
per operating car per operating car
8
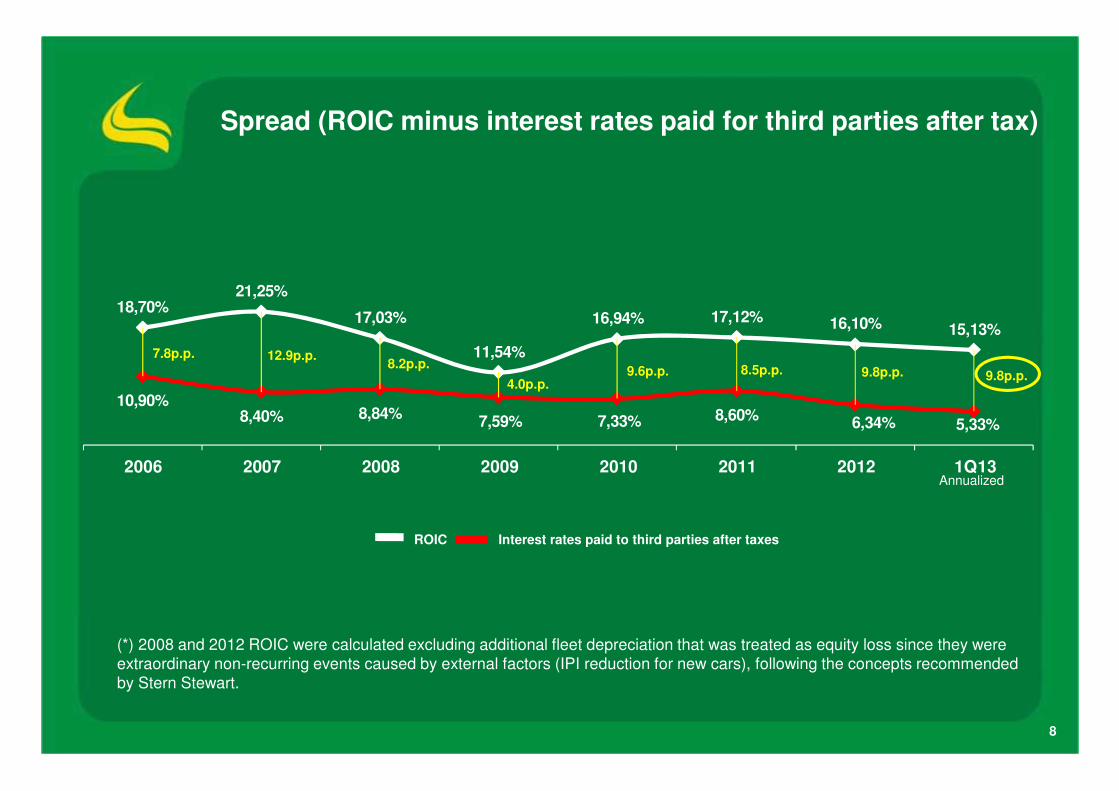
Spread (ROIC minus interest rates paid for third parties after tax)
10,90%8,40% 8,84%
7,59% 7,33% 8,60% 6,34% 5,33%
18,70%21,25%
17,03%
11,54%
16,94% 17,12% 16,10% 15,13%
2006 2007 2008 2009 2010 2011 2012 1Q13
7.8p.p. 12.9p.p.8.2p.p.
4.0p.p.9.6p.p. 8.5p.p. 9.8p.p.
Annualized
9.8p.p.
ROIC Interest rates paid to third parties after taxes
(*) 2008 and 2012 ROIC were calculated excluding additional fleet depreciation that was treated as equity loss since they were extraordinary non-recurring events caused by external factors (IPI reduction for new cars), following the concepts recommended by Stern Stewart.
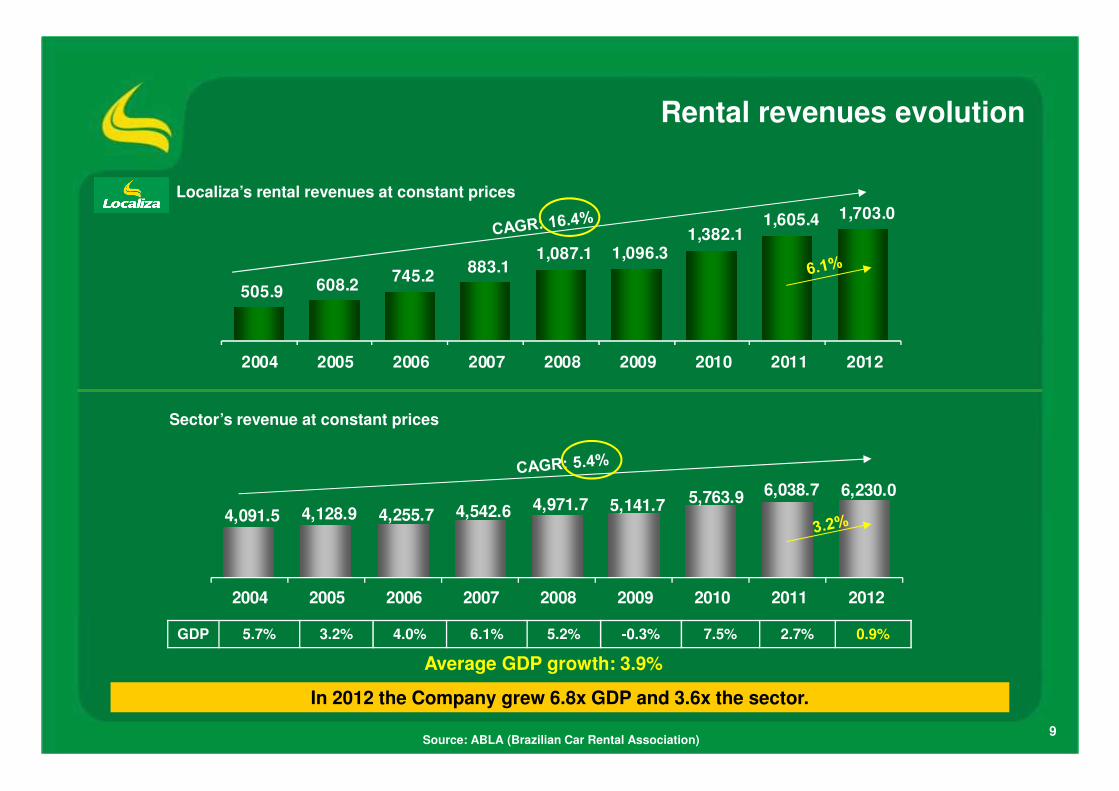
505.9 608.2 745.2
883.1 1,087.1 1,096.3
1,382.1 1,605.4 1,703.0
2004 2005 2006 2007 2008 2009 2010 2011 2012
9
Rental revenues evolution
4,091.5 4,128.9 4,255.7 4,542.6 4,971.7 5,141.7 5,763.9 6,038.7 6,230.0
2004 2005 2006 2007 2008 2009 2010 2011 2012
Localiza’s rental revenues at constant prices
Sector’s revenue at constant prices
In 2012 the Company grew 6.8x GDP and 3.6x the sector.
GDP 5.7% 3.2% 4.0% 6.1% 5.2% -0.3% 7.5% 2.7% 0.9%
Average GDP growth: 3.9%
Source: ABLA (Brazilian Car Rental Association)
10
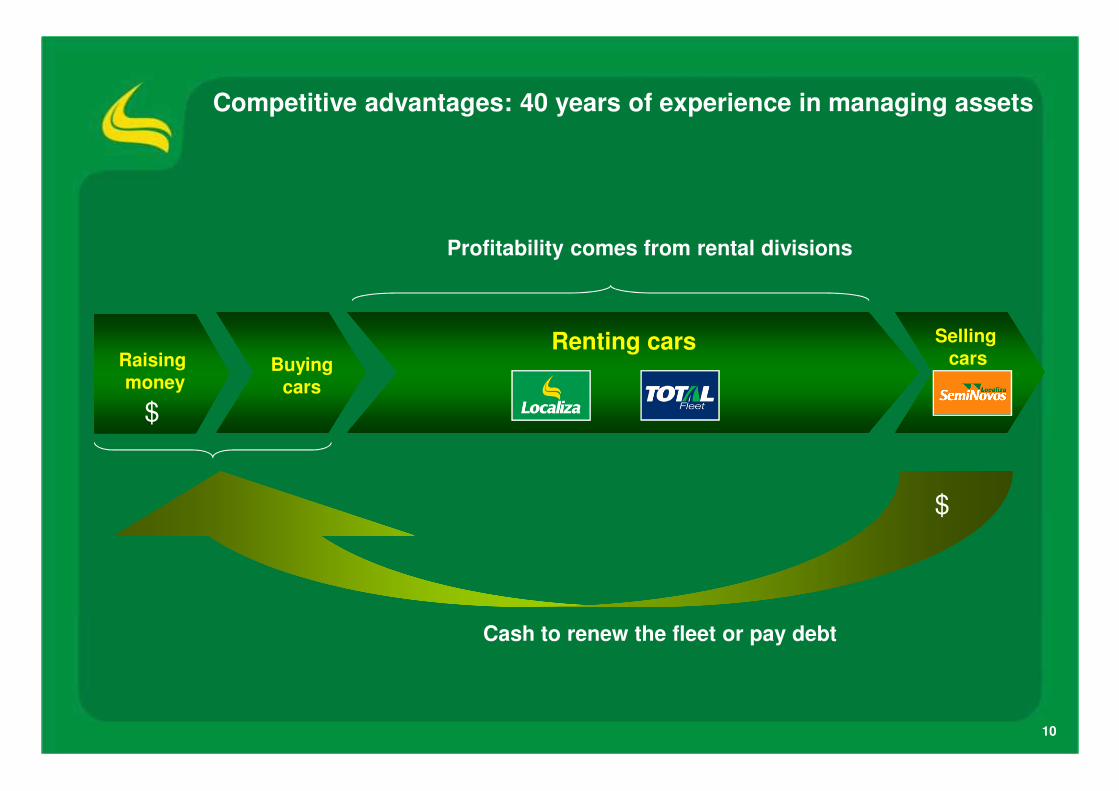
Raising money
Renting cars Selling carsBuying
cars
Cash to renew the fleet or pay debt
$
$
Profitability comes from rental divisions
Competitive advantages: 40 years of experience in managing assets
11
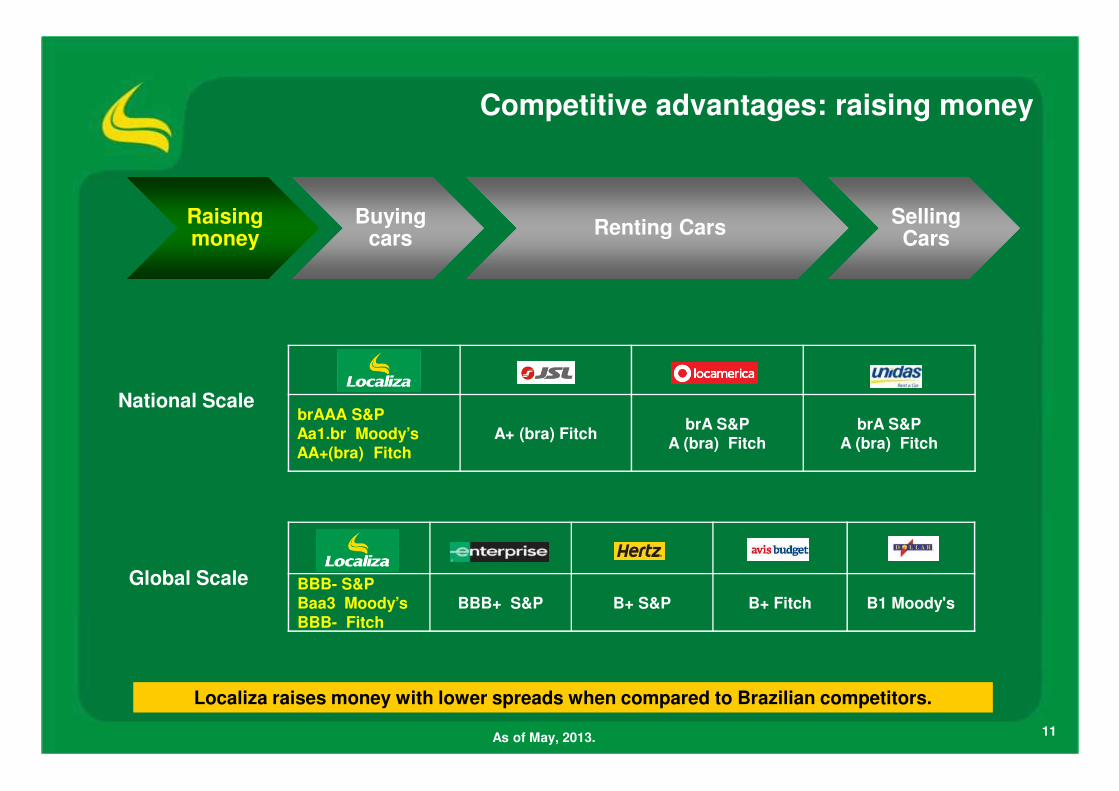
Competitive advantages: raising money
Global Scale
National Scale
Localiza raises money with lower spreads when compared to Brazilian competitors.
As of May, 2013.
BBB- S&PBaa3 Moody’sBBB- Fitch
BBB+ S&P B+ S&P B+ Fitch B1 Moody's
brAAA S&P Aa1.br Moody’sAA+(bra) Fitch
A+ (bra) FitchbrA S&P
A (bra) FitchbrA S&P
A (bra) Fitch
Raisingmoney
Buyingcars
Renting CarsSellingCars
12
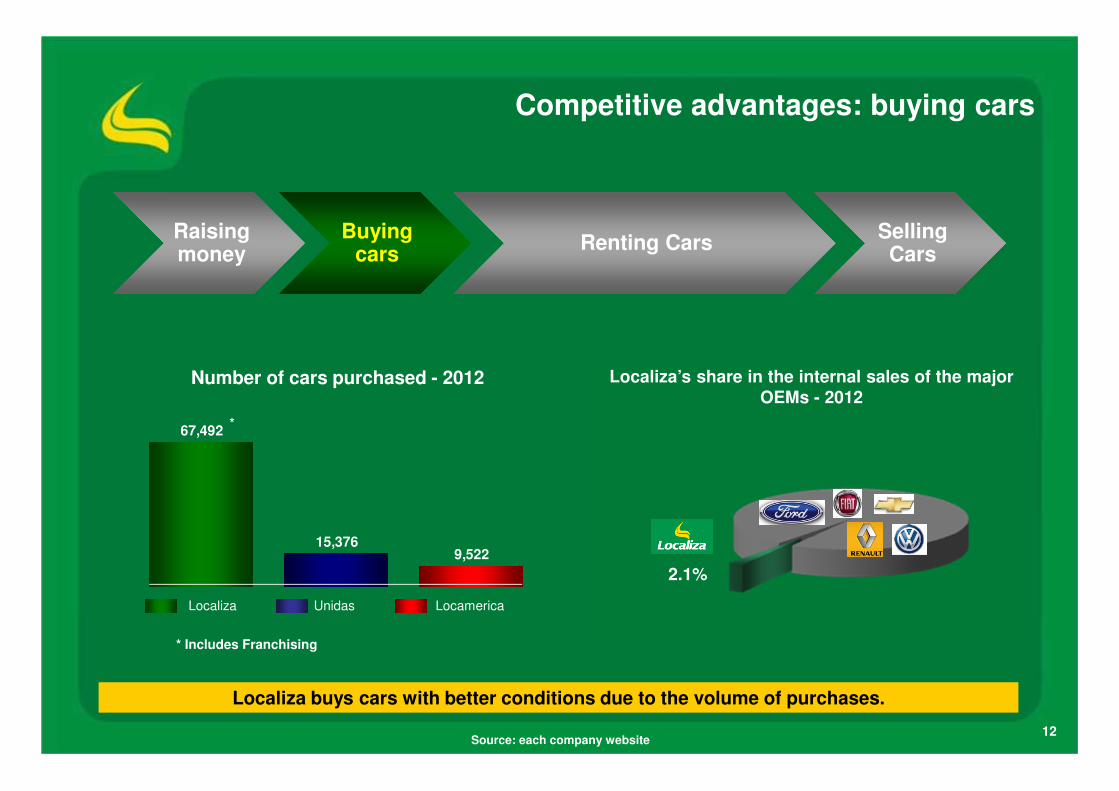
Competitive advantages: buying cars
Localiza buys cars with better conditions due to the volume of purchases.
Number of cars purchased - 2012
* Includes Franchising
Localiza Unidas Locamerica
67,492
15,3769,522
*
Source: each company website
Localiza’s share in the internal sales of the major OEMs - 2012
2.1%
Raisingmoney
Buyingcars
Renting CarsSellingCars
13
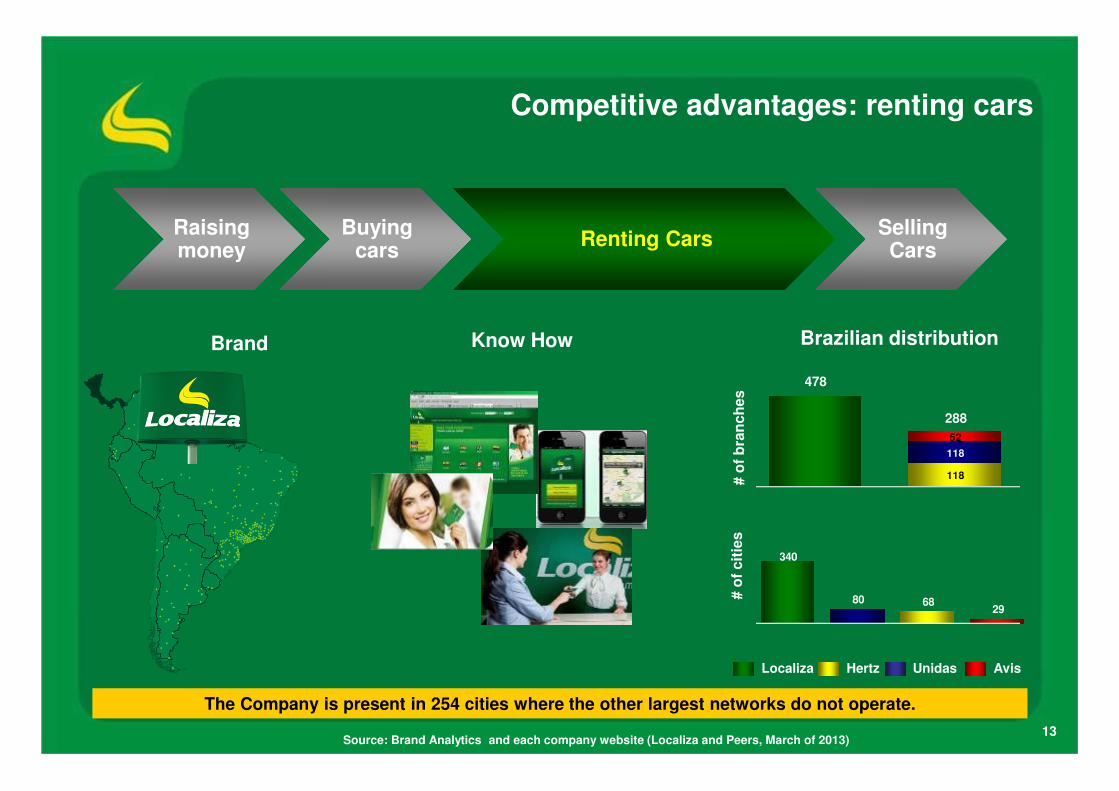
The Company is present in 254 cities where the other largest networks do not operate.
Competitive advantages: renting cars
Know HowBrand Brazilian distribution
# o
f b
ran
ch
es
# o
f cit
ies
Localiza Hertz Unidas Avis
Source: Brand Analytics and each company website (Localiza and Peers, March of 2013)
118
118
52
478
288
340
80 6829
Raisingmoney
Buyingcars
Renting CarsSellingCars
14
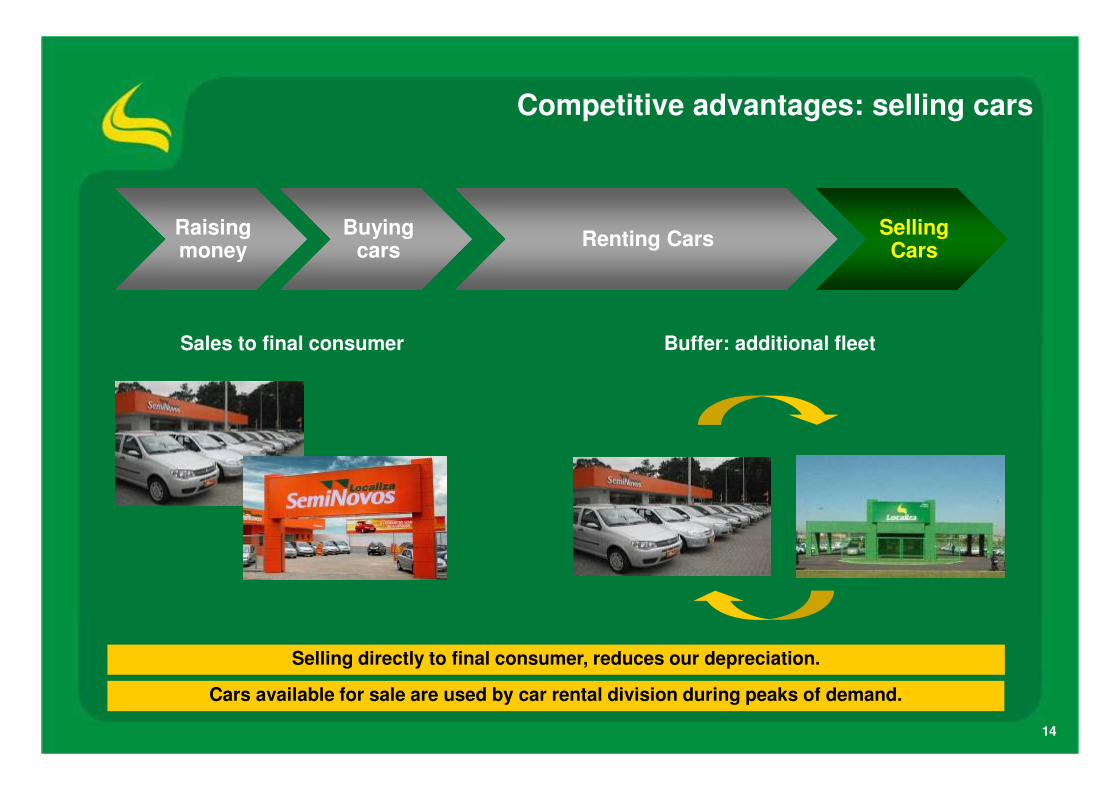
Sales to final consumer
Competitive advantages: selling cars
Selling directly to final consumer, reduces our depreciation.
Cars available for sale are used by car rental division during peaks of demand.
Raisingmoney
Buyingcars
Renting CarsSellingCars
Buffer: additional fleet
15
1. Company overview
2. Main business divisions
� Car rental
� Fleet rental
� Seminovos
3. Consolidated
4. Debt and cash
5. Appendix
� Earnings release 1Q13
Agenda
16
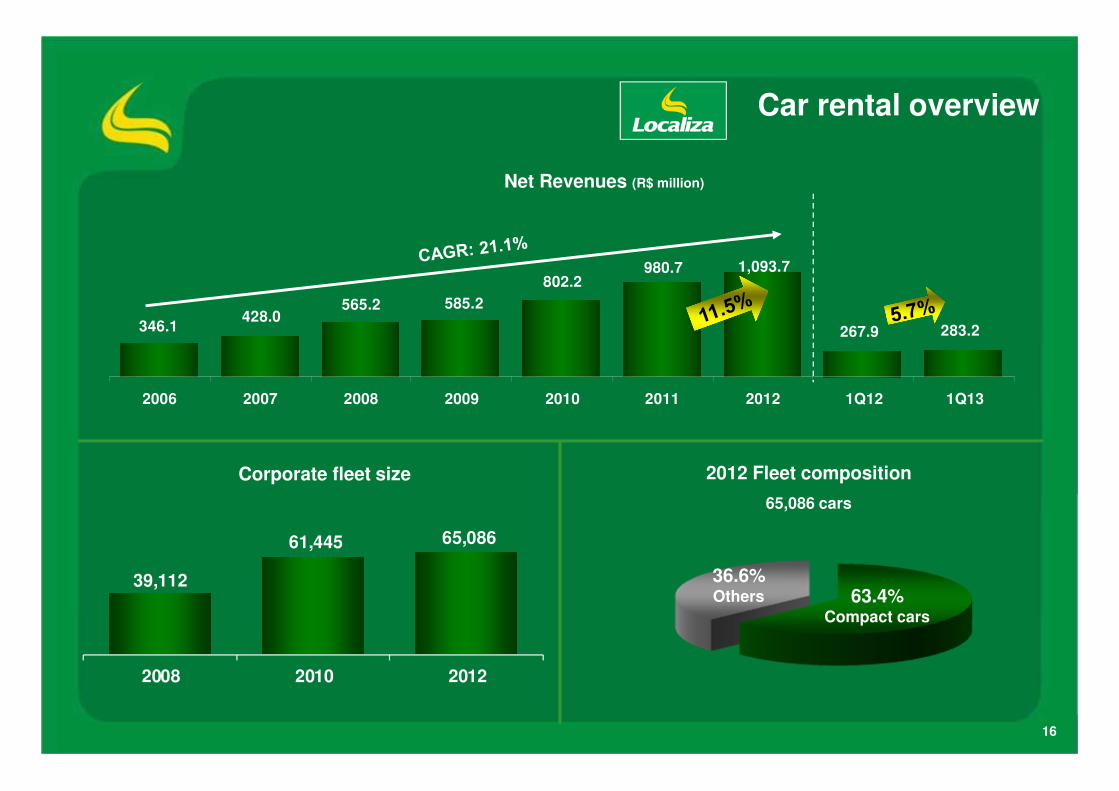
Car rental overview
63.4%Compact cars
2012 Fleet composition
65,086 cars
36.6%Others
Net Revenues (R$ million)
346.1428.0
565.2 585.2
802.2980.7 1,093.7
267.9 283.2
2006 2007 2008 2009 2010 2011 2012 1Q12 1Q13
Corporate fleet size
39,112
61,445 65,086
2008 2010 2012

17
Drivers
71
128154
179 193
2003 2009 2010 2011 2012
Air traffic passengers - millionInvestments in Brazil (2013-2016)(US$ 300 billion)
Source: BNDES, INFRAERO, IPEADATA and BCB
202
132
79 7251
36
GDP per capita
(R$ thousands)
6.9 7.5 8.4 9.5 10.7 11.7 12.8
14.2 16.0 16.6
19.0 21.3 22.4
2000 2001 2002 2003 2004 2005 2006 2007 2008 2009 2010 2011 2012
151180 200
240260 300
350380
415465
510545
622
51%
38%37% 35%
31%27%
22% 20%18% 16% 15% 15% 13%
2000 2001 2002 2003 2004 2005 2006 2007 2008 2009 2010 2011 2012
Monthly minimum salary (R$) Daily rental price over minimum salary (%)
Car rental affordability
18
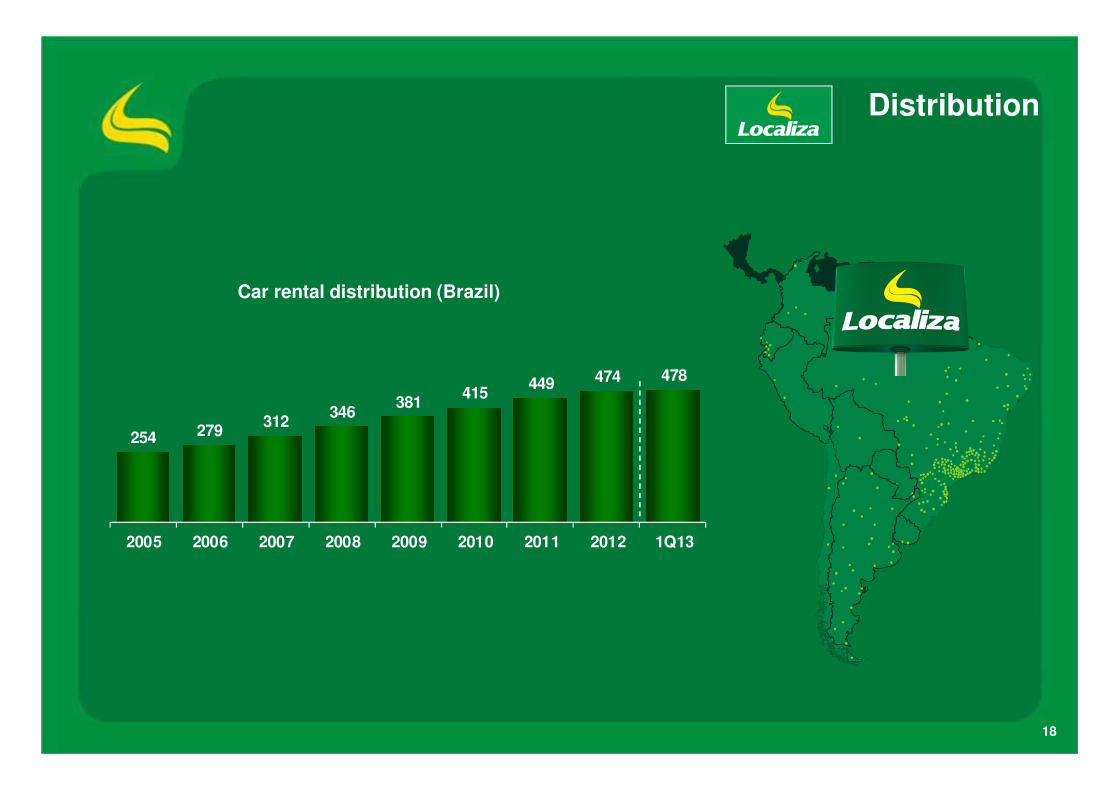
Distribution
254 279312
346381
415449 474 478
2005 2006 2007 2008 2009 2010 2011 2012 1Q13
Car rental distribution (Brazil)
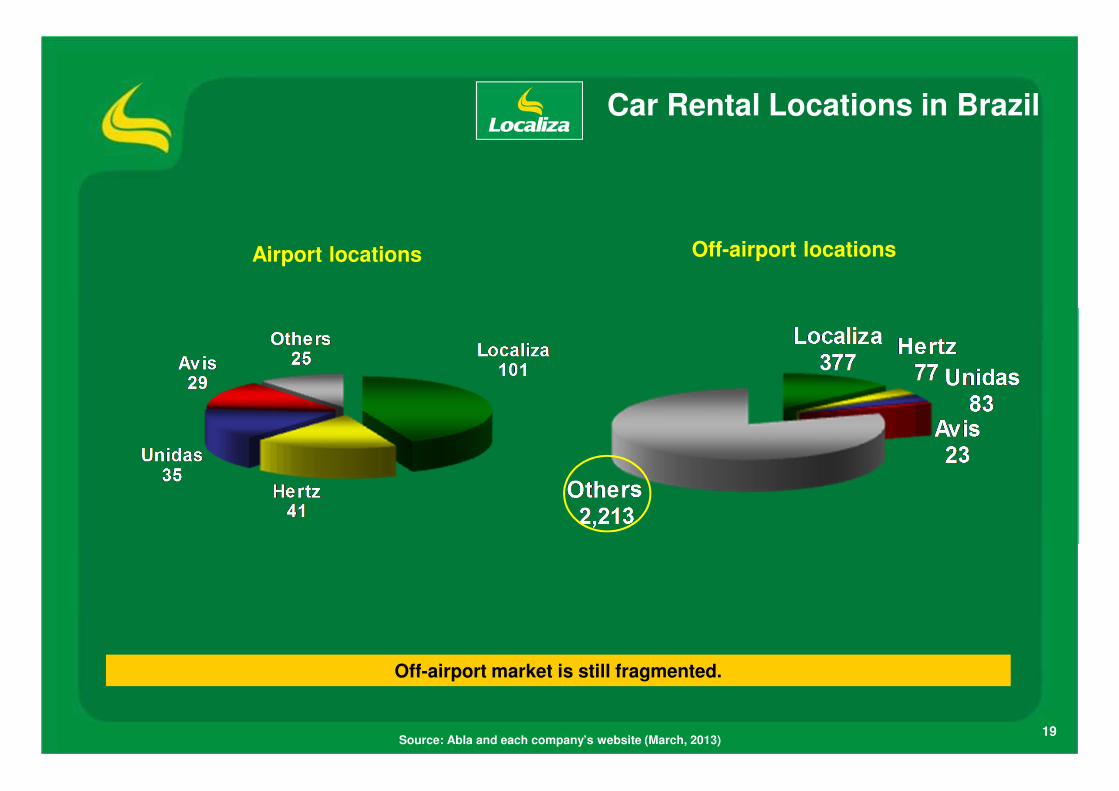
19Source: Abla and each company’s website (March, 2013)
Off-airport market is still fragmented.
Airport locations Off-airport locations
Car Rental Locations in Brazil

2012 Share – Car Rental
Source: ABLA, Companies’ Financial Statements, and Localiza’ estimates (breakdown only).20
36.7%
7.1%
Others50.0%
6.2%
RevenueR$3.083 billion
Unidas
Others58.1%
30.9%
4.6%
6.5%
Fleet210,506 cars
Unidas
Characteristics of Car Rental network:
� Complexity of management of network
� High fixed-cost structure
� Market consolidated in airports and fragmented in off-airport locations
� High barrier to entry
� Capital intensive
43.8%
35.5%
21
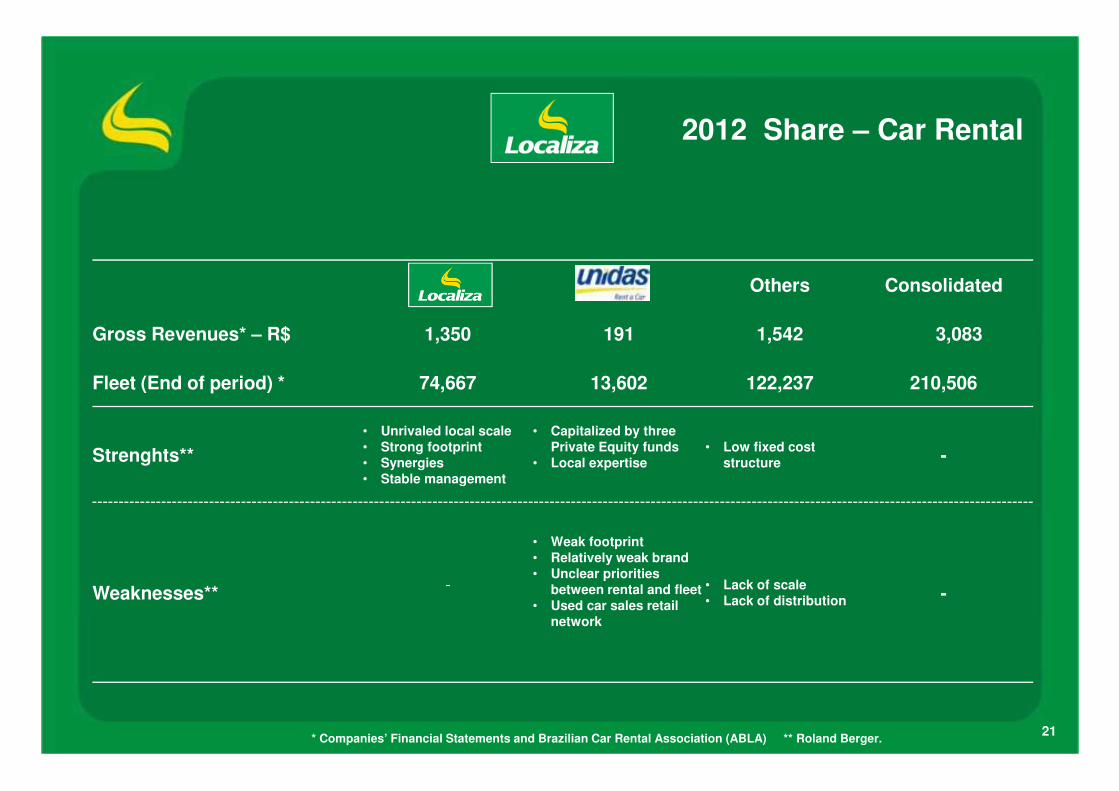
2012 Share – Car Rental
Others Consolidated
Gross Revenues* – R$ 1,350 191 1,542 3,083
Fleet (End of period) * 74,667 13,602 122,237 210,506
Strenghts**
• Unrivaled local scale• Strong footprint• Synergies• Stable management
• Capitalized by three Private Equity funds
• Local expertise• Low fixed cost
structure -
Weaknesses**---- • Weak footprint
• Relatively weak brand• Unclear priorities
between rental and fleet • Used car sales retail
network
• Lack of scale• Lack of distribution -
* Companies’ Financial Statements and Brazilian Car Rental Association (ABLA) ** Roland Berger.

22
1. Company overview
2. Main business divisions
� Car rental
� Fleet rental
� Seminovos
3. Consolidated
4. Debt and cash
5. Appendix
� Earnings release 1Q13
Agenda
23
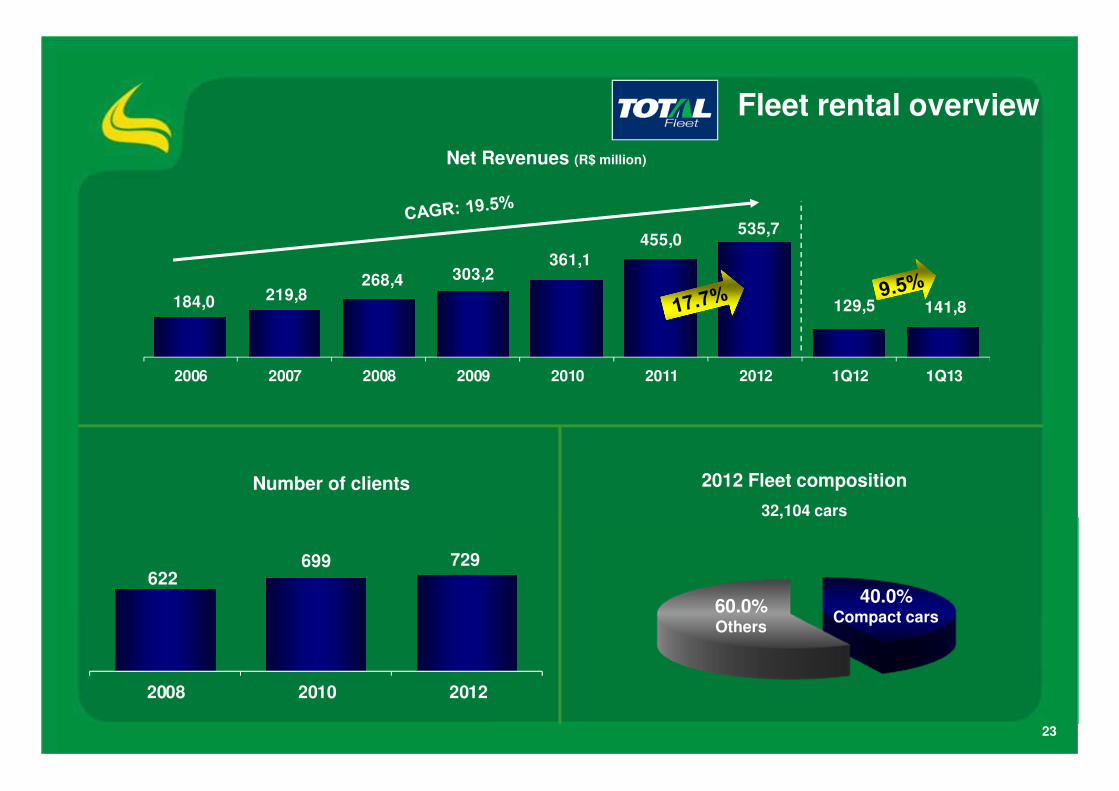
Number of clients
Fleet rental overview
40.0%Compact cars
2012 Fleet composition
32,104 cars
60.0%Others
622699 729
2008 2010 2012
Net Revenues (R$ million)
184,0 219,8 268,4 303,2
361,1 455,0
535,7
129,5 141,8
2006 2007 2008 2009 2010 2011 2012 1Q12 1Q13
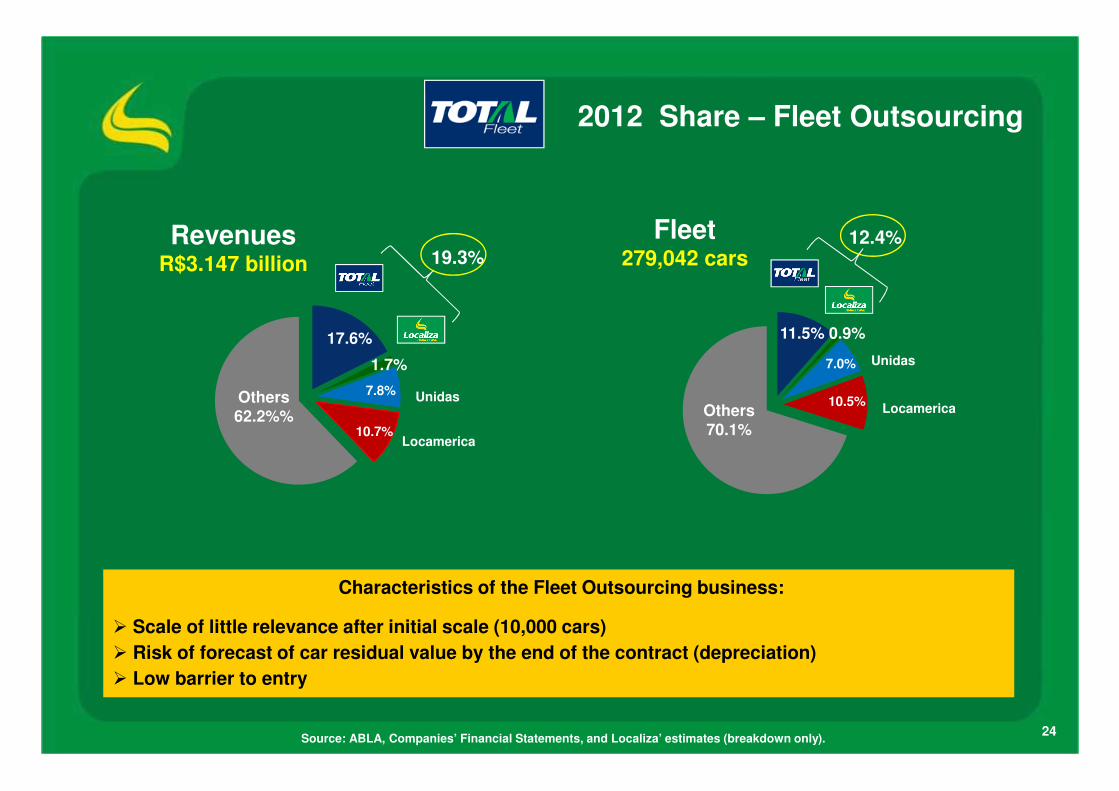
2012 Share – Fleet Outsourcing
Source: ABLA, Companies’ Financial Statements, and Localiza’ estimates (breakdown only).24
Others62.2%%
17.6%
1.7%
7.8%
10.7%
RevenuesR$3.147 billion
Unidas
Locamerica
Others70.1%
11.5% 0.9%
7.0%
10.5%
Fleet279,042 cars
Unidas
Locamerica
Characteristics of the Fleet Outsourcing business:
� Scale of little relevance after initial scale (10,000 cars)
� Risk of forecast of car residual value by the end of the contract (depreciation)
� Low barrier to entry
19.3%12.4%
25
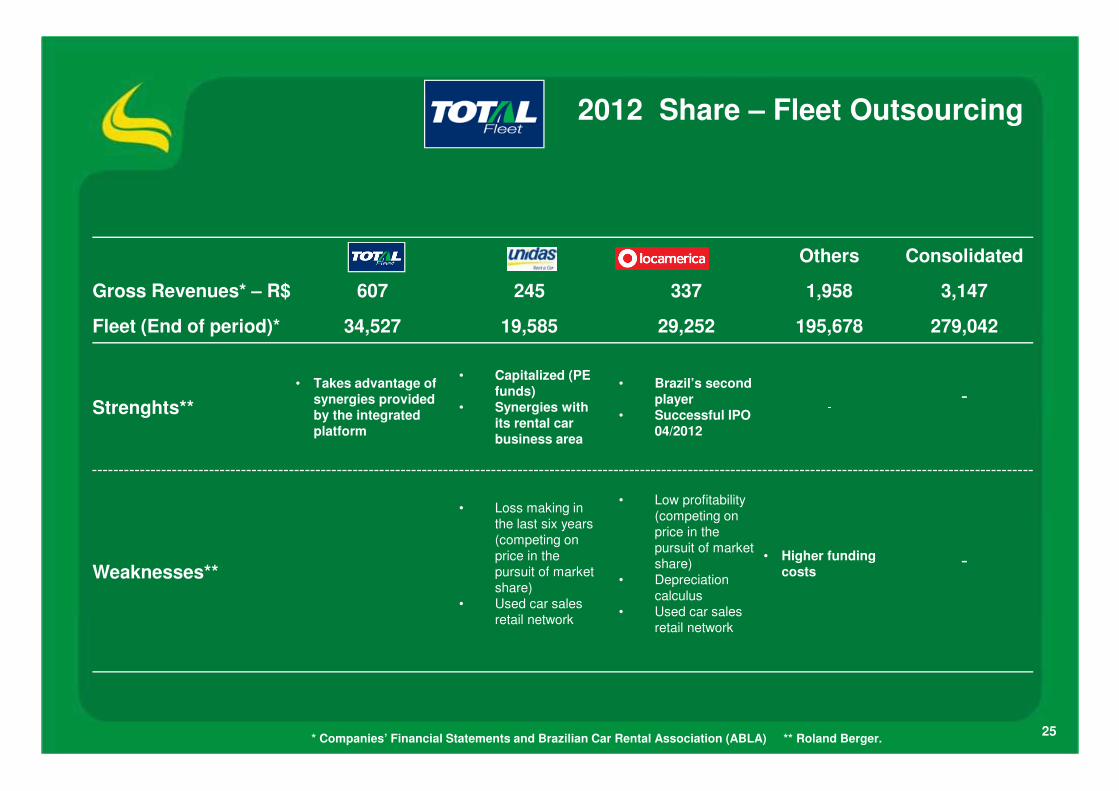
Others Consolidated
Gross Revenues* – R$ 607 245 337 1,958 3,147
Fleet (End of period)* 34,527 19,585 29,252 195,678 279,042
Strenghts**
• Takes advantage ofsynergies providedby the integratedplatform
• Capitalized (PE funds)
• Synergies with its rental car business area
• Brazil’s second player
• Successful IPO 04/2012
- -
Weaknesses**
• Loss making in the last six years (competing on price in the pursuit of market share)
• Used car sales retail network
• Low profitability (competing on price in the pursuit of market share)
• Depreciation calculus
• Used car sales retail network
• Higher fundingcosts
-
2012 Share – Fleet Outsourcing
* Companies’ Financial Statements and Brazilian Car Rental Association (ABLA) ** Roland Berger.

26Source: ABLA and Datamonitor
Less than 50% of targeted fleet is rented.
Outsourced fleet penetration
Corporate fleet:
5,167,444
Targeted fleet:
500,000
Rented fleet:
279,042
32,104
Brazilian Market World
5.4%8.9%
13.3%16.5%
24.5%
37.4%
46.9%
58.3%
Bra
zil
Poland
Cze
ch R
epublic
Ger
man
y
France
Spain Uk
Holla
nd
Drivers

27
1. Company overview
2. Main business divisions
� Car rental
� Fleet rental
� Seminovos
3. Consolidated
4. Debt and cash
5. Appendix
� Earnings release 1Q13
Agenda
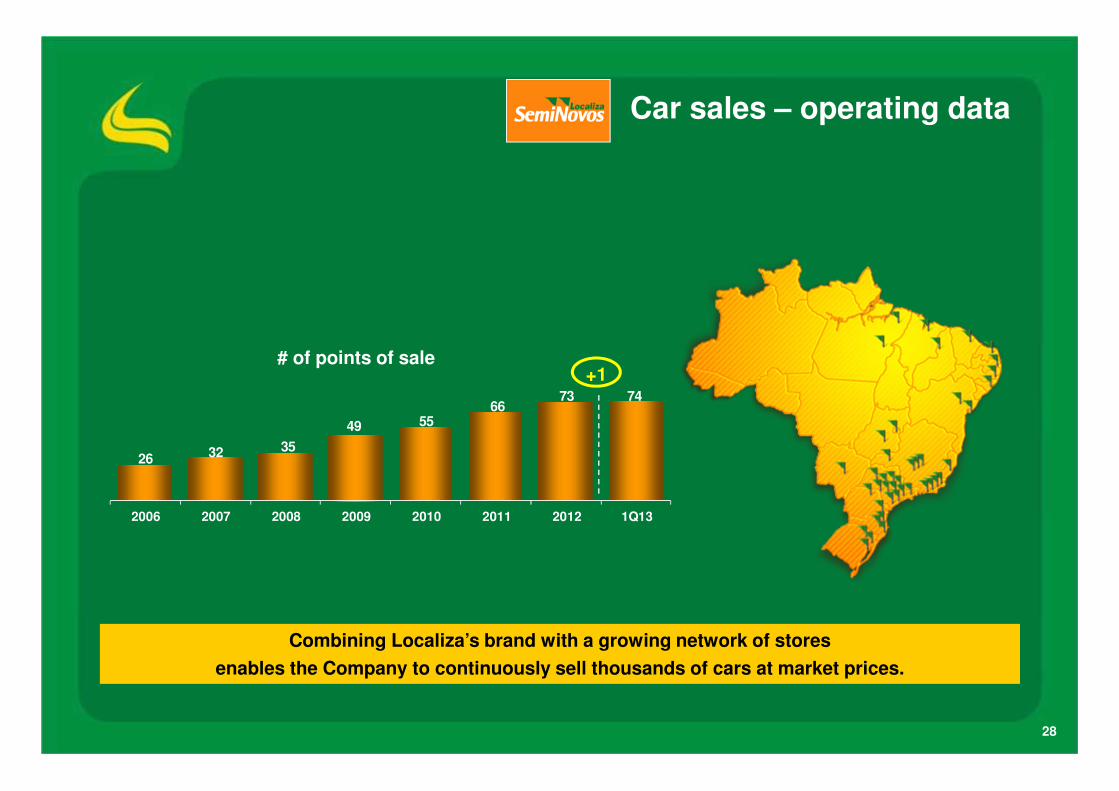
28
Combining Localiza’s brand with a growing network of stores
enables the Company to continuously sell thousands of cars at market prices.
# of points of sale
Car sales – operating data
26 32 35
49 5566
73 74
2006 2007 2008 2009 2010 2011 2012 1Q13
+1
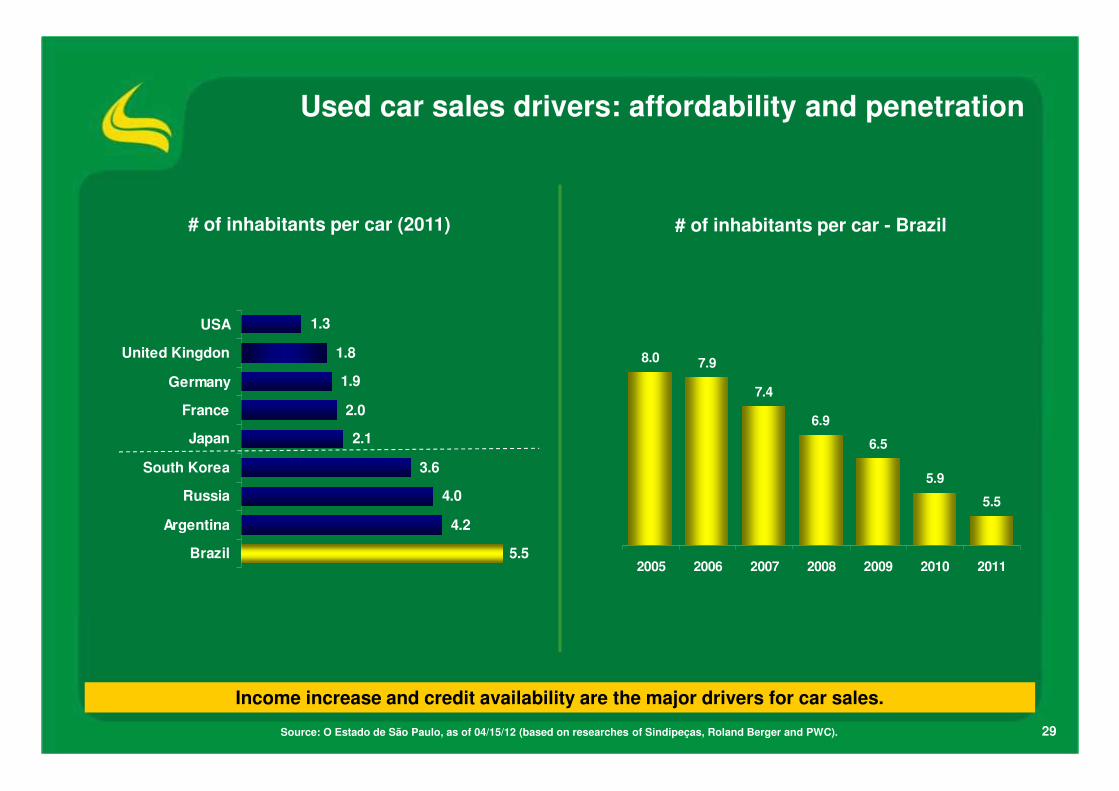
29
8.0 7.9
7.4
6.9
6.5
5.9
5.5
2005 2006 2007 2008 2009 2010 2011
Income increase and credit availability are the major drivers for car sales.
Source: O Estado de São Paulo, as of 04/15/12 (based on researches of Sindipeças, Roland Berger and PWC).
Used car sales drivers: affordability and penetration
# of inhabitants per car (2011) # of inhabitants per car - Brazil
5.5
4.2
4.0
3.6
2.1
2.0
1.9
1.8
1.3
Brazil
Argentina
Russia
South Korea
Japan
France
Germany
United Kingdon
USA
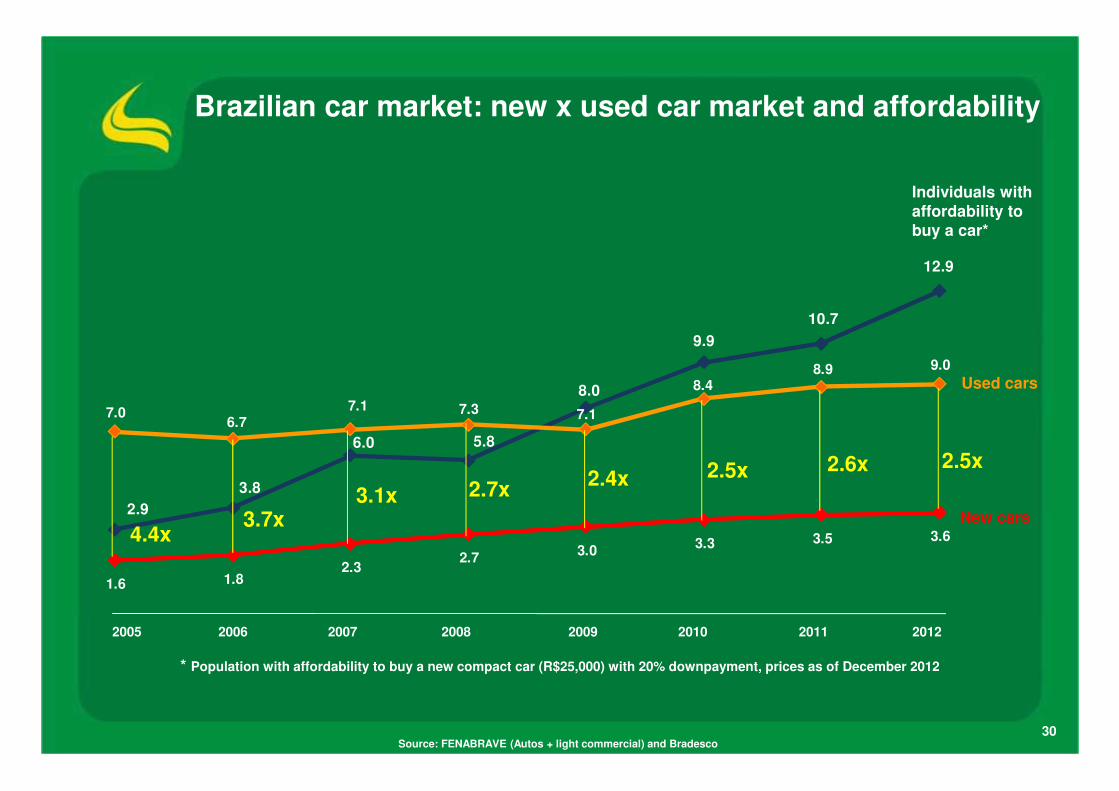
2.9
3.8
6.0 5.8
8.0
9.9
10.7
12.9
7.06.7
7.1 7.3 7.1
8.48.9 9.0
1.6 1.82.3
2.73.0
3.3 3.5 3.6
30
4.4x3.7x
3.1x 2.7x2.4x 2.5x 2.5x
2005 2006 2007 2008 2009 2010 2011 2012
2.6x
Brazilian car market: new x used car market and affordability
Individuals with affordability to buy a car*
New cars
Used cars
Source: FENABRAVE (Autos + light commercial) and Bradesco
* Population with affordability to buy a new compact car (R$25,000) with 20% downpayment, prices as of December 2012
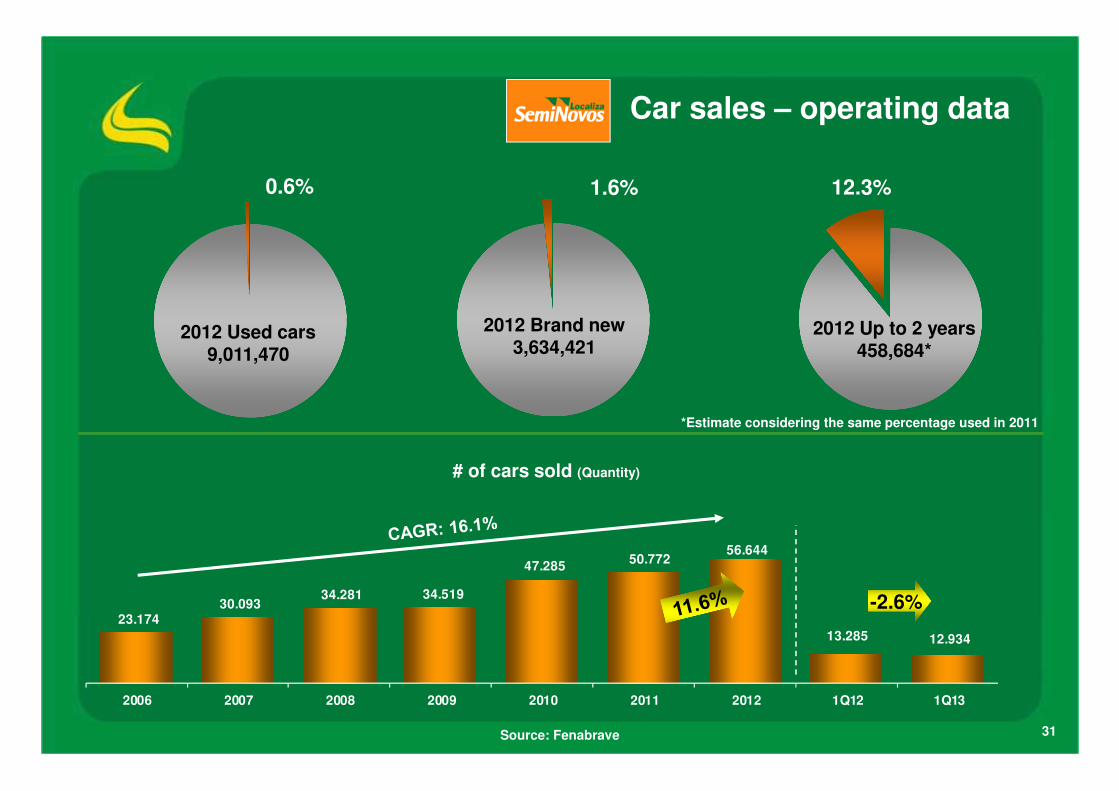
31
2012 Up to 2 years458,684*
2012 Brand new3,634,421
2012 Used cars9,011,470
0.6% 1.6% 12.3%
Car sales – operating data
*Estimate considering the same percentage used in 2011
Source: Fenabrave
23.174 30.093
34.281 34.519
47.285 50.772
56.644
13.285 12.934
2006 2007 2008 2009 2010 2011 2012 1Q12 1Q13
# of cars sold (Quantity)
-2.6%
32
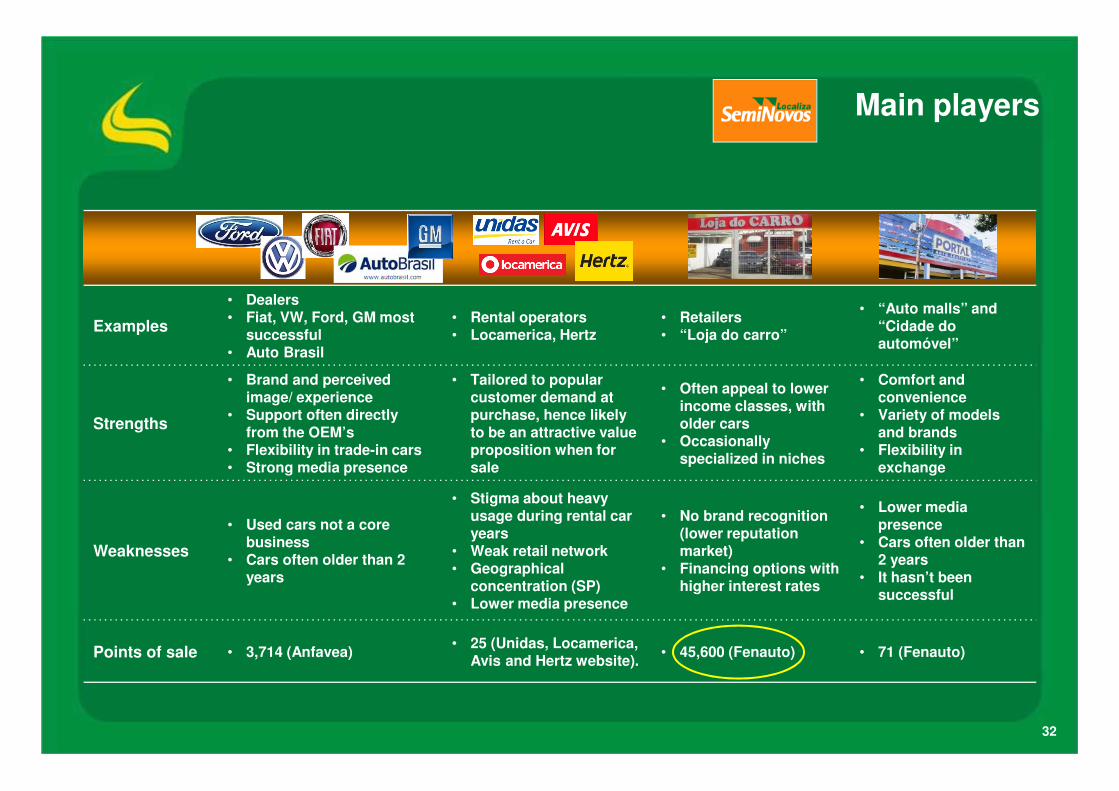
Examples
• Dealers• Fiat, VW, Ford, GM most
successful• Auto Brasil
• Rental operators• Locamerica, Hertz
• Retailers• “Loja do carro”
• “Auto malls” and “Cidade do automóvel”
Strengths
• Brand and perceived image/ experience
• Support often directly from the OEM’s
• Flexibility in trade-in cars• Strong media presence
• Tailored to popular customer demand at purchase, hence likely to be an attractive value proposition when for sale
• Often appeal to lower income classes, with older cars
• Occasionally specialized in niches
• Comfort and convenience
• Variety of models and brands
• Flexibility in exchange
Weaknesses
• Used cars not a core business
• Cars often older than 2 years
• Stigma about heavy usage during rental car years
• Weak retail network• Geographical
concentration (SP)• Lower media presence
• No brand recognition (lower reputation market)
• Financing options with higher interest rates
• Lower media presence
• Cars often older than 2 years
• It hasn’t been successful
Points of sale • 3,714 (Anfavea)• 25 (Unidas, Locamerica,
Avis and Hertz website).• 45,600 (Fenauto) • 71 (Fenauto)
Main players
33
1. Company overview
2. Main business divisions
� Car rental
� Fleet rental
� Seminovos
3. Consolidated
4. Debt and cash
5. Appendix
� Earnings release 1Q13
Agenda
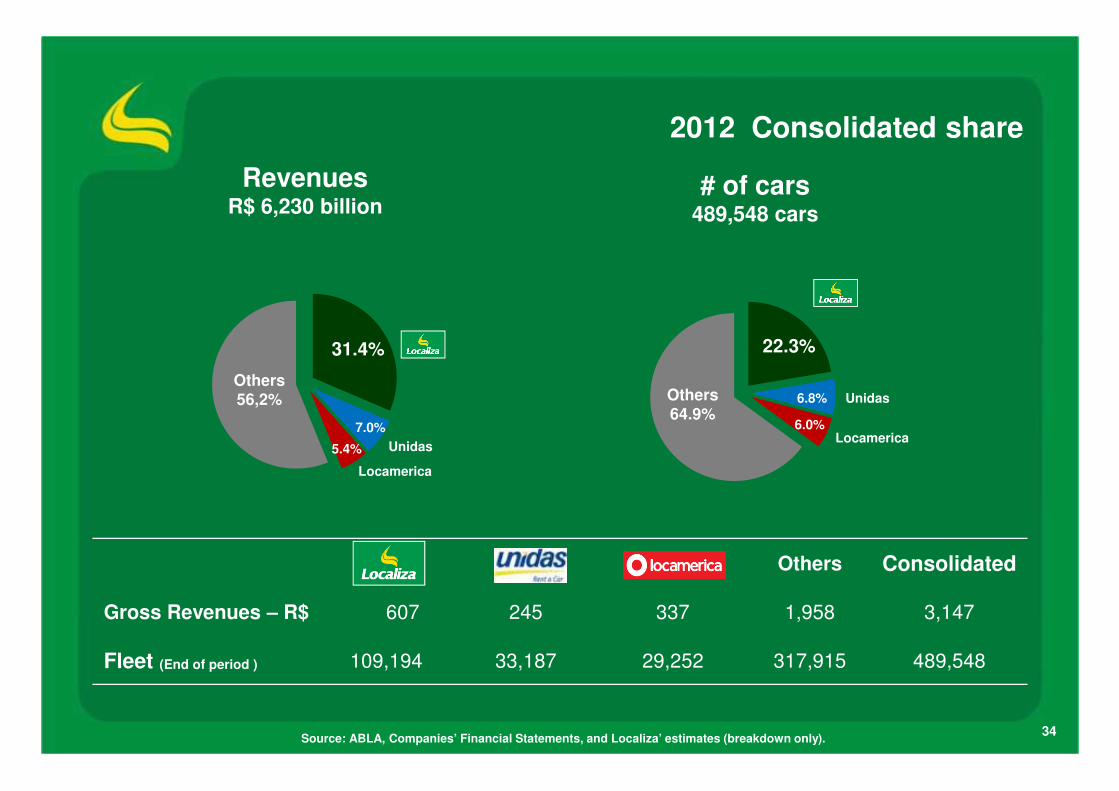
2012 Consolidated share
Source: ABLA, Companies’ Financial Statements, and Localiza’ estimates (breakdown only).34
Others Consolidated
Gross Revenues – R$ 607 245 337 1,958 3,147
Fleet (End of period ) 109,194 33,187 29,252 317,915 489,548
Others56,2%
31.4%
7.0%
5.4%
RevenuesR$ 6,230 billion
Unidas
Others64.9%
22.3%
6.8%
6.0%
# of cars489,548 cars
Unidas
Locamerica
Locamerica

35
2012 Consolidated breakdown
Revenues: R$3,166.7 million EBITDA: R$875.6 million
7%
41% 52%
48%
17%35%
Company’s profitability comes from Car Rental and Fleet Outsourcing Divisions.
EBIT*: R$465.8 million
42%
58%
*Seminovos results recorded in the Car Rental and Fleet Outsourcing Division.
36
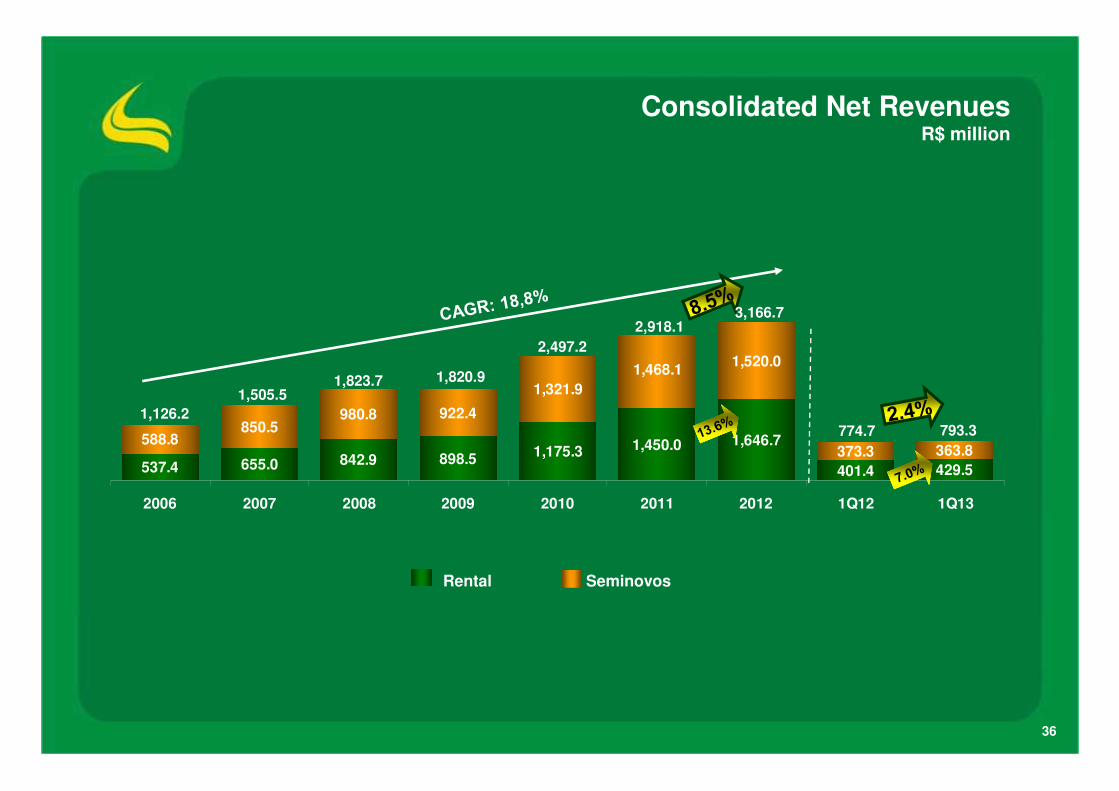
Consolidated Net RevenuesR$ million
537.4 655.0 842.9 898.51,175.3 1,450.0 1,646.7
401.4 429.5
588.8850.5
980.8 922.4
1,321.9
1,520.0
373.3 363.8
1,468.1
2006 2007 2008 2009 2010 2011 2012 1Q12 1Q13
1,126.2
1,505.51,823.7
2,918.1
774.7 793.3
1,820.9
2,497.2
3,166.7
Rental Seminovos
37
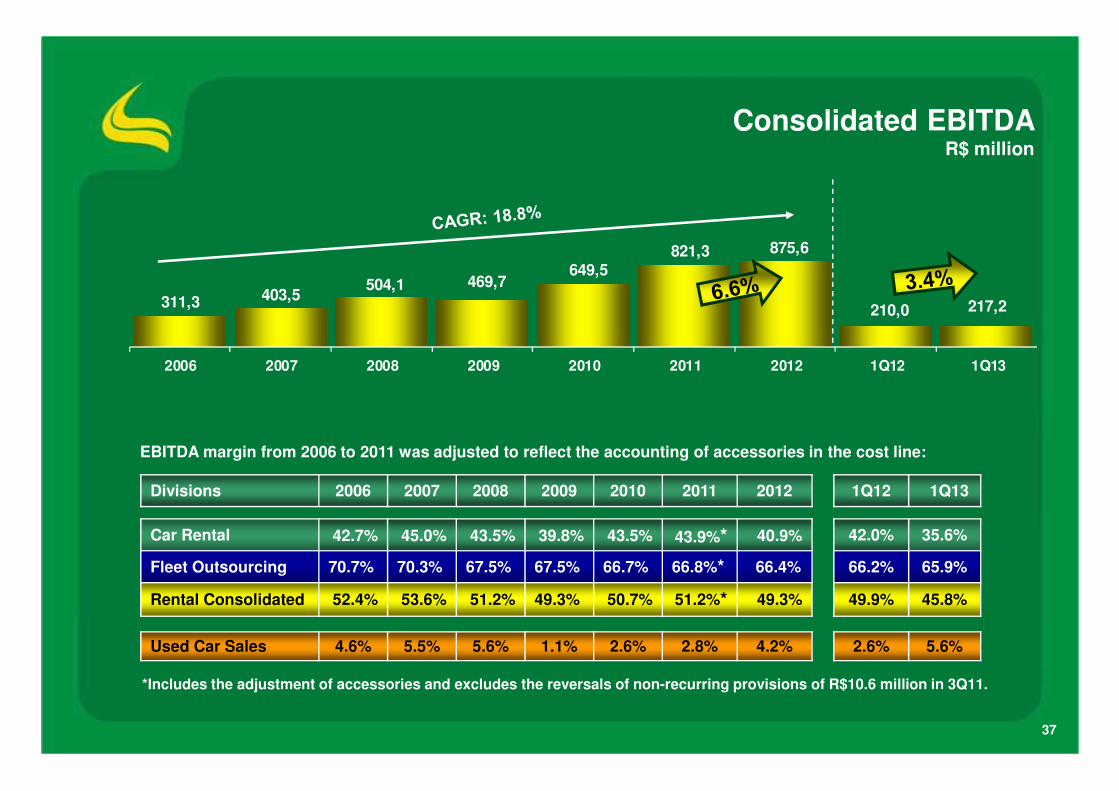
Consolidated EBITDA R$ million
Divisions 2006 2007 2008 2009 2010 2011 2012 1Q12 1Q13
Car Rental 42.7% 45.0% 43.5% 39.8% 43.5% 43.9%* 40.9% 42.0% 35.6%
Fleet Outsourcing 70.7% 70.3% 67.5% 67.5% 66.7% 66.8%* 66.4% 66.2% 65.9%
Rental Consolidated 52.4% 53.6% 51.2% 49.3% 50.7% 51.2%* 49.3% 49.9% 45.8%
Used Car Sales 4.6% 5.5% 5.6% 1.1% 2.6% 2.8% 4.2% 2.6% 5.6%
311,3 403,5504,1 469,7
649,5821,3 875,6
210,0 217,2
2006 2007 2008 2009 2010 2011 2012 1Q12 1Q13
*Includes the adjustment of accessories and excludes the reversals of non-recurring provisions of R$10.6 million in 3Q11.
EBITDA margin from 2006 to 2011 was adjusted to reflect the accounting of accessories in the cost line:
38
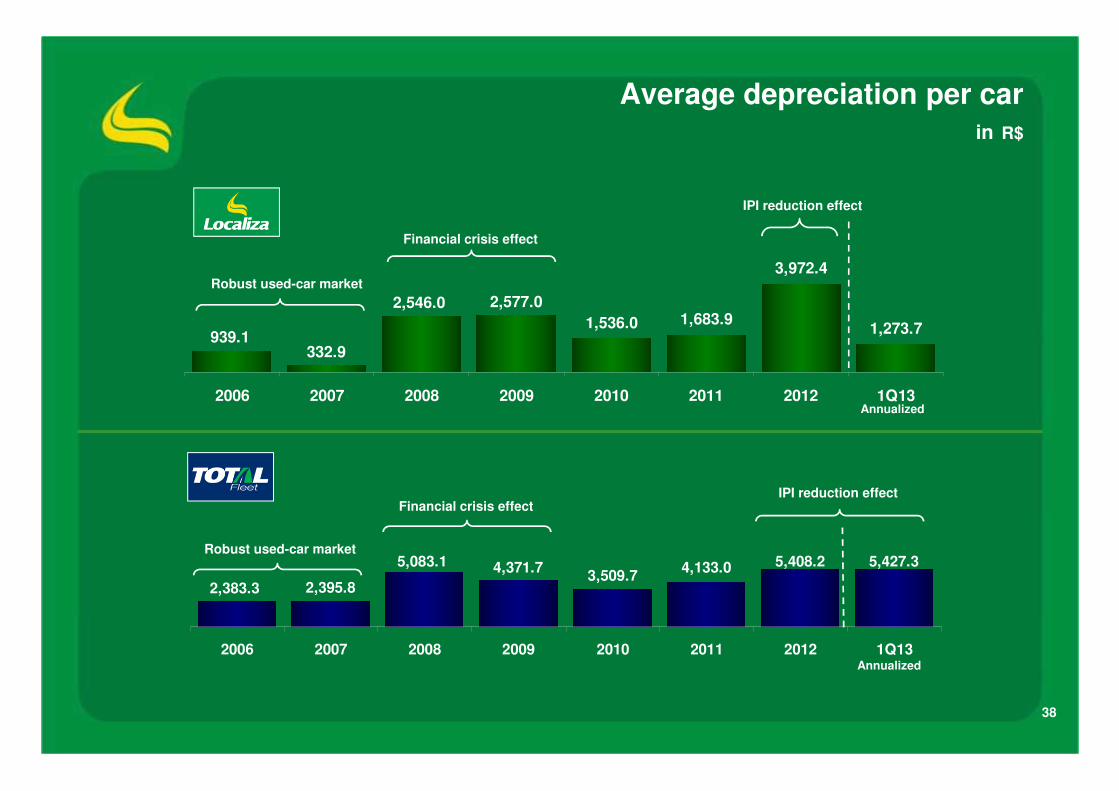
Average depreciation per carin R$
1,683.9
3,972.4
1,273.7939.1
332.9
2,546.0 2,577.0
1,536.0
2006 2007 2008 2009 2010 2011 2012 1Q13Annualized
Robust used-car market
Financial crisis effect
IPI reduction effect
4,133.0 5,408.2 5,427.33,509.7
4,371.75,083.1
2,395.82,383.3
2006 2007 2008 2009 2010 2011 2012 1Q13Annualized
Robust used-car market
Financial crisis effectIPI reduction effect
39
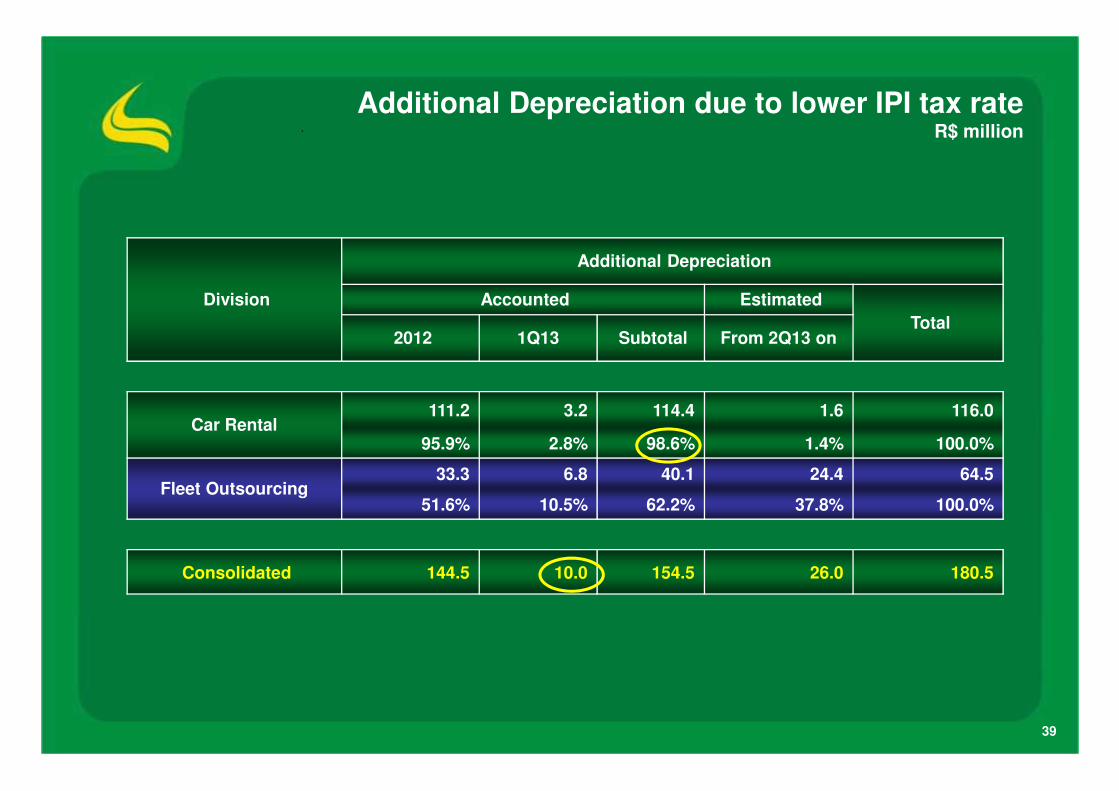
Additional Depreciation due to lower IPI tax rateR$ million
Division
Additional Depreciation
Accounted Estimated
Total 2012 1Q13 Subtotal From 2Q13 on
Car Rental111.2 3.2 114.4 1.6 116.0
95.9% 2.8% 98.6% 1.4% 100.0%
Fleet Outsourcing 33.3 6.8 40.1 24.4 64.5
51.6% 10.5% 62.2% 37.8% 100.0%
Consolidated 144.5 10.0 154.5 26.0 180.5

40
Consolidated EBIT R$ million
245.5346.2
307.5 276.4
482.1
595.7
465.8
144.5 148.1
2006 2007 2008 2009 2010 2011 2012 1Q12 1Q13
* EBIT pro- forma excludes the additional depreciation of R$144.5 million due to the IPI tax exemption.
610,3 *
Net revenues % EBITDA % EBIT % Net income %
1,111.0 35.1% 456.2 52.1% 267.9 57.5% 131.7 54.7%
535.7 16.9% 355.9 40.6% 197.9 42.5% 109.2 45.3%
1,520.0 48.0% 63.5 7.3% * * * *
Consolidated 3,166.7 100.0% 875.6 100.0% 465.8 100.0% 240.9 100.0%
*Seminovos results recorded in the Car Rental and Fleet Outsourcing Division.
41
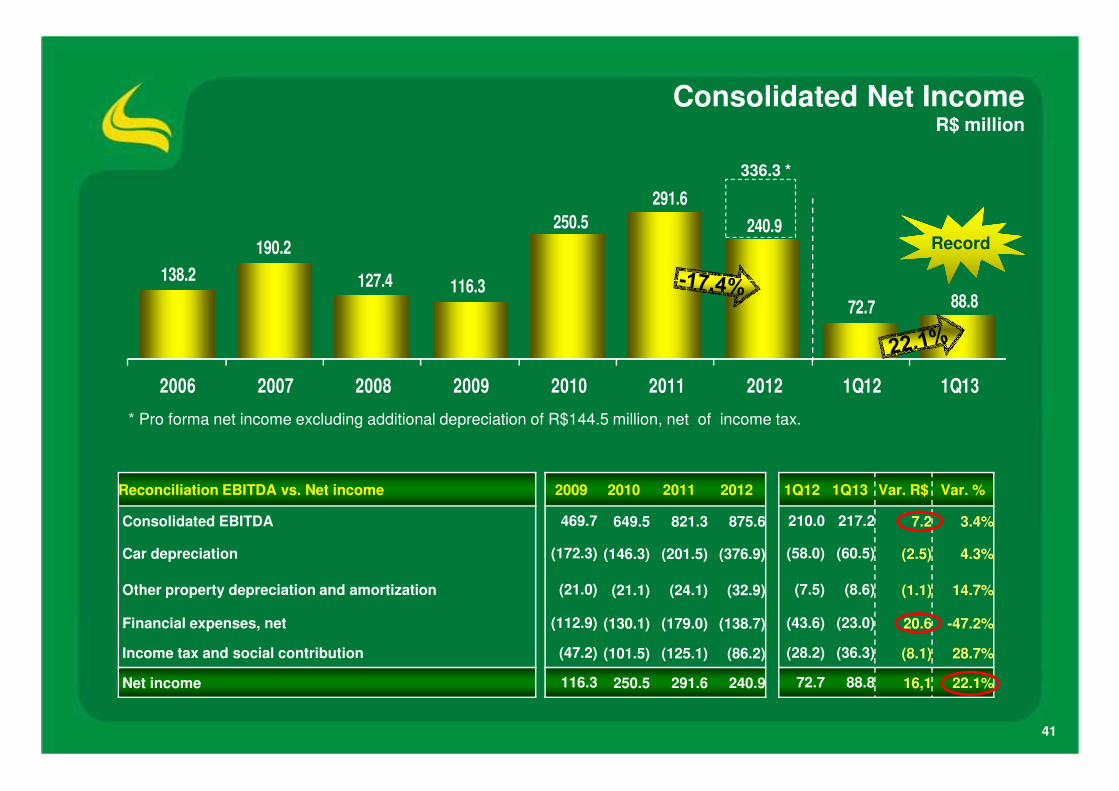
Consolidated Net IncomeR$ million
Reconciliation EBITDA vs. Net income 2009 2010 2011 2012 1Q12 1Q13 Var. R$ Var. %
Consolidated EBITDA 469.7 649.5 821.3 875.6 210.0 217.2 7.2 3.4%
Car depreciation (172.3) (146.3) (201.5) (376.9) (58.0) (60.5) (2.5) 4.3%
Other property depreciation and amortization (21.0) (21.1) (24.1) (32.9) (7.5) (8.6) (1.1) 14.7%
Financial expenses, net (112.9) (130.1) (179.0) (138.7) (43.6) (23.0) 20.6 -47.2%
Income tax and social contribution (47.2) (101.5) (125.1) (86.2) (28.2) (36.3) (8.1) 28.7%
Net income 116.3 250.5 291.6 240.9 72.7 88.8 16,1 22.1%
138.2
190.2
127.4 116.3
250.5
291.6
240.9
72.7 88.8
2006 2007 2008 2009 2010 2011 2012 1Q12 1Q13
336.3 *
* Pro forma net income excluding additional depreciation of R$144.5 million, net of income tax.
Record
42
1. Company overview
2. Main business divisions
� Car rental
� Fleet rental
� Seminovos
3. Consolidated
4. Debt and cash
5. Appendix
� Earnings release 1Q13
Agenda
4343
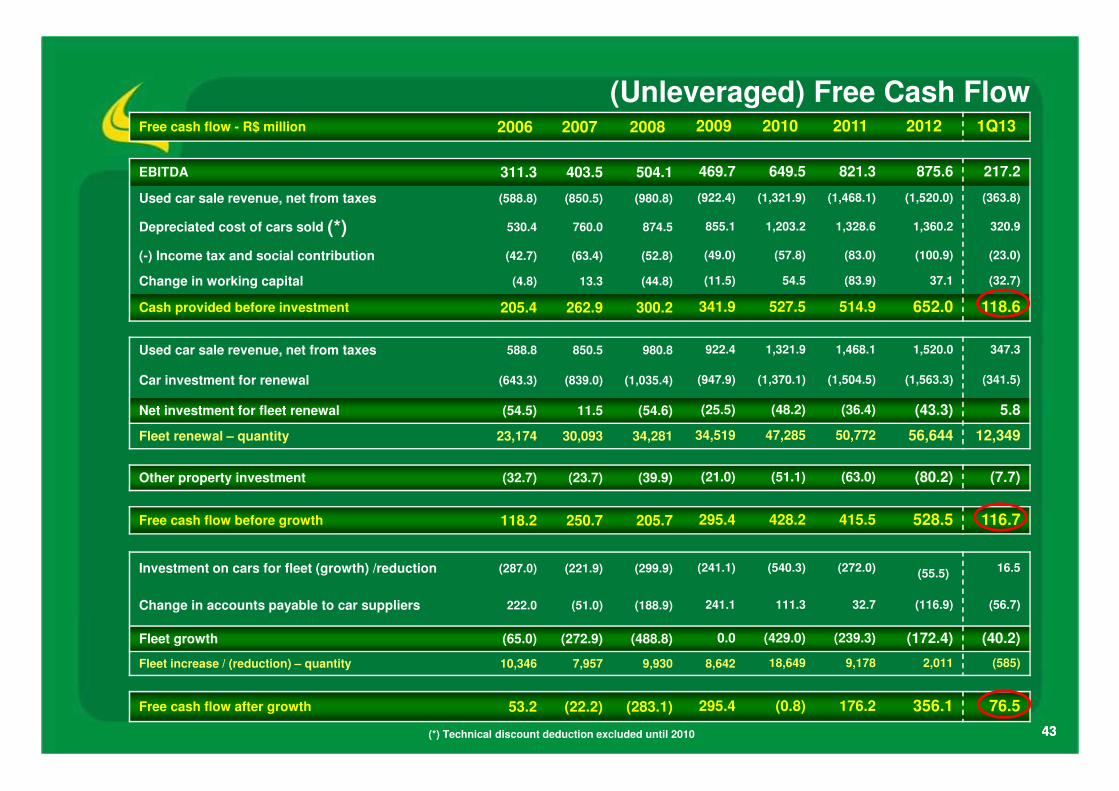
(Unleveraged) Free Cash Flow
(*) Technical discount deduction excluded until 2010
Free cash flow - R$ million 2006 2007 2008 2009 2010 2011 2012 1Q13
EBITDA 311.3 403.5 504.1 469.7 649.5 821.3 875.6 217.2
Used car sale revenue, net from taxes (588.8) (850.5) (980.8) (922.4) (1,321.9) (1,468.1) (1,520.0) (363.8)
Depreciated cost of cars sold (*) 530.4 760.0 874.5 855.1 1,203.2 1,328.6 1,360.2 320.9
(-) Income tax and social contribution (42.7) (63.4) (52.8) (49.0) (57.8) (83.0) (100.9) (23.0)
Change in working capital (4.8) 13.3 (44.8) (11.5) 54.5 (83.9) 37.1 (32.7)
Cash provided before investment 205.4 262.9 300.2 341.9 527.5 514.9 652.0 118.6
Used car sale revenue, net from taxes 588.8 850.5 980.8 922.4 1,321.9 1,468.1 1,520.0 347.3
Car investment for renewal (643.3) (839.0) (1,035.4) (947.9) (1,370.1) (1,504.5) (1,563.3) (341.5)
Net investment for fleet renewal (54.5) 11.5 (54.6) (25.5) (48.2) (36.4) (43.3) 5.8
Fleet renewal – quantity 23,174 30,093 34,281 34,519 47,285 50,772 56,644 12,349
Other property investment (32.7) (23.7) (39.9) (21.0) (51.1) (63.0) (80.2) (7.7)
Free cash flow before growth 118.2 250.7 205.7 295.4 428.2 415.5 528.5 116.7
Investment on cars for fleet (growth) /reduction (287.0) (221.9) (299.9) (241.1) (540.3) (272.0) (55.5) 16.5
Change in accounts payable to car suppliers 222.0 (51.0) (188.9) 241.1 111.3 32.7 (116.9) (56.7)
Fleet growth (65.0) (272.9) (488.8) 0.0 (429.0) (239.3) (172.4) (40.2)
Fleet increase / (reduction) – quantity 10,346 7,957 9,930 8,642 18,649 9,178 2,011 (585)
Free cash flow after growth 53.2 (22.2) (283.1) 295.4 (0.8) 176.2 356.1 76.5

44
Changes in net debt R$ million
Net debt was reduced by 9.7% in 2012 and 3.1% in this quarter.
1,193.5
(23.0)
Interest
(15.8)
Interest on own capital
Net debt 03/31/2013
FCF76.5
1,231.2
Net debt12/31/2012
(138.6)
Interest
(85.3)
Dividends
Net debt 12/31/2012
FCF356.1
1,363.4
Net debt12/31/2011
1,231.2
45
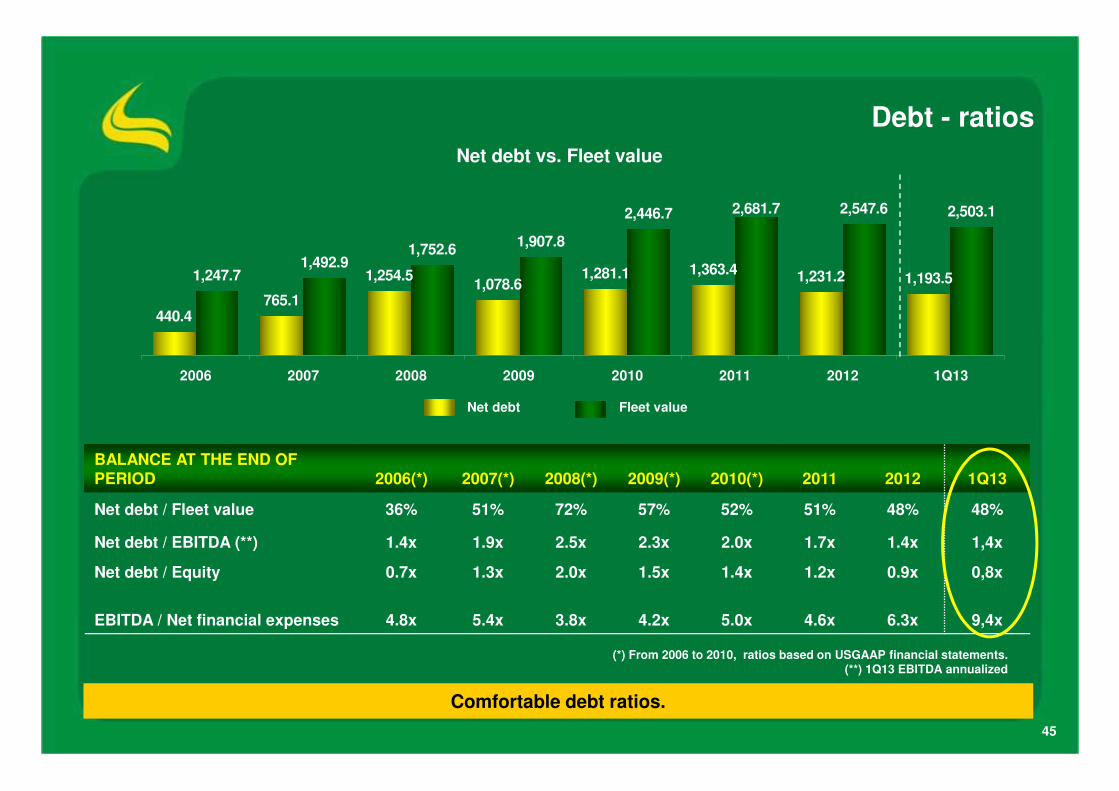
Debt - ratios
Net debt vs. Fleet value
BALANCE AT THE END OF PERIOD 2006(*) 2007(*) 2008(*) 2009(*) 2010(*) 2011 2012 1Q13
Net debt / Fleet value 36% 51% 72% 57% 52% 51% 48% 48%
Net debt / EBITDA (**) 1.4x 1.9x 2.5x 2.3x 2.0x 1.7x 1.4x 1,4x
Net debt / Equity 0.7x 1.3x 2.0x 1.5x 1.4x 1.2x 0.9x 0,8x
EBITDA / Net financial expenses 4.8x 5.4x 3.8x 4.2x 5.0x 4.6x 6.3x 9,4x
(*) From 2006 to 2010, ratios based on USGAAP financial statements.(**) 1Q13 EBITDA annualized
Net debt Fleet value
Comfortable debt ratios.
440.4765.1
1,254.51,078.6
1,281.1 1,363.4 1,231.2 1,193.51,247.71,492.9
1,752.61,907.8
2,446.7 2,681.7 2,547.6 2,503.1
2006 2007 2008 2009 2010 2011 2012 1Q13
46
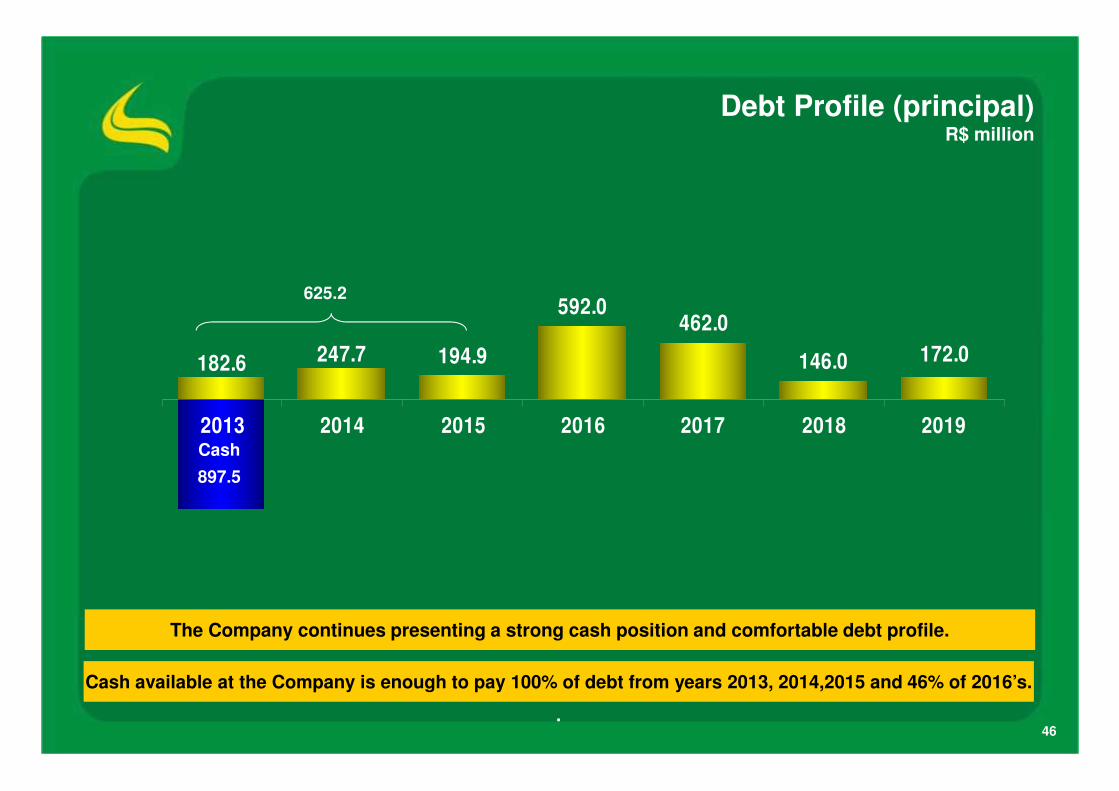
Debt Profile (principal)R$ million
The Company continues presenting a strong cash position and comfortable debt profile.
182.6 247.7 194.9
592.0462.0
146.0 172.0
2013 2014 2015 2016 2017 2018 2019Cash
897.5
625.2
Cash available at the Company is enough to pay 100% of debt from years 2013, 2014,2015 and 46% of 2016’s.
.
47
Localiza Level I ADR
�Ticker Symbol: LZRFY
�CUSIP: 53956W300
�ISIN: US53956W3007
�Ratio: 1 Common Share : 1 ADR
�Exchange: OTC
�Depositary bank: Deutsche Bank Trust Company Americas
�ADR broker helpline: +1 212 250 9100 (New York)
+44 207 547 6500 (London)
�E-mail: [email protected]
�ADR website: www.adr.db.com
�Depositary bank’s local custodian: Banco Bradesco S/A, Brazil
48
Disclaimer
DisclaimerThe material presented is a presentation of general background information about LOCALIZA as of the date of the presentation. It is information in summary form and does not purport to be complete. It is not intended to be relied upon as advice to potential investors. This presentation is strictly confidential and may not be disclosed to any other person. No representation or warranty, express or implied, is made concerning, and no reliance should be placed on, the accuracy, fairness, or completeness of the information presented herein.
This presentation contains statements that are forward-looking within the meaning of Section 27A of the Securities Act of 1933 and Section 21E of the Securities Exchange Act of 1934. Such forward-looking statements are only predictions and are not guarantees of future performance. Investors are cautioned that any such forward-looking statements are and will be, as the case may be, subject to many risks, uncertainties and factors relating to the operations and business environments of LOCALIZA and its subsidiaries that may cause the actual results of the companies to be materially different from any future results expressed or implied in such forward-looking statements.
Although LOCALIZA believes that the expectations and assumptions reflected in the forward-looking statements are reasonable based on information currently available to LOCALIZA’s management, LOCALIZA cannot guarantee future results or events. LOCALIZA expressly disclaims a duty to update any of the forward-looking statement.
Securities may not be offered or sold in the United States unless they are registered or exempt from registration under the Securities Act of 1933. Any offering of securities to be made in the United States will be made by means of an offering memorandum that may be obtained from any underwriters we may appoint in connection with an offering of securities in future. Such offering memorandum will contain, or incorporate by reference, detailed information about LOCALIZA and its business and financial results, as well as its financial statements.This presentation does not constitute an offer, or invitation, or solicitation of an offer, to subscribe for or purchase any securities. Neither this presentation nor anything contained herein
shall form the basis of any contract or commitment whatsoever.
Website: www.localiza.com/ir E-mail: [email protected] Phone: 55 31 3247-7024
Roberto MendesCFO and IR
Nora LanariHead of IR