
Li Fe P O Phase Diagram from First Principles...
10
Li-Fe-P-O 2 Phase Diagram from First Principles Calculations Shyue Ping Ong, † Lei Wang, † Byoungwoo Kang, and Gerbrand Ceder* Department of Materials Science and Engineering, Massachusetts Institute of Technology, 77 Massachusetts AVenue, Cambridge, Massachusetts 02139 ReceiVed August 16, 2007. ReVised Manuscript ReceiVed NoVember 26, 2007 We present an efficient way to calculate the phase diagram of the quaternary Li-Fe-P-O 2 system using ab initio methods. The ground-state energies of all known compounds in the Li-Fe-P-O 2 system were calculated using the generalized gradient approximation (GGA) approximation to density functional theory (DFT) and the DFT+U extension to it. Considering only the entropy of gaseous phases, the phase diagram was constructed as a function of oxidation conditions, with the oxygen chemical potential, µ O 2 , capturing both temperature and oxygen partial pressure dependence. A modified Ellingham diagram was also developed by incorporating the experimental entropy data of gaseous phases. The phase diagram shows LiFePO 4 to be stable over a wide range of oxidation environments, being the first Fe 2+ -containing phase to appear upon reduction at µ O 2 )-11.52 eV and the last of the Fe-containing phosphates to be reduced at µ O 2 )-16.74 eV. Lower µ O 2 represents more reducing conditions, which generally correspond to higher temperatures and/or lower oxygen partial pressures and/or the presence of reducing agents. The predicted phase relations and reduction conditions compare well to experimental findings on stoichiometric and Li-off-stoichiometric LiFePO 4 . For Li-deficient stoichiometries, the formation of iron phosphate phases (Fe 7 (PO 4 ) 6 and Fe 2 P 2 O 7 ) commonly observed under moderately reducing conditions during LiFePO 4 synthesis and the formation of iron phosphides (Fe 2 P) under highly reducing conditions are consistent with the predictions from our phase diagram. Our diagrams also predict the formation of Li 3 PO 4 and iron oxides for Li-excess stoichiometries under all but the most reducing conditions, again in agreement with experimental observations. For stoichiometric LiFePO 4 , the phase diagram gives the correct oxidation products of Li 3 Fe 2 (PO 4 ) 3 and Fe 2 O 3 . The predicted carbothermal reduction temperatures for LiFePO 4 from the Ellingham diagram are also within the range observed in experiments (800–900 °C). The diagrams developed provide a better understanding of phase relations within the Li-Fe-P-O 2 system and serve as a guide for future experimental efforts in materials processing, in particular, for the optimization of synthesis routes for LiFePO 4 . 1. Introduction In recent years, lithium transition metal phosphates have emerged as promising cathodes for rechargeable lithium batteries. 1–5 Of these, olivine LiFePO 4 has garnered the most interest because of its reasonable theoretical capacity of 170 mA h g -1 , low materials cost, and low toxicity. Because of its substantial potential, much research effort has been directed toward optimizing synthesis routes for LiFePO 4 cathodes. A variety of techniques have been developed to control particle size and morphology as well as improve the electrical conductivity of the electrode through coating with conducting phases (e.g., carbon or metallic iron phosphides) or aliovalent doping. One of the first attempts to dope LiFePO 4 with aliovalent cations was reported by Chung et al. 6 in 2002, who found that Li 0.99 Nb 0.01 FePO 4 densified at 800 °C formed black p-type conductors leading to a 6–7 orders of magnitude improvement in conductivity. However, subsequent investigations into aliovalent doping of LiFePO 4 by Herle et al. 7 and Delacourt et al. 8 found no evidence of an aliovalently doped structure. Though both reported the same increase in conductivity, they attributed the increase to a percolating network of iron phosphides and phospho- carbides believed to be formed from carbothermal reduction of LiFePO 4 or Fe 2 P 2 O 7 . These findings were further sup- ported by atomic scale investigations carried out by Islam et al. 9 which found LiFePO 4 to be intolerant of aliovalent doping on either the Li or Fe sites. More recently, Rho et al. 10 used a combination of Mössbauer and X-ray photo- electron spectroscopy to show that, under most synthesis conditions in inert or reducing atmospheres, FeP and Fe 2 P, * To whom correspondence should be addressed: Tel (617) 253-1581, Fax (617) 258-6534, e-mail [email protected]. † These authors contribute equally to this work. (1) Padhi, A. K.; Nanjundaswamy, K. S.; Goodenough, J. B. J. Electro- chem. Soc. 1997, 144, 1188–1194. (2) Huang, H.; Yin, S. C.; Nazar, L. F. Electrochem. Solid State Lett. 2001, 4, A170–A172. (3) Morcrette, M.; Wurm, C.; Masquelier, C. Solid State Sci. 2002, 4, 239–246. (4) Barker, J.; Saidi, M. Y.; Swoyer, J. L. Electrochem. Solid State Lett. 2003, 6, A53–A55. (5) Morgan, D.; Ceder, G.; Saidi, M. Y.; Barker, J.; Swoyer, J.; Huang, H.; Adamson, G. J. Power Sources 2003, 119, 755–759. (6) Chung, S. Y.; Bloking, J. T.; Chiang, Y. M. Nat. Mater. 2002, 1, 123–128. (7) Herle, P. S.; Ellis, B.; Coombs, N.; Nazar, L. F. Nat. Mater. 2004, 3, 147–52. (8) Delacourt, C.; Wurm, C.; Laffont, L.; Leriche, J. B.; Masquelier, C. Solid State Ionics 2006, 177, 333–341. (9) Islam, M. S.; Driscoll, D. J.; Fisher, C. A. J.; Slater, P. R. Chem. Mater. 2005, 17, 5085–5092. (10) Rho, Y. H.; Nazar, L. F.; Perry, L.; Ryan, D. J. Electrochem. Soc. 2007, 154, A283–A289. A Chem. Mater. XXXX, xxx, 000–000 10.1021/cm702327g CCC: $37.00 XXXX American Chemical Society Published on Web 02/07/2008
Transcript of Li Fe P O Phase Diagram from First Principles...

Li-Fe-P-O2 Phase Diagram from First Principles Calculations
Shyue Ping Ong,† Lei Wang,† Byoungwoo Kang, and Gerbrand Ceder*
Department of Materials Science and Engineering, Massachusetts Institute of Technology, 77Massachusetts AVenue, Cambridge, Massachusetts 02139
ReceiVed August 16, 2007. ReVised Manuscript ReceiVed NoVember 26, 2007
We present an efficient way to calculate the phase diagram of the quaternary Li-Fe-P-O2 systemusing ab initio methods. The ground-state energies of all known compounds in the Li-Fe-P-O2 systemwere calculated using the generalized gradient approximation (GGA) approximation to density functionaltheory (DFT) and the DFT+U extension to it. Considering only the entropy of gaseous phases, the phasediagram was constructed as a function of oxidation conditions, with the oxygen chemical potential, µO2,capturing both temperature and oxygen partial pressure dependence. A modified Ellingham diagram wasalso developed by incorporating the experimental entropy data of gaseous phases. The phase diagramshows LiFePO4 to be stable over a wide range of oxidation environments, being the first Fe2+-containingphase to appear upon reduction at µO2 ) -11.52 eV and the last of the Fe-containing phosphates to bereduced at µO2 ) -16.74 eV. Lower µO2 represents more reducing conditions, which generally correspondto higher temperatures and/or lower oxygen partial pressures and/or the presence of reducing agents.The predicted phase relations and reduction conditions compare well to experimental findings onstoichiometric and Li-off-stoichiometric LiFePO4. For Li-deficient stoichiometries, the formation of ironphosphate phases (Fe7(PO4)6 and Fe2 P2O7) commonly observed under moderately reducing conditionsduring LiFePO4 synthesis and the formation of iron phosphides (Fe2P) under highly reducing conditionsare consistent with the predictions from our phase diagram. Our diagrams also predict the formation ofLi3PO4 and iron oxides for Li-excess stoichiometries under all but the most reducing conditions, againin agreement with experimental observations. For stoichiometric LiFePO4, the phase diagram gives thecorrect oxidation products of Li3Fe2(PO4)3 and Fe2O3. The predicted carbothermal reduction temperaturesfor LiFePO4 from the Ellingham diagram are also within the range observed in experiments (800–900°C). The diagrams developed provide a better understanding of phase relations within the Li-Fe-P-O2
system and serve as a guide for future experimental efforts in materials processing, in particular, for theoptimization of synthesis routes for LiFePO4.
1. Introduction
In recent years, lithium transition metal phosphates haveemerged as promising cathodes for rechargeable lithiumbatteries.1–5 Of these, olivine LiFePO4 has garnered the mostinterest because of its reasonable theoretical capacity of 170mA h g-1, low materials cost, and low toxicity. Because ofits substantial potential, much research effort has beendirected toward optimizing synthesis routes for LiFePO4
cathodes. A variety of techniques have been developed tocontrol particle size and morphology as well as improve theelectrical conductivity of the electrode through coating withconducting phases (e.g., carbon or metallic iron phosphides)or aliovalent doping. One of the first attempts to dopeLiFePO4 with aliovalent cations was reported by Chung et
al.6 in 2002, who found that Li0.99Nb0.01FePO4 densified at800 °C formed black p-type conductors leading to a 6–7orders of magnitude improvement in conductivity. However,subsequent investigations into aliovalent doping of LiFePO4
by Herle et al.7 and Delacourt et al.8 found no evidence ofan aliovalently doped structure. Though both reported thesame increase in conductivity, they attributed the increaseto a percolating network of iron phosphides and phospho-carbides believed to be formed from carbothermal reductionof LiFePO4 or Fe2P2O7. These findings were further sup-ported by atomic scale investigations carried out by Islamet al.9 which found LiFePO4 to be intolerant of aliovalentdoping on either the Li or Fe sites. More recently, Rho etal.10 used a combination of Mössbauer and X-ray photo-electron spectroscopy to show that, under most synthesisconditions in inert or reducing atmospheres, FeP and Fe2P,* To whom correspondence should be addressed: Tel (617) 253-1581, Fax
(617) 258-6534, e-mail [email protected].† These authors contribute equally to this work.
(1) Padhi, A. K.; Nanjundaswamy, K. S.; Goodenough, J. B. J. Electro-chem. Soc. 1997, 144, 1188–1194.
(2) Huang, H.; Yin, S. C.; Nazar, L. F. Electrochem. Solid State Lett.2001, 4, A170–A172.
(3) Morcrette, M.; Wurm, C.; Masquelier, C. Solid State Sci. 2002, 4,239–246.
(4) Barker, J.; Saidi, M. Y.; Swoyer, J. L. Electrochem. Solid State Lett.2003, 6, A53–A55.
(5) Morgan, D.; Ceder, G.; Saidi, M. Y.; Barker, J.; Swoyer, J.; Huang,H.; Adamson, G. J. Power Sources 2003, 119, 755–759.
(6) Chung, S. Y.; Bloking, J. T.; Chiang, Y. M. Nat. Mater. 2002, 1,123–128.
(7) Herle, P. S.; Ellis, B.; Coombs, N.; Nazar, L. F. Nat. Mater. 2004, 3,147–52.
(8) Delacourt, C.; Wurm, C.; Laffont, L.; Leriche, J. B.; Masquelier, C.Solid State Ionics 2006, 177, 333–341.
(9) Islam, M. S.; Driscoll, D. J.; Fisher, C. A. J.; Slater, P. R. Chem.Mater. 2005, 17, 5085–5092.
(10) Rho, Y. H.; Nazar, L. F.; Perry, L.; Ryan, D. J. Electrochem. Soc.2007, 154, A283–A289.
AChem. Mater. XXXX, xxx, 000–000
10.1021/cm702327g CCC: $37.00 XXXX American Chemical Society
Published on Web 02/07/2008

along with Li3PO4, are formed on the surface via surfacereduction at temperatures as low as 600 °C. Ellis et al.11
also recently investigated the impact of synthesis conditionson the conductivity and electrochemical performance ofvarious lithium transition metal phosphates. They found thatusing H2 or NH3 gas as a reducing agent, they were able toachieve the reduction of Li-deficient LiFePO4 to ironphosphides at lower temperatures and shorter sinteringperiods than when using carbon alone. They claimed thatthis reduced particle growth and carbon consumption, therebysignificantly improving electrochemical performance.
We can see, therefore, that a key factor to optimizingsynthesis approaches for LiFePO4 is a thorough understand-ing of phase equilibria under stoichiometric and off-sto-ichiometric conditions. LiFePO4 is typically synthesizedunder highly reducing conditions to avoid the formation ofFe3+. Often, an excess of lithium is introduced to compensatefor its high volatility. Depending on the precursors used (e.g.,carbon containing or otherwise), the exact synthesis environ-ment (temperatures, Ar or N2/H2 atmosphere), and the degreeand nature of off-stoichiometry, different secondary phasesmay be formed in addition to LiFePO4, during eithersynthesis or subsequent reoxidation under normal operat-ing conditions. The nature of such “impurity” phases canhave a significant impact on the performance of theelectrode. The presence of undesirable or inactive phasesmay at best reduce the capacity of the electrode and atworst seriously degrade electrochemical performance. Onthe other hand, some secondary phases may improve theperformance of the electrode, for instance, by acting aselectron conduits to compensate for the low intrinsic electri-cal conductivity of LiFePO4.
There is currently no phase diagram available for theLi-Fe-P-O2 system. Phase diagrams representing thethermodynamic phase equilibria of multicomponent systemsreveal fundamental material aspects regarding the processingand reactions of materials. A Li-Fe-P-O2 phase diagramwould therefore provide useful insights into experimentalfindings on LiFePO4 and also serve as a guide for futureexperimental efforts to optimize synthesis approaches forLiFePO4. In this work, we have constructed the phasediagram for the quaternary Li-Fe-P-O2 system as afunction of oxidation conditions using first principles tech-niques. Using the information on phase relations garneredfrom the phase diagram, we were then able to construct anEllingham-type diagram for reactions of interest using acombination of total energies obtained from first principlescalculations and experimental entropy data of gaseous phases.
2. Methodology
2.1. Free Energy Model. To construct a phase diagram,one would need to compare the relative thermodynamicstability of phases belonging to the system using an ap-propriate free energy model. For an isothermal, isobaric,closed Li-Fe-P-O2 system, the relevant thermodynamicpotential is the Gibbs free energy, G, which can be expressed
as a Legendre transform of the enthalpy, H, and internalenergy, E, as follows:
G(T, P, NLi, NFe, NP, NO2) ) H(T, P, NLi, NFe, NP, NO2
) -
TS(T, P, NLi, NFe, NP, NO2) ) E(T, P, NLi, NFe, NP, NO2
) +
PV(T, P, NLi, NFe, NP, NO2) - TS(T, P, NLi, NFe, NP, NO2
)
(2.1)
where T is the temperature of the system, S is the entropyof the system, P is the pressure of the system, V is the volumeof the system, and Ni is the number of atoms of species i inthe system.
In the Li-Fe-P-O2 system, we are primarily comparingthe relative stability of condensed phases, for which P∆V isgenerally small and the PV term may therefore be neglected.At 0 K, the expression for G simplifies to just E. NormalizingE with respect to the total number of particles in the system,we obtain Ej(0,P,xLi,xFe,xP,XO2), where xi ) Ni/(NLi + NFe +NP + NO2). By taking the convex hull12 of Ej for all phasesbelonging to the M-component system and projecting thestable nodes into the (M - 1)-dimension composition space,one can obtain the 0 K phase diagram for the closed systemat constant pressure. The convex hull of a set of points isthe smallest convex set containing the points. For instance,to construct a 0 K, closed Li-Fe-P-O2 system phasediagram, the convex hull is taken on the set of points in (Ej ,xLi, xFe, xP) space with xO2 being related to the other threecomposition variables by xO2 ) 1 - xLi - xFe - xP.
2.2. Determining E from Density Functional Theory.In this work, we have extracted all known ordered com-pounds in the Inorganic Crystal Structure Database (ICSD)13
belonging to the quaternary Li-Fe-P-O2 system andcalculated the energies for these using the generalizedgradient approximation (GGA) to density functional theory(DFT) and the GGA+U extension to it. Projected augmentedwave (PAW)14 pseudopotentials were used, as implementedin the Vienna Ab initio Simulation Package (VASP).15 Anenergy cutoff of 500 eV and appropriate k-point meshes werechosen so that total energies converged within 3 meV performula unit with the atomic positions and lattice vectorsfully relaxed. All calculations were spin-polarized, but noattempt was made to find antiferromagnetic solutions exceptfor the iron oxides for which the magnetic ground states arewell-known.
The DFT+U methodology was chosen for its appropriate-ness for the redox reactions studied in this work. It is well-known that first principles calculations within the localdensity approximation (LDA) or GGA lead to considerableerror in calculated redox energies of transition metal oxides.This arises from the self-interaction error in LDA and GGA,which is not canceled out in redox reactions where anelectron is transferred between significantly different envi-ronments, such as between a metal and a transition metal orbetween a transition metal and oxygen. In 2004, Zhou et
(11) Ellis, B.; Herle, P. S.; Rho, Y. H.; Nazar, L. F.; Dunlap, R.; Perry,L. K.; Ryan, D. H. Faraday Discuss. 2007, 134, 119–141.
(12) Barber, C. B.; Dobkin, D. P.; Huhdanpaa, H. ACM Trans. Math.Software 1996, 22, 469–483.
(13) Fachinformationszentrum (FIZ) Karlsruhe, Inorganic Crystal StructureDatabase, http://icsdweb.fiz-karlsruhe.de/, 2007.
(14) Kresse, G.; Joubert, D. Phys. ReV. B 1999, 59, 1758–1775.(15) Kresse, G.; Furthmuller, J. Phys. ReV. B 1996, 54, 11169–11186.
B Chem. Mater., Vol. xxx, No. xx, XXXX Ong et al.

al.16 demonstrated that a GGA+U treatment17 of the local-ized d orbitals with an explicit Hubbard term to cancel theself-interactions led to significantly improved accuracy inthe calculated redox energies and Li insertion voltages forlithium transition metal cathodes. Similarly, Wang et al.18,19
showed the benefit of the U correction in improving thecalculated oxidation energies for transition metal oxides. Onthe basis of these works, we have used a Ueffective value of4.3 eV, which is the average of the self-consistentlydetermined Ueffective values16 for Fe2+ and Fe3+. It shouldbe noted, however, that the value of Ueffective tends to becomesmaller as the valence state of Fe decreases. Hence, theUeffective value used may be somewhat too small for oxidizedstates (e.g., Fe2O3) and too large for reduced states (e.g.,FeO). In particular, we expect considerable error in thecalculated energies of metallic systems such as Fe metal andthe iron phosphides, FexPy, where the d orbitals are no longeratomic-like and the GGA+U methodology is less applicable.
2.3. Phase Diagram Construction. The description of aclosed four-component system at constant temperature andpressure requires three-dimensional space and can be rep-resented in the form of a composition tetrahedron. However,given the large number of phases present in theLi-Fe-P-O2 system, this representation is not one that isamenable to easy analysis. Furthermore, such a phasediagram, which describes phase equilibria in an environmentwith controlled Li, Fe, P, and O2 compositions, is notreflective of the environments of interest.
The key control variable in the synthesis of LiFePO4 isthe oxygen chemical potential, µO2. LiFePO4 synthesisrequires reducing environments, which are usually achievedusing relatively high temperature processing (typically600–850 °C) and a low oxygen environment such as an Aror N2 atmosphere. In some cases, even more extremereducing environments are achieved with the presence ofcarbon or H2 as reducing agents. In essence, the system ofinterest is an isothermal, isobaric system that is open withrespect to oxygen and closed with respect to the othercomponents, rather than a completely closed system. Therelevant thermodynamic potential to study phase equilibriawith respect to an oxidizing or reducing environment is theoxygen grand potential, defined as
�(T, P, NLi, NFe, NP, µO2) ) G(T, P, NLi, NFe, NP, µO2
) -
µO2NO2
(T, P, NLi, NFe, NP, µO2) (2.2)
≈E(T, P, NLi, NFe, NP, µO2) - TS(T, P, NLi, NFe, NP, µO2
) -
µO2NO2
(T, P, NLi, NFe, NP, µO2) (2.3)
where the PV term is again ignored.Normalizing � with respect to Li-Fe-P composition and
dropping the explicit expression of the functional dependenceof E, S, and NO2 on the right-hand side henceforth for brevity,we obtain
�(T, P, xLi, xFe, xP, µO2) ≈
E - TS - µO2NO2
NLi + NFe + NP(2.4)
where xi ) Ni/(NLi + NFe + NP) is the fraction of componenti in Li-Fe-P composition space.
To formally introduce temperature into ab initio phasestability calculations, one would usually need to take intoaccount all the relevant excitations (e.g., vibrational, con-figurational, and electronic) that contribute to entropy.20–24
However, for our chosen system, a few simplifying assump-tions can be made that allow us to obtain a useful ap-proximate phase diagram with less effort. For an open systemwith respect to oxygen, phase equilibria changes take placeprimarily through reactions involving the absorption or lossof oxygen gas. In such reactions, the reaction entropy isdominated by the entropy of oxygen gas, and the effect oftemperature is mostly captured by changes in the oxygenchemical potential. The oxygen chemical potential is relatedto the temperature and oxygen partial pressure by thefollowing equations:
µO2(T, pO2
) ) µO2(T, p0) + kT ln
pO2
p0(2.5)
≈hO2(T, p0) - T(sO2
(T, p0) - k lnpO2
p0) (2.6)
where pO2 is the partial pressure of oxygen, p0 is a referenceoxygen partial pressure, which for this work is 0.1 MPa,sO2(T,p0) is the per molecule entropy of oxygen at thereference partial pressure and temperature T, µO2(T,p0) is theoxygen chemical potential at the reference partial pressureand temperature T, hO2(T,p0) is the per molecule oxygenenthalpy at the reference partial pressure and temperatureT, and k is Boltzmann’s constant.
Since the TS term in eq 2.4 is the entropy contribution to�j of the condensed system, it can be neglected compared tothe entropy effect of µO2 on �j (due to the much largercontribution of NO2sO2 compared to S), and the expressionfor �j simplifies to
�(µO2, xLi, xFe, xP) ≈
E- µO2NO2
NLi + NFe + NP(2.7)
Using the above assumption, the effect of temperature andoxygen partial pressure can be fully captured in a singlevariable, µO2, with a more negative value corresponding tohigher T or lower pO2 (as can be seen from eq 2.6).
Varying µO2, the Li-Fe-P-O2 phase diagram can beconstructed as constant µO2 sections in (µO2, xLi, xFe, xP) spaceby taking the convex hull of �j for all phases at a particularµO2 and projecting the stable nodes onto a two-dimensionalLi-Fe-P Gibbs triangle. Each constant µO2 phase diagramthen represents phase equilibria at a particular oxidation
(16) Zhou, F.; Cococcioni, M.; Marianetti, C. A.; Morgan, D.; Ceder, G.Phys. ReV. B 2004, 70, 235121.
(17) Anisimov, V. I.; Aryasetiawan, F.; Lichtenstein, A. I. J. Phys.:Condens. Matter 1997, 9, 767–808.
(18) Wang, L.; Maxisch, T.; Ceder, G. Phys. ReV. B 2006, 73, 195107.(19) Wang, L.; Maxisch, T.; Ceder, G. Chem. Mater. 2007, 19, 543–552.
(20) Sanchez, J. M.; Fontaine, D. D. Phys. ReV. B 1978, 17, 2926–2936.(21) Asta, M.; McCormack, R.; DeFontaine, D. Phys. ReV. B 1993, 48,
748–766.(22) Kohan, A. F.; Tepesch, P. D.; Ceder, G.; Wolverton, C. Comput. Mater.
Sci. 1998, 9, 389–396.(23) Garbulsky, G. D.; Ceder, G. Phys. ReV. B 1994, 49, 6327–6330.(24) Ackland, G. J. J. Phys.: Condens. Matter 2002, 14, 2975–3000.
CChem. Mater., Vol. xxx, No. xx, XXXXLi-Fe-P-O2 Phase Diagram
environment, and each point in the phase diagram providesthe phase or combination of phases with the lowest �j .
2.4. Modified Ellingham Diagram Construction. Theeffective oxygen partial pressure may be affected by thepresence of reducing or oxidizing agents. For example, toimprove electrical conductivity, carbon-containing precursorsare often used in the synthesis of LiFePO4. Carbon is areducing agent, and carbothermal reduction (CTR) is usedextensively to reduce metal oxides to metals. The preparationof LiFePO4 using CTR has been carried by various groupssince it was first reported by Barker et al. in 2003.4
Carbon oxidation during CTR can take place via twodifferent reactions:
C + O2 h CO2
2C + O2 h 2CO
The CO2 reaction, which is more thermodynamically favor-able at lower temperatures, has minimal volume change andhence negligible entropy change. At temperatures in excessof 1000 K, however, the formation of CO becomes morethermodynamically favorable than the CO2 reaction.25 TheCO reaction creates one extra mole of gas for every mole ofoxygen consumed and therefore involves an increase inentropy. As temperature increases, the free energy offormation of CO becomes increasingly negative, and thisleads to stronger reducing conditions. In this work, we willprimarily focus on the CO reaction since LiFePO4 synthesisis usually conducted at relatively high temperatures. Anotherreducing agent commonly used in LiFePO4 synthesis ishydrogen gas, which is oxidized according to the followingreaction:
2H2 + O2 h 2H2O
For metal oxides, a typical method of showing therelationship between the reduction transition temperatures,oxygen partial pressures, and the presence of reducing agentsis an Ellingham diagram,26 which shows the change in freeenergy of the oxidation reaction as a function of temperature.In this work, we have used a modified Ellingham construc-tion where the change in Gibbs free energy for reductionreactions of interest (normalized to a per O2 molecule basis)in the Li-Fe-P-O2 system is plotted against temperature.
Consider the following general reaction:
condensed reactants + gaseous reactants hcondensed products + gaseous products
where the gaseous products can be O2, CO, or H2Odepending on whether the reaction is a thermal reduction,carbothermal reduction, or hydrogen reduction, respectively,and the gaseous reactant comprises H2 in the case ofhydrogen reduction. As the entropy contributions of gasesare much higher than that of condensed phases, the changein Gibbs free energy of the reaction can then be approximatedas follows:
∆G ) Gproducts - Greactants (2.8)
≈Hproducts - Hreactants - T(Sgaseous products - Sgaseous reactants)
(2.9)
where the enthalpy, H, can be approximated with the internalenergy, E, at 0 K.
To determine ∆G, we have used the energies for thevarious phases from our DFT calculations and experimentalentropy values for the gases. For the 0 K energy of O2 gas,earlier work by Wang et al.18 has shown that one of the mainsources of error in calculating the redox reaction enthalpiesof transition metal oxides is related to the GGA error inthe energy associated with the formation of O2- ions fromO2 molecules and vice versa. It is believed that this errorarises from the well-known overbinding of O2 moleculein GGA as well as an additional GGA error associatedwith adding electrons to the oxygen p orbital when O2-
is formed from O2. Wang et al. estimated that this errorcan be corrected through a constant shift of -1.36 eVper O2 molecule, which also includes the P∆V contributionto the oxygen enthalpy. For the purposes of this work,we have applied this same shift to the calculated energyof the O2 molecule. Experimental thermodynamic data forO2, CO, H2, and H2O at 0.1 MPa were obtained from theJANAF thermochemical tables.25 To further simplify theanalysis, we have assumed that all other phases are incondensed form at the temperatures of interest, eventhough there may be some phases (e.g., phosphorus) thatvaporize at fairly low temperatures.
3. Results
3.1. Calculated Energies. The calculated energies andstructures of the compounds studied in this paper arepresented in Table 1. All energies are presented as performula unit (fu) formation energies, Ef, from the elements,Li, Fe, P, and O2.
3.2. Phase Diagrams of Ternary Subsystems. To verifythat the calculated energies reasonably reflect the relativestability of the various phases, we first constructed the phasediagrams of the various ternary subsystems at 0 K, i.e., theLi-P-O, Li-Fe-O, Fe-P-O, and Li-Fe-P systems, andcompared these with known experimental phase diagramsfor these systems.27–31 It should be noted, however, that theexperimental phase diagrams are generally for nonzerotemperatures while the calculated phase diagrams representphase equilibria at 0 K. Hence, some differences betweenthe experimental and first principles phase diagrams are tobe expected.
The phase diagrams constructed from first principlescalculations are given in Figure 1. For the ternary diagrams
(25) Chase, M. W. NIST-JANAF Thermochemical Tables; AmericanInstitute of Physics: Woodbury, NY, 1998; Vol. 12.
(26) Ellingham, H. J. T. J. Soc. Chem. Ind., London 1944, 63, 125.
(27) Osterheld, R. K. J. Inorg. Nucl. Chem. 1968, 30, 3174.(28) Raghavan, V. Phase Diagrams of Binary Iron Alloys; Indian Institute
of Metals: Salt Lake City, Kolkata, 1989.(29) Modaressi, A.; Kaell, J. C.; Malaman, B.; Gerardin, R.; Gleitzer, C.
Mater. Res. Bull. 1983, 18, 101–109.(30) Villars, P.; Prince, A.; Okamoto, H. Handbook of Ternary Alloy Phase
Diagrams; ASM Int.: Tokyo, 1995; Vol. 8, pp 10378–10379.(31) Okamoto, H. Phase Diagrams of Binary Iron Alloys; ASM Int.: Tokyo,
1993.
D Chem. Mater., Vol. xxx, No. xx, XXXX Ong et al.

with oxygen as a component, the reference O2 energy usedincludes the constant -1.36 eV correction to the oxygenenthalpy mentioned previously. This reference energy hasno effect on the constant µO2 phase diagram but only modifiesthe scale of the oxygen chemical potential. Comparing theexperimental and calculated diagrams, the following keyobservations can be made:
1. Li-P-O System. All compounds present in theexperimental Li2O-P2O5 phase diagram at 500 °C27 arepresent in our calculated diagrams. Of the five knownLi-P binary phases,32 LiP7, LiP, Li3P, and Li3P7 are
present in our phase diagram while LiP5 is only slightlyabove the convex hull.
2. Li-Fe-O System. Our phase diagram correctly reflectsthe stable compounds of LiFeO2 and Li5FeO4 in theexperimental diagram at 400 °C.28 However, instead ofLiFe5O8, the lithiated form, Li3Fe5O8, is present in our phasediagram.
3. Fe-P-O System. The experimental Fe-P-O phasediagram for Fe/P g 1 at 900 °C has been established byModaressi et al.29 Of the nine ternary phases identified byModaressi in this region, five are present in our calculatedphase diagram (Fe3(PO4)2, Fe4(PO4)2O, Fe2P2O7, Fe7(PO4)6,and FePO4). Fe3(PO4)O3, Fe2(PO4)O, and Fe9(PO4)O8 arepresent in the experimental diagram but not present in ourcalculated diagram, even though these phases were consid-ered in our calculations. The experimental diagram alsoidentifies Fe5(PO4)3O to be a stable phase, though this phasewas not included in our computations as it is not in the ICSDdatabase. For Fe/P < 1, our calculated phase diagramidentifies Fe3(P2O7)2, Fe4(P2O7)3, FeP4O11, Fe2P4O12, andFe(PO3)3 to be stable phases.
4. Li-Fe-P System. Compared with the experimentalLi-Fe-P phase diagram at 800 °C,30 the binary Li3P, LiP,Fe3P, and Fe2P phases are present in our calculateddiagram. However, FeP and the only known ternary phase,LiFeP33,34 are not stable phases in our calculated phasediagram. Compared with the experimental binary Fe-Pphase diagram,31 all the iron phosphide phases are presentin our calculated diagram except FeP and FeP2. Asmentioned in the previous section, we expect significanterrors in the calculated energies of metallic phases suchas Fe metal and the iron phosphides as the GGA+Umethodology is less applicable. Indeed, using GGA
(32) Sangster, J.; Pelton, A.; Okamoto, H. J. Phase Equilib. Diffus. 1995,16, 92–93.
(33) Juza, R.; Langer, K. Z. Anorg. Allg. Chem. 1968, 361, 58–73.(34) Boyanov, S.; Bernardi, J.; Gillot, F.; Dupont, L.; Womes, M.; Tarascon,
J. M.; Monconduit, L.; Doublet, M. L. Chem. Mater. 2006, 18, 3531–3538.
Table 1. Crystal Structures and Calculated Formation Energies of Phases in the Li-Fe-P-O2 System
phase crystal structure Ef (eVa) phase crystal structure Ef (eV)
Li2O Fm3jm -6.200 LiFeO2 R3jm -9.156Li2O2 P63/mmc -7.040 Li5FeO4 Pbca -21.883FeO Fm3jm -4.095 Li3PO4 Pnma -22.189Fe2O3 R3jc -11.250 Li4P2O7 P21/c1 -36.022Fe3O4 Fd3jm -15.682 LiPO3 P2/c -13.685Fe3P I4j -1.114 Fe9(PO4)O8 Cmmm -47.628Fe2P Pnnm -0.876 Fe3(PO4)O3 R3m -26.078FeP Pnma -0.339 Fe4(PO4)2O P21/c -38.360FeP2 P6j2m -0.601 Fe2PO4O Pnma -20.143FeP4 P21/c -1.265 Fe3(PO4)2 P21/c -34.187P4O18 P212121 -32.042 Fe7(PO4)6 P1j -95.984P2O5 Pnma -17.343 Fe2P2O7 C1j -29.097P4O9 R3jc -31.265 FePO4 Pnma -15.309(P4O6)O2 C2/c -27.792 Fe7(P2O7)4 C2221 -113.022P4O7 P21/c -24.028 Fe3(P2O7)2 Pnma -55.034P4O6 P21/m -20.173 Fe4(P2O7)3 P21/c -80.173LiP7 I41/acd -2.261 Fe2P4O12 C2/c -47.801LiP5 Pna21 -1.873 Fe(PO3)3 Cc -33.953LiP P21/c -1.193 FeP4O11 C1j -41.533Li3P7 P212121 -4.619 LiFePO4 Pnma -18.853Li3P P63/mmc -2.944 Li3Fe2(PO4)3 P21/c -53.192LiFeP P4/nmm -1.238 LiFeP2O7 P21 -29.376LiFe5O8 P4332 -30.650 LiFeP3O9 P212121 -37.523Li3Fe5O8 P4332 -35.668 Li9Fe3(P2O7)3(PO4)2 P3jc1 -132.471
a 1 eV/fu ) 96.49 kJ/mol ) 23.06 kcal/mol.
Figure 1. Phase diagrams for ternary subsystems. Only the section of theFe-P-O phase diagram bounded by the oxides is shown given the largenumber of phases in this system.
EChem. Mater., Vol. xxx, No. xx, XXXXLi-Fe-P-O2 Phase Diagram

energies (without the +U extension) results in a Li-Fe-Pphase diagram (not shown) which is more consistent withthe experimental diagram. With the exception of Fe3P,all other phases present in the experimental diagram arepresent in the GGA phase diagram. However, the +Uextension is necessary to obtain accurate redox energiesfor the iron oxide and phosphate phases, which are the
phases of interest in this work. Hence, GGA+U energiesof all phases were used in constructing the phase diagram.
3.3. Constant µO2 Phase Diagrams. Using the calculatedenergies and the methodology outlined earlier, we haveconstructed a series of phase diagrams at constant µO2, givenin Figures 2-5. Diagrams at lower µO2 represent morereducing environments, which correspond to higher temper-atures and/or lower oxygen partial pressures and/or the
Figure 2. Phase diagrams at less reducing environments.
Figure 3. Phase diagrams at more reducing environments.
Figure 4. Phase diagrams at highly reducing environments.
Figure 5. Phase diagrams at extremely reducing environments.
F Chem. Mater., Vol. xxx, No. xx, XXXX Ong et al.
presence of reducing agents, while higher µO2 represents lessreducing environments. The values of µO2 are chosen so asto present diagrams at key transition µO2, i.e., values of µO2
where an important phase of interest (say LiFePO4) is formedor removed. Figure 2 shows diagrams at mildly reducingenvironments in which the monoclinic Li3Fe2(PO4)3 phaseis still present and most Fe-containing phases have Fe inthe 3+ oxidation state. At µO2 ) -11.52 eV, LiFePO4
appears as the first stable Fe2+-containing phase. As theenvironment becomes more reducing, phases containing Fe3+
are progressively being reduced to Fe2+. Figure 3 showsphase diagrams where mixed valence phosphates, such asFe7(PO4)6, are being reduced to Fe2+ phases. At even morereducing environments (Figure 4), Fe2+ becomes the domi-nant valence state for Fe. Finally, at the extremely reducingenvironments represented by Figure 5, the iron phosphatesare reduced to the metallic iron phosphides (Fe valence of0), and eventually LiFePO4 itself is reduced. The reductionof the remaining highly stable oxygen-containing phases(Li3PO4 and Li2O) takes place at conditions much morereducing than those of interest in this paper. Under thoseconditions, the ternary Li-Fe-P phase (Figure 1d) isreproduced.
Also plotted in all the phase diagrams are dotted linesrepresenting the path of Li off-stoichiometry with respect toLiFePO4. Compositions to the left of LiFePO4 have Li excesswhile compositions to the right have Li deficiency. Forcompositions that do not lie at a stable node on the phasediagram, the phases in equilibrium are given by the verticesof the triangle bounding the position of that composition.For instance, at µO2 ) -16.70 eV, the phase diagramindicates that a Li-deficient material (Li1-xFePO4) materialwill consist of LiFePO4, FeP4, and Fe2P.
3.4. Modified Ellingham Diagram. From the phasediagrams, we were able to extract the predicted phaserelations for key reactions of interest. For instance, from thephase diagrams in Figures 2 and 3, we can see that a systemwith a Li:Fe:P composition of 3:2:3 will transit from a singlephase, Li3Fe2(PO4)3, to a mixture of LiFePO4, Li3PO4, andLiFeP2O7 as µO2 decreases; i.e., Li3Fe2(PO4)3 is being reducedto LiFePO4, Li3PO4, and LiFeP2O7 with the release of O2.
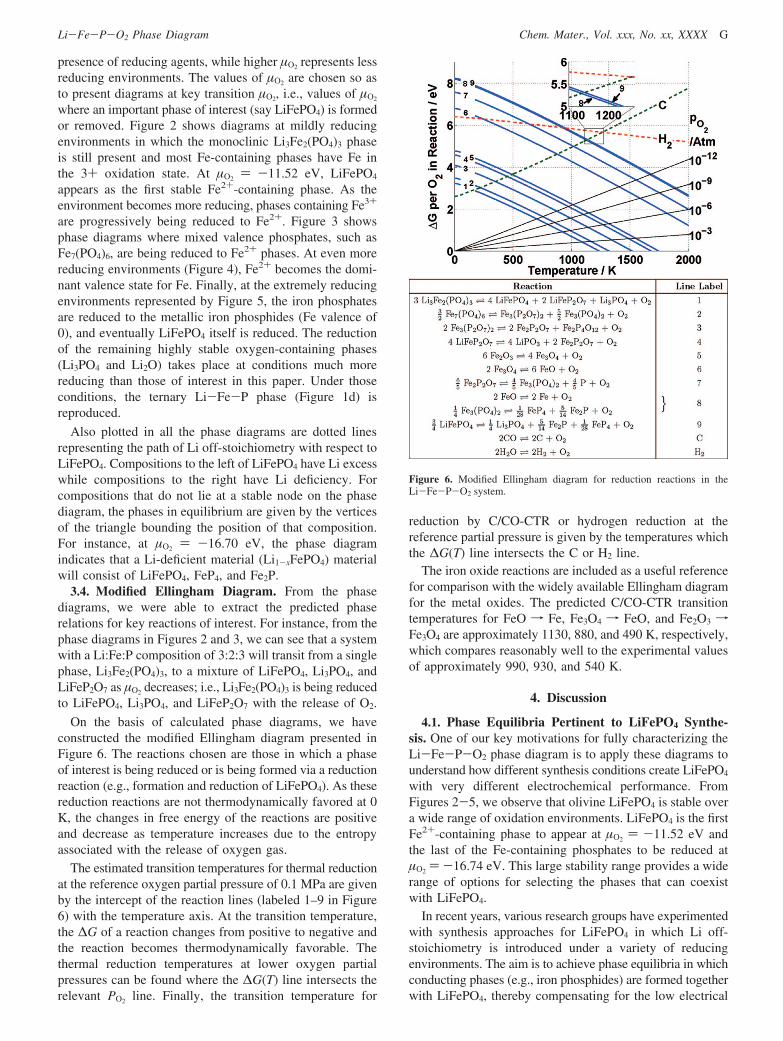
On the basis of calculated phase diagrams, we haveconstructed the modified Ellingham diagram presented inFigure 6. The reactions chosen are those in which a phaseof interest is being reduced or is being formed via a reductionreaction (e.g., formation and reduction of LiFePO4). As thesereduction reactions are not thermodynamically favored at 0K, the changes in free energy of the reactions are positiveand decrease as temperature increases due to the entropyassociated with the release of oxygen gas.
The estimated transition temperatures for thermal reductionat the reference oxygen partial pressure of 0.1 MPa are givenby the intercept of the reaction lines (labeled 1–9 in Figure6) with the temperature axis. At the transition temperature,the ∆G of a reaction changes from positive to negative andthe reaction becomes thermodynamically favorable. Thethermal reduction temperatures at lower oxygen partialpressures can be found where the ∆G(T) line intersects therelevant PO2 line. Finally, the transition temperature for
reduction by C/CO-CTR or hydrogen reduction at thereference partial pressure is given by the temperatures whichthe ∆G(T) line intersects the C or H2 line.
The iron oxide reactions are included as a useful referencefor comparison with the widely available Ellingham diagramfor the metal oxides. The predicted C/CO-CTR transitiontemperatures for FeO f Fe, Fe3O4 f FeO, and Fe2O3 fFe3O4 are approximately 1130, 880, and 490 K, respectively,which compares reasonably well to the experimental valuesof approximately 990, 930, and 540 K.
4. Discussion
4.1. Phase Equilibria Pertinent to LiFePO4 Synthe-sis. One of our key motivations for fully characterizing theLi-Fe-P-O2 phase diagram is to apply these diagrams tounderstand how different synthesis conditions create LiFePO4
with very different electrochemical performance. FromFigures 2-5, we observe that olivine LiFePO4 is stable overa wide range of oxidation environments. LiFePO4 is the firstFe2+-containing phase to appear at µO2 ) -11.52 eV andthe last of the Fe-containing phosphates to be reduced atµO2 ) -16.74 eV. This large stability range provides a widerange of options for selecting the phases that can coexistwith LiFePO4.
In recent years, various research groups have experimentedwith synthesis approaches for LiFePO4 in which Li off-stoichiometry is introduced under a variety of reducingenvironments. The aim is to achieve phase equilibria in whichconducting phases (e.g., iron phosphides) are formed togetherwith LiFePO4, thereby compensating for the low electrical
Figure 6. Modified Ellingham diagram for reduction reactions in theLi-Fe-P-O2 system.
GChem. Mater., Vol. xxx, No. xx, XXXXLi-Fe-P-O2 Phase Diagram

conductivity for LiFePO4. In three papers published between2004 and 2007 (Herle et al.,7 Rho et al.,10 Ellis et al.11),Nazar and colleagues reported that the increase in conductiv-ity previously attributed by Chung et al.6 to aliovalent dopingis in fact due to the formation of iron phosphides duringLiFePO4 synthesis. Systematic investigations were carriedout on “Zr-doped” Li1-xZr0.01FePO4 (with the doping result-ing in a Li deficiency), stoichiometric LiFePO4, and undopedLi-deficient LiFePO4 processed at temperatures ranging from600 to 850 °C. They found that, regardless of doping, Li-deficient Li1-xFePO4 (0.01 < x < 0.07) formed Fe2P2O7 at600 °C, which disappeared at 800 °C to form Fe2P and ironphosphocarbide, Fe75P15C10, at the grain boundaries. Thefraction of Fe2P2O7 was found to be correlated with degreeof Li deficiency. For stoichiometric LiFePO4, formation ofphosphides was found at a higher temperature (850 °C). Theirinvestigations also found that formation of iron phosphidescould be achieved at lower temperatures and shorter sinteringperiods using stronger reducing environments such as 7%H2-N2 or NH3 atmospheres.
Similar investigations were carried out by the Masqueliergroup (Delacourt et al.8,35). They found that Li-rich composi-tions processed at temperatures >500 °C in a N2 atmosphereconsist of LiFePO4, Li3Fe2(PO4)3, and iron oxides. For Li-deficient compositions, the mixed-valence phosphate,Fe7(PO4)6, was formed and as the lithium content decreased,less Fe7(PO4)6 formed but R-FePO4 appeared. Significantamounts of Li3PO4 and iron oxides (Fe2O3 and Fe3O4) werealso found as a result of partial decomposition of LiFePO4.
Kim et al.36 also reported on the effects of synthesisconditions on the properties of LiFePO4. Their experimentsfound Fe2P2O7 and Li3PO4 impurities for Li-deficient andLi-excess stoichiometries, respectively, consistent with thefindings of the Nazar and Masquelier groups.
Table 2 summarizes the predicted phase equilibria fromour first principles Li-Fe-P-O2 phase diagrams for threevalues of µO2, which we believe to be representative of therange of oxidation environments in experimental literature.Lower µO2 phase equilibria correspond to more reducingexperimental conditions of higher temperatures and/or loweroxygen partial pressures and/or the presence of reducingagents, and vice versa. Comparing the predicted phaseequilibria with the experimental findings, we find thefollowing:
1. Li-Deficient Stoichiometries. At less reducing conditions(µO2 ) -10.50 eV), the predicted phase equilibria forintermediate to severe Li-deficiency compositions is consis-
tent with the formation of Fe7(PO4)6 and FePO4 observedby Delacourt et al.8 LiFePO4 itself is not present in the phasediagram at this µO2 level and begins to appear only at µO2 )-11.52 eV (Figure 2). However, inhomogeneities in thereaction environment may allow the coexistence of LiFePO4
with Fe7(PO4)6 and FePO4 in actual experiments. At morereducing conditions, the predicted phase equilibria containsFe2P2O7, and under extremely reducing conditions, ironphosphides are formed. This again compares well with thefindings of the Nazar group. Their observation that theproportion of Fe2P2O7 decreases with more Li-deficientstoichiometries can also be seen from the first principlesphase diagrams by way of the lever rule. We note that forhighly reducing environments the first principles phasediagrams predict the formation of FeP4, which is seldom seenunder experimental conditions. As mentioned previously, weattribute this to likely errors in the calculated energies ofthe metallic iron phosphides due to the application of theGGA+U methodology. Furthermore, phosphorus is treatedas a condensed phase in our framework, though it is likelythe actual experimental conditions are low P chemicalpotential environments due to the vaporization of P.
2. Li-Rich Stoichiometries. For compositions with slightto intermediate Li excess, the predicted phase equilibriacomprises Li3PO4 and iron oxides in all but the most extremereducing conditions. This is consistent with the findings ofKim et al.36 The formation of Li3Fe2(PO4)3, LiFePO4, andFe2O3 for Li-rich compositions observed by Delacourt et al.35
may be due to the partial oxidation of LiFePO4 (Figure 2)or minor inhomogeneities in the reactants or reactionenvironment.
3. Stoichiometric LiFePO4. At sufficiently oxidizing en-vironments, the predicted equilibrium phases are Li3Fe2(PO4)3
and Fe2O3. This is consistent with the findings of Belharouaket al.37
From Figure 6, we can obtain the predicted temperaturesnecessary to achieve reduction of LiFePO4 and Fe2P2O7 tothe iron phosphides. In the absence of reducing agents, theformation of iron phosphides from reduction of LiFePO4 ispredicted to occur at >1500 K. In the presence of carbon,however, the predicted transition temperature decreases toaround 1100 K (assuming CO is produced at the referencepartial pressure), while in a H2 atmosphere, the predictedtransition temperature is even lower at around 900 K (againassuming H2 and H2O are at the reference partial pressure).For formation of the iron phosphides from Fe2P2O7, the phasediagrams indicate that this happens through a two-stagereduction where Fe2P2O7 decomposes first to Fe3(PO4)2,which is in turn reduced to the iron phosphides. The latter(35) Delacourt, C.; Poizot, P.; Tarascon, J. M.; Masquelier, C. Nat. Mater.
2005, 4, 254–260.(36) Kim, D. K.; Park, H. M.; Jung, S. J.; Jeong, Y. U.; Lee, J. H.; Kim,
J. J. J. Power Sources 2006, 159, 237–240.(37) Belharouak, I.; Johnson, C.; Amine, K. Electrochem. Commun. 2005,
7, 983–988.
Table 2. Predicted Phase Equilibria under Various Oxidation and Li Off-Stoichiometry Conditions
µO2/eV Li-deficient stoichiometric Li-excess
-10.50 severe deficiency: LiFeP2O7 + FePO4 + Fe7(PO4)6 Li3Fe2(PO4)3 + Fe2O3 slight-intermediate excess: Li3Fe2(PO4)3 + Li3PO4
intermediate deficiency: LiFeP2O7 + Fe2O3 + Fe7(PO4)6
slight deficiency: Li3Fe2(PO4)3 + LiFeP2O7 + Fe2O3
-13.08 LiFePO4 + Fe2P2O7 LiFePO4 slight-intermediate excess: LiFePO4 + Li3PO4 +Fe2O3
-16.70 LiFePO4 + FeP4 + Fe2P LiFePO4 slight excess: LiFePO4 + Li3PO4 + Fe3Pintermediate excess: Li3PO4 + Fe3P + Fe
H Chem. Mater., Vol. xxx, No. xx, XXXX Ong et al.

process is predicted to take place at slightly lower temper-atures than that for reduction of LiFePO4.
Comparing with the experimental literature, the followingobservations can be made:
1. The predicted temperatures for C/CO-CTR of LiFePO4
compare well with those in experimental literature, whichare generally in the range of 800–900 °C (1073–1173 K).
2. Herle et al.7 have observed that LiFePO4 samplessynthesized from non-carbon-containing precursors do notbecome electrically conducive at any of the temperaturesinvestigated. This is consistent with the high thermalreduction temperatures predicted for stoichiometric LiFePO4
in the absence of reduction agents.3. Ellis et al.11 have reported that CTR of Fe2P2O7 to iron
phosphides takes place at around 800 °C, compared with850 °C for LiFePO4. Reduction in a 7% H2-N2 atmospherewas found to take place at an even lower temperature andshorter sintering times. These are again consistent with thepredictions from our modified Ellingham diagram.
Overall, we found that the predicted phase equilibria andtransition temperatures from our first principles phasediagram and modified Ellingham diagram agree remarkablywell with the findings in the experimental literature surveyed.While there are some differences in some of the phases andtemperatures predicted, these errors do not seem to affect ina significant way the phase evolution as function of composi-tion or reduction conditions.
4.2. Potential Applications. Having validated the dia-grams with experimental literature, they can be used toevaluate current approaches to synthesizing LiFePO4 and inthe development of new synthesis routes to achieve desiredproperties.
Yamada et al.38 identified two key challenges to achievingoptimal performance for LiFePO4: (i) undesirable particlegrowth at T > 600 °C and (ii) the presence of residualnoncrystalline Fe3+ phase at T < 500 °C. Based on ourliterature survey, current approaches to addressing theseobstacles seem to primarily focus on tuning the oxidationenvironment and Li off-stoichiometry. Indeed, our phasediagrams show that the nature and degree of Li off-stoichiometry are important factors in influencing the even-tual phase equilibria obtained. For instance, an excess oflithium is often introduced during LiFePO4 synthesis tocompensate for lithium volatility at high-temperature firingconditions. As can be seen from Figures 2-4, a Li-excessstoichiometry is likely to result in the formation of undesir-able iron oxides at low temperatures, while higher temper-atures may lead to excessive particle growth. The phasediagrams provide a means to identify possible phase equi-libria which may offer better performance. Applying the leverrule on the phase diagrams also provides a means todetermine the stoichiometric proportions needed to achievea desired balance of LiFePO4 and impurity phases, and themodified Ellingham diagram provides a method for fine-tuning the chemical and physical environments to achievethe desired degree of reduction of LiFePO4 and impurityphases.
While our main motivation for this work is to apply thephase diagrams to LiFePO4 synthesis, this is by no meansthe only phase of interest in the Li-Fe-P-O2 system. Forexample, iron phosphates, in particular FePO4, have beenused as a catalyst for oxidative dehydrogenation reactionsfor many years39 while Li3PO4 is used as a solid electrolytein film batteries. The phase diagrams developed can beprovide a better understanding of redox phase relations forthese phases.
Beyond the Li-Fe-P-O2 system, the general methodol-ogy demonstrated in this paper can be extended to any systemof interest with similar characteristics, i.e., systems withprimarily solid state phase transitions in response to changesin the chemical potential of a gas.
4.3. Limitations. Several limitations are inherent in ourapproach to determine the phase diagrams.
First, our phase diagram is developed from phases in theLi-Fe-P-O2 system reported in the ICSD database. Ouranalysis, therefore, by definition does not include phaseswhich have not yet been discovered. However, we do notforesee this to be a major issue as the Li-Fe-P-O2 systemis a well-studied system, and most of the relevant phasesshould have already been identified. A more elaborate searchfor unknown compounds would require a method to predictlikely crystal structures for a large number of possiblestoichiometries. While such an approach has been developedfor metals,40 it does not yet exist for oxides.
Second, we have made several key assumptions in ourfree energy model, most notably considering only theentropic contributions of gaseous phases. This assumptionseems reasonable for the phase equilibria we are interestedin, where phase transitions consist primarily of solid statechanges with the absorption or release of gases. It shouldbe noted, however, that the predicted transition temperaturesare likely to be overestimated as the entropy terms weneglected in the solid state would lower their free energysomewhat.
Finally, while the GGA+U methodology chosen for ourDFT computations has been shown to be useful in obtainingaccurate redox energies, the appropriate values of Ueffective
are dependent on the crystal environment and valence stateof the transition metal ion. We have used an average Ueffective
for Fe in valence states ranging from 0 to 3+. This is likelyto result in errors in the calculated energies, particularly forthe strongly reduced states.
5. Conclusion
In this work, we have presented an efficient method ofcharacterizing from first principles the phase diagram of theLi-Fe-P-O2 system as a function of oxidation conditions.As we only consider the entropy of gaseous phases, tem-perature and oxygen partial pressure can be put on the samescale. By incorporating experimental thermodynamic data,we were also able to construct a modified Ellingham diagram
(38) Yamada, A.; Chung, S. C.; Hinokuma, K. J. Electrochem. Soc. 2001,148, A224–A229.
(39) Miller, J. E.; Gonzales, M. M.; Evans, L.; Sault, A. G.; Zhang, C.;Rao, R.; Whitwell, G.; Maiti, A.; King-Smith, D. Appl. Catal., A 2002,231, 281–292.
(40) Fischer, C. C.; Tibbetts, K. J.; Morgan, D.; Ceder, G. Nat. Mater.2006, 5, 641–6.
IChem. Mater., Vol. xxx, No. xx, XXXXLi-Fe-P-O2 Phase Diagram

to provide a visual representation of the relation betweenthe temperatures, oxygen partial pressures, and chemicalenvironment necessary to achieve a desired reduction reac-tion. The predicted phase equilibria and reduction temper-atures compare well to experimental findings on stoichio-metric and off-stoichiometric LiFePO4 reactions. We believethat the combined application of the phase diagrams andEllingham diagram provides a means to more efficientlyfocus experimental efforts to optimize synthesis approachesfor LiFePO4. While we have focused on the synthesis of
LiFePO4 in this work, the phase diagram can be applied tostudy other compounds of interest in the same system, andmore generally, the methodological approach developed canconceivably be extended to any system of interest.
Acknowledgment. This work was supported by the U.S.Department of Energy under Contract DE-FG02-96ER45571and the BATT program under Contract DE-AC02-05CH11231.
CM702327G
J Chem. Mater., Vol. xxx, No. xx, XXXX Ong et al.