
Impact of solar photovoltaics on the low-voltage ... · PDF fileImpact of solar photovoltaics...
9
Impact of solar photovoltaics on the low-voltage distribution network in New Zealand ISSN 1751-8687 Received on 9th November 2014 Revised on 21st July 2015 Accepted on 21st August 2015 doi: 10.1049/iet-gtd.2014.1076 www.ietdl.org Jeremy D. Watson 1 , Neville R. Watson 1 ✉ , David Santos-Martin 2 , Alan R. Wood 1 , Scott Lemon 2 , Allan J.V. Miller 2 1 Department of Electrical and Computer Engineering, University of Canterbury, Private Bag 4800, Christchurch, New Zealand 2 Electric Power Engineering Centre, University of Canterbury, Private Bag 4800, Christchurch, New Zealand ✉ E-mail: [email protected] Abstract: Residential rooftop-mounted solar photovoltaic (PV) panels are being installed at an increasing rate, both in New Zealand and globally. There have been concerns over possible issues such as overvoltage and overcurrent. These PV systems are mostly connected at low voltage (LV). This study presents a case study of simulating the entire LV network from a single utility, comprising 10,558 11 kV–415 V transformers and their associated distribution feeders. These results are also presented by network type. Various solar PV penetration levels are added to the model and the power- flow results are presented. From these results, possible maximum limits of solar PV penetration are investigated and measures to alleviate overvoltage problems are simulated. The effect of using PV inverters with voltage regulation is simulated. Results show that some minor overvoltage problems can be expected in the future, particularly in urban areas. However, in most cases the overvoltage would not be much higher than the statutory limit of 1.06 p.u. 1 Introduction Concerns over fossil fuel depletion and climate change have caused a high level of interest in renewable energy. As a result, residential rooftop-mounted solar photovoltaic (PV) panels are being installed at an increasing rate, both in New Zealand and globally [1, 2]. This is despite the fact that New Zealand has never had subsidies for PV generation and the buy-back rate for energy export is well below the demand rate. The influx of distributed generation will pose new challenges for electrical power distribution [3–5] and it is important to understand these before they occur, hence the purpose of this paper. PV systems connected to the low-voltage (LV) distribution network may cause overvoltage [6], particularly when high solar radiation coincides with times of low loading, as well as overloading of conductors and transformers. Protection and safety are also of concern. The aim of this study is to determine the impact of PVs on the distribution network in New Zealand. The questions which will be answered are regarding the issues PV generation could potentially cause, and how these can be mitigated effectively. Many valuable previous studies have been performed to evaluate the potential impact of PV. For example, the authors [7–9] have evaluated the impact of distributed generation on the voltage profile along distribution lines; however, most studies have focused on representative or typical networks [8–19]. This does give an insight into the likely problems that may be experienced, but are of limited applicability to other networks and do not give information on the proportion of the LV network that may experience problems. The LV network in New Zealand may well be different to overseas LV feeders, especially as New Zealand is a relatively small island power system. It is therefore important to study the effect of PV systems in a New Zealand distribution system. Another difference to previous studies is that this work assesses the impact of PV generation on a complete distribution system of a single utility. The motivation for doing this is to see how much of the distribution system will experience the violation of limits (voltage magnitudes or overcurrent in conductors). The supplementary question is to what extent will power-factor control on PV inverters alleviate these overvoltages. A perceptive comment from [17] indicates that the 29 feeders they studied do not necessarily represent the whole LV grid. The question is not whether a test feeder will have issues or not, but how much of the whole distribution system. As indicated in [7] the UK network is like the New Zealand system in that it is already operated close to its upper statutory voltage limit in order to allow for voltage drop across the network. The operating voltage does affect the hosting capacity for PV and this was not considered in many of the previous contributions. Although there are similarities across the aforementioned PV impact studies, there are also differences. For example differences exist in: simulation technique (power flow or time domain and also whether deterministic or probabilistic approach), load modelling, PV modelling, type of network represented and level of detail, phenomena of interest and the findings. A brief summary of these studies is provided in Table 1. In Section 2, this paper discusses the methodology of the study performed, describing how the LV network, PV systems and loads are modelled. The power-flow method is also discussed. Section 3 presents the results of the study, focusing on potential overvoltage problems. Methods to mitigate overvoltage problems are investigated, and the effectiveness of these are determined. Finally, the conclusions of the study are presented in Section 4. 2 Methodology At present, the geographical information systems (GSI) and supervisory control and data acquisition (SCADA) systems hold geographic and other information on the network for control and monitoring purposes, but cannot run a power flow of the system. A power-flow model of the medium voltage (MV) is available and maintained separately from the SCADA, but there is no power-flow model of the LV (415 V system). To model the effect of residential PV a three-phase power-flow model first needed to be developed and the approach taken was to download the data held in the GIS and SCADA systems and develop a preconditioning program to trace out the network and create a database that a power-flow program could use directly. This included coping with the small number of imperfections/inaccuracies in the GIS and SCADA data. A purpose built power-flow program was developed, and verified against two commercial programs (for one feeder). Studies were IET Generation, Transmission & Distribution Research Article IET Gener. Transm. Distrib., pp. 1–9 1 This is an open access article published by the IET under the Creative Commons Attribution-NoDerivs License (http://creativecommons.org/licenses/by-nd/3.0/)
-
Upload
truongkhanh -
Category
Documents
-
view
213 -
download
0
Transcript of Impact of solar photovoltaics on the low-voltage ... · PDF fileImpact of solar photovoltaics...

IET Generation, Transmission & Distribution
Research Article
Impact of solar photovoltaics on thelow-voltage distribution network in NewZealand
IET Gener. Transm. Distrib., pp. 1–9This is an open access article published by the IET under the Creative Commons Attribution-NoDerivs Lice(http://creativecommons.org/licenses/by-nd/3.0/)
ISSN 1751-8687Received on 9th November 2014Revised on 21st July 2015Accepted on 21st August 2015doi: 10.1049/iet-gtd.2014.1076www.ietdl.org
Jeremy D. Watson1, Neville R. Watson1 ✉, David Santos-Martin2, Alan R. Wood1, Scott Lemon2,
Allan J.V. Miller2
1Department of Electrical and Computer Engineering, University of Canterbury, Private Bag 4800, Christchurch, New Zealand2Electric Power Engineering Centre, University of Canterbury, Private Bag 4800, Christchurch, New Zealand
✉ E-mail: [email protected]
Abstract: Residential rooftop-mounted solar photovoltaic (PV) panels are being installed at an increasing rate, both in NewZealand and globally. There have been concerns over possible issues such as overvoltage and overcurrent. These PVsystems are mostly connected at low voltage (LV). This study presents a case study of simulating the entire LV networkfrom a single utility, comprising 10,558 11 kV–415 V transformers and their associated distribution feeders. Theseresults are also presented by network type. Various solar PV penetration levels are added to the model and the power-flow results are presented. From these results, possible maximum limits of solar PV penetration are investigated andmeasures to alleviate overvoltage problems are simulated. The effect of using PV inverters with voltage regulation issimulated. Results show that some minor overvoltage problems can be expected in the future, particularly in urbanareas. However, in most cases the overvoltage would not be much higher than the statutory limit of 1.06 p.u.
1 Introduction
Concerns over fossil fuel depletion and climate change have caused ahigh level of interest in renewable energy. As a result, residentialrooftop-mounted solar photovoltaic (PV) panels are being installedat an increasing rate, both in New Zealand and globally [1, 2].This is despite the fact that New Zealand has never had subsidiesfor PV generation and the buy-back rate for energy export is wellbelow the demand rate. The influx of distributed generation willpose new challenges for electrical power distribution [3–5] and itis important to understand these before they occur, hence thepurpose of this paper. PV systems connected to the low-voltage(LV) distribution network may cause overvoltage [6], particularlywhen high solar radiation coincides with times of low loading, aswell as overloading of conductors and transformers. Protection andsafety are also of concern. The aim of this study is to determinethe impact of PVs on the distribution network in New Zealand.The questions which will be answered are regarding the issues PVgeneration could potentially cause, and how these can be mitigatedeffectively.
Many valuable previous studies have been performed to evaluatethe potential impact of PV. For example, the authors [7–9] haveevaluated the impact of distributed generation on the voltage profilealong distribution lines; however, most studies have focused onrepresentative or typical networks [8–19]. This does give an insightinto the likely problems that may be experienced, but are of limitedapplicability to other networks and do not give information on theproportion of the LV network that may experience problems. TheLV network in New Zealand may well be different to overseas LVfeeders, especially as New Zealand is a relatively small islandpower system. It is therefore important to study the effect of PVsystems in a New Zealand distribution system. Another differenceto previous studies is that this work assesses the impact of PVgeneration on a complete distribution system of a single utility. Themotivation for doing this is to see how much of the distributionsystem will experience the violation of limits (voltage magnitudesor overcurrent in conductors). The supplementary question is towhat extent will power-factor control on PV inverters alleviatethese overvoltages. A perceptive comment from [17] indicates thatthe 29 feeders they studied do not necessarily represent the whole
LV grid. The question is not whether a test feeder will have issuesor not, but how much of the whole distribution system. Asindicated in [7] the UK network is like the New Zealand system inthat it is already operated close to its upper statutory voltage limitin order to allow for voltage drop across the network. Theoperating voltage does affect the hosting capacity for PV and thiswas not considered in many of the previous contributions.
Although there are similarities across the aforementioned PVimpact studies, there are also differences. For example differencesexist in: simulation technique (power flow or time domain andalso whether deterministic or probabilistic approach), loadmodelling, PV modelling, type of network represented and level ofdetail, phenomena of interest and the findings. A brief summary ofthese studies is provided in Table 1.
In Section 2, this paper discusses the methodology of the studyperformed, describing how the LV network, PV systems and loadsare modelled. The power-flow method is also discussed. Section 3presents the results of the study, focusing on potential overvoltageproblems. Methods to mitigate overvoltage problems areinvestigated, and the effectiveness of these are determined. Finally,the conclusions of the study are presented in Section 4.
2 Methodology
At present, the geographical information systems (GSI) andsupervisory control and data acquisition (SCADA) systems holdgeographic and other information on the network for control andmonitoring purposes, but cannot run a power flow of the system. Apower-flow model of the medium voltage (MV) is available andmaintained separately from the SCADA, but there is no power-flowmodel of the LV (415 V system). To model the effect of residentialPV a three-phase power-flow model first needed to be developedand the approach taken was to download the data held in the GISand SCADA systems and develop a preconditioning program totrace out the network and create a database that a power-flowprogram could use directly. This included coping with the smallnumber of imperfections/inaccuracies in the GIS and SCADA data.A purpose built power-flow program was developed, and verifiedagainst two commercial programs (for one feeder). Studies were
1nse

Table 1 Literature review of PV impact studies on distribution networks
Ref. Electricity network Comments Analysis method Conclusions/contribution
[7] One representative 11 kV feeder andall LV connected (Leicester, UK).
|V| and losses Unbalanced load flow. Timeseries
The 50% scenario assumes a 2160 W array on halfof all houses, even this very high penetration ofPV will cause only small increases in averagenetwork voltages (2 V). Peak loadings would be
unaffected, since PV output and peak loads do notcoincide in the UK.
[8] One representative LV network fromMalaysian system.
|V| and unbalance Unbalanced load flow(OpenDSS). Time series
Voltage rise still within limits for 200% PVpenetration.
[9] Canadian benchmark test system. |V| Time domain (PSCAD/EMTDC)
2.5 kW/house is acceptable.
[10] Representative networks (fromNREL).
|V| Load flow (powerworldsimulator)
Penetration level up to 20% acceptable.
[11] 16 feeders |V| and overcurrent.Three scenarios for PV
location
GridLAB-D 50% penetration acceptable (PV power/peak loadapparent power).
[13] One LV feeder (from Denmark). |V| Load flow (power factory).Time series
Effect of reactive power control methods on PVhosting capacity.
[14] One LV feeder modelled in detail. |V| Time domain (MATLAB/SIMULINK and powersystem blockset). Time
series
PV effect on |V|.
[15] Two LV distribution feeders from twoactual distribution systems
(Australia). Limited LVrepresentation.
|V|, harmonics, loss ofPV
Load flow (PSS SinCal) Harmonics not a major concern.
[16] Simplistic 3 node LV system. |V| Time domain (MATLAB/SIMULINK).
Presents a simulation tool rather than tangibleresults.
[17] Representative LV networks fromBelgium used.
|V|, unbalance, neutraldisplacement
Load flow (NEPLAN) Gives a good representation of the expectedeffects for feeders which are similar. It has not
been verified that these feeders are representativeof the whole LV grid.
[18] Contrived test system taken fromprevious publications.
|V| Time domain (ATP) Probabilistic approach to PV placement.
[19] IEEE 13 and IEEE 34 bus test system. |V| and unbalance Unbalance 3-phase load-flow(custom)
Scheduling of single-phase DG can reduce voltageunbalance factors. It also released substation
capacity.[22] IEEE 34 bus test system. |V| and V regulator
operationLoad flow (OpenDSS). Time
seriesContribution is the modelling method.
then performed to determine the proportion of the network that wouldexperience issues due to the PV. Moreover, clustering was performedto see how dependent these issues were on the type of network.Finally, different inverter characteristics (volt–var responses) weresimulated and this resulted in the standard being drafted
Fig. 1 Master-plan for evaluating the impact of new technology
2 This is an open access article published by th
(AS/NZS4777.2) to be modified for New Zealand conditions. Thiswork has demonstrated the feasibility of performing a power-flowanalysis on a complete distribution system and has shown that GISand SCADA data, with preconditioning, can give a power-flowmodel that is useful for such studies. It has also demonstrated the
IET Gener. Transm. Distrib., pp. 1–9e IET under the Creative Commons Attribution-NoDerivs License
(http://creativecommons.org/licenses/by-nd/3.0/)
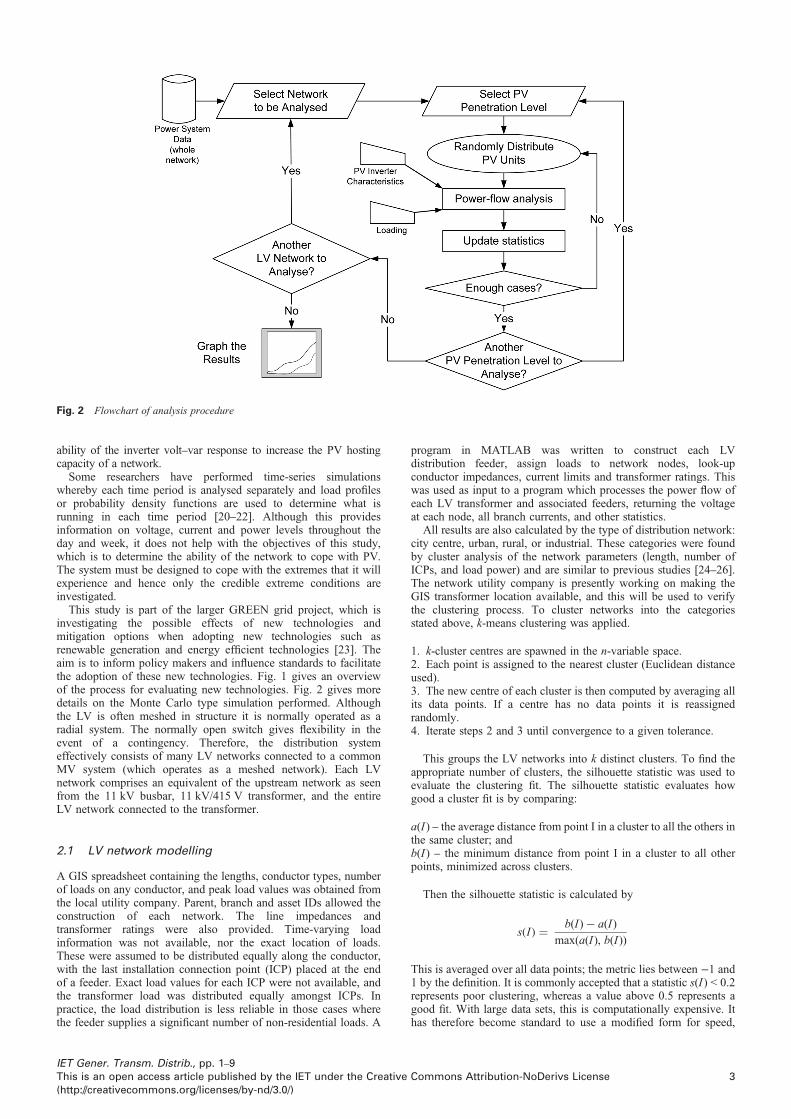
Fig. 2 Flowchart of analysis procedure
ability of the inverter volt–var response to increase the PV hostingcapacity of a network.
Some researchers have performed time-series simulationswhereby each time period is analysed separately and load profilesor probability density functions are used to determine what isrunning in each time period [20–22]. Although this providesinformation on voltage, current and power levels throughout theday and week, it does not help with the objectives of this study,which is to determine the ability of the network to cope with PV.The system must be designed to cope with the extremes that it willexperience and hence only the credible extreme conditions areinvestigated.
This study is part of the larger GREEN grid project, which isinvestigating the possible effects of new technologies andmitigation options when adopting new technologies such asrenewable generation and energy efficient technologies [23]. Theaim is to inform policy makers and influence standards to facilitatethe adoption of these new technologies. Fig. 1 gives an overviewof the process for evaluating new technologies. Fig. 2 gives moredetails on the Monte Carlo type simulation performed. Althoughthe LV is often meshed in structure it is normally operated as aradial system. The normally open switch gives flexibility in theevent of a contingency. Therefore, the distribution systemeffectively consists of many LV networks connected to a commonMV system (which operates as a meshed network). Each LVnetwork comprises an equivalent of the upstream network as seenfrom the 11 kV busbar, 11 kV/415 V transformer, and the entireLV network connected to the transformer.
2.1 LV network modelling
A GIS spreadsheet containing the lengths, conductor types, numberof loads on any conductor, and peak load values was obtained fromthe local utility company. Parent, branch and asset IDs allowed theconstruction of each network. The line impedances andtransformer ratings were also provided. Time-varying loadinformation was not available, nor the exact location of loads.These were assumed to be distributed equally along the conductor,with the last installation connection point (ICP) placed at the endof a feeder. Exact load values for each ICP were not available, andthe transformer load was distributed equally amongst ICPs. Inpractice, the load distribution is less reliable in those cases wherethe feeder supplies a significant number of non-residential loads. A
IET Gener. Transm. Distrib., pp. 1–9This is an open access article published by the IET under the Creative(http://creativecommons.org/licenses/by-nd/3.0/)
program in MATLAB was written to construct each LVdistribution feeder, assign loads to network nodes, look-upconductor impedances, current limits and transformer ratings. Thiswas used as input to a program which processes the power flow ofeach LV transformer and associated feeders, returning the voltageat each node, all branch currents, and other statistics.
All results are also calculated by the type of distribution network:city centre, urban, rural, or industrial. These categories were foundby cluster analysis of the network parameters (length, number ofICPs, and load power) and are similar to previous studies [24–26].The network utility company is presently working on making theGIS transformer location available, and this will be used to verifythe clustering process. To cluster networks into the categoriesstated above, k-means clustering was applied.
1. k-cluster centres are spawned in the n-variable space.2. Each point is assigned to the nearest cluster (Euclidean distanceused).3. The new centre of each cluster is then computed by averaging allits data points. If a centre has no data points it is reassignedrandomly.4. Iterate steps 2 and 3 until convergence to a given tolerance.
This groups the LV networks into k distinct clusters. To find theappropriate number of clusters, the silhouette statistic was used toevaluate the clustering fit. The silhouette statistic evaluates howgood a cluster fit is by comparing:
a(I ) – the average distance from point I in a cluster to all the others inthe same cluster; andb(I ) – the minimum distance from point I in a cluster to all otherpoints, minimized across clusters.
Then the silhouette statistic is calculated by
s I( ) = b(I)− a(I)
max(a(I), b(I))
This is averaged over all data points; the metric lies between −1 and1 by the definition. It is commonly accepted that a statistic s(I ) < 0.2represents poor clustering, whereas a value above 0.5 represents agood fit. With large data sets, this is computationally expensive. Ithas therefore become standard to use a modified form for speed,
3Commons Attribution-NoDerivs License

Table 2 Typical network sizes
Area City Urban Industrial Rural
number of residential loads 15 68 0 3number of commercial loads 27 3 1 1peak load per ICP, kW 9.13 5.58 544.96 39.68
evaluating how close each point is to its centre a(I ), compared to thenearest other centre b(I ). The number of cluster variables was variedand the optimum number of clusters was found to be four, with asilhouette statistic of 0.71. Since the silhouette statistic is close to1, we can conclude that the data contains clear evidence ofclustering. By inspection, these clusters may be classified into thecategories of ‘City’, ‘Urban’, ‘Rural’ and ‘Industrial’. The result ofthe clustering process was that in the 10,558 LV networksmodelled, there are 358 transformers classified as City, 1962 asUrban, 327 as Industrial, and 7937 as Rural. Table 2 shows thetypical network sizes.
The extensive LV network data provided by the utility is generallyof high quality. A small proportion of the data are estimates, whichmay be inaccurate in a few cases. In particular a few very high loads,and conservatively-estimated current ratings of a few unknownconductors, affect the proportion of conductors which appear toexceed their current ratings. Nevertheless, for the simulation ofovervoltage the effect is not significant.
2.2 PV modelling
An actual solar PV installation was measured, and the results wereused in the model. The EnaSolar 5 kW inverter was modelled atan output power of 3.7 kW. The authors plan to monitor, modeland simulate other solar PV installations as well.
A stochastic modelling approach was taken for the uptake of PVunits due to the uncertainty regarding which customers will adoptPV. The approach is similar to that taken for electric vehiclestudies [27–31]. In this study, the term ‘penetration level’ refers tothe proportion of PV units (number of loads with PV divided bythe total number of loads). The solar PV installations weredistributed randomly throughout the network. The PV systems aremodelled as fixed current injections; however, the current spectra
Fig. 3 Power-factor control of draft AS/NZS4777.2
4 This is an open access article published by th
were shifted between iterations in accordance with the voltageangle (using the previous iteration estimate). By doing this thecorrect phase relationship between the terminal voltage and currentspectrum is maintained.
2.3 Load modelling
2.3.1 Unbalance: The single-phase loads were distributed acrossthe phases, with each successive load being assigned to the nextphase. This results in the system being either balanced or onlyslightly unbalanced. The local utility has little difficulty in mitigatingunbalance by changing the connection of any particular ICP.
2.3.2 Load profile: In New Zealand, the instantaneous powerconsumption of an average house can range from 0.1 to 10 kW,with a typical average of about 1 kW [32]. Actual load profileswere investigated in this regard. The utility has a limited amountof measurement data in terms of loading level (hence averagedemand per house) and maximum demand (from maximumdemand indicators at the transformers). This does not, of course,go down to the individual ICP level. These figures were:
At peak load after diversity: 3 kW/house.At low load (in summer, during the day) after diversity: 0.6 kW/house.
These figures were used to scale the load in simulation. As theloading given was from the distribution transformer maximumdemand indicators, a factor of 0.2 was used to reduce residentialloads from the ‘peak load’ to a ‘low load’ level.
2.4 Power-flow method
A network admittance matrix-based unbalanced three-phasepower-flow written MATLAB was used to solve for the voltagesin each LV network. The loads were represented as constant powerloads, although modelling them as constant impedance loads wasalso performed for comparison. At peak load, the differencebetween the two methods did not exceed a couple of volts. Theprogram converts the load power for impedances, solves the linearsystem of equations for voltages, then uses the estimated voltages
IET Gener. Transm. Distrib., pp. 1–9e IET under the Creative Commons Attribution-NoDerivs License
(http://creativecommons.org/licenses/by-nd/3.0/)

to recalculate the load impedances. The algorithm iterates until thepower mismatch at every node is less than 0.1 W.
The whole Orion LV network is simulated 100 times at each PVpenetration level, and this is used to plot the extent of overvoltageproblems at various PV penetration levels and in different types ofLV networks. The location of the PV generation, and the loaddistribution is randomised to reflect the fact that neither PVinstallations nor loads are constant in power or evenly distributedphysically. The selection of 100 simulations was chosen in orderto understand the distribution of the results. It was impractical touse a larger number of simulations due to computational constraints.
2.5 Mitigation
Three different ways of mitigating potential overvoltage problemswere simulated.
(i) Reactive power control: This was simulated, based on thepower-factor control specified in the draft Australian/New Zealandstandards (AS/NZS4777.2) depicted in Fig. 3. However, the uppervoltage threshold had to be modified to suit New Zealand standards,as the statutory limit in Australia is 1.10 p.u. In New Zealand, thestatutory voltage limit is 1.06 p.u., and therefore, reactive powercontrol would not be activated until the voltage is already well overthe limit. Therefore, the voltage threshold of 240 V was usedinstead of 250 V (which is specified in the draft AS/NZS4777.2standard). The power-factor was altered in response to the terminalvoltage. The shapes of the curve are those in Table 3. To keep theinverter within its current rating the real power is reduced to give aconstant apparent power when applying Q control.(ii) Transformer secondary voltage: A significant number of 11kV–415 V transformers in New Zealand have tap settings, whichallow the transformer secondary voltage to be adjusted. However,many newer transformers do not have the option of different tappositions. For the simulation, the secondary voltage was simplyreduced from the utility-supplied figure of 415 V (about 1.05 p.u.)to 410 V (about 1.03 p.u.).(iii) Adopting 1.10 p.u. as an upper voltage limit: In New Zealand,the statutory overvoltage limit is 1.06 p.u. Some other countries haveadopted 1.10 p.u. as the statutory upper voltage limit.(iv) Other ways: According to the utility, the first low costmechanism to manage overvoltage on the urban feeders is to usethe line drop compensation at the zone substation on the 11 kV(reduces voltage at low load). Demand-side management, batterystorage and so on are other ways in which overvoltage may bemitigated. These are not investigated in this paper. The draft AS/NZS4777.2 standard specifies what is known as a ‘volt–var’ and‘volt–watt’ response. AS/NZS4777.2 leaves it to the utility tospecify which of the two responses is required in the PV inverterto deem compliance. The comparative effectiveness depends onthe R/X ratio of the network. For networks with low R/X ratios(≤1) the voltage magnitude is strongly linked to the reactive power
Table 3 Reactive power control investigated by simulation
Voltage, V Power factor (option 1) Power factor (option 2)
<208 0.95 leading 0.80 leading208–220 0.95 to unity (linear) 0.80 to unity (linear)220–240 unity unity240–255 unity to 0.95 lagging (linear) unity to 0.80 lagging (linear)255+ 0.95 lagging 0.80 lagging
Table 4 Proportion of nodes which are undervoltage by classifiedcategories
Cluster City Urban Industrial Rural Total
percentage of networkswithin cluster
20.67% 16.72% 32.56% 8.38% 11.06%
IET Gener. Transm. Distrib., pp. 1–9This is an open access article published by the IET under the Creative(http://creativecommons.org/licenses/by-nd/3.0/)
(vars) and more weakly to the real power (watts). With high R/Xratio systems the converse is true and varying the real powercontrols the voltage magnitude more successfully.
3 Results and discussion
Peak load without PV is modelled first, followed by reduced loadwith increasing levels of solar PV.
3.1 Peak load, no solar PV
At the yearly peak load, with no solar PV, the modelling suggeststhat 11.06% of the LV network has undervoltage problems(Table 4). Naturally there are no overvoltage problems. Note thatin reality the transformer secondary voltage may be higher thanthe utility-supplied figure of 415 V, which would reduce thefigures in Table 4.
A total of 11,599 branches (5.2%) exceed their current ratings inthe simulation. Some of these may not be genuine overcurrentcases. The GIS data, which the simulations are based on, containsestimates for unknown data. This is a consequence of old buriedcables and overhead conductors being implemented before modern‘as built’ processes and a GIS system were implemented. On apositive note the distribution network owner is proactivelyupdating records to eliminate these data gaps. The GIS datacontains estimates for:
† load distribution, particularly of non-residential loads;† unknown conductors (conservatively estimated to highlightpotential problems).
No actual voltage measurements from the utility were available tobe compared with the simulation results, since the utility could notsupply the GIS information with the data for confidentialityreasons. Neither current nor power measurements were available ateach ICP; and the DSO has no record of undervoltage problemsunless a customer complains. Hence, verification was performedby modelling one transformer and associated feeders in PSSSinCal (Siemens) and also SimPowerSystems (MathWorks) toensure the developed power flow was giving the correct results.
3.2 Reduced load, varying solar PV penetration
The load was reduced according to figures supplied by the utility asin Section 2.3, and PV was added to the simulation. The results inFigs. 4–8 show the simulated performance of the LV network inregards to overcurrent, reverse power flow, and overvoltage. Fig. 4
Fig. 4 Overloaded conductors
5Commons Attribution-NoDerivs License

Fig. 5 Number of transformers with reverse power flow
shows that a little solar PV can help combat overcurrent (thermalconstraint), as long as the PV is generating during times ofpeak load (unfortunately not the case in residential areas where theload peaks at winter evenings). As the penetration level isincreased, the number of overloaded conductors dramaticallyincreases as the reverse power flow dominates. As mentionedpreviously, there is a small proportion (∼1%) of outliers in thedata, and these constitute many of the thermally constrainedconductors in Fig. 4.
The number of transformers with reverse power flow is shown inFig. 5. Very few cases are found until the solar PV penetration levelreaches 0.25 or higher.
A comparison of howeach type of LV network copes with solar PVis shown in Fig. 6, with further details shown in Fig. 7. Fig 8 shows the5th and 95th percentile results in order to see the approximatedistribution. Note that the deviation of the results in each categoryis strong related to how many LV networks are present in the group.
Fig. 6 Percentage of networks with overvoltage problems by classified categorie
6 This is an open access article published by th
The percentage of networks with overvoltage simply measures theproportion of LV networks with some part of the network above thevoltage magnitude limit. Figs. 6 (dash-dot line) and 8a show thatthe urban LV network is able to host 10-15% solar PV penetrationwithout significant problems. Above this level overvoltageproblems increase sharply. However, the overvoltage is generallynot much higher than the statutory limit of 1.06 p.u.
City/commercial areas (Fig. 6, dashed line and Fig. 8b) aregenerally more compact, have larger loads and a higher-ratedtransformer than urban areas. Hence they are better equipped tocope with solar PV. Since the city centre is more compact theimpedance is lower. The loading is unlikely to be low duringday-time in the city centre, unlike residential areas.
In rural areas of New Zealand, each LV network usually has only afew ICPs on it (often all part of one farm). The distance betweenfarms means that MV (MV, typically 11 kV) is reticulated alongthe roads and individual 11 kV/415 V transformers supply eachfarm (and in many cases several transformers per farm due todedicated transformers being supplied for the irrigation pumpload). Hence there is a minimal LV network associated with eachICP. In this simulation rural LV networks cope with solar PVrelatively well (Figs. 6 and 8c), since the peak load is quite highand the maximum solar capacity modelled is low (one per ICP).The PV size is insignificant compared to the pumps and farmshed loads, although these are often not operational which maypossibly lead to overvoltage problems in the small local LVnetwork. One would expect larger solar/wind/hydro installationsat farms due to the larger areas available, however, these ought tobe connected at MV rather than LV. Solar PV was not found to bean issue in industrial networks. As expected the industrialnetworks did not have any overvoltage problems for allpenetration levels.
The results show that the statistics for a large system are verystable. When the PV units are randomly distributed over the wholesystem some LV networks may have more units and hence moreproblems (probably), but others will have less PV units and henceless problems. Therefore, the statistics for the complete system(proportion of overvoltages and proportion of lines withovercurrent) is reasonably static (low standard deviation).
s
IET Gener. Transm. Distrib., pp. 1–9e IET under the Creative Commons Attribution-NoDerivs License
(http://creativecommons.org/licenses/by-nd/3.0/)

Fig. 7 Total proportion of networks with undervoltage problems
a Against solar PV penetration levelb Against PV kW per connection
Fig. 8 Percentage of
a urban networks with overvoltage problemsb city networks with overvoltage problemsc rural networks with overvoltage problems
IET Gener. Transm. Distrib., pp. 1–97This is an open access article published by the IET under the Creative Commons Attribution-NoDerivs License
(http://creativecommons.org/licenses/by-nd/3.0/)

Table 8 Results: 1.10 p.u. statutory limit
Threshold, percentageof networks withovervoltage problems
Maximumallowable PV
penetration level, %
Increase in PVpenetration level over
1.06 p.u. statutory limit,%
1% urban 30 205% urban 46 3110% urban 54 36
Fig. 9 Steady-state voltage histogram
3.3 Mitigation of overvoltage
As urban networks are by far the most likely to experienceovervoltage problems, the mitigation analysis will focus solely onthese networks. Urban networks are most likely to experienceextreme conditions (i.e. low load, high solar PV generation; andhigh load, without solar PV generation); hence this extremecondition study best applies to urban networks.
3.3.1 Reactive power control: Reactive power control iscommonly used to limit overvoltage. Although the increase inallowable PV penetration is moderate, it must be noted that extremeovervoltages are substantially reduced. This is due to the fact thatreactive power control is only activated at ICPs with a high voltagemagnitude. The limits with every solar PV system having reactivepower control and real power roll-back are given in Tables 5 and 6.The maximum allowable proportion of urban networks experiencingovervoltage is chosen in the first ‘Threshold’ column. A thresholdof 5% means that 5% of urban networks may experienceovervoltage problems. The maximum allowable PV penetration isthen determined in the second column, and the correspondingimprovement over the base case is given in the third column.
As Table 6 shows, reactive power control with a minimumpower-factor of 0.95 for the PV inverters makes little difference.The R/X ratio of the distribution system is high (about 1.0) whichreduces the effectiveness of reactive power control alone. Theresults with a minimum power factor of 0.80 are somewhat better(Table 6).
3.3.2 Reduced transformer secondary voltage: Reducingthe transformer secondary voltage allows a significantly higherpenetration level of solar PV, as shown in Table 7. However, atpeak load undervoltage problems are significantly worse, and thenumber of overcurrent branches increases, as do the line losses.
Sometimes the transformer secondary voltage is set at the high endof the allowable range. This alleviates the likelihood ofundervoltages occurring and reduces losses. However, often therange of loading does not require this as the voltage variation isnot that great. This is illustrated in Fig. 9, where a sample
Table 6 Results: reactive power control based on ASNZS 4777.2. Theminimum power factor is 0.80
Threshold, percentage ofnetworks withovervoltage problems
Maximum allowablePV penetration level,
%
Increase in PVpenetration overbase case, %
1% urban 13 35% urban 20 410% urban 23 5
Table 5 Results: reactive power control, based on ASNZS 4777.2. Theminimum power-factor is 0.95
Threshold, percentage ofnetworks withovervoltage problems
Maximum allowablePV penetration level,
%
Increase in PVpenetration overbase case, %
1% urban 11 15% urban 17 210% urban 20 2
Table 7 Results: decreased transformer secondary voltage (1.03 p.u.,410 V)
Threshold, percentage ofnetworks withovervoltage problems
Maximum allowablePV penetration
level, %
Increase in PVpenetration level over
base case, %
1% urban 17 75% urban 25 910% urban 30 12
8 This is an open access article published by th
recorded steady-state voltage histogram from a site on the networkis displayed. The site could not be identified in the simulation forconfidentiality reasons. Reducing the transformer secondaryvoltage would increase the hosting capacity for PV. The utilitymanages overvoltage by applying line drop compensation (orapparent current boost) at the zone substation, which provides alower MV voltage (typically 10.9 kV) at times of low load andhigher voltage (typically 11.2 kV) at high load. The ‘apparentcurrent boost’ settings could be modified in the future to bettermanage the risk of overvoltage caused by PV.
3.3.3 Higher statutory upper voltage limit (1.10 p.u.): Manycountries have 1.10 p.u. as the upper voltage statutory limits. In mostof these cases, the higher limit is due to legacy issues and the longlifetime of the assets in the power system. This allows a muchhigher penetration of PV on the LV network, as shown in Table 8,however the higher limit for voltage does place a more stringentrequirement on product design.
4 Conclusions
This work has demonstrated the feasibility of performing apower-flow analysis on a complete distribution system and hasshown that GIS and SCADA data, with preconditioning, can givea power-flow model that is useful for such studies.
The potential impact of distributed PV generation on a LVnetwork in New Zealand has been investigated. K-meansclustering has been used to categorise parts of the LV networkinto city, urban, industrial and rural networks. The hosting limit(allowable penetration level) for PV on these different types of LVnetworks has been found. Urban networks were found to have theleast capacity to host PV. Nevertheless, each LV network isdifferent, and there is a wide variance as to how much a specificLV network can cope with.
Methods to increase this maximum allowable penetration levelhave been evaluated. Reactive power control with an appropriatevoltage trigger level does increase the hosting capacity, but needsto be extended to a power-factor of 0.80 to be significant (0.95limit gives minimal improvement). Changing transformertap-position to reduce the secondary voltage does increase hostingcapacity significantly if it can be performed without
IET Gener. Transm. Distrib., pp. 1–9e IET under the Creative Commons Attribution-NoDerivs License
(http://creativecommons.org/licenses/by-nd/3.0/)

under-voltages occurring. Overvoltages are perhaps best managed atlower to medium PV uptake levels by utilising line dropcompensation at the zone substation transformer.
According to the simulation results, overloading of conductorswill only occur for very high PV penetration levels (>0.45). Someovervoltage problems can be expected in the future, particularly inurban areas as the penetration level increases. In most cases, theovervoltage would not be much higher than the statutory limit of1.06 p.u. However, although the number of overvoltages andoverloaded conductors is low for relatively high PV penetrationlevels, it is still very expensive to reinforce the system whenunderground work is required.
This work also showed the ineffectiveness of the initialpower-factor control proposed by the draft AS/NZS4777.2standard. This is mainly due to the voltage limits in Australiabeing different to New Zealand. Moreover, controlling thepower-factor to be 0.95 has insufficient impact and a power-factorof 0.80 is required to have a significant impact. Only requiring PVinverters of 5 kW rating or greater to have a volt–var or volt–wattresponse is not sufficient as the large number of smaller PVinverters can be just as detrimental – and the use of the largenumber of micro-inverters is becoming a popular concept.
5 Acknowledgments
The authors wish to acknowledge Glenn Coates and AndrewMulligan of Orion NZ Ltd for supplying the low-voltage networkdata and associated report and answering many related questions.The financial support from Ministry of Business, Innovation andEmployment (MBIE), Electricity Engineers’ Association andTranspower NZ Ltd was also gratefully acknowledged.
6 References
1 Zahedi, A., Lu, J.: ‘Economic evaluation of grid-connected solar PV productioncost in New Zealand’. Int. Conf. on Power System Technology (POWERCON2012), Auckland, New Zealand, 30 October–2 November 2012, pp. 1–4
2 Miller, A., Williams, J., Wood, A.R.: ‘Photovoltaic solar power uptake in NewZealand’. Electricity Engineers’ Association (EEA) Conf. and Trade Exhibition,2014
3 Latheef, A., Negnevitsky, M., Muttaqi, K., Perera, S.: ‘Present understanding of theimpact of distributed generation on power quality’. Australasian Universities PowerEngineering Conf., 2008, 14–17 December 2008, pp. 1–6
4 Trichakis, P., Taylor, P.C., Lyons, P.F., Hair, R.: ‘Predicting the technical impactsof high levels of small-scale embedded generators on low-voltage networks’, IETRenew. Power Gener., 2008, 2, (4), pp. 249–262
5 Marti, P., Velasco, M., Fuertes, J.M., Camacho, A., Miret, J., Castilla, M.:‘Distributed reactive power control methods to avoid voltage rise ingrid-connected photovoltaic power generation systems’. 2013 IEEE 22nd Int.Symp. on Industrial Electronics (ISIE), Taipei, Taiwan, 28–31 May 2013, pp. 1–6
6 Walling, R.A., Saint, R., Dugan, R.C., Burke, J., Kojovic, L.A.: ‘Summary ofdistributed resources impact on power delivery systems’, IEEE Trans. PowerDeliv., 2008, 23, (3), pp. 1636–1644
7 Thomson, M., Infield, D.G.: ‘Impact of widespread photovoltaics generation ondistribution systems’, IET Renew. Power Gener., 2007, 1, pp. 33–40
8 Tie, C., Gan, C.: ‘Impact of grid-connected residential PV systems on the Malaysialow voltage distribution network’. 2013 IEEE 7th Int. Power Engineering andOptimization Conf. (PEOCO), Langkawi Island, Malaysia, 3–4 June 2013,pp. 670–675
9 Tonkoski, R., Turcotte, D., El-Fouly, T.: ‘Impact of high PV penetration on voltageprofiles in residential neighborhoods’, IEEE Trans. Sustain. Energy, 2012, 3, (3),pp. 518–527
IET Gener. Transm. Distrib., pp. 1–9This is an open access article published by the IET under the Creative(http://creativecommons.org/licenses/by-nd/3.0/)
10 Elsaidi, A.: ‘Photovoltaic (PV) type solar generators and their effect on distributionsystems’, M.Sc. Thesis, University of Missouri, 2013
11 Hoke, A., Butler, R., Hambrick, J., Kroposki, B.: ‘Maximum PhotovoltaicPenetration Levels on Typical Distribution Feeders’, 2013. http://www.nrel.gov/docs/fy12osti/55094.pdf
12 Schneider, K.P., Chen, Y., Engle, D., Chassin, D.: ‘A taxonomy of North Americanradial distribution networks’, IEEE Power & Energy Society General Meeting PES’09, 2009, pp. 1–6
13 Demirok, E., Casado González, P., Frederiksen, K.H.B., Sera, D., Rodriguez, P.,Teodorescu, R.: ‘Local reactive power control methods for overvoltageprevention of distributed solar inverters in low-voltage grids’, IEEEJ. Photovolt., 2011, 1, (2), pp. 174–182
14 Ali, A., Pearsall, N., Putrus, G.: ‘Impact of high penetration level of grid-connectedphotovoltaic systems on the UK low voltage distribution network’. Int. Conf.Renewable Energies and Power Quality (ICREPQ’12), Santiago de Compostela(Spain), 28–30 March 2012
15 Chant, T.I., Shafiullah, G.M., Oo, A.M.T., Harvey, B.E.: ‘Impacts of increasedphotovoltaic panel utilisation on utility grid operations – a case study’. 2011IEEE PES Innovative Smart Grid Technologies Asia (ISGT), Perth, Australia,13–16 November 2011, pp. 1–7
16 Conti, S., Raiti, S., Tina, G.: ‘Simulink modelling of LV photovoltaicgrid-connected distributed generation’. 18th Int. Conf. on ElectricityDistribution, Turin, June 2005, pp. 6–9
17 Gonzalez, C., Geuns, J., Weckx, S., et al.: ‘LV distribution network feeders inBelgium and power quality issues due to increasing PV penetration levels’. 20123rd IEEE PES Int.l Conf. and Exhibition on Innovative Smart Grid Technologies(ISGT Europe), 14–17 October 2012, pp. 1–8
18 Chen, P., Kezunovic, M.: ‘Analysis of the impact of distributed generationplacement on voltage profile in distribution systems’. IEEE Power and EnergySociety General Meeting (PES), 2013, 21–25 July 2013, pp. 1–5
19 Jan-E-Alam, M., Muttaqi, K.M., Sutanto, D.: ‘Assessment of distributed generationimpacts on distribution networks using unbalanced three-phase power flowanalysis’. IEEE Power and Energy Society General Meeting, 2011, 24–29 July2011, pp. 1–8
20 Salles, D., et al.: ‘Assessing the collective harmonic impact of modern residentialloads – part I: methodology’, IEEETrans. PowerDeliv., 2012, 27, (4), pp. 1937–1946
21 Jiang, C., Salles, D., Xu, W., Freitas, W.: ‘Assessing the collective harmonicimpact of modern residential loads – part II: applications’, IEEE Trans. PowerDeliv., 2012, 27, (4), pp. 1947–1955
22 Mather, B.A.: ‘Quasi-static time-series test feeder for PV integration analysis ondistribution systems’. IEEE Power and Energy Society General Meeting, 2012,22–26 July 2012, pp. 1–8
23 Green Grid project, http://www.epecentre.ac.nz/greengrid/24 Li, Y., Wolfs, P.: ‘A statistical study on topological features of high voltage
distribution networks in Western Australia’, 20th Australasian UniversitiesPower Engineering Conf. (AUPEC), 2010, pp. 1–6
25 Li, Y., Wolfs, P.: ‘Preliminary statistical study of low-voltage networks under arepresentative HV network in Western Australia’. 21st Australasian UniversitiesPower Engineering Conf. (AUPEC), 2011
26 Goeke, T., Wellssow, W.H.: ‘A statistical approach to the calculation of harmonicsin MV systems caused by dispersed LV customers’, IEEE Trans. Power Syst.,1996, 11, (1), pp. 325–331
27 Frame, D., Ault, G., Huang, S.: ‘The uncertainties of probabilistic LV networkanalysis’. IEEE Power and Energy Society General Meeting, 2012, 22–26 July2012, pp. 1–8
28 Frame, D., Ault, G.: ‘Exploring the uncertainties of probabilistic LV networkanalysis’. CIRED 2012 Workshop Integration of Renewables into theDistribution Grid, 29–30 May 2012, pp. 1–4
29 Papadopoulos, P., Skarvelis-Kazakos, S., Grau, I., Cipcigan, L.M., Jenkins, N.:‘Predicting electric vehicle impacts on residential distribution networks withdistributed generation’, IEEE Vehicle Power and Propulsion Conf. (VPPC),2010, 1–3 September 2010, pp. 1–5
30 Papadopoulos, P., Skarvelis-Kazakos, S., Grau, I., Awad, B., Cipcigan, L.M.,Jenkins, N.: ‘Impact of residential charging of electric vehicles on distributionnetworks, a probabilistic approach’. 45th Int. Universities Power EngineeringConf. (UPEC), 2010, 31 August–3 September 2010, vol., no., pp. 1–5
31 Papadopoulos, P., Skarvelis-Kazakos, S., Grau, I., Cipcigan, L.M., Jenkins, N.:‘Electric vehicles’ impact on British distribution networks’, IET Electric. Syst.Transp., 2012, 2, (3), pp. 91–102
32 New Zealand Electricity Authority, Electricity in New Zealand 2011. https://www.ea.govt.nz/dmsdocument/12292
9Commons Attribution-NoDerivs License