Partners Developing Inventories for Greenhouse Gas Emissions for
ANNA M IKA CAMPUS S USTAINABILITY
ENVS 187
S USTAINABILITY FELLOW
J AN . 31 , 2012
Greenhouse Gas
Inventories
Terminology
• Global warming potential (GWP) how much a
specific mass of a GHG contributes to global
warming over a specified amount of time
• Relative to CO2, which has a GWP of 1 for all time
periods
Terminology
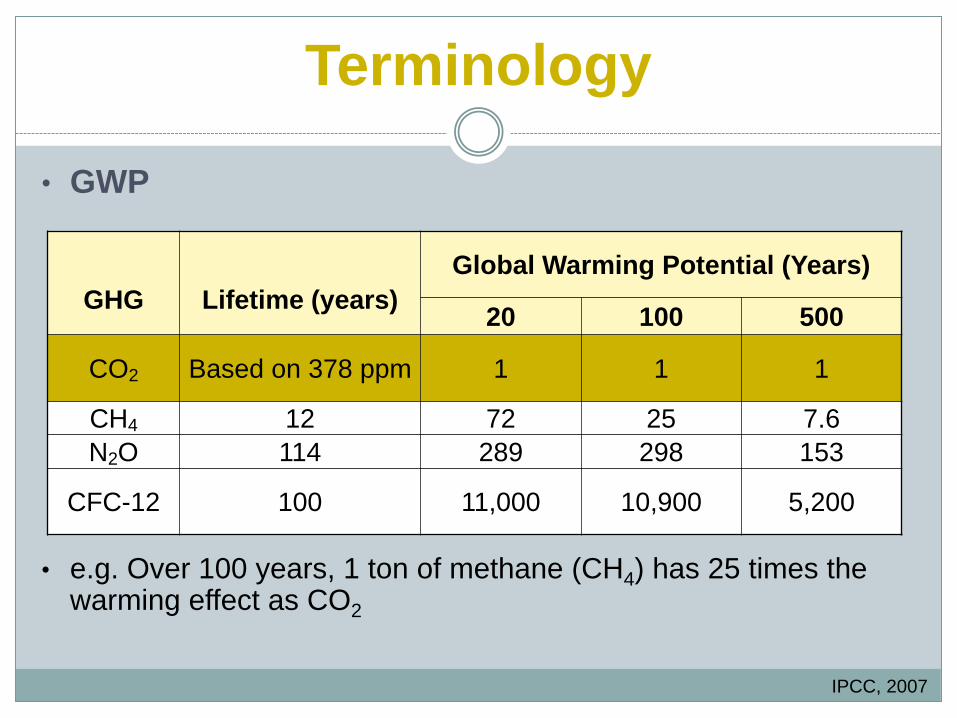
• GWP
• e.g. Over 100 years, 1 ton of methane (CH4) has 25 times the warming effect as CO2
GHG
Lifetime (years)
Global Warming Potential (Years)
20 100 500
CO2 Based on 378 ppm 1 1 1
CH4 12 72 25 7.6
N2O 114 289 298 153
CFC-12 100 11,000 10,900 5,200
IPCC, 2007
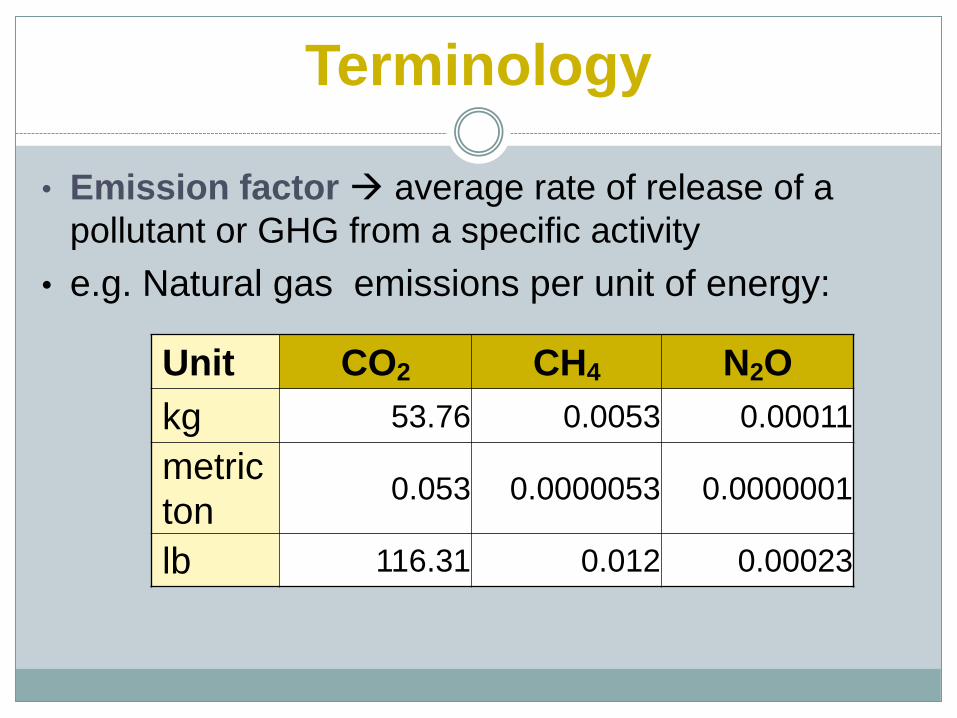
Terminology
• Emission factor average rate of release of a
pollutant or GHG from a specific activity
• e.g. Natural gas emissions per unit of energy:
Unit CO2 CH4 N2O
kg 53.76 0.0053 0.00011
metric
ton 0.053 0.0000053 0.0000001
lb 116.31 0.012 0.00023
Terminology
• CO2e carbon dioxide equivalent
• Combination of all GHG represented as the same
amount of CO2 that would result in the same amount of
warming
• Mass x GWP
• Usually used to represent specific activities
Why Higher Education?
• EPA reporting (> 25,000 tons)
• Leaders
• Ability to make change
• Catalysts for change
• Moral responsibility
“Colleges and universities must exercise
leadership in their communities and throughout society
by modeling ways to eliminate global warming
emissions, and by providing the knowledge and the
educated graduates to achieve climate neutrality.”
~ ACUPCC
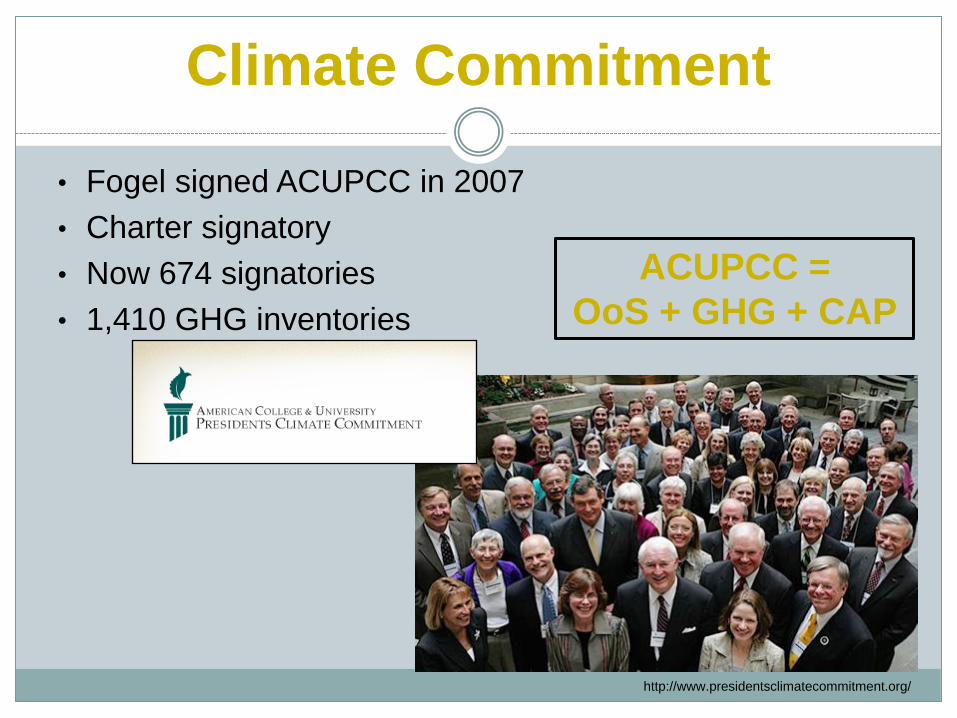
Climate Commitment
• Fogel signed ACUPCC in 2007
• Charter signatory
• Now 674 signatories
• 1,410 GHG inventories
http://www.presidentsclimatecommitment.org/
ACUPCC =
OoS + GHG + CAP
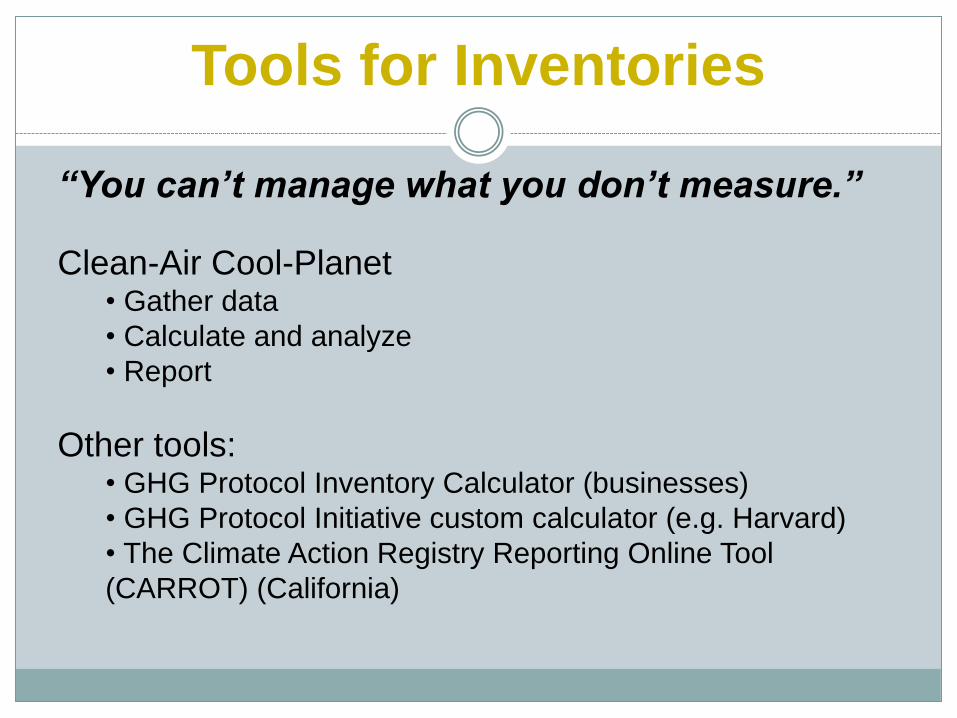
Tools for Inventories
“You can’t manage what you don’t measure.”
Clean-Air Cool-Planet • Gather data
• Calculate and analyze
• Report
Other tools: • GHG Protocol Inventory Calculator (businesses)
• GHG Protocol Initiative custom calculator (e.g. Harvard)
• The Climate Action Registry Reporting Online Tool
(CARROT) (California)

Tools for Inventories
• Clean-Air Cool-Planet
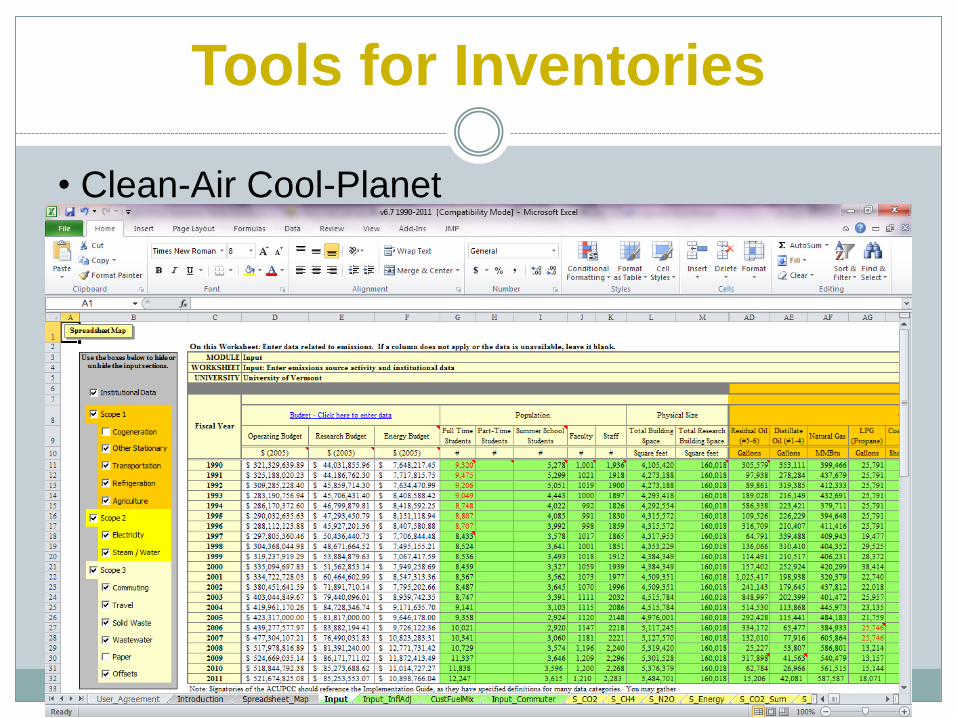
Tools for Inventories
• Clean-Air Cool-Planet
In Practice…
• Boundaries • Physical
• Control and responsibility ($?)
• Available data • What is actually available
• Ways that it’s measured
• Time frame • How many years and how often
• How define “year”
• Baseline

Scopes
• Scope 1 direct emissions resulting from fuels
burned on campus and agriculture
• Scope 2 indirect emissions from fuels
burned due to campus activities, but not directly by
the university (electricity)
• Scope 3 indirect emissions
due to other activities
http://www.concurringopinions.com/archives/2009/04/efficient_brows.html
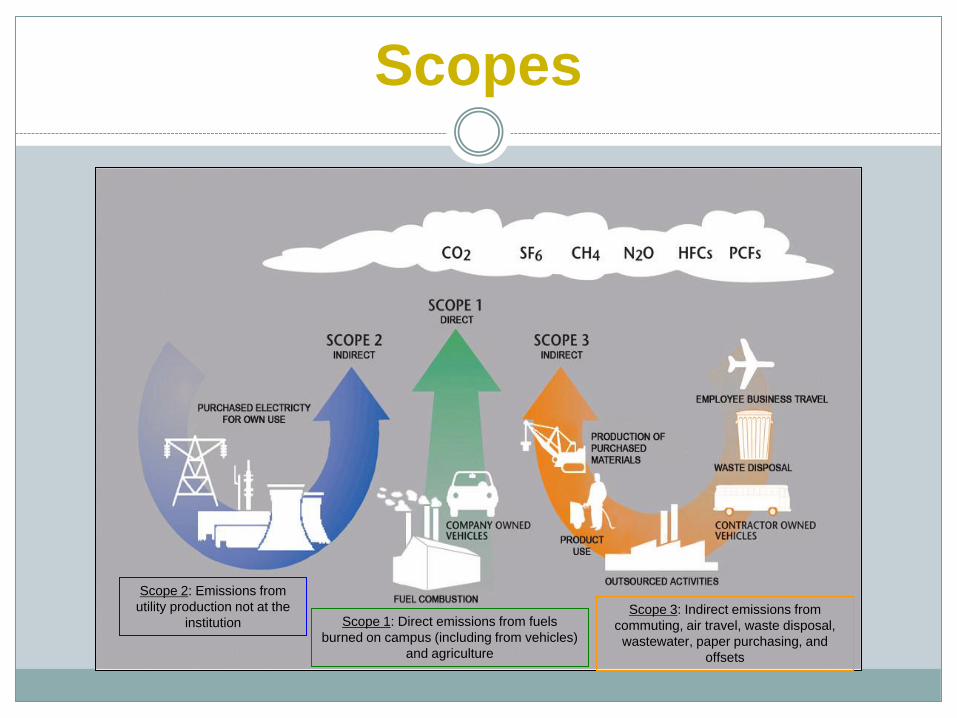
Scopes
Scope 3: Indirect emissions from
commuting, air travel, waste disposal,
wastewater, paper purchasing, and
offsets
Scope 1: Direct emissions from fuels
burned on campus (including from vehicles)
and agriculture
Scope 2: Emissions from
utility production not at the
institution

Scopes
• UVM’s inventory includes: Scope 1: heating, agriculture, University
vehicles (“fleet”) Scope 2: electricity
Scope 3: commuting, waste, line losses,
and air travel
x Scope 3: wastewater, purchased products
(paper), offsets, RECs
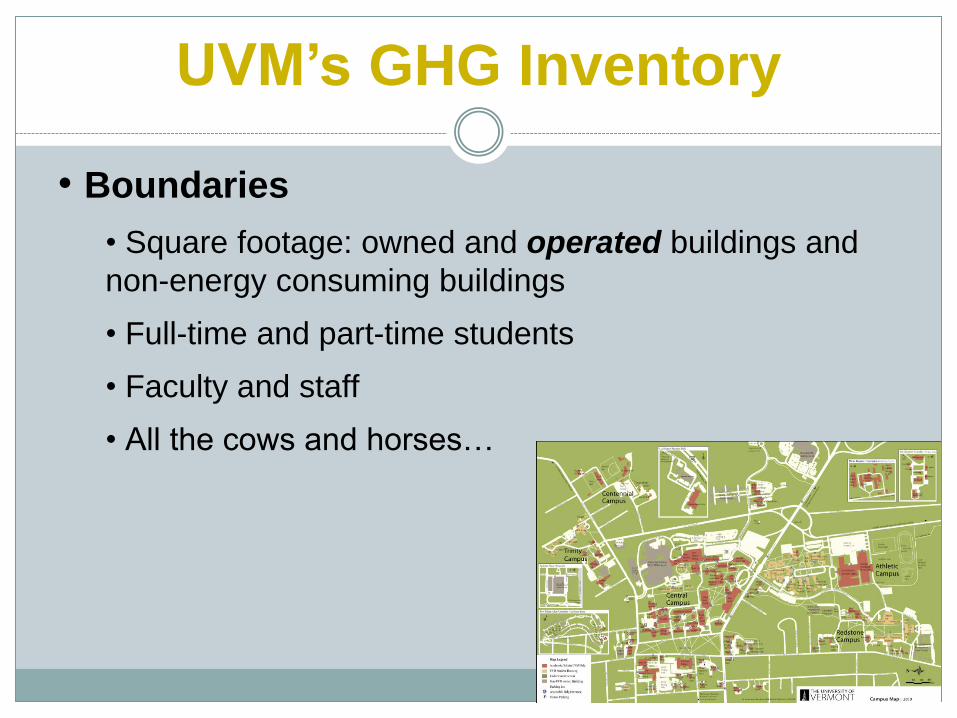
UVM’s GHG Inventory
• Boundaries
• Square footage: owned and operated buildings and
non-energy consuming buildings
• Full-time and part-time students
• Faculty and staff
• All the cows and horses…

UVM’s GHG Inventory
• Data
• SchoolDude: heating and electricity
• Departmental contacts: CATMA, fleet, fertilizer, # of
cows and horses, waste and composting
• Estimates: commuting, air travel
• Timeframe
• 1990 to present
• Fiscal year
• No baseline; trends: per full-time equivalent (FTE) or
per gross square foot (GSF)
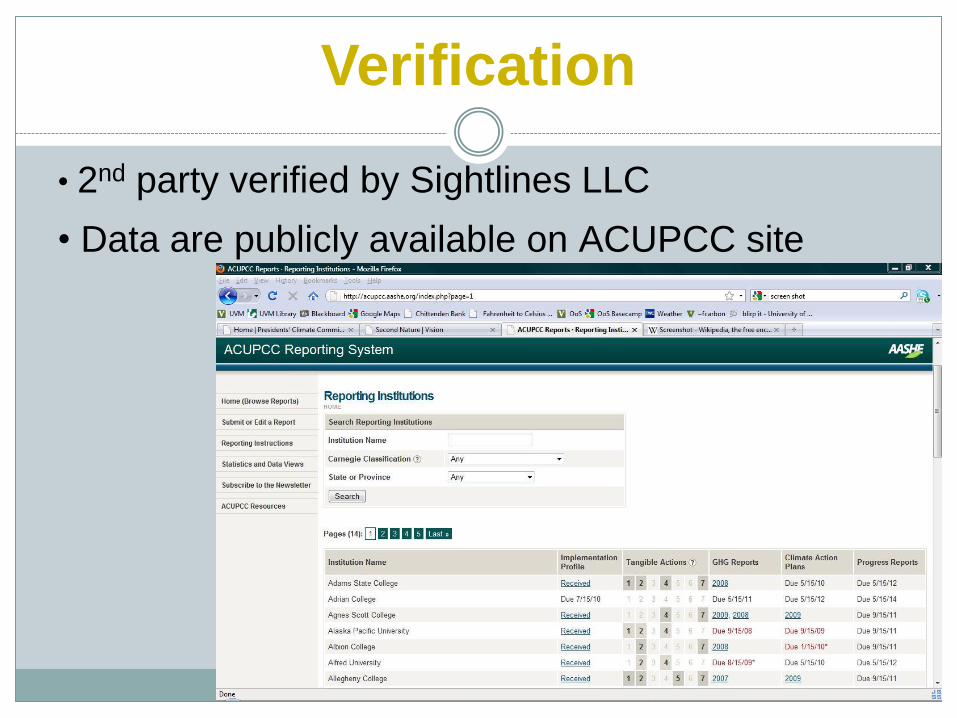
Verification
• 2nd party verified by Sightlines LLC
• Data are publicly available on ACUPCC site
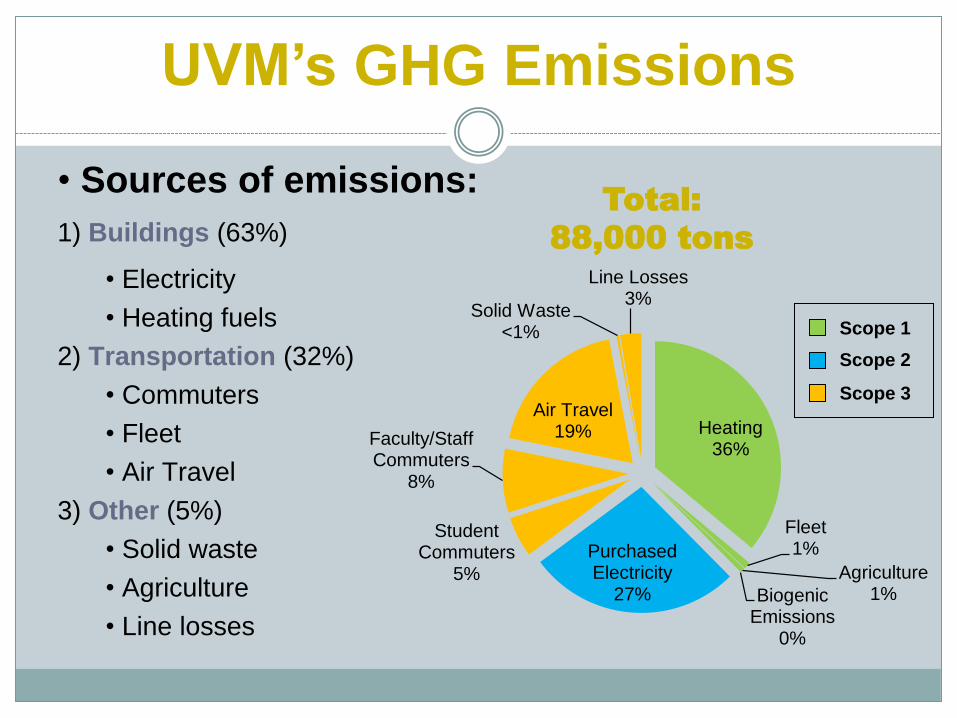
UVM’s GHG Emissions
• Sources of emissions:
1) Buildings (63%)
• Electricity
• Heating fuels
2) Transportation (32%)
• Commuters
• Fleet
• Air Travel
3) Other (5%)
• Solid waste
• Agriculture
• Line losses
Scope 3
Scope 1
Scope 2
Total:
88,000 tons
Heating36%
Fleet1%
Agriculture1%Biogenic
Emissions0%
Purchased Electricity
27%
Student Commuters
5%
Faculty/Staff Commuters
8%
Air Travel19%
Solid Waste<1%
Line Losses3%

Average U.S. Household
• Average US household (48 tons CO2e/year)
Direct emissions Indirect emissions Jones & Kammen 2011

Trends
• 1990-2011:
• 13% increase in emissions
• 31% increase in students
• 34% increase in GSF
0
1
2
3
4
5
6
7
Mt
CO
2e
Fiscal Year
Building Emissions Per FTE Student
0
2
4
6
8
10
12
14
Mt
CO
2e
Fiscal Year
Building Emissions Per 1000 Square Feet

Trends
• 1990-2011:
• Dairy herd down from 355 to 90
• Fleet getting cleaner, using less fuel
• More students walking, biking, taking the bus
• Waste continues to go down; compost up

Electricity Emissions
• UVM’s electricity emissions depend on grid, which
depends on the grid’s fuel mix (can’t use BED)
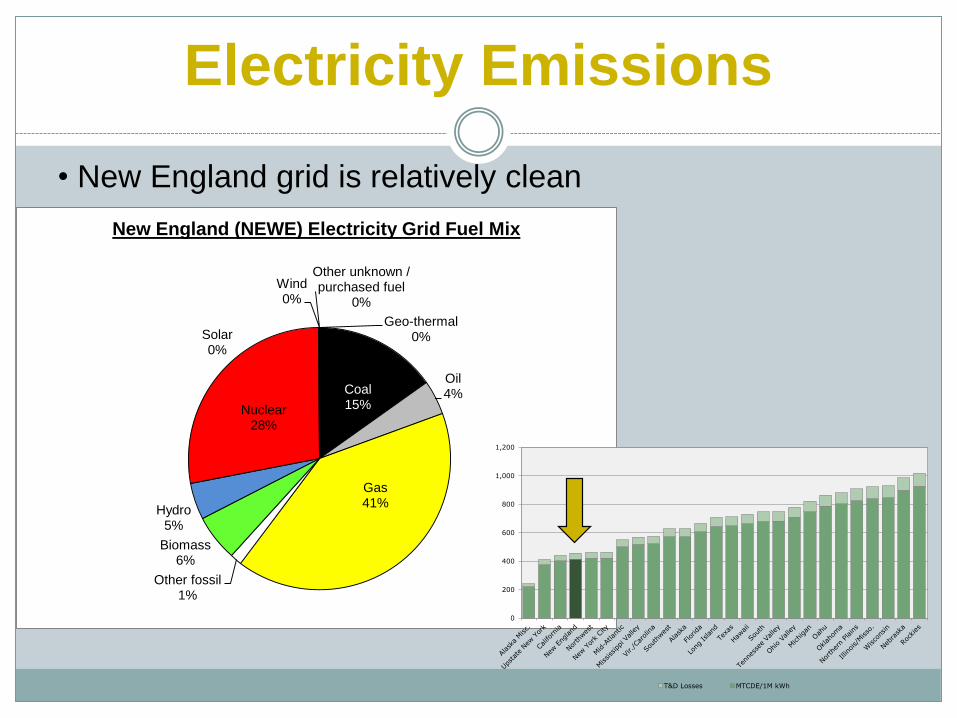
Electricity Emissions
• New England grid is relatively clean
Coal15%
Oil4%
Gas41%
Other fossil1%
Biomass6%
Hydro5%
Nuclear28%
Wind0%
Solar0%
Geo-thermal0%
Other unknown / purchased fuel
0%
New England (NEWE) Electricity Grid Fuel Mix
0
200
400
600
800
1,000
1,200
T&D Losses MTCDE/1M kWh
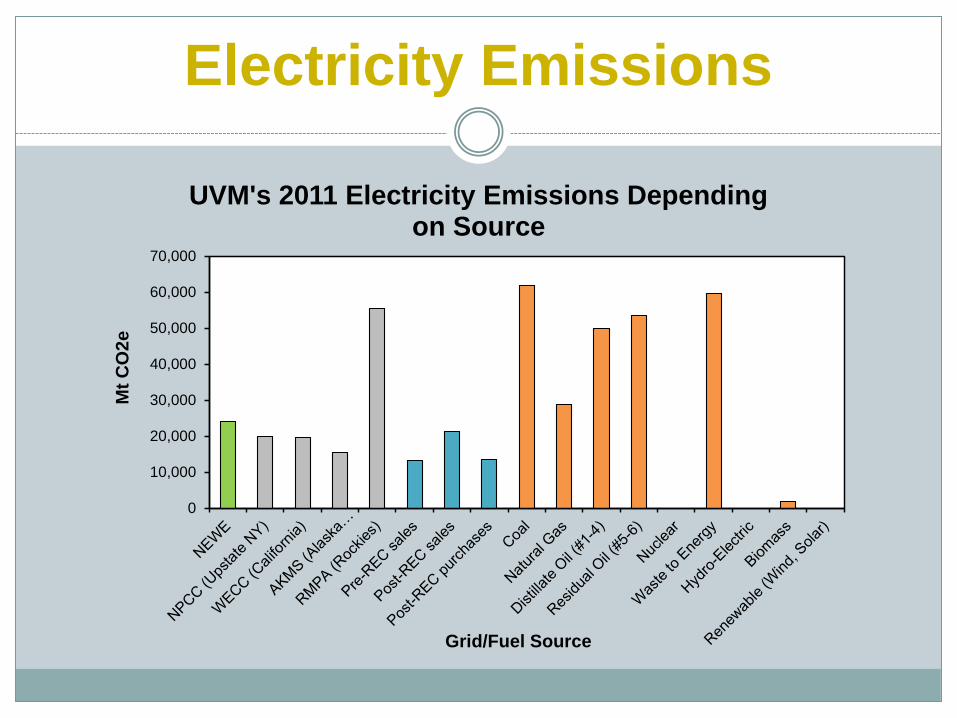
Electricity Emissions
0
10,000
20,000
30,000
40,000
50,000
60,000
70,000
Mt
CO
2e
Grid/Fuel Source
UVM's 2011 Electricity Emissions Depending on Source

CLIMATE ACTION PLAN
• What is climate-neutrality?
www.gfretwell.com and www.uvm.edu
CLIMATE ACTION PLAN
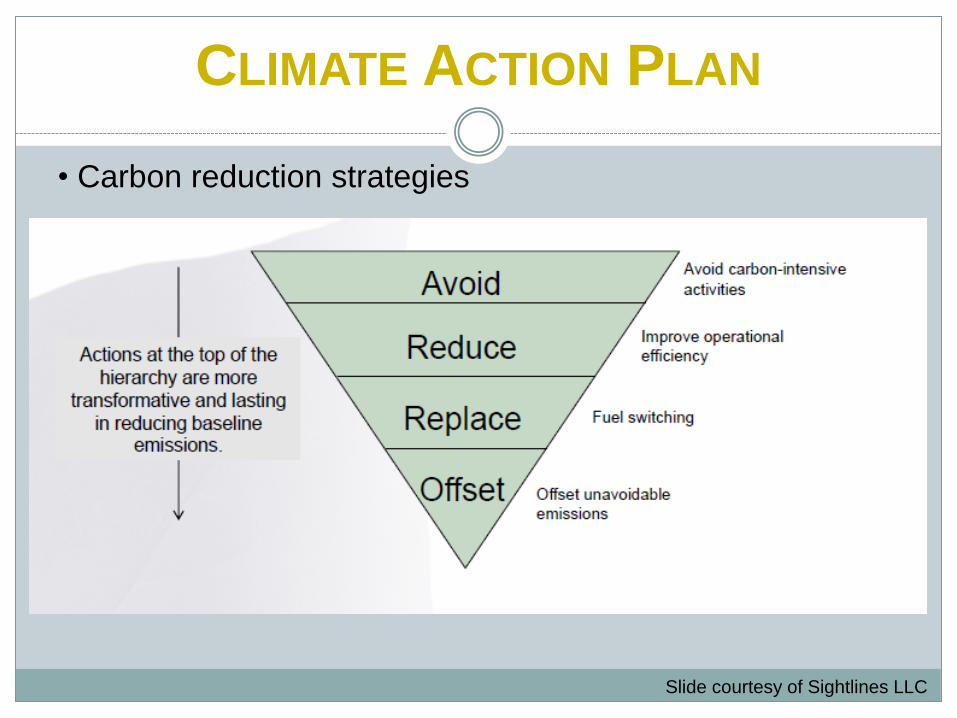
• Carbon reduction strategies
Slide courtesy of Sightlines LLC

CLIMATE ACTION PLAN
• Short-term goals
• Within 2 months: create institutional structures
• Within 1 year: complete GHG inventory and annually thereafter
• Adopt 2 or more short-term actions; UVM chose:
• LEED Silver minimum
• CCTA bus passes
• Long-term goals
• Within 2 years: draft CAP with C-neutrality date and targets

CLIMATE ACTION PLAN
0
20,000
40,000
60,000
80,000
100,000
120,000
1990 1995 2000 2005 2010 2015 2020 2025
Mt
CO
2e
REDUCTIONS:Past Emissions Projected Emissions
Electricity
Heating
Commuting
Agriculture
Fleet
Remainder
Air Travel

CLIMATE ACTION PLAN
• Goal 1: Climate-Neutrality • Electricity by 2015
• Heating by 2020
• Everything else by 2025
• Goal 2: Sustainability Education • Curriculum, research, and outreach
• Culture: educational experience
• Tracking progress using STARS
• Financing educational goals

CLIMATE ACTION PLAN
YEAR DATE ACTION
2008 January President Daniel Mark Fogel announces new Office of
Sustainability
2009 July
Spring, fall
Inventory 1990-2008 online
Discussions with campus community about goals
2010 November
December
President Fogel announces climate neutrality goal and
progress to date
UVM submits 2010 climate action plan to ACUPCC
2011 Feb – Nov
December
Senior leaders incorporate climate goals into strategic
plans and 10-year budget planning process
President reviews strategic plans and overall financial
plan for climate commitment, recommends to Trustees
2012 February
June
Trustees review revised Climate Action Plan
Office of Sustainability finalizes and resubmits plan
2015-
2024
June Climate Action Plan revised and resubmitted every three
years