Greenhouse Gas Inventories for Urban Operations in Southeast Asia ...
30
ASIAN DEVELOPMENT BANK GREENHOUSE GAS INVENTORIES FOR URBAN OPERATIONS IN SOUTHEAST ASIA: CHALLENGES AND OPPORTUNITIES Sonia Chand Sandhu and Sameer A. Kamal ADB SOUTHEAST ASIA WORKING PAPER SERIES NO. 12 June 2015
Transcript of Greenhouse Gas Inventories for Urban Operations in Southeast Asia ...
ASIAN DEVELOPMENT BANK
AsiAn Development BAnk6 ADB Avenue, Mandaluyong City1550 Metro Manila, Philippineswww.adb.org
Greenhouse Gas Inventories for Urban Operations in Southeast AsiaChallenges and Opportunities
This paper discusses the challenges, opportunities, and basic steps associated with estimating greenhouse gas (GHG) emissions for projects in the urban sector, and documenting these as part of GHG inventories for cities. Documenting GHG emissions allows the Asian Development Bank (ADB) to monitor progress on environmental mitigation impacts of reducing carbon in and across its operations. This is particularly relevant in the urban sector, as cities are major contributors to GHG emissions and climate change. Key challenges include the unique and complex nature of the urban sector, the time and costs involved, and the expectation or perception that emission volumes from individual urban projects may be insignificant. In spite of these challenges, there is a strong case and a building global momentum for estimating GHG emissions for projects and developing GHG inventories for cities. Recent case studies provide evidence that GHG emission estimates establish valuable baselines, allowing for credible, analysis-based determinations of the magnitudes of carbon-related impacts of urban projects, and that GHG inventories enable cities to drive green investments, leverage and access climate financing (including from an evolving global carbon market), and raise public awareness. GHG inventories can serve as platforms for cross-sector planning and decision making, enabling cities to explore result-specific solutions with respect to environmental sustainability and climate change. The paper recommends estimating GHG emissions for projects with mitigation potential, and developing GHG inventories as part of urban development projects that aim for comprehensive citywide planning and investments. There is significant opportunity for scaling up and replicating these activities in ADB’s urban operations in Southeast Asia.
About the Asian Development Bank
ADB’s vision is an Asia and Pacific region free of poverty. Its mission is to help its developing member countries reduce poverty and improve the quality of life of their people. Despite the region’s many successes, it remains home to the majority of the world’s poor. ADB is committed to reducing poverty through inclusive economic growth, environmentally sustainable growth, and regional integration.
Based in Manila, ADB is owned by 67 members, including 48 from the region. Its main instruments for helping its developing member countries are policy dialogue, loans, equity investments, guarantees, grants, and technical assistance.
GreenhOUSe GAS InventOrIeS fOr UrBAn OperAtIOnS In SOUtheASt ASIA: ChAllenGeS AnD OppOrtUnItIeSSonia Chand Sandhu and Sameer A. Kamal
adb southEast asiaworking papEr sEriEs
nO. 12
June 2015

ADB Southeast Asia Working Paper Series
Greenhouse Gas Inventories for Urban Operations in Southeast Asia: Challenges and Opportunities
Sonia Chand Sandhu and Sameer A. Kamal
No. 12 June 2015
Sonia Chand Sandhu, Senior Environment and Climate Change Specialist
Sameer A. Kamal, Urban Development Specialist
Urban Development and Water Division Southeast Asia Regional Department Asian Development Bank
ASIAN DEVELOPMENT BANK

Asian Development Bank 6 ADB Avenue, Mandaluyong City 1550 Metro Manila, Philippines www.adb.org © 2015 by Asian Development Bank June 2015 Publication Stock No. WPS157443-2 The views expressed in this publication are those of the author and do not necessarily reflect the views and policies of the Asian Development Bank (ADB) or its Board of Governors or the governments they represent. ADB does not guarantee the accuracy of the data included in this publication and accepts no responsibility for any consequence of their use. By making any designation of or reference to a particular territory or geographic area, or by using the term “country” in this document, ADB does not intend to make any judgments as to the legal or other status of any territory or area. ADB encourages printing or copying information exclusively for personal and noncommercial use with proper acknowledgment of ADB. Users are restricted from reselling, redistributing, or creating derivative works for commercial purposes without the express, written consent of ADB. Note: In this publication, “$” refers to US dollars.

CONTENTS
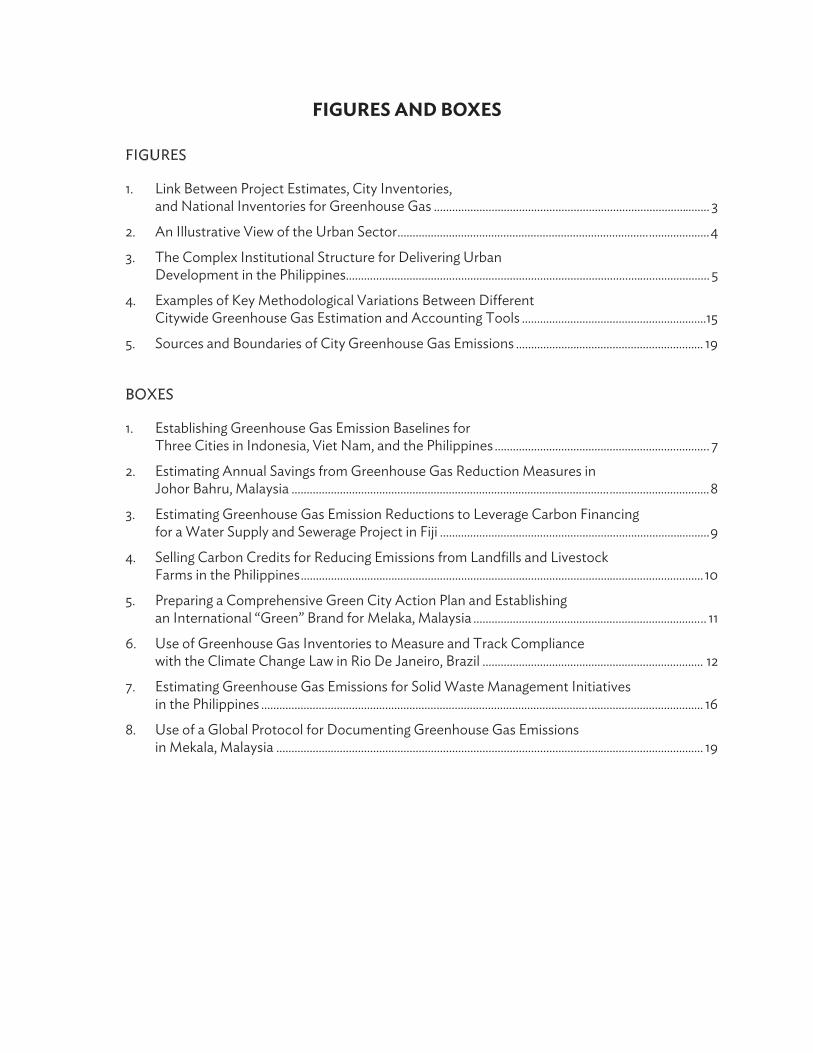
FIGURES AND BOXES ................................................................................................................................................ iv
ACKNOWLEDGMENTS ............................................................................................................................................. v
ABSTRACT ...................................................................................................................... ................................................. vi
ABBREVIATIONS ................................................................................................................. ........................................ vii
INTRODUCTION ........................................................................................................................................................... 1
CHALLENGES .................................................................................................................... .............................................. 4
OPPORTUNITIES .......................................................................................................................................................... 6
METHODOLOGY ......................................................................................................................................................... 13
WAY FORWARD ................................................................................................................... ...................................... 20
4
FIGURES AND BOXES
FIGURES
1. Link Between Project Estimates, City Inventories, and National Inventories for Greenhouse Gas ........................................................................................... 3
2. An Illustrative View of the Urban Sector ....................................................................................................... 4
3. The Complex Institutional Structure for Delivering Urban Development in the Philippines........................................................................................................................ 5
4. Examples of Key Methodological Variations Between Different Citywide Greenhouse Gas Estimation and Accounting Tools .............................................................15
5. Sources and Boundaries of City Greenhouse Gas Emissions .............................................................. 19
BOXES
1. Establishing Greenhouse Gas Emission Baselines for Three Cities in Indonesia, Viet Nam, and the Philippines ....................................................................... 7
2. Estimating Annual Savings from Greenhouse Gas Reduction Measures in Johor Bahru, Malaysia .......................................................................................................................................... 8
3. Estimating Greenhouse Gas Emission Reductions to Leverage Carbon Financing for a Water Supply and Sewerage Project in Fiji ......................................................................................... 9
4. Selling Carbon Credits for Reducing Emissions from Landfills and Livestock Farms in the Philippines ..................................................................................................................................... 10
5. Preparing a Comprehensive Green City Action Plan and Establishing an International “Green” Brand for Melaka, Malaysia ............................................................................. 11
6. Use of Greenhouse Gas Inventories to Measure and Track Compliance with the Climate Change Law in Rio De Janeiro, Brazil ......................................................................... 12
7. Estimating Greenhouse Gas Emissions for Solid Waste Management Initiatives in the Philippines .................................................................................................................................................. 16
8. Use of a Global Protocol for Documenting Greenhouse Gas Emissions in Mekala, Malaysia ............................................................................................................................................. 19

ACKNOWLEDGMENTS This working paper was prepared under the technical assistance (TA 8314-REG) Green Cities—A Sustainable Urban Future in Southeast Asia. Manila ADB. 2012. The authors thank the team from the Carbon Market Program at the Regional and Sustainable Development Department, Asian Development Bank (ADB), led by V.K Duggal, senior climate change specialist, and comprising Darshak Mehta, Hemant Nandanpawar, Lingshui Mo, and Grendell Vie Magoncia, for their peer review and inputs, including on the background and case studies for carbon financing in ADB projects. The authors gratefully acknowledge external peer review comments and provision of data on costs and timelines for city greenhouse gas inventories from Emani Kumar (deputy secretary general, Local Governments for Sustainability [ICLEI] Global, and executive director, ICLEI South Asia) and Soumya Chaturvedula (programme coordinator, Energy and Climate, ICLEI—South Asia). The authors thank Cherry Rivera, Hannu Pelkonen, Jake Tio, and Marcial Semira for their inputs and contributions in documenting the experiences and lessons learned from estimating greenhouse gas emissions in the solid waste management subsector in the Philippines. The authors gratefully acknowledge discussions and inputs from Ramola Naik Singru, senior urban development consultant. The authors also thank Rudolf Frauendorfer, lead urban development specialist; and Tatiana Gallego-Lizon, director, Urban Development and Water division, Southeast Asia Regional Department, ADB, for their strategic guidance and advice during preparation of this paper.

6
ABSTRACT This paper discusses the challenges, opportunities, and basic steps associated with estimating greenhouse gas (GHG) for projects in the urban sector, and documenting these as part of GHG inventories for cities. It addresses how conducting GHG inventories enables cities to establish baselines for result-specific solutions on environment sustainability and climate change, anchored to the environment pillars of economic competitiveness, environmental sustainability, and equity (3E) strategy of the Asian Development Bank’s (ADB) Urban Operational Plan and the GrEEEn Cities Operational Framework. 1 It also discusses the importance of GHG inventories to serve as platforms for cross-sector planning and decision making for urban operations. ADB’s Long-Term Strategic Framework (Strategy 2020)2 and its recently concluded Midterm Review of Strategy 2020 (MTR)3 includes key actions that the ADB will undertake as part of its strategic focus on environment and climate change. To monitor progress on environmental mitigation impacts by reducing carbon in its operations, ADB should document GHG impacts in its projects. This is particularly true in the urban sector, as cities are major contributors to GHG emissions and climate change. In this respect, the GHG inventory is an effective tool that can be considered for ADB projects. Estimating GHG emissions for specific urban infrastructure projects and documenting these as part of a comprehensive inventory for cities has not yet been fully mainstreamed in the urban sector in Southeast Asia. This is in part due to the unique and complex nature of the urban sector and interdependent activities within, in part due to the time and costs involved, and in part due to an expectation or perception that emission volumes from individual urban projects may be insignificant, particularly compared with other sectors such as energy or transportation. In spite of these challenges, there is a strong case, and a building global momentum, for documenting GHG emissions and developing GHG inventories for cities. Recent case studies provide evidence that GHG inventories enable cities to drive green investments, leverage and access climate financing (including from an evolving global carbon market), and raise public awareness. GHG inventories for cities are recommended for urban development projects that aim for comprehensive citywide planning and investments. GHG estimates for projects are recommended for those projects that have mitigation potential. There is significant opportunity for scaling up and replicating these activities in ADB’s urban operations in Southeast Asia.
1 S.C. Sandhu and R.N. Singru. 2014. Enabling GrEEEN Cities: An Operational Framework for Integrated Urban Development in
Southeast Asia. Manila: ADB. 2 ADB. 2008. Strategy 2020: The Long-Term Strategic Framework of the Asian Development Bank, 2008–2020. Manila. 3 ADB. 2014. Midterm Review of Strategy 2020: Meeting the Challenges of a Transforming Asia and Pacific. Manila.

ABBREVIATIONS
ADB – Asian Development Bank CDM – Clean Development Mechanism GCAP – Green City Action Plan GCF – Green Climate Fund GEF – Global Environment Facility Trust Fund GHG – greenhouse gas ICLEI – Local Governments for Sustainability IFEU – Institute for Energy and Environmental Research, Heidelberg IGES – Institute for Global Environment Strategies IPCC – Intergovernmental Panel on Climate Change MTR – Midterm Review of Strategy 2020 tCO2e – tons of carbon dioxide equivalent UNFCC – United Nations Framework Convention on Climate Change


Greenhouse Gas Inventories for Urban Operations in Southeast Asia 1
INTRODUCTION Environmentally sustainable growth is a key part of the Asian Development Bank’s (ADB) vision of an Asia and Pacific region free of poverty and one of ADB’s three core development agendas under its Long-Term Strategic Framework (Strategy 2020).1 The recently concluded Midterm Review (MTR) of Strategy 2020 lists several key actions that the ADB will undertake through 2020 as part of a strategic focus on environment and climate change.2 These include investing more resources in clean energy (including energy efficiency) and sustainable transport, screening, and building climate resilience of projects. It will also include strengthening environmental policies for institutional capacity for compliance and enforcement, and helping member countries access global and regional climate funds. Central to the implementation of Strategy 2020 and the MTR are ADB’s efforts to address climate change through parallel actions in mitigation and adaptation. Mitigation includes measures that reduce the magnitude of climate change itself by reducing emissions, such as the introduction of clean energy and waste technology. Adaptation includes measures that reduce the vulnerability of people and places to the impacts of climate change, such as relocating communities to higher elevations, or building new infrastructure such as levees or sea walls to get protection from flooding. To effectively review and monitor the mitigation impacts of its projects, ADB should be able to document greenhouse gas (GHG) emissions in relation to its operations. Broadly, GHG is any gas that absorbs infrared radiation in the atmosphere, trapping, and building up heat and leading to the greenhouse effect, one of the leading causes of climate change. Under the United Nations Framework Convention on Climate Change (UNFCCC), GHGs include carbon dioxide, methane, nitrous oxide, hydrofluorocarbons, perfluorocarbons, sulphur hexafluoride, and nitrogen trifluoride. The ADB’s safeguards policy recommends that GHG emissions from its projects are documented. ADB’s 2009 Safeguards Policy Statement, which applies to ADB-financed projects, states that the borrower and/or client “will promote the reduction of project-related anthropogenic greenhouse gas emissions in a manner appropriate to the nature and scale of project operations and impacts.”3 In addition, for “projects that are expected to or currently produce significant quantities of greenhouse gases,” the borrower and/or client “will quantify direct emissions from the facilities within the physical project boundary and indirect emissions associated with the off-site production of power used by the project.” The policy defines “significant quantities” as “generally 100,000 tons of carbon dioxide equivalent (tCO2e) per year,” which includes emissions from direct and indirect sources.
1 ADB. 2008. Strategy 2020: The Long-Term Strategic Framework of the Asian Development Bank, 2008–2020. Manila. ADB’s
Strategy 2020 identifies three distinct but complementary development agendas for the region: inclusive economic growth, environmentally sustainable growth, and regional integration.
2 ADB. 2014. Midterm Review of Strategy 2020: Meeting the Challenges of a Transforming Asia and Pacific. Manila. 3 ADB. 2009. Safeguards Policy Statement. Manila.

2 ADB Southeast Asia Working Paper Series No. 12
Documenting GHG emissions in projects is also recommended as a part of the ADB’s obligations to the international community, including as a signatory to international climate protocols and as an administrator of international climate funds.4 In recent years, there has been a big push to document GHG emissions in the energy and transportation sectors, and also to strengthen the procedures and tools used for this purpose to ensure that assumptions are clear, transparent, and reproducible.5 ADB is working with other multilateral financing institutions under the framework of the Working Group for the Environment to strengthen harmonization on key issues including accounting and reporting with relation to GHGs. 6 Per this agreement, ADB will report on GHG emissions from relevant projects following a harmonized approach and agreed methodologies (currently under development for specific sectors). GHG accounting is becoming increasingly relevant for cities, as cities are being recognized as major contributors to global GHG emissions. Since the formation of the UNFCCC, the nature and sources of GHG emissions have been studied in more detail. The urban population in 2014 accounted for 54% of the total global population, up from 34% in 1960, and continues to grow. Cities consume 78% of the world’s energy and contribute more than 60% of all carbon dioxide and significant amounts of other GHG emissions—while covering less than 2% of the earth’s surface.7 Thus, curbing GHG emissions from cities is key to curbing GHG emissions globally.8 Recognizing their role in curbing climate change, many cities regularly measure and disclose their GHG emissions data. GHG measurement in cities is now a global trend. For instance, 164 cities reported to the carbon Cities Climate Registry (cCCR) in 2012, 73 cities reported to the Carbon Disclosure Project in the same year, and 2,450 cities submitted GHG data to the Covenant of Mayors. Many cities in the People’s Republic of China, including 36 national pilot low-carbon cities, have either completed or are in the process of conducting base-year GHG inventories. These city inventories can contribute to and complement the national inventories prepared and submitted by most developing countries as part of their obligations as parties to the UNFCCC.9 However, capturing emission estimates in projects and cities has yet to be fully mainstreamed as a part of ADB’s urban operations, particularly in Southeast Asia. Project estimates refer to GHG emissions associated with activities under a specific project. City estimates refer to emissions generated within the boundary of a city (or similar administrative jurisdiction), which are captured as part of a GHG inventory. Figure 1 shows that project GHG estimates inform city GHG estimates, which in turn inform national estimates.
4 For an overview of ADB-managed climate funds, refer to ADB. 2014. Overview of Climate Financing Windows (Linked Document
2, Real-Time Evaluation of ADB’s Initiatives to Support Access to Climate Finance). Manila. 5 ADB. 2014. 2013 Clean Energy Investments: Project Summaries. Manila. 6 World Bank. 2012. International Financial Institution Framework for a Harmonized Approach to Greenhouse Gas Accounting.
Washington, DC: World Bank. 7 UN-Habitat. 2015. Climate Change. http://unhabitat.org/urban-themes/climate-change/ 8 Depending on the political system followed by a country, the authority and reach to intervene in particular sectors may be
most appropriate at different levels of government. GHG reporting by local authorities, focusing on areas most influenced by their jurisdiction, can in turn feed into city or nationwide inventories.
9 Under the UNFCCC, parties to the convention are required to submit national reports on the implementation of the Convention to the Conference of the Parties.

Greenhouse Gas Inventories for Urban Operations in Southeast Asia 3
In the urban sector, Strategy 2020 has been articulated through ADB’s Urban Operational Plan 2012–2020,10 which calls for an integrated, sustainable approach to urban development anchored around the 3E strategies of economic competitiveness, environmental sustainability, and equity. The plan sets out the direction and approach for the urban sector operations of ADB, and focuses on addressing the environmental (green), equity (inclusiveness), and economic (competitiveness) issues facing cities today. The plan also recognizes the multisector nature of the urban sector, which brings together the energy, transport, and water sectors; and waste and other subsectors. In Southeast Asia, these 3E strategies have been operationalized through the GrEEEn Cities Operational Framework,11 a flexible and scalable initiative that integrates urban development with environmental planning to improve livability and resilience in cities. This approach, which begins with an assessment of the business-as-usual scenario and organizes interventions around the 3Es, provides a framework to develop comprehensive green city actions plans (GCAPs) that help cities achieve their green city vision. The framework, which can be applied at any time and stage in a city’s development trajectory, is currently being implemented through three pilot cities (Ha Giang, Hue, and Vinh Yen) in Viet Nam, as well as in Melaka, Malaysia. The urban operational plan and the GrEEEn cities approach provide good entry points for mainstreaming GHG estimates and inventories in ADB’s urban portfolio. However, doing this requires contending with challenges that have restricted progress. It also requires building awareness on how this exercise is conducted, and the multiple benefits that this can bring to cities. Drawing from several case studies (focusing largely, but not exclusively, on Southeast Asia), as well as recent research and initiatives at ADB, this paper discusses the challenges, opportunities, and basic steps associated with putting together project GHG estimates and documenting these as part of GHG inventory for cities.
10 ADB. 2013. Urban Operational Plan, 2012–2020. Manila. http://www.adb.org/documents/urban-operational-plan-2012-2020 11 S.C. Sandhu, and R.N. Singru. 2014. Enabling GrEEEN Cities: An Operational Framework for Integrated Urban Development in
Southeast Asia. Manila: ADB.
Figure 1: Link between Project Estimates, City Inventories, and National Inventories for Greenhouse Gases
ADB =Asian Development Bank, CO2 = carbon dioxide, GHG = greenhouse gas, UNFCCC = United Nations Framework Convention on Climate Change. Source: Authors.

4 ADB Southeast Asia Working Paper Series No. 12
CHALLENGES There are a number of challenges in estimating and documenting GHG emissions in ADB’s urban sector projects. These challenges relate to accounting for GHG in projects and in cities. These challenges include the unique and complex nature of the urban sector, the time and costs associated with estimating, and the expectation or perception that emission volumes from urban projects may be insignificant, particularly compared with other sectors such as energy or transport. These and other key challenges are discussed below.
The unique nature of the urban sector is a primary challenge, as it encompasses a diverse range of subsectors across several institutions. The activities in a city cut across several sectors and subsectors, including energy, transport, water, waste, industry, agriculture, forestry, and housing. In the urban sector, it is common for projects or activities and associated emissions to cut across more than one subsector, exacerbating the challenge of apportioning emissions to particular subsector. For example, GHG emissions associated with automobile fuel combustion are impacted by the composition and standards of the fuel powering automobiles (which determine emissions for a unit of distance traveled) and also with the traffic and efficiency of the road network (which determines the distance that has to be traveled). Thus, addressing GHG emissions from automobiles requires an analysis that cuts across both the energy and transport sectors. Another example would be a solid waste management project where organic waste would be composted, resulting in avoided emissions from processing fertilizer. This type of urban project would cut across the waste subsector, and energy and agriculture sectors. An illustrative view of the urban sector, showing key subsectors and examples of overlaps between them, is presented in Figure 2.
Figure 2: An Illustrative View of the Complexity of the Urban Sector
The figure encompasses a range of sectors and subsectors. Greenhouse gas emissions from cities include emissions associated with key sectors and subsectors, and their overlaps. Source: Authors. Expanded based on World Bank. 2010. A city-wide approach to carbon finance. Washington, DC: World Bank.

Greenhouse Gas Inventories for Urban Operations in Southeast Asia 5
Emission estimates for urban sector projects have been limited by perceptions around emission volumes, and the quality and availability of data required. There can be an expectation or a perception that the emissions from individual activities or subprojects, particularly in secondary cities, are so limited in scope (e.g., significantly below the threshold of 100,000 tCO2e) that quantifying them is not always valuable, necessary, or cost-effective. Emission estimates require the availability of data associated with key subsector processes associated with GHG emissions (Figure 2), which is not always readily available. For example, estimating emissions for activities relating to a project to construct a landfill would require a reasonably good characterization of the incoming waste stream. Estimating and documenting GHG emissions as part of a comprehensive GHG inventory for cities has also proven difficult, as it requires engaging with complex institutional structures. A comprehensive GHG inventory would entail bringing together GHG estimates from the various urban subsectors in a standardized and meaningful way. This involves a patchwork of institutions—often at different levels, and requires collaboration across departments, ministries, and institutions—often with very different incentives and mandates. This complex institutional structure is illustrated in Figure 3, which shows the institutions responsible for delivering urban development in the Philippines and is illustrative of most countries in the region. It is worth noting that the Philippines has recently passed an executive order for a national GHG
Figure 3: Institutional Structure for Delivering Urban Development in the Philippines
BCDA = Bases Conversion Development Authority, CDC = Clark Development Corporation,. DA = Dept. of Agriculture, DAR = Dept. of Agrarian Reform, DENR = Dept. of Environment and Natural Resources, DlLG = Dept. of Interior and Local Governments, DOH = Dept. of Health, DOTC = Dept. of Transportation and Communications, DPWH = Dept. of Public Works and Highways, DSWD = Dept. of Social Welfare and Development, ERB = Energy Regulator/Board, HDMF = Home Development Mutual Fund, HGC = Home Guaranty Corporation, HLURB = Housing and Land Use Regulatory Board, LLDA = Laguna Lake Development Authority, LRA = Land Registration Authority, LTFRB = Land Transportation Franchising and Regulatory Board, LTO = Land Transportation Office, MARINA = Maritime Regulatory Administration, MWC = Manila Water Company, MWSC = Maynilad Water Services Company, MERALCO = Manila Electric Corporation, MMDA = Metro Manila Development Authority, MWSS = Manila Waterworks and Sewerage System, NAPOCOR = National Power Corporation, NHA = National Housing Authority, NHMFC = National Home Mortgage Finance, NTC = National Telecommunications Commission, NEA = National Electrification Administration, NEDA = National Economic and Development Authority, NWRB = National Water Resources Board, PCUP = Presidential Commission for the Urban Fbor, PEZA = Philippine Economic Zone Authority, PPA = Philippine Ports Authority, PRRC = Pasig River Rehabilitation Commission, SBMA = Subic Bay Metropolitan Authority, Source: R.N. Singru, and M. Lindfield. 2014. Republic of the Philippines: National Urban Assessment. Manila: ADB.

6 ADB Southeast Asia Working Paper Series No. 12
inventory management and reporting, with key ministries being responsible for estimating emissions in the agriculture, energy, and transport sectors, and land use and forestry subsectors.12 Compiling and managing a comprehensive city GHG inventory takes time and money. On average, the compilation of a GHG inventory for cities is reported to take 4 to 6 months, primarily due to the time taken to request, coordinate, obtain, and analyze the data and inputs required—particularly for the first instance when an inventory is compiled.13 For megacities such as Jakarta, Manila, or Delhi, the time needed could be as much as 9 to 12 months. In terms of costs, these can vary significantly depending on the data already available, the presence of standard data collection procedures, the extent of partnerships between the municipal office and other relevant government departments and institutions, and on whether consultants and other support are needed. Costs are minimized in cases where data are readily available, and where municipal authorities use in-house capacity to prepare the full inventory. Recent experiences in Delhi (16.8 million population in 2011), Melaka (0.85 million, 2010), and Yogyakarta (0.6 million, 2012) indicate that a citywide inventory can take between 6 and 12 person-months, and cost between $40,000 to $120,000, depending on the size of the city, availability of baseline data, and costs of software and customization.14 OPPORTUNITIES Despite these challenges, there is a strong case for moving toward establishing and maintaining GHG inventories for cities in the long-term—as has been demonstrated by a number of case studies. Accounting for GHG emissions can help cities to focus and measure the impacts of their mitigation efforts across activities, projects, and subsectors; develop smart, informed strategies and policies to address climate change through carbon reduction; leverage and access global climate financing and carbon markets; raise public awareness and catalyze support for climate initiatives; and ultimately serve as a platform for cross-sectoral integration, planning, and policymaking. Each of these aspects is briefly discussed below. GHG emission estimates establish valuable baselines, which help to focus and measure the impact and progress of mitigation efforts across activities, projects, and urban subsectors. A GHG inventory is usually the first step toward a comprehensive effort to measure and reduce GHG emissions, and can help to determine which sectors, sources, and activities are responsible for GHG emissions; understand emission trends; quantify the benefits of activities that reduce emissions; establish a basis for developing actions plans; and set targets, and track progress, in emission reductions.15
12 Office of the President of the Philippines. 2014. Executive Order No. 174: Institutionalizing the Philippine Greenhouse Gas
Inventory Management and Reporting System. Manila: Office of the President of the Philippines. 13 N. Bader and R. Bleischwitz. 2009. Measuring Urban Greenhouse Gas Emissions: The Challenge of Comparability. S.A.P.I.EN.S.
http://sapiens.revues.org/854 14 S. Chaturvedula. 2015. E-mail communication from ICLEI. 27 March. 15 United States Environmental Protection Agency. 2014. Developing a Greenhouse Gas Inventory.
http://www.epa.gov/statelocalclimate/local/activities/ghg-inventory.html#one

Greenhouse Gas Inventories for Urban Operations in Southeast Asia 7
Estimating GHG emissions for urban sector projects and subprojects allows for a credible, analysis-based determination of the magnitude of carbon-related impacts of specific activities and provides an essential building block for compiling comprehensive GHG inventory in the long term. Conducting an emissions estimate requires a good understanding of the processes associated with GHG emissions, and can lead to important insights on the key variables (such as technology choices) that influence the extent of a project’s environmental impact. In the urban sector, estimating the magnitudes of specific interventions can help contextualize them in the wider context of a city’s GHG emissions, which is a valuable exercise even when waste volumes are expected to be low or below thresholds considered significant. Having reliable estimates allows for estimating cumulative impacts across projects, subsectors, or locations, and provides insights on the impact of different strategies, policies, and/or technology choices. GHG inventories can help to engage the private sector and drive green investments that will make cities more competitive globally. With cities being key drivers of global economic growth—and of GHG emissions—investments to mitigate climate change in cities will yield significant benefits for the global economy and climate. Through GHG inventories, quantifying these benefits by subsector and in economic and financial terms becomes possible, as recent studies have done for selected cities around the world.16 Inventories can also help shed light on opportunities to cluster or combine individual subprojects under one institution or intermediary, as was the case for the Land Bank in the Philippines, where certified emissions reductions from several subprojects were brought together under one agreement (Box 4). Even where opportunities to cluster investments or establish partnerships do not exist, individual green investments will bring direct and indirect benefits to the cities hosting those investments, including through taxes collected on financially viable projects.
16 A. Gouldson, S. Colenbrander, F. McAnulla, A. Sudmant, N. Kerr, P. Sakai, S. Hall, and J.C. I. Kuylenstierna. 2014. The Economic
Case for Low-Carbon Cities. York: Stockholm Environment Institute.
Box 1: Establishing Greenhouse Gas Emission Baselines for Three Cities in Indonesia, Viet Nam, and the Philippines
Greenhouse gas (GHG) inventories were developed for Cebu city in the Philippines, Da Nang in Viet Nam, and Surabaya in Indonesia, and as part of a recent World Bank study exploring sustainable urban energy and emissions planning and development in these cities. The GHG inventories were done to establish baseline emissions that complimented baseline energy balances, to gain insights into the relative share of emissions from different energy sources and on policies and initiatives that the city could undertake to mitigate GHG emissions while also meeting its energy goals. For example, in Cebu city, it was found that the transport sector used just over half of the city’s energy while producing 40% of emissions. From the energy balance analysis, it was determined that 75% of energy associated with transportation was lost in fuel combustion. Thus, it became clear that measures by the city to reduce energy consumption would also have significant impacts on mitigating GHG emissions. Public transportation in Cebu city is currently dominated by jeepneys, which tend to be inefficient with respect to fuel consumption and route optimization. Thus, measures that the city could directly enact included the development of a robust public transportation system and simultaneous improvements in nonmotorized transportation.
Source: World Bank. 2013. Energizing Green Cities in Southeast Asia Applying Sustainable Urban Energy and Emissions Planning. Washington, DC: World Bank.

8 ADB Southeast Asia Working Paper Series No. 12
GHG inventories allow a city to leverage and access more climate financing. Southeast Asian countries can benefit from various international and regional initiatives and programs that provide climate financing, technology transfer, and capacity building.17 While comprehensive, accurate data on the overall scope of international climate financing is not available, recent estimates by ADB suggest that climate financing accounts for 10% to 15% of all multilateral development assistance and 20% to 25% of all bilateral development assistance, for a total of about $40 billion per year.18 It is expected that these figures will increase, following pledges by developed countries to jointly mobilize $100 billion per year by 2020 to address the climate finance needs of developing countries.19 Recent studies by ADB,20 and initiatives such as the World Bank–UNDP Climate Finance Options platform, provide information on climate financing options for developing countries.21 At present, at least 70 different funds provide financing specifically for urban sector projects.
17 ADB. 2009. The Economics of Climate Change in Southeast Asia: A Regional Review. Manila: ADB. 18 ADB. 2014. Aligning Climate Finance and Development Finance for Asia and the Pacific: Potential and Prospects. Manila: ADB. 19 In 2009, under the Copenhagen Accord, industrialized countries committed to a goal of mobilizing jointly $100 billion per year
by 2020 to address the climate finance needs of developing countries. 20 ADB. 2014. Aligning Climate Finance and Development Finance for Asia and the Pacific: Potential and Prospects. Manila: ADB. 21 World Bank and UNDP. 2013. Climate Finance Options: Funding Sources. http://climatefinanceoptions.org/cfo/funding-sources
Box 2: Estimating Annual Savings from Greenhouse Gas Reduction Measures in Johor Bahru, Malaysia
A study focusing on Johor Bahru, Malaysia, estimated that carbon emissions could be reduced by 24% in 2025, relative to business-as-usual trends, through investments of $1 billion. These investments were expected to generate annual savings of $0.77 billion, paying back the initial investment in less than 2 years and generating further lifetime savings. A portion of these investments would target the industrial sector—including through new technologies and operational improvements in the petrochemical and rubber industries—which was found to constitute a significant (45%) share of the city’s total emissions.
Source: A. Gouldson, S. Colenbrander, F. McAnulla, A. Sudmant, N. Kerr, P. Sakai, S. Hall, and J.C.I. Kuylenstierna. 2014. The Economic Case for Low-Carbon Cities. York: Stockholm Environment Institute.

Greenhouse Gas Inventories for Urban Operations in Southeast Asia 9
Most recently, more than $10 billion have been pledged under the Green Climate Fund (GCF), which has been established under the framework of the UNFCCC.22 The financing pledges to the GCF add significantly to the pool of resources available from the existing large climate funds, including the Climate Investment Funds ($8 billion available since 2008) and the Global Environment Facility Trust Fund (GEF, $6 billion available since 1991). GCF financing is expected to be split equally between adaptation and mitigation projects. With an increasing recognition that cities are most able and likely to enact large-scale climate mitigation programs, and a global push toward developing a common protocol for citywide GHG emissions,23 it is likely that cities with comprehensive, peer-reviewed and up-to-date GHG inventories and baselines will have a competitive edge when it comes to harnessing and using carbon financing.24 It is anticipated that the GCF, whose investment framework and results areas are currently being finalized, will include a special focus on cities.
22 Green Climate Fund. 2014. www.gcfund.org 23 GHG Protocol. 2014. Global Protocol for Community-Scale Greenhouse Gas Emission Inventories.
http://www.ghgprotocol.org/city-accounting 24 World Bank. 2010. Climate Finance in the Urban Context. Washington, DC: World Bank.
Box 3: Estimating Greenhouse Gas Emission Reductions to Leverage Carbon Financing for a Water Supply and Sewerage Project in Fiji
Under the Asian Development Bank (ADB)-financed Suva–Nausori Water Supply and Sewerage Project in Fiji, one subcomponent aimed to improve and expand the sewage treatment plant and install flaring system for methane destruction. Under the baseline scenario, the project involved sewage treatment and sludge treatment in a biodigester. The methane generated from the biodigester was released in the atmosphere, contributing to global warming. Under the project, the existing sewage treatment facility was expanded with a provision for the collection and destruction (through flaring) of methane generated by the biodigester. With the support of ADB’s Technical Support Facility, under its Carbon Market Program, the Ministry of Public Utilities, Works and Transport (the implementing agency) was able to successfully estimate reductions in greenhouse gas (GHG) emissions, and register these reductions, amounting to approximately 22,000 tons of carbon dioxide equivalent per year, under the United Nations Framework Convention on Climate Change’s Clean Development Mechanism. With a view to accessing carbon finance for this GHG emission reduction activity, the implementing agency approached ADB’s Future Carbon Fund, which agreed to cofinance $1.35 million through prepurchase of 160,555 certified emission reductions to be generated through the operation of the project. In turn, this carbon financing support helped the implementing agency to meet some of its project implementation costs. Source: Asian Development Bank.

10 ADB Southeast Asia Working Paper Series No. 12
GHG inventories could be a useful tool for cities seeking to access financing from the evolving global carbon market. The new international climate agreements expected at the UN climate talks in Paris in December 2015 will play a big role in determining the future of the carbon market. Regulated carbon markets have been a central feature of the Kyoto Protocol, which established three flexible mechanisms, including the Clean Development Mechanism (CDM), to encourage market-based reductions in carbon emissions.25 A key part of the CDM process is establishing a baseline for emissions, and certifying emission reductions relative to this baseline, a process that is greatly facilitated by citywide GHG inventories. There is a growing recognition for the need for city authorities to directly tap into carbon markets, reversing a historic trend where as low as less than 1% of CDM projects were credited to cities.26 A GHG inventory can serve as a vital tool to aggregate different emissions to a scale that is suitable to access carbon markets. It also helps to prevent double counting of emissions and reductions, which can happen when discrete projects or sectors independently claim credits for the same reduction in emissions (for example, if credits are claimed by the producer as well as the consumer for a green energy project). Comprehensive inventories will help cities and their constituents in monitoring, reporting, and verification of emissions as the global carbon market continues to mature and evolve.
25 The three flexible mechanisms under the Kyoto Protocol are international emissions trading, joint implementation, and CDM. 26 World Bank. 2010. A ciye-wide approach to carbon finance. Washington, DC: World Bank.
Box 4: Selling Carbon Credits for Reducing Emissions from Landfills and Livestock Farms in the Philippines
The Land Bank of the Philippines successfully raised just under €2.5 million in 2010 through carbon credits that were purchased by the World Bank on behalf of the Spanish Carbon Fund. Under the agreement, the Land Bank established subproject agreements with local government units, private piggeries, project developers, and service providers to adopt cleaner power generation technologies to reduce emissions from landfills and livestock farms. Funds were raised under the Clean Development Mechanism framework, on the basis of certified emissions reductions resulting from these green investments. The initiative has faced several challenges, including the availability of reliable data to certify emissions reductions, but was also able to establish a viable institutional mechanism to access the carbon market in the Philippines. Source: A. Valmero. 2010. WB, Land Bank ink €2.437 carbon credt deal. INQUIRER.net. 14 January. http://www.inquirer.net/specialreports/theenvironmentreport/view.php?db=1&article=20100114-247305
Greenhouse Gas Inventories for Urban Operations in Southeast Asia 11
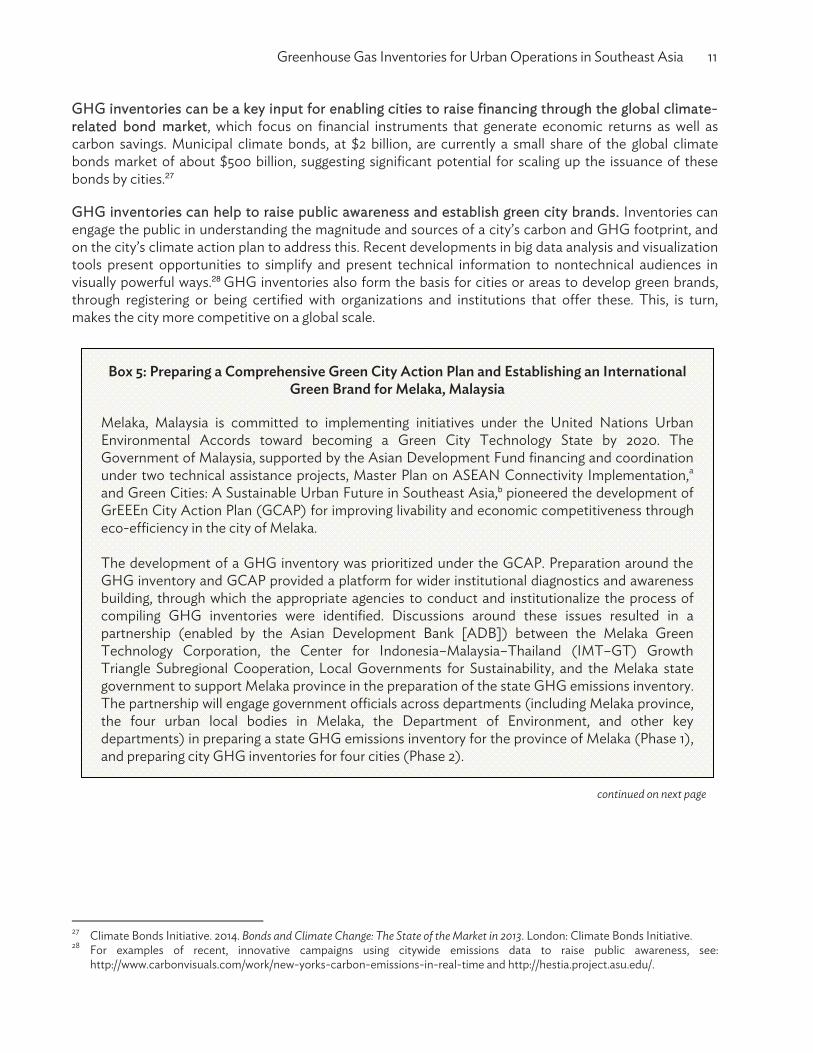
GHG inventories can be a key input for enabling cities to raise financing through the global climate-related bond market, which focus on financial instruments that generate economic returns as well as carbon savings. Municipal climate bonds, at $2 billion, are currently a small share of the global climate bonds market of about $500 billion, suggesting significant potential for scaling up the issuance of these bonds by cities.27 GHG inventories can help to raise public awareness and establish green city brands. Inventories can engage the public in understanding the magnitude and sources of a city’s carbon and GHG footprint, and on the city’s climate action plan to address this. Recent developments in big data analysis and visualization tools present opportunities to simplify and present technical information to nontechnical audiences in visually powerful ways.28 GHG inventories also form the basis for cities or areas to develop green brands, through registering or being certified with organizations and institutions that offer these. This, is turn, makes the city more competitive on a global scale.
continued on next page
27 Climate Bonds Initiative. 2014. Bonds and Climate Change: The State of the Market in 2013. London: Climate Bonds Initiative. 28 For examples of recent, innovative campaigns using citywide emissions data to raise public awareness, see:
http://www.carbonvisuals.com/work/new-yorks-carbon-emissions-in-real-time and http://hestia.project.asu.edu/.
Box 5: Preparing a Comprehensive Green City Action Plan and Establishing an International Green Brand for Melaka, Malaysia
Melaka, Malaysia is committed to implementing initiatives under the United Nations Urban Environmental Accords toward becoming a Green City Technology State by 2020. The Government of Malaysia, supported by the Asian Development Fund financing and coordination under two technical assistance projects, Master Plan on ASEAN Connectivity Implementation,a and Green Cities: A Sustainable Urban Future in Southeast Asia,b pioneered the development of GrEEEn City Action Plan (GCAP) for improving livability and economic competitiveness through eco-efficiency in the city of Melaka. The development of a GHG inventory was prioritized under the GCAP. Preparation around the GHG inventory and GCAP provided a platform for wider institutional diagnostics and awareness building, through which the appropriate agencies to conduct and institutionalize the process of compiling GHG inventories were identified. Discussions around these issues resulted in a partnership (enabled by the Asian Development Bank [ADB]) between the Melaka Green Technology Corporation, the Center for Indonesia–Malaysia–Thailand (IMT–GT) Growth Triangle Subregional Cooperation, Local Governments for Sustainability, and the Melaka state government to support Melaka province in the preparation of the state GHG emissions inventory. The partnership will engage government officials across departments (including Melaka province, the four urban local bodies in Melaka, the Department of Environment, and other key departments) in preparing a state GHG emissions inventory for the province of Melaka (Phase 1), and preparing city GHG inventories for four cities (Phase 2).

12 ADB Southeast Asia Working Paper Series No. 12
Box 5 continued
Ultimately, a comprehensive GHG inventory can serve as a platform for cross-sector integration, planning, and decision making. GHG inventories provide a valuable snapshot of the major activities in a city. They can form an important input into a city’s urban development planning processes and tools (such as targeted climate action plans or green city action plans) or under frameworks that seek to mainstream environmental management as a core part of urban planning (such as the GrEEEn cities operational framework). Climate change mitigation measures in the urban development sector are often most effective when there is a “coincidence of agendas” between a city’s local priorities (including economic growth and service delivery) and its climate change mitigation objectives.29 The platforms enabled by GHG inventories would help to identify and develop these achievable objectives—and also the targeted and transformative actions that are needed in the long term.
29 H. B. Dulal and S. Akbar. 2012. Greenhouse gas emission reduction options for cities: Finding the “Coincidence of Agendas” between
local priorities and climate change mitigation objectives. Habitat International. doi:10.1016/j.habitatint.2012.05.001
Compiling the GHG inventory will enable these pilot cities to become signatories to the carbon Climate Registry (cCR). The cCR is a global mechanism and database for local government to publicly and regularly report their local climate action developments, to enhance the global credibility of local climate actions.c It will also allow these cities to establish an international green brand, and have a monitoring mechanism for carbon reduction. This will support achieving carbon emission reduction targets, including the prime minister of Malaysia’s pledge, at the United Nations Climate Change Conference in Copenhagen in 2009, to reduce GHG emissions in Malaysia voluntarily by 40% (in terms of emissions intensity of gross domestic product) by 2020 compared to 2005 levels.d Ultimately, the intention is to replicate the GCAP experience across the IMT–GT, to meet the challenge of balancing economic growth with urban environmental sustainability and climate resilience. a ADB. 2011. Technical Assistance for the Master Plan on ASEAN Connectivity Implementation. Manila. b ADB. 2012. Regional Technical Assistance Green Cities: A Sustainable Urban Future in Southeast Asia. Manila. c carbonn Climate Registry. http://carbonn.org/ d IMT-GT. 2014. Framework for GrEEEn Actions: Green City Action Plan for Melaka. Melaka: Center for Indonesia–
Malaysia–Thailand Growth Triangle. Source: Asian Development Bank.
Greenhouse Gas Inventories for Urban Operations in Southeast Asia 13
METHODOLOGY Broadly, there are three steps to estimating GHG emissions for urban sector projects, and reporting these emissions as part of a city GHG inventory. These include selecting the right methodology and tools, conducting the analysis, and documenting and reporting on the results. Each of these steps is discussed below. The first step is selecting the right methodology and tools that are internationally recognized and accepted. The ADB 2009 Safeguards Policy specifies that internationally recognized methodologies include those “provided by the Intergovernmental Panel on Climate Change (IPCC), various international organizations, and relevant host country agencies.” Guidance on methodologies has recently been published by ADB, and is also available from key national agencies. Guidelines issued by ADB in June 2014 address how climate change emissions reductions from ADB projects can be estimated in practice.30 The guidelines serve as a practical guide for the most common types of mitigation projects (both energy and non-energy sectors), and bring together and distil a large range of tools and models available on this topic. The new guidelines are timely, as a recently concluded evaluation of GHG accounting in ADB’s energy sector projects suggested that ADB’s previous experiences in documenting emissions calculations for the majority of projects reviewed had “significant deficiencies” in how baseline, gross, and net emissions calculations were documented.31 It is worth noting that joint efforts to harmonize GHG estimation methodologies among the main multilateral development banks, including ADB, are currently underway.32 In addition, national laws and guidelines can also provide valuable insights. All governments that are signatories to the UNFCCC, which includes all the 30 ADB. 2014. Guidelines for Estimating Climate Change Mitigation Investment and Greenhouse Gases (GHGs) Emissions Reductions
of ADB Projects. Manila: ADB. 31 ADB. 2014. Greenhouse Gas Accounting Related Issues (Linked Document 5, Real-Time Evaluation of ADB’s Initiatives to Support
Access to Climate Finance). Manila: ADB. 32 Climate Investment Funds. 2014. Greenhouse Gas Analysis and Harmonization of Methodology. Meeting of the CTF Trust Fund
Committee, CTF/TFC.14/Inf.2. Washington, DC: Climate Investment Funds.
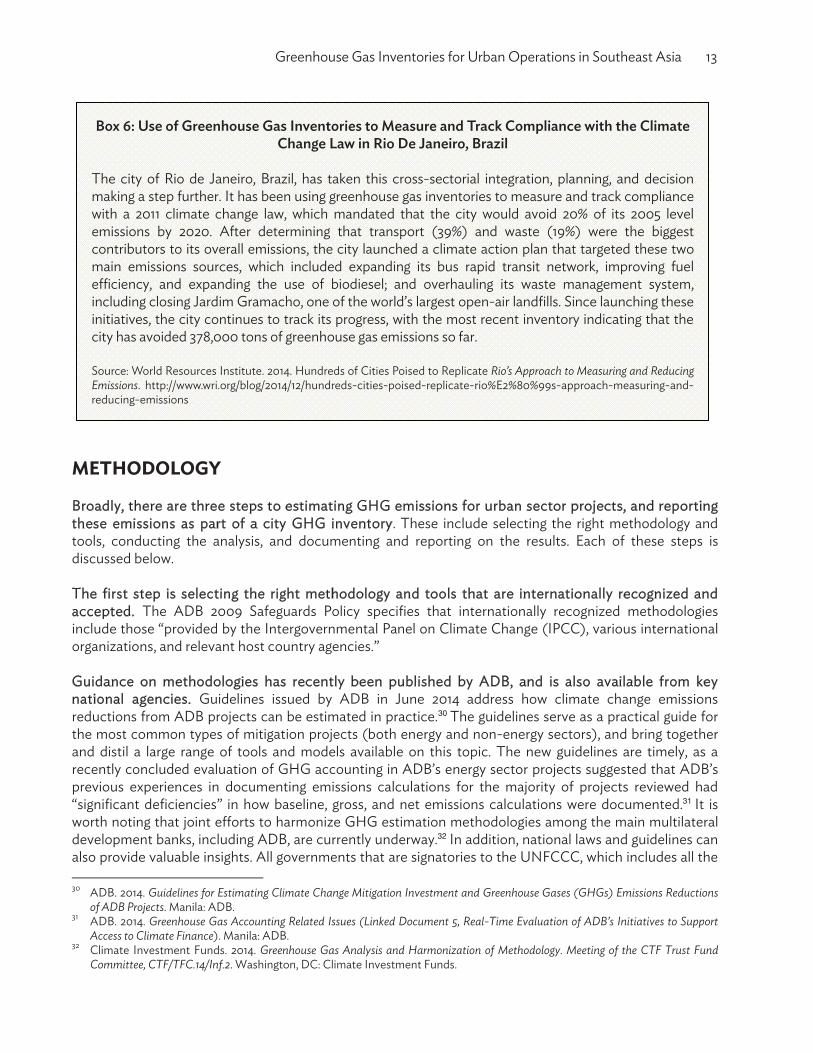
Box 6: Use of Greenhouse Gas Inventories to Measure and Track Compliance with the Climate Change Law in Rio De Janeiro, Brazil
The city of Rio de Janeiro, Brazil, has taken this cross-sectorial integration, planning, and decision making a step further. It has been using greenhouse gas inventories to measure and track compliance with a 2011 climate change law, which mandated that the city would avoid 20% of its 2005 level emissions by 2020. After determining that transport (39%) and waste (19%) were the biggest contributors to its overall emissions, the city launched a climate action plan that targeted these two main emissions sources, which included expanding its bus rapid transit network, improving fuel efficiency, and expanding the use of biodiesel; and overhauling its waste management system, including closing Jardim Gramacho, one of the world’s largest open-air landfills. Since launching these initiatives, the city continues to track its progress, with the most recent inventory indicating that the city has avoided 378,000 tons of greenhouse gas emissions so far. Source: World Resources Institute. 2014. Hundreds of Cities Poised to Replicate Rio’s Approach to Measuring and Reducing Emissions. http://www.wri.org/blog/2014/12/hundreds-cities-poised-replicate-rio%E2%80%99s-approach-measuring-and-reducing-emissions

14 ADB Southeast Asia Working Paper Series No. 12
countries in Southeast Asia, have developed climate change plans and have designated key agencies and focal points to implement them. These climate change plans are operationalized through national laws, regulations, mechanisms, and guidelines,33 some of which provide specific insights on GHG emissions estimations and reporting.34
GHG emissions for most emissions sources are estimated by multiplying activity data by an emissions factor associated with the activity being measured. Activity data is a quantitative measure of a level of activity during a given period of time. The emission factor is a measure of the mass of GHG emissions relative to a unit of activity for a specific pollutant. GHG emissions are reported as metric tons of each GHG, as well as carbon dioxide equivalents. Expressing GHG emissions as carbon dioxide equivalents allows for a universal unit of measurement that can be used to evaluate the climate impact of releasing (or avoiding releasing) different GHGs on a common basis. All tools require the user to enter data on the level of activity, and most tools include default (typical) values for relevant emission factors. Many tools allow these typical values to be replaced by more representative values that are specific to the technology, project, or country as applicable.
Defining the boundary of the analysis is critical. In the context of subproject or project emissions, the boundary usually refers to what phases of a project life cycle can be captured by the estimation tool. For example, a tool may allow flexibility to only focus on emissions during the operational phase of a particular project, or may also have the flexibility to include construction phase emissions. Where construction phase emissions estimates are important, the appropriate tool should be selected. There is also a fundamental question of “associated facilities” i.e., facilities not funded under the project in question, but whose viability and existence depend exclusively on the project and whose goods or services are essential for the successful operation of the project (for example, power plants and transmission lines, roads, pipelines, warehouses etc.).35 In the context of a citywide GHG inventory, the boundary can be used to differentiate between different sources depending on where these emissions are physically originating. For example, the GHG Protocol for Cities defines different sources and boundaries for emission estimations (Figure 5).
A number of available tools are based on standard GHG estimation methodologies. Most of these include reference values for emissions factors, requiring only activity data as inputs. At present, no standardized or specific tool is mandated or required for GHG emissions calculations, either by the IPCC or by the main GHG accounting methodologies and protocols that exist. As such, it is up to the team conducting the analysis to determine which tool is best suited to their needs. The available tools are based on the same basic premise of emissions factors and activity data, and are often tailored for application in specific subsectors, sectors, or countries. (It is worth noting here that tools for calculating emissions are different from the frameworks that are used for documenting and reporting emissions.)
Estimation tools that have been specifically designed to estimate emissions on a local or citywide basis are available. A recent study comparing six commonly used GHG inventory estimation tools concluded that while the methodologies underlying the different tools are relatively similar, key variations in the methodology (Figure 4) meant that the results obtained with the different tools were often not comparable.36 One such tool is the Harmonized Emissions Analysis Tool plus (HEAT+) software tool, developed by ICLEI. HEAT+ allows for the calculation of GHG emissions from local and community actions, and is one of the main tools used by local governments to calculate and account for GHG emissions.
33 ADB. 2009. The Economics of Climate Change in Southeast Asia: A Regional Review. Manila: ADB. 34 It is worth noting that Southeast Asian countries have no obligation to set quantitative standards for GHGs as Non-Annex 1
parties. http://unfccc.int/parties_and_observers/parties/non_annex_i/items/2833.php 35 ADB. 2009. Safeguard Policy Statement, Appendix 1. Manila: ADB. 36 N. Bader. and R. Bleischwitz. 2009. Study report. Comparative analysis of local GHG inventory tools. Paris: Veolia Environment
Institute. http://www.institut.veolia.org/fileadmin/medias/documents/491_Final-report-Comparative-Analysis-of.pdf

Greenhouse Gas Inventories for Urban Operations in Southeast Asia 15
Criteria for selecting a specific tool for use include the data required, the time and cost associated with the analysis, and the reproducibility of the analysis and results. The tool must also be consistent with the desired boundaries of the analysis. In practice, the selection of the emissions estimation tool and data gathering go hand-in-hand, as the choice of which tool to be used can be driven by the type and the format for the data that is readily available. Some tools have simplifying assumptions built into them, which lowers the amount of the data required (and hence and time and cost associated with the analysis) but also means that the modeling results would be less sophisticated (and hence, less accurate), and also less adaptable for changing conditions. As such, the simplicity and ease of model use may often come at the cost of customizability and accuracy of results. The second step involves the application of the selected tool to calculate GHG emissions. This entails collecting activity data; confirming or updating reference emissions factors (which, in many cases, are provided or referenced with the relevant tools); and using the tools to calculate the anticipated GHG emissions. Depending on the data available and the purposes of the inventory, key choices have to be made about how activity data is collected, and what year is selected as the base year. One key choice is whether the approach to data collection will be top–down, bottom–up, or a mix (hybrid) of these two approaches. A top–down approach may entail leveraging existing institutional data systems (for example, from relevant city departments) and the use of data calculation templates, which may be a faster method of data collection, but also one that has to contend with any limitations in the existing data or its documentation. Meanwhile, a bottom–up approach may entail compiling site or activity-specific data and knowledge, which would require more time but would also help ensure that data is captured in sufficient detail. In practice, the approach taken is usually a hybrid approach, where certain data are derived from existing systems, while others are quantified at the site or activity level. Another key choice is on choosing a
Figure 4: Examples of Key Methodological Variations between Different Citywide Greenhouse Gas Estimation and Accounting Tools
Variable Example of variation
GHG measured Only CO2 is measured all GHG are measured
Global warming potential values Global warming potential values derive from second IPCC assessment report values derive from fourth IPCC assessment report
Boundaries Only operations controlled by the public authority are measured all GHG emitting activities of the city are measured
Scope of the measurement Measurement takes only direct emissions into account measurement takes direct, indirect and life cycle emissions into account
Sector definitions Different definition of specific sectors such as the transport sector
Quantifying emissions Default emission factors are used regional and/or local emission factors are used
CO2 = carbon dioxide, GHG = greenhouse gas, IPCC = Intergovernmental Panel on Climate Change. Source: N. Bader and R. Bleischwitz. 2009. Measuring Urban Greenhouse Gas Emissions: The Challenge of Comparability. S.A.P.I.EN.S. http://sapiens.revues.org/854

16 ADB Southeast Asia Working Paper Series No. 12
base year for the GHG inventory, which is the year against which future emissions will be tracked and compared. Most often, the base year is the most recent year for which sufficient information to establish baselines emissions is available.
The process of collecting activity data can be involved and time consuming. When an inventory is being done for the first time, particular care has to be taken to establish data collection processes, develop relationships, and define boundaries in a manner that would facilitate data collection for future updates. The data collection process is an iterative process, involving multiple interactions with several stakeholders across sectors, many of which may be outside the city government’s authority. Participation from these stakeholders is often facilitated through working groups or committees comprising key individuals from the relevant organizations. Explaining the purpose of the data collection exercise, elaborating the potential benefits, and ensuring confidentiality of data (if required) can help to build confidence and ownership of this process.
Uncertainties associated with activity data should be clarified, particularly in terms of how the data was collected, and what physical boundary and time period it is valid for. The physical boundaries of the data collected must be consistent with the scope of the analysis. For example, collecting data on cross-boundary flows of vehicles, fuels, and energy may be difficult for certain cities, as fuel is generated or purchased both inside and outside city boundaries. Similarly, solid waste from several secondary cities may be brought to a landfill in one city. In such cases, the collected data should be organized and annotated sufficiently, and any assumptions documented to ensure consistency for the next time the GHG inventory is updated. Particular care must be taken to ensure that data sourced is evidence-based, well-referenced, and not anecdotal.
The values for emissions factors need to be confirmed or determined. In many cases, default values for emission factors that can be used with a particular tool, and the basis for determining and establishing these factors, are documented. This documentation should be reviewed as it gives an indication of the uncertainty associated with the emission factor. In some cases, it may be necessary to browse recent literature, studies, and reports to include or update previously included factors. Good references for emissions factors include regularly updated guidance from the IPCC, the United States Environmental Protection Agency, environmental agencies (including those of relevant national governments), and academic research.
continued on next page
Box 7: Estimating Greenhouse Gas Emissions for Solid Waste Management Initiatives in the Philippines
Greenhouse gas (GHG) emissions were estimated for solid waste management (SWM) proposals in four municipalities in the Philippines with populations ranging from 15,000 to 120,000. GHG emissions were estimated as part of the municipalities’ solid waste management strategy and action plans, in compliance with the Ecological Solid Waste Management Act of 2000 (Republic Act 9003). The SWM proposals in the cities included a combination of interventions for the rehabilitation and development of landfills, use of emission controls, establishment of material recovery facilities, institutionalization of solid waste collection systems, and adoption and establishment of waste-to-energy technologies.
The team conducting the emissions estimates considered the use of two different tools to simulate GHG emissions. The first was a tool developed by the Institute for Global Environmental Strategies (IGES) that can be used to estimate GHG emissions from all of the existing waste management technologies in developing Asia, and allows for customization of emission factors based on a specification of the country and the climatic zone where projects are located.a The other tool considered was developed by the Institute for Energy and Environmental Research, Heidelberg (IFEU), which was also specifically developed for solid waste management projects.b The IFEU tool offered the possibility of comparing scenarios according to bot0068 GHG emissions and costs, and reporting results in a format that was readily compatible with common GHG reporting regimes.

Greenhouse Gas Inventories for Urban Operations in Southeast Asia 17
Box 7: continued
After comparing and testing both models, the team selected the IGES tool for its GHG emission estimations. This was because the IGES tool was highly customized for use by the local authorities in Southeast Asia, as it already captured emission factors for practices that were common in the region. These factors made the IGES tool simple to adapt and use. While the IGES model did present some limitations, including necessitating separate off-line calculations to estimate the impact of gas capture and the use of waste-to-energy technologies, it was found to best suit the needs of the modeling team. When analyzing GHG emissions, data was needed on each step of the SWM process, including transportation, landfilling, composting, anaerobic digestion, recycling, open burning, and incineration (i.e., controlled burning, which also includes waste-to-energy technologies). To address significant gaps in data on waste volumes and characterization, data was gathered through a waste analysis and characterization survey and a social survey of stakeholders. Through these surveys, the amount and characterization of waste transported, composted, and burned openly was estimated for 2014. The emissions analysis indicated that existing net emissions associated with SWM initiatives across all four municipalities was on the order of 20,000 to 25,000 tons of carbon dioxide equivalent (tCO2e) per year. If the SWM proposals were to be implemented, the collection of waste would improve significantly, and all collected waste would be transported for landfilling, composting, recycling or to waste-to-energy facilities. Initial estimates indicated that there would be a significant increase in GHG emissions due to the proposed use of landfills. However, from a material life cycle perspective, there were significant indirect benefits (savings) that would reduce GHG emissions. This was due to the recovery of materials and energy via an enhanced recycling program, which would result in avoided landfilling of organic waste, and due to avoided emissions from processing fertilizer (which would be replaced by composting organic waste). The analysis concluded that the net GHG emissions savings (accounting for increased direct emissions, but even greater indirect savings) across all four municipalities would be about 5,000 to 10,000 tCO2e per year. Beyond demonstrating and quantifying the potential mitigation impacts of SWM on global warming, this exercise also catalyzed the team’s thinking around financing opportunities related to GHG emissions reductions. Furthermore, comparing GHG emissions from different technology options shed light on incentives and opportunities associated with environmental legislation and policies in the Philippines. For example, the environmental policy is very strict regarding incineration of all classes of solid waste, which leads to the use of large landfills that have significant GHG emissions. a Institute for Global Environmental Strategies. 2014. GHG Calculator for Solid Waste Ver II-2013. http://pub.iges.or.jp/modules/envirolib/view.php?docid=4273 b Institute for Energy and Environmental Research. 2014. Tools for Calculating Greenhouse Gases in Solid Waste Management. http://www.ifeu.org/english/index.php?bereich=abf&seite=klimarechner Source: Asian Development Bank.

18 ADB Southeast Asia Working Paper Series No. 12
The third step is documenting the results of the analysis as part of a citywide GHG inventory. Once subproject or project emissions have been estimated, these can contribute to, or be compared and analyzed in reference to, a citywide GHG inventory. A comprehensive citywide estimate of emissions requires data on emissions across several sectors and subsectors. In practice, citywide emissions can be estimated by bringing together independent emissions estimates for several subprojects, projects, subsectors, and sectors (that may have been derived from different, specific tools), or by estimating emissions from a tool designed specifically for cities. Until recently, a number of frameworks were in place for documenting GHG emissions under a unified GHG inventory. Each framework had its strengths and weaknesses, and international consensus on which framework is most appropriate to document and report GHG inventories for cities was limited. A 2012 study examining the similarities and differences between four leading reporting frameworks concluded that there is an urgent need to develop a standardized international protocol.37 A recent initiative with strong support from the international community is the GHG Protocol for Cities, a standard protocol developed by the World Resources Institute, the C40 Cities Climate Leadership Group, and ICLEI, with strong endorsement from the international climate community, including the World Bank, UN Habitat, and the United Nations Environment Programme.38 Under the GHG protocol, cities are required to measure and report their GHG inventories through a standardized methodology that follows the same principles established by the 2006 IPCC Guidelines for National Greenhouse Gas Inventories. The methodology has been applied to more than 40 cities so far, including in the People’s Republic of China, Indonesia, and Malaysia. Recognizing that activities taking place within a city can generate GHG emissions both inside and outside the city boundaries, the protocol distinguishes between three categories (scopes) of emissions (Figure 5). Scope 1 includes GHG emissions from sources located within the city boundary; scope 2 includes GHG emissions occurring as a consequence of the use of grid-supplied electricity, heat, steam and/or cooling within the city boundary; scope 3 includes all other GHG emissions that occur outside the city boundary due to activities taking place within the city boundary. These scopes have been acknowledged by the UNFCCC.
37 N. Ibrahim, L. Sugar, and D. Hoornweg. 2012. Greenhouse gas emissions from cities: comparison of international inventory
frameworks. Local Environment. 17 (2): 223–241. 38 GHG Protocol. 2014. Global Protocol for Community-Scale Greenhouse Gas Emission Inventories.
http://www.ghgprotocol.org/city-accounting

Greenhouse Gas Inventories for Urban Operations in Southeast Asia 19
At present, the GHG Protocol for Cities appears to be the most viable common platform for documenting citywide GHG inventories. As a standard protocol, it can be used in conjunction with any GHG emissions estimation tool. GHG estimations from different tools, be they subsector or sector-specific estimation tools or more comprehensive citywide estimation tools, can be documented using the protocol. As such, the accuracy of the emissions data reported through the protocol will still be determined by the tool used for the emissions estimations.
Figure 5: Sources and Boundaries of City Greenhouse Gas Emissions
Source: GHG Protocol. 2014. Global Protocol for Community-Scale Greenhouse Gas Emission Inventories. http://www.ghgprotocol.org/city-accounting.
Box 8: Use of a Global Protocol for Documenting Greenhouse Gas Emissions in Mekala, Malaysia
As part of its preparation for the Green Cities Action Plan (Box 5), Melaka, Malaysia recognized that the Global Protocol for Community-Scale Greenhouse Gas Emissions, the precursor to the GHG protocol for cities, provided an internationally recognized and standardized step-by-step approach to help cities quantify their greenhouse gas (GHG) emissions to manage and reduce their GHG impacts and support consistent and transparent public reporting. The GHG inventories will be compiled with the help of the Harmonized Emissions Analysis Tool (HEAT+). A version of HEAT+ for Malaysia is being developed, and will be customized with technical data for the country per the MyCarbon initiative and with Malaysia’s reporting requirements to the United Nations Framework Convention on Climate Change. Source: IMT-GT. 2014. Framework for GrEEEn Actions: Green City Action Plan for Melaka. Melaka: Center for Indonesia–
20 ADB Southeast Asia Working Paper Series No. 12
WAY FORWARD Given the significant opportunities presented by estimating GHG emissions in projects, it is recommended that such estimates be conducted for ADB projects that have potential for mitigation. This will allow the ADB to estimate, report, and track the mitigation impact of its portfolio of projects, even when emission volumes from individual projects may be quite low. More importantly, the case studies documented in this paper demonstrate that even projects with emissions lower than the ADB’s threshold for mandatory reporting (i.e., 100,000 tCo2e) were still eligible for significant financing under the Clean Development Mechanism.39 For example, the Suva–Nausori Water Supply and Sewerage Project in Fiji (Box 3) was able to raise financing of $1.3 million from annual emissions reductions of 22,000 tCO2e over the lifetime of the project. Such opportunities would be missed if GHG emissions are never quantified. It is also recommended that city GHG inventories are conducted for ADB projects that provide comprehensive support to cities in urban planning and investments. Projects that support cities in comprehensive urban planning and investment prioritization are well-suited to include GHG inventories. As the case studies discussed have shown, GHG inventories can provide a snapshot of activities in a city, provide important information of environmental trade-offs for different investment options, and establish platforms for collaboration that cut across sectors and (often complex) institutional structures. While citywide inventories take time and money, data have shown that these costs can be reasonable, particularly when some good data are available. Furthermore, opportunities to use the information provided by the GHG inventory to leverage financing from a growing pot of climate financing are increasing. Finally, the recent momentum that has resulted in a uniform protocol for reporting citywide GHG emissions is evidence of the importance of cities in addressing global climate change. ADB’s ongoing and pipeline urban operations provide opportunities to further replicate and upscale these experiences. Some projects and programs are ideal candidates for these activities. For example, in Qingdao, the People’s Republic of China, ADB supported the city government in developing a strategy and blueprint for low-carbon development through 2020, which was done on the basis of a comprehensive city GHG inventory.40 The study developed a cost-effective emissions reduction plan to address the key drivers of GHG emissions in the city (identified as the energy and industrial sectors) while considering population, urbanization, and gross domestic product growth projections for the city. Looking ahead, the Viet Nam Secondary Cities Development Program (Green Cities), which will support both comprehensive urban planning (using the GrEEEn Cities Operational Framework) as well as specific subprojects in three cities in Viet Nam, provides good entry points for both GHG emission estimates and city inventories.41 The GrEEEn cities approach encourages cities to develop a comprehensive GHG inventory to facilitate city managers in following a low-carbon trajectory and set realistic goals for carbon reduction. As such, experiences with GHG estimates and inventories could also be replicated in future projects under the GrEEEn cities framework.
39 Revenues from such CDM initiatives would depend on the price of carbon, which has been falling since 2008 and is at
historically low values at present. For more information on the carbon prices, see: World Bank. 2013. Mapping Carbon Price Initiatives: Developments and Prospects. Washington, DC: World Bank.
40 ADB. 2013. Enabling the Protection of Jiaozhou Bay Water Quality and Wetland Ecosystem: Technical Assistance Completion Report. Manila.
41 ADB. 2014. Secondary Cities Development Program (Green Cities): Project Data Sheet. http://adb.org/projects/details? page=details&proj_id=47274-001
ASIAN DEVELOPMENT BANK
AsiAn Development BAnk6 ADB Avenue, Mandaluyong City1550 Metro Manila, Philippineswww.adb.org
Greenhouse Gas Inventories for Urban Operations in Southeast AsiaChallenges and Opportunities
This paper discusses the challenges, opportunities, and basic steps associated with estimating greenhouse gas (GHG) emissions for projects in the urban sector, and documenting these as part of GHG inventories for cities. Documenting GHG emissions allows the Asian Development Bank (ADB) to monitor progress on environmental mitigation impacts of reducing carbon in and across its operations. This is particularly relevant in the urban sector, as cities are major contributors to GHG emissions and climate change. Key challenges include the unique and complex nature of the urban sector, the time and costs involved, and the expectation or perception that emission volumes from individual urban projects may be insignificant. In spite of these challenges, there is a strong case and a building global momentum for estimating GHG emissions for projects and developing GHG inventories for cities. Recent case studies provide evidence that GHG emission estimates establish valuable baselines, allowing for credible, analysis-based determinations of the magnitudes of carbon-related impacts of urban projects, and that GHG inventories enable cities to drive green investments, leverage and access climate financing (including from an evolving global carbon market), and raise public awareness. GHG inventories can serve as platforms for cross-sector planning and decision making, enabling cities to explore result-specific solutions with respect to environmental sustainability and climate change. The paper recommends estimating GHG emissions for projects with mitigation potential, and developing GHG inventories as part of urban development projects that aim for comprehensive citywide planning and investments. There is significant opportunity for scaling up and replicating these activities in ADB’s urban operations in Southeast Asia.
About the Asian Development Bank
ADB’s vision is an Asia and Pacific region free of poverty. Its mission is to help its developing member countries reduce poverty and improve the quality of life of their people. Despite the region’s many successes, it remains home to the majority of the world’s poor. ADB is committed to reducing poverty through inclusive economic growth, environmentally sustainable growth, and regional integration.
Based in Manila, ADB is owned by 67 members, including 48 from the region. Its main instruments for helping its developing member countries are policy dialogue, loans, equity investments, guarantees, grants, and technical assistance.
GreenhOUSe GAS InventOrIeS fOr UrBAn OperAtIOnS In SOUtheASt ASIA: ChAllenGeS AnD OppOrtUnItIeSSonia Chand Sandhu and Sameer A. Kamal
adb southEast asiaworking papEr sEriEs
nO. 12
June 2015