Greenhouse Gas Inventories - Minneapolis
68
City of Minneapolis Greenhouse Gas Inventories A Geographic Inventory (2006-2010) and Household Consumption-based Inventory (2010) 5/11/2012
Transcript of Greenhouse Gas Inventories - Minneapolis
City of Minneapolis
Greenhouse Gas Inventories A Geographic Inventory (2006-2010) and Household Consumption-based Inventory (2010)
5/11/2012

1
Acknowledgements The following individuals contributed significant time and energy to the completion of this report.
Project Team
Holly Lahd, Consultant Brendon Slotterback, City of Minneapolis Sustainability Gayle Prest, City of Minneapolis Sustainability Anders Imboden, City of Minneapolis Sustainability
Additional Thanks
Brian Millberg, City of Minneapolis Property Services Paul Adelmann, Xcel Eenrgy David Chapman, Xcel Energy Peter Ciborowski, Minnesota Pollution Control Agency Mark Filipi, Metropolitan Council Megan Forbes, MNDOT Tony Hainualt, Hennepin County Environmental Services J. Drake Hamilton, Fresh Energy Linda Henning, Metropolitan Council Jeff Jenks, City of Minneapolis Solid Waste and Recycling Chris Jones, University of California, Berkeley Paul Kroening, Hennepin County Environmental Services Andy Leith, Hennepin County Environmental Services Dave McNary, Hennepin County Environmental Services Brita Pagels, ICLEI Melisa Pollak, Univeristy of Minnesota Humphrey School Shane Stennes, University of Minnesota Al Swintek, Centerpoint Energy
2
Contents Acknowledgements............................................................................................................................1
Contents ............................................................................................................................................2
Executive Summary ............................................................................................................................3
Geographic Inventory Findings (2006 – 2010) ......................................................................................... 3
Household Consumption Inventory Findings (2010) ................................................................................ 4
Geographic Inventory Summary .........................................................................................................5
Buildings ................................................................................................................................................... 7
Transportation .......................................................................................................................................... 9
Waste ...................................................................................................................................................... 11
Household Consumption Inventory Summary ................................................................................... 13
Introduction ............................................................................................................................................ 13
Results .................................................................................................................................................... 13
Appendices Contents ....................................................................................................................... 16
Appendix 1: Electricity Consumption GHG Emissions ......................................................................... 17
Appendix 2: Road Transportation GHG Emissions ............................................................................. 26
Appendix 3: Natural Gas Consumption GHG Emissions ...................................................................... 42
Appendix 4: University of Minnesota Southeast Steam Plant GHG Emissions ..................................... 47
Appendix 5: Rail and Barge Transportation GHG Emissions ............................................................... 48
Appendix 6: Heating and Backup Power Generation GHG Emissions .................................................. 50
Appendix 7: Waste GHG Emissions ................................................................................................... 51
Appendix 8: Air Travel GHG Emissions .............................................................................................. 64
Appendix 9: Consumption Inventory Methodology ........................................................................... 66

3
Executive Summary There is scientific consensus, as documented by the United States National Academies and the Intergovernmental Panel on Climate Change, that human sources of greenhouse gases (GHGs) such as carbon dioxide and methane are causing unprecedented and severe changes in global and local climate systems. To avoid the most serious impacts to the environment, human health and the economy, significant reductions in GHG emissions will be necessary. This will require bold action from local governments and communities up to national and international levels.
In 1989, Minneapolis joined the City of Saint Paul in an effort to be among the first cities in the world to develop comprehensive plans to reduce greenhouse gas (GHG) emissions. In 2003, Minneapolis incorporated a greenhouse gas emissions reduction target into the City’s Sustainability Indicators and in 2012 they updated that target – reduce citywide greenhouse gas emissions by 15 percent by 2015 and 30 percent by 2025 using 2006 as a baseline.
This report presents the results from an inventory of greenhouse gas emissions released within Minneapolis’ geographic boundary plus additional emissions from outside the boundary associated with activities in the city (such as the consumption of electricity). This inventory method is typically called a geographic-plus approach. The inventory was completed for the years 2006 through 2010.
This report also presents the results of an inventory based on the consumption of goods and services by Minneapolis households in 2010. This consumption inventory uses a model that includes emissions from “cradle to consumer”, meaning it estimated impacts from resource extraction all the way up to purchase of the product regardless of where they are produced. Consumption inventories provide a complementary method of assessing greenhouse gas impacts of a community and capture emissions that often do not appear in a geographic inventory.
Geographic Inventory Findings (2006 – 2010)
• GHG emissions fell 13.4 percent from 5.9 million metric tons of carbon dioxide equivalent (million MTCO2e) in 2006 to 5.1 million metric tons in 2010. Nearly half of this reduction was the result of Xcel Energy using cleaner sources (natural gas and renewables) to produce electricity for the grid.
• Per person GHG emissions fell nearly 15 percent from 15.8 MTCO2e in 2006 to 13.4 MTCO2e in 2010.
• Energy use in commercial and residential buildings (primarily from heating and cooling) was the largest source of GHG emissions at 3.3 million MTCO2e in 2010 representing 65 percent of the total.
• Transportation was the second largest source of GHG emissions at 1.5 million MTCO2e in 2010 which represents 29 percent of the total. This includes cars and trucks on the road, air travel, and rail and barge traffic in the city.
• Emissions from waste, including landfill, waste incineration and wastewater treatment processes, represent 3.8 percent of the total GHG emissions in 2010.
• The largest decline in emissions came from the electricity category, with a 16.5 percent decline in emissions associated with electricity consumption between 2006 and 2010. While electricity use in the city remained fairly stable (1.42 percent decline between 2006 and 2010), significant changes in GHG intensity of electricity provided by Xcel led to significant reductions in electricity-related GHG emissions.
4
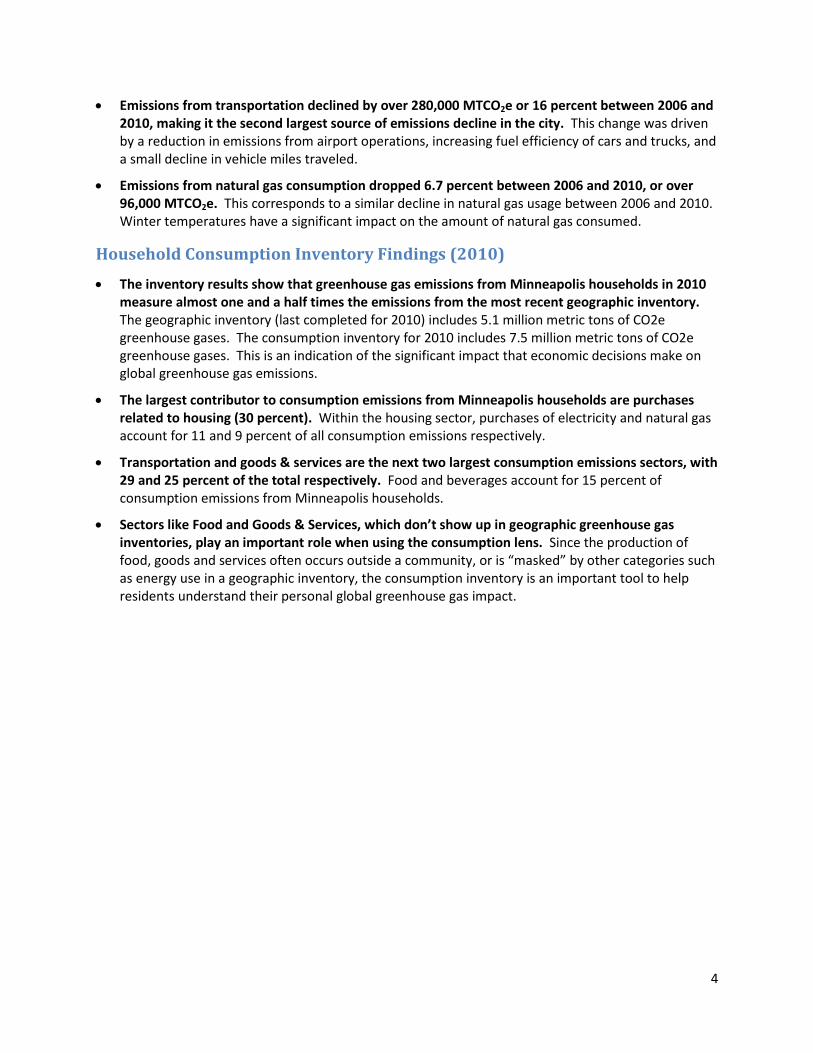
• Emissions from transportation declined by over 280,000 MTCO2e or 16 percent between 2006 and 2010, making it the second largest source of emissions decline in the city. This change was driven by a reduction in emissions from airport operations, increasing fuel efficiency of cars and trucks, and a small decline in vehicle miles traveled.
• Emissions from natural gas consumption dropped 6.7 percent between 2006 and 2010, or over 96,000 MTCO2e. This corresponds to a similar decline in natural gas usage between 2006 and 2010. Winter temperatures have a significant impact on the amount of natural gas consumed.
Household Consumption Inventory Findings (2010)
• The inventory results show that greenhouse gas emissions from Minneapolis households in 2010 measure almost one and a half times the emissions from the most recent geographic inventory. The geographic inventory (last completed for 2010) includes 5.1 million metric tons of CO2e greenhouse gases. The consumption inventory for 2010 includes 7.5 million metric tons of CO2e greenhouse gases. This is an indication of the significant impact that economic decisions make on global greenhouse gas emissions.
• The largest contributor to consumption emissions from Minneapolis households are purchases related to housing (30 percent). Within the housing sector, purchases of electricity and natural gas account for 11 and 9 percent of all consumption emissions respectively.
• Transportation and goods & services are the next two largest consumption emissions sectors, with 29 and 25 percent of the total respectively. Food and beverages account for 15 percent of consumption emissions from Minneapolis households.
• Sectors like Food and Goods & Services, which don’t show up in geographic greenhouse gas inventories, play an important role when using the consumption lens. Since the production of food, goods and services often occurs outside a community, or is “masked” by other categories such as energy use in a geographic inventory, the consumption inventory is an important tool to help residents understand their personal global greenhouse gas impact.
5
Geographic Inventory Summary This inventory is an accounting of greenhouse gas emissions from Minneapolis, which includes emissions from buildings, transportation (cars, trucks, airport, rail and barge), and waste, for the years 2006 through 2010. It is described as a “geographic-plus” inventory because it focuses on emissions from activities occurring within the city boundaries, with the exception of a few sources, such as electricity produced outside the city but used within it.
This inventory uses a standardized accounting approach used by a large number of communities nationally and internationally. During the development of the inventory, other jurisdictions and ICLEI (a national leader in greenhouse gas inventories for communities) were consulted. As greenhouse gas accounting methodologies and protocols continue to evolve, Minneapolis will refine and update the inventory. In developing this inventory, the base year (2006) inventory was updated from the previous report to reflect the latest protocol approaches.
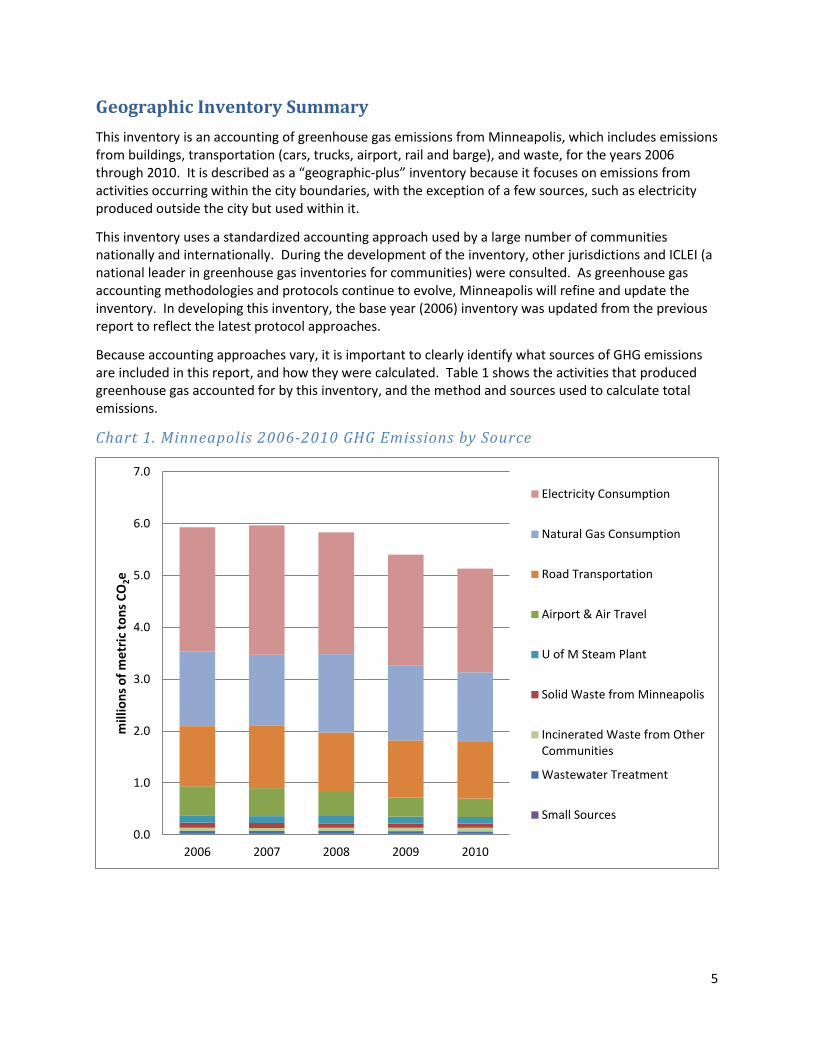
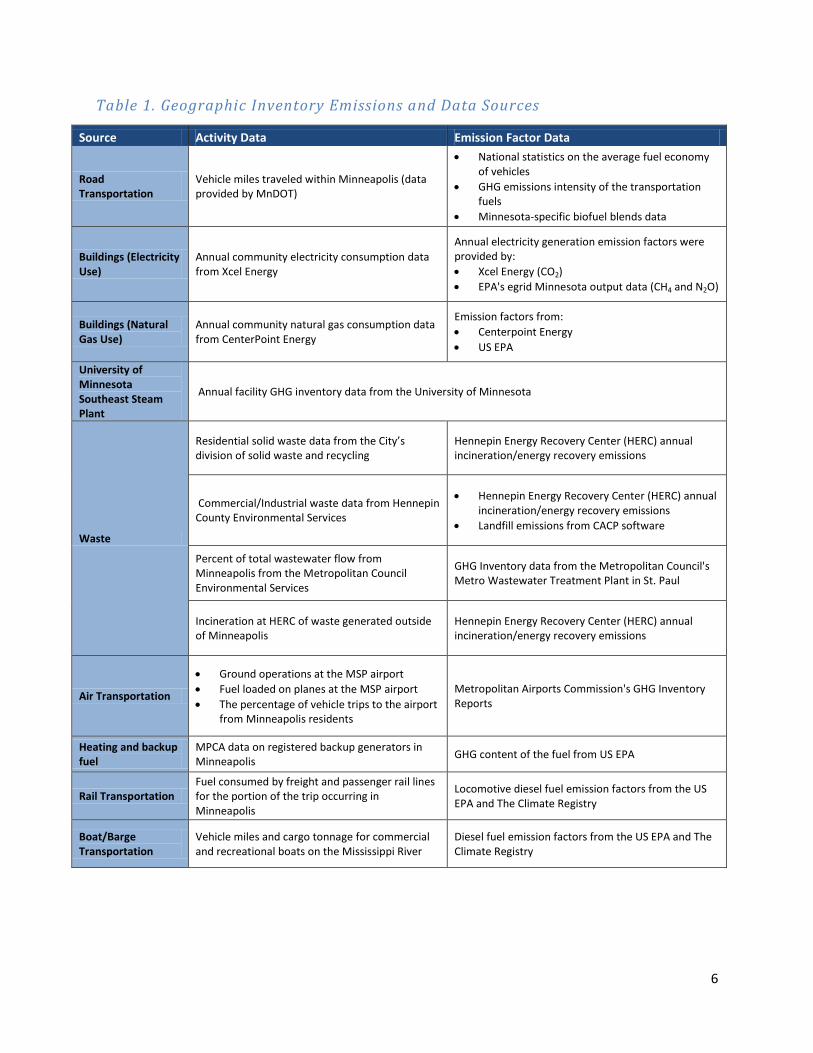
Because accounting approaches vary, it is important to clearly identify what sources of GHG emissions are included in this report, and how they were calculated. Table 1 shows the activities that produced greenhouse gas accounted for by this inventory, and the method and sources used to calculate total emissions.
Chart 1. Minneapolis 2006-2010 GHG Emissions by Source
0.0
1.0
2.0
3.0
4.0
5.0
6.0
7.0
2006 2007 2008 2009 2010
mill
ions
of m
etric
tons
CO
2e
Electricity Consumption
Natural Gas Consumption
Road Transportation
Airport & Air Travel
U of M Steam Plant
Solid Waste from Minneapolis
Incinerated Waste from OtherCommunities
Wastewater Treatment
Small Sources
6
Table 1. Geographic Inventory Emissions and Data Sources
Source Activity Data Emission Factor Data
Road Transportation
Vehicle miles traveled within Minneapolis (data provided by MnDOT)
• National statistics on the average fuel economy of vehicles
• GHG emissions intensity of the transportation fuels
• Minnesota-specific biofuel blends data
Buildings (Electricity Use)
Annual community electricity consumption data from Xcel Energy
Annual electricity generation emission factors were provided by: • Xcel Energy (CO2) • EPA's egrid Minnesota output data (CH4 and N2O)
Buildings (Natural Gas Use)
Annual community natural gas consumption data from CenterPoint Energy
Emission factors from: • Centerpoint Energy • US EPA
University of Minnesota Southeast Steam Plant
Annual facility GHG inventory data from the University of Minnesota
Waste
Residential solid waste data from the City’s division of solid waste and recycling
Hennepin Energy Recovery Center (HERC) annual incineration/energy recovery emissions
Commercial/Industrial waste data from Hennepin County Environmental Services
• Hennepin Energy Recovery Center (HERC) annual incineration/energy recovery emissions
• Landfill emissions from CACP software
Percent of total wastewater flow from Minneapolis from the Metropolitan Council Environmental Services
GHG Inventory data from the Metropolitan Council's Metro Wastewater Treatment Plant in St. Paul
Incineration at HERC of waste generated outside of Minneapolis
Hennepin Energy Recovery Center (HERC) annual incineration/energy recovery emissions
Air Transportation
• Ground operations at the MSP airport • Fuel loaded on planes at the MSP airport • The percentage of vehicle trips to the airport
from Minneapolis residents
Metropolitan Airports Commission's GHG Inventory Reports
Heating and backup fuel
MPCA data on registered backup generators in Minneapolis GHG content of the fuel from US EPA
Rail Transportation Fuel consumed by freight and passenger rail lines for the portion of the trip occurring in Minneapolis
Locomotive diesel fuel emission factors from the US EPA and The Climate Registry
Boat/Barge Transportation
Vehicle miles and cargo tonnage for commercial and recreational boats on the Mississippi River
Diesel fuel emission factors from the US EPA and The Climate Registry
7
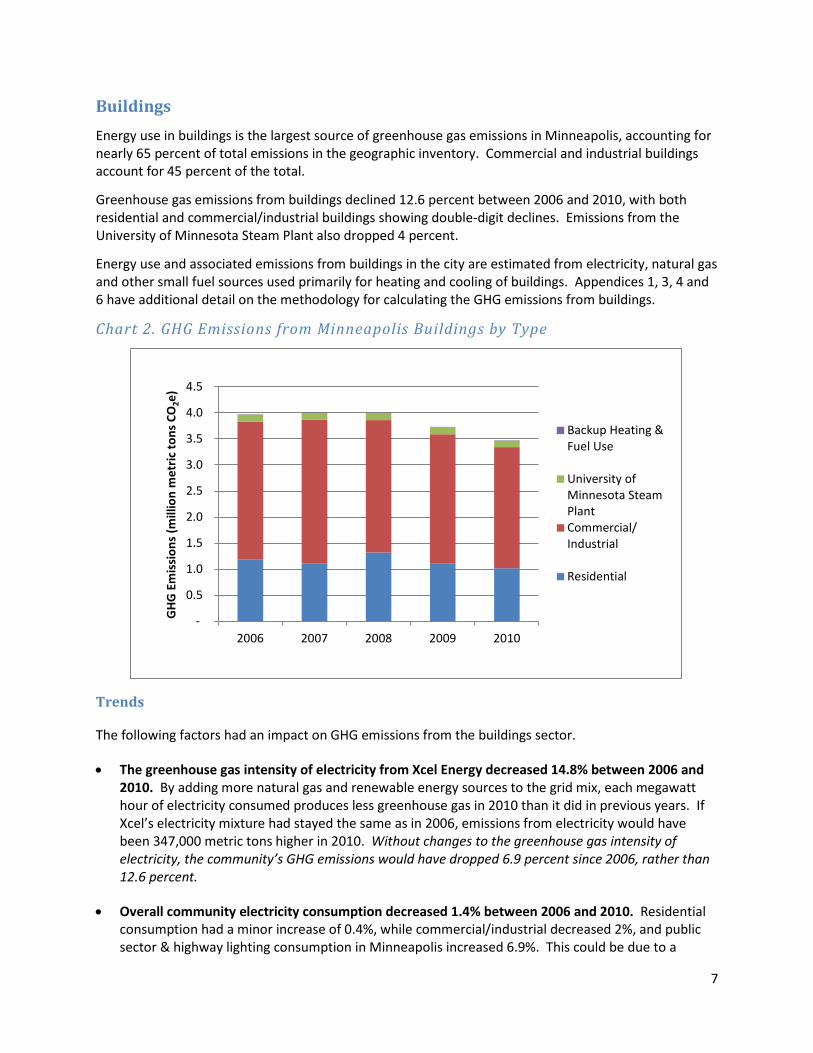
Buildings Energy use in buildings is the largest source of greenhouse gas emissions in Minneapolis, accounting for nearly 65 percent of total emissions in the geographic inventory. Commercial and industrial buildings account for 45 percent of the total.
Greenhouse gas emissions from buildings declined 12.6 percent between 2006 and 2010, with both residential and commercial/industrial buildings showing double-digit declines. Emissions from the University of Minnesota Steam Plant also dropped 4 percent.
Energy use and associated emissions from buildings in the city are estimated from electricity, natural gas and other small fuel sources used primarily for heating and cooling of buildings. Appendices 1, 3, 4 and 6 have additional detail on the methodology for calculating the GHG emissions from buildings.
Chart 2. GHG Emissions from Minneapolis Buildings by Type
Trends
The following factors had an impact on GHG emissions from the buildings sector.
• The greenhouse gas intensity of electricity from Xcel Energy decreased 14.8% between 2006 and 2010. By adding more natural gas and renewable energy sources to the grid mix, each megawatt hour of electricity consumed produces less greenhouse gas in 2010 than it did in previous years. If Xcel’s electricity mixture had stayed the same as in 2006, emissions from electricity would have been 347,000 metric tons higher in 2010. Without changes to the greenhouse gas intensity of electricity, the community’s GHG emissions would have dropped 6.9 percent since 2006, rather than 12.6 percent.
• Overall community electricity consumption decreased 1.4% between 2006 and 2010. Residential consumption had a minor increase of 0.4%, while commercial/industrial decreased 2%, and public sector & highway lighting consumption in Minneapolis increased 6.9%. This could be due to a
-
0.5
1.0
1.5
2.0
2.5
3.0
3.5
4.0
4.5
2006 2007 2008 2009 2010
GHG
Em
issi
ons
(mill
ion
met
ric to
ns C
O2e
)
Backup Heating &Fuel Use
University ofMinnesota SteamPlantCommercial/Industrial
Residential
8
variety of factors, including a cooler summer in 2010, the economic downturn and energy efficiency improvements.
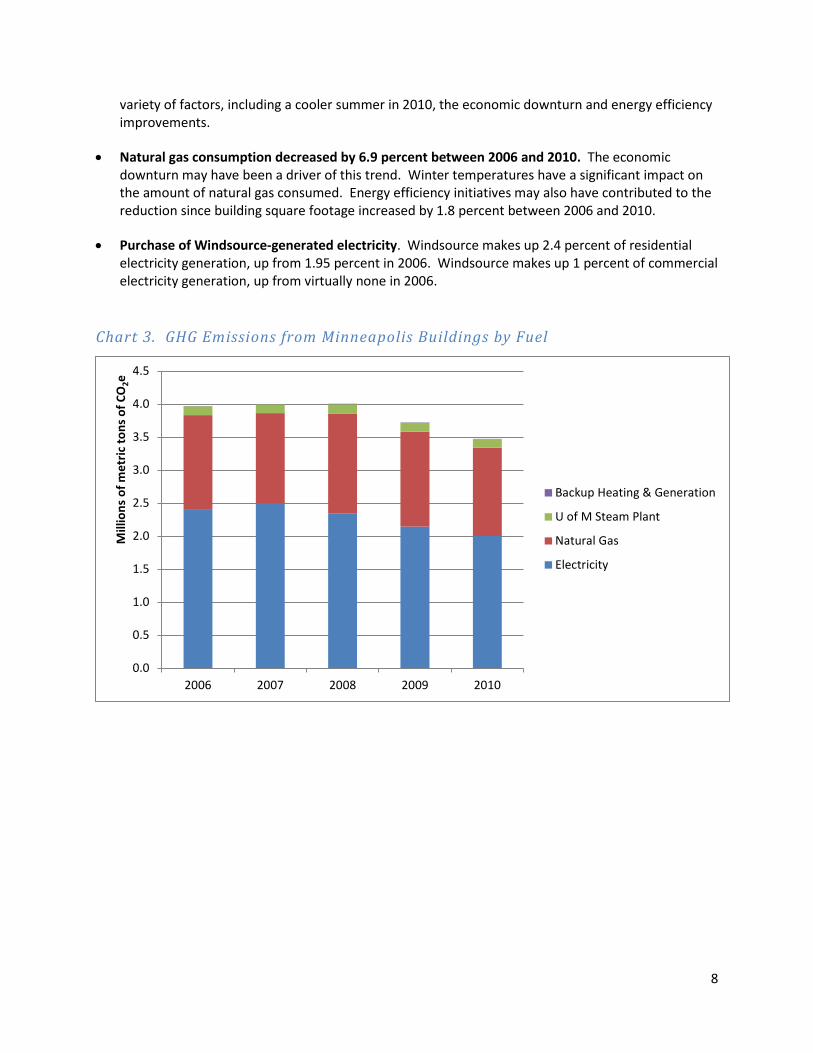
• Natural gas consumption decreased by 6.9 percent between 2006 and 2010. The economic downturn may have been a driver of this trend. Winter temperatures have a significant impact on the amount of natural gas consumed. Energy efficiency initiatives may also have contributed to the reduction since building square footage increased by 1.8 percent between 2006 and 2010.
• Purchase of Windsource-generated electricity. Windsource makes up 2.4 percent of residential electricity generation, up from 1.95 percent in 2006. Windsource makes up 1 percent of commercial electricity generation, up from virtually none in 2006.
Chart 3. GHG Emissions from Minneapolis Buildings by Fuel
0.0
0.5
1.0
1.5
2.0
2.5
3.0
3.5
4.0
4.5
2006 2007 2008 2009 2010
Mill
ions
of m
etric
tons
of C
O2e
Backup Heating & Generation
U of M Steam Plant
Natural Gas
Electricity
9
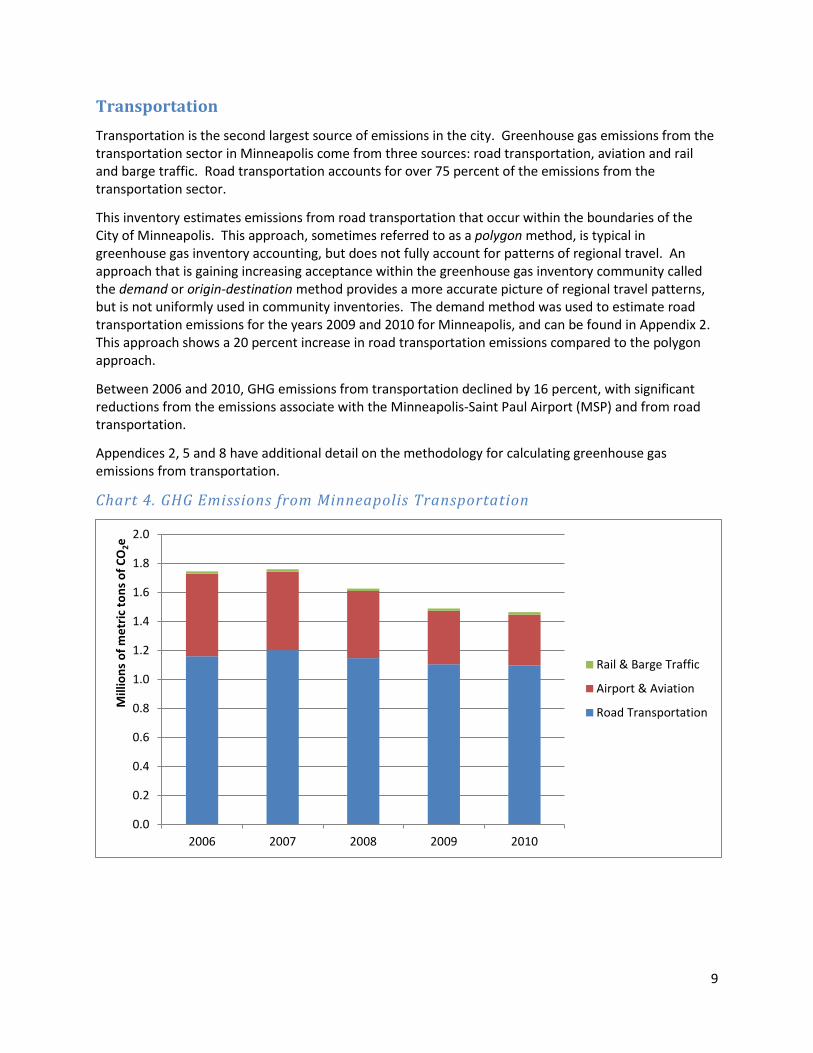
Transportation Transportation is the second largest source of emissions in the city. Greenhouse gas emissions from the transportation sector in Minneapolis come from three sources: road transportation, aviation and rail and barge traffic. Road transportation accounts for over 75 percent of the emissions from the transportation sector.
This inventory estimates emissions from road transportation that occur within the boundaries of the City of Minneapolis. This approach, sometimes referred to as a polygon method, is typical in greenhouse gas inventory accounting, but does not fully account for patterns of regional travel. An approach that is gaining increasing acceptance within the greenhouse gas inventory community called the demand or origin-destination method provides a more accurate picture of regional travel patterns, but is not uniformly used in community inventories. The demand method was used to estimate road transportation emissions for the years 2009 and 2010 for Minneapolis, and can be found in Appendix 2. This approach shows a 20 percent increase in road transportation emissions compared to the polygon approach.
Between 2006 and 2010, GHG emissions from transportation declined by 16 percent, with significant reductions from the emissions associate with the Minneapolis-Saint Paul Airport (MSP) and from road transportation.
Appendices 2, 5 and 8 have additional detail on the methodology for calculating greenhouse gas emissions from transportation.
Chart 4. GHG Emissions from Minneapolis Transportation
0.0
0.2
0.4
0.6
0.8
1.0
1.2
1.4
1.6
1.8
2.0
2006 2007 2008 2009 2010
Mill
ions
of m
etric
tons
of C
O2e
Rail & Barge Traffic
Airport & Aviation
Road Transportation
10
Trends
The following factors had an impact on GHG emissions from the transportation sector.
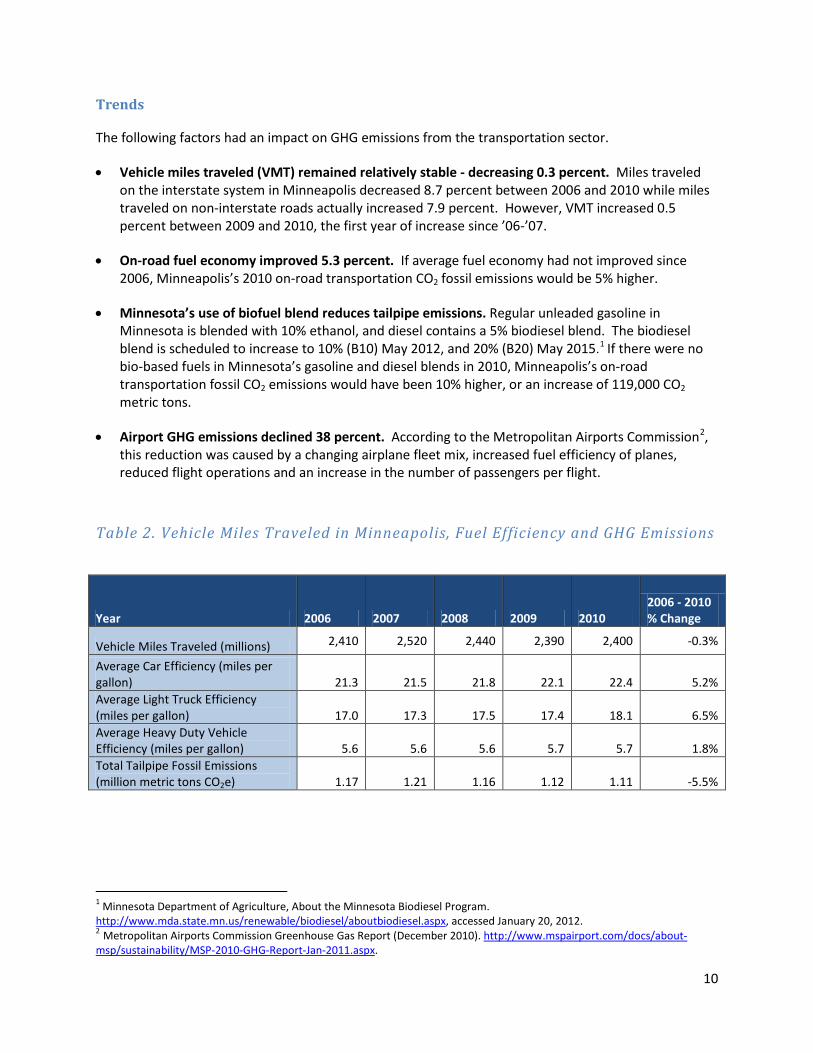
• Vehicle miles traveled (VMT) remained relatively stable - decreasing 0.3 percent. Miles traveled on the interstate system in Minneapolis decreased 8.7 percent between 2006 and 2010 while miles traveled on non-interstate roads actually increased 7.9 percent. However, VMT increased 0.5 percent between 2009 and 2010, the first year of increase since ’06-’07.
• On-road fuel economy improved 5.3 percent. If average fuel economy had not improved since 2006, Minneapolis’s 2010 on-road transportation CO2 fossil emissions would be 5% higher.
• Minnesota’s use of biofuel blend reduces tailpipe emissions. Regular unleaded gasoline in Minnesota is blended with 10% ethanol, and diesel contains a 5% biodiesel blend. The biodiesel blend is scheduled to increase to 10% (B10) May 2012, and 20% (B20) May 2015.1 If there were no bio-based fuels in Minnesota’s gasoline and diesel blends in 2010, Minneapolis’s on-road transportation fossil CO2 emissions would have been 10% higher, or an increase of 119,000 CO2 metric tons.
• Airport GHG emissions declined 38 percent. According to the Metropolitan Airports Commission2, this reduction was caused by a changing airplane fleet mix, increased fuel efficiency of planes, reduced flight operations and an increase in the number of passengers per flight.
Table 2. Vehicle Miles Traveled in Minneapolis, Fuel Efficiency and GHG Emissions
1 Minnesota Department of Agriculture, About the Minnesota Biodiesel Program. http://www.mda.state.mn.us/renewable/biodiesel/aboutbiodiesel.aspx, accessed January 20, 2012. 2 Metropolitan Airports Commission Greenhouse Gas Report (December 2010). http://www.mspairport.com/docs/about-msp/sustainability/MSP-2010-GHG-Report-Jan-2011.aspx.
Year 2006 2007 2008 2009 2010 2006 - 2010 % Change
Vehicle Miles Traveled (millions) 2,410 2,520 2,440 2,390 2,400 -0.3%
Average Car Efficiency (miles per gallon) 21.3 21.5 21.8 22.1 22.4 5.2% Average Light Truck Efficiency (miles per gallon) 17.0 17.3 17.5 17.4 18.1 6.5% Average Heavy Duty Vehicle Efficiency (miles per gallon) 5.6 5.6 5.6 5.7 5.7 1.8% Total Tailpipe Fossil Emissions (million metric tons CO2e) 1.17 1.21 1.16 1.12 1.11 -5.5%
11
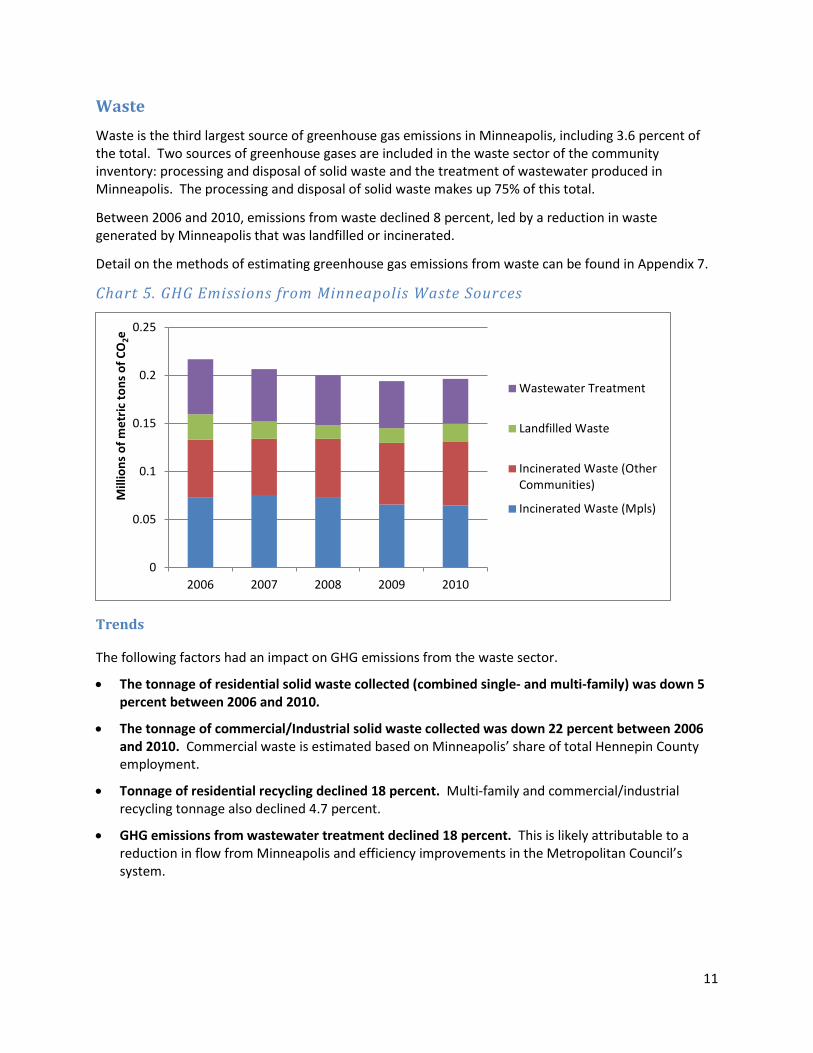
Waste Waste is the third largest source of greenhouse gas emissions in Minneapolis, including 3.6 percent of the total. Two sources of greenhouse gases are included in the waste sector of the community inventory: processing and disposal of solid waste and the treatment of wastewater produced in Minneapolis. The processing and disposal of solid waste makes up 75% of this total.
Between 2006 and 2010, emissions from waste declined 8 percent, led by a reduction in waste generated by Minneapolis that was landfilled or incinerated.
Detail on the methods of estimating greenhouse gas emissions from waste can be found in Appendix 7.
Chart 5. GHG Emissions from Minneapolis Waste Sources
Trends
The following factors had an impact on GHG emissions from the waste sector.
• The tonnage of residential solid waste collected (combined single- and multi-family) was down 5 percent between 2006 and 2010.
• The tonnage of commercial/Industrial solid waste collected was down 22 percent between 2006 and 2010. Commercial waste is estimated based on Minneapolis’ share of total Hennepin County employment.
• Tonnage of residential recycling declined 18 percent. Multi-family and commercial/industrial recycling tonnage also declined 4.7 percent.
• GHG emissions from wastewater treatment declined 18 percent. This is likely attributable to a reduction in flow from Minneapolis and efficiency improvements in the Metropolitan Council’s system.
0
0.05
0.1
0.15
0.2
0.25
2006 2007 2008 2009 2010
Mill
ions
of m
etric
tons
of C
O2e
Wastewater Treatment
Landfilled Waste
Incinerated Waste (OtherCommunities)
Incinerated Waste (Mpls)
12
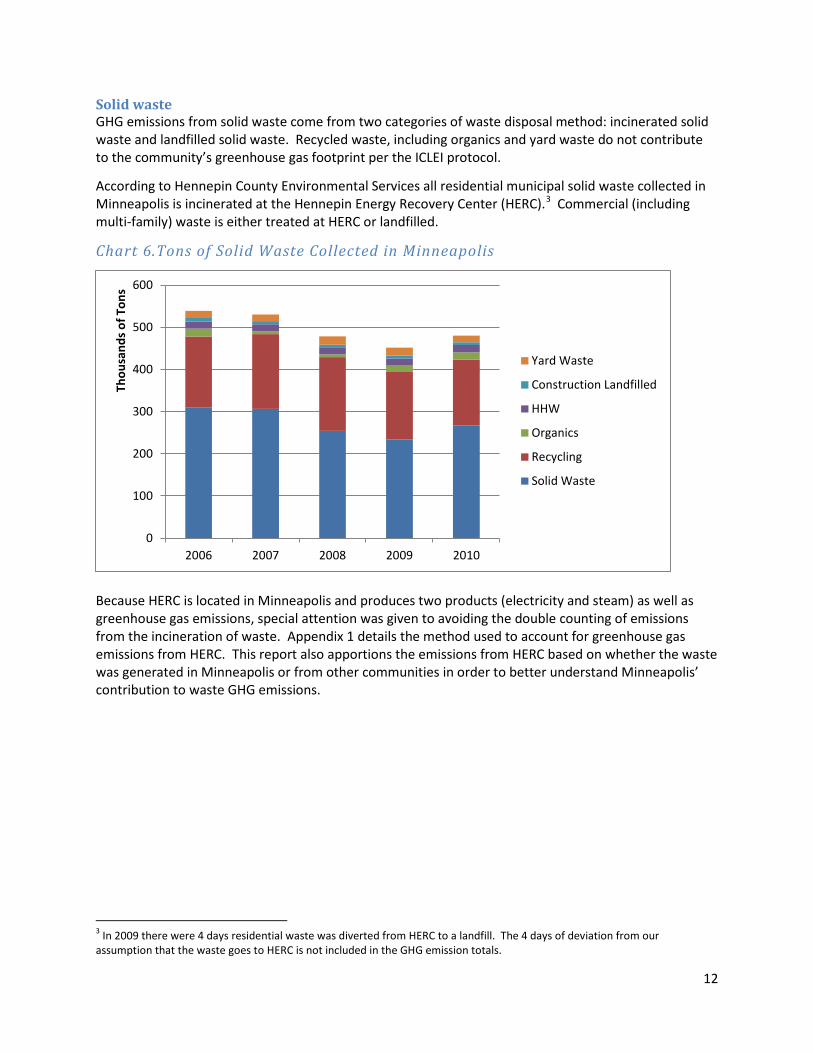
Solid waste GHG emissions from solid waste come from two categories of waste disposal method: incinerated solid waste and landfilled solid waste. Recycled waste, including organics and yard waste do not contribute to the community’s greenhouse gas footprint per the ICLEI protocol.
According to Hennepin County Environmental Services all residential municipal solid waste collected in Minneapolis is incinerated at the Hennepin Energy Recovery Center (HERC).3 Commercial (including multi-family) waste is either treated at HERC or landfilled.
Chart 6.Tons of Solid Waste Collected in Minneapolis
Because HERC is located in Minneapolis and produces two products (electricity and steam) as well as greenhouse gas emissions, special attention was given to avoiding the double counting of emissions from the incineration of waste. Appendix 1 details the method used to account for greenhouse gas emissions from HERC. This report also apportions the emissions from HERC based on whether the waste was generated in Minneapolis or from other communities in order to better understand Minneapolis’ contribution to waste GHG emissions.
3 In 2009 there were 4 days residential waste was diverted from HERC to a landfill. The 4 days of deviation from our assumption that the waste goes to HERC is not included in the GHG emission totals.
0
100
200
300
400
500
600
2006 2007 2008 2009 2010
Thou
sand
s of T
ons
Yard Waste
Construction Landfilled
HHW
Organics
Recycling
Solid Waste
13
Household Consumption Inventory Summary
Introduction Many communities are now completing an inventory of the greenhouse gas impacts of the products and services consumed in a community as a supplement to the more typical geographic emissions inventory. Geographic emissions inventories frequently follow well-established protocols that document emissions from residential and commercial/industrial buildings, transportation systems and waste produced in a community. However, they do not provide complete information about the global emissions impacts of the economic activity that occurs within a community. With the exception of power generation, if emissions are occurring outside of a community to support economic activity inside a community, they are generally not captured in a geographic inventory.
Consumption inventories can help communities understand the full impact of economic activity throughout the supply chain. Consumption inventories use economic activity data to estimate emissions produced “upstream” of the consumer. The Minneapolis consumption inventory used a model that included emissions from “cradle to consumer”, meaning it estimated impacts from resource extraction all the way up to purchase of the product. The following is an example from the EIO-LCA website:
“The effect of producing an automobile would include not only the impacts at the final assembly facility, but also the impact from mining metal ores, making electronic parts, forming windows, etc. that are needed for parts to build the car.”
Consumption inventories enhance geographic inventories. Many of the emissions measured in geographic inventories may overlap with those measured in a consumption inventory. In other words, one cannot be substituted for the other; rather the two methods complement each other. The consumption inventory for Minneapolis relies on estimates of household expenditures based on national survey data, so the result should be considered an estimate (see Methodology section for more detail).
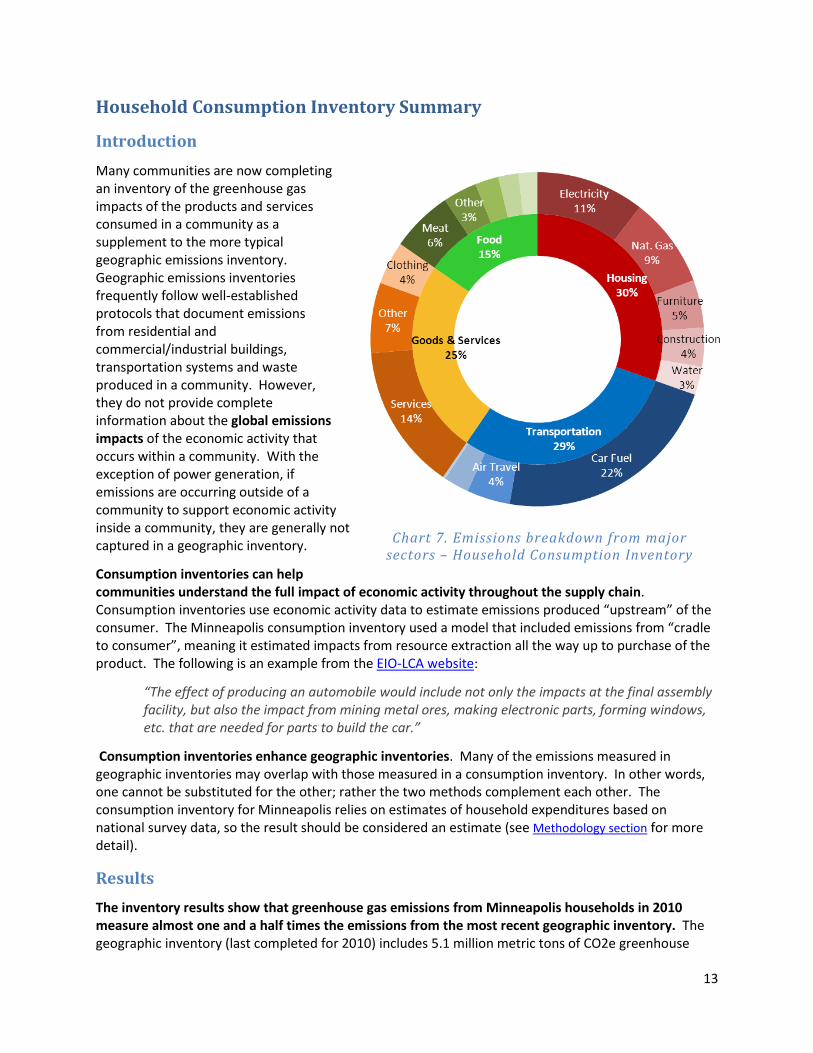
Results The inventory results show that greenhouse gas emissions from Minneapolis households in 2010 measure almost one and a half times the emissions from the most recent geographic inventory. The geographic inventory (last completed for 2010) includes 5.1 million metric tons of CO2e greenhouse
Chart 7. Emissions breakdown from major sectors – Household Consumption Inventory

14
gases. The consumption inventory for 2010 includes 7.5 million metric tons of CO2e greenhouse gases. This is an indication of the significant impact that economic decisions make on global greenhouse gas emissions.
The largest contributor to consumption emissions from Minneapolis households are purchases related to housing (30 percent). Within the housing sector, purchases of electricity and natural gas account for 11 and 9 percent of all consumption emissions respectively.
Transportation and goods & services are the next two largest consumption emissions sectors, with 29 and 25 percent of the total respectively. Food and beverages account for 15 percent of consumption emissions from Minneapolis households. Chart 7 shows each major sector broken out into associated subcategories. A full list of sectors with more detail and associated emissions is shown in table 3.
Sectors like Food and Goods & Services, which don’t show up in geographic greenhouse gas inventories, play an important role when using the consumption lens. Since the production of food, goods and services often occurs outside a community, or is “masked” by other categories such as energy use in a geographic inventory, the consumption inventory is an important tool to help residents understand their personal global greenhouse gas impact.

15
Table 3. Sector detail with emissions estimate
Category Detail Estimated GHG (mt CO2e)
Percent of Total
Housing
Electricity 784,992 10.5%
Natural Gas 652,525 8.7%
Furniture 345,069 4.6%
Construction 281,289 3.8%
Water 204,425 2.7%
Transportation
Car Fuel 1,663,202 22.3%
Air Travel 313,997 4.2%
Car MFG 183,165 2.5%
Public Transit 17,989 0.2%
Goods & Services
Services 1,053,198 14.1%
Other Goods 508,609 6.8%
Clothing 312,361 4.2%
Food and Beverages
Meat 448,100 6.0%
Other Food 245,310 3.3%
Dairy 170,082 2.3%
Cereals 145,551 1.9%
Produce 135,738 1.8%
Total
7,465,601 100.0%
16
Appendices Contents Appendix 1: Electricity Consumption GHG Emissions ..............................................................................................................17
Overview ................................................................................................................................................................................... 17
Electricity Consumption ............................................................................................................................................................ 17
Emission Factors ........................................................................................................................................................................ 19
GHG Emissions ........................................................................................................................................................................... 20
Change Factors .......................................................................................................................................................................... 22
Appendix 2: Road Transportation GHG Emissions ...................................................................................................................26
Overview ................................................................................................................................................................................... 26
Estimating VMT by Road Type ................................................................................................................................................... 26
Fleet Breakdown and VMT by Vehicle Type .............................................................................................................................. 27
Fuel Economy Assumptions ....................................................................................................................................................... 29
CO2 Emissions ............................................................................................................................................................................ 30
N2O and CH4 Emissions .............................................................................................................................................................. 32
Summary of Results ................................................................................................................................................................... 38
Change Factors .......................................................................................................................................................................... 38
Appendix 3: Natural Gas Consumption GHG Emissions ...........................................................................................................42
Overview ................................................................................................................................................................................... 42
Natural Gas Consumption in Other Categories ......................................................................................................................... 42
Change Factors .......................................................................................................................................................................... 43
Appendix 4: University of Minnesota Southeast Steam Plant GHG Emissions .........................................................................47
Appendix 5: Rail and Barge Transportation GHG Emissions ....................................................................................................48
Rail ............................................................................................................................................................................................. 48
River .......................................................................................................................................................................................... 48
Appendix 6: Heating and Backup Power Generation GHG Emissions .......................................................................................50
Appendix 7: Waste GHG Emissions .........................................................................................................................................51
Overview ................................................................................................................................................................................... 51
Residential Waste & Recycling Estimation ................................................................................................................................ 51
Commercial Waste & Recycling Estimation ............................................................................................................................... 52
Problem Materials/Household Hazardous Waste Estimation ................................................................................................... 52
Wastewater Treatment ............................................................................................................................................................. 61
Summary of Waste GHG Emissions ........................................................................................................................................... 62
Appendix 8: Air Travel GHG Emissions ....................................................................................................................................64
Appendix 9: Consumption Inventory Methodology ................................................................................................................66
17
Appendix 1: Electricity Consumption GHG Emissions The methodology described in the sections below was used to estimate Minneapolis’ emissions from community electricity consumption for the years 2006 to 2010.
Overview Annual Minneapolis electricity consumption data and Minnesota CO2 emission factors were provided by Xcel Energy for the years 2006 to 2010. Electricity consumption data was multiplied by Xcel Energy’s CO2 emission factors and the EPA’s e-grid Minnesota emission factors for CH4 and N2O to calculate total CO2e electricity consumption emissions.
There are 4 electricity generating power plants within Minneapolis borders. Allocation steps were taken to avoid double counting of emissions between overall electricity consumption and electricity power plants located inside Minneapolis that generate local greenhouse gas emissions.
Electricity Consumption Data on annual megawatt hours (MWh) consumed within Minneapolis were provided by Xcel Energy. Electricity consumption data were divided into residential, commercial/industrial, and public sector and highway lighting use categories. Electricity consumed as part of the residential and commercial/industrial Windsource® programs was excluded from the calculation of GHG electricity emissions. This is done because Xcel Energy’s electricity emission factor excludes Windsource® electricity generation.
Windsource®: Xcel Energy’s Windsource program provides an option for customers to purchase blocks of wind power. Instead of buying traditional system supply (which contains a renewable supply but consists mainly of power from coal, oil, natural gas, and nuclear sources), a customer can purchase wind power generated in Minnesota. The wind turbines that are used for this program are treated as separate assets. They are not part of the regular system supply and they do not count toward Xcel Energy’s target under Minnesota’s renewable energy standards, nor are they reflected in Xcel Energy’s Minnesota subsidiary Northern States Power emission factor.4
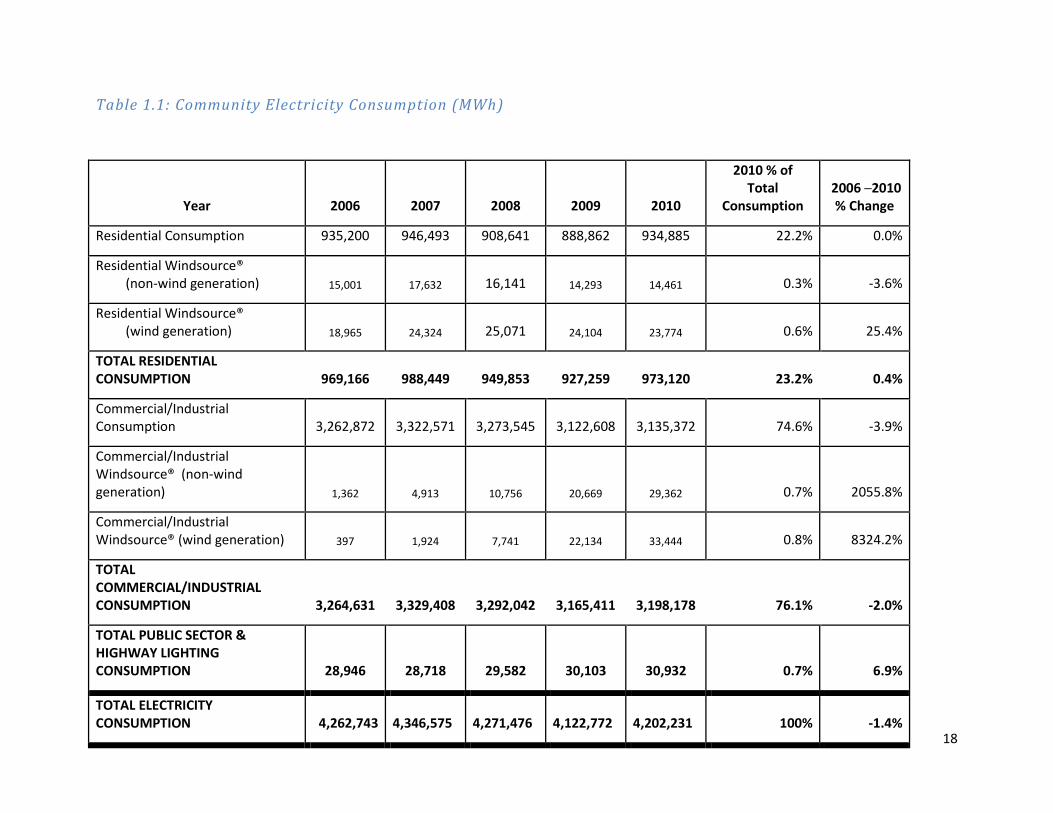
Not all of the electricity sold to Windsource® customers is provided by wind power. In table 1.1 residential and commercial/industrial Windsource® electricity is separated into the electricity provided by wind power and electricity provided by other generation sources (non-wind). Total Minneapolis electricity consumption data for 2006 to 2010 are provided in table 1.1. Over that 5 year period total electricity consumption decreased 1.4%. Minneapolis’s population also decreased 1.4% between 2006 and 2010; residential electricity consumption increased 0.4%.5
4 Source: Minneapolis Carbon Footprint Report 2000 and 2006, Appendix B-1. 5 Population data from the Metropolitan Council.
18
Table 1.1: Community Electricity Consumption (MWh)
Year 2006 2007 2008 2009 2010
2010 % of Total
Consumption 2006 ─2010
% Change
Residential Consumption 935,200 946,493 908,641 888,862 934,885 22.2% 0.0%
Residential Windsource® (non-wind generation) 15,001 17,632 16,141 14,293 14,461 0.3% -3.6%
Residential Windsource® (wind generation) 18,965 24,324 25,071 24,104 23,774 0.6% 25.4%
TOTAL RESIDENTIAL CONSUMPTION 969,166 988,449 949,853 927,259 973,120 23.2% 0.4%
Commercial/Industrial Consumption 3,262,872 3,322,571 3,273,545 3,122,608 3,135,372 74.6% -3.9%
Commercial/Industrial Windsource® (non-wind generation) 1,362 4,913 10,756 20,669 29,362 0.7% 2055.8%
Commercial/Industrial Windsource® (wind generation) 397 1,924 7,741 22,134 33,444 0.8% 8324.2%
TOTAL COMMERCIAL/INDUSTRIAL CONSUMPTION 3,264,631 3,329,408 3,292,042 3,165,411 3,198,178 76.1% -2.0%
TOTAL PUBLIC SECTOR & HIGHWAY LIGHTING CONSUMPTION 28,946 28,718 29,582 30,103 30,932 0.7% 6.9%
TOTAL ELECTRICITY CONSUMPTION 4,262,743
4,346,575
4,271,476
4,122,772
4,202,231 100% -1.4%
19
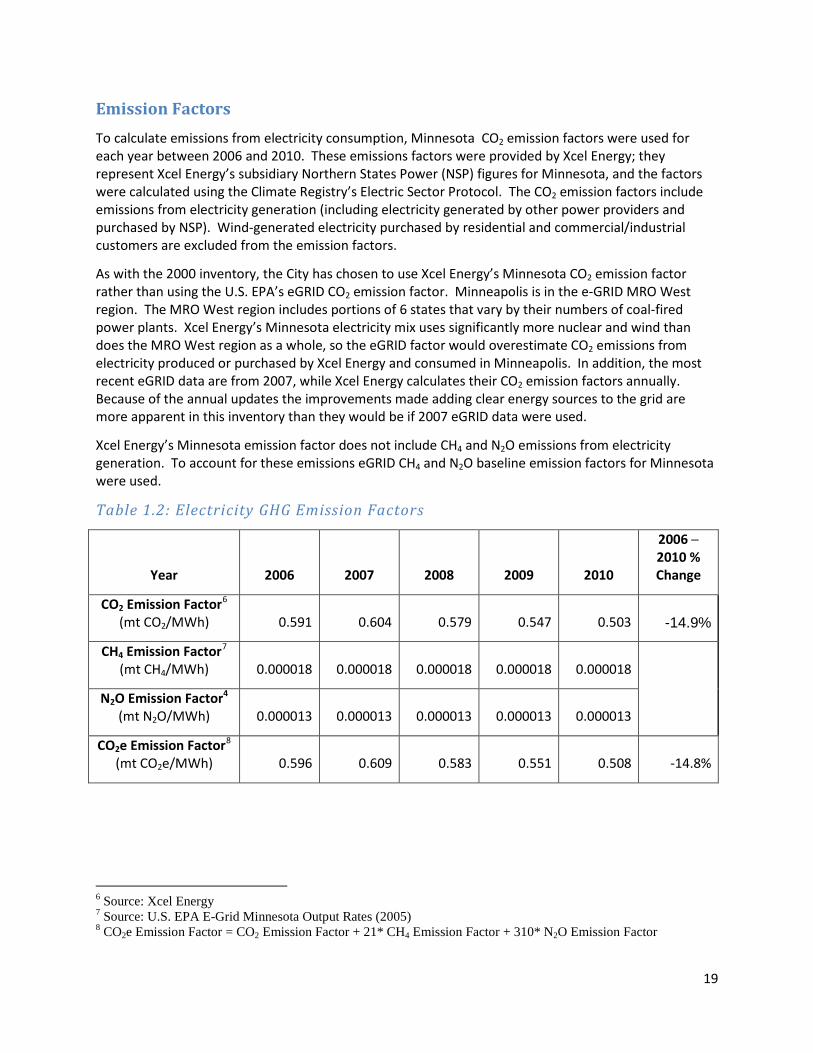
Emission Factors To calculate emissions from electricity consumption, Minnesota CO2 emission factors were used for each year between 2006 and 2010. These emissions factors were provided by Xcel Energy; they represent Xcel Energy’s subsidiary Northern States Power (NSP) figures for Minnesota, and the factors were calculated using the Climate Registry’s Electric Sector Protocol. The CO2 emission factors include emissions from electricity generation (including electricity generated by other power providers and purchased by NSP). Wind-generated electricity purchased by residential and commercial/industrial customers are excluded from the emission factors.
As with the 2000 inventory, the City has chosen to use Xcel Energy’s Minnesota CO2 emission factor rather than using the U.S. EPA’s eGRID CO2 emission factor. Minneapolis is in the e-GRID MRO West region. The MRO West region includes portions of 6 states that vary by their numbers of coal-fired power plants. Xcel Energy’s Minnesota electricity mix uses significantly more nuclear and wind than does the MRO West region as a whole, so the eGRID factor would overestimate CO2 emissions from electricity produced or purchased by Xcel Energy and consumed in Minneapolis. In addition, the most recent eGRID data are from 2007, while Xcel Energy calculates their CO2 emission factors annually. Because of the annual updates the improvements made adding clear energy sources to the grid are more apparent in this inventory than they would be if 2007 eGRID data were used.
Xcel Energy’s Minnesota emission factor does not include CH4 and N2O emissions from electricity generation. To account for these emissions eGRID CH4 and N2O baseline emission factors for Minnesota were used.
Table 1.2: Electricity GHG Emission Factors
Year 2006 2007 2008 2009 2010
2006 ─ 2010 % Change
CO2 Emission Factor6 (mt CO2/MWh)
0.591
0.604
0.579
0.547
0.503 -14.9%
CH4 Emission Factor7 (mt CH4/MWh) 0.000018 0.000018 0.000018 0.000018 0.000018
N2O Emission Factor4 (mt N2O/MWh) 0.000013 0.000013 0.000013 0.000013 0.000013
CO2e Emission Factor8 (mt CO2e/MWh) 0.596 0.609 0.583 0.551 0.508 -14.8%
6 Source: Xcel Energy 7 Source: U.S. EPA E-Grid Minnesota Output Rates (2005) 8 CO2e Emission Factor = CO2 Emission Factor + 21* CH4 Emission Factor + 310* N2O Emission Factor

20
GHG Emissions
Electricity Generating Plants within Minneapolis There are four electricity generating plants located in Minneapolis. They are:
• Xcel Energy’s Riverside Generating Station • Hennepin Energy Recovery Center • University of Minnesota’s Southeast Steam Plant • Xcel Energy’s Hennepin Island Hydro Generating Station
The electricity produced by these plants cannot be assumed to be consumed by Minneapolis residents and businesses because, except for the Southeast Steam Plant, the electricity produced at the plants is sent to Xcel’s electricity grid. To avoid double counting, GHG emissions produced at these plants from the burning of fossil fuel or other sources must be accounted for and not included in the city’s total, as they are reflected in Xcel’s regional greenhouse gas emission factor for electricity. The Southeast Steam Plant generates steam and electricity consumed at the University of Minnesota’s Minneapolis campus; since the plant’s electricity is not sold to Xcel Energy and it not reflected in Xcel Energy’s emission factor the emissions from the plant are accounted for as an individual facility (see Appendix 4).
Riverside Generating Station Xcel Energy’s Riverside Generating Station is located along the Mississippi River in Minneapolis. In 2009 the plant was converted to use natural gas fuel (it previously used coal). Community wide natural gas consumption data are provided by CenterPoint Energy. Riverside’s GHG emissions are included in the calculation of Xcel Energy’s electricity emission factor. To avoid double counting between the electricity grid emissions and the natural gas combustion emissions in Appendix 3 the natural gas consumed at Riverside was subtracted from the Minneapolis natural gas consumption data. Riverside’s natural gas combustion emissions are not included in the natural gas emissions in Appendix 3.
Hennepin Energy Recovery Center Electricity GHG Emissions The Hennepin Energy Recovery Center (HERC) is a waste-to-energy incinerator in downtown Minneapolis. HERC processes a large portion of Minneapolis waste, as well as solid waste from surrounding cities in Hennepin County. HERC produces electricity (which is sold to Xcel Energy) and steam for the downtown district energy system. Because HERC produces two products (electricity and steam) and it is located in Minneapolis, a portion of the facility’s emissions are attributable to both electricity and waste emissions.
Through discussions with City and Hennepin County staff it was decided to account for HERC GHG emissions in the waste emissions category to make the connection between waste generation and emissions clearer. Therefore, to avoid double counting emissions between waste and electricity emission categories, HERC’s emissions associated with its electricity generation are subtracted from the total electricity GHG emissions. The portion of GHG emissions from HERC that is associated with incinerating waste from Minneapolis (both commercial and residential) is accounted for in the Waste portion of the emissions inventory as detailed in Appendix 7. The remaining emissions from HERC (not associated with waste generated in Minneapolis) are accounted for in the HERC Remainder portion of the inventory detailed in Appendix 7, table 7.7. The total MWh of electricity consumption have not changed from this accounting method. Table 1.3’s ‘HERC Electricity Emissions’ column includes the HERC electricity emissions total that was subtracted from the electricity emissions totals in table 1.5.
21
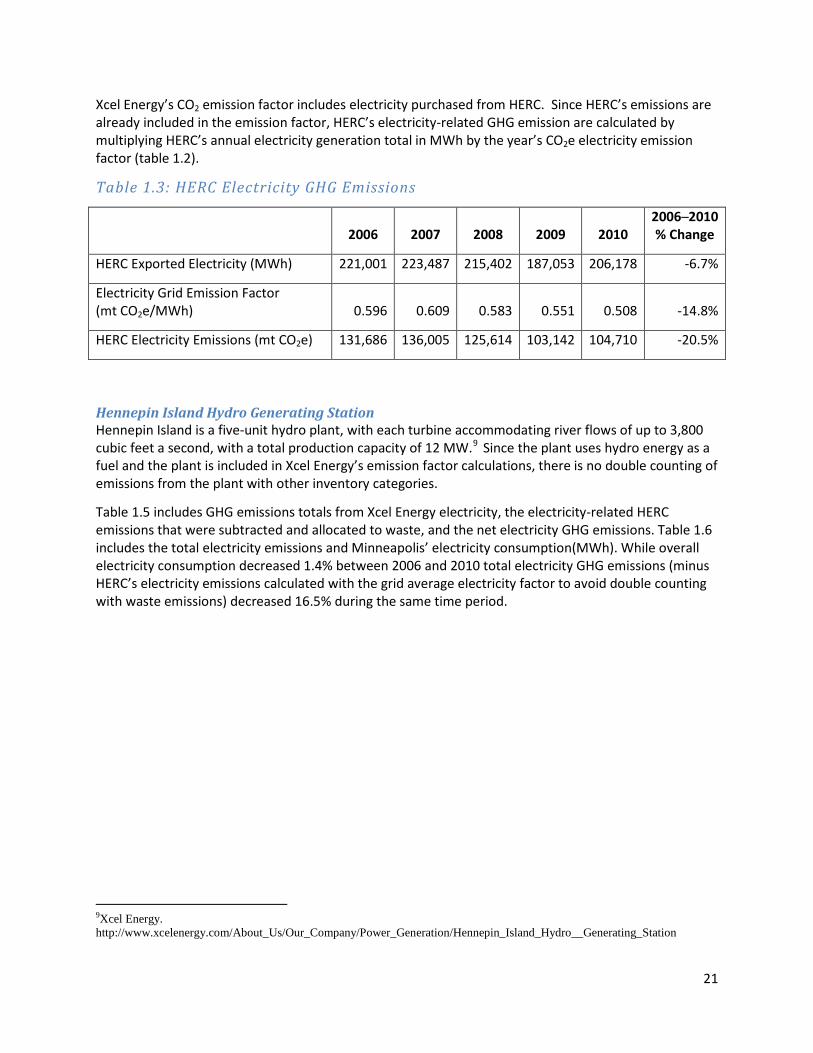
Xcel Energy’s CO2 emission factor includes electricity purchased from HERC. Since HERC’s emissions are already included in the emission factor, HERC’s electricity-related GHG emission are calculated by multiplying HERC’s annual electricity generation total in MWh by the year’s CO2e electricity emission factor (table 1.2).
Table 1.3: HERC Electricity GHG Emissions
2006 2007 2008 2009 2010 2006─2010 % Change
HERC Exported Electricity (MWh) 221,001 223,487 215,402 187,053 206,178 -6.7%
Electricity Grid Emission Factor (mt CO2e/MWh) 0.596 0.609 0.583 0.551 0.508 -14.8%
HERC Electricity Emissions (mt CO2e) 131,686 136,005 125,614 103,142 104,710 -20.5%
Hennepin Island Hydro Generating Station Hennepin Island is a five-unit hydro plant, with each turbine accommodating river flows of up to 3,800 cubic feet a second, with a total production capacity of 12 MW.9 Since the plant uses hydro energy as a fuel and the plant is included in Xcel Energy’s emission factor calculations, there is no double counting of emissions from the plant with other inventory categories.
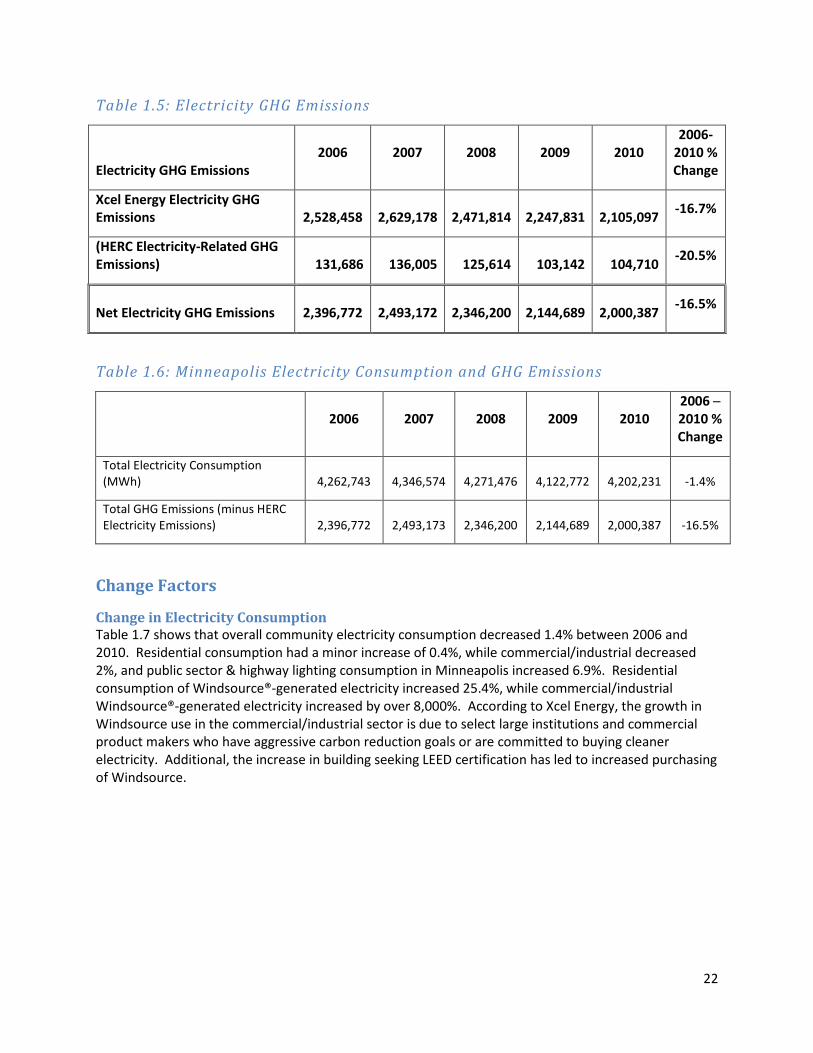
Table 1.5 includes GHG emissions totals from Xcel Energy electricity, the electricity-related HERC emissions that were subtracted and allocated to waste, and the net electricity GHG emissions. Table 1.6 includes the total electricity emissions and Minneapolis’ electricity consumption(MWh). While overall electricity consumption decreased 1.4% between 2006 and 2010 total electricity GHG emissions (minus HERC’s electricity emissions calculated with the grid average electricity factor to avoid double counting with waste emissions) decreased 16.5% during the same time period.
9Xcel Energy. http://www.xcelenergy.com/About_Us/Our_Company/Power_Generation/Hennepin_Island_Hydro__Generating_Station
22
Table 1.5: Electricity GHG Emissions
Electricity GHG Emissions 2006 2007 2008 2009 2010
2006-2010 % Change
Xcel Energy Electricity GHG Emissions
2,528,458
2,629,178
2,471,814
2,247,831
2,105,097 -16.7%
(HERC Electricity-Related GHG Emissions) 131,686 136,005 125,614 103,142 104,710 -20.5%
Net Electricity GHG Emissions
2,396,772
2,493,172
2,346,200
2,144,689
2,000,387 -16.5%
Table 1.6: Minneapolis Electricity Consumption and GHG Emissions
2006 2007 2008 2009 2010 2006 ─ 2010 % Change
Total Electricity Consumption (MWh) 4,262,743 4,346,574 4,271,476 4,122,772 4,202,231 -1.4%
Total GHG Emissions (minus HERC Electricity Emissions) 2,396,772 2,493,173 2,346,200 2,144,689 2,000,387 -16.5%
Change Factors
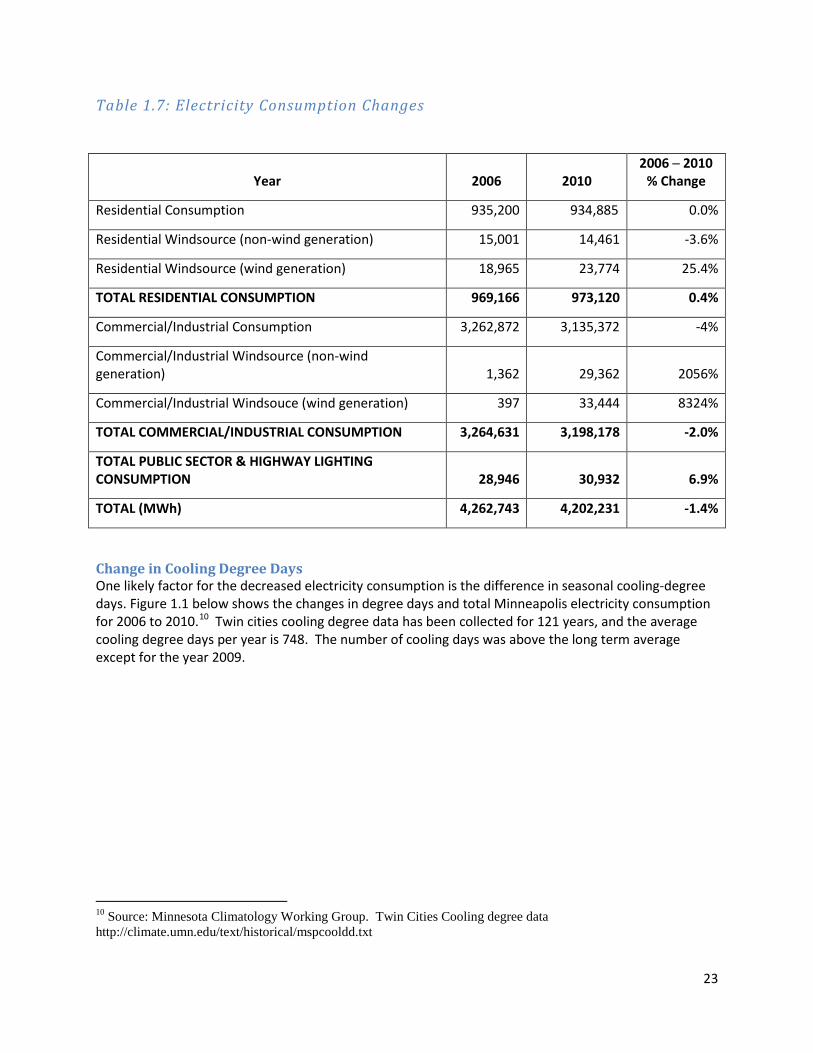
Change in Electricity Consumption Table 1.7 shows that overall community electricity consumption decreased 1.4% between 2006 and 2010. Residential consumption had a minor increase of 0.4%, while commercial/industrial decreased 2%, and public sector & highway lighting consumption in Minneapolis increased 6.9%. Residential consumption of Windsource®-generated electricity increased 25.4%, while commercial/industrial Windsource®-generated electricity increased by over 8,000%. According to Xcel Energy, the growth in Windsource use in the commercial/industrial sector is due to select large institutions and commercial product makers who have aggressive carbon reduction goals or are committed to buying cleaner electricity. Additional, the increase in building seeking LEED certification has led to increased purchasing of Windsource.
23
Table 1.7: Electricity Consumption Changes
Year 2006 2010 2006 ─ 2010
% Change
Residential Consumption 935,200 934,885 0.0%
Residential Windsource (non-wind generation) 15,001 14,461 -3.6%
Residential Windsource (wind generation) 18,965 23,774 25.4%
TOTAL RESIDENTIAL CONSUMPTION 969,166 973,120 0.4%
Commercial/Industrial Consumption 3,262,872 3,135,372 -4%
Commercial/Industrial Windsource (non-wind generation) 1,362 29,362 2056%
Commercial/Industrial Windsouce (wind generation) 397 33,444 8324%
TOTAL COMMERCIAL/INDUSTRIAL CONSUMPTION 3,264,631 3,198,178 -2.0%
TOTAL PUBLIC SECTOR & HIGHWAY LIGHTING CONSUMPTION 28,946 30,932 6.9%
TOTAL (MWh) 4,262,743 4,202,231 -1.4%
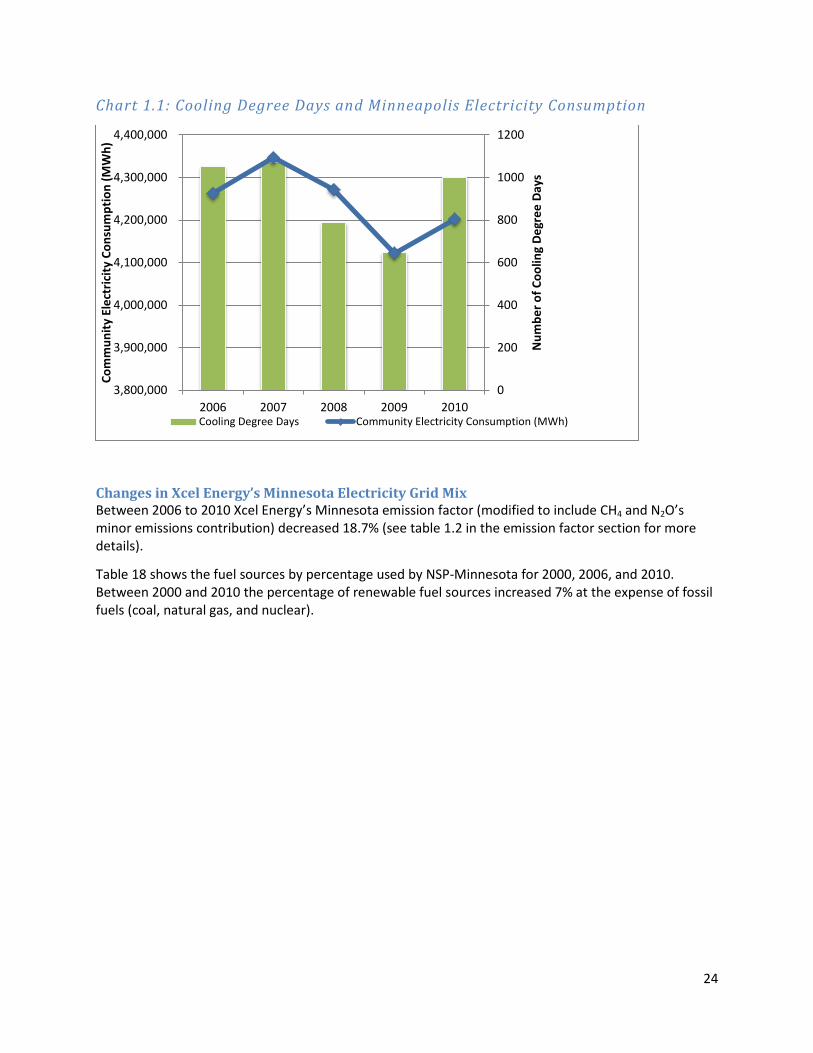
Change in Cooling Degree Days One likely factor for the decreased electricity consumption is the difference in seasonal cooling-degree days. Figure 1.1 below shows the changes in degree days and total Minneapolis electricity consumption for 2006 to 2010.10 Twin cities cooling degree data has been collected for 121 years, and the average cooling degree days per year is 748. The number of cooling days was above the long term average except for the year 2009.
10 Source: Minnesota Climatology Working Group. Twin Cities Cooling degree data http://climate.umn.edu/text/historical/mspcooldd.txt
24
Chart 1.1: Cooling Degree Days and Minneapolis Electricity Consumption
Changes in Xcel Energy’s Minnesota Electricity Grid Mix Between 2006 to 2010 Xcel Energy’s Minnesota emission factor (modified to include CH4 and N2O’s minor emissions contribution) decreased 18.7% (see table 1.2 in the emission factor section for more details).
Table 18 shows the fuel sources by percentage used by NSP-Minnesota for 2000, 2006, and 2010. Between 2000 and 2010 the percentage of renewable fuel sources increased 7% at the expense of fossil fuels (coal, natural gas, and nuclear).
0
200
400
600
800
1000
1200
3,800,000
3,900,000
4,000,000
4,100,000
4,200,000
4,300,000
4,400,000
2006 2007 2008 2009 2010
Num
ber o
f Coo
ling
Degr
ee D
ays
Com
mun
ity E
lect
ricity
Con
sum
ptio
n (M
Wh)
Cooling Degree Days Community Electricity Consumption (MWh)

25
Table 1.8: Northern States Power Minnesota Fuel Sources
Updated 1/15/12
NSP Minnesota Fuel Source (1) 2000 2006 2010 2000 ─ 2010 %
Change
Coal 46% 38.1% 43% (3%)
Natural gas 11% 21.6% 8% (3%)
Nuclear 31% 27.1% 30% (1%)
Oil 0.2%
Renewable and other: 12% 13.0% 19%
7%
Hydro 6.2% 7% 0.8%
Wind (2) 4.6% 8% 3.4%
Biomass 3.2% 3% (0.2%)
Other 1%
Total 100% 100.0% 100%
Notes:
1
Years 2000 and 2006 Source: Xcel Energy, Karen Utt, J.D., Senior Environmental Analyst
Year 2010 Source: Xcel Energy, NSP (Minnesota and Wisconsin) Supply Mix http://www.xcelenergy.com/About_Us/Our_Company/Power_Generation/Power_Generation_Fuel_Mix_-_NSP
2 Does not include Windsource power
If Xcel Energy’s Minnesota emission factor would have remained constant from 2006, Minneapolis’s total electricity emissions would have increased 23.5%, or 469,458 metric tons CO2e.
26
Appendix 2: Road Transportation GHG Emissions The methodology described in the sections below was used to estimate Minneapolis’ overall on-road GHG emissions for the years 2006 to 2010.
Overview Annual estimates of the total vehicle miles traveled (VMT) on roadways within Minneapolis’s borders are available from the Minnesota Department of Transportation (MnDOT). Annual VMT was combined with ICLEI’s Clean Air and Climate Protection (CACP) software assumptions on vehicle fleet composition, the Energy Information Administration’s estimates of U.S. average fleet vehicle efficiency, and GHG emission factors to calculate total on-road GHG emissions. Minnesota’s 10% ethanol blend and the biodiesel blend (2% before May 2009 and 5% after) were factored in to calculate fossil and biogenic on-road CO2 emissions separately. CH4 and N2O emissions were calculated using annual VMT by vehicle type and ICLEI’s CACP emission factors.
In addition, upstream life cycle emissions (well-to-pump) for gasoline, diesel, ethanol, and biodiesel were estimated. Upstream emissions are not included in the overall total of on-road transportation GHG emission results.
The calculation steps and results are provided in greater detail in the sections below.
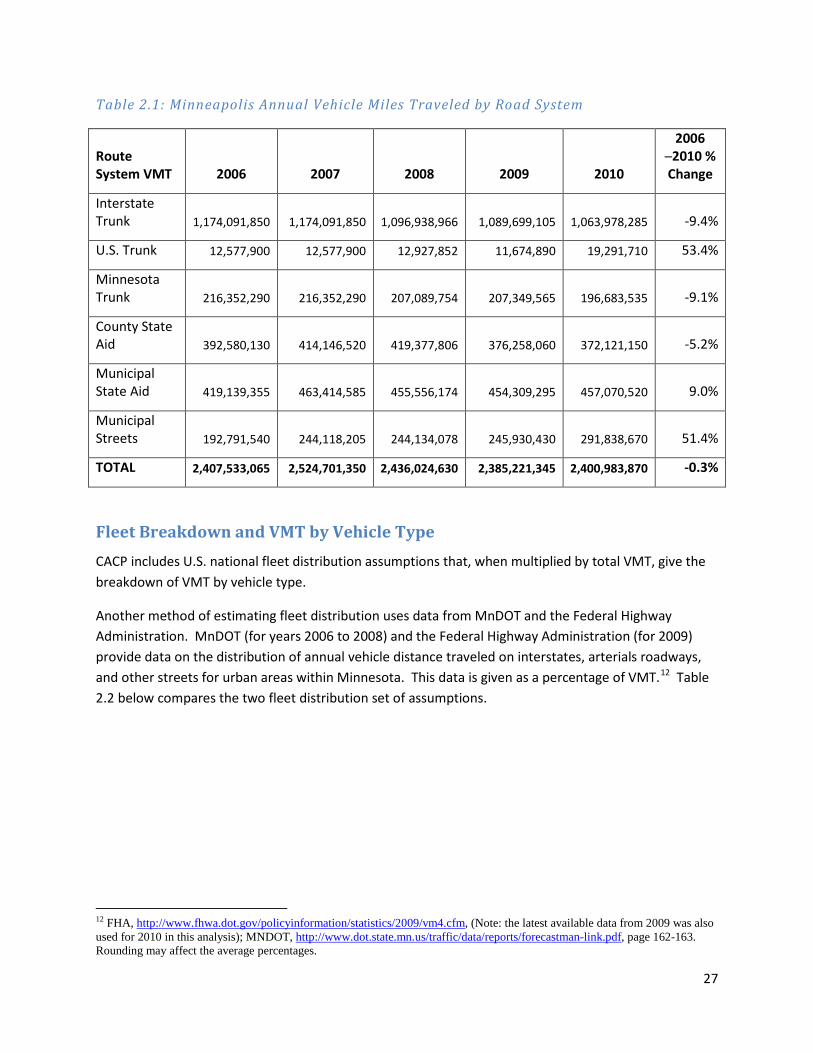
Estimating VMT by Road Type Data on total VMT within Minneapolis boundaries were obtained from the MnDOT’s website from travel on each of 6 categories of roadways: interstate trunk, U.S. trunk, Minnesota trunk, county-state aid roadways, municipal-state aid roadways, and municipal streets.11 The VMT for each study year is shown in table 2.1 below. Overall VMT decreased slightly (-0.3%) between 2006 and 2010.
11 Minnesota Department of Transportation. Roadway Data. http://www.dot.state.mn.us/roadway/data/reports/vmt.html, accessed December 3, 2011.
27
Table 2.1: Minneapolis Annual Vehicle Miles Traveled by Road System
Route System VMT 2006 2007 2008 2009 2010
2006 ─2010 % Change
Interstate Trunk 1,174,091,850 1,174,091,850 1,096,938,966 1,089,699,105 1,063,978,285 -9.4%
U.S. Trunk 12,577,900 12,577,900 12,927,852 11,674,890 19,291,710 53.4%
Minnesota Trunk 216,352,290 216,352,290 207,089,754 207,349,565 196,683,535 -9.1%
County State Aid 392,580,130 414,146,520 419,377,806 376,258,060 372,121,150 -5.2%
Municipal State Aid 419,139,355 463,414,585 455,556,174 454,309,295 457,070,520 9.0%
Municipal Streets 192,791,540 244,118,205 244,134,078 245,930,430 291,838,670 51.4%
TOTAL 2,407,533,065 2,524,701,350 2,436,024,630 2,385,221,345 2,400,983,870 -0.3%
Fleet Breakdown and VMT by Vehicle Type CACP includes U.S. national fleet distribution assumptions that, when multiplied by total VMT, give the breakdown of VMT by vehicle type.
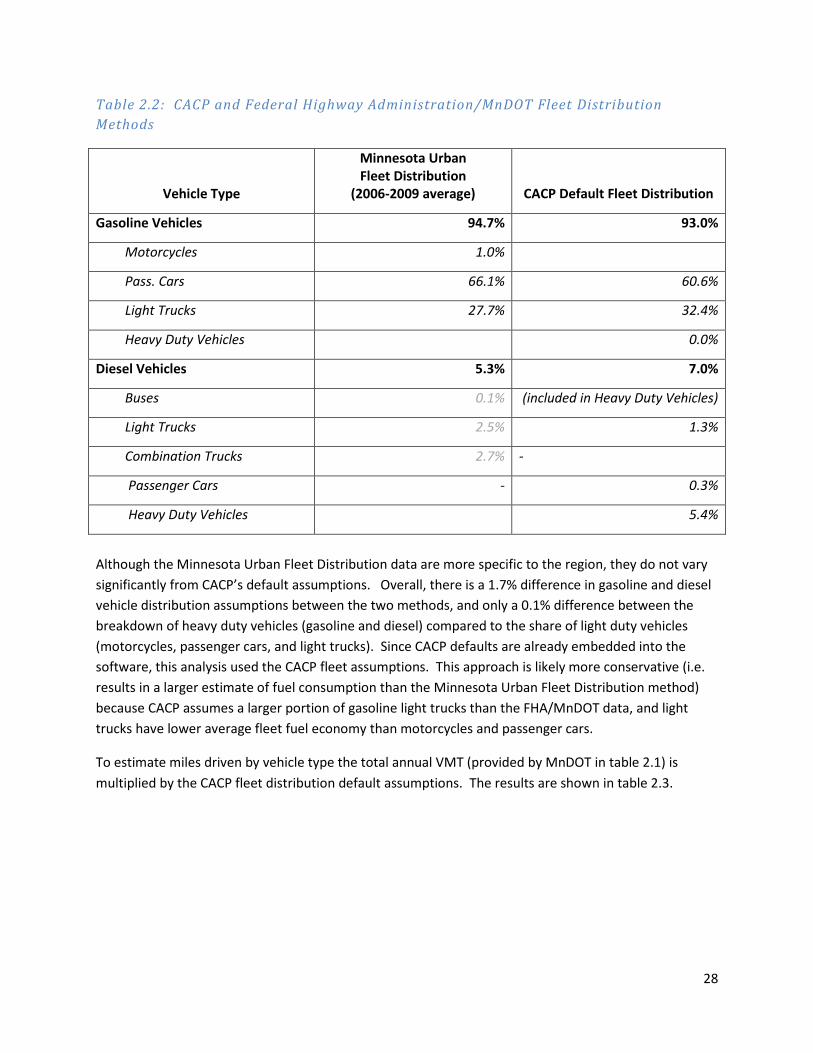
Another method of estimating fleet distribution uses data from MnDOT and the Federal Highway Administration. MnDOT (for years 2006 to 2008) and the Federal Highway Administration (for 2009) provide data on the distribution of annual vehicle distance traveled on interstates, arterials roadways, and other streets for urban areas within Minnesota. This data is given as a percentage of VMT.12 Table 2.2 below compares the two fleet distribution set of assumptions.
12 FHA, http://www.fhwa.dot.gov/policyinformation/statistics/2009/vm4.cfm, (Note: the latest available data from 2009 was also used for 2010 in this analysis); MNDOT, http://www.dot.state.mn.us/traffic/data/reports/forecastman-link.pdf, page 162-163. Rounding may affect the average percentages.
28
Table 2.2: CACP and Federal Highway Administration/MnDOT Fleet Distribution Methods
Vehicle Type
Minnesota Urban Fleet Distribution
(2006-2009 average) CACP Default Fleet Distribution
Gasoline Vehicles 94.7% 93.0%
Motorcycles 1.0%
Pass. Cars 66.1% 60.6%
Light Trucks 27.7% 32.4%
Heavy Duty Vehicles 0.0%
Diesel Vehicles 5.3% 7.0%
Buses 0.1% (included in Heavy Duty Vehicles)
Light Trucks 2.5% 1.3%
Combination Trucks 2.7% -
Passenger Cars - 0.3%
Heavy Duty Vehicles 5.4%
Although the Minnesota Urban Fleet Distribution data are more specific to the region, they do not vary significantly from CACP’s default assumptions. Overall, there is a 1.7% difference in gasoline and diesel vehicle distribution assumptions between the two methods, and only a 0.1% difference between the breakdown of heavy duty vehicles (gasoline and diesel) compared to the share of light duty vehicles (motorcycles, passenger cars, and light trucks). Since CACP defaults are already embedded into the software, this analysis used the CACP fleet assumptions. This approach is likely more conservative (i.e. results in a larger estimate of fuel consumption than the Minnesota Urban Fleet Distribution method) because CACP assumes a larger portion of gasoline light trucks than the FHA/MnDOT data, and light trucks have lower average fleet fuel economy than motorcycles and passenger cars.
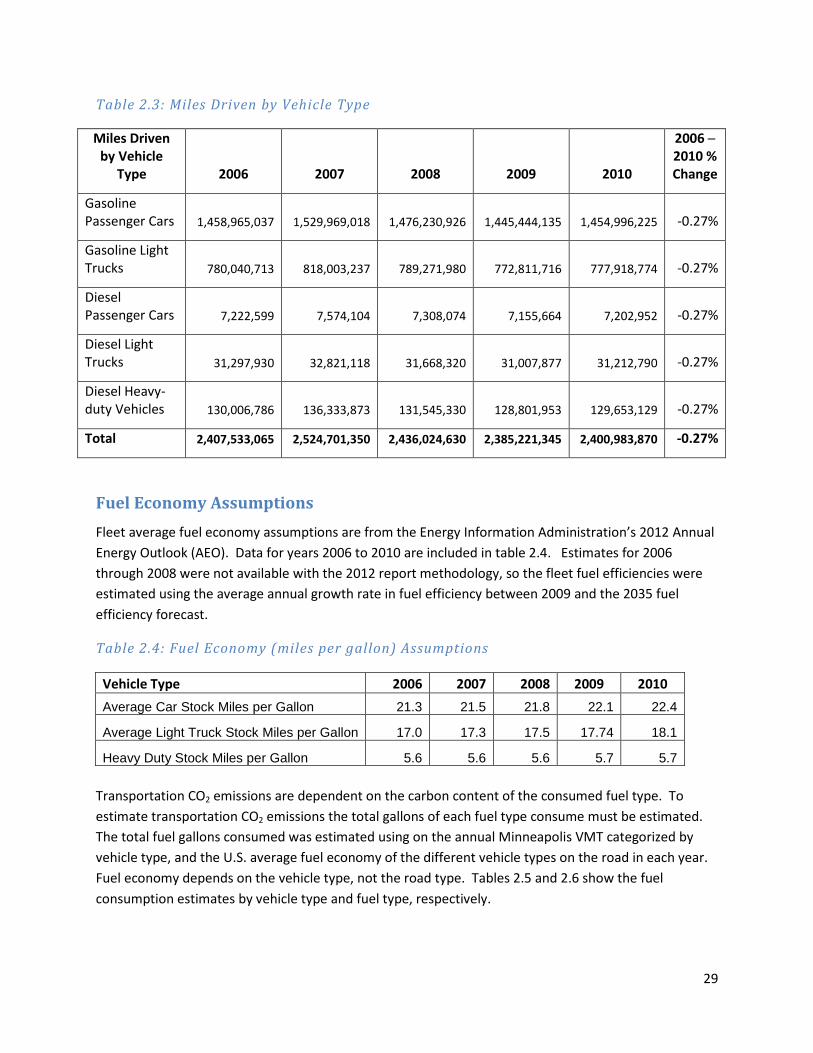
To estimate miles driven by vehicle type the total annual VMT (provided by MnDOT in table 2.1) is multiplied by the CACP fleet distribution default assumptions. The results are shown in table 2.3.
29
Table 2.3: Miles Driven by Vehicle Type
Miles Driven by Vehicle
Type 2006 2007 2008 2009 2010
2006 ─ 2010 % Change
Gasoline Passenger Cars 1,458,965,037 1,529,969,018 1,476,230,926 1,445,444,135 1,454,996,225 -0.27%
Gasoline Light Trucks 780,040,713 818,003,237 789,271,980 772,811,716 777,918,774 -0.27%
Diesel Passenger Cars 7,222,599 7,574,104 7,308,074 7,155,664 7,202,952 -0.27%
Diesel Light Trucks 31,297,930 32,821,118 31,668,320 31,007,877 31,212,790 -0.27%
Diesel Heavy-duty Vehicles 130,006,786 136,333,873 131,545,330 128,801,953 129,653,129 -0.27%
Total 2,407,533,065 2,524,701,350 2,436,024,630 2,385,221,345 2,400,983,870 -0.27%
Fuel Economy Assumptions Fleet average fuel economy assumptions are from the Energy Information Administration’s 2012 Annual Energy Outlook (AEO). Data for years 2006 to 2010 are included in table 2.4. Estimates for 2006 through 2008 were not available with the 2012 report methodology, so the fleet fuel efficiencies were estimated using the average annual growth rate in fuel efficiency between 2009 and the 2035 fuel efficiency forecast.
Table 2.4: Fuel Economy (miles per gallon) Assumptions
Vehicle Type 2006 2007 2008 2009 2010 Average Car Stock Miles per Gallon 21.3 21.5 21.8 22.1 22.4
Average Light Truck Stock Miles per Gallon 17.0 17.3 17.5 17.74 18.1
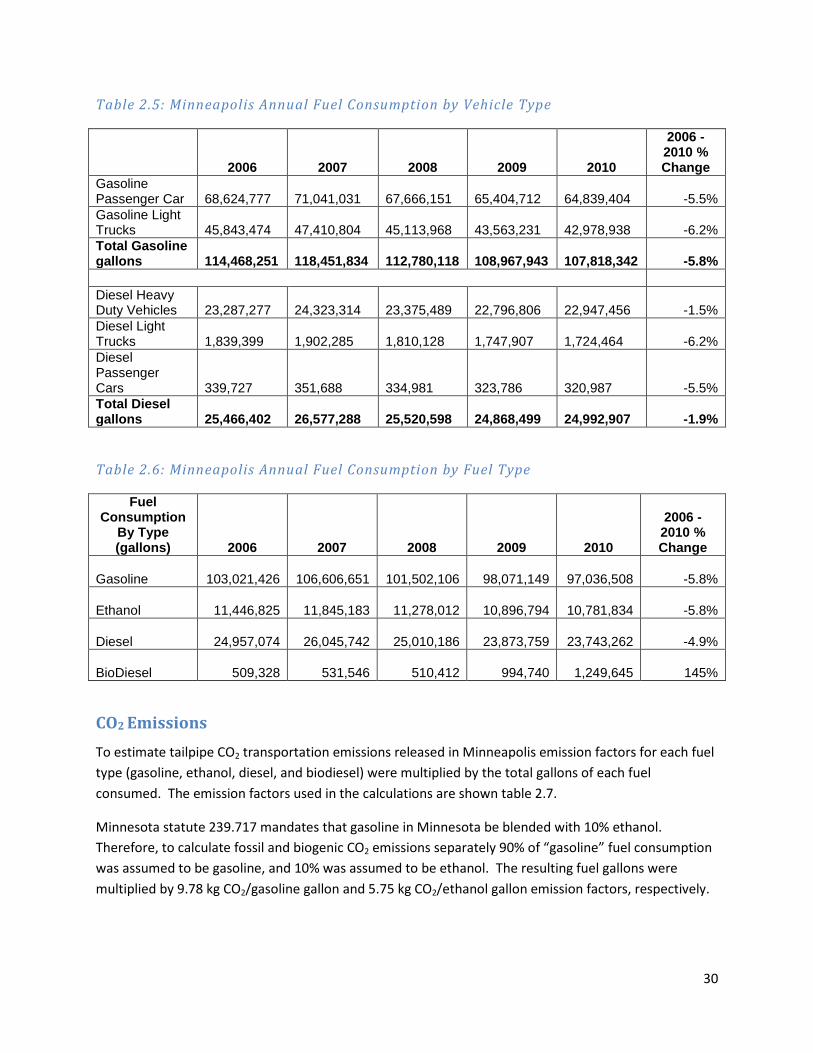
Heavy Duty Stock Miles per Gallon 5.6 5.6 5.6 5.7 5.7 Transportation CO2 emissions are dependent on the carbon content of the consumed fuel type. To estimate transportation CO2 emissions the total gallons of each fuel type consume must be estimated. The total fuel gallons consumed was estimated using on the annual Minneapolis VMT categorized by vehicle type, and the U.S. average fuel economy of the different vehicle types on the road in each year. Fuel economy depends on the vehicle type, not the road type. Tables 2.5 and 2.6 show the fuel consumption estimates by vehicle type and fuel type, respectively.
30
Table 2.5: Minneapolis Annual Fuel Consumption by Vehicle Type
2006 2007 2008 2009 2010
2006 - 2010 % Change
Gasoline Passenger Car
68,624,777
71,041,031
67,666,151
65,404,712
64,839,404 -5.5%
Gasoline Light Trucks
45,843,474
47,410,804
45,113,968
43,563,231
42,978,938 -6.2%
Total Gasoline gallons
114,468,251
118,451,834
112,780,118
108,967,943
107,818,342 -5.8%
Diesel Heavy Duty Vehicles
23,287,277
24,323,314
23,375,489
22,796,806
22,947,456 -1.5%
Diesel Light Trucks
1,839,399
1,902,285
1,810,128
1,747,907
1,724,464 -6.2%
Diesel Passenger Cars
339,727
351,688
334,981
323,786
320,987 -5.5%
Total Diesel gallons
25,466,402
26,577,288
25,520,598
24,868,499
24,992,907 -1.9%
Table 2.6: Minneapolis Annual Fuel Consumption by Fuel Type
Fuel Consumption
By Type (gallons) 2006 2007 2008 2009 2010
2006 - 2010 % Change
Gasoline
103,021,426
106,606,651
101,502,106
98,071,149
97,036,508 -5.8%
Ethanol
11,446,825
11,845,183
11,278,012
10,896,794
10,781,834 -5.8%
Diesel
24,957,074
26,045,742
25,010,186
23,873,759
23,743,262 -4.9%
BioDiesel 509,328 531,546 510,412
994,740
1,249,645 145%
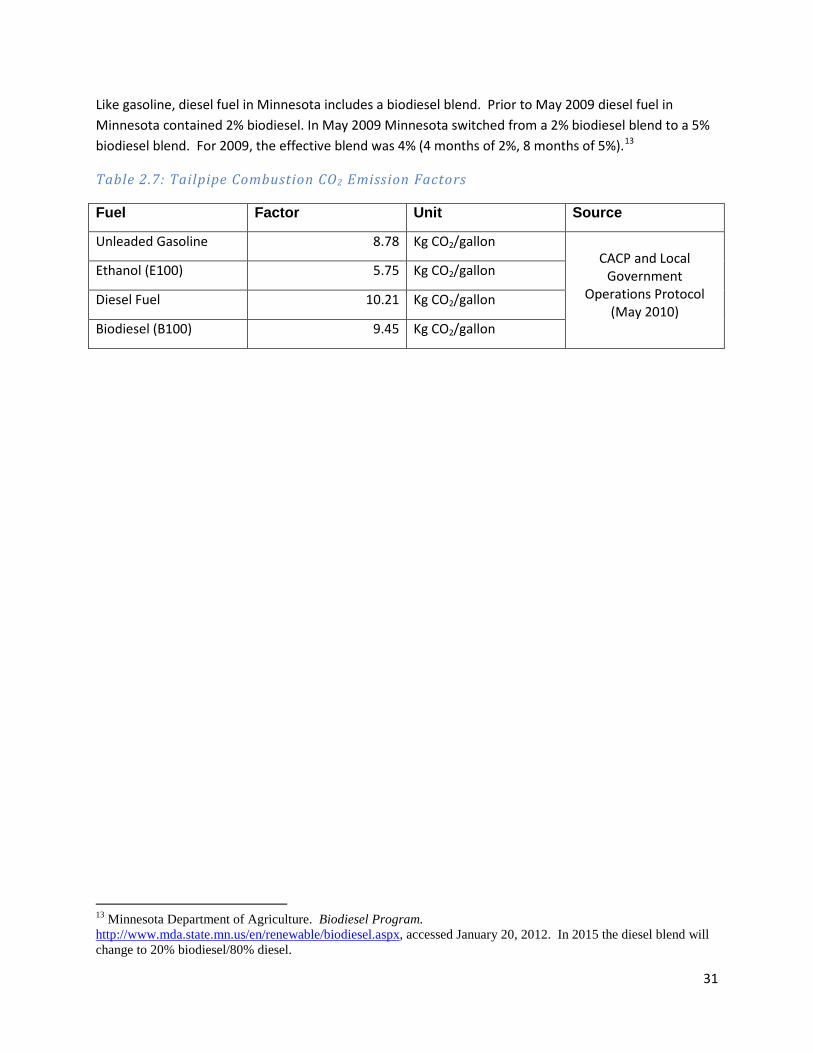
CO2 Emissions To estimate tailpipe CO2 transportation emissions released in Minneapolis emission factors for each fuel type (gasoline, ethanol, diesel, and biodiesel) were multiplied by the total gallons of each fuel consumed. The emission factors used in the calculations are shown table 2.7.
Minnesota statute 239.717 mandates that gasoline in Minnesota be blended with 10% ethanol. Therefore, to calculate fossil and biogenic CO2 emissions separately 90% of “gasoline” fuel consumption was assumed to be gasoline, and 10% was assumed to be ethanol. The resulting fuel gallons were multiplied by 9.78 kg CO2/gasoline gallon and 5.75 kg CO2/ethanol gallon emission factors, respectively.
31
Like gasoline, diesel fuel in Minnesota includes a biodiesel blend. Prior to May 2009 diesel fuel in Minnesota contained 2% biodiesel. In May 2009 Minnesota switched from a 2% biodiesel blend to a 5% biodiesel blend. For 2009, the effective blend was 4% (4 months of 2%, 8 months of 5%).13
Table 2.7: Tailpipe Combustion CO2 Emission Factors
Fuel Factor Unit Source
Unleaded Gasoline 8.78 Kg CO2/gallon CACP and Local
Government Operations Protocol
(May 2010)
Ethanol (E100) 5.75 Kg CO2/gallon
Diesel Fuel 10.21 Kg CO2/gallon
Biodiesel (B100) 9.45 Kg CO2/gallon
13 Minnesota Department of Agriculture. Biodiesel Program. http://www.mda.state.mn.us/en/renewable/biodiesel.aspx, accessed January 20, 2012. In 2015 the diesel blend will change to 20% biodiesel/80% diesel.

32
Table 2.8: On-Road Tailpipe CO2 Emissions
Fossil CO2 Emissions 2006 2007 2008 2009 2010 2006 - 2010 % Change
Gasoline Passenger Cars
542,273
561,366
534,698
516,828
512,361 -5.5%
Gasoline Light Trucks
362,255
374,640
356,491
344,237
339,620 -6.2% Total Gasoline Emissions
904,528
936,006
891,188
861,065
851,981 -5.8%
Diesel Heavy Duty Vehicles
233,008
243,374
233,890
223,445
222,579 -4.5%
Diesel Light Trucks
18,405
19,034
18,112
17,132
16,726 -9.1%
Diesel Passenger Cars
3,399
3,519
3,352
3,174
3,113 -8.4% Total Diesel Emissions
254,812
265,927
255,354
243,751
242,419 -4.9%
Total Emissions (mt CO2e)
1,159,340
1,201,933
1,146,542
1,104,816
1,094,399 -5.6%
Biogenic CO2 Emissions 2006 2007 2008 2009 2010 2006 - 2010 %
Change Gasoline Passenger Cars (ethanol)
39,459
40,849
38,908
37,608
37,283 -5.5%
Gasoline Light Trucks (ethanol)
26,360
27,261
25,941
25,049
24,713 -6.2%
Diesel Heavy Duty Vehicles (biodiesel)
4,401
4,597
4,418
8,617
10,843 146.4%
Diesel Light Trucks (biodiesel)
348
360
342
661
815 134.4%
Diesel Passenger Cars (biodiesel)
64
66
63
122
152 136.2%
Total Emissions (mt CO2e)
70,632
73,133
69,672
72,057
73,805 4.5%
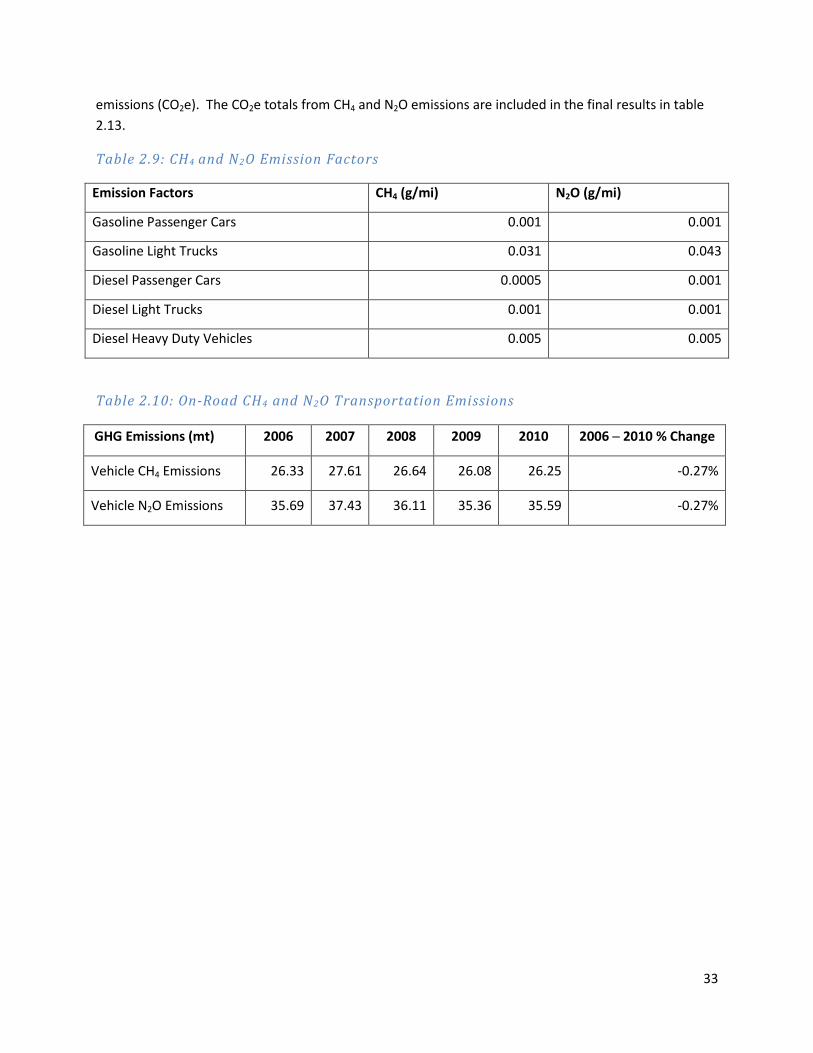
N2O and CH4 Emissions N2O and CH4 emissions are determined by the vehicle’s combustion technology and are calculated using data on the distance traveled instead of the amount of fuel consumed. CACP provides N20 and CH4 emission factors in units of grams/mile by vehicle type (see table 2.9for these emission factors). While other inventory protocols for corporate GHG inventories include emission factors that show reductions in these emission sources in newer model years, CACP assumes these emission factors are constant. These factors were multiplied by the VMT by vehicle type in table 2.3 to calculate total tailpipe N2O and CH4 emissions from vehicles traveling in Minneapolis.
The tailpipe CH4 and N2O emissions in table 2.10 were multiplied by the Global Warming Potential (GWP) factors of 21 and 310, respectively, to convert them into metric tons of carbon dioxide equivalent
33
emissions (CO2e). The CO2e totals from CH4 and N2O emissions are included in the final results in table 2.13.
Table 2.9: CH4 and N2O Emission Factors
Emission Factors CH4 (g/mi) N2O (g/mi)
Gasoline Passenger Cars 0.001 0.001
Gasoline Light Trucks 0.031 0.043
Diesel Passenger Cars 0.0005 0.001
Diesel Light Trucks 0.001 0.001
Diesel Heavy Duty Vehicles 0.005 0.005
Table 2.10: On-Road CH4 and N2O Transportation Emissions
GHG Emissions (mt) 2006 2007 2008 2009 2010 2006 ─ 2010 % Change
Vehicle CH4 Emissions 26.33 27.61 26.64 26.08 26.25 -0.27%
Vehicle N2O Emissions 35.69 37.43 36.11 35.36 35.59 -0.27%

34
Box 2.1: Upstream (Well-to-Pump) Transportation Fuel Emissions
In addition to combustion emissions, GHGs are released from extracting, refining, and further processing transportation fuels. These emissions are not included in the on-road transportation emissions total in table 2.13. Including the life cycle emissions from energy sources like transportation fuels, natural gas, and electricity is relatively new in corporate and community GHG inventories. However, it is a growing practice, and ICLEI’s draft community protocol framework (January 20th, 2011) encourages communities to account for these emissions.
Looking at the full life cycle emissions of energy sources allows decision makers to better make comparisons of the emissions differences between fuels. For example, as part of the National Renewable Fuel Standard program, the U.S. EPA analyzed the life cycle GHG emissions from increased use of renewable fuels. The EPA’s analysis of the full fuel life cycle GHG emissions, including feedstock generation and extraction, distribution, delivery and use of the finished fuel, showed significant differences between baseline gasoline and diesel fuels compared to alternative renewable fuels.14
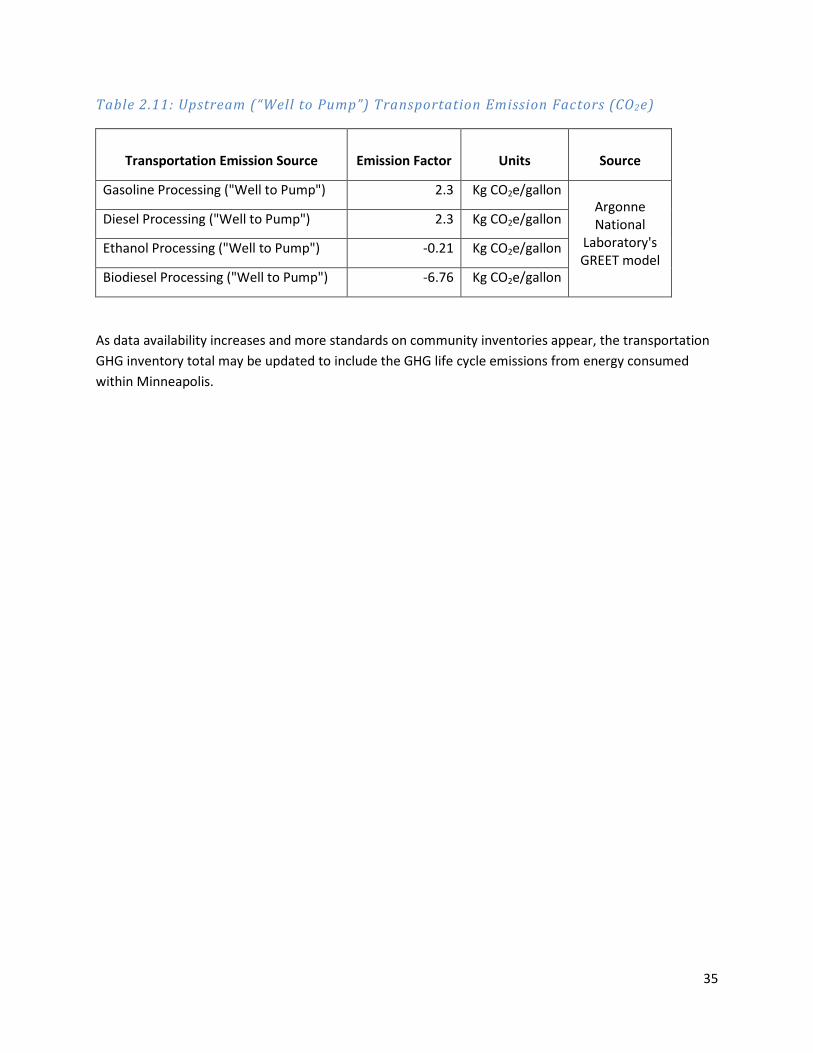
Upstream (“well to pump”) life cycle GHG emissions from gasoline and diesel consumed in Minneapolis were estimated using emission factors from the U.S. Argonne National Laboratory’s GREET model.
When corn and other bioenergy crops are growing, they sequester carbon dioxide from the atmosphere through photosynthesis; they act as a GHG emissions “sink” during this phase. In the processing of harvesting, refining, and distributing the biofuels fossil GHG emissions are released due to energy used in these processes (e.g. emissions from fertilizer application and fuel used in farm equipment). In the upstream ethanol and biodiesel emission factors from the GREET model the sequestered CO2 is added to the released fossil GHG emissions to calculate a net GHG emission factor. In the GREET model sequestered CO2 from the biofuel crops is greater than the total GHG emissions released during the upstream processing, resulting in a net negative upstream processing emission factor for ethanol and biodiesel (see table 2.11).
14 U.S. EPA (May 2009). EPA Lifecycle Analysis of Greenhouse Gas Emissions from Renewable Fuels. Accessed at http://www.epa.gov/otaq/renewablefuels/420f09024.htm
35
Table 2.11: Upstream (“Well to Pump”) Transportation Emission Factors (CO2e)
Transportation Emission Source Emission Factor Units Source
Gasoline Processing ("Well to Pump") 2.3 Kg CO2e/gallon Argonne National
Laboratory's GREET model
Diesel Processing ("Well to Pump") 2.3 Kg CO2e/gallon
Ethanol Processing ("Well to Pump") -0.21 Kg CO2e/gallon
Biodiesel Processing ("Well to Pump") -6.76 Kg CO2e/gallon
As data availability increases and more standards on community inventories appear, the transportation GHG inventory total may be updated to include the GHG life cycle emissions from energy consumed within Minneapolis.
36
Box 2.2: Alternative Demand Method for Estimating VMT
The Minneapolis VMT data used in the inventory calculations measures the distance traveled on roadways within Minneapolis’s borders. This is the method used by most community GHG inventories and is sometimes referred to as the “polygon” method. However, many suburban residents commute to and from Minneapolis for employment, shopping and entertainment. Likewise, many Minneapolis residents commute from the city to jobs or destinations outside the city. The polygon method fails to capture the full impact of these trips and does not reflect the regional nature of transportation networks.
Another way to assign emissions from VMT is by the origin and destination cities of trips. The Metropolitan Council provided VMT data for 2009 and 2010 organized by trips starting in Minneapolis and ending elsewhere, trips starting elsewhere and ending in Minneapolis, and trips starting and ending in Minneapolis. The “demand” method assigns a city half the distance of trips that have an origin or destination (but not both) in that city and all of the distance of trips originating and ending in that city. This method more accurately accounts for regional transportation travel. To date, the Denver County and King County are the only community greenhouse gas inventories to use this method.
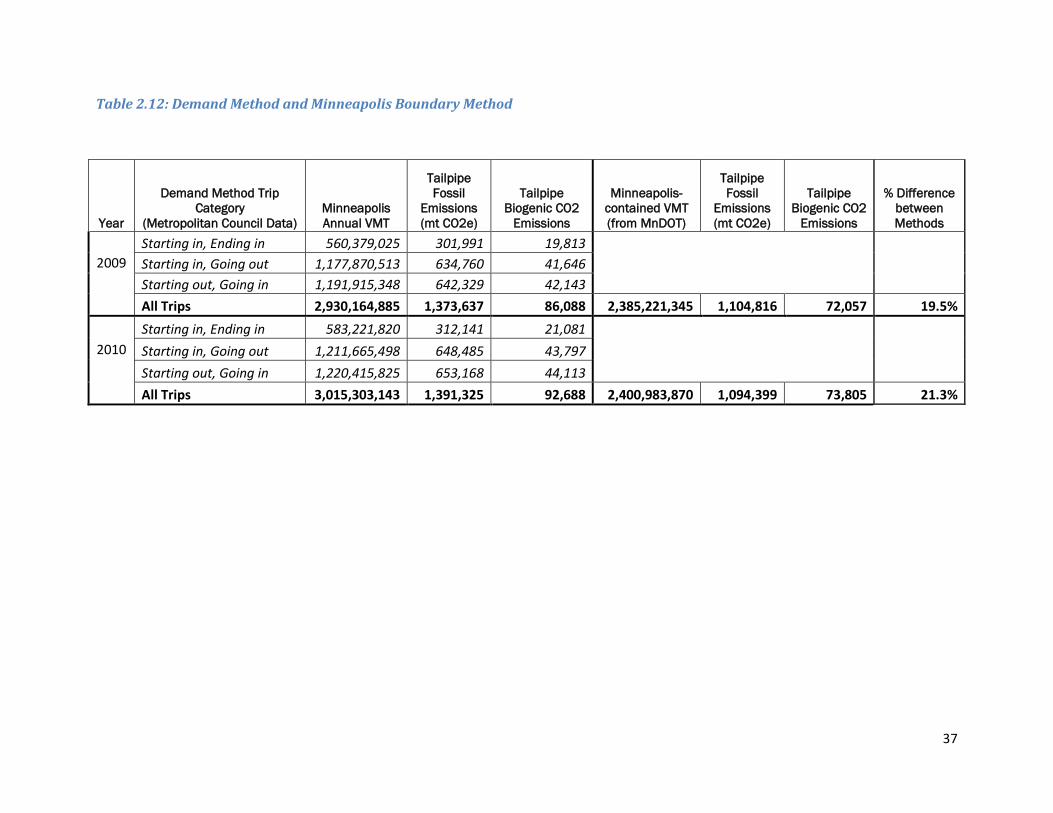
GHG emissions from the demand method VMT were estimated using the same assumptions on fleet distribution, fuel economy, and emission factors from CACP. The fossil and biogenic emissions of both the demand method and the Minneapolis boundary method were compared to see how including trips that start or end in Minneapolis and another community impacted overall on-road GHG emissions. The comparison results are in table 2.12 below. Overall, the demand method results yield a 19.5% increase in GHG emissions in 2009, and a 21.3% increase in 2010.
Since the demand method VMT data were available for only 2009 and 2010 at the time of completing this inventory, and the demand method is not a widely accepted standard for community protocols at this point, the polygon method was used in the final emissions estimate for the community.
37
Table 2.12: Demand Method and Minneapolis Boundary Method
Year
Demand Method Trip Category
(Metropolitan Council Data) Minneapolis Annual VMT
Tailpipe Fossil
Emissions (mt CO2e)
Tailpipe Biogenic CO2
Emissions
Minneapolis-contained VMT (from MnDOT)
Tailpipe Fossil
Emissions (mt CO2e)
Tailpipe Biogenic CO2
Emissions
% Difference between Methods
2009 Starting in, Ending in 560,379,025 301,991 19,813
Starting in, Going out 1,177,870,513 634,760 41,646
Starting out, Going in 1,191,915,348 642,329 42,143
All Trips 2,930,164,885 1,373,637 86,088 2,385,221,345 1,104,816 72,057 19.5%
2010 Starting in, Ending in 583,221,820 312,141 21,081
Starting in, Going out 1,211,665,498 648,485 43,797
Starting out, Going in 1,220,415,825 653,168 44,113
All Trips 3,015,303,143 1,391,325 92,688 2,400,983,870 1,094,399 73,805 21.3%
38
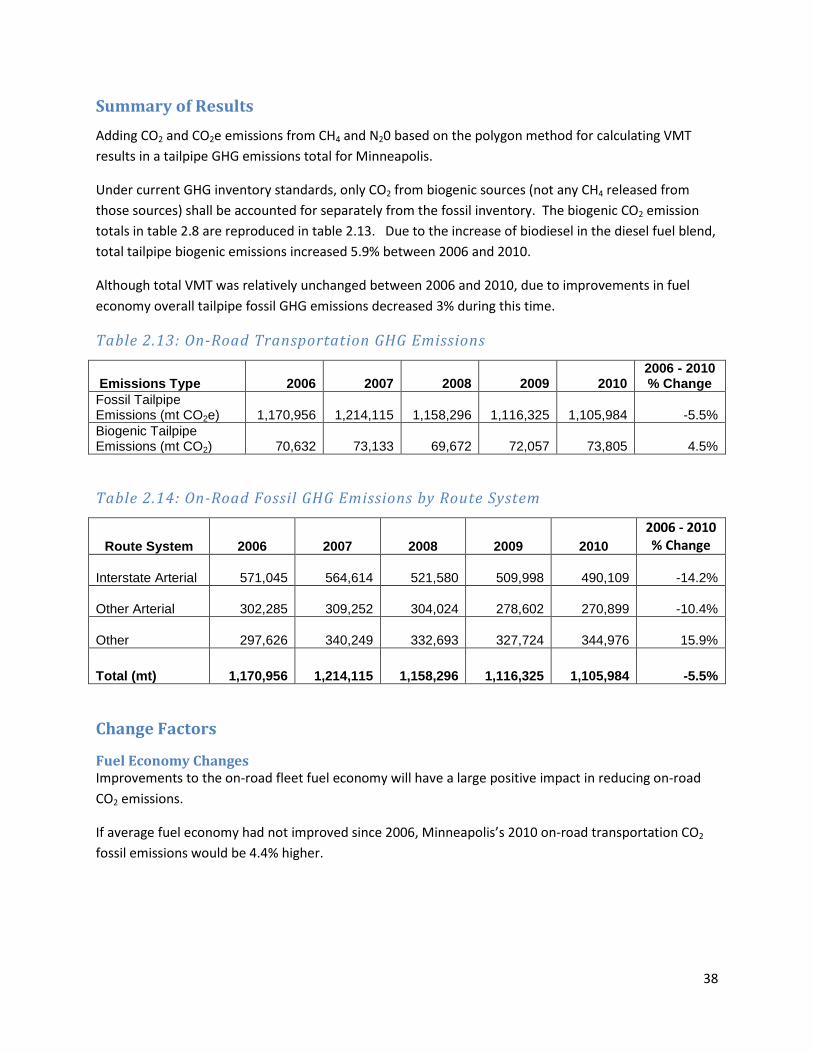
Summary of Results Adding CO2 and CO2e emissions from CH4 and N20 based on the polygon method for calculating VMT results in a tailpipe GHG emissions total for Minneapolis.
Under current GHG inventory standards, only CO2 from biogenic sources (not any CH4 released from those sources) shall be accounted for separately from the fossil inventory. The biogenic CO2 emission totals in table 2.8 are reproduced in table 2.13. Due to the increase of biodiesel in the diesel fuel blend, total tailpipe biogenic emissions increased 5.9% between 2006 and 2010.
Although total VMT was relatively unchanged between 2006 and 2010, due to improvements in fuel economy overall tailpipe fossil GHG emissions decreased 3% during this time.
Table 2.13: On-Road Transportation GHG Emissions
Emissions Type 2006 2007 2008 2009 2010 2006 - 2010 % Change
Fossil Tailpipe Emissions (mt CO2e)
1,170,956
1,214,115
1,158,296
1,116,325
1,105,984 -5.5%
Biogenic Tailpipe Emissions (mt CO2)
70,632
73,133
69,672
72,057
73,805 4.5%
Table 2.14: On-Road Fossil GHG Emissions by Route System
Route System 2006 2007 2008 2009 2010 2006 - 2010 % Change
Interstate Arterial
571,045
564,614
521,580
509,998
490,109 -14.2%
Other Arterial
302,285
309,252
304,024
278,602
270,899 -10.4%
Other
297,626
340,249
332,693
327,724
344,976 15.9%
Total (mt)
1,170,956
1,214,115
1,158,296
1,116,325
1,105,984 -5.5%
Change Factors
Fuel Economy Changes Improvements to the on-road fleet fuel economy will have a large positive impact in reducing on-road CO2 emissions.
If average fuel economy had not improved since 2006, Minneapolis’s 2010 on-road transportation CO2 fossil emissions would be 4.4% higher.
39
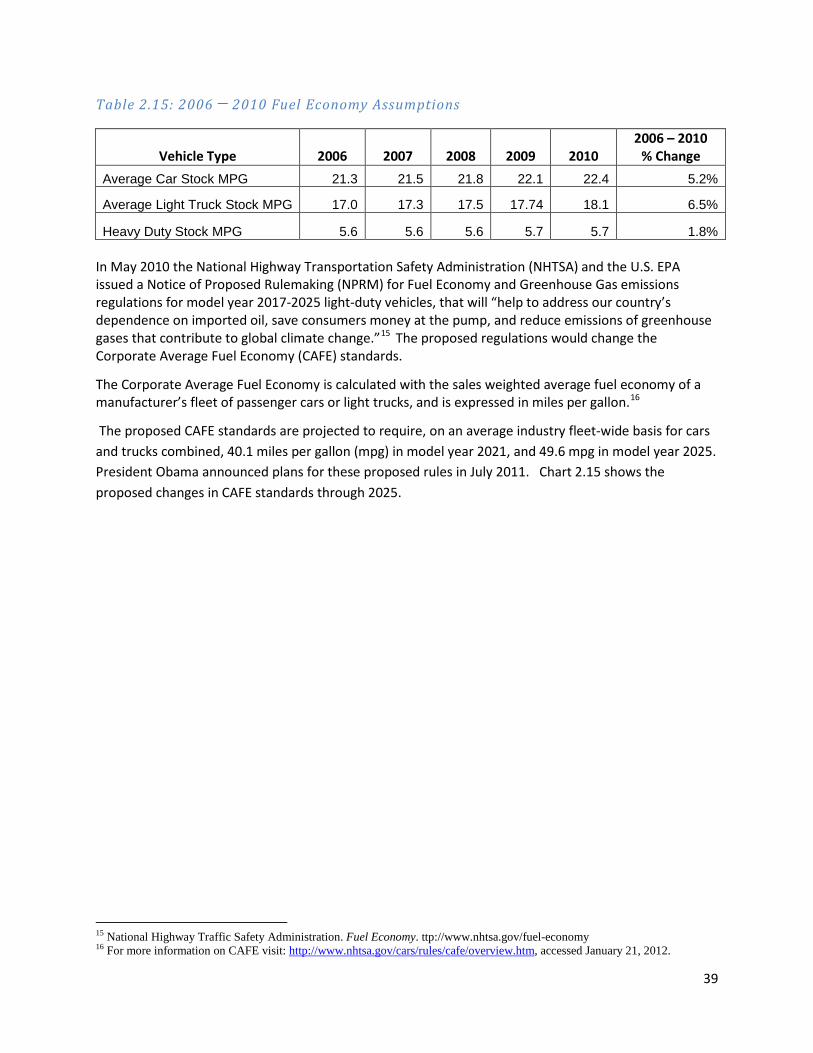
Table 2.15: 2006 ─ 2010 Fuel Economy Assumptions
Vehicle Type 2006 2007 2008 2009 2010 2006 – 2010
% Change Average Car Stock MPG 21.3 21.5 21.8 22.1 22.4 5.2%
Average Light Truck Stock MPG 17.0 17.3 17.5 17.74 18.1 6.5%
Heavy Duty Stock MPG 5.6 5.6 5.6 5.7 5.7 1.8% In May 2010 the National Highway Transportation Safety Administration (NHTSA) and the U.S. EPA issued a Notice of Proposed Rulemaking (NPRM) for Fuel Economy and Greenhouse Gas emissions regulations for model year 2017-2025 light-duty vehicles, that will “help to address our country’s dependence on imported oil, save consumers money at the pump, and reduce emissions of greenhouse gases that contribute to global climate change.”15 The proposed regulations would change the Corporate Average Fuel Economy (CAFE) standards.
The Corporate Average Fuel Economy is calculated with the sales weighted average fuel economy of a manufacturer’s fleet of passenger cars or light trucks, and is expressed in miles per gallon.16
The proposed CAFE standards are projected to require, on an average industry fleet-wide basis for cars and trucks combined, 40.1 miles per gallon (mpg) in model year 2021, and 49.6 mpg in model year 2025. President Obama announced plans for these proposed rules in July 2011. Chart 2.15 shows the proposed changes in CAFE standards through 2025.
15 National Highway Traffic Safety Administration. Fuel Economy. ttp://www.nhtsa.gov/fuel-economy 16 For more information on CAFE visit: http://www.nhtsa.gov/cars/rules/cafe/overview.htm, accessed January 21, 2012.
40
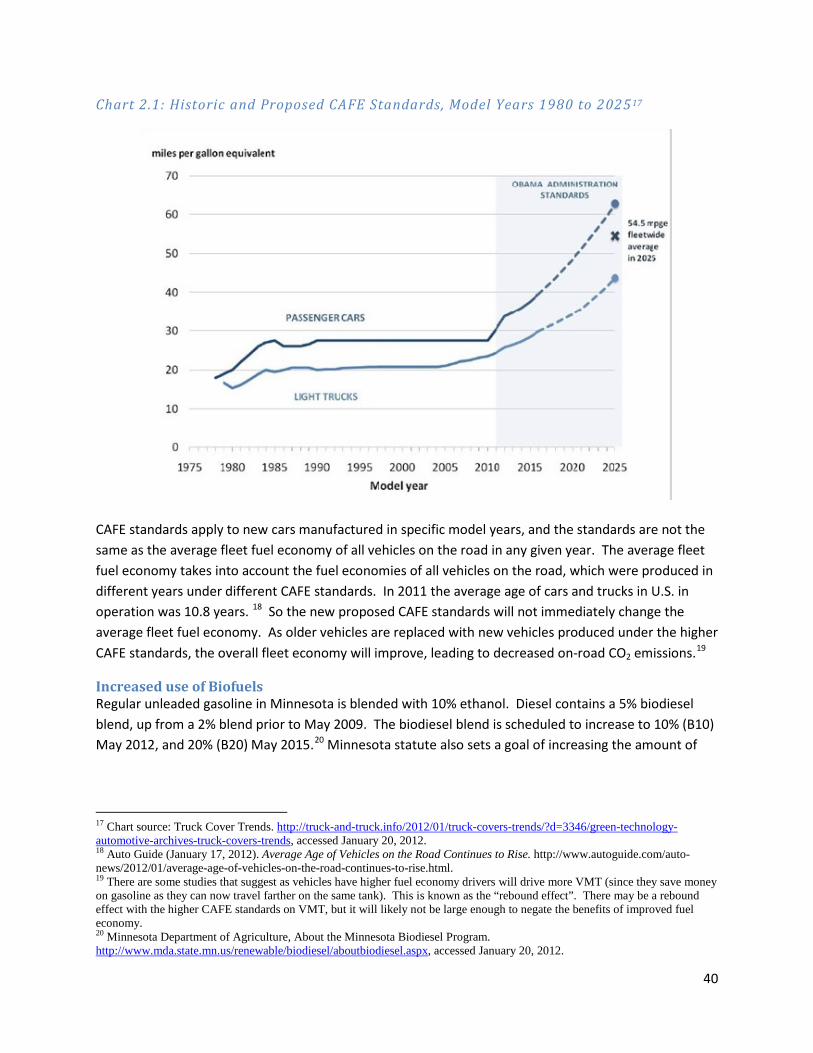
Chart 2.1: Historic and Proposed CAFE Standards, Model Years 1980 to 2025 17
CAFE standards apply to new cars manufactured in specific model years, and the standards are not the same as the average fleet fuel economy of all vehicles on the road in any given year. The average fleet fuel economy takes into account the fuel economies of all vehicles on the road, which were produced in different years under different CAFE standards. In 2011 the average age of cars and trucks in U.S. in operation was 10.8 years. 18 So the new proposed CAFE standards will not immediately change the average fleet fuel economy. As older vehicles are replaced with new vehicles produced under the higher CAFE standards, the overall fleet economy will improve, leading to decreased on-road CO2 emissions.19
Increased use of Biofuels Regular unleaded gasoline in Minnesota is blended with 10% ethanol. Diesel contains a 5% biodiesel blend, up from a 2% blend prior to May 2009. The biodiesel blend is scheduled to increase to 10% (B10) May 2012, and 20% (B20) May 2015.20 Minnesota statute also sets a goal of increasing the amount of
17 Chart source: Truck Cover Trends. http://truck-and-truck.info/2012/01/truck-covers-trends/?d=3346/green-technology-automotive-archives-truck-covers-trends, accessed January 20, 2012. 18 Auto Guide (January 17, 2012). Average Age of Vehicles on the Road Continues to Rise. http://www.autoguide.com/auto-news/2012/01/average-age-of-vehicles-on-the-road-continues-to-rise.html. 19 There are some studies that suggest as vehicles have higher fuel economy drivers will drive more VMT (since they save money on gasoline as they can now travel farther on the same tank). This is known as the “rebound effect”. There may be a rebound effect with the higher CAFE standards on VMT, but it will likely not be large enough to negate the benefits of improved fuel economy. 20 Minnesota Department of Agriculture, About the Minnesota Biodiesel Program. http://www.mda.state.mn.us/renewable/biodiesel/aboutbiodiesel.aspx, accessed January 20, 2012.

41
ethanol blended into gasoline to 20 percent by 2013.21 Ethanol and biodiesel blends emit biogenic CO2 when combusted in a vehicle. Biogenic CO2 emissions are accounted for separately from fossil CO2 emissions because, unlike fossil fuels which sequestered carbon millions of years ago, biogenic CO2 was somewhat recently removed from the atmosphere through plant photosynthesis. When bio-based fuels are combusted they return the carbon, in the form of carbon dioxide, back to the atmosphere.
When the full life cycle emissions of growing bioenergy crops, refining them into fuels, and distributing the fuels are considered, bio-based fuels like ethanol and biodiesel are not carbon neutral. Comparing the life cycle emissions of bio-based fuels and “traditional” fossil fuels such as gasoline and diesel is difficult due to different carbon accounting and life cycle methods employed by different studies. However, when using the GHG inventory accounting method of separately accounting for fossil and biogenic CO2 combustion emissions, and not including upstream life cycle emissions, it is true that displacing fossil fuels with bio-based transportation fuels will reduce the estimated fossil fuel transportation CO2 combustion emissions while increasing biogenic CO2 combustion emissions.
If there were no bio-based fuels in Minnesota’s gasoline and diesel blends in 2010, Minneapolis’s on-road transportation fossil CO2 emissions would have been 10% higher, or an increase of 127,500 CO2 metric tons. Under this scenario, on-road biogenic CO2 emissions would be zero, a decrease of 86,787 metric tons of biogenic CO2. Therefore, the net (fossil and biogenic) increase in on-road CO2 transportation emissions would be 40,419 metric tons under a scenario with no bio-based fuel blends.
21 Minnesota Department of Agriculture Ethanol Program. http://www.mda.state.mn.us/en/renewable/ethanol.aspx, accessed January 20, 2012.
42
Appendix 3: Natural Gas Consumption GHG Emissions
Overview CenterPoint Energy provided total natural gas consumption figures for residential, commercial, and industrial categories for 2006 to 2010 in therms.22 The NRG Energy Center uses natural gas for the downtown district energy system; NRG’s natural gas use is included in the industrial natural gas consumption totals.
CO2, CH4, and N2O EPA emission factors for residential/commercial natural gas combustion were used in the emissions calculations. Industrial CH4 and N2O emission factors are available, but the residential/commercial are more conservative and are easily applied when calculating total natural gas CH4 and N2O emissions. The calculated emission factor is 0.0053 metric tons CO2e/therm.
Natural Gas Consumption in Other Categories Overall community natural gas consumption increased 8% between 2006 and 2010. However, much of that increased use occurred when the NSP Riverside Generating Station switched from coal to natural gas fuel. Riverside’s GHG emissions are included in the calculations of Xcel Energy’s NSP Minnesota electricity emission factor, which was used to calculate emissions from electricity consumed in Minneapolis. The natural gas consumed at Riverside was subtracted from the community natural gas consumption to avoid double counting of natural gas combustion emissions and the electricity grid emissions. In this instance the inventory does not follow a pure “geographic boundary” inventory (accounting for all emissions that occur within the city’s boundaries) because of the disperse electricity grid.
In addition to Riverside, HERC and the University of Minnesota’s Southeast Steam Plant also use natural gas. The natural gas consumed at these facilities was subtracted from the total natural gas consumption prior to calculating GHG emissions from natural gas. The steam plant’s natural gas emissions are accounted for in the facility’s emissions total (appendix 4), and HERC’s natural gas emissions are included in incinerated waste emissions (appendix 7). Excluding Riverside, the U of M Steam Plant and HERC natural gas usage, community natural gas use dropped by 16.9% between 2006 and 2010.
Natural gas consumption and GHG emissions are presented in table 3.1.
22 Therm is a unit of heat energy equal to 100,000 British thermal units (BTU). It is approximately the energy equivalent of burning 100 cubic feet (often referred to as 1 hcf) of natural gas.

43
Table 3.1: Natural Gas Consumption and GHG Emissions
Year 2006 2007 2008 2009 2010
2006 to 2010 % Change
Residential Consumption 123,119,595
102,543,468
119,421,938
115,286,726
104,568,354 -24.2%
Commercial Consumption23
124,092,406
136,912,919
133,671,746
123,306,565 N/A
Industrial Consumption 148,463,937
32,005,146
28,929,756
62,190,009
100,948,703 N/A
Total (therms) 271,583,532
258,641,020
285,264,613
311,148,481
328,823,622 8.0%
(Riverside Generating Station)
(39,686,210)
(75,405,550)
(HERC Consumption)
(351,865)
(282,133)
(225,216)
(451,375)
(768,186) 118.3%24
(University of Minnesota Steam Plant Consumption)
(123,954)
(123,954)
(118,975)
(122,868)
(119,637) -3.5%
Net Consumption (therms)
271,107,713
258,234,933
284,920,422
270,888,028
252,530,249 -16.9%
GHG Emissions (mt CO2e)
1,436,871
1,370,199
1,511,792
1,437,336
1,339,929 -16.9%
Change Factors
Heating Degree Days
Heating degree days relate each day's temperatures to the demand for fuel to heat buildings. To calculate the heating degree days for a particular day, the day's average temperature is found by adding the day's high and low temperatures and dividing by two. If the number is above 65, there are no heating degree days that day. If the number is less than 65, the number is subtracted from 65 to find the number of heating degree days.25
Table 3-2 includes the total heating degree days for 2006 through 2010.26
23 2006 commercial natural gas consumption included with industrial consumption 24 Significant increases in natural gas consumption at HERC may be due to the maintenance and repair cycle. According to Hennepin County staff, there was a major repair outage at HERC in 2009 and frequent but brief outages in 2010. Natural gas is used to bring a boiler back online after shutdown, so outages and subsequent restarts could increase natural gas usage. 25 Source: National Oceanic and Atmospheric Administration. http://www.erh.noaa.gov/cle/climate/info/degreedays.html 26 Heating Degree Days Data from Minnesota Climatology Working Group. http://climate.umn.edu/cawap/eddsum/eddsum.asp
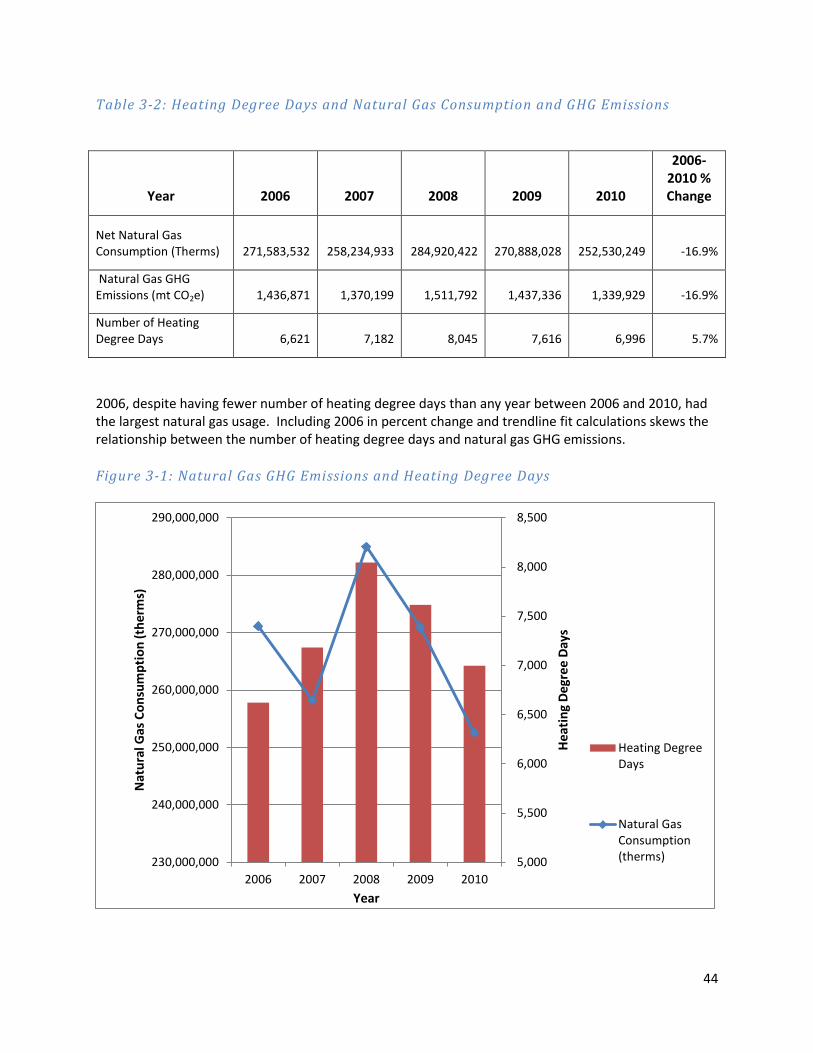
44
Table 3-2: Heating Degree Days and Natural Gas Consumption and GHG Emissions
2006, despite having fewer number of heating degree days than any year between 2006 and 2010, had the largest natural gas usage. Including 2006 in percent change and trendline fit calculations skews the relationship between the number of heating degree days and natural gas GHG emissions.
Figure 3-1: Natural Gas GHG Emissions and Heating Degree Days
5,000
5,500
6,000
6,500
7,000
7,500
8,000
8,500
230,000,000
240,000,000
250,000,000
260,000,000
270,000,000
280,000,000
290,000,000
2006 2007 2008 2009 2010
Hea
ting
Degr
ee D
ays
Nat
ural
Gas
Con
sum
ptio
n (t
herm
s)
Year
Heating DegreeDays
Natural GasConsumption(therms)
Year 2006 2007 2008 2009 2010
2006-2010 % Change
Net Natural Gas Consumption (Therms)
271,583,532
258,234,933
284,920,422
270,888,028
252,530,249 -16.9%
Natural Gas GHG Emissions (mt CO2e) 1,436,871 1,370,199 1,511,792 1,437,336 1,339,929 -16.9%
Number of Heating Degree Days
6,621
7,182
8,045
7,616
6,996 5.7%
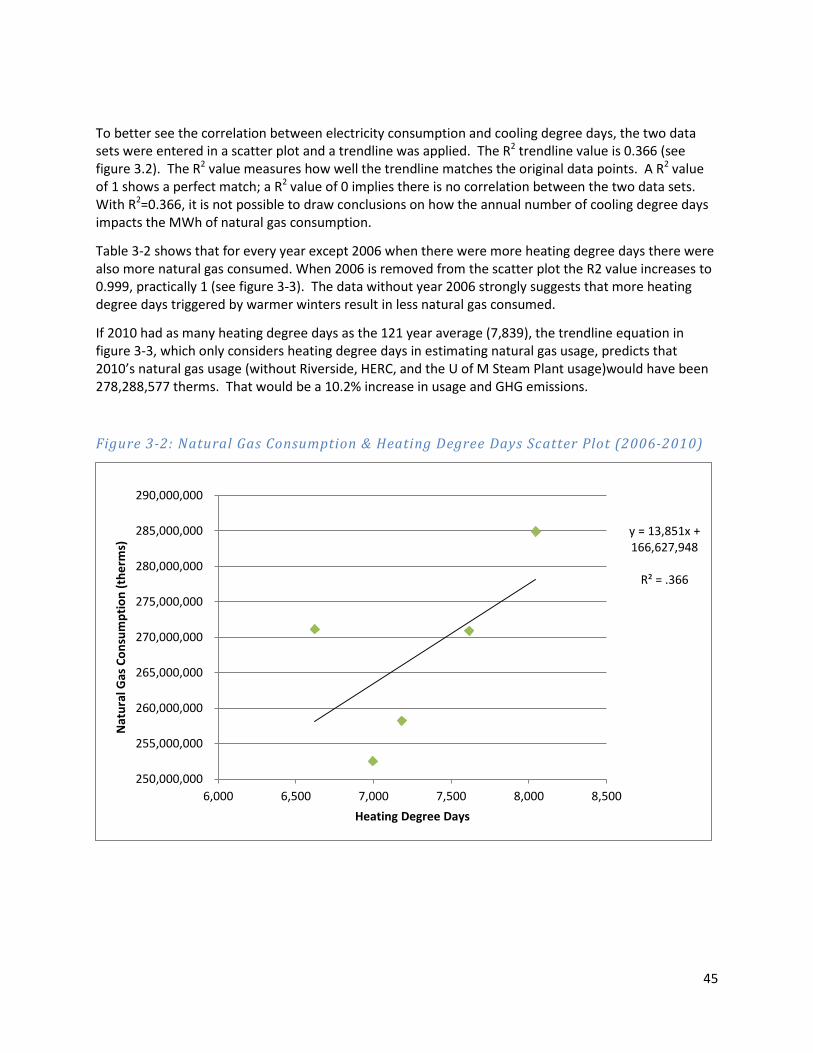
45
To better see the correlation between electricity consumption and cooling degree days, the two data sets were entered in a scatter plot and a trendline was applied. The R2 trendline value is 0.366 (see figure 3.2). The R2 value measures how well the trendline matches the original data points. A R2 value of 1 shows a perfect match; a R2 value of 0 implies there is no correlation between the two data sets. With R2=0.366, it is not possible to draw conclusions on how the annual number of cooling degree days impacts the MWh of natural gas consumption.
Table 3-2 shows that for every year except 2006 when there were more heating degree days there were also more natural gas consumed. When 2006 is removed from the scatter plot the R2 value increases to 0.999, practically 1 (see figure 3-3). The data without year 2006 strongly suggests that more heating degree days triggered by warmer winters result in less natural gas consumed.
If 2010 had as many heating degree days as the 121 year average (7,839), the trendline equation in figure 3-3, which only considers heating degree days in estimating natural gas usage, predicts that 2010’s natural gas usage (without Riverside, HERC, and the U of M Steam Plant usage)would have been 278,288,577 therms. That would be a 10.2% increase in usage and GHG emissions.
Figure 3-2: Natural Gas Consumption & Heating Degree Days Scatter Plot (2006-2010)
y = 13,851x + 166,627,948
R² = .366
250,000,000
255,000,000
260,000,000
265,000,000
270,000,000
275,000,000
280,000,000
285,000,000
290,000,000
6,000 6,500 7,000 7,500 8,000 8,500
Nat
ural
Gas
Con
sum
ptio
n (t
herm
s)
Heating Degree Days
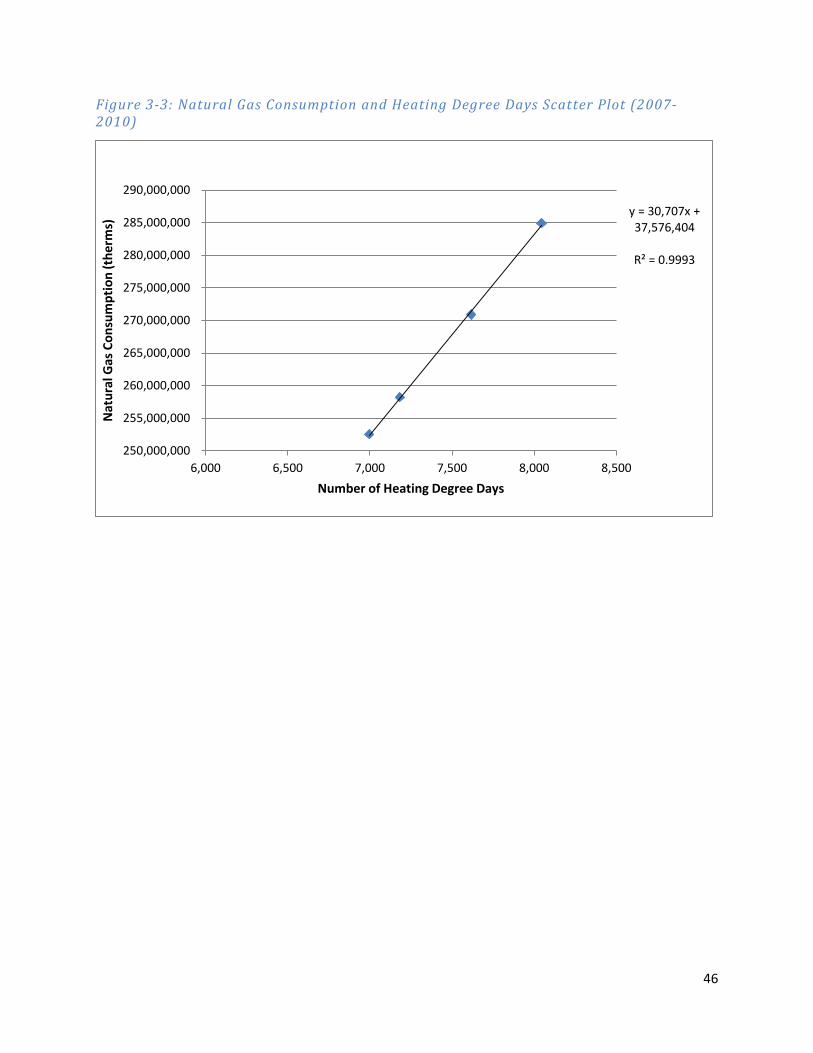
46
Figure 3-3: Natural Gas Consumption and Heating Degree Days Scatter Plot (2007-2010)
y = 30,707x + 37,576,404
R² = 0.9993
250,000,000
255,000,000
260,000,000
265,000,000
270,000,000
275,000,000
280,000,000
285,000,000
290,000,000
6,000 6,500 7,000 7,500 8,000 8,500
Nat
ural
Gas
Con
sum
ptio
n (t
herm
s)
Number of Heating Degree Days
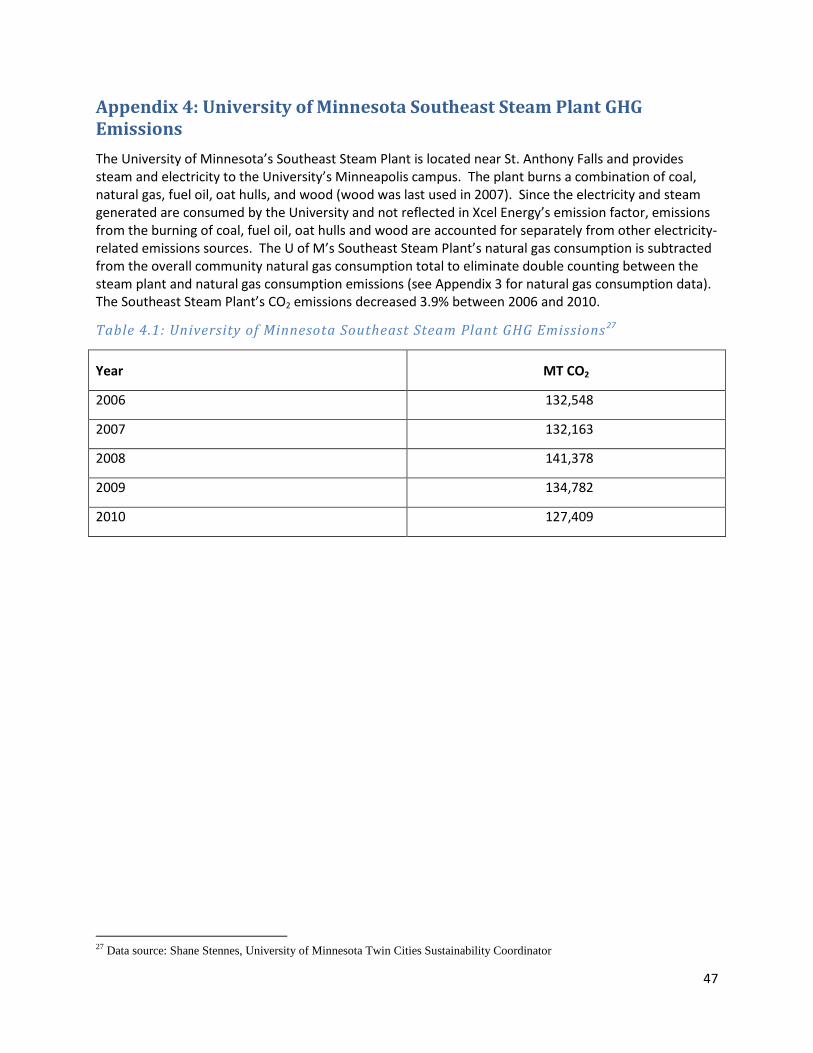
47
Appendix 4: University of Minnesota Southeast Steam Plant GHG Emissions The University of Minnesota’s Southeast Steam Plant is located near St. Anthony Falls and provides steam and electricity to the University’s Minneapolis campus. The plant burns a combination of coal, natural gas, fuel oil, oat hulls, and wood (wood was last used in 2007). Since the electricity and steam generated are consumed by the University and not reflected in Xcel Energy’s emission factor, emissions from the burning of coal, fuel oil, oat hulls and wood are accounted for separately from other electricity-related emissions sources. The U of M’s Southeast Steam Plant’s natural gas consumption is subtracted from the overall community natural gas consumption total to eliminate double counting between the steam plant and natural gas consumption emissions (see Appendix 3 for natural gas consumption data). The Southeast Steam Plant’s CO2 emissions decreased 3.9% between 2006 and 2010.
Table 4.1: University of Minnesota Southeast Steam Plant GHG Emissions 27
Year MT CO2
2006 132,548
2007 132,163
2008 141,378
2009 134,782
2010 127,409
27 Data source: Shane Stennes, University of Minnesota Twin Cities Sustainability Coordinator
48
Appendix 5: Rail and Barge Transportation GHG Emissions In the 2006 Minneapolis GHG Inventory report rail and barge traffic emissions accounted for 0.3% of the total community GHG emissions. Because the rail and barge sector is a relatively small contributor to the overall community GHG emissions and the operations have remained relatively consistent over the past five years, 2006 data were used as a proxy for these emission sources for the years 2007 to 2010.
Emissions associated with the operation of Metro Transit’s Hiawatha LRT line are accounted for in electricity consumption. A summarized version of the 2006 rail and barge transportation description is copied below:
Rail Five railroad companies operate within the City. Only Burlington Northern Santa Fe (BNSF) responded to the information request. The fuel use for BNSF operations within the City limits for year 2007 was calculated from data provided by the railroad. The railroad did not provide data for the target years 2000 and 2006. It was assumed that fuel consumption was relatively constant and the same fuel consumption data for both 2000 and 2006 was used.
BNSF’s average emissions per-track-mile was used as a proxy for Canadian Pacific, Union Packing and Chicago & Northwestern, and Twin Cities and Western Railroad’s operations in Minneapolis.
Amtrak operates two passenger rail trips per day year round on BSNF tracks that go from St. Paul and points east to Seattle and other western destinations. The miles traveled within the City limits and the CACP Software were used to estimate emissions.
Metro Transit’s Northstar Commuter Rail Line began service in 2009. The 40 mile line runs from Big Lake to Target Field Station in downtown Minneapolis. 13% of the rail line is in Minneapolis. Northstar’s diesel fuel usage was 114,318 and 426,047 gallons in 2009 and 2010, respectively. Minneapolis’ portion of Nothstar’s GHG emissions are included in table 5.1.28
River Staff for the Army Corps of Engineers provided data describing the total river traffic for 2000 and 2006 for commercial (tow boats only, not barges), recreational, and passenger traffic through the three locks and dams located within the City limits. The calculations for barge traffic (commercial towboats) are based on cargo tonnages measured through the lock and dams within the City. Calculations for passenger and recreational traffic are based on estimates of vehicle miles traveled.
28 Northstar’s diesel fuel usage was multiplied by 0.0103 mt CO2/gallon of diesel fuel used by a locomotive. Emission factor source: The Climate Registry, 2012 Default Emission Factors, tables 13.1 and 13.6.
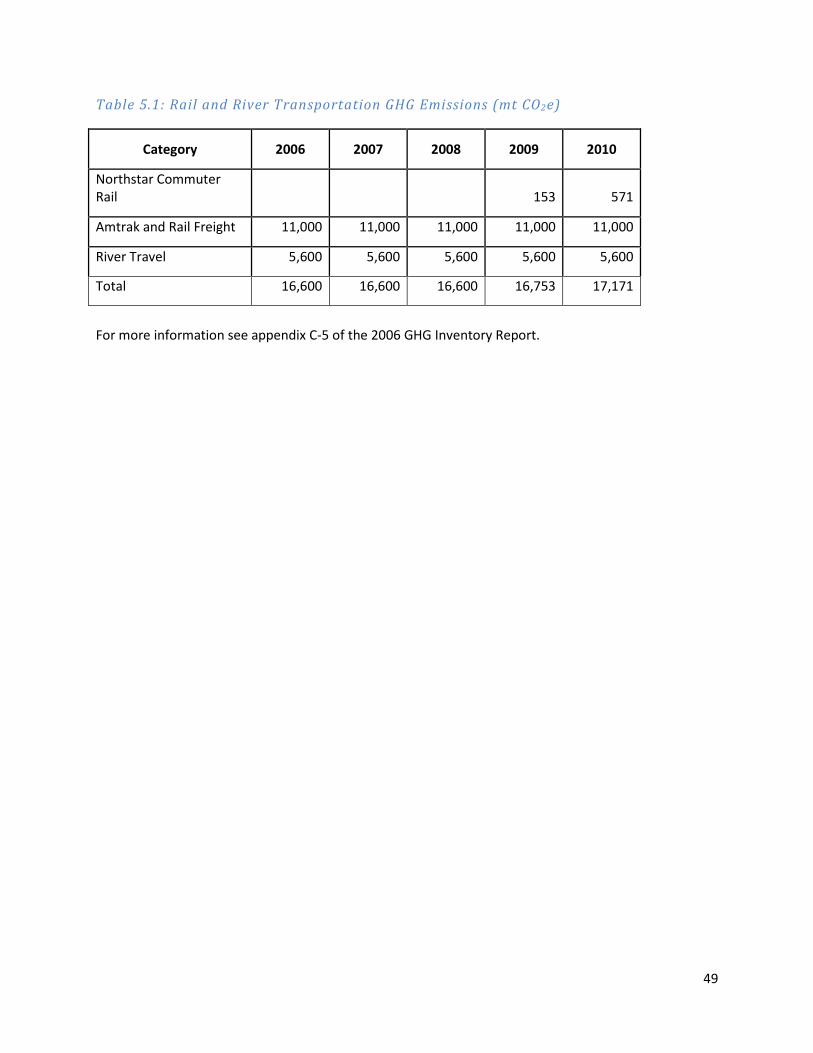
49
Table 5.1: Rail and River Transportation GHG Emissions (mt CO2e)
Category 2006 2007 2008 2009 2010
Northstar Commuter Rail 153 571
Amtrak and Rail Freight 11,000 11,000 11,000 11,000 11,000
River Travel 5,600 5,600 5,600 5,600 5,600
Total 16,600 16,600 16,600 16,753 17,171
For more information see appendix C-5 of the 2006 GHG Inventory Report.
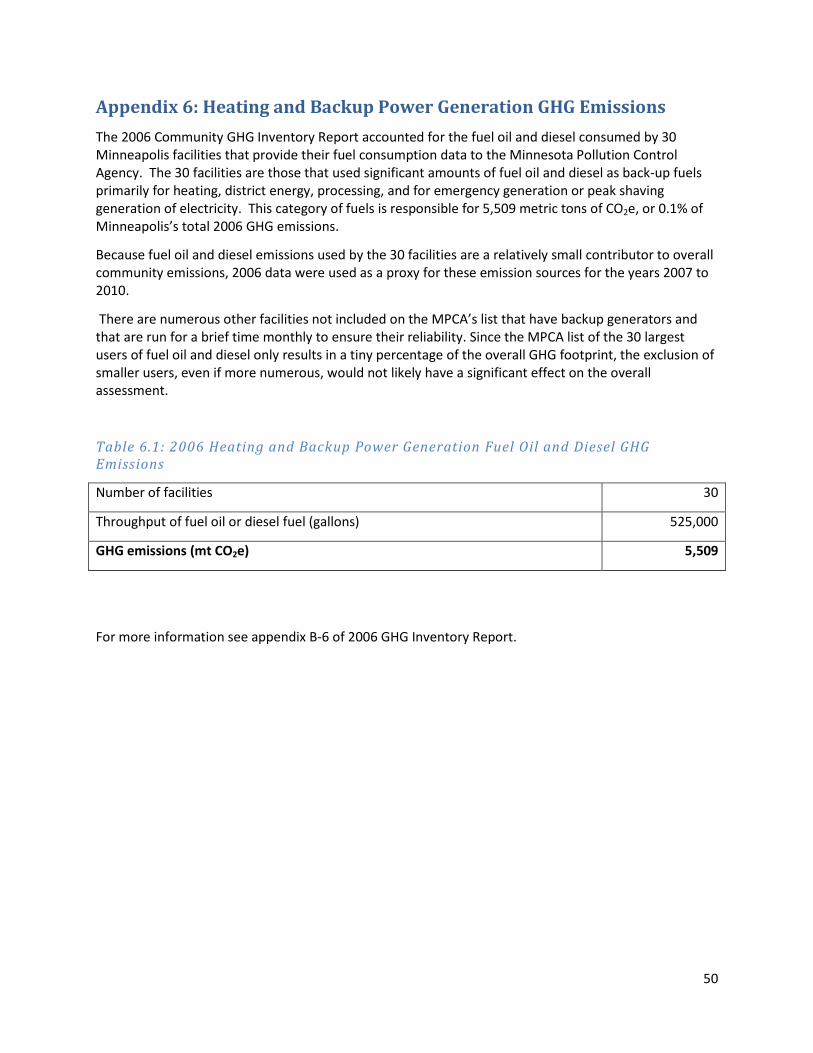
50
Appendix 6: Heating and Backup Power Generation GHG Emissions
The 2006 Community GHG Inventory Report accounted for the fuel oil and diesel consumed by 30 Minneapolis facilities that provide their fuel consumption data to the Minnesota Pollution Control Agency. The 30 facilities are those that used significant amounts of fuel oil and diesel as back-up fuels primarily for heating, district energy, processing, and for emergency generation or peak shaving generation of electricity. This category of fuels is responsible for 5,509 metric tons of CO2e, or 0.1% of Minneapolis’s total 2006 GHG emissions.
Because fuel oil and diesel emissions used by the 30 facilities are a relatively small contributor to overall community emissions, 2006 data were used as a proxy for these emission sources for the years 2007 to 2010.
There are numerous other facilities not included on the MPCA’s list that have backup generators and that are run for a brief time monthly to ensure their reliability. Since the MPCA list of the 30 largest users of fuel oil and diesel only results in a tiny percentage of the overall GHG footprint, the exclusion of smaller users, even if more numerous, would not likely have a significant effect on the overall assessment.
Table 6.1: 2006 Heating and Backup Power Generation Fuel Oil and Diesel GHG Emissions
Number of facilities 30
Throughput of fuel oil or diesel fuel (gallons) 525,000
GHG emissions (mt CO2e) 5,509
For more information see appendix B-6 of 2006 GHG Inventory Report.
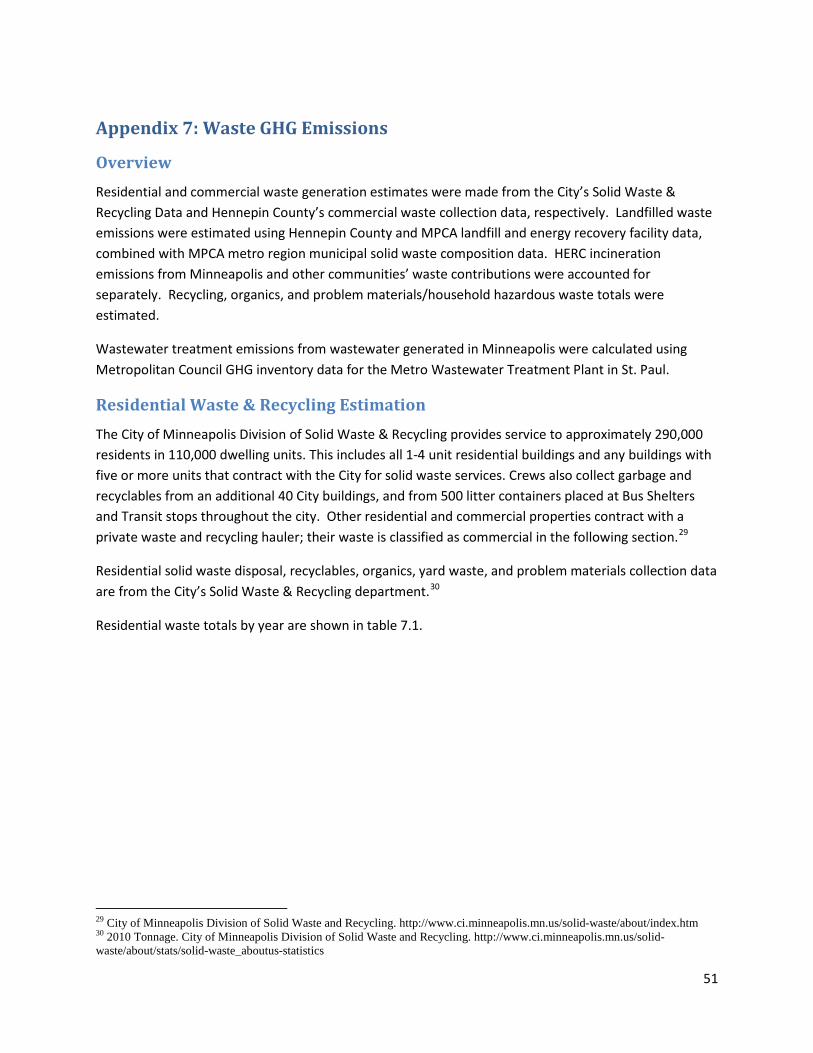
51
Appendix 7: Waste GHG Emissions
Overview Residential and commercial waste generation estimates were made from the City’s Solid Waste & Recycling Data and Hennepin County’s commercial waste collection data, respectively. Landfilled waste emissions were estimated using Hennepin County and MPCA landfill and energy recovery facility data, combined with MPCA metro region municipal solid waste composition data. HERC incineration emissions from Minneapolis and other communities’ waste contributions were accounted for separately. Recycling, organics, and problem materials/household hazardous waste totals were estimated.
Wastewater treatment emissions from wastewater generated in Minneapolis were calculated using Metropolitan Council GHG inventory data for the Metro Wastewater Treatment Plant in St. Paul.
Residential Waste & Recycling Estimation The City of Minneapolis Division of Solid Waste & Recycling provides service to approximately 290,000 residents in 110,000 dwelling units. This includes all 1-4 unit residential buildings and any buildings with five or more units that contract with the City for solid waste services. Crews also collect garbage and recyclables from an additional 40 City buildings, and from 500 litter containers placed at Bus Shelters and Transit stops throughout the city. Other residential and commercial properties contract with a private waste and recycling hauler; their waste is classified as commercial in the following section.29
Residential solid waste disposal, recyclables, organics, yard waste, and problem materials collection data are from the City’s Solid Waste & Recycling department.30
Residential waste totals by year are shown in table 7.1.
29 City of Minneapolis Division of Solid Waste and Recycling. http://www.ci.minneapolis.mn.us/solid-waste/about/index.htm 30 2010 Tonnage. City of Minneapolis Division of Solid Waste and Recycling. http://www.ci.minneapolis.mn.us/solid-waste/about/stats/solid-waste_aboutus-statistics
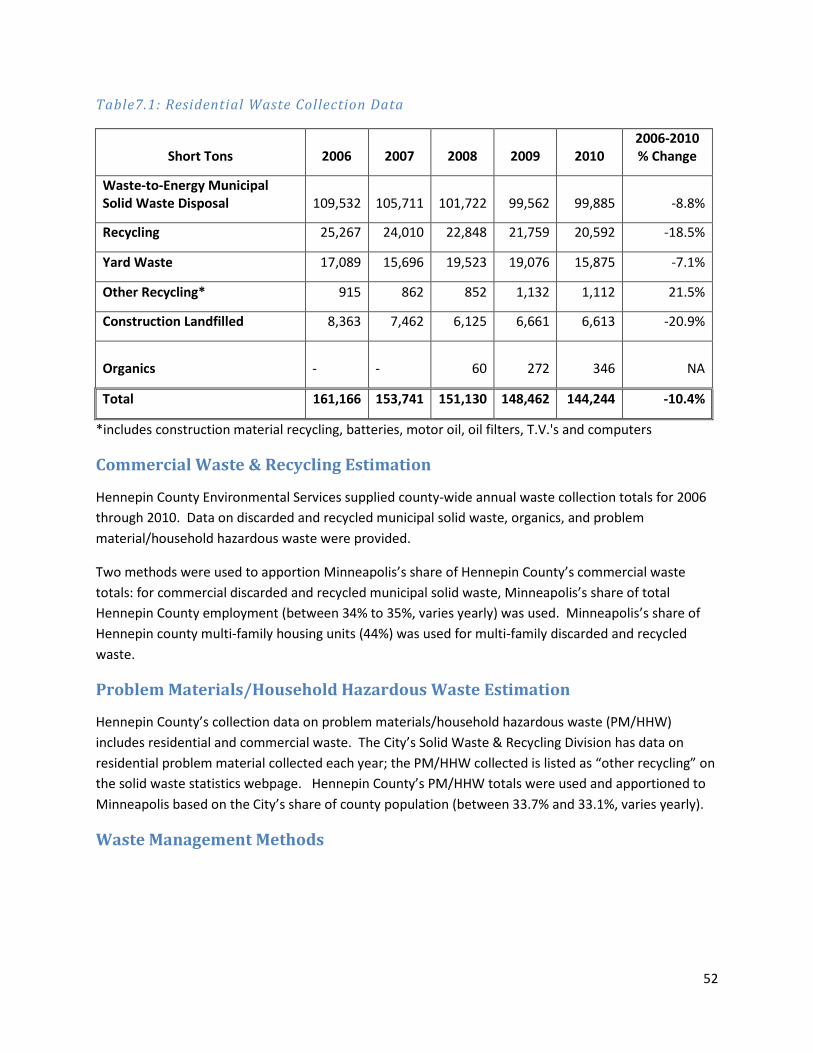
52
Table7.1: Residential Waste Collection Data
Short Tons 2006 2007 2008 2009 2010 2006-2010 % Change
Waste-to-Energy Municipal Solid Waste Disposal 109,532 105,711 101,722 99,562 99,885 -8.8%
Recycling 25,267 24,010 22,848 21,759 20,592 -18.5%
Yard Waste 17,089 15,696 19,523 19,076 15,875 -7.1%
Other Recycling* 915 862 852 1,132 1,112 21.5%
Construction Landfilled 8,363 7,462 6,125 6,661 6,613 -20.9%
Organics -
- 60 272 346 NA
Total 161,166 153,741 151,130 148,462 144,244 -10.4%
*includes construction material recycling, batteries, motor oil, oil filters, T.V.'s and computers
Commercial Waste & Recycling Estimation
Hennepin County Environmental Services supplied county-wide annual waste collection totals for 2006 through 2010. Data on discarded and recycled municipal solid waste, organics, and problem material/household hazardous waste were provided.
Two methods were used to apportion Minneapolis’s share of Hennepin County’s commercial waste totals: for commercial discarded and recycled municipal solid waste, Minneapolis’s share of total Hennepin County employment (between 34% to 35%, varies yearly) was used. Minneapolis’s share of Hennepin county multi-family housing units (44%) was used for multi-family discarded and recycled waste.
Problem Materials/Household Hazardous Waste Estimation
Hennepin County’s collection data on problem materials/household hazardous waste (PM/HHW) includes residential and commercial waste. The City’s Solid Waste & Recycling Division has data on residential problem material collected each year; the PM/HHW collected is listed as “other recycling” on the solid waste statistics webpage. Hennepin County’s PM/HHW totals were used and apportioned to Minneapolis based on the City’s share of county population (between 33.7% and 33.1%, varies yearly).
Waste Management Methods
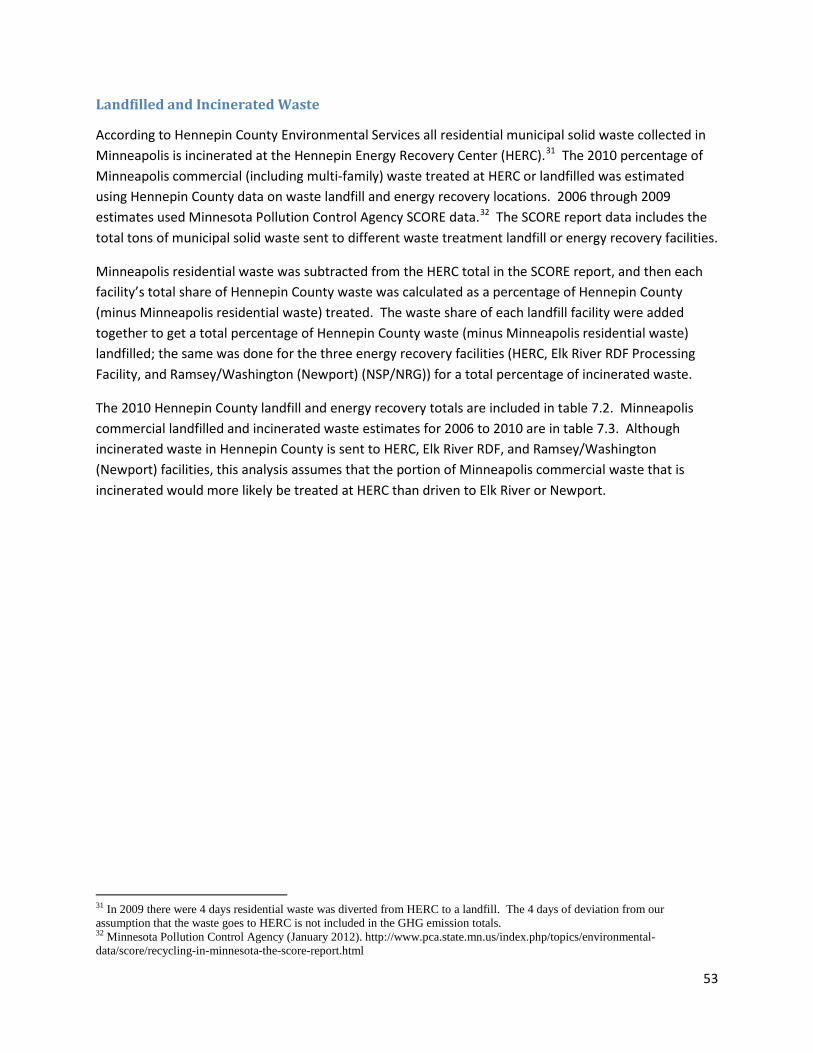
53
Landfilled and Incinerated Waste
According to Hennepin County Environmental Services all residential municipal solid waste collected in Minneapolis is incinerated at the Hennepin Energy Recovery Center (HERC).31 The 2010 percentage of Minneapolis commercial (including multi-family) waste treated at HERC or landfilled was estimated using Hennepin County data on waste landfill and energy recovery locations. 2006 through 2009 estimates used Minnesota Pollution Control Agency SCORE data.32 The SCORE report data includes the total tons of municipal solid waste sent to different waste treatment landfill or energy recovery facilities.
Minneapolis residential waste was subtracted from the HERC total in the SCORE report, and then each facility’s total share of Hennepin County waste was calculated as a percentage of Hennepin County (minus Minneapolis residential waste) treated. The waste share of each landfill facility were added together to get a total percentage of Hennepin County waste (minus Minneapolis residential waste) landfilled; the same was done for the three energy recovery facilities (HERC, Elk River RDF Processing Facility, and Ramsey/Washington (Newport) (NSP/NRG)) for a total percentage of incinerated waste.
The 2010 Hennepin County landfill and energy recovery totals are included in table 7.2. Minneapolis commercial landfilled and incinerated waste estimates for 2006 to 2010 are in table 7.3. Although incinerated waste in Hennepin County is sent to HERC, Elk River RDF, and Ramsey/Washington (Newport) facilities, this analysis assumes that the portion of Minneapolis commercial waste that is incinerated would more likely be treated at HERC than driven to Elk River or Newport.
31 In 2009 there were 4 days residential waste was diverted from HERC to a landfill. The 4 days of deviation from our assumption that the waste goes to HERC is not included in the GHG emission totals. 32 Minnesota Pollution Control Agency (January 2012). http://www.pca.state.mn.us/index.php/topics/environmental-data/score/recycling-in-minnesota-the-score-report.html
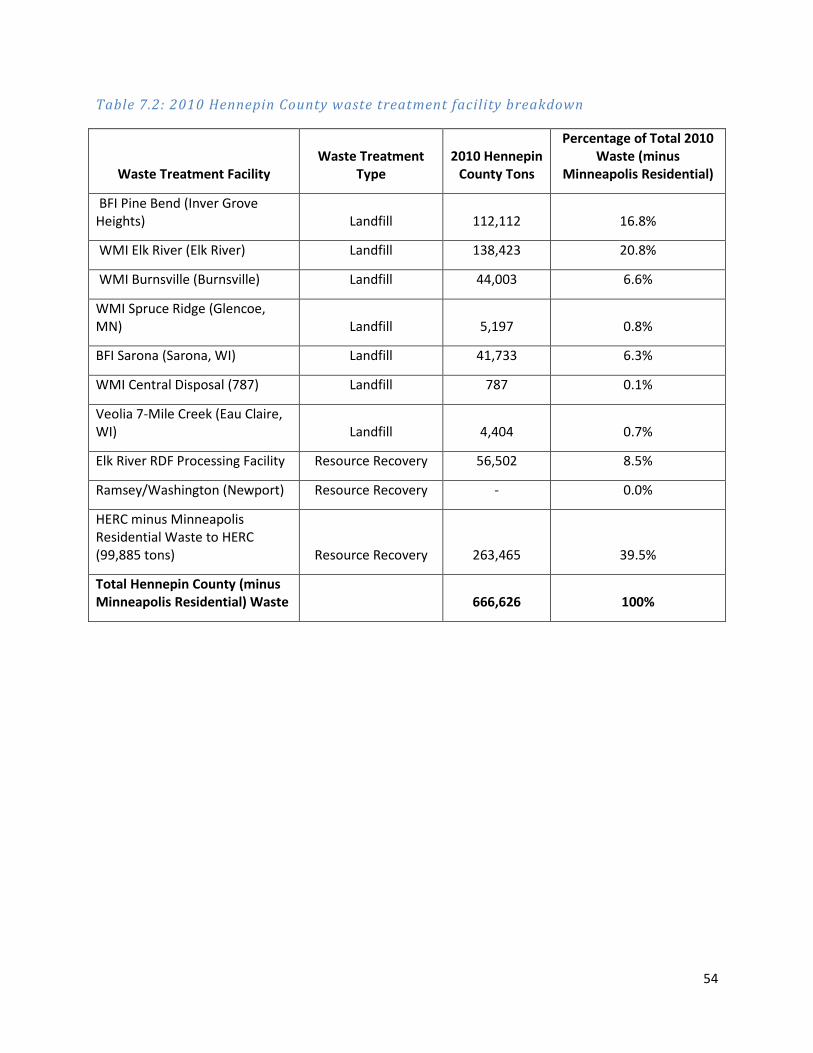
54
Table 7.2: 2010 Hennepin County waste treatment facility breakdown
Waste Treatment Facility Waste Treatment
Type 2010 Hennepin
County Tons
Percentage of Total 2010 Waste (minus
Minneapolis Residential)
BFI Pine Bend (Inver Grove Heights) Landfill 112,112 16.8%
WMI Elk River (Elk River) Landfill 138,423 20.8%
WMI Burnsville (Burnsville) Landfill 44,003 6.6%
WMI Spruce Ridge (Glencoe, MN) Landfill 5,197 0.8%
BFI Sarona (Sarona, WI) Landfill 41,733 6.3%
WMI Central Disposal (787) Landfill 787 0.1%
Veolia 7-Mile Creek (Eau Claire, WI) Landfill 4,404 0.7%
Elk River RDF Processing Facility Resource Recovery 56,502 8.5%
Ramsey/Washington (Newport) Resource Recovery - 0.0%
HERC minus Minneapolis Residential Waste to HERC (99,885 tons) Resource Recovery 263,465 39.5%
Total Hennepin County (minus Minneapolis Residential) Waste 666,626 100%
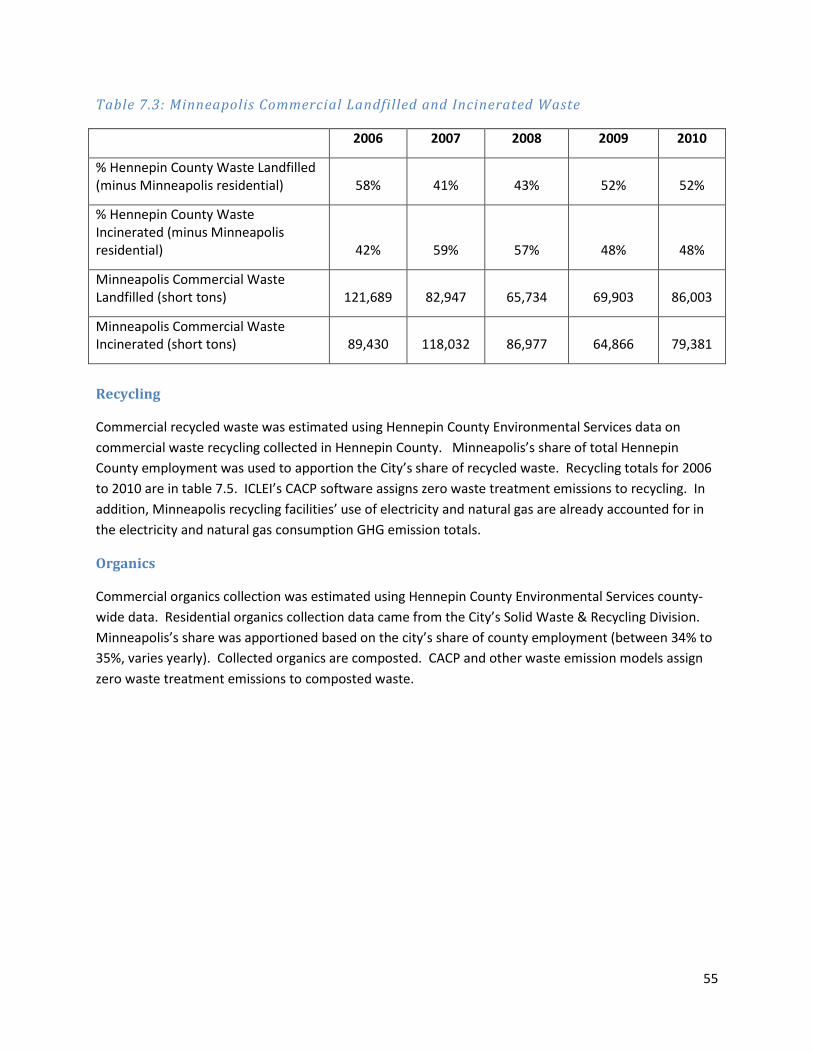
55
Table 7.3: Minneapolis Commercial Landfilled and Incinerated Waste
2006 2007 2008 2009 2010
% Hennepin County Waste Landfilled (minus Minneapolis residential) 58% 41% 43% 52% 52%
% Hennepin County Waste Incinerated (minus Minneapolis residential) 42% 59% 57% 48% 48%
Minneapolis Commercial Waste Landfilled (short tons) 121,689 82,947 65,734 69,903 86,003
Minneapolis Commercial Waste Incinerated (short tons) 89,430 118,032 86,977 64,866 79,381
Recycling
Commercial recycled waste was estimated using Hennepin County Environmental Services data on commercial waste recycling collected in Hennepin County. Minneapolis’s share of total Hennepin County employment was used to apportion the City’s share of recycled waste. Recycling totals for 2006 to 2010 are in table 7.5. ICLEI’s CACP software assigns zero waste treatment emissions to recycling. In addition, Minneapolis recycling facilities’ use of electricity and natural gas are already accounted for in the electricity and natural gas consumption GHG emission totals.
Organics
Commercial organics collection was estimated using Hennepin County Environmental Services county-wide data. Residential organics collection data came from the City’s Solid Waste & Recycling Division. Minneapolis’s share was apportioned based on the city’s share of county employment (between 34% to 35%, varies yearly). Collected organics are composted. CACP and other waste emission models assign zero waste treatment emissions to composted waste.
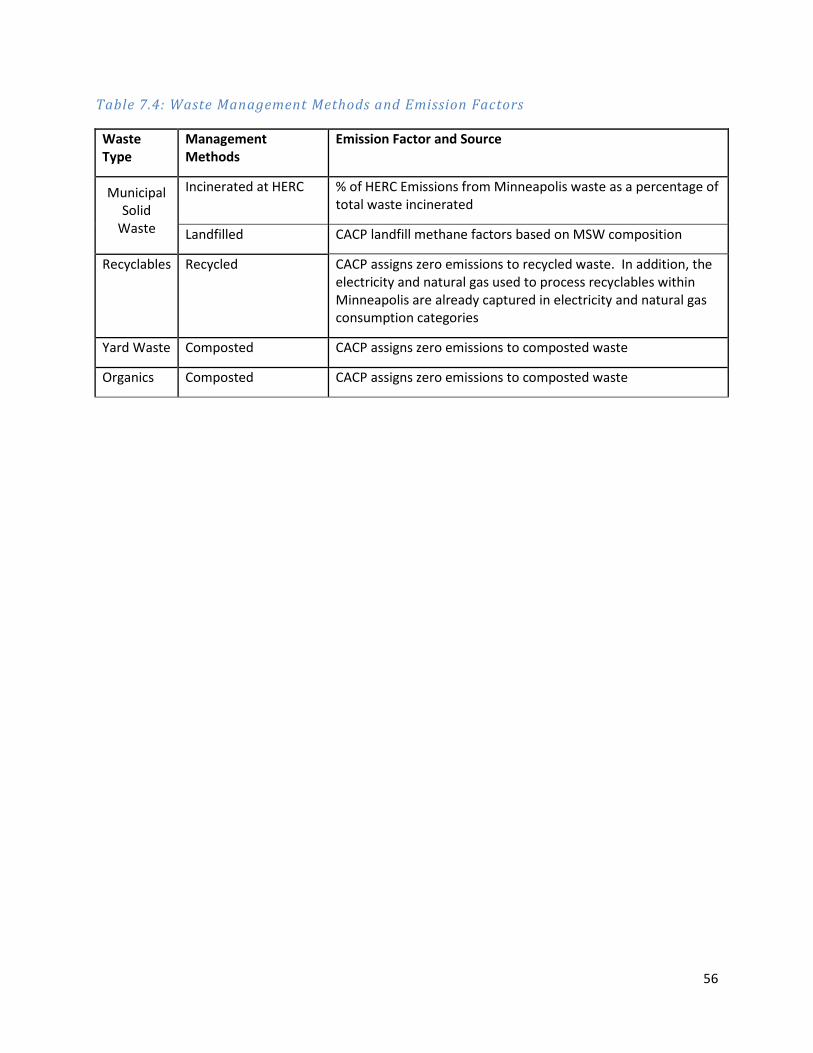
56
Table 7.4: Waste Management Methods and Emission Factors
Waste Type
Management Methods
Emission Factor and Source
Municipal Solid
Waste
Incinerated at HERC % of HERC Emissions from Minneapolis waste as a percentage of total waste incinerated
Landfilled CACP landfill methane factors based on MSW composition
Recyclables Recycled CACP assigns zero emissions to recycled waste. In addition, the electricity and natural gas used to process recyclables within Minneapolis are already captured in electricity and natural gas consumption categories
Yard Waste Composted CACP assigns zero emissions to composted waste
Organics Composted CACP assigns zero emissions to composted waste
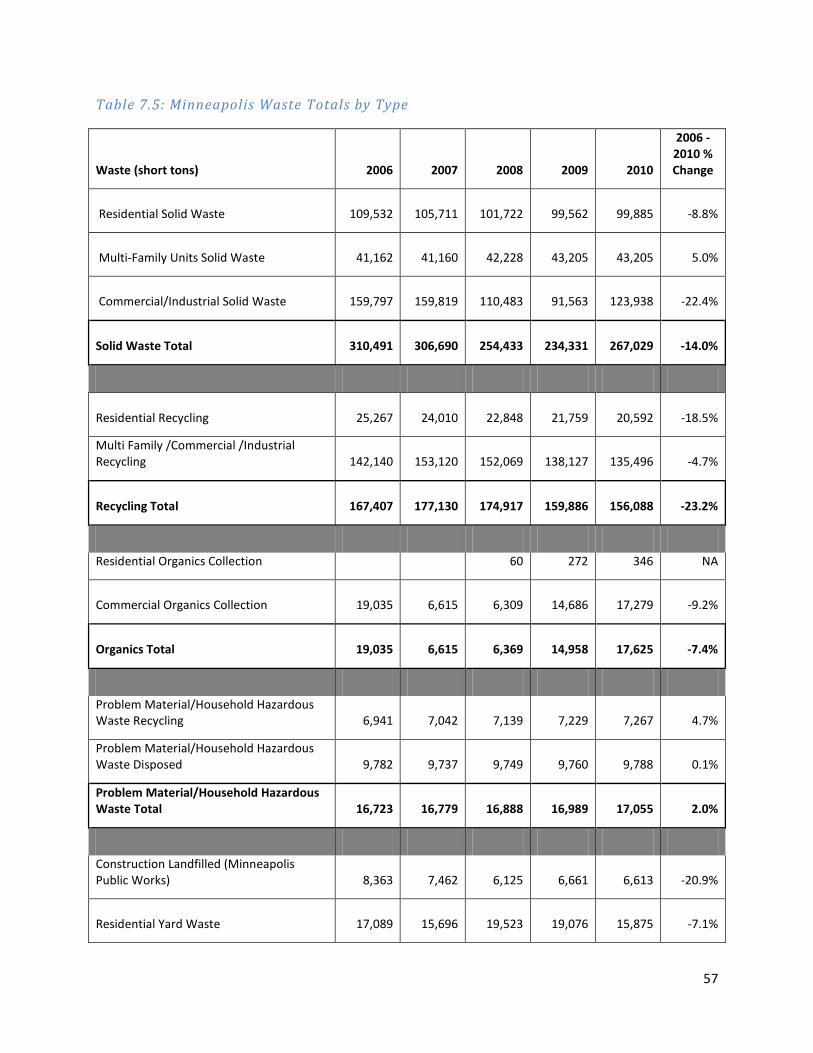
57
Table 7.5: Minneapolis Waste Totals by Type
Waste (short tons) 2006 2007 2008 2009 2010
2006 - 2010 % Change
Residential Solid Waste
109,532
105,711
101,722
99,562
99,885 -8.8%
Multi-Family Units Solid Waste
41,162
41,160
42,228
43,205
43,205 5.0%
Commercial/Industrial Solid Waste
159,797
159,819
110,483
91,563
123,938 -22.4%
Solid Waste Total
310,491
306,690
254,433
234,331
267,029 -14.0%
Residential Recycling
25,267
24,010
22,848
21,759
20,592 -18.5%
Multi Family /Commercial /Industrial Recycling
142,140
153,120
152,069
138,127
135,496 -4.7%
Recycling Total
167,407
177,130
174,917
159,886
156,088 -23.2%
Residential Organics Collection 60 272 346 NA
Commercial Organics Collection
19,035
6,615
6,309
14,686
17,279 -9.2%
Organics Total
19,035
6,615
6,369
14,958
17,625 -7.4%
Problem Material/Household Hazardous Waste Recycling
6,941
7,042
7,139
7,229
7,267 4.7%
Problem Material/Household Hazardous Waste Disposed
9,782
9,737
9,749
9,760 9,788 0.1%
Problem Material/Household Hazardous Waste Total
16,723
16,779
16,888
16,989
17,055 2.0%
Construction Landfilled (Minneapolis Public Works)
8,363
7,462
6,125
6,661
6,613 -20.9%
Residential Yard Waste
17,089
15,696
19,523
19,076
15,875 -7.1%

58
All Waste Types Total
539,108
530,372
478,256
451,900
480,285 -10.9%
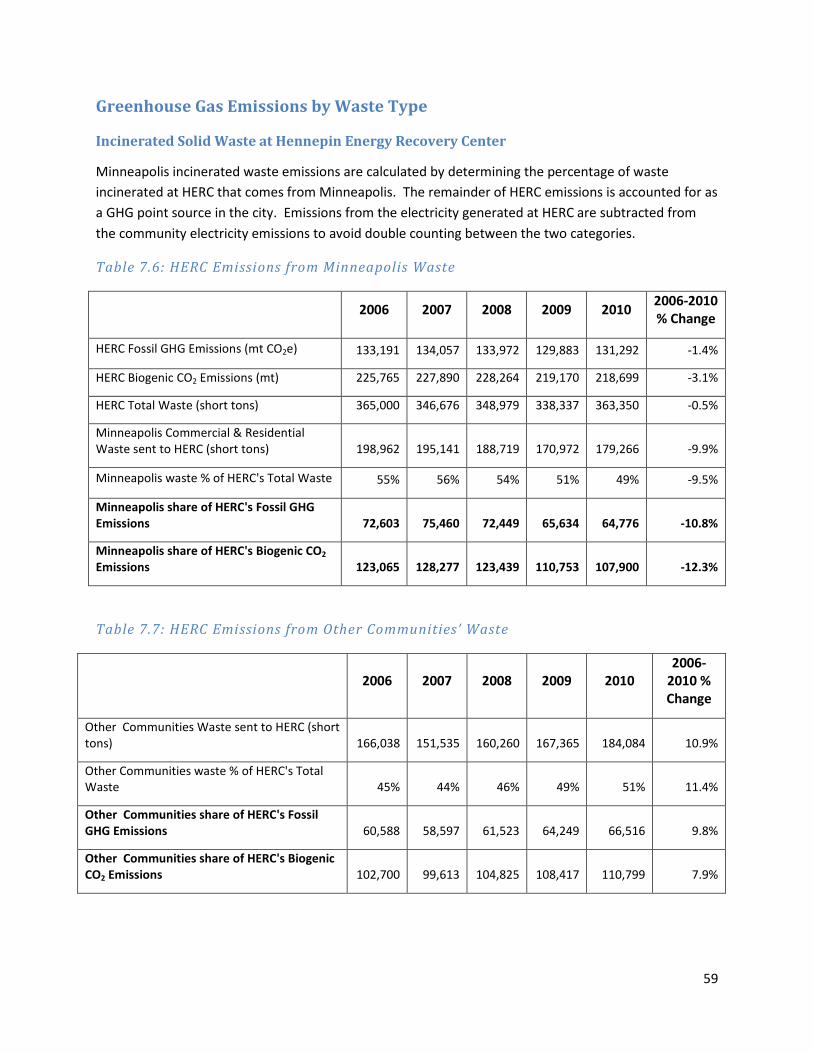
59
Greenhouse Gas Emissions by Waste Type
Incinerated Solid Waste at Hennepin Energy Recovery Center
Minneapolis incinerated waste emissions are calculated by determining the percentage of waste incinerated at HERC that comes from Minneapolis. The remainder of HERC emissions is accounted for as a GHG point source in the city. Emissions from the electricity generated at HERC are subtracted from the community electricity emissions to avoid double counting between the two categories.
Table 7.6: HERC Emissions from Minneapolis Waste
2006 2007 2008 2009 2010 2006-2010 % Change
HERC Fossil GHG Emissions (mt CO2e) 133,191 134,057 133,972 129,883 131,292 -1.4%
HERC Biogenic CO2 Emissions (mt) 225,765 227,890 228,264 219,170 218,699 -3.1%
HERC Total Waste (short tons) 365,000 346,676 348,979 338,337 363,350 -0.5%
Minneapolis Commercial & Residential Waste sent to HERC (short tons)
198,962
195,141
188,719
170,972
179,266 -9.9%
Minneapolis waste % of HERC's Total Waste 55% 56% 54% 51% 49% -9.5%
Minneapolis share of HERC's Fossil GHG Emissions 72,603 75,460 72,449 65,634 64,776 -10.8%
Minneapolis share of HERC's Biogenic CO2 Emissions 123,065 128,277 123,439 110,753 107,900 -12.3%
Table 7.7: HERC Emissions from Other Communities’ Waste
2006 2007 2008 2009 2010 2006-
2010 % Change
Other Communities Waste sent to HERC (short tons) 166,038 151,535 160,260 167,365 184,084 10.9%
Other Communities waste % of HERC's Total Waste 45% 44% 46% 49% 51% 11.4%
Other Communities share of HERC's Fossil GHG Emissions 60,588 58,597 61,523 64,249 66,516 9.8%
Other Communities share of HERC's Biogenic CO2 Emissions 102,700 99,613 104,825 108,417 110,799 7.9%

60
Landfilled Solid Waste
Using the commercial landfilled waste estimates from table 7.3, the landfilled waste total was divided into waste categories using the metro region’s average municipal solid waste composition profile from the MPCA’s Minnesota Municipal Solid Waste Composition Study.33 The metro region’s solid waste composition is in table 7.8. The MPCA waste categories were organized into the broader waste types the CACP software uses. The landfilled totals by each CACP waste category and the resulting landfill GHG emissions are in table 7.9.
The rate of GHG emissions from landfilled solid waste depends on the landfill conditions and waste composition. Therefore, the GHG emissions from waste landfilled in a given year do not necessarily occur during the same calendar year. The GHG emission totals in table 7.9 are the “lifetime” emissions from waste landfilled in each calendar year.
Table 7.8: Metro Region Solid Waste Composition
MPCA Categories Metro Region
Paper 34.2%
Plastic 11.0%
Metals 4.4%
Glass 2.7%
Organic Materials 27.3%
Yard Waste 2.9%
Food Waste 11.0%
Wood/Textiles 9.8%
Diapers 1.9%
Other Organic 1.7%
Problem Materials 1.8%
HHW/HW 0.3%
Other Waste 18.3%
Total 100.0%
33 Minnesota Pollution Control Agency (March 2000). http://www.pca.state.mn.us/index.php/waste/waste-and-cleanup/waste-management/solid-waste/integrated-solid-waste-management/minnesota-msw-composition-study.html.
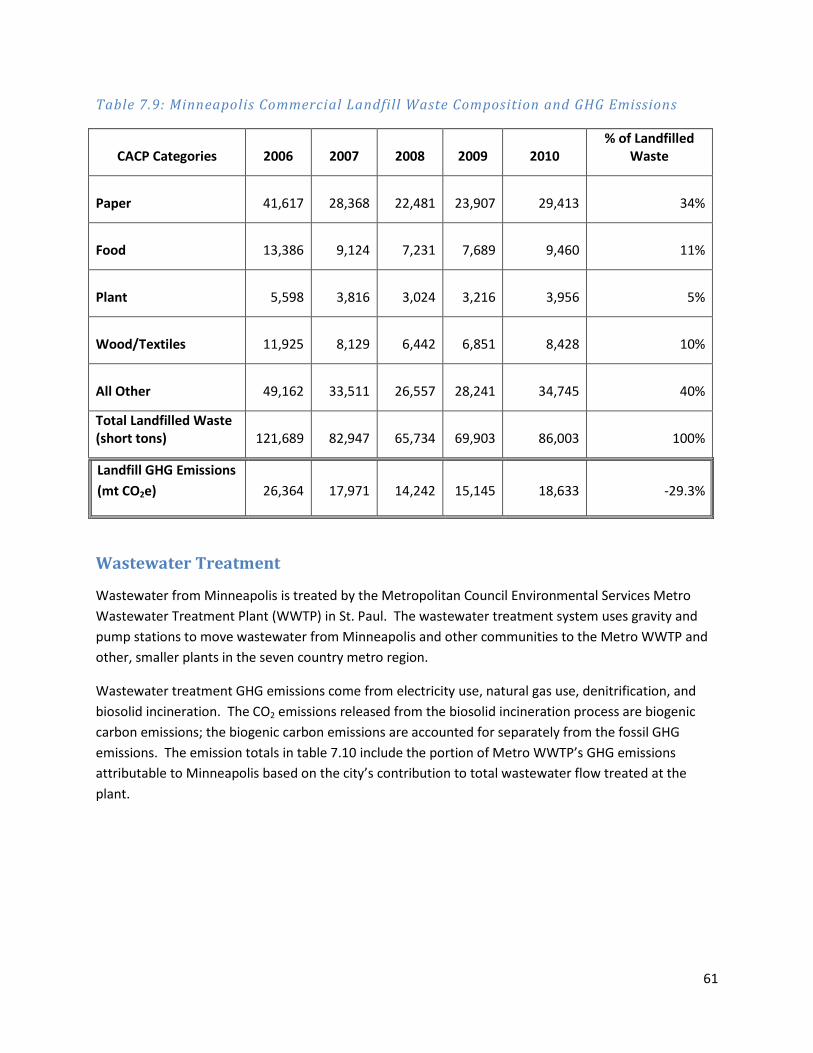
61
Table 7.9: Minneapolis Commercial Landfill Waste Composition and GHG Emissions
CACP Categories 2006 2007 2008 2009 2010 % of Landfilled
Waste
Paper
41,617
28,368
22,481
23,907
29,413 34%
Food
13,386
9,124
7,231
7,689
9,460 11%
Plant
5,598
3,816
3,024
3,216
3,956 5%
Wood/Textiles
11,925
8,129
6,442
6,851
8,428 10%
All Other
49,162
33,511
26,557
28,241
34,745 40%
Total Landfilled Waste (short tons)
121,689
82,947
65,734
69,903
86,003 100%
Landfill GHG Emissions (mt CO2e)
26,364
17,971
14,242
15,145
18,633 -29.3%
Wastewater Treatment
Wastewater from Minneapolis is treated by the Metropolitan Council Environmental Services Metro Wastewater Treatment Plant (WWTP) in St. Paul. The wastewater treatment system uses gravity and pump stations to move wastewater from Minneapolis and other communities to the Metro WWTP and other, smaller plants in the seven country metro region.
Wastewater treatment GHG emissions come from electricity use, natural gas use, denitrification, and biosolid incineration. The CO2 emissions released from the biosolid incineration process are biogenic carbon emissions; the biogenic carbon emissions are accounted for separately from the fossil GHG emissions. The emission totals in table 7.10 include the portion of Metro WWTP’s GHG emissions attributable to Minneapolis based on the city’s contribution to total wastewater flow treated at the plant.

62
Table 7.10: Metro Wastewater Treatment Plant Emissions Attributable to Minneapolis Wastewater
20065 200734 2008 2009 2010
Metro Plant Fossil GHG Emissions Attributable to Minneapolis (Scope 1 & 2, mt CO2e)
57,252
54,557
51,897
49,105
46,476
% of Biogenic Carbon Dioxide Emissions Attributable to Minneapolis (mt CO2)
36,639
36,639
35,136
32,732
42,134
Summary of Waste GHG Emissions
Solid waste landfill, solid waste incineration, and wastewater treatment GHG emission totals are summarized in table 7.11 (fossil GHG emissions) and table 7.12 (biogenic emissions).
Table 7.11: Waste Treatment Fossil GHG Emissions
Fossil GHG Emissions (mt CO2e) 2006 2007 2008 2009 2010 2006-2010 % Change
Minneapolis Landfilled Waste 26,364 17,971 14,242 15,145 18,633 -29.3%
Minneapolis HERC Waste Incineration 72,603 75,460 72,449 65,634 64,776 -10.8%
Minneapolis Wastewater Treatment
57,252 54,557 51,897 49,105 46,476 -18.8%
Total Waste Treatment Fossil GHG Emissions
156,219
147,988
138,588
129,884
129,885 -16.9%
34GHG emission data for Metro Plant were available for the years 2008 to 2010. 2006 and 2007 fossil GHG emissions were estimated by fitting a trend line to 2008 to 2010 data. Since biogenic emissions increased in 2010, 2006 and 2007 biogenic emissions were estimated as an average of the 2008 to 2010 data.
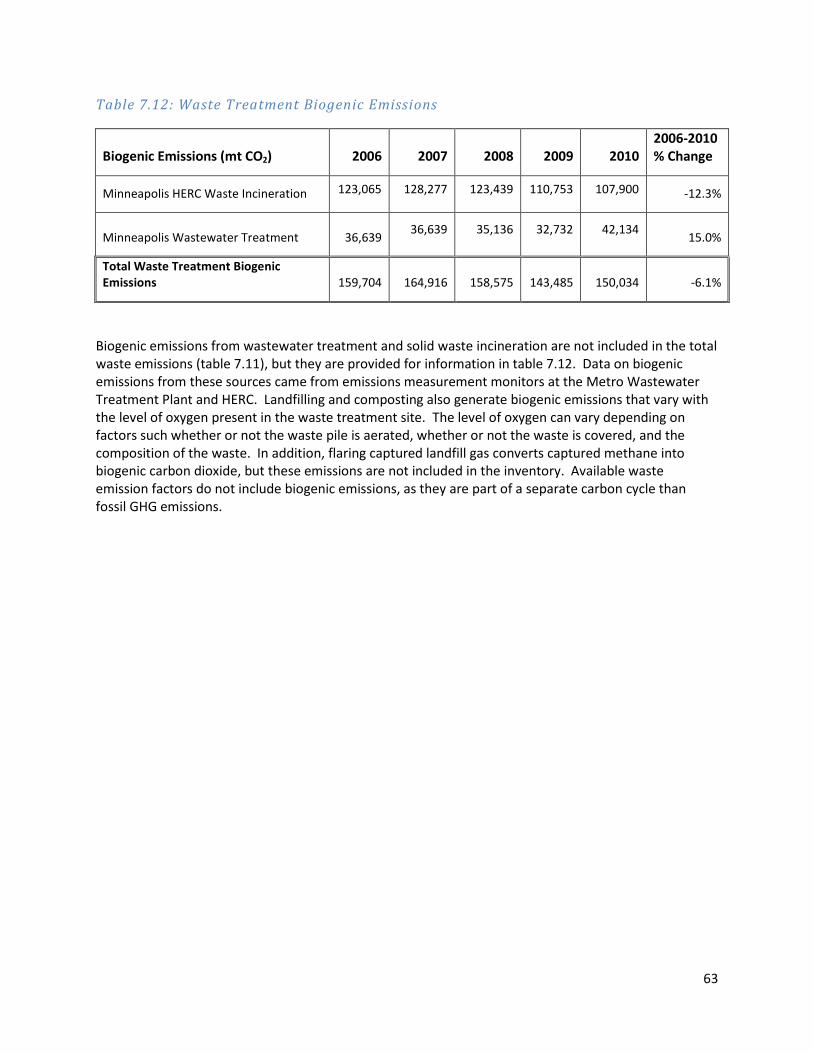
63
Table 7.12: Waste Treatment Biogenic Emissions
Biogenic Emissions (mt CO2) 2006 2007 2008 2009 2010 2006-2010 % Change
Minneapolis HERC Waste Incineration 123,065 128,277 123,439 110,753 107,900 -12.3%
Minneapolis Wastewater Treatment
36,639 36,639 35,136 32,732 42,134 15.0%
Total Waste Treatment Biogenic Emissions
159,704
164,916
158,575
143,485
150,034 -6.1%
Biogenic emissions from wastewater treatment and solid waste incineration are not included in the total waste emissions (table 7.11), but they are provided for information in table 7.12. Data on biogenic emissions from these sources came from emissions measurement monitors at the Metro Wastewater Treatment Plant and HERC. Landfilling and composting also generate biogenic emissions that vary with the level of oxygen present in the waste treatment site. The level of oxygen can vary depending on factors such whether or not the waste pile is aerated, whether or not the waste is covered, and the composition of the waste. In addition, flaring captured landfill gas converts captured methane into biogenic carbon dioxide, but these emissions are not included in the inventory. Available waste emission factors do not include biogenic emissions, as they are part of a separate carbon cycle than fossil GHG emissions.

64
Appendix 8: Air Travel GHG Emissions
The Minneapolis St. Paul International Airport (MSP) is located in Bloomington. The Metropolitan Airport Commission conducted a MSP GHG Inventory for the years 2005, 2007, and 2009.35 The inventory estimated emissions that 1) occur on the ground or within 3,000 atmospheric feet of the MSP-owned property, and 2) are from flights departing from the airport. Emissions on the ground and those occurring below 3,000 feet (takeoff and landing) above ground level were calculated using fuel burn rates and time in each mode of the landing-takeoff cycle. Emissions above 3,000 feet above ground level were calculated by assuming all aircraft fuel dispensed at MSP is tied to the MSP aircraft-related CO2e footprint and subtracting out the fuel consumed at or below 3,000 feet. The total flight and airport emissions inventory results for the years 2005, 2007, and 2009 were used with a linear trendline to estimate 2006, 2008, and 2010 flight and airport emissions. 36
Minneapolis’s share of total departing flight and airport emissions were assumed to be equal to the percent of vehicle trips associated with Minneapolis that had either an origin or destination at the airport. According to the Metropolitan Council, 14.2% of all vehicle trips to and from MSP had Minneapolis as an origin or destination in 2000 and 2005. The same share of vehicle trips was assumed for 2006, 2007, and 2008. The analysis was repeated in 2009 (13.0% share) and 2010 (14.0% share).
The results are presented in table 8.1 and chart 8.1. Between 2006 and 2010 flight and airport GHG emissions assigned to Minneapolis decreased 38% while the airport’s overall emissions decreased 37%. In their 2009 GHG inventory report the Metropolitan Airports Commission attribute the large reduction to:
• Change in fleet mix
• Increased fuel efficiency in engines
• Reduced flight operations
• Increased flight operational efficiency (passengers/flight)37
35 Metropolitan Airports Commission Greenhouse Gas Report (December 2010). http://www.mspairport.com/docs/about-msp/sustainability/MSP-2010-GHG-Report-Jan-2011.aspx. 36 Ibid, table 3-2. 37 Ibid, p. vi.
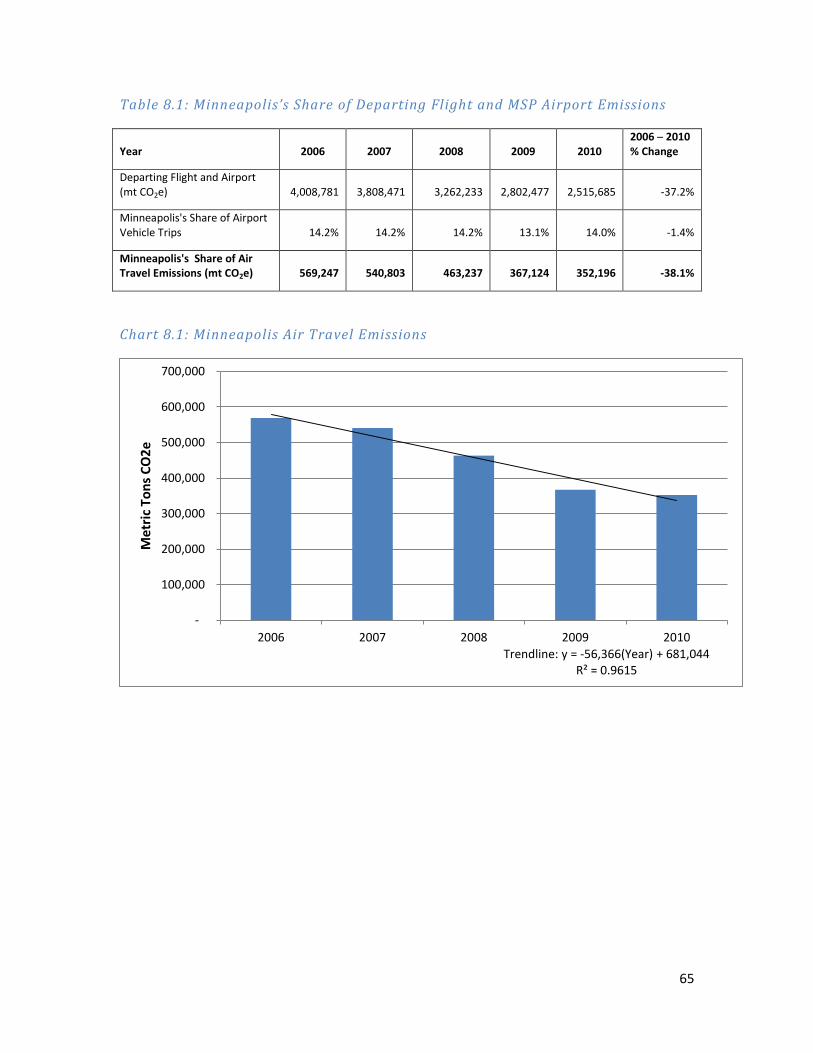
65
Table 8.1: Minneapolis’s Share of Departing Flight and MSP Airport Emissions
Year 2006 2007 2008 2009 2010 2006 ─ 2010 % Change
Departing Flight and Airport (mt CO2e)
4,008,781
3,808,471
3,262,233
2,802,477
2,515,685 -37.2%
Minneapolis's Share of Airport Vehicle Trips 14.2% 14.2% 14.2% 13.1% 14.0% -1.4%
Minneapolis's Share of Air Travel Emissions (mt CO2e)
569,247
540,803
463,237
367,124
352,196 -38.1%
Chart 8.1: Minneapolis Air Travel Emissions
Trendline: y = -56,366(Year) + 681,044 R² = 0.9615
-
100,000
200,000
300,000
400,000
500,000
600,000
700,000
2006 2007 2008 2009 2010
Met
ric T
ons C
O2e
66
Appendix 9: Consumption Inventory Methodology The 2010 Minneapolis greenhouse gas consumption inventory was developed using the CoolClimate Household Carbon Footprint Calculator developed by UC Berkeley and the Cool Climate Network. This tool combines an economic input-output lifecycle-assessment (EIO-LCA) inventory method with direct emissions calculations for certain products to produce an average household emissions rate specific to a city or region. For certain product categories, this method takes economic activity in a detailed sector as an input and outputs estimated emissions. These emissions are estimated from throughout the supply chain.
The method for estimating greenhouse gas emissions from Minneapolis households consisted of two primary steps:
1. Using the calculator to develop a per-household estimate of emissions 2. Refining the calculator output with Minneapolis-specific data on energy consumption
for housing 3. Estimating a citywide emissions figure
Developing a per-household emissions estimate The CoolClimate Household calculator is available at http://coolclimate.berkeley.edu/carboncalculator. A basic per-household emissions estimate can be completed by entering the city name into the calculator. Average household size and income classes are based on Consumer Expenditure Survey data specific to the Twin Cities metropolitan region.
A full list of data sources and calculations used by the tool is available at: http://www.coolcalifornia.org/calculator-documentation.
Refining the per-household estimate Because Minneapolis collects residential energy use data from utilities, it is possible to refine the calculator data to more accurately reflect emissions from energy use in Minneapolis homes.
To adjust the calculator, the average electricity and natural gas use per household was calculated by dividing the total residential use by the number of households in that year. This annual average household use can then be entered on the “Housing” section of the calculator.
Estimating a citywide emissions figure The CoolClimate calculator estimates a per-household figure for emissions. To estimate a figure for all Minneapolis households, the emissions from each detailed sector were multiplied by the number of households in Minneapolis in 2010.
Limitations The expenditure survey used by the CoolClimate calculator is regional, and so is not specific to Minneapolis consumers. Local purchasing habits and economic activity may vary from what is reported by the Consumer Expenditure Survey.

67
Other defaults in the calculator, such as miles driven per year and number of vehicles owned are based on national or regional averages, and thus are not specific to Minneapolis households, who may use transit or other non-auto modes more than regional averages.