
Contents i IC Engines
765
Transcript of Contents i IC Engines
Contents i
IC Engines Fourth Edition

ii ContentsAbout the Author
V. GANESAN currently working as Professor Emeritus in the
Department of Mechanical Engineering, Indian Institute of
Technology Madras, is the recipient of Anna University National
Award for Outstanding Academic for the Year 1997. He was the
Head of the Department of Mechanical Engineering, at Indian
Institute of Technology Madras between October 2000 and June
2002. He was also the Dean (Academic Research) at Indian Institute
of Technology Madras between January 1998 and October 2000.
He has so far published more than 350 research papers in national
and international journals and conferences and has guided 20 M.S. and 40 Ph.D.s.
Among other awards received by him are the Babcock Power Award for the best fundamental
scientific paper of Journal of Energy (1987), the Institution of Engineers Merit Prize and Citation
(1993), SVRCET Surat Prize (1995), Sri Rajendra Nath Mookerjee Memorial Medal (1996),
Automobile Engineer of the Year by the Institution of Automobile Engineers (India) (2001),
Institution of Engineers (India), Tamil Nadu Scientist Award (TANSA) – 2003 by Tamil Nadu
State Council for Science and Technology, ISTE Periyar Award for Best Engineering College
Teacher (2004), N K Iyengar Memorial Prize (2004) by Institution of Engineers (India), SVRCET
Surat Prize (2004), Khosla National Award (2004), Bharat Jyoti Award (2006), UWA Outstanding
Intellectuals of the 21st Century Award by United Writers Association, Chennai (2006), 2006 SAE
Cliff Garrett Turbomachinery Engineering Award by SAE International, USA, Sir Rajendra Nath
Mookerjee Memorial Prize (2006) by Institution of Engineers, Environmental Engineering Design
Award 2006 by The Institution of Engineers (India), 2006 SAE Cliff Garrett Turbomachinery
Engineering Award (2007), Excellence in Engineering Education (Triple “E”) Award by SAE
International, USA (2007), Rashtriya Gaurav Award in the field of Science and Technology by
India International Friendship Society (2012), and Best Citizens of India Award by International
Publishing House New Delhi (2012). He is the Fellow of Indian National Academy of Engineering,
National Environmental Science Academy, Fellow of SAE International, USA, and Institution of
Engineers (India). He has also been felicitated by International Combustion Institute Indian Section
for lifetime contribution in the field of I C engines and combustion.
Dr. Ganesan has authored several other books on Gas Turbines, Computer Simulation of Four-
Stroke Spark-Ignition Engines and Computer Simulation of Four-Stroke Compression-Ignition
Engines and has also edited several proceedings. He was formerly the Chairman of Combustion
Institute (Indian Section) and is currently the Chairman of Engineering Education Board of SAE
(India), besides being a member of many other professional societies.
Dr. Ganesan is actively engaged in a number of sponsored research projects and is a consultant
for various industries and R&D organizations.
Contents iii
Tata McGraw Hill Education Private LimitedNew Delhi
McGraw-Hill Offices
New Delhi New York St louis San Francisco Auckland Bogotá Caracas
Kuala lumpur lisbon london Madrid Mexico City Milan Montreal
San Juan Santiago Singapore Sydney Tokyo Toronto
V Ganesan
Professor Emeritus
Department of Mechanical Engineering
Indian Institute of Technology Madras
Chennai
IC Engines Fourth Edition

iv Contents
Published by the Tata McGraw Hill Education Private Limited,
7 West Patel Nagar, New Delhi 110 008.
IC Engines
Copyright © 2012, by Tata McGraw Hill Education Private Limited.
No part of this publication may be reproduced or distributed in any form or by any means, electronic,
mechanical, photocopying, recording, or otherwise or stored in a database or retrieval system without
the prior written permission of the publishers. The program listings (if any) may be entered, stored and
executed in a computer system, but they may not be reproduced for publication.
This edition can be exported from India only by the publishers,
Tata McGraw Hill Education Private Limited.
ISBN (13): 978-1-25-900619-7
ISBN (10): 1-25-900619-0
Vice President and Managing Director—MHE: Ajay Shukla
Head—Higher Education Publishing and Marketing: Vibha Mahajan
Publishing Manager—SEM & Tech Ed.: Shalini Jha
Sr Editorial Researcher: Harsha Singh
Executive—Editorial Services: Sohini Mukherjee
Sr Production Manager: Satinder Singh Baveja
Production Executive: Anuj K Shriwastava
Marketing Manager—Higher Education: Vijay Sarathi
Sr Product Specialist—SEM and Tech. Voc: Tina Jajoriya
Graphic Designer—Cover: Meenu Raghav
General Manager—Production: Rajender P Ghansela
Production Manager—Production: Reji Kumar
Information contained in this work has been obtained by Tata McGraw-Hill, from sources believed to be
reliable. However, neither Tata McGraw-Hill nor its authors guarantee the accuracy or completeness of
any information published herein, and neither Tata McGraw-Hill nor its authors shall be responsible for
any errors, omissions, or damages arising out of use of this information. This work is published with the
understanding that Tata McGraw-Hill and its authors are supplying information but are not attempting
to render engineering or other professional services. If such services are required, the assistance of an
appropriate professional should be sought.
Printed at Avon Printers, Plot No. 16, Main Loni Road, Jawahar Nagar, Industrial Area, Shahdara,
Delhi-110094.
Cover Printer: AP Offset
R
Tata McGraw-Hill

DEDICATED TO MY BELOVED MOTHER
L. SEETHA AMMAL

FOREWORD
Focussing on the need of a first level text book for the undergraduates, post-graduates and a professional reference book for practicing engineers, the au-thor of this work Dr. V. Ganesan has brought forth this volume using hisextensive teaching and research experience in the field of internal combustionengineering. It is a great pleasure to write a foreword to such a book whichsatisfies a long-felt requirement.
For selfish reasons alone, I wish that this book would have come out muchearlier for the benefit of several teachers like me who have finished their in-nings a long time ago. For me, this would have been just the required textbook for my young engineering students and engineers in the transportationand power fields. The style of the book reflects the teaching culture of pre-mier engineering institutions like IITs, since a vast topic has to be covered in acomprehensive way in a limited time. Each chapter is presented with elegantsimplicity requiring no special prerequisite knowledge of supporting subjects.Self-explanatory sketches, graphs, line schematics of processes and tables havebeen generously used to curtail long and wordy explanations. Numerous il-lustrated examples, exercises and problems at the end of each chapter serveas a good source material to practice the application of the basic principlespresented in the text. SI system of units has been used throughout the bookwhich is not so readily available in the currently-used books.
It is not a simple task to bring out a comprehensive book on an all-encompassing subject like internal combustion engines. Over a century haselapsed since the discovery of the diesel and gasoline engines. Excluding a fewdevelopments of rotary combustion engines, the IC engines has still retainedits basic anatomy. As a descendent of the steam engine, it is still crystallizedinto a standard piston-in-cylinder mechanism, reciprocating first in order torotate finally. The attendant kinematics requiring numerous moving partsare still posing dynamic problems of vibration, friction losses and mechanicalnoise. Empiricism has been the secret of its evolution in its yester years.
As our knowledge of engine processes has increased, these engines have con-tinued to develop on a scientific basis. The present day engines have to satisfythe strict environmental constraints and fuel economy standards in additionto meeting the competitiveness of the world market. Today, the IC engine hassynthesized the basic knowledge of many disciplines — thermodynamics, fluidflow, combustion, chemical kinetics and heat transfer as applied to a systemwith both spatial and temporal variations in a state of non-equilibrium. Withthe availability of sophisticated computers, art of multi-dimensional mathe-matical modelling and electronic instrumentation have added new refinementsto the engine design. From my personal knowledge, Dr. Ganesan has himselfmade many original contributions in these intricate areas. It is a wonder forme how he has modestly kept out these details from the text as it is beyondthe scope of this book. However, the reader is not denied the benefits of these
viii IC Engines
investigations. Skillfully the overall findings and updated information havebeen summarized as is reflected in topics on combustion and flame propa-gation, engine heat transfer, scavenging processes and engine emissions – toname a few examples. Indeed, it must have been a difficult task to summa-rize the best of the wide ranging results of combustion engine research andcompress them in an elegant simple way in this book. The author has alsointeracted with the curriculum development cell so that the contents of thebook will cater to the needs of any standard accredited university.
I congratulate the author, Dr. V. Ganesan on bringing out this excellentbook for the benefit of students in IC engines. While many a student willfind it rewarding to follow this book for his class work, I also hope that it willmotivate a few of them to specialize in some key areas and take up combustionengine research as a career. With great enthusiasm, I recommend this bookto students and practicing engineers.
B. S. Murthy
Former Professor, IIT Madras
PREFACE
We are bringing out the fourth edition of the book after the third editionhas undergone fifteen reprints. Just to recall the history, the first edition ofthis book, published in 1994, had 15 Chapters which were framed in sucha way that it will be useful to both academia and industry. Based on thefeedback and response from the students and teachers the book was revisedin 2003 with the addition of five more chapters taking into account the recentdevelopments in engine technology and management. Again, the feedbackfrom academia helped me to revise the book in 2007 for the second time withthe addition of multiple choice questions. It is gratifying to note that all thethree editions have received overwhelming response and appreciation from thestudents, teachers and practicing engineers.
I am extremely happy to receive the continuous positive feedback from thestudents and teachers. The review of the third edition by eminent reviewershas prompted me to revise the book to bring out this edition. In this, I haveincluded a new chapter on Nonconventional Engines, which brings out themodern trends in the I C Engine development. The topics included are:
• Common Rail Direct Injection (CRDI) Engine
• Dual fuel and Multi-fuel Engine
• Free Piston Engine
• Gasoline Direct Injection (GDI) Engine
• Homogeneous charge Compression Ignition (HCCI) Engine
• Lean Burn Engine
• Stirling Engine
• Stratified Charge Engine
• Variable Compression Ratio(VCR) Engine
• Wankel Engine
I am sure that this will satisfy the long felt need of teachers, students andpracticing engineers to understand the latest developments. Further, I haveincluded the topic on vegetable oil and biodiesel in the chapter on alternatefuels which is the latest trend in engine fuel research. Additional materials,wherever appropriate, have been added in various chapters. Almost all thechapters have been thoroughly revised.
In writing this book, I have kept in mind the tremendous amount of ma-terial which the students and practicing engineers of today are expected tocover. On this count, the chapters have been organized to form a continuous

x IC Engines
logical narrative. Maximum care has been taken to minimize the errors andtyping mistakes. I would be obliged to the readers for informing me any sucherrors and mistakes and will be thankful for bringing them to my notice. Iam grateful to all those who are supporting this book.
It would be impossible to refer in detail, to the many persons whom Ihave consulted in the compilation of this work. I take this opportunity tothank all those who have helped me directly or indirectly in bringing outthis book. This edition would not have been brought to this perfection butfor the sincere and dedicated efforts of Ms. Vijayashree, who has helped mein compiling this book. My thanks are due to the Centre for ContinuingEducation of IIT Madras for their support under book writing scheme.
I hope this edition will also receive the same continued overwhelming sup-port from academia and practicing engineers. I will be thankful for any con-structive criticism for improvements in the future edition of the book.
V GANESAN

Contents
Foreword vii
Preface ix
Nomenclature xxxi
1 Introduction 1
1.1 Energy Conversion 1
1.1.1 Definition of ‘Engine’ 1
1.1.2 Definition of ‘Heat Engine’ 1
1.1.3 Classification and Some Basic Details of Heat Engines 1
1.1.4 External Combustion and Internal Combustion Engines 2
1.2 Basic Engine Components and Nomenclature 3
1.2.1 Engine Components 3
1.2.2 Nomenclature 5
1.3 The Working Principle of Engines 6
1.3.1 Four-Stroke Spark-Ignition Engine 6
1.3.2 Four-Stroke Compression-Ignition Engine 8
1.3.3 Four-stroke SI and CI Engines 10
1.3.4 Two-Stroke Engine 10
1.3.5 Comparison of Four-Stroke and Two-Stroke Engines 12
1.4 Actual Engines 13
1.5 Classification of IC Engines 13
1.5.1 Cycle of Operation 16
1.5.2 Type of Fuel Used 16
1.5.3 Method of Charging 17
1.5.4 Type of Ignition 17
1.5.5 Type of Cooling 17
1.5.6 Cylinder Arrangements 17
1.6 Application of IC Engines 19
1.6.1 Two-Stroke Gasoline Engines 19
1.6.2 Two-Stroke Diesel Engines 20
1.6.3 Four-Stroke Gasoline Engines 20
1.6.4 Four-Stroke Diesel Engines 21
xii Contents
1.7 The First Law Analysis of Engine Cycle 21
1.8 Engine Performance Parameters 22
1.8.1 Indicated Thermal Efficiency (ηith) 22
1.8.2 Brake Thermal Efficiency (ηbth) 23
1.8.3 Mechanical Efficiency (ηm) 23
1.8.4 Volumetric Efficiency (ηv) 23
1.8.5 Relative Efficiency or Efficiency Ratio (ηrel) 24
1.8.6 Mean Effective Pressure (pm) 24
1.8.7 Mean Piston Speed (sp) 25
1.8.8 Specific Power Output (Ps) 25
1.8.9 Specific Fuel Consumption (sfc) 26
1.8.10 Inlet-Valve Mach Index (Z) 26
1.8.11 Fuel-Air (F/A) or Air-Fuel Ratio (A/F ) 26
1.8.12 Calorific Value (CV ) 27
1.9 Design and Performance Data 28
Worked out Examples 30
Review Questions 37
Exercise 38
Multiple Choice Questions 42
2 Air-Standard Cycles and Their Analysis 47
2.1 Introduction 47
2.2 The Carnot Cycle 48
2.3 The Stirling Cycle 50
2.4 The Ericsson Cycle 51
2.5 The Otto Cycle 52
2.5.1 Thermal Efficiency 53
2.5.2 Work Output 54
2.5.3 Mean Effective Pressure 55
2.6 The Diesel Cycle 55
2.6.1 Thermal Efficiency 56
2.6.2 Work Output 58
2.6.3 Mean Effective Pressure 58
2.7 The Dual Cycle 58
2.7.1 Thermal Efficiency 58
2.7.2 Work Output 60
2.7.3 Mean Effective Pressure 60
2.8 Comparison of the Otto, Diesel and Dual Cycles 61
2.8.1 Same Compression Ratio and Heat Addition 61
2.8.2 Same Compression Ratio and Heat Rejection 62
2.8.3 Same Peak Pressure, Peak Temperature & Heat Rejection 62
2.8.4 Same Maximum Pressure and Heat Input 63
2.8.5 Same Maximum Pressure and Work Output 64

Contents xiii
2.9 The Lenoir Cycle 64
2.10 The Atkinson Cycle 65
2.11 The Brayton Cycle 66
Worked out Examples 68
Review Questions 97
Exercise 98
Multiple Choice Questions 103
3 Fuel–Air Cycles and their Analysis 107
3.1 Introduction 107
3.2 Fuel–Air Cycles and their Significance 107
3.3 Composition of Cylinder Gases 109
3.4 Variable Specific Heats 109
3.5 Dissociation 111
3.6 Effect of Number of Moles 113
3.7 Comparison of Air–Standard and Fuel–Air Cycles 114
3.8 Effect of Operating Variables 115
3.8.1 Compression Ratio 115
3.8.2 Fuel–Air Ratio 117
Worked out Examples 121
Review Questions 128
Exercise 128
Multiple Choice Questions 129
4 Actual Cycles and their Analysis 131
4.1 Introduction 131
4.2 Comparison of Air-Standard and Actual Cycles 131
4.3 Time Loss Factor 132
4.4 Heat Loss Factor 137
4.5 Exhaust Blowdown 137
4.5.1 Loss Due to Gas Exchange Processes 138
4.5.2 Volumetric Efficiency 139
4.6 Loss due to Rubbing Friction 142
4.7 Actual and Fuel-Air Cycles of CI Engines 142
Review Questions 143
Multiple Choice Questions 144
5 Conventional Fuels 147
5.1 Introduction 147
5.2 Fuels 147
5.2.1 Solid Fuels 147
5.2.2 Gaseous Fuels 147
5.2.3 Liquid Fuels 148
xiv Contents
5.3 Chemical Structure of Petroleum 148
5.3.1 Paraffin Series 148
5.3.2 Olefin Series 149
5.3.3 Naphthene Series 150
5.3.4 Aromatic Series 150
5.4 Petroleum Refining Process 151
5.5 Important Qualities of Engine Fuels 153
5.5.1 SI Engine Fuels 154
5.5.2 CI Engine Fuels 156
5.6 Rating of Fuels 157
5.6.1 Rating of SI Engine Fuels 157
5.6.2 Rating of CI Engine Fuels 158
Review Questions 159
Multiple Choice Questions 160
6 Alternate Fuels 163
6.1 Introduction 163
6.2 Possible Alternatives 164
6.3 Solid Fuels 164
6.4 Liquid Fuels 166
6.4.1 Alcohol 166
6.4.2 Methanol 167
6.4.3 Ethanol 168
6.4.4 Alcohol for SI Engines 168
6.4.5 Reformulated Gasoline for SI Engine 169
6.4.6 Water-Gasoline Mixture for SI Engines 169
6.4.7 Alcohol for CI Engines 170
6.5 Surface-Ignition Alcohol CI Engine 171
6.6 Spark-Assisted Diesel 172
6.7 Vegetable Oil 172
6.8 Biodiesel 173
6.8.1 Production 174
6.8.2 Properties 175
6.8.3 Environmental Effects 175
6.8.4 Current Research 175
6.9 Gaseous Fuels 176
6.9.1 Hydrogen 176
6.10 Hydrogen Engines 177
6.10.1 Natural Gas 178
6.10.2 Advantages of Natural Gas 179
6.10.3 Disadvantages of Natural Gas 179
6.10.4 Compressed Natural Gas (CNG) 180
6.10.5 Liquefied Petroleum Gas (LPG) 180
Contents xv
6.10.6 Advantages and Disadvantages of LPG 181
6.10.7 Future Scenario for LPG Vehicles 183
6.10.8 LPG (Propane) Fuel Feed System 183
6.11 Dual Fuel Operation 183
6.12 Other Possible Fuels 184
6.12.1 Biogas 184
6.12.2 Producer Gas 185
6.12.3 Blast Furnace Gas 185
6.12.4 Coke Oven Gas 185
6.12.5 Benzol 185
6.12.6 Acetone 186
6.12.7 Diethyl Ether 186
Review Questions 186
Multiple Choice Questions 187
7 Carburetion 189
7.1 Introduction 189
7.2 Definition of Carburetion 189
7.3 Factors Affecting Carburetion 189
7.4 Air–Fuel Mixtures 190
7.5 Mixture Requirements at Different Loads and Speeds 190
7.6 Automotive Engine Air–Fuel Mixture Requirements 192
7.6.1 Idling Range 192
7.6.2 Cruising Range 193
7.6.3 Power Range 194
7.7 Principle of Carburetion 195
7.8 The Simple Carburetor 196
7.9 Calculation of the Air–Fuel Ratio 197
7.9.1 Air–Fuel Ratio Neglecting Compressibility of Air 200
7.9.2 Air–Fuel Ratio Provided by a Simple Carburetor 200
7.9.3 Size of the Carburetor 201
7.10 Essential Parts of a Carburetor 201
7.10.1 The Fuel Strainer 201
7.10.2 The Float Chamber 201
7.10.3 The Main Metering and Idling System 202
7.10.4 The Choke and the Throttle 204
7.11 Compensating Devices 206
7.11.1 Air-bleed jet 206
7.11.2 Compensating Jet 207
7.11.3 Emulsion Tube 207
7.11.4 Back Suction Control Mechanism 208
7.11.5 Auxiliary Valve 210
7.11.6 Auxiliary Port 210

xvi Contents
7.12 Additional Systems in Modern Carburetors 210
7.12.1 Anti-dieseling System 211
7.12.2 Richer Coasting System 212
7.12.3 Acceleration Pump System 212
7.12.4 Economizer or Power Enrichment System 212
7.13 Types of Carburetors 213
7.13.1 Constant Choke Carburetor 214
7.13.2 Constant Vacuum Carburetor 214
7.13.3 Multiple Venturi Carburetor 214
7.13.4 Advantages of a Multiple Venturi System 216
7.13.5 Multijet Carburetors 216
7.13.6 Multi-barrel Venturi Carburetor 217
7.14 Automobile Carburetors 218
7.14.1 Solex Carburetors 218
7.14.2 Carter Carburetor 220
7.14.3 S.U. Carburetor 222
7.15 Altitude Compensation 223
7.15.1 Altitude Compensation Devices 224
Worked out Examples 225
Review Questions 234
Exercise 235
Multiple Choice Questions 238
8 Mechanical Injection Systems 241
8.1 Introduction 241
8.2 Functional Requirements of an Injection System 241
8.3 Classification of Injection Systems 242
8.3.1 Air Injection System 242
8.3.2 Solid Injection System 242
8.3.3 Individual Pump and Nozzle System 243
8.3.4 Unit Injector System 244
8.3.5 Common Rail System 244
8.3.6 Distributor System 245
8.4 Fuel Feed Pump 246
8.5 Injection Pump 246
8.5.1 Jerk Type Pump 246
8.5.2 Distributor Type Pump 248
8.6 Injection Pump Governor 248
8.7 Mechanical Governor 250
8.8 Pneumatic Governor 251
8.9 Fuel Injector 251

Contents xvii
8.10 Nozzle 252
8.10.1 Types of Nozzle 253
8.10.2 Spray Formation 255
8.10.3 Quantity of Fuel and the Size of Nozzle Orifice 257
8.11 Injection in SI Engine 258
Worked out Examples 259
Review Questions 266
Exercise 267
Multiple Choice Questions 268
9 Electronic Injection Systems 271
9.1 Introduction 271
9.2 Why Gasoline Injection? 271
9.2.1 Types of Injection Systems 272
9.2.2 Components of Injection System 273
9.3 Electronic Fuel Injection System 275
9.3.1 Merits of EFI System 276
9.3.2 Demerits of EFI System 276
9.4 Multi-Point Fuel Injection (MPFI) System 277
9.4.1 Port Injection 277
9.4.2 Throttle Body Injection System 278
9.4.3 D-MPFI System 278
9.4.4 L-MPFI System 279
9.5 Functional Divisions of MPFI System 279
9.5.1 MPFI-Electronic Control System 279
9.5.2 MPFI-Fuel System 279
9.5.3 MPFI-Air Induction System 279
9.6 Electronic Control System 281
9.6.1 Electronic Control Unit (ECU) 281
9.6.2 Cold Start Injector 282
9.6.3 Air Valve 282
9.7 Injection Timing 283
9.8 Group Gasoline Injection System 284
9.9 Electronic Diesel Injection System 286
9.10 Electronic Diesel Injection Control 287
9.10.1 Electronically Controlled Unit Injectors 287
9.10.2 Electronically Controlled Injection Pumps (Inline andDistributor Type) 288
9.10.3 Common-Rail Fuel Injection System 290
Review Questions 292
Multiple Choice Questions 293
xviii Contents
10 Ignition 295
10.1 Introduction 295
10.2 Energy Requirements for Ignition 295
10.3 The Spark Energy and Duration 296
10.4 Ignition System 296
10.5 Requirements of an Ignition System 297
10.6 Battery Ignition System 297
10.6.1 Battery 298
10.6.2 Ignition Switch 299
10.6.3 Ballast Resistor 299
10.6.4 Ignition Coil 299
10.6.5 Contact Breaker 300
10.6.6 Capacitor 301
10.6.7 Distributor 301
10.6.8 Spark Plug 302
10.7 Operation of a Battery Ignition System 304
10.8 Limitations 305
10.9 Dwell Angle 306
10.10 Advantage of a 12 V Ignition System 307
10.11 Magneto Ignition System 307
10.12 Modern Ignition Systems 309
10.12.1 Transistorized Coil Ignition (TCI) System 310
10.12.2 Capacitive Discharge Ignition (CDI) System 312
10.13 Firing Order 312
10.14 Ignition Timing and Engine Parameters 314
10.14.1 Engine Speed 314
10.14.2 Mixture Strength 315
10.14.3 Part Load Operation 315
10.14.4 Type of Fuel 315
10.15 Spark Advance Mechanism 315
10.15.1 Centrifugal Advance Mechanism 316
10.15.2 Vacuum Advance Mechanism 317
10.16 Ignition Timing and Exhaust Emissions 318
Review Questions 319
Multiple Choice Questions 320
11 Combustion and Combustion Chambers 323
11.1 Introduction 323
11.2 Homogeneous Mixture 323
11.3 Heterogeneous Mixture 324
11.4 Combustion in Spark–Ignition Engines 324
11.5 Stages of Combustion in SI Engines 324
11.6 Flame Front Propagation 326

Contents xix
11.7 Factors Influencing the Flame Speed 327
11.8 Rate of Pressure Rise 329
11.9 Abnormal Combustion 330
11.10 The Phenomenon of Knock in SI Engines 330
11.10.1 Knock Limited Parameters 332
11.11 Effect of Engine Variables on Knock 333
11.11.1 Density Factors 333
11.11.2 Time Factors 334
11.11.3 Composition Factors 335
11.12 Combustion Chambers for SI Engines 336
11.12.1 Smooth Engine Operation 337
11.12.2 High Power Output and Thermal Efficiency 337
11.13 Combustion in Compression-Ignition Engines 339
11.14 Stages of Combustion in CI Engines 342
11.14.1 Ignition Delay Period 342
11.14.2 Period of Rapid Combustion 344
11.14.3 Period of Controlled Combustion 344
11.14.4 Period of After-Burning 344
11.15 Factors Affecting the Delay Period 344
11.15.1 Compression Ratio 345
11.15.2 Engine Speed 346
11.15.3 Output 347
11.15.4 Atomization and Duration of Injection 347
11.15.5 Injection Timing 347
11.15.6 Quality of Fuel 347
11.15.7 Intake Temperature 347
11.15.8 Intake Pressure 348
11.16 The Phenomenon of Knock in CI Engines 348
11.17 Comparison of Knock in SI and CI Engines 350
11.18 Combustion Chambers for CI Engines 352
11.18.1 Direct–Injection Chambers 353
11.18.2 Indirect–Injection Chambers 355
Review Questions 357
Multiple Choice Questions 358
12 Engine Friction and Lubrication 361
12.1 Introduction 361
12.1.1 Direct Frictional Losses 361
12.1.2 Pumping Loss 361
12.1.3 Power Loss to Drive Components to Chargeand Scavenge 362
12.1.4 Power Loss to Drive the Auxiliaries 362
12.2 Mechanical Efficiency 362

xx Contents
12.3 Mechanical Friction 363
12.3.1 Fluid-film or Hydrodynamic Friction 363
12.3.2 Partial-film Friction 363
12.3.3 Rolling Friction 363
12.3.4 Dry Friction 363
12.3.5 Journal Bearing Friction 364
12.3.6 Friction due to Piston Motion 364
12.4 Blowby Losses 364
12.5 Pumping Loss 365
12.5.1 Exhaust Blowdown Loss 365
12.5.2 Exhaust Stroke Loss 365
12.5.3 Intake Stroke Loss 365
12.6 Factors Affecting Mechanical Friction 366
12.6.1 Engine Design 366
12.6.2 Engine Speed 367
12.6.3 Engine Load 367
12.6.4 Cooling Water Temperature 367
12.6.5 Oil Viscosity 367
12.7 Lubrication 367
12.7.1 Function of Lubrication 368
12.7.2 Mechanism of Lubrication 368
12.7.3 Elastohydrodynamic Lubrication 371
12.7.4 Journal Bearing Lubrication 372
12.7.5 Stable Lubrication 374
12.8 Lubrication of Engine Components 375
12.8.1 Piston 375
12.8.2 Crankshaft Bearings 376
12.8.3 Crankpin Bearings 376
12.8.4 Wristpin Bearing 376
12.9 Lubrication System 377
12.9.1 Mist Lubrication System 377
12.9.2 Wet Sump Lubrication System 379
12.9.3 Dry Sump Lubrication System 382
12.10 Crankcase Ventilation 383
12.11 Properties of Lubricants 384
12.11.1 Viscosity 385
12.11.2 Flash and Fire Points 385
12.11.3 Cloud and Pour Points 385
12.11.4 Oiliness or Film Strength 386
12.11.5 Corrosiveness 386
12.11.6 Detergency 386
12.11.7 Stability 386
12.11.8 Foaming 386
Contents xxi
12.12 SAE Rating of Lubricants 386
12.12.1 Single-grade 386
12.12.2 Multi-grade 387
12.13 Additives for Lubricants 388
12.13.1 Anti-oxidants and Anticorrosive Agents 388
12.13.2 Detergent-Dispersant 389
12.13.3 Extreme Pressure Additives 389
12.13.4 Pour Point Depressors 389
12.13.5 Viscosity Index Improvers 389
12.13.6 Oiliness and Film Strength Agents 389
12.13.7 Antifoam Agents 390
Review Questions 390
Multiple Choice Questions 390
13 Heat Rejection and Cooling 393
13.1 Introduction 393
13.2 Variation of Gas Temperature 393
13.3 Piston Temperature Distribution 394
13.4 Cylinder Temperature Distribution 395
13.5 Heat Transfer 395
13.6 Theory of Engine Heat Transfer 397
13.7 Parameters Affecting Engine Heat Transfer 399
13.7.1 Fuel-Air Ratio 399
13.7.2 Compression Ratio 399
13.7.3 Spark Advance 399
13.7.4 Preignition and Knocking 399
13.7.5 Engine Output 399
13.7.6 Cylinder Wall Temperature 400
13.8 Power Required to Cool the Engine 400
13.9 Need for Cooling System 400
13.10 Characteristics of an Efficient Cooling System 401
13.11 Types of Cooling Systems 401
13.12 Liquid Cooled Systems 401
13.12.1 Direct or Non-return System 402
13.12.2 Thermosyphon System 403
13.12.3 Forced Circulation Cooling System 403
13.12.4 Evaporative Cooling System 407
13.12.5 Pressure Cooling System 408
13.13 Air–Cooled System 409
13.13.1 Cooling Fins 409
13.13.2 Baffles 411
xxii Contents
13.14 Comparison of Liquid and Air–Cooling Systems 411
13.14.1 Advantages of Liquid-Cooling System 411
13.14.2 Limitations 412
13.14.3 Advantages of Air-Cooling System 412
13.14.4 Limitations 412
Review Questions 413
Multiple Choice Questions 414
14 Engine Emissions and Their Control 417
14.1 Introduction 417
14.2 Air Pollution due to IC Engines 417
14.3 Emission Norms 418
14.3.1 Overview of the Emission Norms in India 419
14.4 Comparison between Bharat Stage and Euro norms 419
14.5 Engine Emissions 421
14.5.1 Exhaust Emissions 421
14.6 Hydrocarbons (HC) 422
14.7 Hydrocarbon Emission 423
14.7.1 Incomplete Combustion 423
14.7.2 Crevice Volumes and Flow in Crevices 424
14.7.3 Leakage Past the Exhaust Valve 425
14.7.4 Valve Overlap 425
14.7.5 Deposits on Walls 425
14.7.6 Oil on Combustion Chamber Walls 426
14.8 Hydrocarbon Emission from Two-Stroke Engines 426
14.9 Hydrocarbon Emission from CI Engines 427
14.10 Carbon Monoxide (CO) Emission 428
14.11 Oxides Of Nitrogen (NOx) 429
14.11.1 Photochemical Smog 430
14.12 Particulates 430
14.13 Other Emissions 433
14.13.1 Aldehydes 433
14.13.2 Sulphur 433
14.13.3 Lead 434
14.13.4 Phosphorus 435
14.14 Emission Control Methods 435
14.14.1 Thermal Converters 435
14.15 Catalytic Converters 436
14.15.1 Sulphur 439
14.15.2 Cold Start-Ups 440
14.16 CI engines 441
14.16.1 Particulate Traps 441
14.16.2 Modern Diesel Engines 442

Contents xxiii
14.17 Reducing Emissions by Chemical Methods 442
14.17.1 Ammonia Injection Systems 443
14.18 Exhaust Gas Recirculation (EGR) 443
14.19 Non-Exhaust Emissions 445
14.19.1 Evaporative Emissions 446
14.19.2 Evaporation Loss Control Device (ELCD) 447
14.20 Modern Evaporative Emission Control System 448
14.20.1 Charcoal Canister 449
14.21 Crankcase Blowby 450
14.21.1 Blowby Control 450
14.21.2 Intake Manifold Return PCV System (Open Type) 450
Review Questions 452
Multiple Choice Questions 453
15 Measurements and Testing 457
15.1 Introduction 457
15.2 Friction Power 457
15.2.1 Willan’s Line Method 458
15.2.2 Morse Test 459
15.2.3 Motoring Test 461
15.2.4 From the Measurement of Indicated and Brake Power 461
15.2.5 Retardation Test 461
15.2.6 Comparison of Various Methods 463
15.3 Indicated Power 463
15.3.1 Method using the Indicator Diagram 464
15.3.2 Engine Indicators 465
15.3.3 Electronic Indicators 465
15.4 Brake Power 467
15.4.1 Prony Brake 469
15.4.2 Rope Brake 470
15.4.3 Hydraulic Dynamometer 471
15.4.4 Eddy Current Dynamometer 471
15.4.5 Swinging Field DC Dynamometer 473
15.4.6 Fan Dynamometer 473
15.4.7 Transmission Dynamometer 474
15.4.8 Chassis Dynamometer 474
15.5 Fuel Consumption 474
15.5.1 Volumetric Type Flowmeter 475
15.5.2 Gravimetric Fuel Flow Measurement 478
15.5.3 Fuel Consumption Measurement in Vehicles 479
15.6 Air Consumption 479
15.6.1 Air Box Method 480
15.6.2 Viscous-Flow Air Meter 480

xxiv Contents
15.7 Speed 481
15.8 Exhaust and Coolant Temperature 481
15.9 Emission 482
15.9.1 Oxides of Nitrogen 482
15.9.2 Carbon Monoxide 483
15.9.3 Unburned Hydrocarbons 484
15.9.4 Aldehydes 485
15.10 Visible Emissions 487
15.10.1 Smoke 487
15.11 Noise 490
15.12 Combustion Phenomenon 491
15.12.1 Flame Temperature Measurement 491
15.12.2 Flame Propagation 494
15.12.3 Combustion Process 495
Review Questions 496
Multiple Choice Questions 497
16 Performance Parameters and Characteristics 499
16.1 Introduction 499
16.2 Engine Power 500
16.2.1 Indicated Mean Effective Pressure (pim) 500
16.2.2 Indicated Power (ip) 501
16.2.3 Brake Power (bp) 502
16.2.4 Brake Mean Effective Pressure (pbm) 504
16.3 Engine Efficiencies 505
16.3.1 Air-Standard Efficiency 505
16.3.2 Indicated and Brake Thermal Efficiencies 505
16.3.3 Mechanical Efficiency 505
16.3.4 Relative Efficiency 506
16.3.5 Volumetric Efficiency 506
16.3.6 Scavenging Efficiency 507
16.3.7 Charge Efficiency 507
16.3.8 Combustion Efficiency 507
16.4 Engine Performance Characteristics 507
16.5 Variables Affecting Performance Characteristics 511
16.5.1 Combustion Rate and Spark Timing 511
16.5.2 Air-Fuel Ratio 512
16.5.3 Compression Ratio 512
16.5.4 Engine Speed 512
16.5.5 Mass of Inducted Charge 512
16.5.6 Heat Losses 512
16.6 Methods of Improving Engine Performance 512
16.7 Heat Balance 513

Contents xxv
16.8 Performance Maps 516
16.8.1 SI Engines 516
16.8.2 CI Engines 516
16.9 Analytical Method of Performance Estimation 518
Worked out Examples 521
Review Questions 563
Exercise 564
Multiple Choice Questions 571
17 Engine Electronics 575
17.1 Introduction 575
17.2 Typical Engine Management Systems 576
17.3 Position Displacement and Speed Sensing 577
17.3.1 Inductive Transducers 578
17.3.2 Hall Effect Pickup 578
17.3.3 Potentiometers 579
17.3.4 Linear Variable Differential transformer (LVDT) 580
17.3.5 Electro Optical Sensors 581
17.4 Measurement of Pressure 582
17.4.1 Strain Gauge Sensors 582
17.4.2 Capacitance Transducers 584
17.4.3 Peizoelectric Sensors 584
17.5 Temperature Measurement 585
17.5.1 Thermistors 585
17.5.2 Thermocouples 587
17.5.3 Resistance Temperature Detector (RTD) 587
17.6 Intake air flow measurement 587
17.6.1 Hot Wire Sensor 589
17.6.2 Flap Type Sensor 590
17.6.3 Vortex Sensor 591
17.7 Exhaust Oxygen Sensor 592
17.7.1 Knock Sensor 592
Review Questions 594
Multiple Choice Questions 594
18 Supercharging 597
18.1 Introduction 597
18.2 Supercharging 597
18.3 Types Of Superchargers 598
18.3.1 Centrifugal Type Supercharger 599
18.3.2 Root’s Supercharger 599
18.3.3 Vane Type Supercharger 599
18.3.4 Comparison between the Three Superchargers 600

xxvi Contents
18.4 Methods of Supercharging 600
18.4.1 Electric Motor Driven Supercharging 601
18.4.2 Ram Effect of Supercharging 601
18.4.3 Under Piston Supercharging 601
18.4.4 Kadenacy System of Supercharging 601
18.5 Effects of Supercharging 602
18.6 Limitations to Supercharging 603
18.7 Thermodynamic Analysis of Supercharged Engine Cycle 603
18.8 Power Input for Mechanical Driven Supercharger 604
18.9 Gear Driven and Exhaust Driven Supercharging Arrangements 606
18.10 Turbocharging 607
18.10.1 Charge Cooling 610
Worked out Examples 610
Review Questions 620
Exercise 621
Multiple Choice Questions 623
19 Two-Stroke Engines 625
19.1 Introduction 625
19.2 Types of Two-Stroke Engines 625
19.2.1 Crankcase Scavenged Engine 625
19.2.2 Separately Scavenged Engine 626
19.3 Terminologies and Definitions 628
19.3.1 Delivery Ratio (Rdel) 629
19.3.2 Trapping Efficiency 629
19.3.3 Relative Cylinder Charge 629
19.3.4 Scavenging Efficiency 630
19.3.5 Charging Efficiency 631
19.3.6 Pressure Loss Coefficient (Pl) 631
19.3.7 Index for Compressing the Scavenge Air (n) 632
19.3.8 Excess Air Factor (λ) 632
19.4 Two-stroke Air Capacity 632
19.5 Theoretical Scavenging Processes 632
19.5.1 Perfect Scavenging 633
19.5.2 Perfect Mixing 633
19.5.3 Short Circuiting 633
19.6 Actual Scavenging Process 633
19.7 Classification Based on Scavenging Process 634
19.8 Comparison of Scavenging Methods 636
19.9 Scavenging Pumps 636
19.10 Advantages and Disadvantages of Two-stroke Engines 637
19.10.1 Advantages of Two-stroke Engines 637
19.10.2 Disadvantages of Two-Stroke Engines 638
Contents xxvii
19.11 Comparison of Two-stroke SI and CI Engines 639
Worked out Examples 639
Review Questions 645
Exercise 645
Multiple Choice Questions 647
20 Nonconventional Engines 649
20.1 Introduction 649
20.2 Common Rail Direct Injection Engine 649
20.2.1 The Working Principle 650
20.2.2 The Injector 650
20.2.3 Sensors 652
20.2.4 Electronic Control Unit (ECU) 652
20.2.5 Microcomputer 653
20.2.6 Status of CRDI Engines 653
20.2.7 Principle of CRDI in Gasoline Engines 654
20.2.8 Advantages of CRDI Systems 654
20.3 Dual Fuel and Multi-Fuel Engine 654
20.3.1 The Working Principle 655
20.3.2 Combustion in Dual-Fuel Engines 655
20.3.3 Nature of Knock in a Dual-Fuel Engine 656
20.3.4 Weak and Rich Combustion Limits 657
20.3.5 Factors Affecting Combustion in a Dual-Fuel Engine 657
20.3.6 Advantages of Dual Fuel Engines 658
20.4 Multifuel Engines 658
20.4.1 Characteristics of a Multi-Fuel Engine 659
20.5 Free Piston Engine 660
20.5.1 Free-Piston Engine Basics 661
20.5.2 Categories of Free Piston Engine 661
20.5.3 Single Piston 661
20.5.4 Dual Piston 661
20.5.5 Opposed Piston 662
20.5.6 Free Piston Gas Generators 663
20.5.7 Loading Requirements 664
20.5.8 Design Features 664
20.5.9 The Combustion Process 664
20.5.10 Combustion Optimization 665
20.5.11 Advantages and Disadvantages of Free Piston Engine 665
20.5.12 Applications of Free Piston Engine 666
20.6 Gasoline Direct Injection Engine 667
20.6.1 Modes of Operation 668
xxviii Contents
20.7 Homogeneous Charge Compression Ignition Engine 670
20.7.1 Control 671
20.7.2 Variable Compression Ratio 671
20.7.3 Variable Induction Temperature 671
20.7.4 Variable Exhaust Gas Percentage 672
20.7.5 Variable Valve Actuation 672
20.7.6 Variable Fuel Ignition Quality 672
20.7.7 Power 673
20.7.8 Emissions 673
20.7.9 Difference in Engine Knock 673
20.7.10 Advantages and Disadvantages of HCCI Engine 674
20.8 Lean Burn Engine 674
20.8.1 Basics of Lean Burn Technology 676
20.8.2 Lean Burn Combustion 676
20.8.3 Combustion Monitoring 677
20.8.4 Lean Burn Emissions 677
20.8.5 Fuel Flexibility 677
20.8.6 Toyota Lean Burn Engine 678
20.8.7 Honda Lean Burn Systems 678
20.8.8 Mitsubishi Ultra Lean Burn Combustion Engines 679
20.9 Stirling Engine 680
20.9.1 Principle of Operation 681
20.9.2 Types of Stirling Engines 683
20.9.3 Alpha Stirling Engine 683
20.9.4 Working Principle of Alpha Stirling Engine 684
20.9.5 Beta Stirling Engine 685
20.9.6 Working Principle of Beta Stirling Engine 685
20.9.7 The Stirling Cycle 686
20.9.8 Displacer Type Stirling Engine 687
20.9.9 Pressurization 687
20.9.10 Lubricants and Friction 688
20.9.11 Comparison with Internal Combustion Engines 688
20.9.12 Advantages and Disadvantages of Stirling Engine 688
20.9.13 Applications 691
20.9.14 Future of Stirling Engines 691
20.10 Stratified Charge Engine 692
20.10.1 Advantages of Burning Leaner OverallFuel-Air Mixtures 692
20.10.2 Methods of Charge Stratification 695
20.10.3 Stratification by Fuel Injection and Positive Ignition 695
20.10.4 Volkswagen PCI stratified charge engine 696
20.10.5 Broderson Method of Stratification 697
20.10.6 Charge Stratification by Swirl 698

Contents xxix
20.10.7 Ford Combustion Process (FCP) 698
20.10.8 Ford PROCO 700
20.10.9 Texaco Combustion Process (TCP) 700
20.10.10 Witzky Swirl Stratification Process 702
20.10.11 Honda CVCC Engine 702
20.10.12 Advantages and Disadvantages of StratifiedCharge Engines 703
20.11 Variable Compression Ratio Engine 704
20.11.1 Cortina Variable Compression Engine 705
20.11.2 Cycle Analysis 706
20.11.3 The CFR Engine 707
20.11.4 Performance of Variable Compression Ratio Engines 707
20.11.5 Variable Compression Ratio Applications 709
20.12 Wankel Engine 709
20.12.1 Basic Design 710
20.12.2 Comparison of Reciprocating and Wankel Rotary Engine712
20.12.3 Materials 712
20.12.4 Sealing 712
20.12.5 Fuel consumption and emissions 712
20.12.6 Advantages and Disadvantages of Wankel Engines 713
Review Questions 714
Multiple Choice Questions 716
Index 719

xxx Contents

NOMENCLATURE
Aa1 constantamep mean effective pressure required to drive
the auxiliary componentsA piston area [Chp.1]A TEL in ml/gal of fuel [Chp.5]A area of heat transfer [Chp.14]A average projected area of each particles [Chp.15]A1 cross-sectional area at inlet of the carburettorA2 cross-sectional area at venturi of the carburettorAact actual amount of air in kg for combustion per kg of fuelAf area of cross-section of the fuel nozzle [Chp.7]Af area of fin [Chp.14]Ae effective areaAth theoretical amount of air in kg per kg of fuelA/F air-fuel ratio
Bb1 constantbp brake powerbhp brake horsepowerbmep brake mean effective pressurebsfc brake specific fuel consumptionBDC Bottom Dead Centre
C
cmep mean effective pressure required to drive thecompressor or scavenging pump
C velocity [Chp.7]Cd coefficient of discharge for the orifice [Chp.7]Cda coefficient of discharge for the venturiCdf coefficient of discharge for fuel nozzleCf fuel velocity at the nozzle exitCp specific heat of gas at constant pressureCrel relative chargeCv specific heat at constant volumeCV calorific value of the fuel
D
d cylinder bore diameter [Chp.1]d diameter of orifice [Chp.7]D brake drum diameter
xxxii IC Engines
Ee expansion ratioE enrichment [Chp.7]EV C Exhaust Valve ClosingEV O Exhaust Valve Opening
Ff coefficient of frictionfmep frictional mean effective pressurefp frictional powerF forceF/A fuel-air ratioFR relative fuel-air ratio
G
g acceleration due to gravitygc gravitational constantgp gross power
Hh specific enthalpyh pressure difference [Chp.7]h convective heat transfer coefficient [Chp.13]H enthalpy
Iip indicated powerimep indicated mean effective pressureisfc indicated specific fuel consumptionI intensityIDC Inner Dead CentreIV C Inlet Valve ClosingIV O Inlet Valve Opening
K
k thermal conductivity of gasesk1 constant [Chp.3]K number of cylindersKac optical absorption coefficient
Ll characteristic lengthl distance [Chp.15]
Nomenclature xxxiii
L strokeLℓ length of the light path
Mm massm exponent [Chp.13]mep mean effective pressuremmep mechanical mean effective pressurema mass flow rate of airmact actual mass flow rate of airmth theoretical mass flow rate of airMdel mass of fresh air deliveredMf molecular weight of the fuelM molecular weightMref reference mass
N
n number of power strokesn number of soot particles per unit volume [Chp.15]N speed in revolutions per minuteNi number of injections per minute [Chp.8]
OODC Outer Dead CentreON Octane Numbers
Pp pressurepmep charging mean effective pressurepp pumping powerpar pure air ratiopbm brake mean effective pressurepe exhaust pressurepi inlet pressurepim indicated mean effective pressurepm mean effective pressurePcyl pressure of charge inside the cylinderPinj fuel pressure at the inlet to injectorPl pressure loss coefficientPs specific power outputPN performance number
Qq heat transferq rate of heat transfer
xxxiv IC Engines
QR heat rejectedQS heat supplied
Rr compression ratiorpn relative performance numberrc cut-off ratiorp pressure ratioR length of the moment armR delivery ratio [Chp.19]R universal gas constantRdel delivery ratio
Ssp mean piston speedsfc specific fuel consumptionS spring scale reading
Tt timeT absolute temperatureT torque [Chp.15]TDC Top Dead CentreTb black body temperatureTf friction torqueTg mean gas temperatureTl load torque
U
u specific internal energyU internal energyUc chemical energyUs stored energy
Vv specific volumeV volumeVch volume of cylinder chargeVcp volume of combustion productsVdel volume of air deliveredVf fuel jet velocityVpure volume of pure airVref reference volumeVres volume of residual gasVret volume of retained air or mixture

Nomenclature xxxv
Vs displacement volumeVs swept volumeVshort short circuiting airVtot total volumeVC clearance volumeVT volume at bottom dead centre
Ww specific weightw work transfer [Chp.7]W net workW weight [Chp.15]W number of quartz windows [Chp.15]W load [Chp.12]WOT Wide Open ThrottleWC compressor workWT turbine workWx external work
Z
z height of the nozzle exit [Chp.7]Z constant
GREEKα air coefficientγ ratio of specific heats∆p pressure difference∆T temperature difference between the gas and the wallϵ heat exchanger efficiencyη efficiencyηair std air standard efficiencyηbth brake thermal efficiencyηc compressor efficiencyηch charging efficiencyηith indicated thermal efficiencyηm mechanical efficiencyηrel relative efficiencyηsc scavenging efficiencyηt turbine efficiencyηth thermal efficiencyηtrap trapping efficiencyηv volumetric efficiencyθ crank angle [Chp.11]θ specific absorbance per particle [Chp.15]λ wave length [Chp.15]λ excess air factor [Chp.19]

xxxvi IC Engines
µ kinematic viscosity of gasesν dynamic viscosityρ densityρf density of fuelϕ equivalence ratioψ magnetic field strengthω angular velocity

1INTRODUCTION
1.1 ENERGY CONVERSION
The distinctive feature of our civilization today, one that makes it differentfrom all others, is the wide use of mechanical power. At one time, the primarysource of power for the work of peace or war was chiefly man’s muscles. Later,animals were trained to help and afterwards the wind and the running streamwere harnessed. But, the great step was taken in this direction when manlearned the art of energy conversion from one form to another. The machinewhich does this job of energy conversion is called an engine.
1.1.1 Definition of ‘Engine’
An engine is a device which transforms one form of energy into another form.However, while transforming energy from one form to another, the efficiencyof conversion plays an important role. Normally, most of the engines con-vert thermal energy into mechanical work and therefore they are called ‘heatengines’.
1.1.2 Definition of ‘Heat Engine’
Heat engine is a device which transforms the chemical energy of a fuel intothermal energy and utilizes this thermal energy to perform useful work. Thus,thermal energy is converted to mechanical energy in a heat engine.
Heat engines can be broadly classified into two categories:
(i) Internal Combustion Engines (IC Engines)
(ii) External Combustion Engines (EC Engines)
1.1.3 Classification and Some Basic Details of Heat Engines
Engines whether Internal Combustion or External Combustion are of twotypes:
(i) Rotary engines (ii) Reciprocating engines
A detailed classification of heat engines is given in Fig.1.1. Of the varioustypes of heat engines, the most widely used ones are the reciprocating internalcombustion engine, the gas turbine and the steam turbine. The steam engineis slowly phased out nowadays. The reciprocating internal combustion engineenjoys some advantages over the steam turbine due to the absence of heatexchangers in the passage of the working fluid (boilers and condensers insteam turbine plant). This results in a considerable mechanical simplicityand improved power plant efficiency of the internal combustion engine.

2 IC Engines
Heat Engines
IC Engines EC Engines
Rotary Reciprocating Reciprocating Rotary
OpenCycleGas
Turbine
WankelEngine
GasolineEngine
DieselEngine
SteamEngine
StirlingEngine
SteamTurbine
ClosedCycleGas
Turbine
Fig. 1.1 Classification of heat engines
Another advantage of the reciprocating internal combustion engine overthe other two types is that all its components work at an average temperaturewhich is much below the maximum temperature of the working fluid in thecycle. This is because the high temperature of the working fluid in the cyclepersists only for a very small fraction of the cycle time. Therefore, veryhigh working fluid temperatures can be employed resulting in higher thermalefficiency.
Further, in internal combustion engines, higher thermal efficiency can beobtained with moderate maximum working pressure of the fluid in the cy-cle, and therefore, the weight to power ratio is quite less compared to steamturbine power plant. Also, it has been possible to develop reciprocating in-ternal combustion engines of very small power output (power output of evena fraction of a kilowatt) with reasonable thermal efficiency and cost.
The main disadvantage of this type of engine is the problem of vibrationcaused by the reciprocating components. Also, it is not possible to use a vari-ety of fuels in these engines. Only liquid or gaseous fuels of given specificationcan be effectively used. These fuels are relatively more expensive.
Considering all the above factors the reciprocating internal combustionengines have been found suitable for use in automobiles, motor-cycles andscooters, power boats, ships, slow speed aircraft, locomotives and power unitsof relatively small output.
1.1.4 External Combustion and Internal Combustion Engines
External combustion engines are those in which combustion takes place out-side the engine whereas in internal combustion engines combustion takes placewithin the engine. For example, in a steam engine or a steam turbine, theheat generated due to the combustion of fuel is employed to generate highpressure steam which is used as the working fluid in a reciprocating engineor a turbine. In case of gasoline or diesel engines, the products of combus-tion generated by the combustion of fuel and air within the cylinder form theworking fluid.

Introduction 3
1.2 BASIC ENGINE COMPONENTS AND NOMENCLATURE
Even though reciprocating internal combustion engines look quite simple, theyare highly complex machines. There are hundreds of components which haveto perform their functions effectively to produce output power. There aretwo types of engines, viz., spark-ignition (SI) and compression-ignition (CI)engine. Let us now go through some of the important engine components andthe nomenclature associated with an engine.
1.2.1 Engine Components
A cross section of a single cylinder spark-ignition engine with overhead valvesis shown in Fig.1.2. The major components of the engine and their functionsare briefly described below.
Inlet valve (IV) Spark plug
Air
Fuel
Exhaust valve (EV)
Products
Gudgeon pin
Connecting rod
SumpCrankcaseCrankpin
Cylinder
Crankshaft
Crank
Cylinder block
Piston
Inlet manifold Exhaust manifold
Fig. 1.2 Cross-section of a spark-ignition engine
Cylinder Block : The cylinder block is the main supporting structurefor the various components. The cylinder of a multicylinder engine are castas a single unit, called cylinder block. The cylinder head is mounted on thecylinder block. The cylinder head and cylinder block are provided with waterjackets in the case of water cooling or with cooling fins in the case of aircooling. Cylinder head gasket is incorporated between the cylinder block andcylinder head. The cylinder head is held tight to the cylinder block by numberof bolts or studs. The bottom portion of the cylinder block is called crankcase.A cover called crankcase which becomes a sump for lubricating oil is fastenedto the bottom of the crankcase. The inner surface of the cylinder block whichis machined and finished accurately to cylindrical shape is called bore or face.
Cylinder : As the name implies it is a cylindrical vessel or space in whichthe piston makes a reciprocating motion. The varying volume created in thecylinder during the operation of the engine is filled with the working fluid and

4 IC Engines
subjected to different thermodynamic processes. The cylinder is supported inthe cylinder block.
Piston : It is a cylindrical component fitted into the cylinder forming themoving boundary of the combustion system. It fits perfectly (snugly) into thecylinder providing a gas-tight space with the piston rings and the lubricant.It forms the first link in transmitting the gas forces to the output shaft.
Combustion Chamber : The space enclosed in the upper part of the cylin-der, by the cylinder head and the piston top during the combustion process,is called the combustion chamber. The combustion of fuel and the consequentrelease of thermal energy results in the building up of pressure in this part ofthe cylinder.
Inlet Manifold : The pipe which connects the intake system to the inletvalve of the engine and through which air or air-fuel mixture is drawn intothe cylinder is called the inlet manifold.
Exhaust Manifold : The pipe which connects the exhaust system to theexhaust valve of the engine and through which the products of combustionescape into the atmosphere is called the exhaust manifold.
Inlet and Exhaust Valves : Valves are commonly mushroom shaped pop-pet type. They are provided either on the cylinder head or on the side of thecylinder for regulating the charge coming into the cylinder (inlet valve) andfor discharging the products of combustion (exhaust valve) from the cylinder.
Spark Plug : It is a component to initiate the combustion process in Spark-Ignition (SI) engines and is usually located on the cylinder head.
Connecting Rod : It interconnects the piston and the crankshaft and trans-mits the gas forces from the piston to the crankshaft. The two ends of theconnecting rod are called as small end and the big end (Fig.1.3). Small end isconnected to the piston by gudgeon pin and the big end is connected to thecrankshaft by crankpin.
Crankshaft : It converts the reciprocating motion of the piston into usefulrotary motion of the output shaft. In the crankshaft of a single cylinderengine there are a pair of crank arms and balance weights. The balanceweights are provided for static and dynamic balancing of the rotating system.The crankshaft is enclosed in a crankcase.
Piston Rings : Piston rings, fitted into the slots around the piston, providea tight seal between the piston and the cylinder wall thus preventing leakageof combustion gases (refer Fig.1.3).
Gudgeon Pin : It links the small end of the connecting rod and the piston.
Camshaft : The camshaft (not shown in the figure) and its associated partscontrol the opening and closing of the two valves. The associated parts arepush rods, rocker arms, valve springs and tappets. This shaft also providesthe drive to the ignition system. The camshaft is driven by the crankshaftthrough timing gears.
Cams : These are made as integral parts of the camshaft and are so de-signed to open the valves at the correct timing and to keep them open for thenecessary duration (not shown in the figure).
Fly Wheel : The net torque imparted to the crankshaft during one completecycle of operation of the engine fluctuates causing a change in the angular

Introduction 5
velocity of the shaft. In order to achieve a uniform torque an inertia mass inthe form of a wheel is attached to the output shaft and this wheel is calledthe flywheel (not shown in the figure).
1.2.2 Nomenclature
Cylinder Bore (d) : The nominal inner diameter of the working cylinderis called the cylinder bore and is designated by the letter d and is usuallyexpressed in millimeter (mm).
Piston Area (A) : The area of a circle of diameter equal to the cylinderbore is called the piston area and is designated by the letter A and is usuallyexpressed in square centimeter (cm2).
Stroke (L) : The nominal distance through which a working piston movesbetween two successive reversals of its direction of motion is called the strokeand is designated by the letter L and is expressed usually in millimeter (mm).
Stroke to Bore Ratio : L/d ratio is an important parameter in classifyingthe size of the engine. If d < L, it is called under-square engine. If d = L, itis called square engine. If d > L, it is called over-square engine.
An over-square engine can operate at higher speeds because of larger boreand shorter stroke.
Dead Centre : The position of the working piston and the moving partswhich are mechanically connected to it, at the moment when the directionof the piston motion is reversed at either end of the stroke is called the deadcentre. There are two dead centres in the engine as indicated in Fig.1.3. Theyare:
(i) Top Dead Centre (ii) Bottom Dead Centre
TDC
Bore
Stroke
TDC
BDC
Compression ratio = 6
top dead centre
Pitson at
bottom dead centre
Pitson at
Clearance volume
BDC
1
23456
Piston ring
Small end
Big end
Fig. 1.3 Top and bottom dead centres
(i) Top Dead Centre (TDC) : It is the dead centre when the piston is far-thest from the crankshaft. It is designated as TDC for vertical enginesand Inner Dead Centre (IDC) for horizontal engines.
6 IC Engines
(ii) Bottom Dead Centre (BDC) : It is the dead centre when the piston isnearest to the crankshaft. It is designated as BDC for vertical enginesand Outer Dead Centre (ODC) for horizontal engines.
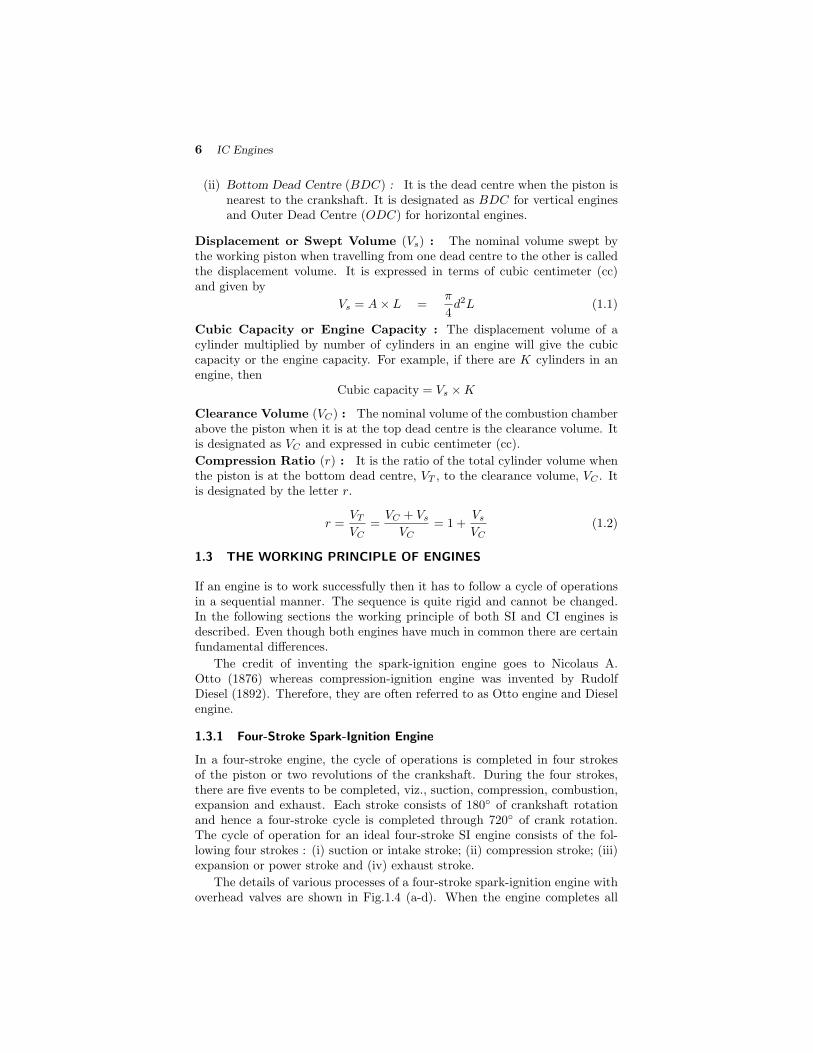
Displacement or Swept Volume (Vs) : The nominal volume swept bythe working piston when travelling from one dead centre to the other is calledthe displacement volume. It is expressed in terms of cubic centimeter (cc)and given by
Vs = A× L =π
4d2L (1.1)
Cubic Capacity or Engine Capacity : The displacement volume of acylinder multiplied by number of cylinders in an engine will give the cubiccapacity or the engine capacity. For example, if there are K cylinders in anengine, then
Cubic capacity = Vs ×K
Clearance Volume (VC) : The nominal volume of the combustion chamberabove the piston when it is at the top dead centre is the clearance volume. Itis designated as VC and expressed in cubic centimeter (cc).
Compression Ratio (r) : It is the ratio of the total cylinder volume whenthe piston is at the bottom dead centre, VT , to the clearance volume, VC . Itis designated by the letter r.
r =VT
VC=
VC + Vs
VC= 1 +
Vs
VC(1.2)
1.3 THE WORKING PRINCIPLE OF ENGINES
If an engine is to work successfully then it has to follow a cycle of operationsin a sequential manner. The sequence is quite rigid and cannot be changed.In the following sections the working principle of both SI and CI engines isdescribed. Even though both engines have much in common there are certainfundamental differences.
The credit of inventing the spark-ignition engine goes to Nicolaus A.Otto (1876) whereas compression-ignition engine was invented by RudolfDiesel (1892). Therefore, they are often referred to as Otto engine and Dieselengine.
1.3.1 Four-Stroke Spark-Ignition Engine
In a four-stroke engine, the cycle of operations is completed in four strokesof the piston or two revolutions of the crankshaft. During the four strokes,there are five events to be completed, viz., suction, compression, combustion,expansion and exhaust. Each stroke consists of 180◦ of crankshaft rotationand hence a four-stroke cycle is completed through 720◦ of crank rotation.The cycle of operation for an ideal four-stroke SI engine consists of the fol-lowing four strokes : (i) suction or intake stroke; (ii) compression stroke; (iii)expansion or power stroke and (iv) exhaust stroke.
The details of various processes of a four-stroke spark-ignition engine withoverhead valves are shown in Fig.1.4 (a-d). When the engine completes all

Introduction 7
the five events under ideal cycle mode, the pressure-volume (p-V ) diagramwill be as shown in Fig.1.5.
(d) Exhaust(c) Expansion(b) Compression(a) Intake
Fig. 1.4 Working principle of a four-stroke SI engine
2
0
3
4
1-5
p
VVsVc
Fig. 1.5 Ideal p-V diagram of a four-stroke SI engine
(i) Suction or Intake Stroke : Suction stroke 0→1 (Fig.1.5) starts whenthe piston is at the top dead centre and about to move downwards.The inlet valve is assumed to open instantaneously and at this time theexhaust valve is in the closed position, Fig.1.4(a). Due to the suctioncreated by the motion of the piston towards the bottom dead centre, thecharge consisting of fuel-air mixture is drawn into the cylinder. Whenthe piston reaches the bottom dead centre the suction stroke ends andthe inlet valve closes instantaneously.
(ii) Compression Stroke : The charge taken into the cylinder during thesuction stroke is compressed by the return stroke of the piston 1→2,(Fig.1.5). During this stroke both inlet and exhaust valves are in closedposition, Fig.1.4(b). The mixture which fills the entire cylinder vol-ume is now compressed into the clearance volume. At the end of thecompression stroke the mixture is ignited with the help of a spark pluglocated on the cylinder head. In ideal engines it is assumed that burningtakes place instantaneously when the piston is at the top dead centreand hence the burning process can be approximated as heat addition

8 IC Engines
at constant volume. During the burning process the chemical energyof the fuel is converted into heat energy producing a temperature riseof about 2000 ◦C (process 2→3), Fig.1.5. The pressure at the end ofthe combustion process is considerably increased due to the heat releasefrom the fuel.
(iii) Expansion or Power Stroke : The high pressure of the burnt gasesforces the piston towards the BDC, (stroke 3→4) Fig.1.5. Both thevalves are in closed position, Fig.1.4(c). Of the four-strokes only duringthis stroke power is produced. Both pressure and temperature decreaseduring expansion.
(iv) Exhaust Stroke : At the end of the expansion stroke the exhaust valveopens instantaneously and the inlet valve remains closed, Fig.1.4(d).The pressure falls to atmospheric level a part of the burnt gases escape.The piston starts moving from the bottom dead centre to top deadcentre (stroke 5→0), Fig.1.5 and sweeps the burnt gases out from thecylinder almost at atmospheric pressure. The exhaust valve closes whenthe piston reaches TDC. at the end of the exhaust stroke and someresidual gases trapped in the clearance volume remain in the cylinder.
These residual gases mix with the fresh charge coming in during thefollowing cycle, forming its working fluid. Each cylinder of a four-strokeengine completes the above four operations in two engine revolutions,first revolution of the crankshaft occurs during the suction and compres-sion strokes and the second revolution during the power and exhauststrokes. Thus for one complete cycle there is only one power strokewhile the crankshaft makes two revolutions. For getting higher outputfrom the engine the heat addition (process 2→3) should be as high aspossible and the heat rejection (process 3→4) should be as small as pos-sible. Hence, one should be careful in drawing the ideal p-V diagram(Fig.1.5), which should depict the processes correctly.
1.3.2 Four-Stroke Compression-Ignition Engine
The four-stroke CI engine is similar to the four-stroke SI engine but it operatesat a much higher compression ratio. The compression ratio of an SI engineis between 6 and 10 while for a CI engine it is from 16 to 20. In the CIengine during suction stroke, air, instead of a fuel-air mixture, is inducted.Due to higher compression ratios employed, the temperature at the end of thecompression stroke is sufficiently high to self ignite the fuel which is injectedinto the combustion chamber. In CI engines, a high pressure fuel pump andan injector are provided to inject the fuel into the combustion chamber. Thecarburettor and ignition system necessary in the SI engine are not required inthe CI engine.
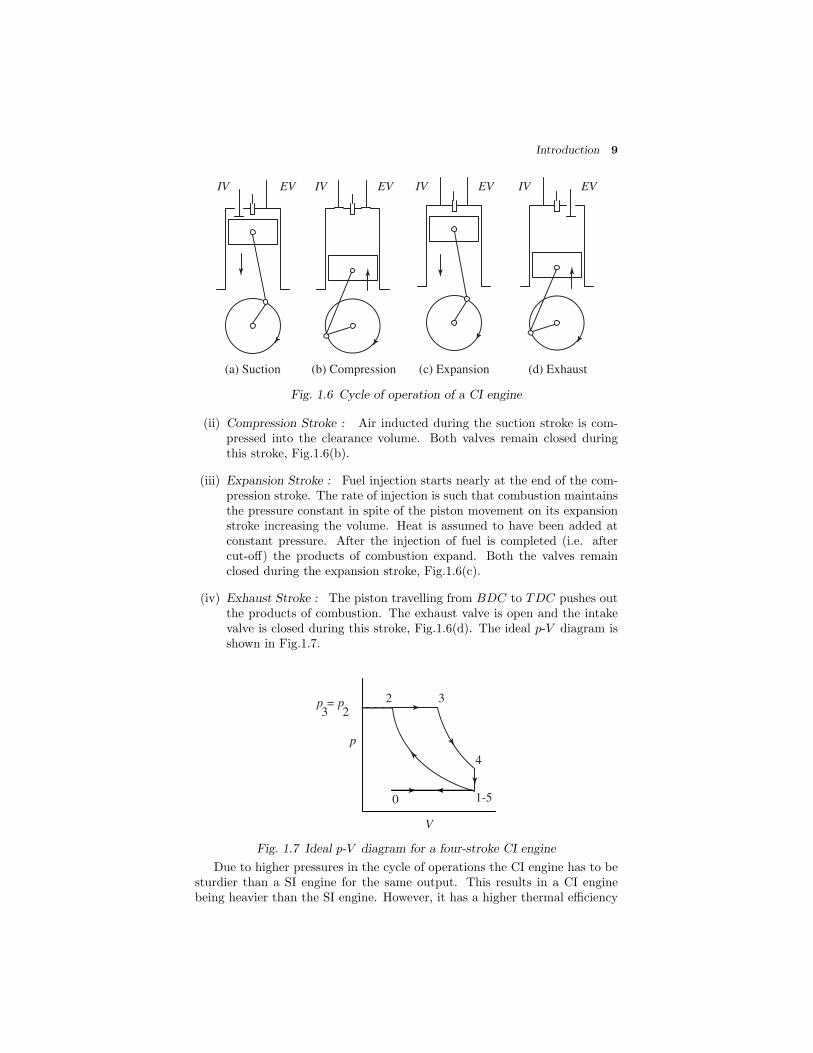
The ideal sequence of operations for the four-stroke CI engine as shown inFig.1.6 is as follows:
(i) Suction Stroke : Air alone is inducted during the suction stroke. Duringthis stroke inlet valve is open and exhaust valve is closed, Fig.1.6(a).
Introduction 9
(c) Expansion
IV EV
(d) Exhaust
IV EV
(a) Suction
IV EV
(b) Compression
IV EV
Fig. 1.6 Cycle of operation of a CI engine
(ii) Compression Stroke : Air inducted during the suction stroke is com-pressed into the clearance volume. Both valves remain closed duringthis stroke, Fig.1.6(b).
(iii) Expansion Stroke : Fuel injection starts nearly at the end of the com-pression stroke. The rate of injection is such that combustion maintainsthe pressure constant in spite of the piston movement on its expansionstroke increasing the volume. Heat is assumed to have been added atconstant pressure. After the injection of fuel is completed (i.e. aftercut-off) the products of combustion expand. Both the valves remainclosed during the expansion stroke, Fig.1.6(c).
(iv) Exhaust Stroke : The piston travelling from BDC to TDC pushes outthe products of combustion. The exhaust valve is open and the intakevalve is closed during this stroke, Fig.1.6(d). The ideal p-V diagram isshown in Fig.1.7.
V
p
2
1-5
3
4
0
p = p3 2
Fig. 1.7 Ideal p-V diagram for a four-stroke CI engine
Due to higher pressures in the cycle of operations the CI engine has to besturdier than a SI engine for the same output. This results in a CI enginebeing heavier than the SI engine. However, it has a higher thermal efficiency

10 IC Engines
on account of the high compression ratio (of about 18 as against about 8 inSI engines) used.
1.3.3 Four-stroke SI and CI Engines
In both SI and CI four-stroke engines, there is one power stroke for every tworevolutions of the crankshaft. There are two non-productive strokes of exhaustand suction which are necessary for flushing the products of combustion fromthe cylinder and filling it with the fresh charge respectively. If this purposecould be served by an alternative arrangement, without involving the pistonmovement, then it is possible to obtain a power stroke for every revolution ofthe crankshaft increasing the output of the engine. However, in both SI andCI engines operating on four-stroke cycle, power can be obtained only in everytwo revolution of the crankshaft. Since both SI and CI engines have much incommon, it is worthwhile to compare them based on important parameters likebasic cycle of operation, fuel induction, compression ratio etc. The detailedcomparison is given in Table 1.1.
1.3.4 Two-Stroke Engine
As already mentioned, if the two unproductive strokes, viz., the suction andexhaust could be served by an alternative arrangement, especially without themovement of the piston then there will be a power stroke for each revolutionof the crankshaft. In such an arrangement, theoretically the power outputof the engine can be doubled for the same speed compared to a four-strokeengine. Based on this concept, Dugald Clark (1878) invented the two-strokeengine.
In two-stroke engines the cycle is completed in one revolution of thecrankshaft. The main difference between two-stroke and four-stroke enginesis in the method of filling the fresh charge and removing the burnt gases fromthe cylinder. In the four-stroke engine these operations are performed by theengine piston during the suction and exhaust strokes respectively. In a two-stroke engine, the filling process is accomplished by the charge compressedin crankcase or by a blower. The induction of the compressed charge movesout the product of combustion through exhaust ports. Therefore, no sepa-rate piston strokes are required for these two operations. Two strokes aresufficient to complete the cycle, one for compressing the fresh charge and theother for expansion or power stroke. It is to be noted that the effective strokeis reduced.
Figure 1.8 shows one of the simplest two-stroke engines, viz., the crankcasescavenged engine. Figure 1.9 shows the ideal p-V diagram of such an engine.The air-fuel charge is inducted into the crankcase through the spring loadedinlet valve when the pressure in the crankcase is reduced due to upward motionof the piston during compression stroke. After the compression and ignition,expansion takes place in the usual way.
During the expansion stroke the charge in the crankcase is compressed.Near the end of the expansion stroke, the piston uncovers the exhaust portsand the cylinder pressure drops to atmospheric pressure as the combustionproducts leave the cylinder. Further movement of the piston uncovers the

Introduction 11
Table 1.1 Comparison of SI and CI Engines
Description SI Engine CI Engine
Basic cycle Works on Otto cycle or con-stant volume heat additioncycle.
Works on Diesel cycle or con-stant pressure heat additioncycle.
Fuel Gasoline, a highly volatilefuel. Self-ignition tempera-ture is high.
Diesel oil, a non-volatile fuel.Self-ignition temperature iscomparatively low.
Introduction offuel
A gaseous mixture of fuel-airis introduced during the suc-tion stroke. A carburettorand an ignition system arenecessary. Modern engineshave gasoline injection.
Fuel is injected directly intothe combustion chamber athigh pressure at the end ofthe compression stroke. Afuel pump and injector arenecessary.
Load control Throttle controls the quan-tity of fuel-air mixture tocontrol the load.
The quantity of fuel is regu-lated to control the load. Airquantity is not controlled.
Ignition Requires an ignition systemwith spark plug in the com-bustion chamber. Primaryvoltage is provided by eithera battery or a magneto.
Self-ignition occurs due tohigh temperature of air be-cause of the high compres-sion. Ignition system andspark plug are not necessary.
Compressionratio
6 to 10. Upper limit is fixedby antiknock quality of thefuel.
16 to 20. Upper limit is lim-ited by weight increase of theengine.
Speed Due to light weight and alsodue to homogeneous combus-tion, they are high speed en-gines.
Due to heavy weight and alsodue to heterogeneous com-bustion, they are low speedengines.
Thermalefficiency
Because of the lower CR,the maximum value of ther-mal efficiency that can be ob-tained is lower.
Because of higher CR, themaximum value of thermalefficiency that can be ob-tained is higher.
Weight Lighter due to comparativelylower peak pressures.
Heavier due to compara-tively higher peak pressures.

12 IC Engines
Spark plug
Deflector
Transfer port
Crankcase
Exhaust port
Spring loaded
inlet valve
Exhaust blowdown Scavenging
Fig. 1.8 Crankcase scavenged two-stroke SI engine
Vc Vs V
Pis
ton t
ravel
duri
ng o
pen
per
iod
3
2
5
4
1
p
Fig. 1.9 Ideal p-V diagram of a two-stroke SI engine
transfer ports, permitting the slightly compressed charge in the crankcase toenter the engine cylinder. The piston top usually has a projection to deflect thefresh charge towards the top of the cylinder preventing the flow through theexhaust ports. This serves the double purpose of scavenging the combustionproducts from the upper part of the cylinder and preventing the fresh chargefrom flowing out directly through the exhaust ports.
The same objective can be achieved without piston deflector by propershaping of the transfer port. During the upward motion of the piston fromBDC the transfer ports close first and then the exhaust ports, thereby theeffective compression of the charge begins and the cycle is repeated.
1.3.5 Comparison of Four-Stroke and Two-Stroke Engines
The two-stroke engine was developed to obtain higher output from the samesize of the engine. The engine has no valves and valve actuating mechanismmaking it mechanically simpler. Almost all two-stroke engines have no con-ventional valves but only ports (some have an exhaust valve). This makes thetwo-stroke engine cheaper to produce and easy to maintain. Theoretically a

Introduction 13
two-stroke engine develops twice the power of a comparable four-stroke enginebecause of one power stroke every revolution (compared to one power strokeevery two revolutions of a four-stroke engine). This makes the two-stroke en-gine more compact than a comparable four-stroke engine. In actual practicepower output is not exactly doubled but increased by only about 30% due to
(i) reduced effective expansion stroke and
(ii) increased heating caused by increased number of power strokes whichlimits the maximum speed.
The other advantages of two-stroke engines are more uniform torque oncrank-shaft and comparatively less exhaust gas dilution. However, when ap-plied to the spark-ignition engine the two-stroke cycle has certain disadvan-tages which have restricted its application to only small engines suitable formotor cycles, scooters, lawn mowers, outboard engines etc. In the SI engine,the incoming charge consists of fuel and air. During scavenging, as both inletand exhaust ports are open simultaneously for some time, there is a possibilitythat some of the fresh charge containing fuel escapes with the exhaust. Thisresults in high fuel consumption and lower thermal efficiency. The other draw-back of two-stroke engine is the lack of flexibility, viz., the capacity to operatewith the same efficiency at all speeds. At part throttle operating condition,the amount of fresh mixture entering the cylinder is not enough to clear allthe exhaust gases and a part of it remains in the cylinder to contaminate thecharge. This results in irregular operation of the engine.
The two-stroke diesel engine does not suffer from these defects. There isno loss of fuel with exhaust gases as the intake charge in diesel engine is onlyair. The two-stroke diesel engine is used quite widely in many high outputengines which work on this cycle. A disadvantage common to all two-strokeengines, gasoline as well as diesel, is the greater cooling and lubricating oilrequirements due to one power stroke in each revolution of the crankshaft.Consumption of lubricating oil is high in two-stroke engines due to highertemperature. A detailed comparison of two-stroke and four-stroke engines isgiven in Table 1.2.
1.4 ACTUAL ENGINES
Actual engines differ from the ideal engines because of various constraintsin their operation. The indicator diagram also differs considerably from theideal indicator diagrams. Typical indicator diagrams of actual two-stroke andfour-stroke SI engines are shown in Figs.1.10(a) and (b) respectively. Thevarious processes are indicated in the respective figures.
1.5 CLASSIFICATION OF IC ENGINES
Internal combustion engines are usually classified on the basis of the thermo-dynamic cycle of operation, type of fuel used, method of charging the cylinder,type of ignition, type of cooling and the cylinder arrangement etc. Details aregiven in Fig.1.11.

14 IC Engines
Table 1.2 Comparison of Four and Two-Stroke Cycle Engines
Four-Stroke Engine Two-Stroke Engine
The thermodynamic cycle is com-pleted in four strokes of the pis-ton or in two revolutions of thecrankshaft. Thus, one power strokeis obtained in every two revolutions ofthe crankshaft.
The thermodynamic cycle is com-pleted in two strokes of the piston orin one revolution of the crankshaft.Thus there is one power stroke for ev-ery revolution of the crankshaft.
Because of the above, turning momentis not so uniform and hence a heavierflywheel is needed.
Because of the above, turning momentis more uniform and hence a lighterflywheel can be used.
Again, because of one power stroke fortwo revolutions, power produced forsame size of engine is less, or for thesame power the engine is heavier andbulkier.
Because of one power stroke for everyrevolution, power produced for samesize of engine is twice, or for the samepower the engine is lighter and morecompact.
Because of one power stroke in tworevolutions lesser cooling and lubrica-tion requirements. Lower rate of wearand tear.
Because of one power stroke in onerevolution greater cooling and lubri-cation requirements. Higher rate ofwear and tear.
Four-stroke engines have valves andvalve actuating mechanisms for open-ing and closing of the intake and ex-haust valves.
Two-stroke engines have no valves butonly ports (some two-stroke enginesare fitted with conventional exhaustvalve or reed valve).
Because of comparatively higherweight and complicated valve mecha-nism, the initial cost of the engine ismore.
Because of light weight and simplicitydue to the absence of valve actuatingmechanism, initial cost of the engineis less.
Higher volumetric efficiency due tomore time for mixture intake.
Lower volumetric efficiency due tolesser time for mixture intake.
Thermal efficiency is higher; part loadefficiency is better.
Thermal efficiency is lower; part loadefficiency is poor.
Used where efficiency is important,viz., in cars, buses, trucks, tractors,industrial engines, aero planes, powergeneration etc.
Used where low cost, compactness andlight weight are important, viz., inmopeds, scooters, motorcycles, handsprayers etc.
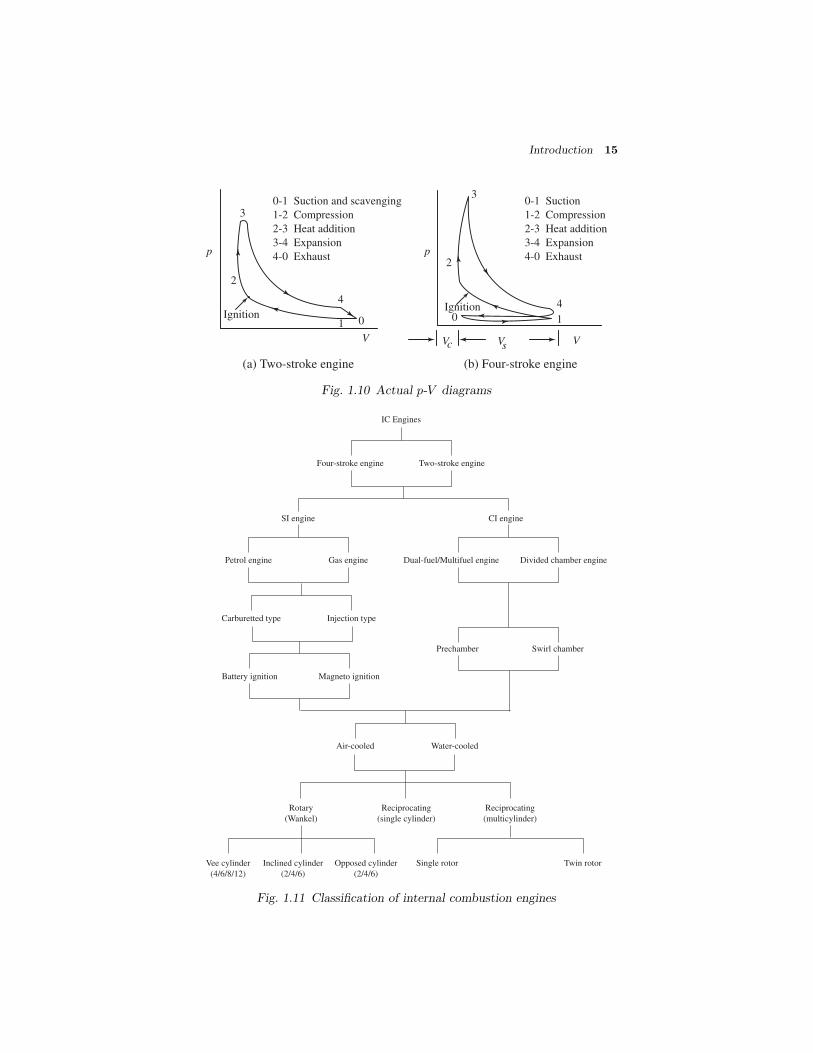
Introduction 15
p
Vc Vs V
0
2
3
4
1
V
p
(a) Two-stroke engine (b) Four-stroke engine
01
2
3
4
Ignition
0-1 Suction
1-2 Compression
2-3 Heat addition
3-4 Expansion
4-0 Exhaust
0-1 Suction and scavenging
1-2 Compression
2-3 Heat addition
3-4 Expansion
4-0 Exhaust
Ignition
Fig. 1.10 Actual p-V diagrams
IC Engines
Four-stroke engine Two-stroke engine
SI engine CI engine
Petrol engine Gas engine Dual-fuel/Multifuel engine Divided chamber engine
Water-cooledAir-cooled
Reciprocating
(single cylinder)
Rotary
(Wankel)
Vee cylinder
(4/6/8/12)
Inclined cylinder
(2/4/6)
Opposed cylinder
(2/4/6)
Reciprocating
(multicylinder)
Single rotor Twin rotor
Battery ignition Magneto ignition
Carburetted type Injection type
Prechamber Swirl chamber
Fig. 1.11 Classification of internal combustion engines
16 IC Engines
1.5.1 Cycle of Operation
According to the cycle of operation, IC engines are basically classified intotwo categories.
(i) Constant volume heat addition engine or Otto cycle engine. It is alsocalled a Spark-Ignition engine, SI engine or Gasoline engine.
(ii) Constant-pressure heat addition engine or Diesel cycle engine. It is alsocalled a compression-ignition engine, CI engine or Diesel engine.
1.5.2 Type of Fuel Used
Based on the type of fuel used engines are classified as
(i) Engines using volatile liquid fuels, For example, gasoline, alcohol, kerosene,benzene etc.The fuel is generally mixed with air to form a homogeneous charge ina carburettor outside the cylinder and drawn into the cylinder in itssuction stroke. The charge is ignited near the end of the compressionstroke by an externally applied spark and therefore these engines arecalled spark-ignition engines.
(ii) Engines using gaseous fuels like Compressed Natural Gas (CNG), Liq-uefied Petroleum Gas (LPG), blast furnace gas and biogas. Gaseousfuels are comparatively better compared to liquid fuels because of thereduced ignition delay.The gas is mixed with air and the mixture is introduced into the cylin-der during the suction process. Working of this type of engine is similarto that of the engines using volatile liquid fuels (SI gas engine).
(iii) Engine using solid fuels like charcoal, powdered coal etc.Solid fuels are generally converted into gaseous fuels outside the enginein a separate gas producer and the engine works as a gas engine.
(iv) Engines using viscous (low volatility at normal atmospheric tempera-tures) liquid fuels like heavy and light diesel oils.The fuel is generally introduced into the cylinder in the form of minutedroplets by a fuel injection system near the end of the compression pro-cess. Combustion of the fuel takes place due to its coming into contactwith the high temperature compressed air in the cylinder. Therefore,these engines are called compression-ignition engines.
(v) Engines using two fuels.A gaseous fuel or a highly volatile liquid fuel is supplied along withair during the suction stroke or during the initial part of compressionthrough a gas valve in the cylinder head and the other fuel (a viscousliquid fuel) is injected into the combustion space near the end of thecompression stroke. These are called dual-fuel engines .
Introduction 17
1.5.3 Method of Charging
According to the method of charging, the engines are classified as
(i) Naturally aspirated engines : Admission of air or fuel-air mixture atnear atmospheric pressure.
(ii) Supercharged Engines : Admission of air or fuel-air mixture under pres-sure, i.e., above atmospheric pressure.
1.5.4 Type of Ignition
Spark-ignition engines require an external source of energy for the initiationof spark and thereby the combustion process. A high voltage spark is madeto jump across the spark plug electrodes. In order to produce the requiredhigh voltage there are two types of ignition systems which are normally used.They are :
(i) battery ignition system (ii) magneto ignition system.
They derive their name based on whether a battery or a magneto is usedas the primary source of energy for producing the spark.
In the case of CI engines there is no need for an external means to producethe ignition. Because of high compression ratio employed, the resulting tem-perature at the end of the compression process is high enough to self-ignitethe fuel when injected. However, the fuel should be atomized into very fineparticles. For this purpose a fuel injection system is used.
1.5.5 Type of Cooling
Cooling is very essential for the satisfactory running of an engine. There aretwo types of cooling systems used in engines, viz.,
(i) air-cooled engine (ii) water-cooled engine
1.5.6 Cylinder Arrangements
Another common method of classifying reciprocating engines is by the cylinderarrangement. The cylinder arrangement is only applicable to multicylinderengines. Two terms used in connection with cylinder arrangements must bedefined first.
(i) Cylinder Row : An arrangement of cylinders in which the centrelineof the crankshaft journals is perpendicular to the plane containing thecentrelines of the engine cylinders.
(ii) Cylinder Bank : An arrangement of cylinders in which the centreline ofthe crankshaft journals is parallel to the plane containing the centrelinesof the engine cylinders.
A number of cylinder arrangements popular with designers are describedbelow. The details of various cylinder arrangements are shown in Fig.1.12.
In-line Engine : The in-line engine is an engine with one cylinder bank, i.e.all cylinders are arranged linearly, and transmit power to a single crankshaft.

18 IC Engines
U-cylinder
Radial
In-line
X-type
Opposed cylinder
V-type
H-type
Opposed piston
Delta type
Fig. 1.12 Engine classification by cylinder arrangements
This type is quite common with automobile engines. Four and six cylinderin-line engines are popular in automotive applications.
‘V’ Engine : In this engine there are two banks of cylinders (i.e., two inline engines) inclined at an angle to each other and with one crankshaft. Mostof the high powered automobiles use the 8 cylinder ‘V’ engine, four in-line oneach side of the ‘V’. Engines with more than six cylinders generally employthis configuration.
Opposed Cylinder Engine : This engine has two cylinder banks locatedin the same plane on opposite sides of the crankshaft. It can be visualized astwo ‘ in-line’ arrangements 180 degrees apart. It is inherently a well balancedengine and has the advantages of a single crankshaft. This design is used insmall aircrafts.
Opposed Piston Engine : When a single cylinder houses two pistons,each of which driving a separate crankshaft, it is called an opposed pistonengine. The movement of the pistons is synchronized by coupling the twocrankshafts. Opposed piston arrangement, like opposed cylinder arrangement,

Introduction 19
and is inherently well balanced. Further, it has the advantage of requiring nocylinder head. By its inherent features, this engine usually functions on theprinciple of two-stroke engines.
Radial Engine : Radial engine is one where more than two cylinders ineach row are equally spaced around the crankshaft. The radial arrangementof cylinders is most commonly used in conventional air-cooled aircraft engineswhere 3, 5, 7 or 9 cylinders may be used in one bank and two to four banksof cylinders may be used. The odd number of cylinders is employed from thepoint of view of balancing. Pistons of all the cylinders are coupled to the samecrankshaft.
‘X’ Type Engine : This design is a variation of ‘V’ type. It has four banksof cylinders attached to a single crankshaft.
‘H’ Type Engine : The ‘H’ type is essentially two ‘Opposed cylinder’ typeutilizing two separate but interconnected crankshafts.
‘U’ Type Engine : The ‘U’ type is a variation of opposed piston arrange-ment.
Delta Type Engine : The delta type is essentially a combination of threeopposed piston engine with three crankshafts interlinked to one another.
In general, automobile and general purpose engines utilize the ‘in-line’ and‘V’ type configuration or arrangement. The ‘radial’ engine was used widelyin medium and large aircrafts till it was replaced by the gas turbine. Smallaircrafts continue to use either the ‘opposed cylinder’ type or ‘in-line’ or ‘V’type engines. The ‘opposed piston’ type engine is widely used in large dieselinstallations. The ‘H’ and ‘X’ types do not presently find any application,except in some diesel installations. A variation of the ‘X’ type is referred toas the ‘pancake’ engine.
1.6 APPLICATION OF IC ENGINES
The most important application of IC engines is in transport on land, sea andair. Other applications include industrial power plants and as prime moversfor electric generators. Table 1.3 gives, in a nutshell, the applications of bothIC and EC engines.
1.6.1 Two-Stroke Gasoline Engines
Small two-stroke gasoline engines are used where simplicity and low cost of theprime mover are the main considerations. In such applications a little higherfuel consumption is acceptable. Very small two-stroke engines (¡50 cc)are usedin mopeds and lawn mowers. Scooters and motor cycles, the commonly usedtwo wheeler transport, have generally 100-150 cc, two-stroke gasoline enginesdeveloping a maximum brake power of about 5 kW at 5500 rpm. High poweredmotor cycles have generally 250 cc gasoline engines developing a maximumbrake power of about 10 kW at 5000 rpm. Gasoline engines are used invery small electric generating sets, pumping sets, and outboard motor boats.However, their specific fuel consumption is higher due to the loss of fuel-aircharge in the process of scavenging and because of high speed of operation

20 IC Engines
Table 1.3 Application of Engines
IC Engine EC Engine
Type Application Type Application
Gasoline engines Automotive,Marine, Aircraft
Steam Engines Locomotives,Marine
Gas engines Industrial power Stirling Engines ExperimentalSpace Vehicles
Diesel engines Automotive,Railways,Power,Marine
Steam Turbines Power, LargeMarine
Gas turbines Power, Aircraft,Industrial,Marine
Close Cycle GasTurbine
Power, Marine
for which such small engines are designed. It may be noted that four-strokeengines are slowly replacing the two-stroke engines used in two-wheelers.
1.6.2 Two-Stroke Diesel Engines
Very high power diesel engines used for ship propulsion are commonly two-stroke diesel engines. In fact, all engines between 400 to 900 mm bore areloop scavenged or uniflow type with exhaust valves (see Figs.19.8 and 19.9).The brake power on a single crankshaft can be upto 37000 kW. Nordberg, 12cylinder 800 mm bore and 1550 mm stroke, two-stroke diesel engine develops20000 kW at 120 rpm. This speed allows the engine to be directly coupled tothe propeller of a ship without the necessity of reduction gear.
1.6.3 Four-Stroke Gasoline Engines
The most important application of small four-stroke gasoline engines is inautomobiles. A typical automobile is powered by a four-stroke four cylinderengine developing an output in the range of 30-60 kW at a speed of about4500 rpm. American automobile engines are much bigger and have 6 or 8cylinder engines with a power output upto 185 kW. However, the oil crisisand air pollution from automobile engines have reversed this trend towardssmaller capacity engines.
Once four-stroke gasoline engines were used for buses and trucks. Theywere generally 4000 cc, 6 cylinder engines with maximum brake power of about90 kW. However, nowadays gasoline engines have been practically replaced bydiesel engines. The four-stroke gasoline engines have also been used in highpower motor cycles with side cars. Another application of four-stroke gasolineengine is in small pumping sets and mobile electric generating sets.
Smaller aircrafts normally employ four-stroke gasoline (SI) radial engines.Engines having maximum power output from 400 kW to 4000 kW have beenused in aircraft. An example is the Bristol Contours 57, 18 cylinder two row,sleeve valve, air-cooled radial engine developing, a maximum brake power ofabout 2100 kW.
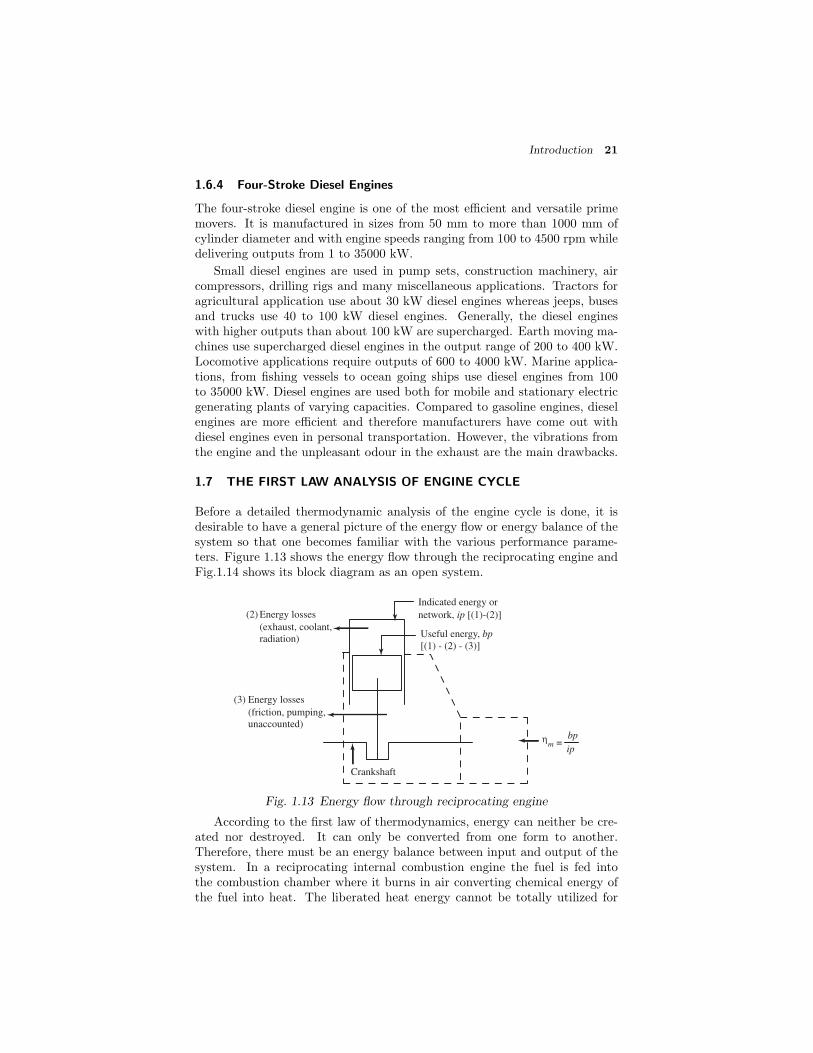
Introduction 21
1.6.4 Four-Stroke Diesel Engines
The four-stroke diesel engine is one of the most efficient and versatile primemovers. It is manufactured in sizes from 50 mm to more than 1000 mm ofcylinder diameter and with engine speeds ranging from 100 to 4500 rpm whiledelivering outputs from 1 to 35000 kW.
Small diesel engines are used in pump sets, construction machinery, aircompressors, drilling rigs and many miscellaneous applications. Tractors foragricultural application use about 30 kW diesel engines whereas jeeps, busesand trucks use 40 to 100 kW diesel engines. Generally, the diesel engineswith higher outputs than about 100 kW are supercharged. Earth moving ma-chines use supercharged diesel engines in the output range of 200 to 400 kW.Locomotive applications require outputs of 600 to 4000 kW. Marine applica-tions, from fishing vessels to ocean going ships use diesel engines from 100to 35000 kW. Diesel engines are used both for mobile and stationary electricgenerating plants of varying capacities. Compared to gasoline engines, dieselengines are more efficient and therefore manufacturers have come out withdiesel engines even in personal transportation. However, the vibrations fromthe engine and the unpleasant odour in the exhaust are the main drawbacks.
1.7 THE FIRST LAW ANALYSIS OF ENGINE CYCLE
Before a detailed thermodynamic analysis of the engine cycle is done, it isdesirable to have a general picture of the energy flow or energy balance of thesystem so that one becomes familiar with the various performance parame-ters. Figure 1.13 shows the energy flow through the reciprocating engine andFig.1.14 shows its block diagram as an open system.
radiation)
(friction, pumping,
Crankshaft
Indicated energy or
Useful energy, bp
m =ip
bpη
(exhaust, coolant,
Energy losses(2)
Energy losses
unaccounted)
(3)
network, ip [(1)-(2)]
[(1) - (2) - (3)]
Fig. 1.13 Energy flow through reciprocating engine
According to the first law of thermodynamics, energy can neither be cre-ated nor destroyed. It can only be converted from one form to another.Therefore, there must be an energy balance between input and output of thesystem. In a reciprocating internal combustion engine the fuel is fed intothe combustion chamber where it burns in air converting chemical energy ofthe fuel into heat. The liberated heat energy cannot be totally utilized for
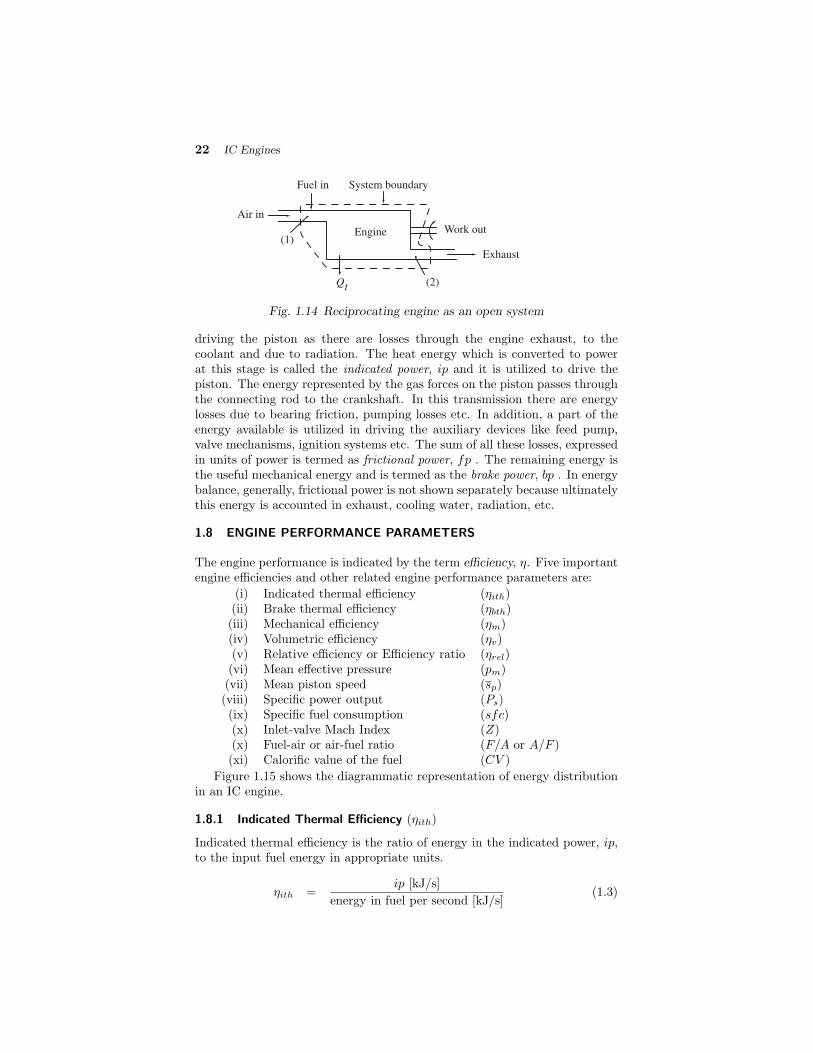
22 IC Engines
Fuel in
Air in
System boundary
(1)
(2)Qt
Engine Work out
Exhaust
Fig. 1.14 Reciprocating engine as an open system
driving the piston as there are losses through the engine exhaust, to thecoolant and due to radiation. The heat energy which is converted to powerat this stage is called the indicated power, ip and it is utilized to drive thepiston. The energy represented by the gas forces on the piston passes throughthe connecting rod to the crankshaft. In this transmission there are energylosses due to bearing friction, pumping losses etc. In addition, a part of theenergy available is utilized in driving the auxiliary devices like feed pump,valve mechanisms, ignition systems etc. The sum of all these losses, expressedin units of power is termed as frictional power, fp . The remaining energy isthe useful mechanical energy and is termed as the brake power, bp . In energybalance, generally, frictional power is not shown separately because ultimatelythis energy is accounted in exhaust, cooling water, radiation, etc.
1.8 ENGINE PERFORMANCE PARAMETERS
The engine performance is indicated by the term efficiency, η. Five importantengine efficiencies and other related engine performance parameters are:
(i) Indicated thermal efficiency (ηith)(ii) Brake thermal efficiency (ηbth)(iii) Mechanical efficiency (ηm)(iv) Volumetric efficiency (ηv)(v) Relative efficiency or Efficiency ratio (ηrel)(vi) Mean effective pressure (pm)(vii) Mean piston speed (sp)(viii) Specific power output (Ps)(ix) Specific fuel consumption (sfc)(x) Inlet-valve Mach Index (Z)(x) Fuel-air or air-fuel ratio (F/A or A/F )(xi) Calorific value of the fuel (CV )
Figure 1.15 shows the diagrammatic representation of energy distributionin an IC engine.
1.8.1 Indicated Thermal Efficiency (ηith)
Indicated thermal efficiency is the ratio of energy in the indicated power, ip,to the input fuel energy in appropriate units.
ηith =ip [kJ/s]
energy in fuel per second [kJ/s](1.3)
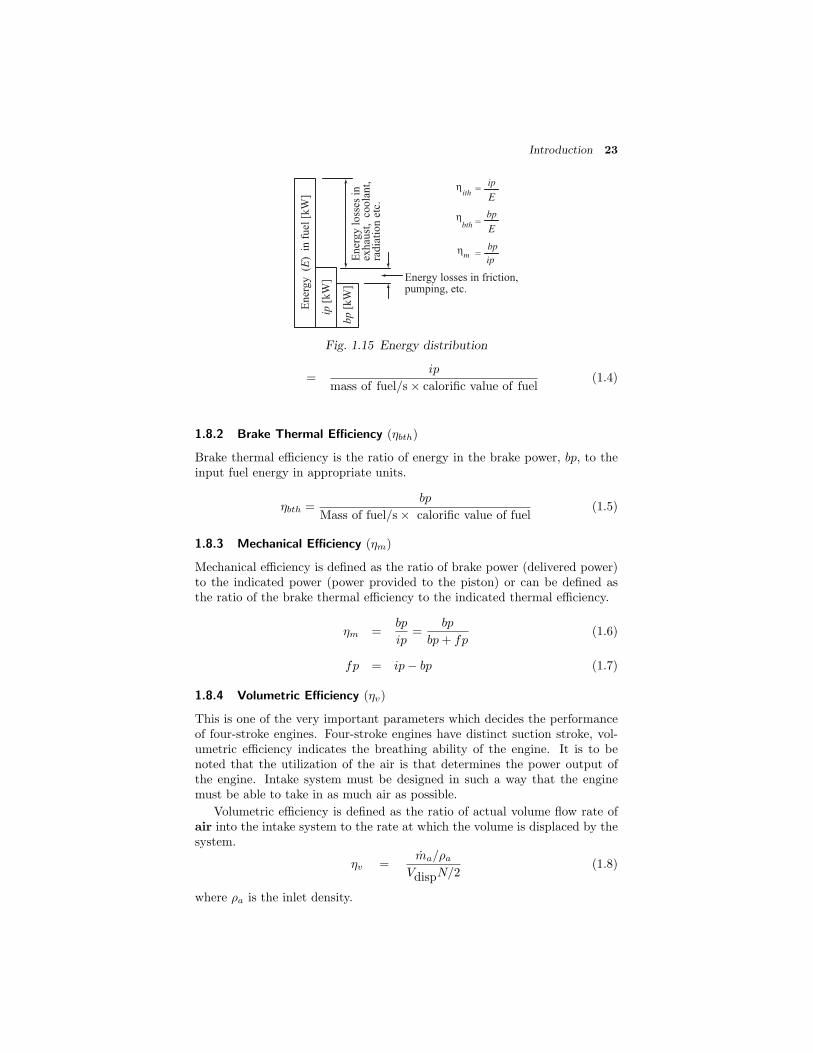
Introduction 23
ip [
kW
]
bp
[k
W]
Ener
gy
(E
) i
n f
uel
[kW
]
pumping, etc.
ithη =
=bthη
mη =
ip
bp
ip
E
bp
E
Ener
gy
loss
es i
nex
hau
st,
coo
lant,
rad
iati
on
etc
.
Energy losses in friction,
Fig. 1.15 Energy distribution
=ip
mass of fuel/s× calorific value of fuel(1.4)
1.8.2 Brake Thermal Efficiency (ηbth)
Brake thermal efficiency is the ratio of energy in the brake power, bp, to theinput fuel energy in appropriate units.
ηbth =bp
Mass of fuel/s× calorific value of fuel(1.5)
1.8.3 Mechanical Efficiency (ηm)
Mechanical efficiency is defined as the ratio of brake power (delivered power)to the indicated power (power provided to the piston) or can be defined asthe ratio of the brake thermal efficiency to the indicated thermal efficiency.
ηm =bp
ip=
bp
bp + fp(1.6)
fp = ip− bp (1.7)
1.8.4 Volumetric Efficiency (ηv)
This is one of the very important parameters which decides the performanceof four-stroke engines. Four-stroke engines have distinct suction stroke, vol-umetric efficiency indicates the breathing ability of the engine. It is to benoted that the utilization of the air is that determines the power output ofthe engine. Intake system must be designed in such a way that the enginemust be able to take in as much air as possible.
Volumetric efficiency is defined as the ratio of actual volume flow rate ofair into the intake system to the rate at which the volume is displaced by thesystem.
ηv =ma/ρa
VdispN/2(1.8)
where ρa is the inlet density.

24 IC Engines
An alternative equivalent definition for volumetric efficiency is
ηv =ma
ρaVd(1.9)
It is to be noted that irrespective of the engine whether SI, CI or gasengine, volumetric rate of air flow is what to be taken into account and notthe mixture flow.
If ρa is taken as the atmospheric air density, then ηv is the pumpingperformance of the entire inlet system. If it is taken as the air density in theinlet manifold, then ηv is the pumping performance of the inlet port and valveonly.
The normal range of volumetric efficiency at full throttle for SI enginesis between 80 to 85% where as for CI engines it is between 85 to 90%. Gasengines have much lower volumetric efficiency since gaseous fuel displaces airand therefore the breathing capacity of the engine is reduced.
1.8.5 Relative Efficiency or Efficiency Ratio (ηrel)
Relative efficiency or efficiency ratio is the ratio of thermal efficiency of anactual cycle to that of the ideal cycle. The efficiency ratio is a very usefulcriterion which indicates the degree of development of the engine.
ηrel =Actual thermal efficiency
Air-standard efficiency(1.10)
1.8.6 Mean Effective Pressure (pm)
Mean effective pressure is the average pressure inside the cylinders of an inter-nal combustion engine based on the calculated or measured power output. Itincreases as manifold pressure increases. For any particular engine, operatingat a given speed and power output, there will be a specific indicated meaneffective pressure, imep, and a corresponding brake mean effective pressure,bmep. They are derived from the indicated and brake power respectively. Forderivation see Chapter 16. Indicated power can be shown to be
ip =pimLAnK
60× 1000(1.11)
then, the indicated mean effective pressure can be written as
pim =60000× ip
LAnK(1.12)
Similarly, the brake mean effective pressure is given by
pbm =60000× bp
LAnK(1.13)

Introduction 25
where ip = indicated power (kW)pim = indicated mean effective pressure (N/m2)L = length of the stroke (m)A = area of the piston (m2)N = speed in revolutions per minute (rpm)n = Number of power strokes
N/2 for 4-stroke and N for 2-stroke enginesK = number of cylinders
Another way of specifying the indicated mean effective pressure pim isfrom the knowledge of engine indicator diagram (p-V diagram). In this case,pim, may be defined as
pim =Area of the indicator diagram
Length of the indicator diagram
where the length of the indicator diagram is given by the difference betweenthe total volume and the clearance volume.
1.8.7 Mean Piston Speed (sp)
An important parameter in engine applications is the mean piston speed, sp.It is defined as
sp = 2LN
where L is the stroke and N is the rotational speed of the crankshaft in rpm.It may be noted that sp is often a more appropriate parameter than crankrotational speed for correlating engine behaviour as a function of speed.
Resistance to gas flow into the engine or stresses due to the inertia ofthe moving parts limit the maximum value of sp to within 8 to 15 m/s.Automobile engines operate at the higher end and large marine diesel enginesat the lower end of this range of piston speeds.
1.8.8 Specific Power Output (Ps)
Specific power output of an engine is defined as the power output per unitpiston area and is a measure of the engine designer’s success in using theavailable piston area regardless of cylinder size. The specific power can beshown to be proportional to the product of the mean effective pressure andmean piston speed.
Specific power output, Ps = bp/A (1.14)
= constant× pbm × sp (1.15)
As can be seen the specific power output consists of two elements, viz., theforce available to work and the speed with which it is working. Thus, for thesame piston displacement and bmep, an engine running at a higher speed willgive a higher specific output. It is clear that the output of an engine can beincreased by increasing either the speed or the bmep. Increasing the speedinvolves increase in the mechanical stresses of various engine components. Forincreasing the bmep better heat release from the fuel is required and this willinvolve more thermal load on engine cylinder.

26 IC Engines
1.8.9 Specific Fuel Consumption (sfc)
The fuel consumption characteristics of an engine are generally expressed interms of specific fuel consumption in kilograms of fuel per kilowatt-hour. Itis an important parameter that reflects how good the engine performance is.It is inversely proportional to the thermal efficiency of the engine.
sfc =Fuel consumption per unit time
Power(1.16)
Brake specific fuel consumption and indicated specific fuel consumption,abbreviated as bsfc and isfc, are the specific fuel consumptions on the basisof bp and ip respectively.
1.8.10 Inlet-Valve Mach Index (Z)
In a reciprocating engine the flow of intake charge takes place through theintake valve opening which is varying during the induction operation. Also,the maximum gas velocity through this area is limited by the local sonicvelocity. Thus gas velocity is finally chosen by the following equation,
u =Ap
CiAiVp (1.17)
where u = gas velocity through the inlet valveat smallest flow area
Ap = piston areaAi = nominal intake valve opening areaCi = inlet valve flow co-efficient
andu
α=
Ap
Ai
Vp
Ciα=
b
Di
2Vp
Ciα= Z (1.18)
where b = cylinder diameterDi = inlet valve diameterVp = mean piston speedα = inlet sonic velocityCi = inlet valve average flow co-efficientZ = inlet valve Mach index.
Large number of experiments have been conducted on CFR single cylinderengine with gaseous mixtures and short induction pipe lengths, at fixed valvetiming and fixed compression ratio, but varying inlet valve diameter and lift.The results are quite revealing as regards the relationship of volumetric effi-ciency versus Mach index are concerned. From Fig.1.16, it could be seen thatthe maximum volumetric efficiency is obtainable for an inlet Mach numberof 0.55. Therefore, engine designers must take care of this factor to get themaximum volumetric efficiency for their engines.
1.8.11 Fuel-Air (F/A) or Air-Fuel Ratio (A/F )
The relative proportions of the fuel and air in the engine are very importantfrom the standpoint of combustion and the efficiency of the engine. This is
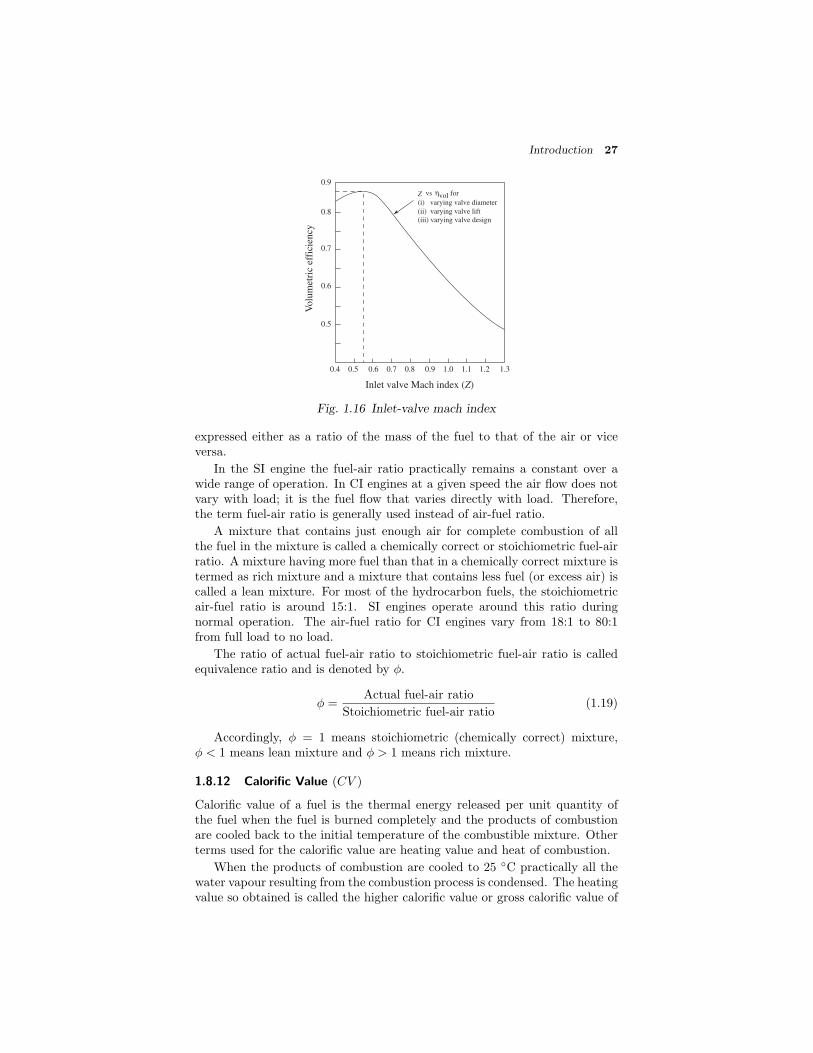
Introduction 27
Inlet valve Mach index (Z)
0.4 0.5 0.6 0.7 0.8 0.9 1.0 1.1 1.2 1.3
0.9
0.8
0.7
0.6
0.5
Volu
met
ric
effi
cien
cy
(iii) varying valve design
(i) varying valve diameter
(ii) varying valve lift
ηvolZ vs for
Fig. 1.16 Inlet-valve mach index
expressed either as a ratio of the mass of the fuel to that of the air or viceversa.
In the SI engine the fuel-air ratio practically remains a constant over awide range of operation. In CI engines at a given speed the air flow does notvary with load; it is the fuel flow that varies directly with load. Therefore,the term fuel-air ratio is generally used instead of air-fuel ratio.
A mixture that contains just enough air for complete combustion of allthe fuel in the mixture is called a chemically correct or stoichiometric fuel-airratio. A mixture having more fuel than that in a chemically correct mixture istermed as rich mixture and a mixture that contains less fuel (or excess air) iscalled a lean mixture. For most of the hydrocarbon fuels, the stoichiometricair-fuel ratio is around 15:1. SI engines operate around this ratio duringnormal operation. The air-fuel ratio for CI engines vary from 18:1 to 80:1from full load to no load.
The ratio of actual fuel-air ratio to stoichiometric fuel-air ratio is calledequivalence ratio and is denoted by φ.
φ =Actual fuel-air ratio
Stoichiometric fuel-air ratio(1.19)
Accordingly, φ = 1 means stoichiometric (chemically correct) mixture,φ < 1 means lean mixture and φ > 1 means rich mixture.
1.8.12 Calorific Value (CV )
Calorific value of a fuel is the thermal energy released per unit quantity ofthe fuel when the fuel is burned completely and the products of combustionare cooled back to the initial temperature of the combustible mixture. Otherterms used for the calorific value are heating value and heat of combustion.
When the products of combustion are cooled to 25 ◦C practically all thewater vapour resulting from the combustion process is condensed. The heatingvalue so obtained is called the higher calorific value or gross calorific value of
28 IC Engines
the fuel. The lower or net calorific value is the heat released when watervapour in the products of combustion is not condensed and remains in thevapour form.
1.9 DESIGN AND PERFORMANCE DATA
Engine ratings usually indicate the highest power at which manufacturers ex-pect their products to give reasonably good performance. The performanceparameters usually takes into account satisfactory economy, reliability, anddurability under service conditions. The speed at which the maximum torqueis achieved, is also usually given. It may be noted that both these quantitiesdepend on displacement volume. Therefore, for comparative analysis betweenengines of different displacements in a given engine category normalized per-formance parameters are preferred and they are most useful.
Typical design and performance data for SI and CI engines used in differ-ent applications are summarized in Table 1.4. As can be seen the four-strokecycle dominates except in the smallest and largest engines. The larger en-gines are usually turbocharged or supercharged. As the engine size increases,the maximum rated engine speed decreases, maintaining the maximum meanpiston speed in the range of about 8 to 15 m/sis maintained. The maximumbmep for turbocharged and supercharged engines is higher compared to nat-urally aspirated engines. Because the maximum fuel-air ratio for SI enginesis higher than for CI engines, their naturally aspirated maximum bmep levelsare higher. As the engine size increases, brake specific fuel consumption de-creases and fuel conversion efficiency increases due to the reduced heat lossesand friction. For the large CI engines, brake thermal efficiencies of about 40%and indicated thermal efficiencies of about 50% can be obtained in modernengines.
The various operating conditions that should be taken into account are
(i) maximum or normal rated operation,
(ii) full throttle or full load operation, and
(iii) long period operation.
For (i) the most important performance parameters are mean piston speed,brake mean effective pressure, power per unit piston area, specific weight, andspecific volume. For (ii) the most important performance parameters is bmeponly and for (iii) they are brake specific fuel consumption, and brake specificfuel emissions.

Introduction 29
Table1.4TypicalDesignandPerformanceDataforModernInternalCombustionEngines
RatedMaximum
Weight/
Approx.
OperatingCompression
Bore
Stroke/
Pow
erbest
cycle
ratio
(m)
bore
Speed
bmep
ratio
bsfc
(Stroke)
ratio
(rev/min)
(atm
)(kg/kW)(g/kW
h)
Spark-ignitionengines
Small(e.g.motorcycles)
2/4
6−10
0.05−0.085
1.2−0.9
4500−7500
4−10
5.5−2.5
350
Passenger
cars
48−10
0.07−0.1
1.1−0.9
4500−6500
7−10
4−2
270
Trucks
47−9
0.09−0.13
1.2−0.7
3600−5000
6.5−7
6.5−2.5
300
Largegasengines
2/4
8−12
0.22−0.45
1.1−1.4
300−900
6.8−12
23−35
200
Wankelengines
4≈
90.57dm3per
chamber
6000−80009.5−10.5
1.6−0.9
300
Compression-ignitionengines
Passenger
cars
416−20
0.075−0.1
1.2−0.9
4000−5000
5−7.5
5−2.5
250
Trucks
416−20
0.1−0.15
1.3−0.8
2100−4000
6−9
7−4
210
Locomotive
4/2
16−18
0.15−0.4
1.1−1.3
425−1800
7−23
6−18
190
Largeengines
210−12
0.4−1
1.2−3.0
110−400
9−17
12−50
180
30 IC Engines
Worked out Examples
1.1 The cubic capacity of a four-stroke over-square spark-ignition engine is245 cc. The over-square ratio is 1.1. The clearance volume is 27.2 cc.Calculate the bore, stroke and compression ratio of the engine.
Solution
Cubic capacity, Vs =π
4d2L =
π
4
d3
1.1= 245
d3 = 343
Bore, d = 7 cmAns⇐=
Stroke, L =7
1.1= 6.36 cm
Ans⇐=
Compression ratio, r =Vs + Vc
Vc
=245 + 27.2
27.2= 10
Ans⇐=
1.2 The mechanical efficiency of a single-cylinder four-stroke engine is 80%.The frictional power is estimated to be 25 kW. Calculate the indicatedpower (ip) and brake power (bp) developed by the engine.
Solution
bp
ip= 0.8
ip− bp = 25
ip− 0.8× ip = 25
Indicated power, ip =25
0.2= 125 kW
Ans⇐=
Brake power, bp = ip− fp = 125− 25 = 100 kWAns⇐=
1.3 A 42.5 kW engine has a mechanical efficiency of 85%. Find the indicatedpower and frictional power. If the frictional power is assumed to beconstant with load, what will be the mechanical efficiency at 60% of theload?
Solution
ip =bp
ηm=
42.5
0.85= 50 kW
Ans⇐=
Introduction 31
Frictional power, fp = ip− bp = 50− 42.5 = 7.5 kWAns⇐=
Brake power at 60% load = 42.5× 0.6 = 25.5 kW
Mechanical efficiency ηm =bp
bp + fp=
25.5
25.5 + 7.5
= 0.773 = 77.3%Ans⇐=
1.4 Find out the speed at which a four-cylinder engine using natural gascan develop a brake power of 50 kW working under following conditions.Air-gas ratio 9:1, calorific value of the fuel = 34 MJ/m3, Compressionratio 10:1, volumetric efficiency = 70%, indicated thermal efficiency =35% and the mechanical efficiency = 80% and the total volume of theengine is 2 litres.
Solution
Total volume/cylinder, Vtot =2000
4= 500 cc
Swept volume/cylinder,Vs =9
10× 500 = 450 cc
Volume of air taken in/cycle = ηv × Vs = 0.7× 450 = 315 cc
Volume of gas taken in/cycle =315
9= 35 cc
Energy supplied/cylinder, E = 35× 10−6 × 34× 103
= 1.19 kJ (1)
Indicated thermal efficiency, ηith =bp/ηm
Energy supplied/cylinder/s
Energy supplied/cylinder/s,E1 =50/0.8
0.35× 4= 44.64 kJ
Now, energy supplied per cylinder in kJ = E1N/120
=44.64× 120
N=
5356.8
N(2)
Equating (1) and (2)5356.8
N= 1.19
N ≈ 4500 rpmAns⇐=
1.5 A four-stroke, four-cylinder diesel engine running at 2000 rpm develops60 kW. Brake thermal efficiency is 30% and calorific value of fuel (CV )

32 IC Engines
is 42 MJ/kg. Engine has a bore of 120 mm and stroke of 100 mm. Takeρa = 1.15 kg/m3, air-fuel ratio = 15:1 and ηm = 0.8. Calculate (i) fuelconsumption (kg/s); (ii) air consumption (m3/s); (iii) indicated thermalefficiency; (iv) volumetric efficiency; (v) brake mean effective pressureand (vi) mean piston speed
Solution
Fuel consumption, mf =bp
ηbth × CV=
60
0.3× 42000
= 4.76× 10⁻³ kg/sAns⇐=
Air consumption =mf
ρa
A
F=
4.76× 10⁻³
1.15× 15
= 62.09× 10⁻³ m3/ sAns⇐=
Air flow rate/cylinder =62.09× 10⁻³
4= 15.52× 10⁻³ m3/s
Indicated power =bp
ηm=
60
0.8= 75 kW
ηith =75
4.76× 10−3 × 42000
= 0.37515 = 37.51%Ans⇐=
Volumetric efficiency =
Actual volume flow rate of air
Volume flow rate of air corresponding to displacement volume× 100
ηv =15.52× 10⁻³
π4 × 0.122 × 0.10× 2000
2× 60
× 100
= 82.3%Ans⇐=
Brake mean effective pressure,
pbm =bp
LAnK
=60
0.1× π4 × 0.122 × 2000
2× 60 × 4× 103
= 7.96× 10⁵ N/m2
= 7.96 barAns⇐=
Mean piston speed =2× 0.1× 2000
60= 6.67 m/s
Ans⇐=

Introduction 33
1.6 A single-cylinder, four-stroke hydrogen fuelled spark-ignition engine de-livers a brake power of 20 kW at 6000 rpm. The air-gas ratio is 8:1and the calorific value of fuel is 11000 kJ/m3. The compression ratio is8:1. If volumetric efficiency is 70%, indicated thermal efficiency is 33%and the mechanical efficiency is 90%, calculate the cubic capacity of theengine.
Solution
Energy input =bp/ηmηith
=20
0.8× 0.33
= 75.76 kJ/s
Number of power strokes/s =N
2× 60=
6000
120= 50
Energy input/power stroke =75.76
50= 1.52 kJ
Actual volume of H2 × CV = 1.52
Actual volume of hydrogen taken in =1.52× 10⁶
11000= 138.18 cc
Actual volume of air take in =A
F× 138.18 = 8× 138.18
= 1105.44 cc
Swept volume, Vs =Actual volume of air taken in
ηv
=1105.44
0.7= 1579.2 cc
Cubic capacity of the engine = Vs ×K = 1579.2× 1
= 1579.2 ccAns⇐=
1.7 Consider two engines with the following details:
Engine I: Four-stroke, four-cylinder, SI engine, indicated power is 40kW, mean piston speed 10 m/s.
Engine II: Two-stroke, two-cylinder, SI engine, indicated power is 10kW.
Assume that mean effective pressure of both the engine to be same.Ratio of bore of the engine I:II = 2:1. Show that the mean piston speedof engine II is same as that of engine I.
Solution
ip =PmLAnK
60000

34 IC Engines
n = N2 for four-stroke engine and n = N for two-stroke engine.
Maximum speed, sp = 2LN
For engine I: 40 =PmI ×AI × spI
4 × 4
60000
For engine II: 10 =PmII ×AII × spII
2 × 2
60000
40
10=
AI
AII× 10
spII
spII =AI
AII× 10
4=
d1d2
2× 2.5
=
2
1
2× 2.5 = 10 m/s
spII = spI = 10 m/sAns⇐=
1.8 An one-litre cubic capacity, four-stroke, four-cylinder SI engine has abrake thermal efficiency of 30% and indicated power is 40 kW at fullload. At half load, it has a mechanical efficiency of 65%. Assuming con-stant mechanical losses, calculate: (i) brake power (ii) frictional power(iii) mechanical efficiency at full load (iv) indicated thermal efficiency.If the volume decreases by eight-fold during the compression stroke,calculate the clearance volume.
Solution
Let the brake power at full load be bp and the frictional power be fp.
bp + fp = 40 kW (1)
At half load, bp = 0.5× bp at full load
ηm = 0.65 =0.5 bp
0.5 bp + fp
0.5 bp = 0.65× (0.5× bp + fp)
= 0.325× bp + 0.65× fp
fp =0.175
0.65× bp = 0.27bp (2)
Using (2) in (1) bp =40
1.27= 31.5 kW
Ans⇐=
fp = 31.5× 0.27 = 8.5 kWAns⇐=
Introduction 35
ηm at full load =31.5
40= 0.788 = 78.8%
Ans⇐=
ηith =ηbthηm
=30
78.8× 100 = 38%
Ans⇐=
Swept volume/cylinder =1000
4= 250 cc
r =Vs + Vc
Vc= 1 +
Vs
Vc= 8
Vc =250
7= 35.71 cc
Ans⇐=
1.9 A four-stroke petrol engine at full load delivers 50 kW. It requires 8.5kW to rotate it without load at the same speed. Find its mechanicalefficiency at full load, half load and quarter load?
Also find out the volume of the fuel consumed per second at full loadif the brake thermal efficiency is 25%, given that calorific value of thefuel = 42 MJ/kg and specific gravity of petrol is 0.75. Estimate theindicated thermal efficiency.
Solution
Mechanical efficiency at full load =bp
bp + fp
=50
50 + 8.5= 0.8547 = 85.47%
Ans⇐=
Mechanical efficiency at half load
=25
25 + 8.5= 0.7462 = 74.62%
Ans⇐=
Mechanical efficiency at quarter load
=12.5
12.5 + 8.5= 0.5952 = 59.52%
Ans⇐=
mf =bp
ηbth × CV=
50
0.25× 42000
= 4.76× 10⁻³ kg/s
Volume flow rate of fuel =4.76× 10⁻³
750= 6.34× 10⁻⁶ m3/s
Ans⇐=
Indicated thermal efficiency at full load
ηith =ηbthηm
=0.25
0.8547= 0.2925
= 29.25%Ans⇐=
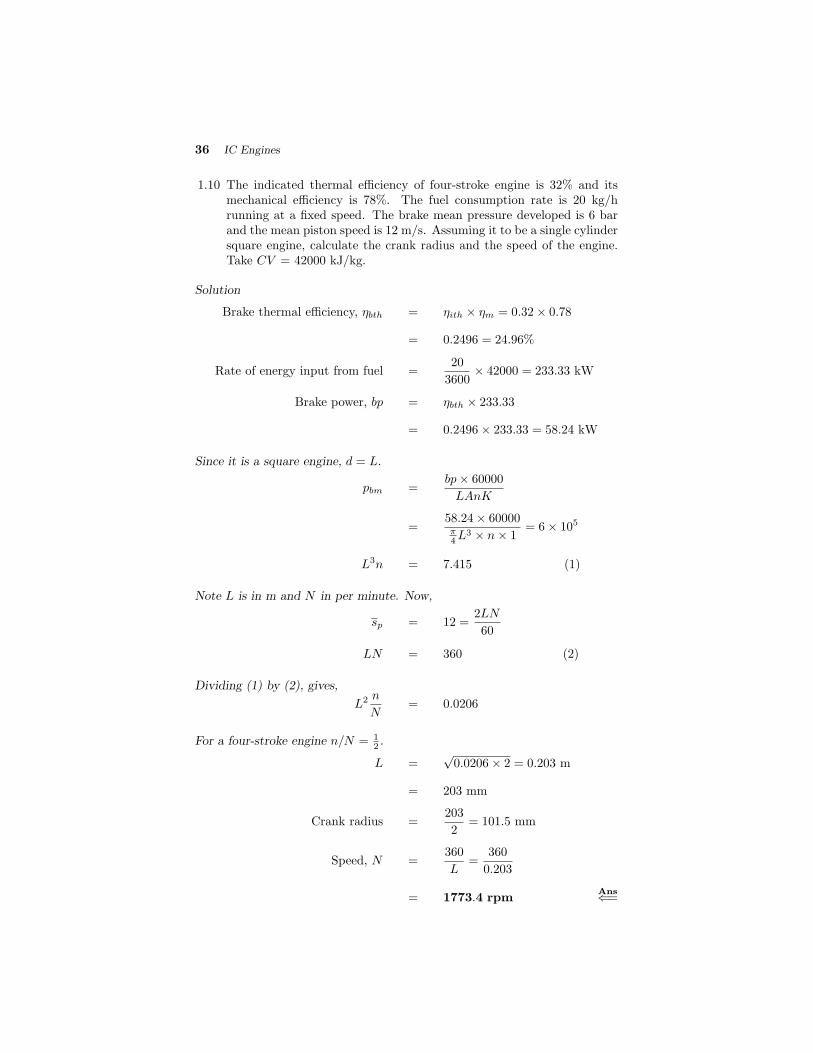
36 IC Engines
1.10 The indicated thermal efficiency of four-stroke engine is 32% and itsmechanical efficiency is 78%. The fuel consumption rate is 20 kg/hrunning at a fixed speed. The brake mean pressure developed is 6 barand the mean piston speed is 12 m/s. Assuming it to be a single cylindersquare engine, calculate the crank radius and the speed of the engine.Take CV = 42000 kJ/kg.
Solution
Brake thermal efficiency, ηbth = ηith × ηm = 0.32× 0.78
= 0.2496 = 24.96%
Rate of energy input from fuel =20
3600× 42000 = 233.33 kW
Brake power, bp = ηbth × 233.33
= 0.2496× 233.33 = 58.24 kW
Since it is a square engine, d = L.
pbm =bp× 60000
LAnK
=58.24× 60000π4L
3 × n× 1= 6× 10⁵
L3n = 7.415 (1)
Note L is in m and N in per minute. Now,
sp = 12 =2LN
60
LN = 360 (2)
Dividing (1) by (2), gives,
L2 n
N= 0.0206
For a four-stroke engine n/N = 12 .
L =√
0.0206× 2 = 0.203 m
= 203 mm
Crank radius =203
2= 101.5 mm
Speed, N =360
L=
360
0.203
= 1773.4 rpmAns⇐=
Introduction 37
Review Questions
1.1 Define the following : (i) engine and (ii) heat engine.
1.2 How are heat engines classified?
1.3 Explain the basic difference in their work principle?
1.4 Give examples of EC and IC engines.
1.5 Compare EC and IC engines.
1.6 What are the important basic components of an IC engine? Explainthem briefly.
1.7 Draw the cross-section of a single cylinder spark-ignition engine andmark the important parts.
1.8 Define the following :
(i) bore (iv) clearance volume(ii) stroke (v) compression ratio(iii) displacement volume (vi) cubic capacity
Mention the units in which they are normally measured.
1.9 What is meant by TDC and BDC? In a suitable sketch mark the twodead centres.
1.10 What is meant by cylinder row and cylinder bank?
1.11 With neat sketches explain the working principle of four-stroke spark-ignition engine.
1.12 Classify the internal combustion engine with respect to
(i) cycle of operation (iv) type of ignition(ii) cylinder arrangements (v) type of fuels used(iii) method of charging the cylinder (vi) type of cooling
1.13 In what respects four-stroke cycle CI engine differ from that of an SIengine?
1.14 What is the main reason for the development of two-stroke engines andwhat are the two main types of two-stroke engines?
1.15 Describe with a neat sketch the working principle of a crankcase scav-enged two-stroke engine.
1.16 Draw the ideal and actual indicator diagrams of a two-stroke SI engine.How are they different from that of a four-stroke cycle engine?
1.17 Compare four-stroke and two-stroke cycle engines. Bring out clearlytheir relative merits and demerits.
1.18 Discuss in detail the application of various types of IC engines.

38 IC Engines
1.19 Give an account of the first law analysis of an internal combustion en-gine.
1.20 Compare SI and CI engines with respect to
(i) basic cycle (v) compression ratio(ii) fuel used (vi) speed(iii) introduction of fuel (vii) efficiency(iv) ignition (viii) weight
1.21 Show by means of a diagram the energy flow in a reciprocating IC engine.
1.22 What is meant by mean piston speed? Explain its importance.
1.23 Discuss briefly the design performance data of SI and CI engines.
1.24 Define the following efficiencies :
(i) indicated thermal efficiency (iv) relative efficiency(ii) brake thermal efficiency (v) volumetric efficiency(iii) mechanical efficiency
1.25 Explain briefly
(i) mean effective pressure (iv) fuel-air ratio(ii) specific output (v) heating value of the fuel(iii) specific fuel consumption (vi) inlet valve Mach index
Exercise
1.1 A diesel engine has a brake thermal efficiency of 30 per cent. If thecalorific value of the fuel is 42000 kJ/kg. Find its brake specific fuelconsumption. Ans: 0.2857 kg/kW h
1.2 A gas engine having a cylinder 250 mm bore and 450 mm stroke hasa volumetric efficiency of 80%. Air-gas ratio equals 9:1, calorific valueof fuel 21000 kJ per m3 at NTP. Calculate the heat supplied to theengine per working cycle. If the compression ratio is 5:1, what is theheat value of the mixture per working stroke per m3 of total cylindervolume? Ans: (i) 36.08 kJ (ii) 1306.8 kJ/m3
1.3 A certain engine at full load delivers a brake power of 36.8 kW at cer-tain speed. It requires 7.36 kW to overcome the friction and to rotatethe engine without load at the same speed. Calculate its mechani-cal efficiency. Assuming that the mechanical losses remain constant,what will be the mechanical efficiency at half load and quarter load.
Ans: (i)83.33% (ii) 71.42% (iii) 55.55%
1.4 An engine develops a brake power of 3.68 kW. Its indicated ther-mal efficiency is 30%, mechanical efficiency is 80%, calorific value ofthe fuel is 42 MJ/kg and its specific gravity = 0.875. Calculate (i)the fuel consumption of the engine in (a) kg/h (b) litres/h (ii) indi-cated specific fuel consumption and (iii) brake specific fuel consumption.
Ans: (i) (a)1.31 kg/h (b)1.5017 l/h (ii) 0.2856 kg/kW h(iii) 0.3571 kg/kW h

Introduction 39
1.5 A two-stroke CI engine develops a brake power of 368 kWwhile its frictional power is 73.6 kW. Its fuel consumption is180 kg/h and works with an air-fuel ratio of 20:1. The heat-ing value of the fuel is 42000 kJ/kg. Calculate (i) indicatedpower (ii) mechanical efficiency (iii) air consumption per hour(iv) indicated thermal efficiency and (v) brake thermal efficiency.
Ans: (i) 441.6 kW (ii) 83.3% (iii) 3600 kg/h (iv) 21% (v) 17.5%
1.6 Compute the brake mean effective pressure of a four-cylinder, four-strokediesel engine having 150 mm bore and 200 mm stroke which develops abrake power of 73.6 kW at 1200 rpm. Ans: 5.206 bar
1.7 Compute the bmep of a four-cylinder, two-stroke engine, 100 mm bore125 mm stroke when it develops a torque of 490 Nm. Ans: 7.84 bar
1.8 Find the brake thermal efficiency of an engine which consumes 7 kg offuel in 20 minutes and develops a brake power of 65 kW. The fuel has aheating value of 42000 kJ/kg. Ans: 26.53%
1.9 Find the mean piston speed of a diesel engine running at 1500 rpm. Theengine has a 100 mm bore and L/d ratio is 1.5. Ans: 7.5 m/s
1.10 An engine is using 5.2 kg of air per minute while operating at 1200 rpm.The engine requires 0.2256 kg of fuel per hour to produce an indicatedpower of 1 kW. The air-fuel ratio is 15:1. Indicated thermal efficiencyis 38% and mechanical efficiency is 80%. Calculate (i) brake power and(ii) heating value of the fuel. Ans: (i) 73.7 kW (ii) 41992.89 kJ/kg
1.11 A four-cylinder, four-stroke, spark-ignition engine has a bore of80 mm and stroke of 80 mm. The compression ratio is8. Calculate the cubic capacity of the engine and the clear-ance volume of each cylinder. What type of engine is this?
Ans: (i) 1608.4 cc (ii) 57.4 cc (iii) Square engine
1.12 A four-stroke, compression-ignition engine with four cylinders developsan indicated power of 125 kW and delivers a brake power of 100 kW.Calculate (i) frictional power (ii) mechanical efficiency of the engine.
Ans: (i) 25 kW (ii) 80%
1.13 An engine with 80 per cent mechanical efficiency develops a brake powerof 30 kW. Find its indicated power and frictional power. If frictionalpower is assumed to be constant, what will be the mechanical efficiencyat half load. Ans: (i) 37.5 kW (ii) 7.5 kW (iii) 66.7%
1.14 A single-cylinder, compression-ignition engine with a brake ther-mal efficiency of 30% uses high speed diesel oil having a calorificvalue of 42000 kJ/kg. If its mechanical efficiency is 80 percent, calculate (i) bsfc in kg/kW h (ii) isfc in kg/kW h
Ans: (i) 0.286 kg/kW h (ii) 0.229 kg/kW h

40 IC Engines
1.15 A petrol engine uses a fuel of calorific value of 42000 kJ/kg and hasa specific gravity of 0.75. The brake thermal efficiency is 24 per centand mechanical efficiency is 80 per cent. If the engine develops a brakepower of 29.44 kW, calculate (i) volume of the fuel consumed per second(ii) indicated thermal efficiency Ans: (i) 2.92×10⁻³ kg/s (ii) 30%
1.16 A single-cylinder, four-stroke diesel engine having a displacement vol-ume of 790 cc is tested at 300 rpm. When a braking torque of 49 Nm isapplied, analysis of the indicator diagram gives a mean effective pressureof 980 kPa. Calculate the brake power and mechanical efficiency of theengine. Ans: (i) 1.54 kW (ii) 79.4%
1.17 A four-stroke SI engine delivers a brake power of 441.6 kW with amechanical efficiency of 85 per cent. The measured fuel consump-tion is 160 kg of fuel in one hour and air consumption is 410 kgduring one sixth of an hour. The heating value of the fuel is 42000kJ/kg. Calculate (i) indicated power (ii) frictional power (iii) air-fuel ratio (iv) indicated thermal efficiency (v) brake thermal efficiency.
Ans: (i) 519.5 kW (ii) 77.9 kW (iii) 15.5 (iv) 28.1% (v) 23.9%
1.18 A two-stroke CI engine develops a brake power of 368 kW while 73.6kW is used to overcome the friction losses. It consumes 180 kg/h of fuelat an air-fuel ratio of 20:1. The heating value of the fuel is 42000 kJ/kg.Calculate (i) indicated power (ii) mechanical efficiency; (iii) Air con-sumption (iv) indicated thermal efficiency (v) brake thermal efficiency.
Ans: (i) 441.6 kW (ii) 83.3% (iii) 1 kg/s (iv) 21% (v) 17.5%
1.19 A four-stroke petrol engine delivers a brake power of 36.8 kW witha mechanical efficiency of 80%. The air-fuel ratio is 15:1 andthe fuel consumption is 0.4068 kg/kW h. The heating value ofthe fuel is 42000 kJ/kg. Calculate (i) indicated power (ii) fric-tional power(iii) brake thermal efficiency (iv) indicated thermal ef-ficiency (v) total fuel consumption (vi) air consumption/second.
Ans: (i) 46 kW (ii) 9.2 kW (iii) 21% (iv) 26.25%(v) 0.0042 kg/s (vi) 0.063 kg/s.
1.20 A spark-ignition engine has a fuel-air ratio of 0.067. How many kg ofair per hour is required for a brake power output of 73.6 kW at anoverall brake thermal efficiency of 20%? How many m3 of air is requiredper hour if the density of air is 1.15 kg/m3. If the fuel vapour has adensity four times that of air, how many m3 per hour of the mixtureis required? The calorific value of the fuel is given as 42000 kJ/kg.
Ans: (i) 470.75 kg/h (ii) 409.35 m3/h (iii) 416.21 m3/h
1.21 A four-stroke CI engine having a cylinder diameter of 39 cm and strokeof 28 cm has a mechanical efficiency of 80%. Assume the frictional poweras 80 kW. Its fuel consumption is 86 kg/h with an air-fuel ratio of 18:1.The speed of the engine is 2000 rpm. Calculate (i) indicated power (ii)if ηith is 40%, calculate the calorific value of the fuel used (iii) pim (iv)ma/hour (v) sp. Ans: (i) 400 kW (ii) 41860 kJ (iii) 12.13 bar
(iv) 1548 kg/h (v) 18.7 m/s

Introduction 41
1.22 A four-stroke LPG engine having a cylinder 250 mm diameter and strokeof 300 mm has a volumetric efficiency of 70% at atmospheric condi-tions. Gas to air ratio is 8:1. Calorific value of the fuel is 100 MJ/m3
at atmospheric conditions. Find the heat supplied to the engine perworking cycle. If the compression ratio is 10, what is the heat valueof the mixture per working stroke per m3 of the total cylinder volume?
Ans: (i) 128.8 kJ (ii) 7.8 MJ
1.23 A four-cylinder spark-ignition engine has the following dimensions: bore= 680 mm and a crank radius = 375 mm. If the compression ratio is8:1, determine the (i) stroke length (ii) swept volume (iii) cubic capacity(iv) clearance volume and (v) total volume. If the volumetric efficiencyis 80% determine the (vi) actual volume of air aspirated/stroke in eachcylinder? Ans: (i) 750 mm (ii) 1.088 m3 (iii) 0.272 m3 (iv) 0.039 m3
(v) 0.0311 m3 (vi) 0.2176 m3
1.24 An engine with an indicated thermal efficiency of 25% and mechani-cal efficiency of 75% consumes 25 kg/h of fuel at a fixed speed. Thebrake mean effective pressure is 5 bar and the mean piston speed is15 m/s. Assuming it is a single cylinder square engine determine thecrank radius and the speed in rpm. Take CV of the fuel = 42 MJ/kg.
Ans: (i) 68.2 mm (ii) 3300 rpm
1.25 A four-cylinder SI engine running at 1200 rpm gives 18.87 kW as brakepower. When one cylinder missed firing the average torque was 100 Nm.Calculate the indicated thermal efficiency if the CV of fuel is 42 MJ/kg.The engine uses 0.335 kg of fuel per kW/h. What is the mechanicalefficiency of the engine? Ans: (i) 34.2% (ii) 74.9%
1.26 A certain engine with a bore of 250 mm has an indicated thermal effi-ciency of 30%. The bsfc and specific power output are 0.35 kg/kW hand 90 kW/m2. Find the mechanical efficiency and brake thermal effi-ciency of the engine. Take the calorific value of the fuel as 42 MJ/kg.
Ans: (i) 81.7% (ii) 24.5%
1.27 A single-cylinder, four-stroke engine having a cubic capacity of 0.7 litrewas tested at 200 rpm. From the indicator diagram the mean effectivepressure was found to be 106 N/m2 and the mechanical efficiency is 75%.Find the frictional power of the engine if the engine is an over-squareengine with a over-square ratio of 0.8. Calculate the bore and stroke.
Ans: (i) 0.29 kW (ii) 41.5 mm (iii) 89.34 mm (iv) 111.68 mm
1.28 In a performance test on a four-stroke engine, the indicator diagram areawas found to be 5 × 10⁻⁴ m2 and the length of the indicator diagramwas 0.05 m. If the y-axis has a scale of 1 m = 50 MPa, find the imep ofthe engine given that bore = 150 mm, stroke = 200 mm. The measuredengine speed was 1200 rpm. Also calculate the ip and isfc of the engineif the fuel injected per cycle is 0.5 cc with the specific gravity of 0.8.
Ans: (i) 5 bar (ii) 70.68 kW (iii) 203 g/kW h
42 IC Engines
1.29 A four-stroke, four-cylinder automotive engine develops 150 Nm braketorque at 3000 rpm. Assuming bmep to be 0.925 bar, find (i) brakepower (ii)displacement volume (iii) stroke (iv) bore. Take sp = 12 m/s.
Ans: (i) 47.124 kW (ii) 5.1 ×10⁻³ m3 (iii) 120 mm (iv) 233 mm
1.30 A single-cylinder, four-stroke, engine has a bsfc of 1.13×10⁻⁵ kg/kW hand a fuel consumption rate of 0.4068 kg/h. The specific power outputof the engine is 0.33 kW/cm2. If the engine runs at 3000 rpm find thedisplacement volume of the cylinder and if the sp is 15 m/s, find thebmep. Ans: (i) 900 cc (ii) 4.44 bar
Multiple Choice Questions (choose the most appropriate answer)
1. Advantage of reciprocating IC engines over steam turbine is
(a) mechanical simplicity
(b) improved plant efficiency
(c) lower average temperature
(d) all of the above
2. The intake charge in a diesel engine consists of
(a) air alone
(b) air + lubricating oil
(c) air + fuel
(d) air + fuel + lubricating oil
3. Disadvantages of reciprocating IC engine are
(a) vibration
(b) use of fossil fuels
(c) balancing problems
(d) all of the above
4. Gudgeon pin forms the link between
(a) piston and big end of connecting rod
(b) piston and small end of connecting rod
(c) connecting rod and crank
(d) big end and small end
5. Engines of different cylinder dimensions, power and speed are comparedon the basis of
(a) maximum pressure
(b) fuel consumption

Introduction 43
(c) mean effective pressure
(d) unit power
6. In a four-stroke IC engine cam shaft rotates at
(a) same speed as crankshaft
(b) twice the speed of crankshaft
(c) half the speed of crankshaft
(d) none of the above
7. Thermal efficiency of CI engine is higher than that of SI engine due to
(a) fuel used
(b) higher compression ratio
(c) constant pressure heat addition
(d) none of the above
8. SI engines are of
(a) light weight
(b) high speed
(c) homogeneous charge of fuel and oil
(d) all of the above
9. Compression ratio in diesel engines is of the order of
(a) 5–7
(b) 7–10
(c) 10–12
(d) 14–20
10. Main advantage of a two-stroke engine over four-stroke engine is
(a) more uniform torque on the crankshaft
(b) more power output for the cylinder of same dimensions
(c) absence of valves
(d) all of the above
11. Engines used for ships are normally
(a) four-stroke SI engines of very high power
(b) two-stroke CI engines of very high power
(c) four-stroke CI engines of high speed
(d) two-stroke SI engines of high power
44 IC Engines
12. An IC engine gives an output of 3 kW when the input is 10,000 J/s.The thermal efficiency of the engine is
(a) 33.3%
(b) 30%
(c) 60%
(d) 66.6%
13. In a reciprocating engine with a cylinder diameter of D and stroke of L,the cylinder volume is
(a) π4D
2L× clearance volume
(b) π4D
2L− clearance volume
(c) π4D
2L+ clearance volume
(d) π4D
2L÷ clearance volume
14. If L is the stroke and N is the rpm, mean piston speed of two-strokeengine is
(a) LN
(b) LN2
(c) 2LN
(d) none of the above
15. Equivalence ratio is
(a)actual fuel/air ratio
stoichiometric fuel/air ratio
(b)stoichiometric fuel/air ratio
actual fuel/air ratio
(c)stoichiometric fuel/air ratio
actual air/fuel ratio
(d)actual air/fuel ratio
stoichiometric fuel/air ratio
16. The volumetric efficiency of the SI engine is comparatively
(a) lower than CI engine
(b) higher than CI engine
(c) will be same as CI engine
(d) none of the above
17. The range of volumetric efficiency of a diesel engine is
(a) 65 – 75%
(b) 75 – 85%
Introduction 45
(c) 85 – 90%
(d) 90 – 95%
18. Relative efficiency is the ratio of
(a)actual thermal efficiency
mechanical efficiency
(b)actual thermal efficiency
airstandard efficiency
(c)airstandard efficiency
actual thermal efficiency
(d)mechanical efficiency
actual thermal efficiency
19. Brake specific fuel consumption is defined as
(a) fuel consumption per hour
(b) fuel consumption per km
(c) fuel consumption per bp
(d) fuel consumption per brake power hour
20. Engine can be fired with
(a) solid fuel
(b) liquid fuel
(c) gaseous fuel
(d) any of the above fuels
21. Frictional power is given by
(a) fp = ip + bp
(b) fp = ip/bp
(c) fp = ip× bp
(d) fp = ip− bp
22. Specific power of an IC engine is given by
(a) ps = ip/A
(b) ps = ip/V
(c) ps = bp/A
(d) ps = bp/V
23. Carburetor is mainly employed
(a) SI engine
(b) CI engine

46 IC Engines
(c) gas engine
(d) none of the above
24. In a four-stroke SI engine during suction
(a) only air is sucked
(b) only fuel is sucked
(c) fuel-air mixture is sucked
(d) none of the above
25. Inlet valve Mach index usually relates
(a) mechanical efficiency
(b) volumetric efficiency
(c) brake thermal efficiency
(d) relative efficiency
Ans : 1. – (d) 2. – (a) 3. – (d) 4. – (b) 5. – (c)6. – (c) 7. – (b) 8. – (d) 9. – (d) 10. – (d)
11. – (b) 12. – (b) 13. – (c) 14. – (c) 15. – (b)16. – (a) 17. – (c) 18. – (b) 19. – (d) 20. – (d)21. – (d) 22. – (c) 23. – (a) 24. – (c) 25. – (b)
2AIR-STANDARD
CYCLES AND THEIR
ANALYSIS
2.1 INTRODUCTION
The operating cycle of an internal combustion engine can be broken downinto a sequence of separate processes viz., intake, compression, combustion,expansion and exhaust. The internal combustion engine does not operate ona thermodynamic cycle as it involves an open system i.e., the working fluidenters the system at one set of conditions and leaves at another. However,it is often possible to analyze the open cycle as though it were a closed oneby imagining one or more processes that would bring the working fluid at theexit conditions back to the condition of the starting point.
The accurate analysis of internal combustion engine processes is very com-plicated. In order to understand them it is advantageous to analyze the per-formance of an idealized closed cycle that closely approximates the real cycle.One such approach is the air-standard cycle, which is based on the followingassumptions:
(i) The working medium is assumed to be a perfect gas and follows therelation pV = mRT or p = ρRT .
(ii) There is no change in the mass of the working medium.
(iii) All the processes that constitute the cycle are reversible.
(iv) Heat is assumed to be supplied from a constant high temperature sourceand not from chemical reactions during the cycle.
(v) Some heat is assumed to be rejected to a constant low temperature sinkduring the cycle.
(vi) It is assumed that there are no heat losses from the system to the sur-roundings.
(vii) The working medium has constant specific heats throughout the cycle.
(viii) The physical constants viz., Cp, Cv, γ and M of working medium are thesame as those of air at standard atmospheric conditions. For examplein SI units,

48 IC Engines
Cp = 1.005 kJ/kg K M = 29 kg/kmolCv = 0.717 kJ/kg K γ = 1.4
Due to these assumptions, the analysis becomes over-simplified and the resultsdo not agree with those of the actual engine. Work output, peak pressure,peak temperature and thermal efficiency based on air-standard cycles will bethe maximum that can be attained and will differ considerably from those ofthe actual engine. It is often used, mainly because of the simplicity in get-ting approximate answers to the complicated processes in internal combustionengines.
In this chapter, we will review the various cycles and also derive the equa-tions for work output, mean effective pressure, efficiency etc. Also, comparisonwill be made between Otto, Dual and Diesel cycles to see which cycle is moreefficient under a set of given operating conditions.
2.2 THE CARNOT CYCLE
Sadi Carnot, a French engineer, proposed a reversible cycle in 1824, in whichthe working medium receives heat at a higher temperature and rejects heatat a lower temperature. The cycle will consist of two isothermal and tworeversible adiabatic processes as shown in Fig.2.1. Carnot cycle is representedas a standard of perfection and engines can be compared with it to judge thedegree of perfection. It gives the concept of maximizing work output betweentwo temperature limits.
2
1
3
4
Isothermal
Adiabatic
Adiabatic
Isothermal
V
p
12
3 4
T
3 4T = T
2 1T = T
sFig. 2.1 Carnot engine
The working of an engine based on the Carnot cycle can be explainedreferring to Fig.2.2 which shows a cylinder and piston arrangement workingwithout friction. The walls of cylinder are assumed to be perfect insulators.The cylinder head is so arranged that it can be a perfect heat conductor aswell as a perfect heat insulator.
First the heat is transferred from a high temperature source, (T3), tothe working medium in the cylinder and as a result the working mediumexpands. This is represented by the isothermal process 3→4 in Fig.2.1. Nowthe cylinder head is sealed and it acts as a perfect insulator. The workingmedium in the cylinder is now allowed to expand further from state 4 to

Air-Standard Cycles and Their Analysis 49
High temperature
source
Low temperature
sink
Perfectly insulated walls
PistonT K
T K
Perfect insulator cum
perfect conductor
3
1
Fig. 2.2 Working principle of a Carnot engine
state 1 and is represented by reversible adiabatic process 4→1 in p-V and T -sdiagrams in Fig.2.1. Now the system is brought into contact with a constantlow temperature sink, (T1), as the cylinder head is now made to act as aperfect heat conductor. Some heat is rejected to the sink without altering thetemperature of sink and as a result the working medium is compressed fromstate 1 to 2 which is represented by isothermal line 1→2. Finally the cylinderhead is made again to act as a perfect insulator and the working medium iscompressed adiabatically from state 2 to 3 which is represented by process2→3. Thus the cycle is completed.
Analyzing the cycle thermodynamically the efficiency of the cycle can bewritten as
ηCarnot =Work done by the system during the cycle (W )
Heat supplied to the system during the cycle (QS)
According to the first law of thermodynamics,
Work done = Heat supplied−Heat rejected
W = QS −QR (2.1)
Considering the isothermal processes 1→2 and 3→4, we get
QR = mRT1 loge
V1V2
(2.2)
QS = mRT3 loge
V4V3
(2.3)
Considering adiabatic processes 2→3 and 4→1
V3V2
=
T2T3
( 1γ−1 )
(2.4)
and

50 IC Engines
V4V1
=
T1T4
( 1γ−1 )
(2.5)
Since T1 = T2 and T4 = T3 we have,
V4V1
=V3V2
orV4V3
=V1V2
= r (say) (2.6)
then,
ηCarnot =mRT3 loge r −mRT1 loge r
mRT3 loge r(2.7)
=T3 − T1
T3= 1− T1
T3(2.8)
The lower temperature i.e., sink temperature, T1, is normally the atmo-spheric temperature or the cooling water temperature and hence fixed. So theincrease in thermal efficiency can be achieved only by increasing the sourcetemperature. In other words, the upper temperature is required to be main-tained as high as possible, to achieve maximum thermal efficiency. Betweentwo fixed temperatures Carnot cycle (and other reversible cycles) has themaximum possible efficiency compared to other air-standard cycles. In spiteof this advantage, Carnot cycle does not provide a suitable basis for the op-eration of an engine using a gaseous working fluid because the work outputfrom this cycle will be quite low.
Mean effective pressure, pm, is defined as that hypothetical constant pres-sure acting on the piston during its expansion stroke producing the same workoutput as that from the actual cycle. Mathematically,
pm =Work Output
Swept Volume(2.9)
It can be shown as
pm =Area of indicator diagram
Length of diagram× constant (2.10)
The constant depends on the mechanism used to get the indicator diagramand has the units, bar/m. These formulae are quite often used to calculatethe performance of an internal combustion engine. If the work output is theindicated output then it is called indicated mean effective pressure, pim, andif the work output is the brake output then it is called brake mean effectivepressure, pbm.
2.3 THE STIRLING CYCLE
The Carnot cycle has a low mean effective pressure because of its very low workoutput. Hence, one of the modified forms of the cycle to produce higher mean
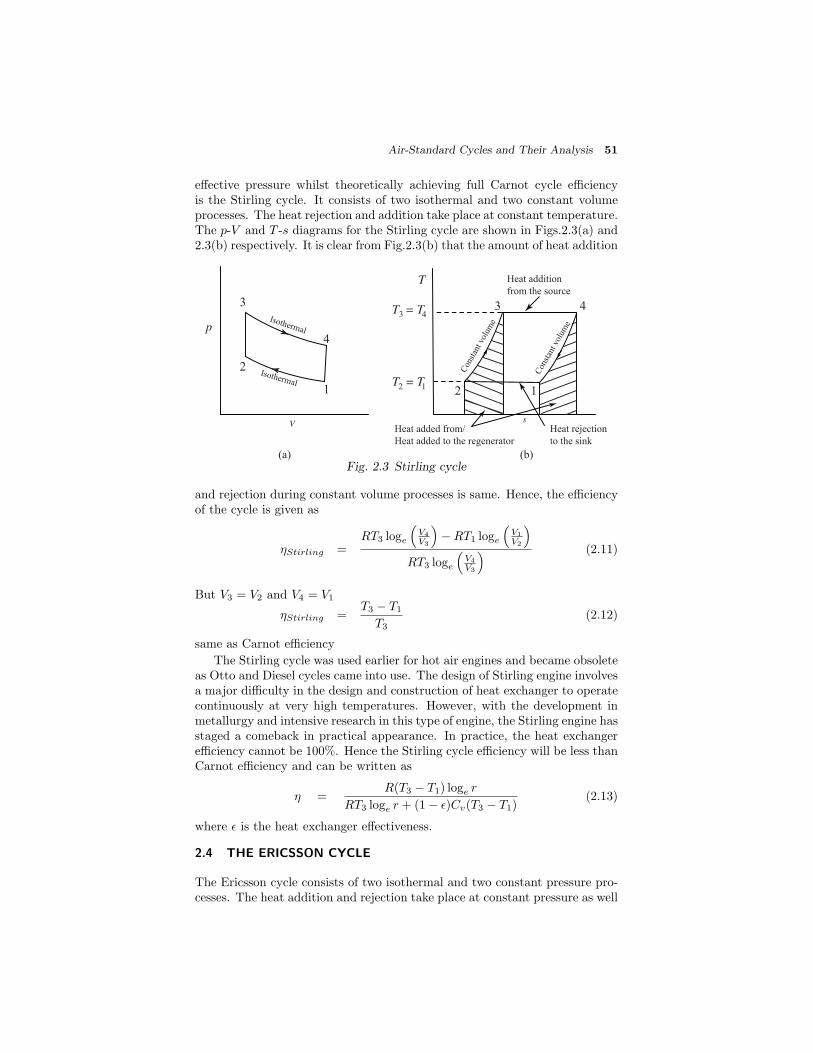
Air-Standard Cycles and Their Analysis 51
effective pressure whilst theoretically achieving full Carnot cycle efficiencyis the Stirling cycle. It consists of two isothermal and two constant volumeprocesses. The heat rejection and addition take place at constant temperature.The p-V and T -s diagrams for the Stirling cycle are shown in Figs.2.3(a) and2.3(b) respectively. It is clear from Fig.2.3(b) that the amount of heat addition
12
3 4
T
3 4T = T
2 1T = T
s
Heat addition
from the source
Heat rejection
to the sink
Con
stan
t vol
ume
Con
stan
t vol
ume
Heat added from/
Heat added to the regenerator
V
p
2
1
3
4
Isothermal
Isothermal
(a) (b)Fig. 2.3 Stirling cycle
and rejection during constant volume processes is same. Hence, the efficiencyof the cycle is given as
ηStirling =RT3 loge
V4V3
−RT1 loge
V1V2
RT3 loge
V4V3
(2.11)
But V3 = V2 and V4 = V1
ηStirling =T3 − T1
T3(2.12)
same as Carnot efficiency
The Stirling cycle was used earlier for hot air engines and became obsoleteas Otto and Diesel cycles came into use. The design of Stirling engine involvesa major difficulty in the design and construction of heat exchanger to operatecontinuously at very high temperatures. However, with the development inmetallurgy and intensive research in this type of engine, the Stirling engine hasstaged a comeback in practical appearance. In practice, the heat exchangerefficiency cannot be 100%. Hence the Stirling cycle efficiency will be less thanCarnot efficiency and can be written as
η =R(T3 − T1) loge r
RT3 loge r + (1− )Cv(T3 − T1)(2.13)
where is the heat exchanger effectiveness.
2.4 THE ERICSSON CYCLE
The Ericsson cycle consists of two isothermal and two constant pressure pro-cesses. The heat addition and rejection take place at constant pressure as well
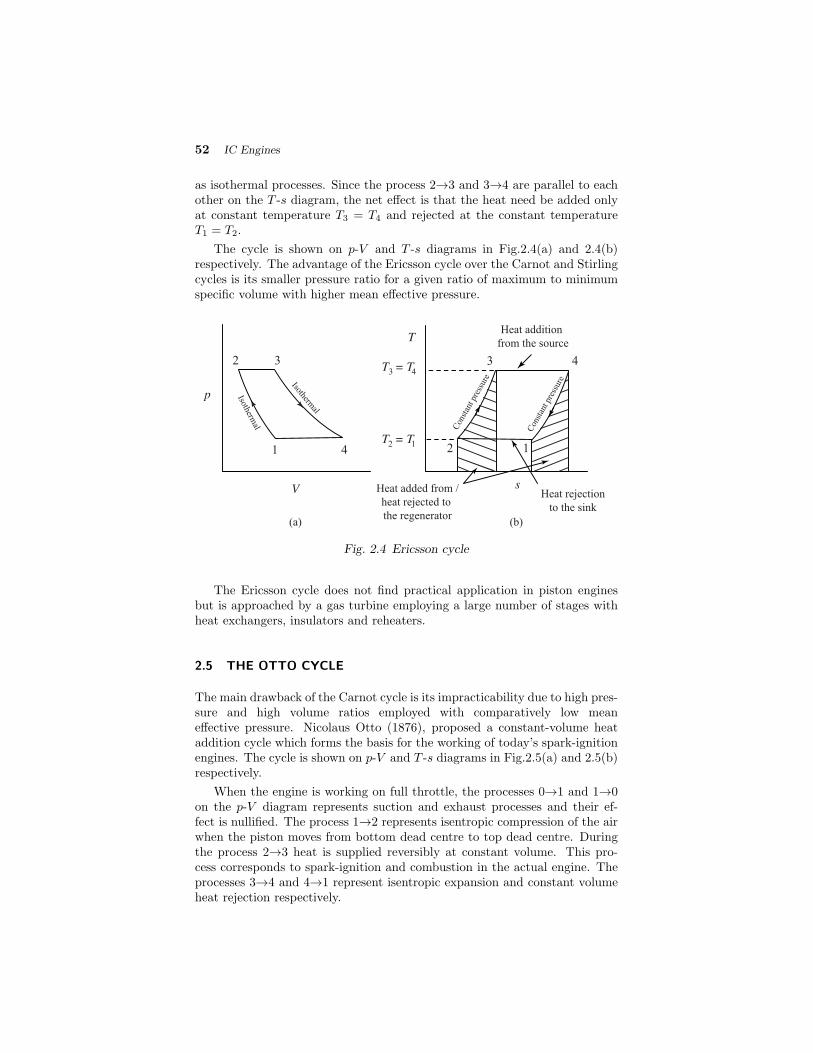
52 IC Engines
as isothermal processes. Since the process 2→3 and 3→4 are parallel to eachother on the T -s diagram, the net effect is that the heat need be added onlyat constant temperature T3 = T4 and rejected at the constant temperatureT1 = T2.
The cycle is shown on p-V and T -s diagrams in Fig.2.4(a) and 2.4(b)respectively. The advantage of the Ericsson cycle over the Carnot and Stirlingcycles is its smaller pressure ratio for a given ratio of maximum to minimumspecific volume with higher mean effective pressure.
12
3 4
T
3 4T = T
2 1T = T
s
Heat addition
from the source
Heat rejection
to the sink
Con
stan
t pre
ssur
e
Con
stan
t pre
ssur
e
Heat added from /
heat rejected to
the regenerator
2
1
3
4
Isothermal
V
p Isothermal
(a) (b)
Fig. 2.4 Ericsson cycle
The Ericsson cycle does not find practical application in piston enginesbut is approached by a gas turbine employing a large number of stages withheat exchangers, insulators and reheaters.
2.5 THE OTTO CYCLE
The main drawback of the Carnot cycle is its impracticability due to high pres-sure and high volume ratios employed with comparatively low meaneffective pressure. Nicolaus Otto (1876), proposed a constant-volume heataddition cycle which forms the basis for the working of today’s spark-ignitionengines. The cycle is shown on p-V and T -s diagrams in Fig.2.5(a) and 2.5(b)respectively.
When the engine is working on full throttle, the processes 0→1 and 1→0on the p-V diagram represents suction and exhaust processes and their ef-fect is nullified. The process 1→2 represents isentropic compression of the airwhen the piston moves from bottom dead centre to top dead centre. Duringthe process 2→3 heat is supplied reversibly at constant volume. This pro-cess corresponds to spark-ignition and combustion in the actual engine. Theprocesses 3→4 and 4→1 represent isentropic expansion and constant volumeheat rejection respectively.

Air-Standard Cycles and Their Analysis 53
1
2
3
4
T
sV
p2
1
3
4
0
QS
QR
Isentropic compression
Constant volu
m
e
Constant volume
(a) (b)
Isentropic expansion
Fig. 2.5 Otto cycle
2.5.1 Thermal Efficiency
The thermal efficiency of Otto cycle can be written as
ηOtto =QS −QR
QS(2.14)
Considering constant volume processes 2→3 and 4→1, the heat supplied andrejected of air can be written as
QS = mCv(T3 − T2) (2.15)
QR = mCv(T4 − T1) (2.16)
ηOtto =m(T3 − T2)−m(T4 − T1)
m(T3 − T2)
= 1− T4 − T1T3 − T2
(2.17)
Considering isentropic processes 1→2 and 3→4, we have
T2T1
=
V1V2
(γ−1)
(2.18)
andT3T4
=
V4V3
(γ−1)
(2.19)
But the volume ratios V1/V2 and V4/V3 are equal to the compression ratio, r.Therefore,
V1V2
=V4V3
= r (2.20)
therefore,

54 IC Engines
T2T1
=T3T4
(2.21)
From Eq.2.21, it can be easily shown that
T4T3
=T1T2
=T4 − T1T3 − T2
(2.22)
ηOtto = 1− T1T2
(2.23)
= 1− 1 V1V2
(γ−1)(2.24)
= 1− 1
r(γ−1)(2.25)
Note that the thermal efficiency of Otto cycle is a function of compressionratio r and the ratio of specific heats, γ. As γ is assumed to be a constant forany working fluid, the efficiency is increased by increasing the compressionratio. Further, the efficiency is independent of heat supplied and pressureratio. The use of gases with higher γ values would increase efficiency of Ottocycle. Fig.2.6 shows the effect of γ and r on the efficiency.
= 1.67γ
= 1.40γ
= 1.30γ
Compression ratio, r
Eff
icie
ncy
, η
(%
)
Mono atomic gas
Air
Exhaust gas
Fig. 2.6 Effect of r and γ on efficiency for Otto cycle
2.5.2 Work Output
The net work output for an Otto cycle can be expressed as
W =p3V3 − p4V4
γ − 1− p2V2 − p1V1
γ − 1(2.26)
Alsop2p1
=p3p4
= rγ

Air-Standard Cycles and Their Analysis 55
p3p2
=p4p1
= rp (say) (2.27)
V1 = rV2 and V4 = rV3
therefore,
W =p1V1γ − 1
p3V3p1V1
− p4V4p1V1
− p2V2p1V1
+ 1
(2.28)
=p1V1γ − 1
rpr
γ
r− rp − rγ
r+ 1
=p1V1γ − 1
rpr
γ−1 − rp − rγ−1 + 1
=p1V1γ − 1
(rp − 1) rγ−1 − 1
(2.29)
2.5.3 Mean Effective Pressure
The mean effective pressure of the cycle is given by
pm =Work output
Swept volume(2.30)
Swept volume = V1 − V2 = V2(r − 1)
pm =
1γ−1p1V1(rp − 1)
r(γ−1) − 1
V2(r − 1)
=p1r(rp − 1)
r(γ−1) − 1
(γ − 1)(r − 1)
(2.31)
Thus, it can be seen that the work output is directly proportional topressure ratio, rp. The mean effective pressure which is an indication ofthe internal work output increases with a pressure ratio at a fixed value ofcompression ratio and ratio of specific heats. For an Otto cycle, an increasein the compression ratio leads to an increase in the mean effective pressure aswell as the thermal efficiency.
2.6 THE DIESEL CYCLE
In actual spark-ignition engines, the upper limit of compression ratio is limitedby the self-ignition temperature of the fuel. This limitation on the compres-sion ratio can be circumvented if air and fuel are compressed separately andbrought together at the time of combustion. In such an arrangement fuel canbe injected into the cylinder which contains compressed air at a higher tem-perature than the self-ignition temperature of the fuel. Hence the fuel igniteson its own accord and requires no special device like an ignition system in aspark-ignition engine. Such engines work on heavy liquid fuels. These enginesare called compression-ignition engines and they work on a ideal cycle known
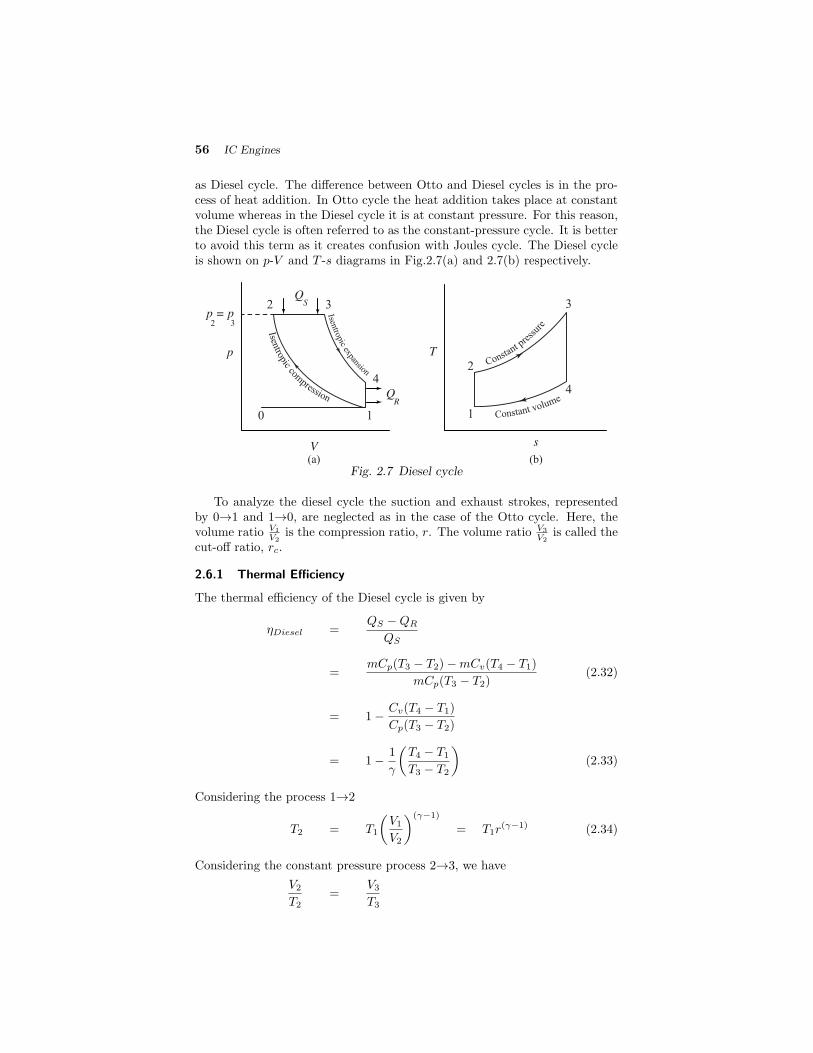
56 IC Engines
as Diesel cycle. The difference between Otto and Diesel cycles is in the pro-cess of heat addition. In Otto cycle the heat addition takes place at constantvolume whereas in the Diesel cycle it is at constant pressure. For this reason,the Diesel cycle is often referred to as the constant-pressure cycle. It is betterto avoid this term as it creates confusion with Joules cycle. The Diesel cycleis shown on p-V and T -s diagrams in Fig.2.7(a) and 2.7(b) respectively.
T
s
1
2
3
4
V
p
2
1
3
4
0
QR
QS
p = p2 3
Constant pre
ssur
e
Constant volume
Isentropic
compression
Isentropic
expansion
(a) (b)Fig. 2.7 Diesel cycle
To analyze the diesel cycle the suction and exhaust strokes, representedby 0→1 and 1→0, are neglected as in the case of the Otto cycle. Here, thevolume ratio V1
V2is the compression ratio, r. The volume ratio V3
V2is called the
cut-off ratio, rc.
2.6.1 Thermal Efficiency
The thermal efficiency of the Diesel cycle is given by
ηDiesel =QS −QR
QS
=mCp(T3 − T2)−mCv(T4 − T1)
mCp(T3 − T2)(2.32)
= 1− Cv(T4 − T1)
Cp(T3 − T2)
= 1− 1
γ
T4 − T1T3 − T2
(2.33)
Considering the process 1→2
T2 = T1
V1V2
(γ−1)
= T1r(γ−1) (2.34)
Considering the constant pressure process 2→3, we have
V2T2
=V3T3

Air-Standard Cycles and Their Analysis 57
T3T2
=V3V2
= rc (say)
T3 = T2rc (2.35)
From Eqs.2.34 and 2.35, we have
T3 = T1r(γ−1)rc (2.36)
Considering process 3→4, we have
T4 = T3
V3V4
(γ−1)
(2.37)
= T3
V3V2× V2
V4
(γ−1)
= T3
rcr
(γ−1)
(2.38)
From Eqs.2.36 and 2.37, we have
T4 = T1r(γ−1)rc
rcr
(γ−1)
= T1rγc
ηDiesel = 1− 1
γ
T1(r
γc − 1)
T1 r(γ−1)rc − r(γ−1)
= 1− 1
γ
(rγc − 1)
r(γ−1)rc − r(γ−1)
= 1− 1
r(γ−1)
rγc − 1
γ(rc − 1)
(2.39)
It may be noted that the efficiency of the Diesel cycle is different fromthat of the Otto cycle only in the bracketed factor. This factor is alwaysgreater than unity. Hence for a given compression ratio, the Otto cycle ismore efficient. In diesel engines the fuel cut-off ratio, rc, depends on out-put, being maximum for maximum output. Therefore, unlike the Otto cyclethe air-standard efficiency of the Diesel cycle depends on output. The higherefficiency of the Otto cycle as compared to the Diesel cycle for the same com-pression ratio is of no practical importance. In practice the operating com-pression ratios of diesel engines are much higher compared to spark-ignitionengines working on Otto cycle. The normal range of compression ratio fordiesel engine is 16 to 20 whereas for spark-ignition engines it is 6 to 10. Dueto the higher compression ratios used in diesel engines the efficiency of a dieselengine is more than that of the gasoline engine.

58 IC Engines
2.6.2 Work Output
The net work output for a Diesel cycle is given by
W = p2(V3 − V2) +p3V3 − p4V4
γ − 1− p2V2 − p1V1
γ − 1(2.40)
= p2V2(rc − 1) +p3rcV2 − p4rV2
γ − 1− p2V2 − p1rV2
γ − 1
= V2
p2(rc − 1)(γ − 1) + p3rc − p4r − (p2 − p1r)
γ − 1
= V2
⎡⎣p2(rc − 1)(γ − 1) + p3
rc − p4
p3r − p2
1− p1
p2r
γ − 1
⎤⎦
= p2V2
(rc − 1)(γ − 1) +
rc − rγc r
(1−γ) − 1− r(1−γ)
γ − 1
=p1V1r
(γ−1) γ(rc − 1)− r(1−γ)(rγc − 1)
γ − 1
(2.41)
2.6.3 Mean Effective Pressure
The expression for mean effective pressure can be shown to be
pm =p1V1 r(γ−1)γ(rc − 1)− (rγc − 1)
(γ − 1)V1
r−1r
(2.42)
=p1[γr
γ(rc − 1)− r(rγc − 1)]
(γ − 1)(r − 1)(2.43)
2.7 THE DUAL CYCLE
In the Otto cycle, combustion is assumed at constant volume while in Dieselcycle combustion is at constant pressure. In practice they are far from real.Since, some time interval is required for the chemical reactions during combus-tion process, the combustion cannot take place at constant volume. Similarly,due to rapid uncontrolled combustion in diesel engines, combustion does notoccur at constant pressure. The Dual cycle, also called a mixed cycle or lim-ited pressure cycle, is a compromise between Otto and Diesel cycles. Figures2.8(a) and 2.8(b) show the Dual cycle on p-V and T -s diagrams respectively.
In a Dual cycle a part of the heat is first supplied to the system at constantvolume and then the remaining part at constant pressure.
2.7.1 Thermal Efficiency
The efficiency of the cycle may be written as
ηDual =QS −QR
QS(2.44)

Air-Standard Cycles and Their Analysis 59
T
sV
p2
1
3 4
5Q
R
1
2
3 4Q
S
QS
Constant pressure
Constant volume
5
Constant volume
Isentropic compression
Isentropicexpansion
(a) (b)Fig. 2.8 Dual cycle
=mCv(T3 − T2) + mCp(T4 − T3)−mCv(T5 − T1)
mCv(T3 − T2) + mCp(T4 − T3)
= 1− T5 − T1(T3 − T2) + γ(T4 − T3)
(2.45)
Now,
T2 = T1
V1V2
(γ−1)
= T1r(γ−1) (2.46)
T3 = T2
p3p2
= T1rpr
(γ−1) (2.47)
where rp is the pressure ratio in the constant volume heat addition processand is equal to p3
p2.
Cut-off ratio rc is given by (V4V3
)
T4 = T3V4V3
= T3rc
Substituting for T3 from Eq.2.47
T4 = T1rcrpr(γ−1) (2.48)
and
T5 = T4
V4V5
(γ−1)
= T1rprcr(γ−1)
V4V5
(γ−1)
(2.49)
NowV4V5
=V4V1
=V4V3× V3
V1(2.50)
=V4V3× V2
V1(sinceV2 = V3)

60 IC Engines
Therefore,
V4V5
=rcr
(2.51)
where V4V5
is the expansion ratio. Now,
T5 = T1rprcrγ−1 rc
r
γ−1
= T1rprγc (2.52)
Substituting for T2, T3, T4 and T5 into Eq.2.45 and simplifying
η = 1− 1
r(γ−1)
rpr
γc − 1
(rp − 1) + rpγ(rc − 1)
(2.53)
It can be seen from the above equation that a value of rp > 1 results in anincreased efficiency for a given value of rc and γ. Thus the efficiency of Dualcycle lies between that of the Otto cycle and the Diesel cycle having samecompression ratio.
With rc = 1, it becomes an Otto cycle, and with rp = 1, it becomes aDiesel cycle.
2.7.2 Work Output
The net work output of the cycle is given by
W = p3(V4 − V3) +p4V4 − p5V5
γ − 1− p2V2 − p1V1
γ − 1
=p1V1γ − 1
(γ − 1)
p4V4p1V1
− p3V3p1V1
+
p4V4p1V1
− p5V5p1V1
− p2V2p1V1
+ 1
=p1V1γ − 1
(γ − 1)
rcrpr
γ−1 − rprγ−1
+ rcrprγ−1
−rprγc − rγ−1 + 1
=
p1V1γ − 1
γrcrpr
γ−1 − γrprγ−1 + rpr
γ−1 − rprγc − rγ−1 + 1
=p1V1γ − 1
γrpr
γ−1(rc − 1) + rγ−1(rp − 1)− (rprγc − 1)
(2.54)
2.7.3 Mean Effective Pressure
The mean effective pressure is given by
pm =Work output
Swept volume=
W
Vs
=1
V1 − V2
p1V1γ − 1
γrpr
γ−1(rc − 1) + rγ−1(rp − 1)− (rprγc − 1)
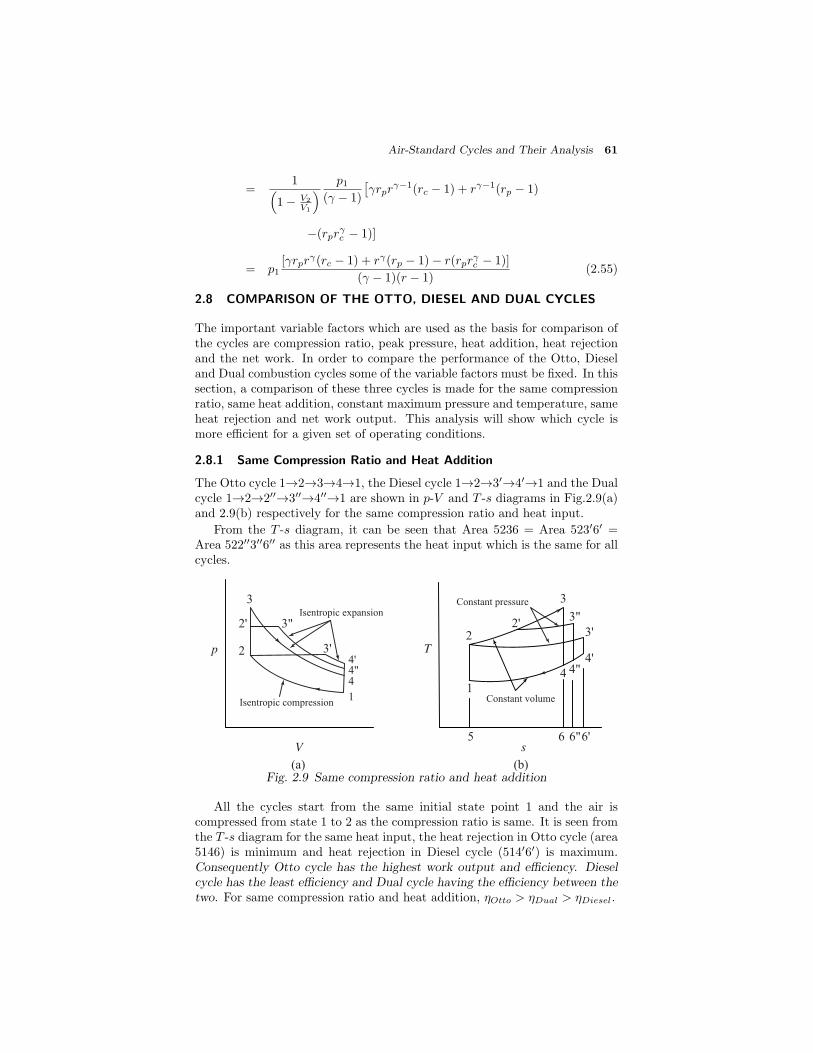
Air-Standard Cycles and Their Analysis 61
=1
1− V2V1
p1(γ − 1)
γrpr
γ−1(rc − 1) + rγ−1(rp − 1)
−(rprγc − 1)]
= p1[γrpr
γ(rc − 1) + rγ(rp − 1)− r(rprγc − 1)]
(γ − 1)(r − 1)(2.55)
2.8 COMPARISON OF THE OTTO, DIESEL AND DUAL CYCLES
The important variable factors which are used as the basis for comparison ofthe cycles are compression ratio, peak pressure, heat addition, heat rejectionand the net work. In order to compare the performance of the Otto, Dieseland Dual combustion cycles some of the variable factors must be fixed. In thissection, a comparison of these three cycles is made for the same compressionratio, same heat addition, constant maximum pressure and temperature, sameheat rejection and net work output. This analysis will show which cycle ismore efficient for a given set of operating conditions.
2.8.1 Same Compression Ratio and Heat Addition
The Otto cycle 1→2→3→4→1, the Diesel cycle 1→2→3 →4 →1 and the Dualcycle 1→2→2 →3 →4 →1 are shown in p-V and T -s diagrams in Fig.2.9(a)and 2.9(b) respectively for the same compression ratio and heat input.
From the T -s diagram, it can be seen that Area 5236 = Area 523 6 =Area 522 3 6 as this area represents the heat input which is the same for allcycles.
1
2
4
T
sV
p 2
3
4
Isentropic compression
3"2'
3'4'
1
2'
3
3"
3'
4'4"
5 6 6"6'
Constant volume
Constant pressure
(a) (b)
4"
Isentropic expansion
Fig. 2.9 Same compression ratio and heat addition
All the cycles start from the same initial state point 1 and the air iscompressed from state 1 to 2 as the compression ratio is same. It is seen fromthe T -s diagram for the same heat input, the heat rejection in Otto cycle (area5146) is minimum and heat rejection in Diesel cycle (514 6 ) is maximum.Consequently Otto cycle has the highest work output and efficiency. Dieselcycle has the least efficiency and Dual cycle having the efficiency between thetwo. For same compression ratio and heat addition, ηOtto > ηDual > ηDiesel.

62 IC Engines
One more observation can be made i.e., Otto cycle allows the workingmedium to expand more whereas Diesel cycle is least in this respect. Thereason is heat is added before expansion in the case of former (Otto cycle) andthe last portion of heat supplied to the fluid has a relatively short expansionin case of the latter (Diesel cycle).
2.8.2 Same Compression Ratio and Heat Rejection
The p-V and T -s diagrams are shown in Figs.2.10(a) and 2.10(b). Now,
ηOtto = 1− QR
QS
where QS is the heat supplied in the Otto cycle and is equal to the area underthe curve 2→3 on the T -s diagram [Fig.2.10(b)]. The efficiency of the Dieselcycle is given by
ηDiesel = 1− QR
Q
S
where Q
S is heat supplied in the Diesel cycle and is equal to the area underthe curve 2→3 on the T -s diagram [Fig.2.10(b)].
1
2
3
4
T
sV
p 2
1
3
4
3'
3'
Constant volume
Constant pressure
(a) (b)
Isentropic compression
Isentropic expansionConsta
nt volum
e
Fig. 2.10 Same compression ratio and heat rejection
From the T -s diagram in Fig.2.10 it is clear that QS > Q
S i.e., heatsupplied in the Otto cycle is more than that of the Diesel cycle. Hence, it isevident that, the efficiency of the Otto cycle is greater than the efficiency ofthe Diesel cycle for a given compression ratio and heat rejection. Also, for thesame compression ratio and heat rejection, ηOtto > ηDual > ηDiesel.
2.8.3 Same Peak Pressure, Peak Temperature and Heat Rejection
Figures 2.11(a) and 2.11(b) show the Otto cycle 1→2→3→4 and Diesel cy-cle 1→2 →3→4 on p-V and T -s coordinates, where the peak pressure andtemperature and the amount of heat rejected are the same.
The efficiency of the Otto cycle 1→2→3→4 is given by
ηOtto = 1− QR
QS
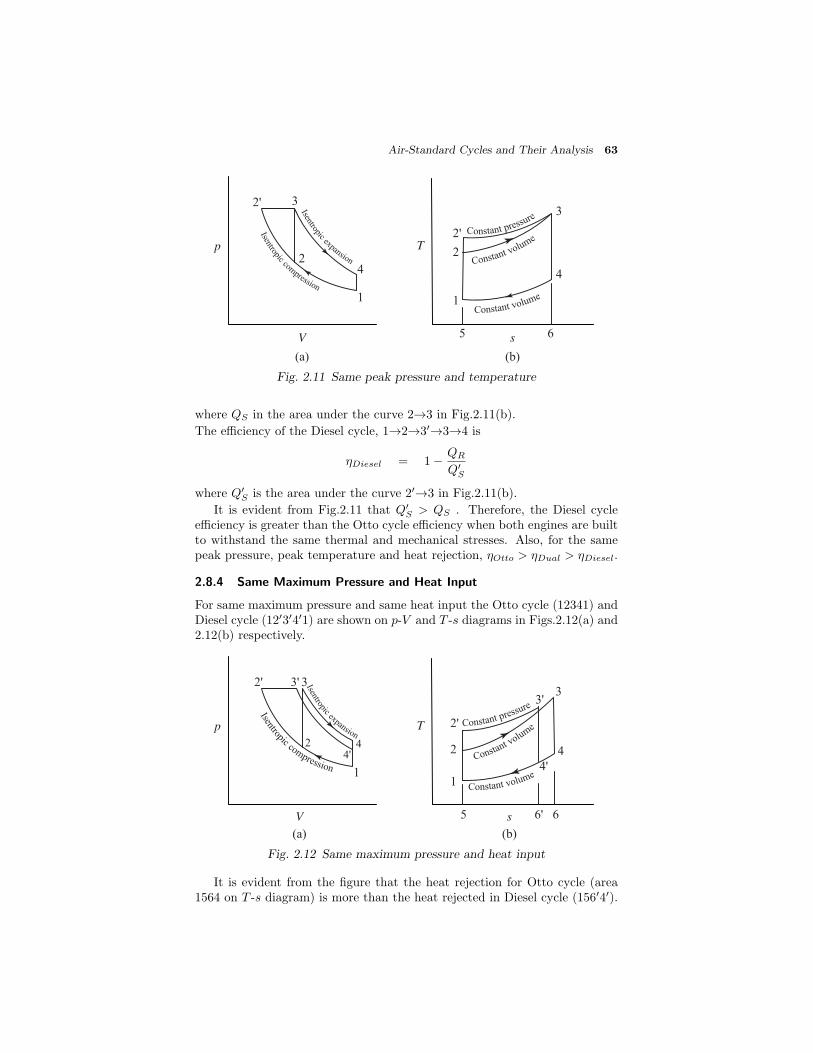
Air-Standard Cycles and Their Analysis 63
T
s
1
2
3
4
V
p
2'
1
3
42
2'
5 6
Isentropicexpansion
Isentropiccom
pression
Constant pressure
Constant volume
Constant volume
(a) (b)
Fig. 2.11 Same peak pressure and temperature
where QS in the area under the curve 2→3 in Fig.2.11(b).
The efficiency of the Diesel cycle, 1→2→3 →3→4 is
ηDiesel = 1− QR
Q
S
where Q
S is the area under the curve 2 →3 in Fig.2.11(b).
It is evident from Fig.2.11 that Q
S > QS . Therefore, the Diesel cycleefficiency is greater than the Otto cycle efficiency when both engines are builtto withstand the same thermal and mechanical stresses. Also, for the samepeak pressure, peak temperature and heat rejection, ηOtto > ηDual > ηDiesel.
2.8.4 Same Maximum Pressure and Heat Input
For same maximum pressure and same heat input the Otto cycle (12341) andDiesel cycle (12 3 4 1) are shown on p-V and T -s diagrams in Figs.2.12(a) and2.12(b) respectively.
T
s
1
2
3
4'
V
p
2'
4'
3'
1
42
2'
3'
4
5 6' 6
Isentropic
expansion
Isentropiccompression
Constant pressure
Constant volum
e
Constant volume
(a) (b)
3
Fig. 2.12 Same maximum pressure and heat input
It is evident from the figure that the heat rejection for Otto cycle (area1564 on T -s diagram) is more than the heat rejected in Diesel cycle (156 4 ).

64 IC Engines
Hence Diesel cycle is more efficient than Otto cycle for the condition of samemaximum pressure and heat input. One can make a note that with theseconditions the Diesel cycle has higher compression ratio V1
V2 than that of Otto
cycle V1V2
. One should also note that the cycle which is having higher efficiencyallows maximum expansion. The Dual cycle efficiency will be between thesetwo. Hence, for the same maximum pressure and heat input, ηOtto > ηDual >ηDiesel.
2.8.5 Same Maximum Pressure and Work Output
The efficiency, η, can be written as
η =Work done
Heat supplied=
Work done
Work done + Heat rejected
Refer to T -s diagram in Fig.2.12(b). For same work output the area 1234(work output of Otto cycle) and area 12 3 4 (work output of Diesel cycle) aresame. To achieve this, the entropy at 3 should be greater than entropy at 3 .It is clear that the heat rejection for Otto cycle is more than that of Dieselcycle. Hence, for these conditions the Diesel cycle is more efficient than theOtto cycle. The efficiency of Dual cycle lies between the two cycles. Hence,for the same maximum pressure and work output, ηOtto > ηDual > ηDiesel.
2.9 THE LENOIR CYCLE
The Lenoir cycle consists of the following processes [see Fig.2.13(a)]. Constantvolume heat addition (1→2); isentropic expansion (2→3); constant pressureheat rejection (3→1). The Lenoir cycle is used for pulse jet engines.
T
s
1
2
3
V
p
31
2
Isentropic expansion Constant volum
e
Constant pressure
(a) (b)Fig. 2.13 Lenoir cycle
ηLenoir =QS −QF
QS
QS = mCv(T2 − T1) (2.56)
QR = mCp(T3 − T1) (2.57)

Air-Standard Cycles and Their Analysis 65
ηLenoir =mCv(T2 − T1)−mCp(T3 − T1)
mCv(T2 − T1)(2.58)
= 1− γ
T3 − T1T2 − T1
Taking p2/p1 = rp, we have T2 = T1rp and
T3T2
=
p3p2
( γ−1
γ )(2.59)
T3 = T2
1
rp
( γ−1
γ )= T1rp
1
rp
( γ−1
γ )= T1r
(1/γ)p
η = 1− γ
T1r
(1/γ)p − T1
T1rp − T1
= 1− γ
r(1/γ)p − 1
rp − 1
(2.60)
Thus the efficiency of the Lenoir cycle depends upon the pressure ratio as wellas the ratio of specific heats, viz., γ.
2.10 THE ATKINSON CYCLE
Atkinson cycle is an ideal cycle for Otto engine exhausting to a gas turbine.In this cycle the isentropic expansion (3→4) of an Otto cycle (1234) is furtherallowed to proceed to the lowest cycle pressure so as to increase the work out-put. With this modification the cycle is known as Atkinson cycle. The cycleis shown on p-V and T -s diagrams in Figs.2.14(a) and 2.14(b) respectively.
1
2
3
4T
sV
p 2
1
3
4
4'4'Consta
nt volume
Constant pressure
Constant volume
(a) (b)
Isentropic expansionIsentropic compression
Fig. 2.14 Atkinson cycle
ηAtkinson =QS −QR
QS(2.61)
=mCv(T3 − T2)−mCp(T4 − T1)
mCv(T3 − T2)(2.62)
66 IC Engines
= 1− γ
T4 − T1T3 − T2
(2.63)
the compression ratio, r = V1V2
and the expansion ratio e = V4 V3
. Now,
T2T1
=
V1V2
(γ−1)
= r(γ−1) (2.64)
T2 = T1r(γ−1) (2.65)
T3T2
=p3p2
=
p3p4
× p4
p2
=
p3p4
× p1p2
(2.66)
p3p4
=
V4
V3
γ
= eγ (2.67)
p1p2
=
V2V1
γ
=1
rγ(2.68)
Substituting Eqs.2.67 and 2.68 in Eq.2.66,
T3T2
=eγ
rγ(2.69)
T3 = T2eγ
rγ= T1r
(γ−1) eγ
rγ= T1
eγ
r(2.70)
T4
T3=
V3V4
(γ−1)
=1
e(γ−1)
T4 = T31
e(γ−1)= T1
eγ
r
1
e(γ−1)
(2.71)
T4 = T1e
r(2.72)
Substituting the values of T2, T3, T4 in the Eq.2.63,
ηAtkinson = 1− γ
T1e/r − T1
T1eγ/r − T1r(γ−1)
= 1− γ
e− r
eγ − rγ
(2.73)
2.11 THE BRAYTON CYCLE
Brayton cycle is a theoretical cycle for gas turbines. This cycle consists oftwo reversible adiabatic or isentropic processes and two constant pressureprocesses. Figure 2.15 shows the Brayton cycle on p-V and T -s coordinates.The cycle is similar to the Diesel cycle in compression and heat addition.The isentropic expansion of the Diesel cycle is further extended followed by

Air-Standard Cycles and Their Analysis 67
T
s
1
2
3
4'
V
p
3
4'
41
2
Constant v
olume
4
Isentropicexpansion
Constant pressure
Constant pressu
re
(a) (b)
Isentropiccom
pression
Fig. 2.15 Brayton cycle
constant pressure heat rejection.
ηBrayton =QS −QR
QS
=mCp(T3 − T2)−mCp(T4 − T1)
mCp(T3 − T2)(2.74)
= 1− T4 − T1T3 − T2
If r is compression ratio i.e., (V1/V2) and rp is the pressure ratio i.e., (p2/p1)then,
T3T4
=
p3p4
( γ−1
γ )=
p2p1
( γ−1
γ )(2.75)
=
V1V2
(γ−1)
= r(γ−1) (2.76)
T4 =T3
r(γ−1)(2.77)
T1 =T2
r(γ−1)(2.78)
ηBrayton = 1− (T3/r(γ−1))− (T2/r
(γ−1))
T3 − T2
= 1− 1
r(γ−1)(2.79)
r =V1V2
=
p2p1
1γ
= r1γp (2.80)
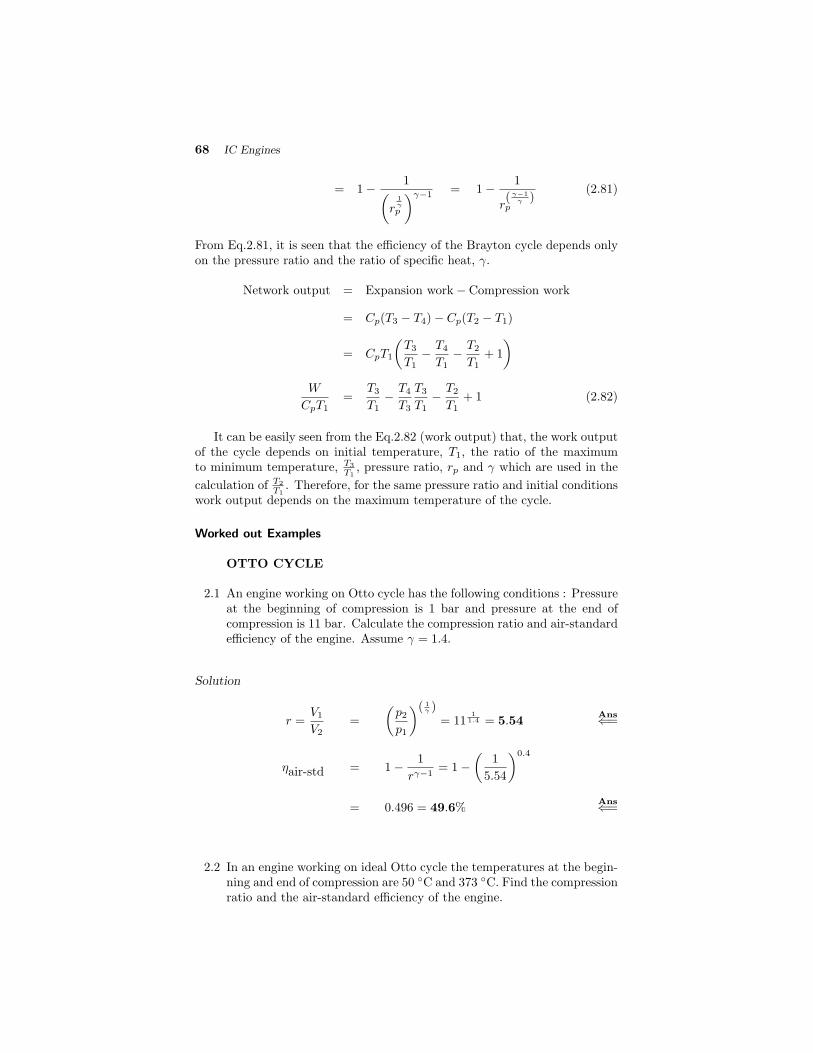
68 IC Engines
= 1− 1 r1γp
γ−1 = 1− 1
r( γ−1
γ )p
(2.81)
From Eq.2.81, it is seen that the efficiency of the Brayton cycle depends onlyon the pressure ratio and the ratio of specific heat, γ.
Network output = Expansion work− Compression work
= Cp(T3 − T4)− Cp(T2 − T1)
= CpT1
T3T1− T4
T1− T2
T1+ 1
W
CpT1=
T3T1− T4
T3
T3T1− T2
T1+ 1 (2.82)
It can be easily seen from the Eq.2.82 (work output) that, the work outputof the cycle depends on initial temperature, T1, the ratio of the maximumto minimum temperature, T3
T1, pressure ratio, rp and γ which are used in the
calculation of T2T1
. Therefore, for the same pressure ratio and initial conditionswork output depends on the maximum temperature of the cycle.
Worked out Examples
OTTO CYCLE
2.1 An engine working on Otto cycle has the following conditions : Pressureat the beginning of compression is 1 bar and pressure at the end ofcompression is 11 bar. Calculate the compression ratio and air-standardefficiency of the engine. Assume γ = 1.4.
Solution
r =V1V2
=
p2p1
( 1γ )= 11
11.4 = 5.54
Ans⇐=
ηair-std = 1− 1
rγ−1= 1−
1
5.54
0.4
= 0.496 = 49.6%Ans⇐=
2.2 In an engine working on ideal Otto cycle the temperatures at the begin-ning and end of compression are 50 ◦C and 373 ◦C. Find the compressionratio and the air-standard efficiency of the engine.

Air-Standard Cycles and Their Analysis 69
Solution
r =V1V2
=
T1T2
1γ−1
=
646
323
10.4
= 5.66Ans⇐=
ηOtto = 1− 1
rγ−1= 1− T1
T2
= 1− 323
646= 0.5 = 50%
Ans⇐=
2.3 In an Otto cycle air at 17 ◦C and 1 bar is compressed adiabaticallyuntil the pressure is 15 bar. Heat is added at constant volume untilthe pressure rises to 40 bar. Calculate the air-standard efficiency, thecompression ratio and the mean effective pressure for the cycle. AssumeCv = 0.717 kJ/kg K and R = 8.314 kJ/kmol K.
Solution
Consider the process 1 – 2
p1Vγ1 = p2V
γ2
V1V2
= r =
p2p1
1γ
=
15
1
11.4
= 6.91
η = 1−
1
r
γ−1V
p2
1
3
4
= 1−
1
6.91
0.4= 0.539 = 53.9%
T2 =p2V2p1V1
T1 =15
1× 1
6.91× 290 = 629.5 K
Consider the process 2 – 3
T3 =p3T2p2
=40
15× 629.5 = 1678.7
Heat supplied = Cv(T3 − T2)
= 0.717× (1678.7− 629.5) = 752.3 kJ/kg
Work done = η × qs = 0.539× 752.3 = 405.5 kJ/kg

70 IC Engines
pm =Work done
Swept volume
v1 =V1m
= MRT1p1
=8314× 290
29× 1× 105= 0.8314 m3/kg
v1 − v2 =5.91
6.91× 0.8314 = 0.711 m3/kg
pm =405.5
0.711× 103 = 5.70× 10⁵ N/m
2
= 5.70 barAns⇐=
2.4 Fuel supplied to an SI engine has a calorific value 42000 kJ/kg. Thepressure in the cylinder at 30% and 70% of the compression stroke are1.3 bar and 2.6 bar respectively. Assuming that the compression followsthe law pV 1.3 = constant. Find the compression ratio. If the relativeefficiency of the engine compared with the air-standard efficiency is 50%.Calculate the fuel consumption in kg/kW h.
Solution
V2 = 1
V1 = 1 + 0.7(r − 1)
= 0.7r + 0.3
V2 = 1 + 0.3(r − 1)
= 0.3r + 0.7
V1
V2
=
p2p1
1n
=
2.6
1.3
11.3
= 1.7
0.7r + 0.3
0.3r + 0.7= 1.7
V
p
2.6
1'p
2'p
2'V 1'V
1.3
70% 30%1V2V
r = 4.68Ans⇐=
ηair−std = 1− 1
rγ−1
= 1− 1
4.680.4= 0.46 = 46%
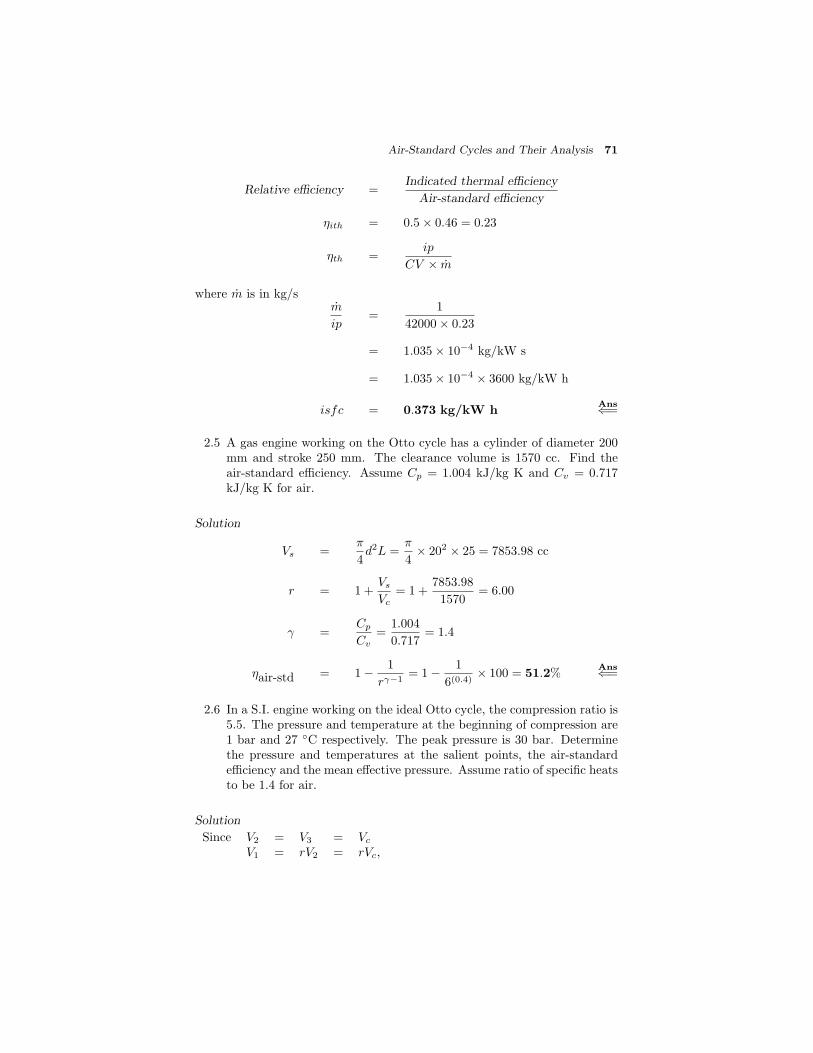
Air-Standard Cycles and Their Analysis 71
Relative efficiency =Indicated thermal efficiency
Air-standard efficiency
ηith = 0.5× 0.46 = 0.23
ηth =ip
CV × m
where m is in kg/sm
ip=
1
42000× 0.23
= 1.035× 10⁻⁴ kg/kW s
= 1.035× 10−4 × 3600 kg/kW h
isfc = 0.373 kg/kW hAns⇐=
2.5 A gas engine working on the Otto cycle has a cylinder of diameter 200mm and stroke 250 mm. The clearance volume is 1570 cc. Find theair-standard efficiency. Assume Cp = 1.004 kJ/kg K and Cv = 0.717kJ/kg K for air.
Solution
Vs =π
4d2L =
π
4× 202 × 25 = 7853.98 cc
r = 1 +Vs
Vc= 1 +
7853.98
1570= 6.00
γ =Cp
Cv=
1.004
0.717= 1.4
ηair-std = 1− 1
rγ−1= 1− 1
6(0.4)× 100 = 51.2%
Ans⇐=
2.6 In a S.I. engine working on the ideal Otto cycle, the compression ratio is5.5. The pressure and temperature at the beginning of compression are1 bar and 27 ◦C respectively. The peak pressure is 30 bar. Determinethe pressure and temperatures at the salient points, the air-standardefficiency and the mean effective pressure. Assume ratio of specific heatsto be 1.4 for air.
Solution
Since V2 = V3 = Vc
V1 = rV2 = rVc,

72 IC Engines
Consider the process 1 – 2,
p2p1
= rγ = 5.51.4 = 10.88
p2 = 10.88× 1× 105
= 10.88× 10⁵ N/m2
T2T1
= rγ−1 = 5.50.4 = 1.978
V
p2
1
3
4
T2 = 1.978× 300 = 593.4 K = 320.4◦ CAns⇐=
Consider the process 2 – 3,
p3 = 30× 105 N/m2
T3T2
=p3p2
=30
10.88= 2.757
T3 = 2.757× 593.4 = 1636 K
= 1363◦ CAns⇐=
Consider the process 3 – 4,
p3p4
=
V4V3
γ
=
V1V2
γ
= rγ = 5.51.4 = 10.88
p4 =p3
10.88= 2.76× 10⁵ N/m
2 Ans⇐=
T3T4
= rγ−1 = 5.50.4 = 1.978
T4 =T3
1.978=
1636
1.978= 827.1 K = 554.1◦ C
Ans⇐=
ηOtto = 1− 1
r(γ−1)= 1− 1
5.50.4= 0.4943 = 49.43%
Ans⇐=
pm =Indicated work/cycle
Vs=Area of p-V diagram 1234
Vs
Area 1234 = Area under 3-4−Area under 2-1
=p3V3 − p4V4
γ − 1− p2V2 − p1V1
γ − 1

Air-Standard Cycles and Their Analysis 73
=30× 105 × Vc − 2.76× 105 × 5.5Vc
0.4
−10.88× 10⁵ × Vc − 1× 105 × 5.5Vc
0.4
= 23.6× 10⁵ × Vc = pm × Vs
pm =23.6× 10⁵ × Vc
Vs=
23.6× 10⁵ × Vc
4.5× Vc
= 5.24× 10⁵ N/m2
= 5.24 barAns⇐=
2.7 A gas engine operating on the ideal Otto cycle has a compression ratio of6:1. The pressure and temperature at the commencement of compressionare 1 bar and 27 ◦C. Heat added during the constant volume combustionprocess is 1170 kJ/kg. Determine the peak pressure and temperature,work output per kg of air and air-standard efficiency. Assume Cv =0.717 kJ/kg K and γ = 1.4 for air.
Solution
Consider the process 1-2
p2p1
= rγ = 61.4 = 12.28
p2 = 12.28× 10⁵ N/m2
T2T1
=
V1V2
γ−1
= rγ−1
= 60.4 = 2.05
T2 = 2.05× 300 = 615K = 342◦ C
V
p2
1
3
4
Consider the process 2-3
For unit mass flowqs = q2−3 = Cv(T3 − T2) = 1170 kJ/kg
T3 − T2 =1170
0.717= 1631.8
T3 = 1631.8 + 615 = 2246.8 K
= 1973.8◦ CAns⇐=
p3p2
=T3T2
=2246.8
615= 3.65

74 IC Engines
Peak pressure,p3 = 3.65× 12.28× 105
= 44.82× 10⁵ N/m2
= 44.82 barAns⇐=
Work output = Area of p-V diagram
= Area under (3 - 4) - Area under (2 - 1)
=p3V3 − p4V4
γ − 1− p2V2 − p1V1
γ − 1
=mR
γ − 1[(T3 − T4)− (T2 − T1)]
R = Cp − Cv = 1.004− 0.717
= 0.287 kJ/kg K
T3T4
=
V3V4
γ−1
= r(γ−1) = 60.4 = 2.048
T4 =T3
2.048=
2246.8
2.048= 1097.1 K
Work output/kg =0.287
0.4× [(2246.8− 1097.1)− (615− 300)]
= 598.9 kJAns⇐=
ηOtto = 1− 1
r(γ−1)= 1− 1
60.40.5116 = 51.16%
Ans⇐=
2.8 A spark-ignition engine working on ideal Otto cycle has the compressionratio 6. The initial pressure and temperature of air are 1 bar and 37◦C. The maximum pressure in the cycle is 30 bar. For unit mass flow,calculate (i) p, V and T at various salient points of the cycle and (ii) theratio of heat supplied to the heat rejected. Assume γ = 1.4 and R =8.314 kJ/kmol K.
Solution
Consider point 1,
n =m
M=
1
29
V1 =nRT1p1
=1× 8314× 310
29× 105= 0.889 m3 Ans⇐=
Consider point 2,
p2 = p1 rγ = 105 × 61.4 = 12.3× 10⁵ N/m2
= 12.3 barAns⇐=
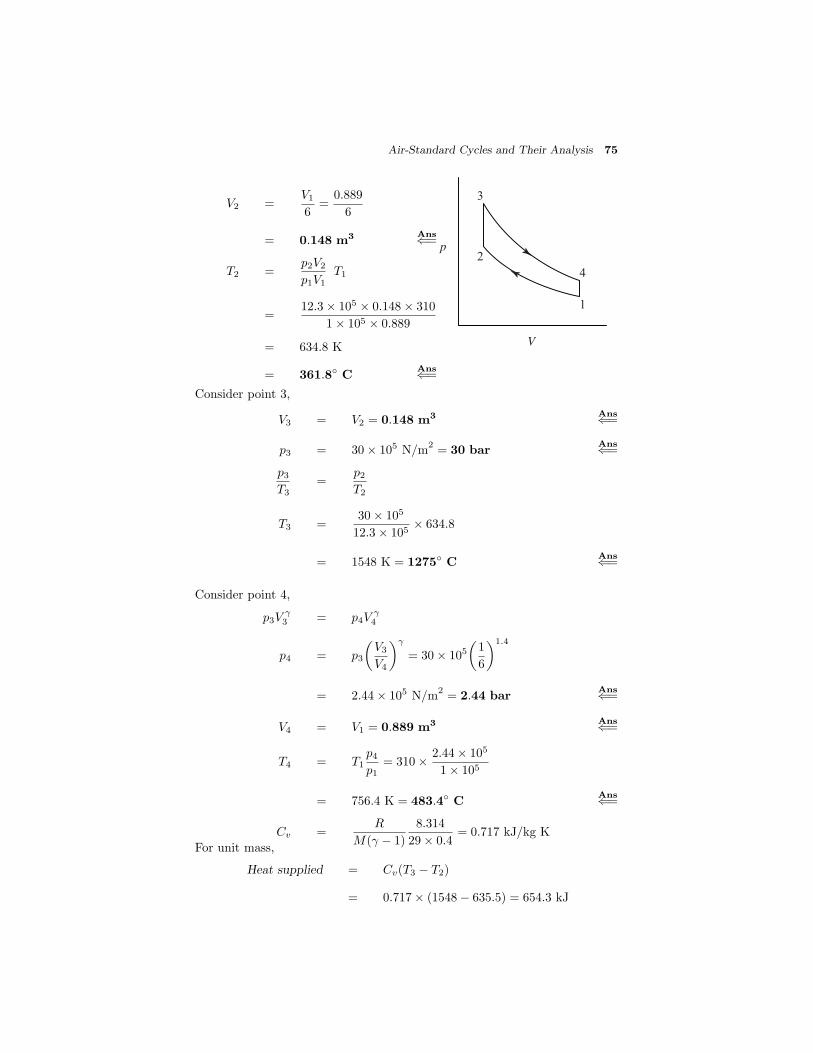
Air-Standard Cycles and Their Analysis 75
V2 =V16
=0.889
6
= 0.148 m3 Ans⇐=
T2 =p2V2p1V1
T1
=12.3× 105 × 0.148× 310
1× 105 × 0.889
= 634.8 K
= 361.8◦ CAns⇐=
V
p2
1
3
4
Consider point 3,
V3 = V2 = 0.148 m3 Ans⇐=
p3 = 30× 105 N/m2
= 30 barAns⇐=
p3T3
=p2T2
T3 =30× 105
12.3× 105× 634.8
= 1548 K = 1275◦ CAns⇐=
Consider point 4,
p3Vγ3 = p4V
γ4
p4 = p3
V3V4
γ
= 30× 105
1
6
1.4
= 2.44× 10⁵ N/m2
= 2.44 barAns⇐=
V4 = V1 = 0.889 m3 Ans⇐=
T4 = T1p4p1
= 310× 2.44× 105
1× 105
= 756.4 K = 483.4◦ CAns⇐=
Cv =R
M(γ − 1)
8.314
29× 0.4= 0.717 kJ/kg K
For unit mass,
Heat supplied = Cv(T3 − T2)
= 0.717× (1548− 635.5) = 654.3 kJ

76 IC Engines
Heat rejected = Cv(T4 − T1)
= 0.717× (756.4− 310) = 320.1 kJ
Heat supplied
Heat rejected=
654.3
320.1= 2.04
Ans⇐=
2.9 In an Otto engine, pressure and temperature at the beginning of com-pression are 1 bar and 37 ◦C respectively. Calculate the theoreticalthermal efficiency of this cycle if the pressure at the end of the adia-batic compression is 15 bar. Peak temperature during the cycle is 2000K. Calculate (i) the heat supplied per kg of air (ii) the work done perkg of air and (iii) the pressure at the end of adiabatic expansion. TakeCv = 0.717 kJ/kg K and γ = 1.4.
Solution
Consider the process 1-2
T2 = T1
p2p1
γ−1
γ
= 310× (15)(0.4/1.4) = 672 K
η = 1− T1T2
= 1− 310
672
= 0.539 = 53.9%
Consider the process 2 – 3
For unit mass flow,
qs = Cv(T3 − T2)
V
p2
1
3
4
= 0.717× (2000− 672) = 952.2 kJ/kgAns⇐=
η =Work done per kg of air
Heat supplied per kg of air=
w
qs
w = ηqs = 0.539× 952.2 = 513.2 kJ/kgAns⇐=
p3 = p2
T3T2
= 15× 2000
672= 44.64 bar
Consider the process 3 – 4
p3p4
=
V4V3
γ
=
V1V2
γ
=p2p1
p4 = p3
p1p2
=
44.64× 1
15= 2.98 bar
Ans⇐=
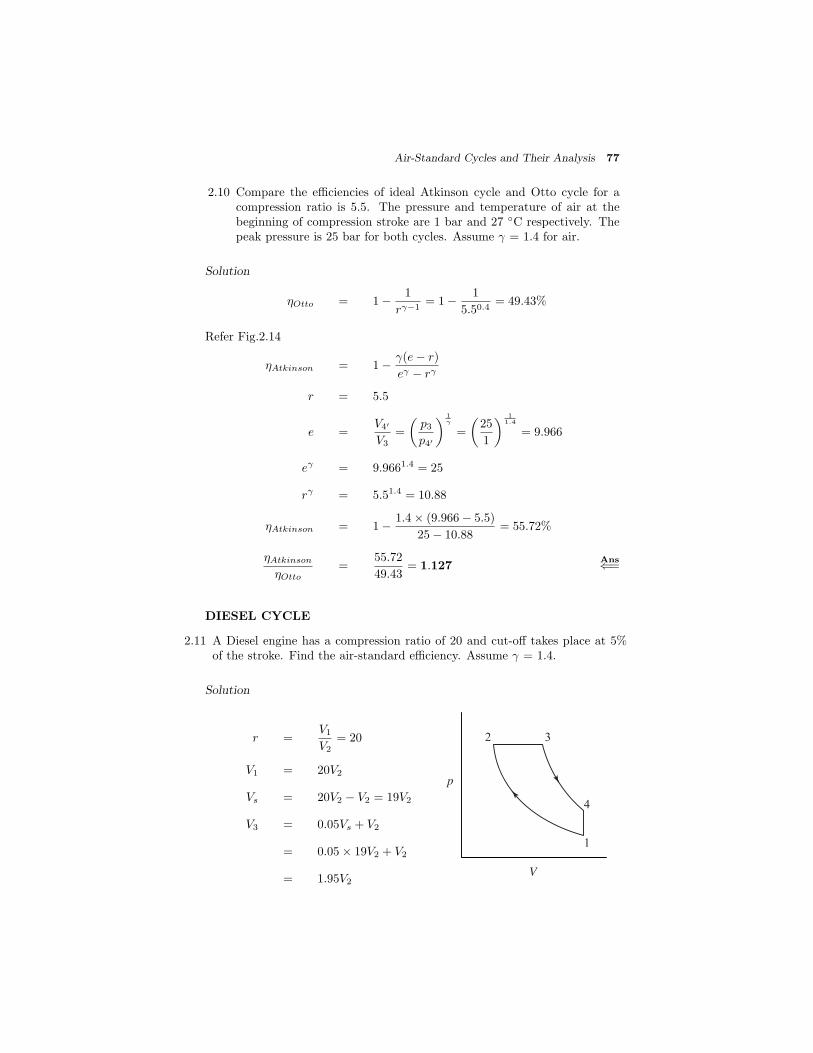
Air-Standard Cycles and Their Analysis 77
2.10 Compare the efficiencies of ideal Atkinson cycle and Otto cycle for acompression ratio is 5.5. The pressure and temperature of air at thebeginning of compression stroke are 1 bar and 27 ◦C respectively. Thepeak pressure is 25 bar for both cycles. Assume γ = 1.4 for air.
Solution
ηOtto = 1− 1
rγ−1= 1− 1
5.50.4= 49.43%
Refer Fig.2.14
ηAtkinson = 1− γ(e− r)
eγ − rγ
r = 5.5
e =V4
V3=
p3p4
1γ
=
25
1
11.4
= 9.966
eγ = 9.9661.4 = 25
rγ = 5.51.4 = 10.88
ηAtkinson = 1− 1.4× (9.966− 5.5)
25− 10.88= 55.72%
ηAtkinson
ηOtto=
55.72
49.43= 1.127
Ans⇐=
DIESEL CYCLE
2.11 A Diesel engine has a compression ratio of 20 and cut-off takes place at 5%of the stroke. Find the air-standard efficiency. Assume γ = 1.4.
Solution
r =V1V2
= 20
V1 = 20V2
Vs = 20V2 − V2 = 19V2
V3 = 0.05Vs + V2
= 0.05× 19V2 + V2
= 1.95V2V
p
2
1
3
4

78 IC Engines
rc =V3V2
=1.95V2
V2= 1.95
η = 1− 1
rγ−1
rγc − 1
γ(rc − 1)
= 1− 1
200.4×
1.951.4 − 1
1.4× (1.95− 1)
= 0.649 = 64.9%
Ans⇐=
2.12 Determine the ideal efficiency of the diesel engine having a cylinder with bore250 mm, stroke 375 mm and a clearance volume of 1500 cc, with fuel cut-offoccurring at 5% of the stroke. Assume γ = 1.4 for air.
Solution
Vs =π
4d2 L =
π
4× 252 × 37.5
= 18407.8 cc
r = 1 +Vs
Vc= 1 +
18407.8
1500= 13.27
η = 1− 1
rγ−1
rγc − 1
γ(rc − 1)
rc =V3V2
Cut-off volume = V3 − V2 = 0.05Vs = 0.05× 12.27Vc
V2 = Vc
V3 = 1.6135Vc
rc =V3V2
= 1.6135
η = 1− 1
13.270.4× 1.61351.4 − 1
1.4× (1.6135− 1)
= 0.6052 = 60.52%Ans⇐=
2.13 In an engine working on Diesel cycle inlet pressure and temperature are 1bar and 17 ◦C respectively. Pressure at the end of adiabatic compression is35 bar. The ratio of expansion i.e. after constant pressure heat addition is5. Calculate the heat addition, heat rejection and the efficiency of the cycle.Assume γ = 1.4, Cp = 1.004 kJ/kg K and Cv = 0.717 kJ/kg K.
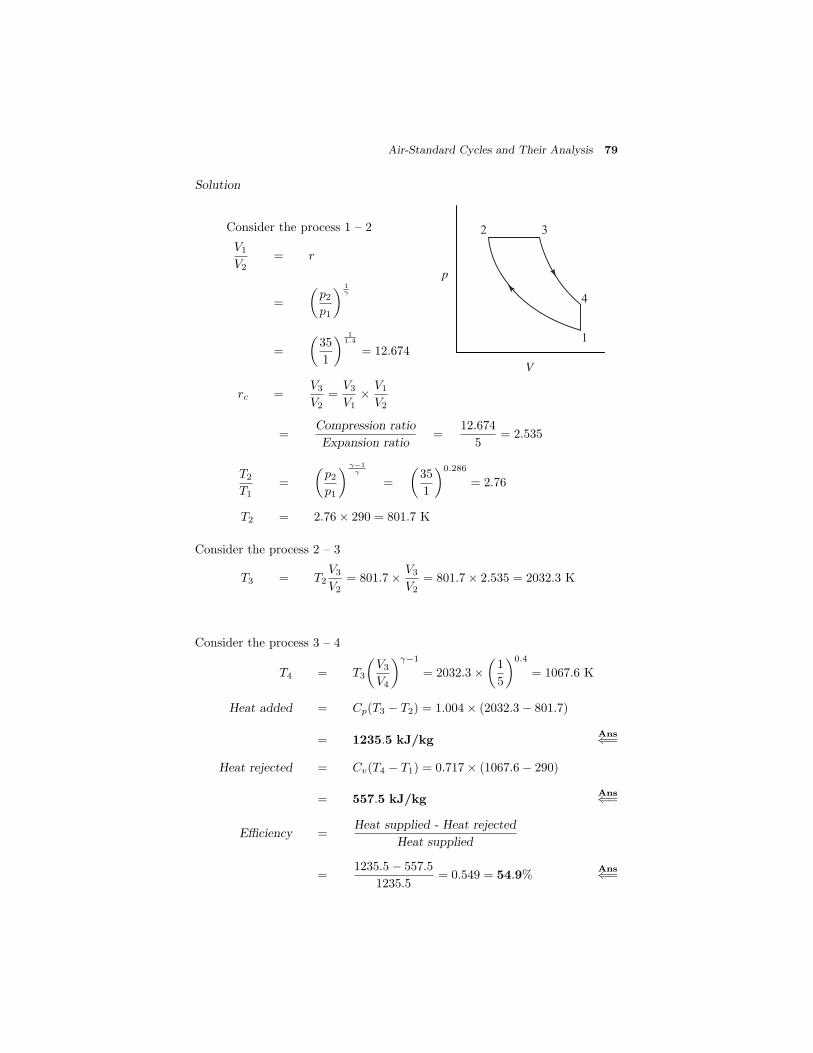
Air-Standard Cycles and Their Analysis 79
Solution
Consider the process 1 – 2
V1V2
= r
=
p2p1
1γ
=
35
1
11.4
= 12.674
rc =V3V2
=V3V1× V1
V2
V
p
2
1
3
4
=Compression ratio
Expansion ratio=
12.674
5= 2.535
T2T1
=
p2p1
γ−1
γ
=
35
1
0.286= 2.76
T2 = 2.76× 290 = 801.7 K
Consider the process 2 – 3
T3 = T2V3V2
= 801.7× V3V2
= 801.7× 2.535 = 2032.3 K
Consider the process 3 – 4
T4 = T3
V3V4
γ−1
= 2032.3×
1
5
0.4= 1067.6 K
Heat added = Cp(T3 − T2) = 1.004× (2032.3− 801.7)
= 1235.5 kJ/kgAns⇐=
Heat rejected = Cv(T4 − T1) = 0.717× (1067.6− 290)
= 557.5 kJ/kgAns⇐=
Efficiency =Heat supplied - Heat rejected
Heat supplied
=1235.5− 557.5
1235.5= 0.549 = 54.9%
Ans⇐=
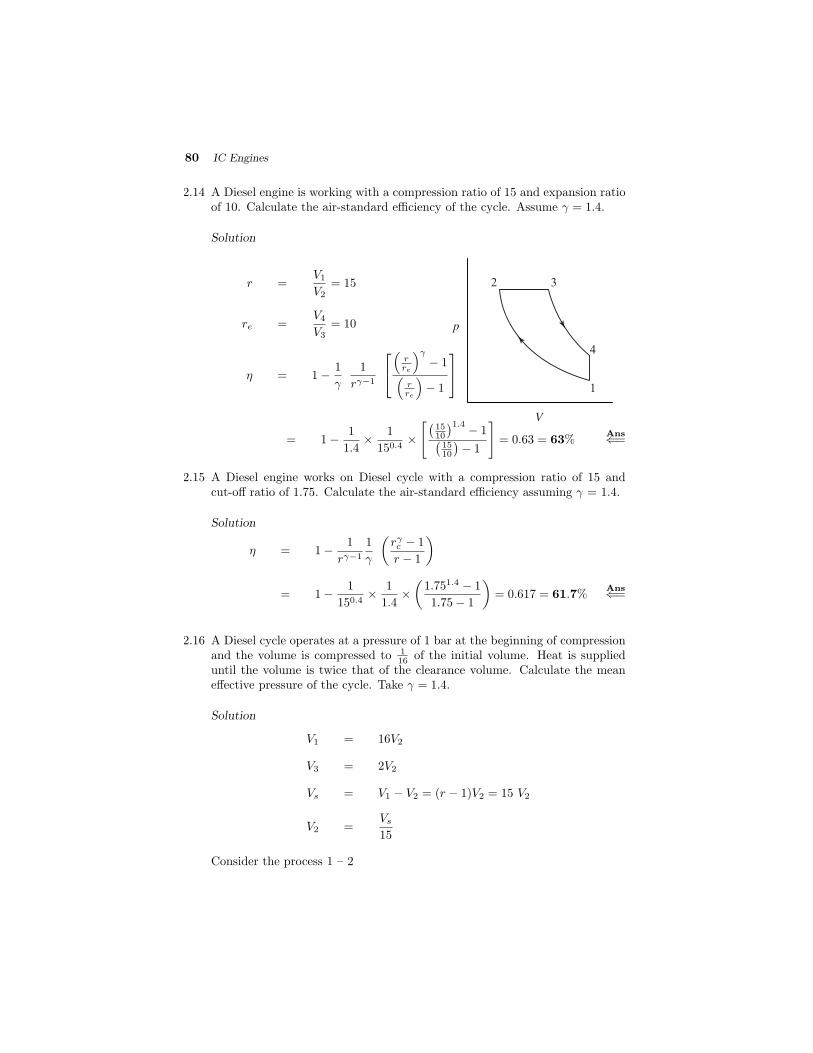
80 IC Engines
2.14 A Diesel engine is working with a compression ratio of 15 and expansion ratioof 10. Calculate the air-standard efficiency of the cycle. Assume γ = 1.4.
Solution
r =V1V2
= 15
re =V4V3
= 10
η = 1− 1
γ
1
rγ−1
⎡⎣
rre
γ− 1
rre
− 1
⎤⎦
V
p
2
1
3
4
= 1− 1
1.4× 1
150.4×
1510
1.4 − 1 1510
− 1
= 0.63 = 63%
Ans⇐=
2.15 A Diesel engine works on Diesel cycle with a compression ratio of 15 andcut-off ratio of 1.75. Calculate the air-standard efficiency assuming γ = 1.4.
Solution
η = 1− 1
rγ−1
1
γ
rγc − 1
r − 1
= 1− 1
150.4× 1
1.4×
1.751.4 − 1
1.75− 1
= 0.617 = 61.7%
Ans⇐=
2.16 A Diesel cycle operates at a pressure of 1 bar at the beginning of compressionand the volume is compressed to 1
16 of the initial volume. Heat is supplieduntil the volume is twice that of the clearance volume. Calculate the meaneffective pressure of the cycle. Take γ = 1.4.
Solution
V1 = 16V2
V3 = 2V2
Vs = V1 − V2 = (r − 1)V2 = 15 V2
V2 =Vs
15
Consider the process 1 – 2

Air-Standard Cycles and Their Analysis 81
p2 = p1
V1V2
γ
= 1× 161.4 = 48.5 bar
p2 = p3 = 48.5 bar
p4 = p3
V3V4
1.4
= 48.5×
2
16
1.4
=48.5
81.4= 2.64 bar (Since, V4 = V1)
V
p
2
1
3
4
pm =1
Vs
p2(V3 − V2) +
p3V3 − p4V4γ − 1
− p2V2 − p1V1γ − 1
=V2Vs
⎡⎣p3
V3V2− 1
+
p3
V3V2− p4
V4V2
γ − 1
−
p2 − p1
V1V2
γ − 1
⎤⎦
=1
15× 48.5× (2− 1) +
48.5× 2− 2.64× 16
1.4− 1− 48.5− 1× 16
1.4− 1
= 6.94 barAns⇐=
2.17 In an engine working on the Diesel cycle the ratios of the weights of air and fuelsupplied is 50 : 1. The temperature of air at the beginning of the compressionis 60 ◦C and the compression ratio used is 14 : 1. What is the ideal efficiencyof the engine. Calorific value of fuel used is 42000 kJ/kg. Assume Cp = 1.004kJ/kg K and Cv = 0.717 kJ/kg K for air.
Solution
η = 1− 1
rγ−1
rγc − 1
γ(rc − 1)
γ =Cp
Cv=
1.004
0.717= 1.4
rc =V3V2
=T3T2
Consider the process 1 – 2
T2T1
=
V1V2
(γ−1)
= r(γ−1) = 140.4 = 2.874
V
p
2
1
3
4
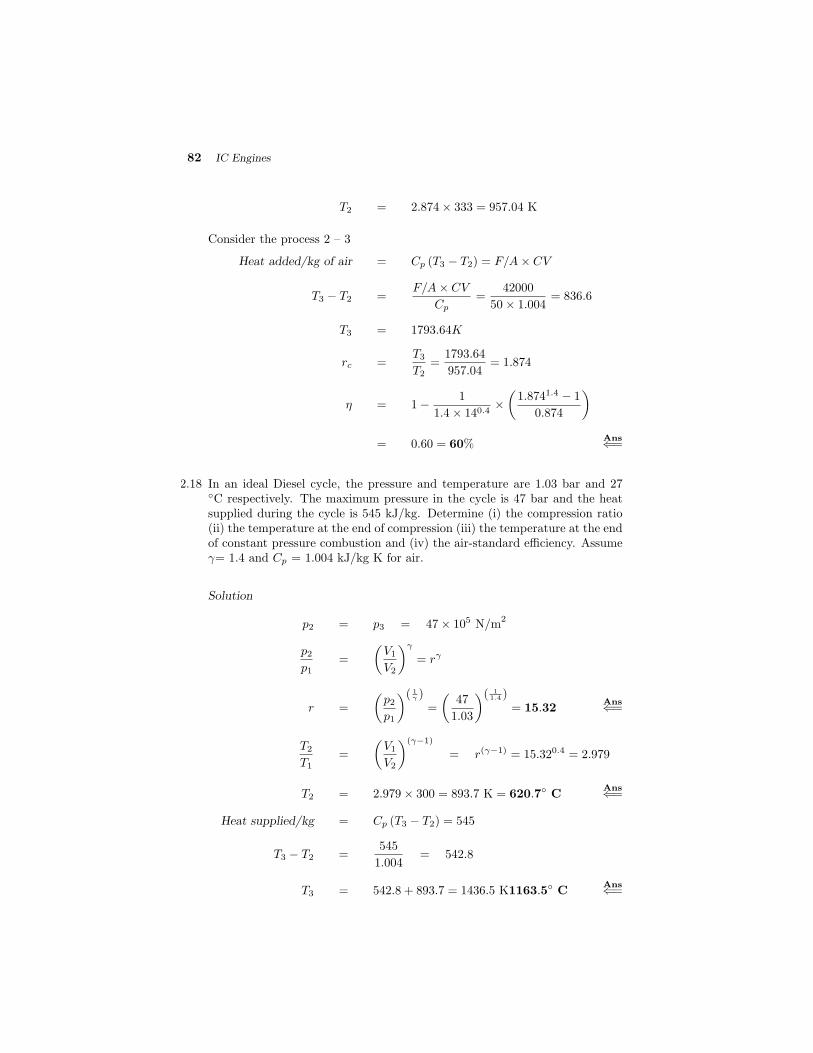
82 IC Engines
T2 = 2.874× 333 = 957.04 K
Consider the process 2 – 3
Heat added/kg of air = Cp (T3 − T2) = F/A× CV
T3 − T2 =F/A× CV
Cp=
42000
50× 1.004= 836.6
T3 = 1793.64K
rc =T3T2
=1793.64
957.04= 1.874
η = 1− 1
1.4× 140.4×
1.8741.4 − 1
0.874
= 0.60 = 60%Ans⇐=
2.18 In an ideal Diesel cycle, the pressure and temperature are 1.03 bar and 27◦C respectively. The maximum pressure in the cycle is 47 bar and the heatsupplied during the cycle is 545 kJ/kg. Determine (i) the compression ratio(ii) the temperature at the end of compression (iii) the temperature at the endof constant pressure combustion and (iv) the air-standard efficiency. Assumeγ= 1.4 and Cp = 1.004 kJ/kg K for air.
Solution
p2 = p3 = 47× 105 N/m2
p2p1
=
V1V2
γ
= rγ
r =
p2p1
( 1γ )=
47
1.03
( 11.4 )
= 15.32Ans⇐=
T2T1
=
V1V2
(γ−1)
= r(γ−1) = 15.320.4 = 2.979
T2 = 2.979× 300 = 893.7 K = 620.7◦ CAns⇐=
Heat supplied/kg = Cp (T3 − T2) = 545
T3 − T2 =545
1.004= 542.8
T3 = 542.8 + 893.7 = 1436.5 K1163.5◦ CAns⇐=

Air-Standard Cycles and Their Analysis 83
η = 1− 1
rγ−1
rγc − 1
γ(rc − 1)
rc =V3V2
=T3T2
=1436.5
893.7= 1.61
ηDiesel = 1−
1
1.4× 15.320.4×
1.611.4 − 1
0.61
= 0.6275 = 62.75%Ans⇐=
2.19 A diesel engine operating on the air-standard Diesel cycle has six cylindersof 100 mm bore and 120 mm stroke. The engine speed is 1800 rpm. At thebeginning of compression the pressure and temperature of air are 1.03 barand 35 ◦C. If the clearance volume is 1/8th of the stroke volume, calculate(i) the pressure and temperature at the salient points of the cycle (ii) thecompression ratio (iii) the efficiency of the cycle and (iv) the power output ifthe air is heated to 1500 ◦C Assume Cp and Cv of air to be 1.004 and 0.717kJ/kg K respectively.
Solution
r = 1 +Vs
Vc
= 1 + 8 = 9Ans⇐=
Consider the process 1 – 2,
p2p1
= rγ = 91.4 = 21.67
p2 = 21.67× 1.03× 105
= 22.32× 10⁵ N/m2
= 22.32 barAns⇐=
V
p
2
1
3
4
Consider the process 3 – 4,
T3T4
= r(γ−1)e
T2T1
= r(γ−1) = 90.4 = 2.408
T2 = 308× 2.408 = 741.6 K = 468.6◦CAns⇐=
Consider the process 2 – 3,
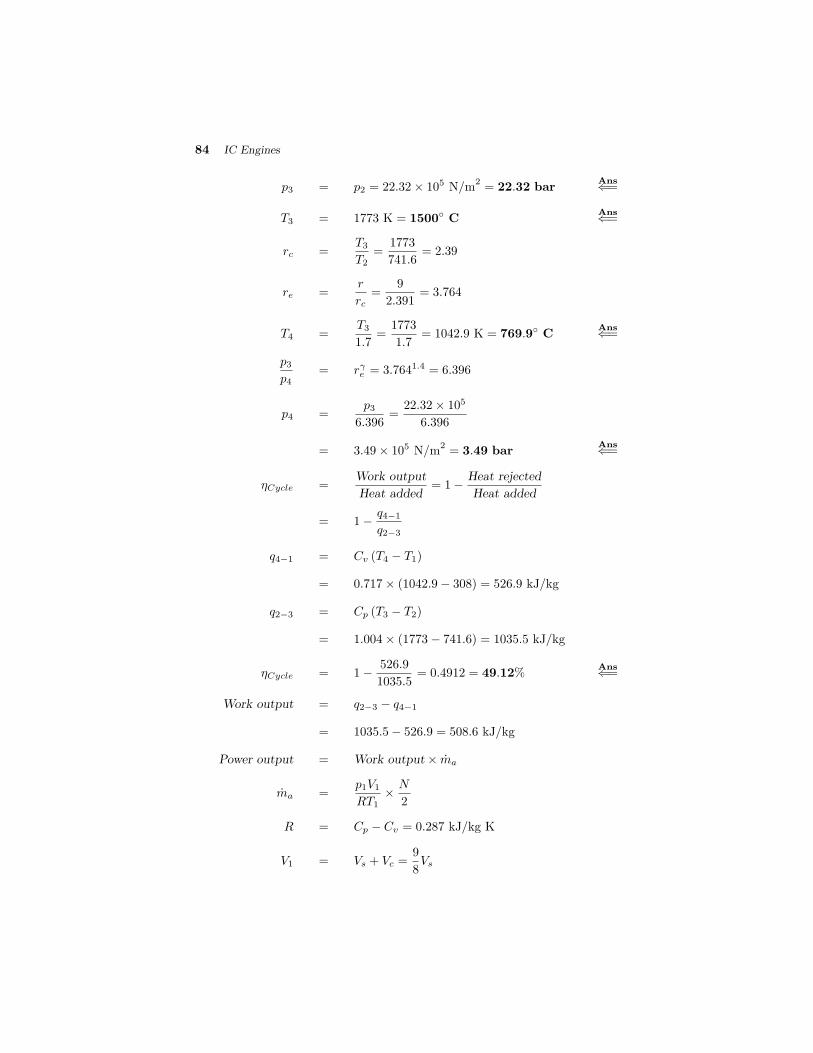
84 IC Engines
p3 = p2 = 22.32× 10⁵ N/m2
= 22.32 barAns⇐=
T3 = 1773 K = 1500◦ CAns⇐=
rc =T3T2
=1773
741.6= 2.39
re =r
rc=
9
2.391= 3.764
T4 =T31.7
=1773
1.7= 1042.9 K = 769.9◦ C
Ans⇐=
p3p4
= rγe = 3.7641.4 = 6.396
p4 =p3
6.396=
22.32× 10⁵
6.396
= 3.49× 10⁵ N/m2
= 3.49 barAns⇐=
ηCycle =Work output
Heat added= 1− Heat rejected
Heat added
= 1− q4−1
q2−3
q4−1 = Cv (T4 − T1)
= 0.717× (1042.9− 308) = 526.9 kJ/kg
q2−3 = Cp (T3 − T2)
= 1.004× (1773− 741.6) = 1035.5 kJ/kg
ηCycle = 1− 526.9
1035.5= 0.4912 = 49.12%
Ans⇐=
Work output = q2−3 − q4−1
= 1035.5− 526.9 = 508.6 kJ/kg
Power output = Work output× ma
ma =p1V1RT1
× N
2
R = Cp − Cv = 0.287 kJ/kg K
V1 = Vs + Vc =9
8Vs

Air-Standard Cycles and Their Analysis 85
Vs = 6× π
4d2 L = 6× π
4× 102 × 12
= 5654.8 cc = 5.65× 10⁻³ m3
V1 = 5.65× 10−3 × 9
8= 6.36× 10⁻³ m3
ma =1.03× 105 × 6.36× 10−3 × 30
287× 308× 2= 0.111 kg/s
Power output = 508.6× 0.111 = 56.45 kWAns⇐=
2.20 The mean effective pressure of an ideal Diesel cycle is 8 bar. If the initialpressure is 1.03 bar and the compression ratio is 12, determine the cut-offratio and the air-standard efficiency. Assume ratio of specific heats for air tobe 1.4.
Solution
W = pm × Vs = Area 1234
= Area under 2 – 3+Area under 3 – 4−Area under 2 – 1
= p2 (V3 − V2) +p3V3 − p4V4
γ − 1− p2V2 − p1V1
γ − 1
r =V1V2
= 1 +Vs
Vc= 12
Vs = 11Vc
V2 = Vc
V1 = V4 = 12V2 = 12Vc
V3 = rcV2 = rcVc
p2p1
= rγ = 121.4 = 32.42
p2 = 32.42× 1.03× 105 = 33.39× 10⁵ N/m2
= p3
p3p4
=
r
rc
1.4=
121.4
r1.4c
=32.42
r1.4c
p4 =33.39
32.42× r1.4c × 105 = 1.03r1.4c × 105
V
p
2
1
3
4
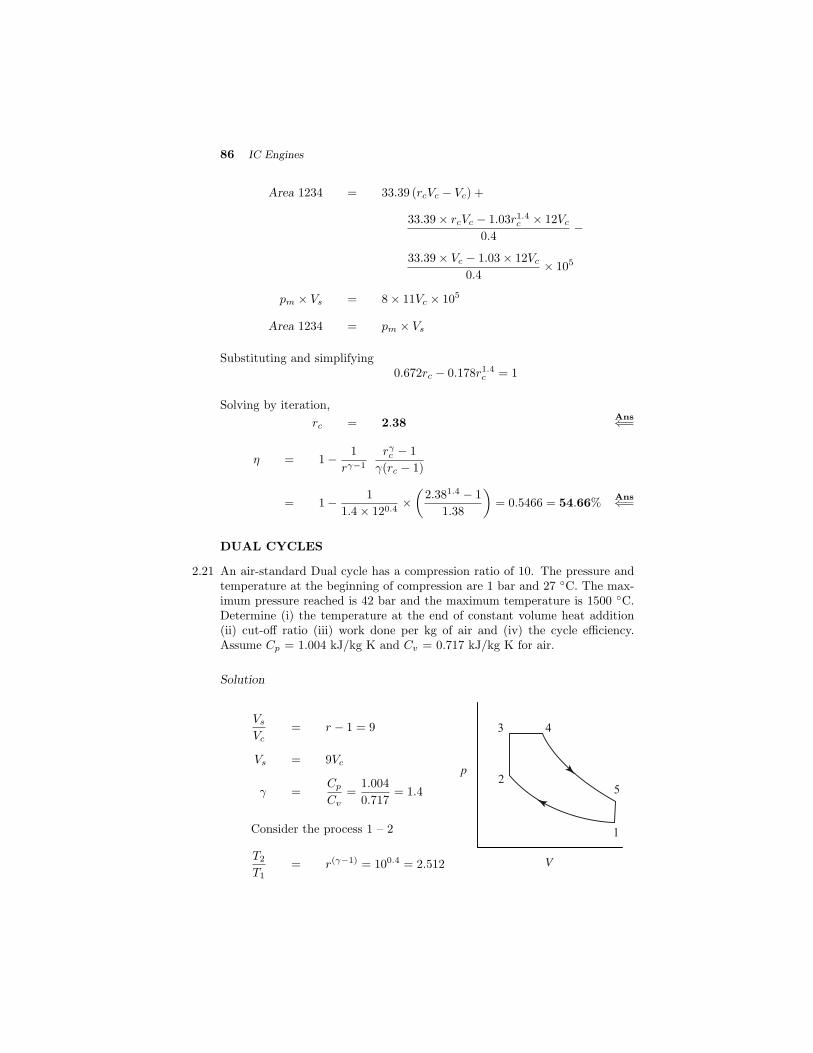
86 IC Engines
Area 1234 = 33.39 (rcVc − Vc) +
33.39× rcVc − 1.03r1.4c× 12Vc
0.4−
33.39× Vc − 1.03× 12Vc0.4
× 105
pm × Vs = 8× 11Vc × 105
Area 1234 = pm × Vs
Substituting and simplifying0.672rc − 0.178r1.4
c= 1
Solving by iteration,
rc = 2.38Ans⇐=
η = 1−1
rγ−1rγc− 1
γ(rc − 1)
= 1−1
1.4× 120.4×
�2.381.4 − 1
1.38
�= 0.5466 = 54.66%
Ans⇐=
DUAL CYCLES
2.21 An air-standard Dual cycle has a compression ratio of 10. The pressure andtemperature at the beginning of compression are 1 bar and 27 ◦C. The max-imum pressure reached is 42 bar and the maximum temperature is 1500 ◦C.Determine (i) the temperature at the end of constant volume heat addition(ii) cut-off ratio (iii) work done per kg of air and (iv) the cycle efficiency.Assume Cp = 1.004 kJ/kg K and Cv = 0.717 kJ/kg K for air.
Solution
Vs
Vc= r − 1 = 9
Vs = 9Vc
γ =Cp
Cv=
1.004
0.717= 1.4
Consider the process 1 – 2
T2
T1= r(γ−1) = 100.4 = 2.512 V
p2
1
3 4
5

Air-Standard Cycles and Their Analysis 87
T2 = 2.512× 300 = 753.6 K
p2p1
= rγ = 101.4 = 25.12
p2 = 25.12× 10⁵ N/m2
Consider the process 3 – 4
T3T2
=p3p2
=42
25.12= 1.672
T3 = 1.672× 753.6 = 1260 K = 987◦ CAns⇐=
rc =T4T3
=1773
1260= 1.407
Ans⇐=
Work done/kg = Heat supplied - Heat rejected
Heat supplied/kg = Cv (T3 − T2) + Cp (T4 − T3)
= 0.717× (1260− 753.6) +
1.004× (1773− 1260) = 878.1 kJAns⇐=
Consider the process 4 – 5
T4T5
=
V5V4
(γ−1)
=
r
rc
(γ−1)
=
10
1.407
0.4= 2.191
T5 =T4
2.191= 809.2 K
Ans⇐=
Heat rejected/kg = Cv (T5 − T1)
= 0.717× (809.2− 300) = 365.1 kJ
Work output/kg = 878.1− 365.1 = 513 kJAns⇐=
ηDual =Work output
Heat added=
513
878.1
= 0.5842 = 58.42%Ans⇐=
2.22 For an engine working on the ideal Dual cycle, the compression ratio is 10and the maximum pressure is limited to 70 bar. If the heat supplied is 1680kJ/kg, find the pressures and temperatures at the various salient points ofthe cycle and the cycle efficiency. The pressure and temperature of air at thecommencement of compression are 1 bar and 100 ◦C respectively. Assume Cp
= 1.004 kJ/kg K and Cv = 0.717 kJ/kg K for air.
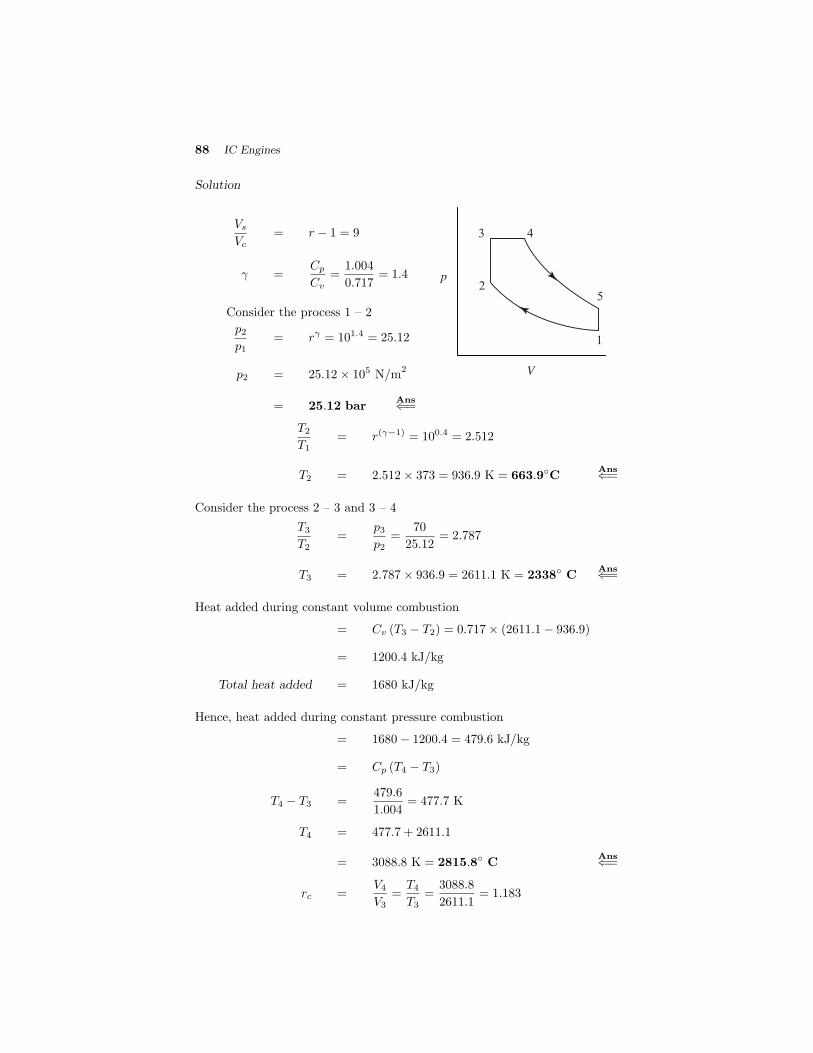
88 IC Engines
Solution
Vs
Vc= r − 1 = 9
γ =Cp
Cv=
1.004
0.717= 1.4
Consider the process 1 – 2
p2p1
= rγ = 101.4 = 25.12
p2 = 25.12× 10⁵ N/m2
= 25.12 barAns⇐=
V
p2
1
3 4
5
T2T1
= r(γ−1) = 100.4 = 2.512
T2 = 2.512× 373 = 936.9 K = 663.9◦CAns⇐=
Consider the process 2 – 3 and 3 – 4
T3T2
=p3p2
=70
25.12= 2.787
T3 = 2.787× 936.9 = 2611.1 K = 2338◦ CAns⇐=
Heat added during constant volume combustion
= Cv (T3 − T2) = 0.717× (2611.1− 936.9)
= 1200.4 kJ/kg
Total heat added = 1680 kJ/kg
Hence, heat added during constant pressure combustion
= 1680− 1200.4 = 479.6 kJ/kg
= Cp (T4 − T3)
T4 − T3 =479.6
1.004= 477.7 K
T4 = 477.7 + 2611.1
= 3088.8 K = 2815.8◦ CAns⇐=
rc =V4V3
=T4T3
=3088.8
2611.1= 1.183

Air-Standard Cycles and Their Analysis 89
Consider the process 4 – 5
T4T5
=
r
rc
(γ−1)
= 8.4530.4 = 2.35
T5 =T4
2.35=
3088.8
2.35= 1314.4 K = 1041.4◦ C
Ans⇐=
p4p5
=
r
rc
γ
= 19.85
p5 =p4
19.85=
70× 105
19.85
= 3.53× 10⁵ N/m2
= 3.53 barAns⇐=
Heat rejected = Cv(T5 − T1)
= 0.717× (1314.4− 373) = 674.98 kJ/kg
η =1680− 674.98
1680= 59.82%
Ans⇐=
2.23 An oil engine works on the Dual cycle, the heat liberated at constant pressurebeing twice that liberated at constant volume. The compression ratio of theengine is 8 and the expansion ratio is 5.3. But the compression and expansionprocesses follow the law pV 1.3 = C. The pressure and temperature at thebeginning of compression are 1 bar and 27 ◦C respectively. Assuming Cp =1.004 kJ/kg K and Cv = 0.717 kJ/kg K for air, find the air-standard efficiencyand the mean effective pressure.
Solution
γ =Cp
Cv=
1.004
0.717= 1.4
Vs
Vc= r − 1 = 7
Vs = 7Vc
re =r
rc= 5.3
rc =8
5.3= 1.509
V
p2
1
3 4
5
90 IC Engines
mep = =Area 12345
Vs
Area 12345 = Area under 3 – 4+
Area under 4 – 5−Area under 2 –1
= p3 (V3 − V4) +p4V4 − p5V5
n− 1−
p2V2 − p1V1n− 1
V2 = V3 = Vc
V1 = V5 = rVc = 8 Vc
V4 = rcV3 = 1.509 Vc
T2T1
= r(n−1) = 80.3 = 1.866
T2 = 1.866× 300 = 559.82 K
p2p1
= rn = 81.3 = 14.93
p2 = 14.93× p1 = 14.93× 10⁵ N/m2
Heat released during constant pressure combustion
= 2 × Heat released during constant volume combustionCp (T4 − T3) = 2Cv (T3 − T2)
1.004× (T4 − T3) = 2× 0.717× (T3 − T2)
T4 − T3 = 1.428× (T3 − T2)
T4T3
=V4V3
= rc = 1.509
T4 = 1.509 T3
1.509 T3 − T3 = 1.428× (T3 − 559.82)
T3 = 869.88 K
T4 = 1312.65 K
p3p2
=T3T2
=869.88
559.82= 1.554

Air-Standard Cycles and Their Analysis 91
p3 = 1.554× 14.93× 105
= 23.20× 10⁵ N/m2
= p4
T4T5
= r(n−1)e = 5.30.3 = 1.649
T5 =1312.65
1.649= 796.03 K
p4p5
= rne = 5.31.3 = 8.741
p5 =p4
8.741=
23.2× 10⁵
8.741
= 2.654× 10⁵ N/m2
Area 12345 =
23.2× 1.509Vc − 2.654× 8Vc
0.3+
23.2× (1.509Vc − Vc)−
14.93× Vc − 1× 8Vc
0.3
× 105
= 34.63× Vc × 105 N/m2
Vc =V18
Area 12345 = pm × Vs = pm × 7× Vc
pm =34.63
7= 4.95× 10⁵ N/m
2
= 4.95 barAns⇐=
η =w
qs
v1 =mRT1
p1=
1× 287× 300
1× 105= 0.861 m3/kg
w = 34.63× 10⁵ × v18
= 34.63× 105 × 0.861
8
= 3.727× 10⁵ J/kg = 372.7 kJ/kg
Note : Work done should be calculated only from the area (
pdv) for apolytropic process

92 IC Engines
qs = q(T3 − T2) + Cp(T4 − T3) = 667.1 kJ/kg
η =372.7
667.1× 100 = 55.9%
Ans⇐=
COMPARISON OF CYCLES
2.24 A four-cylinder, four-stroke, spark-ignition engine has a displacement volumeof 300 cc per cylinder. The compression ratio of the engine is 10 and operatesat a speed of 3000 rev/min. The engine is required to develop an outputof 40 kW at this speed. Calculate the cycle efficiency, the necessary rateof heat addition, the mean effective pressure and the maximum temperatureof the cycle. Assume that the engine operates on the Otto cycle and thatthe pressure and temperature at the inlet conditions are 1 bar and 27 ◦Crespectively.If the above engine is a compression-ignition engine operating on the Dieselcycle and receiving heat at the same rate, calculate efficiency, the maximumtemperature of the cycle, the cycle efficiency, the power output and the meaneffective pressure. Take Cv = 0.717 kJ/kg K and γ = 1.4.
Solution
Consider the Otto cycle, Fig.2.9(a)
η = 1− 1
rγ−1
= 1− 1
100.4= 0.602 = 60.2%
Ans⇐=
η =Power output
Heat supplied
Heat supplied =40
0.602= 66.5 kW = 66.5 kJ/s
Ans⇐=
Number of cycles/s =3000
2× 60= 25
Net work output per cycle from each cylinder
=40
4× 25= 0.4 kJ
pm =W
Vs=
0.4× 1000
300× 10−6
= 13.3× 10⁵ N/m2 Ans⇐=
T2 = T1
V1V2
γ−1
= 300× 100.4 = 753.6 K

Air-Standard Cycles and Their Analysis 93
Heat supplied/cylinder/cycle (Q2−3)
=66.5
4× 25= 0.665 kJ
Now,Q2−3 = mCv (T3 − T2)
v1 =RT1p1
=287× 300
1× 105
= 0.861 m3/kg
This initial volume of air in the cylinder is
V1 = V2 + Vs =
V110
+ Vs
0.9V1 = Vs
V1 =Vs
0.9=
300× 10−6
0.9
= 333× 10−6 m3
m =V1v1
=333× 10−6
0.861
= 0.387× 10⁻³ kg
The temperature rise resulting from heat addition is
T3 − T2 =Q2−3
m Cv
=0.665
0.387× 10−3 × 0.717= 2396.6 K
T3 = T2 + 2396.6 = 753.6 + 2396.6
= 3150.2 K = 2877◦ CAns⇐=
Now let us consider the Diesel cycle
T2 is the same as in the previous case, i.e.
T2 = 753.6
Heat supplied per cycle per cylinder is also same, i.e.
Q2−3 = 0.665 kJ
Q2−3 = m Cp(T3 − T2)
94 IC Engines
T3 − T2 =0.665
0.387× 10−3× 1
1.004
= 1711.5 K
T3 = 1711.5 + 753.6 = 2465.1 K
= 2192.1◦ CAns⇐=
Cut-off ratio, rc =V3V2
=T3
T2=
2465.1
753.6= 3.27
Air-standard efficiency = 1− 1
rγ−1
rγc − 1
γ (rc − 1)
= 1− 1
100.4×
3.271.4 − 1
1.4× (3.27− 1)
= 1− 0.398× 1.338 = 0.467
= 46.7%Ans⇐=
Power output = η × total rate of heat added
= 0.467× 66.5 = 31.1 kW
Power output/cylinder =31.1
4= 7.76 kW
Work done/cylinder/cycle =7.76
25= 0.3104 kJ
pm =W
Vs=
0.3104× 1000
300× 10−6
= 10.35× 10⁵ N/m2 Ans⇐=
As discussed in the text, this problem illustrates that for the same compressionratio and heat input Otto cycle is more efficient.
2.25 The compression ratio of an engine is 10 and the temperature and pressure atthe start of compression is 37 ◦C and 1 bar. The compression and expansionprocesses are both isentropic and the heat is rejected at exhaust at constantvolume. The amount of heat added during the cycle is 2730 kJ/kg. Determinethe mean effective pressure and thermal efficiency of the cycle if (i) the maxi-mum pressure is limited to 70 bar and heat is added at both constant volumeand constant pressure and (ii) if all the heat is added at constant volume.In this case how much additional work per kg of charge would be obtainedif it were possible to expand isentropically the exhaust gases to their originalpressure of 1 bar. Assume that the charge has the same physical propertiesas that of air.

Air-Standard Cycles and Their Analysis 95
Solution
v1 =V1m
=RT1p1
=287× 310
1× 105= 0.89 m3/kg
Consider the process 1-2
T2T1
=
V1V2
γ−1
= 310× 100.4 = 778.7 KV
p
2
3 4
6
5
3'
4'
1
p2 = p1
V1V2
γ
= 25.12 bar
Consider the limited pressure cycle (123451)
T3 = T2p3p2
= 778.7× 70
25.12= 2170 K
Heat supplied at constant volume
= 0.717× (2170− 778.7) = 997.56 kJ/kg
Heat supplied at constant pressure
= 2730− 997.56 = 1732.44 kJ/kg
1732.4 = 1.004× (T4 − 2170)
T4 = 2170 +1732.4
1.004= 3895.5 K
v4 = v3 × T4T3
=0.89
10× 3895.5
2170= 0.16 m3/kg
T5 = T4
v4v5
γ−1
= 3895.5×
0.16
0.89
0.4= 1961 K
Heat rejected = Cv (T5 − T1)
= 0.717× (1961− 310) = 1184 kJ/kg
Work done = Heat supplied−Heat rejected
= 2730− 1184 = 1546 kJ/kg
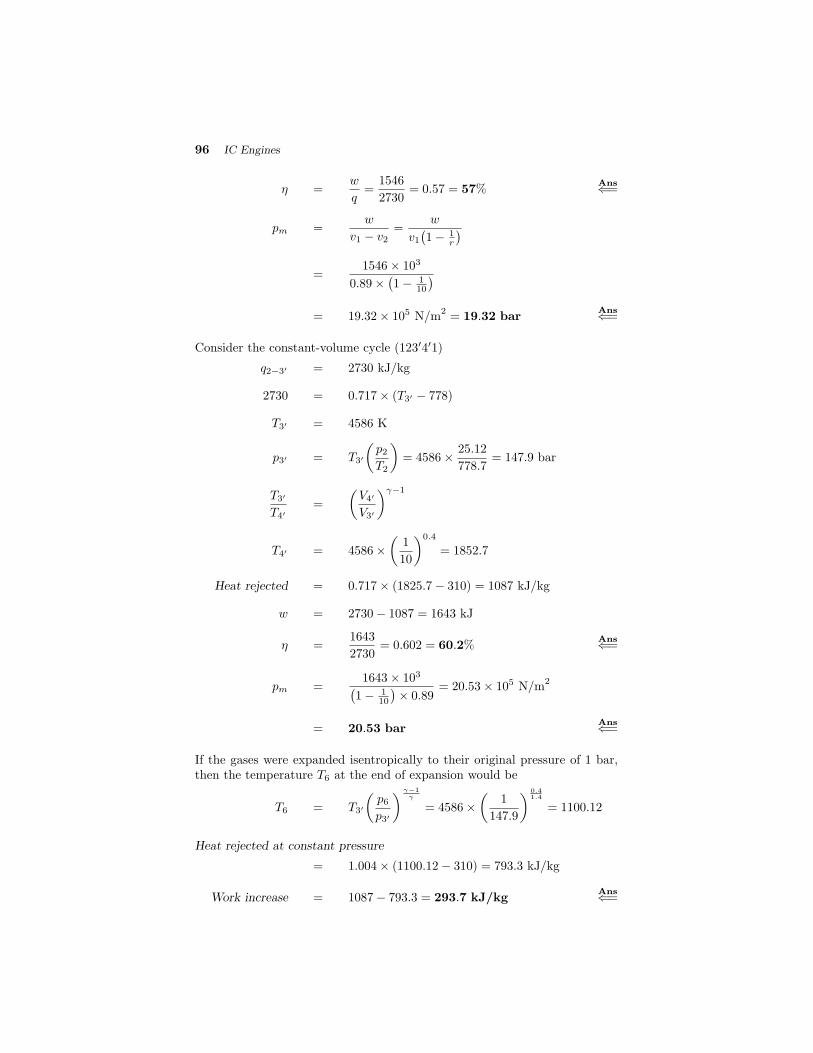
96 IC Engines
η =w
q=
1546
2730= 0.57 = 57%
Ans⇐=
pm =w
v1 − v2=
w
v1 1− 1
r
=
1546× 103
0.89× 1− 110
= 19.32× 10⁵ N/m
2= 19.32 bar
Ans⇐=
Consider the constant-volume cycle (123 4 1)
q2−3 = 2730 kJ/kg
2730 = 0.717× (T3 − 778)
T3 = 4586 K
p3 = T3
p2T2
= 4586× 25.12
778.7= 147.9 bar
T3
T4
=
V4
V3
γ−1
T4 = 4586×
1
10
0.4= 1852.7
Heat rejected = 0.717× (1825.7− 310) = 1087 kJ/kg
w = 2730− 1087 = 1643 kJ
η =1643
2730= 0.602 = 60.2%
Ans⇐=
pm =1643× 103
1− 110
× 0.89= 20.53× 10⁵ N/m
2
= 20.53 barAns⇐=
If the gases were expanded isentropically to their original pressure of 1 bar,then the temperature T6 at the end of expansion would be
T6 = T3
p6p3
γ−1
γ
= 4586×
1
147.9
0.41.4
= 1100.12
Heat rejected at constant pressure
= 1.004× (1100.12− 310) = 793.3 kJ/kg
Work increase = 1087− 793.3 = 293.7 kJ/kgAns⇐=

Air-Standard Cycles and Their Analysis 97
Review Questions
2.1 What is the simplest way by which an IC engine cycle can be analyzed?Do IC engines operate on a thermodynamic cycle?
2.2 What is the use of air-standard cycle analysis?
2.3 Mention the various assumption made in air-standard cycle analysis.
2.4 What is Carnot cycle and what is its importance? How is this cyclereversible?
2.5 Draw the Carnot cycle on p-V and T -s diagrams. Derive an expressionfor its efficiency. Comment on the significance of this result as it relatedto source and sink temperature.
2.6 Define mean effective pressure and comment its application in internalcombustion engines.
2.7 Name the cycles which have the same efficiency of Carnot cycle. Arethese cycles reversible in the sense the Carnot cycle is?
2.8 Draw the Stirling cycle on p-V and T -s diagrams and show how thecycle is reversible?
2.9 Derive the expression for Stirling cycle efficiency and show that the ex-pression is same as that of Carnot cycle.
2.10 If you include the efficiency of the heat exchanger show how the expres-sion is modified.
2.11 Draw the p-V and T -s diagram of Ericsson cycle and show how it ismade reversible.
2.12 Compare Carnot, Stirling and Ericsson cycles operating between thesame source and sink temperatures and with equal changes in specificvolume.
2.13 Draw the Otto cycle on p-V and T -s diagrams mark the various pro-cesses.
2.14 Derive an expression for the efficiency of Otto cycle and comment onthe effect of compression ratio on the efficiency with respect of ratio ofspecific heats by means of a suitable graph.
2.15 Obtain an expression for mean effective pressure of an Otto cycle.
2.16 What is the basic difference between an Otto cycle and Diesel cycle?Derive the expression for the efficiency and mean effective pressure ofthe Diesel cycle.
2.17 Show that the efficiency of the Diesel cycle is lower than that of Otto cy-cle for the same compression ratio. Comment why the higher efficiencyof the Otto cycle compared to Diesel cycle for the same compressionratio is only of a academic interest and not practical importance.
98 IC Engines
2.18 Compare the Otto cycle for the same peak pressure and temperature.Illustrate the cycles on p-V and T -s diagrams.
2.19 Draw the p-V and T -s diagrams of a Dual cycle. Why this cycle is alsocalled limited pressure or mixed cycle?
2.20 Derive the expressions for the efficiency and mean effective pressure ofa Dual cycle.
2.21 Compare Otto, Diesel and Dual cycles for the
(i) same compression ratio and heat input
(ii) same maximum pressure and heat input
(iii) same maximum pressure and temperature
(iv) same maximum pressure and work output
2.22 Sketch the Lenoir cycle on p-V and T -s diagrams and obtain an expres-sion for its air-standard efficiency.
2.23 Compare the Otto cycle and Atkinson cycle. Derive the expression forthe efficiency of Atkinson cycle.
2.24 Derive an expression for the air-standard efficiency of the Joule cyclein terms of
(i) compression ratio
(ii) pressure ratio.
2.25 Where do the following cycles have applications
(i) Otto cycle
(ii) Diesel cycle
(iii) Dual cycle
(iv) Stirling cycle
(v) Ericsson cycle
(vi) Atkinson cycle
(vii) Lenoir cycle
(viii) Joule cycle
Exercise
2.1 Assume working substance for a Carnot cycle to be air with Cp = 1kJ/kg K and Cv = 0.717 kJ/kg K. Temperature at which heat is addedis 2000 K and temperature at which heat is rejected is 300 K. Theamount of heat added per kg of the working substance is 840 kJ/kg.Calculate for the cycle (i) the maximum pressure developed (ii) thecompression ratio assuming adiabatic compression and (iii) the efficiencyof the cycle. The pressure at the beginning of isothermal compressionis 1 bar. Ans: (i) 3304.8 bar (ii) 114.75 (iii) 85%

Air-Standard Cycles and Their Analysis 99
2.2 An engine operates on Otto cycle between pressures 1 bar and 30 bar.The ratio of pressure at constant volume is 4. The temperature atthe end of compression is 200 ◦C and the law of compression and ex-pansion is PV 1.3 = constant. If the engine now operates on Carnotcycle for the same range of temperature, find the efficiency of the cycle.
Ans: 84.3%
2.3 An Otto cycle engine having a clearance volume of 250 cc has acompression ratio of 8. The ratio of pressure rise at constant vol-ume is 4. If the initial pressure is 1 bar, find the work done percycle and the theoretical mean effective pressure. Take γ = 1.4.
Ans: (i) 1946.1 J/cycle (ii) 11.12 bar
2.4 Find the mep for the ideal air-standard Otto cycle having a maximumpressure of 40 bar and minimum pressure of 1 bar. The compressionratio is 5:1. Take γ = 1.4 Ans: 9.04 bar
2.5 An engine working on ideal Otto cycle, the ratio of temperature at thebeginning of compression is 300 K. If the ideal air-standard efficiency =0.5, calculate the compression ratio of the engine. If the peak tempera-ture of the cycle is 1150 K, calculate the temperature when the pistonis at BDC during expansion stroke. Ans: (i) 5.66 (ii) 575 K
2.6 A 2.7 litre cubic capacity, six-cylinder, four-stroke Otto enginehas a compression ratio of 10. The engine develops 138 kWat 5000 rpm. Calculate (i) air-standard efficiency; (ii) the nec-essary rate of heat addition; (iii) the mean effective pressure ofthe cycle; (iv) the peak temperature and pressure of the cycle.
Ans: (i) 0.602 (ii) 229.23 kW (iii) 12.26 bar(iv) 2966 K (v) 98.8 bar
2.7 It is desired to increase the output of an SI engine working on ideal Ottocycle, either by
(i) increasing the compression ratio
(ii) increasing the inlet pressure from 1 to 1.5 bar
which one will give higher peak pressure in the cycle and whatis its value? Assume heat supplied at the constant volumeprocess is the same in both the cases which is 420 kJ. TakeT1 = 27◦, p1 = 1 bar, γ = 1.4. Comment on the result.
Ans: (i) Increase in the compression ratio will producehigher peak pressure. (ii) 44.6 bar
2.8 A petrol engine working on Otto cycle has an maximum pressure of 50bar. Heat supplied is 1000 kJ/kg. If the pressure ratio during com-pression 12.286, find the compression ratio and also the ratio of peaktemperature to inlet temperature. Take p1 = 1 bar and T1 = 27◦ C.
Ans: (i) 6 (ii) 8.34

100 IC Engines
2.9 An Otto cycle takes in air at 300 K. The ratio of maximum to mini-mum temperature is 6. Find out the optimum compression ratio for themaximum work output of the cycle. Ans: 9.39
2.10 The pressure and temperature of a Diesel cycle at the start are 1 barand 20 ◦C respectively and the compression ratio is 14. The pressure atthe end of expansion is 2.5 bar. Find the percentage of working strokeat which heat is supplied and heat supplied per kg of air. Assume γ =1.4 and Cp = 1.004 kJ/kg K. Ans: (i) 7.11% (ii) 781.46 kJ/kg
2.11 An oil engine works on Diesel cycle, the compression ratio being 15.The temperature at the start of compression is 17 ◦C and 700 kJ ofheat is supplied at constant pressure per kg of air and it attains atemperature of 417 ◦C at the end of adiabatic expansion. Find theair-standard efficiency of the cycle. What would be the theoreticalwork done per kg of air. Take Cv = 0.717 kJ/kg K and γ = 1.4.
Ans: (i) 59.03% (ii) 413.20 kJ
2.12 An internal combustion engine works on Diesel cycle with a compressionratio of 8 and expansion ratio of 5. Calculate the air-standard efficiency.Assume γ = 1.41. Ans: 52.6 %
2.13 A Diesel engine works on Diesel cycle with a compression ratio of 16and cut-off ratio of 1.8. Calculate the thermal efficiency assuming γ =1.4. Ans: 62.38 %
2.14 An internal combustion engine works on Diesel cycle with a compressionratio of 14 and cut-off takes place at 10 % of the stroke. Find the ratioof cut-off and the air-standard efficiency. Ans: (i) 2.3 (ii) 57.8 %
2.15 An ideal Diesel cycle operates on a pressure of 1 bar and a temperatureof 27 ◦C at the beginning of compression and a pressure of 2 bar at theend of adiabatic expansion. Calculate the amount of heat required tobe supplied per kg of air if the ideal thermal efficiency is taken as 60 %.Take Cv = 0.717 kJ/kg K. Ans: 537.75 kJ/kg
2.16 The pressure and temperature of a Diesel cycle at the start are 1 barand 17 ◦C. The pressure at the end of compression is 40 bar and that atthe end of expansion is 2 bar. Find the air-standard efficiency. Assumeγ = 1.4. Ans: 61.14 %
2.17 A Diesel cycle operates at a pressure of 1 bar at the beginning of com-pression and the volume is compressed to 1
15 of the initial volume. Heatis then supplied until the volume is twice that of the clearance volume.Determine the mean effective pressure. Take γ = 1.4. Ans: 6.69 bar
2.18 A semi-diesel engine works on dual combustion cycle. The pressureand temperature at the beginning of the compression is 1 bar and 27◦C respectively and the compression ratio being 12. If the maximumpressure is 50 bar and heat received at constant pressure is for 1
30 th ofthe stroke, find the work done per kg of air and the thermal efficiency.Take Cv = 0.717 and Cp = 1.004. Ans: (i) 476.76 kJ/kg (ii) 61.5 %
Air-Standard Cycles and Their Analysis 101
2.19 A compression-ignition engine has a compression ratio of 10 and 23 of
heat of combustion is liberated at constant volume and the remainderat constant pressure. The pressure and temperature at the beginningare 1 bar and 27 ◦C and the maximum pressure is 40 bar. Find thetemperatures at the end of compression and expansion, if it follows thelaw pV 1.35 = constant, and γ = 1.4. Ans: (i) 398.6 ◦C (ii) 380.3 ◦C
2.20 A compression-ignition engine works on dual combustion cycle. Thepressure and temperature at the beginning of compression are 1 barand 27 ◦C respectively and the pressure at the end of compression is 25bar. If 420 kJ of heat is supplied per kg of air during constant volumeheating and the pressure at the end of adiabatic expansion is found tobe 3 bar, find the ideal thermal efficiency. Assume Cp = 1.004 kJ/kg Kand Cv = 0.717 kJ/kg K. Ans: 41.36%
2.21 The cycle of an internal combustion engine with isochoric heat supplyis performed with the compression ratio equal to 8. Find heat suppliedto the cycle and the useful work, if the removed heat is 500 kJ/kg andthe working fluid is air. Ans: (i) 1148.63 kJ/kg (ii) 648.63 kJ/kg
2.22 The initial parameters (at the beginning of compression) of the cycle ofan internal combustion engine with isobaric heat supply are 0.1 MPa and80 ◦C. The compression ratio is 16 and the heat supplied is 850 kJ/kg.Calculate the parameters at the characteristic points of the cycle andthe thermal efficiency, if the working fluid is air.
Ans: (i) p2 = 48.5 bar (ii) p3 = 48.5 bar(iii) p4 = 2.26 bar (iv) T2 = 1070.1 K(v) T3 = 1916 K (vi) T4 = 797.73 K
(vii) ηth = 62.5%
2.23 The pressure ratio λ = 1.5 in the process of isochoric heat supply for thecycle of an internal combustion engine with a mixed supply of heat =1034 kJ/kg and the compression ratio = 13. Find the thermal efficiencyand temperature at the characteristic points of the cycle if the initialparameters are 0.09 MPa and 70 ◦C and the working substance is air.
Ans : (i) ηth = 57.5% (ii) T2 = 956.9 K(iii) T3 = 1435.5 K (iv) T4 = 2122.86 K(v) T5 = 890 K
2.24 The parameters of the initial state of one kilogram of air in the cycle of aninternal combustion engine are 0.095 MPa and 65 ◦C. The compressionratio is 11. Compare the values of the thermal efficiency for isobaricand isochoric heat supply in amounts of 800 kJ, assuming that k = 1.4.
Ans: ηtp = 55.7 %, ηtv = 61.7%
2.25 Find the thermal efficiency of the cycle of an internal combustion enginewith a mixed heat supply, if the minimum temperature of the cycle is

102 IC Engines
85 ◦C and the maximum temperature is 1700 K. The compression ratiois 15 and the pressure ratio in the process of heat supply is 1.3. Theworking fluid is air. Ans: ηth = 65.25 %
2.26 The pressure ratio during the compression in the cycle of an internalcombustion engine with isochoric heat supply is equal to 18. Find thecompression ratio, supplied and removed heat, work and efficiency, ifduring heat removal the temperature drops from 600 to 100 ◦C and theworking fluid is air. Assume γ = 1.4 and Cv = 0.717 kJ/kg K.
Ans: (i) r = 7.88 (ii) q1 = 818.73 kJ/kg(iii) q2 = 358.5 kJ/kg (iv) w = 460.23 kJ/kg(v) ηth = 56.21%
2.27 An oil engine working on the dual combustion cycle has a cylinder di-ameter of 20 cm and stroke of 40 cm. The compression ratio is 13.5 andthe explosion ratio 1.42. Cut-off occurs at 5.1% of the stroke. Find theair-standard efficiency. Take γ = 1.4. Ans: 61.32 %
2.28 A compression-ignition engine working on Dual cycle takes in two-fifthof its total heat supply at constant volume and the remaining at constantpressure. Calculate :
(i) The pressure and temperature at the five cardinal points of thecycle.
(ii) The ideal thermal efficiency of the cycle.
Given : compression ratio = 13.1, Maximum pressure in the cycle = 45bar, air intake at 1 bar and 15 ◦C, Cp = 1.004 kJ/kg K and Cv = 0.717kJ/kg K.
Ans: (i) p1 = 1 bar (ii) p2 = 36.3 bar(iii) p3 = 45 bar (iv) p4 = 45 bar(v) p5 = 1.61 bar (vi) T1 = 288 K
(vii) T2 = 804.09 K (viii) T3 = 996.88 K(ix) T4 = 1203.4 K (x) T5 = 464.6 K(xi) ηth = 63.36%
2.29 An oil engine working on the dual combustion cycle has a cylinder di-ameter of 25 cm and stroke 35 cm. The clearance volume is 1500 ccand cut-off takes place at 5% of the stroke. The explosion ratio 1.4.Find the air-standard efficiency of the engine. Assume γ = 1.4 for air.
Ans: 60.74 %
2.30 A gas turbine unit works on an air-standard Brayton cycle. The pressureratio across the compression is 6. Air enters the compressor at 1 bar and27 ◦C. The maximum temperature of the cycle is 850 ◦C. Calculate thespecific output of the cycle. What will be the power developed by theunit for a mass flow rate of 10 kg/s. Would you recommend this cyclefor a reciprocating engine? For air γ = 1.4 and Cp = 1.005 kJ/kg K.
Air-Standard Cycles and Their Analysis 103
Ans: (i) 250.64 kJ/kg (ii) 2506.4 kW(iii) The volume of the cylinder will be too large due to
high specific volume at state 4, therefore this cycleis not recommended for reciprocating engine.
Multiple Choice Questions (choose the most appropriate answer)
1. The efficiency of Carnot engine is 0.75. If the cycle is reversed, itscoefficient of performance as heat refrigerator is
(a) 0.25
(b) 0.33
(c) 1.33
(d) 4
2. A perfect engine works on the Carnot cycle between 727 ◦C and 227◦C.The efficiency of the engine is
(a) 0.5
(b) 2
(c) 227727
(d) 500727
3. Efficiency of stirling cycle is same as
(a) Otto cycle
(b) Diesel cycle
(c) Carnot cycle
(d) Ericsson cycle
4. The air standard efficiency of Otto cycle is
(a) η = 1− rγ−1
(b) η = 1− 1rγ−1
(c) η = 1− rγ−1
γ
(d) η = 1− 1
rγ−1
γ
5. The air standard Otto cycle consists of
(a) two constant volume and two isentropic processes
(b) two constant pressure and two isentropic processes
(c) two constant pressure and two constant volume processes
(d) none of the above

104 IC Engines
6. In air standard Diesel cycle at fixed r and fixed γ,
(a) ηthermal increases with increase in heat addition and cut-off ratio
(b) ηthermal decreases with increase in heat addition and cut=off ratio
(c) ηthermal remains the same with increase in heat addition andcut=off ratio
(d) none of the above
7. Mean effective pressure of Otto cycle is
(a) inversely proportional to pressure ratio
(b) directly proportional to pressure ratio
(c) does not depend on pressure ratio
(d) proportional to square root of pressure ratio
8. For a given compression ratio the work output of Otto cycle is
(a) increases with increase in r
(b) decreases with increase in r
(c) is not affected
(d) none of the above
9. For a given value of r, efficiency of Otto cycle
(a) decreases with compression ratio
(b) increases with compression ratio
(c) is not affected
(d) none of the above
10. For dual combustion cycle for fixed value of heat addition and compres-sion ratio
(a) mep will be greater with increase in rp and decrease in rc
(b) mep will be greater with decrease in rp and decrease in rc
(c) mep remain the same with increase in rp and decrease in rc
(d) none of the above
11. The normal range of compression ratio for Otto cycle is
(a) 6 to 10
(b) 2 to 4
(c) > 10
(d) none of the above
Air-Standard Cycles and Their Analysis 105
12. The normal range of compression ratio for Diesel cycle is
(a) 4 to 6
(b) 6 to 8
(c) 15 to 20
(d) >25
13. For the same compression ratio and heat addition
(a) ηOtto > ηDiesel > ηDual
(b) ηDiesel > ηOtto > ηDual
(c) ηOtto > ηDual > ηDiesel
(d) ηDual > ηDiesel > ηOtto
14. For the same compression ratio and heat rejection,
(a) ηOtto > ηDual > ηDiesel
(b) ηDiesel > ηDual > ηOtto
(c) ηDual > ηDiesel > ηOtto
(d) ηDual > ηOtto > ηDiesel
15. When the engines are built to withstand the same thermal and mechan-ical stresses
(a) ηDiesel > ηDual > ηOtto
(b) ηDual > ηDiesel > ηOtto
(c) ηOtto > ηDual > ηDiesel
(d) ηOtto > ηDiesel > ηDual
16. For the same peak pressure and heat input
(a) ηOtto > ηDual > ηDiesel
(b) ηOtto > ηDiesel > ηDual
(c) ηDiesel > ηDual > ηOtto
(d) ηDiesel > ηOtto > ηDual
17. For the same peak pressure and work output
(a) ηOtto > ηDual > ηDiesel
(b) ηOtto > ηDiesel > ηDual
(c) ηDiesel > ηOtto > ηDual
(d) ηDiesel > ηDual > ηOtto

106 IC Engines
18. Lenoir cycle is used in
(a) SI engines
(b) CI engines
(c) pulse jet engines
(d) gas turbines
19. A Brayton cycle consists of
(a) two constant volume and two constant pressure processes
(b) two constant volume and two isentropic processes
(c) one constant pressure, one constant volume and two isentropic pro-cesses
(d) none of the above
20. Brayton cycle is used in
(a) Ramjet engines
(b) gas turbines
(c) pulse jet engines
(d) CI engines
(e) SI engines
Ans: 1. – (b) 2. – (a) 3. – (c) 4. – (b) 5. – (a)6. – (b) 7. – (b) 8. – (a) 9. – (b) 10. – (a)
11. – (a) 12. – (c) 13. – (c) 14. – (a) 15. – (a)16. – (c) 17. – (d) 18. – (c) 19. – (c) 20. – (b)
3FUEL–AIR CYCLES AND
THEIR ANALYSIS
3.1 INTRODUCTION
In the previous chapter, a detailed discussion of air-standard cycles, par-ticularly for IC engines has been given. The analysis was based on highlysimplifying assumptions. Because of this, the estimated engine performanceby air-standard cycle analysis is on the higher side compared to the actualperformance. For example, the actual indicated thermal efficiency of an SIengine, say with a compression ratio of 8:1, is of the order of 28% whereasthe air-standard efficiency is 56.5%. This large deviation may to some extentbe attributed to progressive burning of the fuel, incomplete combustion andvalve operation etc. However, the main reasons for this may be attributed tothe over simplified assumptions made in the analysis.
In an actual engine, the working fluid is a mixture of air, fuel vapourand residual gases from the previous cycle. Further, the specific heats of theworking fluid are not constant but increase with temperature. Finally, theproducts of combustion are subjected to certain dissociation at high temper-atures. If the actual physical properties of the gases in the cylinder beforeand after the combustion are taken into account, reasonably close values tothe actual pressures and temperatures existing within the engine cylinder canbe estimated. The mean effective pressures and efficiencies, calculated by thisanalysis, in the case of well designed engines are higher only by a few per centfrom the actual values obtained by tests. The analysis based on the actualproperties of the working medium viz., fuel and air is called the fuel-air cycleanalysis and even this analysis has simplifying assumptions. However, theyare more justifiable and close to the actual conditions than those used in theair-standard cycle analysis.
3.2 FUEL–AIR CYCLES AND THEIR SIGNIFICANCE
By air-standard cycle analysis, it is understood how the efficiency is improvedby increasing the compression ratio. However, analysis cannot bring out theeffect of air-fuel ratio on the thermal efficiency because the working mediumwas assumed to be air. In this chapter, the presence of fuel in the cylinder istaken into account and accordingly the working medium will be a mixture offuel and air. By fuel-air cycle analysis it will be possible to bring out the effectof fuel-air ratio on thermal efficiency and also study how the peak pressuresand temperatures during the cycle vary with respect to fuel-air ratio. Ingeneral, influence of many of the engine operating variables on the pressuresand temperatures within the engine cylinder may be better understood by

108 IC Engines
the examination of the fuel-air cycles. The fuel-air cycle analysis takes intoaccount the following :
(i) The actual composition of the cylinder gases : The cylinder gases con-tains fuel, air, water vapour and residual gas. The fuel-air ratio changesduring the operation of the engine which changes the relative amountsof CO2, water vapour, etc.
(ii) The variation in the specific heat with temperature : Specific heatsincrease with temperature except for mono-atomic gases. Therefore,the value of γ also changes with temperature.
(iii) The effect of dissociation : The fuel and air do not completely combinechemically at high temperatures (above 1600 K) and this leads to thepresence of CO, H2, H and O2 at equilibrium conditions.
(iv) The variation in the number of molecules : The number of moleculespresent after combustion depends upon fuel-air ratio and upon the pres-sure and temperature after the combustion.
Besides taking the above factors into consideration, the following assump-tions are commonly made :
(i) There is no chemical change in either fuel or air prior to combustion.
(ii) Subsequent to combustion, the charge is always in chemical equilibrium.
(iii) There is no heat exchange between the gases and the cylinder walls inany process, i.e. they are adiabatic. Also the compression and expansionprocesses are frictionless.
(iv) In case of reciprocating engines it is assumed that fluid motion canbe ignored inside the cylinder. With particular reference to constant-volume fuel-air cycle, it is also assumed that
(v) The fuel is completely vaporized and perfectly mixed with the air, and
(vi) The burning takes place instantaneously at top dead centre (at constantvolume).
As already mentioned, the air-standard cycle analysis shows the generaleffect of only compression ratio on engine efficiency whereas the fuel-air cy-cle analysis gives the effect of variation of fuel-air ratio, inlet pressure andtemperature on the engine performance. It will be noticed that compressionratio and fuel-air ratio are very important parameters of the engine while inletconditions are not so important.
The actual efficiency of a good engine is about 85 per cent of the estimatedfuel-air cycle efficiency. A good estimate of the power to be expected from theactual engine can be made from fuel-air cycle analysis. Also, peak pressuresand exhaust temperatures which affect the engine structure and design canbe estimated reasonably close to an actual engine. Thus the effect of manyvariables on the performance of an engine can be understood better by fuel-aircycle analysis.

Fuel–Air Cycles and their Analysis 109
3.3 COMPOSITION OF CYLINDER GASES
The air-fuel ratio changes during the engine operation. This change in air-fuelratio affects the composition of the gases before combustion as well as aftercombustion particularly the percentage of carbon dioxide, carbon monoxide,water vapour etc in the exhaust gases.
In four-stroke engines, fresh charge as it enters the engine cylinder, comesinto contact with the burnt gases left in the clearance space of the previouscycle. The amount of exhaust gases in clearance space varies with speed andload on the engine. Fuel-air cycle analysis takes into account this fact and theresults are computed for preparing the combustion charts. However, with theavailability of fast digital computers, nowadays it is possible to analyze theeffect of cylinder gas composition on the performance of the engine by meansof suitable numerical techniques. The computer analysis can produce fast andaccurate results. Thus, fuel-air cycle analysis can be done more easily throughcomputers rather than through manual calculations.
3.4 VARIABLE SPECIFIC HEATS
All gases, except mono-atomic gases, show an increase in specific heat withtemperature. The increase in specific heat does not follow any particular law.However, over the temperature range generally encountered for gases in heatengines (300 K to 2000 K) the specific heat curve is nearly a straight linewhich may be approximately expressed in the form
Cp = a1 + k1TCv = b1 + k1T
(3.1)
where a1, b1 and k1 are constants. Now,
R = Cp − Cv = a1 − b1 (3.2)
where R is the characteristic gas constant.
Above 1500 K the specific heat increases much more rapidly and may beexpressed in the form
Cp = a1 + k1T + k2T2 (3.3)
Cv = b1 + k1T + k2T2 (3.4)
In Eqn.3.4 if the term T 2 is neglected it becomes same as Eqn.3.1. Manyexpressions are available even upto sixth order of T (i.e. T6) for the calculationof Cp and Cv.
The physical explanation for increase in specific heat is that as the tem-perature is raised, larger fractions of the heat would be required to producemotion of the atoms within the molecules. Since temperature is the resultof motion of the molecules, as a whole, the energy which goes into movingthe atoms does not contribute to proportional temperature rise. Hence, moreheat is required to raise the temperature of unit mass through one degree athigher levels. This heat by definition is the specific heat. The values for Cp
and Cv for air are usually taken as

110 IC Engines
Cp = 1.005 kJ/kg K at 300 K Cv = 0.717 kJ/kg K at 300 K
Cp = 1.345 kJ/kg K at 2000 K Cv = 1.057 kJ/kg K at 2000 K
Since the difference between Cp and Cv is constant, the value of γ decreaseswith increase in temperature. Thus, if the variation of specific heats is takeninto account during the compression stroke, the final temperature and pressurewould be lower than if constant values of specific heat are used. This point isillustrated in Fig.3.1.
Cycle 1-2-3-4 : with constant specific heat
Cycle 1-2'-3'-4' : with variable specific heat
Cycle 1-2-3'-4" : with constant specific heat
from point 3'
2
2'
3
3'
44'4"
1
V
p
Fig. 3.1 Loss of power due to variation of specific heat
With variable specific heats, the temperature at the end of compressionwill be 2 , instead of 2. The magnitude of drop in temperature is proportionalto the drop in the value of ratio of specific heats. For the process 1→2, withconstant specific heats
T2 = T1
v1v2
γ−1
(3.5)
with variable specific heats,
T2 = T1
v1v2
k−1
(3.6)
where k =Cp
Cv. Note that v2 = v2 and v1/v2 = v1/v2 = r.
For given values of T1, p1 and r, the magnitude of T2 depends on k. Con-stant volume combustion, from point 2 will give a temperature T3 insteadof T3. This is due to the fact that the rise in the value of Cv because ofvariable specific heat, which reduces the temperature as already explained.
The process, 2 →3 is heat addition with the variation in specific heat.From 3 , if expansion takes place at constant specific heats, this would resultin the process 3 →4 whereas actual expansion due to variable specific heat
Fuel–Air Cycles and their Analysis 111
will result in 3 →4 and 4 is higher than 4 . The magnitude in the differencebetween 4 and 4 is proportional to the reduction in the value of γ.
Consider the process 3 4
T4 = T3
v3v4
(k−1)
(3.7)
for the process 3 4
T4 = T3
v3v4
(γ−1)
(3.8)
Reduction in the value of k due to variable specific heat results in increaseof temperature from T4 to T4 .
3.5 DISSOCIATION
Dissociation process can be considered as the disintegration of combustionproducts at high temperature. Dissociation can also be looked as the reverseprocess to combustion. During dissociation the heat is absorbed whereasduring combustion the heat is liberated. In IC engines, mainly dissociationof CO2 into CO and O2 occurs, whereas there is a very little dissociation ofH2O.
The dissociation of CO2 into CO and O2 starts commencing around 1000◦C and the reaction equation can be written as
CO2 2CO + O2
Similarly, the dissociation of H2O occurs at temperatures above 1300 ◦C andis written as
H2O 2H2 + O2
The presence of CO and O2 in the gases tends to prevent dissociation ofCO2; this is noticeable in a rich fuel mixture, which, by producing more CO,suppresses dissociation of CO2. On the other hand, there is no dissociation inthe burnt gases of a lean fuel-air mixture. This is mainly due to the fact thatthe temperature produced is too low for this phenomenon to occur. Hence, themaximum extent of dissociation occurs in the burnt gases of the chemicallycorrect fuel-air mixture when the temperatures are expected to be high butdecreases with the leaner and richer mixtures.
In case of internal combustion engines heat transfer to the cooling mediumcauses a reduction in the maximum temperature and pressure. As the temper-ature falls during the expansion stroke the separated constituents recombine;the heat absorbed during dissociation is thus again released, but it is too latein the stroke to recover entirely the lost power. A portion of this heat iscarried away by the exhaust gases.
Figure 3.2 shows a typical curve that indicates the reduction in the temper-ature of the exhaust gas mixtures due to dissociation with respect to air-fuelratio. With no dissociation maximum temperature is attained at chemically
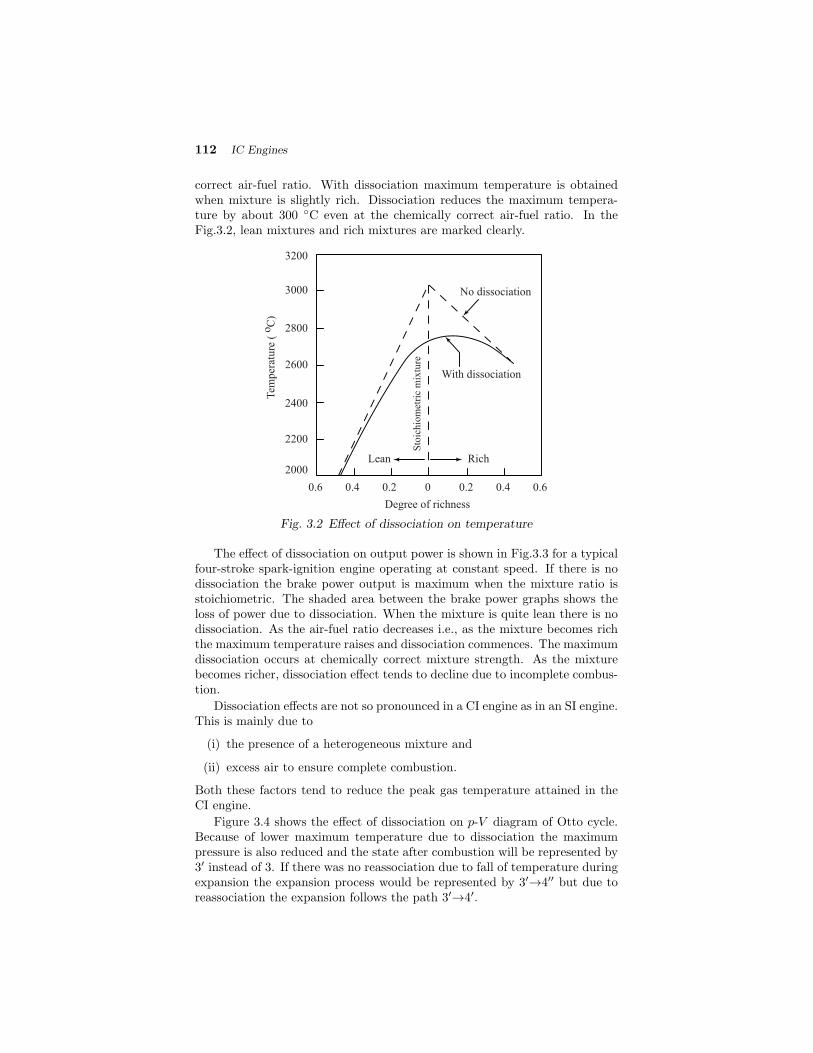
112 IC Engines
correct air-fuel ratio. With dissociation maximum temperature is obtainedwhen mixture is slightly rich. Dissociation reduces the maximum tempera-ture by about 300 ◦C even at the chemically correct air-fuel ratio. In theFig.3.2, lean mixtures and rich mixtures are marked clearly.
Sto
ich
iom
etri
c m
ixtu
re
With dissociation
Degree of richness
No dissociation
0.6 0.4 0.2 0 0.2 0.4 0.6
Tem
per
atu
re (
C
)o
2000
2200
2400
2600
2800
3000
3200
RichLean
Fig. 3.2 Effect of dissociation on temperature
The effect of dissociation on output power is shown in Fig.3.3 for a typicalfour-stroke spark-ignition engine operating at constant speed. If there is nodissociation the brake power output is maximum when the mixture ratio isstoichiometric. The shaded area between the brake power graphs shows theloss of power due to dissociation. When the mixture is quite lean there is nodissociation. As the air-fuel ratio decreases i.e., as the mixture becomes richthe maximum temperature raises and dissociation commences. The maximumdissociation occurs at chemically correct mixture strength. As the mixturebecomes richer, dissociation effect tends to decline due to incomplete combus-tion.
Dissociation effects are not so pronounced in a CI engine as in an SI engine.This is mainly due to
(i) the presence of a heterogeneous mixture and
(ii) excess air to ensure complete combustion.
Both these factors tend to reduce the peak gas temperature attained in theCI engine.
Figure 3.4 shows the effect of dissociation on p-V diagram of Otto cycle.Because of lower maximum temperature due to dissociation the maximumpressure is also reduced and the state after combustion will be represented by3 instead of 3. If there was no reassociation due to fall of temperature duringexpansion the expansion process would be represented by 3 →4 but due toreassociation the expansion follows the path 3 →4 .

Fuel–Air Cycles and their Analysis 113
11 12 13 14 15 16 17 18 19 20 21
Air-fuel ratio
bp with no dissociation
Rich Leanm
ixtu
re
Sto
ich
iom
etri
c sfc
bp
Bra
ke
pow
er
Spec
ific
fuel
consu
mpti
on
Fig. 3.3 Effect of dissociation on power
p
V
2
3'
3
1
44'4"
Fig. 3.4 Effect of dissociation shown on a p-V diagram
By comparing with the ideal expansion 3→4, it is observed that the effectof dissociation is to lower the temperature and consequently the pressure atthe beginning of the expansion stroke. This causes a loss of power and alsoefficiency. Though during recombining the heat is given back it is too late tocontribute a convincing positive increase in the output of the engine.
3.6 EFFECT OF NUMBER OF MOLES
As already mentioned the number of molecules present in the cylinder aftercombustion depends upon the fuel-air ratio, type and extend of reaction inthe cylinder. According to the gas law
pV = N R T

114 IC Engines
the pressure depends on the number of molecules or moles present. This hasdirect effect on the amount of work the cylinder gases can impart on thepiston.
3.7 COMPARISON OF AIR–STANDARD AND FUEL–AIR CYCLES
In this section reasons for difference between air-standard cycles and fuel-aircycles is discussed. The magnitude of difference between the two cycles canbe attributed to the following factors :
(i) character of the cycle (due to assumptions)
(ii) equivalence ratio (actual F/A ÷ stoichiometric F/A)
(iii) chemical composition of the fuel
Figure 3.5 shows variation of efficiency with mixture strength of fuel-aircycle relative to that of air cycle showing the gain in efficiency as the mixturebecomes leaner. It is seen from Fig.3.5 that the efficiency ratio (fuel-air cy-cle efficiency/air-standard cycle efficiency) increases as the mixture becomesleaner and leaner tending towards the air-standard cycle efficiency. It is to benoted that this, trend exists at all compression ratios.
0 0.4 0.8 1.2 1.6
1.0
0.8
0.6
0.2
Eff
icie
ncy
rat
io
Relative fuel-air ratio
Fig. 3.5 Effect of relative fuel-air ratio on efficiency ratio
At very low fuel-air ratio the mixture would tend to behave like a perfectgas with constant specific heat. Cycles with lean to very lean mixtures tendtowards air-standard cycles. In such cycles the pressure and temperaturerises. Some of the chemical reactions involved tend to be more complete asthe pressure increases. These considerations apply to constant-volume as wellas constant-pressure cycles.
The simple air-standard cycle analysis cannot predict the variation of ther-mal efficiency with mixture strength since air is assumed to be the workingmedium. However, fuel-air cycle analysis suggests that the thermal efficiency

Fuel–Air Cycles and their Analysis 115
will deteriorate as the mixture supplied to an engine is enriched. This is ex-plained by the increasing losses due to variable specific heats and dissociationas the mixture strength approaches chemically correct values. This is be-cause, the gas temperature goes up after combustion as the mixture strengthapproaches chemically correct values. Enrichment beyond the chemically cor-rect ratio will lead to incomplete combustion and loss in thermal efficiency.Therefore, it will appear that thermal efficiency will increase as the mixtureis made leaner. However, beyond a certain leaning, the combustion becomeserratic with loss of efficiency. Thus the maximum efficiency is within the leanzone very near the stoichiometric ratio. This gives rise to combustion loop,as shown in Fig.3.6 which can be plotted for different mixture strengths foran engine running at constant speed and at a constant throttle setting. Thisloop gives an idea about the effect of mixture strength on the specific fuelconsumption.
EnrichAir standard theory
Actu
al curv
e
Fuel-air th
eory
Lean mixture
Rich mixture
Stoichiometric mixture
Spec
ific
fuel
consu
mpti
on
min. max. mepmep mep
Fig. 3.6 Specific fuel consumption vs. mean effective pressure at constantspeed and constant throttle setting
3.8 EFFECT OF OPERATING VARIABLES
The effect of the common engine operating variables on the pressure andtemperature within the engine cylinder is better understood by fuel-air cycleanalysis. The details are discussed in the following sections.
3.8.1 Compression Ratio
The fuel-air cycle efficiency increases with the compression ratio in the samemanner as the air-standard cycle efficiency, principally for the same reason(more scope of expansion work). This is shown in Fig.3.7.
The variation of indicated thermal efficiency with respect to the equiva-lence ratio for various compression ratios is given in Fig.3.8 The equivalenceratio, φ, is defined as ratio of actual fuel-air ratio to chemically correct fuel-air

116 IC Engines
4 6 8 10
Compression ratio
Ther
mal
eff
icie
ncy
(%
)
60
50
40
30
20
140
120
10090
Air standard
Percen
tage of theoretical fuel
Fig. 3.7 Effect of compression ratio and mixture strength on efficiency
0.4 0.6 0.8 1.0 1.2 1.4 1.6
0.25
0.30
0.35
0.40
0.45
0.50
Indic
ated
ther
mal
eff
icie
ncy
0.55
0.60
0.65
7
8
9
10
12
14
16
18
22
Equivalence ratio
Sto
ichio
met
ric
Lean Rich
r = 6
Fig. 3.8 Effect of mixture strength on thermal efficiencyfor various compression ratios

Fuel–Air Cycles and their Analysis 117
ratio on mass basis. The maximum pressure and maximum temperature in-crease with compression ratio since the temperature, T2, and pressure, p2, atthe end of compression are higher. However, it can be noted from the experi-mental results (Fig.3.9) that the ratio of fuel-air cycle efficiency to air-standardefficiency is independent of the compression ratio for a given equivalence ratiofor the constant-volume fuel-air cycle.
3.8.2 Fuel–Air Ratio
(i) Efficiency : As the mixture is made lean (less fuel) the temperature risedue to combustion will be lowered as a result of reduced energy inputper unit mass of mixture. This will result in lower specific heat. Further,it will lower the losses due to dissociation and variation in specific heat.The efficiency is therefore, higher and, in fact, approaches the air-cycleefficiency as the fuel-air ratio is reduced as shown in Fig.3.10.
Equivalence ratio
Fuel
-air
cycl
e ef
fici
ency
/
Air
-sta
ndar
d e
ffic
iency
0 0.4 0.8 1.2 1.6 2.0 2.4
0.4
0.5
0.6
0.7
0.8
0.9
1.0
r = 4
r = 6
r = 8
r = 10
Rich
p = p = 1.03 bar1 e
T = 289 K1
Fig. 3.9 Variation of efficiency with mixture strength for a constant volumefuel-air cycle
Mixture strength
Air-standard theory
Fuel-air theory
Sto
ic hio
met
ric
Ther
mal
eff
icie
ncy
RichWeak
mix
t u
re
Actual variation
Fig. 3.10 Effect of mixture strength on thermal efficiency
(ii) Maximum Power : Fuel-air ratio affects the maximum power outputof the engine. The variation is as shown in Fig.3.11. As the mixture
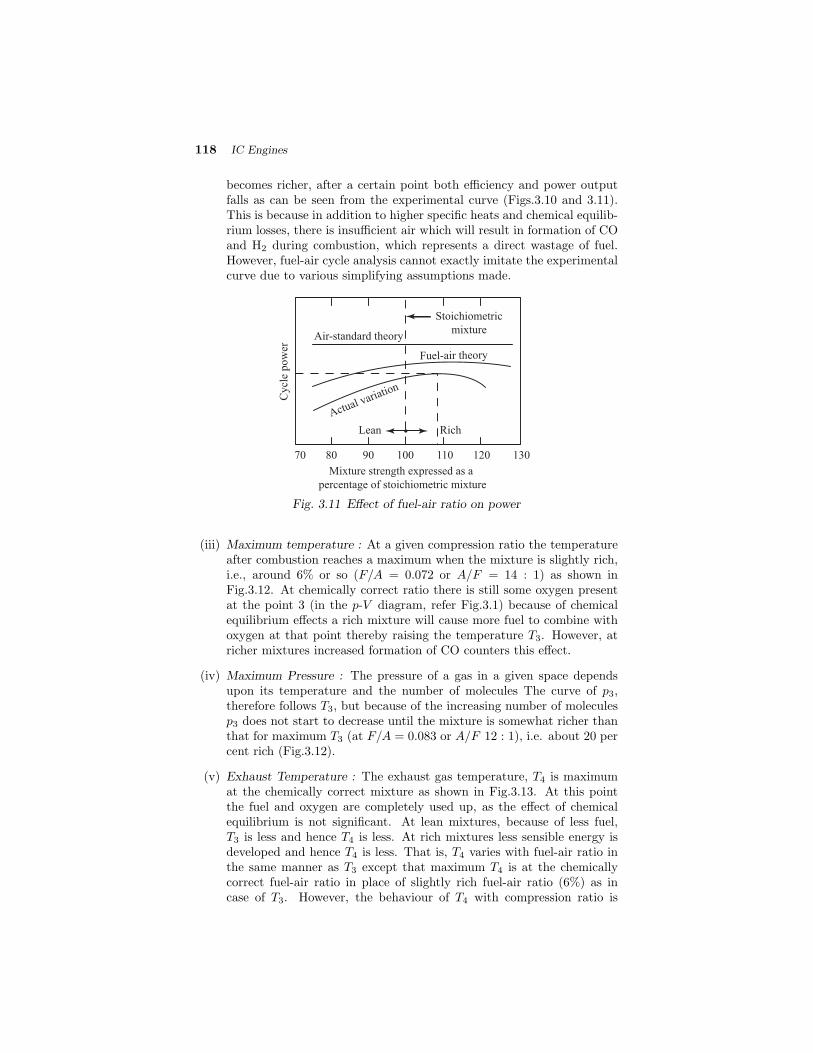
118 IC Engines
becomes richer, after a certain point both efficiency and power outputfalls as can be seen from the experimental curve (Figs.3.10 and 3.11).This is because in addition to higher specific heats and chemical equilib-rium losses, there is insufficient air which will result in formation of COand H2 during combustion, which represents a direct wastage of fuel.However, fuel-air cycle analysis cannot exactly imitate the experimentalcurve due to various simplifying assumptions made.
Mixture strength expressed as a
percentage of stoichiometric mixture
Fuel-air theory
Actual variation
Cycl
e pow
er
RichLean
70 80 90 100 110 120 130
Air-standard theory
Stoichiometric
mixture
Fig. 3.11 Effect of fuel-air ratio on power
(iii) Maximum temperature : At a given compression ratio the temperatureafter combustion reaches a maximum when the mixture is slightly rich,i.e., around 6% or so (F/A = 0.072 or A/F = 14 : 1) as shown inFig.3.12. At chemically correct ratio there is still some oxygen presentat the point 3 (in the p-V diagram, refer Fig.3.1) because of chemicalequilibrium effects a rich mixture will cause more fuel to combine withoxygen at that point thereby raising the temperature T3. However, atricher mixtures increased formation of CO counters this effect.
(iv) Maximum Pressure : The pressure of a gas in a given space dependsupon its temperature and the number of molecules The curve of p3,therefore follows T3, but because of the increasing number of moleculesp3 does not start to decrease until the mixture is somewhat richer thanthat for maximum T3 (at F/A = 0.083 or A/F 12 : 1), i.e. about 20 percent rich (Fig.3.12).
(v) Exhaust Temperature : The exhaust gas temperature, T4 is maximumat the chemically correct mixture as shown in Fig.3.13. At this pointthe fuel and oxygen are completely used up, as the effect of chemicalequilibrium is not significant. At lean mixtures, because of less fuel,T3 is less and hence T4 is less. At rich mixtures less sensible energy isdeveloped and hence T4 is less. That is, T4 varies with fuel-air ratio inthe same manner as T3 except that maximum T4 is at the chemicallycorrect fuel-air ratio in place of slightly rich fuel-air ratio (6%) as incase of T3. However, the behaviour of T4 with compression ratio is
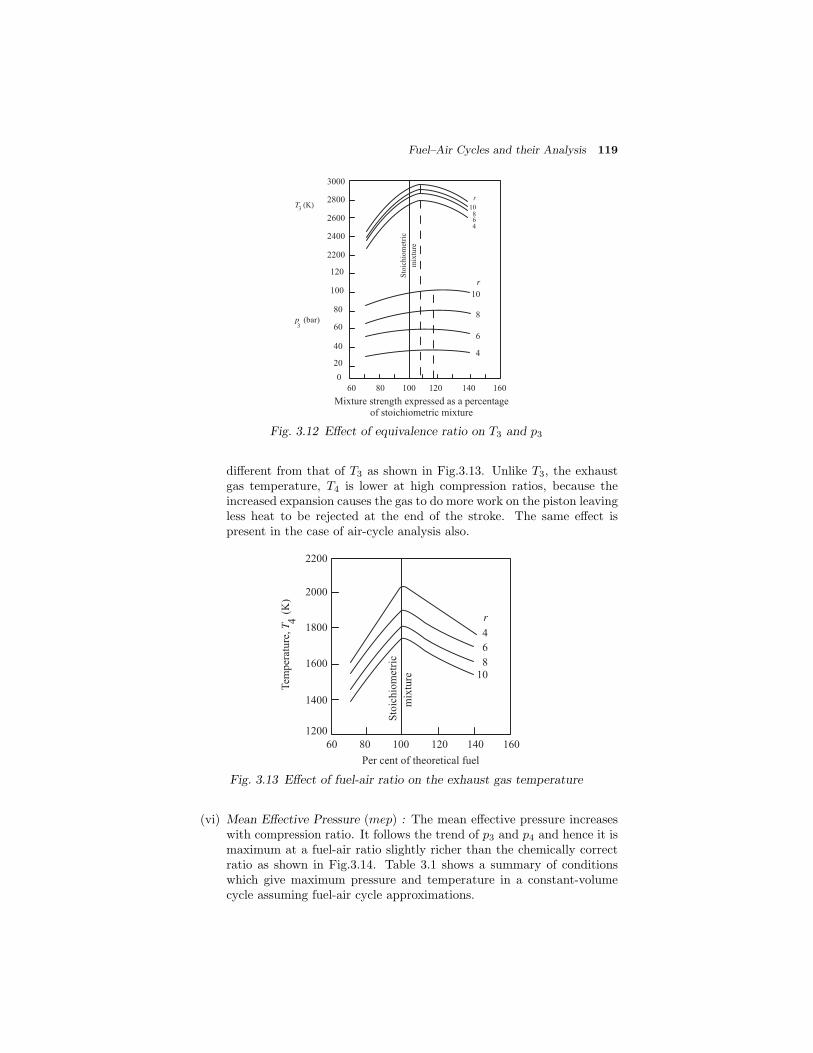
Fuel–Air Cycles and their Analysis 119
60 80 100 120 140 160
Mixture strength expressed as a percentage of stoichiometric mixture
3000
2800
2600
2400
2200
120
100
80
60
40
20
0
p (bar)3
T (K)3 10
6
10
8
6
4
r
8
4
r
Sto
ichio
met
ric
mix
ture
Fig. 3.12 Effect of equivalence ratio on T3 and p3
different from that of T3 as shown in Fig.3.13. Unlike T3, the exhaustgas temperature, T4 is lower at high compression ratios, because theincreased expansion causes the gas to do more work on the piston leavingless heat to be rejected at the end of the stroke. The same effect ispresent in the case of air-cycle analysis also.
Sto
ich
iom
etri
c
mix
ture
60 80 100 120 140 160
Per cent of theoretical fuel
2200
2000
1800
1600
1400
1200
108
6
4
r
Tem
per
atu
re, T
(
K)
4
Fig. 3.13 Effect of fuel-air ratio on the exhaust gas temperature
(vi) Mean Effective Pressure (mep) : The mean effective pressure increaseswith compression ratio. It follows the trend of p3 and p4 and hence it ismaximum at a fuel-air ratio slightly richer than the chemically correctratio as shown in Fig.3.14. Table 3.1 shows a summary of conditionswhich give maximum pressure and temperature in a constant-volumecycle assuming fuel-air cycle approximations.
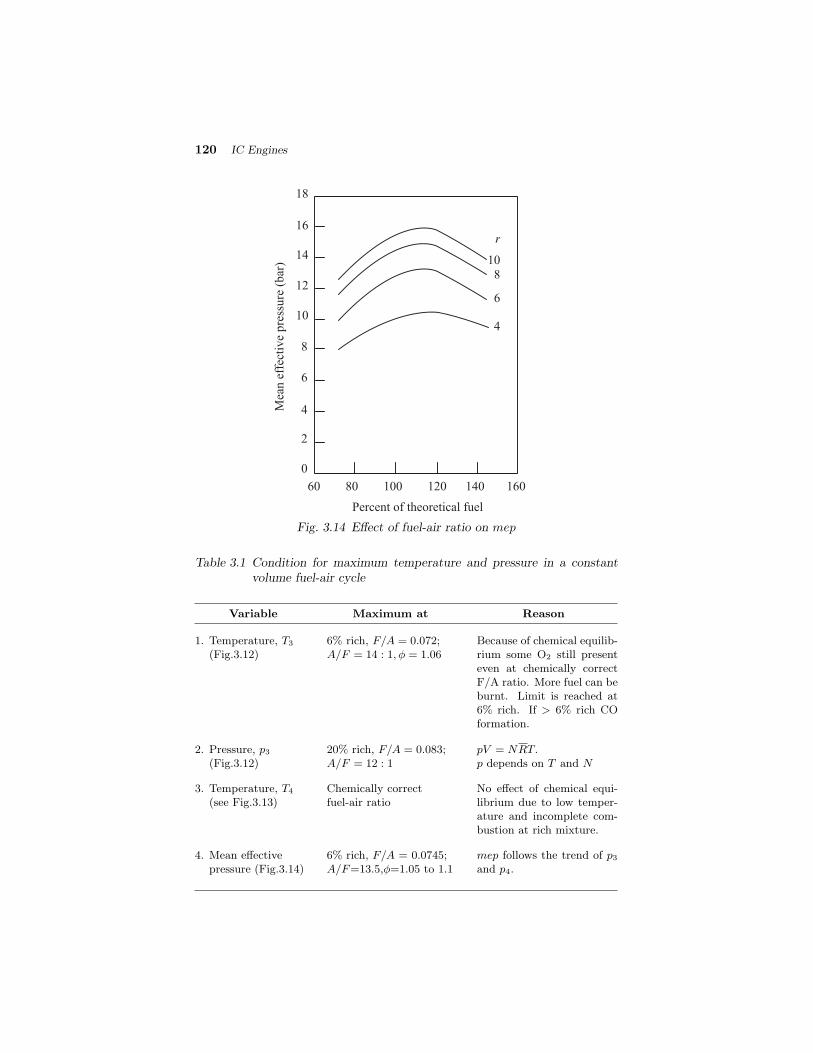
120 IC Engines
60 80 100 120 140 160
Percent of theoretical fuel
10
8
6
4
r
Mea
n e
ffec
tive
pre
ssure
(bar
)
2
14
12
10
8
6
4
0
16
18
Fig. 3.14 Effect of fuel-air ratio on mep
Table 3.1 Condition for maximum temperature and pressure in a constantvolume fuel-air cycle
Variable Maximum at Reason
1. Temperature, T3(Fig.3.12)
6% rich, F/A = 0.072;A/F = 14 : 1, φ = 1.06
Because of chemical equilib-rium some O2 still presenteven at chemically correctF/A ratio. More fuel can beburnt. Limit is reached at6% rich. If > 6% rich COformation.
2. Pressure, p3(Fig.3.12)
20% rich, F/A = 0.083;A/F = 12 : 1
pV = NRT.p depends on T and N
3. Temperature, T4(see Fig.3.13)
Chemically correctfuel-air ratio
No effect of chemical equi-librium due to low temper-ature and incomplete com-bustion at rich mixture.
4. Mean effectivepressure (Fig.3.14)
6% rich, F/A = 0.0745;A/F=13.5,φ=1.05 to 1.1
mep follows the trend of p3and p4.

Fuel–Air Cycles and their Analysis 121
Worked out Examples
3.1 What will be the effect on the efficiency of an Otto cycle having acompression ratio of 8, if Cv increases by 1.6%?
Solution
ηOtto = 1− 1
rγ−1
Cp − Cv = R ;Cp
Cv= γ and γ − 1 =
R
Cv
η = 1−
1
r
R/Cv
1− η = r−R/Cv
ln(1− η) =−R
Cvln r
Differentiating
− 1
1− ηdη =
R
C2v
ln rdCv
dη = − (1− η)R ln r
C2v
dCv
dη
η= − (1− η)(γ − 1) ln r
η
dCv
Cv
η = 1−
1
8
0.4= 0.565 = 56.5%
dη
η= − (1− 0.565)× (1.4− 1)× ln 8
0.565× 1.6
100
= −1.025%Ans⇐=
3.2 What will be the effect on the efficiency of a diesel cycle having a com-pression ratio of 20 and a cut-off ratio is 5% of the swept volume, if theCv increases by 1%. Take Cv = 0.717 and R = 0.287 kJ/kg K.
Solution
ηDiesel = 1−
1
r
γ−1 1
γ
rγc − 1
rc − 1
1− η =1
γ
rγc − 1
rγ−1(rc − 1)
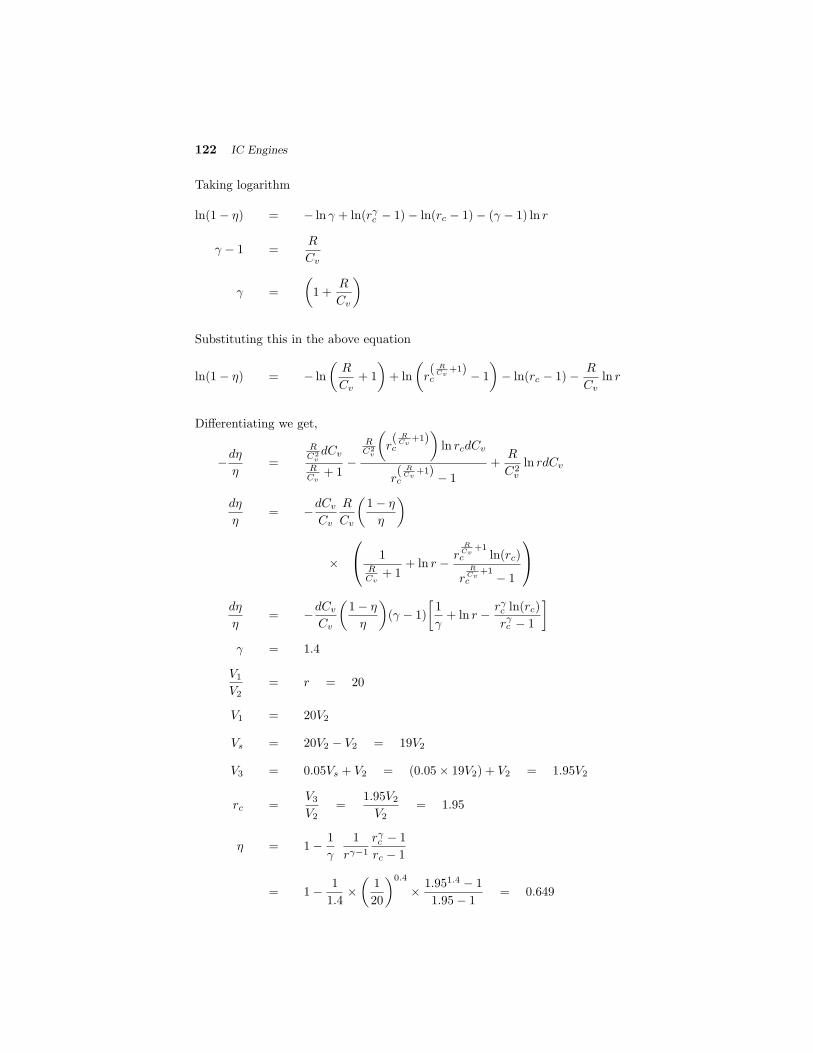
122 IC Engines
Taking logarithm
ln(1− η) = − ln γ + ln(rγc − 1)− ln(rc − 1)− (γ − 1) ln r
γ − 1 =R
Cv
γ =
1 +
R
Cv
Substituting this in the above equation
ln(1− η) = − ln
R
Cv+ 1
+ ln
r( RCv
+1)c − 1
− ln(rc − 1)− R
Cvln r
Differentiating we get,
−dη
η=
RC2vdCv
RCv
+ 1−
RC2v
r( RCv
+1)c
ln rcdCv
r( RCv
+1)c − 1
+R
C2v
ln rdCv
dη
η= −dCv
Cv
R
Cv
1− η
η
×⎛⎝ 1
RCv
+ 1+ ln r − r
RCv
+1c ln(rc)
rRCv
+1c − 1
⎞⎠
dη
η= −dCv
Cv
1− η
η
(γ − 1)
1
γ+ ln r − rγc ln(rc)
rγc − 1
γ = 1.4
V1V2
= r = 20
V1 = 20V2
Vs = 20V2 − V2 = 19V2
V3 = 0.05Vs + V2 = (0.05× 19V2) + V2 = 1.95V2
rc =V3V2
=1.95V2
V2= 1.95
η = 1− 1
γ
1
rγ−1
rγc − 1
rc − 1
= 1− 1
1.4×
1
20
0.4× 1.951.4 − 1
1.95− 1= 0.649
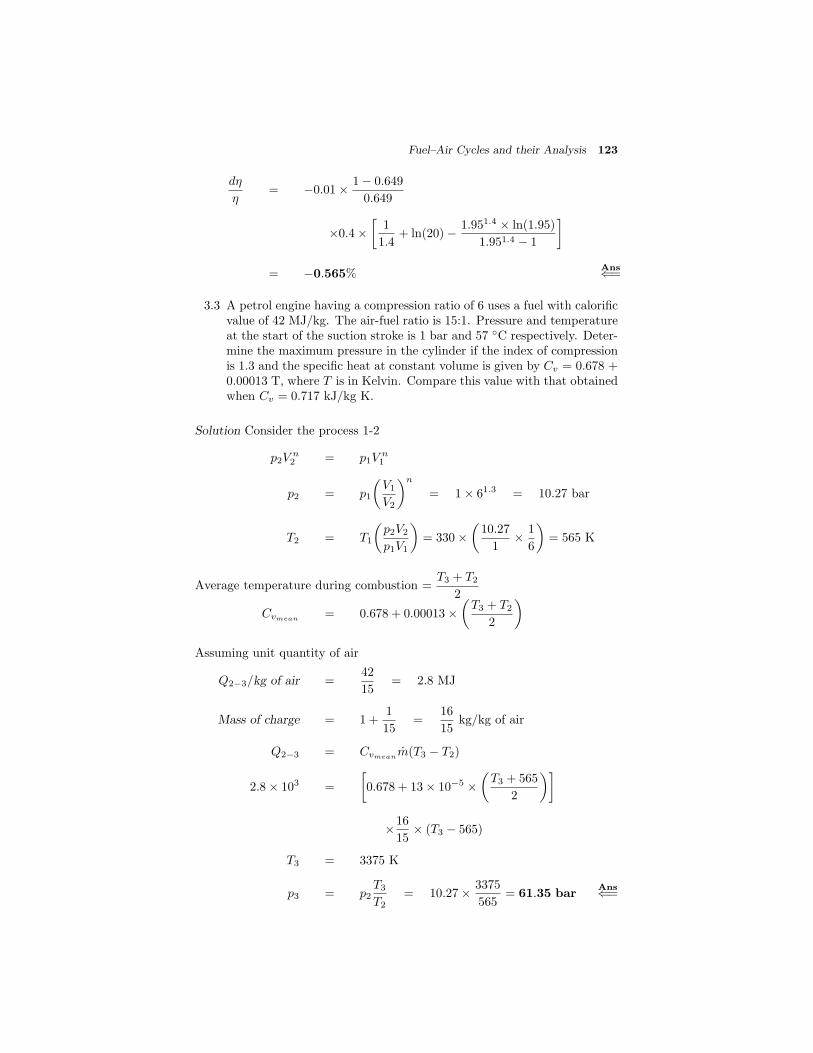
Fuel–Air Cycles and their Analysis 123
dη
η= −0.01× 1− 0.649
0.649
×0.4×
1
1.4+ ln(20)− 1.951.4 × ln(1.95)
1.951.4 − 1
= −0.565%Ans⇐=
3.3 A petrol engine having a compression ratio of 6 uses a fuel with calorificvalue of 42 MJ/kg. The air-fuel ratio is 15:1. Pressure and temperatureat the start of the suction stroke is 1 bar and 57 ◦C respectively. Deter-mine the maximum pressure in the cylinder if the index of compressionis 1.3 and the specific heat at constant volume is given by Cv = 0.678 +0.00013 T, where T is in Kelvin. Compare this value with that obtainedwhen Cv = 0.717 kJ/kg K.
Solution Consider the process 1-2
p2Vn2 = p1V
n1
p2 = p1
V1V2
n
= 1× 61.3 = 10.27 bar
T2 = T1
p2V2p1V1
= 330×
10.27
1× 1
6
= 565 K
Average temperature during combustion =T3 + T2
2
Cvmean= 0.678 + 0.00013×
T3 + T2
2
Assuming unit quantity of air
Q2−3/kg of air =42
15= 2.8 MJ
Mass of charge = 1 +1
15=
16
15kg/kg of air
Q2−3 = Cvmeanm(T3 − T2)
2.8× 103 =
0.678 + 13× 10−5 ×
T3 + 565
2
×16
15× (T3 − 565)
T3 = 3375 K
p3 = p2T3T2
= 10.27× 3375
565= 61.35 bar
Ans⇐=

124 IC Engines
For constant specific heat
2.8× 103 = 0.717× 16
15× (T3 − 565)
T3 = 4226
p3 = 10.27× 4226
565= 76.81 bar
Ans⇐=
3.4 The air-fuel ratio of a Diesel engine is 29:1. If the compression ratio is16:1 and the temperature at the end of compression is 900 K, find atwhat cylinder volume the combustion is complete? Express this volumeas a percentage of stroke. Assume that the combustion begins at the topdead centre and takes place at constant pressure. Take calorific value ofthe fuel as 42000 kJ/kg, R = 0.287 kJ/kg K and Cv = 0.709+0.000028 TkJ/kg K.
Solution
Cp = Cv + R
= (0.709 + 0.000028 T ) + 0.287
= 0.996 + 0.000028 T
dQ = mCpdT
For unit mass, Q =
3
2
CpdT
For 1 kg of fuel the total charge is 30 kg
Q =CV
30=
42000
30= 1400
=
3
2
(0.996 + 0.000028 T )dT
= 0.996(T3 − T2) +0.000028
2
T 23 − T 2
2
= 0.996× (T3 − 900) + 0.000014× T 2
3 − 9002
T3 = 2246.07 K
V3 =T3T2
V2 =2246.07
900V2 = 2.496 V2
Vs = V1 − V2 = V2
V1V2− 1
= V2(r − 1) = 15 V2
V3Vs
=2.496× V2
15× V2× 100 = 16.64%
Ans⇐=

Fuel–Air Cycles and their Analysis 125
3.5 An oil engine, working on the dual combustion cycle, has a compressionratio of 13:1. The heat supplied per kg of air is 2000 kJ, half of which issupplied at constant volume and the other half at constant pressure. Ifthe temperature and pressure at the beginning of compression are 100◦C and 1 bar respectively, find (i) the maximum pressure in the cycleand (ii) the percentage of stroke when cut-off occurs. Assume γ = 1.4,R = 0.287 kJ/kg K and Cv = 0.709 + 0.000028T kJ/kg K.
Solution
p1Vγ1 = p2V
γ2
p2 = p2
V1V2
γ
= 1× 105 × 131.4 = 36.27× 10⁵ N/m2
T1V(γ−1)1 = T2V
γ−12
T2 = T1r(γ−1) = 373× 130.4 = 1040.6 K
For unit mass :Consider the process 2-3,
Q2−3 =1
2× 2000 = 1000 kJ
Q2−3 = m
3
2
(0.709 + 0.000028T )dT
1000 = 0.709× (T3 − 1040.6) +0.000028
2× T 2
3 − 1040.62
T3 = 2362.2 K
p3 = p2
T3T2
= 36.27×
2362.2
1040.6
× 105
= 82.34× 10⁵ N/m2 Ans⇐=
Consider the process 3-4,
Q3−4 =1
2× 1000 = 500 kJ
Cp = Cv + R = 0.996 + 0.000028 T
Q3−4 = m
4
3
dT
500 =
4
3
(0.996 + 0.000028)dT
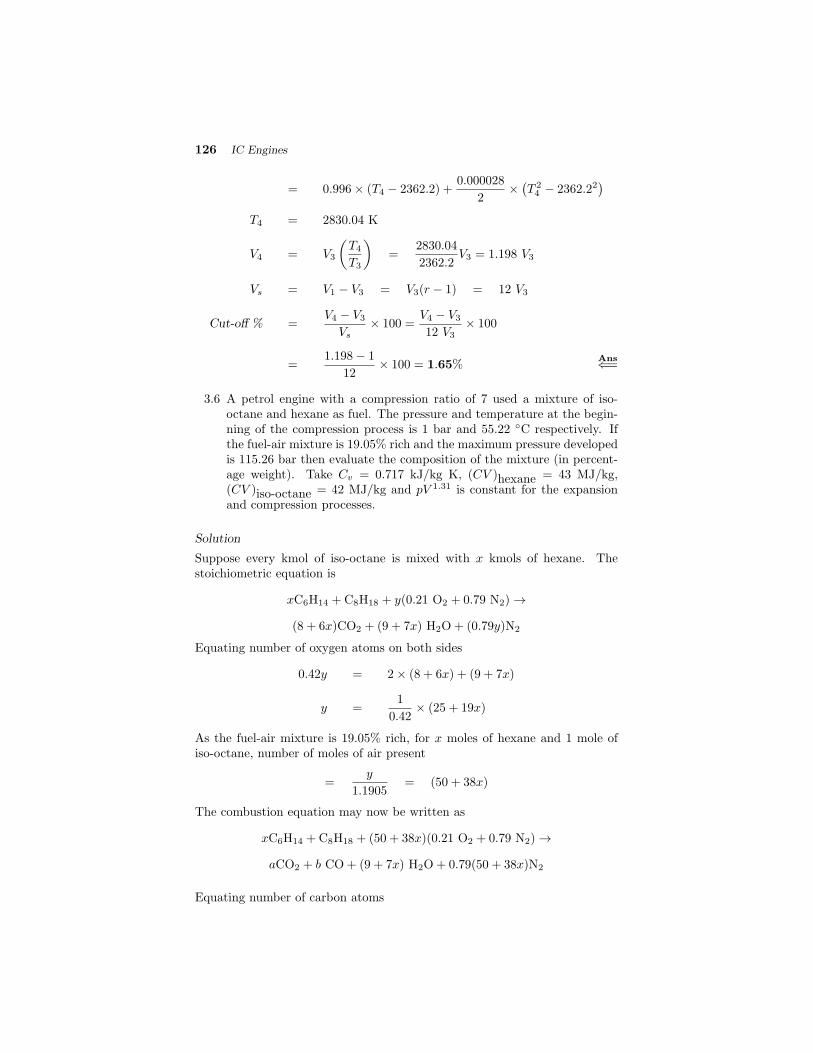
126 IC Engines
= 0.996× (T4 − 2362.2) +0.000028
2× T 2
4 − 2362.22
T4 = 2830.04 K
V4 = V3
T4T3
=
2830.04
2362.2V3 = 1.198 V3
Vs = V1 − V3 = V3(r − 1) = 12 V3
Cut-off % =V4 − V3
Vs× 100 =
V4 − V312 V3
× 100
=1.198− 1
12× 100 = 1.65%
Ans⇐=
3.6 A petrol engine with a compression ratio of 7 used a mixture of iso-octane and hexane as fuel. The pressure and temperature at the begin-ning of the compression process is 1 bar and 55.22 ◦C respectively. Ifthe fuel-air mixture is 19.05% rich and the maximum pressure developedis 115.26 bar then evaluate the composition of the mixture (in percent-age weight). Take Cv = 0.717 kJ/kg K, (CV )hexane = 43 MJ/kg,(CV )iso-octane = 42 MJ/kg and pV 1.31 is constant for the expansionand compression processes.
Solution
Suppose every kmol of iso-octane is mixed with x kmols of hexane. Thestoichiometric equation is
xC6H14 + C8H18 + y(0.21 O2 + 0.79 N2) →
(8 + 6x)CO2 + (9 + 7x) H2O + (0.79y)N2
Equating number of oxygen atoms on both sides
0.42y = 2× (8 + 6x) + (9 + 7x)
y =1
0.42× (25 + 19x)
As the fuel-air mixture is 19.05% rich, for x moles of hexane and 1 mole ofiso-octane, number of moles of air present
=y
1.1905= (50 + 38x)
The combustion equation may now be written as
xC6H14 + C8H18 + (50 + 38x)(0.21 O2 + 0.79 N2) →
aCO2 + b CO + (9 + 7x) H2O + 0.79(50 + 38x)N2
Equating number of carbon atoms
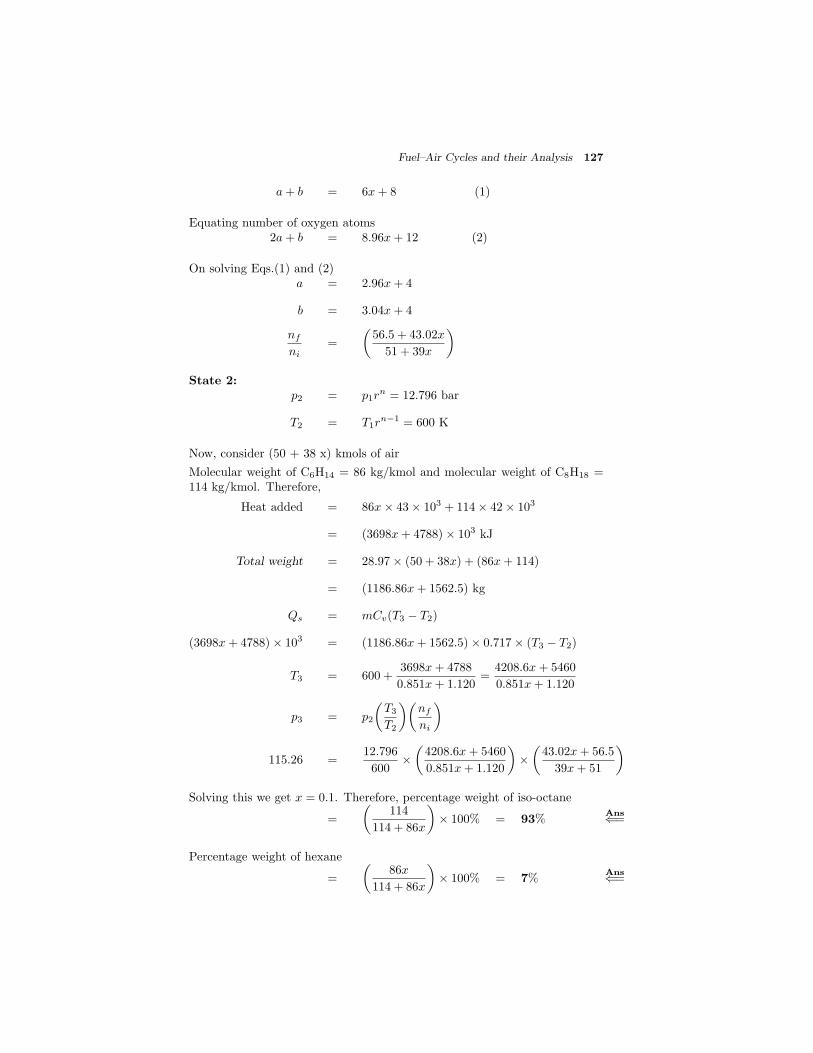
Fuel–Air Cycles and their Analysis 127
a + b = 6x + 8 (1)
Equating number of oxygen atoms2a + b = 8.96x + 12 (2)
On solving Eqs.(1) and (2)a = 2.96x + 4
b = 3.04x + 4
nf
ni=
56.5 + 43.02x
51 + 39x
State 2:p2 = p1r
n = 12.796 bar
T2 = T1rn−1 = 600 K
Now, consider (50 + 38 x) kmols of air
Molecular weight of C6H14 = 86 kg/kmol and molecular weight of C8H18 =114 kg/kmol. Therefore,
Heat added = 86x× 43× 103 + 114× 42× 103
= (3698x + 4788)× 103 kJ
Total weight = 28.97× (50 + 38x) + (86x + 114)
= (1186.86x + 1562.5) kg
Qs = mCv(T3 − T2)
(3698x + 4788)× 103 = (1186.86x + 1562.5)× 0.717× (T3 − T2)
T3 = 600 +3698x + 4788
0.851x + 1.120=
4208.6x + 5460
0.851x + 1.120
p3 = p2
T3T2
nf
ni
115.26 =12.796
600×
4208.6x + 5460
0.851x + 1.120
×
43.02x + 56.5
39x + 51
Solving this we get x = 0.1. Therefore, percentage weight of iso-octane
=
114
114 + 86x
× 100% = 93%
Ans⇐=
Percentage weight of hexane
=
86x
114 + 86x
× 100% = 7%
Ans⇐=
128 IC Engines
Review Questions
3.1 Mention the various simplified assumptions used in fuel-air cycle anal-ysis.
3.2 What is the difference between air-standard cycle and fuel-air cycle anal-ysis? Explain the significance of the fuel-air cycle.
3.3 Explain why the fuel-air cycle analysis is more suitable for analyzingthrough a computer rather than through hand calculations.
3.4 How do the specific heats vary with temperature? What is the physicalexplanation for this variation?
3.5 Explain with the help of a p-V diagram the loss due to variation ofspecific heats in an Otto cycle.
3.6 Show with the help of a p-V diagram for an Otto cycle, that the effectof dissociation is similar to that of variation of specific heats.
3.7 Explain by means of suitable graphs the effect of dissociation on maxi-mum temperature and brake power. How does the presence of CO affectdissociation?
3.8 Explain the effect of change of number of molecules during combustionon maximum pressure in the Otto cycle.
3.9 Compare the air-standard cycle and fuel-air cycles based on (i) characterof the cycle (ii) fuel-air ratio (iii) chemical composition of the fuel
3.10 Is the effect of compression ratio on efficiency the same in fuel-air cyclesalso? Explain.
3.11 From the point of view of fuel-air cycle analysis how does fuel-air ratioaffect efficiency, maximum power, temperature and pressure in a cycle.
3.12 How does exhaust temperature and mean effective pressure affect theengine performance? Explain.
Exercise
3.1 Find the percentage change in the efficiency of an Otto cycle having acompression ratio of 10, if Cv decreases by 2%. Ans: 1.22%
3.2 Find the percentage increase in the efficiency of a Diesel cycle having acompression ratio of 16 and cut-off ratio is 10% of the swept volume, ifCv decreases by 2%. Take Cv = 0.717 and γ = 1.4. Ans: 1.23%
3.3 The air-fuel ratio of a Diesel engine is 31:1. If the compression ratio is15:1 and the temperature at the end of compression is 1000 K, find atwhat percentage of stroke is the combustion complete if the combustionbegins at TDC and continuous at constant pressure. Calorific value ofthe fuel is 40000 kJ/kg. Assume the variable specific heat, Cp = a+ bT ,where a = 1 and b = 0.28× 10⁻⁴. Ans: 15.68%

Fuel–Air Cycles and their Analysis 129
3.4 An engine working on the Otto cycle, uses hexane (C6H14) as fuel. Theengine works on chemically correct air-fuel ratio and the compressionratio is 8. Pressure and temperature at the beginning of compressionare 1 bar and 77 ◦C respectively. If the calorific value of the fuel is43000 kJ/kg and Cv = 0.717 kJ/kg K, find the maximum temperatureand pressure of the cycle. Assume the compression follows the lawpV 1.3 = c. Ans: (i) 4343.6 K (ii) 99.28 bar
3.5 Find the percentage change in efficiency of a dual cycle having com-pression ratio = 16 and cut-off ratio of 10% of swept volume and if Cv
increases by 2%. Given T3T2
= 1.67. Ans: 0.68%
3.6 It is estimated that for air operating in a given engine the γ decreasesby 2% from its original value of 1.4. Find the change in efficiency. Thepressure at the end of compression is 18 bar. Ans: 4.5%
Multiple Choice Questions (choose the most appropriate answer)
1. The actual efficiency of a good engine is about
(a) 100%
(b) 85%
(c) 50%
(d) 25%
of the estimated fuel-air cycle efficiency.
2. With dissociation peak temperature is obtained
(a) at the stoichiometric air-fuel ratio
(b) when the mixture is slightly lean
(c) when the mixture is slightly rich
(d) none of the above
3. With dissociation the exhaust gas temperature
(a) decreases
(b) increases
(c) no effect
(d) increases upto certain air-fuel ratio and then decreases
4. Fuel-air ratio affects maximum power output of the engine due to
(a) higher specific heats
(b) chemical equilibrium losses
(c) both (a) and (b)
(d) none of the above

130 IC Engines
5. Mean effective pressure at a given compression ratio is maximum whenthe air-fuel ratio is
(a) higher than stoichiometric
(b) lower than stoichiometric
(c) equal to stoichiometric
(d) none of the above
6. For a compression process with variable specific heat the peak temper-ature and pressure are
(a) lower
(b) higher
(c) no effect
(d) none of the above
compared to constant specific heat
7. Dissociation can be considered as
(a) disintegration of combustion products at high temperature
(b) reverse process of combustion
(c) heat absorption process
(d) all of the above
8. Cycles with lean to very lean mixture tend towards
(a) practical cycles
(b) fuel-air cycles
(c) air-standard cycles
(d) none of the above
9. When the mixture is lean
(a) efficiency is less
(b) power output is less
(c) maximum temperature and pressure are higher
(d) all of the above
10. For a given compression ratio, as the mixture is made progressively richfrom lean the mean effective pressure
(a) increases
(b) decreases
(c) initially increases and then decreases
(d) remains more or less same
Ans: 1. – (b) 2. – (c) 3. – (a) 4. – (c) 5. – (b)6. – (a) 7. – (d) 8. – (d) 9. – (b) 10. – (c)

4ACTUAL CYCLES AND
THEIR ANALYSIS
4.1 INTRODUCTION
The actual cycles for IC engines differ from the fuel-air cycles and air-standardcycles in many respects. The actual cycle efficiency is much lower than theair-standard efficiency due to various losses occurring in the actual engineoperation. The major losses are due to:
(i) Variation of specific heats with temperature
(ii) Dissociation of the combustion products
(iii) Progressive combustion
(iv) Incomplete combustion of fuel
(v) Heat transfer into the walls of the combustion chamber
(vi) Blowdown at the end of the exhaust process
(vii) Gas exchange process
An estimate of these losses can be made from previous experience and somesimple tests on the engines and these estimates can be used in evaluating theperformance of an engine.
4.2 COMPARISON OF AIR-STANDARD AND ACTUAL CYCLES
The actual cycles for internal combustion engines differ from air-standardcycles in many respects. These differences are mainly due to:
(i) The working substance being a mixture of air and fuel vapour or finelyatomized liquid fuel in air combined with the products of combustionleft from the previous cycle.
(ii) The change in chemical composition of the working substance.
(iii) The variation of specific heats with temperature.
(iv) The change in the composition, temperature and actual amount of freshcharge because of the residual gases.
(v) The progressive combustion rather than the instantaneous combustion.
132 IC Engines
(vi) The heat transfer to and from the working medium.
(vii) The substantial exhaust blowdown loss, i.e., loss of work on the expan-sion stroke due to early opening of the exhaust valve.
(viii) Gas leakage, fluid friction etc., in actual engines.
Points (i) to (iv), being related to fuel-air cycles have already been dealt indetail in Chapter 4. Remaining points viz. (v) to (viii) are in fact responsiblefor the difference between fuel-air cycles and actual cycles.
Most of the factors listed above tend to decrease the thermal efficiencyand power output of the actual engines. On the other hand, the analysis ofthe cycles while taking these factors into account clearly indicates that theestimated thermal efficiencies are not very different from those of the actualcycles.
Out of all the above factors, major influence is exercised by
(i) Time loss factor i.e. loss due to time required for mixing of fuel and airand also for combustion.
(ii) Heat loss factor i.e. loss of heat from gases to cylinder walls.
(iii) Exhaust blowdown factor i.e. loss of work on the expansion stroke dueto early opening of the exhaust valve.
These major losses which are not considered in the previous two chaptersare discussed in the following sections.
4.3 TIME LOSS FACTOR
In air-standard cycles the heat addition is assumed to be an instantaneousprocess whereas in an actual cycle it is over a definite period of time. Thetime required for the combustion is such that under all circumstances somechange in volume takes place while it is in progress. The crankshaft willusually turn about 30 to 40◦ between the initiation of the spark and the endof combustion. There will be a time loss during this period and is called timeloss factor.
The consequence of the finite time of combustion is that the peak pressurewill not occur when the volume is minimum i.e., when the piston is at TDC;but will occur some time after TDC. The pressure, therefore, rises in thefirst part of the working stroke from b to c as shown in Fig.4.1. The point 3represents the state of gases had the combustion been instantaneous and anadditional amount of work equal to area shown hatched would have been done.This loss of work reduces the efficiency and is called time loss due to progres-sive combustion or merely time losses.
The time taken for the burning depends upon the flame velocity which inturn depends upon the type of fuel and the fuel-air ratio and also on the shapeand size of the combustion chamber. Further, the distance from the point ofignition to the opposite side of the combustion space also plays an importantrole.

Actual Cycles and their Analysis 133
0
10
20
30
40
50
60
0 1 2 3 4 5 6 7
Pre
ssure
(bar
)
a
b
c
d1
4'4"
4
V /Vcyl c
3
3'
2
Isentropic through c
Fuel-air cycle
Actual cycle
Fig. 4.1 Effect of time losses shown on p-V diagram
Table 4.1 Cycle performance for various ignition timings for r = 6(typical values)
Max.
CycleIgnition cycle mep efficiency
Actual ηFuel cycle η
advance pressure bar %bar
Fuel-air cycle 0◦ 44 10.20 32.2 1.00Actual cycle 0◦ 23 7.50 24.1 0.75
” 17◦ 34 8.35 26.3 0.81” 35◦ 41 7.60 23.9 0.74
In order that the peak pressure is not reached too late in the expansionstroke, the time at which the combustion starts is varied by varying the sparktiming or spark advance. Figures 4.2 and 4.3 show the effect of spark tim-ing on p-V diagram from a typical trial. With spark at TDC (Fig.4.2) thepeak pressure is low due to the expansion of gases. If the spark is advancedto achieve complete combustion close to TDC (Fig.4.3) additional work isrequired to compress the burning gases.
This represents a direct loss. In either case, viz., with or without sparkadvance the work area is less and the power output and efficiency are low-ered. Therefore, a moderate or optimum spark advance (Fig.4.4) is the bestcompromise resulting in minimum losses on both the compression and expan-sion strokes. Table 4.1 compares the engine performance for various ignitiontimings. Figure 4.5 shows the effect of spark advance on the power output bymeans of the p-V diagram. As seen from Fig.4.6, when the ignition advanceis increased there is a drastic reduction in the imep and the consequent loss
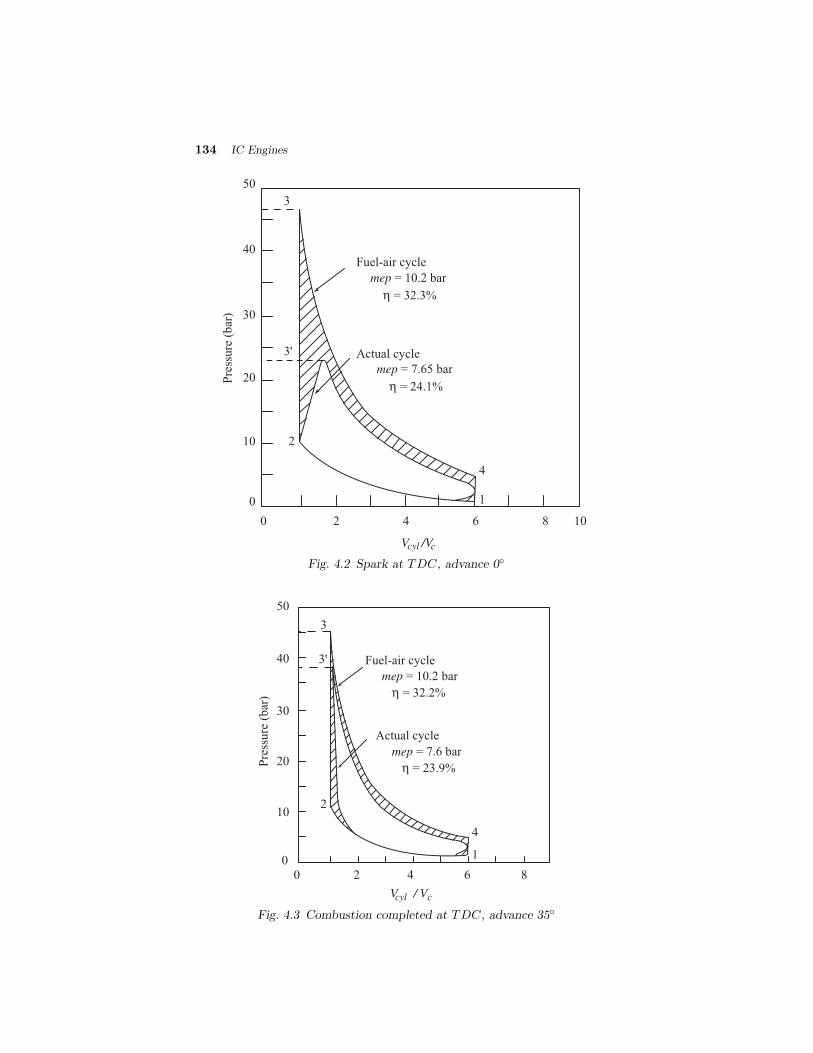
134 IC Engines
0 2 4 6 8 10
0
10
20
30
40
50
Pre
ssure
(bar
)
1
4
V /Vcyl c
3
3'
2
Fuel-air cycle
Actual cycle
mep = 10.2 bar
η = 32.3%
mep = 7.65 bar
η = 24.1%
Fig. 4.2 Spark at TDC, advance 0◦
1
4
3
3'
2
0
10
20
30
40
50
Pre
ssure
(bar
)
0 2 4 6 8
V / Vcyl c
Actual cycle
mep = 7.6 bar
η = 23.9%
Fuel-air cycle
mep = 10.2 bar
η = 32.2%
Fig. 4.3 Combustion completed at TDC, advance 35◦
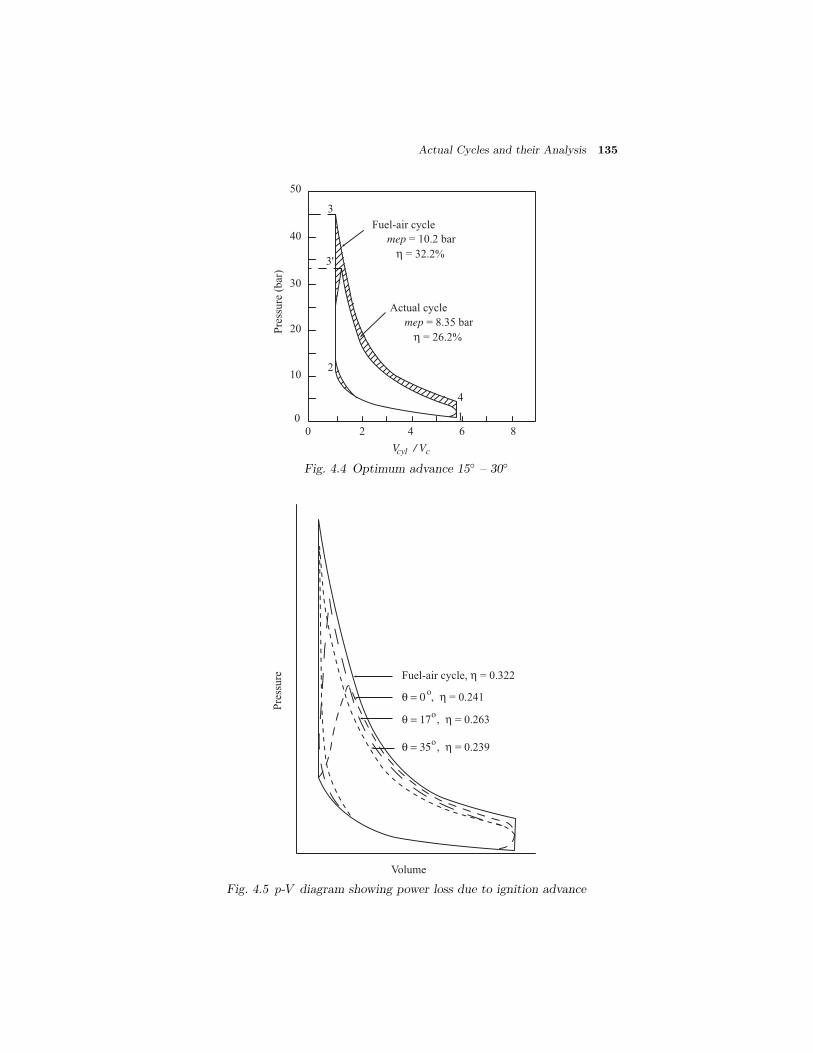
Actual Cycles and their Analysis 135
0
10
20
30
40
50
Pre
ssure
(bar
)
0 2 4 6 8
V / Vcyl c
Actual cycle
mep = 8.35 bar
η = 26.2%
Fuel-air cycle
mep = 10.2 bar
η = 32.2%
1
4
3
3'
2
Fig. 4.4 Optimum advance 15◦ – 30◦
Pre
ssure Fuel-air cycle, η = 0.322
θ = 35 , η = 0.239o
θ = 17 , η = 0.263o
θ = 0 , η = 0.241o
Volume
Fig. 4.5 p-V diagram showing power loss due to ignition advance
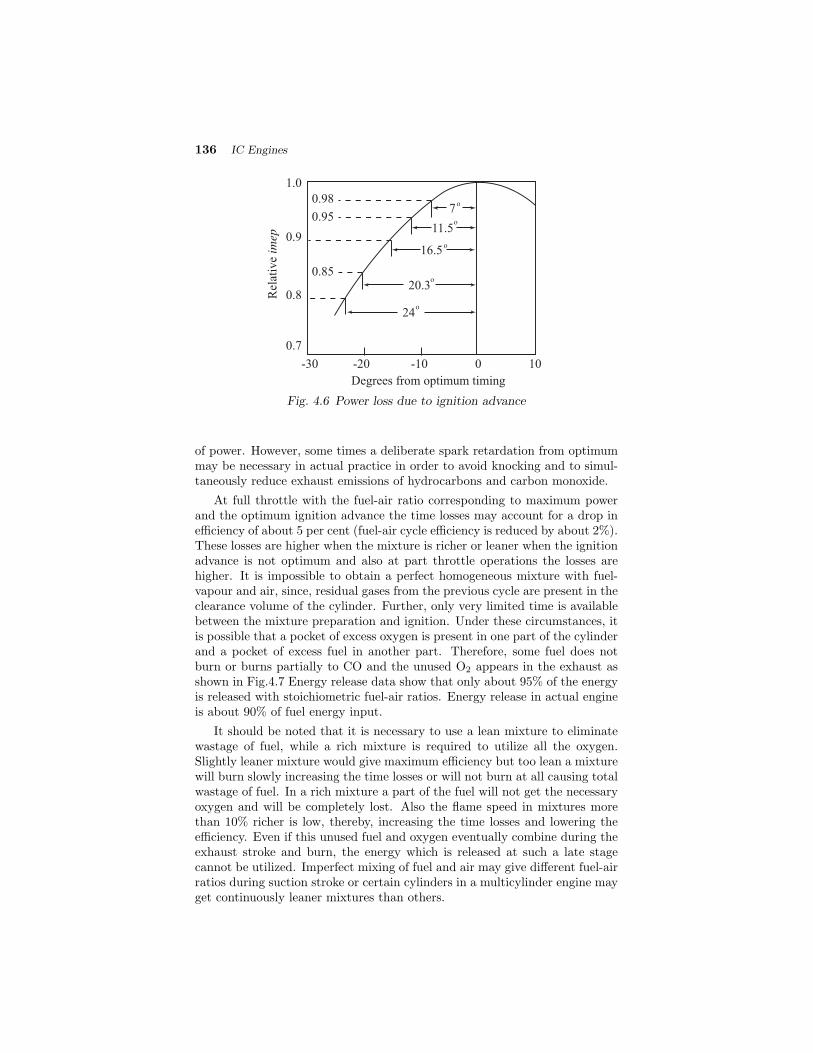
136 IC Engines
1.0
0.9
0.8
0.7
-30 -20 -10 0 10
Degrees from optimum timing
Rel
ativ
e im
ep
7
11.5
16.5
20.30.85
0.95
0.98
24o
o
o
o
o
Fig. 4.6 Power loss due to ignition advance
of power. However, some times a deliberate spark retardation from optimummay be necessary in actual practice in order to avoid knocking and to simul-taneously reduce exhaust emissions of hydrocarbons and carbon monoxide.
At full throttle with the fuel-air ratio corresponding to maximum powerand the optimum ignition advance the time losses may account for a drop inefficiency of about 5 per cent (fuel-air cycle efficiency is reduced by about 2%).These losses are higher when the mixture is richer or leaner when the ignitionadvance is not optimum and also at part throttle operations the losses arehigher. It is impossible to obtain a perfect homogeneous mixture with fuel-vapour and air, since, residual gases from the previous cycle are present in theclearance volume of the cylinder. Further, only very limited time is availablebetween the mixture preparation and ignition. Under these circumstances, itis possible that a pocket of excess oxygen is present in one part of the cylinderand a pocket of excess fuel in another part. Therefore, some fuel does notburn or burns partially to CO and the unused O2 appears in the exhaust asshown in Fig.4.7 Energy release data show that only about 95% of the energyis released with stoichiometric fuel-air ratios. Energy release in actual engineis about 90% of fuel energy input.
It should be noted that it is necessary to use a lean mixture to eliminatewastage of fuel, while a rich mixture is required to utilize all the oxygen.Slightly leaner mixture would give maximum efficiency but too lean a mixturewill burn slowly increasing the time losses or will not burn at all causing totalwastage of fuel. In a rich mixture a part of the fuel will not get the necessaryoxygen and will be completely lost. Also the flame speed in mixtures morethan 10% richer is low, thereby, increasing the time losses and lowering theefficiency. Even if this unused fuel and oxygen eventually combine during theexhaust stroke and burn, the energy which is released at such a late stagecannot be utilized. Imperfect mixing of fuel and air may give different fuel-airratios during suction stroke or certain cylinders in a multicylinder engine mayget continuously leaner mixtures than others.
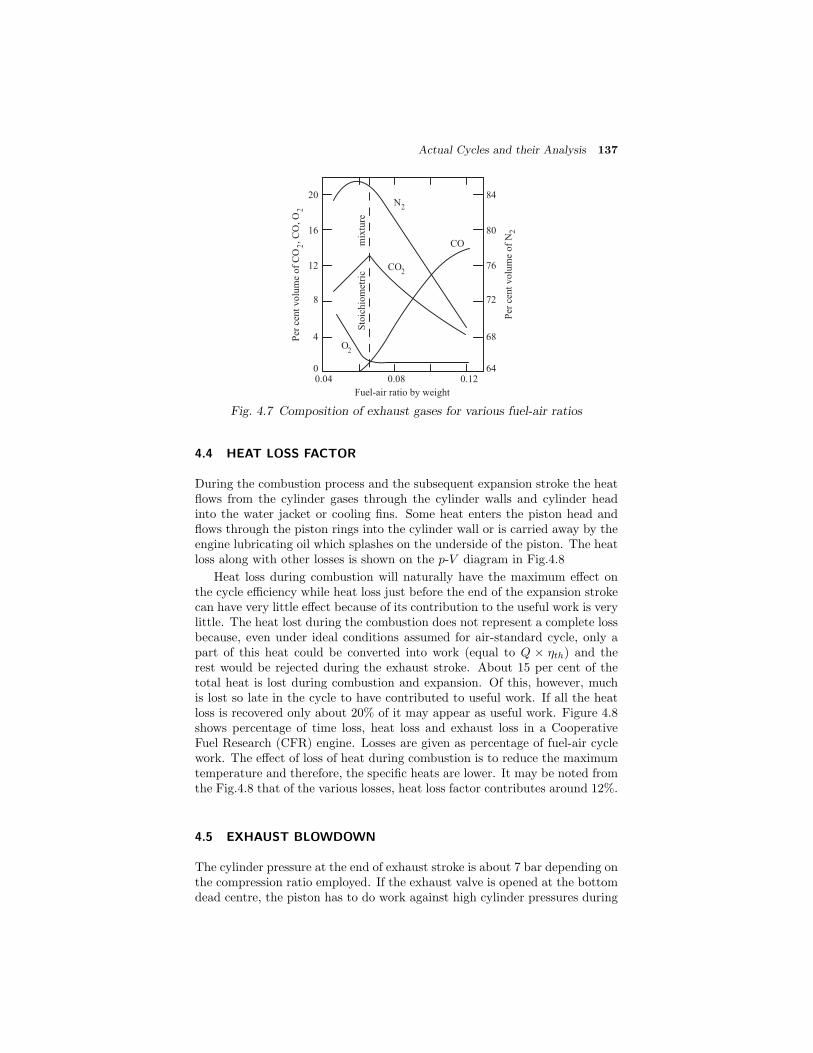
Actual Cycles and their Analysis 137
0
4
8
12
16
20 84
80
76
72
68
640.04 0.08 0.12
CO
O2
Fuel-air ratio by weight
Sto
ich
iom
etri
c
m
ixtu
re
CO2
N2
Per
cen
t v
olu
me
of
CO
,
CO
, O
2
2
Per
cen
t v
olu
me
of
N2
Fig. 4.7 Composition of exhaust gases for various fuel-air ratios
4.4 HEAT LOSS FACTOR
During the combustion process and the subsequent expansion stroke the heatflows from the cylinder gases through the cylinder walls and cylinder headinto the water jacket or cooling fins. Some heat enters the piston head andflows through the piston rings into the cylinder wall or is carried away by theengine lubricating oil which splashes on the underside of the piston. The heatloss along with other losses is shown on the p-V diagram in Fig.4.8
Heat loss during combustion will naturally have the maximum effect onthe cycle efficiency while heat loss just before the end of the expansion strokecan have very little effect because of its contribution to the useful work is verylittle. The heat lost during the combustion does not represent a complete lossbecause, even under ideal conditions assumed for air-standard cycle, only apart of this heat could be converted into work (equal to Q × ηth) and therest would be rejected during the exhaust stroke. About 15 per cent of thetotal heat is lost during combustion and expansion. Of this, however, muchis lost so late in the cycle to have contributed to useful work. If all the heatloss is recovered only about 20% of it may appear as useful work. Figure 4.8shows percentage of time loss, heat loss and exhaust loss in a CooperativeFuel Research (CFR) engine. Losses are given as percentage of fuel-air cyclework. The effect of loss of heat during combustion is to reduce the maximumtemperature and therefore, the specific heats are lower. It may be noted fromthe Fig.4.8 that of the various losses, heat loss factor contributes around 12%.
4.5 EXHAUST BLOWDOWN
The cylinder pressure at the end of exhaust stroke is about 7 bar depending onthe compression ratio employed. If the exhaust valve is opened at the bottomdead centre, the piston has to do work against high cylinder pressures during
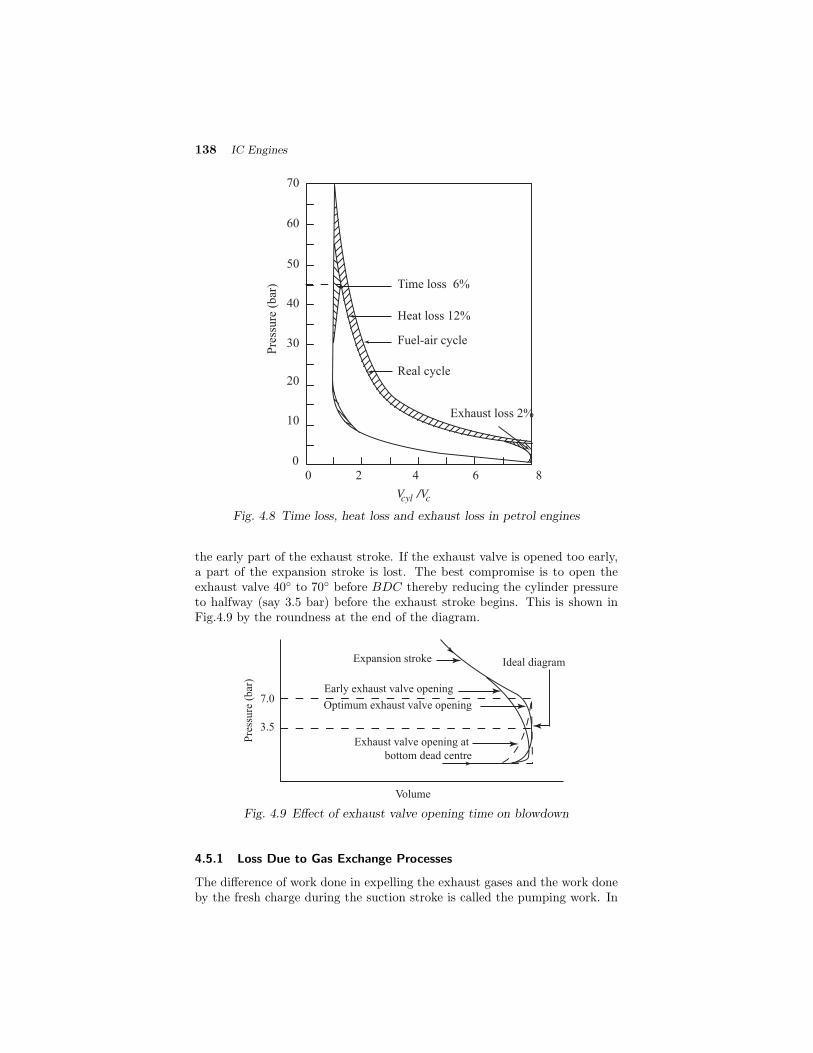
138 IC Engines
Fuel-air cycle
Real cycle
Heat loss 12%
Time loss 6%
Exhaust loss 2%
0 2 4 6 8
V /Vcyl c
60
50
40
30
20
10
0
Pre
ssure
(bar
)
70
Fig. 4.8 Time loss, heat loss and exhaust loss in petrol engines
the early part of the exhaust stroke. If the exhaust valve is opened too early,a part of the expansion stroke is lost. The best compromise is to open theexhaust valve 40◦ to 70◦ before BDC thereby reducing the cylinder pressureto halfway (say 3.5 bar) before the exhaust stroke begins. This is shown inFig.4.9 by the roundness at the end of the diagram.
Exhaust valve opening at
bottom dead centre
Optimum exhaust valve opening
Early exhaust valve opening
Expansion stroke
Volume
Pre
ssure
(bar
)
3.5
7.0
Ideal diagram
Fig. 4.9 Effect of exhaust valve opening time on blowdown
4.5.1 Loss Due to Gas Exchange Processes
The difference of work done in expelling the exhaust gases and the work doneby the fresh charge during the suction stroke is called the pumping work. In

Actual Cycles and their Analysis 139
other words loss due to the gas exchange process (pumping loss) is due topumping gas from lower inlet pressure pi to higher exhaust pressure pe. Thepumping loss increases at part throttle because throttling reduces the suctionpressure. Pumping loss also increases with speed. The gas exchange processesaffect the volumetric efficiency of the engine. The performance of the engine,to a great deal, depends on the volumetric efficiency. Hence, it is worthwhileto discuss this parameter in greater detail here.
4.5.2 Volumetric Efficiency
As already stated in section 1.8.4, volumetric efficiency is an indication of thebreathing ability of the engine and is defined as the ratio of the volume ofair actually inducted at ambient condition to swept volume. However, it mayalso be defined on mass basis as the ratio of the actual mass of air drawn intothe engine during a given period of time to the theoretical mass which shouldhave been drawn in during that same period of time, based upon the totalpiston displacement of the engine, and the temperature and pressure of thesurrounding atmosphere.
The above definition is applicable only to the naturally aspirated engine.In the case of the supercharged engine, however, the theoretical mass of airshould be calculated at the conditions of pressure and temperature prevailingin the intake manifold. The volumetric efficiency is affected by many variables,some of the important ones are:
(i) The density of the fresh charge : As the fresh charge arrives in the hotcylinder, heat is transferred to it from the hot chamber walls and the hotresidual exhaust gases, raising its temperature. This results in a decreasein the mass of fresh charge admitted and a reduction in volumetricefficiency. The volumetric efficiency is increased by low temperatures(provided there are no heat transfer effects) and high pressure of thefresh charge, since density is thereby increased, and more mass of chargecan be inducted into a given volume.
(ii) The exhaust gas in the clearance volume : As the piston moves fromTDC to BDC on the intake stroke, these products tend to expand andoccupy a portion of the piston displacement greater than the clearancevolume, thus reducing the space available to the incoming charge. In ad-dition, these exhaust products tend to raise the temperature of the freshcharge, thereby decreasing its density and further reducing volumetricefficiency.
(iii) The design of the intake and exhaust manifolds : The exhaust mani-fold should be so designed as to enable the exhaust products to escapereadily, while the intake manifold should be designed so as to bring inthe maximum possible fresh charge. This implies minimum restrictionis offered to the fresh charge flowing into the cylinder, as well as to theexhaust products being forced out.
(iv) The timing of the intake and exhaust valves : Valve timing is the reg-ulation of the points in the cycle at which the valves are set to open
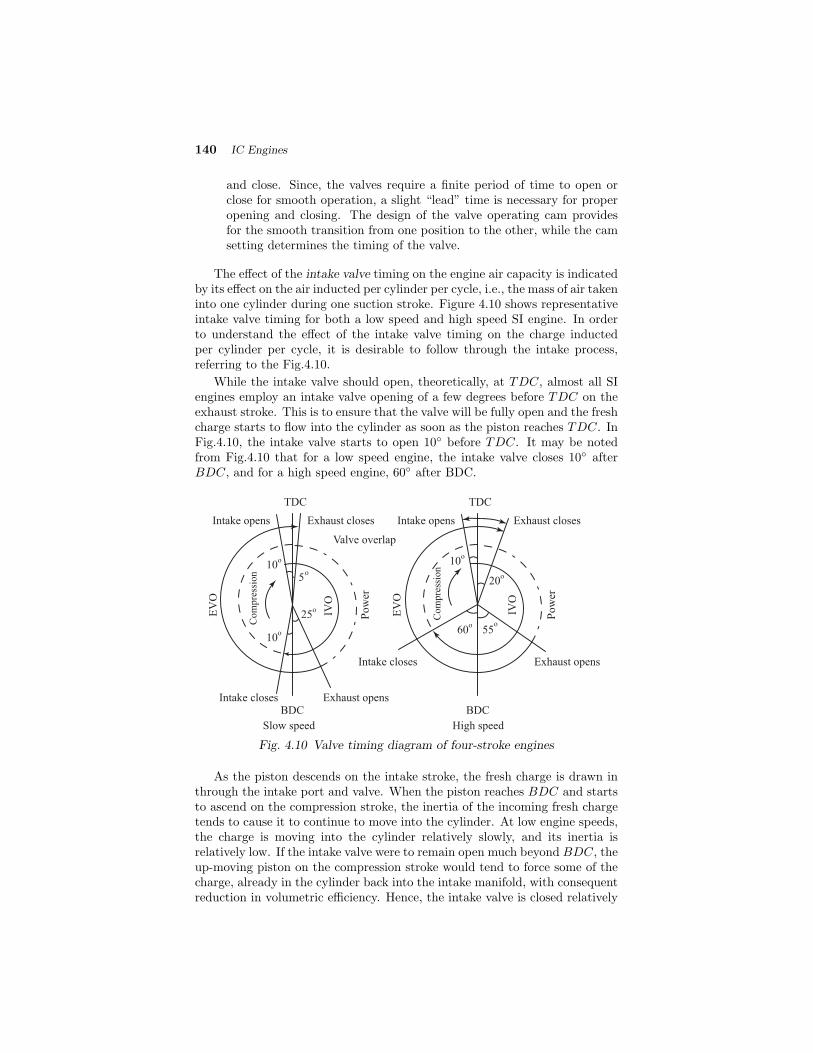
140 IC Engines
and close. Since, the valves require a finite period of time to open orclose for smooth operation, a slight “lead” time is necessary for properopening and closing. The design of the valve operating cam providesfor the smooth transition from one position to the other, while the camsetting determines the timing of the valve.
The effect of the intake valve timing on the engine air capacity is indicatedby its effect on the air inducted per cylinder per cycle, i.e., the mass of air takeninto one cylinder during one suction stroke. Figure 4.10 shows representativeintake valve timing for both a low speed and high speed SI engine. In orderto understand the effect of the intake valve timing on the charge inductedper cylinder per cycle, it is desirable to follow through the intake process,referring to the Fig.4.10.
While the intake valve should open, theoretically, at TDC, almost all SIengines employ an intake valve opening of a few degrees before TDC on theexhaust stroke. This is to ensure that the valve will be fully open and the freshcharge starts to flow into the cylinder as soon as the piston reaches TDC. InFig.4.10, the intake valve starts to open 10◦ before TDC. It may be notedfrom Fig.4.10 that for a low speed engine, the intake valve closes 10◦ afterBDC, and for a high speed engine, 60◦ after BDC.
Com
pre
ssio
n
IVO
EV
O
Intake opens Exhaust closes
TDC
Valve overlap
BDCIntake closes Exhaust opens
10o
10o
25o
5o
Com
pre
ssio
n
IVO
EV
O
60o
55o
Intake opens Exhaust closes
TDC
10o
20o
BDC
Intake closes Exhaust opens
Pow
er
Pow
er
Slow speed High speed
Fig. 4.10 Valve timing diagram of four-stroke engines
As the piston descends on the intake stroke, the fresh charge is drawn inthrough the intake port and valve. When the piston reaches BDC and startsto ascend on the compression stroke, the inertia of the incoming fresh chargetends to cause it to continue to move into the cylinder. At low engine speeds,the charge is moving into the cylinder relatively slowly, and its inertia isrelatively low. If the intake valve were to remain open much beyond BDC, theup-moving piston on the compression stroke would tend to force some of thecharge, already in the cylinder back into the intake manifold, with consequentreduction in volumetric efficiency. Hence, the intake valve is closed relatively
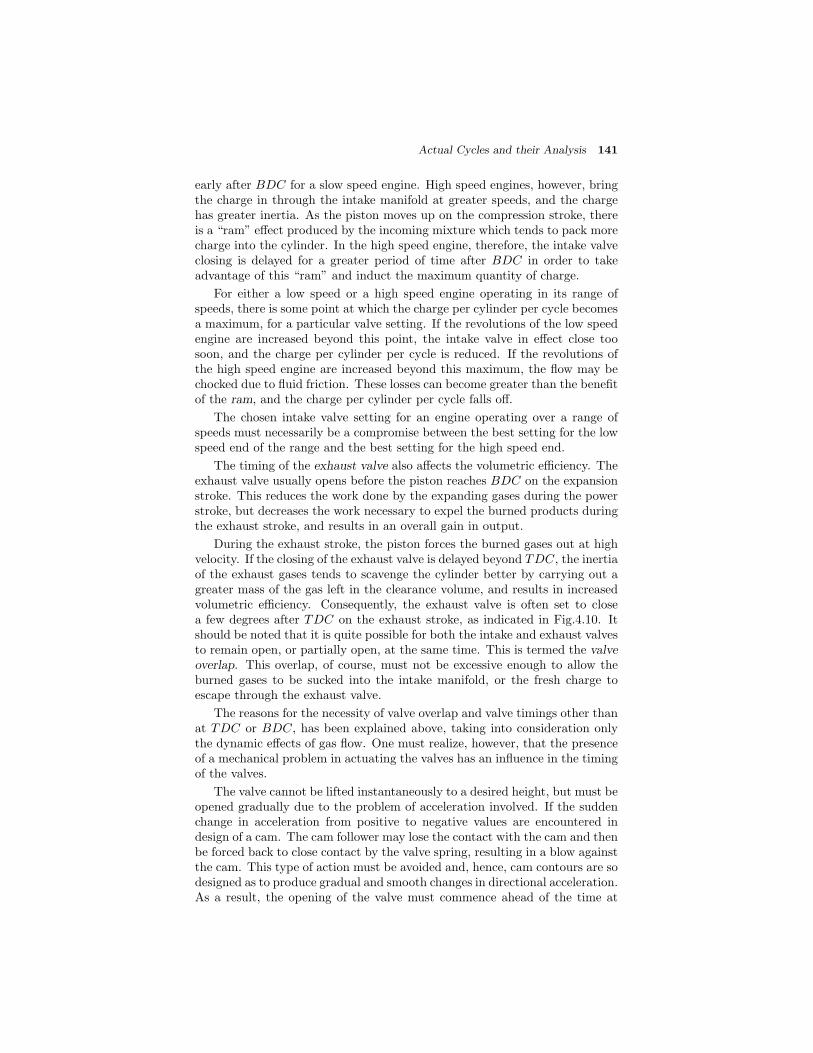
Actual Cycles and their Analysis 141
early after BDC for a slow speed engine. High speed engines, however, bringthe charge in through the intake manifold at greater speeds, and the chargehas greater inertia. As the piston moves up on the compression stroke, thereis a “ram” effect produced by the incoming mixture which tends to pack morecharge into the cylinder. In the high speed engine, therefore, the intake valveclosing is delayed for a greater period of time after BDC in order to takeadvantage of this “ram” and induct the maximum quantity of charge.
For either a low speed or a high speed engine operating in its range ofspeeds, there is some point at which the charge per cylinder per cycle becomesa maximum, for a particular valve setting. If the revolutions of the low speedengine are increased beyond this point, the intake valve in effect close toosoon, and the charge per cylinder per cycle is reduced. If the revolutions ofthe high speed engine are increased beyond this maximum, the flow may bechocked due to fluid friction. These losses can become greater than the benefitof the ram, and the charge per cylinder per cycle falls off.
The chosen intake valve setting for an engine operating over a range ofspeeds must necessarily be a compromise between the best setting for the lowspeed end of the range and the best setting for the high speed end.
The timing of the exhaust valve also affects the volumetric efficiency. Theexhaust valve usually opens before the piston reaches BDC on the expansionstroke. This reduces the work done by the expanding gases during the powerstroke, but decreases the work necessary to expel the burned products duringthe exhaust stroke, and results in an overall gain in output.
During the exhaust stroke, the piston forces the burned gases out at highvelocity. If the closing of the exhaust valve is delayed beyond TDC, the inertiaof the exhaust gases tends to scavenge the cylinder better by carrying out agreater mass of the gas left in the clearance volume, and results in increasedvolumetric efficiency. Consequently, the exhaust valve is often set to closea few degrees after TDC on the exhaust stroke, as indicated in Fig.4.10. Itshould be noted that it is quite possible for both the intake and exhaust valvesto remain open, or partially open, at the same time. This is termed the valveoverlap. This overlap, of course, must not be excessive enough to allow theburned gases to be sucked into the intake manifold, or the fresh charge toescape through the exhaust valve.
The reasons for the necessity of valve overlap and valve timings other thanat TDC or BDC, has been explained above, taking into consideration onlythe dynamic effects of gas flow. One must realize, however, that the presenceof a mechanical problem in actuating the valves has an influence in the timingof the valves.
The valve cannot be lifted instantaneously to a desired height, but must beopened gradually due to the problem of acceleration involved. If the suddenchange in acceleration from positive to negative values are encountered indesign of a cam. The cam follower may lose the contact with the cam and thenbe forced back to close contact by the valve spring, resulting in a blow againstthe cam. This type of action must be avoided and, hence, cam contours are sodesigned as to produce gradual and smooth changes in directional acceleration.As a result, the opening of the valve must commence ahead of the time at

142 IC Engines
which it is fully opened. The same reasoning applies for the closing time.It can be seen, therefore, that the timing of valves depends on dynamic andmechanical considerations.
Both the intake and exhaust valves are usually timed to give the most sat-isfactory results for the average operating conditions of the particular engine,and the settings are determined on the prototype of the actual engine.
4.6 LOSS DUE TO RUBBING FRICTION
These losses are due to friction between the piston and the cylinder walls,friction in various bearings and also the energy spent in operating the auxiliaryequipment such as cooling water pump, ignition system, fan, etc. The pistonring friction increases rapidly with engine speed. It also increases to a smallextent with increase in mean effective pressure. The bearing friction andthe auxiliary friction also increase with engine speed. The efficiency of anengine is maximum at full load and decreases at part loads. It is becausethe percentage of direct heat loss, pumping loss and rubbing friction lossincrease at part loads. The approximate losses for a gasoline engine of highcompression ratio, say 8:1 using a chemically correct mixture are given inTable 4.2, as percentage of fuel energy input.
Table 4.2 Typical losses in a gasoline engine for r = 8
At loadS.No. Item Full load Half load
(a) Air-standard cycle efficiency (ηair-std) 56.5 56.51. Losses due to variation of specific
heat and chemical equilibrium, % 13.0 13.02. Loss due to progressive combustion, % 4.0 4.03. Loss due to incomplete combustion, % 3.0 3.04. Direct heat loss, % 4.0 5.05. Exhaust blowdown loss, % 0.5 0.56. Pumping loss, % 0.5 1.57. Rubbing friction loss, % 3.0 6.0
(b) Fuel-air cycle efficiency = ηair-std – (1) 43.5 43.5(c) Gross indicated thermal efficiency (ηth)
= Fuel-air cycle efficiency (ηith)−(2 + 3 + 4 + 5) 32.0 31.0
(d) Actual brake thermal efficiency= ηith − (6 + 7) 28.5 23.5
4.7 ACTUAL AND FUEL-AIR CYCLES OF CI ENGINES
In the diesel cycle the losses are less than in the otto cycle. The main lossis due to incomplete combustion and is the cause of main difference betweenfuel-air cycle and actual cycle of a diesel engine. This is shown in Fig.4.11. Ina fuel-air cycle the combustion is supposed to be completed at the end of theconstant pressure burning whereas in actual practice after burning continues
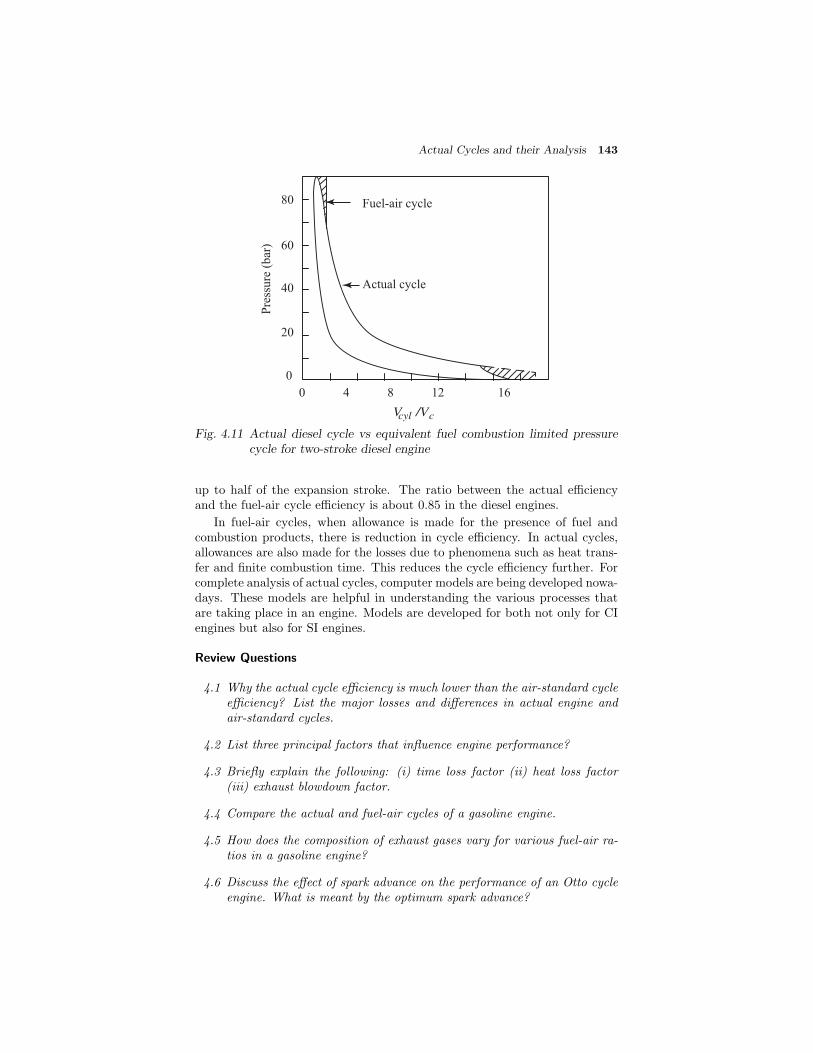
Actual Cycles and their Analysis 143
0
20
40
60
80
0 4 8 12 16
V /Vcyl c
Fuel-air cycle
Actual cycle
Pre
ssure
(bar
)
Fig. 4.11 Actual diesel cycle vs equivalent fuel combustion limited pressurecycle for two-stroke diesel engine
up to half of the expansion stroke. The ratio between the actual efficiencyand the fuel-air cycle efficiency is about 0.85 in the diesel engines.
In fuel-air cycles, when allowance is made for the presence of fuel andcombustion products, there is reduction in cycle efficiency. In actual cycles,allowances are also made for the losses due to phenomena such as heat trans-fer and finite combustion time. This reduces the cycle efficiency further. Forcomplete analysis of actual cycles, computer models are being developed nowa-days. These models are helpful in understanding the various processes thatare taking place in an engine. Models are developed for both not only for CIengines but also for SI engines.
Review Questions
4.1 Why the actual cycle efficiency is much lower than the air-standard cycleefficiency? List the major losses and differences in actual engine andair-standard cycles.
4.2 List three principal factors that influence engine performance?
4.3 Briefly explain the following: (i) time loss factor (ii) heat loss factor(iii) exhaust blowdown factor.
4.4 Compare the actual and fuel-air cycles of a gasoline engine.
4.5 How does the composition of exhaust gases vary for various fuel-air ra-tios in a gasoline engine?
4.6 Discuss the effect of spark advance on the performance of an Otto cycleengine. What is meant by the optimum spark advance?

144 IC Engines
4.7 Discuss the optimum opening position of exhaust valve to reduce theexhaust blowdown loss.
4.8 Briefly discuss pumping and rubbing friction losses.
4.9 Discuss briefly the loss due to gas exchange process.
4.10 Define volumetric efficiency and discuss the effect of various factorsaffecting the volumetric efficiency.
Multiple Choice Questions (choose the most appropriate answer)
1. Time loss factor in actual cycle is due to
(a) progressive combustion
(b) heat loss through cylinder walls
(c) gas leakage
(d) friction
2. If the spark timing is at TDC, the work is less as
(a) the peak pressure is high
(b) the peak pressure is low
(c) the friction is high
(d) none of the above
3. When the spark is advanced, work output is less as
(a) the peak pressure is low
(b) the peak temperature is low
(c) additional work is required to compress the burning gas
(d) frictional losses increase
4. Optimum spark timing gives
(a) higher mean effective pressure
(b) higher efficiency
(c) both (a) and (b)
(d) none of the above
5. The major loss in a SI engine is due to
(a) exhaust blow down
(b) pumping
(c) incomplete combustion
(d) variation in specific heat and chemical equilibrium

Actual Cycles and their Analysis 145
6. Fuel-air cycle efficiency is less than air-standard cycle efficiency by anamount equal to
(a) pumping loss
(b) friction loss
(c) loss due to specific heat variation and chemical equilibrium
(d) exhaust blow down loss
7. The major loss in a CI engine is
(a) direct heat loss
(b) loss due to incomplete combustion
(c) rubbing friction loss
(d) pumping loss
8. The ratio of the actual efficiency and the fuel-air cycle efficiency for CIengines is about
(a) 0.2–0.3
(b) 0.5–0.6
(c) 1.0
(d) 0.6–0.8
9. In an actual SI engine the pumping loss with respect to speed
(a) decreases
(b) increases
(c) remains constant
(d) nothing to do with speed
10. The volumetric efficiency is affected by
(a) the exhaust gas in the clearance volume
(b) the design of intake and exhaust valve
(c) valve timing
(d) all of the above
11. In diesel cycles compared to otto cycle, the losses are
(a) lesser
(b) more
(c) equal
(d) none of the above
146 IC Engines
12. The timing of the exhaust valve affects
(a) mechanical efficiency
(b) volumetric efficiency
(c) indicated thermal efficiency
(d) none of the above
13. Valve overlap is the period in which
(a) intake valve is open while exhaust valve is closed
(b) intake valve is closed while exhaust valve is open
(c) both intake and exhaust valves are open
(d) both intake and exhaust valves are closed
14. With increase in mean effective pressure the ring friction
(a) remains constant
(b) increases and then decreases
(c) decreases
(d) increases only to a small extent
15. Opening the intake valve before the top dead centre improves
(a) power output
(b) brake thermal efficiency
(c) volumetric efficiency
(d) all of the above
Ans : 1. – (a) 2. – (b) 3. – (c) 4. – (c) 5. – (d)6. – (c) 7. – (b) 8. – (d) 9. – (b) 10. – (d)
11. – (a) 12. – (b) 13. – (c) 14. – (d) 15. – (d)
5CONVENTIONAL FUELS
5.1 INTRODUCTION
The study of fuels for IC engines has been carried out ever since these enginescame into existence. The engine converts heat energy which is obtained fromthe chemical combination of the fuel with the oxygen, into mechanical energy.Since the heat energy is derived from the fuel, a fundamental knowledge oftypes of fuels and their characteristics is essential in order to understand thecombustion phenomenon. The characteristics of the fuel used have consider-able influence on the design, efficiency, output and particularly, the reliabilityand durability of the engine. Further, the fuel characteristics play a vital rolein the atmospheric pollution caused by the engines used in automobiles.
5.2 Fuels
Internal combustion engines can be operated on different types of fuels suchas liquid, gaseous and even solid fuels. Depending upon the type of fuel to beused the engine has to be designed accordingly.
5.2.1 Solid Fuels
The solid fuels find little practical application at present because of the prob-lems in handling the fuel as well as in disposing off, the solid residue or ashafter combustion. However, in the initial stages of the engine development,solid fuels such as finely powdered coal was attempted. Compared to gaseousand liquid fuels, solid fuels are quite difficult to handle and storage and feed-ing are quite cumbersome. Because of the complications in the design of thefuel feed systems these fuels have become unsuitable in solid form. Attemptsare being made to generate gaseous or liquid fuels from charcoal for use in ICengines.
5.2.2 Gaseous Fuels
Gaseous fuels are ideal and pose very few problems in using them in internalcombustion engines. Being gaseous, they mix more homogeneously with airand eliminate the distribution and starting problems that are encounteredwith liquid fuels. Even though the gaseous fuels are the most ideal for in-ternal combustion engines, storage and handling problems restrict their usein automobiles. Consequently, they are commonly used for stationary powerplants located near the source of availability of the fuel. Some of the gaseousfuels can be liquefied under pressure for reducing the storage volume but thisarrangement is very expensive as well as risky. Because of the energy crisisin the recent years considerable research efforts are being made to improve

148 IC Engines
the design and performance of gas engines which became obsolete when liquidfuels began to be used.
5.2.3 Liquid Fuels
In most of the modern internal combustion engines, liquid fuels which are thederivatives of liquid petroleum are being used. The three principal commercialtypes of liquid fuels are benzyl, alcohol and petroleum products. However,petroleum products form the main fuels for internal combustion engines as ontoday.
5.3 CHEMICAL STRUCTURE OF PETROLEUM
Petroleum as obtained from the oil wells, is predominantly a mixture ofmany hydrocarbons with differing molecular structure. It also contains smallamounts of sulphur, oxygen, nitrogen and impurities such as water and sand.The carbon and hydrogen atoms may be linked in different ways in a hydrocar-bon molecule and this linking influences the chemical and physical propertiesof different hydrocarbon groups. Most petroleum fuels tend to exhibit thecharacteristics of that type of hydrocarbon which forms a major constituentof the fuel.
The carbon and hydrogen combine in different proportions and molecularstructures to form a variety of hydrocarbons. The carbon to hydrogen ratiowhich is one of the important parameters and their nature of bonding deter-mine the energy characteristics of the hydrocarbon fuels. Depending upon thenumber of carbon and hydrogen atoms the petroleum products are classifiedinto different groups.
The differences in physical and chemical properties between the differenttypes of hydrocarbon depend on their chemical composition and affect mainlythe combustion processes and hence, the proportion of fuel and air requiredin the engine. The basic families of hydrocarbons, their general formulae andtheir molecular arrangement are shown in Table 5.1.
Table 5.1 Basic families of hydrocarbons
Family of General Molecular Saturated/Stabilityhydrocarbons formula structure Unsaturated
Paraffin CnH2n+2 Chain Saturated StableOlefin CnH2n Chain Unsaturated UnstableNaphthene CnH2n Ring Saturated Stable
Aromatic CnH2n−6 RingHighly Mostunsaturated unstable
5.3.1 Paraffin Series
The normal paraffin hydrocarbons are of straight chain molecular structure.They are represented by a general chemical formula, CnH2n+2. The molecularstructures of the first few members of the paraffin family of hydrocarbons areshown below.
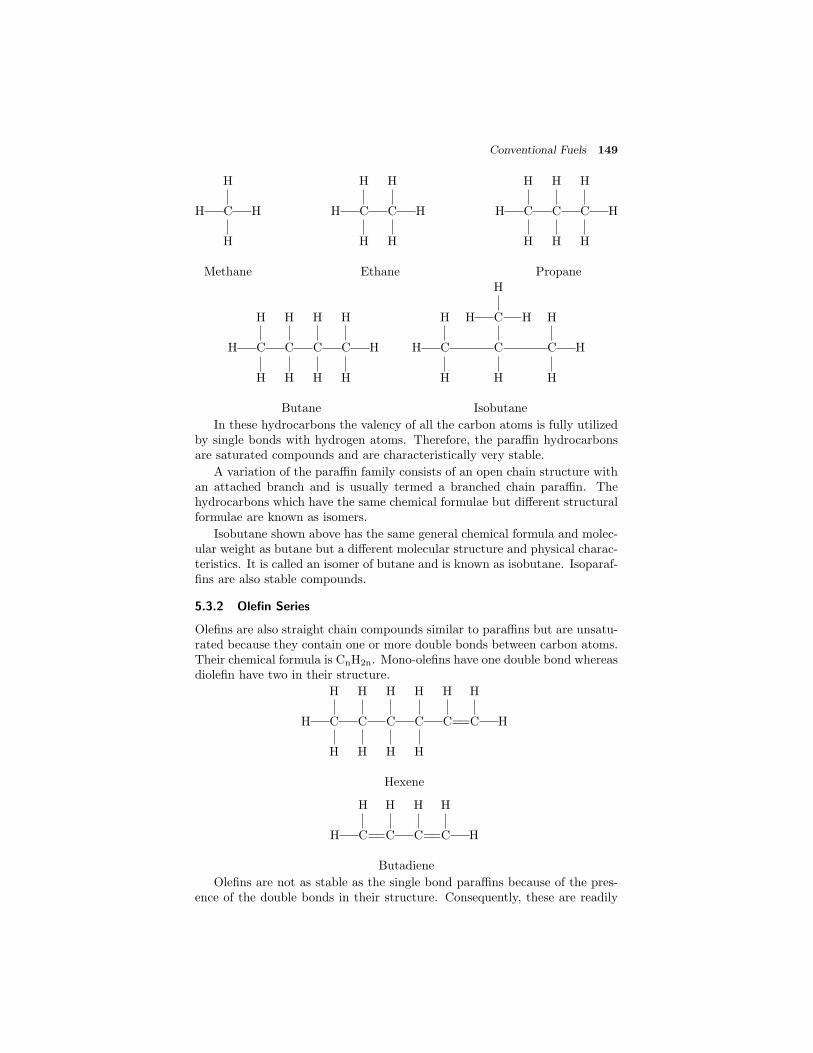
Conventional Fuels 149
H
H C H
H
Methane
H H
H C C H
H H
Ethane
H H H
H C C C H
H H H
Propane
H H H H
H C C C C H
H H H H
Butane
H
H H C H H
H C C C H
H H H
Isobutane
In these hydrocarbons the valency of all the carbon atoms is fully utilizedby single bonds with hydrogen atoms. Therefore, the paraffin hydrocarbonsare saturated compounds and are characteristically very stable.
A variation of the paraffin family consists of an open chain structure withan attached branch and is usually termed a branched chain paraffin. Thehydrocarbons which have the same chemical formulae but different structuralformulae are known as isomers.
Isobutane shown above has the same general chemical formula and molec-ular weight as butane but a different molecular structure and physical charac-teristics. It is called an isomer of butane and is known as isobutane. Isoparaf-fins are also stable compounds.
5.3.2 Olefin Series
Olefins are also straight chain compounds similar to paraffins but are unsatu-rated because they contain one or more double bonds between carbon atoms.Their chemical formula is CnH2n. Mono-olefins have one double bond whereasdiolefin have two in their structure.
H H H H H H
H C C C C C==C H
H H H H
Hexene
H H H H
H C==C C==C H
Butadiene
Olefins are not as stable as the single bond paraffins because of the pres-ence of the double bonds in their structure. Consequently, these are readily
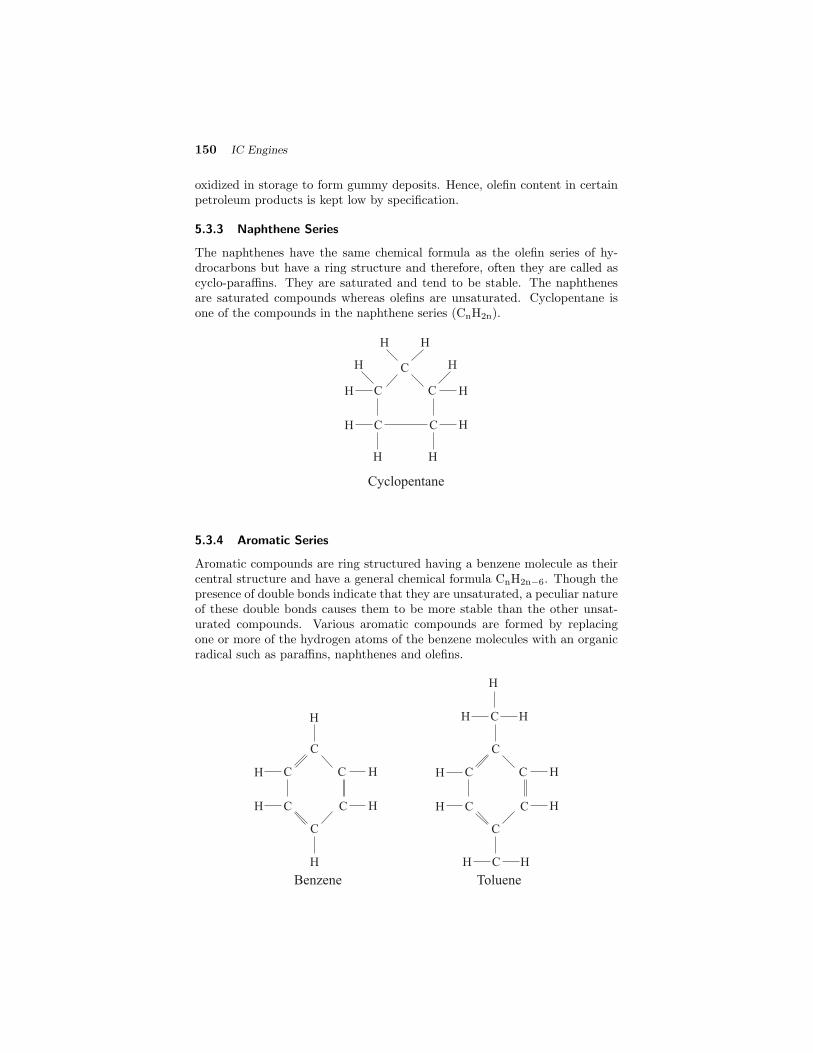
150 IC Engines
oxidized in storage to form gummy deposits. Hence, olefin content in certainpetroleum products is kept low by specification.
5.3.3 Naphthene Series
The naphthenes have the same chemical formula as the olefin series of hy-drocarbons but have a ring structure and therefore, often they are called ascyclo-paraffins. They are saturated and tend to be stable. The naphthenesare saturated compounds whereas olefins are unsaturated. Cyclopentane isone of the compounds in the naphthene series (CnH2n).
C
C C
H H
H H
CH C H
H H
Cyclopentane
H H
5.3.4 Aromatic Series
Aromatic compounds are ring structured having a benzene molecule as theircentral structure and have a general chemical formula CnH2n−6. Though thepresence of double bonds indicate that they are unsaturated, a peculiar natureof these double bonds causes them to be more stable than the other unsat-urated compounds. Various aromatic compounds are formed by replacingone or more of the hydrogen atoms of the benzene molecules with an organicradical such as paraffins, naphthenes and olefins.
C C
CH C H
C
H
H H
C
H
C C
CH C H
C
H
H H
C
CH H
CH H
Benzene Toluene
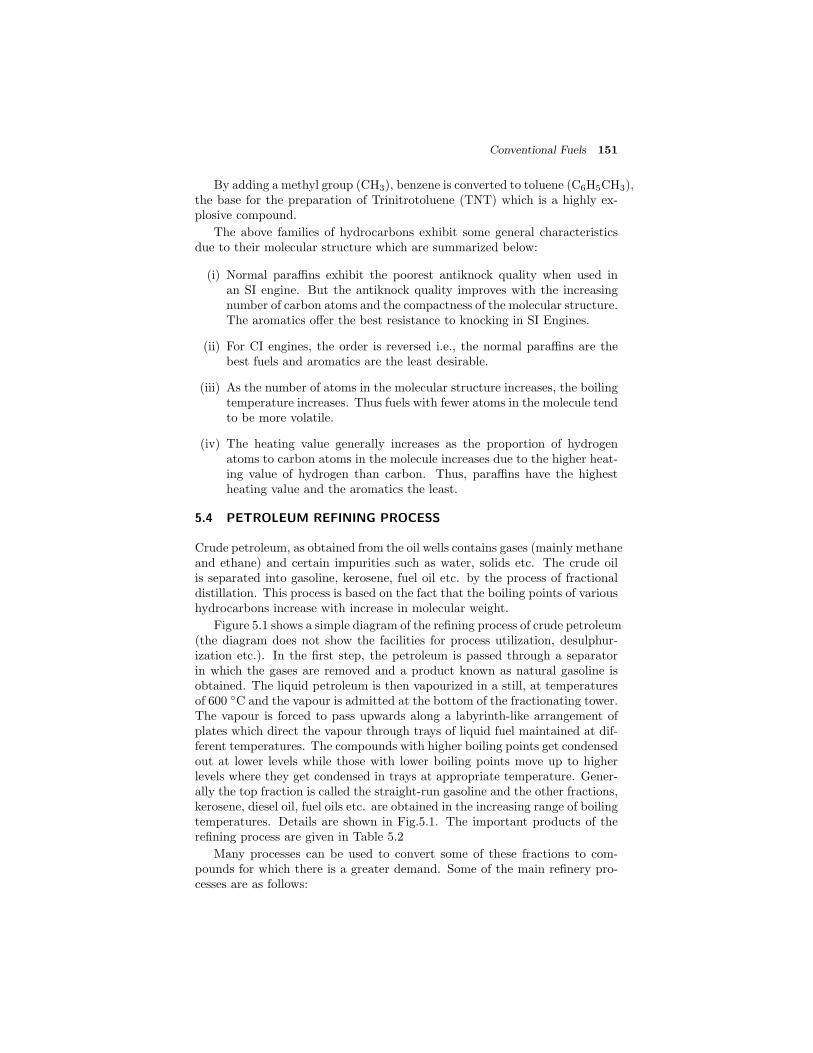
Conventional Fuels 151
By adding a methyl group (CH3), benzene is converted to toluene (C6H5CH3),the base for the preparation of Trinitrotoluene (TNT) which is a highly ex-plosive compound.
The above families of hydrocarbons exhibit some general characteristicsdue to their molecular structure which are summarized below:
(i) Normal paraffins exhibit the poorest antiknock quality when used inan SI engine. But the antiknock quality improves with the increasingnumber of carbon atoms and the compactness of the molecular structure.The aromatics offer the best resistance to knocking in SI Engines.
(ii) For CI engines, the order is reversed i.e., the normal paraffins are thebest fuels and aromatics are the least desirable.
(iii) As the number of atoms in the molecular structure increases, the boilingtemperature increases. Thus fuels with fewer atoms in the molecule tendto be more volatile.
(iv) The heating value generally increases as the proportion of hydrogenatoms to carbon atoms in the molecule increases due to the higher heat-ing value of hydrogen than carbon. Thus, paraffins have the highestheating value and the aromatics the least.
5.4 PETROLEUM REFINING PROCESS
Crude petroleum, as obtained from the oil wells contains gases (mainly methaneand ethane) and certain impurities such as water, solids etc. The crude oilis separated into gasoline, kerosene, fuel oil etc. by the process of fractionaldistillation. This process is based on the fact that the boiling points of varioushydrocarbons increase with increase in molecular weight.
Figure 5.1 shows a simple diagram of the refining process of crude petroleum(the diagram does not show the facilities for process utilization, desulphur-ization etc.). In the first step, the petroleum is passed through a separatorin which the gases are removed and a product known as natural gasoline isobtained. The liquid petroleum is then vapourized in a still, at temperaturesof 600 ◦C and the vapour is admitted at the bottom of the fractionating tower.The vapour is forced to pass upwards along a labyrinth-like arrangement ofplates which direct the vapour through trays of liquid fuel maintained at dif-ferent temperatures. The compounds with higher boiling points get condensedout at lower levels while those with lower boiling points move up to higherlevels where they get condensed in trays at appropriate temperature. Gener-ally the top fraction is called the straight-run gasoline and the other fractions,kerosene, diesel oil, fuel oils etc. are obtained in the increasing range of boilingtemperatures. Details are shown in Fig.5.1. The important products of therefining process are given in Table 5.2
Many processes can be used to convert some of these fractions to com-pounds for which there is a greater demand. Some of the main refinery pro-cesses are as follows:
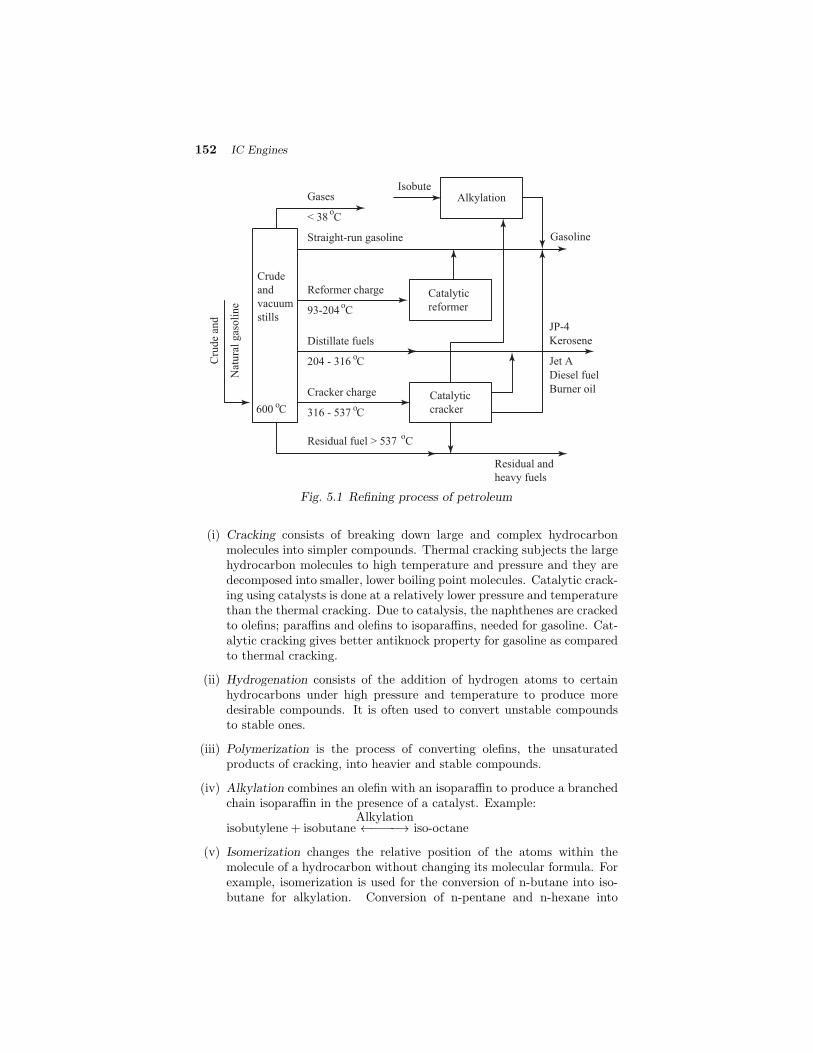
152 IC Engines
Cru
de
and
Nat
ura
l gas
oli
ne
Crude
and
vacuum
stills
600 C
Reformer charge
93-204 C
Distillate fuels
204 - 316 C
Cracker charge
316 - 537 C
Residual fuel > 537 C
Catalytic
cracker
Catalytic
reformer
Gases
< 38 C
IsobuteAlkylation
Straight-run gasoline Gasoline
JP-4
Kerosene
Residual and
heavy fuels
o
o
o
o
o
o
Jet A
Diesel fuel
Burner oil
Fig. 5.1 Refining process of petroleum
(i) Cracking consists of breaking down large and complex hydrocarbonmolecules into simpler compounds. Thermal cracking subjects the largehydrocarbon molecules to high temperature and pressure and they aredecomposed into smaller, lower boiling point molecules. Catalytic crack-ing using catalysts is done at a relatively lower pressure and temperaturethan the thermal cracking. Due to catalysis, the naphthenes are crackedto olefins; paraffins and olefins to isoparaffins, needed for gasoline. Cat-alytic cracking gives better antiknock property for gasoline as comparedto thermal cracking.
(ii) Hydrogenation consists of the addition of hydrogen atoms to certainhydrocarbons under high pressure and temperature to produce moredesirable compounds. It is often used to convert unstable compoundsto stable ones.
(iii) Polymerization is the process of converting olefins, the unsaturatedproducts of cracking, into heavier and stable compounds.
(iv) Alkylation combines an olefin with an isoparaffin to produce a branchedchain isoparaffin in the presence of a catalyst. Example:
isobutylene + isobutaneAlkylation←−−−−→ iso-octane
(v) Isomerization changes the relative position of the atoms within themolecule of a hydrocarbon without changing its molecular formula. Forexample, isomerization is used for the conversion of n-butane into iso-butane for alkylation. Conversion of n-pentane and n-hexane into

Conventional Fuels 153
Table 5.2 Products of petroleum refining process
S.No. FractionApp. boiling
Remarksrange, ◦C
1. Fuel gas -160 to -44 Methane, ethane andsome propane used asrefinery fuel
2. Propane -40 LPG
3. Butane -12 to 30 Blended withmotor gasoline toincrease its volatility
4. Light Naphtha 0 to 150 Motor gasoline forcatalytic reforming
5. Heavy Naphtha 150 to 200 Catalytic reformingfuel, blended withlight gas oilto form jet fuels
6. Kerosene – 200 to 300 Domestic, aviationMiddle distillate fuels
7. Light gas oil – 200 to 315 Furnace fuel oil,Middle distillate diesel fuels
8. Heavy gas oil 315 to 425 Feed for catalyticcracking
9. Vacuum gas oil 425 to 600 Feed for catalyticcracking
10. Pitch >600 Heavy fuel oil, asphalts
isoparaffins to improve knock rating of highly volatile gasoline is an-other example.
(vi) Cyclization joins together the ends of a straight chain molecule to forma ring compound of the naphthene family.
(vii) Aromatization is similar to cyclization, the exception being that theproduct is an aromatic compound.
(viii) Reformation is a type of cracking process which is used to convert thelow antiknock quality stocks into gasolines of higher octane rating (seesection 6.6). It does not increase the total gasoline volume.
(ix) Blending is a process of obtaining a product of desired quality by mixingcertain products in some suitable proportion.
5.5 IMPORTANT QUALITIES OF ENGINE FUELS
Fuels used in IC engines should possess certain basic qualities which are im-portant for the smooth running of the engines. In this section, the importantqualities of fuels for both SI and CI engines are reviewed.
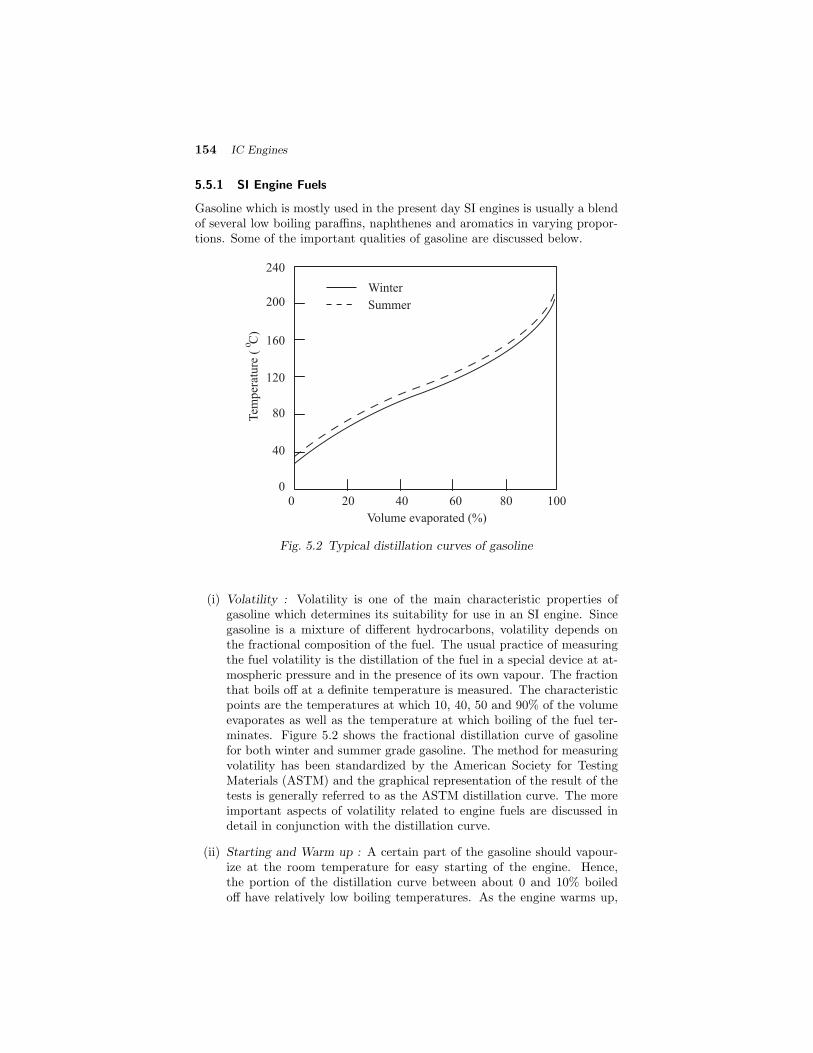
154 IC Engines
5.5.1 SI Engine Fuels
Gasoline which is mostly used in the present day SI engines is usually a blendof several low boiling paraffins, naphthenes and aromatics in varying propor-tions. Some of the important qualities of gasoline are discussed below.
Volume evaporated (%)
0 20 40 60 80 100
0
40
80
120
160
200
240
Tem
per
ature
( C
)o
Winter
Summer
Fig. 5.2 Typical distillation curves of gasoline
(i) Volatility : Volatility is one of the main characteristic properties ofgasoline which determines its suitability for use in an SI engine. Sincegasoline is a mixture of different hydrocarbons, volatility depends onthe fractional composition of the fuel. The usual practice of measuringthe fuel volatility is the distillation of the fuel in a special device at at-mospheric pressure and in the presence of its own vapour. The fractionthat boils off at a definite temperature is measured. The characteristicpoints are the temperatures at which 10, 40, 50 and 90% of the volumeevaporates as well as the temperature at which boiling of the fuel ter-minates. Figure 5.2 shows the fractional distillation curve of gasolinefor both winter and summer grade gasoline. The method for measuringvolatility has been standardized by the American Society for TestingMaterials (ASTM) and the graphical representation of the result of thetests is generally referred to as the ASTM distillation curve. The moreimportant aspects of volatility related to engine fuels are discussed indetail in conjunction with the distillation curve.
(ii) Starting and Warm up : A certain part of the gasoline should vapour-ize at the room temperature for easy starting of the engine. Hence,the portion of the distillation curve between about 0 and 10% boiledoff have relatively low boiling temperatures. As the engine warms up,
Conventional Fuels 155
the temperature will gradually increase to the operating temperature.Low distillation temperatures are desirable throughout the range of thedistillation curve for best warm-up.
(iii) Operating Range Performance : In order to obtain goodvapourization of the gasoline, low distillation temperatures are prefer-able in the engine operating range. Better vapourization tends to pro-duce both more uniform distribution of fuel to the cylinders as wellas better acceleration characteristics by reducing the quantity of liquiddroplets in the intake manifold.
(iv) Crankcase Dilution : Liquid fuel in the cylinder causes loss of lubricatingoil (by washing away oil from cylinder walls) which deteriorates thequality of lubrication and tends to cause damage to the engine throughincreased friction. The liquid gasoline may also dilute the lubricatingoil and weaken the oil film between rubbing surfaces. To prevent thesepossibilities, the upper portion of the distillation curve should exhibitsufficiently low distillation temperatures to insure that all gasoline inthe cylinder is vapourized by the time the combustion starts.
(v) Vapour Lock Characteristics : High rate of vapourization of gasoline canupset the carburettor metering or even stop the fuel flow to the engineby setting up a vapour lock in the fuel passages. This characteristic,demands the presence of relatively high boiling temperature hydrocar-bons throughout the distillation range. Since this requirement is notconsistent with the other requirements desired in (a), (b) and (c), acompromise must be made for the desired distillation temperatures.
(vi) Antiknock Quality : Abnormal burning or detonation in an SI enginecombustion chamber causes a very high rate of energy release, exces-sive temperature and pressure inside the cylinder adversely affects itsthermal efficiency. Therefore, the characteristics of the fuel used shouldbe such that it resists the tendency to produce detonation and thisproperty is called its antiknock property. The antiknock property of afuel depends on the self-ignition characteristics of its mixture and varylargely with the chemical composition and molecular structure of thefuel. In general, the best SI engine fuel will be that having the highestantiknock property, since this permits the use of higher compression ra-tios and thus the engine thermal efficiency and the power output can begreatly increased.
(vii) Gum Deposits : Reactive hydrocarbons and impurities in the fuel havea tendency to oxidize upon storage and form liquid and solid gummysubstances. The gasoline containing hydrocarbons of the paraffin, naph-thene and aromatic families forms little gum while cracked gasoline con-taining unsaturated hydrocarbons is the worst offender. A gasoline withhigh gum content will cause operating difficulties such as sticking valvesand piston rings carbon deposits in the engine, gum deposits in themanifold, clogging of carburettor jets and enlarging of the valve stems,cylinders and pistons. The amount of gum increases with increased

156 IC Engines
concentrations of oxygen, with rise in temperature, with exposure tosunlight and also on contact with metals. Gasoline specifications there-fore limit both the gum content of the fuel and its tendency to formgum during storage.
(viii) Sulphur Content : Hydrocarbon fuels may contain free sulphur, hydro-gen sulphide and other sulphur compounds which are objectionable forseveral reasons. The sulphur is a corrosive element of the fuel that cancorrode fuel lines, carburettors and injection pumps and it will unitewith oxygen to form sulphur dioxide that, in the presence of water atlow temperatures, may form sulphurous acid. Since sulphur has a lowignition temperature, the presence of sulphur can reduce the self-ignitiontemperature, then promoting knock in the SI engine.
5.5.2 CI Engine Fuels
(i) Knock Characteristics : Knock in the CI engine occurs because of anignition lag in the combustion of the fuel between the time of injec-tion and the time of actual burning. As the ignition lag increases, theamount of fuel accumulated in the combustion chamber increases andwhen combustion actually takes place, abnormal amount of energy issuddenly released causing an excessive rate of pressure rise which re-sults in an audible knock. Hence, a good CI engine fuel should have ashort ignition lag and will ignite more readily. Furthermore, ignition lagaffects the starting, warm up, and leads to the production of exhaustsmoke in CI engines. The present day measure in the cetane rating, thebest fuel in general, will have a cetane rating sufficiently high to avoidobjectionable knock.
(ii) Volatility : The fuel should be sufficiently volatile in the operating rangeof temperature to produce good mixing and combustion. Figure 5.3 isa representative distillation curve of a typical diesel fuel.
(iii) Starting Characteristics : The fuel should help in starting the engineeasily. This requirement demands high enough volatility to form a com-bustible mixture readily and a high cetane rating in order that the self-ignition temperature is low.
(iv) Smoking and Odour : The fuel should not promote either smoke or odourin the engine exhaust. Generally, good volatility is the first prerequisiteto ensure good mixing and therefore complete combustion.
(v) Viscosity : CI engine fuels should be able to flow through the fuel systemand the strainers under the lowest operating temperatures to which theengine is subjected to.
(vi) Corrosion and Wear : The fuel should not cause corrosion and wear ofthe engine components before or after combustion. These requirementsare directly related to the presence of sulphur, ash and residue in thefuel.
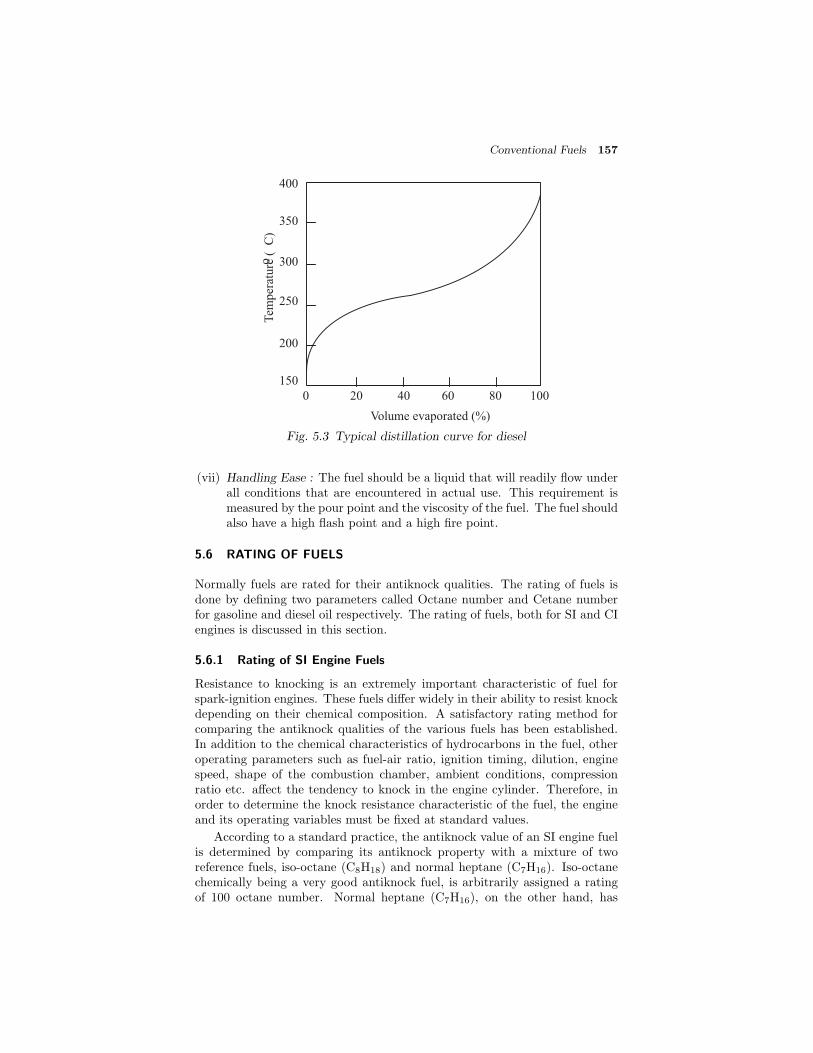
Conventional Fuels 157
Volume evaporated (%)
0 20 40 60 80 100
150
200
250
300
350
400
Tem
per
ature
( C
)o
Fig. 5.3 Typical distillation curve for diesel
(vii) Handling Ease : The fuel should be a liquid that will readily flow underall conditions that are encountered in actual use. This requirement ismeasured by the pour point and the viscosity of the fuel. The fuel shouldalso have a high flash point and a high fire point.
5.6 RATING OF FUELS
Normally fuels are rated for their antiknock qualities. The rating of fuels isdone by defining two parameters called Octane number and Cetane numberfor gasoline and diesel oil respectively. The rating of fuels, both for SI and CIengines is discussed in this section.
5.6.1 Rating of SI Engine Fuels
Resistance to knocking is an extremely important characteristic of fuel forspark-ignition engines. These fuels differ widely in their ability to resist knockdepending on their chemical composition. A satisfactory rating method forcomparing the antiknock qualities of the various fuels has been established.In addition to the chemical characteristics of hydrocarbons in the fuel, otheroperating parameters such as fuel-air ratio, ignition timing, dilution, enginespeed, shape of the combustion chamber, ambient conditions, compressionratio etc. affect the tendency to knock in the engine cylinder. Therefore, inorder to determine the knock resistance characteristic of the fuel, the engineand its operating variables must be fixed at standard values.
According to a standard practice, the antiknock value of an SI engine fuelis determined by comparing its antiknock property with a mixture of tworeference fuels, iso-octane (C8H18) and normal heptane (C7H16). Iso-octanechemically being a very good antiknock fuel, is arbitrarily assigned a ratingof 100 octane number. Normal heptane (C7H16), on the other hand, has

158 IC Engines
very poor antiknock qualities and is given a rating of 0 octane number. TheOctane number fuel is defined as the percentage, by volume, of iso-octanein a mixture of iso-octane and normal heptane, which exactly matches theknocking intensity of the fuel in a standard engine under a set of standardoperating conditions. The addition of certain compounds (e.g. tetraethyllead) to iso-octane produces fuels of greater antiknock quality (above 100octane number). The antiknock effectiveness of tetraethyl lead, for the samequantity of lead added, decreases as the total content of lead in the fuelincreases. Further, each octane number at the higher range of the octanescale will produce greater antiknock effect compared to the same unit at thelower end of the scale. For instance, octane number increase from 92 to 93produce greater antiknock effect than a similar increase from 32 to 33 octanenumber. Because of this non-linear variation, a new scale was derived whichexpresses the approximate relative engine performance and the units of thisscale are known as the Performance Numbers, PN . Octane numbers, ONabove 100 can be computed by
ON(> 100) = 100 +28.28A
1.0 + 0.736A +√
1.0 + 0.736A− 0.035216A2
where A is TEL in ml/gal of fuel, or from the performance number, PN ,
Octane Number = 100 +PN − 100
3
Laboratory Method: The engine is run at specified conditions with a defi-nite compression ratio and a definite blend of reference fuels. The intensity ofknock at these standard conditions is called standard knock. The knock meteris adjusted to give a particular reading under these conditions. The test fuel isnow used in the engine and air-fuel ratio is adjusted to give maximum knockintensity. The compression ratio of the engine is gradually changed until theknock meter reading is the same as in the previous run (standard knock).The compression ratio is now fixed and known blends of reference fuels areused in the engine. The blend of reference fuels which gives a knock meterreading equal to the standard value will match the knocking characteristicsof the test fuel. Percentage by volume of iso-octane in the particular blendgives the octane number.
5.6.2 Rating of CI Engine Fuels
In compression-ignition engines, the knock resistance depends on chemicalcharacteristics as well as on the operating and design conditions of the en-gine. Therefore, the knock rating of a diesel fuel is found by comparing thefuel under prescribed conditions of operation in a special engine with pri-mary reference fuels. The reference fuels are normal cetane, C16H34, whichis arbitrarily assigned a cetane number of 100 and alpha methyl naphthalene,C11H10, with an assigned cetane number of 0. Cetane number of a fuel isdefined as the percentage by volume of normal cetane in a mixture of normalcetane and α-methyl naphthalene which has the same ignition characteristics(ignition delay) as the test fuel when combustion is carried out in a stan-dard engine under specified operating conditions. Since ignition delay is the

Conventional Fuels 159
primary factor in controlling the initial autoignition in the CI engine, it isreasonable to conclude that knock should be directly related to the ignitiondelay of the fuel. Knock resistance property of diesel oil can be improved byadding small quantities of compounds like amyl nitrate, ethyl nitrate or ether.
Laboratory Method: The test is carried out in a standard single cylinderengine like the CFR diesel engine or Ricardo single cylinder variable compres-sion engine under the conditions shown in Table 5.3. The test fuel is first usedin the engine operating at the specified conditions. The fuel pump deliveryis adjusted to give a particular fuel-air ratio. The injection timing is also ad-justed to give an injection advance of 13 degrees. By varying the compressionratio the ignition delay can be increased or decreased until a position is foundwhere combustion begins at TDC. When this position is found, the test fuelundergoes a 13 degree ignition delay. The cetane number of the unknown fuel
Table 5.3 Conditions for ignition quality test on diesel fuels
Engine speed 900 rpmJacket water temperature 100 ◦CInlet air temperature 65.5 ◦CInjection advance Constant at 13◦bTDCIgnition delay 13◦
can be estimated by noting the compression ratio for 13 degree delay and thenreferring to a prepared chart showing the relationship between cetane numberand compression ratio. However, for accuracy two reference fuel blends differ-ing by not more than 5 cetane numbers are selected to bracket the unknownsample. The compression ratio is varied for each reference blend to reach thestandard ignition delay (13 degrees) and, by interpolation of the compressionratios, the cetane rating of the unknown fuel is determined.
Review Questions
5.1 What are the different kinds of fuels used in an IC engine?
5.2 Briefly explain the chemical structure of petroleum.
5.3 Give the general chemical formula of the following fuels: (i) paraffin (ii)olefin (iii) diolefin (iv) naphthene(v) aromatic Also state their moleculararrangements and mention whether they are saturated or unsaturated.
5.4 Briefly explain the petroleum refining process.
5.5 Discuss the significance of distillation curves.
5.6 Discuss the important qualities of an SI and CI engine fuel.
5.7 What is the effect of high sulphur content on the performance of SI andCI engines?
5.8 How are SI and CI engine fuels rated?

160 IC Engines
Multiple Choice Questions (choose the most appropriate answer)
1. Advantage of gaseous fuel is that
(a) it can be stored easily
(b) it can mix easily with air
(c) it can displace more air from the engine
(d) all of the above
2. Paraffins are in general represented by
(a) CnHn
(b) CnH2n
(c) CnH2n+2
(d) CnH2n−6
3. Paraffins have molecular structure of
(a) chain saturated
(b) chain unsaturated
(c) ring saturated
(d) ring unsaturated
4. Olefins are represented by the formula
(a) CnH2n
(b) CnH2n+2
(c) CnH2n−4
(d) CnH2n−6
5. Hydrocarbons are decomposed into smaller hydrocarbons by
(a) reforming
(b) refining
(c) cracking
(d) polymerization
6. The molecular structure of the straight-run gasoline is changed by
(a) cracking
(b) reforming
(c) refining
(d) boiling
Conventional Fuels 161
7. For SI engines fuels most preferred are
(a) aromatics
(b) paraffins
(c) olefins
(d) napthenes
8. For CI engine fuels most preferred are
(a) napthenes
(b) paraffins
(c) olefins
(d) aromatics
9. Octane number of iso-octane is
(a) 0
(b) 30
(c) 60
(d) 100
10. Ignition quality of diesel fuel is indicated by its
(a) octane number
(b) cetane number
(c) flash point
(d) fire point
11. Iso-octane has
(a) straight chain structure with 8 carbon atoms
(b) ring chain structure with 8 carbon atoms
(c) branched chain structure with 8 carbon atoms
(d) none of the above
12. An effective method to prevent detonation in SI engines is
(a) heating of the charge
(b) cooling of the charge
(c) increasing the charge pressure
(d) none of the above

162 IC Engines
13. The major constituent of natural gas
(a) butane
(b) ethane
(c) methane
(d) propane
14. Addition of tetraethyl lead in gasoline is being discontinued as
(a) it has bad odour
(b) it is costly
(c) decreases engine efficiency
(d) blocks the catalytic converter
15. Crude oil is separated into gasoline, kerosene and fuel oil by
(a) cracking
(b) heating
(c) fractional distillation
(d) reforming
16. Abnormal combustion in a SI engine causes
(a) high ratio of energy decrease
(b) excessive rise in pressure and temperature
(c) reduction in thermal efficiency
(d) all of the above
17. A good CI engine fuel should have
(a) high octane number
(b) very high cetane number
(c) a short ignition lag
(d) all of the above
18. Blending of fuel is the process of
(a) just mixing two fuels
(b) obtaining a product of desired quality
(c) mixing of fuel and air for combustion
(d) none of the above
Ans: 1. – (b) 2. – (c) 3. – (a) 4. – (a) 5. – (c)6. – (b) 7. – (a) 8. – (b) 9. – (d) 10. – (b)
11. – (c) 12. – (b) 13. – (c) 14. – (d) 15. – (c)16. – (d) 17. – (c) 18. – (b)

6ALTERNATE FUELS
6.1 INTRODUCTION
In this century, it is believed that crude oil and petroleum products will be-come very scarce and costly. Day-to-day, fuel economy of engines is gettingimproved and will continue to improve. However, enormous increase in num-ber of vehicles has started dictating the demand for fuel. Gasoline and dieselwill become scarce and most costly in the near future. With increased useand the depletion of fossil fuels, alternative fuel technology will become morecommon in the coming decades.
All these years there have always been some IC engines fuelled with non-gasoline or diesel oil fuels. However, their numbers have been relatively verysmall. Because of the high cost of petroleum products, some developing coun-tries are trying to use alternate fuels for their vehicles.
Another reason motivating the development of alternate fuels for the ICengine is the concern over the emission problems of gasoline and diesel engines.Combined with other air-polluting systems, the large number of automobilesis a major contributor to the air quality problem of the world. Quite a lot ofimprovements have been made in reducing emissions from automobile engines.If a 35% improvement made over a period of years, it is to be noted thatduring the same time the number of automobiles in the world increases by40%, thereby nullifying the improvement. Lot of efforts has gone into forachieving the net improvement in cleaning up automobile exhaust. However,more improvements are needed to bring down the ever-increasing air pollutiondue to automobile population.
A third reason for alternate fuel development is the fact that a large per-centage of crude oil must be imported from other countries which controlthe larger oil fields. As of now many alternate fuels have been used in lim-ited quantities in automobiles. Quite often, fleet vehicles have been used fortesting (e.g., taxies, delivery vans, utility company trucks). This paves wayfor comparison with similar gasoline-fuelled vehicles, and simplifies fuelling ofthese vehicles.
The engines used for alternate fuels are modified engines which were orig-inally designed for gasoline fuelling. They are, therefore, not the optimumdesign for the other fuels. Only when extensive research and development isdone over a period of years, maximum performance and efficiency can be re-alized from these engines. However, the research and development is difficultto justify until the fuels are accepted as viable for large numbers of engines.
Some diesel engines have started appearing on the market. They usemethanol or natural gas and a small amount of diesel fuel that is injectedat the proper time to ignite both fuels. Most alternate fuels are very costlyat present since the quantity used is very less. Many of these fuels will cost

164 IC Engines
much less if the amount of their usage gets to the same order of magnitudeas gasoline. The cost of manufacturing, distribution, and marketing would beless.
Another problem with alternate fuels is the lack of distribution points(service stations) where the fuel is available to the public. The public will bereluctant to purchase an automobile unless there is a large-scale network ofservice stations available where fuel for that automobile can be purchased. Onthe other hand, it is difficult to justify building a network of these service sta-tions until there are enough automobiles to make them profitable. Some citieshave started a few distribution points for some of these fuels, like propane,natural gas, LPG and methanol. The transfer from one major fuel type toanother will be a slow, costly, and sometimes painful process. In the followingsections we will discuss the various alternate fuels.
6.2 POSSIBLE ALTERNATIVES
Fuels are classified into three forms, viz. solid, liquid and gaseous. Presentday automobiles use mainly liquid fuels of petroleum origin. However, someuse gaseous fuels like CNG and LPG. It is interesting to note that duringearly days even solid fuels like coal, slurry and charcoal have been tried. Inthe following sections the various alternate fuels for IC engines are discussedin detail. Table 6.1 gives the properties of various fuels.
6.3 SOLID FUELS
Solid fuels are obsolete for IC engines. In order to have historical perspective,some of the earlier attempts are described in this section.
In the latter half of the 1800s, before petroleum-based fuels were perfected,many other fuels were tested and used in IC engines. When Rudolf Diesel wasdeveloping his engine, one of the fuels he used was a coal dust mixed withwater. Fine particles of coal (carbon) were dispersed in water and injectedand burned in early diesel engines. Although this never became a commonfuel, a number of experimental engines using this fuel have been built overthe last hundred years.
Even today, some work continues on this fuel technology. The majorimprovement in this type of fuel has been the reduction of the average coalparticle size. In 1894 the average particle size was on the order of 100 μ (1 μ =1 micron = 10−6 m). This was reduced to about 70 μ in the 1940–1970 periodand further reduced to about 10 μ by the early 1980s. The typical slurry isabout 50% coal and 50% water by mass. One major problem with this fuel isthe abrasiveness of the solid particles, which manifests itself in worn injectorsand piston rings.
Coal is an attractive fuel because of the availability in large quantity.However, as an engine fuel, other methods of use seem more feasible. Theseinclude liquefaction or gasification of the coal.
In the late 1930s and early 1940s petroleum products became very scarce,especially in Europe, due to World War II. Just about all gasoline productswere used by the German army, leaving no fuel for civilian automobile use.
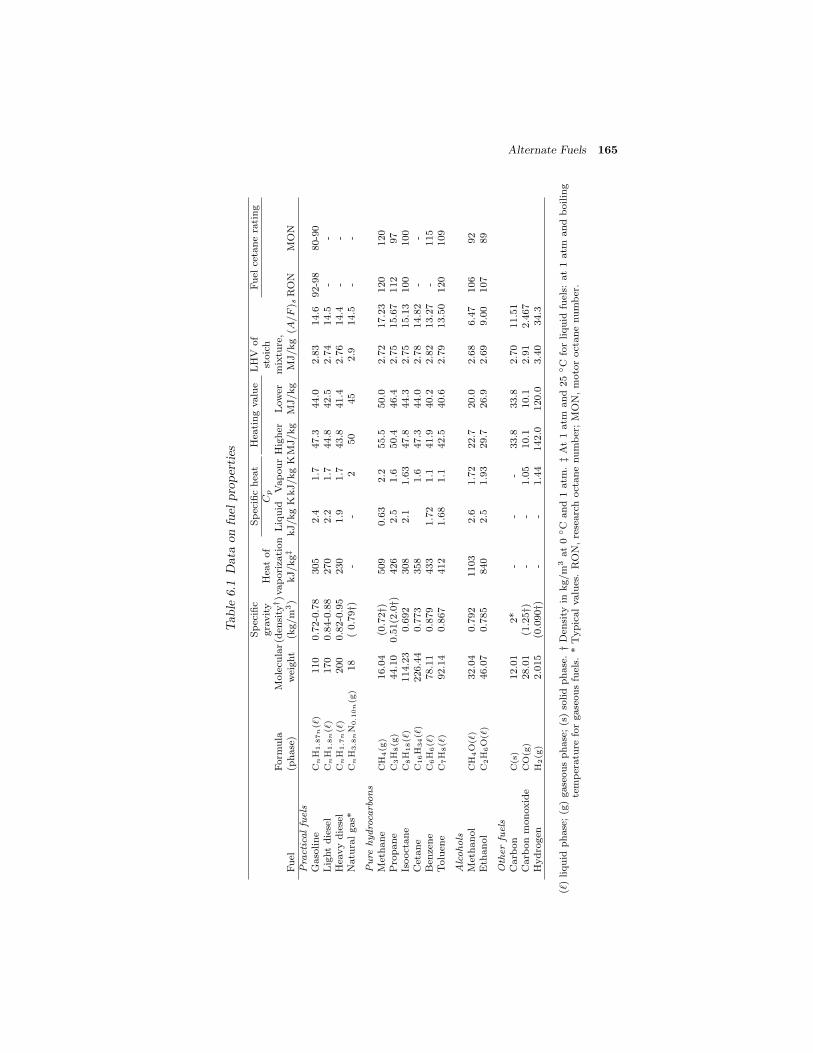
Alternate Fuels 165
Table6.1Dataonfuelproperties
Specific
Specificheat
Heatingvalue
LHV
of
Fuel
cetanerating
gravity
Heatof
Cp
stoich
Form
ula
Molecular(density†)vaporization
Liquid
VapourHigher
Lower
mixture,
Fuel
(phase)
weight
(kg/m3)
kJ/kg‡
kJ/kgKkJ/kgKMJ/kg
MJ/kg
MJ/kg(A
/F) sRON
MON
Practicalfuels
Gasoline
CnH1.87n( )
110
0.72-0.78
305
2.4
1.7
47.3
44.0
2.83
14.6
92-98
80-90
Lightdiesel
CnH1.8n( )
170
0.84-0.88
270
2.2
1.7
44.8
42.5
2.74
14.5
--
Heavydiesel
CnH1.7n( )
200
0.82-0.95
230
1.9
1.7
43.8
41.4
2.76
14.4
--
Naturalgas*
CnH3.8nN0.10n(g)
18
(0.79†)
--
250
45
2.9
14.5
--
Purehydrocarbons
Methane
CH4(g)
16.04
(0.72†)
509
0.63
2.2
55.5
50.0
2.72
17.23
120
120
Propane
C3H8(g)
44.10
0.51(2.0†)
426
2.5
1.6
50.4
46.4
2.75
15.67
112
97
Isooctane
C8H18( )
114.23
0.692
308
2.1
1.63
47.8
44.3
2.75
15.13
100
100
Cetane
C16H34( )
226.44
0.773
358
1.6
47.3
44.0
2.78
14.82
--
Benzene
C6H6( )
78.11
0.879
433
1.72
1.1
41.9
40.2
2.82
13.27
-115
Toluene
C7H8( )
92.14
0.867
412
1.68
1.1
42.5
40.6
2.79
13.50
120
109
Alcohols
Methanol
CH4O( )
32.04
0.792
1103
2.6
1.72
22.7
20.0
2.68
6.47
106
92
Ethanol
C2H6O( )
46.07
0.785
840
2.5
1.93
29.7
26.9
2.69
9.00
107
89
Otherfuels
Carbon
C(s)
12.01
2*
--
-33.8
33.8
2.70
11.51
Carbonmonoxide
CO(g)
28.01
(1.25†)
--
1.05
10.1
10.1
2.91
2.467
Hydrogen
H2(g)
2.015
(0.090†)
--
1.44
142.0
120.0
3.40
34.3
( )liquid
phase;(g)gaseousphase;(s)solidphase.†Density
inkg/m3at0◦C
and1atm
.‡At1atm
and25◦C
forliquid
fuels:
at1atm
andboiling
temperature
forgaseousfuels.
*Typicalvalues.RON,researchoctanenumber;MON,motoroctanenumber.
166 IC Engines
Although this was an inconvenience for the civilian population, it didnot stop them from using their beloved automobiles. Enterprising people inseveral countries, mainly Sweden and Germany, developed a way to operatetheir automobiles using solid fuels like charcoal, wood, or coal.
6.4 LIQUID FUELS
Liquid fuels are preferred for IC engines because they are easy to store andhave reasonably good calorific value. In the liquid fuel category the mainalternative is the alcohol.
6.4.1 Alcohol
Alcohols are an attractive alternate fuel because they can be obtained fromboth natural and manufactured sources. Methanol (methyl alcohol) andethanol (ethyl alcohol) are two kinds of alcohols that seem most promising.The advantages of alcohol as a fuel are:
(i) It can be obtained from a number of sources, both natural and manu-factured.
(ii) It is a high octane fuel with anti-knock index numbers (octane number)of over 100. Engines using high-octane fuel can run more efficiently byusing higher compression ratios. Alcohols have higher flame speed.
(iii) It produces less overall emissions compared to gasoline.
(iv) When alcohols are burned, it forms more moles of exhaust gases, whichgives higher pressure and more power in the expansion stroke.
(v) It has high latent heat of vapourization (hfg) which results in a coolerintake process. This raises the volumetric efficiency of the engine andreduces the required work input in the compression stroke.
(vi) Alcohols have low sulphur content in the fuel.
The disadvantages of alcohol as a fuel are:
(i) Alcohols have a low energy content or in other words the calorific valueof the fuel is almost half. This means that almost twice as much alcoholas gasoline must be burned to give the same energy input to the engine.With equal thermal efficiency and similar engine output usage, twice asmuch fuel would have to be purchased, and the distance which could bedriven with a given fuel tank volume would be cut in half. Automobilesas well as distribution stations would require twice as much storagecapacity, twice the number of storage facilities, twice the volume ofstorage at the service station, twice as many tank trucks and pipelines,etc. Even with the lower energy content of alcohol, engine power fora given displacement would be about the same. This is because of thelower air-fuel ratio needed by alcohol. Alcohol contains oxygen and thusrequires less air for stoichiometric combustion. More fuel can be burnedwith the same amount of air.

Alternate Fuels 167
(ii) Combustion of alcohols produces more aldehydes in the exhaust. If asmuch alcohol fuel was consumed as gasoline, aldehyde emissions wouldbe a serious exhaust pollution problem.
(iii) Alcohol is much more corrosive than gasoline on copper, brass, alu-minum, rubber, and many plastics. This puts some restrictions on thedesign and manufacturing of engines to be used with this fuel. Fuellines and tanks, gaskets, and even metal engine parts can deterioratewith long-term alcohol use (resulting in cracked fuel lines, the need forspecial fuel tank, etc). Methanol is very corrosive on metals.
(iv) It has poor cold weather starting characteristics due to low vapor pres-sure and evaporation. Alcohol-fuelled engines generally have difficulty instarting at temperatures below 10 ◦C. Often a small amount of gasolineis added to alcohol fuel, which greatly improves cold-weather starting.However, the need to do this greatly reduces the attractiveness of anyalternate fuel.
(v) Alcohols have poor ignition characteristics in general.
(vi) Alcohols have almost invisible flames, which is considered dangerouswhen handling fuel. A small amount of gasoline removes this danger.
(vii) There is the danger of storage tank flammability due to low vapor pres-sure. Air can leak into storage tanks and create a combustible mixture.
(viii) There will be less NOx emissions because of low flame temperatures.However, the resulting lower exhaust temperatures take longer time toheat the catalytic converter to an efficient operating temperature.
(ix) Many people find the strong odor of alcohol very offensive. Headachesand dizziness have been experienced when refueling an automobile.
(x) There is a possibility of vapor lock in fuel delivery systems.
6.4.2 Methanol
Of all the fuels being considered as an alternate to gasoline, methanol is oneof the most promising and has experienced major research and development.Pure methanol and mixtures of methanol and gasoline in various percentageshave been extensively tested in engines and vehicles for a number of years.The most common mixtures are M85 (85% methanol and 15% gasoline) andM10 (10% methanol and 90% gasoline). The data of these tests which includeperformance and emission levels are compared with pure gasoline (M0) andpure methanol (M100). Some smart flexible fuel (or variable fuel) engines arecapable of using any random mixture combination of methanol and gasolineranging from pure methanol to pure gasoline. Two fuel tanks are used andvarious flow rates of the two fuels can be pumped to the engine, passingthrough a mixing chamber. Using information from sensors in the intake andexhaust, the electronic monitoring system (EMS) adjusts to the proper air-fuel ratio, ignition timing, injection timing, and valve timing (where possible)for the fuel mixture being used.

168 IC Engines
One problem with gasoline-alcohol mixtures as a fuel is the tendency foralcohol to combine with any water present. When this happens the alcoholseparates locally from the gasoline, resulting in a non-homogeneous mixture.This causes the engine to run erratically due to the large air-fuel ratio differ-ences between the two fuels.
Methanol can be obtained from many sources, both fossil and renewable.These include coal, petroleum, natural gas, biomass, wood, landfills, and eventhe ocean. However, any source that requires extensive manufacturing orprocessing raises the price of the fuel.
Emissions from an engine using M10 fuel are about the same as those usinggasoline. The advantage (and disadvantage) of using this fuel is mainly the10% decrease in gasoline use. With M85 fuel there is a measurable decreasein HC and CO exhaust emissions. However, there is an increase in NOx anda large (≈ 500%) increase in formaldehyde emissions.
Methanol is used in some dual-fuel CI engines. Methanol by itself is not agood CI engine fuel because of its high octane number, but if a small amountof diesel oil is used for ignition, it can be used with good results. This is veryattractive for developing countries, because methanol can often be obtainedfrom much cheaper source than diesel oil.
6.4.3 Ethanol
Ethanol has been used as automobile fuel for many years in various countries ofthe world. Brazil is probably the leading user, where in the early 1990s. About5 million vehicles operated on fuels that were 93% ethanol. For a number ofyears gasohol (gasoline + alcohol) has been available at service stations in theUnited States. Gasohol is a mixture of 90% gasoline and 10% ethanol. Aswith methanol, the development of systems using mixtures of gasoline andethanol continues. Two mixture combinations that are important are E85(85% ethanol) and E10 (gasohol). E85 is basically an alcohol fuel with 15%gasoline added to eliminate some of the problems of pure alcohol (i.e., coldstarting, tank flammability, etc.). E10 reduces the use of gasoline with nomodification needed to the automobile engine. Flexible-fuel engines are beingtested which can operate on any ratio of ethanol-gasoline. Ethanol can bemade from ethylene or from fermentation of grains and sugar. Much of itis made from corn, sugar beets, sugar cane, and even cellulose (wood andpaper). The present cost of ethanol is high due to the manufacturing andprocessing required. This would be reduced if larger amounts of this fuel wereused. However, very high production would create a food-fuel competition,with resulting higher costs for both. Some studies show that at present inthe United States, crops grown for the production of ethanol consume moreenergy in ploughing, planting, harvesting, fermenting, and delivery than whatis in the final product. This defeats one major reason for using an alternatefuel. Ethanol has less HC emissions than gasoline but more than methanol.
6.4.4 Alcohol for SI Engines
Alcohols have higher antiknock characteristic compared to gasoline. As suchwith an alcohol fuel, engine compression ratios between 11:1 and 13:1 are

Alternate Fuels 169
usual. Today’s gasoline engines use a compression ratio of around 7:1 or 9:1,much too low for pure alcohol.
In a properly designed engine and fuel system, alcohol produces fewerharmful exhaust emissions. Alcohol contains about half the heat energy ofgasoline per litre. The stoichiometric air fuel ratio is lesser for alcohol thanfor gasoline. To provide a proper fuel air mixture, a carburetor or fuel injectorfuel passages should be doubled in area to allow extra fuel flow.
Alcohol does not vapourize as easily as gasoline. Its latent heat of vapour-ization is much greater. This affects cold weather starting. If the alcoholliquefies in the engine then it will not burn properly. Thus, the engine may bedifficult or even impossible to start in extremely cold climate. To overcomethis, gasoline is introduced in the engine until the engine starts and warmsup. Once the engine warms, alcohol when introduced will vapourize quicklyand completely and burn normally. Even during normal operation, additionalheat may have to be supplied to completely vapourize alcohol. Alcohol burnsat about half the speed of gasoline. As such, ignition timing must be changed,so that more spark advance is provided. This will give the slow burning alco-hol more time to develop the pressure and power in the cylinder. Moreover,corrosion resistant materials are required for fuel system since alcohols arecorrosive in nature.
6.4.5 Reformulated Gasoline for SI Engine
Reformulated gasoline is normal-type of gasoline with a slightly modified for-mulation and additives to help reduce engine emissions. Additives in the fuelinclude oxidation inhibitors, corrosion inhibitors, metal deactivators, deter-gents, and deposit control additives. Oxygenates such as methyl tertiary-butyl ether (MTBE) and alcohols are mixed, such that there is 1-3% oxygenby weight. This is to help in reducing CO in the exhaust. Levels of benzene,aromatic, and high boiling components are reduced, as is the vapor pressure.Recognizing that engine deposits contribute to emissions, cleaning additivesare included. Some additives clean carburetors, some clean fuel injectors, andsome clean intake valves, each of which often does not clean other components.
On the positive side is that all gasoline-fuelled engines, old and new, canuse this fuel without modification. On the negative side is that only moderateemission reduction is realized, cost is increased, and the use of petroleumproducts is not considerably reduced.
6.4.6 Water-Gasoline Mixture for SI Engines
The development of the spark-ignition engine has been accompanied by thedesire to raise the compression ratio for increased efficiency and fuel economy.One obstacle to this gain in economy at times has been the octane quality ofthe available gasoline. To circumvent this limitation, water was proposed asan antiknock additive.
Water addition to gasoline slows down the burning rate and reduces thegas temperature in the cylinder which probably suppresses detonation. En-gine combustion chamber deposit reductions have also been reported whenwater was added to the intake charge. With respect to nitric oxide emissions,

170 IC Engines
dramatic reductions were reported. Conversely, water addition probably in-creases hydrocarbon emissions. Finally, with respect to carbon monoxideemissions, water addition seems to have minimal effect. Only a very limitedwork has been carried out with the addition of water via an emulsion with thefuel rather than independently. Emulsion could eliminate the need for a sep-arate tank, provide improved atomization and increase fuel safety. However,a water-fuel separation problem may exist.
6.4.7 Alcohol for CI Engines
Techniques of using alcohol in diesel engines are
(i) Alcohol/diesel fuel solutions
(ii) Alcohol diesel emulsions.
(iii) Alcohol fumigation
(iv) Dual fuel injection
(v) Surface ignition of alcohols.
(vi) Spark ignition of alcohols
(vii) Alcohols containing ignition improving additives.
Both ethyl and methyl alcohols have high self ignition temperatures. Hence,very high compression ratios (25-27) will be required to self ignite them. Sincethis would make the engine extremely heavy and expensive, the better methodis to utilize them in dual fuel operation.
In the dual fuel engine, alcohol is carburetted or injected into the inductedair. Due to high self ignition temperature of alcohols there will be no com-bustion with the usual diesel compression ratios of 16 to 18. A little beforethe end of compression stroke, a small quantity of diesel oil is injected intothe combustion chamber through the normal diesel pump and spray nozzle.The diesel oil readily ignites and this initiates combustion in the alcohol airmixture also.
Several methods are adopted for induction of alcohol into the intake man-ifold. They are microfog unit, pneumatic spray nozzle, vapourizer, carburetorand fuel injector. The degree of fineness in mixing of fuel and air are differentfor the above methods.
Another method tried is to inject alcohol into the combustion chamberafter the diesel fuel injection. This way of alcohol injection avoids the alcoholcooling the charge in the cylinder to a degree which will jeopardize the ignitionof the diesel fuel. However, this design calls for two complete and separatefuel systems with tank, fuel pump, injection pump and injectors.
In the dual fuel engines mentioned above, major portion of the heat releaseis by the alcohol supplied and this alcohol is ignited by a pilot spray of dieseloil injection. The performance of the dual fuel engine is influenced by thefollowing properties of alcohols:
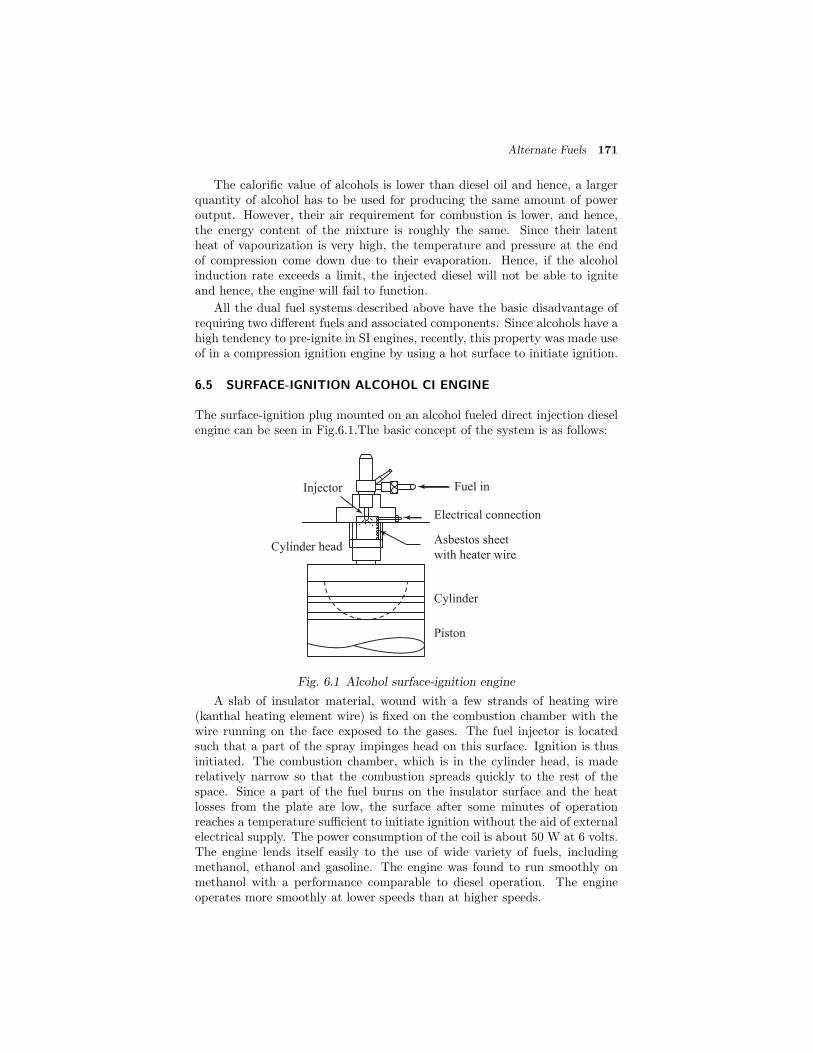
Alternate Fuels 171
The calorific value of alcohols is lower than diesel oil and hence, a largerquantity of alcohol has to be used for producing the same amount of poweroutput. However, their air requirement for combustion is lower, and hence,the energy content of the mixture is roughly the same. Since their latentheat of vapourization is very high, the temperature and pressure at the endof compression come down due to their evaporation. Hence, if the alcoholinduction rate exceeds a limit, the injected diesel will not be able to igniteand hence, the engine will fail to function.
All the dual fuel systems described above have the basic disadvantage ofrequiring two different fuels and associated components. Since alcohols have ahigh tendency to pre-ignite in SI engines, recently, this property was made useof in a compression ignition engine by using a hot surface to initiate ignition.
6.5 SURFACE-IGNITION ALCOHOL CI ENGINE
The surface-ignition plug mounted on an alcohol fueled direct injection dieselengine can be seen in Fig.6.1.The basic concept of the system is as follows:
Injector
Cylinder head
Fuel in
Electrical connection
Asbestos sheet
with heater wire
Cylinder
Piston
Fig. 6.1 Alcohol surface-ignition engine
A slab of insulator material, wound with a few strands of heating wire(kanthal heating element wire) is fixed on the combustion chamber with thewire running on the face exposed to the gases. The fuel injector is locatedsuch that a part of the spray impinges head on this surface. Ignition is thusinitiated. The combustion chamber, which is in the cylinder head, is maderelatively narrow so that the combustion spreads quickly to the rest of thespace. Since a part of the fuel burns on the insulator surface and the heatlosses from the plate are low, the surface after some minutes of operationreaches a temperature sufficient to initiate ignition without the aid of externalelectrical supply. The power consumption of the coil is about 50 W at 6 volts.The engine lends itself easily to the use of wide variety of fuels, includingmethanol, ethanol and gasoline. The engine was found to run smoothly onmethanol with a performance comparable to diesel operation. The engineoperates more smoothly at lower speeds than at higher speeds.

172 IC Engines
6.6 SPARK-ASSISTED DIESEL
In the future, it is predicted that broad cut fuel will appear as petroleumfuel. Alcohols and coal derived fuel will also penetrate as alternate fuels. Oneof the noted characteristics of these fuels is their low cetane value (cetanenumber of diesel : 55, gasoline : 13, ethano1 : 8, methano1 : 5). Hence, theappearance of these fuels might threaten the existence of diesel engine becausethe engine characteristics depend deeply upon high cetane value of fuel. Dieselengines have lot of advantages in its performance, especially in its high thermalefficiency. This advantage is very important in the future from the view pointof energy saving. Keeping this in mind, a leading industry in Japan hasdeveloped a spark assisted diesel engine which can operate with future lowcetane fuel without losing the characteristics of diesel engine. They havemodified the conventional precombustion chamber type diesel engine, whichhas a compression ratio of 19:1 by installing a spark plug in its precombustionchamber. The igniter used is the commercial CDI, multistrike type.
California Energy commission has conducted experiments on two transitbuses which are spark-assisted type. Both buses were tested in parallel withdiesel powered counterparts. In comparing diesel with methanol fuel, roadperformance was nearly identical for each pair of buses. The methanol buseshave a cleaner exhaust with smoke and odour eliminated. Oxides of nitrogenand particulates are also considerably lower with methanol.
6.7 VEGETABLE OIL
Vegetable oil is considered as one of the alternative fuels for diesel enginesHowever, the viscosity of vegetable oil is higher compared to diesel. Therefore,it must be lowered to allow for proper atomization in engines designed toburn diesel fuel. Otherwise, incomplete combustion and carbon build upwill ultimately damage the engine. Some literatures classify vegetable oilas Waste Vegetable Oil (WVO) and Straight Vegetable Oil (SVO) or PurePlant Oil (PPO) to distinguish it from biodiesel. Free fatty acids in WVOhave a detrimental effect on metals. Copper and its alloys, such as brass, areaffected by WVO. Zinc and zinc-plating are stripped by FFA’s and tin, lead,iron, and steel are affected too. Stainless steel and aluminum are generallyunaffected.
As of 2010, the United States was producing in excess of 12 billion litersof waste vegetable oil annually, mainly from industrial deep fryers in potatoprocessing plants, snack food factories and fast food restaurants. If all those12 billion liters could be collected and used to replace the energy equivalentamount of petroleum almost 1% of US oil consumption could be offset. It isto be noted that use of waste vegetable oil as a fuel, competes with some otheruses of the commodity. This has effects on its price as a fuel and increases itscost as an input to the other uses as well.
The main form of SVO/PPO used in various countries is rapeseed oil whichhas a freezing point of −10◦C. Use of sunflower oil, which gels at around−12◦C, is currently being investigated as a means of improving cold weatherstarting. Unfortunately oils with lower gelling points tend to be less saturated
Alternate Fuels 173
and polymerize more easily in the presence of atmospheric oxygen. Most dieselengines are suitable for the use of SVO/ PPO, with minor modifications.The relatively high kinematic viscosity of vegetable oils must be reduced tomake them compatible with conventional C I engines fuel systems. It canbe achieved either by co-solvent blending or can be reduced by preheating itusing waste heat from the engine or using electricity. However, it is to be keptin mind that higher rates of wear and failure in fuel pumps and piston ringsmay occur and it should be appropriately tackled.
One common solution is to add a heat exchanger, and an additional fueltank for ”normal” diesel fuel (petrodiesel or biodiesel) and a three way valveto switch between this additional tank and the main tank of SVO/PPO. En-gine reliability would depend on the condition of the engine. Attention tomaintenance of the engine, particularly of the fuel injectors, cooling systemand glow plugs will increase the life of the engine. Pure plant oil in contrastto waste vegetable oil, is not a byproduct of other industries, and thus itsprospects for use as fuel are not limited by the capacities of other industries.Production of vegetable oils for use as fuels is theoretically limited only bythe agricultural capacity of a given economy. However, doing so detracts fromthe supply of other uses of pure vegetable oil.
6.8 BIODIESEL
Biodiesel refers to a vegetable oil- or animal fat-based diesel engine fuel con-sisting of long-chain alkyl (ethyl, methyl, or propyl) esters. Biodiesel is typ-ically produced by chemically reacting lipids (e.g., vegetable oil, animal fat )with an alcohol.
Biodiesel is meant to be used in standard diesel engines. It is distinct fromthe vegetable and waste oils used in fuel converted diesel engines. Biodieselcan be used alone, or blended with petro-diesel. Biodiesel can also be used asa low carbon alternative to heating oil. Blends of biodiesel and conventionalhydrocarbon-based diesel are products most commonly distributed for use inthe retail diesel fuel marketplace. Much of the world uses a system known asthe ”B” factor to state the amount of biodiesel in any fuel mix.
(i) 100% biodiesel, 0% petro-diesel is labeled B100,
(ii) 20% biodiesel, 80% petro-diesel is labeled B20,
(iii) 5% biodiesel, 95% petro-diesel is labeled B5,
(iv) 2% biodiesel, 98% petro-diesel is labeled B2.
Blends, less than 20% biodiesel can be used in diesel engines without anyor with very minor modifications of the engine. Biodiesel can also be used inits pure form (B100), but may require certain engine modifications to avoidmaintenance and performance problems.
Biodiesel can be blended with petro-diesel at any concentration in mostdiesel engine injection pump. Biodiesel has been known to break down de-posits of residue in the fuel lines where petro-diesel has been used. As a
174 IC Engines
result, fuel filters may get clogged with particulates if a quick transition topure biodiesel is made. Therefore, it is recommended to change the fuel filterson engines and heaters shortly after first switching to a biodiesel blend. Fromthe year 2005, biodiesel use has been increasing all over the world.
6.8.1 Production
Biodiesel is commonly produced by the transesterification of the vegetableoil or animal fat feedstock. The following methods are usually adopted forcarrying out this transesterification reaction:
(i) common batch process,
(ii) supercritical processes,
(iii) ultrasonic methods, and
(iv) microwave methods.
Chemically, transesterified biodiesel comprises a mix of mono-alkyl esters oflong chain fatty acids. The most common form uses methanol (converted tosodium methoxide) to produce methyl esters. These are commonly referredto as Fatty Acid Methyl Ester - FAME. It is the cheapest alcohol available,though ethanol can be used to produce an ethyl ester. It is commonly referredto as Fatty Acid Ethyl Ester - FAEE. Higher alcohols such as isopropanol andbutanol have also been used. Higher molecular weight alcohols improve thecold flow properties of the resulting ester. However, it is at the cost of a lessefficient transesterification reaction. A lipid transesterification productionprocess is used to convert the base oil to the desired esters. Any free fattyacids (FFAs) in the base oil are either converted to soap and removed from theprocess, or they are esterified (yielding more biodiesel) using an acidic catalyst.After this processing, unlike straight vegetable oil, biodiesel has combustionproperties very similar to those of petroleum diesel, and can replace it in mostcurrent uses.
A by-product of the transesterification process is the production of glycerolResearch is being conducted globally to use this glycerol as a chemical buildingblock. Usually this crude glycerol has to be purified, typically by performingvacuum distillation. This is rather energy intensive. The refined glycerol(98%+ purity) can then be utilized directly, or converted into other products.A variety of oils can be used to produce biodiesel. These include:
Virgin oil feedstock: At present rapeseed and soybean oils are most com-monly used. It also can be obtained from field pennycress and jatropha andother crops such as mustard, flax, sunflower, palm oil, coconut, hemp etc.
Pure plant oil or straight vegetable oil: Production of vegetable oils foruse as fuels is theoretically limited only by the agricultural capacity of a giveneconomy. However, doing so detracts from the supply of other uses of purevegetable oil.
Animal fats: These include tallow, lard, yellow grease, chicken fat, and theby-products of the production of Omega-3 fatty acids from fish oil. Animalfats are a by-product of meat production. Although it would not be efficient to

Alternate Fuels 175
raise animals (or catch fish) simply for their fat However, producing biodieselwith animal fat that would have otherwise been discarded could replace asmall percentage of petro-diesel usage.
Algae: This can be grown using waste materials such as sewage and with-out displacing land currently used for food production.
Many believe that waste vegetable oil is the best source of oil to producebiodiesel, but since the available supply is very much less than the amount ofpetroleum-based fuel that is burned for transportation and home heating itmay not be a viable proposition in the near future.
6.8.2 Properties
Biodiesel has better lubricating properties and much higher cetane ratingsthan today’s lower sulphur petro-diesel fuels. Unlike SVO/PPO biodiesel ad-dition reduces fuel system wear, and increases the life of high pressure fuelinjection system equipment that relies on the fuel for its lubrication. Thecalorific value of biodiesel is lower than the petro-diesel which is about 37.27MJ/kg. This is 9% lower than regular petrodiesel. Variation in biodieselenergy density is more dependent on the feedstock used than the productionprocess. Still these variations are less than for petrodiesel. It has been claimedthat biodiesel gives better lubricity and more complete combustion thus in-creasing the engine energy output and partially compensating for the higherenergy density of petrodiesel.
Biodiesel is a liquid which varies in color between golden and dark browndepending on the production feedstock. It is immiscible with water, has a highboiling point and low vapor pressure. The flash point of biodiesel (> 130◦C) issignificantly higher than that of petroleum diesel (64◦C) or gasoline (−45◦C).Biodiesel has a density of 0.88 g/cc higher than petrodiesel (≈0.85 g/cc)
Biodiesel has virtually no sulphur content, and it is often used as an addi-tive to Ultra-Low Sulphur Diesel (ULSD) fuel to aid with lubrication, as thesulphur compounds in petrodiesel provide much of the lubricity.
6.8.3 Environmental Effects
The surge of interest in biodiesels has highlighted a number of environmentaleffects associated with its use. These potentially include reductions in green-house gas emissions, deforestation, pollution and the rate of biodegradation.According to the EPA’s Renewable Fuel Standards Program Regulatory Im-pact Analysis, released in February 2010, biodiesel from soy oil results, onaverage, in a 57% reduction in greenhouse gases compared to fossil diesel, andbiodiesel produced from waste grease results in an 86% reduction.
6.8.4 Current Research
There is ongoing research into finding more suitable crops and improving oilyield. Using the current yields, vast amounts of land and fresh water wouldbe needed to produce enough oil to completely replace fossil fuel usage. Itwould require twice the land area of the US to be devoted to soybean pro-duction, or two-thirds to be devoted to rapeseed production, to meet current
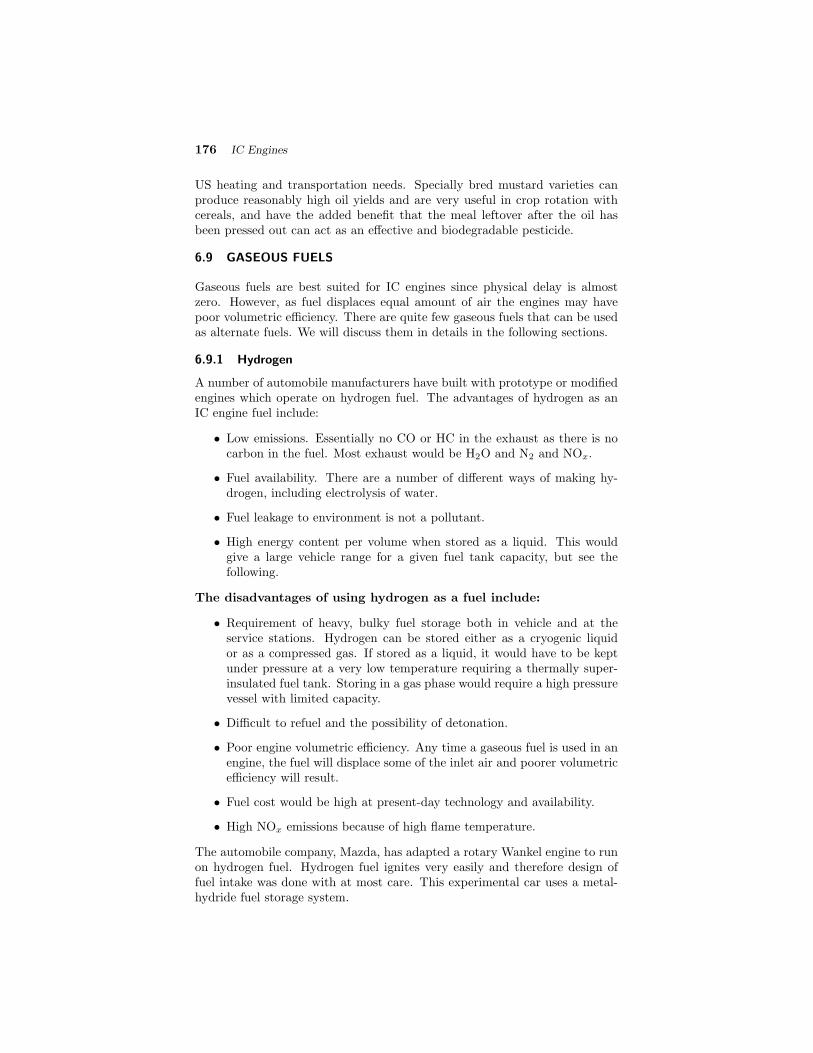
176 IC Engines
US heating and transportation needs. Specially bred mustard varieties canproduce reasonably high oil yields and are very useful in crop rotation withcereals, and have the added benefit that the meal leftover after the oil hasbeen pressed out can act as an effective and biodegradable pesticide.
6.9 GASEOUS FUELS
Gaseous fuels are best suited for IC engines since physical delay is almostzero. However, as fuel displaces equal amount of air the engines may havepoor volumetric efficiency. There are quite few gaseous fuels that can be usedas alternate fuels. We will discuss them in details in the following sections.
6.9.1 Hydrogen
A number of automobile manufacturers have built with prototype or modifiedengines which operate on hydrogen fuel. The advantages of hydrogen as anIC engine fuel include:
• Low emissions. Essentially no CO or HC in the exhaust as there is nocarbon in the fuel. Most exhaust would be H2O and N2 and NOx.
• Fuel availability. There are a number of different ways of making hy-drogen, including electrolysis of water.
• Fuel leakage to environment is not a pollutant.
• High energy content per volume when stored as a liquid. This wouldgive a large vehicle range for a given fuel tank capacity, but see thefollowing.
The disadvantages of using hydrogen as a fuel include:
• Requirement of heavy, bulky fuel storage both in vehicle and at theservice stations. Hydrogen can be stored either as a cryogenic liquidor as a compressed gas. If stored as a liquid, it would have to be keptunder pressure at a very low temperature requiring a thermally super-insulated fuel tank. Storing in a gas phase would require a high pressurevessel with limited capacity.
• Difficult to refuel and the possibility of detonation.
• Poor engine volumetric efficiency. Any time a gaseous fuel is used in anengine, the fuel will displace some of the inlet air and poorer volumetricefficiency will result.
• Fuel cost would be high at present-day technology and availability.
• High NOx emissions because of high flame temperature.
The automobile company, Mazda, has adapted a rotary Wankel engine to runon hydrogen fuel. Hydrogen fuel ignites very easily and therefore design offuel intake was done with at most care. This experimental car uses a metal-hydride fuel storage system.

Alternate Fuels 177
6.10 HYDROGEN ENGINES
Hydrogen is another alternate fuel tried for IC engines. Investigations werecarried out extensively in many countries. The most attractive features ofhydrogen as an IC engine fuel are that it can be produced from a potentiallyavailable raw material, water, and the main product of its combustion againis water.
Hydrogen has very low density both as gas and as liquid. Hence, in spiteof its high calorific value on mass basis its energy density as a liquid is onlyone fourth that of gasoline. As a gas it has less than one tenth the densityof air and its heating value per unit volume is less than one third that ofmethane. This is one of its chief disadvantages. Hydrogen has to be storedas compressed gas, as liquid (in cryogenic containers) or in absorbed form (asmetal hydrides), none of which is as convenient as gasoline storage.
Hydrogen has extremely wide ignition limits. This allows a spark ignitionengine to operate on hydrogen with very little throttling, a decided advantage.Stoichiometric hydrogen air mixture burns seven times as fast as the corre-sponding gasoline air mixture. This too is a great advantage in IC engines,leading to higher engine speeds and greater thermal efficiency. Hydrogen hasa high self-ignition temperature but requires very little energy to ignite it.Hence, it is highly prone to preignition and backflash in SI engines.
Adiabatic flame temperature for hydrogen is a little lower than for gasolinebut the rapid combustion allows very little heat loss to the surroundings andhence, high, instantaneous, local temperatures are produced. This leads tohigh nitric oxide formation.
Hydrogen can be used in SI engines by three methods:
(i) By manifold induction
(ii) By direct introduction of hydrogen into the cylinder.
(iii) By supplementing gasoline.
In the manifold introduction of hydrogen, cold hydrogen is introducedthrough a valve controlled passage into the manifold. This helps to reducethe risk of back flash. The power output of the engine is limited by twofactors, preignition and back flash. Also the energy content of air hydrogenmixture is lower than that of liquid hydrocarbon fuels.
In the direct introduction of hydrogen into the cylinder, hydrogen is storedin the liquid form in a cryogenic cylinder. A pump, pumps this liquid througha small heat exchanger where it is converted into cold hydrogen gas. Themetering of the hydrogen is also done in this unit. The cold hydrogen helpsto prevent preignition and also reduces NOx formation.
Hydrogen can also be used as a supplementary fuel to gasoline in SI en-gines. In this system, hydrogen is inducted along with gasoline, compressedand ignited by a spark. The arrangements of liquid hydrogen storage and de-tails of hydrogen induction into the SI engine cylinder can be seen in Figs.6.2and 6.3 respectively.
178 IC Engines
Piston
Cylinder
Spark plug
Exhaust
Air
H injector2 Small chamber,
high pressure GH
and metering device2
LH pump2
LH tank2
p = 0.5 atm gmax
Fig. 6.2 Liquid hydrogen storage and gaseous hydrogen injection system
There are two methods by which hydrogen can be used in diesel engines.
(i) By introducing hydrogen with air and using a spray of diesel oil to ignitethe mixture that is by the dual fuel mode. The limiting conditionsare when the diesel quantity is too small to produce effective ignition,that is failure of ignition and when the hydrogen air mixture is so richthat the combustion becomes unacceptably violent. In between theselimits, a wide range of diesel to hydrogen proportion can be tolerated.Investigations show that beyond a certain range (30 to 50% substitutionof diesel fuel by hydrogen),leads to violent pressure rise.
(ii) By introducing hydrogen directly into the cylinder at the end of com-pression. Since the self ignition temperature of hydrogen is very high,the gas spray is made to impinge on a hot glow plug in the combustionchamber i.e. by surface ignition. It is also possible to feed a very leanhydrogen air mixture during the intake into an engine and then injectthe bulk of the hydrogen towards the end of the compression stroke.
Since, hydrogen is a highly reactive fuel it requires great care in handling.Flash black arresters have to be provided between the engine and the storagetank to prevent flash back from going to the tank.
6.10.1 Natural Gas
Natural gas is found in various localities in oil and gas bearing sand stratalocated at various depths below the earth surface. The gas is usually underconsiderable pressure, and flows out naturally from the oil well. If the gas isused in an engine located near the well any entrained sand must be separatedfrom the gas before its use. Natural gas obtained from oil wells is calledcasing head gas. It is usually treated for the recovery of gasoline. After this,it is called dry gas. It is delivered into the pipeline systems to be used asfuel. Natural gas can be used in the production of natural gasoline. Naturalgas is a mixture of components, consisting mainly of methane (60–95%) withsmall amounts of other hydrocarbon fuel components. The composition variesconsiderably from place to place and from time to time. But usually contain

Alternate Fuels 179
Cam
Rocker arm
Valve spring
Valve Injector
Nozzle
Spark plug
Combustion chamber
Hydrogen
Fig. 6.3 Hydrogen induction in spark-ignition engine
a large amount of methane (CH4) and small amount of ethane C2H5. Inaddition, it contains various amounts of N2, CO2, He, and traces of othergases. Its sulphur content ranges from very little (sweet) to larger amounts(sour). It is stored as compressed natural gas (CNG) at pressures of 16 to25 bar, or as liquid natural gas (LNG) at pressures of 70 to 210 bar and atemperature around −160◦C. As a fuel, it works best in an engine system witha single-throttle body fuel injector. This gives a longer mixing time, which isneeded by this fuel. Tests using CNG in various sized vehicles continue to beconducted by government agencies and private industry.
6.10.2 Advantages of Natural Gas
Advantages of natural gas as a fuel include:
(i) Octane number is around 110, which makes it a very good SI enginefuel. Because of this high octane number the flame speed is higher andengines can operate with a high compression ratio.
(ii) Low engine emissions. Less aldehydes than with methanol.
(iii) Fuel is fairly abundant worldwide. It can be made from coal but theprocess of making is very costly.
6.10.3 Disadvantages of Natural Gas
Disadvantages of natural gas as an engine fuel:
(i) Low energy density resulting in low engine performance.
180 IC Engines
(ii) Low engine volumetric efficiency because it is a gaseous fuel.
(iii) Need for large pressurized fuel storage tank. There is some safety con-cern with a pressurized fuel tank.
(iv) Inconsistent fuel properties.
(v) Refueling is a slow process.
Some very large stationary CI engines operate on a fuel combination of methaneand diesel fuel. Methane is the major fuel, amounting to more than 90% ofthe total. It is supplied to the engine as a gas through high-pressure pipes. Asmall amount of high grade, low sulphur diesel fuel is used for ignition pur-poses. The net result is very clean running engines. These engines would alsobe good power plants for large ships, except that high-pressure gas pipes areundesirable on ships.
6.10.4 Compressed Natural Gas (CNG)
Petroleum and natural gas are obtained by the process of drilling wells. Asalready known crude petroleum is composed of hydrocarbons. It containssome amount of water, sulphur and other impurities. Petroleum when mixedwith natural gas produces a highly volatile liquid. This liquid is known asnatural gasoline. When this petroleum-natural gas mixture is cooled, thegasoline condenses.
The natural gas can be compressed and then it is called Compressed Natu-ral Gas (CNG). CNG is used to run an automobile vehicle just like LPG. TheCNG fuel feed system is similar to the LPG fuel feed system. CNG conversionkits are used to convert petrol-driven cars into CNG-driven cars. These kitscontain auxiliary parts like the converter, mixer and other essential parts re-quired for conversion. Emission levels and a comparison between CNG-drivenvehicles and petrol-driven vehicles are given in Table 6.2.
Table 6.2 Emission levels and comparison between CNG-driven vehicles andpetrol-driven vehicles
Emission levelsPollutants Emission norms
1977Petrol with cat-alytic converter
CNG with cat-alytic converter
CO (g/km) 5.60 0.92 0.05HC (g/km) – 0.36 0.24NOx (g/km) 1.92 0.25 0.93
6.10.5 Liquefied Petroleum Gas (LPG)
Propane and butane are obtained from oil and gas wells. They are also theproducts of the petroleum refining process. For automobile engines, two typesof LPG are used. One is propane and the other is butane. Sometimes, amixture of propane and butane is used as liquid petroleum gas in automobile

Alternate Fuels 181
engines. Liquid petroleum gases serve as fuel in place of petrol. They are usedwidely in buses, cars and trucks. Liquid petroleum gases are compressed andcooled to form liquid. This liquid is kept in pressure tanks which are sealed.Table 6.3 gives the comparison of petrol with LPG.
6.10.6 Advantages and Disadvantages of LPG
Liquefied petroleum gas has higher potential as an alternate fuel for IC en-gines. The advantages and disadvantages of using LPG are
Advantages :
(i) LPG contains less carbon than petrol. LPG powered vehicle produces50 per cent less carbon monoxide per kilometre, though only slightlyless nitrogen compounds. Therefore emission is much reduced by theuse of LPG.
(ii) LPG mixes with air at all temperatures.
(iii) In multi-cylinder engines a uniform mixture can be supplied to all cylin-ders.
(iv) Since the fuel is in the form of vapour, there is no crankcase dilution.
(v) Automobile engines can use propane, if they have high compressionratios (10:1).
(vi) LPG has high antiknock characteristics.
(vii) Its heat energy is about 80 per cent of gasoline, but its high octane valuecompensates the thermal efficiency of the engine.
(viii) Running on LPG translates into a cost saving of about 50%.
(ix) The engine may have a 50 per cent longer life.
Disadvantages :
(i) Engines are normally designed to take in a fixed volume of the mixtureof fuel and air. Therefore LPG will produce 10 per cent less horse powerfor a given engine, at full throttle.
(ii) The ignition temperature of LPG is somewhat higher than petrol. There-fore running on LPG could lead to a five per cent reduction in valve life.
(iii) A good cooling system is quite necessary, because LPG vaporizer usesengine coolant to provide the heat to convert the liquid LPG to gas.
(iv) The vehicle weight is increased due to the use of heavy pressure cylindersfor storing LPG .
(v) A special fuel feed system is required for liquid petroleum gas.
182 IC Engines
Table 6.3 Comparison of petrol and LPG
Petrol Liquefied Petroleum Gas (LPG)
Fuel consumption in petrol en-gine is less when compared toLPG.
Compared to petrol, running the en-gine on LPG results in around a 10%increase in consumption.
Petrol has odour LPG is odourless
Octane rating of petrol is 81 Octane rating of LPG is 110
Petrol engine is not as smooth asLPG engine
Due to higher octane rating, the com-bustion of LPG is smoother and knock-ing is eliminated and the engine runssmoothly.
In order to increase octane num-ber petrol required lead addi-tives.
LPG is lead-free with high octanenumber
The mixture of petrol and air al-ways leaks past the piston ringsand washes away the lubricatingoil from the upper cylinder wallsurfaces in the process. This re-sults in lack of lubricant whichcauses more wear. It also carrieswith it unburnt fuel components(black carbon) and falls into theengine oil. Thus the life of petrolengine is shorter.
When LPG leaks past the rings intothe crankcase, it does not wash oil fromcylinder walls and does not generateblack carbon. Hence, the lubricatinglayer is not washed away. Thereby, theengine life is increased by 50%
Due to formation of carbon de-posits on the spark plugs, the lifeof the spark plugs is shortened.
Due to absence of carbon deposits onthe electrodes of the spark plugs, thelife of the spark plugs is increased.
Carburetor supplies the mixtureof petrol and air in the properratio to the engine cylinders forcombustion.
The vaporizer functions as the carbure-tor when the engine runs on LPG. It isa control device that reduces LPG pres-sure, vaporizes it and supplies to the en-gine with a regular flow of gas as per theengine requirement.

Alternate Fuels 183
6.10.7 Future Scenario for LPG Vehicles
Cost saving, longer life of the engine and less emission will attract the publicfor making use of LPG run vehicles. Future of LPG Vehicles is bright, providedthe following improvements in the system are made.
(i) At present, in many countries LPG cylinders are used in the vehicles.The weight of the cylinders is a disadvantage. Some amount of power iswasted in carrying these cylinders along with the vehicles. However, indeveloped countries most LPG cars use LPG tanks. The tank is usuallythe same size as the spare wheel and fits snugly into the space for thespare wheel. Such LPG tanks instead of cylinders, should be used incars running on LPG.
(ii) Effort must be made to have more LPG filling stations at convenientlocations, so that LPG tanks can be filled up easily.
(iii) Safety devices are to be introduced to prevent accident due to explosionof gas cylinders or leakage in the gas pipes.
6.10.8 LPG (Propane) Fuel Feed System
Propane has been tested in fleet vehicles for a number of years. It is a goodhigh octane SI engine fuel and produces less emissions than gasoline: about60% less CO, 30% less HC, and 20% less NOx. Propane is stored as a liquidunder pressure and delivered through a high pressure line to the engine, whereit is vaporized. Hence, proper and sufficient precautions are to be takenbefore fitting the vehicle with the fuel feed system. Otherwise, there is everypossibility for gas leakage causing fire hazards. Being a gaseous fuel, it hasthe disadvantage of lower engine volumetric efficiency.
LPG (Propane) fuel feed system is shown in Fig.6.4. This fuel feed systemhas a storage tank placed in the rear portion of the vehicle. Vacuum filterfuel lock, the converter-regulator and the LPG propane carburetor are in frontside of the system. In the fuel feed system, liquid LPG is pushed through thefuel pipe line to the converter. The liquid is converted into vapour by theconverter. A large temperature drop occurs, as LPG changes from liquid tovapour. LPG should be prevented from freezing within the converter. Forthis purpose, the engine cooling water is passed close to the converter whichprevents the gas from freezing. LPG vapours move to the LPG propanecarburetor. This carburetor supplies the air-fuel mixture to the engine forcombustion. At present, LPG auto conversion kits are available for convertingpetrol run cars into LPG gas run cars. These kits contain auxiliaries like theconverter or pressure regulator, LPG vapour/air mixing unit known as themixer and other units which are essential for conversion from petrol-drivenvehicles to LPG-driven vehicles.
6.11 DUAL FUEL OPERATION
Automobiles can be made to run either on petrol or LPG. This dual fueloperation (refer Chapter 20) enables the user to change from LPG to petrol

184 IC Engines
LPG propane tank
unit at the rear side
Fuel lineVacuum filter
fuel lock
Converter regulator
LPG propane carburetor
Engine marked
in dotted lines
Fig. 6.4 Typical LPG propane fuel feed system of an automobile vehicle
or from petrol to LPG at his convenience by merely pressing a button. Onthe petrol line, there is an electro-mechanical solenoid. This device closes theflow of petrol during the operation of LPG and opens the petrol line whenthe engine is running on petrol.
6.12 OTHER POSSIBLE FUELS
Attempts to use many other types of fuel have been tried throughout thehistory of IC engines. Often, this was done out of necessity or to promotefinancial gain by some group. At present, a number of biomass fuels arebeing evaluated, mainly in Europe. These include fuel oil made from wood,barley, soya beans, rape seed, and even beef tallow. Advantages of these fuelsgenerally include availability and low cost, low sulphur, and low emissions.Disadvantages include low energy content (heating value) and correspondinghigh specific fuel consumption. Using technology first researched 20 yearsearlier, many enthusiasts converted their vehicles by building a combustionchamber in the trunk of the car or on a small trailer pulled by the car. In thiscombustion chamber, the coal, wood, or other solid or waste fuel was burnedwith a restricted supply of oxygen (air). This generated a supply of carbonmonoxide, which was then piped to the engine and used to fuel the engine.
Obviously the carburetor on the engine had to be modified and adjustedto supply the gaseous fuel and to give the correct air-fuel ratio. When thiswas done, the automobile could be operated, but with much less power andlongevity. Impurities from the CO generator very quickly dirtied up the com-bustion chambers of the engine, even when extensive filtering was done. An-other problem was with leakage of CO, which is a poisonous, odorless, colorlessgas. When this occurred and CO got into the passenger compartment, thedriver and other occupants were in danger of sickness and death. Drivers sub-jected to CO would react as if intoxicated in much the same way as a drunkdriver, with the same results of erratic driving, accidents, and even death. Aslate as the 1970, Sweden was still working on the development of this methodof using solid fuel to power automobiles.
6.12.1 Biogas
Biogas is another alternate fuel tried in diesels. Biogas can be produced byanaerobic digestion of organic matter. Potential raw materials available on

Alternate Fuels 185
a large scale are cow dung, municipal wastes, and plants specially grown forthis purpose like water hyacinth, algae, certain types of grasses. The mainadvantage of bio-gas is that it can be produced in rural areas from readilyavailable materials. Bio gas consists mainly of methane and carbon dioxide.Its calorific value is low but its knock resistance (octane number) is high andignition quality (cetane number) is low. In dual fuel type diesel engine, thegas is mixed with the incoming air and ignited by pilot diesel fuel injection.Similar to the behaviour of alcohol diesel oil dual fuel engines, this gas enginealso suffers a fall in efficiency at part loads, compared to the diesel engine,but has good efficiency at full power output.
6.12.2 Producer Gas
Producer gas is made by flowing air and steam through a thick coal or cokebed which ranges in temperature from red hot to low temperature. Theoxygen in the air burns the carbon to CO2. This CO2 gets reduced to CO bycontacting with carbon above the combustion zone. Steam gets dissociated,which introduces H2 and the freed O2 combines with the carbon. Producergas has a high percentage of N2, since air is used. Thus, it has a low heatvalue.
6.12.3 Blast Furnace Gas
Blast furnace gas is a byproduct of melting iron ore in steel plants. Its analysisvaries considerably with the fuel used and the method of operating the blastfurnace. It consists principally CO and N2. It is similar to producer gas andhas a low heat value. It contains lot of dust particles and therefore should becleaned thoroughly.
6.12.4 Coke Oven Gas
Coke oven gas is obtained as a byproduct when making coke. Its analysisdepends upon the coal used and also upon the method of operating the oven.The volatile portion of coal is driven off by the application of heat, and theheavier hydrocarbons are cracked, which results in a gas high in H2 and CH4.Its heat value per cubic meter is only about one half that of natural gas.
6.12.5 Benzol
Benzol is a coal tar distillate that consists of about 70% benzene (C6H6), 20percent toluene (C7H8) and 10% xylene (C8H10) and trace amounts of sulphurburning compounds. It has high antiknock characteristic. It has a freezingpoint of 6 ◦C, which eliminates it as a fuel in cold climates. Its specific gravityis 0.88, specific heat 0.4, latent heat of vapourisation about (440 kJ/kg) andviscosity about 20 SSU. It is considerably less detonating than gasoline. Assuch compression ratio upto 6.9 can be used. When added to gasoline itimproves the antiknock effect. About 20% of benzol addition is found to stopknocking in most gasoline engines.

186 IC Engines
6.12.6 Acetone
Acetone (C3H60) is more volatile than methanol. This may be used as a fuelwithout blending with other volatile fuels. Its antiknock quality is higher thanthat of butanol. Hence, it is a desirable fuel to blend with butanol.
6.12.7 Diethyl Ether
Diethyl ether (C4H10O) is a very volatile fuel. It is used with other fuelsto increase the volatility of the blend. In summary it may be stated thatwith increasing air pollution problems and a petroleum shortage looming onthe horizon, major research and development programs are being conductedthroughout the world to find suitable alternate fuels to supply engine needsfor the coming decades.
Review Questions
6.1 Explain the reasons for looking for alternate fuels for IC engines.
6.2 Can one use solid fuels for IC engines? If so how?
6.3 Explain alcohols as alternate fuels for IC engines bringing out their mer-its and demerits.
6.4 Explain the possibility of using reformulated gasoline and water-gasolinemixture as alternate fuel.
6.5 Can alcohol be used for CI engines? Explain.
6.6 Explain with a neat sketch the surface-ignition alcohol engine.
6.7 What are the advantages and disadvantages of using hydrogen in SIengine?
6.8 Explain the two methods by which hydrogen can be used in CI engine.
6.9 What is natural gas? What are the advantages and disadvantages ofusing natural gas as alternate fuels?
6.10 Give a brief account of LPG being used as an alternate fuel in SI engine.
6.11 What are the advantages and disadvantages of using LPG in SI engines?
6.12 Compare LPG and petrol as fuel for SI engines.
6.13 Explain the possibilities of using dual-fuel systems in engines.
6.14 With a sketch explain LPG (propane) fuel feed system.
6.15 What all other possible fuels for engines? Explain.

Alternate Fuels 187
Multiple Choice Questions (choose the most appropriate answer)
1. Which of the following statements is not correct with respect to alcoholsas alternate fuels in IC engines
(a) anti-knock characteristics of alcohol is poor
(b) alcohol contains about half the heat energy of gasoline/litre
(c) alcohol does not vaporize as easily as gasoline
(d) alcohols are corrosive in nature
2. Gasohol is a mixture of
(a) 90% ethanol + 10% gasoline
(b) 10% ethanol + 90% gasoline
(c) 40% ethanol + 60% gasoline
(d) 50% ethanol + 50% gasoline
3. Stoichiometric air-fuel ratio of alcohol when compared to gasoline is
(a) higher
(b) lower
(c) equal
(d) none of the above
4. Small amount of gasoline is often added to alcohol to
(a) reduce the emission
(b) to increase the power output
(c) to increase the efficiency
(d) to improve cold weather starting
5. Methanol by itself is not a good CI engine fuel because
(a) its octane number is high
(b) its cetane number is low
(c) both (a) and (b)
(d) none of the above
6. Anti-knock characteristics of alcohol when compared to gasoline is
(a) higher
(b) lower
(c) equal
(d) none of the above

188 IC Engines
7. Alcohols alone cannot be used in CI engines as
(a) their self ignition temperature is high
(b) latent heat of vaporization is low
(c) both (a) and (b)
(d) none of the above
8. Advantage of hydrogen as an IC engine fuel
(a) high volumetric efficiency
(b) low fuel cost
(c) No HC and CO emissions
(d) relatively safe
9. Disadvantage of hydrogen as a fuel in IC engine
(a) storage is easy
(b) low NOx emissions
(c) detonating tendency
(d) easy handling
10. Major constituent of natural gas is
(a) ethane
(b) methane
(c) propane
(d) butane
11. Octane number of natural gas is
(a) 60–80
(b) 80–100
(c) >100
(d) <60
12. Major disadvantage of LPG as a fuel in automobile is
(a) reduction in life of the engine
(b) less power compared to gasoline
(c) both (a) and (b)
(d) knocking tendency
Ans: 1. – (a) 2. – (b) 3. – (b) 4. – (d) 5. – (c)6. – (a) 7. – (c) 8. – (c) 9. – (c) 10. – (b)
11. – (c) 12. – (c)
7CARBURETION
7.1 INTRODUCTION
Spark-ignition engines normally use volatile liquid fuels. Preparation of fuel-air mixture is done outside the engine cylinder and formation of a homoge-neous mixture is normally not completed in the inlet manifold. Fuel dropletswhich remain in suspension continue to evaporate and mix with air even dur-ing suction and compression processes. The process of mixture preparation isextremely important for spark-ignition engines. The purpose of carburetionis to provide a combustible mixture of fuel and air in the required quantityand quality for efficient operation of the engine under all conditions.
7.2 DEFINITION OF CARBURETION
The process of formation of a combustible fuel-air mixture by mixing theproper amount of fuel with air before admission to engine cylinder is calledcarburetion and the device which does this job is called a carburetor.
7.3 FACTORS AFFECTING CARBURETION
Of the various factors, the process of carburetion is influenced by
(i) the engine speed
(ii) the vapourization characteristics of the fuel
(iii) the temperature of the incoming air and
(iv) the design of the carburetor
Since modern engines are of high speed type, the time available for mixtureformation is very limited. For example, an engine running at 3000 rpm hasonly about 10 milliseconds (ms) for mixture induction during intake stroke.When the speed becomes 6000 rpm the time available is only 5 ms. Therefore,in order to have high quality carburetion (that is mixture with high vapourcontent) the velocity of the air stream at the point where the fuel is injectedhas to be increased. This is achieved by introducing a venturi section in thepath of the air. The fuel is discharged from the main metering jet at theminimum cross section of the venturi (called throat).
Other factors which ensure high quality carburetion within a short periodare the presence of highly volatile hydrocarbons in the fuel. Therefore, suitableevaporation characteristics of the fuel, indicated by its distillation curve, arenecessary for efficient carburetion especially at high engine speeds.

190 IC Engines
The temperature and pressure of surrounding air has a large influence onefficient carburetion. Higher atmospheric air temperature increases the vapor-ization of fuel (percentage of fuel vapour increases with increase in mixturetemperature) and produces a more homogeneous mixture. An increase in at-mospheric temperature, however, leads to a decrease in power output of theengine when the air-fuel ratio is constant due to reduced mass flow into thecylinder or, in other words, reduced volumetric efficiency.
The design of the carburetor, the intake system and the combustion cham-ber have considerable influence on uniform distribution of mixture to thevarious cylinders of the engine. Proper design of carburetor elements aloneensures the supply of desired composition of the mixture under different op-erating conditions of the engine.
7.4 AIR–FUEL MIXTURES
An engine is generally operated at different loads and speeds. For this, properair-fuel mixture should be supplied to the engine cylinder. Fuel and air aremixed to form three different types of mixtures.
(i) chemically correct mixture
(ii) rich mixture and
(iii) lean mixture
Chemically correct or stoichiometric mixture is one in which there is justenough air for complete combustion of the fuel. For example, to burn one kgof octane (C8H18) completely 15.12 kg of air is required. Hence chemicallycorrect A/F ratio for C8H18 is 15.12:1; usually approximated to 15:1. Thischemically correct mixture will vary only slightly in numerical value betweendifferent hydrocarbon fuels. It is always computed from the chemical equationfor complete combustion for a particular fuel. Complete combustion means allcarbon in the fuel is converted to CO2 and all hydrogen to H2O.
A mixture which contains less air than the stoichiometric requirement iscalled a rich mixture (example, A/F ratio of 12:1, 10:1 etc.).
A mixture which contains more air than the stoichiometric requirement iscalled a lean mixture (example, A/F ratio of 17:1, 20:1 etc.).
There is, however, a limited range of A/F ratios in a homogeneous mixture,only within which combustion in an SI engine will occur. Outside this range,the ratio is either too rich or too lean to sustain flame propagation. Thisrange of useful A/F ratio runs from approximately 9:1 (rich) to 19:1 (lean)as indicated in Fig.7.1
The carburetor should provide an A/F ratio in accordance with engineoperating requirements and this ratio must be within the combustible range.
7.5 MIXTURE REQUIREMENTS AT DIFFERENT LOADS AND SPEEDS
The air-fuel ratio at which an engine operates has a considerable influence onits performance. Consider an engine operating at full throttle and constant

Carburetion 191
Excess fuel Excess air
Air-fuel ratio
Too rich to burn
Too lean to burn
9 15 19
Combustible range
Fig. 7.1 Useful air-fuel mixture range of gasoline
speed with varying A/F ratio. Under these conditions, the A/F ratio willaffect both the power output and the brake specific fuel consumption, asindicated by the typical curves shown in Fig.7.2. The mixture correspondingto the maximum output on the curve is called the best power mixture with anA/F ratio of approximately 12:1. The mixture corresponding to the minimumpoint on the bsfc curve is called the best economy mixture. The A/F ratiois approximately 16:1. It may be noted that the best power mixture is muchricher than the chemically correct mixture and the best economy mixture isslightly leaner than the chemically correct.
Stoichiometric mixture
Pow
er o
utp
ut
(kW
)
A/F ratio (kg of air/kg of fuel)
Best economy
8 10 12 14 16 18 20 22
bsfc
Power output
Best power
bsf
c (k
g/k
W h
)
Fig. 7.2 Variation of power output and bsfc with air-fuel ratio for an SI engine
Figure 7.2 is based on full throttle operation. The A/F ratios for the bestpower and best economy at part throttle are not strictly the same as at fullthrottle. If the A/F ratios for best power and best economy are constantover the full range of throttle operation and if the influence of other factorsis disregarded, the ideal fuel metering device would be merely a two positioncarburetor. Such a carburetor could be set for the best power mixture whenmaximum performance is desired and for the best economy mixture when theprimary consideration is the fuel economy. These two settings are indicatedin Fig.7.3 by the solid horizontal lines X–X and Z–Z , respectively. Actualengine requirements, however, again preclude the use of such a simple andconvenient arrangement. These requirements are discussed in the succeedingsection.

192 IC Engines
Under normal conditions it is desirable to run the engine on the maximumeconomy mixture, viz., around 16:1 air-fuel ratio. For quick acceleration andfor maximum power, rich mixture, viz., 12:1 air-fuel ratio is required.
7.6 AUTOMOTIVE ENGINE AIR–FUEL MIXTURE REQUIREMENTS
Actual air-fuel mixture requirements in an automotive engine vary consider-ably from the ideal conditions discussed in the previous section. For successfuloperation of the engine, the carburetor has to provide mixtures which followthe general shape of the curve ABCD (single cylinder) and A B C D (multi-cylinder) in Fig.7.3 which represents a typical automotive engine requirement.The carburetor must be suitably designed to meet the various engine require-ments.
As indicated in Fig.7.3 there are three general ranges of throttle operation.In each of these, the automotive engine requirements differ. As a result, thecarburetor must be able to supply the required air-fuel ratio to satisfy thesedemands. These ranges are:
(i) Idling (mixture must be enriched)
(ii) Cruising (mixture must be leaned)
(iii) High Power (mixture must be enriched)
Best economy
Idling range Cruising range Power range
Multicylinder
Single cylinder
Best power
Lea
nR
ich
0 50 100
A/F
rat
io (
kg o
f ai
r/kg o
f fu
el)
A'
A
Z
B'
B Z'
D'
D
X'
C'
C
Throttle opening (%)
X
Fig. 7.3 Anticipated carburetor performance to fulfill engine requirements
7.6.1 Idling Range
An idling engine is one which operates at no load and with nearly closed throt-tle. Under idling conditions, the engine requires a rich mixture, as indicatedby point A in Fig.7.3. This is due to the existing pressure conditions withinthe combustion chamber and the intake manifold which cause exhaust gas

Carburetion 193
dilution of the fresh charge. The pressures indicated in Fig.7.4 are represen-tative values which exist during idling. The exhaust gas pressure at the end ofthe exhaust stroke does not vary greatly from the value indicated in Fig.7.4,regardless of the throttle position. Since, the clearance volume is constant,the mass of exhaust gas in the cylinder at the end of the exhaust stroke tendsto remain fairly constant throughout the idling range. The amount of freshcharge brought in during idling, however, is much less than that during fullthrottle operation, due to very small opening of the throttle (Fig.7.4). Thisresults in a much larger proportion of exhaust gas being mixed with the freshcharge under idling conditions.
Further, with nearly closed throttle the pressure in the intake manifold isconsiderably below atmospheric due to restriction to the air flow. When theintake valve opens, the pressure differential between the combustion chamberand the intake manifold results in initial backward flow of exhaust gases intothe intake manifold. As the piston proceeds down on the intake stroke, theseexhaust gases are drawn back into the cylinder, along with the fresh charge.As a result, the final mixture of fuel and air in the combustion chamberis diluted more by exhaust gas. The presence of this exhaust gas tends toobstruct the contact of fuel and air particles — a requirement necessary forcombustion. This results in poor combustion and, as a result, in loss of power.It is, therefore, necessary to provide more fuel particles by richening the air-fuel mixture. This richening increases the probability of contact between fueland air particles and thus improves combustion.
Fuel
Air
ThrottleIV EV
Intake manifold
Combustion chamber
(1.02 bar)
0.3 bar 1 bar
Cylinder
Carburetor
Fig. 7.4 Schematic diagram of combustion chamber and induction system atthe start of intake stroke
As the throttle is gradually opened from A to B, (Fig.7.3), the pressuredifferential between the inlet manifold and the cylinder becomes smaller andthe exhaust gas dilution of the fresh charge diminishes. Mixture requirementsthen proceed along line AB (Fig.7.3) to a leaner A/F ratio required for thecruising operation.
7.6.2 Cruising Range
In the cruising range from B to C (Fig.7.3), the exhaust gas dilution problemis relatively insignificant. The primary interest lies in obtaining the maximumfuel economy. Consequently, in this range, it is desirable that the carburetorprovides the engine with the best economy mixture.

194 IC Engines
7.6.3 Power Range
During peak power operation the engine requires a richer mixture, as indicatedby the line CD (Fig.7.3), for the following reasons
(i) To provide best power: Since high power is desired, it is logical totransfer the economy settings of the cruising range to that mixture whichwill produce the maximum power, or a setting in the vicinity of the bestpower mixture, usually in the range of 12:1.
(ii) To prevent overheating of exhaust valve and the area near it: At highpower, the increased mass of gas at higher temperatures passing throughthe cylinder results in the necessity of transferring greater quantities ofheat away from critical areas such as those around the exhaust valve.Enrichening the mixture reduces the flame temperature and the cylindertemperature. This reduces the cooling problem and also reduces thetendency to damage exhaust valves at high power. In the cruising range,the mass of charge is smaller and the tendency to burn the exhaust valveis not as high.
In an automobile engine, indication of knocking is available in the form ofan audible sound and the operator can make the engine operating conditionsless stringent by releasing the throttle or by shifting to a lower gear. Fur-thermore, automobile engines generally operate well below full power and acomplicated and expensive system for enrichment for this purpose is not eco-nomically feasible, although some means of richening at high power is usuallyincorporated. For aircraft engine installations, the complication and expenseis justified because of the necessity to increase power during takeoff.
Figure 7.3, then, is better representative of a typical engine requirementsfor the carburetor. Automobile engine requirements are similar in the idlingand cruising ranges but tend to be relatively lower or less rich, in the powerrange (C to D in Fig.7.5). A more representative engine requirement curvefor automobiles is shown in Fig.7.5. The portion of the curve from D toE indicates the requirements after the throttle is wide open and the load isfurther increased.
Simple carburetor
Wide open throttle
Part throttle
A
B
E
C
D
F
0 2 4 6 8 10
10
14
18
22
Air
-fuel
rat
io
(kg o
f ai
r/kg o
f fu
el)
Air flow (m /min)3
Fig. 7.5 Performance curve of an automobile carburetor

Carburetion 195
7.7 PRINCIPLE OF CARBURETION
Both air and gasoline are drawn through the carburetor and into the enginecylinders by the suction created by the downward movement of the piston.This suction is due to an increase in the volume of the cylinder and a con-sequent decrease in the gas pressure in this chamber. It is the difference inpressure between the atmosphere and cylinder that causes the air to flowinto the chamber. In the carburetor, air passing into the combustion cham-ber picks up fuel discharged from a tube. This tube has a fine orifice calledcarburetor jet which is exposed to the air path. The rate at which fuel isdischarged into the air depends on the pressure difference or pressure headbetween the float chamber and the throat of the venturi and on the area ofthe outlet of the tube. In order that the fuel drawn from the nozzle may bethoroughly atomized, the suction effect must be strong and the nozzle outletcomparatively small. In order to produce a strong suction, the pipe in thecarburetor carrying air to the engine is made to have a restriction. At thisrestriction called throat due to increase in velocity of flow, a suction effect iscreated. The restriction is made in the form of a venturi as shown in Fig.7.6to minimize throttling losses. The end of the fuel jet is located at the venturior throat of the carburetor.
The geometry of venturi tube is as shown in Fig.7.6. It has a narrowerpath at the centre so that the flow area through which the air must pass isconsiderably reduced. As the same amount of air must pass through everypoint in the tube, its velocity will be greatest at the narrowest point. Thesmaller the area, the greater will be the velocity of the air, and thereby thesuction is proportionately increased (see the manometer in the Fig.7.6).
Air
Fig. 7.6 Operation of the venturi tube
As mentioned earlier, the opening of the fuel discharge jet is usually locatedwhere the suction is maximum. Normally, this is just below the narrowestsection of the venturi tube. The spray of gasoline from the nozzle and theair entering through the venturi tube are mixed together in this region anda combustible mixture is formed which passes through the intake manifoldinto the cylinders. Most of the fuel gets atomized and simultaneously a smallpart will be vapourized. Increased air velocity at the throat of the venturihelps the rate of evaporation of fuel. The difficulty of obtaining a mixture of
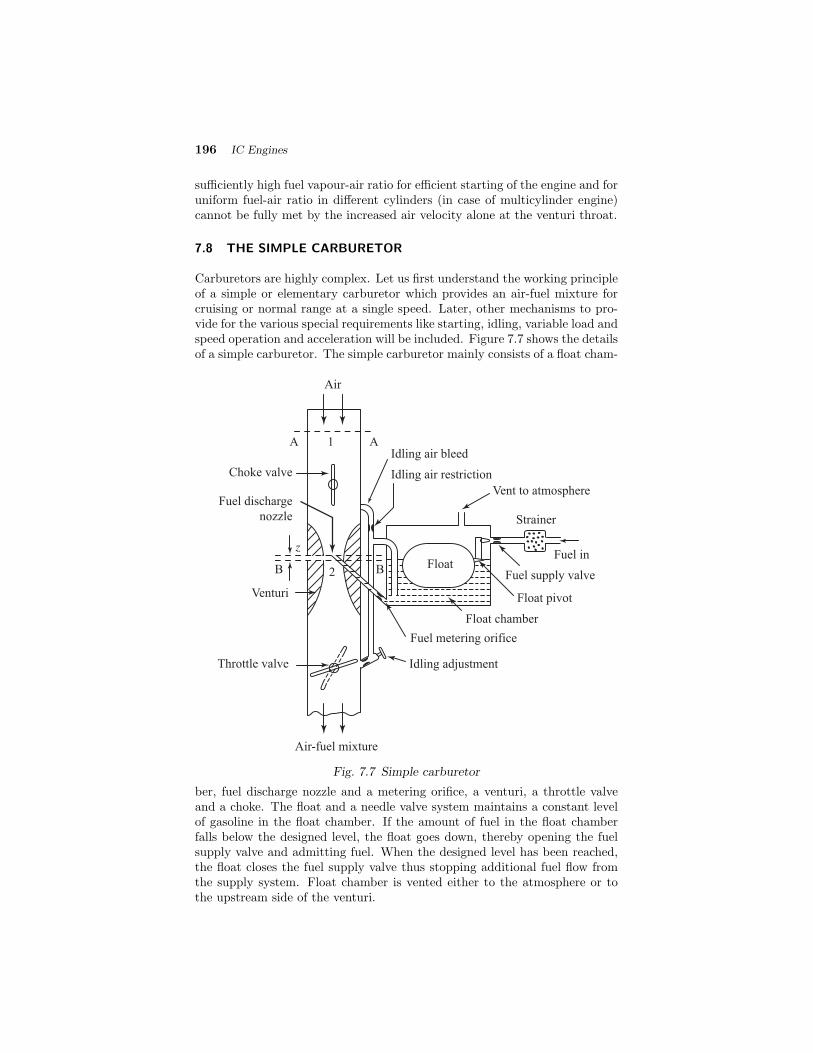
196 IC Engines
sufficiently high fuel vapour-air ratio for efficient starting of the engine and foruniform fuel-air ratio in different cylinders (in case of multicylinder engine)cannot be fully met by the increased air velocity alone at the venturi throat.
7.8 THE SIMPLE CARBURETOR
Carburetors are highly complex. Let us first understand the working principleof a simple or elementary carburetor which provides an air-fuel mixture forcruising or normal range at a single speed. Later, other mechanisms to pro-vide for the various special requirements like starting, idling, variable load andspeed operation and acceleration will be included. Figure 7.7 shows the detailsof a simple carburetor. The simple carburetor mainly consists of a float cham-
Venturi
Choke valve
Idling air bleed
Idling air restriction
Vent to atmosphere
Fuel in
Fuel supply valve
Float pivot
Float chamber
Fuel metering orifice
Idling adjustmentThrottle valve
Air-fuel mixture
Fuel discharge
nozzle
Air
Float
Strainer
A A1
B B2
z
Fig. 7.7 Simple carburetor
ber, fuel discharge nozzle and a metering orifice, a venturi, a throttle valveand a choke. The float and a needle valve system maintains a constant levelof gasoline in the float chamber. If the amount of fuel in the float chamberfalls below the designed level, the float goes down, thereby opening the fuelsupply valve and admitting fuel. When the designed level has been reached,the float closes the fuel supply valve thus stopping additional fuel flow fromthe supply system. Float chamber is vented either to the atmosphere or tothe upstream side of the venturi.
Carburetion 197
During suction stroke air is drawn through the venturi. As already de-scribed, venturi is a tube of decreasing cross-section with a minimum area atthe throat. Venturi tube is also known as the choke tube and is so shapedthat it offers minimum resistance to the air flow. As the air passes throughthe venturi the velocity increases reaching a maximum at the venturi throat.Correspondingly, the pressure decreases reaching a minimum. From the floatchamber, the fuel is fed to a discharge jet, the tip of which is located in thethroat of the venturi. Because of the differential pressure between the floatchamber and the throat of the venturi, known as carburetor depression, fuelis discharged into the air stream. The fuel discharge is affected by the sizeof the discharge jet and it is chosen to give the required air-fuel ratio. Thepressure at the throat at the fully open throttle condition lies between 4 to 5cm of Hg, below atmospheric and seldom exceeds 8 cm Hg below atmospheric.To avoid overflow of fuel through the jet, the level of the liquid in the floatchamber is maintained at a level slightly below the tip of the discharge jet.This is called the tip of the nozzle. The difference in the height between thetop of the nozzle and the float chamber level is marked h in Fig.7.7.
The gasoline engine is quantity governed, which means that when poweroutput is to be varied at a particular speed, the amount of charge deliveredto the cylinder is varied. This is achieved by means of a throttle valve usuallyof the butterfly type which is situated after the venturi tube. As the throttleis closed less air flows through the venturi tube and less is the quantity ofair-fuel mixture delivered to the cylinder and hence power output is reduced.As the throttle is opened, more air flows through the choke tube resulting inincreased quantity of mixture being delivered to the engine. This increasesthe engine power output.
A simple carburetor of the type described above suffers from a fundamen-tal drawback in that it provides the required A/F ratio only at one throttleposition. At the other throttle positions the mixture is either leaner or richerdepending on whether the throttle is opened less or more. As the throttleopening is varied, the air flow varies and creates a certain pressure differen-tial between the float chamber and the venturi throat. The same pressuredifferential regulates the flow of fuel through the nozzle. Therefore, the ve-locity of flow of air and fuel vary in a similar manner. At the same time, thedensity of air decreases as the pressure at the venturi throat decreases withincreasing air flow whereas that of the fuel remains unchanged. This resultsin a simple carburetor producing a progressively rich mixture with increasingthrottle opening. The mathematical analysis of the performance of a simplecarburetor is given in the next section.
7.9 CALCULATION OF THE AIR–FUEL RATIO
A simple carburetor with the tip of the fuel nozzle h metres above the fuellevel in the float chamber is shown in Fig.7.7. It may be noted that the densityof air is not the same at the inlet to the carburetor (section A–A, point 1)and the venturi throat (section B–B, point 2). The calculation of exact airmass flow involves taking this change in density or compressibility of air intoaccount.

198 IC Engines
Applying the steady flow energy equation to sections AA and B–B andassuming unit mass flow of air, we have,
q − w = (h2 − h1) +1
2
C22 − C2
1
(7.1)
Here q, w are the heat and work transfers from entrance to throat and h andC stand for enthalpy and velocity respectively.
Assuming an adiabatic flow, we get q = 0, w = 0 and C1 ≈ 0,
C2 =
2(h1 − h2) (7.2)
Assuming air to behave like ideal gas, we get h = CpT . Hence, Eq.7.2 can bewritten as,
C2 =
2Cp(T1 − T2) (7.3)
As the flow process from inlet to the venturi throat can be considered to beisentropic, we have
T2T1
=
p2p1
( γ−1
γ )(7.4)
T1 − T2 = T1
1−
p2p1
( γ−1
γ )
(7.5)
Substituting Eq.7.5 in Eq.7.3, we get
C2 =
2CpT1
1−
p2p1
( γ−1
γ )
(7.6)
Now, mass flow of air,
ma = ρ1A1C1 = ρ2A2C2 (7.7)
where A1 and A2 are the cross-sectional area at the air inlet (point 1) andventuri throat (point 2).
To calculate the mass flow rate of air at venturi throat, we have
p1/ργ1 = p2/ρ
γ2 (7.8)
ρ2 = (p2/p1)1/γρ1
ma =
p2p1
1/γρ1A2
2CpT1
1− p2
p1
γ−1
γ
(7.9)
=
p2p1
1/γp1
RT1A2
2CpT1
1−
p2p1
γ−1
γ
Carburetion 199
=A2p1
R√
T1
2Cp
p2p1
2γ
−
p2p1
γ+1γ
(7.10)
Substituting Cp = 1005 J/kg K, γ = 1.4 and R = 287 J/kg K for air,
ma = 0.1562A2p1√
T1
p2p1
1.43−
p2p1
1.71
= 0.1562A2p1√
T1φ kg/s (7.11)
where
φ =
p2p1
1.43−
p2p1
1.71(7.12)
Here, p is in N/m2, A is in m2 and T is in K.
Equation 7.11 gives the theoretical mass flow rate. To get the actualmass flow rate, the above equation should be multiplied by the co-efficient ofdischarge for the venturi, Cda.
maactual = 0.1562CdaA2p1√
T1φ (7.13)
Since Cda and A2 are constants for a given venturi,
maactual ∝ p1√T1
φ (7.14)
In order to calculate the air-fuel ratio, fuel flow rate is to be calculated.As the fuel is incompressible, applying Bernoulli’s Theorem we get
p1ρf− p2
ρf=
C2f
2+ gz (7.15)
where ρf is the density of fuel, Cf is the fuel velocity at the nozzle exit andz is the height of the nozzle exit above the level of fuel in the float bowl
Cf =
2
p1 − p2
ρf− gz
Mass flow rate of fuel,
mf = AfCfρf (7.16)
= Af
2ρf p1 − p2 − gzρf
(7.17)
where Af is the area of cross-section of the nozzle and ρf is the density of thefuel

200 IC Engines
mfactual = CdfAf
2ρf p1 − p2 − gzρf
(7.18)
where Cdf is the coefficient of discharge for fuel nozzle
A/F ratio =maactual
mfactual
A
F= 0.1562
Cda
Cdf
A2
Af
p1φ 2T1ρf
p1 − p2 − gzρf
(7.19)
7.9.1 Air–Fuel Ratio Neglecting Compressibility of Air
When air is considered as incompressible, Bernoulli’s theorem is applicable toair flow also. Hence, assuming U1 ≈ 0
p1ρa− p2
ρa=
C22
2(7.20)
C2 =
2
p1 − p2
ρa
(7.21)
ma = A2C2ρa = A2
2ρa p1 − p2
(7.22)
maactual = CdaA2
2ρa p1 − p2
(7.23)
A/F ratio =ma
mf
=Cda
Cdf
A2
Af
ρa p1 − p2
ρf p1 − p2 − gzρf
(7.24)
If z = 0ma
mf=
Cda
Cdf
A2
Af
!ρaρf
(7.25)
7.9.2 Air–Fuel Ratio Provided by a Simple Carburetor
(i) It is clear from expression for mf (Eq.7.17) that if (p1 − p2) is less thangzρf there is no fuel flow and this can happen at very low air flow. Asthe air flow increases, (p1−p2) increases and when (p1−p2) > gzρf thefuel flow begins and increases with increase in the differential pressure.
(ii) At high air flows where (p1− p2) is large compared to gzρf the fractiongzρf/(p1 − p2) becomes negligible and the air-fuel ratio approaches
Cda
Cdf
A2
Af
!ρaρf

Carburetion 201
(iii) A decrease in the density of air reduces the value of air-fuel ratio (i.e.,mixture becomes richer). It happens at
(a) high air flow rates where (p1− p2) becomes large and ρ2 decreases.
(b) high altitudes where the density of air is low.
7.9.3 Size of the Carburetor
The size of a carburetor is generally given in terms of the diameter of theventuri tube in mm and the jet size in hundredths of a millimeter. Thecalibrated jets have a stamped number which gives the flow in ml/min undera head of 500 mm of pure benzol.
For a venturi of 30 to 35 mm size (having a jet size which is one sixteenthof venturi size) the pressure difference (p1 − p2) is about 50 mm of Hg. Thevelocity at throat is about 90 - 100 m/s and the coefficient of discharge forventuri Cda is usually 0.85.
7.10 ESSENTIAL PARTS OF A CARBURETOR
A carburetor consists essentially of the following parts, viz.
(i) fuel strainer
(ii) float chamber
(iii) main fuel metering and idling nozzles
(iv) choke and throttle
Various parts mentioned above are discussed briefly in the following sections.
7.10.1 The Fuel Strainer
As the gasoline has to pass through a narrow nozzle exit there is every pos-sibility that the nozzle may get clogged during prolonged operation of theengine. To prevent possible blockage of the nozzle by dust particles, the gaso-line is filtered by installing a fuel strainer at the inlet to the float chamber(Fig.7.8). The strainer consists of a fine wire mesh or other type of filteringdevice, cone shaped or cylindrical shaped. The strainer is usually removableso that it can be taken out and cleaned thoroughly. It is retained in its seatby a strainer plug or a compression spring.
7.10.2 The Float Chamber
The function of a float chamber in a carburetor is to supply the fuel to thenozzle at a constant pressure head. This is possible by maintaining a constantlevel of the fuel in the float bowl. The float in a carburetor is designedto control the level of fuel in the float chamber. This fuel level must bemaintained slightly below the discharge nozzle outlet holes in order to providethe correct amount of fuel flow and to prevent leakage of fuel from the nozzlewhen the engine is not operating. The arrangement of a float mechanism in

202 IC Engines
Fuel in
Fuel supply valveFloat
Strainer
z
Fig. 7.8 Strainer
relation to the discharge nozzle is shown in Fig.7.9. When the float rises withthe fuel coming in, the fuel supply valve closes and stops the flow of fuel intothe chamber. At this point, the level of the fuel is correct for proper operationof the carburetor.
As shown in Fig.7.9, the float valve mechanism includes a fuel supplyvalve and a pivot. During the operation of the carburetor, the float assumesa position slightly below its highest level to allow a valve opening sufficientfor replacement of the fuel as it is drawn out through the discharge nozzle.
7.10.3 The Main Metering and Idling System
The main metering system of the carburetor controls the fuel feed for cruisingand full throttle operations (Fig.7.10). It consists of three principal units:
(i) the fuel metering orifice through which fuel is drawn from the floatchamber
(ii) the main discharge nozzle
(iii) the passage leading to the idling system
The three functions of the main metering system are
(i) to proportion the fuel-air mixture
(ii) to decrease the pressure at the discharge nozzle exit
(iii) to limit the air flow at full throttle
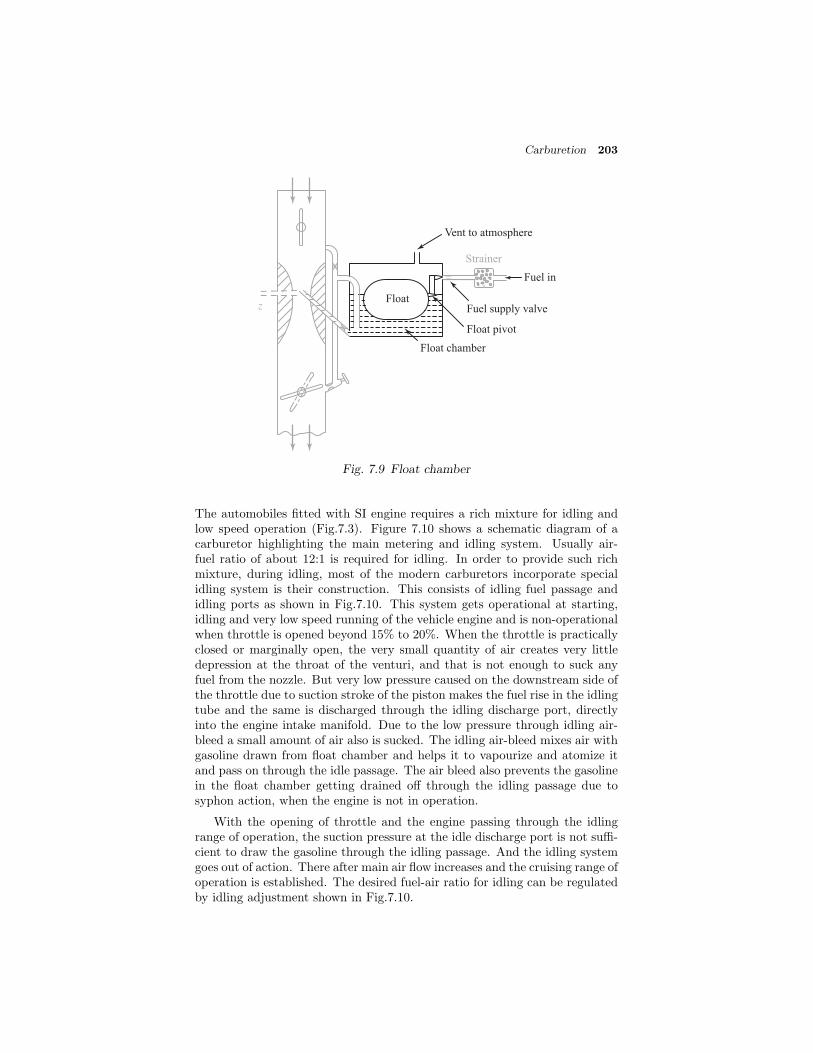
Carburetion 203
Vent to atmosphere
Fuel in
Fuel supply valve
Float pivot
Float chamber
Float
Strainer
z
Fig. 7.9 Float chamber
The automobiles fitted with SI engine requires a rich mixture for idling andlow speed operation (Fig.7.3). Figure 7.10 shows a schematic diagram of acarburetor highlighting the main metering and idling system. Usually air-fuel ratio of about 12:1 is required for idling. In order to provide such richmixture, during idling, most of the modern carburetors incorporate specialidling system is their construction. This consists of idling fuel passage andidling ports as shown in Fig.7.10. This system gets operational at starting,idling and very low speed running of the vehicle engine and is non-operationalwhen throttle is opened beyond 15% to 20%. When the throttle is practicallyclosed or marginally open, the very small quantity of air creates very littledepression at the throat of the venturi, and that is not enough to suck anyfuel from the nozzle. But very low pressure caused on the downstream side ofthe throttle due to suction stroke of the piston makes the fuel rise in the idlingtube and the same is discharged through the idling discharge port, directlyinto the engine intake manifold. Due to the low pressure through idling air-bleed a small amount of air also is sucked. The idling air-bleed mixes air withgasoline drawn from float chamber and helps it to vapourize and atomize itand pass on through the idle passage. The air bleed also prevents the gasolinein the float chamber getting drained off through the idling passage due tosyphon action, when the engine is not in operation.
With the opening of throttle and the engine passing through the idlingrange of operation, the suction pressure at the idle discharge port is not suffi-cient to draw the gasoline through the idling passage. And the idling systemgoes out of action. There after main air flow increases and the cruising range ofoperation is established. The desired fuel-air ratio for idling can be regulatedby idling adjustment shown in Fig.7.10.
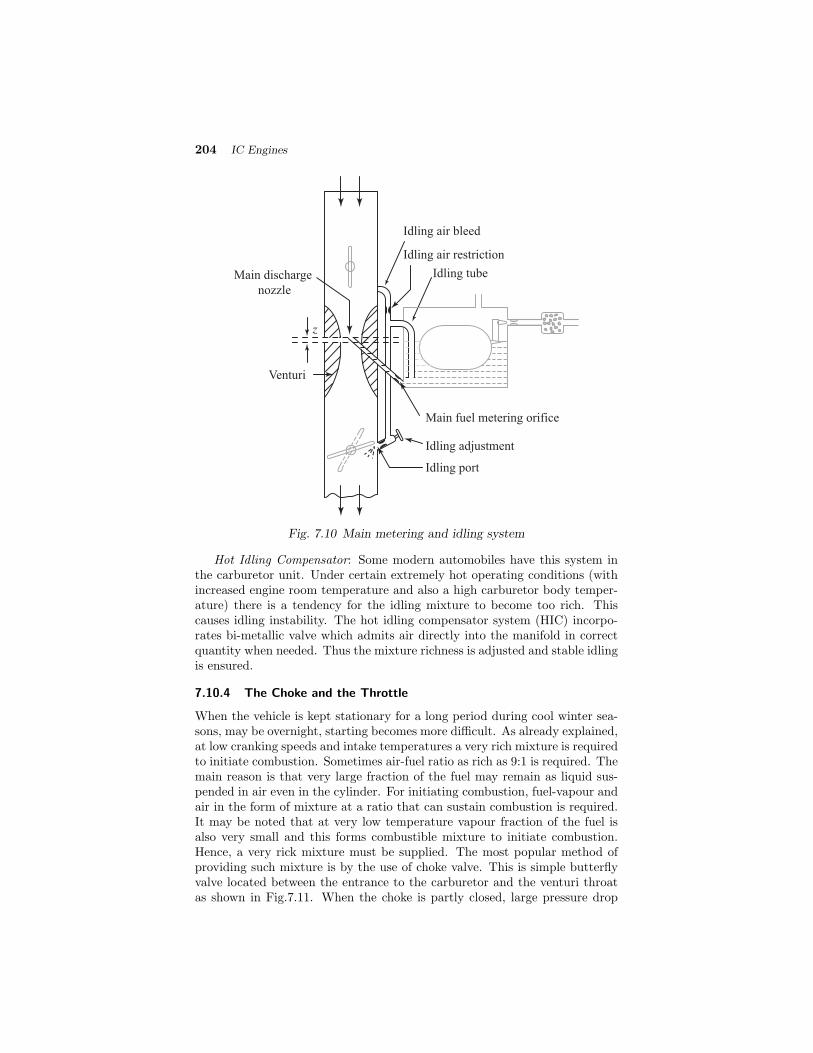
204 IC Engines
Venturi
Idling air bleed
Idling air restriction
Main fuel metering orifice
Idling adjustment
z
Main discharge
nozzle
Idling tube
Idling port
Fig. 7.10 Main metering and idling system
Hot Idling Compensator: Some modern automobiles have this system inthe carburetor unit. Under certain extremely hot operating conditions (withincreased engine room temperature and also a high carburetor body temper-ature) there is a tendency for the idling mixture to become too rich. Thiscauses idling instability. The hot idling compensator system (HIC) incorpo-rates bi-metallic valve which admits air directly into the manifold in correctquantity when needed. Thus the mixture richness is adjusted and stable idlingis ensured.
7.10.4 The Choke and the Throttle
When the vehicle is kept stationary for a long period during cool winter sea-sons, may be overnight, starting becomes more difficult. As already explained,at low cranking speeds and intake temperatures a very rich mixture is requiredto initiate combustion. Sometimes air-fuel ratio as rich as 9:1 is required. Themain reason is that very large fraction of the fuel may remain as liquid sus-pended in air even in the cylinder. For initiating combustion, fuel-vapour andair in the form of mixture at a ratio that can sustain combustion is required.It may be noted that at very low temperature vapour fraction of the fuel isalso very small and this forms combustible mixture to initiate combustion.Hence, a very rick mixture must be supplied. The most popular method ofproviding such mixture is by the use of choke valve. This is simple butterflyvalve located between the entrance to the carburetor and the venturi throatas shown in Fig.7.11. When the choke is partly closed, large pressure drop

Carburetion 205
occurs at the venturi throat that would normally result from the quantityof air passing through the venturi throat. The very large depression at thethroat inducts large amount of fuel from the main nozzle and provides a veryrich mixture so that the ratio of the evaporated fuel to air in the cylinder iswithin the combustible limits. Sometimes, the choke valves are spring loadedto ensure that large carburetor depression and excessive choking does notpersist after the engine has started, and reached a desired speed. This chokecan be made to operate automatically by means of a thermostat so that thechoke is closed when engine is cold and goes out of operation when enginewarms up after starting. The speed and the output of an engine is controlled
Choke valve
Throttle valve
z
Fig. 7.11 Choke and the throttle
by the use of the throttle valve, which is located on the downstream side ofthe venturi. The more the throttle is closed the greater is the obstruction tothe flow of the mixture placed in the passage and the less is the quantity ofmixture delivered to the cylinders. The decreased quantity of mixture gives aless powerful impulse to the pistons and the output of the engine is reducedaccordingly. As the throttle is opened, the output of the engine increases.Opening the throttle usually increases the speed of the engine. But this isnot always the case as the load on the engine is also a factor. For example,opening the throttle when the motor vehicle is starting to climb a hill may ormay not increase the vehicle speed, depending upon the steepness of the hilland the extent of throttle opening. In short, the throttle is simply a meansto regulate the output of the engine by varying the quantity of charge goinginto the cylinder (Fig.7.11).
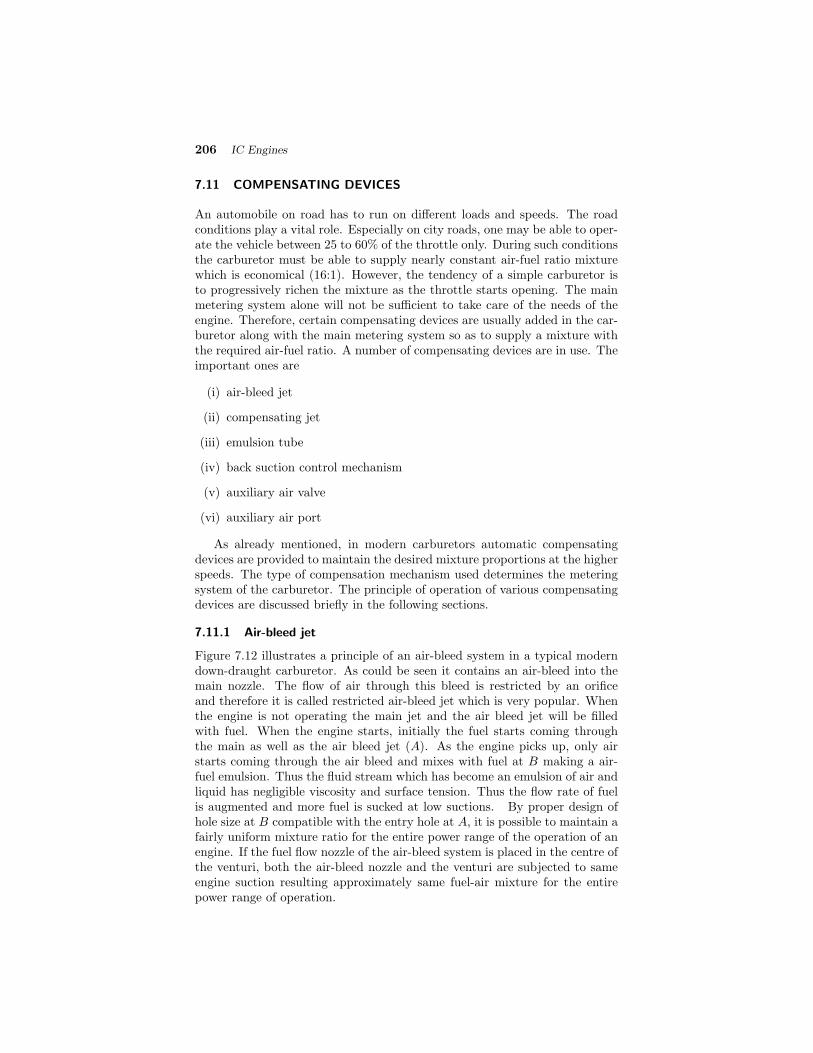
206 IC Engines
7.11 COMPENSATING DEVICES
An automobile on road has to run on different loads and speeds. The roadconditions play a vital role. Especially on city roads, one may be able to oper-ate the vehicle between 25 to 60% of the throttle only. During such conditionsthe carburetor must be able to supply nearly constant air-fuel ratio mixturewhich is economical (16:1). However, the tendency of a simple carburetor isto progressively richen the mixture as the throttle starts opening. The mainmetering system alone will not be sufficient to take care of the needs of theengine. Therefore, certain compensating devices are usually added in the car-buretor along with the main metering system so as to supply a mixture withthe required air-fuel ratio. A number of compensating devices are in use. Theimportant ones are
(i) air-bleed jet
(ii) compensating jet
(iii) emulsion tube
(iv) back suction control mechanism
(v) auxiliary air valve
(vi) auxiliary air port
As already mentioned, in modern carburetors automatic compensatingdevices are provided to maintain the desired mixture proportions at the higherspeeds. The type of compensation mechanism used determines the meteringsystem of the carburetor. The principle of operation of various compensatingdevices are discussed briefly in the following sections.
7.11.1 Air-bleed jet
Figure 7.12 illustrates a principle of an air-bleed system in a typical moderndown-draught carburetor. As could be seen it contains an air-bleed into themain nozzle. The flow of air through this bleed is restricted by an orificeand therefore it is called restricted air-bleed jet which is very popular. Whenthe engine is not operating the main jet and the air bleed jet will be filledwith fuel. When the engine starts, initially the fuel starts coming throughthe main as well as the air bleed jet (A). As the engine picks up, only airstarts coming through the air bleed and mixes with fuel at B making a air-fuel emulsion. Thus the fluid stream which has become an emulsion of air andliquid has negligible viscosity and surface tension. Thus the flow rate of fuelis augmented and more fuel is sucked at low suctions. By proper design ofhole size at B compatible with the entry hole at A, it is possible to maintain afairly uniform mixture ratio for the entire power range of the operation of anengine. If the fuel flow nozzle of the air-bleed system is placed in the centre ofthe venturi, both the air-bleed nozzle and the venturi are subjected to sameengine suction resulting approximately same fuel-air mixture for the entirepower range of operation.
Carburetion 207
Throttle
Venturi
Main jet
B
Float chamber
Fuel-air mixture
Air
Restricted air bleed
A
Fig. 7.12 Air-bleed principle in a typical modern carburetor
7.11.2 Compensating Jet
The principle of compensating jet device is to make the mixture leaner as thethrottle opens progressively. In this method, as can be seen from Fig.7.13 inaddition to the main jet, a compensating jet is incorporated. The compen-sating jet is connected to the compensation well. The compensating well isalso vented to atmosphere like the main float chamber. The compensatingwell is supplied with fuel from the main float chamber through a restrictingorifice. With the increase in air flow rate, there is decrease of fuel level in thecompensating well, with the result that fuel supply through the compensat-ing jet decreases. The compensating jet thus progressively makes the mixtureleaner as the main jet progressively makes the mixture richer. The sum ofthe two tends to keep the fuel-air mixture more or less constant as shown inFig.7.14. The main jet curve and the compensating jet curve are more or lessreciprocals of each other.
7.11.3 Emulsion Tube
The mixture correction is attempted by air bleeding in modern carburetor. Inone such arrangement as shown in Fig.7.15, the main metering jet is kept at alevel of about 25 mm below the fuel level in the float chamber. Therefore, itis also called submerged jet. The jet is located at the bottom of a well. Thesides of the well have holes. As can be seen from the figure these holes arein communication with the atmosphere. In the beginning the level of petrolin the float chamber and the well is the same. When the throttle is openedthe pressure at the venturi throat decreases and petrol is drawn into the airstream. This results in progressively uncovering the holes in the central tubeleading to increasing air-fuel ratios or decreasing richness of mixture when allholes have been uncovered. Normal flow takes place from the main jet. Theair is drawn through these holes in the well, and the fuel is emulsified and the

208 IC Engines
Main jet fuel metering
Throttle valve
Compensating jet
Float chamber
Air-fuel mixture
Air
Compensating well
Orifice to well
Main jet
x
h
Fig. 7.13 Compensating jet device
Fuel
-air
rat
io
Air flow litre/min
Main jet
Combined jet
Compensating jet
Fig. 7.14 Effect of compensating device on fuel-air ratio
pressure differential across the column of fuel is not as high as that in simplecarburetor.
7.11.4 Back Suction Control Mechanism
Figure 7.16 gives the details of back suction control device. In this device, thetop of the fuel f1oat chamber is connected to air entry by means of a largevent line fitted with a control valve. Another line with a small orifice connectsthe top of the fuel float chamber with the venturi throat. When the controlvalve is completely open, the vent line is unrestricted and the pressure (p1) inthe float chamber is atmospheric and the throat pressure will be p2. So thepressure differential acting on the orifice is (p1 − p2). If the valve is closed, thefloat chamber pressure will equalize with the pressure at the venturi throatand no fuel can flow. By proper adjustment of the control valve, the requiredpressure differential can be obtained in the float chamber. Thus altering the

Carburetion 209
Throttle valve
Air-fuel mixture
Air
25 mm
Atmospheric pressure
Well
Submerged main jet
Fig. 7.15 Emulsion tube
Venturi
Air-fuel mixture
Air
Orifice
Control valve
Fuel level
h
p1
p2
Fig. 7.16 Back suction control or pressure reduction method

210 IC Engines
quantity of fuel discharged from the nozzle the required air-fuel ratio mixturecan be achieved. This method is employed only in large carburetors.
7.11.5 Auxiliary Valve
Figure 7.17 shows a simplified picture of an auxiliary valve device for under-standing the principle. When the engine is not operating the pressure, p1acting on the top of the auxiliary valve is atmospheric. The vacuum at theventuri throat increases (the throat pressure, p2 decreases) with increase inload. This pressure differential (p1 − p2) lifts the valve against the tension ofthe spring. And as a result, more air is admitted and the mixture is preventedfrom becoming rich.
Throttle
Air-fuel mixture
Air
Auxiliary valve
Valve spring
Nozzle
Fig. 7.17 Auxiliary valve
7.11.6 Auxiliary Port
Figure 7.18 shows an auxiliary port employed in a downdraught carburetor. Ifthe butterfly valve is opened, additional air passes through this port reducingthe flow of air through the venturi. This means that Δp will be comparativelysmaller. As a result fuel drawn is reduced. This method was popular for air-craft carburetors to compensate for the loss in density of air at high altitudes.
7.12 ADDITIONAL SYSTEMS IN MODERN CARBURETORS
Apart from the above compensating devices there are few other systems nor-mally used in modern carburetors for meeting the requirement of vehicles.The details of the various systems are explained in the following sections.
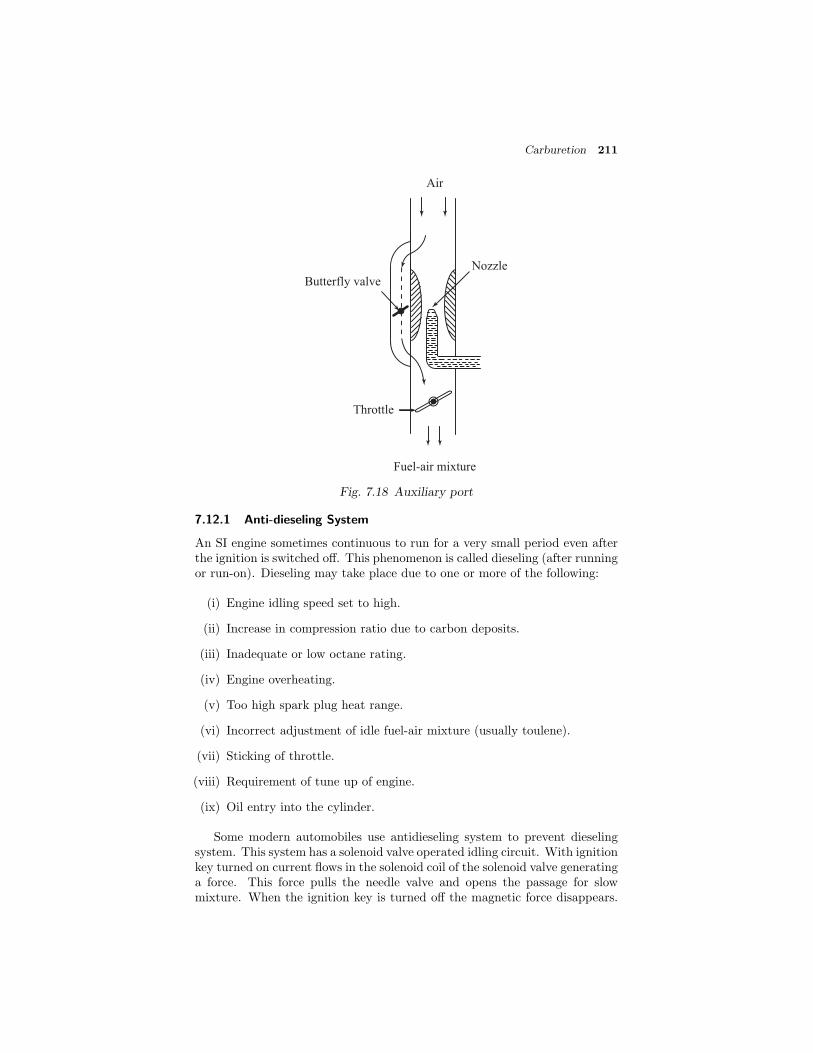
Carburetion 211
Throttle
Fuel-air mixture
Air
Butterfly valve
Nozzle
Fig. 7.18 Auxiliary port
7.12.1 Anti-dieseling System
An SI engine sometimes continuous to run for a very small period even afterthe ignition is switched off. This phenomenon is called dieseling (after runningor run-on). Dieseling may take place due to one or more of the following:
(i) Engine idling speed set to high.
(ii) Increase in compression ratio due to carbon deposits.
(iii) Inadequate or low octane rating.
(iv) Engine overheating.
(v) Too high spark plug heat range.
(vi) Incorrect adjustment of idle fuel-air mixture (usually toulene).
(vii) Sticking of throttle.
(viii) Requirement of tune up of engine.
(ix) Oil entry into the cylinder.
Some modern automobiles use antidieseling system to prevent dieselingsystem. This system has a solenoid valve operated idling circuit. With ignitionkey turned on current flows in the solenoid coil of the solenoid valve generatinga force. This force pulls the needle valve and opens the passage for slowmixture. When the ignition key is turned off the magnetic force disappears.

212 IC Engines
Then the needle valve is brought to the original (closed position) by the actionof the spring in the solenoid valve. By this way the slow mixture passage iscut-off and hence the engine stops. This reduces hydrocarbon emissions.
7.12.2 Richer Coasting System
The richer coasting system is incorporated in some modern cars. When thecar is travelling at high speed and when the accelerator pedal is suddenlyreleased, the wheel will motor the engine at a high speed. Consequently, thevacuum in the inlet manifold and the combustion chamber increases too muchand causes incomplete combustion. The richer coaster system is designed toovercome this problem by supplying a proper mixture to the intake manifoldfor proper combustion. This system has a chamber connected to the intakemanifold for stable combustion. When the throttle valve is closed to deceleratethe vacuum of the intake manifold increases. As this happens the vacuumapplied to the chamber pulls the membrane and causes the coasting valve toopen. Then the fuel in the float chamber is metered at the coasting fuel jetand mixed with air and sucked into the intake manifold.
7.12.3 Acceleration Pump System
Acceleration is a transient phenomenon. In order to accelerate the vehicleand consequently its engine, the mixture required is very rich and the richnessof the mixture has to be obtained quickly and very rapidly. In automobileengines situations arise when it is necessary to accelerate the vehicle. Thisrequires an increased output from the engine in a very short time. If thethrottle is suddenly opened there is a corresponding increase in the air flow.However, because of the inertia of the liquid fuel, the fuel flow does not increasein proportion to the increase in air flow. This results in a temporary leanmixture causing the engine to misfire and a temporary reduction in poweroutput. To prevent this condition, all modern carburetors are equipped withan accelerating system. Figure 7.19 illustrates simplified sketch of one suchdevice. The pump comprises of a spring loaded plunger which takes care ofthe situation with the rapid opening of the throttle valve. The plunger movesinto the cylinder and forces an additional jet of fuel at the venturi throat.When the throttle is partly open, the spring sets the plunger back. Thereis also an arrangement which ensures that fuel in the pump cylinder is notforced through the jet when valve is slowly opened or leaks past the plungeror some holes into the float chamber.
Mechanical linkage system, in some carburetor, is substituted by an ar-rangement whereby the pump plunger is held up by manifold vacuum. Whenthis vacuum is decreased by rapid opening of the throttle, a spring forces theplunger down pumping the fuel through the jet.
7.12.4 Economizer or Power Enrichment System
At the maximum power range of operation from 80% to 100% load, richerair-fuel ratio of about 12 to 14 is required and at the maximum power, anair-fuel ratio of approximately 12 i.e. expected. An economizer is a valvewhich remains closed at normal cruise operation and gets opened to supply

Carburetion 213
Fuel-air mixture
Air
h
Throttle
Separate
accelerating jet
Venturi
Fig. 7.19 Acceleration pump system
rich mixture at full throttle operation. It regulates the additional fuel supplyduring the full throttle operation. The term economizer is rather misleading.Probably as it does not interfere during cruising operation where an economymixture is supplied it is called economizer! It should more appropriately becalled power enrichment system. Figure 7.20 shows the skeleton outline of ametering rod economizer system. It allows a large opening to the main jetonly when the throttle is opened beyond a specified limit. The metering rodmay be tapered or stepped.
7.13 TYPES OF CARBURETORS
There are three general types of carburetors depending on the direction offlow of air. The first is the updraught type shown in Fig.7.21(a) in which theair enters at the bottom and leaves at the top so that the direction of its flowis upwards. The disadvantage of the updraught carburetor is that it mustlift the sprayed fuel droplet by air friction. Hence, it must be designed forrelatively small mixing tube and throat so that even at low engine speeds theair velocity is sufficient to lift and carry the fuel particles along. Otherwise,the fuel droplets tend to separate out providing only a lean mixture to theengine. On the other hand, the mixing tube is finite and small then it cannotsupply mixture to the engine at a sufficiently rapid rate at high speeds. Inorder to overcome this drawback the downdraught carburetor [Fig.7.21(b)] isadopted. It is placed at a level higher than the inlet manifold and in whichthe air and mixture generally follow a downward course. Here the fuel doesnot have to be lifted by air friction as in the updraught carburetors but move
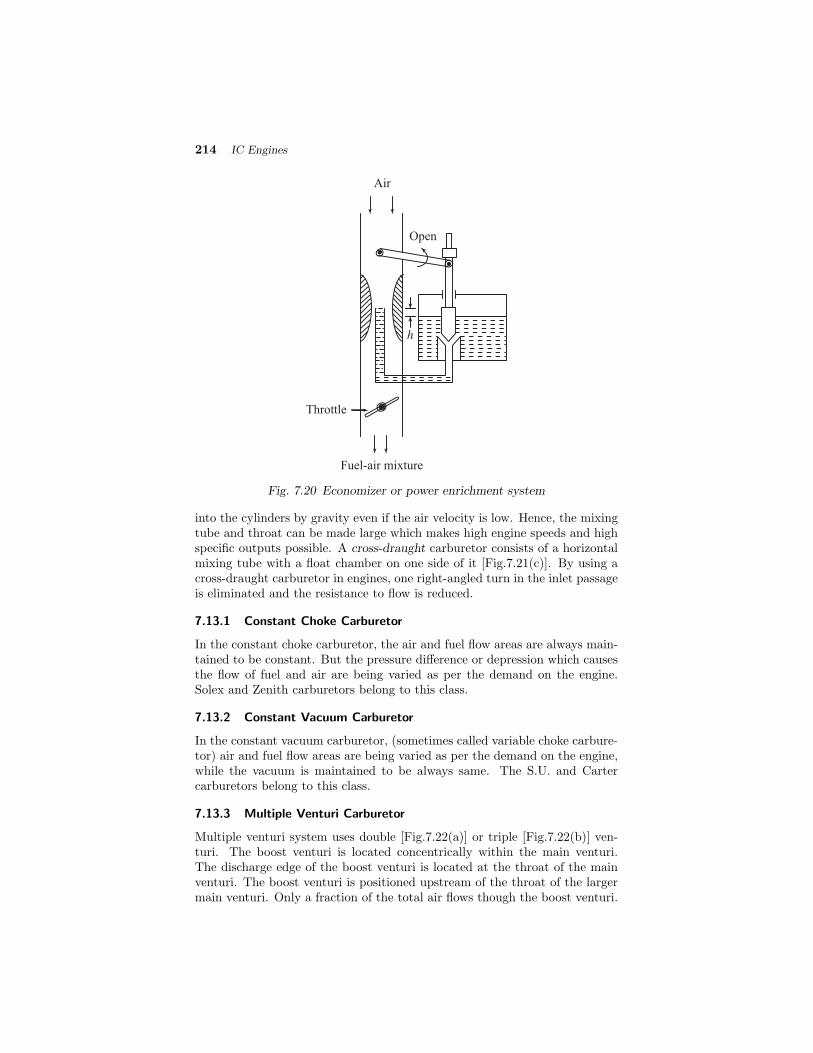
214 IC Engines
Fuel-air mixture
Air
h
Throttle
Open
Fig. 7.20 Economizer or power enrichment system
into the cylinders by gravity even if the air velocity is low. Hence, the mixingtube and throat can be made large which makes high engine speeds and highspecific outputs possible. A cross-draught carburetor consists of a horizontalmixing tube with a float chamber on one side of it [Fig.7.21(c)]. By using across-draught carburetor in engines, one right-angled turn in the inlet passageis eliminated and the resistance to flow is reduced.
7.13.1 Constant Choke Carburetor
In the constant choke carburetor, the air and fuel flow areas are always main-tained to be constant. But the pressure difference or depression which causesthe flow of fuel and air are being varied as per the demand on the engine.Solex and Zenith carburetors belong to this class.
7.13.2 Constant Vacuum Carburetor
In the constant vacuum carburetor, (sometimes called variable choke carbure-tor) air and fuel flow areas are being varied as per the demand on the engine,while the vacuum is maintained to be always same. The S.U. and Cartercarburetors belong to this class.
7.13.3 Multiple Venturi Carburetor
Multiple venturi system uses double [Fig.7.22(a)] or triple [Fig.7.22(b)] ven-turi. The boost venturi is located concentrically within the main venturi.The discharge edge of the boost venturi is located at the throat of the mainventuri. The boost venturi is positioned upstream of the throat of the largermain venturi. Only a fraction of the total air flows though the boost venturi.
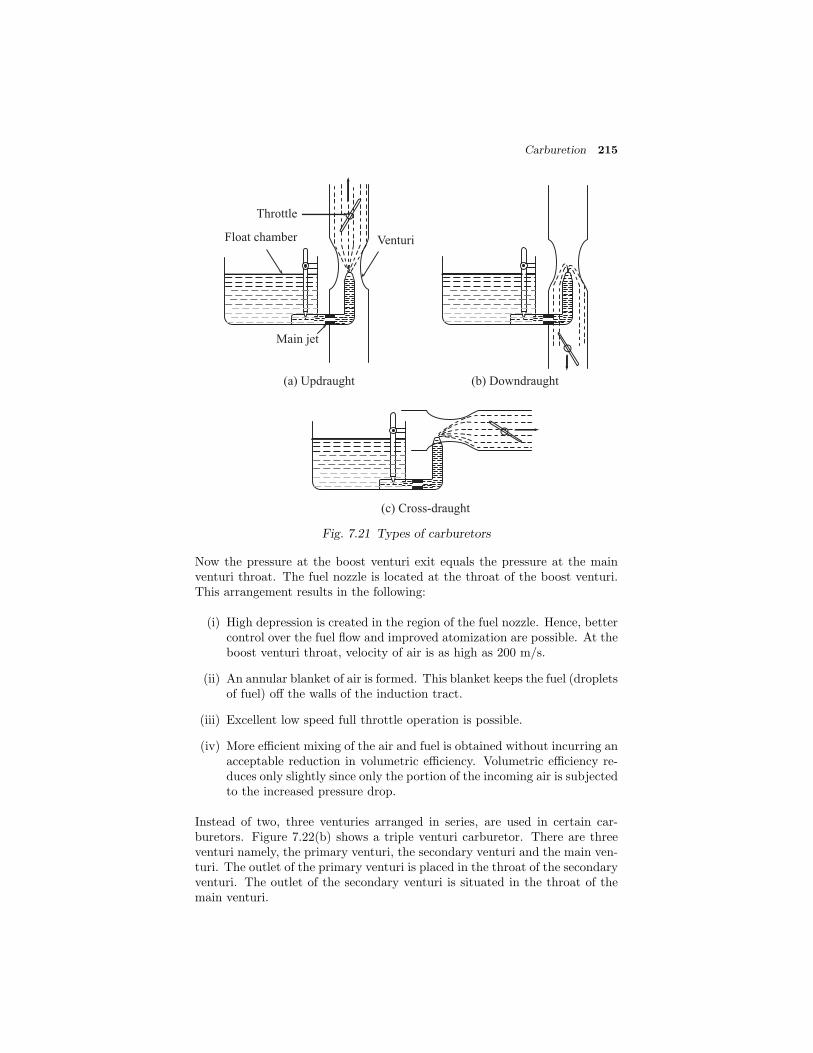
Carburetion 215
Float chamber
Throttle
Venturi
Main jet
(a) Updraught (b) Downdraught
(c) Cross-draught
Fig. 7.21 Types of carburetors
Now the pressure at the boost venturi exit equals the pressure at the mainventuri throat. The fuel nozzle is located at the throat of the boost venturi.This arrangement results in the following:
(i) High depression is created in the region of the fuel nozzle. Hence, bettercontrol over the fuel flow and improved atomization are possible. At theboost venturi throat, velocity of air is as high as 200 m/s.
(ii) An annular blanket of air is formed. This blanket keeps the fuel (dropletsof fuel) off the walls of the induction tract.
(iii) Excellent low speed full throttle operation is possible.
(iv) More efficient mixing of the air and fuel is obtained without incurring anacceptable reduction in volumetric efficiency. Volumetric efficiency re-duces only slightly since only the portion of the incoming air is subjectedto the increased pressure drop.
Instead of two, three venturies arranged in series, are used in certain car-buretors. Figure 7.22(b) shows a triple venturi carburetor. There are threeventuri namely, the primary venturi, the secondary venturi and the main ven-turi. The outlet of the primary venturi is placed in the throat of the secondaryventuri. The outlet of the secondary venturi is situated in the throat of themain venturi.
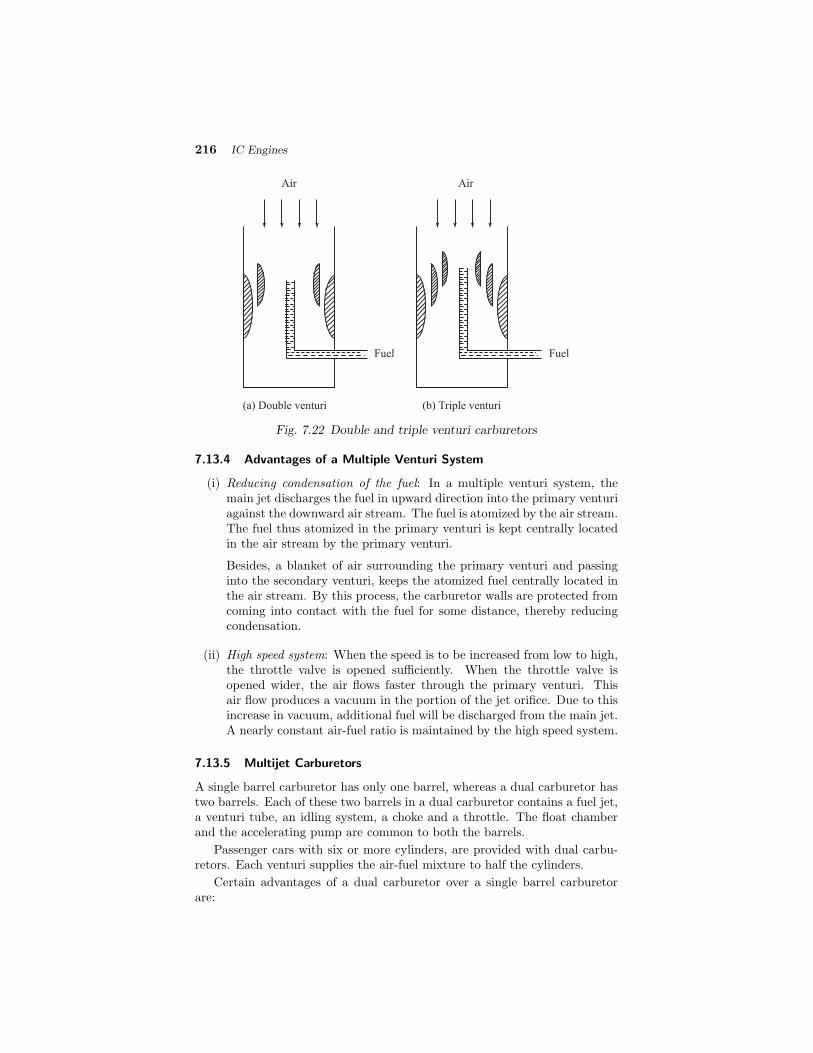
216 IC Engines
(a) Double venturi (b) Triple venturi
Air
Fuel Fuel
Air
Fig. 7.22 Double and triple venturi carburetors
7.13.4 Advantages of a Multiple Venturi System
(i) Reducing condensation of the fuel: In a multiple venturi system, themain jet discharges the fuel in upward direction into the primary venturiagainst the downward air stream. The fuel is atomized by the air stream.The fuel thus atomized in the primary venturi is kept centrally locatedin the air stream by the primary venturi.
Besides, a blanket of air surrounding the primary venturi and passinginto the secondary venturi, keeps the atomized fuel centrally located inthe air stream. By this process, the carburetor walls are protected fromcoming into contact with the fuel for some distance, thereby reducingcondensation.
(ii) High speed system: When the speed is to be increased from low to high,the throttle valve is opened sufficiently. When the throttle valve isopened wider, the air flows faster through the primary venturi. Thisair flow produces a vacuum in the portion of the jet orifice. Due to thisincrease in vacuum, additional fuel will be discharged from the main jet.A nearly constant air-fuel ratio is maintained by the high speed system.
7.13.5 Multijet Carburetors
A single barrel carburetor has only one barrel, whereas a dual carburetor hastwo barrels. Each of these two barrels in a dual carburetor contains a fuel jet,a venturi tube, an idling system, a choke and a throttle. The float chamberand the accelerating pump are common to both the barrels.
Passenger cars with six or more cylinders, are provided with dual carbu-retors. Each venturi supplies the air-fuel mixture to half the cylinders.
Certain advantages of a dual carburetor over a single barrel carburetorare:
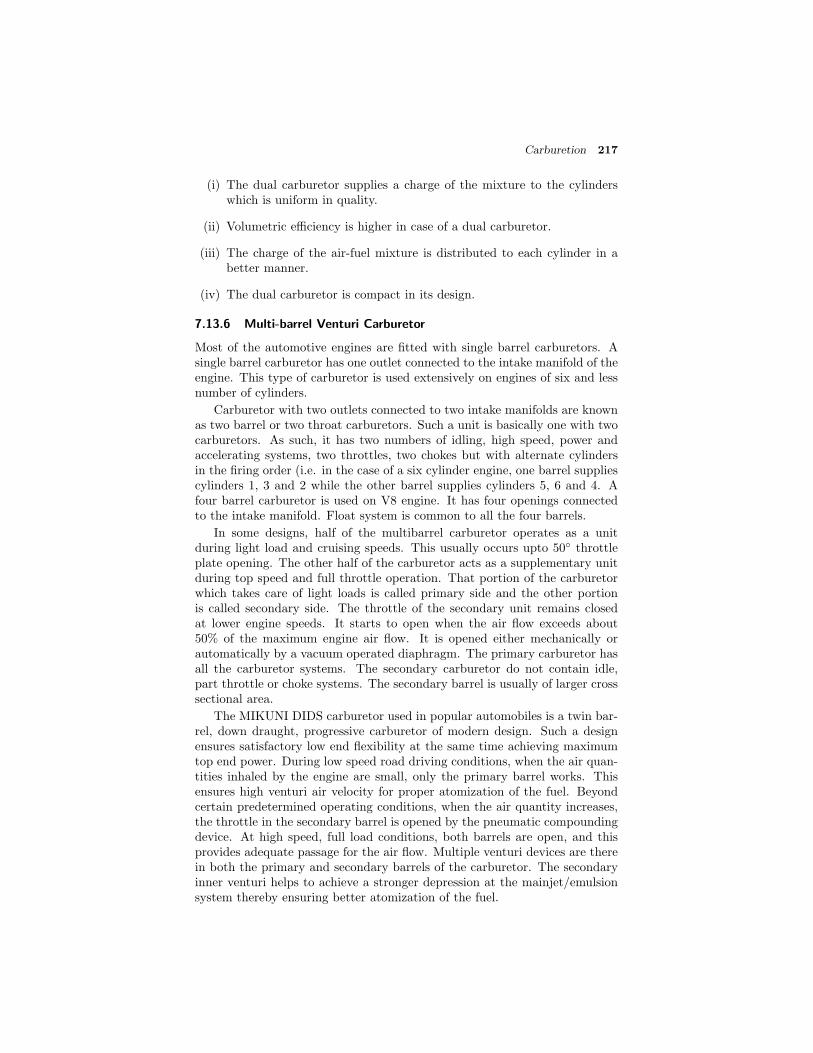
Carburetion 217
(i) The dual carburetor supplies a charge of the mixture to the cylinderswhich is uniform in quality.
(ii) Volumetric efficiency is higher in case of a dual carburetor.
(iii) The charge of the air-fuel mixture is distributed to each cylinder in abetter manner.
(iv) The dual carburetor is compact in its design.
7.13.6 Multi-barrel Venturi Carburetor
Most of the automotive engines are fitted with single barrel carburetors. Asingle barrel carburetor has one outlet connected to the intake manifold of theengine. This type of carburetor is used extensively on engines of six and lessnumber of cylinders.
Carburetor with two outlets connected to two intake manifolds are knownas two barrel or two throat carburetors. Such a unit is basically one with twocarburetors. As such, it has two numbers of idling, high speed, power andaccelerating systems, two throttles, two chokes but with alternate cylindersin the firing order (i.e. in the case of a six cylinder engine, one barrel suppliescylinders 1, 3 and 2 while the other barrel supplies cylinders 5, 6 and 4. Afour barrel carburetor is used on V8 engine. It has four openings connectedto the intake manifold. Float system is common to all the four barrels.
In some designs, half of the multibarrel carburetor operates as a unitduring light load and cruising speeds. This usually occurs upto 50◦ throttleplate opening. The other half of the carburetor acts as a supplementary unitduring top speed and full throttle operation. That portion of the carburetorwhich takes care of light loads is called primary side and the other portionis called secondary side. The throttle of the secondary unit remains closedat lower engine speeds. It starts to open when the air flow exceeds about50% of the maximum engine air flow. It is opened either mechanically orautomatically by a vacuum operated diaphragm. The primary carburetor hasall the carburetor systems. The secondary carburetor do not contain idle,part throttle or choke systems. The secondary barrel is usually of larger crosssectional area.
The MIKUNI DIDS carburetor used in popular automobiles is a twin bar-rel, down draught, progressive carburetor of modern design. Such a designensures satisfactory low end flexibility at the same time achieving maximumtop end power. During low speed road driving conditions, when the air quan-tities inhaled by the engine are small, only the primary barrel works. Thisensures high venturi air velocity for proper atomization of the fuel. Beyondcertain predetermined operating conditions, when the air quantity increases,the throttle in the secondary barrel is opened by the pneumatic compoundingdevice. At high speed, full load conditions, both barrels are open, and thisprovides adequate passage for the air flow. Multiple venturi devices are therein both the primary and secondary barrels of the carburetor. The secondaryinner venturi helps to achieve a stronger depression at the mainjet/emulsionsystem thereby ensuring better atomization of the fuel.

218 IC Engines
7.14 AUTOMOBILE CARBURETORS
The details of various devices for carburetors to satisfy the demand of an au-tomobile engine under different conditions have been discussed in the previoussections. Some of the popular brands of carburetors in use are (i) Solex, (ii)Carter, and (iii) S.U. carburetor Before going into the details of these carbu-retors let us see the important requirements of an automobile carburetors.
(i) Ease of starting the engine, particularly under low ambient conditions.
(ii) Ability to give full power quickly after starting the engine.
(iii) Equally good and smooth engine operation at various loads.
(iv) Good and quick acceleration of the engine.
(v) Developing sufficient power at high engine speeds.
(vi) Simple and compact in construction.
(vii) Good fuel economy.
(viii) Absence of racing of the engine under idling conditions.
(ix) Ensuring full torque at low speeds.
The operation of a SI engine depends primarily on the quality (air-fuel ratio)and the quantity of the air-fuel mixture delivered to the engine cylinder. Agood carburetor must produce the desired air-fuel mixture ratio and supplythe mixture to the engine at all speeds and loads and must do the sameautomatically.
7.14.1 Solex Carburetors
The solex carburetor is famous for its ease of starting, good performance andreliability. It is made in various models and is used in many automobileengines. The solex carburetor as shown in Fig.7.23 is a downdraught carbu-retor. This has the provision to supply richer mixture required for starting,and weaker mixture to cruise the vehicle. It consists of various fuel circuitssuch as starting, idling or low speed operation, normal running, accelerationetc.
Figure 7.23 gives the line sketch of a solex carburetor. It incorporates adevice called bi-starter which is unique for this carburetor. This device isvery useful for cold starting of the engine. The various components and thecircuits for air and fuel are explained below for various ranges of operation.
Normal Running: A float (1) with a tapered needle valve at the top faceof the float is fixed in the float chamber. This tapered valve takes care of thelevel of fuel in the float chamber. The main metering jet (2) supplies fuel andthe air comes through the venturi (3). The fuel from the main jet goes intothe well of the air-bleed emulsion system. The emulsion tube has lateral holes(4) as shown in the figure. Air correction jet (5), calibrates the air enteringthrough it and ensures automatically the correct-balance of air and fuel. The
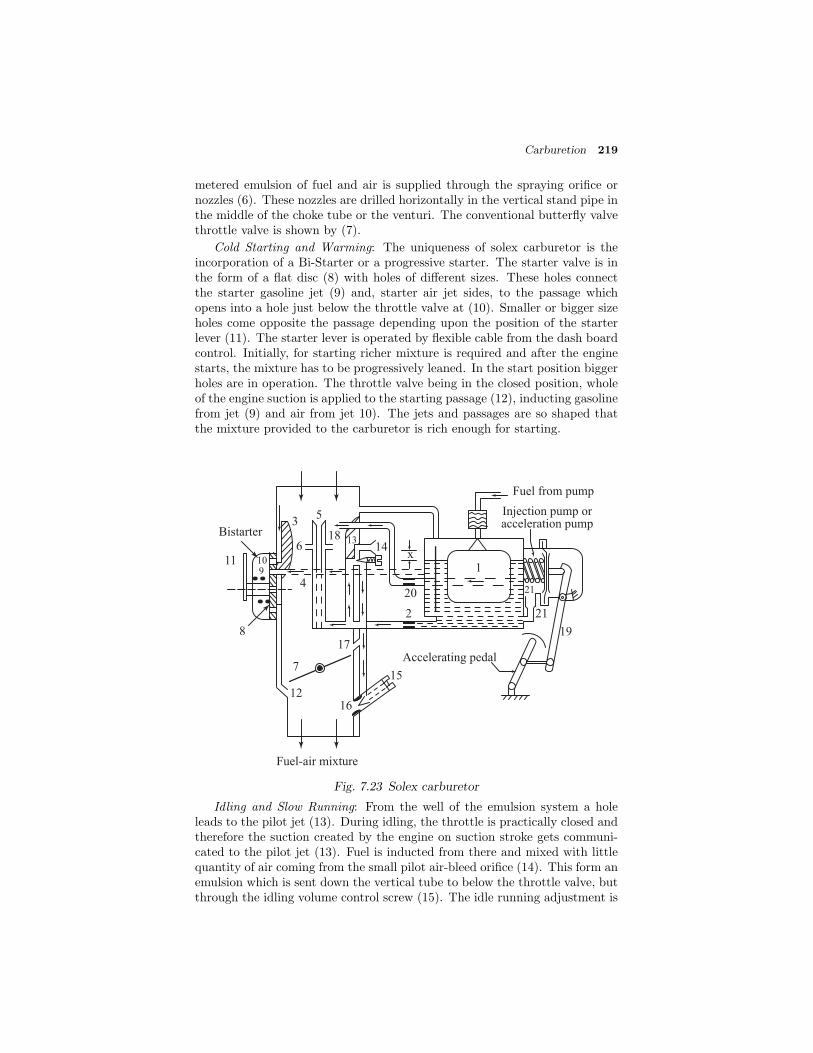
Carburetion 219
metered emulsion of fuel and air is supplied through the spraying orifice ornozzles (6). These nozzles are drilled horizontally in the vertical stand pipe inthe middle of the choke tube or the venturi. The conventional butterfly valvethrottle valve is shown by (7).
Cold Starting and Warming: The uniqueness of solex carburetor is theincorporation of a Bi-Starter or a progressive starter. The starter valve is inthe form of a flat disc (8) with holes of different sizes. These holes connectthe starter gasoline jet (9) and, starter air jet sides, to the passage whichopens into a hole just below the throttle valve at (10). Smaller or bigger sizeholes come opposite the passage depending upon the position of the starterlever (11). The starter lever is operated by flexible cable from the dash boardcontrol. Initially, for starting richer mixture is required and after the enginestarts, the mixture has to be progressively leaned. In the start position biggerholes are in operation. The throttle valve being in the closed position, wholeof the engine suction is applied to the starting passage (12), inducting gasolinefrom jet (9) and air from jet 10). The jets and passages are so shaped thatthe mixture provided to the carburetor is rich enough for starting.
109
14x
35
6
4
8
11
18
20
2
1
Fuel from pump
Injection pump oracceleration pump
1917
7
1216
Fuel-air mixture
Accelerating pedal
15
21
13Bistarter
21
Fig. 7.23 Solex carburetor
Idling and Slow Running: From the well of the emulsion system a holeleads to the pilot jet (13). During idling, the throttle is practically closed andtherefore the suction created by the engine on suction stroke gets communi-cated to the pilot jet (13). Fuel is inducted from there and mixed with littlequantity of air coming from the small pilot air-bleed orifice (14). This form anemulsion which is sent down the vertical tube to below the throttle valve, butthrough the idling volume control screw (15). The idle running adjustment is

220 IC Engines
done by the idle adjustment screw (15). The idling speed can be thus variedand set to a desired value.
In order to change over smoothly from the idle and low speed operation tothe main jet operation without a flat spot, there is a by-pass orifice (17) onthe venturi side of the throttle valve. As the throttle is opened, the suction atidle port (16) is reduced. But the suction pressure is exerted at a slow speedopening (17). This off sets the reduction of suction at the idle port (16). Thusflat spot is averted.
Acceleration: In order to avert flat spot during acceleration a diaphragm typeacceleration pump is incorporated. This pump supplies extra fuel needed foracceleration through pump injector (18). Pump lever (19) is connected tothe accelerator. When the pedal is pressed by foot the lever moves towardsleft and presses the pump diaphragm towards left. This forces the gasolinethrough pump jet (20) and injector (18). On releasing the pressure on thepedal, the lever moves the diaphragm back towards right and in so doing,creates vacuum towards left. The vacuum so created opens the pump inletvalve (21), and gasoline from float chamber enters the pump.
7.14.2 Carter Carburetor
Carter carburetor is normally used in Jeeps. It is a multiple jet, plain tubetype of carburetor with only one adjustment which is for idling or low speedoperation. A combination of gasoline and air is drawn into the nozzle chamberthrough the jets on side of nozzle forming a time spray which is carried bythe stand pipe to the venturi or main air passage, where it is absorbed byincoming air forming mixture on which engine operates.
Jets on the side of the nozzle come into operation in direct proportion tothrottle position. More and more the throttle is opened, the more jets are inoperation. At wide-open-throttle (WOT) all jets are working and engine isgetting maximum supply.
Low-speed jet assembly supplies gasoline to the engine at idle engine speedand up to approximately 20 km/h, gasoline flowing through a drilled passageconnecting low speed jet chamber with carburetor well.
At idling gasoline is drawn through low speed jet and idling port at theedge of the throttle valve. With the idling screw, the mixture for idle runningcan be enriched or made leaner as required.
Figure 7.24 shows the down draught carter carburetor. The brief descrip-tion of the components and air and fuel circuits is given. The gasoline entersthe float chamber (1) which is a conventional type. Air enters the choke tubeof the carburetor from the top. Carter carburetor is down-draught carbure-tor. A choke valve (2) in the air passage is always fully open during normaloperation. Carter carburetor comprises three venturi diffusing type of choketube. The smallest of the these venturi (3) is above the fuel level in the floatchamber, and the remaining two venturi (6) and (5) are below the fuel levelin the float chamber one below the other.
At low speed, the suction in the venturi (3) is sufficient to induct the fuel.Nozzle (4) enters the venturi (3) and throws the fuel up against the air streamevenly, thereby providing finely atomized fuel. The mixture from venturi (3)
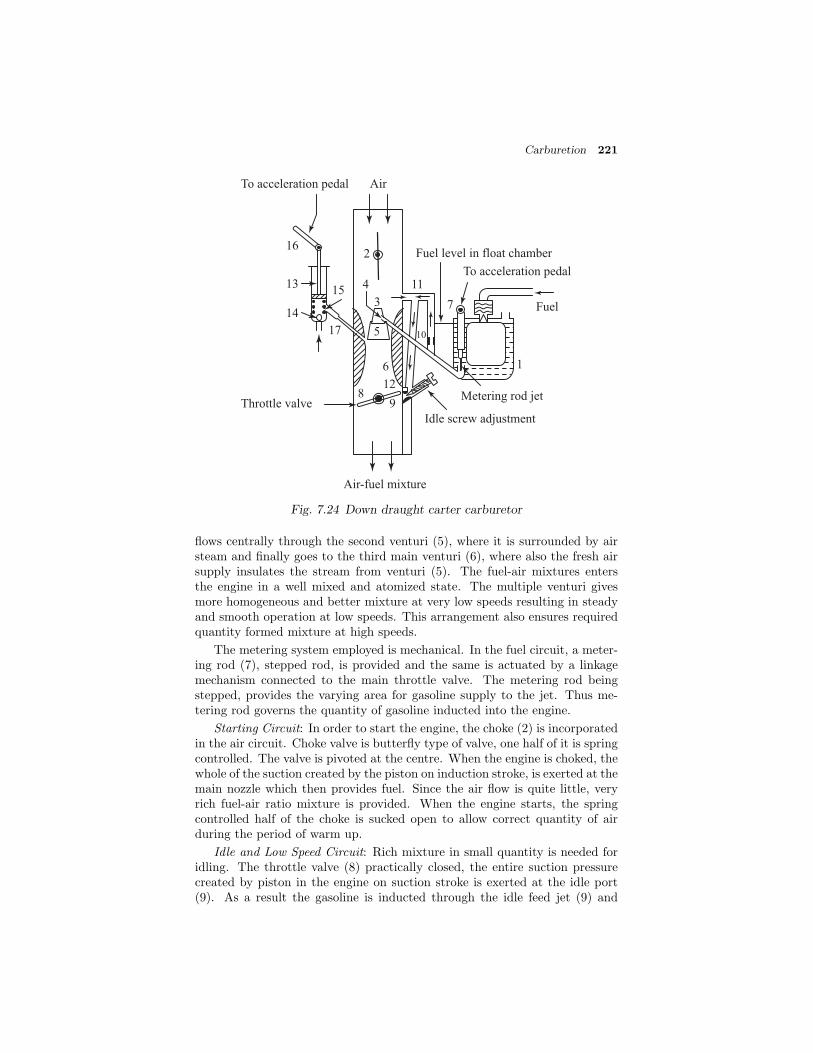
Carburetion 221
Fuel
Throttle valve
Air-fuel mixture
AirTo acceleration pedal
16
13
14
15
17
4
3
6
5
12
9
Idle screw adjustment
Metering rod jet
Fuel level in float chamber
8
10
11
7
1
To acceleration pedal
2
Fig. 7.24 Down draught carter carburetor
flows centrally through the second venturi (5), where it is surrounded by airsteam and finally goes to the third main venturi (6), where also the fresh airsupply insulates the stream from venturi (5). The fuel-air mixtures entersthe engine in a well mixed and atomized state. The multiple venturi givesmore homogeneous and better mixture at very low speeds resulting in steadyand smooth operation at low speeds. This arrangement also ensures requiredquantity formed mixture at high speeds.
The metering system employed is mechanical. In the fuel circuit, a meter-ing rod (7), stepped rod, is provided and the same is actuated by a linkagemechanism connected to the main throttle valve. The metering rod beingstepped, provides the varying area for gasoline supply to the jet. Thus me-tering rod governs the quantity of gasoline inducted into the engine.
Starting Circuit: In order to start the engine, the choke (2) is incorporatedin the air circuit. Choke valve is butterfly type of valve, one half of it is springcontrolled. The valve is pivoted at the centre. When the engine is choked, thewhole of the suction created by the piston on induction stroke, is exerted at themain nozzle which then provides fuel. Since the air flow is quite little, veryrich fuel-air ratio mixture is provided. When the engine starts, the springcontrolled half of the choke is sucked open to allow correct quantity of airduring the period of warm up.
Idle and Low Speed Circuit: Rich mixture in small quantity is needed foridling. The throttle valve (8) practically closed, the entire suction pressurecreated by piston in the engine on suction stroke is exerted at the idle port(9). As a result the gasoline is inducted through the idle feed jet (9) and
222 IC Engines
the air is inducted through first-by-pass (11)and a rich mixture is provided.This fuel-air ratio can be varied to get optimum idling speed by the idle screwadjustment. For low speed operation, the throttle valve is opened further andthe main nozzle also begins to supply the fuel. For some duration, during thelow speed operation, fuel is supplied by both main venturi and low speed port(12), through the idle passage.
Accelerating Pump Circuit: The purpose of acceleration pump is to avertflat spot in acceleration. The pump comprises of a plunger (13), operatinginside a cylinder consisting non-return of inlet check valve (14) and the outletcheck valve (15). The plunger of the pump to connected to the accelerationpedal by throttle control rod (16). On rapidly opening the throttle by pressingthe accelerator pedal, the pump is actuated and a small amount of gasolinespurts into the choke tube by jet (17). Releasing the accelerator pedal takesthe plunger back by spring force and in the process sucks gasoline from thefloat chamber for the next operation via the non-return value (14). Thegasoline is delivered through jet (17) via checkout value (15). The mainand sole purpose of the acceleration pump is to provide extra spurt of littlequantity of fuel during acceleration to avert a flat spot. This pump does notsupply any fuel during other situation of idling running, cruising and overloads.
7.14.3 S.U. Carburetor
Carburetors in general are constant choke type. Zenith, Solex and Cartercarburetors are examples of this type. S.U. carburetors differs completelyfrom them being constant vacuum or constant depression type with automaticvariable choke.
A simplified sketch of this carburetor is shown in Fig.7.25. It consists ofa sliding piston. The lower end of the piston is provided with a taper needlewhich is inserted into the main jet. When the piston is moved up and downthe needle also moves up and down with the main jet. The upper end of thepiston is given a flat form which is known as suction disc. The up and downmovement of the piston and the suction disc is guided by means of piston rodand piston rod guide as shown in Fig.7.25.
The piston always remains loaded by a helical spring. The movementof the piston controls the air passage. The portion above the disc is calledsuction chamber which connects the air passage by means of a slot provided inthe piston. The main jet of the carburetor can be moved up and down alongthe taper needle by operating a lever from the dash board. This movementis required to adjust the mixture strength throughout the operating range ofthe carburetor. The carburetor consists of an ordinary butterfly type throttlevalve. The lower portion of the suction disc is connected to the atmosphere bymeans of an air rectifier hole and the upper portion to the throttle air passage.The system does not have any separate idling slow running and acceleratingsystem.
The weight of the piston is constant and always acts down. The vacuumin the suction chamber always tends to move the piston upwards. Therefore,at a particular instant the position of the piston is balanced by the weight and

Carburetion 223
Piston rod guide
Piston rodSuction chamber
Suction disc
Suction air entrance
Throttle valve
Float
chamber
Jet
Piston
Air rectifier hole
Taper jet needle
Fig. 7.25 S.U. carburetor
constant vacuum produced above the piston. In starting, a rich mixture isneeded by the engine which can be obtained by pulling the jet downwards withthe help of the lever attached to it. Therefore, as the throttle is opened moreair is allowed to pass through the inlet due to upward movement of the piston.The upward movement of the taper needle also ensures more flow of fuel fromthe main jet. Thus the air and fuel passage are varied with different enginespeeds and velocities of the fuel and air remains constant in this system.
7.15 ALTITUDE COMPENSATION
An inherent characteristic of the conventional float-type carburetor is to me-ter air and fuel by volume and not by weight as the basis of calculatingcombustible air-fuel ratio. The weight of one cubic meter of air decreases asaltitude increases. Most automobile carburetors are calibrated at altitudesnear sea level and similarly production carburetors are flow tested and ad-justed in a controlled environment. When the atmospheric conditions aredifferent from those at which the carburetor was calibrated, the air-fuel ratiochanges. If the vehicle is operated at an altitude lower than the calibrationaltitude a lean mixture is obtained which results in poor drivability. At al-titudes higher than the calibration altitude a rich mixture is supplied whichcauses incomplete combustion and emit hydrocarbon and carbon monoxide.The enrichment, E, due to variation of air density follows the relationship
E + 1 =
!ρ0ρ
=
p0T
pT0(7.26)
where subscript ‘0’ refers to the calibration conditions. Thus if the densityratio is (say) 0.84, then the enrichment E is given by
E + 1 =
!1
0.84= 1.091
E = 0.091 = 9.1% (7.27)

224 IC Engines
This is the enrichment of the charge over the basic calibrated air-fuel ratio inan uncompensated carburetor. Figure 7.26 shows the flow characteristic of atypical carburetor at various altitude levels. It also illustrates the early enrich-ments caused by the effect of low manifold vacuum on the power enrichmentsystem.
Air (kg/min)
0 0.5 1 2 3 4 6 8 10
10
12
14
16
18
20
22
Altitude (m)
1400
2500
3300
200
Air
-fuel
rat
io
Fig. 7.26 Flow characteristics of a typical carburetor
7.15.1 Altitude Compensation Devices
The problem of mixture enrichment is quite acute in aircraft carburetors. Athigher altitudes, density of air is less and therefore the mass of the air takeninto engine decreases and the power is reduced in approximately the sameproportion. Since, the quantity of oxygen taken into the engine decreases, thefuel-air mixture becomes too rich for normal operation. The mixture strengthdelivered by the carburetor becomes richer at a rate inversely proportional tothe square root of the density ratio as given by the Eq.7.26 If the pressureremains constant, the density of the air will vary according to temperature,increasing as the temperature drops. This will cause a leaning of the fuel-airmixture in the carburetor because the denser air contains more oxygen. Thechange in air pressure due to altitude is considerably more of a problem thanthe change in density due to temperature changes. At 6,000 m altitude, theair pressure is approximately one-half the pressure at sea level. Hence, inorder to provide a correct mixture, the fuel flow would have to be reduced toalmost one-half what it would be at sea level. The adjustment of fuel flow tocompensate for changes in air pressure and temperature is a principal functionof the mixture control.
Briefly, the mixture-control system can be described as a mechanism ordevice by means of which the richness of the mixture entering the engineduring flight can be controlled to a reasonable extent. This control shouldexist through all normal altitudes of operation to prevent the mixture frombecoming too rich at high altitudes and to economize on fuel during engineoperation in the low-power range where cylinder temperature will not becomeexcessive with the use of the leaner mixture.
Mixture-control systems may be classified according to their principles ofoperation as
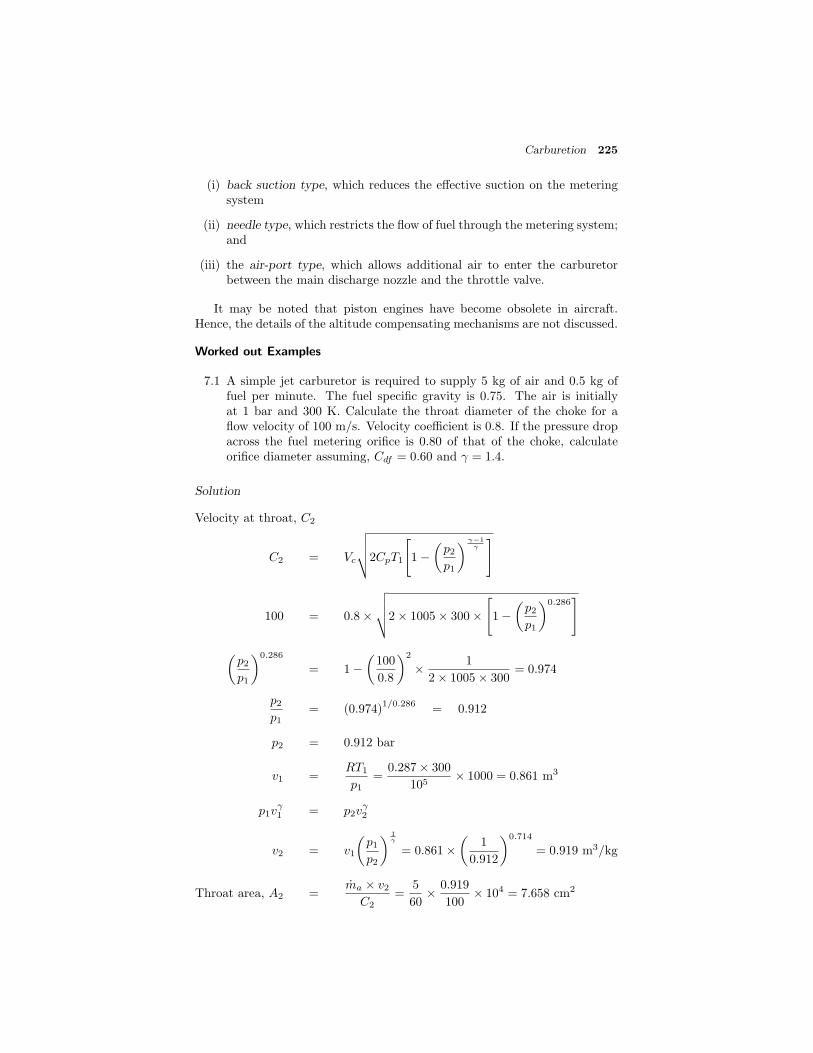
Carburetion 225
(i) back suction type, which reduces the effective suction on the meteringsystem
(ii) needle type, which restricts the flow of fuel through the metering system;and
(iii) the air-port type, which allows additional air to enter the carburetorbetween the main discharge nozzle and the throttle valve.
It may be noted that piston engines have become obsolete in aircraft.Hence, the details of the altitude compensating mechanisms are not discussed.
Worked out Examples
7.1 A simple jet carburetor is required to supply 5 kg of air and 0.5 kg offuel per minute. The fuel specific gravity is 0.75. The air is initiallyat 1 bar and 300 K. Calculate the throat diameter of the choke for aflow velocity of 100 m/s. Velocity coefficient is 0.8. If the pressure dropacross the fuel metering orifice is 0.80 of that of the choke, calculateorifice diameter assuming, Cdf = 0.60 and γ = 1.4.
Solution
Velocity at throat, C2
C2 = Vc
2CpT1
1−
p2p1
γ−1
γ
100 = 0.8×
2× 1005× 300× 1−
p2p1
0.286
p2p1
0.286= 1−
100
0.8
2× 1
2× 1005× 300= 0.974
p2p1
= (0.974)1/0.286
= 0.912
p2 = 0.912 bar
v1 =RT1p1
=0.287× 300
105× 1000 = 0.861 m3
p1vγ1 = p2v
γ2
v2 = v1
p1p2
1γ
= 0.861×
1
0.912
0.714= 0.919 m3/kg
Throat area, A2 =ma × v2
C2=
5
60× 0.919
100× 104 = 7.658 cm2
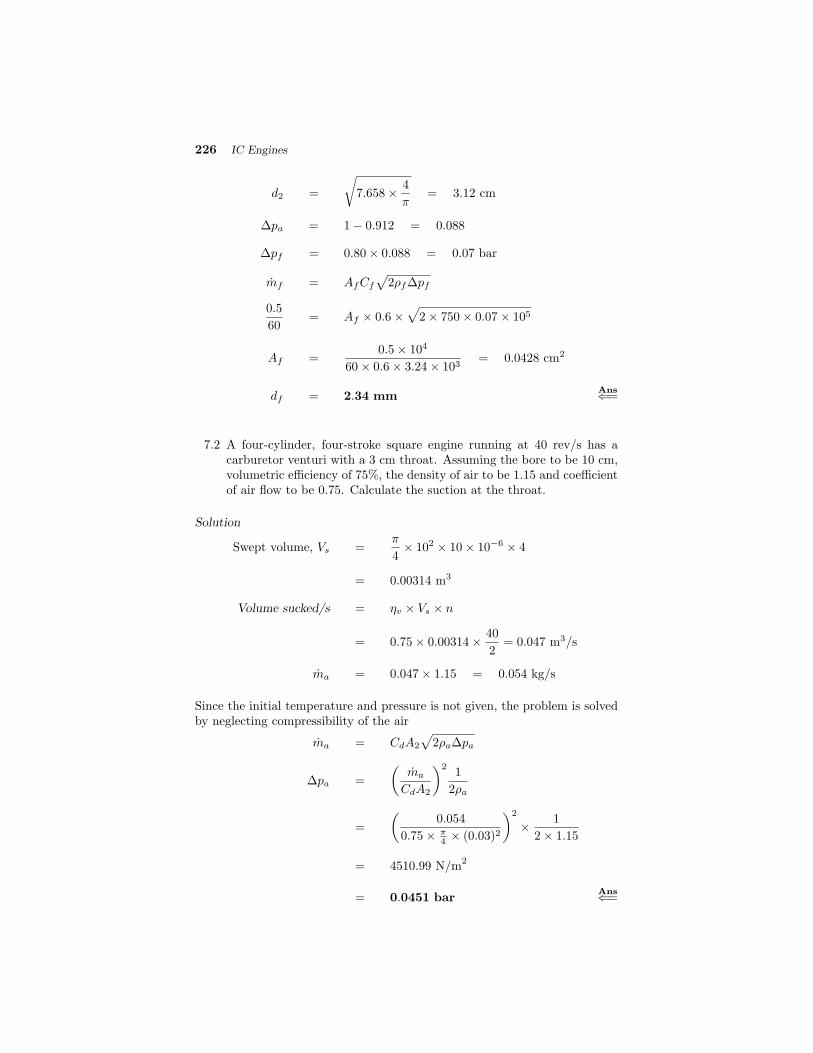
226 IC Engines
d2 =
!7.658× 4
π= 3.12 cm
Δpa = 1− 0.912 = 0.088
Δpf = 0.80× 0.088 = 0.07 bar
mf = AfCf
2ρfΔpf
0.5
60= Af × 0.6×
2× 750× 0.07× 105
Af =0.5× 10⁴
60× 0.6× 3.24× 103= 0.0428 cm2
df = 2.34 mmAns⇐=
7.2 A four-cylinder, four-stroke square engine running at 40 rev/s has acarburetor venturi with a 3 cm throat. Assuming the bore to be 10 cm,volumetric efficiency of 75%, the density of air to be 1.15 and coefficientof air flow to be 0.75. Calculate the suction at the throat.
Solution
Swept volume, Vs =π
4× 102 × 10× 10−6 × 4
= 0.00314 m3
Volume sucked/s = ηv × Vs × n
= 0.75× 0.00314× 40
2= 0.047 m3/s
ma = 0.047× 1.15 = 0.054 kg/s
Since the initial temperature and pressure is not given, the problem is solvedby neglecting compressibility of the air
ma = CdA2
2ρaΔpa
Δpa =
ma
CdA2
21
2ρa
=
0.054
0.75× π4 × (0.03)2
2× 1
2× 1.15
= 4510.99 N/m2
= 0.0451 barAns⇐=

Carburetion 227
7.3 An experimental four-stroke gasoline engine of 1.7 litre capacity is todevelop maximum power at 5000 revolutions per minute. The volumet-ric efficiency is 75% and the air-fuel ratio is 14:1. Two carburetors areto be fitted and it is expected that at maximum power the air speedat the choke is 100 m/s. The coefficient of discharge for the venturi isassumed to be 0.80 and that of main jet is 0.65. An allowance shouldbe made for emulsion tube, the diameter of which can be taken as 1/3of choke diameter. The gasoline surface is 6 mm below the choke at thisengine condition. Calculate the sizes of a suitable choke and main jet.The specific gravity of the gasoline is 0.75. pa and Ta are 1 bar and 300K respectively.
Solution
Actual volume of air sucked per second
= ηv × Vcyl × rpm
2× 1
60
= 0.75× 1.7× 10−3 × 5000
2× 1
60
= 0.053125 m3/s
Air flow through each carburetor at atmospheric conditions, V1,
V1 =0.053125
2= 0.0265 m3/s
ρa =pa
RTa=
1× 10⁵
0.287× 103 × 300
= 1.16 kg/m3
ma = ρaV1 = 1.16× 0.0265
= 0.0308 kg/s
The velocity of air at throat, C2
C2 =
2CpT1
1−
p2p1
γ−1
γ
1002 = 2× 1005× 300× 1−
p2p1
0.286
1−
p2p1
0.286= 0.0166
p2p1
= (1− 0.0166)1/0.286 = 0.943

228 IC Engines
Pressure at throat = 0.943 bar
Volume flow at choke, V2 = V1
p1p2
1/γ
= 0.0265×
1
0.943
1/1.4= 0.0276 m3/s
If compressibility is neglected, V1 = V2
Nominal choke area, A2 =V2
C2 × Cda
=0.0276
100× 0.80× 104 = 3.45 cm2
If D is the diameter of choke tube and d is the diameter of the emulsion tube
A2 =π
4
D2 − d2
since d = D3 , we have
π
4
D2 −
D
3
2 =
π
4× 8D2
9= 3.45
D = 2.22 cmAns⇐=
mf =ma
14=
0.0308
14= 0.0022 kg/s
mf = CdfAfρf
2Δpfρf
= CdfAf
2ρfΔpf
For gasoline the pressure difference across the main jet is given by
Δpf = pa − pf − ghρf
mf = CdfAf
2ρf (pa − p2 − ghρf )
0.0022 = 0.65×Af
2× 750
105(1− 0.943)− 9.81× 6
103× 750
Af = 1.162× 10⁻⁶ m2 = 0.01162 cm2
d = 0.122 cm = 1.22 mmAns⇐=

Carburetion 229
7.4 Determine the change of air-fuel ratio in an airplane-engine carburetorwhen it takes off from sea level to a height of 5000 m. Carburetor isadjusted for 15:1 ratio at sea level where air temperature is 27◦C andpressure 1 bar.Assume the variation of temperature of air with altitude at t = ts − 0.0065 hwhere h is in m and t is in ◦C. The air pressure decreases with altitudeas per the relation h = 19200 log10(1/p), where p is in bar. Evaluate thevariation of air-fuel ratio with respect to altitude in steps of 1000 m onthe trend. Show the variation on a graph and discuss.
Solution
We shall illustrate the calculation for 5000 m
Temperature at 5000 m
t = 300− 0.0065 h
= 300− 0.0065× 5000 = 267.5 K
h = 19200 log10
1
p
10h/19200 =1
p
p =1
10h/19200= 10−h/19200 = 0.549 bar
ρsl =psl
RTsl=
1× 10⁵
287× 300= 1.161
ρal =pal
RTal=
0.5490× 10⁵
0.287× 1000× 267.5= 0.715
A/Fal = A/Fsl ×!
ρalρsl
= 15×!
0.715
1.16
= 11.77Ans⇐=
Similarly we can calculate A/F for various altitudes. The results are given inthe table. The variation is shown in the following graph.
h 0 1000 2000 3000 4000 5000A/F 15 14.283 13.603 12.959 12.348 11.77
It is seen from the graph that with increase in altitude the mixturebecomes richer and richer. Therefore some altitude compensating deviceshould be incorporated. Otherwise proper combustion will not takeplace.

230 IC Engines
x
x
x
x
x
x
h
Air
-fuel
rat
io
0 2000 4000 6000
14
16
12
10
7.5 The venturi of a simple carburetor has a throat diameter of 20 mm andthe coefficient of flow is 0.8. The fuel orifice has a diameter of 1.14 mmand the coefficient of fuel flow is 0.65. The gasoline surface is 5 mmbelow the throat, calculate
(i) the air-fuel ratio for a pressure drop of 0.08 bar when the nozzletip is neglected
(ii) the air-fuel ratio when the nozzle tip is taken into account
(iii) the minimum velocity of air or critical air velocity required to startthe fuel flow when the nozzle tip is provided.
Assume the density of air and fuel as 1.20 and 750 kg/m3 respectively.
Solution
(i) When the nozzle tip is neglected
ma = CdaAa
2ρaΔp
mf = CdfAf
2ρfΔp
A/F =Cda
Cdf
Aa
Af
!ρaρf
=0.80
0.65×
20
1.14
2×!
1.20
750
= 15.15Ans⇐=
(ii) When the nozzle tip is taken into account, ma will remain the same, But
mf = CdfAF
2ρf (Δp− ρfghf )
ρfghf =5
1000× 9.81× 750 = 36.79 N/m
2
= 36.79× 10−5 = 0.00037 bar
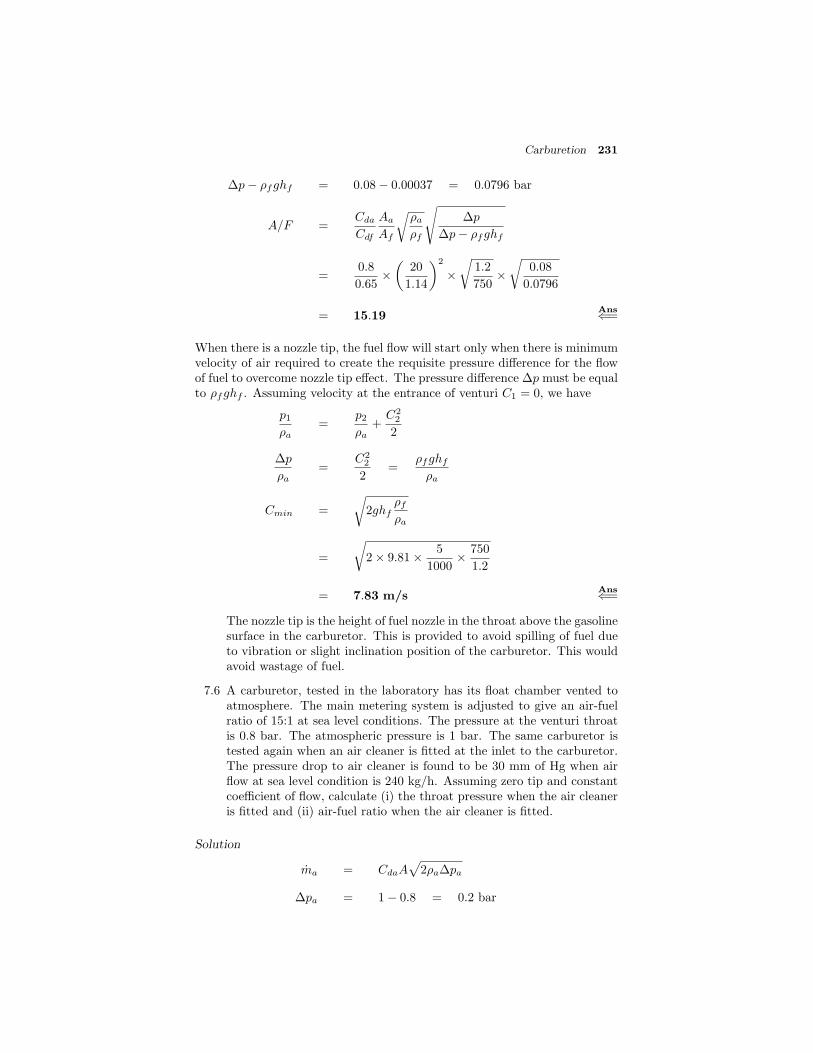
Carburetion 231
Δp− ρfghf = 0.08− 0.00037 = 0.0796 bar
A/F =Cda
Cdf
Aa
Af
!ρaρf
Δp
Δp− ρfghf
=0.8
0.65×
20
1.14
2×!
1.2
750×!
0.08
0.0796
= 15.19Ans⇐=
When there is a nozzle tip, the fuel flow will start only when there is minimumvelocity of air required to create the requisite pressure difference for the flowof fuel to overcome nozzle tip effect. The pressure difference Δp must be equalto ρfghf . Assuming velocity at the entrance of venturi C1 = 0, we have
p1ρa
=p2ρa
+C22
2
Δp
ρa=
C22
2=
ρfghf
ρa
Cmin =
!2ghf
ρfρa
=
!2× 9.81× 5
1000× 750
1.2
= 7.83 m/sAns⇐=
The nozzle tip is the height of fuel nozzle in the throat above the gasolinesurface in the carburetor. This is provided to avoid spilling of fuel dueto vibration or slight inclination position of the carburetor. This wouldavoid wastage of fuel.
7.6 A carburetor, tested in the laboratory has its float chamber vented toatmosphere. The main metering system is adjusted to give an air-fuelratio of 15:1 at sea level conditions. The pressure at the venturi throatis 0.8 bar. The atmospheric pressure is 1 bar. The same carburetor istested again when an air cleaner is fitted at the inlet to the carburetor.The pressure drop to air cleaner is found to be 30 mm of Hg when airflow at sea level condition is 240 kg/h. Assuming zero tip and constantcoefficient of flow, calculate (i) the throat pressure when the air cleaneris fitted and (ii) air-fuel ratio when the air cleaner is fitted.
Solution
ma = CdaA
2ρaΔpa
Δpa = 1− 0.8 = 0.2 bar

232 IC Engines
when air cleaner is fitted, let p
t be the throat pressure, then
Δp
a = (1− 0.04− p
t) = 0.96− p
t
For the same air flow and constant coefficients
Δpa = Δp
a
0.2 = 0.96− p
t
p
t = 0.96− 0.2 = 0.76 barAns⇐=
Without air cleaner
Δpa = 0.20 bar
With air cleaner fitted with float chamber still vented to atmosphere
Δpf = 1− 0.76 = 0.24
Since Δpf has increased more fuel will flow through, making the mixturericher
New A/F = 15×!
0.2
0.24= 13.7
Ans⇐=
7.7 A four-cylinder, four-stroke SI engine, having a bore of 10 cm and stroke9 cm runs at 4000 rpm. The fuel used has a carbon content of 84.50 percent and hydrogen content of 15.50 per cent by weight. The volumetricefficiency of the engine at 75% of full throttle and at 4000 rpm is 0.85referred to 300 K and 1 bar. The engine is to be supplied with a mixtureof air coefficient 0.95 when running at 75% of full throttle. Calculatethe throat diameter of the venturi if the air velocity at throat is not toexceed 200 m/s under the above operating conditions. Also calculate therate of fuel flow in kg/s at the pressure drop at venturi throat. Dischargecoefficient for the venturi is 0.8 and the area ratio of the venturi is 0.8.Take R for air as 0.287 kJ/kg K and for fuel vapour is 0.09 kJ/kg K.
Solution
Volume flow rate of mixture/second
=π
4× 102 × 9× 10−6 × 4000
2× 60× 4× 0.85
= 0.08 m3/s
Air required for the stoichiometric mixture with 1 kg of fuel
=
0.845
12× 32 +
0.155
2× 16
× 100
23.3
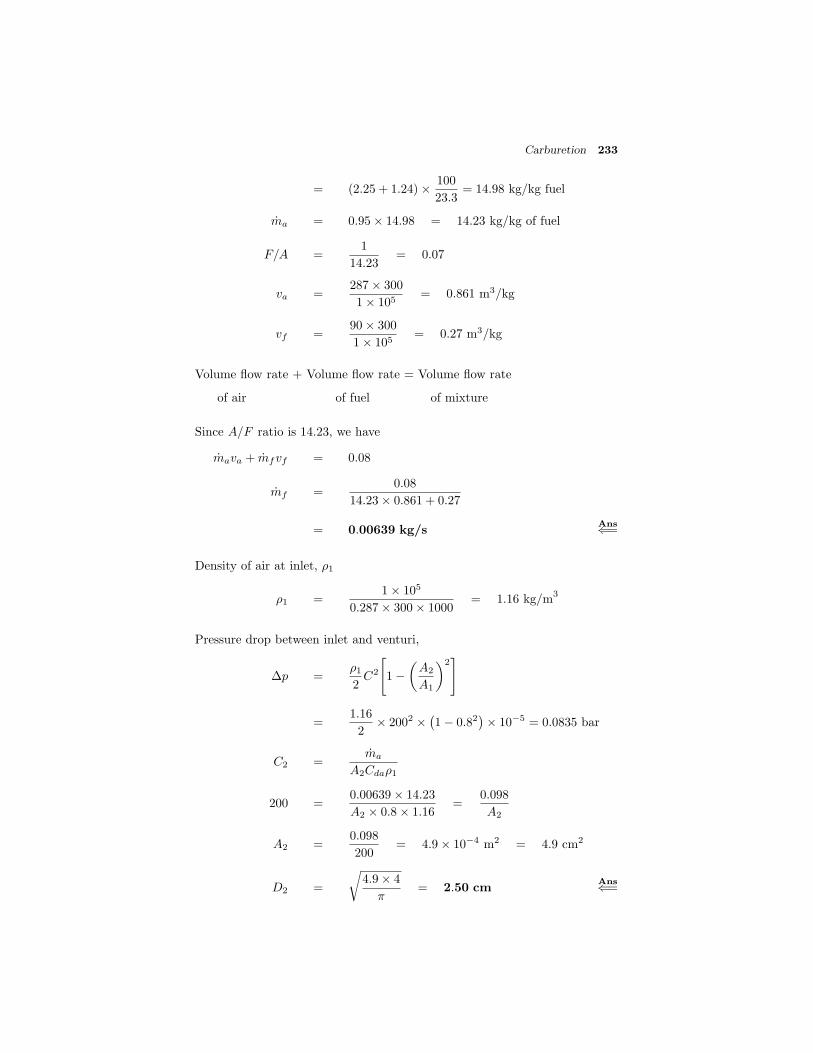
Carburetion 233
= (2.25 + 1.24)× 100
23.3= 14.98 kg/kg fuel
ma = 0.95× 14.98 = 14.23 kg/kg of fuel
F/A =1
14.23= 0.07
va =287× 300
1× 105= 0.861 m3/kg
vf =90× 300
1× 105= 0.27 m3/kg
Volume flow rate + Volume flow rate = Volume flow rate
of air of fuel of mixture
Since A/F ratio is 14.23, we have
mava + mfvf = 0.08
mf =0.08
14.23× 0.861 + 0.27
= 0.00639 kg/sAns⇐=
Density of air at inlet, ρ1
ρ1 =1× 10⁵
0.287× 300× 1000= 1.16 kg/m
3
Pressure drop between inlet and venturi,
Δp =ρ12
C2
1−
A2
A1
2
=1.16
2× 2002 × 1− 0.82
× 10−5 = 0.0835 bar
C2 =ma
A2Cdaρ1
200 =0.00639× 14.23
A2 × 0.8× 1.16=
0.098
A2
A2 =0.098
200= 4.9× 10⁻⁴ m2 = 4.9 cm2
D2 =
!4.9× 4
π= 2.50 cm
Ans⇐=

234 IC Engines
Review Questions
7.1 Define carburetion.
7.2 Explain the factors that affect the process of carburetion.
7.3 What are different air-fuel mixture on which an engine can be operated?
7.4 Explain the following: (i) rich mixture, (ii) stoichiometric mixture, and(iii) lean mixture.
7.5 How the power and efficiency of the SI engine vary with air-fuel ratiofor different load and speed conditions?
7.6 By means of a suitable graph explain the necessary carburetor perfor-mance to fulfill engine requirements.
7.7 Briefly discuss the air-fuel ratio requirements of a petrol engine from noload to full load.
7.8 Explain why a rich mixture is required for the following:(i) idling, (ii) maximum power, and sudden acceleration.
7.9 Explain the principle of carburetion.
7.10 With a neat sketch explain the working principle of a simple carburetor.
7.11 Derive an expression for air-fuel ratio of a simple carburetor.
7.12 Develop an expression for air-fuel ratio neglecting compressibility for asimple carburetor.
7.13 Explain why a simple carburetor cannot meet the various engine require-ments.
7.14 Describe the essential parts of a modern carburetor.
7.15 Describe with suitable sketches the following system of a modern carbu-retor:
(i) main metering system
(ii) idling system
(iii) economizer system
(iv) acceleration pump system
(v) choke
7.16 What are the three basic types of carburetors? Explain.
7.17 With suitable sketches explain the various modern automobile carbure-tors.
7.18 With a suitable sketch explain the starting circuit of a Solex carburetor.

Carburetion 235
7.19 Draw the sketch of a carter downdraught carburetor. How do the idleand low speed circuit work in this carburetor?
7.20 What are the special requirements of an air craft carburetor? What doyou understand by altitude compensation? Explain.
Exercise
7.1 The fuel consumption of a gasoline engine is 6 litres/hour. Carbure-tor provides an air-fuel ratio of 15:1. The venturi diameter is 15 mm.Determine the diameter of the main metering jet if the tip of the jetis 2.5 mm above the fuel level in the float chamber. The barometricreading is 750 mm of Hg and the atmospheric temperature is 27 ◦C.Assume Ca = 0.85 and Cf = 0.7. Take specific gravity of fuel as 0.7,and 1 atmosphere = 760 mm of Hg = 1 bar. Neglect compressibilityeffect. Ans: 0.86 mm
7.2 A simple carburetor is designed to supply 6 kg of air per minute and0.4 kg of fuel per minute. The density of the fuel is 770 kg/m3. The airis initially at 1 bar and 17 ◦C. Calculate the venturi throat diameter ifthe velocity of air at throat is 100 m/s. Assume Cda = 0.84, Cdf = 0.65and γ = 1.4. If the drop across the fuel metering orifice is 0.85 of thepressure at the throat. Ans: 2.09 mm
7.3 An engine fitted with a single jet carburetor having a jet diameter of1.25 mm has a fuel consumption of 6 kg/h. The specific gravity offuel is 0.7. The level of fuel in the float chamber is 5 mm below thetop of the jet when the engine is not running. Ambient conditionsare 1 bar and 17 ◦C. The fuel jet diameter is 0.6 mm. The dischargecoefficient of air is 0.85. Air-fuel ratio is 15. Determine the criticalvelocity of flow at throat and the throat diameter. Express the pres-sure at throat in mm of water column. Neglect compressibility effect.
Ans: (i) 6.43 m/s (ii) 20 mm (iii) 360 mm of water
7.4 A six cylinder four-stroke engine with bore and stroke 10 cm each, usesgasoline with the following composition: C = 85% and H2 = 15%. Thethroat diameter of the venturi is 50 mm. The volumetric efficiency at4000 rpm is 0.75 referred to 17◦C and 1 bar. The pressure differentialat venturi is 0.12 bar. The temperature at throat is 27 ◦C. If chemicallycorrect air-fuel ratio is supplied by the carburetor determine
(i) fuel consumption in kg/h and
(ii) the air velocity at throat
Assume R for air = 287 J/kg K and for fuel 97 J/kg K.Ans: (i) 33 kg/h (ii) 69.1 m/s
7.5 A carburetor with float chamber vented to atmosphere is tested in alaboratory without air cleaner. The engine is run on economy modewith an air-fuel ratio of 16 at 1 bar. The throat pressure measured is

236 IC Engines
0.82 bar. The same carburetor is once again test with air cleaner fittedon to it. The additional pressure drop due to air cleaner is 0.04 bar.With air flow at the atmospheric conditions to remain unchanged at250kg/h. Assuming same air flow in both cases and constant coefficientof flow determine
(i) throat pressure with air cleaner fitted
(ii) the air fuel ratio with air cleaner fitted
Ans: (i) 0.78 bar (ii) 14.47
7.6 A four-stroke engine carburetor is set for a 10% lean operation at sealevel where the temperature and pressure are 27 ◦C and 1 bar. The sameengine was tested at 3 km altitude. Determine the percentage richnessthe carburetor will provide at 3 km if the temperature and pressure ataltitude varies according to the following equations.
t = ts − 0.008H
H = 8400ln
1
p
where ts is the temperature at sea level (◦C), H is the height in meters,p is the pressure at altitude in bar. Ans: 6.66%
7.7 A 1.6 litre cubic capacity four-stroke SI engine has a volumetric effi-ciency of 75% at a speed of 5000 rpm. The carburetor gives an air-fuel ratio of 14. The air velocity at the throat is 100 m/s. Take Cda
= 0.9 and Cdf = 0.7. Lip height h = 5mm, specific gravity of fuel= 0.8. Atmospheric pressure and temperature are 1 bar and 27 ◦C.An allowance must be made for the emulsion tube. The diameter ofthe tube may be assumed 1
25 of the choke diameter. Cp of air 1.005kJ/kg K. Determine the size of the venturi throat and main jet diame-ter. Ans: (i) 29.62 mm (ii) 1.58 mm
7.8 The cubic capacity of a four-stroke SI engine is 50 cc. It runs at 6000rpm with an air-fuel ratio of 15:1. The ratio of venturi throat diameterto the fuel jet diameter is 10. The engine works with a volumetric effi-ciency of 75%. The venturi throat diameter is 10 mm with a dischargecoefficient of 0.85. The discharge coefficient of fuel nozzle is 0.65. Spe-cific gravity of the fuel is 0.75. Calculate the lip height of the fuel nozzle.Take atmospheric conditions as 1 bar and 300 K. Neglect compressibilityeffect. Ans: 3.89 mm
7.9 Determine the air-fuel ratio supplied at 4000 m altitude by a carbure-tor which is adjusted to give a stoichiometric air-fuel ratio at sea levelwhere air temperature is 300 K and pressure is 1 bar. Assume that thetemperature of air decreases with altitude given by
t = ts − 0.00675h
Carburetion 237
where h is height in metres and ts is sea level temperature in ◦C. Theair pressure decreases with altitude as per the relation
h = 19000 log10
1
p
where p is in bar. State any assumption made.Ans: A/F at 4000 m = 12.35
7.10 Determine the size of fuel orifice to give a 13.5:1 air-fuel ratio, if theventuri throat has 3 cm diameter and the pressure drop in the venturiis 6.5 cm Hg. The air temperature and pressure at carburetor entranceare 1 bar and 27 ◦C respectively. The fuel orifice is at the same level asthat of the float chamber. Take density of gasoline as 740 kg/m3 anddischarge coefficient as unity. Assume atmospheric pressure to be 76 cmof Hg. Ans: Orifice diameter = 1.62 mm
7.11 A four-stroke gasoline engine with a swept volume of 5 litres has avolumetric efficiency of 75% when running at 3000 rpm. The en-gine is fitted with a carburetor which has a choke diameter of 35mm. Assuming the conditions of a simple carburetor and neglectingthe effects of compressibility, calculate the pressure and the air ve-locity at the choke. Take the coefficient of discharge at the throatas 0.85 and take the atmospheric conditions as 1bar and 27 ◦C.
Ans: (i) Air velocity at the choke = 114.6 m/s(ii) Pressure at the choke = 0.925 bar
7.12 A single jet carburetor is to supply 6 kg/min of air and 0.44 kg/min ofpetrol of specific gravity 0.74. The air is initially at 1 bar and 27 ◦C.Assuming an isentropic coefficient of 1.35 for air, determine (i) the diam-eter of the venturi if the air speed is 90 m/s and the velocity coefficientfor venturi is 0.85 (ii) the diameter of the jet if the pressure drop at thejet is 0.8 times the pressure drop at the venturi, and the coefficient of dis-charge for the jet is 0.66. Ans: (i) Diameter of the venturi = 3.58 cm
(ii) Diameter of the jet = 2.2 mm
7.13 A 8.255 cm × 8.9 cm four-cylinder, four-stroke cycle SI engine is to havea maximum speed of 3000 rpm and a volumetric efficiency of 80 per cent.If the maximum venturi depression is to be 0.1 bar (i) what must be thesize of the venturi? (ii) Determine the size of fuel orifice if an air-fuelratio of 12 to 1 is desired. Assume ρa = 1.2 kg/m3, ρf = 740 kg/m3,Cda = 0.8 Cdf = 0.6. Ans: (i) Diameter of the venturi = 2.16 cm
(ii) Diameter of the jet = 1.45 mm
7.14 A six-cylinder, four-stroke cycle engine has a bore of 8 cm and astroke of 11 cm and operates at a speed of 2000 rpm with volumet-ric efficiency of 80 per cent. If the diameter of the venturi sectionis 2.5 cm, what should be the diameter of the fuel orifice to ob-tain an A/F ratio of 12 to 1? Assume air density as 1.16 kg/m3.
Ans: Diameter of the fuel orifice = 1.66 mm

238 IC Engines
7.15 An automobile carburetor having its float chamber vented to the atmo-sphere is tested in the factory without an air cleaner at sea-level con-ditions, the main metering system of this carburetor is found to yielda fuel-air ratio of 0.065. The venturi throat pressure is 0.84 bar. Thiscarburetor is now installed in an automobile and an air cleaner is placedon the inlet to the carburetor. With the engine operating at 230 kg/hair consumption and at sea-level conditions, there is found to be a pres-sure drop through the air filter of 0.035 bar. Assuming z = 0 and orificecoefficients constant, calculate
(i) the venturi throat pressure with air cleaner
(ii) fuel-air ratio with air cleaner
Assume that the flow through the carburetor is incompressible.Ans: (i) Venturi throat pressure with air cleaner=0.805 bar
(ii) Fuel-air ratio with air cleaner = 0.0717
Multiple Choice Questions (choose the most appropriate answer)
1. Stoichiometric air-fuel ratio of petrol is roughly
(a) 50:1
(b) 25:1
(c) 15:1
(d) 1:1
2. Venturi in the carburetor results in
(a) decrease of air velocity
(b) increase of air velocity
(c) decrease of fuel flow
(d) increase of manifold vacuum
3. The choke is closed when the engine is
(a) accelerating
(b) hot
(c) cold
(d) idling
4. Lean air mixture is required during
(a) idling
(b) starting
(c) accelerating
(d) cruising

Carburetion 239
5. The limits of air-fuel for SI engine are
(a) 8/1 to 18/1
(b) 8/1 to 50/1
(c) 25/1 to 50/1
(d) 50/1 to 100/1
6. In a SI engine for maximum power, the relative fuel-air ratio is
(a) 1.5
(b) 1.2
(c) 0.8
(d) 0.6
7. For maximum thermal efficiency, the fuel-air mixture in SI enginesshould be
(a) lean
(b) rich
(c) stoichiometric
(d) may be rich or lean
8. During starting petrol engines require
(a) stoichiometric mixture
(b) lean mixture
(c) rich mixture
(d) any air-fuel ratio is alright
9. For petrol engines the method of governing is
(a) hit and miss governing
(b) quality governing
(c) quantity governing
(d) none of the above
10. Economizer is used to provide enriched mixture during
(a) starting
(b) idling
(c) cruising
(d) full throttle operation

240 IC Engines
11. When the throttle is suddenly opened, the mixture from the simplecarburetor tends to become
(a) rich
(b) lean
(c) stoichiometric
(d) not affected
12. Precise petrol injection system is
(a) direct injection
(b) sequential injection
(c) throttle body injection
(d) port injection
13. The choke in an automobile meant for supplying
(a) lean mixture
(b) rich mixture
(c) stoichiometric mixture
(d) weak mixture
14. Modern carburettors provide the correct quality of air-fuel mixture dur-ing
(a) starting
(b) idling
(c) cruising
(d) all conditions
15. A simple carburettor supplies rich mixture during
(a) starting
(b) idling
(c) cruising
(d) accelerating
Ans: 1. – (c) 2. – (b) 3. – (c) 4. – (d) 5. – (a)6. – (b) 7. – (a) 8. – (c) 9. – (c) 10. – (d)
11. – (b) 12. – (c) 13. – (b) 14. – (d) 15. – (d)
8MECHANICAL
INJECTION SYSTEMS
8.1 INTRODUCTION
The fuel-injection system is the most vital component in the working of CIengines. The engine performance viz., power output, economy etc. is greatlydependent on the effectiveness of the fuel-injection system. The injectionsystem has to perform the important duty of initiating and controlling thecombustion process.
Basically, the purpose of carburetion and fuel-injection is the same viz.,preparation of the combustible charge. But in case of carburetion fuel isatomized by processes relying on the air speed greater than fuel speed at thefuel nozzle, whereas, in fuel-injection the fuel speed at the point of delivery isgreater than the air speed to atomize the fuel. In carburetors, as explained inChapter 7, air flowing through a venturi picks up fuel from a nozzle locatedthere. The amount of fuel drawn into the engine depends upon the air velocityin the venturi. In a fuel-injection system, the amount of fuel delivered intothe air stream going to the engine is controlled by a pump which forces thefuel under pressure.
When the fuel is injected into the combustion chamber towards the endof compression stroke, it is atomized into very fine droplets. These dropletsvaporize due to heat transfer from the compressed air and form a fuel-air mix-ture. Due to continued heat transfer from hot air to the fuel, the temperaturereaches a value higher than its self-ignition temperature. This causes the fuelto ignite spontaneously initiating the combustion process.
8.2 FUNCTIONAL REQUIREMENTS OF AN INJECTION SYSTEM
For a proper running and good performance from the engine, the followingrequirements must be met by the injection system:
(i) Accurate metering of the fuel injected per cycle. This is very criticaldue to the fact that very small quantities of fuel being handled. Me-tering errors may cause drastic variation from the desired output. Thequantity of the fuel metered should vary to meet changing speed andload requirements of the engine.
(ii) Timing the injection of the fuel correctly in the cycle so that maximumpower is obtained ensuring fuel economy and clean burning.
(iii) Proper control of rate of injection so that the desired heat-release patternis achieved during combustion.
242 IC Engines
(iv) Proper atomization of fuel into very fine droplets.
(v) Proper spray pattern to ensure rapid mixing of fuel and air.
(vi) Uniform distribution of fuel droplets in the combustion chamber.
(vii) To supply equal quantities of metered fuel to all cylinders in case ofmulti cylinder engines.
(viii) No lag during beginning and end of injection i.e., to eliminate dribblingof fuel droplets into the cylinder.
8.3 CLASSIFICATION OF INJECTION SYSTEMS
In a constant-pressure cycle or diesel engine, only air is compressed in thecylinder and then fuel is injected into the cylinder by means of a fuel-injectionsystem. For producing the required pressure for atomizing the fuel either airor a mechanical means is used. Accordingly the injection systems can beclassified as:
(i) Air injection systems
(ii) Solid injection systems
8.3.1 Air Injection System
In this system, fuel is forced into the cylinder by means of compressed air.This system is little used nowadays, because it requires a bulky multi-stage aircompressor. This causes an increase in engine weight and reduces the brakepower output further. One advantage that is claimed for the air injectionsystem is good mixing of fuel with the air with resultant higher mean effectivepressure. Another is the ability to utilize fuels of high viscosity which are lessexpensive than those used by the engines with solid injection systems. Theseadvantages are off-set by the requirement of a multistage compressor therebymaking the air-injection system obsolete.
8.3.2 Solid Injection System
In this system the liquid fuel is injected directly into the combustion chamberwithout the aid of compressed air. Hence, it is also called airless mechanicalinjection or solid injection system. Solid injection systems can be classifiedas:
(i) Individual pump and nozzle system
(ii) Unit injector system
(iii) Common rail system
(iv) Distributor system
All the above systems comprise mainly of the following components.

Mechanical Injection Systems 243
(i) fuel tank,
(ii) fuel feed pump to supply fuel from the main fuel tank to the injectionsystem,
(iii) injection pump to meter and pressurize the fuel for injection,
(iv) governor to ensure that the amount of fuel injected is in accordance withvariation in load,
(v) injector to take the fuel from the pump and distribute it in the combus-tion chamber by atomizing it into fine droplets,
(vi) fuel filters to prevent dust and abrasive particles from entering the pumpand injectors thereby minimizing the wear and tear of the components.
A typical arrangement of various components for the solid injection systemused in a CI engine is shown in Fig.8.1. Fuel from the fuel tank first entersthe coarse filter from which is drawn into the plunger feed pump where thepressure is raised very slightly. Then the fuel enters the fine filter where allthe dust and dirt particles are removed. From the fine filter the fuel enters thefuel pump where it is pressurized to about 200 bar and injected into the enginecylinder by means of the injector. Any spill over in the injector is returnedto the fine filter. A pressure relief valve is also provided for the safety of thesystem. The above functions are achieved with the components listed above.The types of solid injection system described in the following sections differonly in the manner of operation and control of the components mentionedabove.
Fuel pump
Plunger feed pumpCoarse filter
Injector Fine filter
Pressure relief valve
Fuel tank
Fig. 8.1 Typical fuel feed system for a CI engine
8.3.3 Individual Pump and Nozzle System
The details of the individual pump and nozzle system are shown in Fig.8.2(a)and (b). In this system, each cylinder is provided with one pump and oneinjector. In this arrangement a separate metering and compression pump isprovided for each cylinder. The pump may be placed close to the cylinderas shown in Fig.8.2(a) or they may be arranged in a cluster as shown in

244 IC Engines
Fig.8.2(b). The high pressure pump plunger is actuated by a cam, and pro-duces the fuel pressure necessary to open the injector valve at the correct time.The amount of fuel injected depends on the effective stroke of the plunger.
Injector
HP line
LP pumpHP pumps
Fuel in
(a) Individual pump and nozzlewith separated pumps
(b) Individual pump and nozzlewith pumps in cluster
Injector
HP line
LP pump
Fuel in
HP pumps
(c) Unit injector system
Injectors with HP pump
LP line
LP pump
Return
(d) Common rail system
Injector
HP line
HP pump
Fuel inHeader
Fig. 8.2 Injection systems with pump and nozzle arrangements used in CIengines
8.3.4 Unit Injector System
The unit injector system, Fig.8.2(c), is one in which the pump and the injectornozzle are combined in one housing. Each cylinder is provided with one ofthese unit injectors. Fuel is brought up to the injector by a low pressure pump,where at the proper time, a rocker arm actuates the plunger and thus injectsthe fuel into the cylinder. The amount of fuel injected is regulated by theeffective stroke of the plunger. The pump and the injector can be integratedin one unit as shown in Fig.8.2(c).
8.3.5 Common Rail System
In the common rail system, Fig.8.2(d), a HP pump supplies fuel, under highpressure, to a fuel header. High pressure in the header forces the fuel to eachof the nozzles located in the cylinders. At the proper time, a mechanically

Mechanical Injection Systems 245
Table 8.1 Comparison of Various Fuel-Injection Systems
Air Solid injection systemJob injection Individual Common Distributor
system pump railMetering Pump Pump Injection Pump
valveTiming Fuel cam Pump cam Fuel cam Fuel camInjection Spray valve Pump cam Spray Fuel camrate valveAtomization Spray valve Spray tip Spray tip Spray tipDistribution Spray valve Spray tip Spray tip Spray tip
operated (by means of a push rod and rocker arm) valve allows the fuel toenter the proper cylinder through the nozzle. The pressure in the fuel headermust be that, for which the injector system was designed, i.e., it must enableto penetrate and disperse the fuel in the combustion chamber. The amountof fuel entering the cylinder is regulated by varying the length of the pushrod stroke. A high pressure pump is used for supplying fuel to a header, fromwhere the fuel is metered by injectors (assigned one per cylinder). The detailsof the system are illustrated in Fig.8.2(d).
8.3.6 Distributor System
Figure 8.3 shows a schematic diagram of a distributor system. In this systemthe pump which pressurizes the fuel also meters and times it. The fuel pumpafter metering the required amount of fuel supplies it to a rotating distributorat the correct time for supply to each cylinder. The number of injection strokesper cycle for the pump is equal to the number of cylinders. The details ofthe system are given in Fig.8.3. Since there is one metering element in eachpump, a uniform distribution is automatically ensured. Not only that, thecost of the fuel-injection system also reduces to a value less than two-thirdsof that for individual pump system. A comparison of various fuel-injectionsystems is given in Table 8.1.
HP line
Distributor
Pump
Low pressure fuel
High pressure fuel
Fig. 8.3 Schematic diagram of distributor system

246 IC Engines
8.4 FUEL FEED PUMP
A schematic sketch of fuel feed pump is shown in Fig.8.4. It is of spring loadedplunger type. The plunger is actuated through a push rod from the cam shaft.At the minimum lift position of the cam the spring force on the plunger creates
Suction
Fuel pump Injector
Fig. 8.4 Schematic diagram of fuel feed pump
a suction which causes fuel flow from the main tank into the pump. When thecam is turned to its maximum lift position, the plunger is lifted upwards. Atthe same time the inlet valve is closed and the fuel is forced through the outletvalve. When the operating pressure gets released, the plunger return springceases to function resulting in varying of the pumping stroke under varyingengine loads according to the quantity of fuel required by the injection pump.
8.5 INJECTION PUMP
The main objectives of fuel-injection pump is to deliver accurately meteredquantity of fuel under high pressure (in the range from 120 to 200 bar) at thecorrect instant to the injector fitted on each cylinder. Injection pumps are oftwo types, viz. (i) Jerk type pumps (ii) Distributor type pumps
8.5.1 Jerk Type Pump
It consists of a reciprocating plunger inside a barrel. The plunger is drivenby a camshaft. The working principle of jerk pump is illustrated in Fig.8.5.
(a) A sketch of a typical plunger is shown.
(b) A schematic diagram of the plunger within the barrel is shown. Nearthe port A, fuel is always available under relatively low pressure. Whilethe axial movement of the plunger is through cam shaft, its rotational
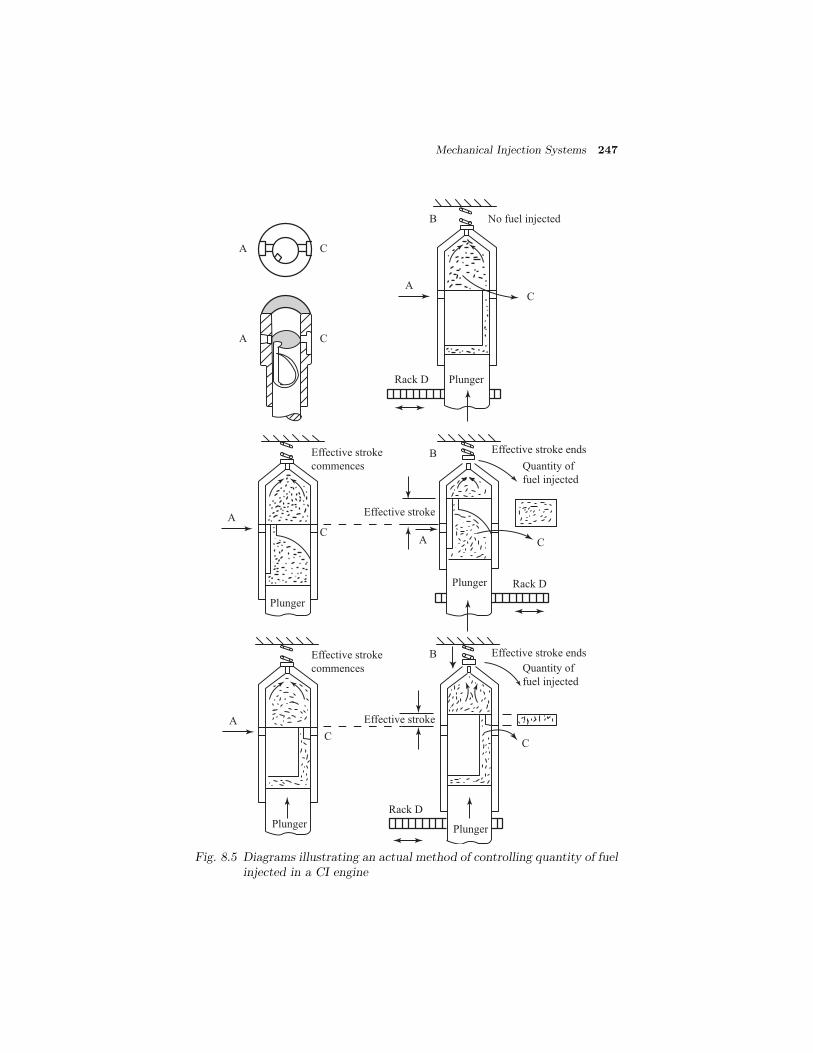
Mechanical Injection Systems 247
A C
A C
Rack D
B No fuel injected
AC
Plunger
Effective stroke
commences
C
Plunger
C
Effective stroke
commences
Effective stroke
Rack D
PlungerPlunger
Effective stroke ends
Rack DPlunger
Effective stroke
Effective stroke ends
Quantity of
fuel injected
B
B
Quantity of
fuel injected
C
C
A
A
A
Fig. 8.5 Diagrams illustrating an actual method of controlling quantity of fuelinjected in a CI engine
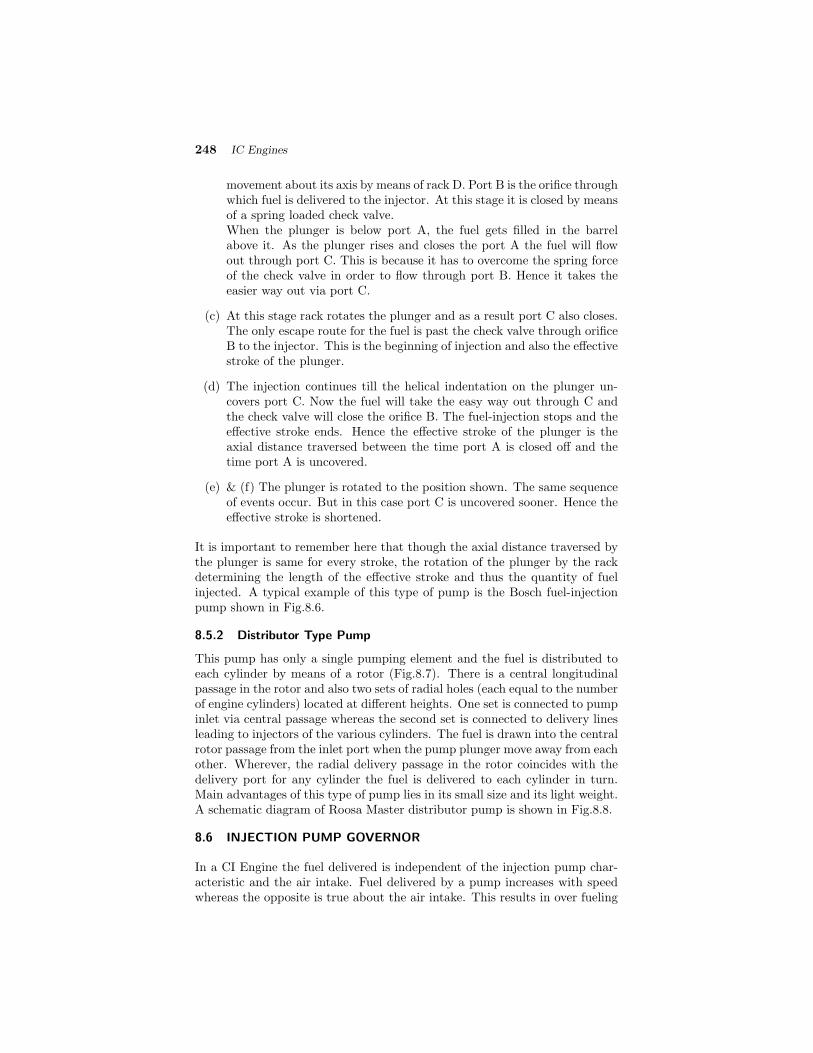
248 IC Engines
movement about its axis by means of rack D. Port B is the orifice throughwhich fuel is delivered to the injector. At this stage it is closed by meansof a spring loaded check valve.When the plunger is below port A, the fuel gets filled in the barrelabove it. As the plunger rises and closes the port A the fuel will flowout through port C. This is because it has to overcome the spring forceof the check valve in order to flow through port B. Hence it takes theeasier way out via port C.
(c) At this stage rack rotates the plunger and as a result port C also closes.The only escape route for the fuel is past the check valve through orificeB to the injector. This is the beginning of injection and also the effectivestroke of the plunger.
(d) The injection continues till the helical indentation on the plunger un-covers port C. Now the fuel will take the easy way out through C andthe check valve will close the orifice B. The fuel-injection stops and theeffective stroke ends. Hence the effective stroke of the plunger is theaxial distance traversed between the time port A is closed off and thetime port A is uncovered.
(e) & (f) The plunger is rotated to the position shown. The same sequenceof events occur. But in this case port C is uncovered sooner. Hence theeffective stroke is shortened.
It is important to remember here that though the axial distance traversed bythe plunger is same for every stroke, the rotation of the plunger by the rackdetermining the length of the effective stroke and thus the quantity of fuelinjected. A typical example of this type of pump is the Bosch fuel-injectionpump shown in Fig.8.6.
8.5.2 Distributor Type Pump
This pump has only a single pumping element and the fuel is distributed toeach cylinder by means of a rotor (Fig.8.7). There is a central longitudinalpassage in the rotor and also two sets of radial holes (each equal to the numberof engine cylinders) located at different heights. One set is connected to pumpinlet via central passage whereas the second set is connected to delivery linesleading to injectors of the various cylinders. The fuel is drawn into the centralrotor passage from the inlet port when the pump plunger move away from eachother. Wherever, the radial delivery passage in the rotor coincides with thedelivery port for any cylinder the fuel is delivered to each cylinder in turn.Main advantages of this type of pump lies in its small size and its light weight.A schematic diagram of Roosa Master distributor pump is shown in Fig.8.8.
8.6 INJECTION PUMP GOVERNOR
In a CI Engine the fuel delivered is independent of the injection pump char-acteristic and the air intake. Fuel delivered by a pump increases with speedwhereas the opposite is true about the air intake. This results in over fueling

Mechanical Injection Systems 249
To injector
Delivery valve(in delivery position) Helix on plunger
Spill port
Plunger
Control rack
Housing
Delivery valve spring
Fuel inlet
Intake port
Fuel sump
Toothed control
sleeve
Lug attached
to plunger
Plunger
return spring
20 10 0
Fig. 8.6 Single cylinder jerk pump type fuel-injection system
Inlet
A
Outlet
BB
A
Rotors
Plungers
Section at AA Section at BB
Fig. 8.7 Principle of working of distributor type fuel-injection pump
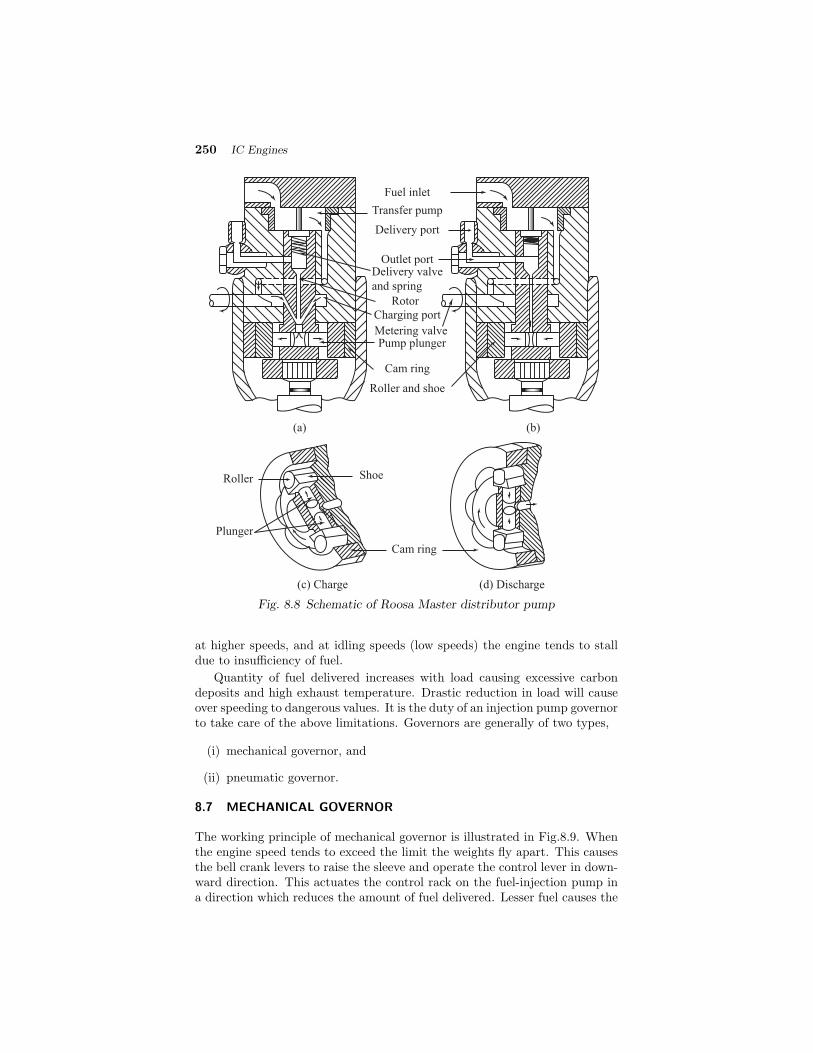
250 IC Engines
Delivery valve
and spring
Rotor
Roller
Plunger
Shoe
Cam ring
(c) Charge (d) Discharge
(a) (b)
Delivery port
Outlet port
Charging port
Metering valvePump plunger
Roller and shoe
Cam ring
Fuel inlet
Transfer pump
Fig. 8.8 Schematic of Roosa Master distributor pump
at higher speeds, and at idling speeds (low speeds) the engine tends to stalldue to insufficiency of fuel.
Quantity of fuel delivered increases with load causing excessive carbondeposits and high exhaust temperature. Drastic reduction in load will causeover speeding to dangerous values. It is the duty of an injection pump governorto take care of the above limitations. Governors are generally of two types,
(i) mechanical governor, and
(ii) pneumatic governor.
8.7 MECHANICAL GOVERNOR
The working principle of mechanical governor is illustrated in Fig.8.9. Whenthe engine speed tends to exceed the limit the weights fly apart. This causesthe bell crank levers to raise the sleeve and operate the control lever in down-ward direction. This actuates the control rack on the fuel-injection pump ina direction which reduces the amount of fuel delivered. Lesser fuel causes the

Mechanical Injection Systems 251
engine speed to decrease. The reverse happens when engine speed tends todecrease.
Spring
Centrifugal weight
Fulcrum
Lever
Governor shaft
Sleeve
Lever to operate
control rack
Fig. 8.9 Principle of mechanical governor
8.8 PNEUMATIC GOVERNOR
The details of a pneumatic governor is shown in Fig.8.10. The amount of vac-uum applied to the diaphragm is controlled by the accelerator pedal throughthe position of the butterfly valve in the venturi unit. A diaphragm is con-nected to the fuel pump control rack. Therefore, position of the acceleratorpedal also determines the position of the pump control rack and hence theamount of fuel injected.
8.9 FUEL INJECTOR
Quick and complete combustion is ensured by a well designed fuel injector.By atomizing the fuel into very fine droplets, it increases the surface areaof the fuel droplets resulting in better mixing and subsequent combustion.Atomization is done by forcing the fuel through a small orifice under highpressure. The injector assembly consists of
(i) a needle valve
(ii) a compression spring
(iii) a nozzle
(iv) an injector body
A cross sectional view of a typical Bosch fuel injector is shown in Fig.8.11.When the fuel is supplied by the injection pump it exerts sufficient force

252 IC Engines
Accelerator pedal
Air filter
Venturi unit
Vacuum pipe
To engine inlet manifold
Fuel to injectorControl rack
Fuel injection pump
Diaphragm
Diaphragm spring
Idling spring adjuster
Idling spring
Diaphragm unit
Venturi control unit
Fig. 8.10 Principle of pneumatic governor
against the spring to lift the nozzle valve, fuel is sprayed into the combustionchamber in a finely atomized particles. After, fuel from the delivery pumpgets exhausted, the spring pressure pushes the nozzle valve back on its seat.For proper lubrication between nozzle valve and its guide a small quantity offuel is allowed to leak through the clearance between them and then drainedback to fuel tank through leak off connection. The spring tension and hencethe valve opening pressure is controlled by adjusting the screw provided atthe top.
8.10 NOZZLE
Nozzle is that part of an injector through which the liquid fuel is sprayed intothe combustion chamber.
The nozzle should fulfill the following functions:
(i) Atomization : This is a very important function since it is the firstphase in obtaining proper mixing of the fuel and air in the combustionchamber.
(ii) Distribution of fuel : Distribution of fuel to the required areas withinthe combustion chamber. Factors affecting this are:
(a) Injection pressure : Higher the injection pressure better the dis-persion and penetration of the fuel into all the desired locations incombustion chamber.

Mechanical Injection Systems 253
Adjusting screw
Spring
Spindle
Nozzle cap
Nozzle body
End cap
Lock nut
Leak off
Fuel inlet
Injector body
Fuel passage
Nozzle valve
Fig. 8.11 Fuel injector (Bosch)
(b) Density of air in the cylinder : If the density of compressed air in thecombustion chamber is high then the resistance to the movementof the droplets is higher and dispersion of the fuel is better.
(c) Physical properties of fuel : The properties like self-ignition tem-perature, vapour pressure, viscosity, etc. play an important role inthe distribution of fuel.
(iii) Prevention of impingement on walls : Prevention of the fuel from im-pinging directly on the walls of combustion chamber or piston. Thisis necessary because fuel striking the walls decomposes and producescarbon deposits. This causes smoky exhaust as well as increase in fuelconsumption.
(iv) Mixing : Mixing the fuel and air in case of non-turbulent type of com-bustion chamber should be taken care of by the nozzle.
8.10.1 Types of Nozzle
The design of the nozzle must be such that the liquid fuel forced through thenozzle will be broken up into fine droplets, or atomized, as it passes into thecombustion chamber. This is the first phase in obtaining proper mixing of thefuel and air in the combustion chamber.

254 IC Engines
The fuel must then be properly distributed, or dispersed, in the desiredareas of the chamber. In this phase, the injection pressure, the density ofthe air in the cylinder and the physical qualities of the fuel in use, as wellas the nozzle design, become important factors. Higher injection pressureresults in better dispersion as well as greater penetration of the fuel into alllocations in the chamber where is presence is desired. It also produces finerdroplets which tend to mix more readily with the air. The greater the densityof the compressed air in the combustion chamber, the greater the resistanceoffered to the travel of the fuel droplets across the chamber, with resultantbetter dispersion of the fuel. The physical qualities of the fuel itself, such asviscosity, surface tension, etc. also enter into the dispersion of the fuel.
The nozzle must spray the fuel into the chamber in such a manner as tominimize the quantity of fuel reaching the surrounding walls. Any fuel strikingthe walls tends to decompose, producing carbon deposits, unpleasant odourand a smoky exhaust, as well as an increase in fuel consumption.
The design of the nozzle is closely interrelated to the type of combustionchamber used. It is sufficient to state here that the turbulent type of com-bustion chamber depends upon chamber turbulence to produce the requiredmixing of the fuel and air. The non-turbulent type of combustion chamber,on the other hand, depends almost entirely on both the nozzle design andinjection pressure to secure the desired mixing in the combustion chamber;consequently, with this type of chamber, the nozzle must accomplish the ad-ditional function of mixing the fuel and air.
Various types of nozzles are used in CI engines. These types are shown inFig.8.12. The most common types are:
(i) the pintle nozzle, (ii) the single hole nozzle(iii) the multi-hole nozzle, (iv) pintaux nozzle
(i) Pintle Nozzle : The stem of the nozzle valve is extended to form a pinor pintle which protrudes through the mouth of the nozzle [Fig.8.12(a)].The size and shape of the pintle can be varied according to the require-ment. It provides a spray operating at low injection pressures of 8-10MPa. The spray cone angle is generally 60◦. Advantage of this nozzleis that it avoids weak injection and dribbling. It prevents the carbondeposition on the nozzle hole.
(ii) Single Hole Nozzle : At the centre of the nozzle body there is a singlehole which is closed by the nozzle valve [Fig.8.12(b)]. The size of thehole is usually of the order of 0.2 mm. Injection pressure is of order of8-10 MPa and spray cone angle is about 15◦. Major disadvantage withsuch nozzle is that they tend to dribble. Besides, their spray angle istoo narrow to facilitate good mixing unless higher velocities are used.
(iii) Multi-hole Nozzle : It consists of a number of holes bored in the tipof the nozzle [Fig.8.12(c)]. The number of holes varies from 4 to 18 andthe size from 35 to 200 μm. The hole angle may be from 20◦ upwards.These nozzles operate at high injection pressures of the order of 18 MPa.Their advantage lies in the ability to distribute the fuel properly evenwith lower air motion available in open combustion chambers.

Mechanical Injection Systems 255
(a) Pintle
(d) Pintaux
Nozzle valve
Nozzle body
Auxiliary hole
(b) Single hole (c) Multihole
Fig. 8.12 Types of nozzles
(iv) Pintaux Nozzle : It is a type of pintle nozzle which has an auxiliaryhole drilled in the nozzle body [Fig.8.12(d)]. It injects a small amountof fuel through this additional hole which is called pilot injection in theupstream direction slightly before the main injection. The needle valvedoes not lift fully at low speeds and most of the fuel is injected throughthe auxiliary hole. Main advantage of this nozzle is better cold startingperformance. (20 to 25 ◦C lower than multi hole design). A majordrawback of this nozzle is that its injection characteristics are poorerthan the multihole nozzle.
8.10.2 Spray Formation
The various phases of spray formation as the fuel is injected through thenozzle are shown in Fig.8.13. At the start of the fuel-injection the pressuredifference across the orifice is low. Therefore single droplets are formed as inFig.8.13(a). As the pressure difference increases the following process occurone after the other.

256 IC Engines
(a)
(e) (f)
(b)
l1
(c)
l2l3
(d)
l2 = l3
Fig. 8.13 Successive phases of spray formation
(i) A stream of fuel emerges from the nozzle, [Fig.8.13(b)].
(ii) The stream encounters aerodynamic resistance from the dense air presentin the combustion chamber (12 to 14 times the ambient pressure) andbreaks into a spray, say at a distance of l3, [Fig.8.13(c)]. The distance ofthis point where this event occurs from the orifice is called the break-updistance.
(iii) With further and further increase in the pressure difference, the break-up distance decreases and the cone angle increases until the apex of thecone practically coincides with the orifice [Fig.8.13(d), (e) and (f)].
At the exit of the orifice the fuel jet velocity, Vf , is of the order of 400 m/s.It is given by the following equation
Vf = Cd
2 (pinj − pcyl)
ρf
where Cd = coefficient of discharge for the orificepinj = fuel pressure at the inlet to injector, N/m2
pcyl = pressure of charge inside the cylinder, N/m2
ρf = fuel density, kg/m3

Mechanical Injection Systems 257
The spray from a circular orifice has a denser and compact core, sur-rounded by a cone of fuel droplets of various sizes and vaporized liquid. Largerdroplets provide a higher penetration into the chamber but smaller dropletsare required for quick mixing and evaporation of the fuel. The diameter ofmost of the droplets in a fuel spray is less than 5 microns. The droplet sizesdepends on various factors which are listed below:
(i) Mean droplet size decreases with increase in injection pressure.
(ii) Mean droplet size decreases with increase in air density.
(iii) Mean droplet size increases with increase in fuel viscosity.
(iv) Size of droplets increases with increase in the size of the orifice.
8.10.3 Quantity of Fuel and the Size of Nozzle Orifice
The quantity of the fuel injected per cycle depends to a great extent uponthe power output of the engine. As already mentioned the fuel is suppliedinto the combustion chamber through the nozzle holes and the velocity of thefuel for good atomization is of the order of 400 m/s. The velocity of the fuelthrough nozzle orifice in terms of h can be given by
Vf = Cd
2gh
where h is the pressure difference between injection and cylinder pressure,measured in m of fuel column.
The volume of the fuel injected per second, Q, is given by
Q = Area of all orifices × fuel jet velocity ×time of one injection × number of injectionsper second for one orifice
Q = π
4d2 × n
× Vf ×
θ
360× 60
N
×
Ni
60
where Ni for four-stroke engine is rpm/2 and for a two-stroke engine Ni isrpm itself and d is the diameter of one orifice in m, n is the number of orifices,θ is the duration of injection in crank angle degrees and Ni is the numberof injections per minute. Usually the rate of fuel-injection is expressed inmm3/degree crank angle/litre cylinder displacement volume to normalize theeffect of engine size.
The rate of fuel injected/degree of crankshaft rotation is a function ofinjector camshaft velocity, the diameter of the injector plunger, and flow areaof the tip orifices. Increasing the rate of injection decreases the durationof injection for a given fuel input and subsequently introduces a change ininjection timing. A higher rate of injection may permit injection timing to beretarded from optimum value. This helps in maintaining fuel economy withoutexcessive smoke emission. However, an increase in injection rate requires anincreased injection pressure and increases the load on the injector push rodand the cam. This may affect the durability of the engine.

258 IC Engines
8.11 INJECTION IN SI ENGINE
Fuel-injection systems are commonly used in CI engines. Presently gasolineinjection system is coming into vogue in SI engines because of the followingdrawbacks of the carburetion.
(i) Non uniform distribution of mixture in multicylinder engines.
(ii) Loss of volumetric efficiency due to restrictions for the mixture flow andthe possibility of back firing.
A gasoline injection system eliminates all these drawbacks. The injection offuel into an SI engine can be done by employing any of the following methodswhich are shown in Fig.8.14.
(a) direct injection of fuel into the cylinder
(b) injection of fuel close to the inlet valve
(c) injection of fuel into the inlet manifold
(a) Direct injection into the cylinder (b) Injection upstream of inlet valve
(c) Injection into the inlet manifold
Fig. 8.14 Location of injection nozzle
There are two types of gasoline injection systems, viz.,
(i) Continuous Injection : Fuel is continuously injected. It is adopted whenmanifold injection is contemplated.
(ii) Timed Injection : Fuel is injected only during induction stroke over alimited period. Injection timing is not a critical factor in SI engines.

Mechanical Injection Systems 259
Major advantages of fuel-injection in an SI engine are:
(i) Increased volumetric efficiency
(ii) Better thermal efficiency
(iii) Lower exhaust emissions
(iv) High quality fuel distribution
The use of petrol injection is limited by its high initial cost, complex de-sign and increased maintenance requirements. It is believed that the petrolinjection has a promising future compared to carburetion and may replacecarburetor in the near future.
Worked out Examples
8.1 A six cylinder, four-stroke diesel engine develops 125 kW at 3000 rpm.Its brake specific fuel consumption is 200 gm/kW h. Calculate thequantity of fuel to be injected per cycle per cylinder. Specific gravity ofthe fuel may be taken as 0.85.
Solution
Fuel consumed/hour = bsfc× Power output
= 200× 10−3 × 125 = 25 kg
Fuel consumption/cylinder =25
6= 4.17 kg/h
Fuel consumption/cycle =Fuel consumption/minute
n
where n = N/2 for four-stroke cycle engines
=4.17/60
3000/2= 4.63× 10⁻⁵ kg
= 0.0463 gm
Volume of fuel injected =0.0463
0.85
= 0.0545 cc/cycleAns⇐=
8.2 Calculate the diameter of the fuel orifice of a four-stroke engine whichdevelops 25 kW per cylinder at 2500 rpm. The specific fuel consumptionis 0.3 kg/kW h fuel with 30◦API. The fuel is injected at a pressure of 150bar over a crank travel of 25◦. The pressure in the combustion chamberis 40 bar. Coefficient of velocity is 0.875 and specific gravity is given by
S.G. =141.5
131.5 + ◦API

260 IC Engines
Solution
Duration of injection =25
360× 2500/60= 1.667× 10⁻³ s
S.G. =141.5
131.5 + 30◦= 0.8762
Velocity of injection,Vinj = Cd
2(pinj − pcyl)
ρf
= 0.875×!
2× (150− 40)× 105
876.2
= 138.65 m/s
Vol. of fuel injected/cycle =(bsfc/60)× output
(rpm/2)× ρfuel
=(0.3/60)× 25
(2500/2)× 876.2
= 0.114× 10⁻⁶ m3/cycle
Nozzle orifice area,Af =Volume of fuel injected/cycle
Inj. velocity× Inj. time
=0.114× 10⁻⁶
138.65× 1.667× 10−3
= 0.4932× 10⁻⁶ m2
Area of the orifice =π
4× d2 = 0.4932× 10⁻⁶
d =
!4× 0.4932× 10−6
π
= 0.792× 10⁻³ m = 0.792 mmAns⇐=
8.3 A four-cylinder, four-stroke diesel engine develops a power of 180 kWat 1500 rpm. The bsfc is 0.2 kg/kW h. At the beginning of injec-tion pressure is 30 bar and the maximum cylinder pressure is 50 bar.The injection is expected to be at 200 bar and maximum pressureat the injector is set to be about 500 bar. Assuming the following:Cd for injector = 0.7S.G. of fuel = 0.875Atmospheric pressure = 1 barEffective pressure difference = Average pressure difference
over the injection period

Mechanical Injection Systems 261
Determine the total orifice area required per injector if the injectiontakes place over 15◦ crank angles.
Solution
Power output/cylinder =180
4= 45 kW
Fuel consumption/cylinder = 45× bsfc
= 45× 0.2 = 9 kg/h
= 0.15 kg/min
Fuel injected/cycle =0.15
(rpm/2)=
0.15
(1500/2)
= 2× 10⁻⁴ kg
Time for injection =θ
360× rpm/60
=15× 60
360× 1500
= 1.667× 10⁻³ s
Pressure difference at beginning = 200− 30 = 170 bar
Pressure difference at end = 500− 50 = 450 bar
Average pressure difference =450 + 170
2= 310 bar
Velocity of injection,Vinj = Cd
2(pinj − pcyl)
ρf
= 0.7×!
2× 310× 105
875
= 186.33 m/s
Volume of fuel injected/cycle =2× 10⁻⁴
875
= 0.2286× 10⁻⁶ m3/cycle
Af =0.2286× 10⁻⁶
186.33× 1.667× 10−3
= 0.736× 10⁻⁶ m2 Ans⇐=

262 IC Engines
8.4 A closed type injector has a nozzle orifice diameter of 0.949 mm and themaximum cross sectional area of the passage between the needle coneand the seat is 1.75 mm2. The discharge coefficient for the orifice is 0.85and for the passage is 0.80. The injection pressure is 175 bar and theaverage pressure of charge during injection is 25 bar, when the needlecone is fully lifted up. Calculate the volume rate of flow per second offuel through the injector and the velocity of jet at that instant. Densityof fuel is 850 kg/m3.
Solution
pinj − p =V 2f × ρf
2× 1051
(CdA)2 bar
Now we have two equations
175− p =V 2f × 850
2× 105× 1
(0.8× 1.75× 10−6)2 bar
= 2.1684× 10⁹ × V 2f (1)
p− 25 =V 2f × 850
2× 105× 1
(0.85× 0.7854× 0.9492 × 10−6)2
= 12.6261× 10⁹ × V 2f bar (2)
Adding (1) and (2), we get
150 = V 2f × (2.1684 + 12.6261)× 109
= 14.7945× 10⁹ × V 2f
Vf =
!150
14.7945× 109= 1.007× 10⁻⁴ m3/s
= 100.7 cc/sAns⇐=
Now, from Eq.1,
p = 175− 2.1684× 109 × (1.007× 10−4)2
= 153.01 bar
Velocity of fuel through orifice
=
!2× (153.01− 25)
850× 105
= 173.55 m/sAns⇐=
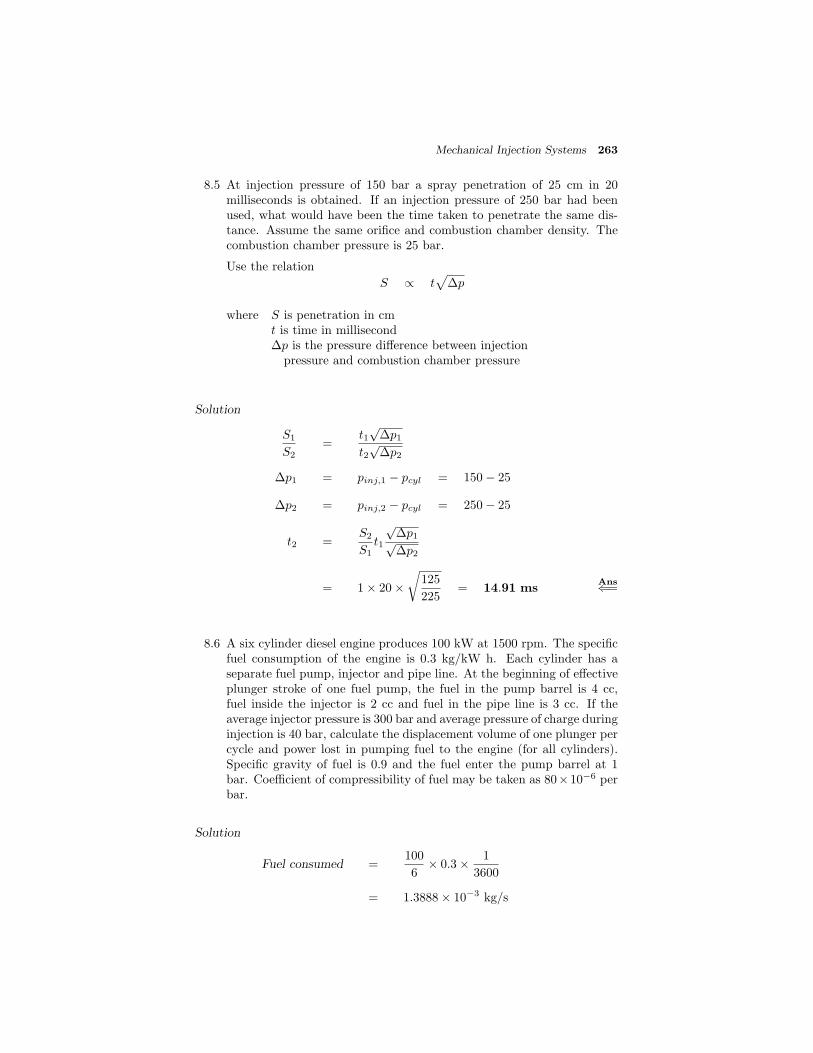
Mechanical Injection Systems 263
8.5 At injection pressure of 150 bar a spray penetration of 25 cm in 20milliseconds is obtained. If an injection pressure of 250 bar had beenused, what would have been the time taken to penetrate the same dis-tance. Assume the same orifice and combustion chamber density. Thecombustion chamber pressure is 25 bar.
Use the relation
S ∝ t
Δp
where S is penetration in cmt is time in millisecondΔp is the pressure difference between injection
pressure and combustion chamber pressure
Solution
S1
S2=
t1√
Δp1t2√
Δp2
Δp1 = pinj,1 − pcyl = 150− 25
Δp2 = pinj,2 − pcyl = 250− 25
t2 =S2
S1t1
√Δp1√Δp2
= 1× 20×!
125
225= 14.91 ms
Ans⇐=
8.6 A six cylinder diesel engine produces 100 kW at 1500 rpm. The specificfuel consumption of the engine is 0.3 kg/kW h. Each cylinder has aseparate fuel pump, injector and pipe line. At the beginning of effectiveplunger stroke of one fuel pump, the fuel in the pump barrel is 4 cc,fuel inside the injector is 2 cc and fuel in the pipe line is 3 cc. If theaverage injector pressure is 300 bar and average pressure of charge duringinjection is 40 bar, calculate the displacement volume of one plunger percycle and power lost in pumping fuel to the engine (for all cylinders).Specific gravity of fuel is 0.9 and the fuel enter the pump barrel at 1bar. Coefficient of compressibility of fuel may be taken as 80×10−6 perbar.
Solution
Fuel consumed =100
6× 0.3× 1
3600
= 1.3888× 10⁻³ kg/s
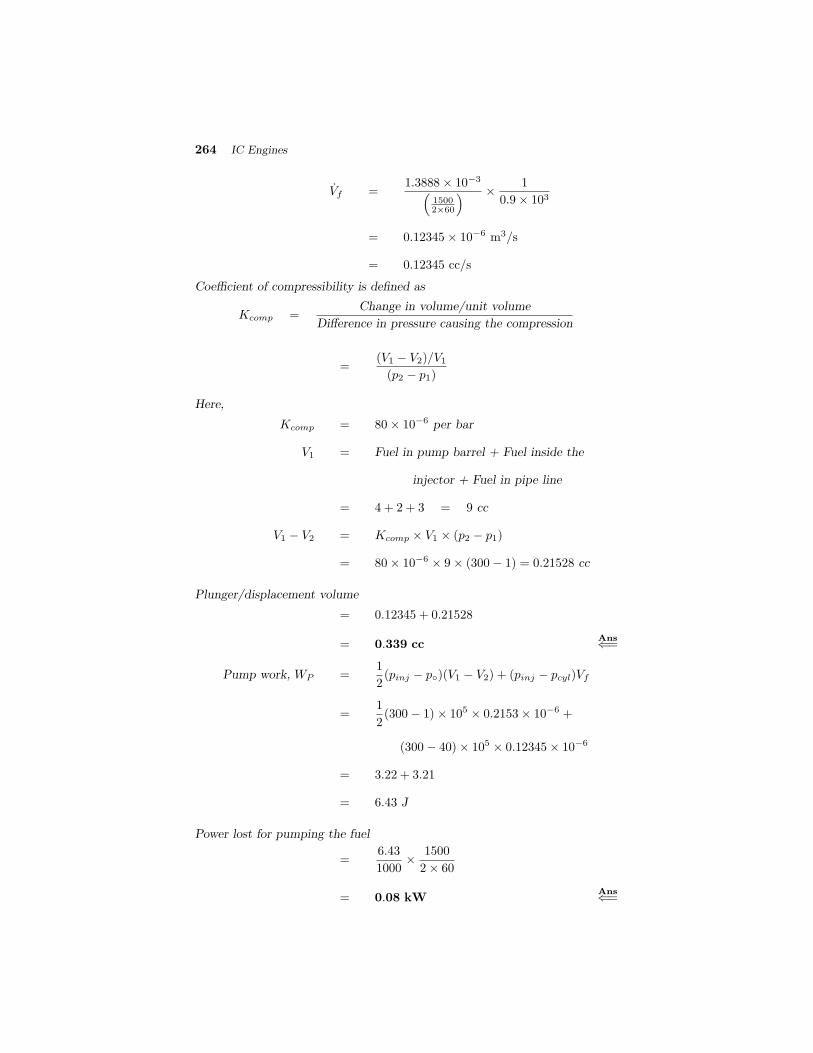
264 IC Engines
Vf =1.3888× 10⁻³
15002×60
× 1
0.9× 103
= 0.12345× 10⁻⁶ m3/s
= 0.12345 cc/s
Coefficient of compressibility is defined as
Kcomp =Change in volume/unit volume
Difference in pressure causing the compression
=(V1 − V2)/V1
(p2 − p1)
Here,
Kcomp = 80× 10−6 per bar
V1 = Fuel in pump barrel + Fuel inside the
injector + Fuel in pipe line
= 4 + 2 + 3 = 9 cc
V1 − V2 = Kcomp × V1 × (p2 − p1)
= 80× 10−6 × 9× (300− 1) = 0.21528 cc
Plunger/displacement volume
= 0.12345 + 0.21528
= 0.339 ccAns⇐=
Pump work, WP =1
2(pinj − p◦)(V1 − V2) + (pinj − pcyl)Vf
=1
2(300− 1)× 105 × 0.2153× 10−6 +
(300− 40)× 105 × 0.12345× 10−6
= 3.22 + 3.21
= 6.43 J
Power lost for pumping the fuel
=6.43
1000× 1500
2× 60
= 0.08 kWAns⇐=

Mechanical Injection Systems 265
8.7 Before commencement of the effective stroke, fuel in the pump barrel ofa diesel fuel injection system is 6 cc. The diameter and the length ofthe fuel line from pump to injector is 2.5 mm and 600 mm respectively.The fuel in the injection valve is 2 cc.
(i) To deliver 0.10 cc of fuel at a pressure of 150 bar, how much dis-placement the plunger undergoes. Assume a
pump inlet pressure of 1 bar.
(ii) What is the effective stroke of the plunger if its diameter is 7 mm.
Assume coefficient of compressibility of oil as 75 × 10−6 per bar at at-mospheric pressure.
Solution
K =(V1 − V2)
V1(p2 − p1)
Change in volume due to compression,
V1 = Total initial fuel volume
= Volume of fuel in barrel +
Volume of fuel in delivery line +
Volume of fuel in injection valve
= 6 +π
4× (0.25)
2 × 600
10+ 2 = 10.95 cc
V1 − V2 = K × V1 × (p2 − p1)
= 75× 10−6 × 10.95× (150− 1) = 0.122 cc
Total displacement of plunger
= (V1 − V2) + 0.10 = 0.122 + 0.10
= 0.222 ccAns⇐=
π
4d2 × l = 0.222
Effective stroke of plunger
= 0.222× 4
π× 1
(0.7)2
= 0.577 cm
= 5.77 mmAns⇐=

266 IC Engines
Review Questions
8.1 What are the functional requirements of an injection system?
8.2 How are the injection system classified? Describe them briefly. Why theair injection system is not used nowadays?
8.3 How is the solid injection further classified? With a neat sketch explainthe various components of a fuel feed system of a CI engine.
8.4 Explain
(i) individual pump and nozzle system
(ii) unit injector system
(iii) common rail system
(iv) distributor system.
8.5 Draw a schematic diagram of fuel feed pump and explain its workingprinciple.
8.6 What are the main functions of an injection pump? What are two typesof injection pump that are commonly used?
8.7 With a neat sketch explain the jerk pump type injection system.
8.8 With a neat sketch explain the working principle of a distributor typefuel-injection pump.
8.9 What is the purpose of using a governor in CI engines? What are thetwo major type of governors?
8.10 Explain with a neat sketch the working principle of a mechanical gover-nor.
8.11 With a neat diagram bring out clearly the working principle of a pneu-matic governor.
8.12 What is the purpose of a fuel injector? Mention the various parts of ainjector assembly.
8.13 What are the functions of a nozzle? With sketches explain the varioustypes of nozzles.
8.14 Give a brief account of the injection in SI engine.
8.15 With sketches explain the possible locations of the injection nozzles inSI engines.
8.16 Draw a sketch of pintaux nozzle and discuss it merits and demerits.
8.17 Derive an expression for the velocity of injection.
8.18 Develop an equation for the amount of fuel injected per cycle in termsof brake horse power and speed of a four-stroke CI engine.
Mechanical Injection Systems 267
Exercise
8.1 A four-cylinder, four-stroke diesel engine develops 100 kW at3500 rpm. Its brake specific fuel consumption is 180 gm perkW h. Calculate the quantity of fuel to be injected per cycleper cylinder. Specific gravity of the fuel may be taken as 0.88.
Ans: Volume of the fuel injected = 0.0487 cc
8.2 Calculate the diameter of the fuel orifice of a four-stroke engine whichdevelops 20 kW per cylinder at 2000 rpm. The specific fuel consumptionis 0.25 kg/kW h of fuel with 30◦API. The fuel is injected at a pressureof 180 bar over a crank travel of 25◦. The pressure in the combustionchamber is 38 bar. Coefficient of velocity is 0.85 and specific gravity isgiven by
S.G. =141.5
131.5 + ◦API
Ans: Diameter of fuel orifice = 0.754 mm
8.3 A six-cylinder, four-stroke diesel engine develops a power of 200 kWat 2000 rpm. The bsfc is 0.2 kg/kW h. At the beginning of in-jection, pressure is 35 bar and the maximum cylinder pressure is 55bar. The injection is expected to be at 180 bar and maximum pres-sure at the injector is set to be about 520 bar. Assuming the following:Cd for injector = 0.75S.G. of fuel = 0.85Atmospheric pressure = 1 barEffective pressure = Average pressure difference
difference over the injection period
(i) Determine the total orifice area required per injector if the injectiontakes place over 16◦ crank angles.
Ans: Orifice area = 0.4876× 10⁻⁶ m2
8.4 A closed type injector has a nozzle orifice diameter of 1.0 mm and themaximum cross sectional area of the passage between the needle coneand the seat is 2.0 mm2. The discharge coefficient for the orifice is 0.85and for the passage is 0.80. The injection pressure is 200 bar and theaverage pressure of charge during injection is 25 bar, when the needlecone is fully lifted up. Calculate the volume rate of flow per second offuel through the injector and the velocity of jet at that instant. Specificgravity of fuel is 0.85. Ans: (i) Volume rate of flow of fuel = 125 cc/s
(ii) Velocity of jet = 187.27 m/s
8.5 At injection pressure of 180 bar a spray penetration of 30 cm in 22milliseconds is obtained. If an injection pressure of 240 bar had beenused, what would have been the time taken to penetrate the same dis-tance. Assume the same orifice and combustion chamber density. Thecombustion chamber pressure is 30 bar. Use the relation:
S ∝ t
Δp

268 IC Engines
where S is penetration in cmt is time in millisecondΔp is the pressure difference between injection pres-
sure and combustion chamber pressure
Ans: (i) Time taken for penetration = 18.593 milliseconds
8.6 A four-cylinder diesel engine produces 100 kW at 1500 rpm. The specificfuel consumption of the engine is 0.28 kg/kW h. Each cylinder has aseparate fuel pump, injector and pipe line. At the beginning of effectiveplunger stroke of one fuel pump, the fuel in the pump barrel is 4 cc,fuel inside the injector is 2 cc and fuel in the pipe line is 4 cc. Ifthe average injector pressure is 200 bar and average pressure of chargeduring injection is 30 bar, calculate the displacement volume of oneplunger per cycle and power lost in pumping fuel to the engine (for allcylinders). Specific gravity of fuel is 0.85 and the fuel enter the pumpbarrel at 1 bar. Coefficient of compressibility of fuel is 80 × 10−6 perbar. Ans: (i) Disp. volume of each plunger/cycle = 0.3422 cc
(ii) Power lost in pumping = 0.058 kW
8.7 Before commencement of the effective stroke the fuel in the pump barrelof a diesel fuel injection pump is 7 cc. The diameter of the fuel line frompump to injector is 3 mm and is 600 mm long. The fuel in the injectionvalve is 3 cc.
(i) To deliver 0.10 cc of fuel at a pressure of 150 bar, how much dis-placement the plunger undergoes? Assume a pump inlet pressureof 1 bar.
(ii) What is the effective stroke of the plunger if its diameter is 6 mm?
(iii) Assume coefficient of compressibility of oil as 78 × 10−6 at atmo-spheric pressure.
Ans: (i) Plunger displacement = 0.2655 cc(ii) Effective stroke of plunger = 9.39 mm
Multiple Choice Questions (choose the most appropriate answer)
1. Fuel injector is used for
(a) gas engines
(b) CI engines
(c) SI engines
(d) none of the above
2. Advantage of air injection system is
(a) cheaper fuels can be used
(b) mep is high
Mechanical Injection Systems 269
(c) fine atomization and distribution of the fuel
(d) all of the above
3. Commonly used injection system in automobiles is
(a) air injection
(b) solid injection
(c) combination of (a) and (b)
(d) none of the above
4. Fuel injection pressure in solid injection system is around
(a) <10 bar
(b) 10–20 bar
(c) 30–50 bar
(d) 200–250 bar
5. Fuel filters do not use generally
(a) oil
(b) paper
(c) cloth
(d) felt
6. Fuel is injected in a four-stroke CI engine
(a) at the end of suction stroke
(b) at the end of expansion stroke
(c) at the end of compression stroke
(d) at the end of exhaust stroke
7. Injection system in which the pump and the injector nozzle is combinedin one housing is known as
(a) common rail system
(b) distributor system
(c) unit injector system
(d) individual pump and nozzle system
8. Main advantage of pintaux nozzle is
(a) better cold starting performance
(b) ability to distribute the fuel
270 IC Engines
(c) good penetration
(d) good atomization
9. The most accurate gasoline injection system is
(a) direct injection
(b) port injection
(c) throttle body injection
(d) manifold injection
10. Advantage of fuel injection in SI engine is
(a) low initial cost
(b) low maintenance requirements
(c) increased volumetric efficiency
(d) none of the above
Ans : 1. – (b) 2. – (d) 3. – (b) 4. – (d) 5. – (b)6. – (c) 7. – (c) 8. – (a) 9. – (b) 10. – (c)

9ELECTRONIC
INJECTION SYSTEMS
9.1 INTRODUCTION
The year 1903 is a memorable year in the history of IC engine development.It is in that year the Wright Brothers made the maiden SI engine poweredflight which had a gear pump that injected fuel into the intake ports. Soonafter, in 1906 the Brazilian Santos Dumont made his first flight in Europe withplunger pump. The famous Grade Enddecker who in 1909 flew 13 kilometers,also did it with injection in gasoline engine: a two-stroke engine in which eachcylinder’s crankcase pressure was utilized as injection pressure for the fuel.Therefore, the injection system for gasoline engines is not a new proposition.
In case of automotive engines a continuous metered quantity of the gasoline-air mixture must be ensured to make the engine run smoothly. In a gasolineinjection system, the fuel is injected into the intake manifold or near the intakeport through an injector. The gasoline is received by the injector from thepump and is sprayed into the air stream in a finely atomized form. Comparedto carburetion the mixing of gasoline with the air stream is better in this case.
It may be observed that in both the carburettor and the gasoline injectionsystem, the position of the throttle valve controls the flow of the mixture intothe intake manifold. Nowadays, gasoline injection is employed in a numberof automobiles. Well established manufacturers like Ford, Daewoo, Fiat, Mit-subishi, Honda etc. have come out with gasoline injection system in theirmodels.
9.2 WHY GASOLINE INJECTION?
In a carburettor engine, uniformity of mixture strength is difficult to realize ineach cylinder of a multicylinder engine. Figure 9.1 shows a typical pattern ofmixture distribution in an intake manifold of a multicylinder engine. As maybe noticed that the intake valve is open in cylinder 2. As can also be observedthe gasoline moves to the end of the manifold and accumulates there. Thisenriches the mixture going to the end cylinders. However, the central cylin-ders, which are very close to the carburettor, get the leanest mixture. Thusthe various cylinders receive the air-gasoline mixture in varying quantitiesand richness. This problem is called the maldistribution and can be solved bythe port injection system by having the same amount of gasoline injected ateach intake manifold. Therefore, there is an urgent need to develop injectionsystems for gasoline engines. By adopting gasoline injection each cylinder canget the same richness of the air-gasoline mixture and the maldistribution canbe avoided to a great extent.

272 IC Engines
Air gasoline mixtureLarge gasoline dropletsAccumulation of
liquid gasoline
321
Fig. 9.1 Typical pattern of mixture distribution in a multi-cylinder engine
As already mentioned, some of the recent automotive engines are equippedwith gasoline injection system, instead of a carburetion for one or more of thefollowing reasons:
(i) To have uniform distribution of fuel in a multicylinder engine.
(ii) To improve breathing capacity i.e. volumetric efficiency.
(iii) To reduce or eliminate detonation.
(iv) To prevent fuel loss during scavenging in case of two-stroke engines.
9.2.1 Types of Injection Systems
The fuel injection system can be classified as:
(i) Gasoline direct injection into the cylinder (GDI)
(ii) Port injection
(a) Timed, and (b) Continuous
(iii) Manifold injection
The above fuel injection systems can be grouped under two heads, viz.,single-point and multi-point injection. In the single point injection system, oneor two injectors are mounted inside the throttle body assembly. Fuel sprays aredirected at one point or at the center of the intake manifold. Another name ofthe single point injection is throttle body injection. Multipoint injection hasone injector for each engine cylinder. In this system, fuel is injected in morethan one location. This is more common and is often called port injectionsystem.
As already mentioned the gasoline fuel injection system used in a spark-ignition engine can be either of continuous injection or timed injection.

Electronic Injection Systems 273
(i) Continuous injection systems: This system usually has a rotary pump.The pump maintains a fuel line gauge pressure of about 0.75 to 1.5 bar.The system injects the fuel through a nozzle located in the manifoldimmediately downstream of the throttle plate. In a supercharged engine,fuel is injected at the entrance of the supercharger. The timing andduration of the fuel injection is determined by Electronic Control Unit(ECU) depending upon the load and speed.
(ii) Timed fuel injection system: This system has a fuel supply pump whichsends fuel at a low pressure of about 2 bar when the engine is running atmaximum speed. A fuel metering or injection pump and a nozzle are theother parts of the system. The nozzle injects the fuel in the manifold orthe cylinder head port at about 6.5 bar or into the combustion chamberat pressures that range from 16 to 35 bar. Timed injection system injectsfuel usually during the early part of the suction stroke. During maximumpower operation injection begins after the closure of the exhaust valveand ends usually after BDC. Direct in-cylinder injection is superior andalways desirable and better compared to manifold injection. In thiscase both low and high volatile fuels can be used and higher volumetricefficiencies can be achieved. However, it was noticed that direct injectioncaused oil dilution in the frequent warm up phases if the car is used fordaily transportation.
Typical fuel injection methods used in four stroke and two stroke gasolineengines are shown in Fig.9.2(a) and Fig.9.2(b) respectively .
9.2.2 Components of Injection System
The objectives of the fuel injection system are to meter, atomize and uniformlydistribute the fuel throughout the air mass in the cylinder. At the same time itmust maintain the required air-fuel ratio as per the load and speed requirementof the engine. To achieve all the above tasks, a number of components arerequired in the fuel injection system, the functions of which are mentionedbelow.
(i) Pumping element – moves the fuel from the fuel tank to the injector.This includes necessary piping, filter etc.
(ii) Metering element – measures and supplies the fuel at the rate demandedby load and speed conditions of the engine.
(iii) Mixing element – atomizes the fuel and mixes it with air to form ahomogenous mixture.
(iv) Metering control – adjusts the rate of metering in accordance with loadand speed of the engine.
(v) Mixture control – adjusts fuel-air ratio as demanded by the load andspeed.
(vi) Distributing element – divides the metered fuel equally among the cylin-ders.

274 IC Engines
Low pressure
direct injection
Low pressure intake
manifold injection
Low pressure
semi-direct injection
(a) Gasoline injection in four-stroke engines
High pressure
direct injection
Low pressure
semi-direct injection
Low pressure intake
manifold injection
Low pressure
direct injection
Low pressure
transfer port injection
(b) Fuel injection in two-stroke engines
Fig. 9.2 Different methods of fuel injection

Electronic Injection Systems 275
(vii) Timing control – fixes the start and stop of the fuel-air mixing process.
(viii) Ambient control – compensates for changes in temperature and pressureof either air or fuel that may affect the various elements of the system.
9.3 ELECTRONIC FUEL INJECTION SYSTEM
Modern gasoline injection systems use engine sensors, a computer, and solenoidoperated fuel injectors to meter and inject the right amount of fuel into theengine cylinders. These systems called electronic fuel injection (EFI) use elec-trical and electronic devices to monitor and control engine-operation.
An electronic control unit (ECU) or the computer receives electrical signalsin the form of current or voltage from various sensors. It then uses the storeddata to operate the injectors, ignition system and other engine related devices.As a result, less unburned fuel leaves the engine as emissions, and the vehiclegives better mileage. Typical sensors for an electronic fuel injection systemincludes the following:
(i) Exhaust gas or oxygen sensor – senses the amount of oxygen in the en-gine exhaust and calculates air-fuel ratio. Sensor output voltage changesin proportion to air-fuel ratio.
(ii) Engine temperature sensor – senses the temperature of the engine coolant,and from this data the computer adjusts the mixture strength to richside for cold starting.
(iii) Air flow sensor – monitors mass or volume of air flowing into the intakemanifold for adjusting the quantity of fuel.
(iv) Air inlet temperature sensor – checks the temperature of the ambientair entering the engine for fine tuning the mixture strength.
(v) Throttle position sensor – senses the movement of the throttle plate sothat the mixture flow can be adjusted for engine speed and acceleration.
(vi) Manifold pressure sensor – monitors vacuum in the engine intake mani-fold so that the mixture strength can be adjusted with changes in engineload.
(vii) Camshaft position sensor – senses rotation of engine camshaft/crankshaftfor speed and timing of injection.
(viii) Knock sensor – microphone type sensor that detects ping or preignitionnoise so that the ignition timing can be retarded.
The fuel injector in an EFI is nothing but a fuel valve. When it is notenergized, spring pressure makes the injector to remain closed and no fuel willenter the engine. When the computer sends the signal through the injectorcoil, the magnetic field attracts the injector armature. Fuel then spurts intothe intake manifold.

276 IC Engines
The injector pulse width is an indication of the period for which eachinjector is energized and kept open. The computer decides and controls theinjector pulse width based on the signals received from the various sensors.
Under full load, the computer will sense a wide open throttle, high intakemanifold pressure, and high inlet air flow. The ECU will then increase theinjector pulse width to enrich the mixture which will enable the engine toproduce higher power.
Under low load and idling conditions, the ECU will shorten the pulse widthby which the injectors are kept in the closed position over a longer period oftime. Because of this, air-fuel mixture will become leaner and will result inbetter fuel economy.
Electronic fuel injection system has a cold start injector too. This is anextra injector that sprays fuel into the center of the engine intake manifold,when the engine is cold. It serves the same purpose as the carburettor choke.The cold start injector ensures easy engine startup in very cold weather.
9.3.1 Merits of EFI System
The spark ignition engine with an EFI system compared with a carburettorunit have the following favourable points:
(i) Improvement in the volumetric efficiency due to comparatively less re-sistance in the intake manifolds which will cause less pressure losses. Iteliminates majority of carburettor pressure losses and almost eliminatesthe requirement of manifold heating.
(ii) Manifold wetting is eliminated due to the fuel being injected into orclose to the cylinder and need not flow through the manifold.
(iii) Atomization of fuel is independent of cranking speed and therefore start-ing will be easier.
(iv) Better atomization and vapourization will make the engine less knockprone.
(v) Formation of ice on the throttle plate is eliminated.
(vi) Distribution of fuel being independent of vapourization, less volatile fuelcan be used.
(vii) Variation of air-fuel ratio is almost negligible even when the vehicle takesdifferent positions like turning, moving on gradients, uneven roads etc.
(viii) Position of the injection unit is not so critical and thereby the height ofthe engine (and hood) can be less.
9.3.2 Demerits of EFI System
Some of the disadvantages of EFI system are:
(i) high maintenance cost,
(ii) difficulty in servicing, and
(iii) possibility of malfunction of some sensors.
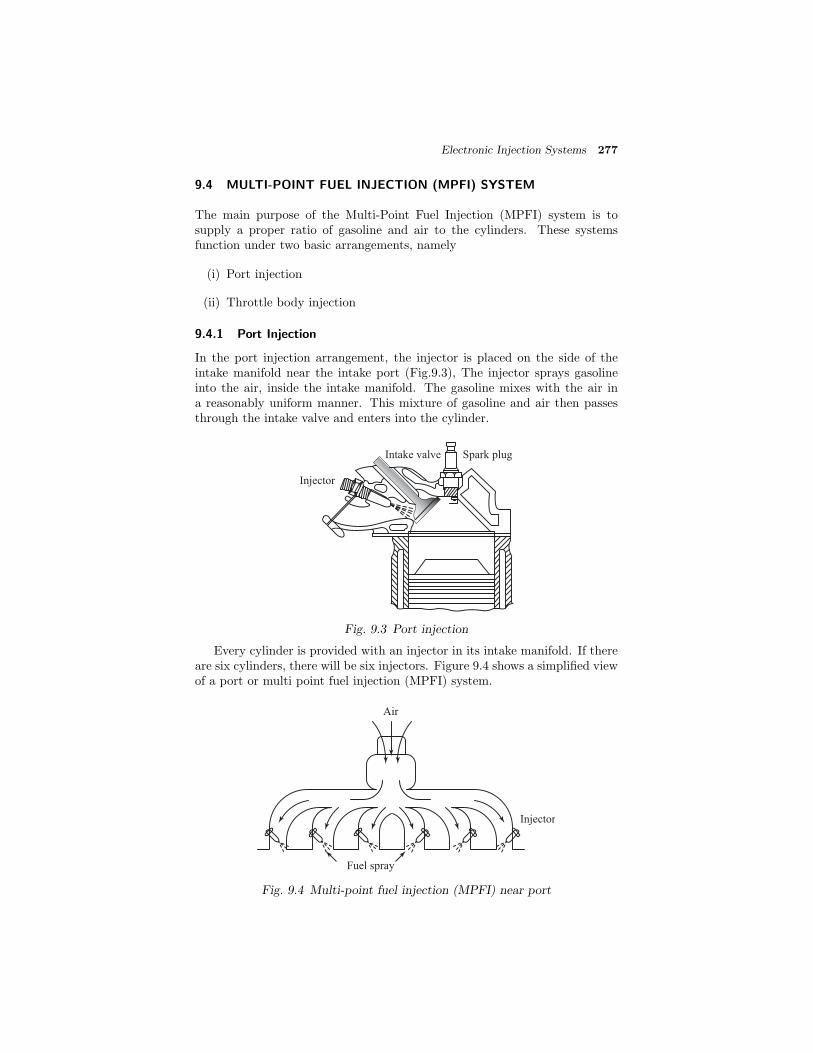
Electronic Injection Systems 277
9.4 MULTI-POINT FUEL INJECTION (MPFI) SYSTEM
The main purpose of the Multi-Point Fuel Injection (MPFI) system is tosupply a proper ratio of gasoline and air to the cylinders. These systemsfunction under two basic arrangements, namely
(i) Port injection
(ii) Throttle body injection
9.4.1 Port Injection
In the port injection arrangement, the injector is placed on the side of theintake manifold near the intake port (Fig.9.3), The injector sprays gasolineinto the air, inside the intake manifold. The gasoline mixes with the air ina reasonably uniform manner. This mixture of gasoline and air then passesthrough the intake valve and enters into the cylinder.
Injector
Spark plugIntake valve
Fig. 9.3 Port injection
Every cylinder is provided with an injector in its intake manifold. If thereare six cylinders, there will be six injectors. Figure 9.4 shows a simplified viewof a port or multi point fuel injection (MPFI) system.
Fuel spray
Injector
Air
Fig. 9.4 Multi-point fuel injection (MPFI) near port

278 IC Engines
9.4.2 Throttle Body Injection System
Figure 9.5 illustrates the simplified sketch of throttle body injection system(Single point injection). This throttle body is similar to the carburettor throt-tle body, with the throttle valve controlling the amount of air entering theintake manifold.
Fuel spray
Injector
Air
Throttle body Intake manifold
Air
Fig. 9.5 Throttle body injection (single point)
An injector is placed slightly above the throat of the throttle body. Theinjector sprays gasoline into the air in the intake manifold where the gasolinemixes with air. This mixture then passes through the throttle valve and entersinto the intake manifold.
As already mentioned, fuel-injection systems can be either timed or con-tinuous. In the timed injection system, gasoline is sprayed from the injectorsin pulses. In the continuous injection system, gasoline is sprayed continuouslyfrom the injectors. The port injection system and the throttle-body injectionsystem may be either pulsed systems or continuous systems. In both systems,the amount of gasoline injected depends upon the engine speed and powerdemands. In some literature MPFI systems are classified into two types: D-MPFI and L-MPFI.
9.4.3 D-MPFI System
The D-MPFI system is the manifold fuel injection system. In this type, thevacuum in the intake manifold is first sensed. In addition, it senses the vol-ume of air by its density. Figure 9.6 gives the block diagram regarding thefunctioning of the D-MPFI system. As air enters into the intake manifold,the manifold pressure sensor detects the intake manifold vacuum and sendsthe information to the ECU. The speed sensor also sends information aboutthe rpm of the engine to the ECU. The ECU in turn sends commands to theinjector to regulate the amount of gasoline supply for injection. When theinjector sprays fuel in the intake manifold the gasoline mixes with the air andthe mixture enters the cylinder.

Electronic Injection Systems 279
9.4.4 L-MPFI System
The L-MPFI system is a port fuel-injection system. In this type the fuelmetering is regulated by the engine speed and the amount of air that actuallyenters the engine. This is called air-mass metering or air-flow metering.The block diagram of an L-MPFI system is shown in Fig.9.7. As air entersinto the intake manifold, the air flow sensor measures the amount of air andsends information to the ECU. Similarly, the speed sensor sends informationabout the speed of the engine to the ECU. The ECU processes the informationreceived and sends appropriate commands to the injector, in order to regulatethe amount of gasoline supply for injection. When injection takes place, thegasoline mixes with the air and the mixture enters the cylinder.
9.5 FUNCTIONAL DIVISIONS OF MPFI SYSTEM
The MPFI system can be functionally divided into
(i) electronic control system,
(ii) fuel system, and
(iii) air induction system.
These functional divisions are described in the following sections.
9.5.1 MPFI-Electronic Control System
The MPFI-electronic control system is shown in the form of block diagramin Fig.9.8. The sensors that monitor intake air temperature, the oxygen, thewater temperature, the starter signal and the throttle position send signals tothe ECU. The air-flow sensor sends signals to the ECU regarding the intakeair volume. The ignition sensor sends information about the engine speed.
The ECU processes all these signals and sends appropriate commands tothe injectors, to control the volume of the fuel for injection. When neces-sary the cold-start injector timing switch off the ECU operates the cold startinjector which is a part of the fuel system.
9.5.2 MPFI-Fuel System
The MPFI-fuel system is shown in the form of block diagrams in Fig.9.9. Inthis system, fuel is supplied by the fuel pump. At the time of starting, thecold start injector is operated by the cold start injector time switch. Thecold start injector injects fuel into the air intake chamber, thus enriching theair-fuel mixture. The pressure regulator regulates the pressure of the fuel.The injectors receive signals from the ECU and inject the fuel into the intakemanifold.
9.5.3 MPFI-Air Induction System
The MPFI-air induction system is shown in the block diagram in Fig.9.10.The air cleaner, the air-flow meter, the throttle body and the air valve supplya proper amount of air to the air intake chamber and intake manifold. Thequantity of air supplied is just what is necessary for complete combustion.
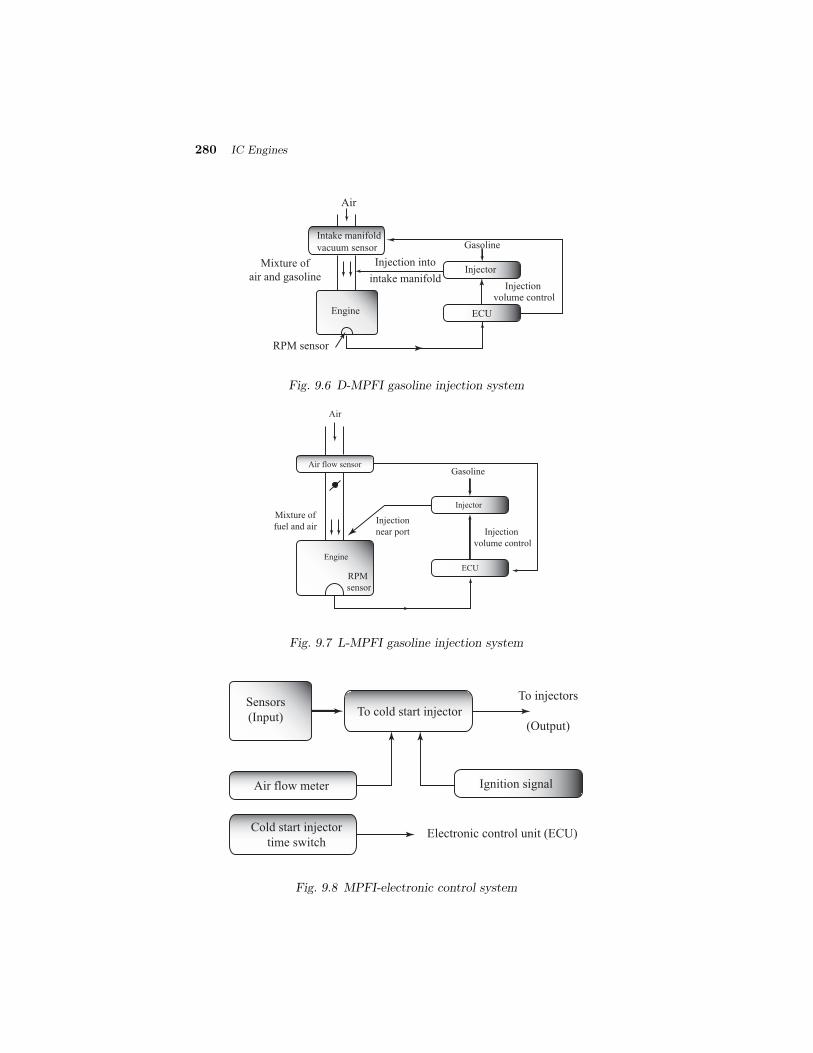
280 IC Engines
Air
Mixture of
air and gasolineInjection
volume control
Gasoline
Injection into
Engine
Intake manifold
vacuum sensor
ECU
Injector
RPM sensor
intake manifold
Fig. 9.6 D-MPFI gasoline injection system
Mixture of
fuel and airInjection
volume control
Gasoline
Injection
near port
Engine
ECU
Injector
Air
RPM
sensor
Air flow sensor
Fig. 9.7 L-MPFI gasoline injection system
Sensors
(Input)
Air flow meter Ignition signal
Cold start injector
time switchElectronic control unit (ECU)
To injectors
(Output)
To cold start injector
Fig. 9.8 MPFI-electronic control system

Electronic Injection Systems 281
Fuel
Fuel pump
Injection signal from
ECU controlling fuel
injection volume
Cold start injector
Pressure regulator
Fuel cold start
injector timing switch
To air intake
chamber
Injectors
Injection to intake manifold
Fig. 9.9 MPFI-fuel system
9.6 ELECTRONIC CONTROL SYSTEM
The electronic control system consists of mainly the Electronic Control Unit(ECU), which determines the duration of operation of the injectors. In addi-tion to this, there is a starter timing switch, which controls the operation ofthe cold start injector during engine starting. There is a circuit opening relayto control fuel pump operation. There is also a resistor, which stabilizes theinjector operation.
9.6.1 Electronic Control Unit (ECU)
The ECU in the electronic control system, receives signals from the sensorsand determines the opening time for the injector’s land which also controlsthe injection volume.
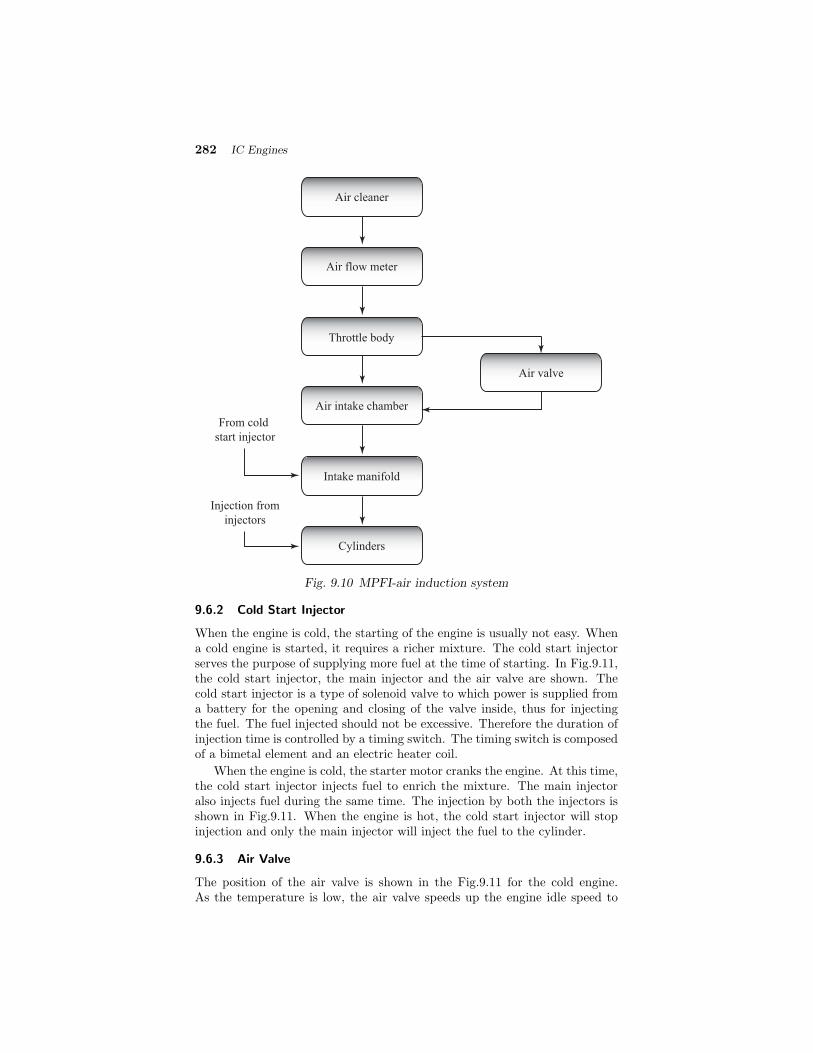
282 IC Engines
Air cleaner
Air flow meter
Throttle body
Air intake chamber
Intake manifold
Cylinders
Air valve
From cold
start injector
Injection from
injectors
Fig. 9.10 MPFI-air induction system
9.6.2 Cold Start Injector
When the engine is cold, the starting of the engine is usually not easy. Whena cold engine is started, it requires a richer mixture. The cold start injectorserves the purpose of supplying more fuel at the time of starting. In Fig.9.11,the cold start injector, the main injector and the air valve are shown. Thecold start injector is a type of solenoid valve to which power is supplied froma battery for the opening and closing of the valve inside, thus for injectingthe fuel. The fuel injected should not be excessive. Therefore the duration ofinjection time is controlled by a timing switch. The timing switch is composedof a bimetal element and an electric heater coil.
When the engine is cold, the starter motor cranks the engine. At this time,the cold start injector injects fuel to enrich the mixture. The main injectoralso injects fuel during the same time. The injection by both the injectors isshown in Fig.9.11. When the engine is hot, the cold start injector will stopinjection and only the main injector will inject the fuel to the cylinder.
9.6.3 Air Valve
The position of the air valve is shown in the Fig.9.11 for the cold engine.As the temperature is low, the air valve speeds up the engine idle speed to
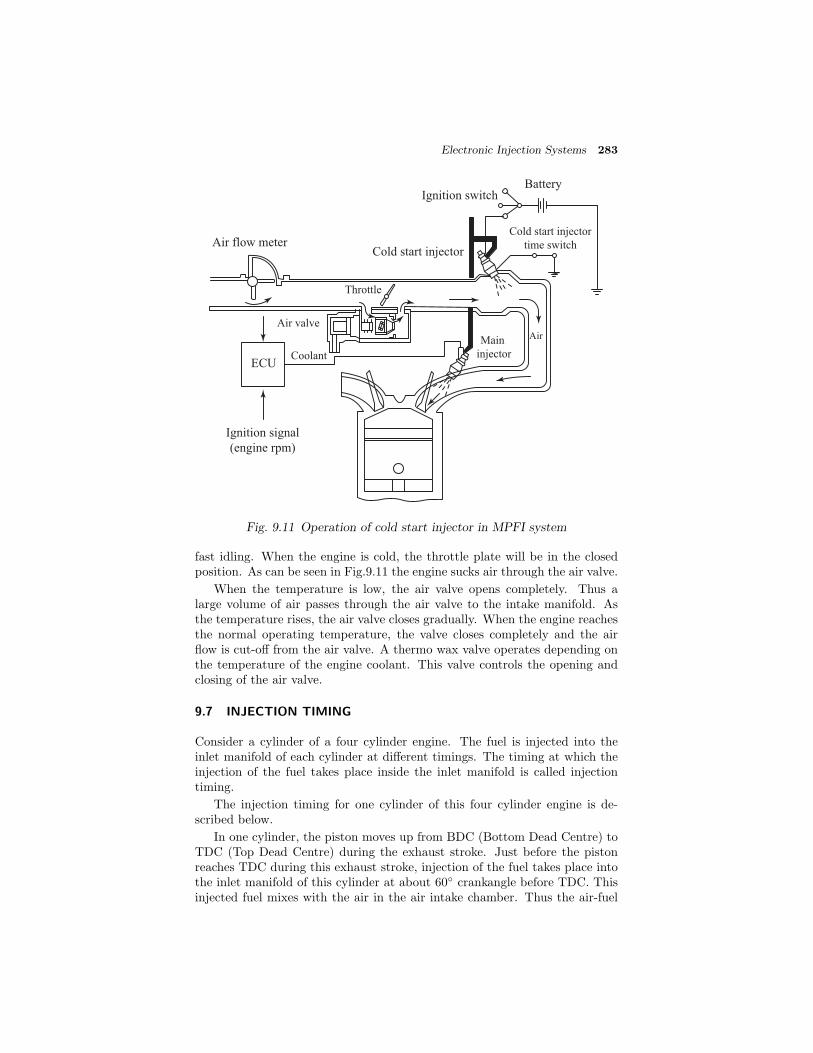
Electronic Injection Systems 283
Air flow meter
Throttle
Cold start injector
Ignition switchBattery
Cold start injector
time switch
Main
injector
Air valve
Coolant
Ignition signal
(engine rpm)
ECU
Air
Fig. 9.11 Operation of cold start injector in MPFI system
fast idling. When the engine is cold, the throttle plate will be in the closedposition. As can be seen in Fig.9.11 the engine sucks air through the air valve.
When the temperature is low, the air valve opens completely. Thus alarge volume of air passes through the air valve to the intake manifold. Asthe temperature rises, the air valve closes gradually. When the engine reachesthe normal operating temperature, the valve closes completely and the airflow is cut-off from the air valve. A thermo wax valve operates depending onthe temperature of the engine coolant. This valve controls the opening andclosing of the air valve.
9.7 INJECTION TIMING
Consider a cylinder of a four cylinder engine. The fuel is injected into theinlet manifold of each cylinder at different timings. The timing at which theinjection of the fuel takes place inside the inlet manifold is called injectiontiming.
The injection timing for one cylinder of this four cylinder engine is de-scribed below.
In one cylinder, the piston moves up from BDC (Bottom Dead Centre) toTDC (Top Dead Centre) during the exhaust stroke. Just before the pistonreaches TDC during this exhaust stroke, injection of the fuel takes place intothe inlet manifold of this cylinder at about 60◦ crankangle before TDC. Thisinjected fuel mixes with the air in the air intake chamber. Thus the air-fuel

284 IC Engines
mixture is obtained. At the beginning of the suction stroke, intake valve opensand the air-fuel mixture is sucked into the cylinder during the suction stroke.
According to the firing order, the injection of the fuel takes place insidethe inlet manifolds of the other three cylinders at various timings.
In this four cylinder engine, the ECU calculates the appropriate injectiontiming for each cylinder and the air fuel-mixture is made available at eachsuction stroke.
In order to meet the operating conditions, the injection valve is kept openfor a longer time by ECU. For example, if the vehicle is accelerating, theinjection valve will be opened for longer time, in order to supply additionalfuel to the engine.
9.8 GROUP GASOLINE INJECTION SYSTEM
In an engine having group gasoline injection system, the injectors are notactivated individually, but are activated in groups. In a four-cylinder enginealso there are two groups, each group having two injectors. In a six-cylinderengine, there are two groups, each group having 3 injectors.
Figure 9.12 shows a block diagram with sensors and the Electronic ControlUnit (ECU), for a group injection system. Sensors for detecting pressurein the manifold, engine speed in rpm, throttle position, intake manifold airtemperature and the coolant temperature send information to the ECU. Withthis information, the ECU computes the amount of gasoline that the engineneeds. The ECU then sends signals to the injectors and other parts of thesystem. The timing of the injectors is decided by the engine-speed sensor.
Pressure in manifold
Engine rpm
Throttle position
Intake manifold
air temperature
Coolant temperature
Cylinders
EGR solenoid
Fuel pump
Fuel idle valve
Group I injectors
Group II injectors
Electronic
control unit
(ECU)
Fig. 9.12 Block diagram showing the sensors and ECU for group injectionsystem
The injectors are divided into two groups. Based on the signals fromthe speed sensor, the ECU activates one group of injectors. Subsequently,
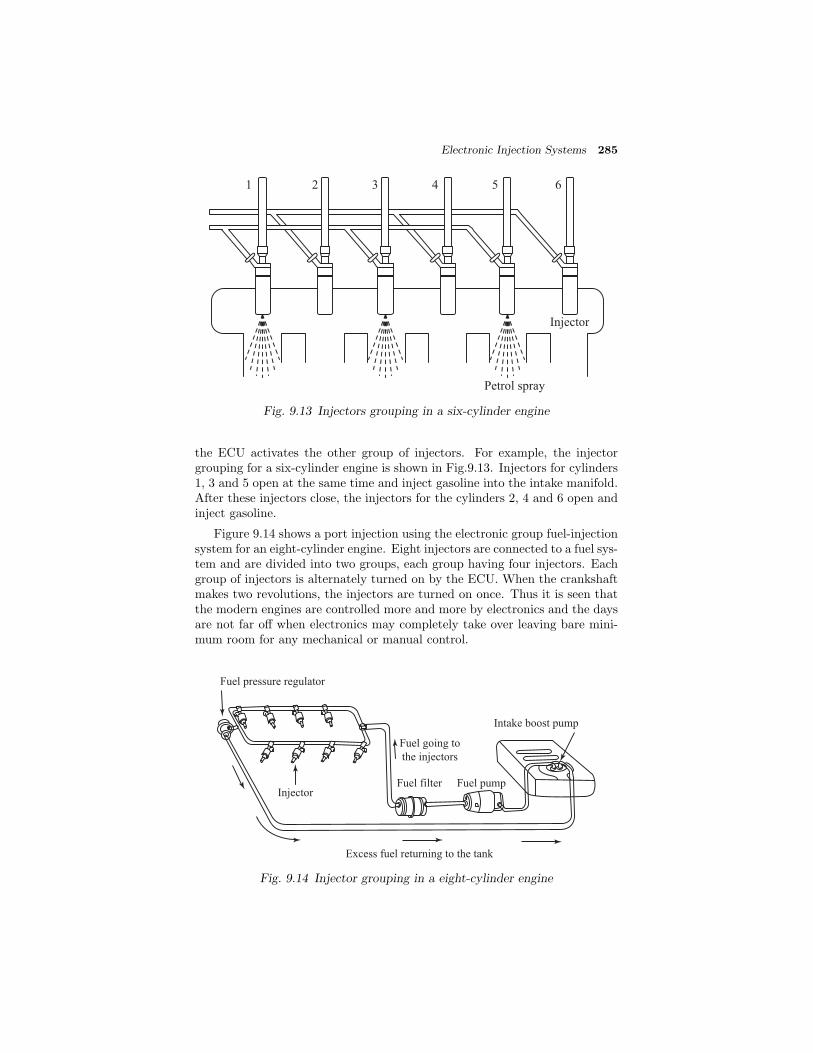
Electronic Injection Systems 285
Injector
Petrol spray
1 2 3 4 5 6
Fig. 9.13 Injectors grouping in a six-cylinder engine
the ECU activates the other group of injectors. For example, the injectorgrouping for a six-cylinder engine is shown in Fig.9.13. Injectors for cylinders1, 3 and 5 open at the same time and inject gasoline into the intake manifold.After these injectors close, the injectors for the cylinders 2, 4 and 6 open andinject gasoline.
Figure 9.14 shows a port injection using the electronic group fuel-injectionsystem for an eight-cylinder engine. Eight injectors are connected to a fuel sys-tem and are divided into two groups, each group having four injectors. Eachgroup of injectors is alternately turned on by the ECU. When the crankshaftmakes two revolutions, the injectors are turned on once. Thus it is seen thatthe modern engines are controlled more and more by electronics and the daysare not far off when electronics may completely take over leaving bare mini-mum room for any mechanical or manual control.
Excess fuel returning to the tank
Fuel filter Fuel pump
Fuel going to
the injectors
Intake boost pump
Injector
Fuel pressure regulator
Fig. 9.14 Injector grouping in a eight-cylinder engine
286 IC Engines
9.9 ELECTRONIC DIESEL INJECTION SYSTEM
It may be noted that meeting future emission and other norms puts a largestress on the fuel injection system of a diesel engine. A conventional fuelinjection pump with variable delivery capability is already seen in Fig.8.7.All parameters related to the injection process like, timing, rate of injection,end of injection, quantity of injected fuel etc. have to be precisely controlledif the engine has to operate with a high efficiency and low emission levels.Such a control is difficult with conventional mechanical systems. Mechanicalsystems only sense a few parameters and meter the fuel quantity or adjustthe injection timing. They seldom change the injection rate or the injectionpressure.
Use of pilot injection systems can lead to significant advantages. Here,a small quantity of fuel is first injected and allowed to undergo the ignitiondelay and burn. Subsequently the main injection takes place into gases, whichare already hot. Thus the amount of fuel taking part in the premixed or theuncontrolled combustion phase is minimized and this leads to a reduction innoise and NOx levels. Such a system will need an injection rate variationwith time which is rather difficult to achieve precisely in mechanical systems.Hence, different types of injection systems with electronic controls have beendeveloped.
By means of EFI systems one can achieve the precise control of:
(i) Injection timing,
(ii) Fuel injection quantity,
(iii) Injection rate during various stages of injection,
(iv) Injection pressure during injection,
(v) Nozzle opening speed and
(vi) Pilot injection timing and its quantity,
The following are easy to obtain with such systems:
(i) Very high injection pressure,
(ii) Sharp start and stop of injection,
(iii) Cylinder cut off,
(iv) Diagnostic capability,
(v) Turbocharger control and
(vi) Two stage injection
Electronic Injection Systems 287
9.10 ELECTRONIC DIESEL INJECTION CONTROL
There are various versions of electronically controlled diesel injection systems.Some of the important ones are discussed below:
(i) Electronically controlled injection pumps (inline and distributor type)
(ii) Electronically controlled unit injectors
(iii) Common rail fuel injection system
Electronically controlled diesel fuel injection systems may use the followingas inputs:
(i) Engine speed
(ii) Crank shaft position
(iii) Accelerator pedal position
(iv) Intake air temperature
(v) Lubricating oil temperature
(vi) Ambient air temperature and
(vii) Turbocharger boost pressure
(viii) Intake air mass flow rate
These are parameters, which can significantly affect the performance of theengine. The frequency of injection depends on the engine speed and number ofcylinders. The timing of injection has to be advanced as the speed increases.The accelerator pedal position indicates the load on the engine. Intake airtemperature and pressure indicate atmospheric conditions based on which theinjection quantity and timing may have to be altered. The lubricating oil andcoolant temperatures indicate the engine condition. This input can be usedto detect cold start and warm up conditions, which will need the injectiontiming to be retarded and the fuel quantity to be momentarily increased.The turbocharger boost pressure can be used to detect the mass flow rate ofair, which can be used to decide the fuel injection quantity. Alternatively ahot wire sensor can measure the mass flow rate of air. Various electronicallycontrolled injection systems are discussed below in some detail.
9.10.1 Electronically Controlled Unit Injectors
The schematic layout of the entire system is indicated in Fig.9.15. Unit in-jectors can be combination of high-pressure pumps and injectors in one unit.They do not have high-pressure lines and hence the injection lag is low. Themain high-pressure pump is situated above the injector. Fuel is fed into thehigh-pressure pump by a supply gear pump at low pressure. The plunger ofthe high-pressure pump is pushed down at the appropriate time by a cam, androcker mechanism. A simplified cross section of the unit injector and phases

288 IC Engines
of injection are shown in Fig.9.16. The fuel pushed down by the injector justbypasses the injection nozzle till the solenoid controlled spill valve closes thespill port. The closure of the spill port initiates the injection process. Theinjection stops when the solenoid valve opens the spill port. The timing andduration of the square pulse given to the solenoid can thus control the fueltiming and injection quantity. The solenoid can also be opened and closedmore than once to have a pilot injection spray followed by the main spray.The pressure of injection is however controlled by the rate of displacement ofthe fuel and the size of the hole in the nozzle. The ECU generates the pulsesto operate the solenoid controlled spill valve.
9.10.2 Electronically Controlled Injection Pumps (Inline and DistributorType)
Diesel engines use inline and distributor pumps. The start of injection in theconventional inline element is determined by the instant when the top of theplunger covers the bypass or the spill ports. The end of delivery occurs whenthe helical slot or groove on the plunger uncovers these ports. The start ofdelivery is fixed but the end of delivery depends on the amount of fuel to bedelivered.
In the case of the electronically controlled system there will be a controlsleeve which can be moved up and down by an actuator which is controlledby the ECU (Electronic Control Unit). The ECU determines the amount offuel to be injected depending on the throttle position, engine speed, and otherparameters. Once this is obtained the control sleeve is positioned so that therequired quantity of fuel can be injected. The timing of injection is still donemechanically.
Distributor pumps use control sleeves for metering the injected quantity.Thus they can be easily be made to work with an electronically controlledsolenoid actuator. The principle of operation is similar to the one explainedabove.
Inline pump governors in mechanical systems are quite complex. Thesebasically alter the injected fuel quantity of the pump so that the engine speedcan be maintained. A mechanical governor is used, which senses the enginespeed through the use of flyweights. In addition to the speed the governor alsoputs a limit on the maximum fuel delivery depending on engine operating andambient conditions. It also has to supply excess fuel just for starting. Thefuel delivery has to be controlled based on the turbocharger outlet conditions.The governor has to also limit the maximum speed and ensure stable idlingoperation.
The schematic of an electronically controlled inline fuel injection system isgiven in the Fig.9.17 as a block diagram. The various inputs are as shown inthe figure. The ECU determines the correct quantity of the fuel to be injectedbased on the inputs and the data in the look up table. The fuel input de-pends on the rack position and thus the ECU controls the rack position usinga solenoid. The position of the rack is measured and used for feedback. Theaccelerator pedal position is the input from the driver and a potentiometeris used to sense it. The system can maintain the vehicle speed at any set
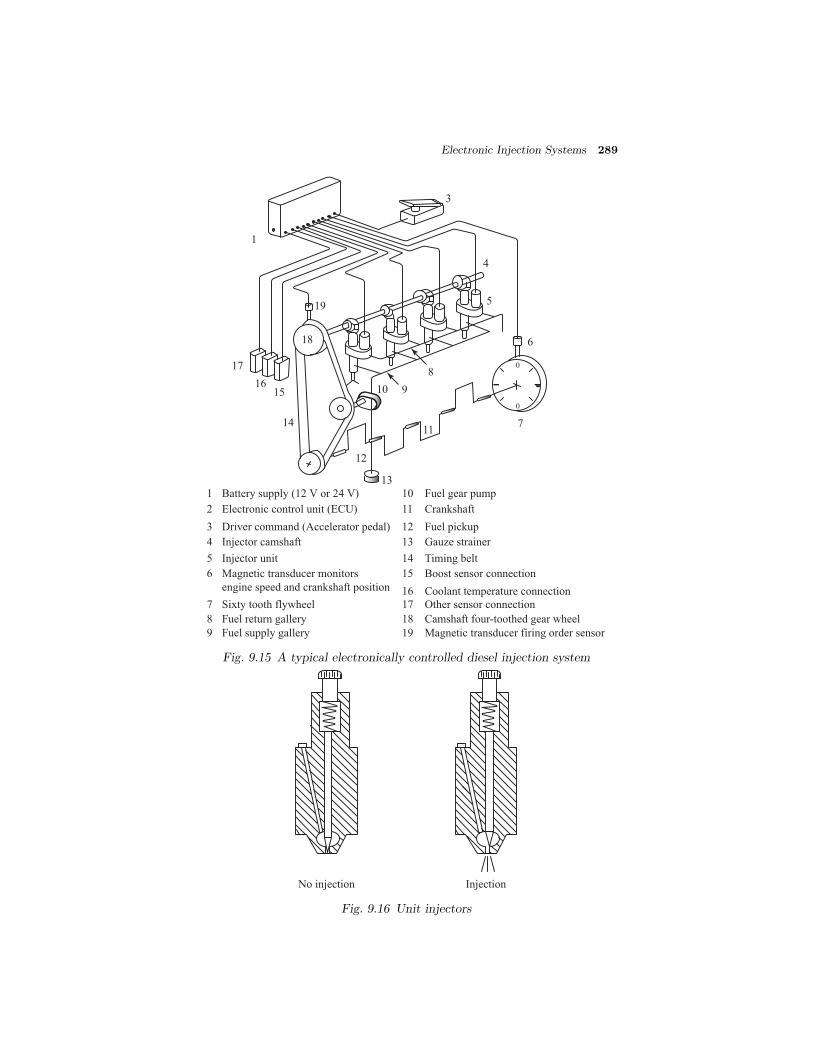
Electronic Injection Systems 289
Fuel gear pump
Magnetic transducer firing order sensor
Other sensor connection
Coolant temperature connection
Boost sensor connection
Timing belt
Gauze strainer
Crankshaft
Camshaft four-toothed gear wheel
Fuel pickup12
19
10
13
18
15
16
17
11
14
Battery supply (12 V or 24 V)
Electronic control unit (ECU)
Driver command (Accelerator pedal)
Injector camshaft
Injector unit
Magnetic transducer monitors
engine speed and crankshaft position
Fuel return gallery
Sixty tooth flywheel
1
2
3
4
5
6
7
8
9 Fuel supply gallery
0
0
1
3
4
5
6
7
8
910
11
12
13
14
1516
17
18
19
Fig. 9.15 A typical electronically controlled diesel injection system
No injection Injection
Fig. 9.16 Unit injectors

290 IC Engines
value. The ECU can also regulate the fuel quantity depending on other con-ditions like braking. The ECU also protects the engine against overheatingby regulating the maximum quantity of fuel delivered.
Charge-air pressure sensor
Temperature sensors(coolant, air, fuel)
Pump speed sensor
Substitute speedsignal (alternator)
Vehicle speed sensor
Sensors
Accelerator pedal sensor
Operator panel (vechicle speed,
intermediate speed)
Switches for brakes, exhaust brake, clutch
Rack-travel sensor(injection pump)
Desired-value generators
Microprocessor
Injected fuel quantity
Stop
Fuel injection pump
ECU Actuators
Diagnosis displayDiagnosis call-up
OBD
Data receive
Fuel quantity override
Vehicle ECU (option)
Variant programming
Programming device(only for data
program
Data mapscharacteristic
curves
Fig. 9.17 System blocks for electronic diesel control (EDC)
9.10.3 Common-Rail Fuel Injection System
The common rail fuel injection system is finding increasing use in diesel en-gines as it has the potential to drastically cut emissions and fuel consumption.This system provides control of many important parameters linked to the in-jection system (refer Chapter 20). It has a wide range of application, fromsmall to heavy duty engines. Some important features are:
(i) Very high injection pressures of the order of 1500 bar.
(ii) Complete control over start, and end of injection
(iii) Injection pressure is independent of engine speed
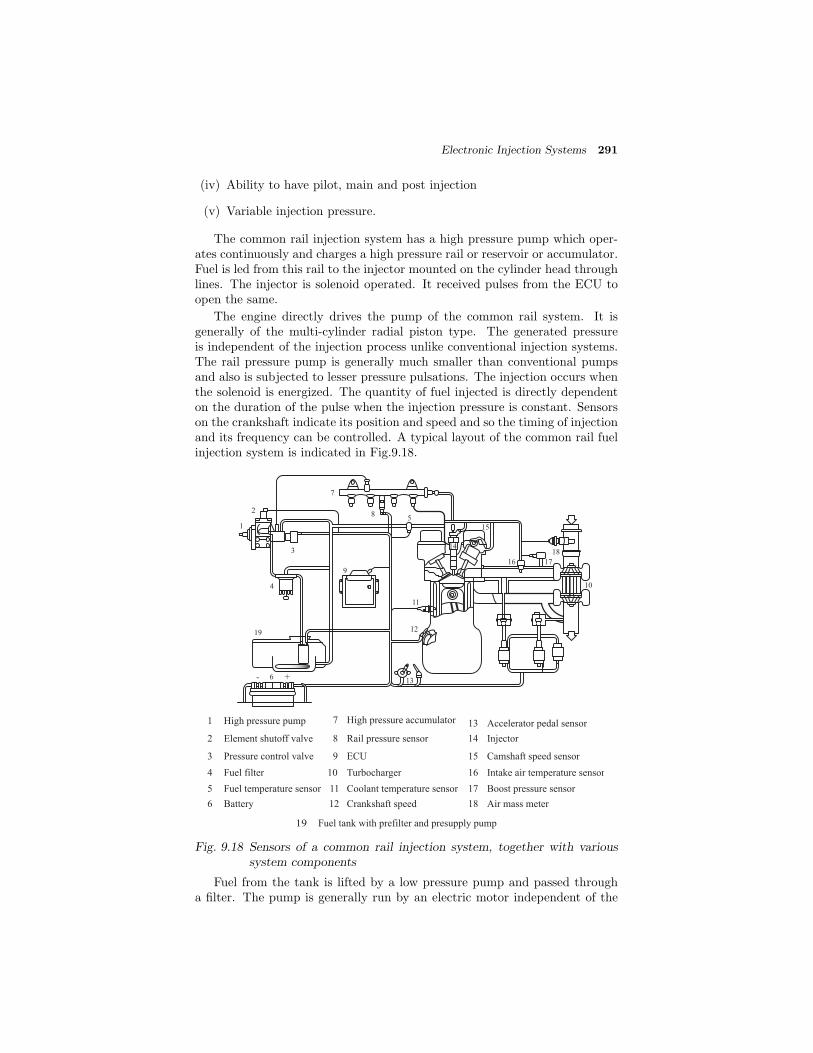
Electronic Injection Systems 291
(iv) Ability to have pilot, main and post injection
(v) Variable injection pressure.
The common rail injection system has a high pressure pump which oper-ates continuously and charges a high pressure rail or reservoir or accumulator.Fuel is led from this rail to the injector mounted on the cylinder head throughlines. The injector is solenoid operated. It received pulses from the ECU toopen the same.
The engine directly drives the pump of the common rail system. It isgenerally of the multi-cylinder radial piston type. The generated pressureis independent of the injection process unlike conventional injection systems.The rail pressure pump is generally much smaller than conventional pumpsand also is subjected to lesser pressure pulsations. The injection occurs whenthe solenoid is energized. The quantity of fuel injected is directly dependenton the duration of the pulse when the injection pressure is constant. Sensorson the crankshaft indicate its position and speed and so the timing of injectionand its frequency can be controlled. A typical layout of the common rail fuelinjection system is indicated in Fig.9.18.
1
2
3
4
19
6
7
8
9
5
11
12
13
14
15
16 17
18
10
- +
19 Fuel tank with prefilter and presupply pump
9 ECU
7 High pressure accumulator
8 Rail pressure sensor
1 High pressure pump
2 Element shutoff valve
3 Pressure control valve
4 Fuel filter
6 Battery
5 Fuel temperature sensor 11 Coolant temperature sensor
12 Crankshaft speed
13 Accelerator pedal sensor
14 Injector
15 Camshaft speed sensor
18 Air mass meter
17 Boost pressure sensor
16 Intake air temperature sensor10 Turbocharger
Fig. 9.18 Sensors of a common rail injection system, together with varioussystem components
Fuel from the tank is lifted by a low pressure pump and passed througha filter. The pump is generally run by an electric motor independent of the

292 IC Engines
engine speed. The main pumping element can be a conventional gear pumpor of the roller cell type. The roller cell pump has a rotor with radial slots.These slots house rollers which are always in contact with the inner surfaceof the housing due to fuel pressure and centrifugal forces. The space betweenthe rotor and the housing varies as the rotor turns and this is responsible forthe suction and delivery.
Lucas diesel systems is of a high pressure pump which is seen in Fig.9.19.This pump has a cam which is stationary and a rotating hydraulic head whichhouses two plungers. These plungers touch the cam and are pushed in fourtimes a rotation. Thus fuel is pumped four times per rotation. A non returnvalve is used to send the fuel to the rail. The inlet of the pump is controlledto maintain the needed delivery. It may be noted that any excess delivery isultimately returned back from the rail pressure regulator after it is throttleddown to tank pressure. This amounts to fuel heating and also loss of worktakes place to pump the fuel. Hence, controlling the delivery at the pump isa good idea. A high pressure regulator is also used. Both these valves aresolenoid operated and are controlled by the ECU.
Inlet fitting
Roller
Shoe
Inlet orifice
Plunger
Outlet orifice
Discharge fittingCam
Fig. 9.19 LDCR high pressure pump
In the rail-pressure regulator the spring force and the electromagnetic forcegenerated by the coil regulate the pressure. The pressure is controlled by theECU. The electromagnet receives a pulse at a frequency of 1 kHz whose widthis modulated to change the effective current through the electromagnet. Thecommon rail system also has a pressure sensor and a pressure limiter attachedto the rail. There is also a flow limiter to prevent continuous injection ifone of the injectors mal functions. Thus, it is seen that engine managementis gradually turning into electronic control thereby better combustion andeconomy as well as low emissions can be achieved.
Review Questions
9.1 What is the necessity for gasoline injection? Explain with suitable sketch.
9.2 Mention the various types of gasoline injection systems.
9.3 Enumerate various components of a electronic injection system and men-tion their functions.
Electronic Injection Systems 293
9.4 What are the various sensors used in electronic fuel injection system?
9.5 Explain the merits and demerits of a EFI system.
9.6 Describe briefly the MPFI system with a neat sketch.
9.7 Explain port injection and throttle body injection system.
9.8 Describe D-MPFI and L-MPFI injection system.
9.9 With a neat sketch explain the functions of MPFI system.
9.10 Explain the functions of electronic control systems.
9.11 What do you understand by group gasoline injection system? Explain.
9.12 Briefly explain the electronic diesel injection system with necessary con-trols.
9.13 Explain with a layout electronically controlled injection pump system.
9.14 What is a common rail system? Explain.
9.15 With a neat sketch explain LDCR high pressure pump.
Multiple Choice Questions (choose the most appropriate answer)
1. Multi-point fuel injection system uses
(a) manifold injection
(b) direct injection
(c) port injection
(d) throttle body injection
(e) both (c) and (d)
2. L-MPFI system uses
(a) port injection
(b) direct injection
(c) manifold injection
(d) throttle body injection
3. D-MPFI system uses
(a) port injection
(b) manifold injection
(c) direct injection
(d) throttle body injection

294 IC Engines
4. Common rail injection system uses injection pressures of the order
(a) 100–200 bar
(b) 200–400 bar
(c) 400–600 bar
(d) 1500 bar
5. Continuous injection system usually has
(a) plunger pump
(b) rotary pump
(c) gear pump
(d) vane pump
6. The cold start injector
(a) maintain stoichiometric air-fuel ratio
(b) provides lean air-fuel ratio
(c) gives rich air-fuel ratio
(d) is not used for any of the above functions
7. ECU is an electronic injection system used for
(a) calculating the appropriate injection timing
(b) meeting only certain operating conditions
(c) closing the injection valve only
(d) none of the above
8. With EFI of diesel engines
(a) sharp start and stop is not possible
(b) very high injection pressure can be obtained
(c) sudden cylinder cut-off is impossible
(d) diagnostic properties are poor
9. EFI system can achieve
(a) proper injection timing
(b) proper injection quantity
(c) proper injection pressure
(d) all of the above
Ans: 1. – (e) 2. – (a) 3. – (b) 4. – (d) 5. – (b)6. – (c) 7. – (a) 8. – (b) 9. – (d)

10IGNITION
10.1 INTRODUCTION
In spark-ignition engines, as compression ratio is lower, and the self-ignitiontemperature of gasoline is higher, for igniting the mixture for the initiation ofcombustion an ignition system is a must.
The electrical discharge produced between the two electrodes of a sparkplug by the ignition system starts the combustion process in a spark-ignitionengine. This takes place close to the end of the compression stroke. Thehigh temperature plasma kernel created by the spark, develops into a selfsustaining and propagating flame front. In this thin reaction sheet certainexothermic chemical reactions occur. The function of the ignition system isto initiate this flame propagation process. It must be noted that the spark isto be produced in a repeatable manner viz., cycle-by-cycle, over the full rangeof load and speed of the engine at the appropriate moment in the engine cycle.
By implication, ignition is merely a prerequisite for combustion. Therefore,the study of ignition is a must to understand the phenomenon of combustionso that a criterion may be established to decide whether ignition has occurred.Although the ignition process is intimately connected with the initiation ofcombustion, it is not associated with the gross behaviour of combustion. In-stead, it is a local small-scale phenomenon that takes place within a smallzone in the combustion chamber.
In terms of its simplest definition, ignition has no degree, intensively orextensively. Either the combustion of the medium is initiated or it is not.Therefore, it is reasonable to consider ignition from the standpoint of thebeginning of the combustion process that it initiates.
10.2 ENERGY REQUIREMENTS FOR IGNITION
The total enthalpy required to cause the flame to be self sustaining and pro-mote ignition, is given by the product of the surface area of the spherical flameand the enthalpy per unit area. It is reasonable to assume that the basic re-quirement of the ignition system is that it should supply this energy withina small volume. Further, ignition should occur in a time interval sufficientlyshort to ensure that only a negligible amount of energy is lost other than toestablish the flame. In view of this last mentioned condition, it is apparentthat the rate of supply of energy is as important a factor as the total energysupplied.
A small electric spark of short duration would appear to meet most of therequirements for ignition. A spark can be caused by applying a sufficientlyhigh voltage between two electrodes separated by a gap, and there is a criticalvoltage below which no sparking occurs. This critical voltage is a function

296 IC Engines
of the dimension of the gap between the electrodes, the fuel-air ratio and thepressure of the gas. Additionally, the manner in which the voltage is raisedto the critical value and the configuration and the condition of the electrodesare important in respect of the energy required.
An ignition process obeys the law of conservation of energy. Hence, it canbe treated as a balance of energy between:
(i) that provided by an external source
(ii) that released by chemical reaction and
(iii) that dissipated to the surroundings by means of thermal conduction,convection and radiation
10.3 THE SPARK ENERGY AND DURATION
With a homogeneous mixture in the cylinder, spark energy of the order of 1 mJand a duration of a few micro-seconds would suffice to initiate the combustionprocess. However, in practice, circumstances are less than the ideal. Thepressure, temperature and density of the mixture between the spark plugelectrodes have a considerable influence on the voltage required to produce aspark. Therefore, the spark energy and duration are to be of sufficient orderto initiate combustion under the most unfavourable conditions expected inthe vicinity of the spark plug over the complete range of engine operation.Usually, if the spark energy exceeds 40 mJ and the duration is longer than0.5 ms, reliable ignition is obtained. If the resistance of the deposits on thespark plug electrodes is sufficiently high, the loss of electrical energy throughthese deposits may prevent the spark discharge.
10.4 IGNITION SYSTEM
In principle, a conventional ignition system should provide sufficiently largevoltage across the spark plug electrodes to affect the spark discharge. Further,it should supply the required energy for the spark to ignite the combustiblemixture adjacent to the plug electrodes under all operating conditions. It maybe noted that for a given engine design, the optimum spark timing varies withengine speed, inlet manifold pressure and mixture composition. The designof a conventional ignition system should take these factors into account toprovide the spark of proper energy and duration at the appropriate time.
As air is a poor conductor of electricity an air gap in an electric circuit actsas a high resistance. But when a high voltage is applied across the electrodesof a spark plug it produces a spark across the gap. When such a spark isproduced to ignite a homogeneous air-fuel mixture in the combustion chamberof an engine it is called the spark-ignition system. The ignition systems areclassified depending upon how the primary energy for operating the circuit ismade available as:
(i) battery ignition systems
(ii) magneto ignition systems

Ignition 297
10.5 REQUIREMENTS OF AN IGNITION SYSTEM
A smooth and reliable functioning of an ignition system is essential for reliableworking of an engine. The requirements of such an ignition system are:
(i) It should provide a good spark between the electrodes of the plugs atthe correct timing.
(ii) It should function efficiently over the entire range of engine speed.
(iii) It should be light, effective and reliable in service.
(iv) It should be compact and easy to maintain.
(v) It should be cheap and convenient to handle.
(vi) The interference from the high voltage source should not affect the func-tioning of the radio and television receivers inside an automobile.
10.6 BATTERY IGNITION SYSTEM
Most of the modern spark-ignition engines use battery ignition system. Inthis system, the energy required for producing spark is obtained from a 6 or12 volt battery. The construction of a battery ignition system is extremelyvaried. It depends on the type of ignition energy storage as well as on theignition performance which is required by the particular engine. The reasonfor this is that an ignition system is not an autonomous machine, that is, itdoes not operate completely by itself, but instead it is but one part of theinternal combustion engine, the heart of the engine. It is therefore extremelyimportant that the ignition system be matched sufficiently well to its engine.
Passenger cars, light trucks, some motorcycles and large stationary enginesare fitted with battery ignition systems. The details of the battery ignitionsystem of a six-cylinder engine are shown in Fig.10.1.
The essential components of the system are:
(i) battery
(ii) ignition switch
(iii) ballast resistor
(iv) ignition coil
(v) contact breaker
(vi) capacitor
(vii) distributor
(viii) spark plug
In the above list the first three components are housed in the primary sideof the ignition coil whereas the last four are in the secondary side. The detailsof the various components are described briefly in the following sections.
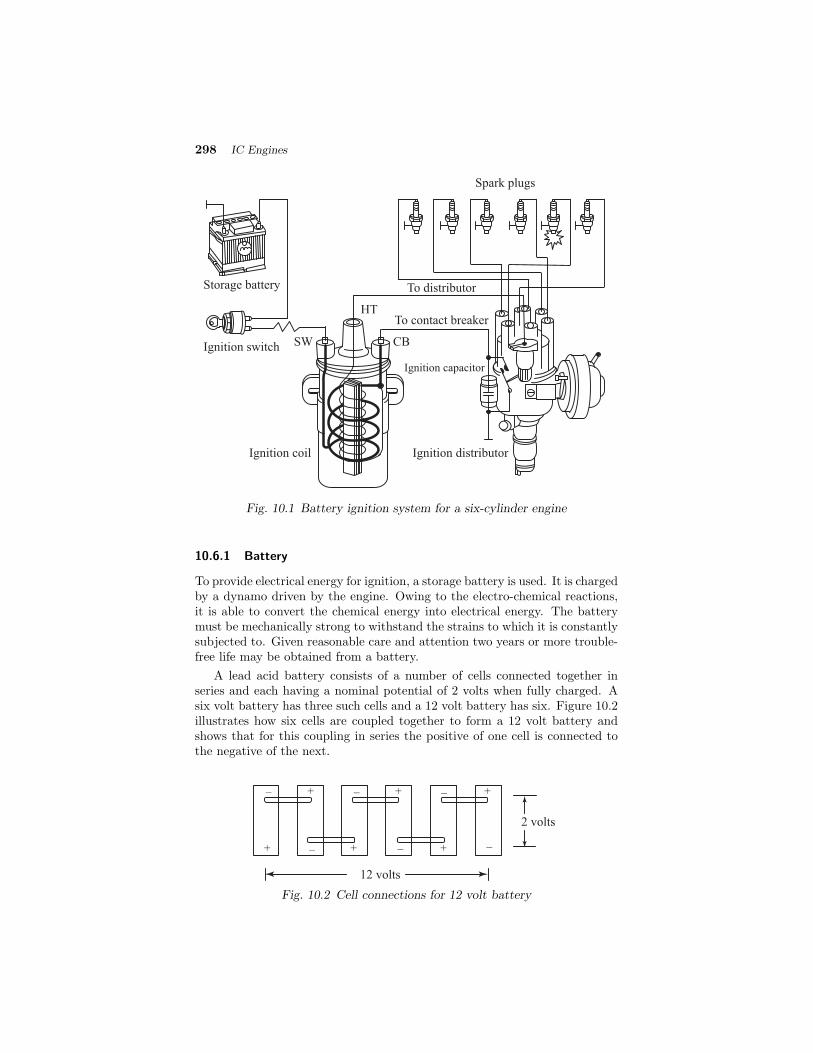
298 IC Engines
Ignition distributor
Ignition capacitor
Ignition coil
SW CB
HTTo contact breaker
To distributor
Spark plugs
Storage battery
Ignition switch
Fig. 10.1 Battery ignition system for a six-cylinder engine
10.6.1 Battery
To provide electrical energy for ignition, a storage battery is used. It is chargedby a dynamo driven by the engine. Owing to the electro-chemical reactions,it is able to convert the chemical energy into electrical energy. The batterymust be mechanically strong to withstand the strains to which it is constantlysubjected to. Given reasonable care and attention two years or more trouble-free life may be obtained from a battery.
A lead acid battery consists of a number of cells connected together inseries and each having a nominal potential of 2 volts when fully charged. Asix volt battery has three such cells and a 12 volt battery has six. Figure 10.2illustrates how six cells are coupled together to form a 12 volt battery andshows that for this coupling in series the positive of one cell is connected tothe negative of the next.
+ + +
+ + +
_ _ _
___
2 volts
12 volts
Fig. 10.2 Cell connections for 12 volt battery

Ignition 299
Two types of batteries are used for spark-ignition engines, the lead acidbattery and the alkaline battery. The former is used in light duty commercialvehicles and the later on heavy duty commercial vehicles.
10.6.2 Ignition Switch
Battery is connected to the primary winding of the ignition coil through anignition switch and ballast resistor. With the help of the ignition switch theignition system can be turned on or off.
10.6.3 Ballast Resistor
A ballast resistor is provided in series with the primary winding to regulatethe primary current. The object of this is to prevent injury to the spark coilby overheating if the engine should be operated for a long time at low speed,or should be stalled with the breaker in the closed position. This coil is madeof iron wire, and iron has the property that its electrical resistance increasesvery rapidly if a certain temperature is exceeded. The coil is therefore madeof wire of such size that if the primary current flows nearly continuously, theballast coil reaches a temperature above that where this rapid increase inresistance occurs. This additional resistance in the primary circuit holds theprimary current down to a safe value. For starting from cold this resistor isby-passed to allow more current to flow in the primary circuit.
10.6.4 Ignition Coil
Ignition coil is the source of ignition energy in the conventional ignition sys-tem. This coil stores the energy in its magnetic field and delivers it at theappropriate time in the form of a ignition pulse through the high-tension igni-tion cables to the respective spark plug. The purpose of the ignition coil is tostep up the 6 or 12 volts of the battery to a high voltage, sufficient to inducean electric spark across the electrodes of the spark plug. The ignition coilconsists of a magnetic core of soft iron wire or sheet and two insulated con-ducting coils, called primary and the secondary windings. A typical ignitioncoil is shown in Fig.10.3.
The secondary coil consists of about 21,000 turns of 38-40 gauge enameledcopper wire sufficiently insulated to withstand the high voltage. It is woundclose to the core with one end connected to the secondary terminal and theother end grounded either to the metal case or the primary coil.
The primary winding, located outside the secondary coil is generally formedof 200-300 turns of 20 gauge wire to produce a resistance of about 1.15Ω.The ends are connected to exterior terminals. More heat is generated in theprimary than in the secondary and with the primary coil wound over the sec-ondary coil, it is easier to dissipate the heat. The entire unit when assembled,is enclosed in a metal container and forms a neat and compact unit. On thetop of the coil assembly is the heavily insulated terminal block, which sup-ports three terminals. To the two smaller terminals (Fig.10.3), usually markedSW (switch wire) and CB (contact breaker) the two ends of the primary areconnected.

300 IC Engines
To contact breaker
To distributor
HT
CBSW
To ignition switch
Fig. 10.3 Ignition coil
As can be seen in Fig.10.3, one end of the secondary winding is connectedto the central high-tension terminal in the moulded cover of the distributor.The other end is connected to the primary. An external high tension wireconnects this central terminal to the central terminal of the distributor.
10.6.5 Contact Breaker
This is a mechanical device for making [Fig.10.4(a)] and breaking [Fig.10.4(b)]the primary circuit of the ignition coil. It consists essentially of a fixed metalpoint against which, another metal point bears which is being on a springloaded pivoted arm. The metal used is invariably one of the hardest metals,usually tungsten and each point has a circular flat face of about 3 mm diam-eter. The fixed contact point is earthed by mounting it on the base of thecontact breaker assembly whereas the arm to which the movable contact pointis attached, is electrically insulated. When the points are closed the currentflows and when they are open, the circuit is broken and the flow of currentstops. The pivoted arm has, generally, a heel or a rounded part of some hardplastic material attached in the middle and this heel bears on the cam whichis driven by the engine. Consequently, every time the cam passes under theheel, the points are forced apart and the circuit is broken. The pivoted arm is
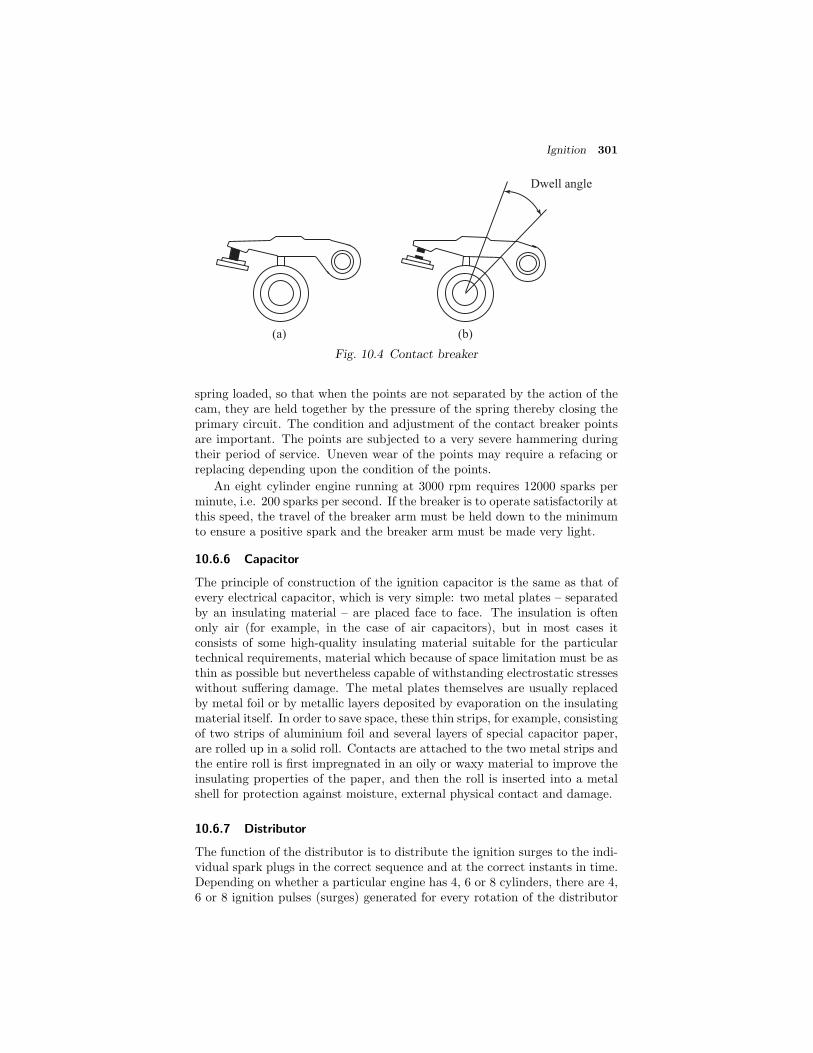
Ignition 301
(a)
Dwell angle
(b)
Fig. 10.4 Contact breaker
spring loaded, so that when the points are not separated by the action of thecam, they are held together by the pressure of the spring thereby closing theprimary circuit. The condition and adjustment of the contact breaker pointsare important. The points are subjected to a very severe hammering duringtheir period of service. Uneven wear of the points may require a refacing orreplacing depending upon the condition of the points.
An eight cylinder engine running at 3000 rpm requires 12000 sparks perminute, i.e. 200 sparks per second. If the breaker is to operate satisfactorily atthis speed, the travel of the breaker arm must be held down to the minimumto ensure a positive spark and the breaker arm must be made very light.
10.6.6 Capacitor
The principle of construction of the ignition capacitor is the same as that ofevery electrical capacitor, which is very simple: two metal plates – separatedby an insulating material – are placed face to face. The insulation is oftenonly air (for example, in the case of air capacitors), but in most cases itconsists of some high-quality insulating material suitable for the particulartechnical requirements, material which because of space limitation must be asthin as possible but nevertheless capable of withstanding electrostatic stresseswithout suffering damage. The metal plates themselves are usually replacedby metal foil or by metallic layers deposited by evaporation on the insulatingmaterial itself. In order to save space, these thin strips, for example, consistingof two strips of aluminium foil and several layers of special capacitor paper,are rolled up in a solid roll. Contacts are attached to the two metal strips andthe entire roll is first impregnated in an oily or waxy material to improve theinsulating properties of the paper, and then the roll is inserted into a metalshell for protection against moisture, external physical contact and damage.
10.6.7 Distributor
The function of the distributor is to distribute the ignition surges to the indi-vidual spark plugs in the correct sequence and at the correct instants in time.Depending on whether a particular engine has 4, 6 or 8 cylinders, there are 4,6 or 8 ignition pulses (surges) generated for every rotation of the distributor

302 IC Engines
shaft. The use of a distributor represents a considerable simplification in abattery ignition system because in most cases we want to use only a singleignition circuit. The contact breaker and the spark advance mechanism arecombined with the distributor in a single unit because of the absolute necessitythat the distributor operate in synchronism with the crankshaft.
There are two types of distributors, the brush type and the gap type.In the former, carbon brush carried by the rotor arm slides over metallicsegments embedded in the distributor cap of molded insulating material, thusestablishing electrical connection between the secondary winding of the coiland the spark plug, while in the latter the electrode of the rotor arm passclose to, but does not actually contact the segments in the distributor cap.With the latter type of distributor, there will not be any appreciable wear ofthe electrodes.
The distributor unit also consists of several other auxiliary units. In thelower part of the housing there is a speed sensitive device or governor, whosefunction is to advance the spark with increase in engine speed. Above this unitis the contact breaker assembly which can be rotated to adjust the timing ofspark. In the upper part of the housing is located the high tension distributor.It also carries the vacuum ignition governor, which serves to retard the sparkas the load on the engine increases. Each of the segments of the distributor isconnected to a sparking plug and as the rotor presses it, the contact breakeropens, the high tension current is passed through the rotor and brass segmentthrough the high tension wiring to the appropriate spark plug. Obviously, theorder in which the sparking plugs are connected to the distributor head willdepend on the firing order of the engine.
10.6.8 Spark Plug
The spark plug provides the two electrodes with a proper gap across whichthe high potential discharges to generate a spark and ignite the combustiblemixture within the combustion chamber. A sectional view of a spark plug isshown in Fig.10.5.
A spark plug consists essentially of a steel shell, an insulator and twoelectrodes. The central electrode to which the high tension supply from theignition coil is connected, is well insulated with porcelain or other ceramicmaterials. The other electrode is welded to the steel shell of the plug andthereby is automatically grounded when the plug is installed on the cylinderhead of the engine. The electrodes are usually made of high nickel alloy towithstand the severe erosion and corrosion to which they are subjected in use.
The tips of the central electrode and the insulator are exposed to thecombustion gases. This results in the insulators having a tendency to crackfrom the high thermal and mechanical stresses. Some insulators are alsoseriously affected by moisture and by abnormal surface deposits. Since, thecentral electrode and the insulator are subjected to the high temperature ofthe combustion gases, the heat must flow from the insulator to the steel shellwhich is in contact with the relatively cool cylinder head in order to cool theelectrodes and thereby prevent preignition.
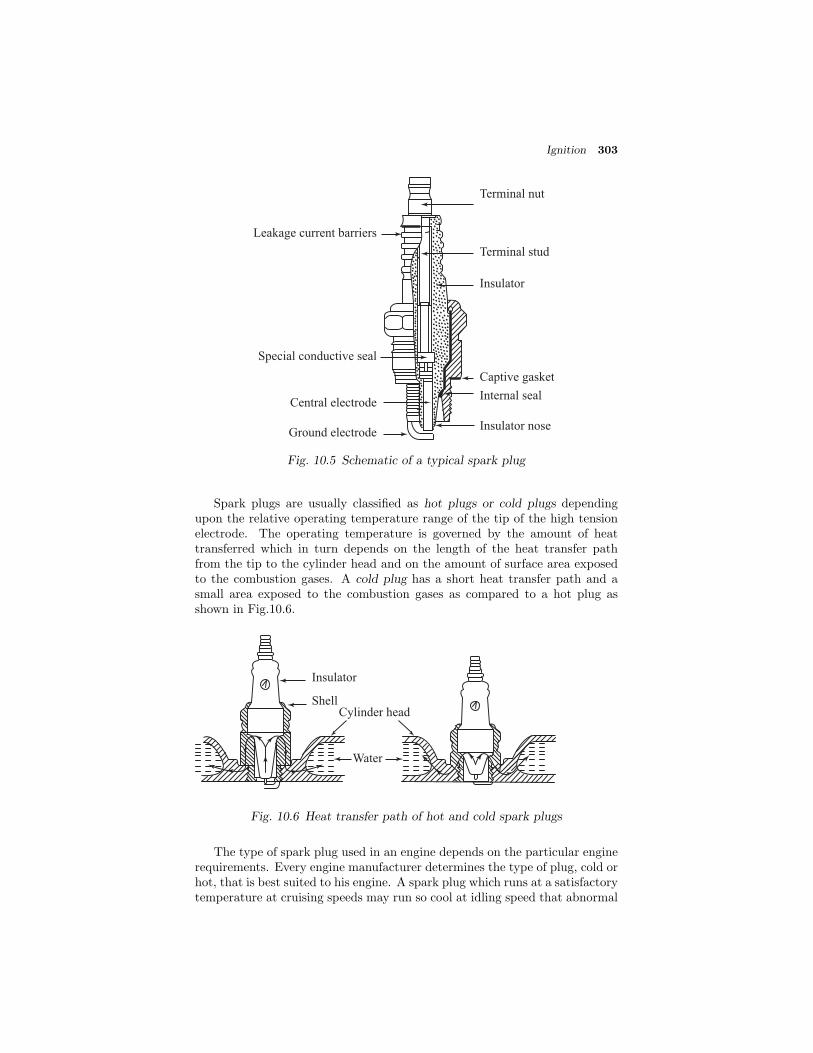
Ignition 303
Terminal nut
Terminal stud
Insulator
Captive gasket
Internal seal
Insulator nose
Leakage current barriers
Special conductive seal
Central electrode
Ground electrode
Fig. 10.5 Schematic of a typical spark plug
Spark plugs are usually classified as hot plugs or cold plugs dependingupon the relative operating temperature range of the tip of the high tensionelectrode. The operating temperature is governed by the amount of heattransferred which in turn depends on the length of the heat transfer pathfrom the tip to the cylinder head and on the amount of surface area exposedto the combustion gases. A cold plug has a short heat transfer path and asmall area exposed to the combustion gases as compared to a hot plug asshown in Fig.10.6.
Water
Insulator
ShellCylinder head
Fig. 10.6 Heat transfer path of hot and cold spark plugs
The type of spark plug used in an engine depends on the particular enginerequirements. Every engine manufacturer determines the type of plug, cold orhot, that is best suited to his engine. A spark plug which runs at a satisfactorytemperature at cruising speeds may run so cool at idling speed that abnormal

304 IC Engines
deposits are likely to foul the electrodes. These deposits may be of soft dullcarbon from incomplete combustion or of hard shiny carbon from excess lu-bricating oil that passes the piston rings and enters the combustion chamber.The carbon deposits from incomplete combustion will burn off at tempera-tures above 340 ◦C while the excess oil carbon deposits from lubricating oilrequire a temperature above 540 ◦C to burn. If a spark plug runs hot enoughat idling speeds to prevent carbon deposits, it may run too hot at high speedsand cause preignition. If a spark plug runs at a temperature above 800 ◦Cpreignition usually results. A compromise must be made in order to obtaina proper spark plug which would operate satisfactorily throughout the entireengine operating range. An improper spark plug is always a major source ofengine trouble such as misfiring and preignition.
10.7 OPERATION OF A BATTERY IGNITION SYSTEM
The source of the ignition energy in the battery ignition system is the ignitioncoil. This coil stores the energy in its magnetic field and delivers it at theinstant of ignition (firing point) in the form of a surge of high voltage current(ignition pulse) through the high tension ignition cables to the correct sparkplug. Storage of energy in the magnetic field is based on an inductive process,as a result of which we also designate the ignition coil as an inductive storagedevice. The schematic diagram of a conventional battery ignition system fora four-cylinder engine is shown in Fig.10.7.
Ballast
Switch
Pri
mar
y
Sec
ondar
y
Cam
Cylinder 1 2 3 4
Spark
plug
1 3
2 4
Ignition
distributor
Fig. 10.7 Conventional coil ignition system for four-cylinder engines –schematic diagram
As already explained the ignition coil consists of two coils of wire, onewound around the other, insulated from each other; the primary winding,
Ignition 305
L1 with few turns of heavy copper wire and the secondary winding, L2 withmany turns of fine copper wire. The primary and secondary winding arewound around a laminated iron core which has the effect of increasing thestrength of the magnetic field and thus of the amount of energy stored.
One end of the primary winding is connected through the ignition switchto the positive terminal post of the storage battery, and the other end isgrounded through the contact breaker. The ignition capacitor is connected inparallel with the contact breaker. One end of the secondary winding is alsogrounded through the contact breaker, and the other end is connected throughthe distributor and the high-tension ignition cables to the center electrode ofthe spark plug.
When the ignition switch is closed, the primary winding of the coil isconnected to the positive terminal post of the storage battery. If the primarycircuit is closed through the breaker contacts, a current flows, the so calledprimary current.
This current, flowing through the primary coil, which is wound on a softiron core, produces a magnetic field in the core. A cam driven by the engineshaft, is arranged to open the breaker points whenever an ignition discharge isrequired. When the breaker points open, the current which had been flowingthrough the points now flows into the condenser, which is connected acrossthe points. As the condenser becomes charged, the primary current falls andthe magnetic field collapses. The collapse of the field induces a voltage in theprimary winding, which charges the condenser to a voltage much higher thanbattery voltage. The condenser then discharges into the battery, reversingthe direction of both the primary current and the magnetic field. The rapidcollapse and reversal of the magnetic field in the core induce a very highvoltage in the secondary winding of the ignition coil. The secondary windingconsists of a large number of turns of very fine wire wound on the same corewith the primary. The high secondary voltage is led to the proper spark plugby means of a rotating switch called the distributor, which is located in thesecondary or high tension circuit of the ignition system.
If a condenser were not used in the primary circuit, the high primaryvoltage caused by the collapse of the magnetic field around the primary wind-ing would cause an arc across the breaker points. The arc would burn anddestroy the points and would also prevent the rapid drop in primary currentand magnetic field which is necessary for the production of the high secondaryvoltage.
Note that the spark timing is controlled by the crank angle at which thebreaker points open, while the distributor merely determines the firing se-quence of the spark plugs. Changes in ignition timing may be affected byrotating the plate which holds the breaker points, relative to the cam. Be-cause of this ignition will be delayed if the plate is displaced in the directionin which the camshaft rotates.
10.8 LIMITATIONS
(i) The primary voltage decreases as the engine speed increases due to thelimitations in the current switching capability of the breaker system.

306 IC Engines
(ii) Time available for build-up of the current in the primary coil and thestored energy decrease as the engine speed increases due to the dwellperiod becoming shorter.
(iii) Because of the high source impedance (about 500 kΩ) the system issensitive to side-tracking across the spark plug insulator.
(iv) The breaker points are continuously subjected to electrical as well as me-chanical wear which results in short maintenance intervals. Increasedcurrents cause a rapid reduction in breaker point life and system re-liability. Acceptable life for these systems is obtained with a primarycurrent limited to about 4 amperes.
10.9 DWELL ANGLE
The period, measured in degree of cam rotation, during which the contactpoints remain closed is called the dwell angle or the cam angle. This is il-lustrated in Fig.10.8. The dwell angle must be sufficiently large to allowmagnetic saturation of the primary coil. Too small a dwell angle will result inlower secondary voltage and hence poor sparks or even misfiring. Too largea dwell angle will lead to burning of condenser and the contact points due toover-saturation of windings.
Dwell angle
Fig. 10.8 Dwell angle
The magnitude of the dwell angle depends upon the gap between thepoints and also the angle between the cam lobes. The gap between the pointsis generally of the order of 0.35 mm to 0.55 mm. The angle between the camlobes depends upon the number of engine cylinders. If a single contact breakeris used the number of lobes on the cam is the same as the number of cylinders.This means that at any given engine speed the time available to supply energyto the primary winding decreases as the number of cylinders increases, therebyimposing a high-speed limit on an engine having large number of cylinders.The effects of inertia and spring lag further worsen the situation.

Ignition 307
As the number of cylinders is increased, the dwell angle must be reducedbecause more and more closing and opening operations must be accommo-dated during every rotation of the distributor camshaft; in the four-cylinderengine the dwell angle is about 50◦, in the six-cylinder engine it is about 38◦,and in the eight-cylinder engine it is about 33◦. The following formula showsthe way in which the dwell period can be expressed as a function of the dwellangle and the engine speed (in rev/min).
Dwell period (milliseconds) =1000× dwell angle (degrees)
6× engine speed (rev/min)
The smaller the gap between the contact points when they are fully open, thelarger the dwell angle, and vice versa. This has led to the use of twin contactbreakers connected in parallel between the primary winding and earth and acam having number of lobes half that of the number of cylinders, to increasethe dwell angle and thereby allow sufficient build-up of primary coil energy.Six cylinder engine will, thus have a 60◦ lobe angle with a twin contact breaker.Such an arrangement however, requires accurate synchronization of the armsof the contact breaker which very often causes problems in service. To avoidthis, nowadays a cam having the same number of lobes as there are enginecylinders is used in conjunction with two contact breakers arranged in parallel.One contact breaker always opens the points while the other always closes thepoints, i.e., the dwell angle is doubled.
10.10 ADVANTAGE OF A 12 V IGNITION SYSTEM
Until about 1950 all car engines had 6-volt ignition systems. The chief advan-tage of the 6-volt system is that it uses the three cell storage battery which ischeaper, lighter and less bulky than a six-cell battery of the same watt-hourcapacity. With the relatively low compression ratios used in those days the6-volt system gave satisfactory results. As the compression ratios and theengine speeds increased, the voltage required to break down the spark gaprose. Hence, the 12-volt system came to be preferred as considerably highersecondary voltages are obtainable with it.
The other advantages are as follows:
(i) for transmitting equal power without excessive voltage drop, the cablesin a 6-volt system need theoretically to be twice the thickness of 12-voltcables.
(ii) starting, in particular, is much improved by the 12-volt system sincealmost twice the power is available for ignition coil during the startingsurge.
(iii) the 12-volt system has adequate electric power to supply the increasingnumber of electrical accessories used.
10.11 MAGNETO IGNITION SYSTEM
Magneto is a special type of ignition system with its own electric generatorto provide the necessary energy for the system. It is mounted on the engine

308 IC Engines
and replaces all the components of the coil ignition system except the sparkplug. A magneto when rotated by the engine is capable of producing a veryhigh voltage and does not need a battery as a source of external energy.
A schematic diagram of a high tension magneto ignition system is shownin Fig.10.9. The high tension magneto incorporates the windings to generatethe primary voltage as well as to step up the voltage and thus does not requirea separate coil to boost up the voltage required to operate the spark plug.
Cam
Condenser
Rotating magnet
two pole shown
Contact breaker
Ignition switch
Coil
Distributor
Spark plug
1
2
3
4
Primary winding
Secondary winding
Fig. 10.9 High tension magneto ignition system
Magneto can be either rotating armature type or rotating magnet type. Inthe first type, the armature consisting of the primary and secondary windingsall rotate between the poles of a stationary magnet, whilst, in the second typethe magnet revolves and the windings are kept stationary. A third type ofmagneto called the polar inductor type is also in use. In the polar inductortype magneto both the magnet and the windings remain stationary but thevoltage is generated by reversing the flux field with the help of soft iron polarprojections, called inductors.
The working principle of the magneto ignition system is exactly the sameas that of the coil ignition system. With the help of a cam, the primary circuitflux is changed and a high voltage is produced in the secondary circuit.
The variation of the breaker current with speed for the coil ignition systemand the magneto ignition system is shown in Fig.10.10. It can be seen thatsince the cranking speed at start is low the current generated by the magneto isquite small. As the engine speed increases the flow of current also increases.

Ignition 309
Thus, with magneto there is always a starting difficulty and sometimes aseparate battery is needed for starting. The magneto is best at high speedsand therefore is widely used for sports and racing cars, aircraft engines etc.
0 2000 4000 6000
0
1
2
3
4
5
Spark per minute
Curr
ent
at b
reak
(am
per
es)
Battery coil
HT magneto
Fig. 10.10 Breaker current versus speed in coil and magneto ignition systems
In comparison, the battery ignition system is more expensive but highlyreliable. Because of the poor starting characteristics of the magneto systeminvariably the battery ignition system is preferred to the magneto system inautomobile engines. However, in two wheelers magneto ignition system isfavoured due to light weight and less maintenance.
The main disadvantage of the high tension magneto ignition system liesin the fact that the wirings carry a very high voltage and thus there is astrong possibility of causing engine misfire due to leakage. To avoid thisthe high tension wires must be suitably shielded. The development of the lowtension magneto system is an attempt to avoid this trouble. In the low tensionmagneto system the secondary winding is changed to limit the secondaryvoltage to a value of about 400 volts and the distributor is replaced by a brushcontact. The high voltage is obtained with the help of a step-up transformer.All these changes have the effect of limiting the high voltage current in thesmall portion of the ignition system wiring and thus avoid the possibilities ofleakage etc. Table 10.1 gives the comparison of battery and magneto ignitionsystems.
10.12 MODERN IGNITION SYSTEMS
The major limitations of the breaker-operated ignition systems are the de-crease in available voltage as the engine speed increases due to limitationsin the current switching capability of the breaker system and the decreasingtime available to build up the stored energy in the primary coil. A furtherdisadvantage is that due to their high current load, the breaker points aresubjected to electrical wear in addition to mechanical wear which results in

310 IC Engines
Table 10.1 Comparison between battery ignition and magneto ignition system
Battery Ignition System Magneto Ignition System
Battery is necessary. Difficult to startthe engine when battery is discharged.
No battery is needed and there-fore there is no problem of batterydischarge.
Maintenance problems are more dueto battery.
Maintenance problems are less sincethere is no battery.
Current for primary circuit is ob-tained from the battery.
The required electric current is gener-ated by the magneto.
A good spark is available at the sparkplug even at low speed.
During starting, quality of spark ispoor due to low speed.
Efficiency of the system decreaseswith the reduction in spark intensityas engine speed rises.
Efficiency of the system improves asthe engine speed rises due to high in-tensity spark.
Occupies more space. Occupies less space.
Commonly employed in cars and lightcommercial vehicles.
Mainly used in racing cars and twowheelers.
short maintenance intervals. The life of the breaker points is dependent onthe current they are required to switch.
In order to overcome the above problems in the conventional ignition sys-tems modern ignition systems use electronic circuits. The ability of a transis-tor to interrupt a circuit carrying a relatively high current makes it an idealreplacement for the breaker points and condenser. One of the pioneering ver-sions was from Ford Motor Company in 1963 and many of the variations areavailable nowadays. In modern automobiles the following two types are incommon use.
(i) Transistorized coil ignition system (TCI system)
(ii) Capacitive discharge ignition system (CDI system)
The details of these ignition systems are explained in the following sections.
10.12.1 Transistorized Coil Ignition (TCI) System
In automotive applications, the transistorized coil ignition systems which pro-vide a higher output voltage and use electronic triggering to maintain therequired timing are fast replacing the conventional ignition systems. Thesesystems are also called high energy electronic ignition systems. These havethe following advantages:
(i) reduced ignition system maintenance
(ii) reduced wear of the components
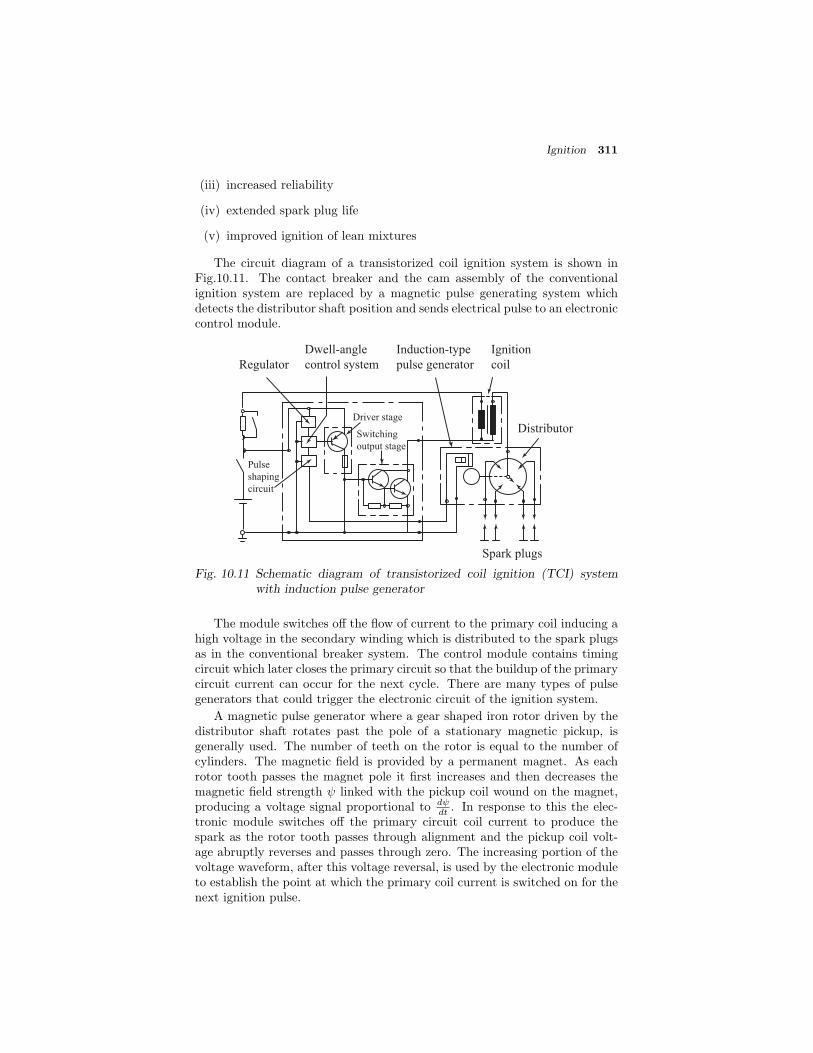
Ignition 311
(iii) increased reliability
(iv) extended spark plug life
(v) improved ignition of lean mixtures
The circuit diagram of a transistorized coil ignition system is shown inFig.10.11. The contact breaker and the cam assembly of the conventionalignition system are replaced by a magnetic pulse generating system whichdetects the distributor shaft position and sends electrical pulse to an electroniccontrol module.
Regulator
Dwell-angle
control system
Induction-type
pulse generator
Ignition
coil
Pulse
shaping
circuit
Driver stage
Switching
output stage
Distributor
Spark plugs
Fig. 10.11 Schematic diagram of transistorized coil ignition (TCI) systemwith induction pulse generator
The module switches off the flow of current to the primary coil inducing ahigh voltage in the secondary winding which is distributed to the spark plugsas in the conventional breaker system. The control module contains timingcircuit which later closes the primary circuit so that the buildup of the primarycircuit current can occur for the next cycle. There are many types of pulsegenerators that could trigger the electronic circuit of the ignition system.
A magnetic pulse generator where a gear shaped iron rotor driven by thedistributor shaft rotates past the pole of a stationary magnetic pickup, isgenerally used. The number of teeth on the rotor is equal to the number ofcylinders. The magnetic field is provided by a permanent magnet. As eachrotor tooth passes the magnet pole it first increases and then decreases themagnetic field strength ψ linked with the pickup coil wound on the magnet,producing a voltage signal proportional to dψ
dt . In response to this the elec-tronic module switches off the primary circuit coil current to produce thespark as the rotor tooth passes through alignment and the pickup coil volt-age abruptly reverses and passes through zero. The increasing portion of thevoltage waveform, after this voltage reversal, is used by the electronic moduleto establish the point at which the primary coil current is switched on for thenext ignition pulse.

312 IC Engines
10.12.2 Capacitive Discharge Ignition (CDI) System
The details of capacitive discharge ignition system are shown in Fig.10.12. Inthis system, a capacitor rather than an induction coil is used to store the igni-tion energy. The capacitance and charging voltage of the capacitor determinethe amount of stored energy. Ignition transformer steps up the primary volt-age generated at the time of spark by the discharge of the capacitor throughthe thyristor to the high voltage required at the spark plug. The CDI trigger
Charging device
Pulse maping circuit
To induction-type
pulse generator
To distributor
Control unit
Trigger box Ignition transformer
Fig. 10.12 Schematic of capacitive discharge ignition (CDI) system
box contains the capacitor, thyristor power switch, charging device (to convertbattery voltage to charging voltage of 300 to 500 V by means of pulses viaa voltage transformer), pulse shaping unit and control unit. The advantageof using this system is that it is insensitive to electrical shunts resulting fromspark plug fouling. Because of the fast capacitive discharge, the spark is strongbut short (0.1 to 0.3 ms) which leads to ignition failure during lean mixtureoperating conditions. This is the main disadvantage of the CDI system.
10.13 FIRING ORDER
Every engine cylinder must fire once in every cycle. This requires that fora four-stroke four-cylinder engine the ignition system must fire for every 180degrees of crank rotation. For a six-cylinder engine the time available is only120 degrees of crank rotation.
The order in which various cylinders of a multicylinder engine fire is calledthe firing order. The number of possibilities of firing order depends upon thenumber of cylinders and throws of the crankshaft. It is desirable to have thepower impulses equally spaced and from the point of view of balancing thishas led to certain conventional arrangements of crankshaft throws. Further,there are three factors which must be considered before deciding the optimumfiring order of an engine. These are:

Ignition 313
(i) engine vibrations
(ii) engine cooling and
(iii) development of back pressure
Consider that the cylinder number 1 of the four-cylinder engine, shown inFig.10.13, is fired first. Pressure, p, generated in the cylinder number 1 willgive rise to a force equal to pA[b/(a+b)] and pA[a/(a+b)] on the two bearingsA and B respectively. The load on bearing A is much more than load onbearing B. If the next cylinder fired is cylinder number 2, this imbalance inload on the two bearings would further aggravate the problem of balancing ofthe crankshaft vibrations. If we fire cylinder number 3 after cylinder number1, the load may be more or less evenly distributed.
a b
A 2 3
1 4
B
1
2
4
3
Fig. 10.13 Firing order
Further, consider the effect of firing sequence on engine cooling. When thefirst cylinder is fired its temperature increases. If the next cylinder that firesis number 2, the portion of the engine between the cylinder number 1 and 2gets overheated. If then the third cylinder is fired, overheating is shifted tothe portion between the cylinders 2 and 4. Thus we see that the task of thecooling system becomes very difficult because it is then, required to cool moreat one place than at other places and this imposes great strain on the coolingsystem. If the third cylinder is fired after the first the overheating problemcan be controlled to a greater extent.
Next, consider the flow of exhaust gases in the exhaust pipe. After firingthe first cylinder, exhaust gases flow out to the exhaust pipe. If the nextcylinder fired is the cylinder number 2, we find that before the gases exhaustedby the first cylinder go out of the exhaust pipe the gases exhausted from thesecond cylinder try to overtake them. This would require that the exhaustpipe be made bigger. Otherwise the back pressure in it would increase andthe possibility of back flow would arise. If instead of firing cylinder number2, cylinder number 3 is fired then by the time the gases exhausted by thecylinder 3 come into the exhaust pipe, the gases from cylinder 1 would havesufficient time to travel the distance between cylinder 1 and cylinder 3 andthus, the development of a high back pressure is avoided.
It should be noted that to some extent all the above three requirementsare conflicting and therefore a trade-off is necessary. For four-cylinder enginesthe possible firing orders are:
1− 3− 4− 2 or 1− 2− 4− 3
314 IC Engines
The former is more commonly used in the vertical configuration of cylin-ders. For a six-cylinder engine the firing orders can be:
1− 5− 3− 6− 2− 4 or 1− 5− 4− 6− 2− 3 or1− 2− 4− 6− 5− 3 or 1− 2− 3− 6− 5− 4
The first one is more commonly used.
10.14 IGNITION TIMING AND ENGINE PARAMETERS
In order to obtain maximum power from an engine, the compressed mixturemust deliver its maximum pressure at a time when the piston is about tocommence its downward stroke and is very close to TDC. Since, there is atime lag between occurrence of spark and the burning of the mixture the sparkmust take place before the piston reaches top dead centre on its compressionstroke. Usually the spark should occur at about 15 degrees bTDC. If thespark occurs too early the combustion takes place before the compressionstroke is completed and the pressure so developed would oppose the pistonmotion and thereby reduce the engine power. If the spark occurs too late, thepiston would have already completed a certain part of the expansion strokebefore the pressure rise occurs and a corresponding amount of engine poweris lost.
The correct instant for the introduction of a spark is mainly determinedby the ignition lag. The ignition lag depends on many factors, such as com-pression ratio, mixture strength, throttle opening, engine temperature, com-bustion chamber design and speed. Some of the important engine parametersaffecting the ignition timings are discussed in the following sections.
10.14.1 Engine Speed
Suppose an engine has got ignition advance of d degrees and operating speedis N rpm. Then time available for combustion is
d
360 Nmin
Now if the engine rpm is increased to 2N , then in order to have the sametime available for combustion an ignition advance of 2d degrees is required.Thus, if the combustion time for a given mixture strength, compression ratioand volumetric efficiency be assumed constant, then as the engine speed isincreased it will be necessary to advance the ignition progressively in order tofollow Upton’s rule for optimum advance. The variation of ignition advancerequired at different speeds is shown in Fig.10.14.
Figure 10.15 shows indicator diagrams taken for a petrol engine runningat 1000 and 2000 rpm respectively but with the ignition advance adjusted ineach case to give the maximum pressure peak at about 12 degrees after topdead centre. It is seen that at the higher speed a spark advance of 20 degreesis necessary as against 10 degrees at the lower speed. Corresponding delayperiods between the passage of the spark and commencement of pressure risewere 20 and 10 degrees respectively, i.e. proportional to the engine speeds.
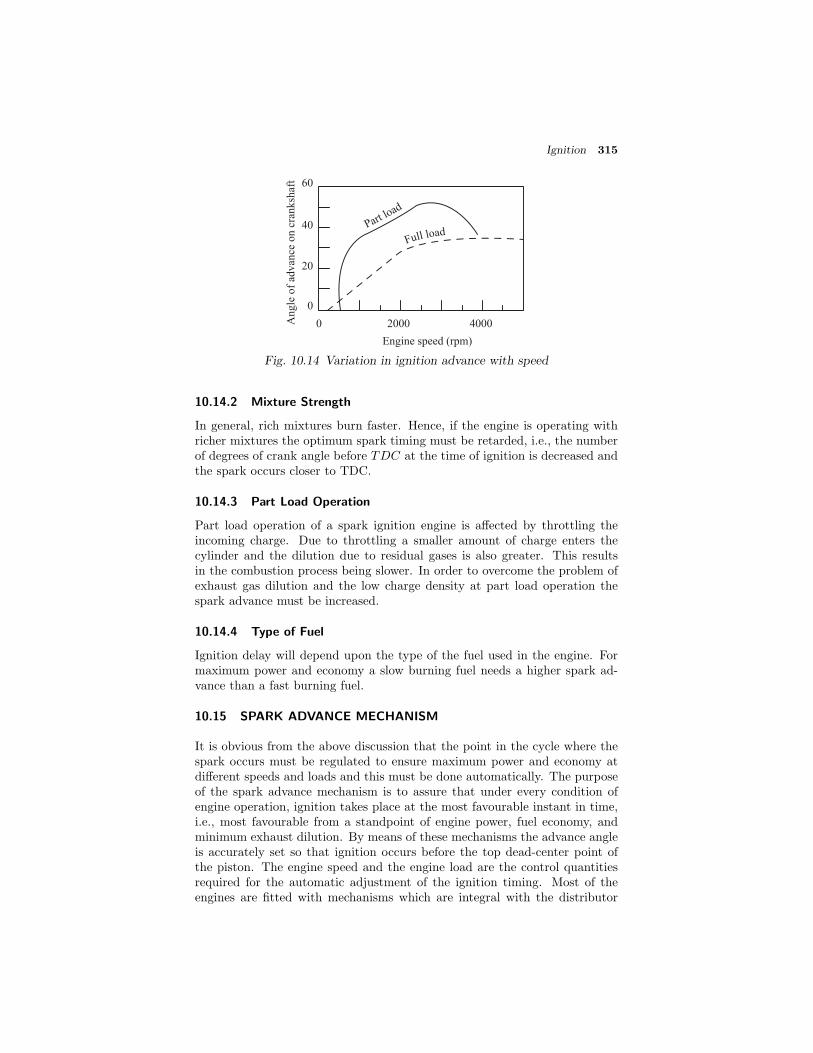
Ignition 315
0 2000 4000 Ang
le o
f ad
van
ce o
n c
rank
shaf
t
Engine speed (rpm)
0
20
40
60
Part load
Full load
Fig. 10.14 Variation in ignition advance with speed
10.14.2 Mixture Strength
In general, rich mixtures burn faster. Hence, if the engine is operating withricher mixtures the optimum spark timing must be retarded, i.e., the numberof degrees of crank angle before TDC at the time of ignition is decreased andthe spark occurs closer to TDC.
10.14.3 Part Load Operation
Part load operation of a spark ignition engine is affected by throttling theincoming charge. Due to throttling a smaller amount of charge enters thecylinder and the dilution due to residual gases is also greater. This resultsin the combustion process being slower. In order to overcome the problem ofexhaust gas dilution and the low charge density at part load operation thespark advance must be increased.
10.14.4 Type of Fuel
Ignition delay will depend upon the type of the fuel used in the engine. Formaximum power and economy a slow burning fuel needs a higher spark ad-vance than a fast burning fuel.
10.15 SPARK ADVANCE MECHANISM
It is obvious from the above discussion that the point in the cycle where thespark occurs must be regulated to ensure maximum power and economy atdifferent speeds and loads and this must be done automatically. The purposeof the spark advance mechanism is to assure that under every condition ofengine operation, ignition takes place at the most favourable instant in time,i.e., most favourable from a standpoint of engine power, fuel economy, andminimum exhaust dilution. By means of these mechanisms the advance angleis accurately set so that ignition occurs before the top dead-center point ofthe piston. The engine speed and the engine load are the control quantitiesrequired for the automatic adjustment of the ignition timing. Most of theengines are fitted with mechanisms which are integral with the distributor
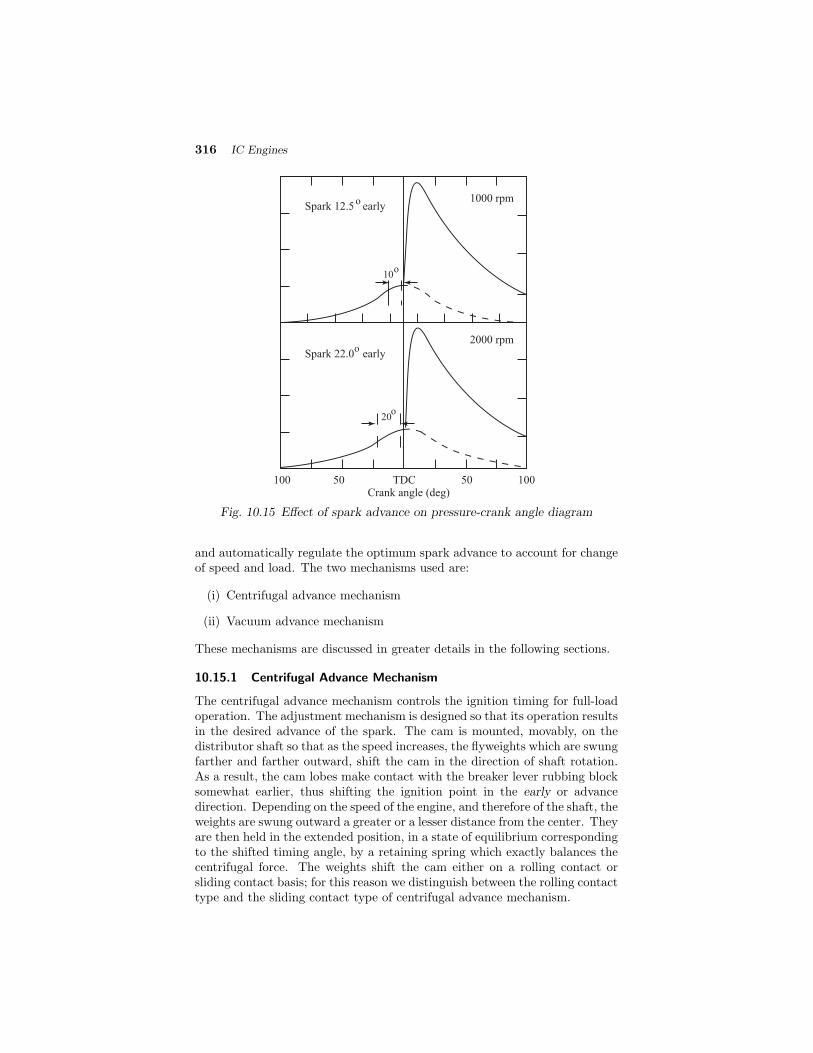
316 IC Engines
2000 rpm
1000 rpm
100 50 TDC 50 100
Spark 22.0 early
Spark 12.5 early
Crank angle (deg)
o
o
10o
20o
Fig. 10.15 Effect of spark advance on pressure-crank angle diagram
and automatically regulate the optimum spark advance to account for changeof speed and load. The two mechanisms used are:
(i) Centrifugal advance mechanism
(ii) Vacuum advance mechanism
These mechanisms are discussed in greater details in the following sections.
10.15.1 Centrifugal Advance Mechanism
The centrifugal advance mechanism controls the ignition timing for full-loadoperation. The adjustment mechanism is designed so that its operation resultsin the desired advance of the spark. The cam is mounted, movably, on thedistributor shaft so that as the speed increases, the flyweights which are swungfarther and farther outward, shift the cam in the direction of shaft rotation.As a result, the cam lobes make contact with the breaker lever rubbing blocksomewhat earlier, thus shifting the ignition point in the early or advancedirection. Depending on the speed of the engine, and therefore of the shaft, theweights are swung outward a greater or a lesser distance from the center. Theyare then held in the extended position, in a state of equilibrium correspondingto the shifted timing angle, by a retaining spring which exactly balances thecentrifugal force. The weights shift the cam either on a rolling contact orsliding contact basis; for this reason we distinguish between the rolling contacttype and the sliding contact type of centrifugal advance mechanism.

Ignition 317
The beginning of the timing adjustment in the range of low engine speedsand the continued adjustment based on the full load curve are determinedby the size of the weights, by the shape of the contact mechanisms (rollingor sliding contact type), and by the retaining springs, all of which can bewidely differing designs. The centrifugal force controlled cam is fitted witha lower limit stop for purposes of setting the beginning of the adjustment,and also with an upper limit stop to restrict the greatest possible full-loadadjustment. A typical sliding contact type centrifugal advance mechanism isshown in Fig.10.16(a) and (b).
Weight return spring Fly weight
Yoke Support plate
Cam
(a) (b)
Fig. 10.16 Sliding contact type centrifugal advance mechanism
10.15.2 Vacuum Advance Mechanism
Vacuum advance mechanism shifts the ignition point under part load opera-tion. The adjustment system is designed so that its operation results in theprescribed part-load advance curve. In this mechanism the adjustment controlquantity is the static vacuum prevailing in the carburettor, a pressure whichdepends on the position of the throttle valve at any given time and which isat a maximum when this valve is about half open. This explains the vacuummaximum.
The diaphragm of a vacuum unit is moved by changes in gas pressure. Theposition of this diaphragm is determined by the pressure differential at anygiven moment between the prevailing vacuum and atmospheric pressure. Thebeginning of adjustment is set by the pre-established tension on a compressionspring. The diaphragm area, the spring force, and the spring rigidity are allselected in accordance with the part-load advance curve which is to be followedand are all balanced with respect to each other. The diaphragm movement istransmitted through a vacuum advance arm connected to the movable breakerplate, and this movement shifts the breaker plate an additional amount underpart-load conditions in a direction opposite to the direction of rotation of thedistributor shaft. Limit stops on the vacuum advance arm in the base of thevacuum unit restrict the range of adjustment.

318 IC Engines
The vacuum advance mechanism operates independent of the centrifu-gal advance mechanism. The mechanical interplay between the two advancemechanisms, however, permits the total adjustment angle at any given timeto be the result of the addition of the shifts provided by the two individ-ual mechanisms. In other words, the vacuum advance mechanism operatesin conjunction with the centrifugal advance mechanism to provide the totaladjustment required when the engine is operating under part load. A typicalvacuum advance mechanism is shown in Fig.10.17.
Movable breaker plate
Vacuum unit
Diaphragm
Compression ring
Vacuum advance arm
Hose connection
Fig. 10.17 Vacuum advance mechanism
10.16 IGNITION TIMING AND EXHAUST EMISSIONS
Idling, deceleration and running rich with closed throttle are some engine op-erating conditions which produce excessive unburnt hydrocarbons and carbonmonoxide in exhaust. The emission quality is greatly affected by the ignitiontiming as shown in Fig.10.18.
Emission control timing
Tim
ing
advan
ce
Standard timing
Vacuum advance curve
Centrifugal advance curve
TDC
Fig. 10.18 Typical distributor advance curve for lower HC and CO exhaustemission
Ignition 319
Retarding ignition timing at idle tends to reduce exhaust emission in twoways. With retarded timing, exhaust gas temperatures are higher (fuel econ-omy is adversely affected), thereby promoting additional burning of the hydro-carbons in the exhaust manifold. Since engine efficiency is reduced, retardedtiming requires a slightly larger throttle opening to maintain the same idlespeed. The larger throttle opening means the possibility of better mixingand combustion during idling. This reduces exhaust emissions appreciablyespecially during deceleration.
Review Questions
10.1 What is meant by ignition? What is the interrelation between ignitionand combustion?
10.2 What are various types of ignition system that are commonly used?
10.3 Explain the basic energy requirements for spark ignition.
10.4 What is capacitance spark and how is it produced?
10.5 With a neat sketch explain an induction coil.
10.6 How does gas movement affect spark-ignition?
10.7 Comment on the spark energy and its duration in the initiation of com-bustion.
10.8 What are the important requirements of the high voltage ignition sourcefor the spark-ignition process?
10.9 What are the two conventional types of ignition systems that are nor-mally used in automobiles?
10.10 Mention the various important qualities of a good ignition system.
10.11 With a neat sketch explain the battery ignition system.
10.12 Explain TCI ignition system with a sketch.
10.13 Explain CDI ignition system with a suitable diagram.
10.14 With a neat sketch explain the magneto ignition system.
10.15 What is the main function of a spark plug? Draw a neat sketch of aspark plug and explain its various parts.
10.16 Explain the details of firing order.
10.17 Briefly discuss the various factors which affect the ignition timing.
10.18 Why spark advance is required? Explain.
10.19 Briefly explain the centrifugal advance mechanism.
10.20 Explain with a neat sketch the vacuum advance mechanism.

320 IC Engines
Multiple Choice Questions (choose the most appropriate answer)
1. The secondary winding of ignition coil consists of
(a) few turns of fine wire
(b) few turns of thick wire
(c) many turns of fine wire
(d) many turns of thick wire
2. Dwell is the time
(a) for which the points remain closed
(b) for which the points remain open
(c) time during which inlet and exhaust valves are open
(d) none of the above
3. Dwell period
(a) is directly proportional to engine speed
(b) is inversely proportional to engine speed
(c) does not depend on engine speed
(d) none of the above
4. If the contact breaker gap is small, it results in
(a) advanced timing
(b) increased dwell
(c) rapid burning of the pointer gaps
(d) none of the above
5. For a four cylinder engine operating at N rpm, the contact breaker mustmake and break the circuit
(a) N times
(b) 2N times
(c) N2 times
(d) none of the above
6. Contact breaker should be set
(a) just before starting the engine
(b) before adjustment of dwell angle
(c) after adjustment of dwell angle
(d) before setting spark plug gap
Ignition 321
7. Dwell meter is used for
(a) setting spark plug gap
(b) contact breaker gap
(c) setting the ignition advance
(d) setting
8. For a four cylinder vertical engine, the commonly used firing order is
(a) 1–2–3–4
(b) 3–4–1–2
(c) 1–3–4–2
(d) 4–3–2–1
9. For engine operating with rich mixtures the optimum spark timing
(a) must be advanced
(b) must be retarded
(c) must be at TDC
(d) none of the above
10. For peak lead operation, the spark advance
(a) must be decreased
(b) must be increased
(c) need not be altered
(d) none of the above
11. Ignition timing is adjusted by
(a) tachometer
(b) stroboscopic light
(c) stop watch
(d) accurate clock
12. Vacuum advance mechanism shifts the ignition point under
(a) no load operation
(b) full load operation
(c) part load operation
(d) under sudden acceleration
322 IC Engines
13. Which of the following statement is wrong?
(a) retarded timing causes exhaust gas temperature to be higher
(b) retarded timing improves fuel economy
(c) retarded timing requires slightly longer throttle opening
(d) retarded timing causes burning of the hydrocarbons in the exhaust
14. Choose the correct statement from the following
(a) maintenance problem in magneto-ignition system is more
(b) magneto ignition system occupies more space
(c) magneto ignition system is used in larger four wheelers
(d) magneto ignition system has poor quality of spark during starting
15. Battery ignition system
(a) occupies more space
(b) has more maintenance problem
(c) is commonly employed in four wheelers
(d) all of the above
Ans: 1. – (c) 2. – (a) 3. – (b) 4. – (c) 5. – (b)6. – (c) 7. – (b) 8. – (c) 9. – (a) 10. – (b)
11. – (b) 12. – (c) 13. – (b) 14. – (d) 15. – (d)

11COMBUSTION AND
COMBUSTION
CHAMBERS
11.1 INTRODUCTION
Combustion is a chemical reaction in which certain elements of the fuel likehydrogen and carbon combine with oxygen liberating heat energy and causingan increase in temperature of the gases. The conditions necessary for com-bustion are the presence of combustible mixture and some means of initiatingthe process. The theory of combustion is a very complex subject and hasbeen a topic of intensive research for many years. In spite of this, not muchknowledge is available concerning the phenomenon of combustion.
The process of combustion in engines generally takes place either in ahomogeneous or a heterogeneous fuel vapour-air mixture depending on thetype of engine.
11.2 HOMOGENEOUS MIXTURE
In spark-ignition engines a nearly homogeneous mixture of air and fuel isformed in the carburettor. Homogeneous mixture is thus formed outside theengine cylinder and the combustion is initiated inside the cylinder at a par-ticular instant towards the end of the compression stroke. The flame frontspreads over a combustible mixture with a certain velocity. In a homoge-neous gas mixture the fuel and oxygen molecules are more or less, uniformlydistributed.
Once the fuel vapour-air mixture is ignited, a flame front appears andrapidly spreads through the mixture. The flame propagation is caused byheat transfer and diffusion of burning fuel molecules from the combustionzone to the adjacent layers of unburnt mixture. The flame front is a narrowzone separating the fresh mixture from the combustion products. The velocitywith which the flame front moves, with respect to the unburned mixture in adirection normal to its surface is called the normal flame velocity.
In a homogeneous mixture with an equivalence ratio, φ, (the ratio of theactual fuel-air ratio to the stoichiometric fuel-air ratio) close to 1.0, the flamespeed is normally of the order of 40 cm/s. However, in a spark-ignition enginethe maximum flame speed is obtained when φ is between 1.1 and 1.2, i.e.,when the mixture is slightly richer than stoichiometric.
If the equivalence ratio is outside this range the flame speed drops rapidlyto a low value. When the flame speed drops to a very low value, the heat

324 IC Engines
loss from the combustion zone becomes equal to the amount of heat-releasedue to combustion and the flame gets extinguished. Therefore, it is quitepreferable to operate the engine within an equivalence ratio of 1.1 to 1.2 forproper combustion. However, by introducing turbulence and incorporatingproper air movement, the flame speed can be increased in mixtures outsidethe above range.
11.3 HETEROGENEOUS MIXTURE
In a heterogeneous gas mixture, the rate of combustion is determined by thevelocity of mutual diffusion of fuel vapours and air and the rate of chemicalreaction is of minor importance. Self-ignition or spontaneous ignition of fuel-air mixture, at the high temperature developed due to higher compressionratios, is of primary importance in determining the combustion characteristics.
When the mixture is heterogeneous the combustion can take place in anoverall lean mixture since, there are always local zones where φ varies be-tween 1.0 and 1.2 corresponding to maximum rate of chemical reaction. Ig-nition starts in this zone and the flame produced helps to burn the fuel inthe adjoining zones where the mixture is leaner. Similarly, in the zones wherethe mixture is rich the combustion occurs because of the high temperatureproduced due to combustion initiated in the zones where φ is 1.0 to 1.2.
A comprehensive study of combustion in both spark-ignition and compression-ignition engines is given in the following sections.
11.4 COMBUSTION IN SPARK–IGNITION ENGINES
As already mentioned, in a conventional spark-ignition engine, the fuel andair are homogeneously mixed together in the intake system, inducted throughthe intake valve into the cylinder where it mixes with residual gases and isthen compressed. Under normal operating conditions, combustion is initiatedtowards the end of the compression stroke at the spark plug by an electricdischarge. A turbulent flame develops following the ignition and propagatesthrough this premixed charge of fuel and air, and also the residual gas in theclearance volume until it reaches the combustion chamber walls. Combustionin the SI engine may be broadly divided into two general types, viz., normalcombustion and abnormal combustion.
11.5 STAGES OF COMBUSTION IN SI ENGINES
A typical theoretical pressure-crank angle diagram, during the process of com-pression (a→b), combustion (b→c) and expansion (c→d) in an ideal four-stroke spark-ignition engine is shown in Fig.11.1. In an ideal engine, as canbe seen from the diagram, the entire pressure rise during combustion takesplace at constant volume i.e., at TDC. However, in an actual engine thisdoes not happen. The detailed process of combustion in an actual SI engineis described below.
Sir Ricardo, known as the father of engine research, describes the combus-tion process in a SI engine as consisting of three stages:
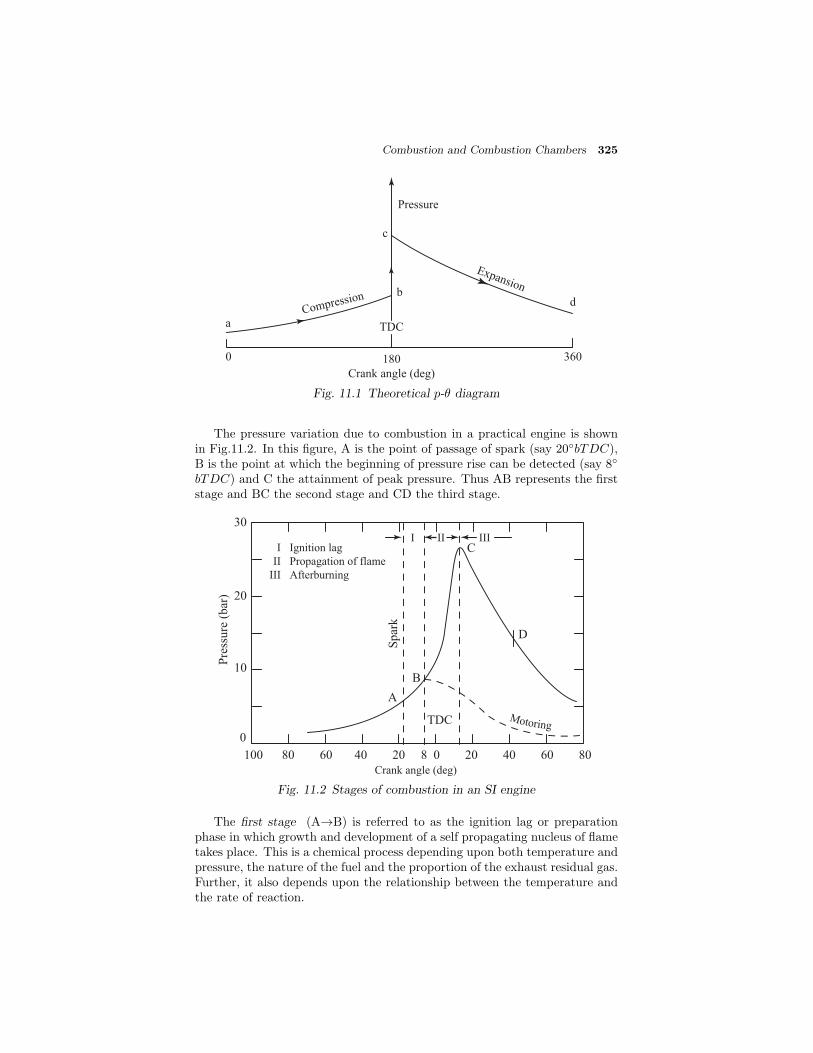
Combustion and Combustion Chambers 325
0 180 360
Crank angle (deg)
aCompression
TDC
Expansion
db
c
Pressure
Fig. 11.1 Theoretical p-θ diagram
The pressure variation due to combustion in a practical engine is shownin Fig.11.2. In this figure, A is the point of passage of spark (say 20◦bTDC),B is the point at which the beginning of pressure rise can be detected (say 8◦
bTDC) and C the attainment of peak pressure. Thus AB represents the firststage and BC the second stage and CD the third stage.
100 80 60 40 20 8 0 20 40 60 80
0
10
20
30
Pre
ssure
(bar
)
Spar
k
A
B
C
D
I II III
Crank angle (deg)
TDC
I
II
III
Ignition lag
Propagation of flame
Afterburning
Motoring
Fig. 11.2 Stages of combustion in an SI engine
The first stage (A→B) is referred to as the ignition lag or preparationphase in which growth and development of a self propagating nucleus of flametakes place. This is a chemical process depending upon both temperature andpressure, the nature of the fuel and the proportion of the exhaust residual gas.Further, it also depends upon the relationship between the temperature andthe rate of reaction.

326 IC Engines
The second stage (B→C) is a physical one and it is concerned with thespread of the flame throughout the combustion chamber. The starting pointof the second stage is where the first measurable rise of pressure is seen on theindicator diagram i.e., the point where the line of combustion departs fromthe compression line (point B). This can be seen from the deviation from themotoring curve.
During the second stage the flame propagates practically at a constantvelocity. Heat transfer to the cylinder wall is low, because only a small part ofthe burning mixture comes in contact with the cylinder wall during this period.The rate of heat-release depends largely on the turbulence intensity and alsoon the reaction rate which is dependent on the mixture composition. The rateof pressure rise is proportional to the rate of heat-release because during thisstage, the combustion chamber volume remains practically constant (sincepiston is near the top dead centre).
The starting point of the third stage is usually taken as the instant atwhich the maximum pressure is reached on the indicator diagram (point C).The flame velocity decreases during this stage. The rate of combustion be-comes low due to lower flame velocity and reduced flame front surface. Sincethe expansion stroke starts before this stage of combustion, with the pistonmoving away from the top dead centre, there can be no pressure rise duringthis stage.
11.6 FLAME FRONT PROPAGATION
For efficient combustion the rate of propagation of the flame front within thecylinder is quite critical. The two important factors which determine therate of movement of the flame front across the combustion chamber are thereaction rate and the transposition rate. The reaction rate is the result of apurely chemical combination process in which the flame eats its way into theunburned charge. The transposition rate is due to the physical movementof the flame front relative to the cylinder wall and is also the result of thepressure differential between the burning gases and the unburnt gases in thecombustion chamber.
Figure 11.3 shows the rate of flame propagation. In area I, (A→B), theflame front progresses relatively slowly due to a low transposition rate andlow turbulence. The transposition of the flame front is very little since thereis a comparatively small mass of charge burned at the start. The low reactionrate plays a dominant role resulting in a slow advance of the flame. Also,since the spark plug is to be necessarily located in a quiescent layer of gasthat is close to the cylinder wall, the lack of turbulence reduces the reactionrate and hence the flame speed. As the flame front leaves the quiescent zoneand proceeds into more turbulent areas (area II) where it consumes a greatermass of mixture, it progresses more rapidly and at a constant rate (B→C) asshown in Fig.11.3.
The volume of unburned charge is very much less towards the end of flametravel and so the transposition rate again becomes negligible thereby reducingthe flame speed. The reaction rate is also reduced again since the flame isentering a zone (area III) of relatively low turbulence (C→D) in Fig.11.3.
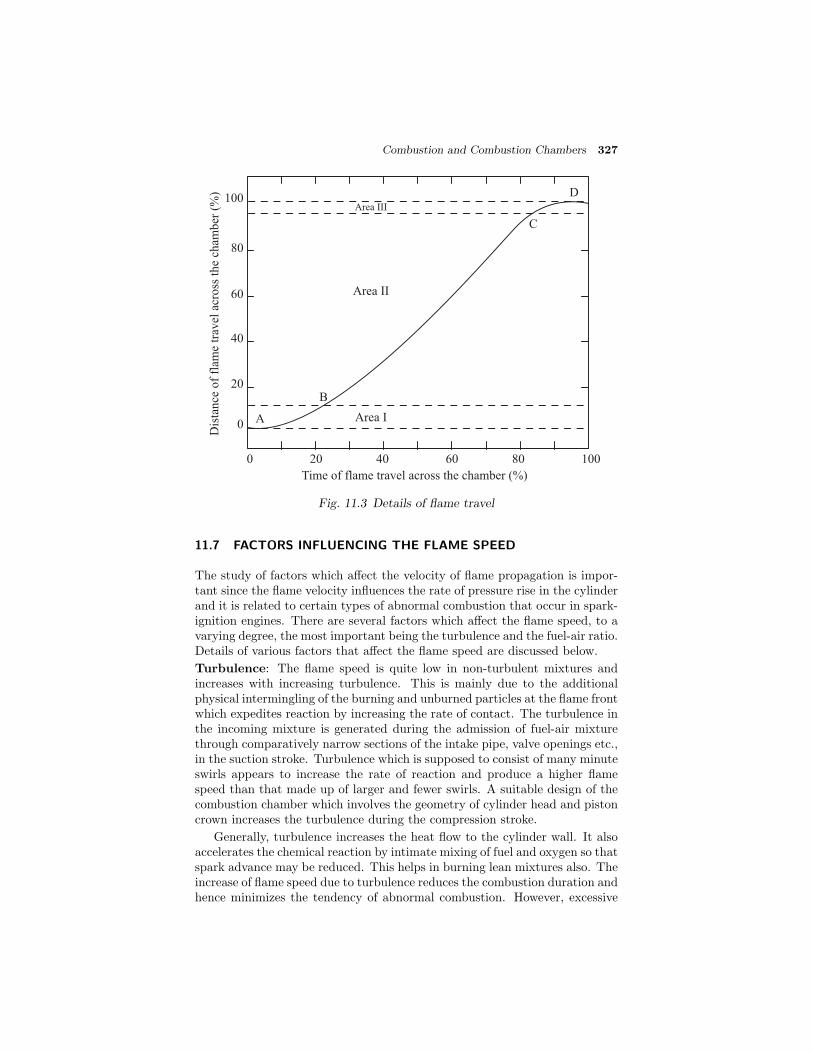
Combustion and Combustion Chambers 327
0 20 40 60 80 100
100
80
60
40
20
0 A
B
Area II
Area III
C
D
Time of flame travel across the chamber (%)
Area I
Dis
tance
of
flam
e tr
avel
acr
oss
the
cham
ber
(%
)
Fig. 11.3 Details of flame travel
11.7 FACTORS INFLUENCING THE FLAME SPEED
The study of factors which affect the velocity of flame propagation is impor-tant since the flame velocity influences the rate of pressure rise in the cylinderand it is related to certain types of abnormal combustion that occur in spark-ignition engines. There are several factors which affect the flame speed, to avarying degree, the most important being the turbulence and the fuel-air ratio.Details of various factors that affect the flame speed are discussed below.
Turbulence: The flame speed is quite low in non-turbulent mixtures andincreases with increasing turbulence. This is mainly due to the additionalphysical intermingling of the burning and unburned particles at the flame frontwhich expedites reaction by increasing the rate of contact. The turbulence inthe incoming mixture is generated during the admission of fuel-air mixturethrough comparatively narrow sections of the intake pipe, valve openings etc.,in the suction stroke. Turbulence which is supposed to consist of many minuteswirls appears to increase the rate of reaction and produce a higher flamespeed than that made up of larger and fewer swirls. A suitable design of thecombustion chamber which involves the geometry of cylinder head and pistoncrown increases the turbulence during the compression stroke.
Generally, turbulence increases the heat flow to the cylinder wall. It alsoaccelerates the chemical reaction by intimate mixing of fuel and oxygen so thatspark advance may be reduced. This helps in burning lean mixtures also. Theincrease of flame speed due to turbulence reduces the combustion duration andhence minimizes the tendency of abnormal combustion. However, excessive
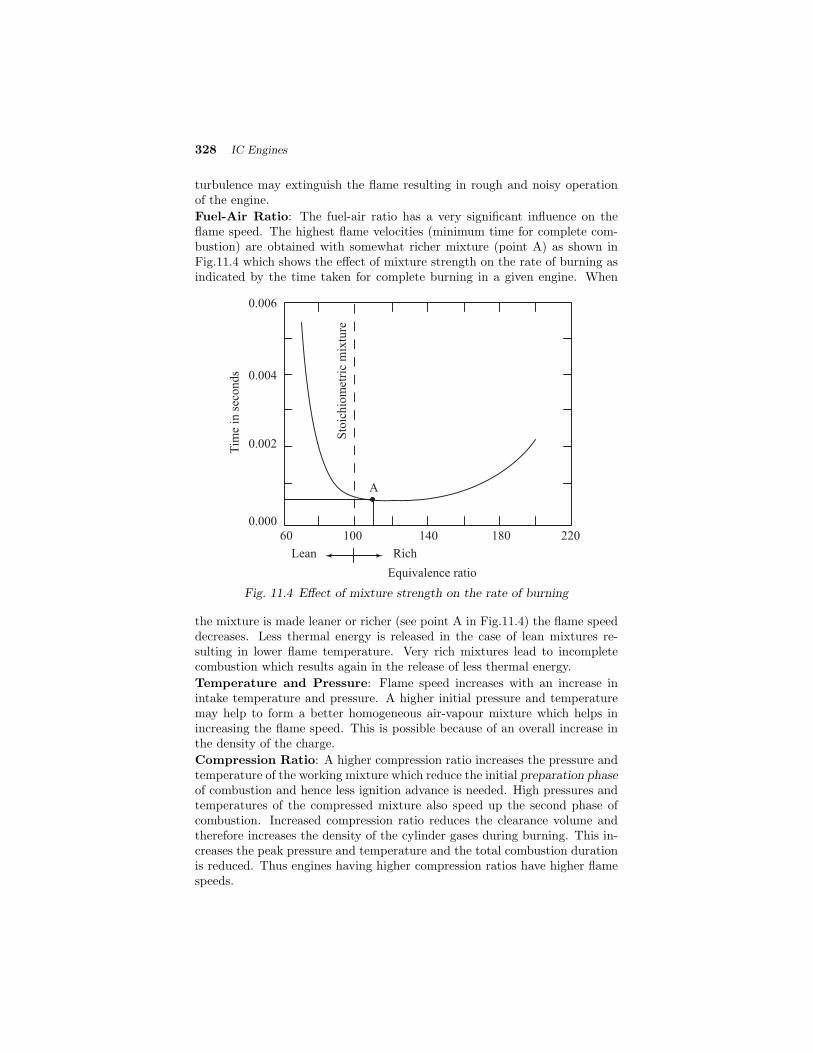
328 IC Engines
turbulence may extinguish the flame resulting in rough and noisy operationof the engine.
Fuel-Air Ratio: The fuel-air ratio has a very significant influence on theflame speed. The highest flame velocities (minimum time for complete com-bustion) are obtained with somewhat richer mixture (point A) as shown inFig.11.4 which shows the effect of mixture strength on the rate of burning asindicated by the time taken for complete burning in a given engine. When
60 100 140 180 220
Tim
e in
sec
onds
A
Sto
ichio
met
ric
mix
ture
0.006
0.004
0.002
0.000
Lean Rich
Equivalence ratio
Fig. 11.4 Effect of mixture strength on the rate of burning
the mixture is made leaner or richer (see point A in Fig.11.4) the flame speeddecreases. Less thermal energy is released in the case of lean mixtures re-sulting in lower flame temperature. Very rich mixtures lead to incompletecombustion which results again in the release of less thermal energy.
Temperature and Pressure: Flame speed increases with an increase inintake temperature and pressure. A higher initial pressure and temperaturemay help to form a better homogeneous air-vapour mixture which helps inincreasing the flame speed. This is possible because of an overall increase inthe density of the charge.
Compression Ratio: A higher compression ratio increases the pressure andtemperature of the working mixture which reduce the initial preparation phaseof combustion and hence less ignition advance is needed. High pressures andtemperatures of the compressed mixture also speed up the second phase ofcombustion. Increased compression ratio reduces the clearance volume andtherefore increases the density of the cylinder gases during burning. This in-creases the peak pressure and temperature and the total combustion durationis reduced. Thus engines having higher compression ratios have higher flamespeeds.

Combustion and Combustion Chambers 329
Engine Output: The cycle pressure increases when the engine output isincreased. With the increased throttle opening the cylinder gets filled to ahigher density. This results in increased flame speed. When the output isdecreased by throttling, the initial and final compression pressures decreaseand the dilution of the working mixture increases. The smooth development ofself-propagating nucleus of flame becomes unsteady and difficult. The maindisadvantages of SI engines are the poor combustion at low loads and thenecessity of mixture enrichment (φ between 1.2 to 1.3) which causes wastageof fuel and discharge of unburnt hydrocarbon and the products of incompletecombustion like carbon monoxide etc. in the atmosphere.
Engine Speed: The flame speed increases almost linearly with engine speedsince the increase in engine speed increases the turbulence inside the cylinder.The time required for the flame to traverse the combustion space would behalved, if the engine speed is doubled. Double the engine speed and hencehalf the original time would give the same number of crank degrees for flamepropagation. The crank angle required for the flame propagation during theentire phase of combustion, will remain nearly constant at all speeds.
Engine Size: The size of the engine does not have much effect on the rate offlame propagation. In large engines the time required for complete combus-tion is more because the flame has to travel a longer distance. This requiresincreased crank angle duration during the combustion. This is one of thereasons why large sized engines are designed to operate at low speeds.
11.8 RATE OF PRESSURE RISE
The rate of pressure rise in an engine combustion chamber exerts a consider-able influence on the peak pressure developed, the power produced and thesmoothness with which the forces are transmitted to the piston. The rate ofpressure rise is mainly dependent upon the mass rate of combustion of mixturein the cylinder.
The relationship between the pressure and the crank angle for three dif-ferent combustion rates is shown in Fig.11.5. Curve I is for a high, curve IIfor the normal and curve III for a low rate of combustion. It is clear from thefigure that with lower rate of combustion longer time is required for the com-pletion of combustion which necessitates the initiation of burning at an earlypoint on the compression stroke. Also, it may be noted that higher rate ofcombustion results in higher rate of pressure rise producing higher peak pres-sures at a point closer to TDC. This generally is a desirable feature becausehigher peak pressures closer to TDC produce a greater force acting througha large part of the power stroke and hence, increase the power output of theengine. The higher rate of pressure rise causes rough running of the enginebecause of vibrations produced in the crankshaft rotation. It also tends topromote an undesirable occurrence known as knocking.
A compromise between these opposing factors is accomplished by designingand operating the engine in such a manner that approximately one-half of themaximum pressure is reached by the time the piston reaches TDC. Thisresults in the peak pressure being reasonably close to the beginning of thepower stroke, yet maintaining smooth engine operation.

330 IC Engines
120 80 40 TDC 40 80 120
Before TDC After TDC
Crank angle (deg)
Compression Power
Motoring curve
Low rate - III
Normal rate - II
High rate - I
Peak pressure
Pre
ssure
(bar
)Start of pressure rise
Rate of pressure rise
indicated by the slope of
the curves between start
of pressure rise and the
peak pressure
30
20
10
0
*
*
*
*
Fig. 11.5 Illustrations of various combustion rates
11.9 ABNORMAL COMBUSTION
In normal combustion, the flame initiated by the spark travels across thecombustion chamber in a fairly uniform manner. Under certain operatingconditions the combustion deviates from its normal course leading to loss ofperformance and possible damage to the engine. This type of combustion maybe termed as an abnormal combustion or knocking combustion. The conse-quences of this abnormal combustion process are the loss of power, recurringpreignition and mechanical damage to the engine.
11.10 THE PHENOMENON OF KNOCK IN SI ENGINES
In a spark-ignition engine combustion which is initiated between the sparkplug electrodes spreads across the combustible mixture. A definite flame frontwhich separates the fresh mixture from the products of combustion travelsfrom the spark plug to the other end of the combustion chamber. Heat-releasedue to combustion increases the temperature and consequently the pressure, ofthe burned part of the mixture above those of the unburned mixture. In orderto effect pressure equalization the burned part of the mixture will expand, andcompress the unburned mixture adiabatically thereby increasing its pressureand temperature. This process continues as the flame front advances throughthe mixture and the temperature and pressure of the unburned mixture areincreased further.
If the temperature of the unburnt mixture exceeds the self-ignition temper-ature of the fuel and remains at or above this temperature during the period

Combustion and Combustion Chambers 331
of preflame reactions (ignition lag), spontaneous ignition or autoignition oc-curs at various pin-point locations. This phenomenon is called knocking. Theprocess of autoignition leads towards engine knock.
Normal combustion
A
B
D
B'
(a)
A
B
D
B'C'
C
(c)
Combustion with detonation
Pre
ssure
(d)
BDC TDC BDC
Time
Pre
ssure
(b)
BDC TDC BDC
Time
.Ignition
.Ignition
Fig. 11.6 Normal and abnormal combustion
The phenomenon of knock may be explained by referring to Fig.11.6(a)which shows the cross-section of the combustion chamber with flame advanc-ing from the spark plug location A without knock whereas Fig.11.6(c) showsthe combustion process with knock. In the normal combustion the flame trav-els across the combustion chamber from A towards D. The advancing flamefront compresses the end charge BB D farthest from the spark plug, thusraising its temperature. The temperature is also increased due to heat trans-fer from the hot advancing flame-front. Also some preflame oxidation maytake place in the end charge leading to further increase in temperature. Inspite of these factors if the temperature of the end charge had not reachedits self-ignition temperature, the charge would not autoignite and the flamewill advance further and consume the charge BB D. This is the normal com-bustion process which is illustrated by means of the pressure-time diagram,Fig.11.6(b). However, if the end charge BB D reaches its autoignition tem-perature and remains upto the time of preflame reactions the charge willautoignite, leading to knocking combustion. In Fig.11.6(c), it is assumed thatwhen flame has reached the position BB , the charge ahead of it has reachedcritical autoignition temperature. During the preflame reaction period if theflame front could move from BB to only CC then the charge ahead of CC
would autoignite.

332 IC Engines
Because of the autoignition, another flame front starts traveling in theopposite direction to the main flame front. When the two flame fronts collide,a severe pressure pulse is generated. The gas in the chamber is subjectedto compression and rarefaction along the pressure pulse until pressure equi-librium is restored. This disturbance can force the walls of the combustionchambers to vibrate at the same frequency as the gas. Gas vibration frequencyin automobile engines is of the order of 5000 cps. The pressure-time trace ofsuch a situation is shown in Fig.11.6(d).
It is to be noted that the onset of knocking is very much dependent on theproperties of fuel. It is clear from the above description that if the unburnedcharge does not reach its autoignition temperature there will be no knocking.Further, if the initial phase i.e., ignition lag period, is longer than the timerequired for the flame front to burn through the unburned charge, there willbe no knocking. But, if the critical temperature is reached and maintained,and the ignition lag is shorter than the time it takes for the flame front toburn through the unburned charge then the end charge will detonate. Hence,in order to avoid or inhibit detonation, a high autoignition temperature anda long ignition lag are the desirable qualities for SI engine fuels.
In summary, when autoignition occurs, two different types of vibrationmay be produced. In one case a large amount of mixture may autoignitegiving rise to a very rapid increase in pressure throughout the combustionchamber and there will be a direct blow on the engine structure. The humanear can detect the resulting thudding sound and consequent noise from freevibrations of the engine parts. In the other case, large pressure differencesmay exist in the combustion chamber and the resulting gas vibrations canforce the walls of the chamber to vibrate at the same frequency as the gas.An audible sound may be evident.
The impact of knock on the engine components and structure can causeengine failure and in addition the noise from engine vibration is always ob-jectionable. The pressure differences in the combustion chamber cause thegas to vibrate and scrub the chamber walls causing increased loss of heat tothe coolant. The presence or absence of knocking combustion in engines isoften judged from a distinctly audible sound. A scientific method to detectthe phenomenon of knocking is to use a pressure transducer. The output ofthis transducer is connected, usually, to a cathode ray oscilloscope. Typicalpressure-time traces which can be obtained from a pressure transducer aregiven in Fig.11.6(b) for a normal combustion and in Fig.11.6(d) for knockingcombustion.
11.10.1 Knock Limited Parameters
It should be the aim of the designer to reduce the tendency of knocking in theengine. In this connection, certain knock limited parameters are explained.
Knock Limited Compression Ratio: The knock limited compression ratiois obtained by increasing the compression ratio on a variable compressionratio engine until incipient knocking is observed. Any change in operatingconditions such as fuel-air ratio or in the engine design that increases the knock

Combustion and Combustion Chambers 333
limited compression ratio is said to reduce the tendency towards knocking.
Knock Limited Inlet Pressure: The inlet pressure can be increased byopening the throttle or increasing supercharger delivery pressure until incip-ient knock is observed. An increase in knock limited inlet pressure indicatesa reduction in the knocking tendency.
Knock Limited Indicated Mean Effective Pressure: The indicatedmean effective pressure measured at incipient knock is usually abbreviatedas Klimep. This parameter and the corresponding fuel consumption are ob-viously of great practical interest.
An useful measure of knocking tendency called the performance number,has been developed from the concept of knock limited indicated mean effectivepressure. This number is defined as the ratio of Klimep with the fuel in ques-tion to Klimep with iso-octane when the inlet pressure is kept constant. Thisperformance number is related to octane number and one of the advantagesof this is that it can be applied to fuels whose knocking characteristics aresuperior to that of iso-octane, i.e., it extends the octane scale beyond 100.
Further simplification on the use of performance number requirements isdone by introducing the concept of relative performance number, rpn, whichis defined as:
rpn =Actual Performance number
Performance number corresponding to the imep of 100
11.11 EFFECT OF ENGINE VARIABLES ON KNOCK
From the discussion on knock in the previous section, it may be seen that fourmajor factors are involved in either producing or preventing knock. Theseare the temperature, pressure, density of the unburned charge and the timefactors. Since, the effect of temperature, pressure and density are closelyinterrelated, these three are consolidated into one group and the time factorsinto another group.
11.11.1 Density Factors
Any factor in the design or operation of an engine which tends to reduce thetemperature of the unburned charge should reduce the possibility of knockingby reducing the temperature of the end charge for autoignition. Similarly, anyfactor which reduces the density of the charge tends to reduce knocking byproviding lower energy release. Further, the effect of the following parameterswhich are directly or indirectly connected with temperature, pressure anddensity factors on the possibility of knocking is discussed below.
Compression Ratio: Compression ratio of an engine is an important fac-tor which determines both the pressure and temperature at the beginning ofthe combustion process. Increase in compression ratio increases the pressureand temperature of the gases at the end of the compression stroke. This de-creases the ignition lag of the end gas and thereby increasing the tendencyfor knocking. The overall increase in the density of the charge due to highercompression ratio increases the preflame reactions in the end charge therebyincreasing the knocking tendency of the engine. The increase in the knocking
334 IC Engines
tendency of the engine with increasing compression ratio is the main reasonfor limiting the compression ratio to a lower value.
Mass of Inducted Charge: A reduction in the mass of the inducted chargeinto the cylinder of an engine by throttling or by reducing the amount ofsupercharging reduces both temperature and density of the charge at thetime of ignition. This decreases the tendency of knocking.
Inlet Temperature of the Mixture: Increase in the inlet temperatureof the mixture makes the compression temperature higher thereby, increas-ing the tendency of knocking. Further, volumetric efficiency will be lowered.Hence, a lower inlet temperature is always preferable to reduce knocking. Itis important that the temperature should not be so low as to cause startingand vaporization problems in the engine.
Temperature of the Combustion Chamber Walls: Temperature of thecombustion chamber walls play a predominant role in knocking. In order toprevent knocking the hot spots in the combustion chamber should be avoided.Since, the spark plug and exhaust valve are two hottest parts in the combus-tion chamber, the end gas should not be compressed against them.
Retarding the Spark Timing: By retarding the spark timing from theoptimized timing, i.e., having the spark closer to TDC, the peak pressuresare reached farther down on the power stroke and are thus of lower magnitude.This might reduce the knocking. However, the spark timing will be differentfrom the MBT timing. This will affect the brake torque and power output ofthe engine.
Power Output of the Engine: A decrease in the output of the enginedecreases the temperature of the cylinder and the combustion chamber wallsand also the pressure of the charge thereby lowering mixture and end gastemperatures. This reduces the tendency to knock.
11.11.2 Time Factors
Increasing the flame speed or increasing the duration of the ignition lag orreducing the time of exposure of the unburned mixture to autoignition condi-tion will tend to reduce knocking. The following factors, in most cases, reducethe possibility of knocking.
Turbulence: Turbulence depends on the design of the combustion chamberand on engine speed. Increasing turbulence increases the flame speed andreduces the time available for the end charge to attain autoignition conditionsthereby decreasing the tendency to knock.
Engine Speed: An increase in engine speed increases the turbulence of themixture considerably resulting in increased flame speed, and reduces the timeavailable for preflame reactions. Hence knocking tendency is reduced at higherspeeds.
Flame Travel Distance: The knocking tendency is reduced by shorteningthe time required for the flame front to traverse the combustion chamber.Engine size (combustion chamber size), and spark plug position are the threeimportant factors governing the flame travel distance.
Engine Size: The flame requires a longer time to travel across the combustionchamber of a larger engine. Therefore, a larger engine has a greater tendency
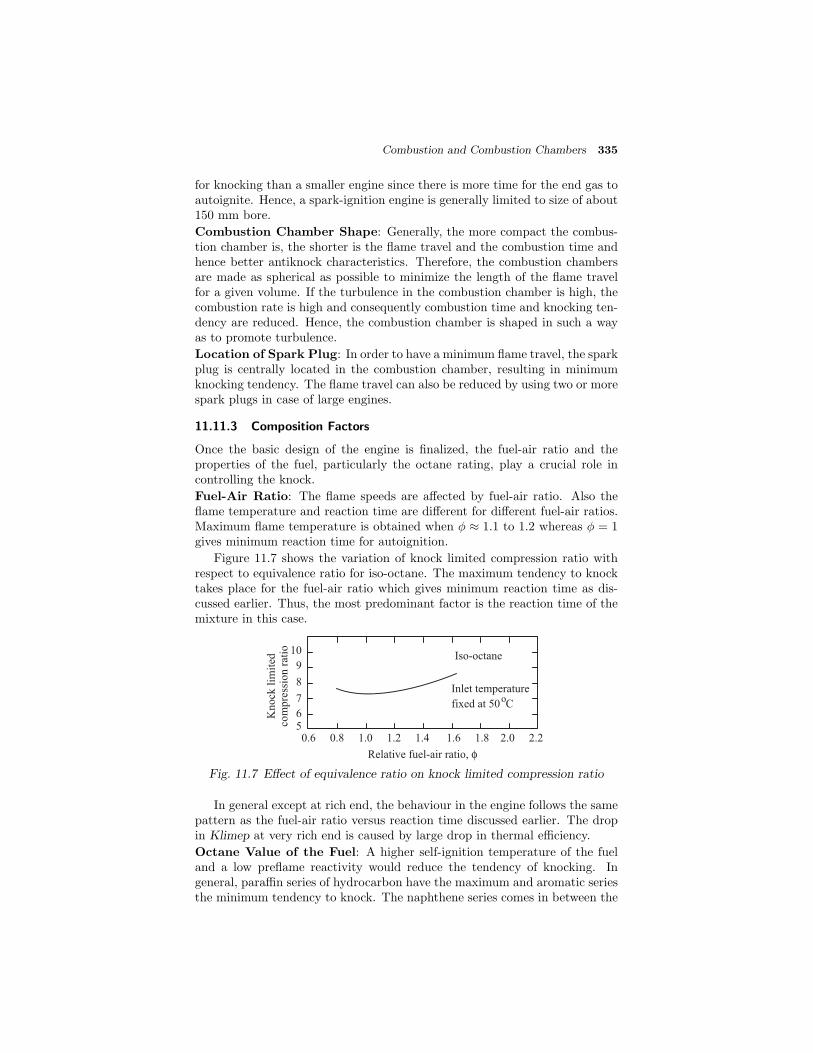
Combustion and Combustion Chambers 335
for knocking than a smaller engine since there is more time for the end gas toautoignite. Hence, a spark-ignition engine is generally limited to size of about150 mm bore.
Combustion Chamber Shape: Generally, the more compact the combus-tion chamber is, the shorter is the flame travel and the combustion time andhence better antiknock characteristics. Therefore, the combustion chambersare made as spherical as possible to minimize the length of the flame travelfor a given volume. If the turbulence in the combustion chamber is high, thecombustion rate is high and consequently combustion time and knocking ten-dency are reduced. Hence, the combustion chamber is shaped in such a wayas to promote turbulence.
Location of Spark Plug: In order to have a minimum flame travel, the sparkplug is centrally located in the combustion chamber, resulting in minimumknocking tendency. The flame travel can also be reduced by using two or morespark plugs in case of large engines.
11.11.3 Composition Factors
Once the basic design of the engine is finalized, the fuel-air ratio and theproperties of the fuel, particularly the octane rating, play a crucial role incontrolling the knock.
Fuel-Air Ratio: The flame speeds are affected by fuel-air ratio. Also theflame temperature and reaction time are different for different fuel-air ratios.Maximum flame temperature is obtained when φ ≈ 1.1 to 1.2 whereas φ = 1gives minimum reaction time for autoignition.
Figure 11.7 shows the variation of knock limited compression ratio withrespect to equivalence ratio for iso-octane. The maximum tendency to knocktakes place for the fuel-air ratio which gives minimum reaction time as dis-cussed earlier. Thus, the most predominant factor is the reaction time of themixture in this case.
0.6 0.8 1.0 1.2 1.4 1.6 1.8 2.0 2.2
Relative fuel-air ratio, φ
Iso-octane
Inlet temperature
fixed at 50 Co
Knock
lim
ited
com
pre
ssio
n r
atio 10
9
8
7
65
Fig. 11.7 Effect of equivalence ratio on knock limited compression ratio
In general except at rich end, the behaviour in the engine follows the samepattern as the fuel-air ratio versus reaction time discussed earlier. The dropin Klimep at very rich end is caused by large drop in thermal efficiency.
Octane Value of the Fuel: A higher self-ignition temperature of the fueland a low preflame reactivity would reduce the tendency of knocking. Ingeneral, paraffin series of hydrocarbon have the maximum and aromatic seriesthe minimum tendency to knock. The naphthene series comes in between the

336 IC Engines
Table 11.1 Summary of variables affecting knock in an SI engine
Increase Major effect Action to be Can operatorin variable on unburned taken to usually
reduce charge knocking control?
Compression Increases Reduce Noratio temperature &
pressure
Mass of Increases Reduce Yescharge inducted pressure
Inlet Increases Reduce In some casestemperature temperature
Chamber wall Increases Reduce Not ordinarilytemperature temperature
Spark advance Increases Retard In some casestemperature &
pressure
A/F ratio Increases Make very rich In some casestemperature &
pressure
Turbulence Decreases Increase Somewhattime factor (through engine
speed)
Engine speed Decreases Increase Yestime factor
Distance of Increases Reduce Noflame travel time factor
two. Usually, compounds with more compact molecular structure are lessprone to knock. In aliphatic hydrocarbons, unsaturated compounds showlesser knocking tendency than saturated hydrocarbons, the exception beingethylene, acetylene and propylene.
Table 11.1 gives the general summary of variables affecting the knock inan SI engine and shows whether the various factors can be controlled by theoperator.
11.12 COMBUSTION CHAMBERS FOR SI ENGINES
The design of the combustion chamber for an SI engine has an importantinfluence on the engine performance and its knocking tendencies. The designinvolves the shape of the combustion chamber, the location of spark plug

Combustion and Combustion Chambers 337
and the location of inlet and exhaust valves. Because of this importance,the combustion chamber design has been a subject of considerable amountof research and development in the last fifty years. It has resulted in theraising of the compression ratio of the engine from 4 before the first world warperiod to 11 in the present times with special combustion chamber designsand suitable antiknock fuels. The important requirements of an SI enginecombustion chamber are to provide high power output with minimum octanerequirement, high thermal efficiency and smooth engine operation.
Combustion chambers must be designed carefully, keeping in mind thefollowing general objectives.
11.12.1 Smooth Engine Operation
The aim of any engine design is to have a smooth operation and a goodeconomy. These can be achieved by the following:
Moderate Rate of Pressure Rise: The rate of pressure rise can be reg-ulated such that the greatest force is applied to the piston as closely afterTDC on the power stroke as possible, with a gradual decrease in the force onthe piston during the power stroke. The forces must be applied to the pistonsmoothly, thus limiting the rate of pressure rise as well as the position of thepeak pressure with respect to TDC.
Reducing the Possibility of Knocking: Reduction in the possibility ofknocking in an engine can be achieved by,
(i) Reducing the distance of the flame travel by centrally locating the sparkplug and also by avoiding pockets of stagnant charge.
(ii) Satisfactory cooling of the spark plug and of exhaust valve area whichare the source of hot spots in the majority of the combustion chambers.
(iii) Reducing the temperature of the last portion of the charge, throughapplication of a high surface to volume ratio in that part where the lastportion of the charge burns. Heat transfer to the combustion chamberwalls can be increased by using high surface to volume ratio therebyreducing the temperature.
11.12.2 High Power Output and Thermal Efficiency
The main objective of the design and development of an engine is to obtainhigh power as well as high thermal efficiency. This can be achieved by con-sidering the following factors:
(i) A high degree of turbulence is needed to achieve a high flame frontvelocity. Turbulence is induced by inlet flow configuration or squish.Squish can be induced in spark-ignition engines by having a bowl inpiston or with a dome shaped cylinder head. Squish is the rapid radialmovement of the gas trapped in between the piston and the cylinderhead into the bowl or the dome.

338 IC Engines
(ii) High volumetric efficiency, i.e., more charge during the suction stroke,results in an increased power output. This can be achieved by provid-ing ample clearance around the valve heads, large diameter valves andstraight passages with minimum pressure drop.
(iii) Any design of the combustion chamber that improves its antiknock char-acteristics permits the use of a higher compression ratio resulting inincreased output and efficiency.
(iv) A compact combustion chamber reduces heat loss during combustionand increases the thermal efficiency. Different types of combustionchambers have been developed over a period of time. Some of themare shown in Fig.11.8. Brief description of these combustion chambersare given below.
S
I E
(a) T-head type
S
I E
(b) L-head type
S
I E
(c) L-head typeS
I
E
(e) F-head type
S
I, E
(d) I-head type
E - Exhaust valve
I - Inlet valve
S - Spark plug
Fig. 11.8 Examples of typical combustion chamber
T-Head Type: The T-head combustion chambers [Fig.11.8(a)] were used inthe early stage of engine development. Since the distance across the combus-tion chamber is very long, knocking tendency is high in this type of engines.This configuration provides two valves on either side of the cylinder, requir-ing two camshafts. From the manufacturing point of view, providing twocamshafts is a disadvantage.
L-Head Type: A modification of the T-head type of combustion chamberis the L-head type which provides the two valves on the same side of thecylinder and the valves are operated by a single camshaft. Figures 11.8(b)and (c) show two types of this side valve engine. In these types, it is easy tolubricate the valve mechanism. With the detachable head it may be notedthat the cylinder head can be removed without disturbing valve gear etc. In

Combustion and Combustion Chambers 339
Fig.11.8(b) the air flow has to take two right angle turns to enter the cylinder.This causes a loss of velocity head and a loss in turbulence level resulting ina slow combustion process.
The main objectives of the Ricardo’s turbulent head design, Fig.11.8(c),are to obtain fast flame speed and reduced knock. The main body of the com-bustion chamber is concentrated over the valves leaving a slightly restrictedpassage communicating with the cylinder thereby creating additional turbu-lence during the compression stroke. This design reduces the knocking ten-dency by shortening the effective flame travel length by bringing that portionof the head which lay over the farther side of the piston into as close a contactas possible with the piston crown, forming a quench space. The thin layer ofgas (entrapped between the relatively cool piston and also cooler head) losesits heat rapidly because of large enclosing surface thereby avoiding knock-ing. By placing the spark plug in the centre of the effective combustion spaceslightly towards the hot exhaust valve, the flame travel length is reduced.
I-Head Type or Overhead Valve: The I-head type is also called theoverhead valve combustion chamber in which both the valves are located onthe cylinder head. The overhead valve engine [Fig.11.8(d)] is superior to a sidevalve or an L-head engine at high compression ratios. Some of the importantcharacteristics of this type of valve arrangement are:
(i) less surface to volume ratio and therefore less heat loss
(ii) less flame travel length and hence greater freedom from knock
(iii) higher volumetric efficiency from larger valves or valve lifts
(iv) confinement of thermal failures to cylinder head by keeping the hotexhaust valve in the head instead of the cylinder block.
F-Head Type: The F-head type of valve arrangement is a compromise be-tween L-head and I-head types. Combustion chambers in which one valve is inthe cylinder head and the other in the cylinder block are known as F-head com-bustion chambers [Fig.11.8(e)]. Modern F-head engines have exhaust valve inthe head and inlet valve in the cylinder block. The main disadvantage of thistype is that the inlet valve and the exhaust valve are separately actuated bytwo cams mounted on two camshafts driven by the crankshaft through gears.
11.13 COMBUSTION IN COMPRESSION-IGNITION ENGINES
There are certain basic differences existing between the combustion process inthe SI and CI engines. In the SI engine, a homogeneous carburetted mixtureof gasoline vapour and air, in a certain proportion, is compressed (compressionratio 6:1 to 10:1) and the mixture is ignited at one place before the end ofthe compression stroke by means of an electric spark. A single flame frontprogresses through the air-fuel mixture after ignition.
In the CI engine, only air is compressed through a high compression ratio(16:1 to 20:1) raising its temperature and pressure to a high value. Fuel isinjected through one or more jets into this highly compressed air in the com-bustion chamber. Here, the fuel jet disintegrates into a core of fuel surrounded

340 IC Engines
by a spray envelope of air and fuel particles [Fig.11.9(a)]. This spray envelopeis created both by the atomization and vaporization of the fuel. The turbu-lence of the air in the combustion chamber passing across the jet tears thefuel particles from the core. A mixture of air and fuel forms at some locationin the spray envelope and oxidation starts.
Depth of jet
Front of jet
Velocity
Periphery of jet
Core of jet
Disintegration of jet
Fuel nozzle
No air swirlNozzle
With air swirl
Nozzle
(a)
(b)
(c)
Fig. 11.9 Schematic representation of the disintegration of a fuel jet
The liquid fuel droplets evaporate by absorbing the latent heat of vapor-ization from the surrounding air which reduces the temperature of a thin layerof air surrounding the droplet and some time elapses before this temperaturecan be raised again by absorbing heat from the bulk of air. As soon as thisvapour and the air reach the level of the autoignition temperature and if thelocal A/F ratio is within the combustible range, ignition takes place. Thus,it is obvious that at first there is a certain delay period before ignition takesplace.
Since the fuel droplets cannot be injected and distributed uniformly through-out the combustion space, the fuel-air mixture is essentially heterogeneous. Ifthe air within the cylinder were motionless under these conditions, there willnot be enough oxygen in the burning zone and burning of the fuel would be

Combustion and Combustion Chambers 341
either slow or totally fail as it would be surrounded by its own products ofcombustion [Fig.11.9(b)]. Hence, an orderly and controlled movement must beimparted to the air and the fuel so that a continuous flow of fresh air is broughtto each burning droplet and the products of combustion are swept away. Thisair motion is called the air swirl and its effect is shown in Fig.11.9(c).
In an SI engine, the turbulence is a disorderly air motion with no generaldirection of flow. However, the swirl which is required in CI engines, is anorderly movement of the whole body of air with a particular direction of flowand it assists the breaking up of the fuel jet. Intermixing of the burned andunburned portions of the mixture also takes place due to this swirl. In the SIengine, the ignition occurs at one point with a slow rise in pressure whereasin the CI engine, the ignition occurs at many points simultaneously withconsequent rapid rise in pressure. In contrast to the process of combustion inSI engines, there is no definite flame front in CI engines.
In an SI engine, the air-fuel ratio remains close to stoichiometric value fromno load to full load. But in a CI engine, irrespective of load, at any givenspeed, an approximately constant supply of air enters the cylinder. Withchange in load, the quantity of fuel injected is changed, varying the air-fuelratio. The overall air-fuel ratio thus varies from about 18:1 at full load toabout 80:1 at no load. It is the main aim of the CI engine designer that theA/F ratio should be as close to stoichiometric as possible while operating atfull load since the mean effective pressure and power output are maximumat that condition. Thermodynamic analysis of the engine cycles has clearly
Constant speed operation
Air-fuel ratio
10 20 30 40
Po
wer
ou
tpu
t (k
W)
Ob
ject
ion
able
sm
ok
e ar
ea
Fig. 11.10 Effect of A/F ratio on power output of a CI engine
established that operating an engine with a leaner air-fuel ratio always gives abetter thermal efficiency but the mean effective pressure and the power outputreduce. Therefore, the engine size becomes bigger for a given output if it isoperated near the stoichiometric conditions, the A/F ratio in certain regionswithin the chamber is likely to be so rich that some of the fuel molecules willnot be able to find the necessary oxygen for combustion and thus produce a
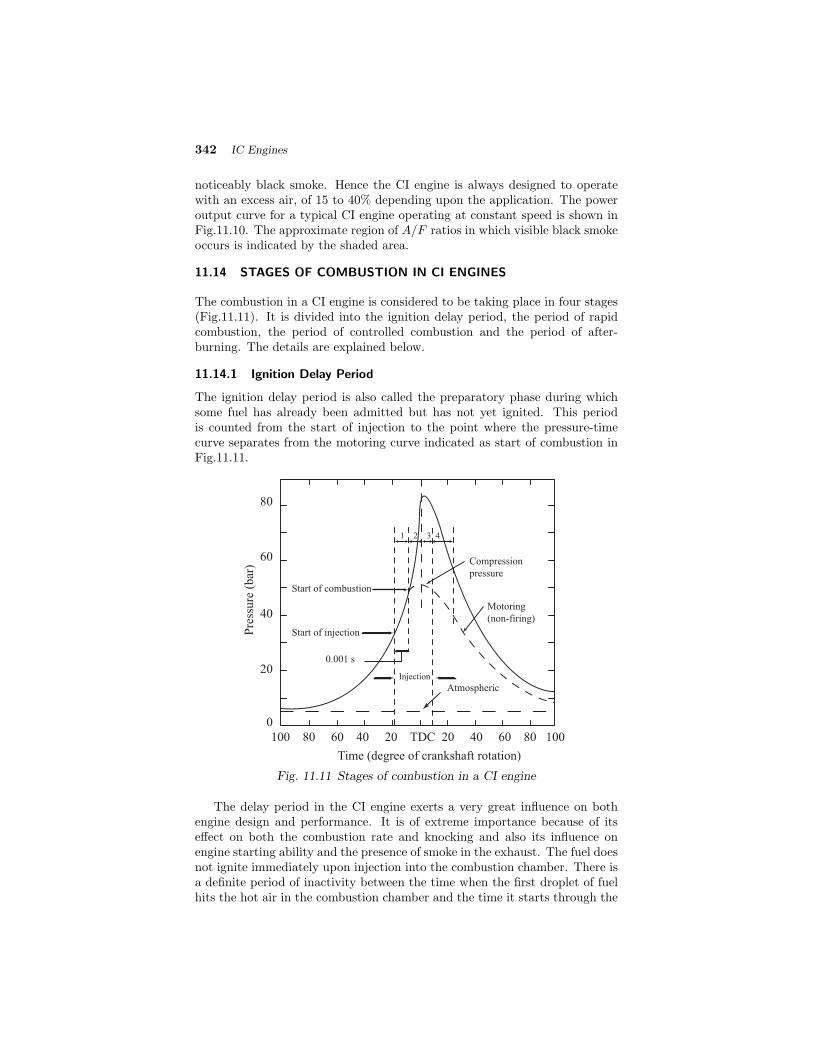
342 IC Engines
noticeably black smoke. Hence the CI engine is always designed to operatewith an excess air, of 15 to 40% depending upon the application. The poweroutput curve for a typical CI engine operating at constant speed is shown inFig.11.10. The approximate region of A/F ratios in which visible black smokeoccurs is indicated by the shaded area.
11.14 STAGES OF COMBUSTION IN CI ENGINES
The combustion in a CI engine is considered to be taking place in four stages(Fig.11.11). It is divided into the ignition delay period, the period of rapidcombustion, the period of controlled combustion and the period of after-burning. The details are explained below.
11.14.1 Ignition Delay Period
The ignition delay period is also called the preparatory phase during whichsome fuel has already been admitted but has not yet ignited. This periodis counted from the start of injection to the point where the pressure-timecurve separates from the motoring curve indicated as start of combustion inFig.11.11.
Pre
ssure
(bar
)
80
60
40
20
0
100 80 60 40 20 TDC 20 40 60 80 100
Time (degree of crankshaft rotation)
Compression
pressure
Motoring
(non-firing)
Atmospheric
Injection
Start of injection
Start of combustion
1 2 3 4
0.001 s
Fig. 11.11 Stages of combustion in a CI engine
The delay period in the CI engine exerts a very great influence on bothengine design and performance. It is of extreme importance because of itseffect on both the combustion rate and knocking and also its influence onengine starting ability and the presence of smoke in the exhaust. The fuel doesnot ignite immediately upon injection into the combustion chamber. There isa definite period of inactivity between the time when the first droplet of fuelhits the hot air in the combustion chamber and the time it starts through the

Combustion and Combustion Chambers 343
actual burning phase. This period is known as the ignition delay period. InFig.11.12 the delay period is shown on pressure crank angle (or time) diagrambetween points a and b. Point a represents the time of injection and point brepresents the time at which the pressure curve (caused by combustion) firstseparates from the motoring curve. The ignition delay period can be dividedinto two parts, the physical delay and the chemical delay.
Pre
ssure
Maximum pressure
a - Start of injection
b - Start of combustion
c - Ignition delay
d - Mixing period
e - Interaction period
a bc
d e
Expanded view of area A
Time
a b
c
Area A
TDC
M
otoring curve
Com
bustionpressure
Fig. 11.12 Pressure-time diagram illustrating ignition delay
Physical Delay: The physical delay is the time between the beginning ofinjection and the attainment of chemical reaction conditions. During thisperiod, the fuel is atomized, vaporized, mixed with air and raised to its self-ignition temperature. This physical delay depends on the type of fuel, i.e., forlight fuel the physical delay is small while for heavy viscous fuels the physicaldelay is high. The physical delay is greatly reduced by using high injectionpressures, higher combustion chamber temperatures and high turbulence tofacilitate breakup of the jet and improving evaporation.
Chemical Delay: During the chemical delay, reactions start slowly andthen accelerate until inflammation or ignition takes place. Generally, thechemical delay is larger than the physical delay. However, it depends onthe temperature of the surroundings and at high temperatures, the chemicalreactions are faster and the physical delay becomes longer than the chemicaldelay. It is clear that, the ignition lag in the SI engine is essentially equivalentto the chemical delay for the CI engine. In most CI engines the ignition lagis shorter than the duration of injection.
344 IC Engines
11.14.2 Period of Rapid Combustion
The period of rapid combustion also called the uncontrolled combustion, isthat phase in which the pressure rise is rapid. During the delay period, thedroplets have had time to spread over a wide area and fresh air is alwaysavailable around the droplets. Most of the fuel admitted would have evapo-rated and formed a combustible mixture with air. By this time, the preflamereactions would have also been completed. The period of rapid combustion iscounted from end of delay period or the beginning of the combustion to thepoint of maximum pressure on the indicator diagram. The rate of heat-releaseis maximum during this period. It may be noted that the pressure reachedduring the period of rapid combustion will depend on the duration of thedelay period (the longer the delay the more rapid and higher is the pressurerise since more fuel would have accumulated in the cylinder during the delayperiod).
11.14.3 Period of Controlled Combustion
The rapid combustion period is followed by the third stage, the controlledcombustion. The temperature and pressure in the second stage is alreadyquite high. Hence the fuel droplets injected during the second stage burnfaster with reduced ignition delay as soon as they find the necessary oxygenand any further pressure rise is controlled by the injection rate. The periodof controlled combustion is assumed to end at maximum cycle temperature.
11.14.4 Period of After-Burning
Combustion does not cease with the completion of the injection process. Theunburnt and partially burnt fuel particles left in the combustion chamber startburning as soon as they come into contact with the oxygen. This processcontinues for a certain duration called the after-burning period. Usually thisperiod starts from the point of maximum cycle temperature and continuesover a part of the expansion stroke. Rate of after-burning depends on thevelocity of diffusion and turbulent mixing of unburnt and partially burnt fuelwith the air. The duration of the after-burning phase may correspond to 70-80degrees of crank travel from TDC.
The sequence of the events in the entire combustion process in a CI engineincluding the delay period is shown in Fig.11.13 by means of a block diagram.
11.15 FACTORS AFFECTING THE DELAY PERIOD
Many design and operating factors affect the delay period. The importantones are:
(i) compression ratio
(ii) engine speed
(iii) output

Combustion and Combustion Chambers 345
MixtureFormation
Ignition Final combustion Products
Delay period
Disintegration
of stream of
injected fuel
Mixing of
liquid fuel
with air
Vapourization
of fuel
Mixing of
fuel vapour
with air
Preflame
oxidation
of fuel
Local
ignition
Inflammation
Thermal
decomposition
of fuel
Oxidation
of fuel-air
mixture
Mixture of
products of
partial oxidation
or of thermal
decomposition
with air
Temperature
and oxygen
concentration
unfavourable
for complete
combustion
(chilling,
overlean and
over rich
mixtures)
Temperature
and oxygen
concentration
favourable
for complete
combustion
Products of
complete
combustion
Products of
incomplete
combustion
Physical
delay
Chemical
delay
Decreased by
swirl (turbulence)
}Fig. 11.13 Block diagram illustrating the combustion process in a CI engine
(iv) atomization of fuel and duration of injection
(v) injection timing
(vi) quality of the fuel
(vii) intake temperature
(viii) intake pressure
The effect of these factors on the delay period is discussed in detail in thefollowing sections.
11.15.1 Compression Ratio
The increase in the compression temperature of the air with increase in com-pression ratio evaluated at the end of the compression stroke is shown inFig.11.14. It is also seen from the same figure that the minimum autoignitiontemperature of a fuel decreases due to increased density of the compressedair. This results in a closer contact between the molecules of fuel and oxygenreducing the time of reaction. The increase in the compression temperatureas well as the decrease in the minimum autoignition temperature decreasesthe delay period. The peak pressure during the combustion process is onlymarginally affected by the compression ratio (because delay period is shorterwith higher compression ratio and hence the pressure rise is lower).

346 IC Engines
0 4 8 12 16 20 24
1250
1000
750
500
250
0
Tem
per
ature
(K
)
Compression ratio
Max
imum
airtem
perature
Minimum auto-ignition temperature
Fig. 11.14 Effect of compression ratio on maximum air temperature and min-imum autoignition temperature
One of the practical disadvantages of using a very high compression ratiois that the mechanical efficiency tends to decrease due to increase in weight ofthe reciprocating parts. Therefore, in practice the engine designers always tryto use a lower compression ratio which helps in easy cold starting and lightload running at high speeds.
11.15.2 Engine Speed
The delay period could be given either in terms of absolute time (in mil-liseconds) or in terms of crank angle degrees. Fig.11.15 shows the decreasein delay period in terms of milliseconds with increase in engine speed in avariable speed operation with a given fuel.
Ignit
ion d
elay
(mil
lise
conds)
Engine speed (rpm)
57 Cetane fuel
2.0
1.5
1.0
0.5
800 1200 1600 2000
Fig. 11.15 Effect of speed on ignition delay in a diesel engine
With increase in engine speed, the loss of heat during compression de-creases, resulting in the rise of both the temperature and pressure of thecompressed air thus reducing the delay period in milliseconds. However, in
Combustion and Combustion Chambers 347
degrees of crank travel the delay period increases as the engine operates at ahigher rpm. The fuel pump is geared to the engine, and hence the amountof fuel injected during the delay period depends on crank degrees and not onabsolute time. Hence, at high speeds, there will be more fuel present in thecylinder to take part in the second stage of uncontrolled combustion resultingin high rate of pressure rise.
11.15.3 Output
With an increase in engine output the air-fuel ratio decreases, operating tem-peratures increase and hence delay period decreases. The rate of pressure riseis unaffected but the peak pressure reached may be high.
11.15.4 Atomization and Duration of Injection
Higher fuel-injection pressures increase the degree of atomization. The fine-ness of atomization reduces ignition delay, due to higher surface volume ratio.Smaller droplet size will have low depth of penetration due to less momentumof the droplet and less velocity relative to air from where it has to find oxygenafter vapourisation. Because of this air utilization factor will be reduced dueto fuel spray path being shorter. Also with smaller droplets, the aggregatearea of inflammation will increase after ignition, resulting in higher pressurerise during the second stage of combustion. Thus, lower injection pressure,giving larger droplet size may give lower pressure rise during the second stageof combustion and probably smoother running. Hence, an optimum groupmean diameter of the droplet size should be attempted as a compromise.Also the fuel delivery law i.e., change in the quantity of fuel supplied with thecrank angle travel will affect the rates of pressure rise during second stage ofcombustion though ignition delay remains unaffected by the same.
11.15.5 Injection Timing
The effect of injection advance on the pressure variation is shown in Fig.11.16for three injection advance timings of 9◦, 18◦, and 27◦ before TDC. The in-jected quantity of fuel per cycle is constant. As the pressure and temperatureat the beginning of injection are lower for higher ignition advance, the delayperiod increases with increase in injection advance. The optimum angle of in-jection advance depends on many factors but generally it is about 20◦bTDC.
11.15.6 Quality of Fuel
Self-ignition temperature is the most important property of the fuel whichaffects the delay period. A lower self-ignition temperature results in a lowerdelay period. Also, fuels with higher cetane number give lower delay periodand smoother engine operation. Other properties of the fuel which affect thedelay period are volatility, latent heat, viscosity and surface tension.
11.15.7 Intake Temperature
Increase in intake temperature increases the compressed air temperature re-sulting in reduced delay period. However, preheating of the charge for this

348 IC Engines
27 18 9
100
80
60
40
20
0
40 20 TDC 20 40
27
18
9
Motoring
o
o
o
Pre
ssure
(bar
)
Crank angle (deg)
Fig. 11.16 Effect of injection timing on indicator diagram
purpose would be undesirable because it would reduce the density of air re-ducing the volumetric efficiency and power output.
11.15.8 Intake Pressure
Increase in intake pressure or supercharging reduces the autoignition temper-ature and hence reduces the delay period. The peak pressure will be highersince the compression pressure will increase with intake pressure. Table 11.2gives the summary of the factors which influence the delay period in an engine.
11.16 THE PHENOMENON OF KNOCK IN CI ENGINES
In CI engines the injection process takes place over a definite interval of time.Consequently, as the first few droplets to be injected are passing through theignition delay period, additional droplets are being injected into the chamber.If the ignition delay of the fuel being injected is short, the first few droplets willcommence the actual burning phase in a relatively short time after injectionand a relatively small amount of fuel will be accumulated in the chamber whenactual burning commences. As a result, the mass rate of mixture burned willbe such as to produce a rate of pressure rise that will exert a smooth force onthe piston, as shown in Fig.11.17(a). If, on the other hand, the ignition delayis longer, the actual burning of the first few droplets is delayed and a greaterquantity of fuel droplets gets accumulated in the chamber. When the actualburning commences, the additional fuel can cause too rapid a rate of pressurerise as shown in Fig.11.17(b), resulting in a jamming of forces against thepiston and rough engine operation. If the ignition delay is quite long, so muchfuel can accumulate that the rate of pressure rise is almost instantaneous,as shown in Fig.11.17(c). Such a situation produces the extreme pressuredifferentials and violent gas vibrations known as knocking and is evidenced byaudible knock. The phenomenon is similar to that in the SI engine. However,

Combustion and Combustion Chambers 349
Table 11.2 Effect of Variables on the Delay Period
Increases in Effect onReasonvariable Delay Period
Cetane number offuel
Reduces Reduces the self-ignitiontemperature
Injection pressure Reduces Reduces physical delay dueto greater surface-volumeratio
Injection timing ad-vance
Reduces Reduced pressures andtemperatures when theinjection begins
Compression ratio Reduces Increases air temperatureand pressure and reducesautoignition temperature
Intake temperature Reduces Increases air temperature
Jacket water temper-ature
Reduces Increases wall and henceair temperature
Fuel temperature Reduces Increases chemical reactiondue to better vaporization
Intake pressure (su-percharging)
Reduces Increases density andalso reduces autoignitiontemperature
Speed Increases in terms ofcrank angle. Reducesin terms of millisec-onds
Reduces loss of heat
Load (fuel-air ratio) Decreases Increases the operatingtemperature
Engine size Decreases in terms ofcrank angle. Little ef-fect in terms of mil-liseconds
Larger engines operatenormally at low speeds
Type of combustionchamber
Lower for engineswith precombustionchamber
Due to compactness of thechamber

350 IC Engines
in the SI engine, knocking occurs near the end of combustion whereas in theCI engine, knocking occurs near the beginning of combustion.
In order to decrease the tendency of knock it is necessary to start theactual burning as early as possible after the injection begins. In other words,it is necessary to decrease the ignition delay and thus decrease the amount offuel present when the actual burning of the first few droplets start.
11.17 COMPARISON OF KNOCK IN SI AND CI ENGINES
It may be interesting to note that knocking in spark-ignition engines andcompression-ignition engines is fundamentally due to the autoignition of thefuel-air mixture. In both the cases, the knocking depends on the autoignitionlag of the fuel-air mixture. But careful examination of the knocking phe-nomenon in spark-ignition and the compression-ignition engines reveals thefollowing differences. A comparison of the knocking process in SI and CIengines is shown on the pressure-time diagrams of Fig.11.18.
(i) In spark-ignition engines, the autoignition of the end gas away from thespark plug, most likely near the end of the combustion causes knock-ing. But in compression-ignition engines the autoignition of the chargecausing knocking is at the start of combustion. It is the first chargethat autoignites and causes knocking in the compression-ignition en-gines. This is illustrated in Fig.11.18. It is clear from Fig.11.18 thatexplosive auto- ignition is more or less over before the peak pressurefor the compression-ignition engines. But for spark-ignition engines, thecondition for explosive autoignition of the end charge is more favourableafter the peak pressure. In order to avoid knocking in spark-ignition en-gines, it is necessary to prevent autoignition of the end gas to take placeat all. In compression-ignition engine, the earliest possible autoignitionis necessary to avoid knocking.
(ii) In spark-ignition engine, the charge that autoignites is homogeneous andtherefore intensity of knocking or the rate of pressure rise at explosiveautoignition is likely to be more than that in compression-ignition en-gines where the fuel and air are not homogeneously mixed even whenexplosive autoignition of the charge occurs. Therefore, it is often calleddetonation in SI engines.
(iii) In compression-ignition engines, only air is compressed during the com-pression stroke and the ignition can take place only after fuel is injectedjust before the top dead centre. Thus there can be no preignition incompression-ignition engines as in spark-ignition engines.
(iv) It has already been pointed out that, the normal process of combustionin compression-ignition engines is by autoignition. And thus normalrate of pressure rise for the first part of the charge for compression-ignition are higher than those for spark-ignition engine, in terms of perdegree crank rotation. And normally, audible knock is always present
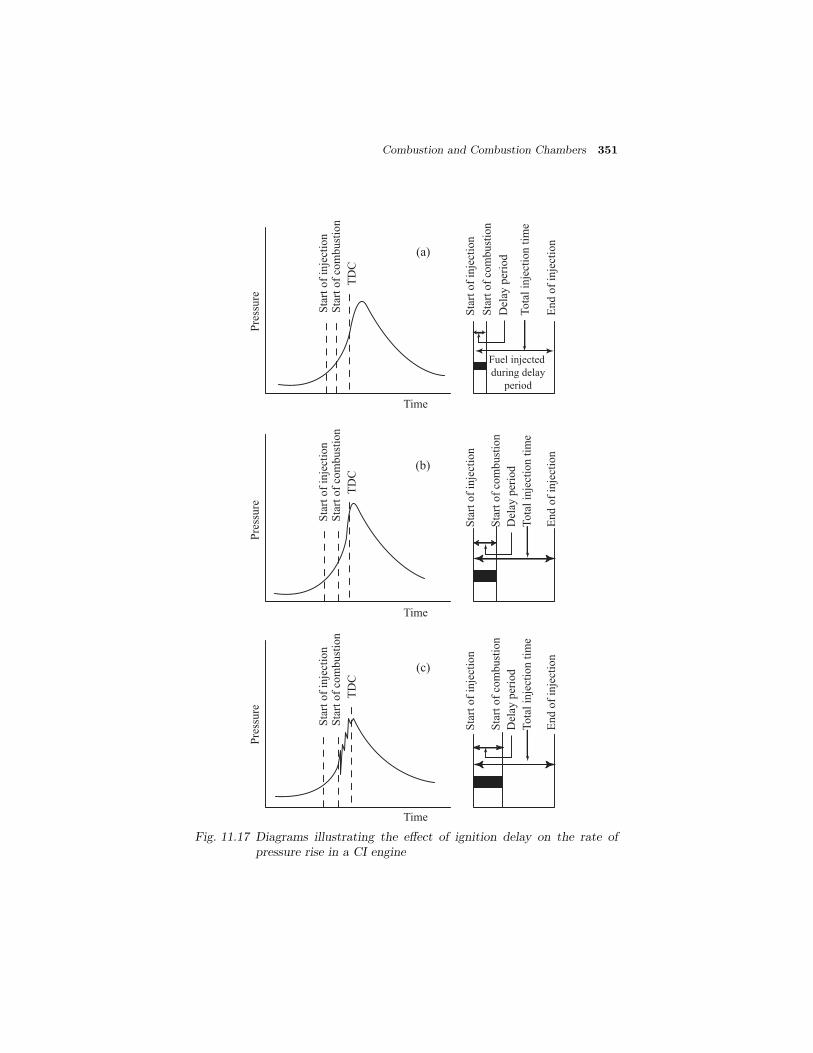
Combustion and Combustion Chambers 351
Pre
ssu
re
Sta
rt o
f in
ject
ion
Sta
rt o
f co
mb
ust
ion
TD
C
Time
Sta
rt o
f in
ject
ion
Sta
rt o
f co
mb
ust
ion
Del
ay p
erio
d
To
tal
inje
ctio
n t
ime
En
d o
f in
ject
ion
Fuel injected
during delay
period
Pre
ssu
re
Sta
rt o
f in
ject
ion
Sta
rt o
f co
mb
ust
ion
TD
C
Time
Sta
rt o
f in
ject
ion
Sta
rt o
f co
mb
ust
ion
Del
ay p
erio
d
To
tal
inje
ctio
n t
ime
En
d o
f in
ject
ion
Pre
ssu
re
Sta
rt o
f in
ject
ion
Sta
rt o
f co
mb
ust
ion
TD
C
Time
Sta
rt o
f in
ject
ion
Sta
rt o
f co
mb
ust
ion
Del
ay p
erio
d
To
tal
inje
ctio
n t
ime
En
d o
f in
ject
ion
(a)
(b)
(c)
Fig. 11.17 Diagrams illustrating the effect of ignition delay on the rate ofpressure rise in a CI engine

352 IC Engines
Pre
ssure
Ignit
ion
TDC
Time
Pre
ssure
Time
Sta
rt o
f in
ject
ion TDC
Start of combustion
SI Engine CI Engine
Fig. 11.18 Diagrams illustrating knocking combustion in SI and CI engines
in compression-ignition engine. Thus when the audible noise becomessevere and causes heavy vibrations in the engine, it is said that the en-gine is knocking. Therefore, it is also a matter of judgement. A definitedemarcation between normal combustion and knocking combustion isvery difficult. The rate of pressure rise may be as high as 10 bar perdegree crank rotation in compression-ignition engines. The factors thattend to increase autoignition reaction time and prevent knock in SI en-gines promote knock in CI engines. Also, a good fuel for spark-ignitionengine is a poor fuel for compression-ignition engine. The spark-ignitionfuels have high octane rating 80 to 100 and low cetane rating of about20, whereas diesel fuels have high cetane rating of about 45 to 65 andlow octane rating of about 30.
Table 11.3 gives a comparative statement of various characteristics that reduceknocking in spark-ignition engines and compression-ignition engines.
11.18 COMBUSTION CHAMBERS FOR CI ENGINES
The most important function of the CI engine combustion chamber is toprovide proper mixing of fuel and air in a short time. In order to achievethis, an organized air movement called the air swirl is provided to producehigh relative velocity between the fuel droplets and the air. The effect ofswirl has already been discussed in Section 11.13. The fuel is injected into thecombustion chamber by an injector having a single or multihole orifices. Theincrease in the number of jets reduces the intensity of air swirl needed.
When the liquid fuel is injected into the combustion chamber, the spraycone gets disturbed due to the air motion and turbulence inside. The onset ofcombustion will cause an added turbulence that can be guided by the shape ofthe combustion chamber. Since the turbulence is necessary for better mixing,and the fact that it can be controlled by the shape of the combustion chamber,makes it necessary to study the combustion chamber design in detail.
CI engine combustion chambers are classified into two categories:

Combustion and Combustion Chambers 353
Table 11.3 Characteristics tending to reduce detonation or knock
S.No. Characteristics SI Engines CI Engines
1. Ignition temperature of fuel High Low
2. Ignition delay Long Short
3. Compression ratio Low High
4. Inlet temperature Low High
5. Inlet pressure Low High
6. Combustion wall temperature Low High
7. Speed, rpm High Low
8. Cylinder size Small Large
(i) Direct-Injection (DI) Type: This type of combustion chamber is alsocalled an open combustion chamber. In this type the entire volume ofthe combustion chamber is located in the main cylinder and the fuel isinjected into this volume.
(ii) Indirect-Injection (IDI) Type: In this type of combustion chambers,the combustion space is divided into two parts, one part in the maincylinder and the other part in the cylinder head. The fuel-injection isaffected usually into that part of the chamber located in the cylinderhead. These chambers are classified further into:
(a) Swirl chamber in which compression swirl is generated.
(b) Precombustion chamber in which combustion swirl is induced.
(c) Air cell chamber in which both compression and combustion swirlare induced.
11.18.1 Direct–Injection Chambers
An open combustion chamber is defined as one in which the combustion spaceis essentially a single cavity with little restriction from one part of the chamberto the other and hence with no large difference in pressure between parts ofthe chamber during the combustion process. There are many designs of openchamber some of which are shown in Fig.11.19.
In four-stroke engines with open combustion chambers, induction swirl isobtained either by careful formation of the air intake passages or by masking aportion of the circumference of the inlet valve whereas in two-stroke engines itis created by suitable form for the inlet ports. These chambers mainly consistof space formed between a flat cylinder head and a cavity in the piston crownin different shapes. The fuel is injected directly into this space. The injector

354 IC Engines
(a) Shallow depth chamber (b) Hemispherical chamber
(c) Cylindrical chamber (d) Toroidal chamber
Fig. 11.19 Open combustion chambers
nozzles used for this type of chamber are generally of multihole type workingat a relatively high pressure (about 200 bar). The main advantages of thistype of chambers are:
(i) Minimum heat loss during compression because of lower surface area tovolume ratio and hence, better efficiency.
(ii) No cold starting problems.
(iii) Fine atomization because of multihole nozzle.
The drawbacks of these combustion chambers are:
(i) High fuel-injection pressure required and hence complex design of fuel-injection pump.
(ii) Necessity of accurate metering of fuel by the injection system, particu-larly for small engines.
Shallow Depth Chamber: In shallow depth chamber the depth of the cavityprovided in the piston is quite small. This chamber [Fig.11.19(a)] is usuallyadopted for large engines running at low speeds. Since the cavity diameter isvery large, the squish is negligible.

Combustion and Combustion Chambers 355
Hemispherical Chamber: This chamber [Fig.11.19(b)] also gives smallsquish. However, the depth to diameter ratio for a cylindrical chamber canbe varied to give any desired squish to give better performance.
Cylindrical Chamber: This design [Fig.11.19(c)] was attempted in recentdiesel engines. This is a modification of the cylindrical chamber in the form ofa truncated cone with base angle of 30◦. The swirl was produced by maskingthe valve for nearly 180◦ of circumference. Squish can also be varied byvarying the depth.
Toroidal Chamber: The idea behind this shape [Fig.11.19(d)] is to providea powerful squish along with the air movement, similar to that of the familiarsmoke ring, within the toroidal chamber. Due to powerful squish the maskneeded on inlet valve is small and there is better utilization of oxygen. Thecone angle of spray for this type of chamber is 150◦ to 160◦.
11.18.2 Indirect–Injection Chambers
A divided combustion chamber is defined as one in which the combustion spaceis divided into two or more distinct compartments connected by restrictedpassages. This creates considerable pressure differences between them duringthe combustion process.
Swirl Chamber: Swirl chamber consists of a spherical-shaped chamber sep-arated from the engine cylinder and located in the cylinder head (Fig.11.20).Into this chamber, about 50% of the air is transferred during the compressionstroke. A throat connects the chamber to the cylinder which enters the cham-ber in a tangential direction so that the air coming into this chamber is givena strong rotary movement inside the swirl chamber and after combustion, theproducts rush back into the cylinder through the same throat at much highervelocity. This causes considerable heat loss to the walls of the passage whichcan be reduced by employing a heat-insulated chamber. However, in this typeof combustion chambers even with a heat insulated passage, the heat loss isgreater than that in an open combustion chamber which employs inductionswirl.
This type of combustion chamber finds application where fuel quality isdifficult to control, where reliability under adverse conditions is more impor-tant than fuel economy. The use of single hole of larger diameter for the fuelspray nozzle is often important consideration for the choice of swirl chamberengine.
Precombustion Chamber: A typical precombustion chamber (Fig.11.21)consists of an antichamber connected to the main chamber through a numberof small holes (compared to a relatively large passage in the swirl chamber).The precombustion chamber is located in the cylinder head and its volumeaccounts for about 40% of the total combustion space. During the compres-sion stroke the piston forces the air into the precombustion chamber. Thefuel is injected into the prechamber and the combustion is initiated. The re-sulting pressure rise forces the flaming droplets together with some air andtheir combustion products to rush out into the main cylinder at high velocitythrough the small holes. Thus it creates both strong secondary turbulenceand distributes the flaming fuel droplets throughout the air in the main com-
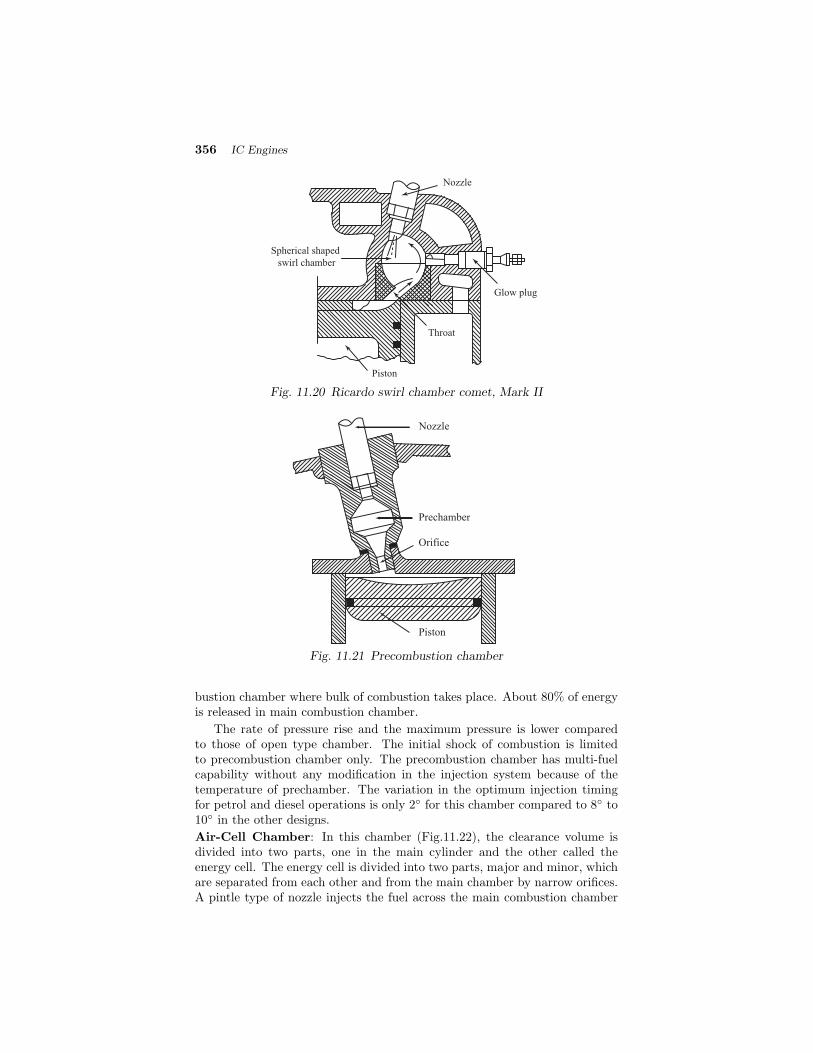
356 IC Engines
Nozzle
Glow plug
Throat
Spherical shaped
swirl chamber
Piston
Fig. 11.20 Ricardo swirl chamber comet, Mark II
Piston
Orifice
Prechamber
Nozzle
Fig. 11.21 Precombustion chamber
bustion chamber where bulk of combustion takes place. About 80% of energyis released in main combustion chamber.
The rate of pressure rise and the maximum pressure is lower comparedto those of open type chamber. The initial shock of combustion is limitedto precombustion chamber only. The precombustion chamber has multi-fuelcapability without any modification in the injection system because of thetemperature of prechamber. The variation in the optimum injection timingfor petrol and diesel operations is only 2◦ for this chamber compared to 8◦ to10◦ in the other designs.
Air-Cell Chamber: In this chamber (Fig.11.22), the clearance volume isdivided into two parts, one in the main cylinder and the other called theenergy cell. The energy cell is divided into two parts, major and minor, whichare separated from each other and from the main chamber by narrow orifices.A pintle type of nozzle injects the fuel across the main combustion chamber

Combustion and Combustion Chambers 357
Two-lobed main combustion chamberPiston
Cylinder
Injector
Cylinder head
Inlet and exhaust valves Two-part energy cell
Fig. 11.22 Lanova air-cell combustion chamber
space towards the open neck of the air cell.
During compression, the pressure in the main chamber is higher than thatinside the energy cell due to restricted passage area between the two. Atthe TDC, the difference in pressure will be high and air will be forced athigh velocity through the opening into the energy cell and this moment thefuel-injection also begins. Combustion starts initially in the main chamberwhere the temperature is comparatively higher but the rate of burning is veryslow due to absence of any air motion. In the energy cell, the fuel is wellmixed with air and high pressure is developed due to heat-release and thehot burning gases blow out through the small passage into the main chamber.This high velocity jet produces swirling motion in the main chamber andthereby thoroughly mixes the fuel with air resulting in complete combustion.The design is not suitable for variable speed operation as the combustioninduced swirl has no relationship to the speed of the engine. The energy cellis designed to run hot, to reduce ignition lag.
The main advantages of the indirect-injection combustion chambers are:
(i) injection pressure required is low
(ii) direction of spraying is not very important.
These chambers have the following serious drawbacks which have made itsapplication limited.
(i) Poor cold starting performance requiring heater plugs.
(ii) Specific fuel consumption is high because there is a loss of pressure dueto air motion through the duct and heat loss due to large heat transferarea.

358 IC Engines
Review Questions
11.1 What are homogeneous and heterogeneous mixtures? In which enginesthese mixtures are used? Explain.
11.2 Briefly explain the stages of combustion in SI engines elaborating theflame front propagation.
11.3 Explain the various factors that influence the flame speed.
11.4 What is meant by abnormal combustion? Explain the phenomena ofknock in SI engines.
11.5 Explain the effect of various engine variables on SI engine knock.
11.6 What are the various types of combustion chambers used in SI engines?Explain them briefly.
11.7 Bring out clearly the process of combustion in CI engines and also ex-plain the various stages of combustion.
11.8 What is delay period and what are the factors that affect it?
11.9 Explain the phenomenon of knock in CI engines and compare it with SIengine knock.
11.10 Explain with figures the various types of combustion chambers used inCI engines.
Multiple Choice Questions (choose the most appropriate answer)
1. In SI engines maximum flame speed is obtained when the equivalentratio is between
(a) 1.1 and 1.2
(b) 1.0 and 1.1
(c) 1.2 and 1.3
(d) less than 1
2. In SI engines flame speed increases
(a) with turbulence
(b) with fuel-air ratio
(c) both (a) and (b)
(d) none of the above
3. With increase in compression ratio flame speed
(a) increases
(b) decreases
(c) remains the same
(d) none of the above

Combustion and Combustion Chambers 359
4. With increase in speed the crank angle required for flame propagation
(a) increases
(b) decreases
(c) not affected
(d) none of the above
5. Increasing the compression ratio in SI engines the knocking tendency
(a) decreases
(b) increases
(c) not affected
(d) none of the above
6. Decreasing the cooling water temperature in SI engines the knockingtendency
(a) increases
(b) decreases
(c) not affected
(d) none of the above
7. Detonation in SI engines occur due to
(a) preignition of the charge before the spark
(b) sudden ignition of the charge before the spark
(c) autoignition of the charge after the spark in struck
(d) none of the above
8. Desirable characteristics of the combustion chamber for SI engines toavoid knock is
(a) small bore
(b) short ratio of flame path to bore
(c) absence of hot surfaces in the last region of the charge
(d) all of the above
9. In CI engines with increase in compression ratio the delay period
(a) increases
(b) decreases
(c) first increases and then decreases
(d) not affected

360 IC Engines
10. Knocking takes place in CI engines
(a) at the start of combustion
(b) at the end of combustion
(c) during combustion
(d) none of the above
11. In CI engines knocking tendency increases with
(a) increase in compression ratio
(b) increasing inlet temperature of air
(c) decrease in compression ratio
(d) increasing coolant water temperature
12. In CI engines by increasing inlet air pressure the knocking tendency
(a) increases
(b) decreases
(c) not affected
(d) first decreases and then increases
13. Open combustion chambers in CI engines require
(a) high injection pressures
(b) accurate metering of fuel by the injection system
(c) both (a) and (b)
(d) none of the above
14. The advantages of the indirect injection combustion chambers are
(a) low injection pressure
(b) direction of spray is not critical
(c) both (a) and (b)
(d) good cold starting performance
15. In CI engines the delay period is affected by
(a) compression ratio
(b) engine speed
(c) output
(d) all of the above
Ans: 1. – (a) 2. – (c) 3. – (a) 4. – (c) 5. – (b)6. – (b) 7. – (c) 8. – (d) 9. – (b) 10. – (a)
11. – (c) 12. – (b) 13. – (c) 14. – (c) 15. – (d)

12ENGINE FRICTION
AND LUBRICATION
12.1 INTRODUCTION
Friction generally refers to forces acting between surfaces in relative motion.In engines, frictional losses are mainly due to sliding as well as rotating parts.Normally, engine friction, in its broader sense, is taken as the difference be-tween the indicated power, ip, and the brake power, bp. Usually engine fric-tion is expressed in terms of frictional power, fp. Frictional loss is mainlyattributed to the following mechanical losses.
(i) direct frictional losses
(ii) pumping losses
(iii) power loss to drive the components to charge and scavenge
(iv) power loss to drive other auxiliary components
A good engine design should not allow the total frictional losses to be morethan 30% of the energy input in reciprocating engines. It should be the aim ofa good designer to reduce friction and wear of the parts subjected to relativemotion. This is achieved by proper lubrication. In this section the variouslosses associated with friction is enumerated.
12.1.1 Direct Frictional Losses
It is the power absorbed due to the relative motion of different bearing surfacessuch as piston rings, main bearings, cam shaft bearings etc. Since, there area number of moving parts, the frictional losses are comparatively higher inreciprocating engines.
12.1.2 Pumping Loss
In case of the four-stroke engines a considerable amount of energy is spentduring intake and exhaust processes. The pumping loss is the net powerspent by the engine (piston) on the working medium (gases) during intakeand exhaust strokes. In the case of two-stroke engines this is negligible sincethe incoming fresh mixture is used to scavenge the exhaust gases.

362 IC Engines
12.1.3 Power Loss to Drive Components to Charge and Scavenge
In certain types of four-stroke engines the intake charge is supplied at a higherpressure than the naturally aspirated engines. For this purpose a mechani-cally driven compressor or a turbine driven compressor is used. Accordinglythe engine is called the supercharged or turbocharged engine. In case of asupercharged engine, the engine itself supplies power to drive the compressorwhereas in a turbocharged engine, the turbine is driven by the exhaust gasesof the engine. These devices take away a part of the engine output. This lossis considered as negative frictional loss. In case of two-stroke engines with ascavenging pump, the power to drive the pump is supplied by the engine.
12.1.4 Power Loss to Drive the Auxiliaries
A good percentage of the generated power output is spent to drive auxiliariessuch as water pump, lubricating oil pump, fuel pump, cooling fan, generatoretc. This is considered a loss because the presence of each of these componentsreduces the net output of the engine.
12.2 MECHANICAL EFFICIENCY
The various losses described above can be clubbed into one heading, viz., themechanical losses. The mechanical losses can be written in terms of meaneffective pressure that is frictional torque divided by engine displacement vol-ume per unit time. Therefore, frictional mean effective pressure, fmep, canbe expressed as
fmep = mmep + pmep + amep + cmep
where mmep : mean effective pressure required to over-come mechanical friction
pmep : Mean effective pressure required forcharging and scavenging
amep : mean effective pressure required to drivethe auxiliary components
cmep : mean effective pressure required to drivethe compressor or scavenging pump
Because of the various mechanical losses in the engine the term mechani-cal efficiency is usually associated with the reciprocating internal combustionengine.
As already explained in Chapter 1, mechanical efficiency is defined as theratio of bp to ip or bmep to imep. It is written as
ηm =bp
ip=
bmep
imep
Knowledge of engine friction is essential for calculating the mechanical ef-ficiency of the engine. Mechanical efficiency indicates how good an engine is,
Engine Friction and Lubrication 363
in converting the indicated power to useful power. The value of mechanicalefficiency varies widely with the design and operating conditions. It is ev-idently zero under idling conditions, i.e. all the indicated power developedby the engine is spent in overcoming friction. It should be the aim of anydesigner to increase the mechanical efficiency to the maximum by reducingthe frictional losses to a minimum.
12.3 MECHANICAL FRICTION
As mentioned earlier, friction loss comes into picture in the bearing surfacesof the engine components due to their relative motion. Mechanical frictionin engine may be divided into six classes which are discussed in the followingsections.
12.3.1 Fluid-film or Hydrodynamic Friction
The hydrodynamic friction is associated with the phenomena when a completefilm of lubricant exists between the two bearing surfaces. In this case thefriction force entirely depends on the lubricant viscosity. This type of frictionis the main mechanical friction loss in the engine.
12.3.2 Partial-film Friction
When rubbing (metal) surfaces are not sufficiently lubricated, there is a con-tact between the rubbing surfaces in some regions. During normal engineoperation there is almost no metallic contact except between the compression(top) piston ring and cylinder walls. This is mainly at the end of each strokewhere the piston velocity is nearly zero. During starting of the engine, thejournal bearings operate in partial-film friction. Thus, partial-film frictioncontributes very little to total engine friction and hence, it may be neglected.
12.3.3 Rolling Friction
The rolling friction is due to rolling motion between the two surfaces. Ball androller bearings and tappet rollers are subjected to rolling friction. Bearings ofthis type have a coefficient of friction which is nearly independent of load andspeed. This friction is partly due to local rubbing from distortion under loadand partly due to continuous climbing of roller. Rolling friction coefficientis lower than journal bearing friction coefficient during starting and initialrunning of engine. The reason is that the oil viscosity is high and more-over, partial friction exists in journal bearing during starting where engineuses plain journal bearings on the crankshaft. Rolling friction is negligiblecompared to total friction.
12.3.4 Dry Friction
Even when an engine is not operated for a long time there is little possibil-ity for direct metal to metal contact. Always some lubricant exists betweenthe rubbing surfaces even after long periods of disuse. One can take thedry friction to be non-existent and hence, this can be safely neglected whileconsidering engine friction.
364 IC Engines
12.3.5 Journal Bearing Friction
A circular cylindrical shaft called journal rotates against a cylindrical sur-face called the bearing. Journal bearings are called partial when the bearingsurface is less than full circumference. The rotary motion may be either con-tinuous or oscillatory. Much theoretical and experimental work has been doneto find the performance of journal bearing under various operating conditions.Engine journal bearing operates under load which varies in magnitude and di-rection with time. However, the same basic relations obtained for ordinaryjournal bearing apply to engine journal bearing but the coefficients of frictionare usually different.
12.3.6 Friction due to Piston Motion
Friction due to the motion of piston can be divided into
(i) viscous friction due to piston
(ii) non-viscous friction due to piston ring
The non-viscous piston ring friction can be further subdivided into
(i) friction due to ring tension
(ii) friction due to gas pressure behind the ring
Tests show that the quantity of the lubricant between the piston and thecylinder wall is normally insufficient to fill the entire space between the pistonand the cylinder wall. The oil film thickness between piston and the cylinderis also affected by the piston side-thrust and the resulting vibrations. Averageoil film thickness between the piston and the cylinder wall varies with loadand speed. Piston friction also depends upon the viscosity of the oil and thetemperature at the various points on the piston.
Piston rings are categorized into compression rings and oil rings. Com-pression rings are on the top portion of the piston to seal against gas pressure.The pressure exerted by the compression ring on the cylinder wall is partlydue to the elasticity of the ring and partly due to the gas pressure which leaksinto the space between the ring and the piston. The gas pressure behind thetop ring (compression ring) is nearly equal to the cylinder pressure, less thanthe cylinder pressure in the second ring groove and much less in the third.
Oil rings are designed to scrape some of the oil from the cylinder wall andallow it to return to the oil sump through radial passage in the ring. Thesegrooves for the rings are vented by holes drilled into the piston interior andtherefore no gas pressure can act behind it. In this case the pressure of thering surface on the cylinder wall is entirely due to the elasticity (tension) ofthe rings. Piston rings press against the cylinder walls at all times because oftheir spring action. Therefore, the friction due to piston motion always exists.
12.4 BLOWBY LOSSES
It is the phenomenon of leakage of combustion products (gases) from thecylinder to the crankcase past the piston and piston rings. It depends on the
Engine Friction and Lubrication 365
compression ratio, inlet pressure and the condition of the piston rings. In caseof worn out piston rings this loss is more. This loss is usually accounted inthe overall frictional losses.
12.5 PUMPING LOSS
The work spent to charge the cylinder with fresh mixture during the suctionstroke and to discharge the combustion products during the exhaust stroke iscalled the pumping loss. This pumping loss may be reduced by increasing thevalve areas. However, this area cannot be greatly increased due to the practi-cal limitation on the availability of space in the cylinder head. Further, enginespeed also plays a role on the pumping loss. For four-stroke engines pump-ing loss may be divided into three parts as shown in the indicator diagram,Fig.12.1.
12.5.1 Exhaust Blowdown Loss
To reduce the work spent by the piston to drive out the exhaust gases theexhaust valve is made to open before piston reaches BDC on its expansionstroke. During this period the combustion gases rush out of cylinder due topressure difference. Because of this there is a certain loss of power indicatedby the area shown in Fig.12.1. This loss is called the blowdown loss. Thismainly depends on the exhaust valve timing and its size. With large valve areaand earlier exhaust valve opening the blowdown loss will be higher whereaswith increase in speed this loss tends to be lower.
12.5.2 Exhaust Stroke Loss
The work required to force the products of combustion out of the cylinder afterthe blowdown process is the exhaust loss. During the starting of blowdownprocess the gas pressure inside the cylinder is more than three to four times thegas pressure inside the exhaust pipe, therefore, the gases flow out with highvelocity. Due to inertia, the high velocity of exhaust gases tends to persisteven during exhaust stroke and the cylinder pressure may momentarily dropbelow the gas pressure in the exhaust pipe. When the piston moves up again,pressure rises and gases are pushed into exhaust pipe. Thus, as mentionedearlier, the power required to drive the exhaust gases out is called the exhaustloss. This loss is shown in indicator diagram. This loss depends on valvesize, valve timing and valve flow coefficient. Increase in valve size, earlyopening of valve and higher valve flow coefficient may tend to reduce exhauststroke loss. Increase in speed increases the exhaust stroke loss. Thus factorslike high speed, late opening of exhaust valve, reduced exhaust valve sizewhich tend to increase the exhaust stroke loss may tend to reduce blowdownloss. The combination of the two losses should be minimal for getting betterperformance from the engine.
12.5.3 Intake Stroke Loss
Energy is supplied to the piston to produce a pressure difference across theinlet valve so that fresh charge could be drawn into the cylinder. This is

366 IC Engines
V
Pumping loss
Exhaust blowdown loss
Heat transfer loss
Real combustion loss
p
Fig. 12.1 Pumping and blowdown losses
done to overcome the friction and inertia of the gas in the intake system andthe power spent by the piston for doing this is called the intake stroke loss.The combination of intake and exhaust stroke loss is called the pumping lossillustrated in the Fig.12.1.
12.6 FACTORS AFFECTING MECHANICAL FRICTION
Various factors affect the engine friction. In this section, the effect of some ofthese factors on mechanical friction is discussed.
12.6.1 Engine Design
The design parameters which influence the friction losses are:
(i) Stroke-bore Ratio : Lower stroke-bore ratio may tend to slightly de-crease the fmep. It is mainly due to less frictional area in case of lowerstroke to bore ratio.
(ii) Effect of Engine Size : Larger engines have more frictional surfaces.Hence, lubrication requirements are more in such engines.
(iii) Piston Rings : Reducing the number of piston rings and reducing thecontacting surface of the ring with cylinder wall reduces the friction.Light ring pressure also reduces the friction.

Engine Friction and Lubrication 367
(iv) Compression Ratio : The friction mean effective pressure increases withincrease in compression ratio. But the mechanical efficiency either re-mains or may improve slightly because of the increase in the imep.
(v) Journal Bearings : Reducing journal diameter/diametrical clearance ra-tio in journal bearing reduces the fmep. Short pistons with reducedmass along the gudgeon pin axis will minimize inertia loads. This inturn will reduce the friction loss.
12.6.2 Engine Speed
Friction increases rapidly with increasing speed. At higher speeds mechanicalefficiency starts deteriorating considerably. This is one of the reasons forrestricting the speeds of engines.
12.6.3 Engine Load
Increasing the load increases the maximum pressure in the cylinder whichresults in slight increase in friction values. At the same time increases in loadresults in increase in temperature inside the cylinder and also temperature ofthe lubricating oil. The decrease in oil viscosity due to higher temperatureslightly reduces the friction.
In gasoline engines the throttling losses reduce as the throttle is openedmore so as to supply more fuel. Results of the above may tend to bring downthe frictional losses in such engines (SI engine). However, for diesel enginesthe frictional losses due to engine load are more or less constant since thereis no throttling effect.
12.6.4 Cooling Water Temperature
A rise in cooling water temperature slightly reduces engine friction by reducingoil viscosity. Friction losses are high during starting since temperature of waterand oil are low and viscosity is high.
12.6.5 Oil Viscosity
Viscosity and friction loss are (directly) proportional to each other. Theviscosity can be reduced by increasing the temperature of the oil. But beyonda certain value of oil temperature, failure of local oil film may occur resultingin partial fluid film friction or even metal to metal contact which is veryharmful to the engine.
12.7 LUBRICATION
From the above discussion it can be understood that lubrication is essentialto reduce friction and wear between the components in an engine. In thefollowing sections the details of engine lubrication are discussed.

368 IC Engines
12.7.1 Function of Lubrication
Lubrication is an art of admitting a lubricant (oil, grease, etc.) between twosurfaces that are in contact and in relative motion. The purpose of lubricationin an engine is to perform one or several of the following functions.
(i) To reduce friction and wear between the moving parts and thereby theenergy loss and to increase the life of the engine.
(ii) To provide sealing action e.g. the lubricating oil helps the piston rings tomaintain an effective seal against the high pressure gases in the cylinderfrom leaking out into the crankcase.
(iii) To cool the surfaces by carrying away the heat generated in enginecomponents.
(iv) To clean the surfaces by washing away carbon and metal particles causedby wear.
Of all these functions, the first function is considered to be the most im-portant one. In internal combustion engines, the problems of lubricationbecome more difficult because of the high temperatures experienced duringthe combustion process and by the wide range of temperatures encounteredthroughout the cycle. As stated earlier, the energy loss from the frictionbetween different components of the engine can be minimized by providingproper lubrication.
Moreover, because of the variation in the gas force on the piston and the in-ertia force of the moving parts, the bearings are subjected to fluctuating loadswhere effective lubrication at all operating conditions is extremely difficult.The temperature extremes are emphasized to minimize starting problems dur-ing which the flow of lubricating oil is difficult. Therefore, the moving partsmay suffer from inadequate supply of lubricating oil and metal to metal con-tact may result. The basic problems associated with the proper lubricationof the various types of bearings encountered in an internal combustion enginewill be discussed in general in this chapter. In addition, the properties of lu-bricating oils, the effect of engine operation on these properties and the typesof lubricating systems will also be discussed.
12.7.2 Mechanism of Lubrication
Consider two solid blocks which are in contact with each other. In order tomove the upper block over the surface of the lower block, a constant tangentialforce must be applied. The force due to the weight of the upper block actingperpendicular to the surface is called the normal force. The ratio of thetangential force to the normal force is known as the dynamic coefficient offriction or the coefficient of friction, f .
Coefficient of friction, f =Tangential force
Normal force
To keep the block in motion, a constant tangential force is required toovercome the frictional resistance between the two surfaces. This frictional

Engine Friction and Lubrication 369
resistance arises because the moving surfaces are rough, and hence small irreg-ularities will fit together at the contact area (interface) to give a mechanicallock to the motion. Also, if the moving surfaces are too smooth, the molecularattraction will be more in the interface and will resist the motion. Therefore,friction between dry surfaces may arise either from surface irregularities orfrom molecular attraction or from both.
The coefficient of friction between two dry surfaces tends to be constantand independent of the load (normal force), relative speed and contact areasof the surfaces but varies with the materials and the surface finish.
The resistance between moving surfaces can be reduced by the introductionof a small film of lubricant between the moving surfaces so that the twosurfaces are not in physical contact. The lubricant film layer provides lesserresistance than that of the solid surface and hence less force is required toaccomplish a relative motion. The friction due to surface irregularities andlarger molecular attraction is also reduced. The solid friction is replaced witha definitely lesser fluid friction.
Consider the case of two parallel plates filled with viscous oil in betweenthem, of which one is stationary and other is in motion with a constant velocityin the direction as shown in Fig.12.2. It is assumed that
(i) the width of the plates in the direction perpendicular to the motion islarge so that the flow of lubricant in this direction is negligibly small
(ii) the fluid is incompressible
Let us imagine the film as composed of a series of horizontal layers and theforce, F causing layers to deform or slide one over another, just like a deckof cards. The first layer clinging to the moving surface will move with the
V=0
V=u
u
Fig. 12.2 Mechanism of lubrication in parallel surfaces
plate because of the adhesive force between the plate and the oil layer whilethe next layer is moving by at slower pace. The subsequent layers below keepmoving at gradually reducing velocities. The layer clinging to the surface ofthe stationary plate will have zero velocity. The reason is that each layer ofthe oil is subjected to a shearing stress and the force required to overcome thisstress is the fluid friction. Thus the velocity profile across the oil film varies

370 IC Engines
from zero at the stationary plate to the velocity of the plate at the movingsurface, as shown in Fig.12.2.
In the above example, the fluid or internal friction arose because of theresistance of the lubricant to shearing stress. A measure of the resistance toshear is a property called dynamic viscosity or coefficient of viscosity.
Now let us consider that the above mentioned plates are non-parallel andthe upper one (A B ) is moving while the lower one (AB) remains stationary.The cross section of the fluid at the leading edge is less than that of thetrailing edge. This arrangement is shown in Fig.12.3. The discussion withregard to Fig.12.2 indicates that the velocity distributions across the oil filmat the edges are expected to have the shape shown by dotted line in Fig.12.3.But as the fluid is incompressible, the actual volume of oil carried into the
N
L
A'
A
y
HC'
J
J'
U
K' B'
U U
D'
I
B
W M
α
Fig. 12.3 Mechanism of lubrication on wedge shaped surfaces
space at the trailing edge must be equal to the volume discharged from thisspace at the leading edge. Therefore, the excess volume of oil carried intothe space is squeezed out through either ends producing a constant pressure,which induces a flow through these sections. It is to be remembered that thewidth of the plates is assumed to be large so that there is no leakage alongthe side ends of the plate. In addition, the viscosity of the fluid also retardsthe escape of lubricant resulting from the squeezing action of the normalfaces that tends to bring the surface together. This creates a pressure inthe lubricant film. Therefore, the actual velocity distribution in the sectionat the edges is the result of the combined flow of lubricant due to pressureinduced flow and due to viscous drag, which is indicated by continuous lines(curved lines) across the section at the edges. This oil film pressure enablesto carry the load. This type of lubrication where a wedge shaped oil film isformed between two moving surface is called hydrodynamic lubrication. Theimportant feature of this type of lubrication is that the load carrying capacityof the bearing increases with increase in relative speed of the moving surfaces.This is because at high speed, the available time for the oil to squeeze out isless and hence the pressure rise tends to be high.
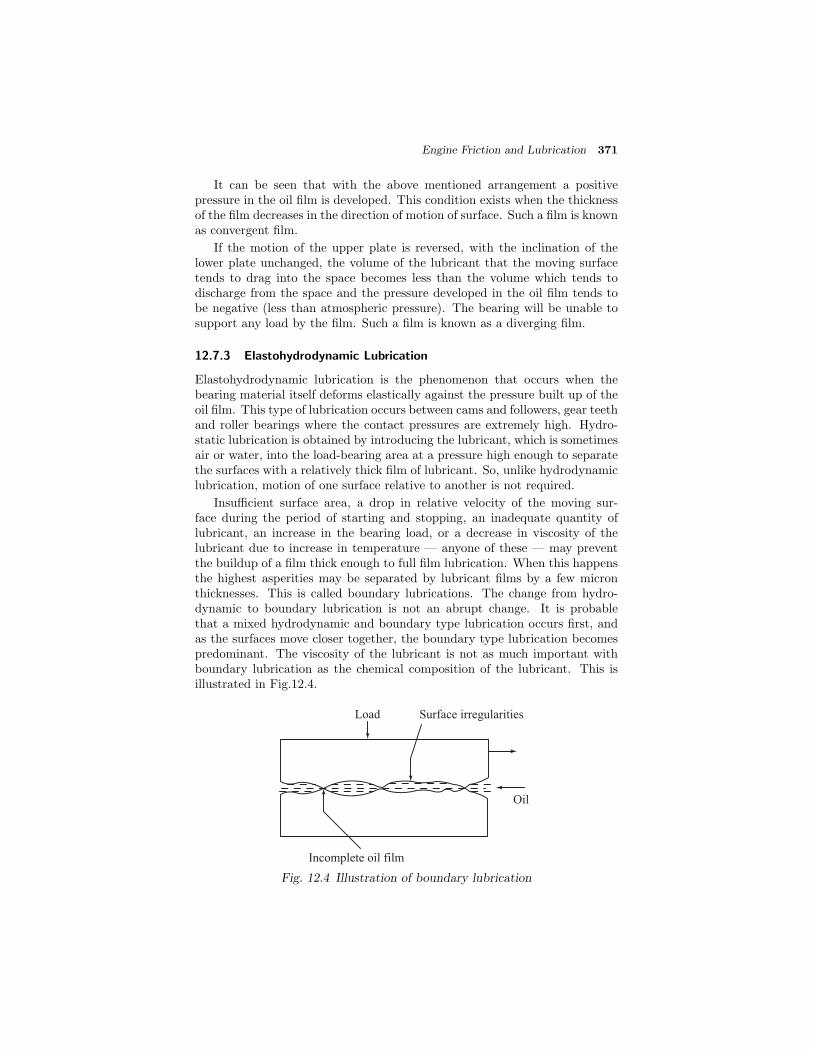
Engine Friction and Lubrication 371
It can be seen that with the above mentioned arrangement a positivepressure in the oil film is developed. This condition exists when the thicknessof the film decreases in the direction of motion of surface. Such a film is knownas convergent film.
If the motion of the upper plate is reversed, with the inclination of thelower plate unchanged, the volume of the lubricant that the moving surfacetends to drag into the space becomes less than the volume which tends todischarge from the space and the pressure developed in the oil film tends tobe negative (less than atmospheric pressure). The bearing will be unable tosupport any load by the film. Such a film is known as a diverging film.
12.7.3 Elastohydrodynamic Lubrication
Elastohydrodynamic lubrication is the phenomenon that occurs when thebearing material itself deforms elastically against the pressure built up of theoil film. This type of lubrication occurs between cams and followers, gear teethand roller bearings where the contact pressures are extremely high. Hydro-static lubrication is obtained by introducing the lubricant, which is sometimesair or water, into the load-bearing area at a pressure high enough to separatethe surfaces with a relatively thick film of lubricant. So, unlike hydrodynamiclubrication, motion of one surface relative to another is not required.
Insufficient surface area, a drop in relative velocity of the moving sur-face during the period of starting and stopping, an inadequate quantity oflubricant, an increase in the bearing load, or a decrease in viscosity of thelubricant due to increase in temperature — anyone of these — may preventthe buildup of a film thick enough to full film lubrication. When this happensthe highest asperities may be separated by lubricant films by a few micronthicknesses. This is called boundary lubrications. The change from hydro-dynamic to boundary lubrication is not an abrupt change. It is probablethat a mixed hydrodynamic and boundary type lubrication occurs first, andas the surfaces move closer together, the boundary type lubrication becomespredominant. The viscosity of the lubricant is not as much important withboundary lubrication as the chemical composition of the lubricant. This isillustrated in Fig.12.4.
Surface irregularities
Oil
Load
Incomplete oil film
Fig. 12.4 Illustration of boundary lubrication

372 IC Engines
12.7.4 Journal Bearing Lubrication
Let us examine the formation of a lubricant film in a journal bearing. Fig.12.5shows a full journal bearing, with the clearance greatly exaggerated. Assumethat the space between the journal and bearing is filled with a fluid lubricant.In Fig.12.5(a), the journal loaded by a vertical load, W , is at rest.
W W W W
n
m p s
l q t
(a) (b) (c) (d)
Oil supply groove
Bearing
Lubricant
Journal
s
t
Oil film pressureOil supply groove
Load
Load
Wedge
s
t
Journal
(e) (f)
α
Bearing
Fig. 12.5 Mechanism of lubrication of journal bearings
In this case the metal to metal contact between the surface of the journaland the bearing is at point n on the line of action of the load. If the journalis just beginning to rotate in an anti-clockwise direction, it tends to climbor roll up the left side of the bearing. Under these conditions, a dry bearingequilibrium is obtained when the friction force is balanced by the tangentialcomponent of the bearing load. Therefore, the point of contact will move intoposition m [Fig.12.5(b)].
It is easy to see that if the speed is quite low, the pressure built in thefilm can be neglected. The angle α is equal to the angle of sliding frictionbetween the surfaces. With fluid lubricant present, the friction in this casecorresponds to the conditions of boundary or extreme boundary conditions.
Engine Friction and Lubrication 373
In this position, the continuous oil film consists of two parts, a convergentpart above the line m- and a divergent part below this line. As explainedpreviously, under such conditions a positive pressure is developed in the con-verging parts of the oil film. This pressure makes the journal to move to theright. Therefore, with an increase in journal speed, the pressure forces willovercome at the point of contact and will move the journal to the right asshown in Fig.12.5(c).
When the journal reaches a certain speed, the journal is lifted up as shownin Fig.12.5(d) because of the oil pressure. The centre of the journal has movedto such a position that the minimum film thickness is now at point s. From sto t in the direction of motion the oil film is diverging film and t to s it is aconverging film and therefore is able to support the load.
An oil film pressure is developed as shown in Fig.12.5(e), the journal isthus operating in the thick film region and the load is carried by the wedgeof oil, shown as the shaded area in Fig.12.5(e). To form and to maintain thefluid film, it is necessary to supply a sufficient quantity of lubricant to replacethat lost due to end leakage from the bearing and to prevent rupture. Thiswill enable a continuous film around the journal. The proper place where thelubricant must be introduced into the bearing is where the film pressure islow. The part of the film s to t in the direction of motion is diverging. Fromthe foregoing discussion it is clear that no positive pressure can be developedin this region. On the contrary a negative pressure is expected in this region,which may cause a break in the film. This region can be utilized to supplythe lubricant so that a continuous oil film can be maintained. If an oil supplygroove is cut in the loaded region as in Fig.12.5(f) the oil film pressure isreduced, resulting in a large reduction in load carrying capacity.
As discussed earlier, if the surface velocity of the journal is high enough andif there is sufficient oil supply, enough oil pressure may be developed due tothe creation of wedge film to raise the shaft off the bearing. The same wedgefilm can be created if either the journal is held stationary and the bearingrotates or both rotate. The reader should apply the same reasoning for thehydrodynamic pressure development for the journal rotation and stationarybearing as discussed previously. The relative velocity between journal andthe bearing plays a vital role in the hydrodynamic pressure development andhence, the load carrying capacity. In addition, the load may also vary eitherin magnitude (fluctuating) or in direction (rotating) or both. For example,the bearings of the crankshafts of an internal combustion engine are subjectedto a fluctuating and rotating load.
In some other cases, the bearing may still support a load even when thejournal and bearing are held stationary but the load is rotating. Also frominvestigations, one interesting phenomenon noted is that the bearing will notsupport any load when it is stationary and the load rotates at one half of thespeed and also in the same direction as the journal. As regard to the pistonpins, the wedge action due to rotation is absent as neither the journal northe bearing rotates. However, the loads on the piston pins are adequatelysupported and the piston pin bushings rarely fail in practice. The r on for theabove is as discussed below.
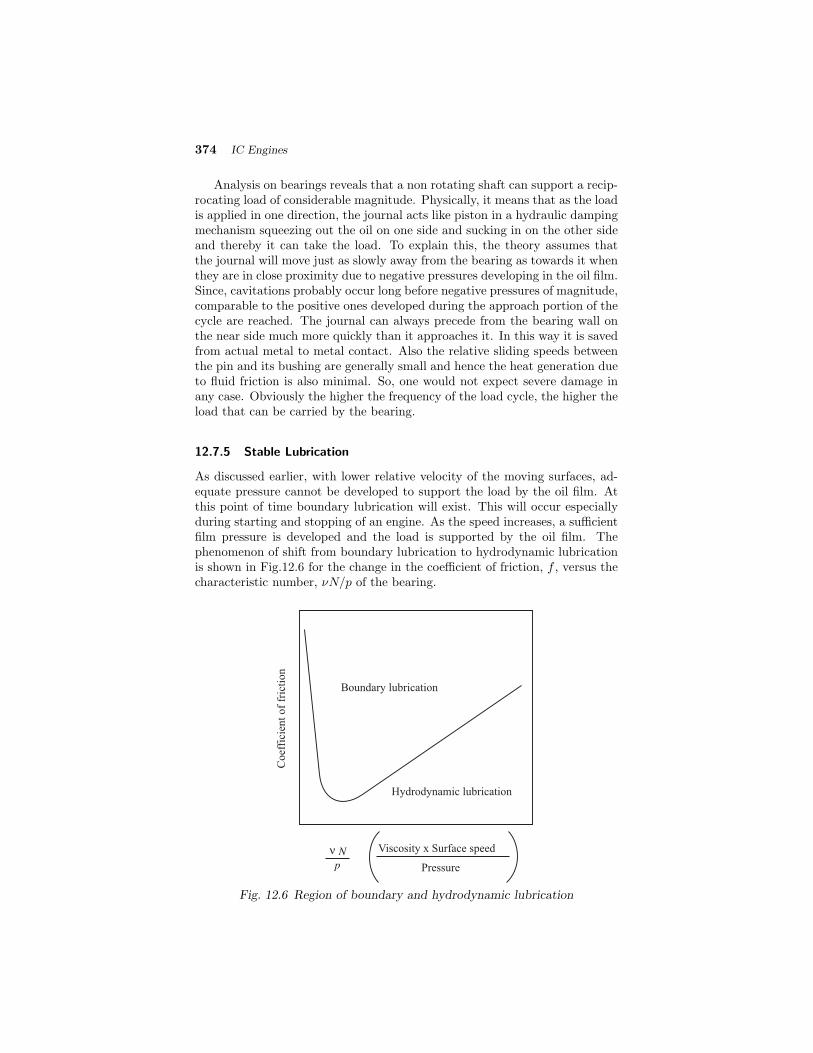
374 IC Engines
Analysis on bearings reveals that a non rotating shaft can support a recip-rocating load of considerable magnitude. Physically, it means that as the loadis applied in one direction, the journal acts like piston in a hydraulic dampingmechanism squeezing out the oil on one side and sucking in on the other sideand thereby it can take the load. To explain this, the theory assumes thatthe journal will move just as slowly away from the bearing as towards it whenthey are in close proximity due to negative pressures developing in the oil film.Since, cavitations probably occur long before negative pressures of magnitude,comparable to the positive ones developed during the approach portion of thecycle are reached. The journal can always precede from the bearing wall onthe near side much more quickly than it approaches it. In this way it is savedfrom actual metal to metal contact. Also the relative sliding speeds betweenthe pin and its bushing are generally small and hence the heat generation dueto fluid friction is also minimal. So, one would not expect severe damage inany case. Obviously the higher the frequency of the load cycle, the higher theload that can be carried by the bearing.
12.7.5 Stable Lubrication
As discussed earlier, with lower relative velocity of the moving surfaces, ad-equate pressure cannot be developed to support the load by the oil film. Atthis point of time boundary lubrication will exist. This will occur especiallyduring starting and stopping of an engine. As the speed increases, a sufficientfilm pressure is developed and the load is supported by the oil film. Thephenomenon of shift from boundary lubrication to hydrodynamic lubricationis shown in Fig.12.6 for the change in the coefficient of friction, f , versus thecharacteristic number, νN/p of the bearing.
Coef
fici
ent
of
fric
tion
Boundary lubrication
Hydrodynamic lubrication
N
p
ν Viscosity x Surface speed
Pressure
Fig. 12.6 Region of boundary and hydrodynamic lubrication

Engine Friction and Lubrication 375
Here ν is the oil viscosity, p is the pressure and N is the speed. To theleft of the point the hydrodynamic pressure developed by the film is too lowto support the load and metal to metal contact occurs. This is the zoneof boundary lubrication. Even a small reduction in νN/p will increase thecoefficient of friction drastically and will result in more heat generation whichis undesirable for any hydrodynamic bearing.
The bearing operation to the right of this, minimum νN/p point is stable.An increase in bearing temperature reduces the oil viscosity and hence, resultsin lower friction coefficient which gives rise to lower bearing temperature dueto reduced heat generation, thereby stabilizing the bearing temperature.
12.8 LUBRICATION OF ENGINE COMPONENTS
In a reciprocating engine there are many surfaces in contact with each otherand therefore they should be lubricated to reduce friction. The principalfriction surfaces requiring lubrication in an internal combustion engine are
(i) piston and cylinders
(ii) crankshaft and their bearings
(iii) crankpin and their bearings
(iv) wristpin and their bearings
(v) valve gear
12.8.1 Piston
Since the piston and piston rings are exposed to high temperatures, the oilthat is supplied to the cylinder walls must provide proper lubrication underextreme conditions. In addition, the lubricant on the cylinder walls mustfunction as a seal to minimize the amount of the gases of combustion thatpass the piston rings and enter the crankcase.
Pistons of high speed engines used in automobiles, usually do not need anyspecial lubricating provisions. The oil which flows from the main bearings andcrankpin is splashed by the crank webs and connecting rods and the oil mistwhich is formed in the enclosed crankcase by the fast moving parts furnishsufficient lubrication for the pistons. These conditions exist not only whenthe oil in the crankcase is kept at a certain level to allow its pick-up by theconnecting rods but even when the oil level is low in the crankcase because ofthe state of constant ignition in the sump in the many vehicles.
Pistons of low and medium speed engines are lubricated by positive feedmechanical oilers. A positive feed mechanical oiler has a small plunger whichdischarges oil to the cylinder surface during its forward stroke. On its returnstroke a check valve prevents the oil from being sucked back and oil is drawnin through another line.
Tests indicate that the piston rings and cylinders operate in the thin-film lubrication region a great deal of time. Thick-film lubrication wouldresult in excessive oil consumption. In thin film region, oiliness and surface

376 IC Engines
finish will play a vital role in reducing wear and scuffing. A smooth surfacehas flat spots with many small indentations interposed among them. Theseirregularities help the oil to maintain a film on the surface and act as individualoil reservoirs. Surface damage may be further reduced by adding sulphur andchlorine compounds in the lubricant. These compounds convert the materialinto sulphides and chlorides and prevent welding of stressed points. In highspeed engines with higher specific power output an oil gallery is provided bywhich the lubricant helps to remove heat to a greater extent.
12.8.2 Crankshaft Bearings
In small stationary engines, the main bearings of the crankshaft are madewith ring oilers. A ring oiler is nothing but a ring which is slipped over theshaft and runs over the journal. The diameter of the ring is bigger thanthe journal diameters which enable the ring to slip over the shaft when it isrotating. Because of the shaft rotation the ring will also tends to rotate. Whilerotating, the bottom portion of the ring picks up the oil from the reservoir andcarries it to the top of the journal where it is able to flow into the bearing oilgrooves and bearing clearance space, to be distributed to the entire bearingsurface.
For large engines, with open or at least not very tight crankcase, as in thecase of most horizontal engines, the main bearings are lubricated by positivefeed lubricators. Engines with enclosed crankcases as in the case of the mostvertical engines, are usually built with pressure lubrication. The oil is drawnby a gear pump and delivered it to the oil gallery in the crankcase whichdistributes it to the bearings. Oil coming out of the bearing goes to an oilsump where it is picked up by a scavenging pump. Then it is pumped througha filter to oil cooler and to a supply tank from which it flows back to thepressure pump. Usually, the oil is circulated in large quantities as the oil notonly serves as lubricant but also act as a cooling medium to the bearings.
12.8.3 Crankpin Bearings
In small engines, the bearing pressure is low and the crankpins are sometimeslubricated by splashing oil. For this purpose, the bottom of the connectingrod is attached with a dipper which dips into the oil when the connecting rodcomes down. This arrangement is illustrated in Fig.12.7(a).
Small horizontal engines and some two-stroke vertical engines use the cen-trifugal banjo oiler. Fig.12.7(b) shows this kind of arrangement. The oil holeleading to the surface of the crankpin is often drilled at an angle of about 30◦
before the dead centre, so that the upper shell receives oil before the ignitionat a point of relatively low pressure. For a heavy duty engine, the oil is fedfrom the main bearing to the crankpin by a drilled hole. The details areillustrated in Fig.12.7(c).
12.8.4 Wristpin Bearing
In small horizontal engines the wristpin is lubricated by a sight feed oiler.The details of the arrangements are shown in Fig.12.8(a). A special scraper

Engine Friction and Lubrication 377
(a) (b) (c)
Fig. 12.7 Lubrication of crankpin bearings
scoop is provided to scrap the oil dripping from the cylinder walls and thearrangement is illustrated in Fig.12.8(b).
In other vertical engines where the lubricating oil delivered under pressureto the main and crankpin bearings, the wristpin is lubricated by excess oilfrom the crankpin bearing. For this purpose, a hole will be drilled throughthe connecting rod shown. This is illustrated in Fig.12.8(c).
12.9 LUBRICATION SYSTEM
The function of a lubrication system is to provide sufficient quantity of cool,filtered oil to give positive and adequate lubrication to all the moving partsof an engine. The various lubrication systems used for internal combustionengines may be classified as
(i) mist lubrication system
(ii) wet sump lubrication system
(iii) dry sump lubrication system
12.9.1 Mist Lubrication System
This system is used where crankcase lubrication is not suitable. In two-strokeengine, as the charge is compressed in the crankcase, it is not possible to havethe lubricating oil in the sump. Hence, mist lubrication is adopted in practice.In such engines, the lubricating oil is mixed with the fuel, the usual ratio being3% to 6%. The oil and the fuel mixture are inducted through the carburettor.The fuel is vaporized and the oil in the form of mist goes via the crankcase intothe cylinder. The oil which strikes the crankcase walls lubricates the main andconnecting rod bearings, and the rest of the oil lubricates the piston, pistonrings and the cylinder.
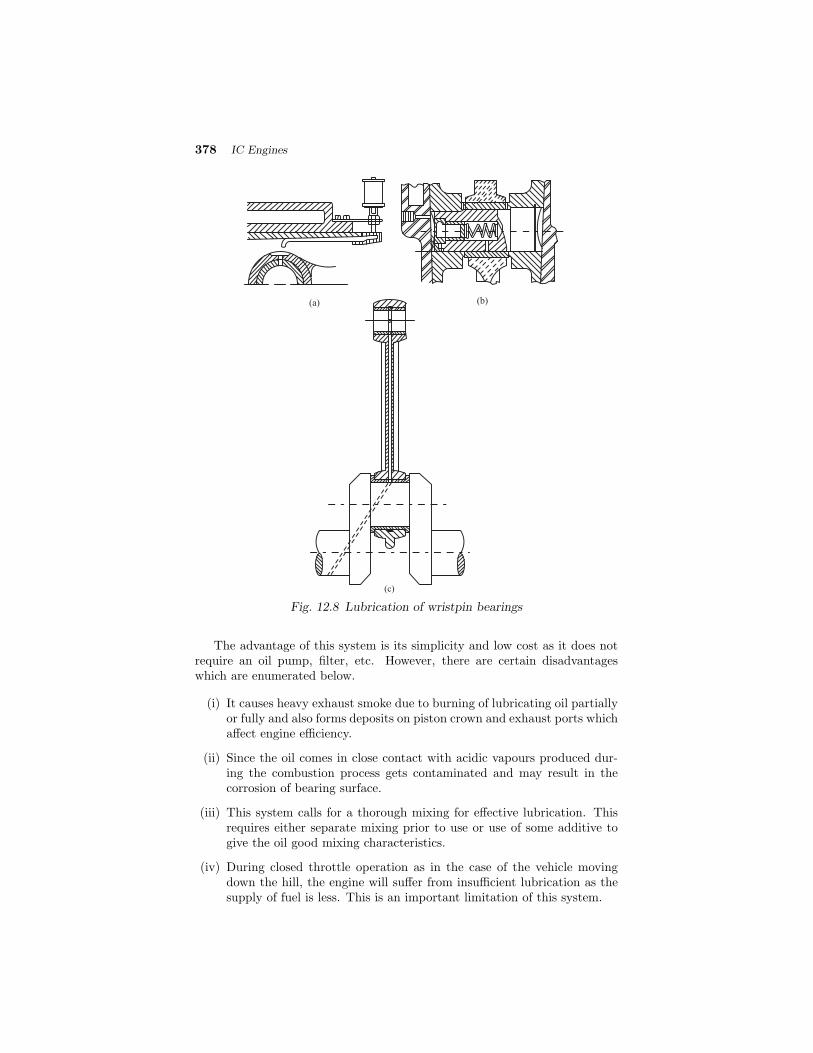
378 IC Engines
(a) (b)
(c)
Fig. 12.8 Lubrication of wristpin bearings
The advantage of this system is its simplicity and low cost as it does notrequire an oil pump, filter, etc. However, there are certain disadvantageswhich are enumerated below.
(i) It causes heavy exhaust smoke due to burning of lubricating oil partiallyor fully and also forms deposits on piston crown and exhaust ports whichaffect engine efficiency.
(ii) Since the oil comes in close contact with acidic vapours produced dur-ing the combustion process gets contaminated and may result in thecorrosion of bearing surface.
(iii) This system calls for a thorough mixing for effective lubrication. Thisrequires either separate mixing prior to use or use of some additive togive the oil good mixing characteristics.
(iv) During closed throttle operation as in the case of the vehicle movingdown the hill, the engine will suffer from insufficient lubrication as thesupply of fuel is less. This is an important limitation of this system.

Engine Friction and Lubrication 379
In some of the modern engines, the lubricating oil is directly injected intothe carburettor and the quantity of oil is regulated. Thus the problem ofoil deficiency is eliminated to a very great extent. In this system the mainbearings also receive oil from a separate pump. For this purpose, they will belocated outside the crankcase. With this system, formation of deposits andcorrosion of bearings are also eliminated.
12.9.2 Wet Sump Lubrication System
In the wet sump system, the bottom of the crankcase contains an oil pan orsump from which the lubricating oil is pumped to various engine componentsby a pump. After lubricating these parts, the oil flows back to the sump bygravity. Again it is picked up by a pump and recirculated through the enginelubricating system. There are three varieties in the wet sump lubricationsystem. They are
(i) the splash system
(ii) the splash and pressure system
(iii) the pressure feed system
Splash System: This type of lubrication system is used in light duty engines.A schematic diagram of this system is shown in Fig.12.9.
Oil pump
Oil troughsLower oil pan
Main bearingConnecting rod bearing
Camshaft
Oil pressure gauge
Oil strainer
Fig. 12.9 Splash lubrication system
The lubricating oil is charged into in the bottom of the engine crankcaseand maintained at a predetermine level. The oil is drawn by a pump anddelivered through a distributing pipe extending the length of the crankcase

380 IC Engines
into splash troughs located under the big end of all the connecting rods.These troughs were provided with overflows and the oil in the troughs istherefore kept at a constant level. A splasher or dipper is provided under eachconnecting rod cap which dips into the oil in the trough at every revolutionof the crankshaft and the oil is splashed all over the interior of the crankcase,into the pistons and onto the exposed portions of the cylinder walls. A holeis drilled through the connecting rod cap through which oil will pass to thebearing surface. Oil pockets are also provided to catch the splashing oil overall the main bearings and also over the camshaft bearings. From the pocketsthe oil will reach the bearings surface through a drilled hole. The oil drippingfrom the cylinders is collected in the sump where it is cooled by the air flowingaround. The cooled oil is then recirculated.
The Splash and Pressure Lubrication System: This system is shownin Fig.12.10, where the lubricating oil is supplied under pressure to main andcamshaft bearings. Oil is also supplied under pressure to pipes which directa stream of oil against the dippers on the big end of connecting rod bearingcup and thus the crankpin bearings are lubricated by the splash or spray ofoil thrown up by the dipper.
Oil pump
Main bearing
Connecting rod bearing
Camshaft
Oil pressure gauge
Oil strainer
Oil jet of dipdirected on rod
Fig. 12.10 Splash and pressure lubrication system
Pressure Feed System: The pressure feed system is illustrated in Fig.12.11in which oil is drawn in from the sump and forced to all the main bearings ofthe crankshaft through distributing channels. A pressure relief valve will alsobe fitted near the delivery point of the pump which opens when the pressurein the system attains a predetermined value. An oil hole is drilled in thecrankshaft from the centre of each crankpin to the centre of an adjacent mainjournal, through which oil can pass from the main bearings to the crankpin

Engine Friction and Lubrication 381
bearing. From the crankpin it reaches piston pin bearing through a holedrilled in the connecting rod. The cylinder walls, tappet rollers, piston andpiston rings are lubricated by oil spray from around the piston pins and themain and connecting rod bearings. The basic components of the wet sumplubrication systems are (i) pump (ii) strainer (iii) pressure regulator (iv) filter(v) breather.
Oil pump
Main bearing
Connecting rod bearing
Camshaft
Oil pressure gauge
Oil strainer
End leakage
Header line
Tappet and cam receive oil
thrown from connecting rod
Fig. 12.11 Pressure feed lubrication system
A typical wet sump and its components are shown in Fig.12.12. Oil isdrawn from the sump by a gear or rotor type of oil pump through an oilstrainer. The strainer is a fine mesh screen which prevents foreign particlesfrom entering the oil circulating systems. A pressure relief valve is providedwhich automatically keeps the delivery pressure constant and can be set toany value. When the oil pressure exceeds that for which the valve is set, thevalve opens and allows some of the oil to return to the sump thereby relievingthe oil pressure in the systems. Fig.12.13 shows a typical gear pump, pressurerelief valve and by-pass. Most of the oil from the pump goes directly tothe engine bearings and a portion of the oil passes through a cartridge filterwhich removes the solid particles from the oil. This reduces the amount ofcontamination from carbon dust and other impurities present in the oil. Sinceall the oil coming from the pump does not pass directly through the filter,this filtering system is called by-pass filtering system. All the oil will passthrough the filter over a period of operation. The advantage of this system isthat a clogged filter will not restrict the flow of oil to the engine.

382 IC Engines
To engine bearings
Oil pump
Oil strainer
Drain plug
Wet sump
Breather
Pressure regulator
Filter
Engine crankcase
Fig. 12.12 Basic components of wet sump lubrication system
Pressure
relief valve
To enginePump inlet
By-pass
Fig. 12.13 Gear type lubricating pump
12.9.3 Dry Sump Lubrication System
A dry sump lubricating system is illustrated in Fig.12.14. In this, the supplyof oil is carried in an external tank. An oil pump draws oil from the supplytank and circulates it under pressure to the various bearings of the engine.Oil dripping from the cylinders and bearings into the sump is removed by ascavenging pump which in turn the oil is passed through a filter, and is fedback to the supply tank. Thus, oil is prevented from accumulating in the baseof the engine. The capacity of the scavenging pump is always greater thanthe oil pump. In this system a filter with a bypass valve is placed in betweenthe scavenge pump and the supply tank. If the filter is clogged, the pressurerelief valve opens permitting oil to by-pass the filter and reaches the supplytank. A separate oil cooler with either water or air as the cooling medium, isusually provided in the dry sump system to remove heat from the oil.

Engine Friction and Lubrication 383
Supply tank
Filter by-pass pressure relief valve
Dry pump
Strainer
Scavenging pump
Filter
Engine crankcase
To bearings
Oil pump
Oil cooler
Pressure
relief valve
Vent
Fig. 12.14 Dry sump lubrication system
12.10 CRANKCASE VENTILATION
During the compression and the expansion strokes the gas inside the cylindergets past the piston rings and enters the crankcase which is called the blowby.It contains water vapour and sulphuric acid if either the oil or the fuel containsappreciable amount of sulphur. They might cause corrosion of steel parts inthe crankcase. This may also promote sludge formation in the lubricatingoil. When the amount of water vapour condensed becomes considerable, incold weather this may freeze and may cause damage to the lubricating oilpump. Hence, it is imperative to remove the blowby from the crankcase. Thisremoval of the blowby can be achieved effectively by passing a constant streamof fresh air through the crankcase known as crankcase ventilation. By doingso, not only all the water vapour but also a considerable proportion of the fuelin the blowby may be removed from the crankcase. The problem of excessivecrankcase dilution and the crankcase corrosion is at least materially lessened.This type of crankcase ventilation is illustrated in Fig.12.15.
The crankcase must have an air inlet and air outlet for the effectivecrankcase ventilation. The breather and oil filter (if any) forms a suitableinlet placed near the forward end of the case where the fan blows the coolingair and an outlet opening is then provided near the rear end of the engineblock and a tube is taken from this outlet to a point below the crankcasewhere rapid flow of air flows past its outlet when the vehicle is in motioncausing an ejector effect. Air enters through the breather on the right, passesthrough the crankcase and exits through a pipe down into the air stream atthe bottom of the crankcase. The outlet from the crankcase should be locatedat a point where the air is comparatively quiescent and therefore does nothold much oil in suspension.
It is also possible to connect the crankcase outlet to the air cleaner, wherethe intake suction serves to ventilate the crankcase and the unburned fuel,

384 IC Engines
Front end
Air in
Rear end
Air and exhaust gases out
Fig. 12.15 Crankcase ventilation
gases as well as the water vapour is then drawn into the cylinders where thefuel has another chance to burn. This scheme, however has been given upevidently in the belief that corrosion might be promoted by circulating thesevapours through the engine.
12.11 PROPERTIES OF LUBRICANTS
The duties of the lubricant in an engine are many and varied in scope. Thelubricant is called upon to limit and control the following:
(i) friction between the components and metal to metal contact
(ii) overheating of the components
(iii) wear and corrosion of the components
To accomplish the above functions, the lubricant should have
(i) suitable viscosity
(ii) oiliness to ensure adherence to the bearings, and for less friction andwear when the lubrication is in the boundary region, and as a protectivecovering against corrosion
(iii) high strength to prevent the metal to metal contact and seizure underheavy load
(iv) should not react with the lubricating surfaces
(v) a low pour point to allow flow of the lubricant at low temperatures tothe oil pump
(vi) no tendency to form deposits by reacting with air, water, fuel or theproducts of combustion
(vii) cleaning ability, nontoxic, non-inflammable, non-foaming characteristics
(viii) low cost
Engine Friction and Lubrication 385
12.11.1 Viscosity
The viscosity of the oil at the temperature and pressure of the operation mustbe compatible with the load and speed to ensure hydrodynamic lubrication.In general, large clearances and high loads require high-viscosity oils whereashigh speeds require low viscosity oils. Hence, the oil supplied must be in aposition to meet the variable viscosity requirements.
Viscosity Index: The viscosity index is a measure of change in viscosity ofan oil with temperature as compared to two reference oils having the sameviscosity at 100 ◦C. It is an empirical number wherein typical Pennsylvania(paraffinic base) oil is assigned an index of 100 and Gulf Coast (naphthenic-base) oil is assigned an index of zero. In general, the high viscosity indexnumber indicates relatively a smaller change in viscosity with temperature. Alow index number for a given oil indicates relatively large change of viscositywith temperature.
Thus, the viscosity index of a lubricating oil is an important factor whereextreme range of temperature is encountered. The oil must necessarily main-tain sufficient viscosity at operating temperatures. Yet it should not be tooviscous for starting of the engine especially at low temperature. Normally, ahigh viscosity index is preferred for engine lubrication, because of relativelysmaller changes in viscosity of the oil with temperature.
12.11.2 Flash and Fire Points
The flash point of an oil is the minimum temperature at which sufficientflammable vapour is driven off to flash when brought into contact with aflame. The fire point is the minimum temperature at which the inflammablevapours will continue to form and steadily burn once ignited. Flash and firepoints may vary with the nature of the original crude oil, the viscosity andthe method of refining. For the same viscosities and degree of refinement, theparaffinic oils have higher flash and fire points than naphthenic oils.
12.11.3 Cloud and Pour Points
Petroleum oils when cooled may become plastic solids as a result of either ofpartial separation of wax or of congealing of the hydrocarbons. With someoils, the separation of wax becomes visible at temperatures slightly abovethe solidification point and this temperature (under prescribed condition) isknown as the cloud point. With oils in which the separation is invisible, thecloud point cannot be determined. That temperature at which the oil will notflow when the test container is tilted under prescribed conditions is known asthe pour point.
The pour point indicates the lowest temperature at which an oil stopsflowing to the pump, bearings or cylinder walls. It is particularly importantfor immediate oil circulation in respect of starting of engines in very coldclimates with gravity lubricating systems the fluidity is a factor of pour pointand viscosity of the cold oil. Pour point depressants may be added to waxcontaining oils to lower the pour points instead of dewaxing the oil.

386 IC Engines
12.11.4 Oiliness or Film Strength
Oiliness or film strength of a lubricant is a measure of the protective filmbetween shaft and bearing. Thus two oils of identical viscosity may showdifferences in their coefficients of friction in the boundary region because ofthe difference in their oiliness. Most probably, the lubricant reacts with thebearing on shaft to form a protective grease or soap, thus giving rise to thelower coefficient of friction (higher oiliness). Film strength refers to the abilityof the lubricant to resist welding and scuffing. The lubricating oil used mustbe of enough film strength to take care of welding and scuffing.
12.11.5 Corrosiveness
The oil should be noncorrosive and should protect against corrosion. It isprobable that the absorbed film that rises to the level of oiliness is also relatedto the protection of the surface against corrosion.
12.11.6 Detergency
An oil has the property of detergency if it acts to clean the engine deposits.A separate property is the dispersing ability which enables the oil to carrysmall particles uniformly distributed without agglomeration. In general, theterm is the name for both detergent and dispersing properties.
12.11.7 Stability
The ability of oil to resist oxidation that would yield acids, lacquers andsludge is called stability. Oil stability demands low-temperature (under 90◦C) operation and the removal of all hot areas from contact with the oil.
12.11.8 Foaming
Foaming describes the condition where minute bubbles of air are held in theoil. This action accelerates oxidation and reduces the mass flow of oil to thebearings thus reducing the hydrodynamic pressure in the bearing and hencethe load bearing capacity of the bearing.
12.12 SAE RATING OF LUBRICANTS
Selection of the lubricant for engine application is based on the temperature atwhich the engine is to be started and operated and the type of service to whichthe engine is to be subjected to. The SAE (Society of Automotive Engineers)has been the first organization that in June 1911 developed the SAE J300standard that specifies Engine Oil Viscosity Classification. Therefore, gradeof the engine oil is defined by SAE J300 standard. They have specified twogrades for engine applications.
12.12.1 Single-grade
A single-grade engine oil cannot use a polymeric Viscosity Index Improveradditive. SAE J300 has eleven viscosity grades, of which six are consideredWinter-grades and given a W designation. The eleven viscosity grades are

Engine Friction and Lubrication 387
0W, 5W, 10W, 15W, 20W, 25W, 20, 30, 40, 50, and 60. These numbers areoften referred to as the ’weight’ of a motor oil; and single-grade motor oils areoften called ”straight-weight” oils.
For single winter grade oils, the dynamic viscosity is measured at differentcold temperatures in units of mPa or the equivalent older non-SI units, cen-tipoise (cP), using two different test methods viz., the cold cranking simulator(ASTMD5293) and mini-rotary viscometer (ASTMD4684).
Based on the coldest temperature at which the oil can flow, it is gradedas 0W, 5W, 10W, 15W, 20W, or 25W. The lower is the viscosity grade, thelower will be the temperature at which the oil can flow. For example, if anoil can flow at the specifications for 10W and 5W, but fails for 0W, then thatoil must be labeled as an SAE 5W. That oil cannot be labeled as either 0Wor 10W.
For single non-winter grade oils, the kinematic viscosity is measured at atemperature of 100 C in units of mm/s or the equivalent older non-SI units,centistokes (abbreviated cSt).
Based on the range of viscosity the oil falls in at that temperature, the oilis graded as SAE viscosity grade 20, 30, 40, 50, or 60. Higher the viscosity,the higher is the SAE grade.
For applications, where the temperature ranges in use are not very wide,single-grade motor oil is satisfactory; for example, lawn mower engines, in-dustrial applications, and vintage or classic cars.
12.12.2 Multi-grade
The temperature range the oil is exposed to in most automobiles can bewide. For example it can range from cold temperatures in the winter beforethe vehicle is started up, to hot operating temperatures when the vehicle isfully warmed up in hot summer weather. A specific single-grade oil will havehigher viscosity when cold and a lower viscosity at the engine’s operatingtemperature. The difference in viscosities for most single-grade oil is toolarge between the extremes of temperature.
To bring the difference in viscosities closer together, special polymer ad-ditives called Viscosity Index Improvers or V I Is are added to the oil. Theseadditives are used to make the oil a multi-grade though it is possible to have amulti-grade oil without the use of V I Is. The idea is to cause the multi-gradeoil to have the viscosity of the base grade when cold and the viscosity of thesecond grade when hot. This enables one type of oil to be used all year. In fact,when multi-grades were initially developed, they were frequently described asall-season oil.
Present day engine oils are multi grade (viscosity) oils. The multi viscosityoil is one that has a low viscosity when cold (for easier cranking) and a higherviscosity when hot (to provide adequate lubrication). Multi grade oils arerated at two different temperatures. The SAE designation for multi-gradeoils includes two viscosity grades. Multi grade oils are specified as SAE10W30, 20W 40 etc. The first of the double numbers indicates the relative flowability and the second number indicates the relative resistances to film breakdown. For example, a 10W 30 weight oil will flow easily (like a l0W oil) when
388 IC Engines
starting a cold engine. It will then act as a thicker oil (like 30 weight) when theengine warms up to operating temperature. As such, it will provide adequatefilm strength (thickness) when the engine is at full operating temperature.
The service classification by API for diesel engine lubricating oils is subdi-vided into three classes ranging from the least to the most severe service, viz.,DG, DM and DS. These correspond to the Diesel Good, Diesel Medium andDiesel Severe service respectively. There are five service ratings for petrol en-gine lubricating oils: SA,SB, SC, SD and SE. The oil differs in their propertiesand in the additives they contain.
Synthetic oils are now available for use in engines. The manufacturersclaim that these have superior lubricating properties. There are several basictypes of synthetic oils. The type most widely used at present is producedfrom organic acids and alcohols (from plants of various types). A second typeis produced from coal and crude oil.
12.13 ADDITIVES FOR LUBRICANTS
The lubricating oil should possess all the above properties for the satisfactoryengine performance. The modern lubricants for heavy duty engines are highlyrefined which otherwise may produce sludge or suffer a progressive increasein viscosity. For these reasons the lubricants are seasoned by the additionof certain oil-soluble organic compounds containing inorganic elements suchas phosphorus, sulphur, amine derivatives. Metals are added to the mineralbased lubricating oil to exhibit the desired properties. Thus oil soluble organiccompounds added to the present day lubricants to impart one or more of thefollowing characteristics.
(i) anti-oxidant and anticorrosive agents
(ii) detergent-dispersant
(iii) extreme pressure additives
(iv) pour point depressors
(v) viscosity index improvers
(vi) antifoam agent
(vii) oiliness and film-strength agents
12.13.1 Anti-oxidants and Anticorrosive Agents
Oxidation of the lubricating oil is slow at temperatures below 90 ◦C butincrease at an exponential rate when high temperatures are encountered. Ox-idation is undesirable, not only because sludge and varnish are formed but alsobecause of the formation of acids which may be corrosive. Thus the additivehas the dual purpose of preserving both the lubricant and the componentsof the engine. To accomplish these purposes, the additive must nullify theaction of metals in catalyzing oxidation; copper is especially active as an ox-idation catalyst of hydrocarbon. The additives may be alkaline to neutralize
Engine Friction and Lubrication 389
acids formed by oxidation, or, it may be non-alkaline and protect the metalby forming a surface film.
Some additives may unite with oxygen, either preferentially to the oilor else with some already oxidized portion of the oil or fuel contaminant.Other additives might act as metal deactivators and as corrosion shields bychemically combining with the metal. Thus a thin sulphide or phosphidecoating on the metal deactivates those metals that act as catalysts whileprotecting other metals from corrosive attack. Zinc ditinophosphate serves asan anti-oxidant and anticorrosive additive.
12.13.2 Detergent-Dispersant
This type of additives improve the detergent action of the lubricating oil.These additives might be metallic salts or organic acids. The action dueto the additive may arise either from direct chemical reaction or from polarattraction. Thus the additives may chemically combine with the compoundsin the oil that would otherwise form sludge and varnish. On the other hand, ifthe additive and the deposits in the engine are polar compounds, the detergentaction may arise from neutralization of the electric moment of the depositmolecules with that of the additive. In this manner the deposit could beneutralized and would not tend to cling to other molecules or to the surface.Therefore, agglomeration of deposits would be prevented.
12.13.3 Extreme Pressure Additives
At high loads and speeds with high surface temperatures, an extreme pres-sure additive is necessary. Such additives interact with the metal surface toform a complex inorganic film containing iron, oxygen, carbon and hydrogen.Welding is prevented by the presence of the film.
12.13.4 Pour Point Depressors
In order to obtain fluidity or flow of oil at low temperatures, pour pointdepressants is added to the lubricating oils to lower the pour point. An enginehaving a lubricant with higher pour point will not get adequate lubricationduring starting at low ambient temperatures and excessive wear would result.These additives tend to prevent the formation of wax at the low temperaturesencountered in starting.
12.13.5 Viscosity Index Improvers
High molecule polymers are added to the lubricating oils to increase theirviscosity index. An increase in the viscosity index increases the resistance ofan oil to change its viscosity with a change in temperature. A high viscosityindex oil will have good starting characteristics plus satisfactory operation athigh speed and heavy load conditions.
12.13.6 Oiliness and Film Strength Agents
Oiliness and high film-strength can be improved by adding organic sulphur,chlorine and phosphorus compounds.
390 IC Engines
12.13.7 Antifoam Agents
Foaming, to some extent is due to the violent agitation and aeration of the oilthat occurs in an operating engine. The minute particles of air in a foamingoil increase oxidation and reduce the mass flow of oil to the bearings. In addi-tion foaming may cause abnormal loss of oil through the crankcase breather.Antifoam agents are used to reduce the foaming tendencies of the lubricant.Although many chemical compounds are available for this purpose, the mosteffective are the silicone polymers.
Review Questions
12.1 Explain the six classes of mechanical friction and the various factorsaffecting them.
12.2 Explain the various mechanism of lubrication and their functions.
12.3 What are the various components to be lubricated in an engine and ex-plain how it is accomplished?
12.4 Explain and compare the wet sump dry sump lubrication systems.
12.5 What is meant by crankcase ventilation? Explain the details.
12.6 What are the various desired properties of a lubricant and explain howadditives help to achieve the desired properties.
Multiple Choice Questions (choose the most appropriate answer)
1. Mechanical efficiency is the ratio of
(a) brake power to heat input
(b) indicated power to heat input
(c) brake power to indicated power
(d) friction loss to heat input
2. Most commonly used lubrication system in automobiles is the
(a) splash system
(b) pressure system
(c) petrol system
(d) gravity system
3. Friction that occurs between the layers of oil film is called
(a) viscous friction
(b) greasy friction
(c) dry friction
(d) boundary friction
Engine Friction and Lubrication 391
4. Crankcase ventilation is provided
(a) to cool cylinder
(b) to cool crankcase
(c) to cool piston
(d) to remove blowby
5. The most important property of the lubricant is
(a) density
(b) viscosity
(c) thermal conductivity
(d) none of the above
6. The maximum pressure in the lubrication system is controlled by
(a) oil pump
(b) oil filter
(c) valve relief
(d) supply voltage
7. The lubricants commonly used in the automobiles are
(a) animal oils
(b) vegetable oils
(c) mineral oils
(d) cooking oils
8. Detergents are oil additives used to
(a) reduce viscosity
(b) increase fire point
(c) prevent sludge formation
(d) prevent foaming
9. Oil pressure in the dry sump lubrication system is around
(a) 5 bar – 10 bar
(b) 11 bar – 15 bar
(c) 3 bar – 8 bar
(d) 1 bar

392 IC Engines
10. fmep decreases when using
(a) single cylinder engine
(b) smaller number of larger cylinders
(c) larger number of smaller cylinders
(d) none of the above
11. With increase in compression ratio, mechanical efficiency
(a) increases
(b) decreases
(c) remains constant
(d) compression ratio has nothing to do with ηmech
12. Blowby losses are
(a) directly proportional to the inlet pressure
(b) inversely proportional to the inlet pressure
(c) proportional to the square root of inlet pressure
(d) none of the above
13. Most lubrication system is mainly used in
(a) four-stroke petrol engine
(b) four-stroke diesel engine
(c) two-stroke petrol engine
(d) Wankle engine
14. Additives are added in lubricant to have
(a) detergent-dispersant characteristics
(b) pour point depression
(c) antifoam characteristics
(d) all of the above
15. The principal surfaces requiring lubrication in an IC engine are
(a) cylinder head
(b) crankcase
(c) inlet and exhaust manifold
(d) none of the above
Ans : 1. – (c) 2. – (b) 3. – (a) 4. – (d) 5. – (b)6. – (c) 7. – (c) 8. – (c) 9. – (c) 10. – (c)
11. – (a) 12. – (c) 13. – (c) 14. – (d) 15. – (d)

13HEAT REJECTION
AND COOLING
13.1 INTRODUCTION
Internal combustion engines at best can transform about 25 to 35 per cent ofthe chemical energy in the fuel into mechanical energy. About 35 per cent ofthe heat generated is lost to the cooling medium, remainder being dissipatedthrough exhaust and lubricating oil.
During the process of combustion, the cylinder gas temperature oftenreaches quite a high value. A considerable amount of heat is transferredto the walls of the combustion chamber. Therefore, it is necessary to provideproper cooling especially to the walls of the combustion chamber. Due to theprevailing high temperatures, chemical and physical changes in the lubricatingoil may also occur. This causes wear and sticking of the piston rings, scoringof cylinder walls or seizure of the piston. Excessive cylinder-wall temperatureswill therefore cause the rise in the operating temperature of piston head. Thisin turn will affect the strength of piston seriously.
In addition, overheated cylinder head may lead to overheated spark plugelectrodes causing preignition. The exhaust valve may become hot enough tocause preignition or may fail structurally. Moreover, preignition can increasethe cylinder head temperature to the extent of engine failure or complete lossof power.
As the last part of the charge to burn is in contact with the walls of thecombustion space during the burning period, a high cylinder wall or cylinderhead temperature will lead to auto-ignition in SI engines.
In view of the above, the inside surface temperature of the cylinder wallsshould be kept in a range which will ensure correct clearances between parts,promote vaporization of fuel, keep the oil at its best viscosity and prevent thecondensation of harmful vapours. Therefore, the heat that is transferred intothe walls of the combustion chamber is continuously removed by employing acooling system. Almost 30 to 35 per cent of the total heat supplied by the fuelis removed by the cooling medium. Heat carried away by lubricating oil andheat lost by radiation amounts to 5 per cent of the total heat supplied. Unlessthe engine is adequately cooled engine seizure will result. In this chapter thedetails of engine heat transfer, heat rejection and cooling are considered.
13.2 VARIATION OF GAS TEMPERATURE
There is an appreciable variation in the temperature of the gases inside theengine cylinder during different processes of the cycle. Temperature inside the

394 IC Engines
engine cylinder is almost the lowest at the end of the suction stroke. Duringcombustion there is a rapid rise in temperature to a peak value which againdrops during the expansion. This variation of gas temperature is illustratedin Fig.13.1 for various processes in the cycle.
0 120 240 360 120 240 360
TDC BDC TDC BDC TDC
2500
2000
1500
1000
500
0
Tem
per
ature
(K
)
Crank angle (deg)
Exhaust
Com
bust
ion
Compression
Intake
Expansion
Fig. 13.1 Gas temperature variation during a cycle
13.3 PISTON TEMPERATURE DISTRIBUTION
The piston crown is exposed to very high combustion temperatures. Figure13.2 gives the typical values of temperature at different parts of a cast ironpiston. It may be noted that the maximum temperature occurs at the centre
430 - 450 Co
130 - 150 Co
150 - 165 Co
260 - 300 Co
130 - 150 Co
150 - 165 Co
260 - 300 Co
Fig. 13.2 Piston temperature distribution
of the crown and decreases with increasing distance from the centre. Thetemperature is the lowest at the bottom of the skirt. Poor design may resultin the thermal overloading of the piston at the centre of the crown. The

Heat Rejection and Cooling 395
temperature difference between piston outer edge and the centre of the crownis responsible for the flow of heat to the ring belt through the path offered bymetal section of the crown. It is, therefore, necessary to increase the thicknessof the crown from the centre to the outer edge in order to make a path ofgreater cross-section available for the increasing heat quantity. The length ofthe path should not be too long or the thickness of the crown cross-sectiontoo small for the heat to flow. This will cause the temperature at the centreof crown to build up and thereby excessive temperature difference betweenthe crown and the outer edge of the piston will result. This may even lead tocracking of piston during overload operation.
13.4 CYLINDER TEMPERATURE DISTRIBUTION
Whenever a moving gas comes into contact with a wall, there exists a relativelystagnant gas layer which acts as a thermal insulator. The resistance of thislayer to heat flow is quite high. Heat transfer from the cylinder gases takesplace through the gas layer and through the cylinder walls to the coolingmedium. A large temperature drop is produced in the stagnant layer adjacentto the walls. The peak cylinder gas temperature may be 2800 K while thetemperature of the cylinder inner wall surface may be only 450 K due tocooling, (Fig.13.3). Heat is transferred from the gases to the cylinder walls
Maximum gas temperature
~ 2800 K
Gas film
450 K
Air film
400 K
300 K
Cooling air temperature
Cylinder
wall
Fig. 13.3 Cylinder wall temperature distribution of a properly cooled cylinder
when the gas temperature is higher than the wall temperature. The rate anddirection of flow of heat varies depending upon the temperature differential. Ifno cooling is provided, there could be no heat flow, so that the whole cylinderwall would soon reach an average temperature of the cylinder gases. Byproviding adequate cooling, the cylinder wall temperature can be maintainedat optimum level.
13.5 HEAT TRANSFER
Heat transfer occurs when a temperature difference exists. As a result of com-bustion, high temperatures are produced, inside the engine cylinder. Consid-

396 IC Engines
Air-cooled
Gas = 850 CTgo
(mean)
= 175 CTsgo
= 95 CTsco
Coolant
= 95 CTco
(mean)
Gas = 850 CTgo
= 175 CTsgo
= 95 CTsco
Coolant
Water-cooled
= 72 CTco
Fig. 13.4 Temperature profile across cylinder wall
erable heat flow occurs from the gases to the surrounding metal walls. Inaddition to this the shearing of the oil film (separating the bearing surfaces)transforms available energy into internal energy of the oil film. This increasesthe temperature of oil film and results in heat transfer from the oil to thebearing surfaces. However, the heat transfer on this account is quite small.Hence, the cylinder walls must be adequately cooled to maintain safe operat-ing temperatures in order to maintain the quality of the lubricating oil.
Heat transfer from gases to the cylinder walls may occur predominantlyby convection and radiation whereas the heat transfer through the cylinderwall occurs only by conduction. Heat is ultimately transferred to the coolingmedium by all the three modes of heat transfer. The temperature profilesacross the cylinder barrel wall are shown for both water-cooled and air-cooledengine in Fig.13.4.
In this case, Tg, is the mean gas temperature which may be as high as 850◦C. This may not be confused with the peak temperature of the cycle whichmay be two or three times this value. Largest temperature drop, however,occurs in the boundary-layer of the gas which lies adjacent to the cylinderwall. There is a corresponding boundary-layer in the cooling medium on theouter side of the cylinder. However, because of fins in the air-cooled enginesthe effect of external boundary-layer is reduced.
The conduction of heat through cylinder walls with corresponding tem-perature gradients is illustrated in Fig.13.5 The gas film, being of low conduc-tivity, offers a relatively high resistance to the heat flow, whilst on the waterjacket side there is usually a layer of corrosion products, scale etc., which arepoor conductors of heat. The least resistance to the heat flow occurs throughthe metal cylinder wall, as shown by temperature gradient there.
In actual practice because of the cyclic operation of engines, there is acyclic variation of the gas temperature within the cylinder the effect of whichis to cause a wave of heat to travel into the metal which gradually dies out andafter the warm-up period a steady flow condition prevails. It has been exper-imentally established that in internal combustion engines the cyclic temper-
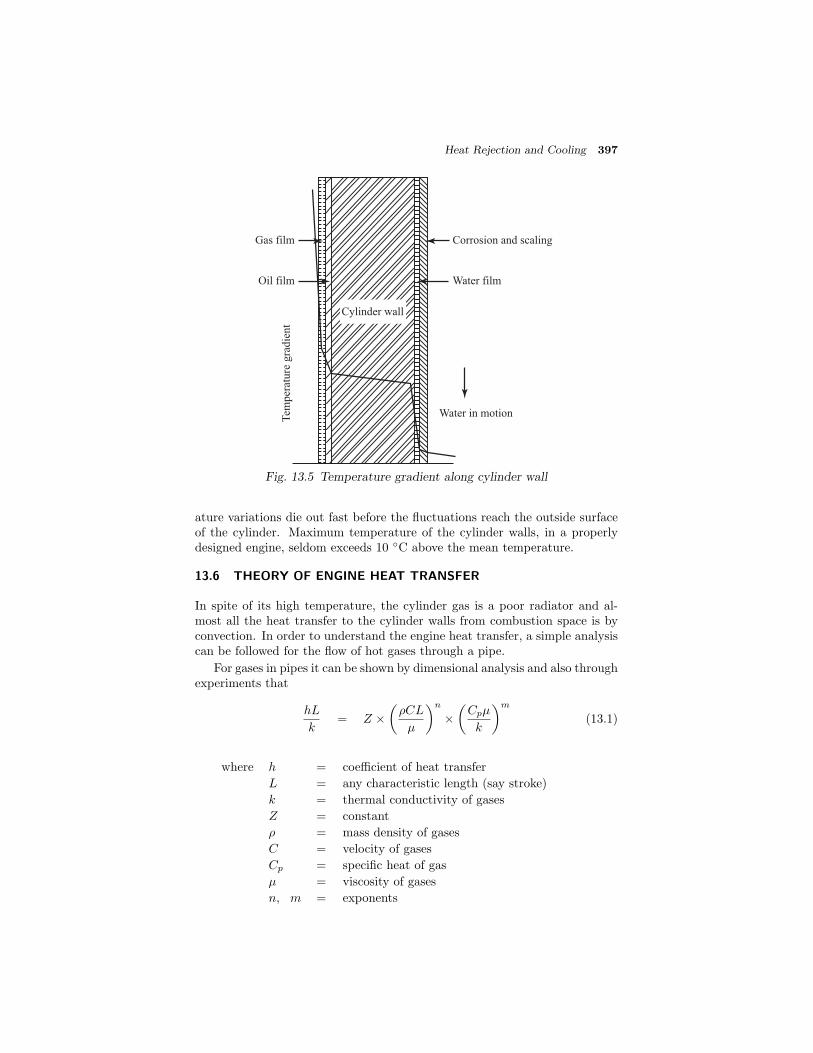
Heat Rejection and Cooling 397
Gas film
Oil filmT
emper
ature
gra
die
nt
Water film
Corrosion and scaling
Water in motion
Cylinder wall
Fig. 13.5 Temperature gradient along cylinder wall
ature variations die out fast before the fluctuations reach the outside surfaceof the cylinder. Maximum temperature of the cylinder walls, in a properlydesigned engine, seldom exceeds 10 ◦C above the mean temperature.
13.6 THEORY OF ENGINE HEAT TRANSFER
In spite of its high temperature, the cylinder gas is a poor radiator and al-most all the heat transfer to the cylinder walls from combustion space is byconvection. In order to understand the engine heat transfer, a simple analysiscan be followed for the flow of hot gases through a pipe.
For gases in pipes it can be shown by dimensional analysis and also throughexperiments that
hL
k= Z ×
ρCL
μ
n
×
Cpμ
k
m
(13.1)
where h = coefficient of heat transfer
L = any characteristic length (say stroke)
k = thermal conductivity of gases
Z = constant
ρ = mass density of gases
C = velocity of gases
Cp = specific heat of gas
μ = viscosity of gases
n, m = exponents
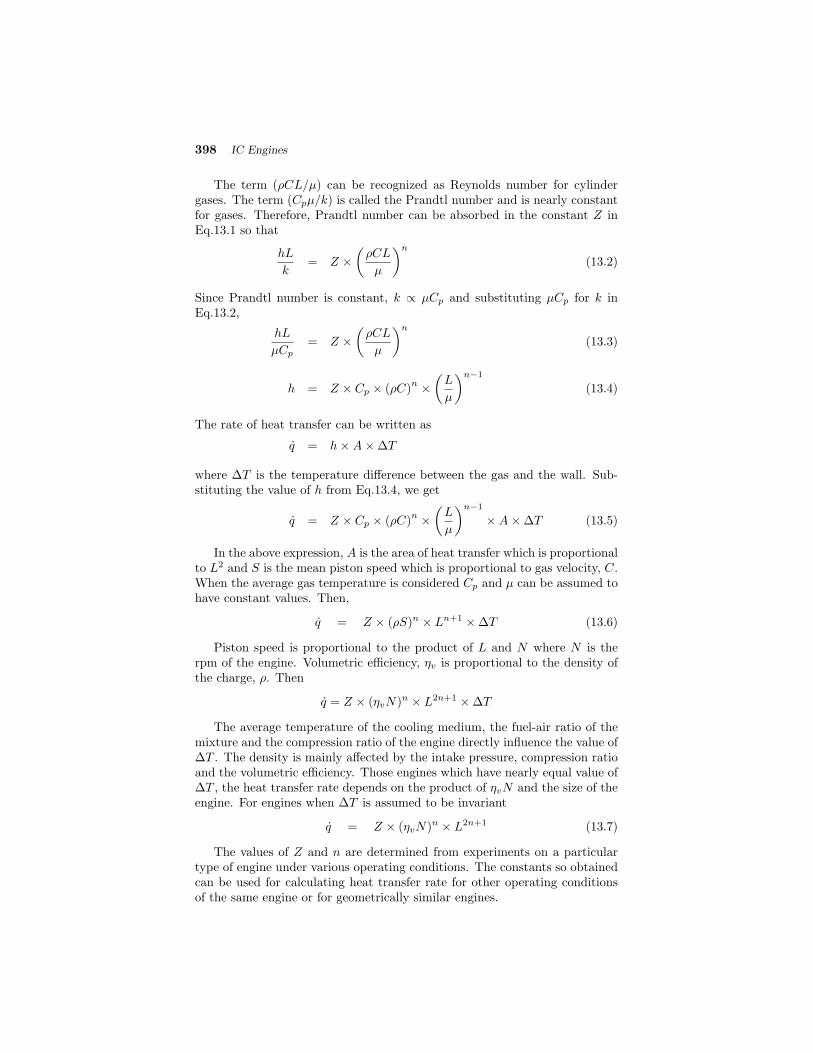
398 IC Engines
The term (ρCL/μ) can be recognized as Reynolds number for cylindergases. The term (Cpμ/k) is called the Prandtl number and is nearly constantfor gases. Therefore, Prandtl number can be absorbed in the constant Z inEq.13.1 so that
hL
k= Z ×
ρCL
μ
n
(13.2)
Since Prandtl number is constant, k ∝ μCp and substituting μCp for k inEq.13.2,
hL
μCp= Z ×
ρCL
μ
n
(13.3)
h = Z × Cp × (ρC)n ×
L
μ
n−1
(13.4)
The rate of heat transfer can be written as
q = h×A×ΔT
where ΔT is the temperature difference between the gas and the wall. Sub-stituting the value of h from Eq.13.4, we get
q = Z × Cp × (ρC)n ×
L
μ
n−1
×A×ΔT (13.5)
In the above expression, A is the area of heat transfer which is proportionalto L2 and S is the mean piston speed which is proportional to gas velocity, C.When the average gas temperature is considered Cp and μ can be assumed tohave constant values. Then,
q = Z × (ρS)n × Ln+1 ×ΔT (13.6)
Piston speed is proportional to the product of L and N where N is therpm of the engine. Volumetric efficiency, ηv is proportional to the density ofthe charge, ρ. Then
q = Z × (ηvN)n × L2n+1 ×ΔT
The average temperature of the cooling medium, the fuel-air ratio of themixture and the compression ratio of the engine directly influence the value ofΔT . The density is mainly affected by the intake pressure, compression ratioand the volumetric efficiency. Those engines which have nearly equal value ofΔT , the heat transfer rate depends on the product of ηvN and the size of theengine. For engines when ΔT is assumed to be invariant
q = Z × (ηvN)n × L2n+1 (13.7)
The values of Z and n are determined from experiments on a particulartype of engine under various operating conditions. The constants so obtainedcan be used for calculating heat transfer rate for other operating conditionsof the same engine or for geometrically similar engines.

Heat Rejection and Cooling 399
13.7 PARAMETERS AFFECTING ENGINE HEAT TRANSFER
From the above discussion, it may be noted that the engine heat transferdepends upon many parameters. Unless the effect of these parameters isknown, the design of a proper cooling system will be difficult. In this section,the effect of various parameters on engine heat transfer is briefly discussed.
13.7.1 Fuel-Air Ratio
A change in fuel-air ratio will change the temperature of the cylinder gasesand affect the flame speed. The maximum gas temperature will occur at anequivalence ratio of about 1.12 i.e., at a fuel-air ratio about 0.075. At this fuel-air ratio ΔT will be a maximum. However, from experimental observationsthe maximum heat rejection is found to occur for a mixture, slightly leanerthan this value.
13.7.2 Compression Ratio
An increase in compression ratio causes only a slight increase in gas tempera-ture near the top dead centre; but, because of greater expansion of the gases,there will be a considerable reduction in gas temperature near bottom deadcentre where a large cylinder wall is exposed. The exhaust gas temperaturewill also be much lower because of greater expansion so that the heat rejectedduring blowdown will be less. In general, as compression ratio increases theretend to be a marginal reduction in heat rejection.
13.7.3 Spark Advance
A spark advance more than the optimum as well as less than the optimumwill result in increased heat rejection to the cooling system. This is mainlydue to the fact that the spark timing other than MBT value (Minimum sparkadvance for Best Torque) will reduce the power output and thereby more heatis rejected.
13.7.4 Preignition and Knocking
Effect of preignition is the same as advancing the ignition timing. Largespark advance might lead to erratic running and knocking. Though knockingcauses large changes in local heat transfer conditions, the over-all effect on heattransfer due to knocking appears to be negligible. However, no quantitativeinformation is available regarding the effect of preignition and knocking onengine heat transfer.
13.7.5 Engine Output
Engines which are designed for high mean effective pressures or high pistonspeeds, heat rejection will be less. Less heat will be lost for the same indicatedpower in large engines.

400 IC Engines
13.7.6 Cylinder Wall Temperature
The average cylinder gas temperature is much higher in comparison to thecylinder wall temperature. Hence, any marginal change in cylinder gas tem-perature will have very little effect on the temperature difference and thus onheat rejection.
13.8 POWER REQUIRED TO COOL THE ENGINE
Theoretically the thermal efficiency of the engine will improve if there is nocooling system, but actually the engine will cease to operate. It is mainlybecause of high temperature, the metals will lose their characteristics andpiston will expand considerably resulting in engine seizure. In order to avoidseizure, cooling of the engine is a must. However, the power required to runthe cooling system should come from the engine. In this section, the powerrequired to run a cooling system for an air-cooled engine is briefly discussed.
In order to simplify the calculations and obtain an expression for the powerrequired for cooling an engine, some assumptions have to be made. Theimportant ones are:
(i) Engine is assumed to operate at constant fuel-air ratio.
(ii) Changes in fin or coolant temperature are assumed to be small enoughso that ΔT , the temperature difference between cylinder gases and thecylinder wall may be assumed to be constant.
(iii) The density and temperature of cooling media are assumed to be unaf-fected by its flow through the engine or radiator fins.
With the above assumption, it can be shown that variation of coolingpower required in terms of the indicated power of the engine can be shown tobe
Pc =Ae(ip)2.25
(AfΔTf )3.75
ρ2a(13.8)
Equation 13.8 shows that, for a given power, a great reduction in requiredcooling power can be effected by increasing the fin area and the temperaturedifference as much as possible. In the above equation, Ae is the effectivearea, ip is the indicated power, Af is the fin area and ΔTf is the temperaturedifference between the air and the fin and ρa is the density of air. By reducingthe air velocity, power required for the cooling, Pc, can be reduced. It canbe shown that Pc ∝ C3
a , where Ca is the velocity of air. In order to reducethe air velocity, adjustable flaps are usually provided in the cooling air ductof air-cooled engines.
13.9 NEED FOR COOLING SYSTEM
From the discussion on heat rejection in the previous sections, it may be notedthat during the process of converting thermal energy to mechanical energy,high temperatures are produced in the cylinders of the engine as a result of the
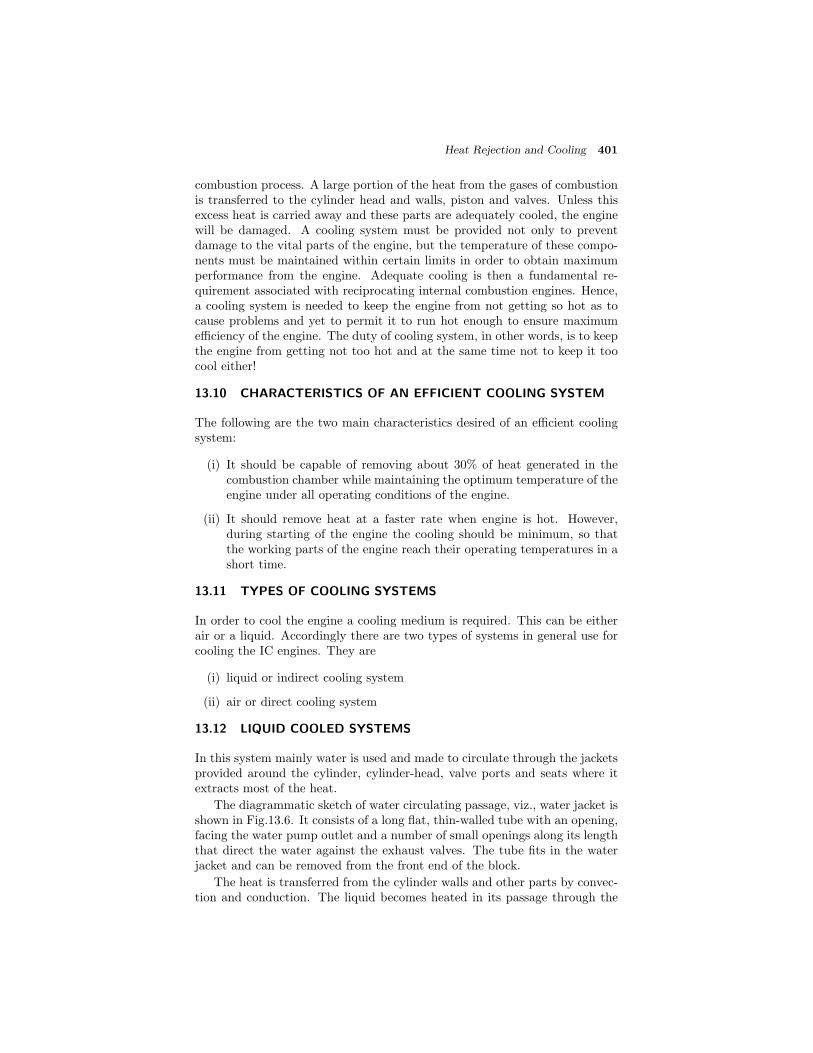
Heat Rejection and Cooling 401
combustion process. A large portion of the heat from the gases of combustionis transferred to the cylinder head and walls, piston and valves. Unless thisexcess heat is carried away and these parts are adequately cooled, the enginewill be damaged. A cooling system must be provided not only to preventdamage to the vital parts of the engine, but the temperature of these compo-nents must be maintained within certain limits in order to obtain maximumperformance from the engine. Adequate cooling is then a fundamental re-quirement associated with reciprocating internal combustion engines. Hence,a cooling system is needed to keep the engine from not getting so hot as tocause problems and yet to permit it to run hot enough to ensure maximumefficiency of the engine. The duty of cooling system, in other words, is to keepthe engine from getting not too hot and at the same time not to keep it toocool either!
13.10 CHARACTERISTICS OF AN EFFICIENT COOLING SYSTEM
The following are the two main characteristics desired of an efficient coolingsystem:
(i) It should be capable of removing about 30% of heat generated in thecombustion chamber while maintaining the optimum temperature of theengine under all operating conditions of the engine.
(ii) It should remove heat at a faster rate when engine is hot. However,during starting of the engine the cooling should be minimum, so thatthe working parts of the engine reach their operating temperatures in ashort time.
13.11 TYPES OF COOLING SYSTEMS
In order to cool the engine a cooling medium is required. This can be eitherair or a liquid. Accordingly there are two types of systems in general use forcooling the IC engines. They are
(i) liquid or indirect cooling system
(ii) air or direct cooling system
13.12 LIQUID COOLED SYSTEMS
In this system mainly water is used and made to circulate through the jacketsprovided around the cylinder, cylinder-head, valve ports and seats where itextracts most of the heat.
The diagrammatic sketch of water circulating passage, viz., water jacket isshown in Fig.13.6. It consists of a long flat, thin-walled tube with an opening,facing the water pump outlet and a number of small openings along its lengththat direct the water against the exhaust valves. The tube fits in the waterjacket and can be removed from the front end of the block.
The heat is transferred from the cylinder walls and other parts by convec-tion and conduction. The liquid becomes heated in its passage through the

402 IC Engines
Valve ports
Spark plug
Cylinder head
Water jacket
Cylinder wall
Gasket
Piston
Water jacket
Water transfer port
Fig. 13.6 Cooling water passages
jackets and is in turn cooled by means of an air-cooled radiator system. Theheat from liquid in turn is transferred to air. Hence it is called the indirectcooling system.
Water-cooling can be carried out by any one of the following five methods:
(i) Direct or non-return system
(ii) Thermosyphon system
(iii) Forced circulation cooling system
(iv) Evaporative cooling system
(v) Pressure cooling system
13.12.1 Direct or Non-return System
This system is useful for large installations where plenty of water is available.The water from a storage tank is directly supplied through an inlet valve tothe engine cooling water jacket. The hot water is not cooled for reuse butsimply discharged.

Heat Rejection and Cooling 403
13.12.2 Thermosyphon System
The basic principle of thermosyphon can be explained with respect to Fig.13.7.Heat is supplied to the fluid in the tank A. Because of the relatively lowerdensity, the hot fluid travels up, its place being taken up by comparativelycold fluid from the tank B through the pipe p2.
Cold
Heat
Hot
A
B
2p
p1
Fig. 13.7 Principle of thermosyphon system
The hot fluid flows through the pipe p1 to the tank B where it gets cooled.Thus the fluid circulates through the system in the form of convection currents.
For engine application, tank A represents the cylinder jackets while tankB represents a radiator and water acts as the circulating fluid. In order toensure that coolest water is always made available to cylinder jackets, thewater jackets are located at a lower level than the radiator.
The main advantages of the system are its simplicity and automatic cir-culation of cooling water. The main limitation of the system is its inability tomeet the requirement of large flow rate of water, particularly for high outputengines.
13.12.3 Forced Circulation Cooling System
This system is used in a large number of automobiles like cars, buses andeven heavy trucks. Here, flow of water from radiators to water jackets is byconvection assisted by a pump.
The main principle of this system is explained with the help of a blockdiagram shown in Fig.13.8. The water or coolant is circulated through jacketsaround the parts of the engine to be cooled, and is kept in motion by acentrifugal pump which is driven by the engine. The water is passed throughthe radiator where it is cooled by air drawn through the radiator by a fanand by the air draft due to the forward motion of the vehicle. A thermostatis used to control the water temperature required for cooling. This systemmainly consists of four components, viz., a radiator, fan, water pump and athermostat. The details of these components are shown in Fig.13.9.
Radiator: The purpose of a radiator is to provide a large amount of coolingsurface area so that the water passing downward through it in thin streams is

404 IC Engines
Engine
Pump
ThermostatRadiator
Fig. 13.8 Principle of Forced Circulation cooling system using the thermostat
Water pump Cylinder
ValvesThermostat
Header tank
Radiator
Drain
Fan
Fig. 13.9 Cooling of an automobile
cooled efficiently. To accomplish this, there are many possible arrangements.One such arrangement is shown in Fig.13.10.
The radiator consists essentially of an upper tank (header tank) and alower tank. The upper tank in some design may contain a removable filtermesh to avoid dust particles going in into the radiator while filling water inthe radiator. Between the two tanks is the core or radiating element. Theupper tank is connected to the water outlets from the engine jacket by rubberhose, and the lower tank is connected by another rubber hose to the jacketinlet through the pump.
Radiator cores are classified as tubular or cellular. A tubular radiator,consists of a large number of elliptical or circular brass tubes pressed into anumber of suitable punched brass fins. The tubes are finned to guard againstcorrosion and are staggered as shown in Fig.13.10. The main disadvantage isthe great inconvenience to repair any of the damaged tubes. But initial cost ofthe system is comparatively less. The other type of radiator core arrangement,called honey comb or cellular radiator core is shown in Fig.13.11.

Heat Rejection and Cooling 405
Brass fins
Air flowWater flow
Tinned brass tubeElevation
Plan
Fig. 13.10 Radiator construction
Air space
Thin brass or copper tubes
Fig. 13.11 Honey comb radiator core
The water used for cooling should be soft. If hard water is used, it formssediments on water jackets and tubes, which acts as insulator and make thecooling inefficient. If soft water is not available, 30 g of sodium bichromateshould be added for every 10 litres of water.
Fan: The fan mounted on the impeller spindle driven by a suitable belt pulleyarrangement as shown in Fig.13.9 draws air through the spaces between theradiator tubes thus bringing down the temperature of the water appreciably.
Pump: The pump maintains the circulation of the water through the system.The bottom of radiator is connected to the suction side of the pump. Thepower is transmitted to the pump spindle from a pulley mounted on the endof the camshaft or crankshaft. A positive supply of water is achieved in allconditions by centrifugal pump placed in this system (Fig.13.9). This ensuresgood velocity of water circulation. Consequently less quantity of water and asmaller radiator would suit the purpose.
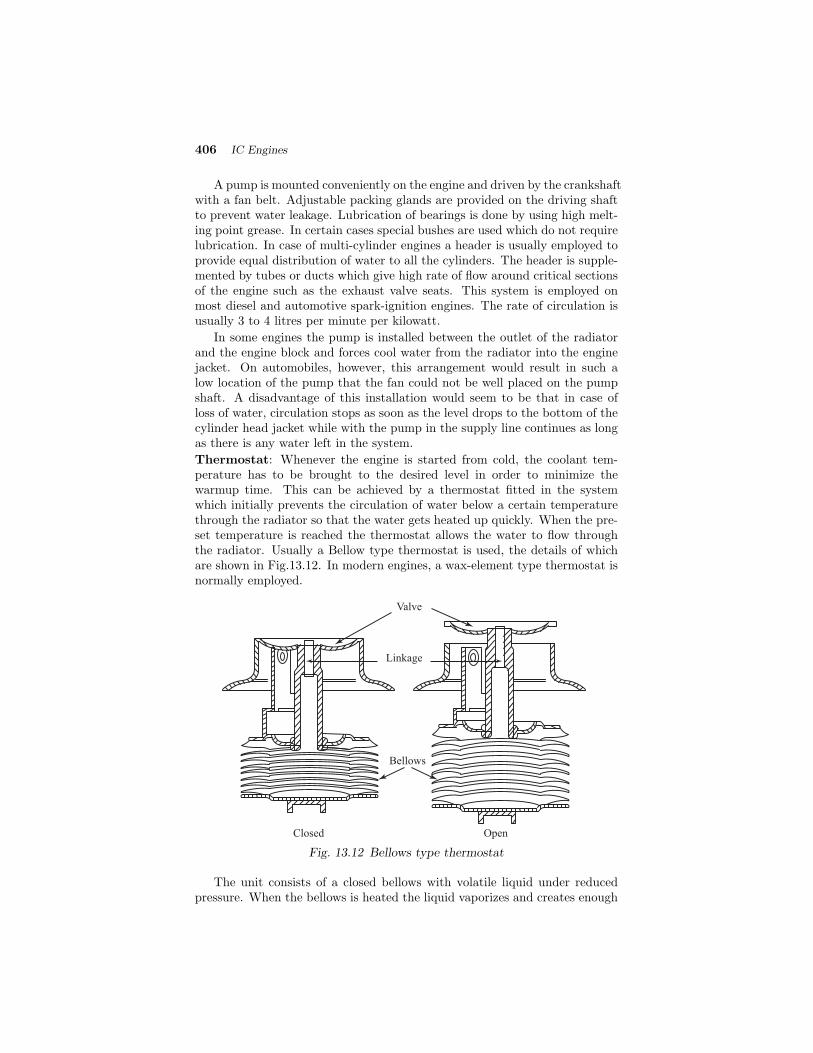
406 IC Engines
A pump is mounted conveniently on the engine and driven by the crankshaftwith a fan belt. Adjustable packing glands are provided on the driving shaftto prevent water leakage. Lubrication of bearings is done by using high melt-ing point grease. In certain cases special bushes are used which do not requirelubrication. In case of multi-cylinder engines a header is usually employed toprovide equal distribution of water to all the cylinders. The header is supple-mented by tubes or ducts which give high rate of flow around critical sectionsof the engine such as the exhaust valve seats. This system is employed onmost diesel and automotive spark-ignition engines. The rate of circulation isusually 3 to 4 litres per minute per kilowatt.
In some engines the pump is installed between the outlet of the radiatorand the engine block and forces cool water from the radiator into the enginejacket. On automobiles, however, this arrangement would result in such alow location of the pump that the fan could not be well placed on the pumpshaft. A disadvantage of this installation would seem to be that in case ofloss of water, circulation stops as soon as the level drops to the bottom of thecylinder head jacket while with the pump in the supply line continues as longas there is any water left in the system.
Thermostat: Whenever the engine is started from cold, the coolant tem-perature has to be brought to the desired level in order to minimize thewarmup time. This can be achieved by a thermostat fitted in the systemwhich initially prevents the circulation of water below a certain temperaturethrough the radiator so that the water gets heated up quickly. When the pre-set temperature is reached the thermostat allows the water to flow throughthe radiator. Usually a Bellow type thermostat is used, the details of whichare shown in Fig.13.12. In modern engines, a wax-element type thermostat isnormally employed.
Closed Open
Valve
Linkage
Bellows
Fig. 13.12 Bellows type thermostat
The unit consists of a closed bellows with volatile liquid under reducedpressure. When the bellows is heated the liquid vaporizes and creates enough
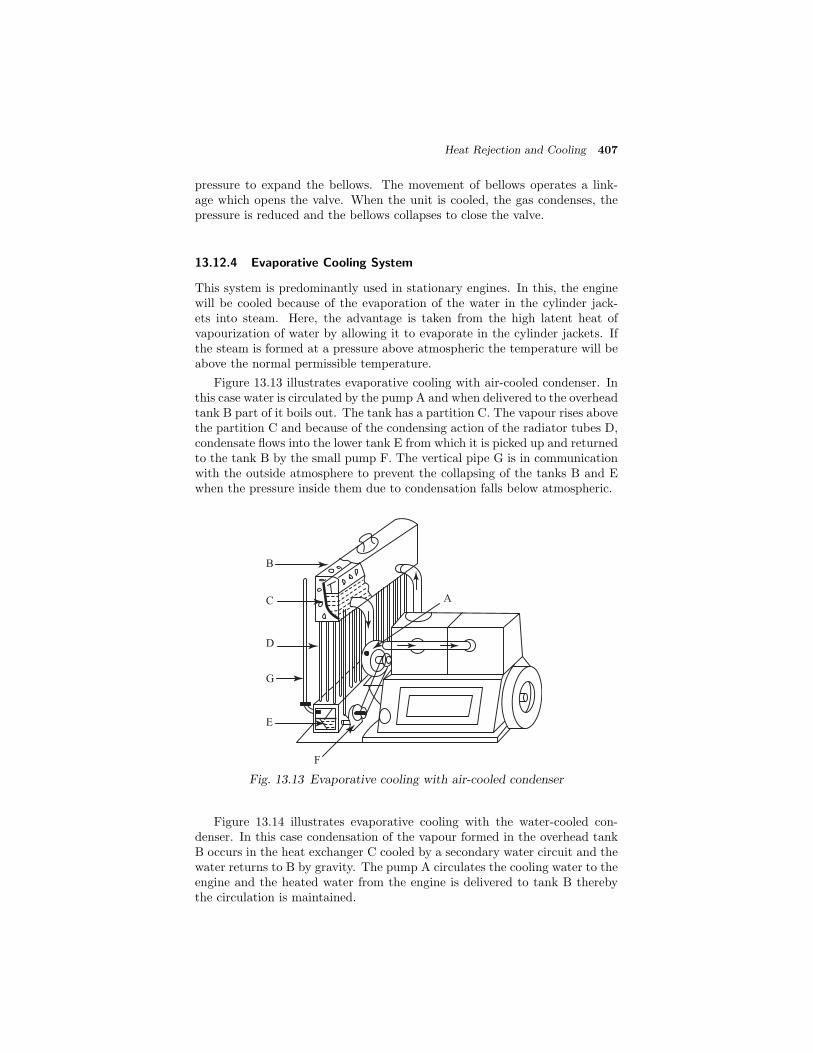
Heat Rejection and Cooling 407
pressure to expand the bellows. The movement of bellows operates a link-age which opens the valve. When the unit is cooled, the gas condenses, thepressure is reduced and the bellows collapses to close the valve.
13.12.4 Evaporative Cooling System
This system is predominantly used in stationary engines. In this, the enginewill be cooled because of the evaporation of the water in the cylinder jack-ets into steam. Here, the advantage is taken from the high latent heat ofvapourization of water by allowing it to evaporate in the cylinder jackets. Ifthe steam is formed at a pressure above atmospheric the temperature will beabove the normal permissible temperature.
Figure 13.13 illustrates evaporative cooling with air-cooled condenser. Inthis case water is circulated by the pump A and when delivered to the overheadtank B part of it boils out. The tank has a partition C. The vapour rises abovethe partition C and because of the condensing action of the radiator tubes D,condensate flows into the lower tank E from which it is picked up and returnedto the tank B by the small pump F. The vertical pipe G is in communicationwith the outside atmosphere to prevent the collapsing of the tanks B and Ewhen the pressure inside them due to condensation falls below atmospheric.
A
F
B
C
D
E
G
Fig. 13.13 Evaporative cooling with air-cooled condenser
Figure 13.14 illustrates evaporative cooling with the water-cooled con-denser. In this case condensation of the vapour formed in the overhead tankB occurs in the heat exchanger C cooled by a secondary water circuit and thewater returns to B by gravity. The pump A circulates the cooling water to theengine and the heated water from the engine is delivered to tank B therebythe circulation is maintained.

408 IC Engines
C
G
B
A
D
Fig. 13.14 Evaporative cooling with water-cooled condenser
13.12.5 Pressure Cooling System
As already mentioned, the rate of heat transfer depends upon the temper-ature difference between the two mediums, the area of exposed surface andconductivity of materials. In case of radiators, in order to reduce the size ofradiator, it is proposed to seal the cooling system from the atmosphere andto allow a certain amount of pressure to build-up in the system, so that theadvantage may be taken of the fact that the temperature of the boiling pointof water increases as the pressure increases. Boiling point of water at variouspressures is shown in Table 13.1.
Table 13.1 Boiling Point of Water at Various Pressures
Pressure (bar) 1.0 2.0 5.0 10.0
Temperature (◦C) 100 121 153 180
In pressure cooling system moderate pressures, say upto 2 bar, are com-monly used. As shown in Fig.13.15, a cap is fitted with two valves, a safetyvalve which is loaded by a compression spring and a vacuum valve. When thecoolant is cold both valves are shut but as the engine warms up the coolanttemperature rises until it reaches a certain preset value corresponding to thedesired pressure when the safety valve opens; but if the coolant temperaturefalls during the engine operation the valve will close again until the tempera-ture again rises to the equivalent pressure value. When the engine is switchedoff and the coolant cools down vacuum begins to form in the cooling system
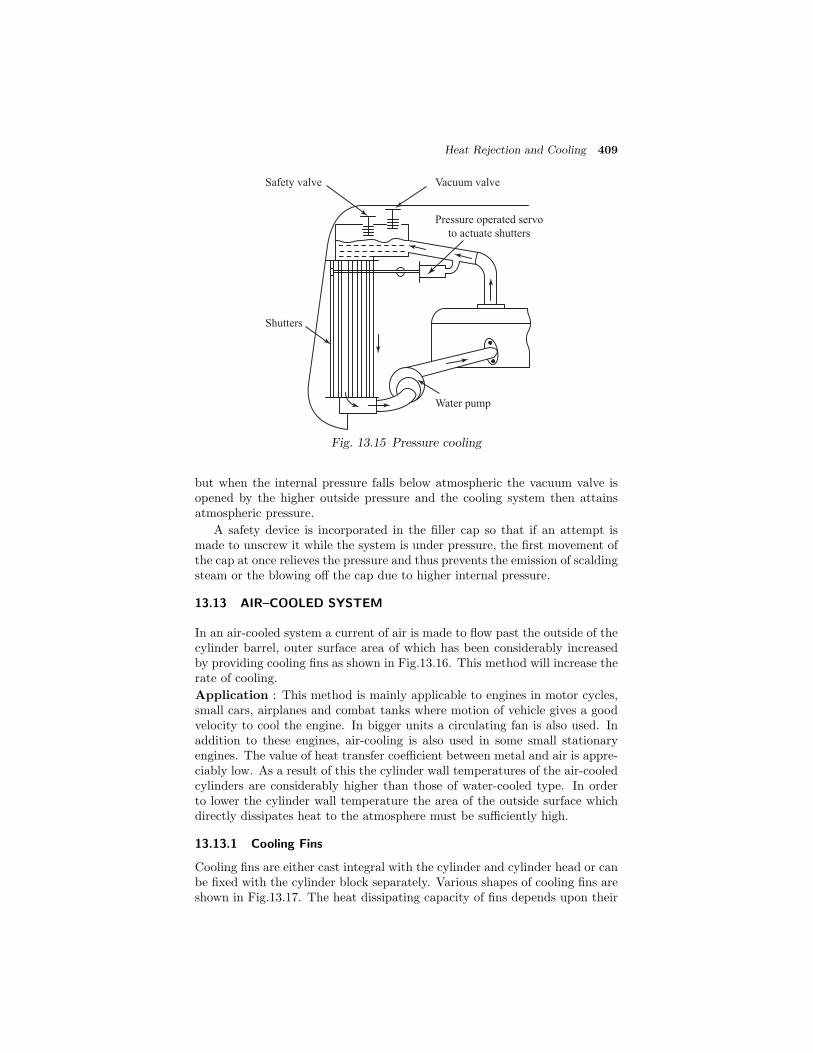
Heat Rejection and Cooling 409
Vacuum valve
Pressure operated servo
to actuate shutters
Shutters
Safety valve
Water pump
Fig. 13.15 Pressure cooling
but when the internal pressure falls below atmospheric the vacuum valve isopened by the higher outside pressure and the cooling system then attainsatmospheric pressure.
A safety device is incorporated in the filler cap so that if an attempt ismade to unscrew it while the system is under pressure, the first movement ofthe cap at once relieves the pressure and thus prevents the emission of scaldingsteam or the blowing off the cap due to higher internal pressure.
13.13 AIR–COOLED SYSTEM
In an air-cooled system a current of air is made to flow past the outside of thecylinder barrel, outer surface area of which has been considerably increasedby providing cooling fins as shown in Fig.13.16. This method will increase therate of cooling.
Application : This method is mainly applicable to engines in motor cycles,small cars, airplanes and combat tanks where motion of vehicle gives a goodvelocity to cool the engine. In bigger units a circulating fan is also used. Inaddition to these engines, air-cooling is also used in some small stationaryengines. The value of heat transfer coefficient between metal and air is appre-ciably low. As a result of this the cylinder wall temperatures of the air-cooledcylinders are considerably higher than those of water-cooled type. In orderto lower the cylinder wall temperature the area of the outside surface whichdirectly dissipates heat to the atmosphere must be sufficiently high.
13.13.1 Cooling Fins
Cooling fins are either cast integral with the cylinder and cylinder head or canbe fixed with the cylinder block separately. Various shapes of cooling fins areshown in Fig.13.17. The heat dissipating capacity of fins depends upon their

410 IC Engines
Cooling fins
Cooling fins between walls
Fig. 13.16 Cooling fins on an engine cylinder increase the surface areaof cooling
a
b
c
d 6 mm
40 mm
40 mm
0.0
1.0
0.8
0.6
0.4
0.2
dcb
a
T/T
root
Fig. 13.17 Types of cooling systems
cross-section and length. At the same time as heat is gradually dissipatedfrom the fin surface, the temperature of the fin decreases from its root toits tip. Hence, the fin surface nearer to the tip dissipates heat at a lowerrate and is less efficient. On the other hand as the quantity of heat flowingtowards the tip gradually decreases, the thickness of the fin can be decreased.The material of the fin is used most efficiently if the drop in temperaturefrom the root to the tip is constant per unit length. A comparison of fins ofdifferent cross-sections is shown in Fig.13.17 with drop in temperature fromroot to tip. The rectangular section has least temperature drop whereas themaximum temperature drop is for the fin marked ‘a’.
Fins are usually given a taper of 3 to 5 degrees in order to give sufficientdraft to the pattern. The tip is made 0.5 to 1.25 mm thick and a clearance of2.5 to 5 mm is allowed at the root. The fins are made 25 to 50 mm long. Tooclose spacing of the fins is undesirable as mutual interference of the boundary-layers of adjacent layers restricts the air flow and results in small quantity ofheat dissipated.

Heat Rejection and Cooling 411
13.13.2 Baffles
The rate of heat transfer from the cylinder walls can be substantially increasedby using baffles which force the air through the space between the fins. Figure13.18 shows various types of baffles commonly used on engines. The arrange-
(a) (b) (c) (d)
Fig. 13.18 Types of baffles in air-cooled engines
ment at ‘a’ has got the highest pressure drop. It is always desired to havenegligible kinetic energy loss between the entrance and the exit. Usually thenormal type of baffle, ‘b’, is used on petrol engines. The arrangement ‘c’ forminimizing the kinetic energy loss is shown with a well rounded entrance toreduce the entrance loss and an exit section that will transform the velocityhead into pressure head and thus decrease the pressure drop. Arrangement‘d’ is adopted for diesel engines.
13.14 COMPARISON OF LIQUID AND AIR–COOLING SYSTEMS
In view of the wide spread use of these two alternative cooling systems forpetrol as well as diesel engines it is of interest to summarize the respectiveadvantages and limitations of these systems.
13.14.1 Advantages of Liquid-Cooling System
(i) Compact design of engines with appreciably smaller frontal area is pos-sible.
(ii) The fuel consumption of high compression liquid-cooled engines arerather lower than for air-cooled ones.
(iii) Because of the even cooling of cylinder barrel and head due to jacketingmakes it possible to reduce the cylinder head and valve seat tempera-tures.
(iv) In case of water-cooled engines, installation is not necessarily at thefront of the mobile vehicles, aircraft etc. as the cooling system can be

412 IC Engines
conveniently located wherever required. This is not possible in case ofair-cooled engines.
(v) The size of engine does not involve serious problems as far as the designof cooling systems is concerned. In case of air-cooled engines particularlyin high horsepower range difficulty is encountered in the circulation ofrequisite quantity of air for cooling purposes.
13.14.2 Limitations
(i) This is a dependent system in which water circulation in the jackets isto be ensured by additional means.
(ii) Power absorbed by the pump for water circulation is considerable andthis affects the power output of the engine.
(iii) In the event of failure of the cooling system serious damage may becaused to the engine.
(iv) Cost of the system is considerably high.
(v) System requires considerable maintenance of its various parts.
13.14.3 Advantages of Air-Cooling System
(i) The design of the engine becomes simpler as no water jackets are re-quired. The cylinder can have identical dimensions and be individuallydetachable and therefore cheaper to renew in case of accident etc.
(ii) Absence of cooling pipes, radiator, etc. makes the cooling system sim-pler thereby has minimum maintenance problems.
(iii) No danger of coolant leakage etc.
(iv) The engine is not subject to freezing troubles etc., usually encounteredin case of water cooled engines.
(v) The weight of the air-cooled engine is less than that of water-cooledengine, i.e., power to weight ratio is improved.
(vi) In this case, the engine is rather a self-contained unit as it requires noexternal components like radiator, header, tank etc.
(vii) Installation of air-cooled engines is easier.
13.14.4 Limitations
(i) Can be applied only to small and medium sized engines
(ii) In places where ambient temperatures are lower
(iii) Cooling is not uniform
(iv) Higher working temperatures compared to water-cooling

Heat Rejection and Cooling 413
(v) Produce more aerodynamic noise
(vi) Specific fuel consumption is slightly higher
(vii) Lower maximum allowable compression ratios
(viii) The fan, if used absorbs as much as 5% of the power developed by theengine
Review Questions
13.1 Explain with a figure the variation of gas temperature during a cycle.
13.2 Explain with sketches piston and cylinder temperature distribution.
13.3 Explain briefly the engine heat transfer. Develop the necessary equationfor the rate of heat transfer.
13.4 Mention the various parameters which affect the engine heat transferand explain their effect.
13.5 Explain the reasons for cooling an engine.
13.6 What are the various characteristics of an efficient cooling system?
13.7 Explain the two types of cooling systems and compare them.
13.8 Explain the following:
(i) thermosyphon cooling system
(ii) forced circulation cooling system
(iii) evaporative cooling system
(iv) pressure cooling system
13.9 What is an air-cooling system and in which engine it is normally used?
13.10 Why fins and baffles are required in an air-cooled engine? Explain.
13.11 What are advantages of liquid cooling system?
13.12 What are the limitations of liquid cooling system?
13.13 What are the advantages of air cooling system
13.14 What are the limitations of the air cooling system
13.15 Compare the air cooling and liquid cooling systems

414 IC Engines
Multiple Choice Questions (choose the most appropriate answer)
1. The heat given to cooling medium in IC engines is about
(a) 50 – 60%
(b) 30 – 40%
(c) 10 – 20%
(d) 60 – 70%
2. Radiator is provided to
(a) cool the jacket water
(b) pressurise the cooling water
(c) provide additional water flow
(d) none of the above
3. Thermostat is used in radiators to
(a) control the velocity of water
(b) control distribution of water to various cylinders
(c) control the water temperature
(d) control the pressure of water
4. As the compression ratio increases, there is a
(a) large increase in heat rejection
(b) large decrease in heat reduction
(c) marginal increase in heat rejection
(d) marginal reduction in heat rejection
5. Spark timing other than MBT results in
(a) less heat rejection
(b) more heat rejection
(c) no effect on heat rejection
(d) none of the above
6. Direct system of cooling air is one which
(a) cooling water flows by gravity
(b) hot water is continuously cooled and circulated
(c) hot water is simply discharged
(d) water is allowed to evaporate in the cylinder jacket

Heat Rejection and Cooling 415
7. In evaporate cooling systems, heat absorbed per kg of coolant air is
(a) CpΔt
(b) CvΔt
(c) latent heat of the coolant
(d) (Cp − Cv)Δt
8. Pump used in the forced cooling system is normally
(a) piston pump
(b) gear pump
(c) vane pump
(d) centrifugal pump
9. Advantage of liquid cooling system is
(a) dependent only on water supply
(b) power absorbed by the pump is considerable
(c) even cooling
(d) very cheap
10. Limitations of air cooling systems are
(a) applicable only to large engines
(b) cooling is fast
(c) higher working temperature compared to water cooling
(d) all of the above
11. The main purpose of a thermostat in an engine cooling system is to
(a) allow engine to warm-up quickly
(b) prevent the coolant from boiling
(c) pressurize the system
(d) indicate to the driver the coolant temperature
12. The radiator cooling tubes are generally made of
(a) rubber
(b) plastic
(c) brass
(d) copper

416 IC Engines
13. Water circulation in a thermosyphon cooling system is due to
(a) conduction currents
(b) a gear driven water pump
(c) change in the density of water
(d) a belt driven water impeller
14. The main purpose of fan in a liquid cooling system is to
(a) disperse engine fumes
(b) pump cold air over the hot water
(c) cool the external surface of the engine
(d) drive air flow when the vehicle speed is low
15. Engine overheating may be due to
(a) stuck radiator pressure cap
(b) open thermostat
(c) broken fan belt
(d) excess coolant
Ans: 1. – (b) 2. – (a) 3. – (c) 4. – (d) 5. – (b)6. – (c) 7. – (c) 8. – (d) 9. – (c) 10. – (c)
11. – (a) 12. – (d) 13. – (a) 14. – (b) 15. – (c)

14ENGINE EMISSIONS
AND THEIR CONTROL
14.1 INTRODUCTION
Internal combustion engines generate undesirable emissions during the com-bustion process. In this, both SI and CI engines are equally responsible for thesame. The emissions exhausted into the surroundings pollute the atmosphereand causes the following problems
(i) global warming
(ii) acid rain
(iii) smog
(iv) odours
(v) respiratory and other health hazards
The major causes of these emissions are non-stoichiometric combustion,dissociation of nitrogen, and impurities in the fuel and air. The emissions ofconcern are: unburnt hydrocarbons (HC), oxides of carbon (COx), oxides ofnitrogen (NOx), oxides of sulphur (SOx), and solid carbon particulates.
It is the dream of engineers and scientists to develop engines and fuels suchthat very few quantity of harmful emissions are generated, and these couldbe let into the surroundings without a major impact on the environment.However, with the present technology this is not possible, and after-treatmentof the exhaust gases as well as in-cylinder reduction of emissions are veryimportant. In case of after-treatment it consists mainly of the use of thermal orcatalytic converters and particulate traps. For in-cylinder reduction, exhaustgas recirculation (EGR) and some fuel additives are being tried. In additionto exhaust emissions non-exhaust emissions also play a part. In this chapterwe will look into the details of these emissions and their control.
14.2 AIR POLLUTION DUE TO IC ENGINES
Until the middle of the 20th century the number of IC engines in the worldwas so small that the pollution they caused was tolerable. During that pe-riod the environment, with the help of sunlight, stayed relatively clean. Asworld population grew, power plants, factories, and an ever-increasing num-ber of automobiles began to pollute the air to the extent that it was no longeracceptable. During the late 1940s, air pollution as a problem was first recog-nized in the Los Angeles basin in California. Two causes of this were the large
418 IC Engines
population density and the natural weather conditions of the area. Smoke andother pollutants from many factories and automobiles combined with fog thatwas common in this ocean area, and smog resulted. During the 1950s, thesmog problem increased along with the increase in population density andautomobile density. At this stage it was realized that the automobile was oneof the major contributors to the problem. By the 1960s emission standardswere beginning to be enforced in California.
During the next decade, emission standards were adopted in the rest ofthe United States and in Europe and Japan. By making engines more fuelefficient, and with the use of exhaust after-treatment, emissions per vehicle ofHC, CO, and NOx were reduced by about 95% during the 1970s and 1980s.Lead, one of the major air pollutants, was phased out as a fuel additive duringthe 1980s. More fuel-efficient engines were developed, and by the 1990s theaverage automobile consumed less than half the fuel used in 1970. However,during this time the number of automobiles greatly increased, resulting in nooverall decrease in fuel usage.
Further reduction of emissions will be much more difficult and costly. Asworld population grows, emission standards have become more stringent outof necessity. The strictest laws are generally initiated in California, with therest of the United States and world following. Although air pollution is aglobal problem, some regions of the world still have no emission standards orlaws. However, many countries including India have started following emissionnorms. We will briefly go through the norms followed in India in the followingsection.
14.3 EMISSION NORMS
Emission norms are statutory requirements that set specific limits to theamount of pollutants that can be released into the environment. Norms focuson regulating pollutants released by automobiles and other powered vehi-cles. They can also regulate emissions from industry, power plants, and dieselgenerators. The pollutants in general that are regulated are the emissions ofnitrogen oxides (NOx), sulfur oxides, particulate matter (PM) or soot, carbonmonoxide (CO), or volatile hydrocarbons
In the United States, emissions standards are managed by the Environmen-tal Protection Agency (EPA). The state of California has special dispensationto promulgate more stringent vehicle emissions standards. Other states maychoose to follow either the national or California standards. The EuropeanUnion has its own set of emissions standards that all new vehicles must meet.Currently, standards are set for all road vehicles, trains, barges and ’nonroadmobile machinery’ (such as tractors). No standards apply to seagoing shipsor airplanes.
The European Union is to introduce Euro 4 effective from January 1, 2008,Euro 5 effective from January 1, 2010 and Euro 6 effective from January 1,2014. These dates have been postponed for two years to give oil refineries theopportunity to modernize their plants. The first Indian emission regulationswere idle emission limits which became effective in 1989. These idle emissionregulations were soon replaced by mass emission limits for both gasoline (1991)
Engine Emissions and Their Control 419
and diesel (1992) vehicles, which were gradually tightened during the 1990’s.Since the year 2000, India started adopting European emission norms and fuelregulations for four-wheeled light-duty and for heavy-duty vehicles. Indianown emission regulations still apply to two- and three-wheeled vehicles.
14.3.1 Overview of the Emission Norms in India
1991 Idle CO Limits for Gasoline Vehicles and Free Acceleration Smoke forDiesel Vehicles, Mass Emission Norms for Gasoline Vehicles.
1992 Mass Emission Norms for Diesel Vehicles.
1996 Revision of Mass Emission Norms for Gasoline and Diesel Vehicles,mandatory fitment of Catalytic Converter for Cars in Metros on Un-leaded Gasoline.
1998 Cold Start Norms Introduced.
2000 India 2000 (equivalent to Euro I) Norms, Modified IDC (Indian DrivingCycle), Bharat Stage II Norms for Delhi.
2001 Bharat Stage II (equivalent to Euro II) Norms for All Metros, EmissionNorms for CNG and LPG Vehicles.
2003 Bharat Stage II (equivalent to Euro II) Norms for 11 major cities.
2005 From 1st April Bharat Stage III (equivalent to Euro III) Norms for 11major cities.
2010 Bharat Stage III Emission Norms for 4-wheelers for entire country whereasBharat Stage - IV (equivalent to Euro IV) for 11 major cities.
14.4 COMPARISON BETWEEN BHARAT STAGE AND EURO NORMS
The Bharat Stage norms have been styled to suit specific needs and demandsof Indian conditions. The differences lie essentially in environmental and ge-ographical needs, even though the emission standards are exactly the same.For instance, Euro-III is tested at sub-zero temperatures in European coun-tries. In India, where the average annual temperature ranges between 24 and28 degree Celsius, the test is done away with.
Another major distinction is in the maximum speed at which the vehicle istested. A speed of 90 km/h is stipulated for BS-III, whereas it is 120 km/h forEuro-III, keeping emission limits the same in both cases. Further, the massemission test measurements done in g/km on a chassis dynamometer requiresa loading of 100 kg weight in addition to unloaded car weight in Europe.In India, BS-III norms require an extra loading of 150 kg weight to achievethe desired inertia weight mainly due to road conditions here. Details of thenorms for petrol and diesel vehicles are given in Table 14.1.

420 IC Engines
Table 14.1 Indian emission norms for petrol and diesel vehicles
Petrol Vehicles
Two-Wheelers (g/km)
Year CO HC HC + NOx1991 12 - 30 8-12 –1996 4.50 - 3.602000 2.00 - 2.002005 (BS - II) 1.50 - 1.50
Three-Wheelers (g/km)Year CO HC HC + NOx1991 12 - 30 8–12 –1996 6.75 - 5.402000 4.00 - 2.002005 (BS - II) 2.25 - 2.00
Cars (g/km)Year CO HC NOx HC + NOx1991 14.30–27.10 2.00–2.90 – –1996 8.68–12.40 - - 3.00 - 4.361998 * 4.34–6.20 - - 1.50–2.182000 2.72–6.90 - - 0.97–1.70BS – II 2.20 – – 0.50BS – III 2.30 0.20 0.15 –
Diesel Vehicles (GVW Upto 3.5 Tons)
Engine Dynamometer (g/kW h)
Year CO HC NOx PM1992 14.00 3.50 18.00 -1996 11.20 2.40 14.40 -2000 4.50 1.10 8.00 0.36 / 0.61†BS - II 4.00 1.10 7.00 0.15
Diesel Vehicles (GVW > 3.5 Tons) (Engine Dynamometer Test) (g/kW h)Year CO HC NOx PM1992 17.30 - 32.60 2.70 - 3.70 - -1996 11.20 2.40 14.40 -2000 4.50 1.10 8.00 0.36 / 0.61 †BS - II 4.00 1.10 7.00 0.15BS - III 2.10 0.66 5.0 0.10
* For Catalytic Converter Fitted Vehicles.
† For Engines with Power exceeding 85 kW / For Engines with powerupto 85 kW. BS - III - Norms with effect from 1st April 2005 in major11 Cities.
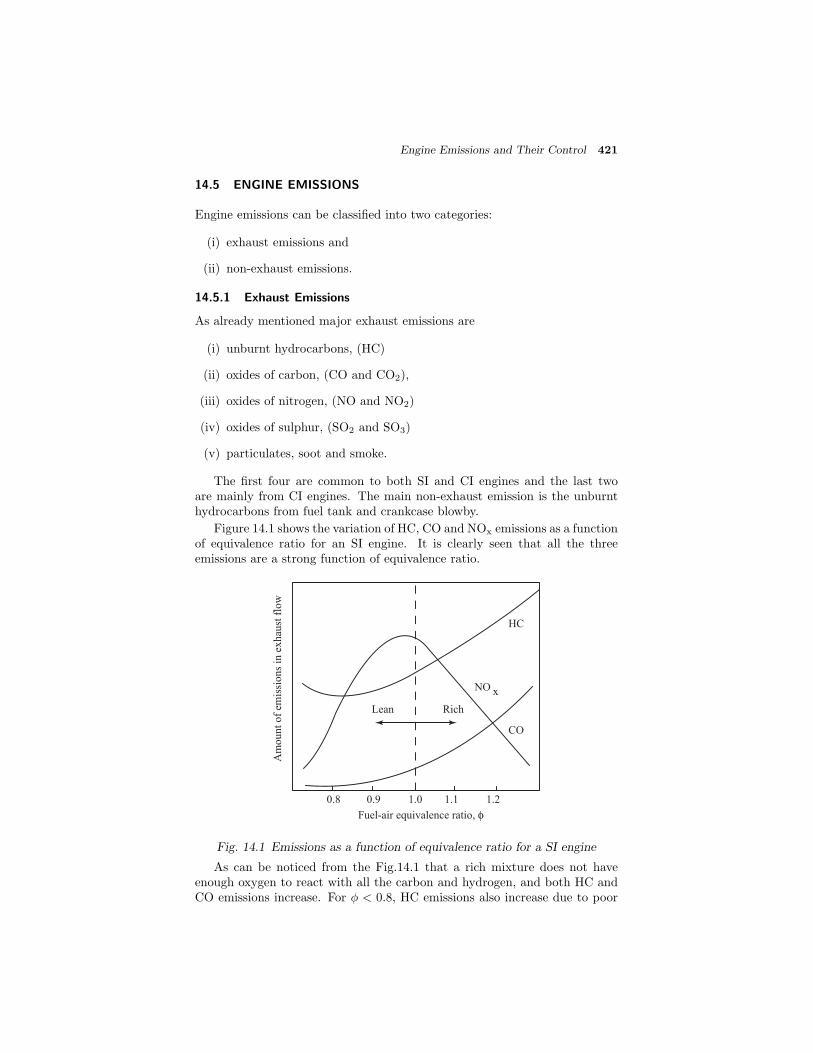
Engine Emissions and Their Control 421
14.5 ENGINE EMISSIONS
Engine emissions can be classified into two categories:
(i) exhaust emissions and
(ii) non-exhaust emissions.
14.5.1 Exhaust Emissions
As already mentioned major exhaust emissions are
(i) unburnt hydrocarbons, (HC)
(ii) oxides of carbon, (CO and CO2),
(iii) oxides of nitrogen, (NO and NO2)
(iv) oxides of sulphur, (SO2 and SO3)
(v) particulates, soot and smoke.
The first four are common to both SI and CI engines and the last twoare mainly from CI engines. The main non-exhaust emission is the unburnthydrocarbons from fuel tank and crankcase blowby.
Figure 14.1 shows the variation of HC, CO and NOx emissions as a functionof equivalence ratio for an SI engine. It is clearly seen that all the threeemissions are a strong function of equivalence ratio.
CO
HC
NO x
Lean Rich
0.8 0.9 1.0 1.1 1.2
Am
ount
of
emis
sions
in e
xhau
st f
low
Fuel-air equivalence ratio, φ
Fig. 14.1 Emissions as a function of equivalence ratio for a SI engine
As can be noticed from the Fig.14.1 that a rich mixture does not haveenough oxygen to react with all the carbon and hydrogen, and both HC andCO emissions increase. For φ < 0.8, HC emissions also increase due to poor

422 IC Engines
combustion and misfire. The generation of nitrogen oxide emissions is a func-tion of the combustion temperature, highest near stoichiometric conditionswhen temperatures are at the peak value. Maximum NOx emissions occur atslightly lean conditions, where the combustion temperature is high and thereis an excess of oxygen to react with the nitrogen.
Figure 14.2 shows a qualitative picture of HC, CO and NOx emissionswith respect to equivalence ratio, φ for a four-stroke DI Diesel engine. Ascan be seen HC will decrease slightly with increase in φ due to higher cylin-der temperatures making it easier to burn up any over-mixed (very lean) orunder-mixed (rich) fuel-air mixture. At high loads, however, HC may increaseagain if the amount of fuel in regions too rich to burn during primary com-bustion process. CO emissions will be very low at all equivalence ratio sinceexcess air is always available. NOx emission will steadily increase as φ increasedue to increasing fraction of cylinder contents being burnt gases close to stoi-chiometric during combustion, and also due to higher peak temperatures andpressures. In the following sections the causes for these emissions and theircontrols will be dealt with in detail.
0 0.2 0.4 0.6 0.8 1.0
NO
, C
O, H
C c
once
ntr
atio
n
NO
HC
CO
x
Fuel-air equivalence ratio, φ
Fig. 14.2 Emissions as a function of equivalence ratio for a CI engine
14.6 HYDROCARBONS (HC)
Exhaust gases leaving the combustion chamber of an SI engine contain upto 6000 ppm of hydrocarbon components, the equivalent of 1-1.5% of thefuel. About 40% of this is unburned components of the fuel. The other 60%consists of partially reacted components that were not present in the originalfuel. These consist of small non-equilibrium molecules, which are formedwhen large fuel molecules break up (thermal cracking) during the combustionreaction. It is often convenient to treat these molecules as if they containedone carbon atom, as CH1.
Engine Emissions and Their Control 423
Hydrocarbon emissions will be different for each gasoline blend, dependingon the original fuel components. Combustion chamber geometry and engineoperating parameters also influence the HC component spectrum.
When hydrocarbon emissions get into the atmosphere, they act as irritantsand odorants; some are carcinogenic. All components except CH4 react withatmospheric gases to form photochemical smog.
14.7 HYDROCARBON EMISSION
Figure 14.1 shows the variation of HC emission levels with respect to equiv-alence ratio for an SI engine. It is evident that it is a strong function ofair-fuel ratio. With a fuel-rich mixture there is not enough oxygen to reactwith all the carbon, resulting in high levels of HC and CO in the exhaustproducts. This is particularly true during starting, when the air-fuel mixtureis purposely made very rich. It is also true to a lesser extent during rapidacceleration under load. If air-fuel ratio is too lean poorer combustion occurs,again resulting in HC emissions. The extreme of poor combustion for a cycleis total misfire. This occurs more often as air-fuel ratio is made leaner. Onemisfire out of 1000 cycles gives exhaust emissions of 1 gm/kg of fuel used.
The causes for hydrocarbon emissions from SI engine are:
(i) Incomplete combustion
(ii) Crevice volumes and flow in crevices
(iii) Leakage past the exhaust valve
(iv) Valve overlap
(v) Deposits on walls
(vi) Oil on combustion chamber walls
We will discuss in details the various causes listed above.
14.7.1 Incomplete Combustion
Even when the fuel and air entering an engine are at the ideal stoichiometriccondition, perfect combustion does not occur and some HC ends up in theexhaust. There are several reasons for this. Complete and homogeneousmixing of fuel and air is almost impossible. The incomplete combustion isdue to:
(i) Improper mixing: Due to incomplete mixing of the air and fuel some fuelparticles do not find oxygen to react with. This causes HC emissions.
(ii) Flame quenching: As the flame goes very close to the walls it getsquenched at the walls leaving a small volume of unreacted air-fuel mix-ture. The thickness of this unburned layer is of the order of 100 microns.However, it may be noted that some of this mixture near the wall thatdoes not originally get burned as the flame front passes will burn later inthe combustion process due to additional mixing, swirl and turbulence.

424 IC Engines
Another reason for flame quenching is the expansion of gases, which occursduring combustion and power stroke. As the piston moves down from TDCto BDC during power stroke, expansion of the gases lowers both pressure andtemperature within the cylinder. This makes combustion slow and finallyquenches the flame somewhere late in the expansion stroke. This leaves somefuel particles unreacted and causes HC emissions.
High exhaust gas contamination causes poor combustion and which in turncauses quenching during expansion. This is experienced at low load and idleconditions. High levels of EGR will also cause quenching of flame and willresult in HC emission.
It has been found that HC emissions can be reduced by incorporatingan additional spark plug at appropriate locations in the engine combustionchamber. By starting combustion at two points, the flame travel distance andtotal reaction time are both reduced, and less expansion quenching will result.
14.7.2 Crevice Volumes and Flow in Crevices
The volumes between the piston, piston rings, and cylinder wall are shownschematically in Fig.14.3. These crevices consist of a series of volumes (num-bered 1 to 5) connected by flow restrictions such as the ring side clearanceand ring gap. The geometry changes as each ring moves up and down in itsring groove, sealing either at the top or bottom ring surface. The gas flow,pressure distribution, and ring motion are therefore coupled.
Oil ring
Region side clearance
Top ring gap
Top land crevice
Region behind rings
Plane a
b
c
d
Combustion chamber
1
3
5
2
4
Fig. 14.3 Schematic of piston and ring assembly in automotive spark-ignitionengine showing various crevice volume
During the compression stroke and early part of the combustion process,air and fuel are compressed into the crevice volume of the combustion chamberat high pressure. As much as 3.5% of the fuel in the chamber can be forced
Engine Emissions and Their Control 425
into this crevice volume. Later in the cycle during the expansion stroke,pressure in the cylinder is reduced below crevice volume pressure, and reverseblow-by occurs. Fuel and air, flow back into the combustion chamber, wheremost of the mixture is consumed in the flame. However, before the lastelements of reverse blow-by occurs flame will be quenched and unreacted fuelparticles come out in the exhaust. Location of the spark plug relative to thetop compression ring gap will affect the amount of HC in engine exhaust.The farther the spark plug is from the ring gap, the greater is the HC in theexhaust. This is because more fuel will be forced into the gap before the flamefront passes.
Crevice volume around the piston rings is greatest when the engine is cold,due to the differences in thermal expansion of the various materials. Up to80% of all HC emissions can come from this source.
14.7.3 Leakage Past the Exhaust Valve
As pressure increases during compression and combustion, some amount ofair-fuel mixture is forced into the crevice volume around the edges of theexhaust valve and between the valve and valve seat. A small amount evenleaks past the valve into the exhaust manifold. When the exhaust valve opens,the air-fuel mixture which is still in this crevice volume gets carried into theexhaust manifold. This causes a momentary increase in HC concentration atthe start of blowdown process.
14.7.4 Valve Overlap
Valve overlap is a must to obtain satisfactory performance from the engine.During valve overlap, both the exhaust and intake valves are open, simulta-neously creating a path where the fresh air-fuel mixture can flow directly intothe exhaust. A well-designed engine minimizes this flow, but a small amountof fresh fuel-air mixture escape is inevitable. The worst condition for this isat idle and low speed, when the overlap in terms of time (milliseconds) is thelargest.
14.7.5 Deposits on Walls
Gas particles, including those of fuel vapor, are absorbed by the deposits onthe walls of the combustion chamber. The amount of absorption is a functionof gas pressure. The maximum absorption occurs during compression andcombustion. Later in the cycle, when the exhaust valve opens and cylinderpressure gets reduced, absorption capacity of the deposit material becomeslower. Gas particles are desorbed back into the cylinder. These particles,including some HC, comes out from the cylinder during the exhaust stroke.This problem is greater in engines with higher compression ratios due to thehigher pressure these engines generate. More gas absorption occurs as pressuregoes up. Clean combustion chamber walls with minimum deposits will reduceHC emissions in the exhaust. Most gasoline blends include additives to reducedeposit buildup in engines. Older engines will typically have a greater amountof wall deposit buildup. This increases HC emissions correspondingly. This isdue to age and to less swirl that was generally found in earlier engine design.

426 IC Engines
High swirl helps to keep wall deposits to a minimum. When unleaded gasolineis used HC emissions from wall deposits becomes more severe. When leadedgasoline is burned the lead compounds make the walls harder and less porousto gas absorption.
14.7.6 Oil on Combustion Chamber Walls
A very thin layer of oil gets deposited on the cylinder walls to provide lu-brication between the walls and the moving piston. During the intake andcompression strokes, the incoming air and fuel comes in contact with this oilfilm. In the same way as wall deposits, this oil film absorbs and desorbs gasparticles, depending on gas pressure.
During compression and combustion, when cylinder pressure is high, gasparticles, including fuel vapor, are absorbed into the oil film. When pressureis later reduced during expansion and blowdown, the absorption capability ofthe oil is reduced and fuel particles are desorbed back into the cylinder. Someof this fuel ends up in the exhaust.
As an engine ages, the clearance between piston rings and cylinder wallsbecomes greater, and a thicker film of oil is left on the walls. Some of this oilfilm is scraped off the walls during the compression stroke and gets burnedduring combustion. Oil is a high-molecular-weight hydrocarbon compoundthat does not burn as readily as gasoline. Some of it comes out as HC emis-sions. This happens at a very slow rate with a new engine but increases withengine age and wear.
Often as an engine ages, due to wear, clearance between the pistons andcylinder walls increases. This increases oil consumption contributes to anincrease in HC emissions in three ways:
(i) there is added crevice volume,
(ii) there is added absorption-desorption of fuel in the thicker oil film oncylinder walls, and
(iii) there is more oil burned in the combustion process.
Figure 14.4 shows how HC emissions go up as oil consumption increases. Oilconsumption increases as the piston rings and cylinder walls wear. In olderengines, oil being burned in the combustion chamber is a major source ofHC emissions. In addition to oil consumption going up as piston rings wear,blowby and reverse blowby also increase. The increase in HC emissions istherefore both from combustion of oil and from the added crevice volumeflow.
14.8 HYDROCARBON EMISSION FROM TWO-STROKE ENGINES
Older two-stroke SI engines and many modern small two-stroke SI enginesadd HC emissions to the exhaust during the scavenging process. The intakeair-fuel mixture is used to push exhaust residual out of the open exhaust portwhich is called scavenging. When this is done, some of the air and fuel mixwith the exhaust gases and are expelled out of the cylinder before the exhaust
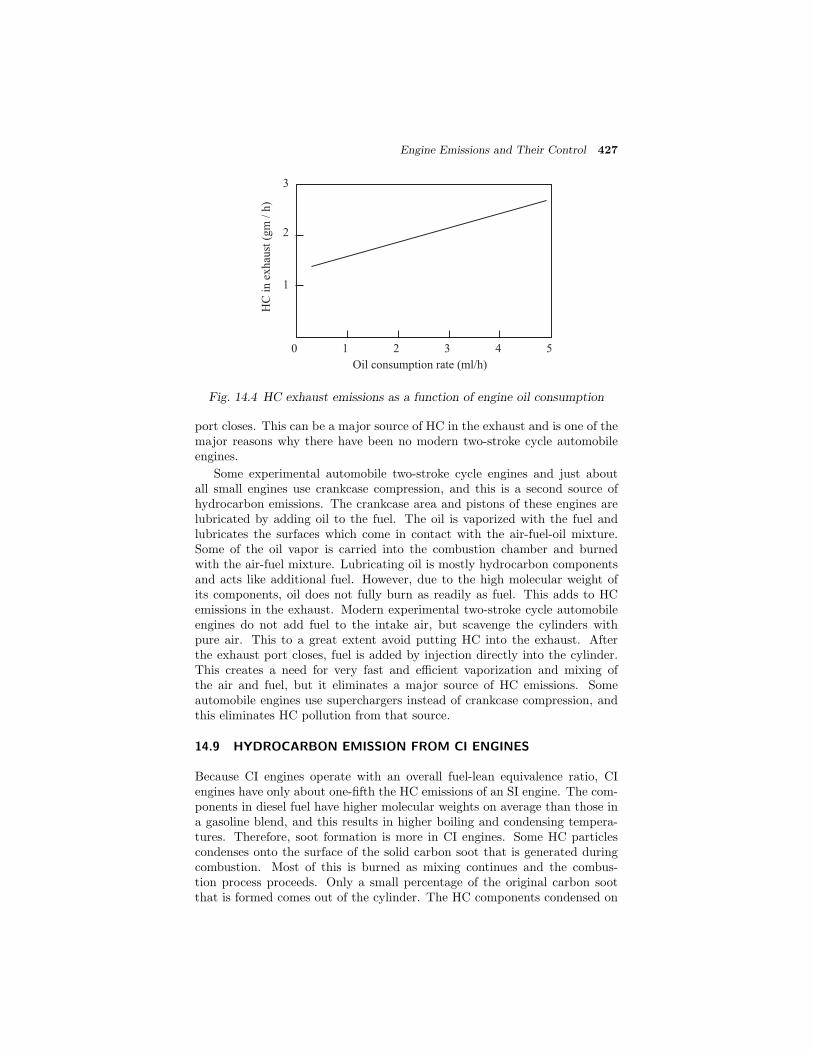
Engine Emissions and Their Control 427
HC
in
ex
hau
st (
gm
/ h
)
1
2
3
0 1 2 3 4 5
Oil consumption rate (ml/h)
Fig. 14.4 HC exhaust emissions as a function of engine oil consumption
port closes. This can be a major source of HC in the exhaust and is one of themajor reasons why there have been no modern two-stroke cycle automobileengines.
Some experimental automobile two-stroke cycle engines and just aboutall small engines use crankcase compression, and this is a second source ofhydrocarbon emissions. The crankcase area and pistons of these engines arelubricated by adding oil to the fuel. The oil is vaporized with the fuel andlubricates the surfaces which come in contact with the air-fuel-oil mixture.Some of the oil vapor is carried into the combustion chamber and burnedwith the air-fuel mixture. Lubricating oil is mostly hydrocarbon componentsand acts like additional fuel. However, due to the high molecular weight ofits components, oil does not fully burn as readily as fuel. This adds to HCemissions in the exhaust. Modern experimental two-stroke cycle automobileengines do not add fuel to the intake air, but scavenge the cylinders withpure air. This to a great extent avoid putting HC into the exhaust. Afterthe exhaust port closes, fuel is added by injection directly into the cylinder.This creates a need for very fast and efficient vaporization and mixing ofthe air and fuel, but it eliminates a major source of HC emissions. Someautomobile engines use superchargers instead of crankcase compression, andthis eliminates HC pollution from that source.
14.9 HYDROCARBON EMISSION FROM CI ENGINES
Because CI engines operate with an overall fuel-lean equivalence ratio, CIengines have only about one-fifth the HC emissions of an SI engine. The com-ponents in diesel fuel have higher molecular weights on average than those ina gasoline blend, and this results in higher boiling and condensing tempera-tures. Therefore, soot formation is more in CI engines. Some HC particlescondenses onto the surface of the solid carbon soot that is generated duringcombustion. Most of this is burned as mixing continues and the combus-tion process proceeds. Only a small percentage of the original carbon sootthat is formed comes out of the cylinder. The HC components condensed on
428 IC Engines
the surface of the carbon particles, in addition to the solid carbon particlesthemselves, contribute to the HC emissions of the engine.
In general, a CI engine has combustion efficiency of about 98%. Thismeans that only about 2% of the HC fuel being emitted. Because of the non-homogeneity of fuel-air mixture some local spots in the combustion chamberwill be too lean to combust properly. Other spots may be too rich, with notenough oxygen to burn all the fuel. Local spots range from very rich to verylean, and many flame fronts exist at the same time. With undermixing, somefuel particles in fuel-rich zones never react due to lack of oxygen. In fuel-lean zones, combustion is limited and some fuel does not get burned. Withovermixing, some fuel particles will be mixed with already burned gas andwill therefore not combust totally.
It is important that injectors be constructed such that when injection stopsthere is no dribble. However, a small amount of liquid fuel will be trapped onthe tip of the nozzle. This very small volume of fuel is called sac volume, itssize depending on the nozzle design. This sac volume of liquid fuel evaporatesvery slowly because it is surrounded by a fuel rich zone and, once the injectornozzle closes, there is no pressure pushing it into the cylinder. Some of thisfuel does not evaporate until combustion has stopped, and this increases HCemissions.
CI engines also have HC emissions for some of the same reasons as SIengines do (i.e., wall deposit absorption, oil film absorption, crevice volume,etc).
14.10 CARBON MONOXIDE (CO) EMISSION
Carbon monoxide is a colorless and odorless but a poisonous gas. It is gen-erated in an engine when it is operated with a fuel-rich equivalence ratio, asshown in Fig.14.1. When there is not enough oxygen to convert all carbon toCO2, some fuel does not get burned and some carbon ends up as CO. Typi-cally the exhaust of an SI engine will be about 0.2 to 5% carbon monoxide.Not only is CO considered an undesirable emission, but it also represents lostchemical energy. CO is a fuel that can be combusted to supply additionalthermal energy:
CO +1
2O2 → CO2 + heat (14.1)
Maximum CO is generated when an engine runs rich. Rich mixture isrequired during starting or when accelerating under load. Even when theintake air-fuel mixture is stoichiometric or lean, some CO will be generated inthe engine. Poor mixing, local rich regions, and incomplete combustion willalso be the source for CO emissions.
A well-designed SI engine operating under ideal conditions can have anexhaust mole fraction of CO as low as 0.001. CI engines that operate overalllean generally have very low CO emissions [Fig.14.2].

Engine Emissions and Their Control 429
14.11 OXIDES OF NITROGEN (NOx)
Exhaust gases of an engine can have up to 2000 ppm of oxides of nitrogen.Most of this will be nitrogen oxide (NO), with a small amount of nitrogen diox-ide (NO2). There will also be traces of other nitrogen-oxygen combinations.These are all grouped together NOx, with x representing some suitable num-ber. NOx is very undesirable. Regulations to reduce NOx emissions continueto become more and more stringent year by year. Released NOx reacts in theatmosphere to form ozone and is one of the major causes of photochemicalsmog.
NOx is created mostly from nitrogen in the air. Nitrogen can also be foundin fuel blends. Further, fuel may contain trace amounts of NH3, NC, andHCN, but this would contribute only to a minor degree. There are a numberof possible reactions that form NO. All the restrictions are probably occurringduring the combustion process and immediately after. These include but arenot limited to:
O + N2 → NO + N (14.2)
N + O2 → NO + O (14.3)
N + OH → NO + H (14.4)
NO, in turn, can further react to form NO2 by various means, including
NO + H2O → NO2 + H2 (14.5)
NO + O2 → NO2 + O (14.6)
At low temperatures, atmospheric nitrogen exists as a stable diatomicmolecule. Therefore, only very small trace amounts of oxides of nitrogenare found. However, at very high temperatures that occur in the combustionchamber of an engine, some diatomic nitrogen (N2) breaks down to monatomicnitrogen (N) which is reactive:
N2 → 2N (14.7)
It may be noted that the chemical equilibrium constant for Eq.14.7 ishighly dependent on temperature. Significant amount of N is generated inthe temperature range of 2500-3000 K that can exist in an engine. Othergases that are stable at low temperatures but become reactive and contributeto the formation of NOx at high temperatures include oxygen and water vapor,which break down as follows:
O2 → 2O (14.8)
H2O → OH +1
2H2 (14.9)
If one goes a little deep into combustion chemistry it can be understoodthat chemical Eqs.14.7 to 14.9 all react much further to the right as high

430 IC Engines
combustion chamber temperatures are reached. The higher the combus-tion reaction temperature, the more diatomic nitrogen, N2, will dissociateto monatomic nitrogen, N, and the more NOx will be formed. At low tem-peratures very little NOx is created.
Although maximum flame temperature will occur at a stoichiometric air-fuel ratio (φ = 1), Fig.14.1 shows that maximum NOx is formed at a slightlylean equivalence ratio of about φ = 0.95. At this condition flame temperatureis still very high, and in addition, there is an excess of oxygen that can combinewith the nitrogen to form various oxides.
In addition to temperature, the formation of NOx depends on pressure andair-fuel ratio. Combustion duration plays a significant role in NOx formationwithin the cylinder. Figure 14.5 shows the NOx versus time relationship andsupports the fact that NOx is reduced in modern engines with fast-burn com-bustion chambers. The amount of NOx generated also depends on the locationof spark plug within the combustion chamber. The highest concentration isformed around the spark plug, where the highest temperatures occur. Figure14.6 shows how NOx can be correlated with ignition timing. If spark is ad-vanced, the cylinder temperature will be increased and more NOx will becreated. Because CI engines have higher compression ratios and higher tem-peratures and pressure, they with divided combustion chambers and indirectinjection (IDI) tend to generate higher levels of NOx.
14.11.1 Photochemical Smog
NOx is one of the primary causes of photochemical smog, which has become amajor problem in many large cities of the world. Smog is formed by the photo-chemical reaction of automobile exhaust and atmospheric air in the presenceof sunlight. NO2 decomposes into NO and monatomic oxygen:
NO2 + energy from sunlight → NO + O + smog (14.10)
Monatomic oxygen is highly reactive and initiates a number of differentreactions, one of which is the formation of ozone:
O + O2 → O3 (14.11)
Ground-level ozone is harmful to lungs and other biological tissue. It is harm-ful to plants and trees and causes very heavy crop losses each year. Damageis also caused through reaction with rubber, plastics, and other materials.Ozone also results from atmospheric reactions with other engine emissionssuch as HC, aldehydes, and other oxides of nitrogen.
14.12 PARTICULATES
The exhaust of CI engines contains solid carbon soot particles that are gen-erated in the fuel-rich zones within the cylinder during combustion. Theseare seen as exhaust smoke and cause an undesirable odorous pollution. Maxi-mum density of particulate emissions occurs when the engine is under load atWOT. At this condition maximum fuel is injected to supply maximum power,

Engine Emissions and Their Control 431
1
2
φ = 0
.95
0 2 4 6 8 10
Conce
ntr
atio
n o
f N
O (k
g/m
)
x3
φ = 1.00
φ = 0.70
Time (m/s)
3
Fig. 14.5 Generation of NOx as a function of combustion time in an engine
φ = 0.95
φ = 1.00
50 40 30 20 10 0
Spark timing (degrees bTDC)
Stoichiometric
Mole
fra
ctio
n o
f N
O i
n e
xhau
st (
%)
0.3
0.2
0.1
x
Fig. 14.6 Generation of NOx in an SI engine as a function of spark timing

432 IC Engines
resulting in a rich mixture and poor fuel economy. This can be seen in theheavy exhaust smoke emitted when a truck or railroad locomotive acceleratesup a hill or from a stop.
Soot particles are clusters of solid carbon spheres. These spheres havediameters from 9 nm to 90 nm (1 nm = 10−9 m). But most of them arewithin the range of 15-30 nm. The spheres are solid carbon with HC andtraces of other components absorbed on the surface. A single soot particlemay contain up to 5000 carbon spheres.
Carbon spheres are generated in the combustion chamber in the fuel-richzones where there is not enough oxygen to convert all carbon to CO2 :
Cx Hy + z O2 → a CO2 + b H2 O + cCO + dC(s) (14.12)
Then, as turbulence and mass motion continue to mix the components inthe combustion chamber, most of these carbon particles [C(s)] find sufficientoxygen to further react and are converted to CO2:
C(s) + O2 → CO2 (14.13)
More than 90 to 95% of carbon particles originally generated within an en-gine are thus converted to CO2 and never comes out as carbon particles. Itshould be remembered that if CI engines are made to operate with an overallstoichiometric air-fuel mixture, instead of overall lean as they do, particulateemissions in the exhaust would far exceed acceptable levels.
Up to about 25% of the carbon in soot comes from lubricating oil compo-nents which vaporize and then react during combustion. The rest comes fromthe fuel and amounts to 0.2-0.5% of the fuel. Because of the high compres-sion ratios of CI engines, a large expansion occurs during the power stroke.This makes the gases within the cylinder cooled to a relatively low tempera-ture. This causes the remaining high-boiling-point components found in thefuel and lubricating oil to condense on the surface of the carbon soot parti-cles. This absorbed portion of the soot particles is called the soluble organicfraction (SOF), and the amount is highly dependent on cylinder temperature.
At light loads, cylinder temperatures are reduced and can drop to as lowas 200 ◦C during final expansion and exhaust blow-down. Under these con-ditions, SOF can be as high as 50% of the total mass of soot. Under otheroperating conditions when temperatures are not so low, very little condens-ing occurs and SOF can be as low as 3% of total soot mass. SOF consistsmostly of hydrocarbon components with some hydrogen, NO, NO2, SO2 andtrace amounts of calcium, chromium, iron, phosphorus, silicon, sulphur andzinc. Diesel fuel contains calcium, chromium, iron, silicon, and sulphur, whilelubricating oil additives contain calcium, phosphorus, and zinc.
Particulate generation can be reduced by engine design and control of op-erating conditions, but quite often this will create other adverse results. Ifthe combustion time is extended by combustion chamber design and timingcontrol, particulate amounts in the exhaust can be reduced. Soot particlesoriginally generated will have a greater time to be mixed with oxygen andcombusted to CO2. However, a longer combustion time means a high cylinder

Engine Emissions and Their Control 433
temperature and more NOx generation. Dilution with EGR lowers NOx emis-sions but increases particulates and HC emissions. Higher injection pressuregives a finer droplet size. This will reduce HC and particulate emissions butincreases cylinder temperature and NOx emissions. Engine management sys-tems are programmed to minimize CO, HC, NOx, and particulate emissionsby controlling ignition timing, injection pressure, injection timing, and/orvalve timing. Obviously, some sort of compromise is necessary. In most casesexhaust particulate amounts cannot be reduced to acceptable levels solely byengine design and control.
14.13 OTHER EMISSIONS
Apart from major emissions like unburnt hydrocarbon, carbon monoxide andNOx, there are other emissions that come out of the exhaust. A brief accountof other emissions are given in the following sections.
14.13.1 Aldehydes
A major emission problem when alcohol fuel is used is the generation of alde-hydes, an eye and respiratory irritant. These have the chemical formula of:where R denotes various chemical radicals. This is a product of incomplete
H
CR O
combustion and would be a major problem if as much alcohol fuel were usedas presently as gasoline.
14.13.2 Sulphur
Many fuels used in CI engines contain small amounts of sulphur. When ex-hausted in the form of SO2 and SO3 (called SOx) they contribute to the acidrain problem of the world. Unleaded gasoline generally contains 150-550 ppmsulphur by weight. Some diesel fuels contain up to 5500 ppm by weight, butin the developed countries this is restricted by law to a tenth of this value orless. At high temperatures, sulphur combines with hydrogen to form H2S andwith oxygen to form SO2:
H2 + S → H2S (14.14)
O2 + S → SO2 (14.15)
Engine exhaust can contain up to 20 ppm of SO2. SO2 then combines withoxygen in the air to form SO3
2 SO2 + O2 → 2 SO3 (14.16)
These combine with water vapor in the atmosphere to form sulphuric acid(H2SO4) and sulphurous acid (H2SO3), which are ingredients in acid rain

434 IC Engines
SO3 + H2O → H2 SO4 (14.17)
SO2 + H2O → H2 SO3 (14.18)
Many countries have laws restricting the amount of sulphur allowed infuel. These are continuously being made more stringent. During the 1990s,the developed countries reduced acceptable levels of sulphur in diesel fuel from0.05% by weight to 0.01%.
The amount of sulphur in natural gas can range from little (sweet) to large(sour) amounts. This can be a major emissions problem when natural gas isused in a IC engine or any other combustion system.
14.13.3 Lead
Lead was a major gasoline additive from its introduction in 1920s to whenit was phased out in the 1980s. The additive TEL (tetraethyl lead) was ef-fectively used to increase gasoline octane number, which allowed higher com-pression ratios and more efficient engines. However, the resulting lead in theengine exhaust was a highly poisonous pollutant. During the first half ofthe 1900s, due to the lower number of automobiles and other engines, theatmosphere was able to absorb these emissions of lead without noticeableproblems. As population and automobile density increased, the awareness ofair pollution and its danger also increased. The danger of lead emissions wasrecognized, and a phase-out occurred during the 1970s and 1980s.
The use of lead could not be stopped immediately but had to be phased outover a number of years. First, low-lead gasoline was introduced, and then,years later no-lead gasoline. Lead was still the major additive to raise theoctane number of gasoline, and alternate octane raisers had to be developedas lead was phased out. Millions of modern high-compression ratio enginescould not use low-octane fuel.
Metals used in engines also had to be changed as lead in gasoline wasphased out. When leaded fuel is burned, it hardens the surfaces in the com-bustion chamber and on the valves and valve seats. Engines designed to useleaded fuel had softer metal surfaces to start and relied on surface hardeningeffects that occurred in use. If these engines are used with unleaded fuel,surface hardening is not realized. Quick and serious wear problems were ex-perienced. Catastrophic failures of valve seats or piston faces are commonin a short period of time (i.e., 10,000–20,000 km in an automobile). Hence,harder metals and added surface treatments are being employed for enginesdesigned to use unleaded fuel. It was necessary to phase out leaded gasolineover a period of time as older automobiles wore out and were taken out ofoperation.
Leaded gasoline contains about 0.15 gm/liter of lead in the fuel. 10 to50% of this gets exhausted out with the other combustion products. Theremaining lead gets deposited on the walls of the engine and exhaust system.The hardened combustion chamber surfaces which resulted from the burningof leaded gasoline were quite impervious to the absorption of gases such as fuelvapor. HC emissions were also, therefore, slightly reduced in these engines.
Engine Emissions and Their Control 435
14.13.4 Phosphorus
Small amounts of phosphorus are emitted in engine exhaust. These comefrom impurities in the air and small amounts found in some fuel blends andlubricating oil.
14.14 EMISSION CONTROL METHODS
It is to be noted that combustion process in the four-stroke cycle occurs onlyfor about 25 to 50 ms depending upon the operating conditions. After thecombustion process ends, the exhaust gas constituents in the cylinder gasmixture that have been partially burned continue to react during the expan-sion stroke, during exhaust blowdown, and into the exhaust process. Over90 to 95% of the HC remaining after combustion reacts during this time ei-ther in the cylinder, near the exhaust port, or in the upstream part of theexhaust manifold. CO and small component hydrocarbons react with oxygento form CO2 and H2O and reduce undesirable emissions. The higher the ex-haust temperature, the more these secondary reactions occur and the lowerthe engine emissions. Higher exhaust temperature can be caused by stoichio-metric air-fuel combustion, high engine speed, retarded spark, and/or a lowexpansion ratio. Hence, in order to reduce emissions, some after-treatmentsare necessary with add on devices. The details are discussed in the followingsections.
14.14.1 Thermal Converters
Secondary reactions occur much more readily and completely if the temper-ature is high. So some engines are equipped with thermal converters as ameans of lowering emissions. Thermal converters are high-temperature cham-bers through which the exhaust gas flows. They promote oxidation of the COand HC which remain in the exhaust.
CO +1
2O2 → CO2 (14.19)
For this reaction to occur at a useful rate, the temperature must be held above700 ◦C. Now consider the reaction
Cx Hy + z O2 → x CO2 + y H2 O (14.20)
where z = x + 0.25y.
The above reaction needs a temperature above 600 ◦C for at least 50 mil-liseconds to substantially reduce HC. It is therefore necessary for a thermalconverter to be effective, it should operate at a high temperature. Further,it should also be large enough to provide adequate residence time of the ex-haust gases to promote the occurrence of these secondary reactions. Mostthermal converters are essentially an enlarged exhaust manifold connectedto the engine immediately outside the exhaust ports. This is necessary tominimize heat losses and keep the exhaust gases from cooling to nonreactingtemperatures.
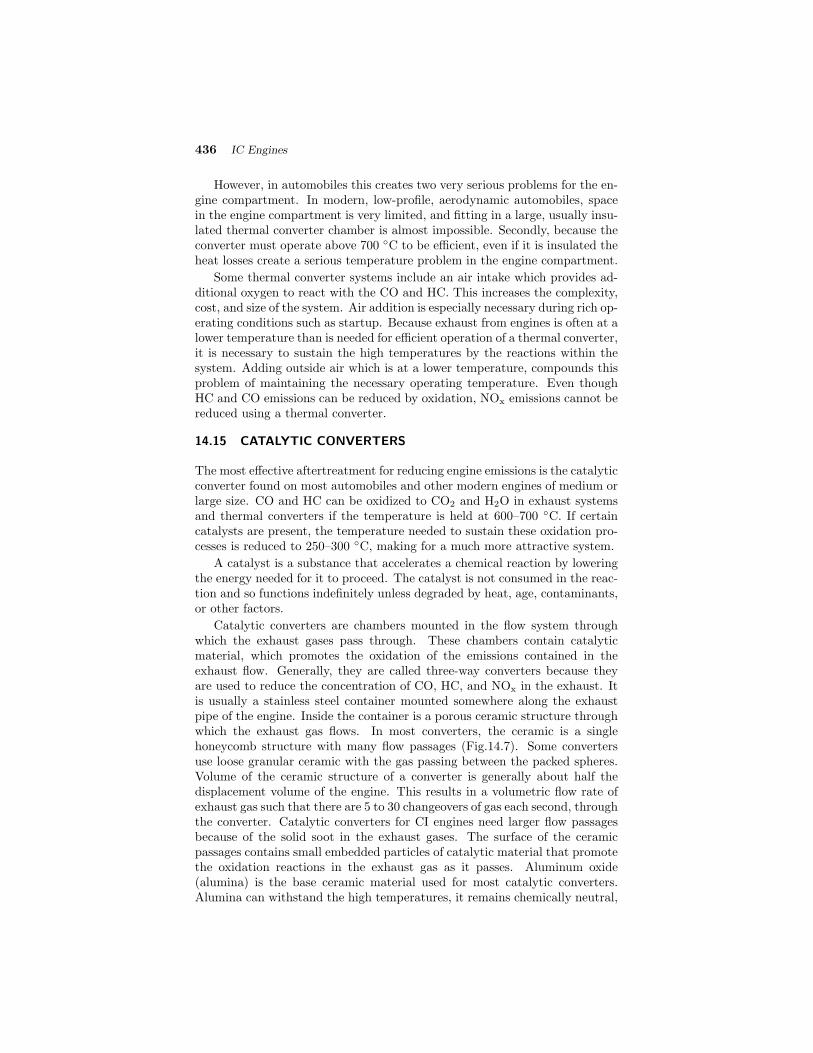
436 IC Engines
However, in automobiles this creates two very serious problems for the en-gine compartment. In modern, low-profile, aerodynamic automobiles, spacein the engine compartment is very limited, and fitting in a large, usually insu-lated thermal converter chamber is almost impossible. Secondly, because theconverter must operate above 700 ◦C to be efficient, even if it is insulated theheat losses create a serious temperature problem in the engine compartment.
Some thermal converter systems include an air intake which provides ad-ditional oxygen to react with the CO and HC. This increases the complexity,cost, and size of the system. Air addition is especially necessary during rich op-erating conditions such as startup. Because exhaust from engines is often at alower temperature than is needed for efficient operation of a thermal converter,it is necessary to sustain the high temperatures by the reactions within thesystem. Adding outside air which is at a lower temperature, compounds thisproblem of maintaining the necessary operating temperature. Even thoughHC and CO emissions can be reduced by oxidation, NOx emissions cannot bereduced using a thermal converter.
14.15 CATALYTIC CONVERTERS
The most effective aftertreatment for reducing engine emissions is the catalyticconverter found on most automobiles and other modern engines of medium orlarge size. CO and HC can be oxidized to CO2 and H2O in exhaust systemsand thermal converters if the temperature is held at 600–700 ◦C. If certaincatalysts are present, the temperature needed to sustain these oxidation pro-cesses is reduced to 250–300 ◦C, making for a much more attractive system.
A catalyst is a substance that accelerates a chemical reaction by loweringthe energy needed for it to proceed. The catalyst is not consumed in the reac-tion and so functions indefinitely unless degraded by heat, age, contaminants,or other factors.
Catalytic converters are chambers mounted in the flow system throughwhich the exhaust gases pass through. These chambers contain catalyticmaterial, which promotes the oxidation of the emissions contained in theexhaust flow. Generally, they are called three-way converters because theyare used to reduce the concentration of CO, HC, and NOx in the exhaust. Itis usually a stainless steel container mounted somewhere along the exhaustpipe of the engine. Inside the container is a porous ceramic structure throughwhich the exhaust gas flows. In most converters, the ceramic is a singlehoneycomb structure with many flow passages (Fig.14.7). Some convertersuse loose granular ceramic with the gas passing between the packed spheres.Volume of the ceramic structure of a converter is generally about half thedisplacement volume of the engine. This results in a volumetric flow rate ofexhaust gas such that there are 5 to 30 changeovers of gas each second, throughthe converter. Catalytic converters for CI engines need larger flow passagesbecause of the solid soot in the exhaust gases. The surface of the ceramicpassages contains small embedded particles of catalytic material that promotethe oxidation reactions in the exhaust gas as it passes. Aluminum oxide(alumina) is the base ceramic material used for most catalytic converters.Alumina can withstand the high temperatures, it remains chemically neutral,

Engine Emissions and Their Control 437
it has very low thermal expansion, and it does not thermally degrade withage. The catalyst materials most used are platinum, palladium, and rhodium.
Outlet gasCatalytic pellet compound
Metal shell
Shell
Catalyst
Inlet gas
Outer wrap
InsulationOuter wrap
Insulation
Converter shell
Catalyst
Retainer
Fill plug
(a) Packed spheres
Palladium and platinum promote the oxidation of CO and HC as inEqs.14.19 and 14.20, with platinum especially active in the hydrocarbon reac-tion. Rhodium promotes the reaction of NOx in one or more of the followingreactions:
NO + CO → 1
2N2 + CO2 (14.21)
2 NO + 5 CO + 3 H2O → 2 NH3 + 5 CO2 (14.22)
2 NO + CO → N2O + CO2 (14.23)
NO + H2 → 1
2N2 + H2O (14.24)

438 IC Engines
2 NO + 5 H2 → 2 NH3 + 2 H2 O (14.25)
2 NO + H2 → N2 O + H2 O (14.26)
Also often used is cerium oxide, which promotes the so-called water gas shift
CO + H2 O → CO2 + H2 (14.27)
This reduces CO by using water vapor as an oxidant instead of O2, which isvery important when the engine is running rich.
Figure 14.8 shows that the efficiency of a catalytic converter is very muchdependent on temperature. When a converter in good working order is oper-ating at a fully warmed temperature of 400 ◦C or above, it will remove 98-99%of CO, 95% of NOx, and more than 95% of HC from exhaust flow emissions.
0 100 200 300 400 500
20
40
60
80
100
HC
Light-off
temperature
Temperature ( C)o
NOx
CO
Cat
alyti
c co
nver
ter
effi
cien
cy (
%)
Fig. 14.8 Conversion efficiency of catalytic converters as a function of con-verter temperature
Figure 14.9 shows that it is also necessary to be operating at the properequivalence ratio to get high converter efficiency. Effective control of HCand CO occurs with stoichiometric or lean mixtures while control of NOx
requires near stoichiometric conditions. Very poor NOx control occurs withlean mixtures.
It is important that a catalytic converter be operated hot to be efficient,but not hotter. Engine malfunctions can cause poor efficiency and overheatingof converters. A poorly tuned engine can have misfires and periods of toolean and/or too rich conditions. These cause the converter to be inefficient.A turbocharger lowers the exhaust temperature by removing energy, and thiscan make a catalytic converter less efficient.
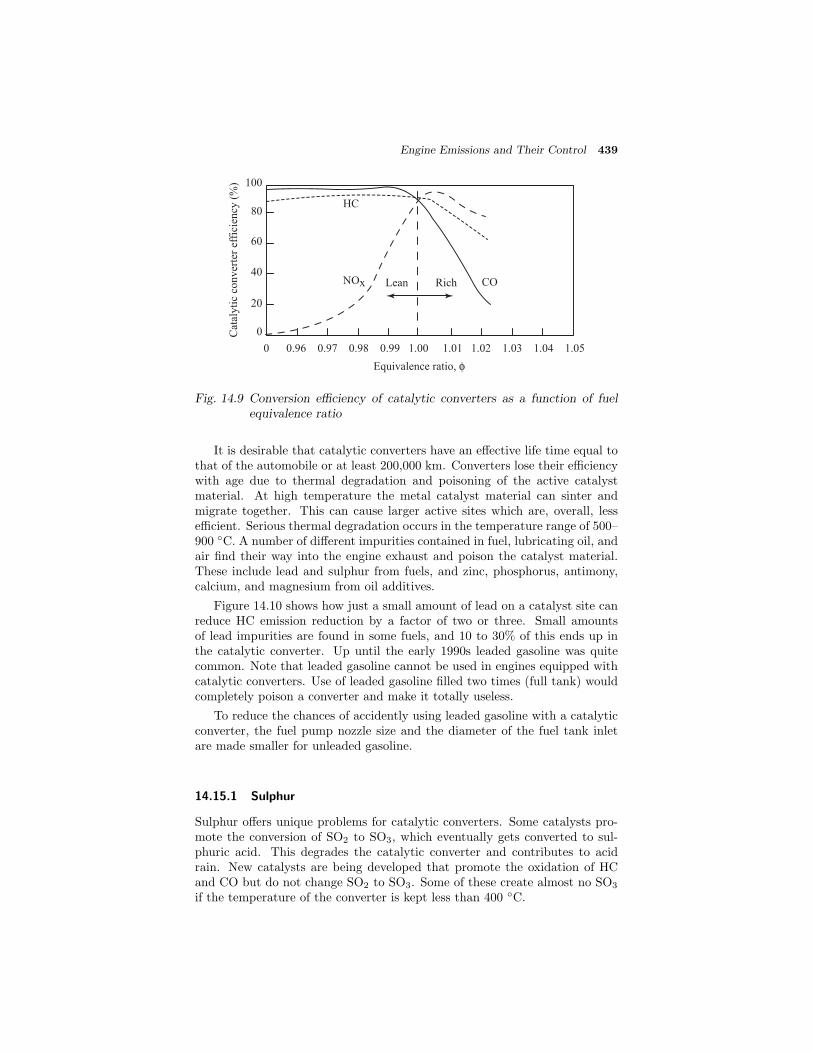
Engine Emissions and Their Control 439
0 0.96 0.97 0.98 0.99 1.00 1.01 1.02 1.03 1.04 1.05
Equivalence ratio, φ
Lean Rich
HC
NOx CO
Cat
alyti
c co
nver
ter
effi
cien
cy (
%)
0
20
40
60
80
100
Fig. 14.9 Conversion efficiency of catalytic converters as a function of fuelequivalence ratio
It is desirable that catalytic converters have an effective life time equal tothat of the automobile or at least 200,000 km. Converters lose their efficiencywith age due to thermal degradation and poisoning of the active catalystmaterial. At high temperature the metal catalyst material can sinter andmigrate together. This can cause larger active sites which are, overall, lessefficient. Serious thermal degradation occurs in the temperature range of 500–900 ◦C. A number of different impurities contained in fuel, lubricating oil, andair find their way into the engine exhaust and poison the catalyst material.These include lead and sulphur from fuels, and zinc, phosphorus, antimony,calcium, and magnesium from oil additives.
Figure 14.10 shows how just a small amount of lead on a catalyst site canreduce HC emission reduction by a factor of two or three. Small amountsof lead impurities are found in some fuels, and 10 to 30% of this ends up inthe catalytic converter. Up until the early 1990s leaded gasoline was quitecommon. Note that leaded gasoline cannot be used in engines equipped withcatalytic converters. Use of leaded gasoline filled two times (full tank) wouldcompletely poison a converter and make it totally useless.
To reduce the chances of accidently using leaded gasoline with a catalyticconverter, the fuel pump nozzle size and the diameter of the fuel tank inletare made smaller for unleaded gasoline.
14.15.1 Sulphur
Sulphur offers unique problems for catalytic converters. Some catalysts pro-mote the conversion of SO2 to SO3, which eventually gets converted to sul-phuric acid. This degrades the catalytic converter and contributes to acidrain. New catalysts are being developed that promote the oxidation of HCand CO but do not change SO2 to SO3. Some of these create almost no SO3
if the temperature of the converter is kept less than 400 ◦C.
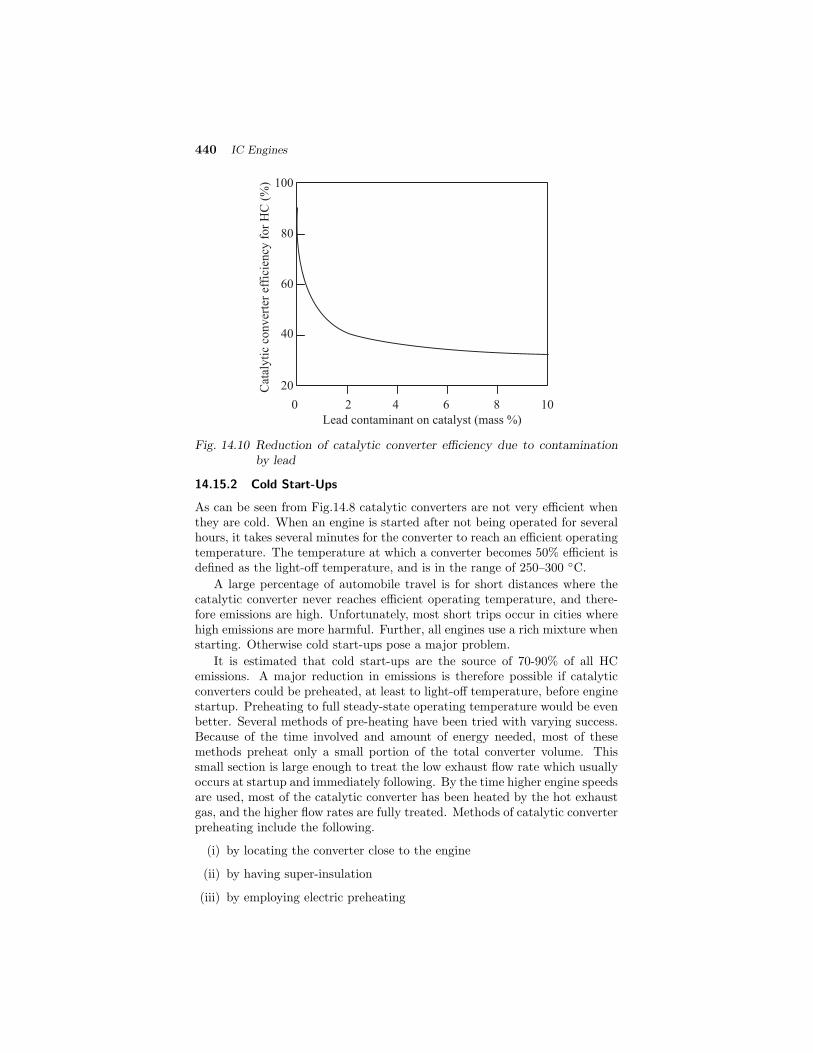
440 IC Engines
0 2 4 6 8 10
Lead contaminant on catalyst (mass %)
Cat
alyti
c co
nver
ter
effi
cien
cy f
or
HC
(%
)
20
40
60
80
100
Fig. 14.10 Reduction of catalytic converter efficiency due to contaminationby lead
14.15.2 Cold Start-Ups
As can be seen from Fig.14.8 catalytic converters are not very efficient whenthey are cold. When an engine is started after not being operated for severalhours, it takes several minutes for the converter to reach an efficient operatingtemperature. The temperature at which a converter becomes 50% efficient isdefined as the light-off temperature, and is in the range of 250–300 ◦C.
A large percentage of automobile travel is for short distances where thecatalytic converter never reaches efficient operating temperature, and there-fore emissions are high. Unfortunately, most short trips occur in cities wherehigh emissions are more harmful. Further, all engines use a rich mixture whenstarting. Otherwise cold start-ups pose a major problem.
It is estimated that cold start-ups are the source of 70-90% of all HCemissions. A major reduction in emissions is therefore possible if catalyticconverters could be preheated, at least to light-off temperature, before enginestartup. Preheating to full steady-state operating temperature would be evenbetter. Several methods of pre-heating have been tried with varying success.Because of the time involved and amount of energy needed, most of thesemethods preheat only a small portion of the total converter volume. Thissmall section is large enough to treat the low exhaust flow rate which usuallyoccurs at startup and immediately following. By the time higher engine speedsare used, most of the catalytic converter has been heated by the hot exhaustgas, and the higher flow rates are fully treated. Methods of catalytic converterpreheating include the following.
(i) by locating the converter close to the engine
(ii) by having super-insulation
(iii) by employing electric preheating

Engine Emissions and Their Control 441
(iv) by using flame heating
(v) incorporating thermal batteries
14.16 CI ENGINES
Catalytic converters are being tried with CI engines but are not efficient atreducing NOx due to their overall lean operation. HC and CO can be ad-equately reduced, although there is greater difficulty because of the coolerexhaust gases of a CI engine (because of the larger expansion ratio). This iscounter balanced by the fact that less HC and CO are generated in the leanburn of the CI engine. NOx is reduced in a CI engine by the use of EGR,which keeps the maximum temperature down. EGR and lower combustiontemperatures, however, contribute to an increase in solid soot.
Platinum and palladium are two main catalyst materials used for convert-ers on CI engines. They promote the removal of 30–80% of the gaseous HCand 40–90% of the CO in the exhaust. The catalysts have little effect on solidcarbon soot but do remove 30–60% of the total particulate mass by oxidizinga large percent of the HC absorbed on the carbon particles. Diesel fuel con-tains sulphur impurities, and this leads to poisoning of the catalyst materials.However, this problem is getting minimized as legal levels of sulphur in dieselfuels continue to be lowered.
14.16.1 Particulate Traps
Compression ignition engine systems are equipped with particulate traps intheir exhaust flow to reduce the amount of particulates released to the atmo-sphere. Traps are filter-like systems often made of ceramic in the form of amonolith or mat, or else made of metal wire mesh. Traps typically remove60–90% of particulates in the exhaust flow. As traps catch the soot particles,they slowly fill up with the particulates. This restricts exhaust gas flow andraises the back pressure of the engine. Higher back pressure causes the engineto run hotter, the exhaust temperature to rise, and fuel consumption to in-crease. To reduce this flow restriction, particulate traps are regenerated whenthey begin to saturate. Regeneration consists of combusting the particulatesin the excess oxygen contained in the exhaust of the lean-operating CI engine.
Carbon soot ignites at about 550–650 ◦C, while CI engine exhaust is 150–350 ◦C at normal operating conditions. As the particulate trap fills with sootand restricts flow, the exhaust temperature rises but is still not high enoughto ignite the soot and regenerate the trap. In some systems, automatic flameigniters are used which start combustion in the carbon when the pressure dropacross the trap reaches a predetermined value. These igniters can be electricheaters or flame nozzles that use diesel fuel. If catalyst material is installedin the traps, the temperature needed to ignite the carbon soot is reducedto the 350–450 ◦C range. Some such traps can automatically regenerate byself-igniting when the exhaust temperature rises from increased back pressure.Other catalyst systems use flame igniters.
Another way of lowering the ignition temperature of the carbon soot andpromoting self-regeneration in traps is to use catalyst additives in the diesel

442 IC Engines
fuel. These additives generally consist of copper compounds or iron com-pounds, with about 6 to 8 grams of additive in 1000 liters of fuel is usuallynormal. To keep the temperatures high enough to self-regenerate in a cat-alytic system, traps can be mounted as close to the engine as possible, evenbefore the turbocharger.
On some larger stationary engines and on some construction equipmentand large trucks, the particulate trap is replaced when it becomes close tofilled position. The removed trap is then regenerated externally, with thecarbon being burned off in a furnace. The regenerated trap can then be usedagain.
Various methods are used to determine when soot buildup becomes exces-sive and regeneration is necessary. The most common method is to measurepressure drop in the exhaust flow as it passes through the trap. When a pre-determined pressure drop Δp is reached, regeneration is initiated. Pressuredrop is also a function of exhaust flow rate, and this must be programmedinto the regeneration controls. Another method used to sense soot buildup isto transmit radio frequency waves through the trap and determine the per-cent that is absorbed. Carbon soot absorbs radio waves while the ceramicstructure does not. The amount of soot buildup can therefore be determinedby the percent decrease in radio signal. This method does not readily detectsoluble organic fraction (SOF).
Modern particulate traps are not totally satisfactory, especially for auto-mobiles. They are costly and complex when equipped for regeneration, andlong-term durability does not exist. An ideal catalytic trap would be simple,economical, and reliable; it would be self-regenerating; and it would impose aminimum increase in fuel consumption.
14.16.2 Modern Diesel Engines
Carbon soot particulate generation has been greatly reduced in modern CI en-gines by advanced design technology in fuel injectors and combustion chambergeometry. With greatly increased mixing efficiency and speeds, large regionsof fuel- rich mixtures can be avoided when combustion starts. These are theregions where carbon soot is generated, and by reducing their volume, far lesssoot is generated. Increased mixing speeds are obtained by a combination ofindirect injection, better combustion chamber geometry, better injector designand higher pressures, heated spray targets, and air-assisted injectors. Indirectinjection into a secondary chamber that promotes high turbulence and swirlgreatly speeds the air-fuel mixing process. Better nozzle design and higherinjection pressures create finer fuel droplets which evaporate and mix quicker.Injection against a hot surface speeds evaporation, as do air-assisted injectors.Some modern, top-of-the-line CI automobile engines have reduced particulategeneration enough that they meet stringent standards without the need forparticulate traps.
14.17 REDUCING EMISSIONS BY CHEMICAL METHODS
Development work has been done on large stationary engines using cyanuricacid to reduce NOx emissions. Cyanuric acid is a low-cost solid material that

Engine Emissions and Their Control 443
sublimes in the exhaust flow. The gas dissociates, producing isocyanide thatreacts with NOx to form N2, H2O, and CO2. Operating temperature is about500 ◦C. Up to 95% NOx reduction can be achieved with no loss of engineperformance. At present, this system is not practical for automobile enginesbecause of its size, weight, and complexity.
Research is being done using zeolite molecular sieves to reduce NOx emis-sions. These are materials that absorb selected molecular compounds andcatalyze chemical reactions. Using both SI and CI engines, the efficiency ofNOx reduction is being determined over a range of operating variables, in-cluding air-fuel ratio, temperature, flow velocity, and zeolite structure. Atpresent, durability is a serious limitation with this method.
Various chemical absorbers, molecular sieves, and traps are being testedto reduce HC emissions. HC is collected during engine startup time, whenthe catalytic converter is cold, and then later released back into the exhaustflow when the converter is hot. The converter then efficiently burns the HCto H2O and CO2. A 35% reduction of cold-start HC has been achieved.
H2S emissions occur under rich operating conditions. Chemical systemsare being developed that trap and store H2S when an engine operates richand then convert this to SO2 when operation is lean and excess oxygen exists.The reaction equation is
H2 S + O2 → SO2 + H2 (14.28)
14.17.1 Ammonia Injection Systems
Some large marine engines and stationary engines reduce NOx emissions withan injection system that sprays NH3 into the exhaust flow. In the presence ofa catalyst, the following reactions occur
4 NH3 + 4 NO + O2 → 4 N2 + 6 H2O (14.29)
6 NO2 + 8 NH3 → 7 N2 + 12 H2 O (14.30)
Careful control must be adhered to, as NH3 itself is an undesirable emission.
Ammonia injection systems are not practical in automobiles or on othersmaller engines. This is because of the needed NH3 storage and fairly complexinjection and control system.
14.18 EXHAUST GAS RECIRCULATION (EGR)
The most effective way of reducing NOx emissions is to hold combustion cham-ber temperatures down. Although practical, this is a very unfortunate methodin that it also reduces the thermal efficiency of the engine. Those who haveundergone thermodynamics course are aware that to obtain maximum enginethermal efficiency it should be operated at the highest temperature possible.
Probably the simplest and practical method of reducing maximum flametemperature is to dilute the air-fuel mixture with a non-reacting parasite gas.This gas absorbs energy during combustion without contributing any energyinput. The net result is a lower flame temperature. Any nonreacting gas

444 IC Engines
would work as a diluents, as shown in Fig.14.11. Those gases with larger spe-cific heats would absorb the most energy per unit mass and would thereforerequire the least amount; thus less CO2 would be required than argon forthe same maximum temperature. However, neither CO2 nor argon is readilyavailable for use in an engine. Air is available as a diluents but is not totallynonreacting. Adding air changes the air-fuel ratio and combustion character-istics. The one nonreacting gas that is available to use in an engine is exhaustgas, and this is used in all modern automobile and other medium-size andlarge engines. Adding any non reacting neutral gas to the inlet air-fuel mix-ture reduces flame temperature and NOx generation, Exhaust gas (EGR) isthe one gas that is readily available for engine use.
0 5 10 15 20 25 30
0.20
0.15
0.10
0.05 EGRHelium
Argon
Diluent in intake (mole %)
Mo
le f
ract
ion
of
NO
i
n e
xh
aust
(%
)x
N2CO2
Fig. 14.11 NOx reduction using non-combustible diluent gas to intake mixture
Exhaust gas recycle (EGR) is done by ducting some of the exhaust flowback into the intake system, usually immediately after the throttle. Theamount of flow can be as high as 30% of the total intake. EGR combines withthe exhaust residual left in the cylinder from the previous cycle to effectivelyreduce the maximum combustion temperature. The flow rate of EGR is con-trolled by the Engine Management System. EGR is defined as a mass percentof the total intake flow
EGR =
mEGRmcyl
× 100 (14.31)
where cyl is the total mass flow into the cylinders.
After EGR combines with the exhaust residual left from the previous cycle,the total fraction of exhaust in the cylinder during the compression stroke is
xex =
EGR
100
× (1− xr) + xr (14.32)
where xr is the exhaust residual from previous cycle.
Not only does EGR reduce the maximum temperature in the combustionchamber, but it also lowers the overall combustion efficiency. Increase in
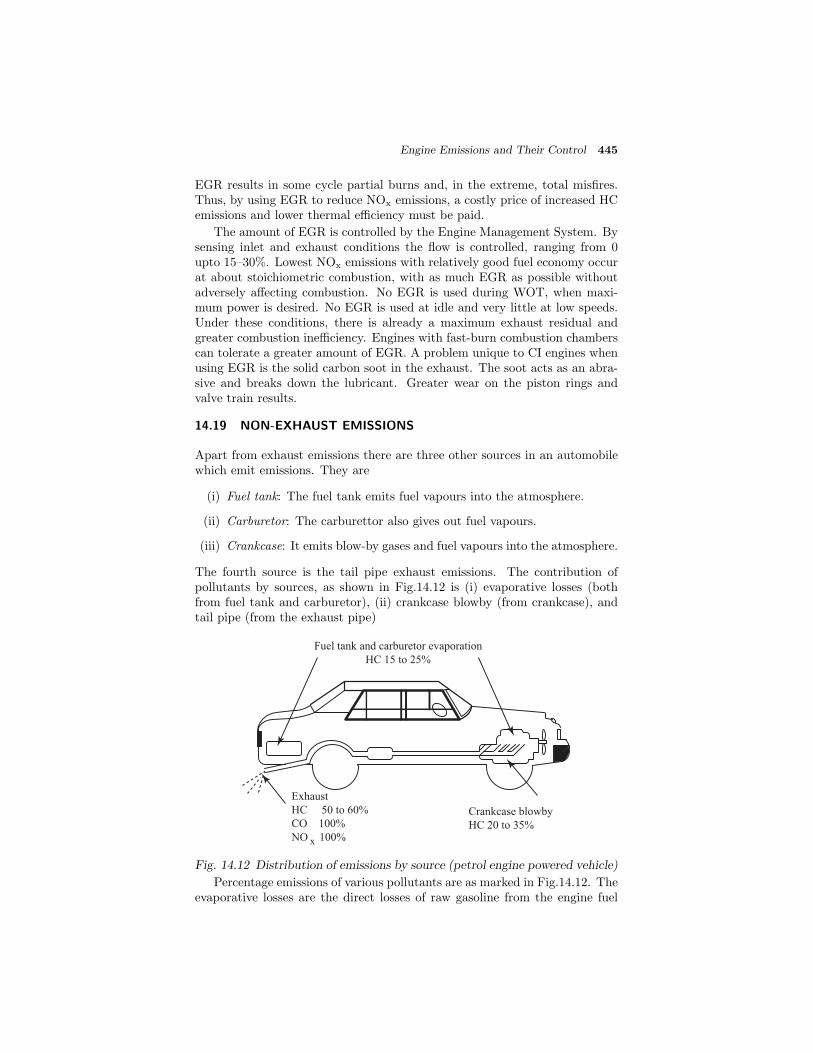
Engine Emissions and Their Control 445
EGR results in some cycle partial burns and, in the extreme, total misfires.Thus, by using EGR to reduce NOx emissions, a costly price of increased HCemissions and lower thermal efficiency must be paid.
The amount of EGR is controlled by the Engine Management System. Bysensing inlet and exhaust conditions the flow is controlled, ranging from 0upto 15–30%. Lowest NOx emissions with relatively good fuel economy occurat about stoichiometric combustion, with as much EGR as possible withoutadversely affecting combustion. No EGR is used during WOT, when maxi-mum power is desired. No EGR is used at idle and very little at low speeds.Under these conditions, there is already a maximum exhaust residual andgreater combustion inefficiency. Engines with fast-burn combustion chamberscan tolerate a greater amount of EGR. A problem unique to CI engines whenusing EGR is the solid carbon soot in the exhaust. The soot acts as an abra-sive and breaks down the lubricant. Greater wear on the piston rings andvalve train results.
14.19 NON-EXHAUST EMISSIONS
Apart from exhaust emissions there are three other sources in an automobilewhich emit emissions. They are
(i) Fuel tank: The fuel tank emits fuel vapours into the atmosphere.
(ii) Carburetor: The carburettor also gives out fuel vapours.
(iii) Crankcase: It emits blow-by gases and fuel vapours into the atmosphere.
The fourth source is the tail pipe exhaust emissions. The contribution ofpollutants by sources, as shown in Fig.14.12 is (i) evaporative losses (bothfrom fuel tank and carburetor), (ii) crankcase blowby (from crankcase), andtail pipe (from the exhaust pipe)
Exhaust
HC 50 to 60%
CO 100%
NO 100%x
Crankcase blowby
HC 20 to 35%
Fuel tank and carburetor evaporation
HC 15 to 25%
Fig. 14.12 Distribution of emissions by source (petrol engine powered vehicle)
Percentage emissions of various pollutants are as marked in Fig.14.12. Theevaporative losses are the direct losses of raw gasoline from the engine fuel
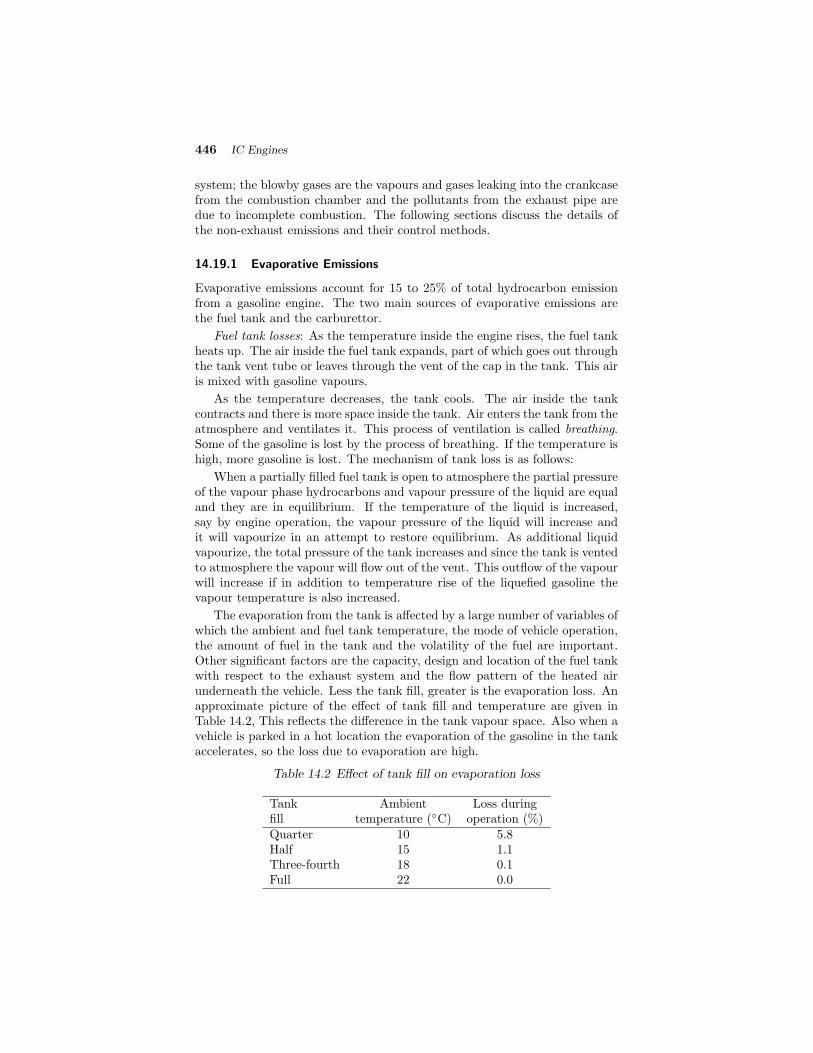
446 IC Engines
system; the blowby gases are the vapours and gases leaking into the crankcasefrom the combustion chamber and the pollutants from the exhaust pipe aredue to incomplete combustion. The following sections discuss the details ofthe non-exhaust emissions and their control methods.
14.19.1 Evaporative Emissions
Evaporative emissions account for 15 to 25% of total hydrocarbon emissionfrom a gasoline engine. The two main sources of evaporative emissions arethe fuel tank and the carburettor.
Fuel tank losses: As the temperature inside the engine rises, the fuel tankheats up. The air inside the fuel tank expands, part of which goes out throughthe tank vent tube or leaves through the vent of the cap in the tank. This airis mixed with gasoline vapours.
As the temperature decreases, the tank cools. The air inside the tankcontracts and there is more space inside the tank. Air enters the tank from theatmosphere and ventilates it. This process of ventilation is called breathing.Some of the gasoline is lost by the process of breathing. If the temperature ishigh, more gasoline is lost. The mechanism of tank loss is as follows:
When a partially filled fuel tank is open to atmosphere the partial pressureof the vapour phase hydrocarbons and vapour pressure of the liquid are equaland they are in equilibrium. If the temperature of the liquid is increased,say by engine operation, the vapour pressure of the liquid will increase andit will vapourize in an attempt to restore equilibrium. As additional liquidvapourize, the total pressure of the tank increases and since the tank is ventedto atmosphere the vapour will flow out of the vent. This outflow of the vapourwill increase if in addition to temperature rise of the liquefied gasoline thevapour temperature is also increased.
The evaporation from the tank is affected by a large number of variables ofwhich the ambient and fuel tank temperature, the mode of vehicle operation,the amount of fuel in the tank and the volatility of the fuel are important.Other significant factors are the capacity, design and location of the fuel tankwith respect to the exhaust system and the flow pattern of the heated airunderneath the vehicle. Less the tank fill, greater is the evaporation loss. Anapproximate picture of the effect of tank fill and temperature are given inTable 14.2, This reflects the difference in the tank vapour space. Also when avehicle is parked in a hot location the evaporation of the gasoline in the tankaccelerates, so the loss due to evaporation are high.
Table 14.2 Effect of tank fill on evaporation loss
Tank Ambient Loss duringfill temperature (◦C) operation (%)Quarter 10 5.8Half 15 1.1Three-fourth 18 0.1Full 22 0.0
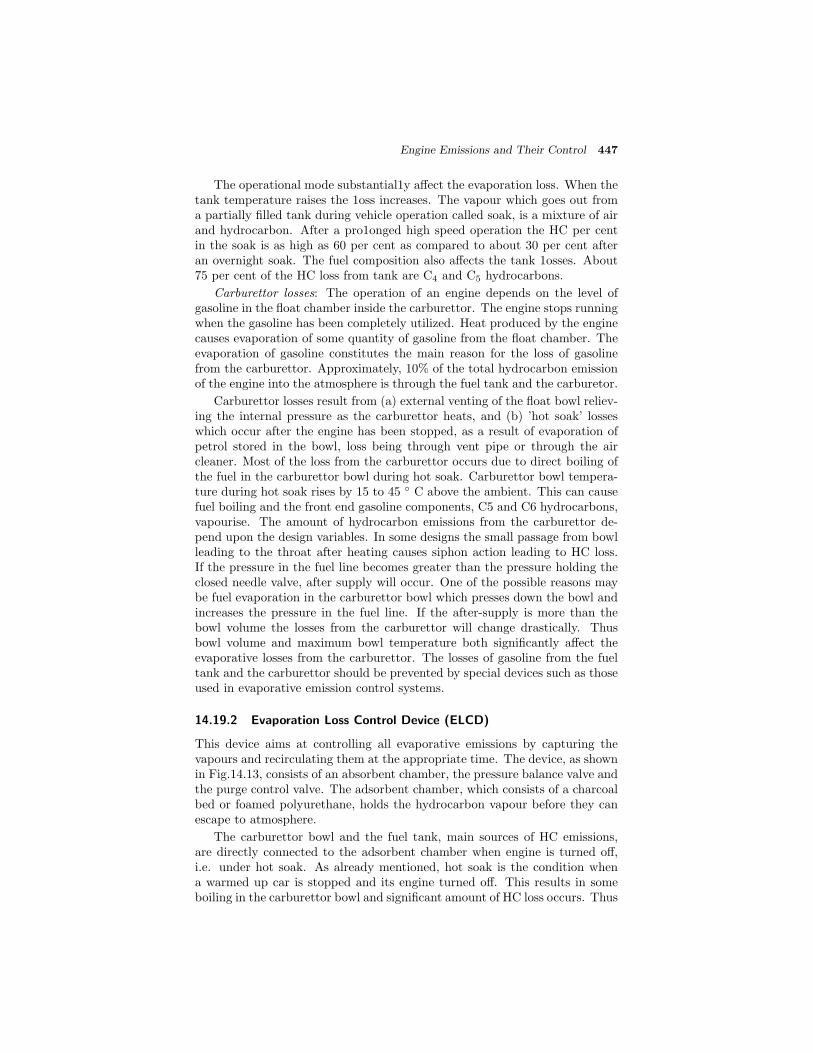
Engine Emissions and Their Control 447
The operational mode substantial1y affect the evaporation loss. When thetank temperature raises the 1oss increases. The vapour which goes out froma partially filled tank during vehicle operation called soak, is a mixture of airand hydrocarbon. After a pro1onged high speed operation the HC per centin the soak is as high as 60 per cent as compared to about 30 per cent afteran overnight soak. The fuel composition also affects the tank 1osses. About75 per cent of the HC loss from tank are C4 and C5 hydrocarbons.
Carburettor losses: The operation of an engine depends on the level ofgasoline in the float chamber inside the carburettor. The engine stops runningwhen the gasoline has been completely utilized. Heat produced by the enginecauses evaporation of some quantity of gasoline from the float chamber. Theevaporation of gasoline constitutes the main reason for the loss of gasolinefrom the carburettor. Approximately, 10% of the total hydrocarbon emissionof the engine into the atmosphere is through the fuel tank and the carburetor.
Carburettor losses result from (a) external venting of the float bowl reliev-ing the internal pressure as the carburettor heats, and (b) ’hot soak’ losseswhich occur after the engine has been stopped, as a result of evaporation ofpetrol stored in the bowl, loss being through vent pipe or through the aircleaner. Most of the loss from the carburettor occurs due to direct boiling ofthe fuel in the carburettor bowl during hot soak. Carburettor bowl tempera-ture during hot soak rises by 15 to 45 ◦ C above the ambient. This can causefuel boiling and the front end gasoline components, C5 and C6 hydrocarbons,vapourise. The amount of hydrocarbon emissions from the carburettor de-pend upon the design variables. In some designs the small passage from bowlleading to the throat after heating causes siphon action leading to HC loss.If the pressure in the fuel line becomes greater than the pressure holding theclosed needle valve, after supply will occur. One of the possible reasons maybe fuel evaporation in the carburettor bowl which presses down the bowl andincreases the pressure in the fuel line. If the after-supply is more than thebowl volume the losses from the carburettor will change drastically. Thusbowl volume and maximum bowl temperature both significantly affect theevaporative losses from the carburettor. The losses of gasoline from the fueltank and the carburettor should be prevented by special devices such as thoseused in evaporative emission control systems.
14.19.2 Evaporation Loss Control Device (ELCD)
This device aims at controlling all evaporative emissions by capturing thevapours and recirculating them at the appropriate time. The device, as shownin Fig.14.13, consists of an absorbent chamber, the pressure balance valve andthe purge control valve. The adsorbent chamber, which consists of a charcoalbed or foamed polyurethane, holds the hydrocarbon vapour before they canescape to atmosphere.
The carburettor bowl and the fuel tank, main sources of HC emissions,are directly connected to the adsorbent chamber when engine is turned off,i.e. under hot soak. As already mentioned, hot soak is the condition whena warmed up car is stopped and its engine turned off. This results in someboiling in the carburettor bowl and significant amount of HC loss occurs. Thus
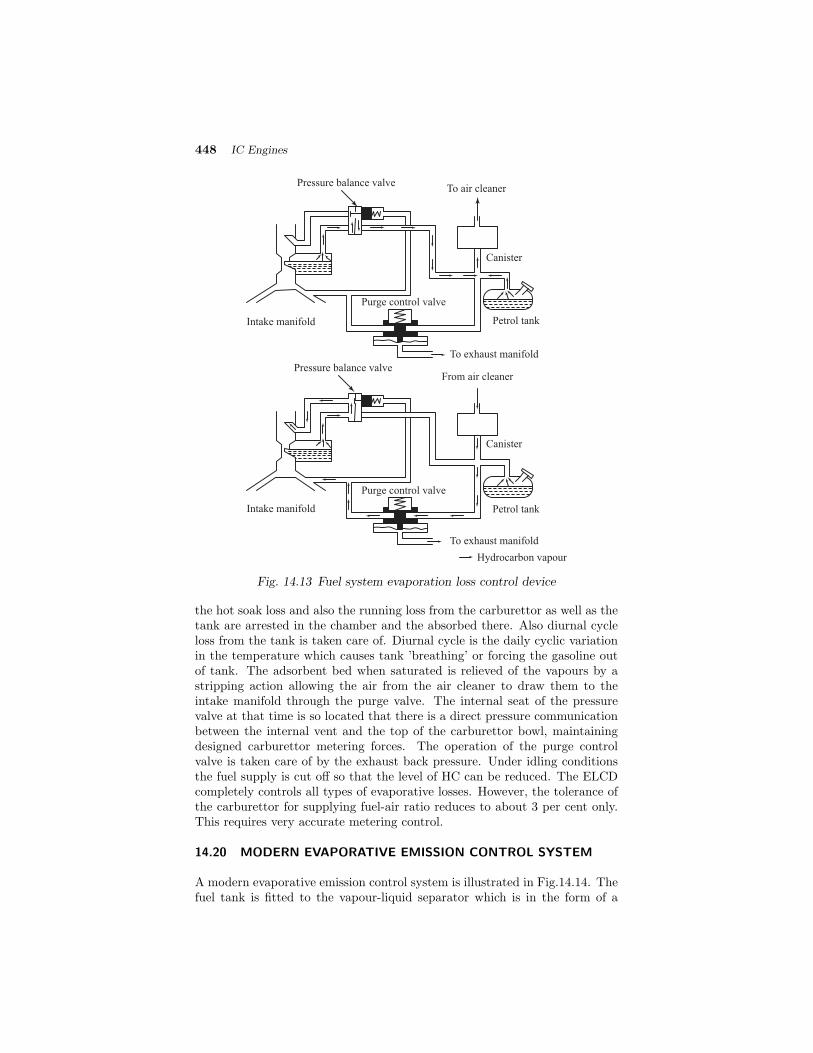
448 IC Engines
Intake manifold
Purge control valve
Canister
To air cleanerPressure balance valve
To exhaust manifold
Petrol tank
Hydrocarbon vapour
Pressure balance valveFrom air cleaner
Canister
Petrol tank
To exhaust manifold
Purge control valve
Intake manifold
Fig. 14.13 Fuel system evaporation loss control device
the hot soak loss and also the running loss from the carburettor as well as thetank are arrested in the chamber and the absorbed there. Also diurnal cycleloss from the tank is taken care of. Diurnal cycle is the daily cyclic variationin the temperature which causes tank ’breathing’ or forcing the gasoline outof tank. The adsorbent bed when saturated is relieved of the vapours by astripping action allowing the air from the air cleaner to draw them to theintake manifold through the purge valve. The internal seat of the pressurevalve at that time is so located that there is a direct pressure communicationbetween the internal vent and the top of the carburettor bowl, maintainingdesigned carburettor metering forces. The operation of the purge controlvalve is taken care of by the exhaust back pressure. Under idling conditionsthe fuel supply is cut off so that the level of HC can be reduced. The ELCDcompletely controls all types of evaporative losses. However, the tolerance ofthe carburettor for supplying fuel-air ratio reduces to about 3 per cent only.This requires very accurate metering control.
14.20 MODERN EVAPORATIVE EMISSION CONTROL SYSTEM
A modern evaporative emission control system is illustrated in Fig.14.14. Thefuel tank is fitted to the vapour-liquid separator which is in the form of a
Engine Emissions and Their Control 449
chamber on the fuel tank. Vapour from the fuel tank goes to the top of theseparator where the liquid gasoline is separated and sent back to the fueltank through the fuel return pipe. A vent valve or a vent hole is providedfor the carburettor for the flow of fuel vapours. This vent hole is connectedby a tube to the canister. Fuel vapours from the float chamber flow throughthe vent hole and the tube to the canister. The canister adsorbs the fuelvapours and stores them. Adsorption refers to the process of trapping of thegasoline vapours by the activated charcoal particles filled inside the canister.Vapour laden air from both the fuel tank and the carburettor passes throughthe canister. Hydrocarbons (HC) are left in the canister due to the processof adsorption, and air leaves from the canister into the atmosphere. When anengine is started, the inlet manifold sucks fresh air through the canister.
Fuel tank
Vapour-liquid separatorCarburetor
Vent valve
Charcoal (carbon) canister
Purge control valve
To inlet manifold of the engine
Fig. 14.14 Layout of vapour recovery system
The fresh air purges the gasoline vapours from the canister. ’Purging’is the process by which the gasoline vapours are removed from the charcoalparticles inside the canister. The air carries the hydrocarbons (HC) throughthe purge control solenoid valve to the engine induction system. The purgecontrol solenoid valve is controlled by the Electronic Control Module (ECM)of the Computer Command Control (CCC) system in modern automobiles.
14.20.1 Charcoal Canister
A charcoal canister used for trapping gasoline vapours is shown in Fig.14.15.This type of charcoal canister is used in the evaporative emission control sys-tem of a petrol engine. Fuel vapours from the float chamber of the carburetorenter into the canister though the left end passage.
Fuel vapours from the fuel tank enter through the mid passage into thecanister. The flow of these vapours is shown by the arrows pointing down-wards. When the engine is not running, the fuel vapours flow in this manner. The fuel vapours are absorbed by the charcoal particles present in the can-ister. When the engine runs, air reaches the charcoal, canister due to thesuction provided by the engine. This air carries away the hydrocarbons (HC)in the fuel vapours to the engine manifold. This purging action is shown atthe right end of the charcoal canister by the arrows pointing upwards. As

450 IC Engines
charcoal is a form of carbon, the charcoal canister is also called the carboncanister.
GridFilter
Cansister body
Filter
Vapour from carburetor chamber
Vapour from fuel tank
Filter
Canister purge
Filter
Filter
Air
Fig. 14.15 Charcoal canister
14.21 CRANKCASE BLOWBY
The blowby is the phenomenon of leakage past the piston and piston ringsfrom the cylinder to the crankcase. The blowby HC emission are about 20per cent of the total HC emission from the engine. This is increased to about35 per cent if the rings are worn.
The blowby rate is greatly affected by the top land clearance and theposition of the top ring because some of quenched gas is recycled in the com-bustion chamber and the ability of this to burn will depend on nearness tospark plug and the flame speed etc. and it will burn only when favourableconditions are there, otherwise it will go in the form of HC.
14.21.1 Blowby Control
The basic principle of all types or crankcase blowby control is recirculationof the vapours back to the intake air cleaner. There are a large numberof different systems in use. Figure 14.16 shows typical closed or positivecrankcase ventilation systems. In the PCV system the draft tube as shownin Fig.14.17 is eliminated and the blowby gases are rerouted back into theintake manifold or inlet of the carburettor. The blowby gases are consequentlyreintroduced into the combustion chamber where they are burned along withfresh incoming air and fuel. Since the blowby handling devices place thecrankcase under a slight vacuum, they quickly became known as positivecrankcase ventilation (PCV) systems.
14.21.2 Intake Manifold Return PCV System (Open Type)
Figure 14.16 (a) shows the intake manifold return PCV or open type system.It has a tube leading from crankcase or else the rocker arm cover through a
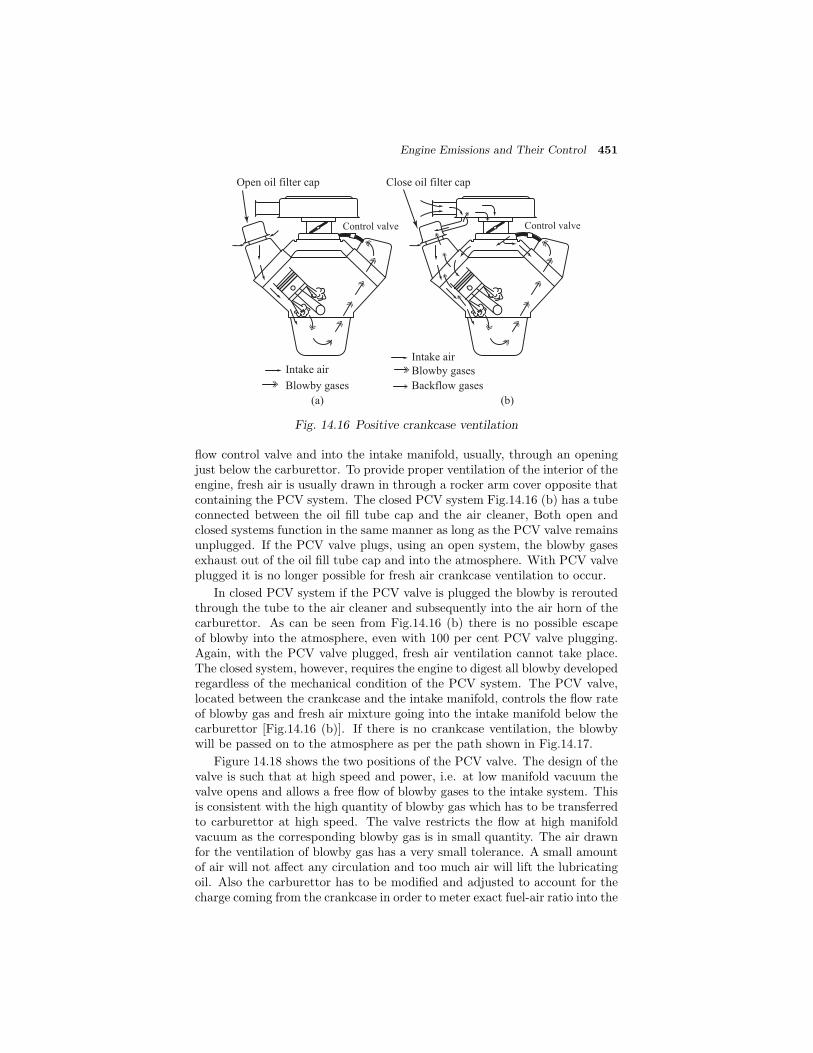
Engine Emissions and Their Control 451
Open oil filter cap
Intake air
Blowby gases
Control valve
(a) (b)
Intake air
Blowby gases
Backflow gases
Close oil filter cap
Control valve
Fig. 14.16 Positive crankcase ventilation
flow control valve and into the intake manifold, usually, through an openingjust below the carburettor. To provide proper ventilation of the interior of theengine, fresh air is usually drawn in through a rocker arm cover opposite thatcontaining the PCV system. The closed PCV system Fig.14.16 (b) has a tubeconnected between the oil fill tube cap and the air cleaner, Both open andclosed systems function in the same manner as long as the PCV valve remainsunplugged. If the PCV valve plugs, using an open system, the blowby gasesexhaust out of the oil fill tube cap and into the atmosphere. With PCV valveplugged it is no longer possible for fresh air crankcase ventilation to occur.
In closed PCV system if the PCV valve is plugged the blowby is reroutedthrough the tube to the air cleaner and subsequently into the air horn of thecarburettor. As can be seen from Fig.14.16 (b) there is no possible escapeof blowby into the atmosphere, even with 100 per cent PCV valve plugging.Again, with the PCV valve plugged, fresh air ventilation cannot take place.The closed system, however, requires the engine to digest all blowby developedregardless of the mechanical condition of the PCV system. The PCV valve,located between the crankcase and the intake manifold, controls the flow rateof blowby gas and fresh air mixture going into the intake manifold below thecarburettor [Fig.14.16 (b)]. If there is no crankcase ventilation, the blowbywill be passed on to the atmosphere as per the path shown in Fig.14.17.
Figure 14.18 shows the two positions of the PCV valve. The design of thevalve is such that at high speed and power, i.e. at low manifold vacuum thevalve opens and allows a free flow of blowby gases to the intake system. Thisis consistent with the high quantity of blowby gas which has to be transferredto carburettor at high speed. The valve restricts the flow at high manifoldvacuum as the corresponding blowby gas is in small quantity. The air drawnfor the ventilation of blowby gas has a very small tolerance. A small amountof air will not affect any circulation and too much air will lift the lubricatingoil. Also the carburettor has to be modified and adjusted to account for thecharge coming from the crankcase in order to meter exact fuel-air ratio into the
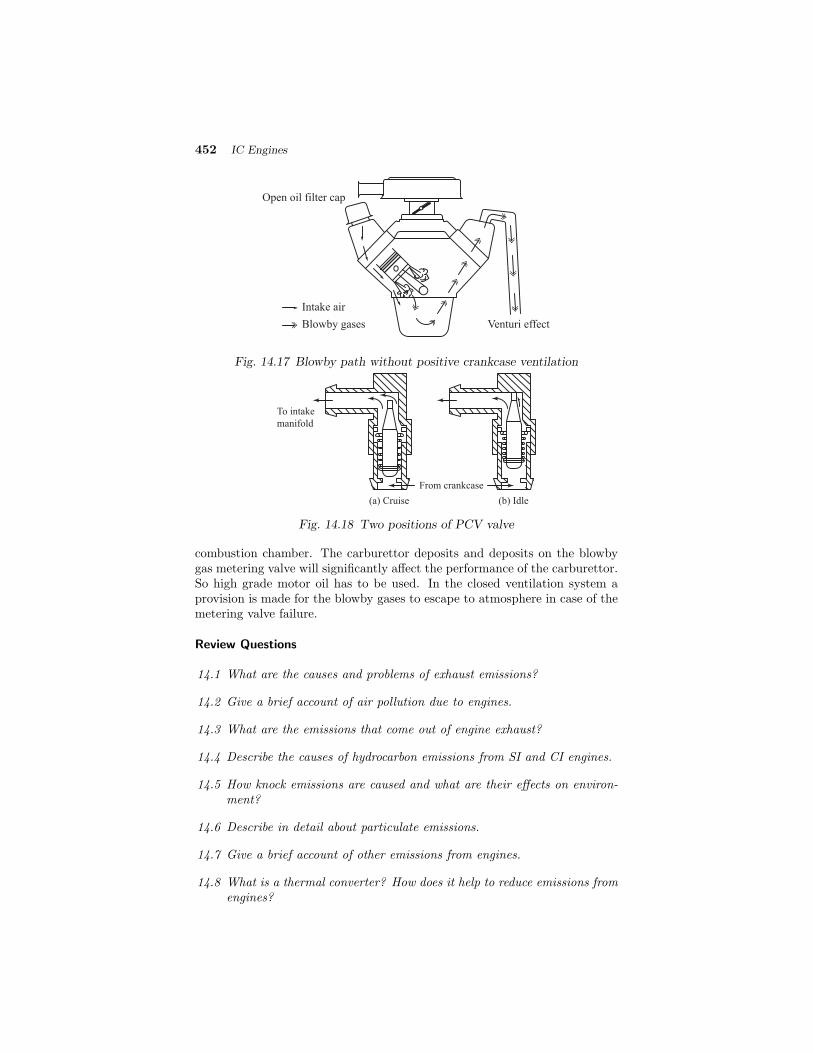
452 IC Engines
Open oil filter cap
Venturi effect
Intake air
Blowby gases
Fig. 14.17 Blowby path without positive crankcase ventilation
From crankcase
To intake
manifold
(a) Cruise (b) Idle
Fig. 14.18 Two positions of PCV valve
combustion chamber. The carburettor deposits and deposits on the blowbygas metering valve will significantly affect the performance of the carburettor.So high grade motor oil has to be used. In the closed ventilation system aprovision is made for the blowby gases to escape to atmosphere in case of themetering valve failure.
Review Questions
14.1 What are the causes and problems of exhaust emissions?
14.2 Give a brief account of air pollution due to engines.
14.3 What are the emissions that come out of engine exhaust?
14.4 Describe the causes of hydrocarbon emissions from SI and CI engines.
14.5 How knock emissions are caused and what are their effects on environ-ment?
14.6 Describe in detail about particulate emissions.
14.7 Give a brief account of other emissions from engines.
14.8 What is a thermal converter? How does it help to reduce emissions fromengines?

Engine Emissions and Their Control 453
14.9 What are catalytic converters? How do they help in reducing HC, COand NOx emissions?
14.10 How does catalytic converters help in reducing HC, CO and NOx emis-sions?
14.11 Give a brief account of emissions from CI engines.
14.12 How can emissions be reduced using chemical methods?
14.13 What is EGR? and explain how it reduces the NOx emission.
14.14 Explain with a sketch the non-exhaust emission from a vehicle.
14.15 Explain with sketches how non-exhaust emission are controlled.
14.16 Explain with a neat sketch fuel system evaporation loss control device.
14.17 Give a layout of a vapour recovery system and explain.
14.18 With a neat sketch explain a charcoal canister for controlling non-exhaust emission.
14.19 What is crankcase blowby? How it is controlled?
14.20 Explain intake manifold open type PCV system.
Multiple Choice Questions (choose the most appropriate answer)
1. Strictest emission norms are initiated in the world first in
(a) London
(b) New Delhi
(c) Tokyo
(d) California
2. One of the major exhaust emissions from CI engines compared to SIengine is
(a) oxides of nitrogen
(b) unburnt hydrocarbons
(c) particulates
(d) CO and CO2
3. Decrease in air-fuel ratio in SI engines results in
(a) increase of NOx
(b) decrease of CO and UBHC
(c) increase of CO and UBHC
(d) none of the above

454 IC Engines
4. NOx emission is maximum in SI engines when the air-fuel ratio is
(a) nearly stoichiometric
(b) lean
(c) rich
(d) none of the above
5. NOx emission in SI engines will be lowest during
(a) cruising
(b) idling
(c) accelerating
(d) decelerating
6. Photochemical smog is mainly due to
(a) NOx and HC
(b) soot and particulate matter
(c) CO and CO2
(d) excess O2
7. Alcohol is the major source for the emission of
(a) HC
(b) aldehydes
(c) oxides of nitrogen
(d) soot
8. Fumigation technique is used to control
(a) HC
(b) NOx
(c) CO
(d) smoke
9. Blue smoke in diesel engines indicate
(a) NOx
(b) HC
(c) CO
(d) unburnt oil

Engine Emissions and Their Control 455
10. What smoke in CI engines is noticed during
(a) starting and idling
(b) light loads
(c) heavy loads
(d) acceleration
11. Thermal converters cannot reduce emission of
(a) CO
(b) HC
(c) NOx
(d) soot
12. Three way catalytic converters reduce emission of
(a) CO, CO2 and soot
(b) CO, NOx and HC
(c) CO2, NOx and HC
(d) CO, HC and soot
13. Platinum and Rhodium promote the oxidation of
(a) CO, HC
(b) CO, NOx
(c) CO
(d) HC, NOx
14. Rhodium promotes the reduction of
(a) HC
(b) CO
(c) NOx
(d) CO and HC
15. Efficient operation of catalytic converters require maintenance of
(a) temperature
(b) equivalence ratio
(c) (a) and (b)
(d) pressure
456 IC Engines
16. EGR is the most effective way of reducing emission of
(a) NOx
(b) CO
(c) HC
(d) CO and HC
17. Exhaust gas recirculation has the disadvantage of
(a) decreasing thermal efficiency
(b) increasing HC emission
(c) (a) and (b)
(d) increasing aldehydes
18. Evaporative emission in SI engines account for emission of
(a) 50% CO
(b) 50% HC
(c) 100% HC
(d) 25% HC
19. Chemiluminescence technique is used to measure
(a) NOx
(b) CO
(c) CO2
(d) smoke intensity
20. Lead compounds were added in gasoline to
(a) reduce HC emissions
(b) reduce knocking
(c) reduce exhaust temperature
(d) increase power output
Ans: 1. – (d) 2. – (c) 3. – (c) 4. – (a) 5. – (b)6. – (a) 7. – (b) 8. – (d) 9. – (d) 10. – (a)
11. – (c) 12. – (b) 13. – (a) 14. – (c) 15. – (c)16. – (a) 17. – (c) 18. – (d) 19. – (a) 20. – (b)

15MEASUREMENTS
AND TESTING
15.1 INTRODUCTION
The basic task in the design and development of engines is to reduce the cost ofproduction and improve the efficiency and power output. In order to achievethe above task, the development engineer has to compare the engine developedwith other engines in terms of its output and efficiency. Towards this end hehas to test the engine and make measurements of relevant parameters thatreflect the performance of the engine. In general, he has to conduct a widevariety of engine tests. The nature and the type of the tests to be conducteddepend upon a large number of factors. It is beyond the scope of this bookto discuss all the factors. In this chapter certain basic as well as importantmeasurements and tests are considered.
(i) Friction power
(ii) Indicated power
(iii) Brake power
(iv) Fuel consumption
(v) Air flow
(vi) Speed
(vii) Exhaust and coolant temperature
(viii) Emissions
(ix) Noise
(x) Combustion phenomenon
The details of measurement of these parameters are discussed in the fol-lowing sections.
15.2 FRICTION POWER
The difference between the indicated and the brake power of an engine isknown as friction power. The internal losses in an engine are essentially oftwo kinds, viz., pumping losses and friction losses. During the inlet andexhaust stroke the gaseous pressure on the piston is greater on its forward
458 IC Engines
side (on the underside during the inlet and on the upper side during theexhaust stroke), hence during both strokes the piston must be moved againsta gaseous pressure, and this causes the so called pumping loss. The frictionloss is made up of the friction between the piston and cylinder walls, pistonrings and cylinder walls, and between the crankshaft and camshaft and theirbearings, as well as by the loss incurred by driving the essential accessories,such as the water pump, ignition unit etc.
It should be the aim of the designer to have minimum loss of power infriction. Friction power is used for the evaluation of indicated power andmechanical efficiency. Following methods are used to find the friction powerto estimate the performance of the engine.
(i) Willan’s line method
(ii) Morse test
(iii) Motoring test
(iv) From the measurement of indicated and brake power
(v) Retardation test
15.2.1 Willan’s Line Method
This method is also known as fuel rate extrapolation method. A graph con-necting fuel consumption (y-axis) and brake power (x-axis) at constant speedis drawn and it is extrapolated on the negative axis of brake power. The in-tercept of the negative axis is taken as the friction power of the engine at thatspeed. The method of extrapolation is shown in Fig.15.1 (dotted lines). Asshown in the Fig.15.1, since, in most of the power range the relation betweenthe fuel consumption and brake power is linear which permits extrapolation.Further, when the engine does not develop any power, i.e., bp = 0, it consumesa certain amount of fuel. The energy would have been spent in overcoming thefriction. Hence, the extrapolated negative intercept of the x-axis will be thework representing the combined losses due to mechanical friction, pumpingand blowby and as a whole it is termed the frictional loss of the engine. Itshould be noted that the measured frictional power by this method will holdgood only for a particular speed and is applicable mainly to CI engines.
The main drawback of this method is the long distance to be extrapolatedfrom data obtained between 5 and 40% load towards the zero line of fuelinput. The directional margin of error is rather wide because the graph isnot exactly linear. The changing slope along the curve indicates the effect ofpart load efficiency of the engine. The pronounced change in the slope of thisline near full load reflects the limiting influence of the air-fuel ratio and of thequality of combustion. Similarly, there may be slight curvature at light loads.This is perhaps due to the difficulty in injecting accurately and consistentlyvery small quantities of fuel per cycle. Therefore, it is essential that great careshould be taken in extrapolating the line and as many readings as possibleshould be taken at light loads to establish the true nature of the curve. Theaccuracy obtained in this method is reasonably good and compares favourablywith other methods if extrapolation is carefully done.

Measurements and Testing 459
-5 0 5 10 15 20 25 30
-20 0 20 40 60 80 100
Engine torque (N-m)
Brake power (kW)
0
0.2
0.4
0.6
0.8
1.0
1.2
Water temperature = 50 C
Engine speed = 1500 rpm
o
Fu
el f
low
rat
e (g
/s)
Friction torque
Fig. 15.1 Willan’s line method
15.2.2 Morse Test
The Morse test consists of obtaining indicated power of the engine withoutany elaborate equipment. The test consists of making inoperative, in turn,each cylinder of the engine and noting the reduction in brake power developed.With a gasoline engine each cylinder is rendered inoperative by shorting thespark plug of the cylinder; with a diesel engine by cutting off the supply of fuelto each cylinder. It is assumed that pumping and friction losses are the samewhen the cylinder is inoperative as well as during firing. This test is applicableonly to multi cylinder engines. Referring to the Fig.15.2, the unshaded areaof the indicator diagram is a measure of the gross power, gp developed by theengine, the dotted area being the pumping power, pp.
Net indicated power per cylinder = gp− pp
In this test the engine is first run at the required speed by adjustingthe throttle in SI engine or the pump rack in CI engine and the output ismeasured. The throttle rack is locked in this position. Then, one cylinder iscut out by short circuiting the spark plug in the SI engine or by disconnectingthe injector in the CI engine. Under this condition all the other cylinders willmotor the cut out cylinder and the speed and output drop. The engine speedis brought to its original value by reducing the load. This will ensure that thefrictional power is the same while the brake power of the engine will be withone cylinder less.

460 IC Engines
gp
pp
p
V
Fig. 15.2 p-V diagram of an Otto engine
If there are k cylinders, then
ip1 + ip2 + ip3 + ip4 + . . . + ipk =k"1
bpk + fpk (15.1)
where ip, bp and fp are respectively indicated, brake and frictional power andthe suffix k stands for the cylinder number.
If the first cylinder is cut-off, it will not produce any power but it will havefriction, then
ip2 + ip3 + ip4 + . . . + ipk =
k"2
bpk + fpk (15.2)
Subtracting Eqn.15.2 from Eqn.15.1
ip1 =k"1
bpk −k"2
bpk
Similarly we can find the indicated power of the cylinders, viz., ip2, ip3, ip4, . . . , ipk.
The total indicated power developed by the engine, ipk, is given by
ipk =k"1
ipk (15.3)
when all the k cylinders are working, it is possible to find the brake power,bpk, of the engine.
The frictional power of the engine is given by
fpk = ipk − bpk (15.4)
For a better understanding of this test refer to the worked out examples 17.24and 17.25.
Measurements and Testing 461
15.2.3 Motoring Test
In Motoring test the engine is steadily operated at the rated speed by its ownpower and allowed to remain under the given speed and load conditions forsufficient time so that the temperature of the engine components, lubricatingoil and cooling water reaches a steady state. A swinging field type electricdynamometer is used to absorb the power during this period which is mostsuitable for this test. The ignition is then cut-off and by suitable electricswitching devices the dynamometer is converted to run as a motor so as tocrank the engine at the same speed at which it was previously operating. Thepower supply from the above dynamometer is measured which is a measureof the frictional power of the engine at that speed. The water supply is alsocut-off during the motoring test so that the actual operating temperatures aremaintained to the extent possible.
This method though determines the fp at conditions very near to theactual operating temperatures at the test speed and load, it does not give thetrue losses occurring under firing conditions due to following reasons:
(i) The temperatures in the motored engine are different from those in afiring engine.
(ii) The pressure on the bearings and piston rings is lower than in the firingengine.
(iii) The clearance between piston and cylinder wall is more (due to cooling)and this reduces the piston friction.
(iv) The air is drawn at a temperature much lower than when the engine isfiring because it does not get heat from the cylinder (rather losses heatto the cylinder).
Motoring method, however, gives reasonably good results and is very suit-able for finding the losses imparted by various engine components. This insighton the losses caused by various components and other parameters is obtainedby progressive stripping off of the engine. First the full engine is motored,then the test is conducted under progressive dismantling conditions keepingwater and oil circulation intact. Then the cylinder head can be removed toevaluate by difference, the compression loss. In this manner, piston rings,pistons, etc. can be removed and evaluated for their effect on overall friction.
15.2.4 From the Measurement of Indicated and Brake Power
This is an ideal method by which fp is obtained by computing the differencebetween indicated power obtained from an indicator diagram and brake powerobtained by a dynamometer. This method is mostly used only in researchlaboratories as it is necessary to have elaborate equipment to obtain accurateindicator diagrams at high speeds.
15.2.5 Retardation Test
This test involves the method of retarding the engine by cutting the fuelsupply. The engine is made to run at no load and rated speed taking into

462 IC Engines
all usual precautions. When the engine is running under steady operatingconditions the supply of fuel is cut-off and simultaneously the time of fall inspeeds by say 20%, 40%, 60%, 80% of the rated speed is recorded. The testsare repeated once again with 50% load on the engine. The values are usuallytabulated in an appropriate table. A graph connecting time for fall in speed(x-axis) and speed (y-axis) at no load as well as 50% load conditions is drawnas shown in Fig.15.3.
100 rpm
Spee
d
50%
load
No load
Time
t2
t3
Fig. 15.3 Graph for retardation test
From the graph the time required to fall through the same range (say 100rpm) in both, no load and load conditions are found. Let t2 and t3 be thetime of fall at no load and load conditions respectively. The frictional torqueand hence frictional power are calculated as shown below. Moment of inertiaof the rotating parts is constant throughout the test.
Torque = Moment of Inertia×Angular Acceleration
Let ω be the angular velocity and dωdt be the angular acceleration.
T = Idω
dt(15.5)
I = MK2 (15.6)
therefore,
T = MK2 dω
dt(15.7)
dω =T
MK2dt (15.8)
Now integrating between the limits ω1 and ω2 for time t1 and t2, ω2
ω1
dω =T
MK2
t2
t1
dt (15.9)
Measurements and Testing 463
therefore,
(ω2 − ω1) =T
MK2(t2 − t1) (15.10)
Let Tf be the friction torque and Tl the load torque. At no load the torqueis only friction torque, Tf , and at load the torque is Tl +Tf . Hence at no load
ω0 − ω1 =Tf
MK2(t2 − 0) (15.11)
The reference angular velocity, ω0 is that at, say 1000 rpm, the time offall for the same range at load
ω0 − ω1 =Tf + Tl
MK2(t3 − 0) (15.12)
(Tf + Tl)t3 = Tf t2
t2t3
=Tl + Tf
Tf= 1 +
Tl
Tf(15.13)
Tl
Tf=
t2t3− 1 =
t2 − t3t3
(15.14)
Tf = Tl
t3
t2 − t3
(15.15)
Tl is the load torque which can be measured from the loading, t2 and t3are observed values. From the above Tf can be calculated and thereby thefrictional power. For a better understanding of this test refer the worked outexample 16.26.
15.2.6 Comparison of Various Methods
The Willan’s line method and Morse tests are comparatively easy to conduct.However, both these tests give only an overall idea of the losses whereasmotoring test gives a very good insight into the various causes of losses andis a much more powerful tool. As far as accuracy is concerned, the ip − bpmethod is the most accurate if carefully done. Motoring method usually givesa higher value for fp as compared to that given by the Willan’s line method.Retardation method, though simple, requires accurate determination of theload torque and the time for the fall in speed for the same range.
15.3 INDICATED POWER
Indicated power of an engine tells about the health of the engine and alsogives an indication regarding the conversion of chemical energy in the fuelinto heat energy. Indicated power is an important variable because it is thepotential output of the cycle. Therefore, to justify the measurement of in-dicated power, it must be more accurate than motoring and other indirectmethods of measuring frictional power. For obtaining indicated power thecycle pressure must be determined as a function of cylinder volume. It may
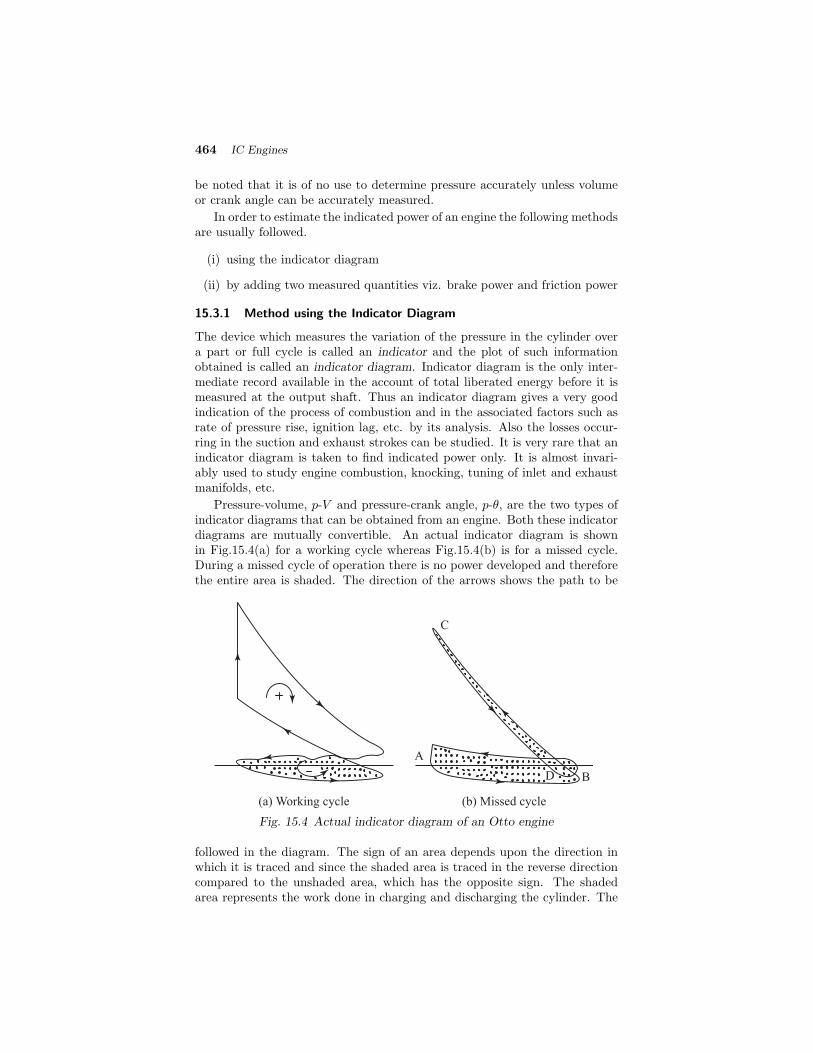
464 IC Engines
be noted that it is of no use to determine pressure accurately unless volumeor crank angle can be accurately measured.
In order to estimate the indicated power of an engine the following methodsare usually followed.
(i) using the indicator diagram
(ii) by adding two measured quantities viz. brake power and friction power
15.3.1 Method using the Indicator Diagram
The device which measures the variation of the pressure in the cylinder overa part or full cycle is called an indicator and the plot of such informationobtained is called an indicator diagram. Indicator diagram is the only inter-mediate record available in the account of total liberated energy before it ismeasured at the output shaft. Thus an indicator diagram gives a very goodindication of the process of combustion and in the associated factors such asrate of pressure rise, ignition lag, etc. by its analysis. Also the losses occur-ring in the suction and exhaust strokes can be studied. It is very rare that anindicator diagram is taken to find indicated power only. It is almost invari-ably used to study engine combustion, knocking, tuning of inlet and exhaustmanifolds, etc.
Pressure-volume, p-V and pressure-crank angle, p-θ, are the two types ofindicator diagrams that can be obtained from an engine. Both these indicatordiagrams are mutually convertible. An actual indicator diagram is shownin Fig.15.4(a) for a working cycle whereas Fig.15.4(b) is for a missed cycle.During a missed cycle of operation there is no power developed and thereforethe entire area is shaded. The direction of the arrows shows the path to be
(a) Working cycle (b) Missed cycle
D B
A
C
Fig. 15.4 Actual indicator diagram of an Otto engine
followed in the diagram. The sign of an area depends upon the direction inwhich it is traced and since the shaded area is traced in the reverse directioncompared to the unshaded area, which has the opposite sign. The shadedarea represents the work done in charging and discharging the cylinder. The

Measurements and Testing 465
elasticity of the column of exhaust gas results in a wavy line on the exhauststroke. The unshaded area represents the gross power, gp, developed andthe shaded one represents the pumping power, pp. Therefore, the indicatedpower, ip = (gp−pp). In practice pp is generally ignored since it is very small.Thus the area of the indicator diagram if accurately measured will representthe indicated power of the engine.
15.3.2 Engine Indicators
Basically an engine indicating device consists of
(i) a pressure sensing device
(ii) a device for sensing the piston displacement or the angular position ofthe crankpin over the complete cycle and
(iii) a display device which can depict both pressure and piston displacementon paper or screen.
Some indicators also need additional equipment such as preamplifier toamplify the pressure signal before it can be displayed.
The main types of engine indicators are
(i) Piston indicator
(ii) Balanced diaphragm type indicator
(iii) Electronic indicator
In addition to this, optical indicators are also used. Thus, a large numberof indicators are in use. Of the above types, only electronic indicators are incommon use at present.
15.3.3 Electronic Indicators
In order to investigate the individual cycles or a part of the cycle, electronicindicators have been developed which consist of four main parts.
(i) a pressure pick-up
(ii) a preamplifying device
(iii) a time-base recording device
(iv) a display unit
The pressure pick-up shown in Fig.15.5 is usually called a pressure trans-ducer. It generates an electric signal in proportion to the pressure to whichit is subjected. The transducer is usually fitted in the cylinder head just likea spark plug without projecting into the combustion space. The pressureis picked-up with respect to displacement of a diaphragm. This diaphragmis made very stiff in order to reduce the displacement and hence the iner-tia effects are reduced to minimum. The displacement of the diaphragm istransmitted to the transducer element which may be any one of the following.

466 IC Engines
(i) piezo electric crystal
(ii) electromagnetic type
(iii) capacitance type
(iv) strain gauge-type element
Quartz crystals High leadDiaphragm
Electrodes
Fig. 15.5 Pressure transducer
The detailed description of these transducer elements and their character-istics is beyond the scope of this book and is not discussed. The transducerelement produces an electrical signal which is usually too small to be displayedon any device. Therefore, a preamplifying device is used to augment the signalso that it can be displayed on the oscilloscope or recorded in a recorder.
The pick-up used for measuring the cylinder pressure must have a linearoutput and a good frequency response. Its temperature behaviour shouldalso be satisfactory, i.e., the effect of heat should not affect its performance.Also it must have low acceleration sensitivity. Of all the pressure transducerscurrently available the piezo electric quartz transducers are most satisfactoryfor all normal uses in internal combustion engine measurements as far asthe sensitivity is concerned. The quartz transducer, which has a naturalfrequency greater than 50 kHz, has a sensitivity of about one-tenth of theother types of pressure transducers in which inductive, capacitive or strain-gauge principles are applied. The temperature effect is about 0.005 per centper degree centigrade change in temperature of the crystal.
The use of electrical pressure pickups avoids almost all the difficulties of amechanical indicator and gives inertia free operation. However, the greatestproblem when using these transducers is the difficulty in calibrating them. Anotable exception is strain gauge type transducer which can be satisfactorilycalibrated.
Usually the device used to display the p-θ diagram is the storage typecathode ray oscilloscope, CRO. The CRO provides almost inertia free record-ing and displaying of the pressure signal. The principle of CRO is that acathode ray can be deflected by the variation of an electric current. It canbe of electromagnetic or electrostatic type. Usually the pressure signal fromthe pressure transducer and the time signal from the time-base pick-up areapplied to the two beams of dual beam oscilloscope. This produces a p-θ orp-t diagram on the screen of the oscilloscope which can be observed or pho-tographed. A typical time base unit consists of a permanent magnet with coil

Measurements and Testing 467
and a V -shaped pole piece and a rotating disc having slots in which a mag-netic material is fixed. When the disc rotates and a slot passes the permanentmagnet it generates a voltage according to its depth and produces a peak onthe oscilloscope screen. Usually slots are 1◦ apart with deeper slots at 10◦
intervals and still deeper at 90◦ interval so that a complete degree timing di-agram is produced. The disc is so adjusted on the engine shaft that when thedeepest slot is against the magnet poles it shows the top dead centre. Thistype of time base device does not work below about 150 rpm because of weakimpulse signal. Hence an oscilloscope triggering circuit is used. A typical p-θdiagram obtained from the electronic indicator is shown in Fig.15.6(a) for 0to 360◦ and Fig.15.6(b) for 360 to 720◦.
CR
RPM
FIS
Rated load
= 16
= 1500
= 27 bTDCo
Cy
lin
der
pre
ssu
re (
bar
)
0
20
40
60
80
BDC
100 200 300 360 400
TDC
0
300 400 500 600 700
BDC
BDC TDC BDC
Cy
lin
der
pre
ssu
re (
bar
)
0
1
2
3
4
CR
RPM
FIS
Rated load
= 16
= 1500
= 27 bTDCo
Crank angle (deg)
Crank angle (deg)
(a)
(b)
Fig. 15.6 A typical p-θ diagram
15.4 BRAKE POWER
Measurement of brake power is one of the most important measurements inthe test schedule of an engine. It involves the determination of the torque

468 IC Engines
and the angular speed of the engine output shaft. The torque measuringdevice is called a dynamometer. Figure 15.7 shows the basic principle ofa dynamometer. A rotor driven by the engine under test, is mechanically,hydraulically or electromagnetically coupled to a stator. For every revolution
R
L
SScaleR
otor
Sta
tor
Counter
balance weight
Coupling force
Fig. 15.7 Principle of a dynamometer
of the shaft, the rotor periphery moves through a distance 2πR against thecoupling force, F . Hence the work done per revolution is
W = 2πRF (15.16)
The external moment or torque is equal to S × L, where S is the scalereading and L is the arm length. This moment balances the turning momentR× F , i.e.,
S × L = R× F (15.17)
ThereforeWork done/revolution = 2πSL
Work done/minute = 2πSLN
Hence brake power is given by
bp = 2πNT Watts (15.18)
where T is the torque and N is rpm.
Dynamometers can be broadly classified into two main types:
(i) Absorption Dynamometers: These dynamometers measure and absorbthe power output of the engine to which they are coupled. The powerabsorbed is usually dissipated as heat by some means. Examples of such
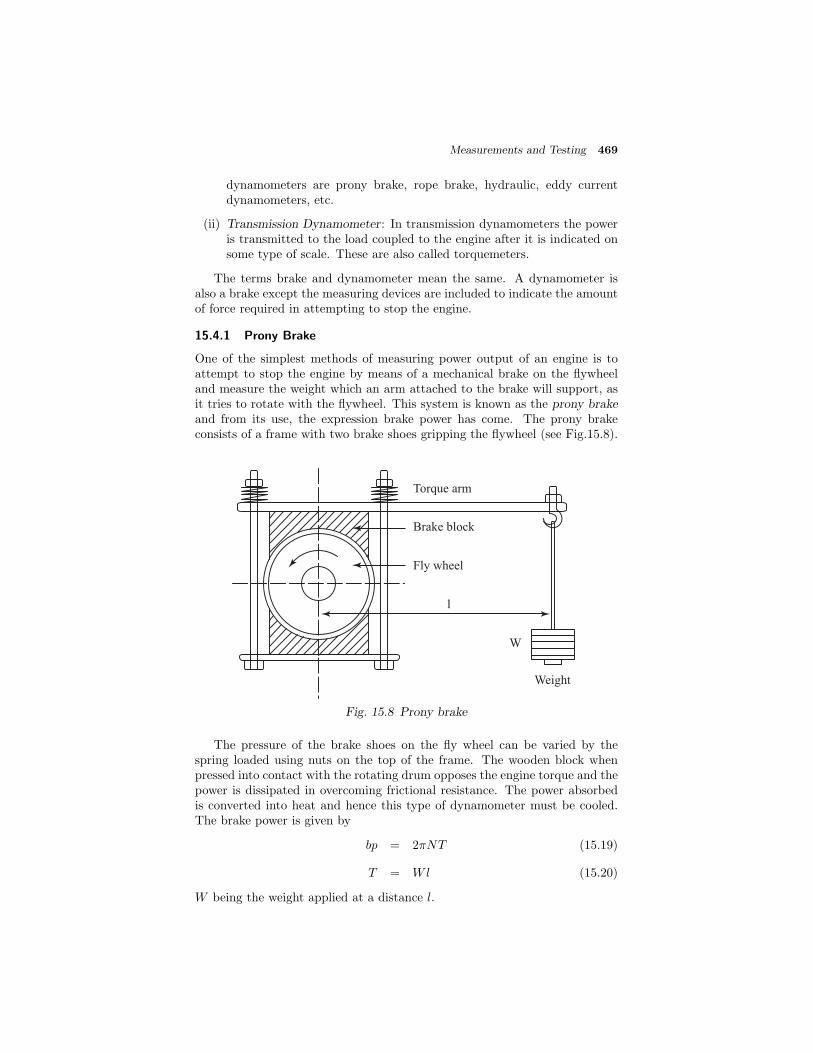
Measurements and Testing 469
dynamometers are prony brake, rope brake, hydraulic, eddy currentdynamometers, etc.
(ii) Transmission Dynamometer: In transmission dynamometers the poweris transmitted to the load coupled to the engine after it is indicated onsome type of scale. These are also called torquemeters.
The terms brake and dynamometer mean the same. A dynamometer isalso a brake except the measuring devices are included to indicate the amountof force required in attempting to stop the engine.
15.4.1 Prony Brake
One of the simplest methods of measuring power output of an engine is toattempt to stop the engine by means of a mechanical brake on the flywheeland measure the weight which an arm attached to the brake will support, asit tries to rotate with the flywheel. This system is known as the prony brakeand from its use, the expression brake power has come. The prony brakeconsists of a frame with two brake shoes gripping the flywheel (see Fig.15.8).
Weight
W
l
Brake block
Torque arm
Fly wheel
Fig. 15.8 Prony brake
The pressure of the brake shoes on the fly wheel can be varied by thespring loaded using nuts on the top of the frame. The wooden block whenpressed into contact with the rotating drum opposes the engine torque and thepower is dissipated in overcoming frictional resistance. The power absorbedis converted into heat and hence this type of dynamometer must be cooled.The brake power is given by
bp = 2πNT (15.19)
T = Wl (15.20)
W being the weight applied at a distance l.
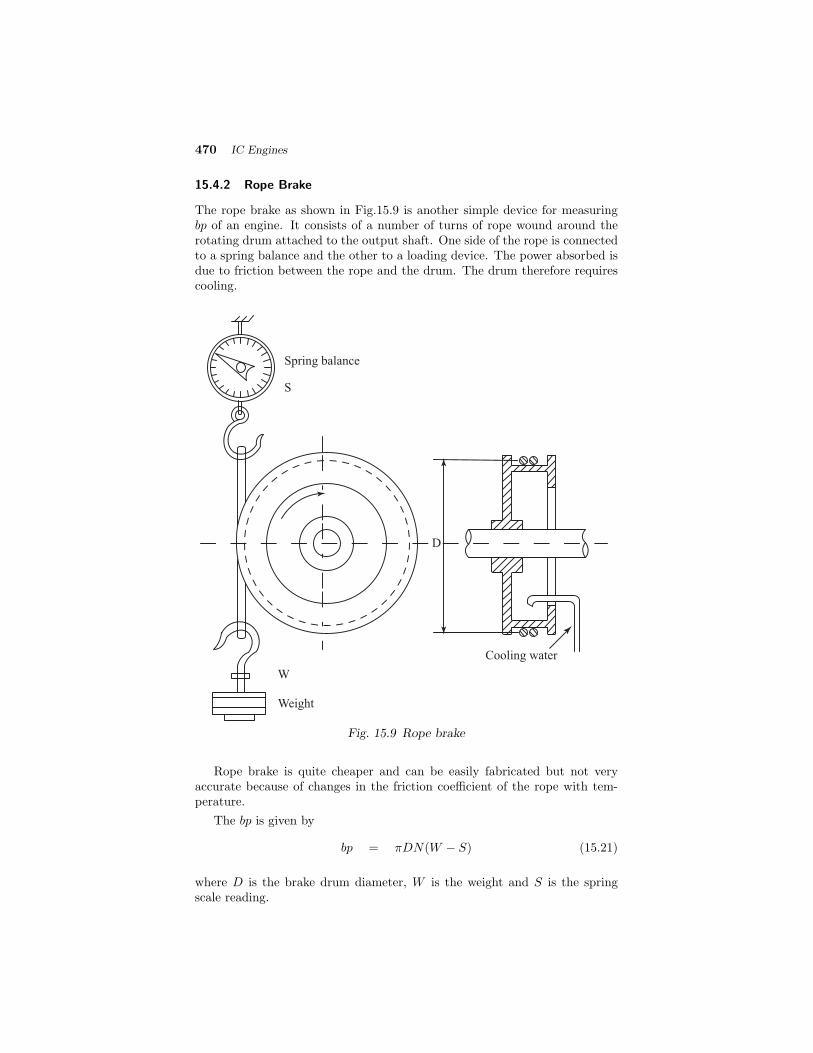
470 IC Engines
15.4.2 Rope Brake
The rope brake as shown in Fig.15.9 is another simple device for measuringbp of an engine. It consists of a number of turns of rope wound around therotating drum attached to the output shaft. One side of the rope is connectedto a spring balance and the other to a loading device. The power absorbed isdue to friction between the rope and the drum. The drum therefore requirescooling.
Spring balance
Cooling water
Weight
W
S
D
Fig. 15.9 Rope brake
Rope brake is quite cheaper and can be easily fabricated but not veryaccurate because of changes in the friction coefficient of the rope with tem-perature.
The bp is given by
bp = πDN(W − S) (15.21)
where D is the brake drum diameter, W is the weight and S is the springscale reading.

Measurements and Testing 471
15.4.3 Hydraulic Dynamometer
The hydraulic dynamometer (Fig.15.10) works on the principle of dissipatingthe power in fluid friction rather than in dry friction. In principle its con-struction is similar to that of a fluid flywheel. It consists of an inner rotatingmember or impeller coupled to the output shaft of the engine. This impeller
Casing
Sluice gates for
load control
Shaft bearing
StatorRotor
Shaft
Casing trunnion bearing
Water inlet holes in vanes
Water outlet
Water inlet
Fig. 15.10 Hydraulic dynamometer
rotates in a casing filled with some hydraulic fluid. The outer casing, dueto the centrifugal force developed, tends to revolve with the impeller, but isresisted by a torque arm supporting the balance weight. The frictional forcesbetween the impeller and the fluid are measured by the spring-balance fittedon the casing. The heat developed due to dissipation of power is carried awayby a continuous supply of the working fluid, usually water. The output canbe controlled by regulating the sluice gates which can be moved in and outto partially or wholly obstruct the flow of water between impeller and thecasing.
15.4.4 Eddy Current Dynamometer
The details of eddy current dynamometer are shown in Fig.15.11. It consists ofa stator on which are fitted a number of electromagnets and a rotor disc made

472 IC Engines
of copper or steel and coupled to the output shaft of the engine. When therotor rotates eddy currents are produced in the stator due to magnetic flux setup by the passage of field current in the electromagnets. These eddy currentsoppose the rotor motion, thus loading the engine. These eddy currents aredissipated in producing heat so that this type of dynamometer also requiressome cooling arrangement. The torque is measured exactly as in other typesof absorption dynamometers i.e., with the help of a moment arm. The loadis controlled by regulating the current in the electromagnets.
Casing
trunnion
bearing
Shaft bearing
Torque weighing dial
Water inlet
Shaft
Water
outlet
Coil
Stator
Rotor
Fig. 15.11 Eddy current dynamometer
The main advantages of eddy current dynamometers are:
(i) Capable of measuring high power per unit weight of the dynamometer.
(ii) They offer the highest ratio of constant brake power to speed range (upto 5:1).
(iii) Level of field excitation is below 1 per cent of total power being handledby dynamometer, thus easy to control and operate.
(iv) Development of eddy current is smooth hence the torque is also smoothand continuous under almost all conditions.
(v) Relatively higher torque under low speed conditions.
(vi) Has no intricate rotating parts except shaft bearing.
(vii) No natural limit to size, either small or large.

Measurements and Testing 473
15.4.5 Swinging Field DC Dynamometer
Basically a swinging field DC dynamometer is a DC shunt motor so supportedin trunnion bearings to measure the reaction torque that the outer case andfield coils tend to rotate due to the magnetic drag. Hence the name swingingfield. The torque is measured with an arm and weighing equipment in theusual manner.
These dynamometers are provided with suitable electric connections to runas motor also. Then the dynamometer is reversible, i.e., works as a motoringas well as power absorbing device. When used as an absorption dynamometerit works as a DC generator and converts mechanical energy into electric energywhich is dissipated in an external resistor or fed back to the mains. Whenused as a motoring device an external source of DC voltage is needed to drivethe motor. The load is controlled by changing the field current.
15.4.6 Fan Dynamometer
A fan dynamometer is shown in Fig.15.12. This dynamometer is also anabsorption type of dynamometer in that when driven by the engine it absorbsthe engine power. Such dynamometers are useful mainly for rough testingand running in. The accuracy of the fan dynamometer is very poor. It is alsoquite difficult to adjust the load. The power absorbed is determined by usingprevious calibration of the fan brake.
Fig. 15.12 Fan dynamometer

474 IC Engines
15.4.7 Transmission Dynamometer
Transmission dynamometers, also called torquemeters, mostly consist of a setof strain gauges fixed on the rotating shaft and the torque is measured bythe angular deformation of the shaft which is indicated as strain of the straingauge. Usually a four-arm bridge is used to reduce the effect of temperatureto minimum and the gauges are arranged in pairs such that the effect of axialor transverse load on the strain gauges is avoided.
Figure 15.13 shows a transmission dynamometer which employs beamsand strain-gauges for a sensing torque.
Strain gauges
Beam
Strain gauges
Beam
Input shaft
Output shaft
Fig. 15.13 Transmission dynamometer
Transmission dynamometers are very accurate and are used where contin-uous transmission of load is necessary. These are used mainly in automaticunits.
15.4.8 Chassis Dynamometer
In order to test the complete vehicle a chassis dynamometer is used. Use ofchassis dynamometer allows the test engineer to simulate road load condi-tions in a laboratory and it can be termed as all weather road for the testvehicle. The road load on the vehicle can be put on the engine on a chassisdynamometer and quick results can be obtained. However, this dynamometeris quite expensive to install.
15.5 FUEL CONSUMPTION
There is two ways of expressing fuel consumption viz. by volume or by weightduring a specified time. For automobiles it is expressed in terms of kilometersper litre.
Accurate measurement of fuel consumption is very important in enginetesting work. Though this seems to be a simple matter, it is by no means soas apparent from the occurrence of the following phenomena:

Measurements and Testing 475
(i) Due to engine heat, vapour bubbles are formed in the fuel line. Whenthe bubble grows the fuel volume increases and back flow of fuel takeplace. Some fuel flowmeters measure this backflow as if it was forwardflow. Some meters do not count backward flow but when the bubblecollapses a forward flow takes place which is counted.
(ii) If bubbles are formed before or inside the flowmeter the measured flowcan be much higher than actual.
(iii) If there is any swirl in the fuel flow especially in the case of turbine typeflowmeter it may register a higher flow rate.
(iv) The density of the fuel is dependent on temperature which can vary overa wide range (-10 ◦C to 70 ◦C) giving rise to an error in measurement.
(v) Some flowmeters which use a light beam, the measurement may be af-fected by the colour of the fuel.
(vi) The needle valve in the float bowl of the carburettor opens and closesperiodically allowing fuel to surge into the float bowl. This may causewater hammer type effect making the turbine type flowmeter to continueto rotate even when fuel flow has stopped, thereby producing errors inflow measurements.
As already mentioned two basic type of fuel measurement methods are
(i) Volumetric type
(ii) Gravimetric type
15.5.1 Volumetric Type Flowmeter
The simplest method of measuring volumetric fuel consumption is using glassbulbs of known volume and having a mark on each side of the bulb. Timetaken by the engine to consume this volume is measured by a stop watch.Volume divided by time will give the volumetric flow rate.
Burette Method: It consists of two spherical glass bulbs having 100 cc and200 cc capacity respectively (Fig.15.14). They are connected by three waycocks so that one may feed the engine while the other is being filled. Theglass bulbs are of different capacities so as to make the duration of the testsapproximately constant irrespective of the engine load whilst the sphericalform combines strength with a small variation of fuel head which is mostimportant particularly in case of carburettor engines.
In order to avoid the error in sighting the fuel level against the mark onthe burette photocells are used. Figure 15.14 shows such an arrangement inwhich the measurement is made automatic.
Automatic Burette Flowmeter: Figure 15.15 shows an automatic volu-metric type fuel flow measuring system which is commercially available. Itconsists of a measuring volume (A) which has a photocell (B) and a lightsource (C) fitted in tubular housings. These housings are put opposite toeach other at an angle such that a point of light is formed on the axis of the
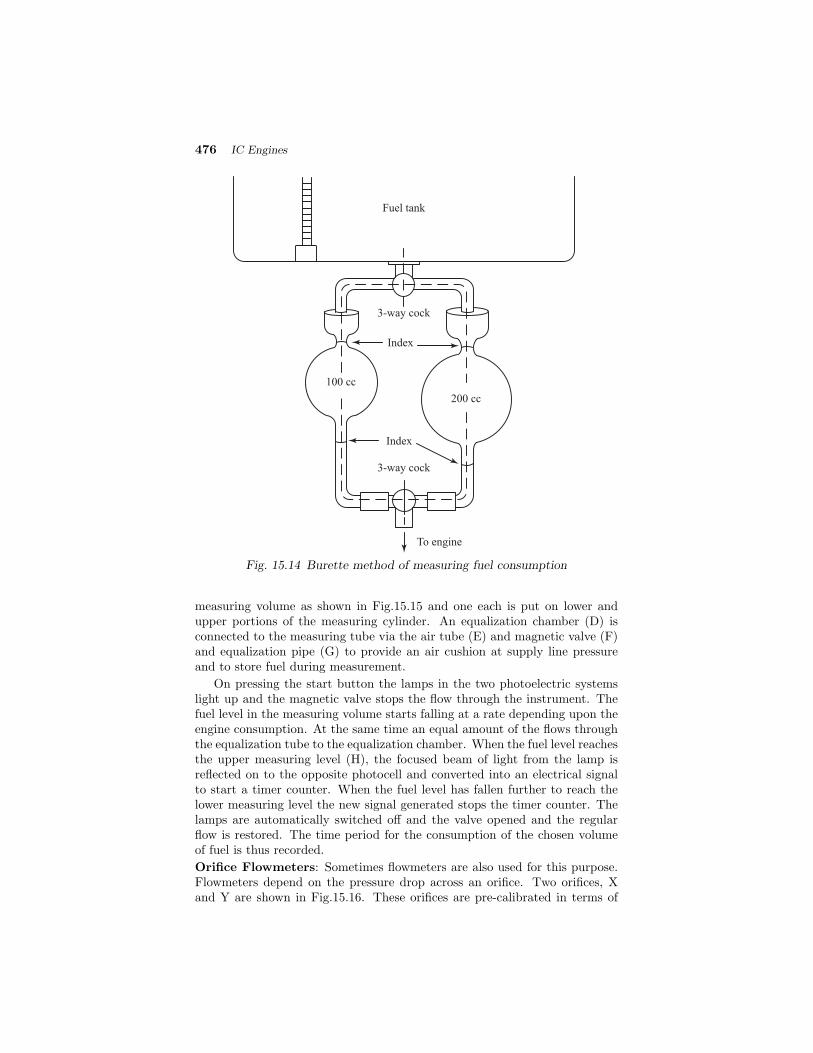
476 IC Engines
Fuel tank
3-way cock
3-way cock
To engine
200 cc
100 cc
Index
Index
Fig. 15.14 Burette method of measuring fuel consumption
measuring volume as shown in Fig.15.15 and one each is put on lower andupper portions of the measuring cylinder. An equalization chamber (D) isconnected to the measuring tube via the air tube (E) and magnetic valve (F)and equalization pipe (G) to provide an air cushion at supply line pressureand to store fuel during measurement.
On pressing the start button the lamps in the two photoelectric systemslight up and the magnetic valve stops the flow through the instrument. Thefuel level in the measuring volume starts falling at a rate depending upon theengine consumption. At the same time an equal amount of the flows throughthe equalization tube to the equalization chamber. When the fuel level reachesthe upper measuring level (H), the focused beam of light from the lamp isreflected on to the opposite photocell and converted into an electrical signalto start a timer counter. When the fuel level has fallen further to reach thelower measuring level the new signal generated stops the timer counter. Thelamps are automatically switched off and the valve opened and the regularflow is restored. The time period for the consumption of the chosen volumeof fuel is thus recorded.
Orifice Flowmeters: Sometimes flowmeters are also used for this purpose.Flowmeters depend on the pressure drop across an orifice. Two orifices, Xand Y are shown in Fig.15.16. These orifices are pre-calibrated in terms of
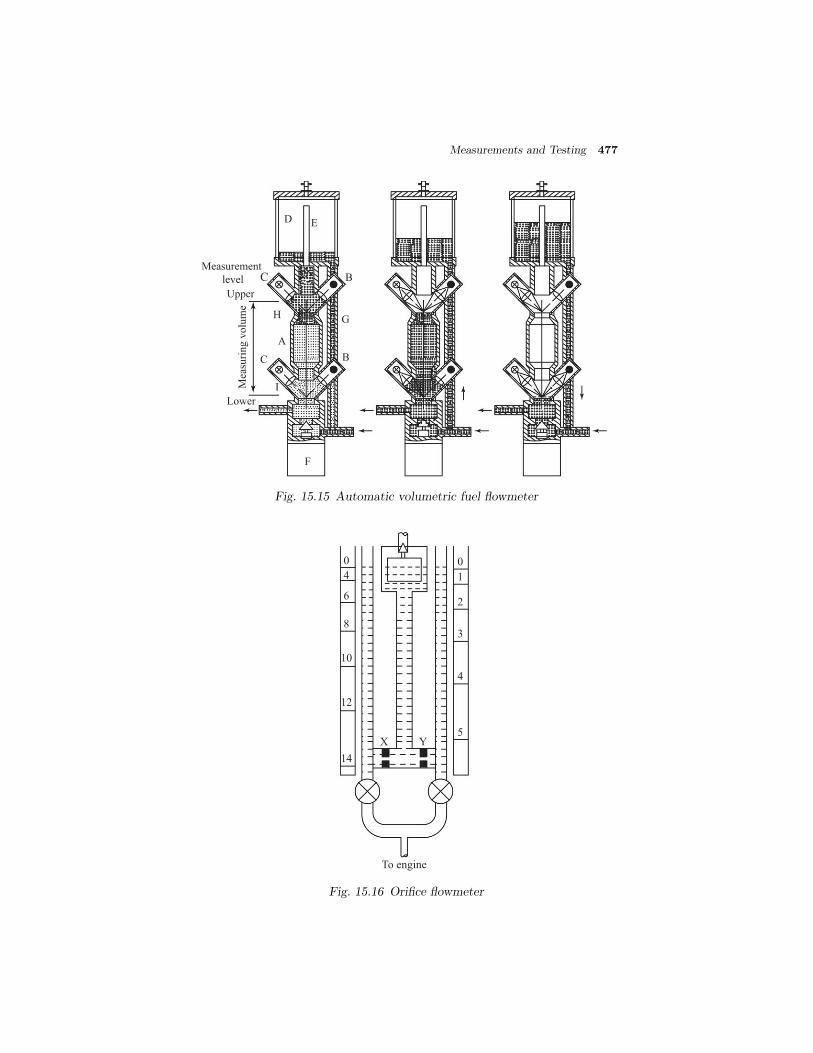
Measurements and Testing 477
D E
A
BC
F
GH
BC
Upper
Lower
Mea
suri
ng v
olu
me
I
Measurement
level
Fig. 15.15 Automatic volumetric fuel flowmeter
14
12
10
8
6
4
0 0
1
2
3
4
5X Y
To engine
Fig. 15.16 Orifice flowmeter
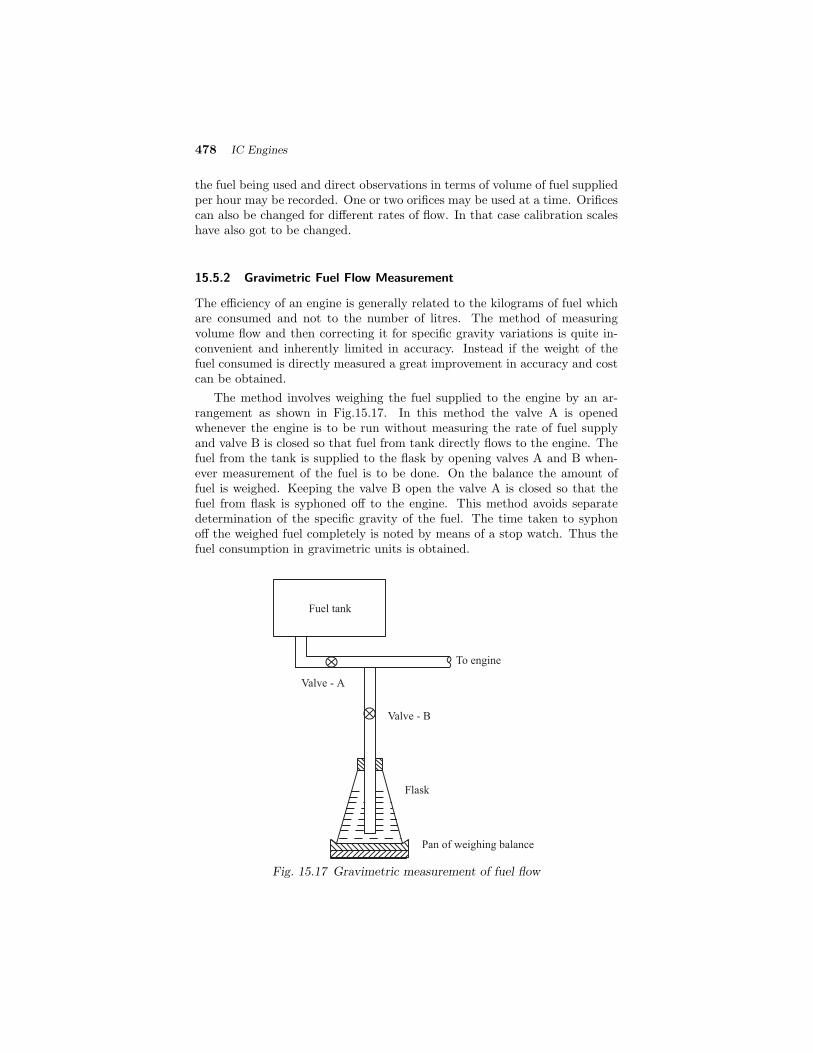
478 IC Engines
the fuel being used and direct observations in terms of volume of fuel suppliedper hour may be recorded. One or two orifices may be used at a time. Orificescan also be changed for different rates of flow. In that case calibration scaleshave also got to be changed.
15.5.2 Gravimetric Fuel Flow Measurement
The efficiency of an engine is generally related to the kilograms of fuel whichare consumed and not to the number of litres. The method of measuringvolume flow and then correcting it for specific gravity variations is quite in-convenient and inherently limited in accuracy. Instead if the weight of thefuel consumed is directly measured a great improvement in accuracy and costcan be obtained.
The method involves weighing the fuel supplied to the engine by an ar-rangement as shown in Fig.15.17. In this method the valve A is openedwhenever the engine is to be run without measuring the rate of fuel supplyand valve B is closed so that fuel from tank directly flows to the engine. Thefuel from the tank is supplied to the flask by opening valves A and B when-ever measurement of the fuel is to be done. On the balance the amount offuel is weighed. Keeping the valve B open the valve A is closed so that thefuel from flask is syphoned off to the engine. This method avoids separatedetermination of the specific gravity of the fuel. The time taken to syphonoff the weighed fuel completely is noted by means of a stop watch. Thus thefuel consumption in gravimetric units is obtained.
Flask
Pan of weighing balance
To engine
Fuel tank
Valve - A
Valve - B
Fig. 15.17 Gravimetric measurement of fuel flow
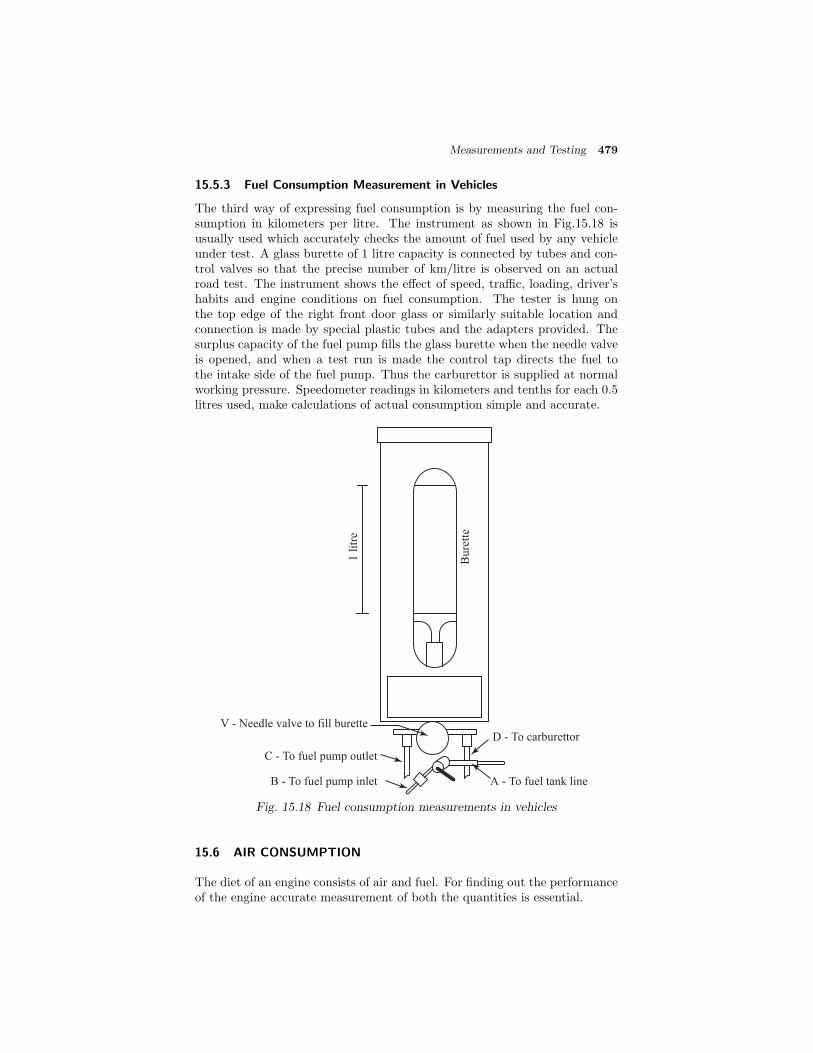
Measurements and Testing 479
15.5.3 Fuel Consumption Measurement in Vehicles
The third way of expressing fuel consumption is by measuring the fuel con-sumption in kilometers per litre. The instrument as shown in Fig.15.18 isusually used which accurately checks the amount of fuel used by any vehicleunder test. A glass burette of 1 litre capacity is connected by tubes and con-trol valves so that the precise number of km/litre is observed on an actualroad test. The instrument shows the effect of speed, traffic, loading, driver’shabits and engine conditions on fuel consumption. The tester is hung onthe top edge of the right front door glass or similarly suitable location andconnection is made by special plastic tubes and the adapters provided. Thesurplus capacity of the fuel pump fills the glass burette when the needle valveis opened, and when a test run is made the control tap directs the fuel tothe intake side of the fuel pump. Thus the carburettor is supplied at normalworking pressure. Speedometer readings in kilometers and tenths for each 0.5litres used, make calculations of actual consumption simple and accurate.
D - To carburettor
A - To fuel tank line
V - Needle valve to fill burette
C - To fuel pump outlet
B - To fuel pump inlet
1 l
itre
Bu
rett
e
Fig. 15.18 Fuel consumption measurements in vehicles
15.6 AIR CONSUMPTION
The diet of an engine consists of air and fuel. For finding out the performanceof the engine accurate measurement of both the quantities is essential.

480 IC Engines
In IC engines the satisfactory measurement of air consumption is quitedifficult because the flow is pulsating due to the cyclic nature of the engineand because the air is a compressible fluid. Therefore, the simple method ofusing an orifice in the induction pipe is not satisfactory since the reading willbe pulsating and unreliable.
All kinetic flow inferring systems such as nozzles, orifices and venturieshave a square law relationship between flow rate and differential pressurewhich gives rise to severe errors on unsteady flow. Pulsation produced errorsare roughly inversely proportional to the pressure across the orifice for a givenset of flow conditions.
15.6.1 Air Box Method
The orifice method can be used if pressure pulsations could be damped outby some means. The usual method of damping out pulsations is to fit an airbox of suitable volume (500 to 600 times the swept volume in single cylinderengines and less in the case of multi-cylinder engines) to the engine with anorifice placed in the side of the box remote from the engine (Fig.15.19).
Engine
Manometer
Air tank
Intake
Thermometer
Orifice plate
ΔH
Fig. 15.19 Measurement of air by air box method
15.6.2 Viscous-Flow Air Meter
The use (Fig.15.20) of viscous flow airmeter gives accurate reading for pulsat-ing flows. This meter uses an element where viscous resistance is the principalsource of pressure loss and kinetic effects are small. This gives a linear rela-tionship between pressure difference and flow instead of a square-law. Fromthis it follows that a true mean-flow indication is obtained under pulsatingflow conditions.
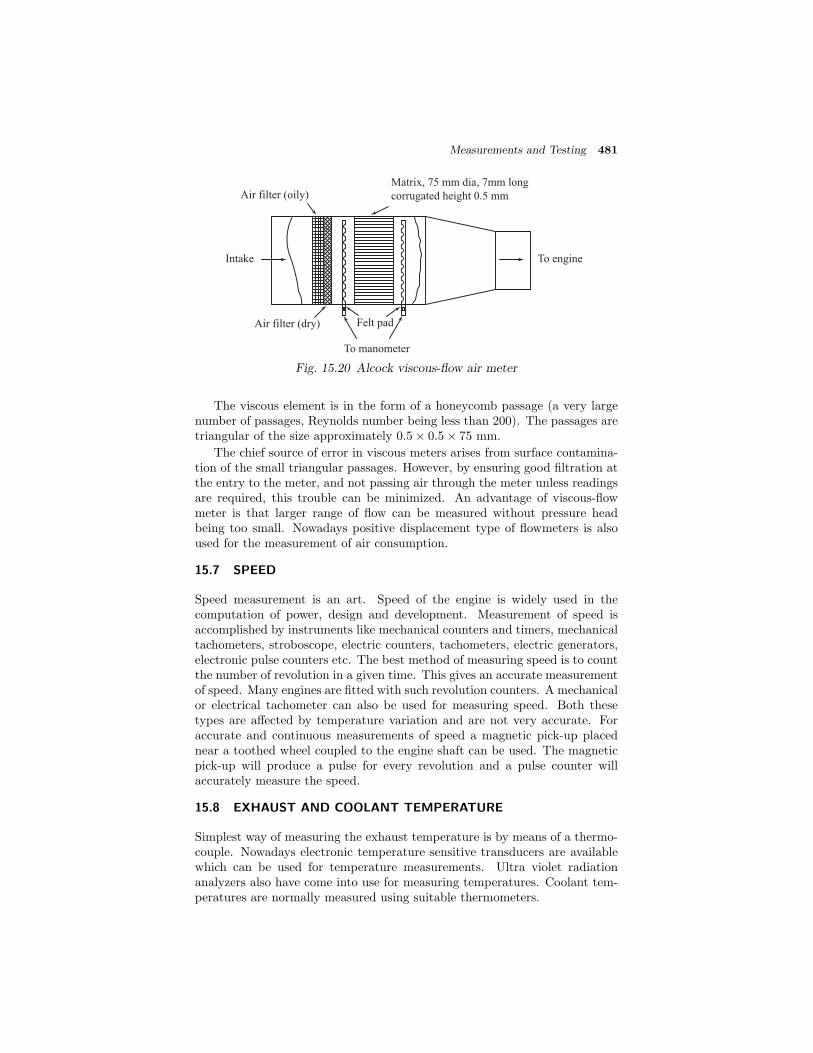
Measurements and Testing 481
Air filter (oily)Matrix, 75 mm dia, 7mm long
corrugated height 0.5 mm
Intake
Air filter (dry) Felt pad
To manometer
To engine
Fig. 15.20 Alcock viscous-flow air meter
The viscous element is in the form of a honeycomb passage (a very largenumber of passages, Reynolds number being less than 200). The passages aretriangular of the size approximately 0.5× 0.5× 75 mm.
The chief source of error in viscous meters arises from surface contamina-tion of the small triangular passages. However, by ensuring good filtration atthe entry to the meter, and not passing air through the meter unless readingsare required, this trouble can be minimized. An advantage of viscous-flowmeter is that larger range of flow can be measured without pressure headbeing too small. Nowadays positive displacement type of flowmeters is alsoused for the measurement of air consumption.
15.7 SPEED
Speed measurement is an art. Speed of the engine is widely used in thecomputation of power, design and development. Measurement of speed isaccomplished by instruments like mechanical counters and timers, mechanicaltachometers, stroboscope, electric counters, tachometers, electric generators,electronic pulse counters etc. The best method of measuring speed is to countthe number of revolution in a given time. This gives an accurate measurementof speed. Many engines are fitted with such revolution counters. A mechanicalor electrical tachometer can also be used for measuring speed. Both thesetypes are affected by temperature variation and are not very accurate. Foraccurate and continuous measurements of speed a magnetic pick-up placednear a toothed wheel coupled to the engine shaft can be used. The magneticpick-up will produce a pulse for every revolution and a pulse counter willaccurately measure the speed.
15.8 EXHAUST AND COOLANT TEMPERATURE
Simplest way of measuring the exhaust temperature is by means of a thermo-couple. Nowadays electronic temperature sensitive transducers are availablewhich can be used for temperature measurements. Ultra violet radiationanalyzers also have come into use for measuring temperatures. Coolant tem-peratures are normally measured using suitable thermometers.
482 IC Engines
15.9 EMISSION
From the point of view of pollution control, measurement of emissions fromengines is very important. Emissions may be divided into two groups, viz., in-visible emissions and visible emissions. The exhaust of an engine may containone or more of the following:
(i) carbon dioxide
(ii) water vapour
(iii) oxides of nitrogen
(iv) unburnt hydrocarbons
(v) carbon monoxide
(vi) aldehydes
(vii) smoke and
(viii) particulate
Out of the eight the first six may be grouped as invisible emissions and the lasttwo as visible emissions. Out of the various invisible emissions carbon dioxideand water vapour are considered harmless compared to others. Hence, theirmeasurements are not discussed. We will briefly describe the measurement ofother invisible emissions.
15.9.1 Oxides of Nitrogen
Oxides of nitrogen which also occur only in the engine exhaust are a combi-nation of nitric oxide (NO) and nitrogen dioxide (NO2). Nitrogen and oxygenreact at relatively high temperatures. Therefore, high temperatures and avail-ability of oxygen are the two main reasons for the formation of NOx. Whenthe proper amount of oxygen is available, the higher the peak combustiontemperature the more is the NO formed.
The NOx concentration in exhaust is affected by engine design and themode of vehicle operation. Air-fuel ratio and the spark advance are the twoimportant factors which significantly affect NOx emissions. The maximumNOx is formed at ratios between 14:1 and 16:1. At lean and rich air-fuelmixtures the NOx concentration is comparatively low. Increasing the ignitionadvance will result in lower peak combustion temperatures and higher exhausttemperatures. This will result in high NOx concentration in the exhaust.
Internationally accepted method for measuring oxides of nitrogen is bychemiluminescence analyzer. The details are shown in Fig.15.21. The prin-ciple of measurement is based on chemiluminescence reaction between ozoneand NO resulting in the formation of excited NO2. This excited NO2 emitslight whose intensity is proportional to NO concentration. The light intensityis measured by a photo multiplier tube. The analyzer measures only nitricoxide, NO, and not NO2. To analyze all the oxides of nitrogen a converter

Measurements and Testing 483
P
P
Photo
multiplier
tube
Scrubber Reaction chamber
NO /CO
Convertorx
O Generator3
Sample gas in
Air in
Span gas in
Flowmeter
Fig. 15.21 Chemiluminescence method of measuring oxides of nitrogen
is usually fitted ahead of the reaction chamber to convert all the oxides ofnitrogen into nitric oxide. Thereby, the light intensity can be taken to beproportional to the oxides of nitrogen concentration in the sample.
15.9.2 Carbon Monoxide
Carbon monoxide occurs only in engine exhaust. It is a product of incom-plete combustion due to insufficient amount of air in the air-fuel mixture orinsufficient time in the cycle for completion of combustion. Theoretically, thegasoline engine exhaust, can be made free of CO by operating it at air-fuelmixture ratios greater than 16:1. However, that some CO is always presentin the exhaust even at lean mixtures.
The percentage of CO decreases with speed. In passenger cars CO per-centage has been found to be as high as 5 per cent with rich mixtures and
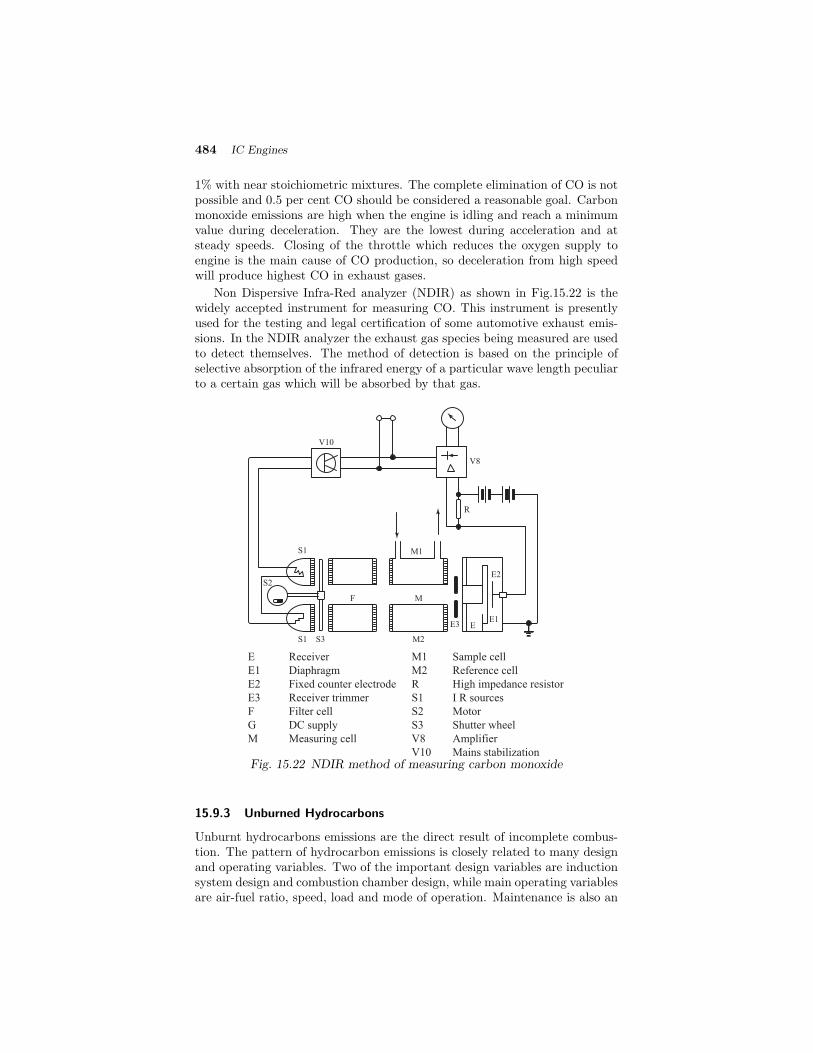
484 IC Engines
1% with near stoichiometric mixtures. The complete elimination of CO is notpossible and 0.5 per cent CO should be considered a reasonable goal. Carbonmonoxide emissions are high when the engine is idling and reach a minimumvalue during deceleration. They are the lowest during acceleration and atsteady speeds. Closing of the throttle which reduces the oxygen supply toengine is the main cause of CO production, so deceleration from high speedwill produce highest CO in exhaust gases.
Non Dispersive Infra-Red analyzer (NDIR) as shown in Fig.15.22 is thewidely accepted instrument for measuring CO. This instrument is presentlyused for the testing and legal certification of some automotive exhaust emis-sions. In the NDIR analyzer the exhaust gas species being measured are usedto detect themselves. The method of detection is based on the principle ofselective absorption of the infrared energy of a particular wave length peculiarto a certain gas which will be absorbed by that gas.
S1
S1 S3
S2
F M
M2
M1
E3E1
E
E2
R
V8
V10
E Receiver M1 Sample cell
E1 Diaphragm M2 Reference cell
E2 Fixed counter electrode R High impedance resistor
E3 Receiver trimmer S1 I R sources
F Filter cell S2 Motor
G DC supply S3 Shutter wheel
M Measuring cell V8 Amplifier
V10 Mains stabilizationFig. 15.22 NDIR method of measuring carbon monoxide
15.9.3 Unburned Hydrocarbons
Unburnt hydrocarbons emissions are the direct result of incomplete combus-tion. The pattern of hydrocarbon emissions is closely related to many designand operating variables. Two of the important design variables are inductionsystem design and combustion chamber design, while main operating variablesare air-fuel ratio, speed, load and mode of operation. Maintenance is also an

Measurements and Testing 485
important factor. Induction system design and engine maintenance affect theoperating air-fuel ratio of the engine and hence the emission of hydrocar-bons and carbon monoxide. Induction system determines fuel distributionof cylinders, fuel economy, available power etc. And the quantity of enginemaintenance determines whether the engine will operate at the designed air-fuel ratio and for how long. This will include piston ring wear, lubrication,cooling, deposits and other factors which are likely to affect the air-fuel ratiosupplied or its combustion in the combustion chamber.
The design of the combustion chamber is important. A portion of thefuel-air mixture in the combustion chamber comes into direct contact withthe chamber walls and are quenched and do not burn. Some of this quenchedfuel-air mixture is forced out of the chamber during the exhaust stroke and,because of the high local concentration of hydrocarbon in this mixture, con-tributes to the high hydrocarbon exhaust from the engine. A small displace-ment engine will have a higher surface-to-volume ratio than an engine with alarge displacement. Factors like combustion chamber shape, bore diameter,stroke and compression ratio affect the surface-to-volume ratio and hence thehydrocarbon emission. Lower compression ratio, higher stroke to bore ratio,larger displacement per cylinder and fewer cylinders, all lower the surface-to-volume ratio and hence the hydrocarbons. The effect of air-fuel ratio on theHC emission is exactly like that on carbon monoxide. At near stoichiometricfuel-air mixtures both hydrocarbon and carbon monoxide (HC/CO) emissionsare higher and lean fuel mixtures have substantially low HC/CO emission.
Flame Ionization Detector (FID) is used for measuring hydrocarbons. Thisinstrument as shown in Fig.15.23 is a well established and accepted method formeasuring HC. Ionization is a characteristic of HC compound. This principleis employed in the FID detector. Formation of electrically charged particlesof ionized carbon atoms from the hydrocarbons in a hydrogen-oxygen flameis achieved in the FID analyzer. Current flow in micro amperes (amplified formeasurements) is a measure of the concentration of hydrocarbons.
15.9.4 Aldehydes
The emission of odourous oxygenated hydrocarbons from the engines is gen-erally carcinogenic. The use of alcohol based fuels can lead to higher lev-els of oxygenated hydrocarbon emissions. These aldehydes are responsiblefor the pungent smell of the engine exhaust and a trained human person-nel specifies the odour ratings for the emission sample by comparison. Themethods of measurement for aldehydes are based on wet chemical methods(analytical methods) like iodine titration technique (ITT), chromotropic acid(CA) method, 3-methyl 2-benzo-thiazolene hydrazone (MBTH) method and2,4 Dinitrophenyl hydrazine (DNPH) method. While the first two methodsare meant to measure total aldehydes, the DNPH method is for individualaldehydes and the CA method is only for the formaldehyde.
All the above described wet chemical methods excepting the improvedDNPH method, even though time consuming and cumbersome, are econom-ical. Various other methods available are Fourier Transform-Infrared Spec-troscopy (FT-IR), Derivative Spectrophotometry and Portable Polarigraph.

486 IC Engines
Ion plasmaCurrent amplifier
Output
Air distributor
Burner jet
Collector plates
Air Fuel and sample
Filter
RegulatorRestrictor
gauge
Air
Filter
Regulator Gauge
Fuel
Solenoid Restrictor
Burner
Sample probe
temperature controlled
3-way valve
Filter
Pump
Zero Valve
Span Valve Flowmeter
Bypass
Gauge
Sample
capillaryTemperature
controlled oven
Fig. 15.23 Flame ionization method for measuring unburnt hydrocarbons

Measurements and Testing 487
15.10 VISIBLE EMISSIONS
Compared to harmful and invisible emissions, visible emissions are more irri-tating and cause nuisance. Especially in diesel engines, smoke is one of visibleemissions. The details are discussed in the following sections.
15.10.1 Smoke
The smoke of the engine exhaust is a visible indicator of the combustionprocess in the engine. Smoke is due to incomplete combustion. Smoke indiesel engine can be divided into three categories viz., blue, white and black.Visible method of analysis is used for quantifying the above three types ofsmokes. Smoke measurements can be broadly classified into two groups viz.comparison method and obscuration method.
Comparison Method: Most ordinances regulating smoke emissions arebased on estimation of the density of the smoke as it emerges from the exhaust.Of the several available methods, the one of the commonly used method isthe Ringelmann Chart. The chart shows four shades of gray, as well as apure white and an all-black section. To overcome the difficulty of reproducingvarious shades of gray, the intermediate shades are built from black lines ofvarious widths (Fig.15.24). The four intermediate charts are printed by theUnited States Bureau of Mines on a single 70 cm × 25 cm sheet. They maybe reproduced as follows:
0 All white
1 Black lines 1 mm thick, 10 mm apart, leaving white spaces 9 mm square.
2 Lines 2.3 mm thick, spaces 7.7 mm square.
3 Lines 3.7 mm thick, spaces 6.3 mm square.
4 Lines 5.5 mm thick, spaces 4.5 mm square.
5 All black.
Equivalent to
20% black
1 2 3 4
Equivalent to
40% black
Equivalent to
60% black
Equivalent to
80% black
Fig. 15.24 Ringelmann chart
In use, the chart is set up at eye level in line with the stack at suchdistances (10 m or more) that the sections appear to be different degrees of
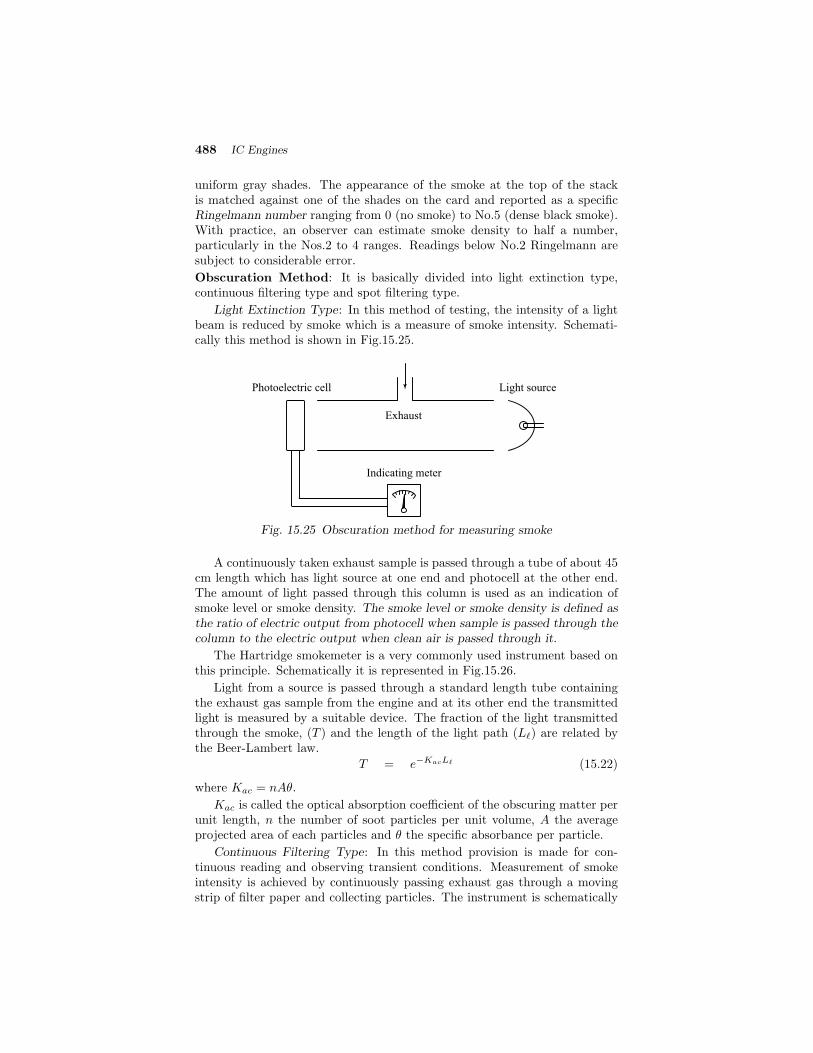
488 IC Engines
uniform gray shades. The appearance of the smoke at the top of the stackis matched against one of the shades on the card and reported as a specificRingelmann number ranging from 0 (no smoke) to No.5 (dense black smoke).With practice, an observer can estimate smoke density to half a number,particularly in the Nos.2 to 4 ranges. Readings below No.2 Ringelmann aresubject to considerable error.
Obscuration Method: It is basically divided into light extinction type,continuous filtering type and spot filtering type.
Light Extinction Type: In this method of testing, the intensity of a lightbeam is reduced by smoke which is a measure of smoke intensity. Schemati-cally this method is shown in Fig.15.25.
Photoelectric cell Light source
Exhaust
Indicating meter
Fig. 15.25 Obscuration method for measuring smoke
A continuously taken exhaust sample is passed through a tube of about 45cm length which has light source at one end and photocell at the other end.The amount of light passed through this column is used as an indication ofsmoke level or smoke density. The smoke level or smoke density is defined asthe ratio of electric output from photocell when sample is passed through thecolumn to the electric output when clean air is passed through it.
The Hartridge smokemeter is a very commonly used instrument based onthis principle. Schematically it is represented in Fig.15.26.
Light from a source is passed through a standard length tube containingthe exhaust gas sample from the engine and at its other end the transmittedlight is measured by a suitable device. The fraction of the light transmittedthrough the smoke, (T ) and the length of the light path (L ) are related bythe Beer-Lambert law.
T = e−KacL (15.22)
where Kac = nAθ.
Kac is called the optical absorption coefficient of the obscuring matter perunit length, n the number of soot particles per unit volume, A the averageprojected area of each particles and θ the specific absorbance per particle.
Continuous Filtering Type: In this method provision is made for con-tinuous reading and observing transient conditions. Measurement of smokeintensity is achieved by continuously passing exhaust gas through a movingstrip of filter paper and collecting particles. The instrument is schematically
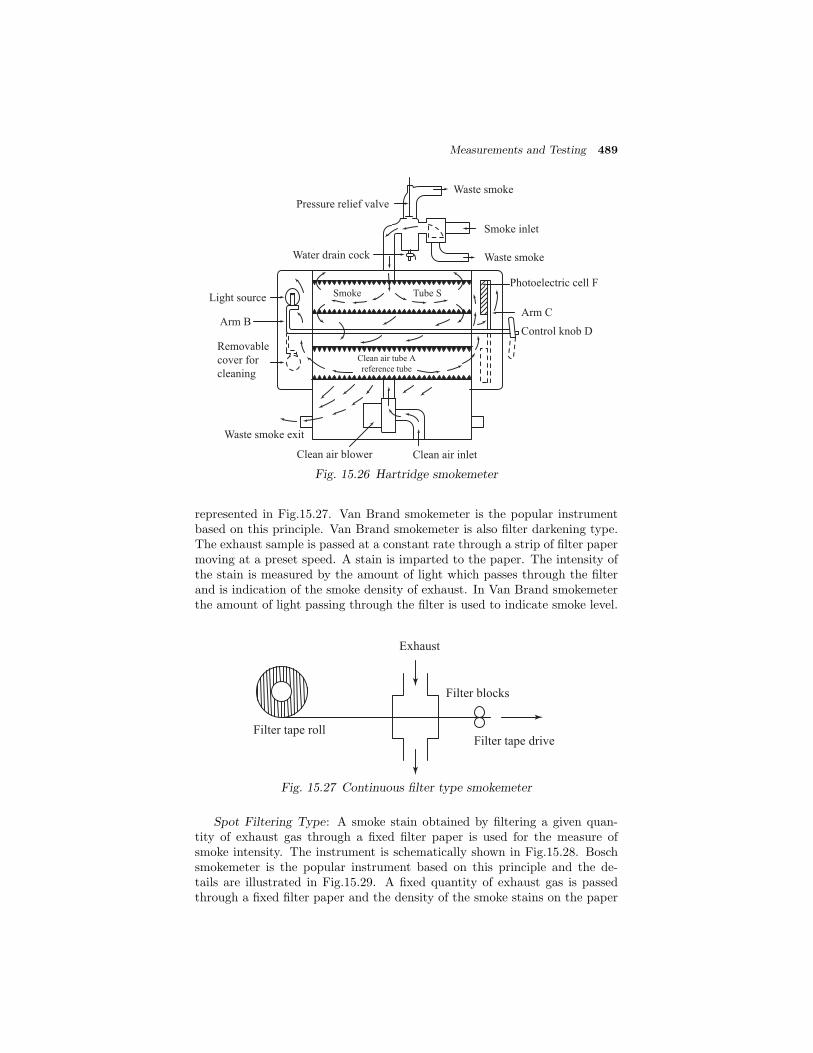
Measurements and Testing 489
Smoke Tube S
Water drain cock
Light source
Arm B
Removable
cover for
cleaning
Waste smoke exit
Clean air blower Clean air inlet
Clean air tube A
reference tube
Waste smoke
Pressure relief valve
Smoke inlet
Waste smoke
Photoelectric cell F
Arm C
Control knob D
Fig. 15.26 Hartridge smokemeter
represented in Fig.15.27. Van Brand smokemeter is the popular instrumentbased on this principle. Van Brand smokemeter is also filter darkening type.The exhaust sample is passed at a constant rate through a strip of filter papermoving at a preset speed. A stain is imparted to the paper. The intensity ofthe stain is measured by the amount of light which passes through the filterand is indication of the smoke density of exhaust. In Van Brand smokemeterthe amount of light passing through the filter is used to indicate smoke level.
Exhaust
Filter tape rollFilter tape drive
Filter blocks
Fig. 15.27 Continuous filter type smokemeter
Spot Filtering Type: A smoke stain obtained by filtering a given quan-tity of exhaust gas through a fixed filter paper is used for the measure ofsmoke intensity. The instrument is schematically shown in Fig.15.28. Boschsmokemeter is the popular instrument based on this principle and the de-tails are illustrated in Fig.15.29. A fixed quantity of exhaust gas is passedthrough a fixed filter paper and the density of the smoke stains on the paper

490 IC Engines
is evaluated optically. In a recent modification of this type of smokemeter, apneumatically operated sampling pump and a photo-electric unit are used forthe measurement of the intensity of smoke stain on filter paper.
Exhaust
Filter tape
Pump
Fig. 15.28 Spot filtering type smokemeter
Filter paper disc
Annular photocell
Lamp 3.8 V/0.07 A
Micrometer scaled
0 to 10 smoke number
4.5 volts
Sampling connection
Filter paper disc
Piston
Pneumatic
tripping device
Bellows
Setting knob
10 W
20 W0
10
Fig. 15.29 Bosch smokemeter
15.11 NOISE
Noise is a mixture of various sounds which is a source of irritation for the lis-tener. Sound is created by a vibrating object. The vibrations are transmittedto the surrounding air in the form of pressure waves. If the frequency andintensity of the pressure waves are within specified range they produce sensa-tion of sound (15 to 15000 Hz and 0 to 120 dB intensity). Sound level meterconsists of a microphone, calibrated attenuator, an electronic amplifier and anindicator meter which reads in decibels (dB) as shown in Fig.15.30. Octaveband frequency analyzer is suitable for obtaining the frequency distribution inlight bands in frequency region between 20 and 10,000 Hz. The measurementof the noise emitted by motor vehicles is based on a moving vehicle, since it isthe total noise emitted by motor vehicle including gear box and transmission.
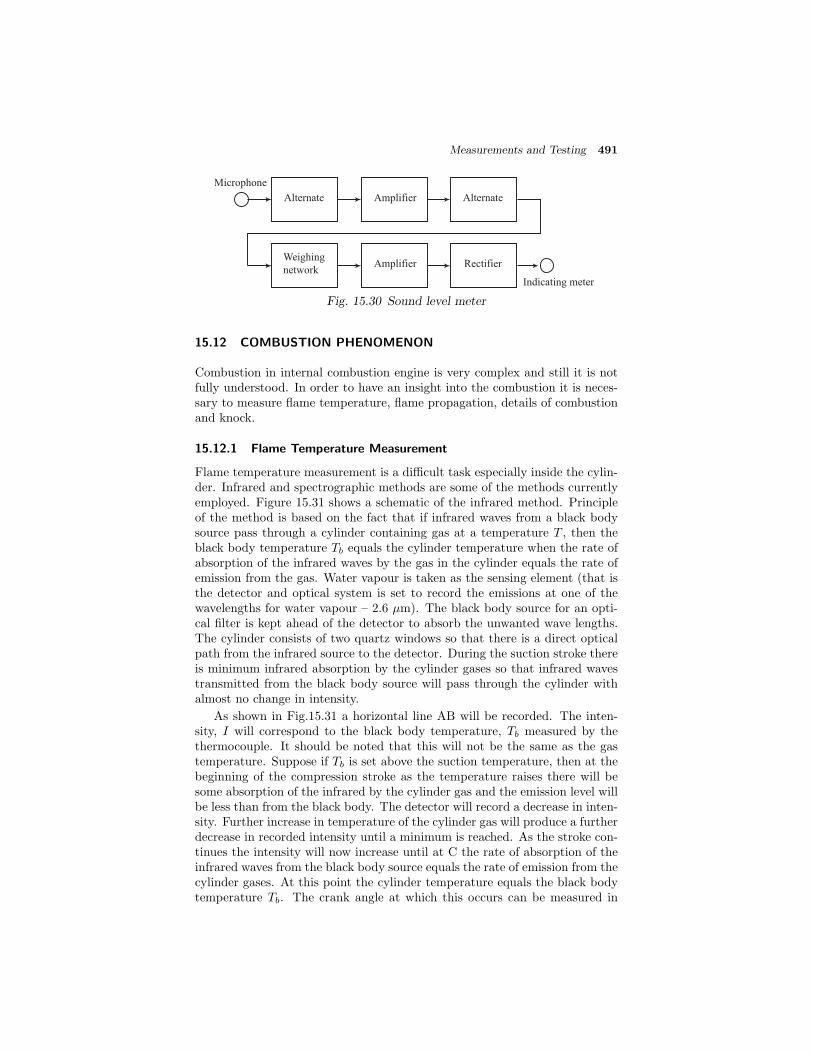
Measurements and Testing 491
Microphone
Alternate Amplifier Alternate
Weighing
networkAmplifier Rectifier
Indicating meter
Fig. 15.30 Sound level meter
15.12 COMBUSTION PHENOMENON
Combustion in internal combustion engine is very complex and still it is notfully understood. In order to have an insight into the combustion it is neces-sary to measure flame temperature, flame propagation, details of combustionand knock.
15.12.1 Flame Temperature Measurement
Flame temperature measurement is a difficult task especially inside the cylin-der. Infrared and spectrographic methods are some of the methods currentlyemployed. Figure 15.31 shows a schematic of the infrared method. Principleof the method is based on the fact that if infrared waves from a black bodysource pass through a cylinder containing gas at a temperature T , then theblack body temperature Tb equals the cylinder temperature when the rate ofabsorption of the infrared waves by the gas in the cylinder equals the rate ofemission from the gas. Water vapour is taken as the sensing element (that isthe detector and optical system is set to record the emissions at one of thewavelengths for water vapour – 2.6 μm). The black body source for an opti-cal filter is kept ahead of the detector to absorb the unwanted wave lengths.The cylinder consists of two quartz windows so that there is a direct opticalpath from the infrared source to the detector. During the suction stroke thereis minimum infrared absorption by the cylinder gases so that infrared wavestransmitted from the black body source will pass through the cylinder withalmost no change in intensity.
As shown in Fig.15.31 a horizontal line AB will be recorded. The inten-sity, I will correspond to the black body temperature, Tb measured by thethermocouple. It should be noted that this will not be the same as the gastemperature. Suppose if Tb is set above the suction temperature, then at thebeginning of the compression stroke as the temperature raises there will besome absorption of the infrared by the cylinder gas and the emission level willbe less than from the black body. The detector will record a decrease in inten-sity. Further increase in temperature of the cylinder gas will produce a furtherdecrease in recorded intensity until a minimum is reached. As the stroke con-tinues the intensity will now increase until at C the rate of absorption of theinfrared waves from the black body source equals the rate of emission from thecylinder gases. At this point the cylinder temperature equals the black bodytemperature Tb. The crank angle at which this occurs can be measured in

492 IC Engines
Time Time
A B
C A B
Intensity Pressure
Amplifier Amplifier
Pressure transducer
PotentiometerDetector
Lens
Filter
Windows
Black body source
Thermocouple
Cylinder
Fig. 15.31 Infrared spectrographic method
the normal manner. As series of black body temperatures Tb is taken and theprocedure is repeated, a temperature-crank angle diagram can be obtained.Cleanliness of the quartz windows, window radiation, absorption and homo-geneity of the cylinder temperature, cycle-to-cycle variations are factors uponwhich the accuracy of the method depends.
Another technique is the spectrographic method which is not only usedfor measuring the local gas temperature but also for studying the chemicalreactions in the cylinder. Basis of this method depends on the measurementof the light intensities associated with reacting species at defined wavelengthsat which the intensities are at a maximum. One method which has been suc-cessfully used to study the formation of oxides of nitrogen during combustionis described. Figures 15.32(a) and 15.32(b) show the details.
A number of quartz windows, W are fitted in the cylinder head. The lightsource is of 2× 2 mm size fitted in the combustion chamber. The core of lightemitted from the cylinder is split into four separate beams in mirror M2, eachof which is brought to a separate focus by mirrors M3 and M4. Three beams(2, 3 and 4) are focused onto a photo-multiplier with an interference filter topass wave lengths 0.38 μm and 0.61 μm with a band pass of 100◦A and a wavelength of 0.75 μm at a band pass of 300◦A. The fourth channel is monitoredwith a monochromator and photomultiplier. The light intensities I at thewave length 0.38 μm, 0.68 μm and 0.61 μm are recorded on a oscillographrelative to the crank angle as shown in Fig.15.32(c). The 0.38 μm wavelengthcorresponds to the reaction
CO + O → CO2 + hν (15.23)

Measurements and Testing 493
W W W W
Section
AAInlet Piston
Top of stroke
1 2 3 4
W WW
W W
W
WW
WWP
P
V
V
S
AA
Inlet
V
S
W
P
Valve
Spark plug
Window
Pressure guage
Top view
1 2 3 4
Monochromator
(channel 1)
Entrance slit
Exit slit
Photomultiplier
Inference filter channels 2, 3 and 4
Mirror
WindowCombustion chamber
1M
4M
2M
3M
Lig
ht
inte
nsi
ty Pressure
/ang
le
I = 0.38
I = 0.68
I = 0.61
μ
μ
μ
(a)
(b)
Fig. 15.32 Spectrographic method to study the formation of oxygen

494 IC Engines
where the emitted light is mainly associated with the discreet energy pockethν. The 0.61 μm and 0.68 μm wave lengths are associated with the reaction
NO + O → NO2 + hν (15.24)
For the above two reactions the intensities of emitted light I associatedwith the energy packets hν are related to the concentrations by
ICO = K1 [CO] [O] (15.25)
INO = K2 [NO] [O] (15.26)
K1 andK2 parameters are functions of the instantaneous temperature Tand the wave length λ. It is assumed that the carbon-hydrogen-oxygen reac-tions are in equilibrium. Thus for each temperature T there is a known valuefor [CO][O] from the equilibrium constant. Also for each temperature andwave length there is a known value for K1. It follows therefore that at a givenwave length
K1 [CO] [O] = f(T ) (15.27)
when this function equals the numerical value of the emitted light ICO we knowthe temperature and the oxygen concentration. In this way by measuringthe intensity ICO at the wave length 0.38 μm we can determine the localtemperature T .
For the nitric oxide reaction, if INO is known at the appropriate wavelength, then, since we know the temperature T and the oxygen concentration[O] and K2 is a known function of the wave length and temperature, the nitricoxide concentration can be calculated from
[NO] =INO
K2[O](15.28)
15.12.2 Flame Propagation
Slow combustion and the propagation of a combustion wave are the two phe-nomena that occur whenever ignition of combustible mixture takes place.During slow combustion, the fuel molecules that are already burning raisethe temperature of adjacent molecules by conduction and radiation causingthem to ignite. At the same time the temperature rise of the gas moleculesincreases their velocity. This raises the pressure in that point and results inan expansion that assists in propagating the ignition.
Turbulence created in the charge before ignition increase materially thevelocity of flame propagation which in this case occurs not only through con-duction and radiation but also through convection. It is not easy to segregateall these processes. Whenever a compression wave occurs its velocity mayreach several metres per second and passing through the explosive mixtureaccompanied by almost instantaneous generation of very high pressures it maycause serious trouble in the engine. That is why the measurement of flamepropagation is necessary in the evaluation of the performance of IC engine.

Measurements and Testing 495
Flame location with time is directly measured by the use of ionizationgauges. The gauges are made up of a wire in an annulus. The wire is in-sulated from the body of the gauge. Whenever flame reaches the annulus itbecomes conducting since an electrical circuit is completed between the wireand the gauge body. A DC voltage is normally applied to the wire and anelectronic timing circuit connected to the gauge body as well as some refer-ence time location. When the flame arrives at the gauge the timing circuitis triggered and the time from the reference time is measured. By locatinga number of gauges in the combustion chamber a quantitative picture of theflame propagation may be made. Allowance must be made for expansion ofthe hot gas zone which is superimposed on the flame speed during the analysisof the results. Air-fuel ratio affects the minimum voltage.
15.12.3 Combustion Process
High speed colour photography has been successfully used for qualitative com-bustion analysis notably by Ricardo (Fig.15.33).
Layout of optical system and camera
Injector
Prechamber
Flywheel
Degree scale
Injector
Transparent window
Location of transparent windows in comet V combustion chamber
Rigid support
Faxtex
camera
Aluminized mirrors
Lamps
Combustion chamberPiston
Fig. 15.33 High speed photographic technique for combustion analysis
The cylinder has either a quartz or perspex window. A high speed rotatingprism camera, operating up to 16,000 frames per second is mounted on a rigidsupport and mirrors are arranged to record the combustion and crankshaftsimultaneously. The fuel is normally doped with copper oleate to render lowluminosity flames visible. A better understanding of the combustion process

496 IC Engines
can be obtained from combustion films. Nowadays software is developed toanalyze these chemical films and thereby analysis of the process is accuratelypossible using computers.
Review Questions
15.1 List various methods available for finding friction power of an engine.
15.2 State the limitations experienced in the evaluation of friction power usingWillan’s line method.
15.3 Why Morse test is not suitable for single cylinder engine? Describe themethod of finding friction power using Morse test.
15.4 Explain the method of motoring test for obtaining friction power of anengine.
15.5 Explain the principle involved in the measurement of brake power.
15.6 Why the method of obtaining friction power by computing the differ-ence between indicated power and brake power is mostly used in researchlaboratories?
15.7 Explain the use of prony brake and rope brake in measuring the poweroutput of an engine.
15.8 Explain the basic principle and working of hydraulic dynamo-meter.
15.9 With a neat sketch, explain an Eddy current dynamometer.
15.10 What is transmission dynamometer? Explain.
15.11 Enumerate the advantage of gravimetric fuel flow measurement overvolumetric fuel flow measurement.
15.12 Explain an automatic fuel flow meter.
15.13 Classify the meters used for measuring air flow and explain.
15.14 “Air flow to engines cannot be measured with the same precision as canfuel flow”, explain the significance of the above statement.
15.15 What is the need for measurement of speed of an I.C. engine?
15.16 List the types of exhaust temperature measurement.
15.17 List the emissions that are considered significant for measurement andperformance study.
15.18 Explain the internationally accepted methods of measuring the followinginvisible emission. (i) Oxides of nitrogen; (ii) Carbon monoxide; (iii)Unburned hydrocarbons; (iv) Aldehydes.
15.19 What is smoke and classify the measurement of smoke?

Measurements and Testing 497
15.20 Explain the method of measurement of smoke by comparison method.
15.21 In obscuration method of measuring smoke, list the types and give thename of popular instruments with the principle of working.
15.22 Define noise and explain the method of measurement of noise usingsound level meter.
15.23 What parameters are necessary for measurement in order to have aninsight into combustion?
15.24 Explain the method of determining the local temperature (flame tem-perature) by spectrographic method.
15.25 Explain how the flame propagation during the combustion process canbe measured using high speed photographic techniques.
Multiple Choice Questions (choose the most appropriate answer)
1. The range of mechanical efficiency for automobile engines is
(a) 0 – 30%
(b) 30 – 50%
(c) 70 – 80%
(d) 90 – 100%
2. The measurement of frictional power by Willans line is applicable to
(a) SI engines at a particular speed
(b) CI engines at a particular speed
(c) any engine at a particular speed only
(d) none of the above
3. Morse test is applicable only to
(a) single cylinder SI engines
(b) single cylinder CI engines
(c) multicylinder CI engines
(d) single and multicylinder SI and CI engines
4. The most accurate method of determining fp is by
(a) Willan’s line
(b) Morse test
(c) measurement of brake and indicated power
(d) motoring test

498 IC Engines
5. In the air box method of measuring air flow, the air box is provided to
(a) have constant temperature
(b) have constant flow
(c) damp out the pulsations
(d) provide constant velocity of flow
6. The air box/swept volume ratio should be in the range for single-cylinderengines
(a) 10 – 100%
(b) 200 – 300%
(c) 500 – 600%
(d) > 1000%
7. The best method of measuring speed is by
(a) mechanical tachometer
(b) electrical tachometer
(c) magnetic pickup
(d) none of the above
8. Flame ionization detector is used for measuring
(a) CO
(b) HC
(c) NOx
(d) CO2
9. Chemiluminescence analyzer is used for measuring
(a) NOx
(b) CO
(c) HC
(d) CO2
10. Non-dispersive infra-red analyzer is widely accepted instrument formeasuring
(a) NOx
(b) HC
(c) CO
(d) CO2
Ans: 1. – (c) 2. – (b) 3. – (c) 4. – (c) 5. – (c)6. – (c) 7. – (c) 8. – (b) 9. – (a) 10. – (c)
16PERFORMANCE
PARAMETERS AND
CHARACTERISTICS
16.1 INTRODUCTION
Internal combustion engine generally operates within a useful range of speed.Some engines are made to run at fixed speed by means of a speed governorwhich is its rated speed. At each speed within the useful range the poweroutput varies and it has a maximum usable value. The ratio of power devel-oped to the maximum usable power at the same speed is called the load. Thespecific fuel consumption varies with load and speed. The performance of theengine depends on inter-relationship between power developed, speed and thespecific fuel consumption at each operating condition within the useful rangeof speed and load.
The following factors are to be considered in evaluating the performanceof an engine:
(i) Maximum power or torque available at each speed within the usefulrange of speed.
(ii) The range of power output at constant speed for stable operation of theengine. The different speeds should be selected at equal intervals withinthe useful speed range.
(iii) Brake specific fuel consumption at each operating condition within theuseful range of operation.
(iv) Reliability and durability of the engine for the given range of operation.
Engine performance characteristics can be determined by the followingtwo methods.
(i) By using experimental results obtained from engine tests.
(ii) By analytical calculation based on theoretical data.
Engine performance is really a relative term. It is represented by typicalcharacteristic curves which are functions of engine operating parameters. Theterm performance usually means how well an engine is doing its job in relationto the input energy or how effectively it provides useful energy in relation tosome other comparable engines.
500 IC Engines
Some of the important parameters are speed, inlet pressure and temper-ature, output, air-fuel ratio etc. The useful range of all these parametersis limited by various factors, like mechanical stresses, knocking, over-heatingetc. Due to this, there is a practical limit of maximum power and efficiencyobtainable from an engine. The performance of an engine is judged from thepoint of view of the two main factors, viz., engine power and engine efficiency.Besides the overall efficiency, various other efficiencies are encountered whendealing with the theory, design and operation of engines. These factors arediscussed in more detail in the following two sections.
16.2 ENGINE POWER
In general, as indicated in section 1.7, the energy flow through the engineis expressed in three distinct terms. They are indicated power, ip, frictionpower fp and brake power, bp. Indicated power can be computed from themeasurement of forces in the cylinder and brake power may be computedfrom the measurement of forces at the crankshaft of the engine. The frictionpower can be estimated by motoring the engine or other methods discussedin Chapter 15. It can also be calculated as the difference between the ip andbp if these two are known, then,
ip = bp + fp (16.1)
fp = ip− bp (16.2)
In the following sections, the usually employed formulae for the computationof power are discussed.
16.2.1 Indicated Mean Effective Pressure (pim)
It has been stated in section 16.2 that ip can be computed from the measure-ment of forces developed in the cylinder, viz., the pressure of the expandinggases. As already described, in chapters dealing with cycles, the pressure inthe cylinder varies throughout the cycle and the variation can be expressedwith respect to volume or crank angle to obtain p-V or p-θ diagrams respec-tively. However, such a continuous variation does not readily lend itself tosimple mathematical analysis in the computation of ip. If an average pressurefor one cycle can be used, then the computations becomes far less difficult.
As the piston moves back and forth between TDC and BDC (Fig.16.1),the process lines on the p-V diagram indicate the successive states of theworking fluid through the cycle. The indicated net work of the cycle is rep-resented by the area 1234 enclosed by the process lines for that cycle. If thearea of rectangle ABCD equals area 1234, the vertical distance between thehorizontal lines AB and CD represents the indicated mean effective pressure,imep. It is a mean value expressed in N/m2, which, when multiplied by thedisplacement volume, Vs, gives the same indicated net work as is actuallyproduced with the varying pressures.
pim × (V1 − V2) = Net work of cycle (16.3)
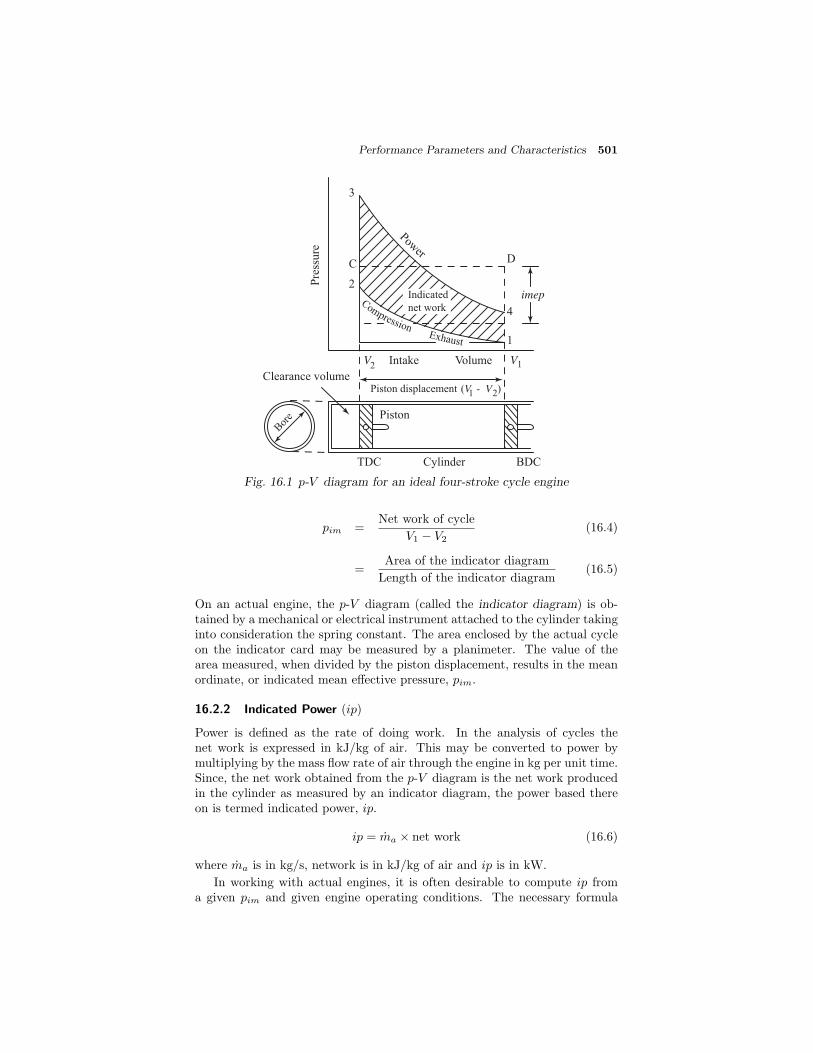
Performance Parameters and Characteristics 501
Power
CompressionExhaust
3
C
2
D
4
1
imep
V Intake Volume V
Pre
ssu
re
Piston displacement
Piston
Clearance volume
Indicated
net work
Bor
e
TDC Cylinder BDC
(V - V )1 2
2 1
Fig. 16.1 p-V diagram for an ideal four-stroke cycle engine
pim =Net work of cycle
V1 − V2(16.4)
=Area of the indicator diagram
Length of the indicator diagram(16.5)
On an actual engine, the p-V diagram (called the indicator diagram) is ob-tained by a mechanical or electrical instrument attached to the cylinder takinginto consideration the spring constant. The area enclosed by the actual cycleon the indicator card may be measured by a planimeter. The value of thearea measured, when divided by the piston displacement, results in the meanordinate, or indicated mean effective pressure, pim.
16.2.2 Indicated Power (ip)
Power is defined as the rate of doing work. In the analysis of cycles thenet work is expressed in kJ/kg of air. This may be converted to power bymultiplying by the mass flow rate of air through the engine in kg per unit time.Since, the net work obtained from the p-V diagram is the net work producedin the cylinder as measured by an indicator diagram, the power based thereon is termed indicated power, ip.
ip = ma × net work (16.6)
where ma is in kg/s, network is in kJ/kg of air and ip is in kW.
In working with actual engines, it is often desirable to compute ip froma given pim and given engine operating conditions. The necessary formula
502 IC Engines
may be developed from the equation of net work based on the mean effectivepressure and piston displacement. From Eq.16.3,
Indicated net work/cycle = pim Vs (16.7)
By definition,
Indicated power = Indicated net work× cycles/s
ip =pimVsnK
1000× 60=
pimLAnK
60000kW (16.8)
where ip = indicated power (kW)
pim = indicated mean effective pressure (N/m2)
L = length of the stroke (m)
A = area of the piston (m2)
N = speed in revolutions per minute
n = number of power strokes per minute
N/2 for a four-stroke engine
N for a two-stroke engine
K = number of cylinders
16.2.3 Brake Power (bp)
Indicated power is based on indicated net work and is thus a measure of theforces developed within the cylinder. More practical interest is the rotationalforce available at the delivery point, at the engine crankshaft (termed thedrive-shaft), and the power corresponding to it. This power is interchangeablyreferred to as brake power, shaft power or delivered power. In general, onlythe term brake power, bp, has been used in this book to indicate the poweractually delivered by the engine.
The bp is usually measured by attaching a power absorption device to thedrive-shaft of the engine. Such a device sets up measurable forces counter-acting the forces delivered by the engine, and the determined value of thesemeasured forces is indicative of the forces being delivered.
By using the geometry of a simple prony brake as the basis, a formula cannow be developed for computing the bp delivered by an engine. Work has beendefined as the product of a force and the distance through which the point ofapplication of force moves. Then the drive-shaft of the engine turns throughone revolution, any point on the periphery of the rigidly attached wheel movesthrough a distance equal to 2πr (Fig.16.2). During this movement, a frictionforce, f is acting against the wheel. The force, f is thus acting through thedistance 2πr, and producing work. Thus,
Work during one revolution = Distance× Force
= (2πr)× f (16.9)

Performance Parameters and Characteristics 503
R
Friction adjustment
Movement arm
Scales
Fr
f
Engine
Fly wheel
Friction band
Driveshaft
Fig. 16.2 Adaptation of prony brake for power measurement
The torque, rf , produced by the drive-shaft is opposed by a turning momentequal to the product of the length of the moment arm R and the force Fmeasured by the scale
T = rf = RF (16.10)
Work during one revolution = 2πRF
Power =Work
Time= 2πRF
N
60(16.11)
where N = revolutions per minute of the drive-shaft. Therefore,
bp =2πRFN
60× 1000kW (16.12)
It should be noted that N is the rpm of the engine. The friction force is actingduring every revolution of the crankshaft, regardless of whether or not thatrevolution contains a power stroke.
The product of the moment arm R and the measured force, F is termedthe torque of the engine and is usually expressed in Nm. Torque, T is theuniform or fluctuating turning moment, or twist, exerted by a tangential forceacting at a distance from the axis of rotation. For an engine operating at agiven speed and delivering a given power, the torque must be a fixed amount,or the product of F and R must be constant (T = FR). In such a case, if Ris decreased, F will increase proportionately and vice versa.
The brake power, bp, can also be written as
bp =2πNT
60000kW (16.13)
In practice, the length of the moment arm R of the measuring equipmentis so designed that the value of the constants 2π and the constant R and 60000combine to give a convenient number (i.e., in thousands and ten-thousands)

504 IC Engines
in order to simplify computations.
bp =FN
60000/2πR=
FN
C1(16.14)
In order to have C1 = 10000, R should be 0.955 m.
The reader may recollect that the torque is the capacity of an engine todo work while power is the rate at which an engine does work. A simpleexample is that a tractor pulling a given load. The torque developed willdetermine whether or not the tractor is capable of pulling the load, and thepower delivered will determine how fast the load can be pulled.
16.2.4 Brake Mean Effective Pressure (pbm)
Indicated mean effective pressure may be considered to consist of fmep andbmep, two hypothetical pressures. Friction mean effective pressure is thatportion of imep which is required to overcome friction losses, and brake meaneffective pressure is the portion which produces the useful power delivered bythe engine.
imep = bmep + fmep
Since bmep is that portion of imep which goes into the development of usefulpower, it has the same relationship to bp as imep has to ip, or
bmep
imep=
bp
ip(16.15)
Equation 16.8 was developed as a means of computing ip when imep is deter-mined from an engine indicator diagram
ip =pimLAnK
60000
For a given engine, L,A, n and K are constants. Since bp and bmep have thesame relationship to one another as do ip and imep, bp can be expressed as
bp =pbmLAnK
60000(16.16)
where pbm is brake mean effective pressure (N/m2).
And due to the same relationship, the mechanical efficiency, ηm of theengine can be expressed as the ratio of bmep to imep.
ηm =bp
ip=
bmep
imep(16.17)
It should be noted that for a given engine operating under given conditions,the torque developed is proportional to the bmep. This relationship, may beobtained by equating Eq.16.13 and Eq.16.16.
Brake mean effective pressure is very useful in comparing engines or inestablishing engine operating limits.

Performance Parameters and Characteristics 505
16.3 ENGINE EFFICIENCIES
Apart from expressing engine performance in terms of power, it is also essentialto express in terms of efficiencies. Various engine efficiencies are:
(i) Air-standard efficiency
(ii) Brake thermal efficiency
(iii) Indicated thermal efficiency
(iv) Mechanical efficiency
(v) Relative efficiency
(vi) Volumetric efficiency
(vii) Scavenging efficiency
(viii) Charge efficiency
(ix) Combustion efficiency
Most of these efficiencies have already been discussed in various chapters.Generally these efficiencies are expressed in percentage or decimal fractions.We will briefly review them again here.
16.3.1 Air-Standard Efficiency
The air-standard efficiency is also known as thermodynamic efficiency. It ismainly a function of compression ratio and other parameters. It gives theupper limit of the efficiency obtainable from an engine.
16.3.2 Indicated and Brake Thermal Efficiencies
The indicated and brake thermal efficiencies are based on the ip and bp of theengine respectively. These efficiencies give an idea of the output generatedby the engine with respect to heat supplied in the form of fuel. In modernengines an indicated thermal efficiency of almost 28 per cent is obtainablewith gas and gasoline spark-ignition engines having a moderate compressionratio and as high as 36 per cent or even more with high compression ratio oilengines.
16.3.3 Mechanical Efficiency
Mechanical efficiency takes into account the mechanical losses in an engine.Mechanical losses of an engine may be further subdivided into the followinggroups:
(i) Friction losses as in case of pistons, bearings, gears, valve mechanisms.With the development in bearing design and materials, improvementsin gears etc., these losses are usually limited from 7 to 9 per cent of theindicated output.
506 IC Engines
(ii) Power is absorbed by engine auxiliaries such as fuel pump, lubricatingoil pump, water circulating pump, radiator, magneto and distributor,electric generator for battery charging, radiator fan etc. These lossesmay account for 3 to 8 per cent of the indicated output.
(iii) Ventilating action of the flywheel. This loss is usually below 4 per centof the indicated output.
(iv) Work of charging the cylinder with fresh charge and discharging theexhaust gases during the exhaust stroke. In case of two-stroke enginesthe power absorbed by the scavenging pump etc. These losses may ac-count for 2 to 6 per cent of the indicated output. In general, mechanicalefficiency of engines varies from 65 to 85%.
16.3.4 Relative Efficiency
The relative efficiency or efficiency ratio as it is sometimes called is the ratioof the actual efficiency obtained from an engine to the theoretical efficiencyof the engine cycle. Hence,
Relative efficiency =Actual brake thermal efficiency
Air-standard efficiency
Relative efficiency for most of the engines varies from 75 to 95% with theo-retical air and decreases rapidly with insufficient air to about 75% with 90%air.
16.3.5 Volumetric Efficiency
Volumetric efficiency is a measure of the success with which the air supply,and thus the charge, is inducted into the engine. It is a very importantparameter, since it indicates the breathing capacity of the engine. It has beendiscussed in detail in section 4.5.2. Volumetric efficiency is defined as the ratioof the actual mass of air drawn into the engine during a given period of timeto the theoretical mass which should have been drawn in during that sameperiod of time, based upon the total piston displacement of the engine, andthe temperature and pressure of the surrounding atmosphere.
ηv =mact
mth(16.18)
mth = ρanVs
where n is the number of intake strokes per minute. For a four-stroke enginen = N/2 and for a two-stroke engine n = N , where N is the speed of theengine in rev/min. The actual mass is a measured quantity. The theoreticalmass is computed from the geometry of the cylinder, the number of cylinders,and the speed of the engine, in conjunction with the density of the surroundingatmosphere.
Performance Parameters and Characteristics 507
16.3.6 Scavenging Efficiency
In case of two-stroke engines (discussed in detail in the next chapter) scaveng-ing efficiency is defined as the ratio of the amount of air or gas-air mixture,which remains in the cylinder, at the actual beginning of the compressionto the product of the total volume and air density of the inlet. Scavengingefficiency for most of the two-stroke engines varies from 40 to 95 per centdepending upon the type of scavenging provided.
16.3.7 Charge Efficiency
The charge efficiency shows how well the piston displacement of a four-strokeengine is utilized. Various factors affecting charge efficiency are:
(i) the compression ratio.
(ii) the amount of heat picked up during passage of the charge throughintake manifold.
(iii) the valve timing of the engine.
(iv) the resistance offered to air-fuel charge during its passage through in-duction manifold.
16.3.8 Combustion Efficiency
Combustion efficiency is the ratio of heat liberated to the theoretical heatin the fuel. The amount of heat liberated is less than the theoretical valuebecause of incomplete combustion either due to dissociation or due to lack ofavailable oxygen. Combustion efficiency in a well adjusted engine varies from92% to 97%.
16.4 ENGINE PERFORMANCE CHARACTERISTICS
Engine performance characteristics are a convenient graphical presentation ofan engine performance. They are constructed from the data obtained duringactual test runs of the engine and are particularly useful in comparing theperformance of one engine with that of another. In this section some of theimportant performance characteristics of the SI engines are discussed.
It is to be noted that there is a certain speed, within the speed range ofa particular engine, at which the charge inducted per cylinder per cycle willbe the maximum. At this point, the maximum force can therefore be exertedon the piston. For all practical purposes, the torque, or engine capacity todo work will also be maximum at this point. Thus, there is a particularengine speed at which the charge per cylinder per cycle is a maximum, and atapproximately this same speed, the torque of the engine will be a maximum.
As the speed of the engine is increased above this speed the quantity ofthe indicated charge will decrease. However, the power output of the engineincreases with speed due to more number of cycles are executed per unittime. It should be noted that the air consumption will continue to increasewith increased engine speed until some point is reached where the charge per

508 IC Engines
cylinder per stroke decreases very rapidly than the number of strokes per unittime is increasing. Engines are so designed that the maximum air consumptionpoint is not reached within the operating speed of the engine. Increase in airconsumption means that increased quantities of fuel can be added per unittime increasing the power output. In fact the ip produced in the cylinder isalmost directly proportional to the engine air consumption.
The relationship between air charge per cylinder per cycle and torque,as well as air consumption and ip is illustrated in Fig.16.3. Note that themaximum torque occurs at a lower speed than the maximum ip.
Air charge Full throttle
Spee
d f
or
max
. ip
Torque indicated
Air
consu
mption ip
Sp
eed
fo
r
max
imu
m
torq
ueAir
char
ge
per
cyli
nder
per
cycl
e
Torq
ue
Low Engine speed High
Fig. 16.3 Typical performance plot with respect to speed
Figure 16.4 shows some of the other important performance characteristicsfor a typical SI engine. In this figure, torque, ip, bp and fp are plotted againstengine speed throughout the operating range of the engine, at full throttleand variable load. The difference between the ip produced in the cylinder,and the bp realized at the drive-shaft, is the fp. At low engine speeds, thefp is relatively low, and bp is close to ip. As engine speed increases, thefp increases at a greater rate. At engine speeds above the usual operatingrange, fp increases very rapidly. Also, at these higher speeds, ip will reach amaximum and then fall off. At some point, ip and fp will be equal, and bp willthen drop to zero. Note that the torque reaches a maximum at approximately60% of the rated rpm of the engine, while the ip has not reached maximumeven at the rated speed.
Figure 16.5 shows fuel consumption and bsfc plotted against the enginespeed, for the same engine operating under the same conditions. The quantityof fuel consumed increases with engine speed. The bsfc, on the other hand,drops as the speed is increased in the low speed range, nearly levels off atmedium speeds, and increases in the high speed range, At low speeds, theheat loss to the combustion chamber walls is proportionately greater andcombustion efficiency is poorer, resulting in higher fuel consumption for the

Performance Parameters and Characteristics 509
Full throttle operation
Engine speed (rpm)
Torq
ue
(Nm
)
Torque
ip
bp
fp
Pow
er (
kW
)
Fig. 16.4 Typical SI engine performance curves
power produced. At the high speeds, the fp is increasing at a rapid rate,resulting in a slower increase in bp than in fuel consumption, with a consequentincrease in bsfc.
bsfc
Fuel consumption
Full throttle operation
Engine speed (rpm)
Fuel
consu
mpti
on (
kg/h
)
bsf
c (k
g/k
W h
)
Fig. 16.5 Typical fuel consumption curves for an SI engine
The bsfc curve of Fig.16.5 is for full throttle, variable speed operation.At any one speed, it represents the bsfc which will result when the engine iscarrying its maximum load at that speed. By reducing throttle opening andload, that same speed may be obtained, but at loads less than the maximum.A family of curves for various speeds can be obtained, each showing the effecton bsfc of varying the load at constant speed. Under these conditions ofconstant speed and variable load, and at a constant air-fuel ratio, the bsfc willrise consistently and rapidly as the load (and throttle opening) is decreased.Figure 16.6 illustrates the general shape of the curve for any given rpm. Thereason for the rapid increase in bsfc with the reduction in throttle opening isthat the fp remains essentially constant, while the ip is being reduced. Thebp drops more rapidly than fuel consumption, and thereby the bsfc rises.

510 IC Engines
bsfc
Constant speed
Constant A/F ratio
Fu
ll t
hro
ttle
bsf
c (k
g/h
)
0 Full load (%) 100
Fig. 16.6 bsfc curve at constant speed and variable load
Performance curves can be constructed for other operating factors such asimep, bmep, air consumption etc. However, the curves presented are typical,and are among the more important. Probably the most important of theseare the curves of torque, bp and bsfc plotted against engine speed at fullthrottle operation. These curves are the ones most generally published byengine manufacturers with the descriptive literature on their engine models.Such a plot would look similar to Fig.16.7.
bsfc
Fuel
consu
mpti
on (
kg/k
W h
) T
orq
ue
(Nm
)
bp
Bra
ke
pow
er
Torque
Engine speed (rpm)
Fig. 16.7 Variation of bsfc, torque and bp with respect to speed for an SIengine
For selecting a particular capacity engine, one can refer to the curvespublished by the various engine manufacturers which will meet his needs.Then comprehensive performance curves may be studied to determine theappropriate engine.
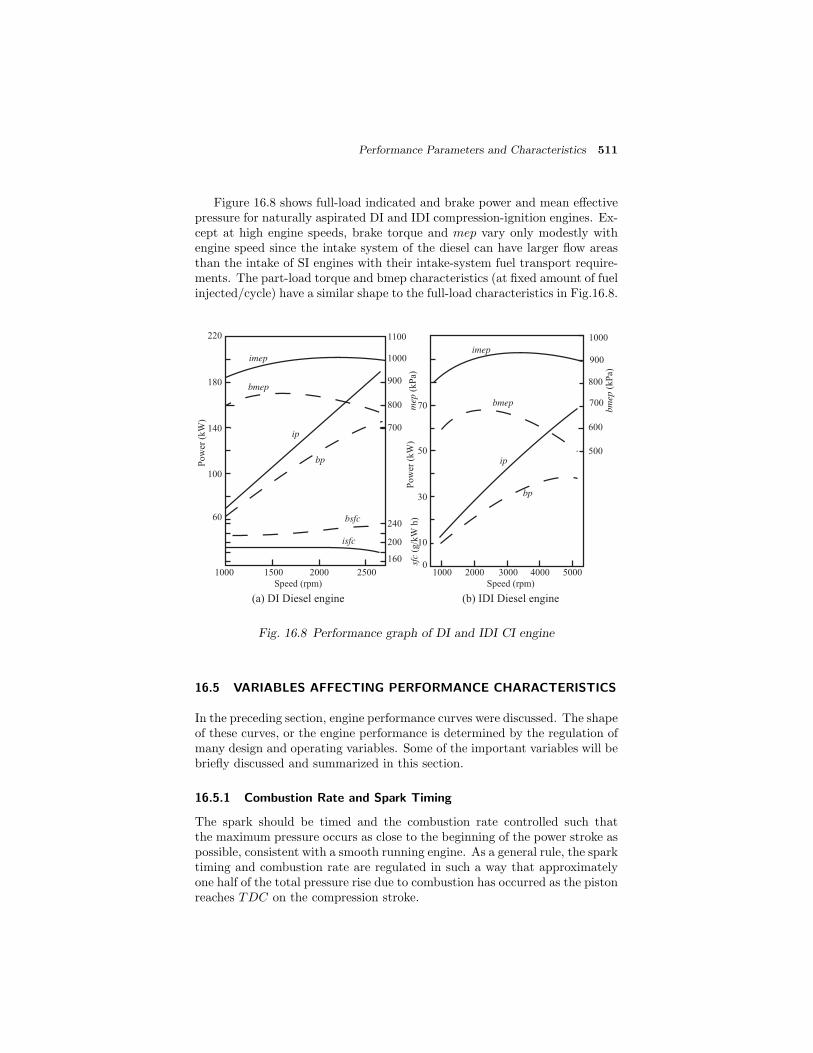
Performance Parameters and Characteristics 511
Figure 16.8 shows full-load indicated and brake power and mean effectivepressure for naturally aspirated DI and IDI compression-ignition engines. Ex-cept at high engine speeds, brake torque and mep vary only modestly withengine speed since the intake system of the diesel can have larger flow areasthan the intake of SI engines with their intake-system fuel transport require-ments. The part-load torque and bmep characteristics (at fixed amount of fuelinjected/cycle) have a similar shape to the full-load characteristics in Fig.16.8.
60
100
140
180
220
1000 1500 2000 2500
160
200
240
Pow
er (
kW
)
imep
bmep
ip
bp
bsfc
isfc
sfc
(g/k
W h
)
700
800
900
1000
1100
mep
(kP
a)P
ow
er (
kW
)
imep
bmep
ip
bp
Speed (rpm)
bm
ep (
kP
a)
500
600
700
800
900
1000
50002000 3000
50
70
1000 4000
10
30
0
Speed (rpm)
(a) DI Diesel engine (b) IDI Diesel engine
Fig. 16.8 Performance graph of DI and IDI CI engine
16.5 VARIABLES AFFECTING PERFORMANCE CHARACTERISTICS
In the preceding section, engine performance curves were discussed. The shapeof these curves, or the engine performance is determined by the regulation ofmany design and operating variables. Some of the important variables will bebriefly discussed and summarized in this section.
16.5.1 Combustion Rate and Spark Timing
The spark should be timed and the combustion rate controlled such thatthe maximum pressure occurs as close to the beginning of the power stroke aspossible, consistent with a smooth running engine. As a general rule, the sparktiming and combustion rate are regulated in such a way that approximatelyone half of the total pressure rise due to combustion has occurred as the pistonreaches TDC on the compression stroke.

512 IC Engines
16.5.2 Air-Fuel Ratio
This ratio must be set to fulfill engine requirements. Consistent with theserequirements, however, it is usually set as close as possible to the best economyproportions during normal cruising speeds, and as close as possible to the bestpower proportions when maximum performance is required.
16.5.3 Compression Ratio
An increase in compression ratio increases the thermal efficiency, and is, there-fore, generally advantageous. The compression ratio in most SI engines islimited by knock, and the use of economically feasible antiknock quality fuels.Increasing compression ratio also increases the friction of the engine, partic-ularly between piston rings and the cylinder walls, and there is a point atwhich further increase in compression ratio would not be profitable, thoughthis point appears to be rather high.
16.5.4 Engine Speed
At low speeds, a greater length of time is available for heat transfer to thecylinder walls and therefore a greater proportion of heat loss occurs. Up toa certain point, higher speeds produce greater air consumption and thereforegreater ip. Higher speeds, however, are accompanied by rapidly increasing fpand by greater inertia in the moving parts. Consequently, the engine speedrange must be a compromise, although most present day designs appear tofavour the higher speeds.
16.5.5 Mass of Inducted Charge
The greater the mass of the charge inducted, the higher the power produced.For a given engine, the geometry is fixed, and it is desirable to induct a chargeto a maximum possible density giving the highest volumetric efficiency.
16.5.6 Heat Losses
It should be noted that the large proportion of the available energy is lostin a non-usable form, i.e., heat losses. Any method which can be employedto prevent the excessive heat loss and cause this energy to leave the engineis a usable form will tend to increase engine performance. Higher coolanttemperatures, for instance, provide a smaller temperature gradient aroundcombustion chamber walls and a reduction in heat loss, but are limited by thepossibility of damage to engine parts.
16.6 METHODS OF IMPROVING ENGINE PERFORMANCE
The engine designer is always interested in methods through which engineperformance may be improved. By referring to Fig.1.13, it can be seen thatthere are two general areas in which methods can be utilized to improveperformance:
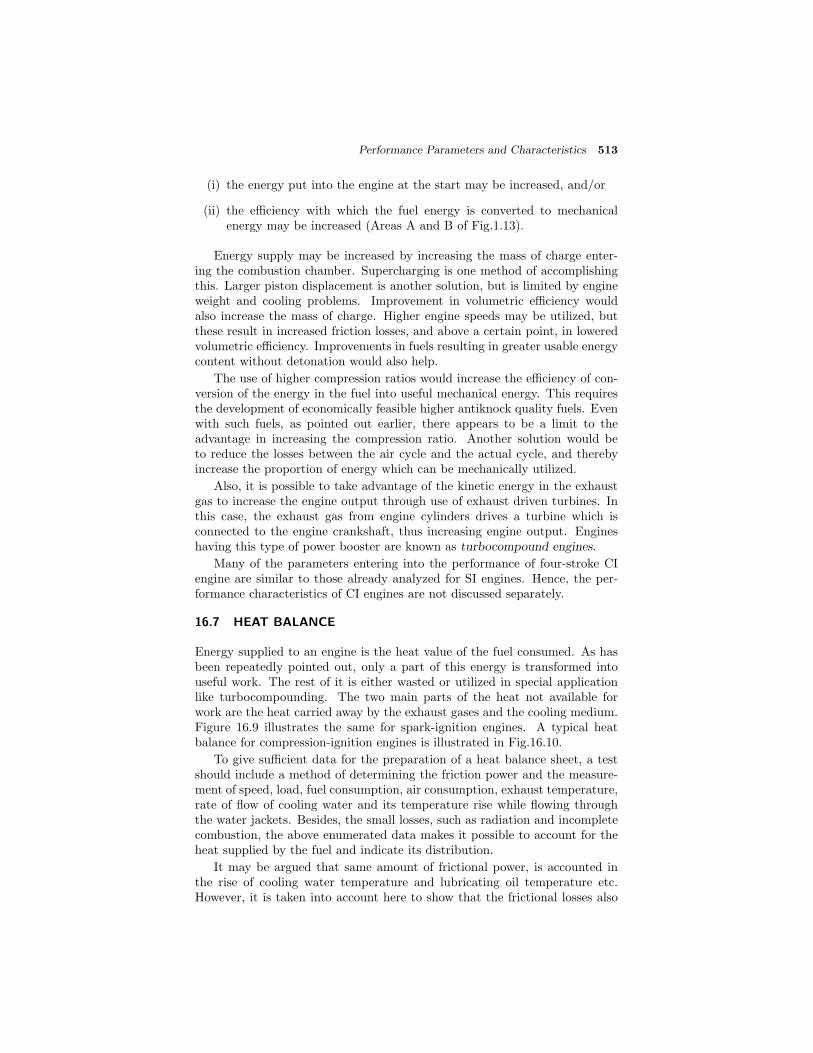
Performance Parameters and Characteristics 513
(i) the energy put into the engine at the start may be increased, and/or
(ii) the efficiency with which the fuel energy is converted to mechanicalenergy may be increased (Areas A and B of Fig.1.13).
Energy supply may be increased by increasing the mass of charge enter-ing the combustion chamber. Supercharging is one method of accomplishingthis. Larger piston displacement is another solution, but is limited by engineweight and cooling problems. Improvement in volumetric efficiency wouldalso increase the mass of charge. Higher engine speeds may be utilized, butthese result in increased friction losses, and above a certain point, in loweredvolumetric efficiency. Improvements in fuels resulting in greater usable energycontent without detonation would also help.
The use of higher compression ratios would increase the efficiency of con-version of the energy in the fuel into useful mechanical energy. This requiresthe development of economically feasible higher antiknock quality fuels. Evenwith such fuels, as pointed out earlier, there appears to be a limit to theadvantage in increasing the compression ratio. Another solution would beto reduce the losses between the air cycle and the actual cycle, and therebyincrease the proportion of energy which can be mechanically utilized.
Also, it is possible to take advantage of the kinetic energy in the exhaustgas to increase the engine output through use of exhaust driven turbines. Inthis case, the exhaust gas from engine cylinders drives a turbine which isconnected to the engine crankshaft, thus increasing engine output. Engineshaving this type of power booster are known as turbocompound engines.
Many of the parameters entering into the performance of four-stroke CIengine are similar to those already analyzed for SI engines. Hence, the per-formance characteristics of CI engines are not discussed separately.
16.7 HEAT BALANCE
Energy supplied to an engine is the heat value of the fuel consumed. As hasbeen repeatedly pointed out, only a part of this energy is transformed intouseful work. The rest of it is either wasted or utilized in special applicationlike turbocompounding. The two main parts of the heat not available forwork are the heat carried away by the exhaust gases and the cooling medium.Figure 16.9 illustrates the same for spark-ignition engines. A typical heatbalance for compression-ignition engines is illustrated in Fig.16.10.
To give sufficient data for the preparation of a heat balance sheet, a testshould include a method of determining the friction power and the measure-ment of speed, load, fuel consumption, air consumption, exhaust temperature,rate of flow of cooling water and its temperature rise while flowing throughthe water jackets. Besides, the small losses, such as radiation and incompletecombustion, the above enumerated data makes it possible to account for theheat supplied by the fuel and indicate its distribution.
It may be argued that same amount of frictional power, is accounted inthe rise of cooling water temperature and lubricating oil temperature etc.However, it is taken into account here to show that the frictional losses also
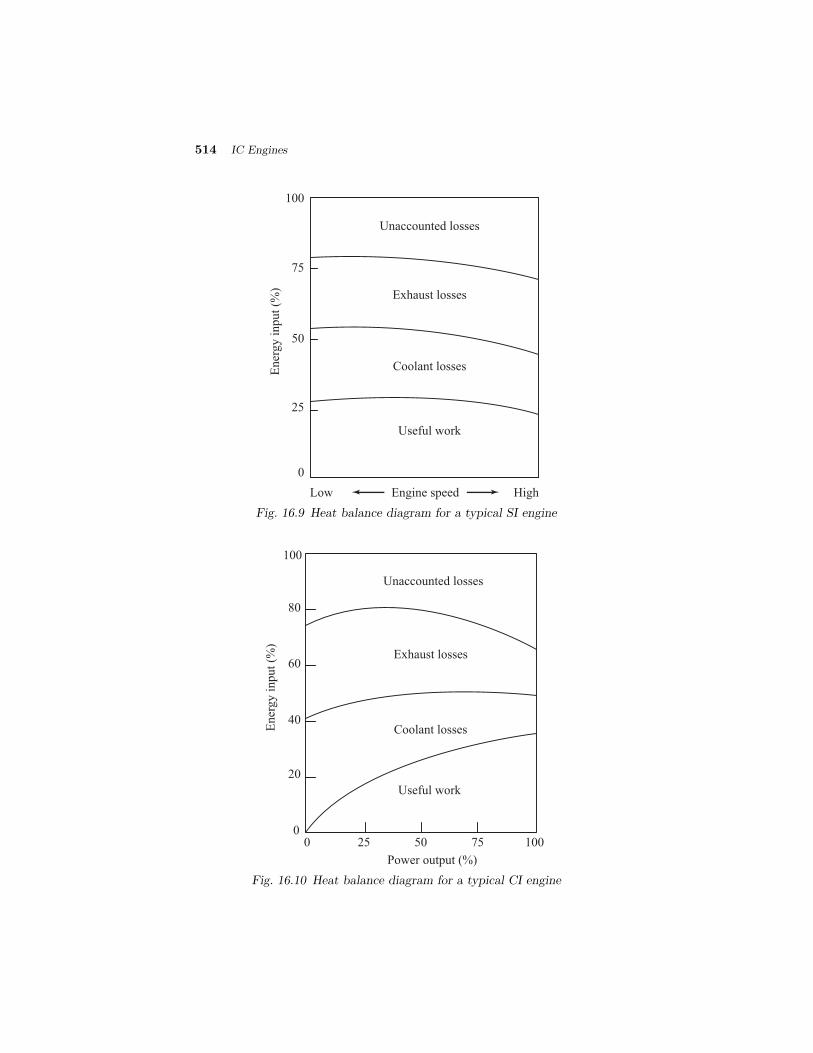
514 IC Engines
Useful work
Coolant losses
Exhaust losses
Unaccounted losses
Ener
gy i
nput
(%)
0
25
50
75
100
Low Engine speed High
Fig. 16.9 Heat balance diagram for a typical SI engine
Useful work
Coolant losses
Exhaust losses
Unaccounted losses
Ener
gy i
nput
(%)
0
20
40
60
100
80
0 25 50 75 100
Power output (%)
Fig. 16.10 Heat balance diagram for a typical CI engine

Performance Parameters and Characteristics 515
include blowdown and pumping losses and therefore it is not appropriate toput it in the heat balance. Since, there are always certain losses which cannotbe accounted for, by including fp in the heat balance, the unaccounted losseswill reduce.
The heat balance may be external or internal. Typical external heat bal-ance is shown in Fig.16.11.
Exhaust gasesFuel Air
Cooling water
Lubricating oil
Crankcase and wall radiationLubricating oil
Cooling water
Engine
Fig. 16.11 External heat balance
Usually the amount of heat carried by lubricating oil is comparativelysmall and are normally not included. A further method of representing heatbalance is by means of the Sankey diagram. This is a stream type diagram inwhich the width of the stream represents the heat quantity being considered,usually as a percentage of the heat supplied, as shown in Fig.16.12.
Coolant 35%
Loss 80%
65%
32%
Surrounding 12%
bp 20%
Heat from fuel 100%
Exhaust 33%
Fig. 16.12 Sankey diagram
It may be observed that the diagram starts at the bottom with a streamwidth which represents the heat input from the fuel which is 100% of the heat
516 IC Engines
input and is marked as such. Moving up the diagram, first the coolant lossstream is let off to the left.
The width of this stream represents the percentage loss to the coolant.Still higher the exhaust loss stream is let off to the left and finally the loss tothe surroundings appears. The loss streams finally meet a single loss streamas shown of the original vertical stream, only the brake power output streamis left at the top of the diagram. The figures on the diagram are percentagesof the heat supplied in the fuel. A more detailed diagram for a spark-ignitionengine is shown in Fig.16.13. In this case, actually the heat distribution ismuch more involved. During the suction or scavenging period the enteringfresh charge receives heat from the residual gases and from the cylinder walls.Part of the indicated work on the piston is transformed through friction intoheat, which goes mostly into the cooling medium but partly into the exhaustgases and lubricating oil and also is dissipated through the crankcase to thesurrounding air.
16.8 PERFORMANCE MAPS
For critical analysis the performance of an IC engine under all conditionsof load and speed is shown by a performance map. Figure 16.14 shows theperformance map of an automotive SI engine and Fig.16.15 the performancemap of a four-stroke prechamber CI engine. Figure 16.14 also includes atypical curve of bmep vs piston speed for level road operation in high gear.Note that these maps can be used for comparing different sized engines, asperformance parameters have been generalized by converting rpm into pistonspeed and power per unit piston area. Generally speaking, all the enginesshow a region of lowest specific fuel consumption (highest efficiency) at arelatively low piston speed with a relatively high bmep.
16.8.1 SI Engines
Constant Speed Line : Reduced bsfc is obtained by moving upward alongconstant speed line. Mixture enrichment at high load more than offsets in-crease in mechanical efficiency. Moving to lower bmeps, the bsfc increasesbecause of the reduced mechanical efficiency.
Constant bmep Line : Moving from the region of highest efficiency along aline of constant bmep, the bsfc increases due to increased friction at higherpiston speeds. Moving to the left towards lower piston speed, although frictionmep decreases, indicated efficiency falls off owing to poor fuel distribution andincreased heat losses.
16.8.2 CI Engines
In the CI engine the bsfc increases at high loads owing to the increased fuelwaste (smoke) associated with high fuel-air ratios. At lower load bsfc increasesdue to decrease in mechanical efficiency (same as in the SI engine).
As the speed is reduced from the point of best economy along a line ofconstant bmep, the product of mechanical and indicated thermal efficiency

Performance Parameters and Characteristics 517
Energy in exhaust
35%
Cooling water
30%
Total radiation
8%
Crankcase and
wall radiation
Energy in
unburnt products
Exhaust
manifold
Heat to mixture
from cylinder walls
Heat in
residual gases
Heat from
exhaust
Hea
ting v
alue
of
fres
h c
har
ge
100%
Ener
gy o
f m
ixtu
re
in t
he
cyli
nder
Ind
icat
ed
work
Heat from
cylinder walls
and pistons
Pumping
Exhaust ports
Mechanical losses
Shaft work 27%
Water jacket
radiation
Fig. 16.13 Sankey diagram for an SI engine
10
8
6
4
2
0
0 200 400 600 800 1000
Piston speed (m/min)
bm
ep (
bar
)
Full throttle
0.0
4
0.0
7
0.0
9
0.1
1
0.1
3
0.16
0.1
8
0.310.32
0.32
0.33
0.34
0.36
0.37
0.43
0.56
0.75
0.91 bsfc (kg/kW h)
Fig. 16.14 Generalized performance map of automotive SI engine

518 IC Engines
200 300 400 500 600 700 800
Piston speed (m/min)
10
8
6
4
2
0
bm
ep (
bar
)
0.42
0.38
0.34
0.24
0.22
0.04
0.07
0.11
Maximum indicated mep
0.15
Maximum brake mep
bsfc (kg/kWh)
Fig. 16.15 Performance map of a four-stroke prechamber diesel engine
appears to remain a constant down to the lowest operating speed. The reduc-tion in fmep with speed is apparently balanced by a reduction is indicatedthermal efficiency due to poor spray characteristics at very low speeds. Aninteresting feature of the performance curves is that they show the power atmaximum economy is about half of the maximum power.
16.9 ANALYTICAL METHOD OF PERFORMANCE ESTIMATION
Performance data of engine obtained from theoretical analysis are very usefulfor the design of a new engine. Due to complex nature of the processestaking place in an engine (such as combustion with variable specific heat anddissociation, mixing of different gases, heat transfer, etc.) the theoreticalcalculations are rather very difficult and some simplifying assumptions are tobe made. Therefore, results obtained from theoretical calculations must becompared with experimental results obtained from engine of similar design forvalidation. The theoretical results are accepted only when they are reasonablyclose to the experimental results.
The brake output of an engine depends on brake mean effective pres-sure, bmep, and the piston speed, sp. Brake mean effective pressure dependson indicated mean effective pressure, imep, and the frictional mean effectivepressure, fmep. When the speed of the engine changes from N1 to N2, thepiston speed changes from sp1 to sp2 and the brake output changes from bp1

Performance Parameters and Characteristics 519
to bp2. Now the ratio of bp2 to bp1 can be written as
bp2bp1
=imep2 − fmep2imep1 − fmep1
× sp2sp1
(16.19)
where bp1 and bp2 are the power output in kW at speeds N1 and N2 respec-tively.
The ratio of indicated mean effective pressure at N2 and N1 is given by
=imep2imep1
=ρin2ρin1
ηv2ηv1
(mfηith)2(mfηith)1
(16.20)
Dividing numerator and denominator on the right hand side of Eq.16.19 byimep1, we get
bp2bp1
=
imep2imep1
− fmep2fmep1
1− fmep1imep1
× sp2sp1
= − fmep2
imep1
1− fmep1imep1
× sp2sp1
(16.21)
From the above relation the power output at condition 2 (bp2 at mean effectivepressure, imep2 and speed, N2) can be obtained if the bp1 at imep1 and N1
are known. In order to determine the complete performance at condition 2,the brake specific fuel consumption at condition 2 should be determined. Thebrake specific fuel consumption, bsfc, which indicates the economy of theengine operation, is related to the indicated specific fuel consumption, isfcby the following relation:
bsfc =isfcbmepimep
=isfc
1− fmepimep
(16.22)
Therefore, the ratio of specific fuel consumption at condition 2 to that atcondition 1 is given by the following relation,
bsfc2bsfc1
=isfc2isfc1
1− fmep1
imep1
1− fmep2imep2
=isfc2isfc1
1−
fmep1imep1fmep2
×imep1
(16.23)
When engine speed is constant, power developed is proportional to bmep2 andtherefore, bp2 can be obtained from the relation
bp2bp1
=bmep2bmep1
=imep2 − fmep2imep1 − fmep1
(16.24)
For four-stroke cycle unsupercharged engine, the change in fmep with changein power output at constant speed is negligibly small.

520 IC Engines
Therefore, we can assume
fmep1 = fmep2 = fmep
Therefore, the ratio of brake outputs is given by
bp2bp1
=
imep2imep1
− fmepimep1
1− fmepimep1
= − fmep
imep1
1− fmepimep1
(16.25)
bsfc2bsfc1
=isfc2isfc1
1− fmep
imep1
1− fmepimep2
=isfc2isfc1
1− fmep
imep1
1− fmep ×imep1
(16.26)
Value of air capacity is given by the product of inlet density and volumetricefficiency (ρin × ηv) for a spark-ignition engine and it increases with increasein average piston speed and reaches a maximum value at a particular pistonspeed. The indicated thermal efficiency is nearly constant with increasingspeed if the fuel-air ratio and the spark timing are adjusted to best powercondition at each speed. Therefore, the ratio of indicated mean effective pres-sures, imep, is approximately equal to the ratio of air capacities at differentspeeds. The mean effective pressure, due to mechanical losses, fmep changeswith change in average piston speed. The variation of fmep with variation ofpiston speed for different designs of engine are obtained from motoring tests.The values of fmep1 and fmep2 are taken from the test data of similar engineat piston speeds sp1 and sp2. The air capacities and fmep at two conditionbeing known, the power output and brake specific fuel consumption at condi-tion 2 can be calculated (by Eqs.16.21 and 16.23. When the power output ofthe engine is decreased at a constant speed, the value of ρinηv decreases appre-ciably (resistance at inlet increases due to throttling). The indicated thermalefficiency, ηith, also decreases and the change in indicated thermal efficiencybeing known, the ratio of indicated mean effective pressures, can be calcu-lated. The power output and brake specific fuel consumption at condition 2can be calculated using Eqs.16.25 and 16.26.
When the speed of a compression-ignition engine increases the value of aircapacity ρinηv first increases and then decreases after reaching its maximumvalue. The indicated thermal efficiency ηith increases with increase in speed aslong as the fuel feed system operates satisfactorily and the air capacity remainssufficiently high. Therefore, the ratio of indicated mean effective pressures, increases with speed upto a particular value. The fmep also increases withspeed of the engine (average piston speed). The variation of fmep with pistonspeed is obtained from motoring tests. Knowing the value of and fmep2the power output and brake specific fuel consumption at condition 2 can becalculated.
When the power developed at a constant speed is reduced by decreasingthe amount of fuel injected the volumetric efficiency and indicated thermal

Performance Parameters and Characteristics 521
efficiency increases with decrease in power developed. Therefore, though thefuel-air ratio decreases, the net effect is an increase in the indicated meaneffective pressure. Therefore, the value of increases with decrease in loadat constant speed. The fmep at constant speed and varying power output(varying load) practically remains constant and knowing the value of outputand brake specific fuel consumption at condition 2 can be determined.
Other factors (except the speed and load of the engine) commonly affect-ing engine performance are the atmospheric conditions (pressure, temperatureand humidity), the fuel-air ratio and the compression ratio. The effects of vari-ation of these factors on the volumetric efficiency, indicated thermal efficiencyand mechanical efficiency within the range of speed and output of the enginehave been discussed in previous chapters.
If the fuel-air ratio is maintained nearly constant during change of inletconditions (other factors remain constant), the indicated thermal efficiencymay be assumed constant. Therefore, the indicated mean effective pressurewill depend on ρa × ηv. Under this condition, the volumetric efficiency isinversely proportional to
√T0 (pin = pex at all conditions). Therefore, ρa×ηv
is proportional to p0/T0 ×√
T0 or p0/√
T0. Therefore,
imep2imep1
=p02p01
T01T02
12
= (16.27)
Using this value of the performance of the engine at condition 2 can beobtained if their performance at rated condition is known.
The effect of altitude on engine performance is important when the engineoperates at different heights in mountainous region or for the aircraft engines.With change in altitude both the inlet pressure and temperature (also theexhaust pressure) change. Therefore, their performance using constant fuel-air ratio can be obtained as in the previous case.
Fuel-air ratio has a marked effect on the indicated thermal efficiency ofan engine. Its effect on volumetric efficiency, is however, small (may be ne-glected). Therefore,
imep2imep1
=(mf ηith)2(mf ηith)1
= (16.28)
when all other conditions remain the same but the fuel-air ratio of the charge ischanged. The performance at condition 2 can be obtained if the performanceat conditions 1 is known.
Compression ratio has significant effect on indicated thermal efficiency.Therefore, when the compression ratio is changed all other conditions of op-eration remaining the same, the ratio of indicated mean effective pressures isgiven by,
imep2imep1
=(ηith)2(ηith)1
= (16.29)
Worked out Examples
16.1 A four-stroke gas engine has a bore of 20 cm and stroke of 30 cm andruns at 300 rpm firing every cycle. If air-fuel ratio is 4:1 by volume and

522 IC Engines
volumetric efficiency on NTP basis is 80%, determine the volume of gasused per minute. If the calorific value of the gas is 8 MJ/m3 at NTPand the brake thermal efficiency is 25% determine the brake power ofthe engine.
Solution
Vs =π
4D2L =
π
4× 202 × 30 = 9424.8 cc
Total charge taken in per cycle
VC = 0.8× 9424.8 = 7.54× 10⁻³ m3
Volume of gas used per minute
Vg =7.54× 10⁻³
4 + 1× 300
2
= 0.2262 m3 at NTP/min
Heat input = 8000× 0.2262 = 1809.6 kJ/min
bp = ηbth × Heat input =0.25× 1809.6
60
= 7.54 kWAns⇐=
16.2 The following observations have been made from the test of a four-cylinder, two-stroke gasoline engine. Diameter = 10 cm; stroke = 15 cm;speed = 1600 rpm; Area of the positive loop of the indicator diagram =5.75 sq cm; Area of the negative loop of the indicator diagram = 0.25sq cm; Length of the indicator diagram = 55 mm; Spring constant =3.5 bar/cm; Find the indicated power of the engine.
Solution
Net area of diagram = 5.75− 0.25 = 5.5 cm2
Average height of the diagram =5.5
5.5= 1 cm
pim = Average height of the diagram× Spring constant
= 1× 3.5 = 3.5 bar
ip =pimLAnK
60000=
3.5× 105 × 0.15× π4 × 0.12 × 1600× 4
60000
= 43.98 kWAns⇐=

Performance Parameters and Characteristics 523
16.3 A single-cylinder engine running at 1800 rpm develops a torque of 8Nm. The indicated power of the engine is 1.8 kW. Find the loss due tofriction power as the percentage of brake power.
Solution
bp =2πNT
60000=
2× π × 1800× 8
60000= 1.508 kW
Friction power = 1.8− 1.508 = 0.292
Percentage loss =0.292
1.508× 100 = 19.36%
Ans⇐=
16.4 A gasoline engine working on Otto cycle consumes 8 litres of gasolineper hour and develops 25 kW. The specific gravity of gasoline is 0.75and its calorific value is 44000 kJ/kg. Determine the indicated thermalefficiency of the engine.
Solution
ηith =Heat equivalent of ip
Heat input
=25× 60× 60
(8× 10−3 × 750)× 44000× 100 = 34.1%
Ans⇐=
16.5 A four cylinder engine running at 1200 rpm delivers 20 kW. The averagetorque when one cylinder was cut is 110 Nm. Find the indicated thermalefficiency if the calorific value of the fuel is 43 MJ/kg and the engineuses 360 grams of gasoline per kW h.
Solution
Avg. bp for 3 cylinders =2πNT
60000=
2π × 1200× 110
60000= 13.82 kW
Avg. ip with 1 cylinder = 20− 13.82 = 6.18 kW
Total ip = 4× 6.18 = 24.72 kW
isfc = bsfc× bp
ip= 360× 20
24.72
= 291.26 g/kW h
Fuel consumption =isfc× ip
3600× 1000=
291.26× 24.72
3600× 1000
= 2× 10⁻³ kg/s

524 IC Engines
ηith =ip
mf × CV=
24.72
2× 10−3 × 43000× 100
= 28.74%Ans⇐=
16.6 The bore and stroke of a water-cooled, vertical, single-cylinder, four-stroke diesel engine are 80 mm and 110 mm respectively and the torqueis 23.5 Nm. Calculate the brake mean effective pressure of the engine.
Solution
P =2πNT
60000=
pbmLAn
60000
pbm =2πNT
LAn=
2πNT
L× π4 ×D2N
2
=16T
D2L
=16× 23.5
0.082 × 0.11= 5.34× 10⁵ Pa = 5.34 bar
Ans⇐=
16.7 Find the mean effective pressure and torque developed by the engine inthe previous problem if its rating are 4 kW at 1500 rpm.
Solution
pbm =P × 60000π4D
2LN2
× 10−5 bar
=4× 60000
π4 × 0.082 × 0.11× 1500
2
× 10−5 = 5.78 barAns⇐=
T =P × 60000
2πN=
4× 60000
2× π × 1500= 25.46 Nm
Ans⇐=
16.8 Find the brake specific fuel consumption in kg/kW h of a diesel enginewhose fuel consumption is 5 grams per second when the power outputis 80 kW. If the mechanical efficiency is 75%, calculate the indicatedspecific fuel consumption.
Solution
bsfc =mf
bp=
5
80= 0.0625 g/kW s
=0.0625
1000× 3600 = 0.225 kg/kW h
Ans⇐=
isfc = bsfc× ηm0.225× 0.75 = 0.169 kg/kW hAns⇐=
Performance Parameters and Characteristics 525
16.9 For engine in the previous problem find the brake specific energy con-sumption, bsec, given the fuel consumption 5.55 g/s and the lower heat-ing value of the fuel as 43 MJ/kg. Find also the indicated specific energyconsumption.
Solution
bsec =kW heat input
kW work output=
CV × mf
P= CV × bsfc
bsfc =5.55
80= 0.069 g/kW s = 0.069× 10⁻³ kg/kW s
CV = 43 MJ/kg = 43× 103 kJ/kg
bsec = bsfc× CV = 43× 103 × 0.069× 10−3 = 2.97Ans⇐=
isec = bsec× ηm = 2.97× 0.75 = 2.23Ans⇐=
16.10 Find the air-fuel ratio of a four-stroke, single-cylinder, air-cooled enginewith fuel consumption time for 10 cc is 20.4 s and air consumption timefor 0.1 m3 is 16.3 s. The load is 17 kg at the speed of 3000 rpm.Find also brake specific fuel consumption in g/kW h and brake thermalefficiency. Assume the density of air as 1.175 kg/m3 and specific gravityof fuel to be 0.7. The lower heating value of fuel is 43 MJ/kg and thedynamometer constant is 5000.
Solution
Air consumption =0.1
16.3× 1.175 = 7.21× 10⁻³ kg/s
Fuel consumption =10
20.4× 0.7× 1
1000= 0.343× 10⁻³ kg/s
Air-fuel ratio =7.21× 10⁻³
0.343× 10−3= 21
Ans⇐=
Power output, P =WN
5000=
7× 3000
5000= 4.2 kW
bsfc =Fuel consumption (g/h)
Power output
=0.343× 10−3 × 3600× 1000
4.2
= 294 g/kW hAns⇐=
ηbth =4.2
0.343× 10−3 × 43000× 100 = 28.48%
Ans⇐=

526 IC Engines
16.11 A six-cylinder, gasoline engine operates on the four-stroke cycle. Thebore of each cylinder is 80 mm and the stroke 100 mm. The clearancevolume per cylinder is 70 cc. At a speed of 4000 rpm the fuel consump-tion is 20 kg/h and the torque developed is 150 Nm. Calculate (i) thebrake power (ii) the brake mean effective pressure (iii) brake thermalefficiency if the calorific value of the fuel is 43000 kJ/kg and (iv) therelative efficiency on a brake power basis assuming the engine works onthe constant volume cycle. γ = 1.4 for air.
Solution
bp =2πNT
60000=
2× π × 4000× 150
60000= 62.8 kW
Ans⇐=
pbm =bp× 60000
LAnK=
62.8× 60000
0.1× π4 × 0.082 × 4000
2 × 6
= 6.25× 10⁵ Pa = 6.25 barAns⇐=
ηbth =bp
mf × CV=
62.8× 3600
20× 43000× 100 = 26.3%
Ans⇐=
r =Vs + Vcl
Vcl
Vs =π
4D2L =
π
4× 82 × 10 = 502.65 cc
r =502.65 + 70
70= 8.18
ηOtto = 1− 1
8.180.4= 0.568
ηrel =0.263
0.568× 100 = 46.3%
Ans⇐=
16.12 An eight-cylinder, four-stroke engine of 9 cm bore and 8 cm stroke witha compression ratio of 7 is tested at 4500 rpm on a dynamometer whichhas 54 cm arm. During a 10 minutes test the dynamometer scale beamreading was 42 kg and the engine consumed 4.4 kg of gasoline havinga calorific value of 44000 kJ/kg. Air 27 ◦C and 1 bar was suppliedto the carburettor at the rate of 6 kg/min. Find (i) the brake powerdelivered (ii) the brake mean effective pressure (iii) the brake specificfuel consumption (iv) the brake specific air consumption (v) the brakethermal efficiency (vi) the volumetric efficiency and (vii) the air-fuelratio.
Solution
bp =2πNT
60000
Performance Parameters and Characteristics 527
=2× π × 4500× 42× 0.54× 9.81
60000= 104.8 kW
Ans⇐=
bmep =bp× 60000
LAnK=
104.8× 60000
0.08× π4 × 0.092 × 4500
2 × 8
= 6.87× 10⁵ Pa = 6.87 barAns⇐=
bsfc =4.410 × 60
104.8= 0.252 kg/kW h
Ans⇐=
bsac =6× 60
104.8= 3.435 kg/kW h
Ans⇐=
ηbth =bp
mf × CV=
104.9× 604.410 × 44000
× 100 = 32.5%Ans⇐=
Volume flow rate of air at intake condition
Va =maRT
p=
6× 287× 300
1× 105= 5.17 m3/min
Vs =π
4D2LnK =
π
4× 0.092 × 0.08× 4500
2× 8 = 9.16 m3/min
ηv =5.17
9.16× 100 = 56.44%
Ans⇐=
A/F =6.0
0.44= 13.64
Ans⇐=
16.13 The following details were noted in a test on a four-cylinder, four-strokeengine, diameter = 100 mm; stroke = 120 mm; speed of the engine =1600 rpm; fuel consumption = 0.2 kg/min; calorific value of fuel is 44000kJ/kg; difference in tension on either side of the brake pulley = 40 kg;brake circumference is 300 cm. If the mechanical efficiency is 80%, cal-culate (i) brake thermal efficiency (ii) indicated thermal efficiency (iii)indicated mean effective pressure and (iv) brake specific fuel consump-tion
Solution
bp =2πNT
60000=
2πNWR
60000=
WN2πR
60000
=40× 9.81× 1600× 3
60000= 31.39 kW
ηbth =bp
mf × CV× 100 =
31.39× 60
0.2× 44000× 100 = 21.40%
Ans⇐=
ηith =ηbthηm
× 100 =0.214
0.80× 100 = 26.75%
Ans⇐=

528 IC Engines
imep =
bpηm× 60000
LAnK=
31.390.8 × 60000
0.12× π4 0.12 × 1600
2 × 4
= 7.8× 10⁵ Pa = 7.8 barAns⇐=
bsfc =mf
bp=
0.2× 60
31.39= 0.382 kg/kW h
Ans⇐=
16.14 The air flow to a four cylinder, four-stroke oil engine is measured bymeans of a 5 cm diameter orifice having a coefficient of discharge of 0.6.During a test on the engine the following data were recorded : bore =10 cm; stroke = 12 cm; speed = 1200 rpm; brake torque = 120 Nm;fuel consumption = 5 kg/h; calorific value of fuel = 42 MJ/kg; pressuredrop across orifice is 4.6 cm of water; ambient temperature and pressureare 17 ◦C and 1 bar respectively. Calculate (i) the thermal efficiency onbrake power basis; (ii) the brake mean effective pressure and (iii) thevolumetric efficiency based on free air condition.
Solution
bp =2πNT
60000=
2× π × 1200× 120
60000= 15.08 kW
ηbth =15.08× 60560 × 42000
× 100 = 25.85%Ans⇐=
pim =bp× 60000
LAnK
=15.08× 60000
0.12× π4 × 0.12 × 1200
2 × 4= 4× 10⁵ Pa = 4 bar
Ans⇐=
Va = CdA
!2gΔhw
ρwρa
ρa =p
RT=
105
287× 290= 1.20 kg/m
3
Va = 0.6× π
4× 0.052 ×
!2× 9.81× 0.046× 1000
1.2× 60
= 1.938 m3/min
Vs =π
4d2LnK
=π
4× 0.12 × 0.12× 1200
2× 4 = 2.262 m3/min
ηv =1.938
2.262× 100 = 85.7%
Ans⇐=

Performance Parameters and Characteristics 529
16.15 The following observations were recorded during a trial of a four-stroke,single-cylinder oil engine. Duration of trial is 30 min; oil consumption is4 litres; calorific value of the oil is 43 MJ/kg; specific gravity of the fuel= 0.8; average area of the indicator diagram = 8.5 cm2; Length of theindicator diagram = 8.5 cm; spring constant = 5.5 bar/cm; brake load= 150 kg; spring balance reading = 20 kg; effective brake wheel diame-ter = 1.5 m; speed = 200 rpm; cylinder diameter = 30 cm; stroke = 45cm; jacket cooling water = 10 kg/min; temperature rise is 36 ◦C. Calcu-late (i) indicated power (ii) brake power (iii) mechanical efficiency (iv)brake specific fuel consumption in kg/kW h and (v) indicated thermalefficiency.
Solution
pim =Area of the diagram
Length of the diagram× Spring const.
=8.5
8.5× 5.5 = 5.5 bar
ip =pimLAn
60000
=5.5× 105 × 0.45× π
4 × 0.32 × 2002
60000
= 29.16 kWAns⇐=
bp =2πNWR
60000=
πNWd
60000
=π × 200× (150− 20)× 9.81× 1.5
60000
= 20.03 kWAns⇐=
ηm =20.03
29.16× 100 = 68.7%
Ans⇐=
mf =4
30× 60× 10−3 × 800 = 6.4 kg/h
bsfc =6.4
20.03= 0.3195 kg/kW h
Ans⇐=
ηith =ip
mf × CV=
29.16× 3600
6.4× 43000× 100 = 38.14%
Ans⇐=
16.16 A four-stroke cycle gas engine has a bore of 20 cm and a stroke of 40cm. The compression ratio is 6. In a test on the engine the indicatedmean effective pressure is 5 bar, the air to gas ratio is 6:1 and thecalorific value of the gas is 12 MJ/m3 at NTP. At the beginning of
530 IC Engines
the compression stroke the temperature is 77 ◦C and pressure 0.98 bar.Neglecting residual gases, determine the indicated power, the thermalefficiency and the relative efficiency of the engine at 250 rpm.
Solution
Vs =π
4D2L =
π
4× 202 × 40 = 12566.4 cc
Volume of gas in the cylinder
=1
1 + A/F× V1
V1 = Vs +Vs
r − 1= Vs × 6
5=
1
6 + 1× 12566.4× 6
5
= 2154.24 cc/cycle
Since the residual gases are to be neglected, one can assume a volumetricefficiency of 100%
Normal pressure = 1 bar pV
T
NTP
=
p2V2T2
working
Volume of gas at NTP conditions
= 2154.24× 0.98
1× 273
350= 1646.7 cc
Heat added = 1646.7× 10−6 × 12× 103 = 19.76 kJ/cycle
ip =pimVsn
60000=
5× 105 × 12566.4× 10−6 × 2502
60000
= 13.09 kWAns⇐=
ηith =ip
Heat added (in kW)× 100 =
13.09
19.76× 2502×60
× 100
= 31.8%Ans⇐=
ηair−std = 1− 1
60.4= 0.512
ηrel =0.318
0.512× 100 = 62.11%
Ans⇐=
16.17 A four-stroke, four-cylinder gasoline engine has a bore of 60 mm and astroke of 100 mm. On test it develops a torque of 66.5 Nm when running

Performance Parameters and Characteristics 531
at 3000 rpm. If the clearance volume in each cylinder is 60 cc the relativeefficiency with respect to brake thermal efficiency is 0.5 and the calorificvalue of the fuel is 42 MJ/kg, determine the fuel consumption in kg/hand the brake mean effective pressure.
Solution
Vs =π
4× 0.062 × 0.1 = 2.83× 10⁻⁴ m3/cylinder
= 283 cc/cylinder
r =283 + 60
60= 5.71
ηair−std = 1− 1
5.710.4= 0.50
ηbth = Relative η ×Air-standard η = 0.5× 0.5 = 0.25
bp =2× π × 3000× 66.5
60000= 20.89 kW
Heat supplied =20.89
0.25= 83.56 kJ/s
Fuel consumption =83.56× 3600
42000= 7.16 kg/h
Ans⇐=
pbm =P × 60000
VsnK=
20.89× 60000
2.83× 10−4 × 30002 × 4
= 7.38× 10⁵ N/m2
= 7.38 barAns⇐=
16.18 The power output of a six cylinder four-stroke engine is absorbed bya water brake for which the law is WN/20000 where the brake load,W is in Newton and the speed, N is in rpm. The air consumption ismeasured by an air box with sharp edged orifice system. The followingreadings are obtained.
Orifice diameter = 30 mmBore = 100 mmStroke = 120 mmBrake load = 560 NC/H ratio by mass = 83/17Coefficient of discharge = 0.6Ambient pressure = 1 barPressure drop across orifice = 14.5 cm of HgTime taken for 100 cc of fuel consumption = 20 sAmbient temperature = 27 ◦CFuel density = 831 kg/m3

532 IC Engines
Calculate (i) the brake power (ii) the torque (iii) the brake specific fuelconsumption (iv) the percentage of excess air and (v) the volumetricefficiency
Solution
ρa =p
RT=
1× 10⁵
287× 300= 1.16 kg/m
3
Va = CdA
!2gΔHg
ρHg
ρa
= 0.6× π
4× 0.032 ×
!2× 9.81× 0.145× 13600
1.16
= 0.077 m3/s
Vs =π
4× 0.12 × 0.12× 2400
2× 6
60
= 0.113 m3/s
ηv =0.077
0.113× 100 = 68.1%
Ans⇐=
bp =WN
20000=
560× 2400
20000= 67.2 kW
Ans⇐=
bmep =bp× 60000
LAnK
=67.2× 60000× 10−5
0.12× π4 × 0.12 × 2400
2 × 6= 5.94 bar
T =bp× 60000
2πN
=67.2× 60000
2× π × 2400= 267.3 Nm
Ans⇐=
mf =100
20× 10−6 × 831× 3600 = 14.96 kg/h
bsfc =14.96
67.2= 0.223 kg/kW h
Ans⇐=
O2 required/kg of fuel = 0.83× 32
12+ 0.17× 8
1
= 3.57 kg/kg of fuel
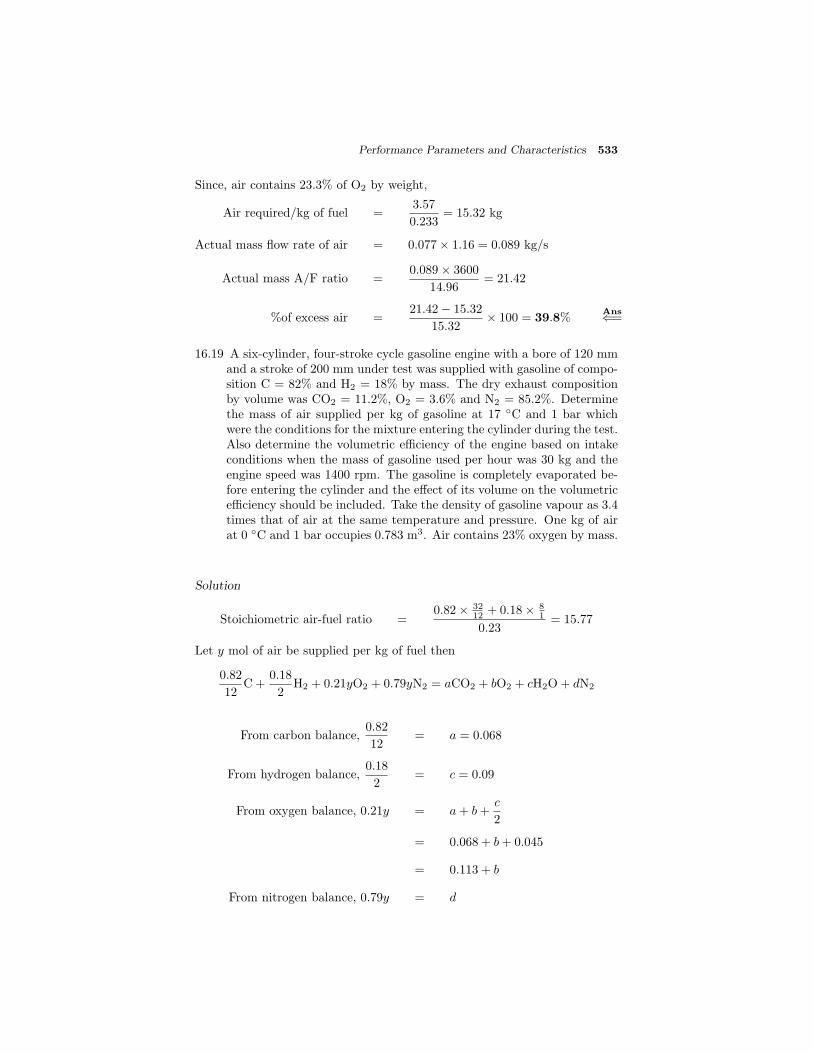
Performance Parameters and Characteristics 533
Since, air contains 23.3% of O2 by weight,
Air required/kg of fuel =3.57
0.233= 15.32 kg
Actual mass flow rate of air = 0.077× 1.16 = 0.089 kg/s
Actual mass A/F ratio =0.089× 3600
14.96= 21.42
%of excess air =21.42− 15.32
15.32× 100 = 39.8%
Ans⇐=
16.19 A six-cylinder, four-stroke cycle gasoline engine with a bore of 120 mmand a stroke of 200 mm under test was supplied with gasoline of compo-sition C = 82% and H2 = 18% by mass. The dry exhaust compositionby volume was CO2 = 11.2%, O2 = 3.6% and N2 = 85.2%. Determinethe mass of air supplied per kg of gasoline at 17 ◦C and 1 bar whichwere the conditions for the mixture entering the cylinder during the test.Also determine the volumetric efficiency of the engine based on intakeconditions when the mass of gasoline used per hour was 30 kg and theengine speed was 1400 rpm. The gasoline is completely evaporated be-fore entering the cylinder and the effect of its volume on the volumetricefficiency should be included. Take the density of gasoline vapour as 3.4times that of air at the same temperature and pressure. One kg of airat 0 ◦C and 1 bar occupies 0.783 m3. Air contains 23% oxygen by mass.
Solution
Stoichiometric air-fuel ratio =0.82× 32
12 + 0.18× 81
0.23= 15.77
Let y mol of air be supplied per kg of fuel then
0.82
12C +
0.18
2H2 + 0.21yO2 + 0.79yN2 = aCO2 + bO2 + cH2O + dN2
From carbon balance,0.82
12= a = 0.068
From hydrogen balance,0.18
2= c = 0.09
From oxygen balance, 0.21y = a + b +c
2
= 0.068 + b + 0.045
= 0.113 + b
From nitrogen balance, 0.79y = d

534 IC Engines
From exhaust gas analysis.0.068
d=
11.2
85.2
d =85.2
11.2× 0.068 = 0.517
0.79y = 0.517
y = 0.655 mol of air/kg of fuel
Molecular wt of air = 0.23× 32 + 0.77× 28
= 28.92 kg/mol
Actual air-fuel ratio = 0.655× 28.92
= 18.94Ans⇐=
% excess air =18.94− 15.77
15.77× 100
= 20.1%
Volume of air = Va ×m
Va = 0.783× 290
273= 0.832 m3/kg
= 0.832× 18.94 = 15.76 m3
Volume of fuel = Vf ×m
=0.832
3.4× 1 = 0.245 m3
Total volume = 15.76 + 0.245
= 16.005 m3/kg of fuel
Mixture evaporated =16.005× 30
60= 8.002 m3/min
Vs/min = 6× π
4× 0.122 × 0.20× 1400
2
= 9.5 m3/min
ηv =8.002
9.5× 100 = 84.2%
Ans⇐=
16.20 An indicator diagram taken from a single-cylinder, four-stroke CI enginehas a length of 100 mm and an area of 2000 mm2. The indicator pointerdeflects a distance of 10 mm for pressure increment of 2 bar in thecylinder. If the bore and stroke of the engine cylinder are both 100 mm
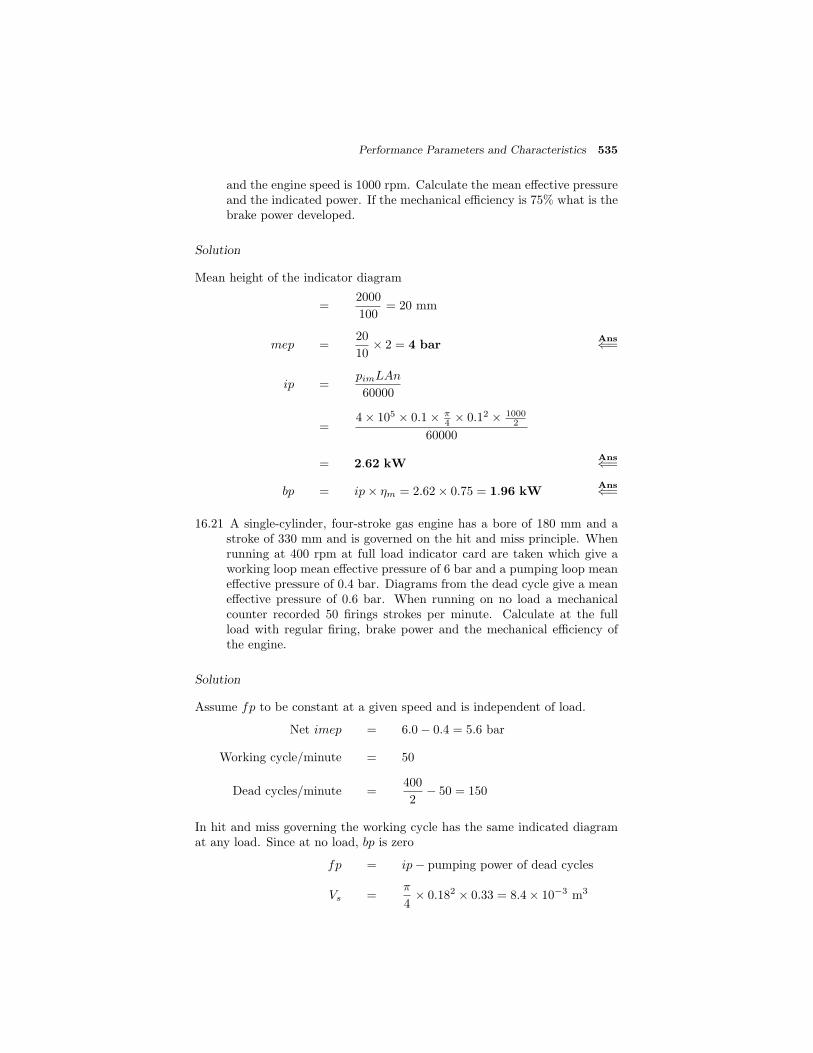
Performance Parameters and Characteristics 535
and the engine speed is 1000 rpm. Calculate the mean effective pressureand the indicated power. If the mechanical efficiency is 75% what is thebrake power developed.
Solution
Mean height of the indicator diagram
=2000
100= 20 mm
mep =20
10× 2 = 4 bar
Ans⇐=
ip =pimLAn
60000
=4× 105 × 0.1× π
4 × 0.12 × 10002
60000
= 2.62 kWAns⇐=
bp = ip× ηm = 2.62× 0.75 = 1.96 kWAns⇐=
16.21 A single-cylinder, four-stroke gas engine has a bore of 180 mm and astroke of 330 mm and is governed on the hit and miss principle. Whenrunning at 400 rpm at full load indicator card are taken which give aworking loop mean effective pressure of 6 bar and a pumping loop meaneffective pressure of 0.4 bar. Diagrams from the dead cycle give a meaneffective pressure of 0.6 bar. When running on no load a mechanicalcounter recorded 50 firings strokes per minute. Calculate at the fullload with regular firing, brake power and the mechanical efficiency ofthe engine.
Solution
Assume fp to be constant at a given speed and is independent of load.
Net imep = 6.0− 0.4 = 5.6 bar
Working cycle/minute = 50
Dead cycles/minute =400
2− 50 = 150
In hit and miss governing the working cycle has the same indicated diagramat any load. Since at no load, bp is zero
fp = ip− pumping power of dead cycles
Vs =π
4× 0.182 × 0.33 = 8.4× 10⁻³ m3

536 IC Engines
fp =pim × Vs × n
60000− pfm × Vs × n
60000
=5.6× 105 × 8.4× 10−3 × 50
60000−
0.6× 105 × 8.4× 10−3 × 150
60000
= 3.92− 1.26 = 2.66
At full load, with regular firing (n = 400/2) per minute
ip =pimLAn
60000
=5.6× 105 × 8.4× 10−3 × 400
2
60000
= 15.68 kW
bp = 15.68− 2.66 = 13.02 kWAns⇐=
ηmech =13.02
15.68× 100 = 83.03%
Ans⇐=
16.22 A six-cylinder, four-stroke, direct-injection oil engine is to deliver 120kW at 1600 rpm. The fuel to be used has a calorific value of 43 MJ/kgand its percentage composition by mass is carbon 86.0%, hydrogen13.0%, non combustibles 1.0%. The absolute volumetric efficiency isassumed to 80%, the indicated thermal efficiency 40% and the mechan-ical efficiency 80%. The air consumption to be 110% in excess of thatrequired for theoretically correct combustion.
(i) Estimate the volumetric composition of dry exhaust gas
(ii) Determine the bore and stroke of the engine, taking a stroke tobore ratio as 1.5.
Assume the volume of 1 kg of air at the given conditions as 0.77 m3.Oxygen in air is 23% by mass and 21% by volume.
Solution
Stoichiometric air-fuel ratio =0.86× 32
12 + 0.13× 81
0.23
= 14.49
A/F =
1 +
110
100
× 14.49 = 30.43
Mol wt of air = 0.23× 32 + 0.769× 28
= 28.9 kg/K molAns⇐=

Performance Parameters and Characteristics 537
Let y mol of air be supplied per kg of fuel and the equation of combustion perkg of fuel is
0.86
12C +
0.14
2H2 + 0.21yO2 + 0.79yN2 = aCO2 + bH2O + cO2 + dN2
From carbon balance,0.86
12= a = 0.0717
From hydrogen balance,0.13
2= b = 0.065
From oxygen balance, 0.21y = a +b
2+ c = 0.0717 + 0.0325 + c
= 0.1042 + c
Number of kilo moles of air for per kg of fuel
30.43
28.9= 1.05 = y
0.21× 1.05 = 0.1042 + c
c = 0.116
From nitrogen balance, 0.79y = d
d = 0.79× 1.05 = 0.8295
Volumetric composition of dry exhaust gasAns⇐=
Constituent mols % VolCO2 0.0717 7.05O2 0.1160 11.40N2 0.8295 81.55Total 1.0172 100.00
ip =bp
ηm=
120
0.8= 150 kW
Heat input =Heat equivalent of ip
ηith
=150× 60
0.40= 22500 kJ/min
mf =22500
43000= 0.523 kg/min
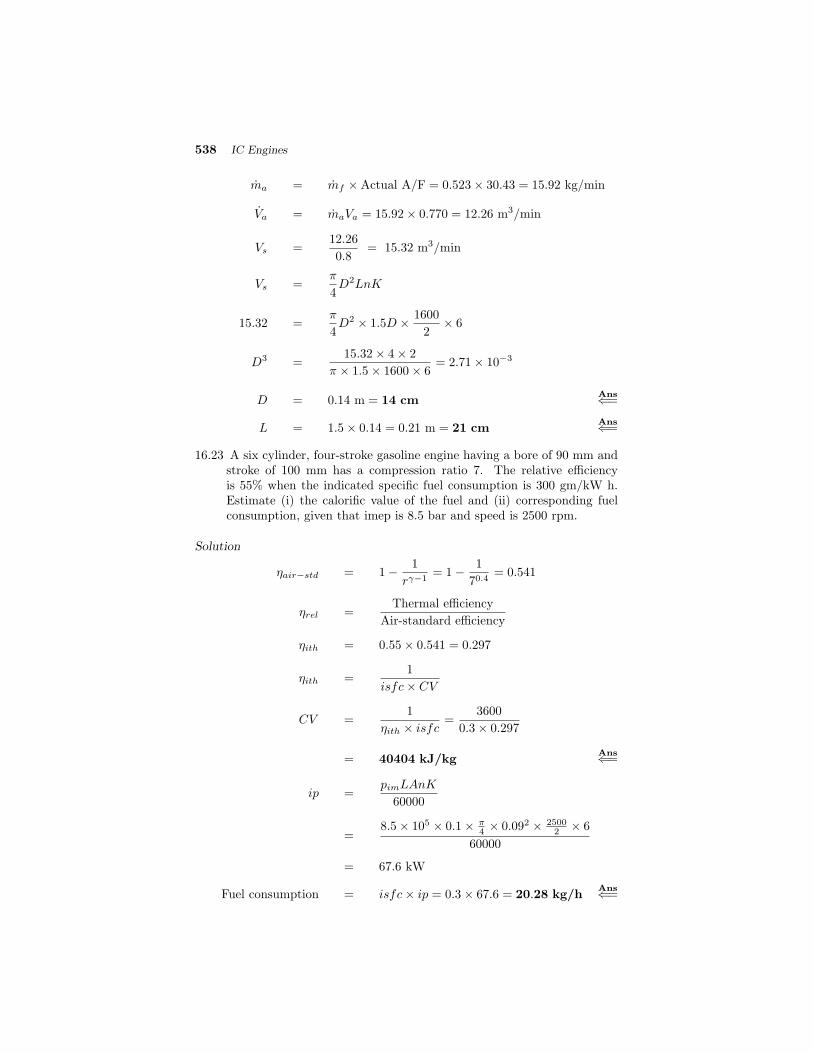
538 IC Engines
ma = mf ×Actual A/F = 0.523× 30.43 = 15.92 kg/min
Va = maVa = 15.92× 0.770 = 12.26 m3/min
Vs =12.26
0.8= 15.32 m3/min
Vs =π
4D2LnK
15.32 =π
4D2 × 1.5D × 1600
2× 6
D3 =15.32× 4× 2
π × 1.5× 1600× 6= 2.71× 10⁻³
D = 0.14 m = 14 cmAns⇐=
L = 1.5× 0.14 = 0.21 m = 21 cmAns⇐=
16.23 A six cylinder, four-stroke gasoline engine having a bore of 90 mm andstroke of 100 mm has a compression ratio 7. The relative efficiencyis 55% when the indicated specific fuel consumption is 300 gm/kW h.Estimate (i) the calorific value of the fuel and (ii) corresponding fuelconsumption, given that imep is 8.5 bar and speed is 2500 rpm.
Solution
ηair−std = 1− 1
rγ−1= 1− 1
70.4= 0.541
ηrel =Thermal efficiency
Air-standard efficiency
ηith = 0.55× 0.541 = 0.297
ηith =1
isfc× CV
CV =1
ηith × isfc=
3600
0.3× 0.297
= 40404 kJ/kgAns⇐=
ip =pimLAnK
60000
=8.5× 105 × 0.1× π
4 × 0.092 × 25002 × 6
60000
= 67.6 kW
Fuel consumption = isfc× ip = 0.3× 67.6 = 20.28 kg/hAns⇐=
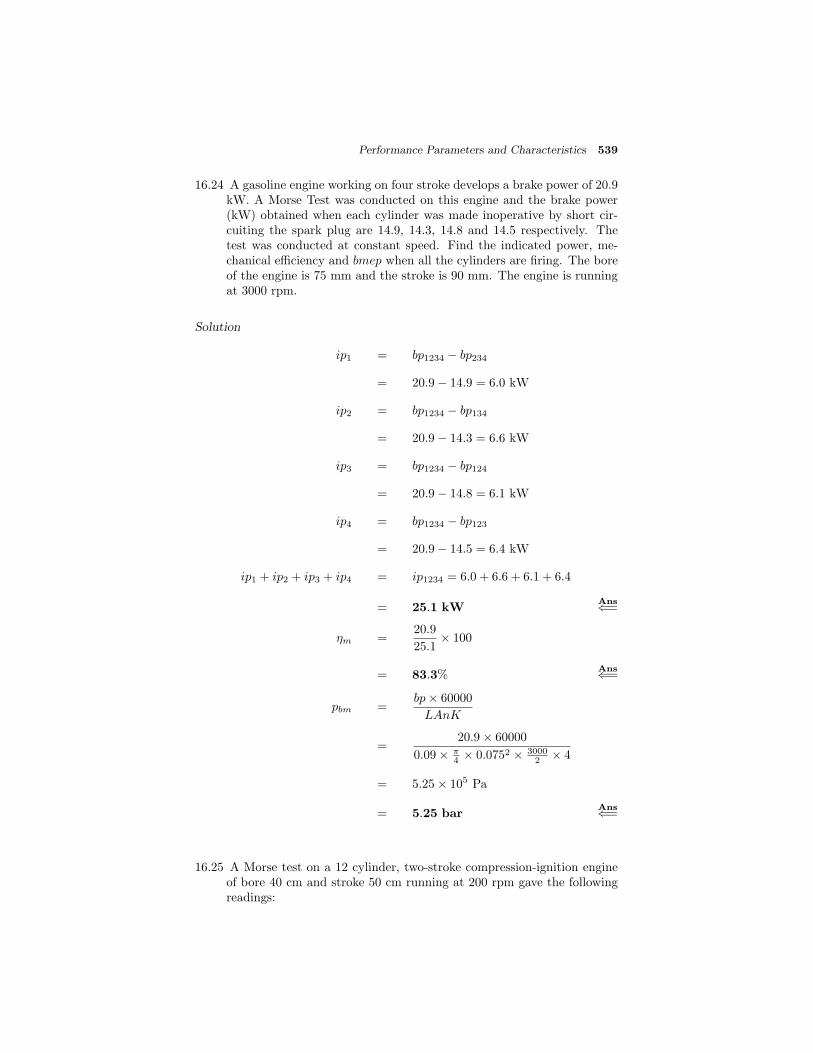
Performance Parameters and Characteristics 539
16.24 A gasoline engine working on four stroke develops a brake power of 20.9kW. A Morse Test was conducted on this engine and the brake power(kW) obtained when each cylinder was made inoperative by short cir-cuiting the spark plug are 14.9, 14.3, 14.8 and 14.5 respectively. Thetest was conducted at constant speed. Find the indicated power, me-chanical efficiency and bmep when all the cylinders are firing. The boreof the engine is 75 mm and the stroke is 90 mm. The engine is runningat 3000 rpm.
Solution
ip1 = bp1234 − bp234
= 20.9− 14.9 = 6.0 kW
ip2 = bp1234 − bp134
= 20.9− 14.3 = 6.6 kW
ip3 = bp1234 − bp124
= 20.9− 14.8 = 6.1 kW
ip4 = bp1234 − bp123
= 20.9− 14.5 = 6.4 kW
ip1 + ip2 + ip3 + ip4 = ip1234 = 6.0 + 6.6 + 6.1 + 6.4
= 25.1 kWAns⇐=
ηm =20.9
25.1× 100
= 83.3%Ans⇐=
pbm =bp× 60000
LAnK
=20.9× 60000
0.09× π4 × 0.0752 × 3000
2 × 4
= 5.25× 10⁵ Pa
= 5.25 barAns⇐=
16.25 A Morse test on a 12 cylinder, two-stroke compression-ignition engineof bore 40 cm and stroke 50 cm running at 200 rpm gave the followingreadings:
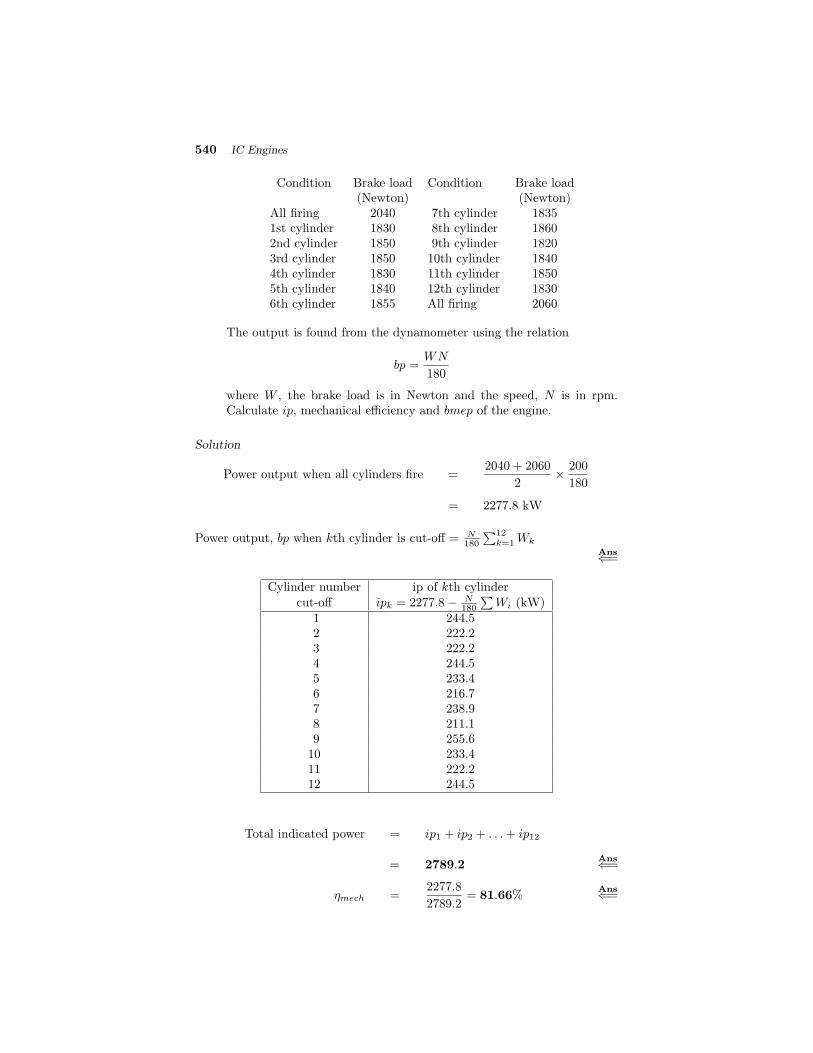
540 IC Engines
Condition Brake load Condition Brake load(Newton) (Newton)
All firing 2040 7th cylinder 18351st cylinder 1830 8th cylinder 18602nd cylinder 1850 9th cylinder 18203rd cylinder 1850 10th cylinder 18404th cylinder 1830 11th cylinder 18505th cylinder 1840 12th cylinder 18306th cylinder 1855 All firing 2060
The output is found from the dynamometer using the relation
bp =WN
180
where W , the brake load is in Newton and the speed, N is in rpm.Calculate ip, mechanical efficiency and bmep of the engine.
Solution
Power output when all cylinders fire =2040 + 2060
2× 200
180
= 2277.8 kW
Power output, bp when kth cylinder is cut-off = N180
#12k=1 Wk
Ans⇐=
Cylinder number ip of kth cylindercut-off ipk = 2277.8− N
180
#Wi (kW)
1 244.52 222.23 222.24 244.55 233.46 216.77 238.98 211.19 255.6
10 233.411 222.212 244.5
Total indicated power = ip1 + ip2 + . . . + ip12
= 2789.2Ans⇐=
ηmech =2277.8
2789.2= 81.66%
Ans⇐=

Performance Parameters and Characteristics 541
bmep =bp× 60000
LAnK
=2277.8× 60000
0.5× π4 × 0.42 × 200× 12
= 9.06× 10⁵ Pa = 9.06 barAns⇐=
16.26 The observations recorded after the conduct of a retardation test on asingle-cylinder diesel engine are as follows:
Rated power : 8 kW Rated speed : 475 rpm
Drop inTime for fall of Time for fall of
S.No.speed (rpm)
speed at speed atno load, t2 (s) 50% load, t3 (s)
1. 475 → 400 7.0 2.22. 475 → 350 10.6 3.73. 475 → 325 12.5 4.84. 475 → 300 15.0 5.45. 475 → 275 16.6 6.56. 475 → 250 18.9 7.2
Calculate frictional power and mechanical efficiency.
Solution
First draw a graph of drop in speed versus time taken for the drop.
0 10 20 30
0
100
200
300
Time (s)
Dro
p i
n s
pee
d (
rpm
)
50%
load
No
load
8.3
3.4
t3
t2
P =2πNT
60000kW

542 IC Engines
Full load torque, T =P × 60000
2πN
=8× 60000
2× π × 475= 160.8 Nm
Torque at half load, T 12
= 80.4 Nm
From the graph, time for the fall of 100 rpm at no load, t2 = 8.3 s and timefor the fall of same 100 rpm at half load, t3 = 3.4 s.
Tf =t3
t2 − t3T 12
=
3.4
8.3− 3.4
× 80.4 = 55.8 Nm
fp =2πNTf
60000
=2× π × 475× 55.8
60000= 2.77 kW
Ans⇐=
ηm =bp
bp + fp=
8
8 + 2.77× 100
= 74.28%Ans⇐=
16.27 A single-cylinder gas engine, with bore x stroke of 25 x 50 cm andrunning at 240 rpm fires 100 times per min. The quantity of coal gasused is 0.3 m3 per minute at 100 cm of water (gauge) (barometer pressure1 bar) at 17 ◦C while the amount of air used is 3 kg/min. Assumingthat an extra volume of air is taken in during a missed cycle equal tothat of a coal gas normally taken in, if both are measured at NTP, find(i) the charge of air per working cycle as measured at NTP and (ii) thevolumetric efficiency. Assume 760 mm of Hg as 1 bar.
Solution
Gas pressure = 1 +100
13.6× 1
76
= 1.097 bar
Volume of coal gas at NTP = 0.3× 1.097
1× 273
290
= 0.31 m3/min
Volume of coal gas used/explosion =0.31
100
= 0.0031 m3 at NTP
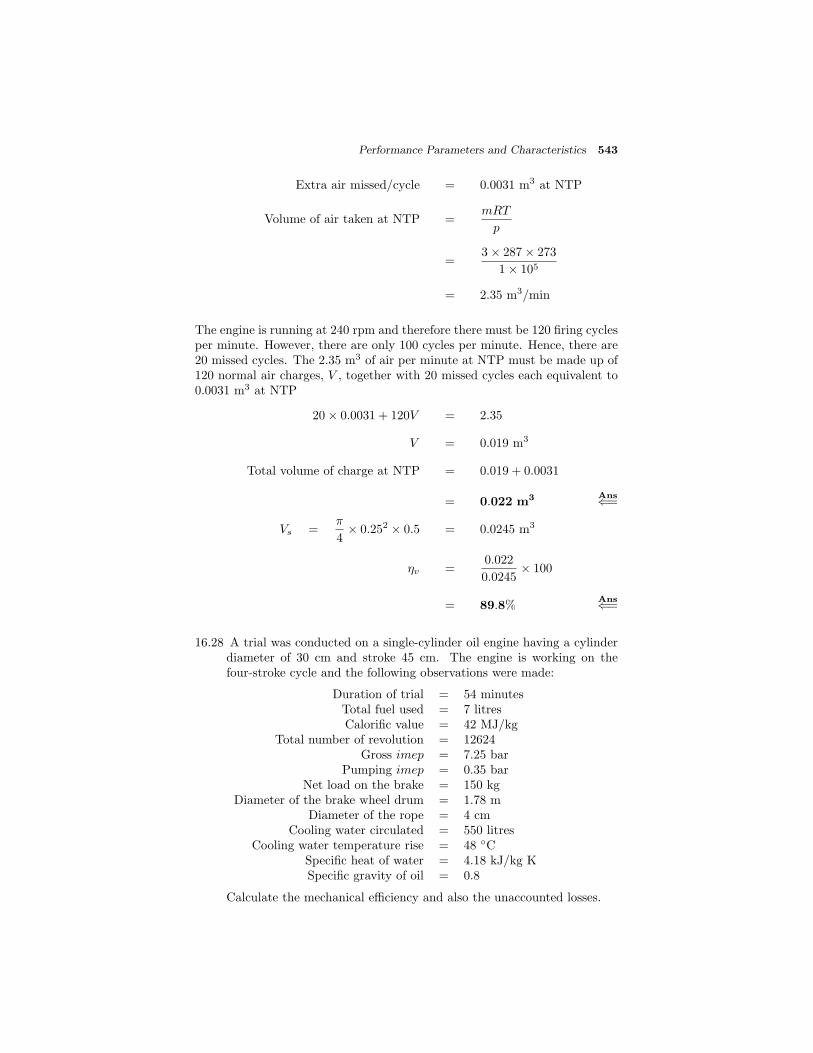
Performance Parameters and Characteristics 543
Extra air missed/cycle = 0.0031 m3 at NTP
Volume of air taken at NTP =mRT
p
=3× 287× 273
1× 105
= 2.35 m3/min
The engine is running at 240 rpm and therefore there must be 120 firing cyclesper minute. However, there are only 100 cycles per minute. Hence, there are20 missed cycles. The 2.35 m3 of air per minute at NTP must be made up of120 normal air charges, V , together with 20 missed cycles each equivalent to0.0031 m3 at NTP
20× 0.0031 + 120V = 2.35
V = 0.019 m3
Total volume of charge at NTP = 0.019 + 0.0031
= 0.022 m3 Ans⇐=
Vs =π
4× 0.252 × 0.5 = 0.0245 m3
ηv =0.022
0.0245× 100
= 89.8%Ans⇐=
16.28 A trial was conducted on a single-cylinder oil engine having a cylinderdiameter of 30 cm and stroke 45 cm. The engine is working on thefour-stroke cycle and the following observations were made:
Duration of trial = 54 minutesTotal fuel used = 7 litresCalorific value = 42 MJ/kg
Total number of revolution = 12624Gross imep = 7.25 bar
Pumping imep = 0.35 barNet load on the brake = 150 kg
Diameter of the brake wheel drum = 1.78 mDiameter of the rope = 4 cm
Cooling water circulated = 550 litresCooling water temperature rise = 48 ◦C
Specific heat of water = 4.18 kJ/kg KSpecific gravity of oil = 0.8
Calculate the mechanical efficiency and also the unaccounted losses.

544 IC Engines
Solution
ip =(7.25− 0.35)× 105 × 0.45× π
4 × 0.32 × 1262445×2
60000
= 51.3 kW
Heat supplied =7× 10−3 × 800
45× 42000 = 5226.67 kJ/min
bp =9.8× 150× π × (1.78 + 0.4)× 12624
60000× 54
= 39.23 kW
ηm =bp
ip× 100 =
39.23
51.3× 100 = 76.47%
Ans⇐=
Heat equivalent of bp = 39.23× 60 = 2353.8 kJ/min
Heat lost in cooling water =550× 48× 4.18
45= 2452.3 kJ/min
Unaccounted losses = 5226.67− (2353.8 + 2452.3)
= 420.57 kJ/minAns⇐=
16.29 A four-stroke gas engine has a cylinder diameter of 25 cm and stroke45 cm. The effective diameter of the brake is 1.6 m. The observationsmade in a test of the engine were as follows:
Duration of test = 40 minTotal number of revolutions = 8080Total number of explosions = 3230
Net load on the brake = 90 kgMean effective pressure = 5.8 bar
Volume of gas used = 7.5 m3
Pressure of gas indicated in meter = 136 mm water of gaugeAtmospheric temperature = 17 ◦C
Calorific value of gas = 19 MJ/m3 at NTP
Rise in temperature of jacket = 45 ◦Ccooling water
Cooling water supplied = 180 kg
Draw up a heat balance sheet and estimate the indicated thermal ef-ficiency and brake thermal efficiency. Assume atmospheric pressure as760 mm of Hg.
Solution
ip =pimLAn
60000

Performance Parameters and Characteristics 545
=5.8× 105 × 0.45× π
4 × 0.252 × 323040
60000= 17.25
bp =9.81× 90× π × 1.6× 8080
40
60000= 14.94 kW
Pressure of the gas supplied
= 760 +136
13.6= 770 mm of Hg
Volume of gas used at NTP
= 7.5× 273
290× 770
760= 7.15 m3
Heat supplied =7.15× 19000
40= 3396.25 kJ/min
Heat equivalent of bp
= 14.94× 60 = 896.4 kJ/minAns⇐=
Heat loss in cooling medium
=180× 45
40× 4.18 = 846.5 kJ/min
Ans⇐=
Heat lost to exhaust, radiation, etc. (by difference)
= 3396.25− 896.4− 846.5 = 1653.35 kJ/minAns⇐=
ηith =ip× 60
Heat supplied/min× 100
=17.25× 60
3396.25× 100 = 30.47%
Ans⇐=
ηbth =bp× 60
Heat supplied=
14.94× 60
3396.25× 100
= 26.39%Ans⇐=
Heat input(kJ)
Heat expenditure(kJ)(per minute) (per minute)
Heat supplied 3396.25 1. Heat equivalent to bp 896.40by fuel 2. Heat lost to cooling 846.50
medium3. Heat lost in exhaust 1653.35
Total 3396.25
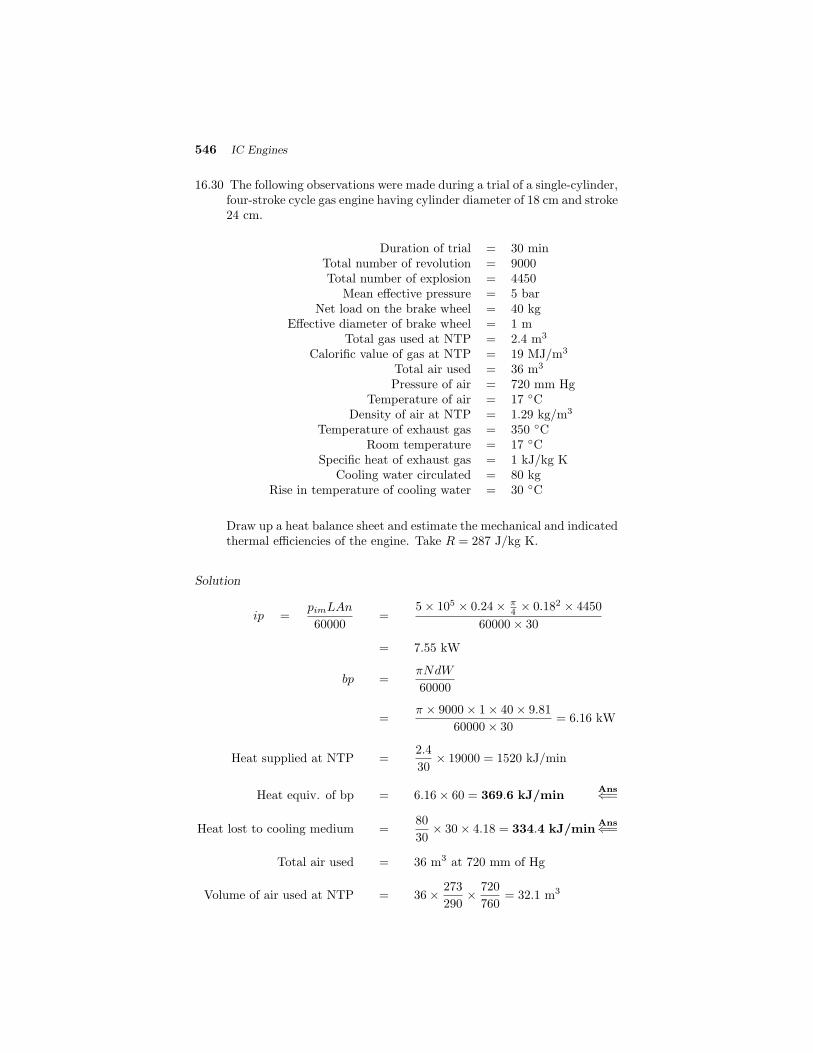
546 IC Engines
16.30 The following observations were made during a trial of a single-cylinder,four-stroke cycle gas engine having cylinder diameter of 18 cm and stroke24 cm.
Duration of trial = 30 minTotal number of revolution = 9000Total number of explosion = 4450
Mean effective pressure = 5 barNet load on the brake wheel = 40 kg
Effective diameter of brake wheel = 1 mTotal gas used at NTP = 2.4 m3
Calorific value of gas at NTP = 19 MJ/m3
Total air used = 36 m3
Pressure of air = 720 mm HgTemperature of air = 17 ◦C
Density of air at NTP = 1.29 kg/m3
Temperature of exhaust gas = 350 ◦CRoom temperature = 17 ◦C
Specific heat of exhaust gas = 1 kJ/kg KCooling water circulated = 80 kg
Rise in temperature of cooling water = 30 ◦C
Draw up a heat balance sheet and estimate the mechanical and indicatedthermal efficiencies of the engine. Take R = 287 J/kg K.
Solution
ip =pimLAn
60000=
5× 105 × 0.24× π4 × 0.182 × 4450
60000× 30
= 7.55 kW
bp =πNdW
60000
=π × 9000× 1× 40× 9.81
60000× 30= 6.16 kW
Heat supplied at NTP =2.4
30× 19000 = 1520 kJ/min
Heat equiv. of bp = 6.16× 60 = 369.6 kJ/minAns⇐=
Heat lost to cooling medium =80
30× 30× 4.18 = 334.4 kJ/min
Ans⇐=
Total air used = 36 m3 at 720 mm of Hg
Volume of air used at NTP = 36× 273
290× 720
760= 32.1 m3

Performance Parameters and Characteristics 547
Mass of air used =32.1× 1.29
30= 1.38 kg/min
Mass of gas at NTP, mg =pV
RT=
1× 105 × 2.4
287× 273= 3.06 kg
Mass of gas/min =3.06
30= 0.102 kg
Total mass of exhaust gas = 1.38 + 0.102 = 1.482 kg
Heat lost to exhaust gas = 1.482× (350− 17)× 1
= 493.5 kJ/minAns⇐=
Heat lost by radiation = 1520− (369.6 + 334.4 + 493.5)
= 322.5 kJ/minAns⇐=
ηm =bp
ip× 100 =
6.16
7.55× 100 = 81.6%
Ans⇐=
ηith =ip× 60
Heat supplied=
7.55× 60
1520× 100
= 29.8%Ans⇐=
Heat input(kJ)
Heat expenditure(kJ)
(per minute) (per minute)Heat supplied 1520 1. Heat equivalent to bp 369.6by fuel 2. Heat lost to cooling 334.4
medium3. Heat lost in exhaust 493.54. Unaccounted losses 322.5
Total 1520.0
16.31 The following results were obtained in a test on a gas engine:
Gas used = 0.16 m3/min at NTPCalorific value of gas at NTP = 14 MJ/m3
Density of gas at NTP = 0.65 kg/m3
Air used = 1.50 kg/minSpecific heat of exhaust gas = 1.0 kJ/kg KTemperature of exhaust gas = 400 ◦C
Room temperature = 20 ◦CCooling water per minute = 6 kg
Specific heat of water = 4.18 kJ/kg KRise in temp. of cooling water = 30 ◦C
ip = 12.5 kWbp = 10.5 kW

548 IC Engines
Draw a heat balance sheet for the test on per hour basis in kJ.
Solution
Heat supplied at NTP = 0.16× 14000× 60 = 134400 kJ/h
Heat equivalent of bp = 10.5× 60× 60 = 37800 kJ/hAns⇐=
Heat lost in cooling medium= 6× 30× 4.18× 60
= 45144 kJ/hAns⇐=
Mass of gas used = 0.16× 0.65 = 0.104 kg/min
Mass of air used = 1.50 kg/min
Mass of exhaust gas = 0.104 + 1.50 = 1.604 kg/min
Heat carried away in exhaust gases
= 1.604× 1× (400− 20)× 60
= 36571.2 kJ/hAns⇐=
Unaccounted losses = 134400− (37800 + 45144 + 36571.2)
= 14884.8 kJ/hAns⇐=
Heat input(kJ)
Heat expenditure(kJ)(per minute) (per minute)
Heat supplied 134400 1. Heat equivalent to bp 37800.0by fuel 2. Heat lost to cooling 45144.0
medium3. Heat lost in exhaust 36571.24. Unaccounted losses 14884.8
Total 134400.0
16.32 A test on a two-stroke engine gave the following results at full load:Speed = 350 rpm
Net brake load = 65 kgmep = 3 bar
Fuel consumption = 4 kg/hJacket cooling water flow rate = 500 kg/h
Jacket water temperature at inlet = 20 ◦CJacket water temperature at outlet = 40 ◦C
Test room temperature = 20 ◦C

Performance Parameters and Characteristics 549
Temperature of exhaust gases = 400 ◦CAir used per kg of fuel = 32 kg
Cylinder diameter = 22 cmStroke = 28 cm
Effective brake diameter = 1 mCalorific value of fuel = 43 MJ/kg
Proportion of hydrogen in fuel = 15%Mean specific heat of dry exhaust gas = 1 kJ/kg K
Mean specific heat of steam = 2.1 kJ/kg KSensible heat of water at room temp. = 62 kJ/kg
Latent heat of steam = 2250 kJ/kg
Find ip, bp and draw up a heat balance sheet for the test in kJ/min andin percentage.
Solution
ip =pimLAn
60000
=3× 105 × 0.28× π
4 × 0.222 × 350
60000
= 18.63 kWAns⇐=
bp =WπNd
60000=
65× 9.81× π × 350× 1
60000
= 11.68 kWAns⇐=
Heat supplied/min =4× 43000
60
= 2866.7 kJ = 100% (let)Ans⇐=
Heat equivalent of bp = 11.68× 60
= 700.8 kJ/min = 24.4%Ans⇐=
Heat lost to cooling water = 696.7 kJ/min = 24.3%Ans⇐=
1 kg of H2 produces 9 kg of H2O. Therefore,
H2O produced per kg of fuel burnt
= 9×%H2 × mass of fuel/min
= 9× 0.15× 4
60= 0.09 kg/min
Mass of wet exhaust
gases/min=
Mass of air/min
+ Mass of fuel/min

550 IC Engines
=(32 + 1)× 4
60= 2.2 kg/min
Mass of dry exhaust
gases/min=
Mass of wet exhaust gases/min
− Mass of H2O produced/min
= 2.2− 0.09 = 2.11 kg
Heat lost to dry exhaust gases/minute
= 2.11× 1× (400− 20)
= 801.8 kJ/min = 28%Ans⇐=
Assuming that steam in exhaust exists as super heated steam at atmosphericpressure and at exhaust gas temperature, total heat of 1 kg of steam at at-mospheric pressure (1 bar) and 400◦ reckoned above room temperature,
Heat in steam = Hsup − h
where h is the sensible heat of water at room temperature.
Cpw(100− TR) + Cps(Tsup − 100) + L− h
= [−h + 100Cpw + L + Cps(Tsup − 100)]− h
= 100Cpw + L + Cps(Tsup − 100)− 2h
= [100× 4.18 + 2250 + 2.1× (400− 100)]
−2× 4.18× 293 = 848.52 kJ/kg
Heat carried away by steam in exhaust gases per minute
= 0.09× 848.52
= 76.4 kJ/min = 2.7%Ans⇐=
Unaccounted losses = 2866.7− (700.8 + 696.7 + 801.8 + 76.4)
= 591 kJ = 20.6%Ans⇐=

Performance Parameters and Characteristics 551
Heat input(kJ) %
Heat expenditure(kJ) %(per min) (per minute)
Heat 2866.7 100 1. Equivalent of bp 700.8 24.4supplied 2. Lost to cooling 696.7 24.3by fuel water
3. Lost to dry 801.8 28.0exhaust gas
4. Carried away 76.4 2.7by steam
5. Unaccounted 591.0 20.6losses
Total 2866.7 100.0
16.33 During the trial of a single-cylinder, four-stroke oil engine, the followingresults were obtained.
Cylinder diameter = 20 cmStroke = 40 cm
Mean effective pressure = 6 barTorque = 407 NmSpeed = 250 rpm
Oil consumption = 4 kg/hCalorific value of fuel = 43 MJ/kg
Cooling water flow rate = 4.5 kg/minAir used per kg of fuel = 30 kg
Rise in cooling water temperature = 45 ◦CTemperature of exhaust gases = 420 ◦C
Room temperature = 20 ◦CMean specific heat of exhaust gas = 1 kJ/kg K
Specific heat of water = 4.18 kJ/kg K
Find the ip, bp and draw up a heat balance sheet for the test in kJ/h.
Solution
ip =pimLAn
60000=
6× 105 × 0.4× π4 × 0.22 × 250
2
60000
= 15.7 kWAns⇐=
bp =2πNT
60000=
2× π × 250× 407
60000
= 10.6 kWAns⇐=
Heat supplied = 4× 43000 = 172000 kJ/h
Heat equivalent ofbp = 10.6× 60× 60 = 38160 kJ/hAns⇐=
Heat carried away by cooling water

552 IC Engines
= 4.5× 60× 45× 4.18 = 50787 kJ/hAns⇐=
Heat carried away by exhaust= 4× (30 + 1)× 1× (420− 20)
= 49600 kJ/hAns⇐=
Unaccounted loss by difference
= 33453 kJ/hAns⇐=
Heat input(kJ)
Heat expenditure(kJ)(per hour) (per hour)
Heat supplied 172000 1. Heat equivalent to bp 38160by fuel 2. Heat lost to cooling 50787
medium3. Heat lost in exhaust 496004. Unaccounted losses 33453
Total 172000
16.34 In a test of an oil engine under full load condition the following resultswere obtained.
ip = 33 kWbrake power = 27 kW
Fuel used = 8 kg/hRate of flow of water through gas calorimeter = 12 kg/min
Cooling water flow rate = 7 kg/minCalorific value of fuel = 43 MJ/kg
Inlet temperature of cooling water = 15 ◦COutlet temperature of cooling water = 75 ◦C
Inlet temperature of water to exhaust = 15 ◦Cgas calorimeter
Outlet temperature of water to exhaust = 55 ◦Cgas calorimeter
Final temperature of the exhaust gases = 80 ◦CRoom temperature = 17 ◦C
Air-fuel ratio on mass basis = 20Mean specific heat of exhaust gas = 1 kJ/kg K
Specific heat of water = 4.18 J/kg K
Draw up a heat balance sheet and estimate the thermal and mechanicalefficiencies.
Solution
Heat supplied =8× 43000
60= 5733.3 kJ/min

Performance Parameters and Characteristics 553
Heat equivalent of bp = 27× 60 = 1620 kJ/minAns⇐=
Heat carried away by cooling water = 7× 4.18× (75− 15)
= 1755.6 kJ/minAns⇐=
Heat lost by exhaust gases in exhaust calorimeter in kJ/min
= 12× 4.18× (55− 15) = 2006.4
Mass of exhaust gases (fuel + air) =8
60+ 20× 8
60
= 2.8 kg/min
Heat lost in exhaust gases = mexCpex(tex − tR)
= 2.8× 1× (80− 17)
= 176.4 kJ/min
Total heat carried away by the exhaust gases
= 2006.4 + 176.4
= 2182.8 kJ/minAns⇐=
Total heat accounted = 1620 + 1755.6 + 2182.8
= 5558.4 kJ/minAns⇐=
Unaccounted loss = 5733.3− 5558.4
= 174.9 kJ/minAns⇐=
ηith =ip× 60
Heat supplied/min× 100
=33× 60
5733.3× 100
= 34.5%Ans⇐=
ηbth =27× 60
5733.3× 100 = 28.3%
Ans⇐=
ηm =bp
ip× 100 =
27
33× 100
= 81.8%Ans⇐=

554 IC Engines
Heat input(kJ)
Heat expenditure(kJ)(per minute) (per minute)
Heat 5733.3 1. Heat equivalent of bp 1620supplied 2. Heat lost to cooling medium 1755.6by fuel 3. Heat lost in exhaust 2182.8
4. Unaccounted losses 174.9Total 5558.4
16.35 A gasoline engine has a stroke volume of 0.0015 m3 and a compressionratio of 6. At the end of the compression stroke, the pressure is 8 barand temperature 350◦C. Ignition is set so that the pressure rises alonga straight line during combustion and attains its highest value of 25 barafter the piston has travelled 1/30 of the stroke. The charge consistsof a gasoline-air mixture in proportion by mass 1 to 16. Take R = 287J/kg K, calorific value of the fuel = 42 MJ/kg and Cp = 1 kJ/kg K.Calculate the heat lost per kg of charge during combustion.
Solution
25
8
p (bar)
2' 3' V (cc)
3' 3
2
50
1500300
4
1
V1 − V2 = 0.0015× 106 = 1500 cc
V2 =1500
6− 1= 300 cc
V3 =1500
30+ 300 = 350 cc
T2 = 350 + 273 = 623K
T3 = T2p3V3p2V2
= 623× 25
8× 350
300= 2271 K
In order to estimate the heat added to the mixture during the process 2→3,it is required to calculate the work done and the increase in internal energybetween 2 and 3.
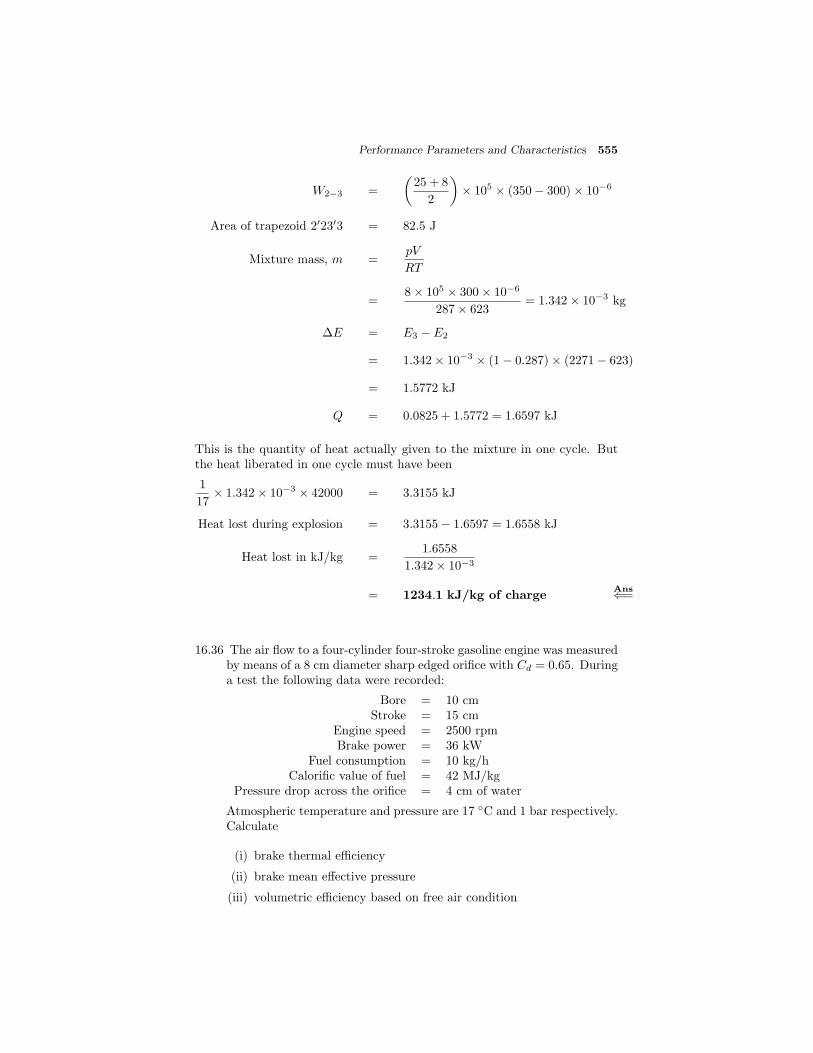
Performance Parameters and Characteristics 555
W2−3 =
25 + 8
2
× 105 × (350− 300)× 10−6
Area of trapezoid 2 23 3 = 82.5 J
Mixture mass, m =pV
RT
=8× 105 × 300× 10−6
287× 623= 1.342× 10⁻³ kg
ΔE = E3 − E2
= 1.342× 10−3 × (1− 0.287)× (2271− 623)
= 1.5772 kJ
Q = 0.0825 + 1.5772 = 1.6597 kJ
This is the quantity of heat actually given to the mixture in one cycle. Butthe heat liberated in one cycle must have been
1
17× 1.342× 10−3 × 42000 = 3.3155 kJ
Heat lost during explosion = 3.3155− 1.6597 = 1.6558 kJ
Heat lost in kJ/kg =1.6558
1.342× 10−3
= 1234.1 kJ/kg of chargeAns⇐=
16.36 The air flow to a four-cylinder four-stroke gasoline engine was measuredby means of a 8 cm diameter sharp edged orifice with Cd = 0.65. Duringa test the following data were recorded:
Bore = 10 cmStroke = 15 cm
Engine speed = 2500 rpmBrake power = 36 kW
Fuel consumption = 10 kg/hCalorific value of fuel = 42 MJ/kg
Pressure drop across the orifice = 4 cm of water
Atmospheric temperature and pressure are 17 ◦C and 1 bar respectively.Calculate
(i) brake thermal efficiency
(ii) brake mean effective pressure
(iii) volumetric efficiency based on free air condition

556 IC Engines
Solution
ηbth =36× 60
1060 × 42000
× 100 = 30.86%Ans⇐=
pbm =bp× 60000
LAnK=
36× 60000
0.15× π4 × 0.12 × 2500
2 × 4
= 3.67× 10⁵ Pa = 3.67 barAns⇐=
Vs =π
4d2LK =
π
4× 102 × 15× 4 = 4712.4 cc
Velocity of air through the orifice,
Ca =
2gΔha
Δhwρw = Δhaρa
ρa =p
RT=
1× 10⁵
287× 290= 1.20 kg/m
3
Ca =
2g × Δhw
1000× 1000
ρa
where Δhw is the pressure drop in mm of water column
Ca =
!2× 9.81× 40
1.2= 25.57 m/s
ma = CdAρaCa
= 0.65× π
4× 0.082 × 1.20× 25.57× 3600
= 360.9 kg/h
Volume of air =mRT
p=
360.9× 287× 290
1× 105= 300.4 m3/h
Vs = 4712.4× 10−6 × 2500
2× 60 = 353.43 m3/h
ηv =300.4
353.43× 100 = 85%
Ans⇐=
16.37 A test on a single-cylinder, four-stroke oil engine having a bore of 15 cmand stroke 30 cm gave the following results: speed 300 rpm; brake torque200 Nm; indicated mean effective pressure 7 bar; fuel consumption 2.4kg/h; cooling water flow 5 kg/min; cooling water temperature rise 35 ◦C;air-fuel ratio 22; exhaust gas temperature 410 ◦C; barometer pressure
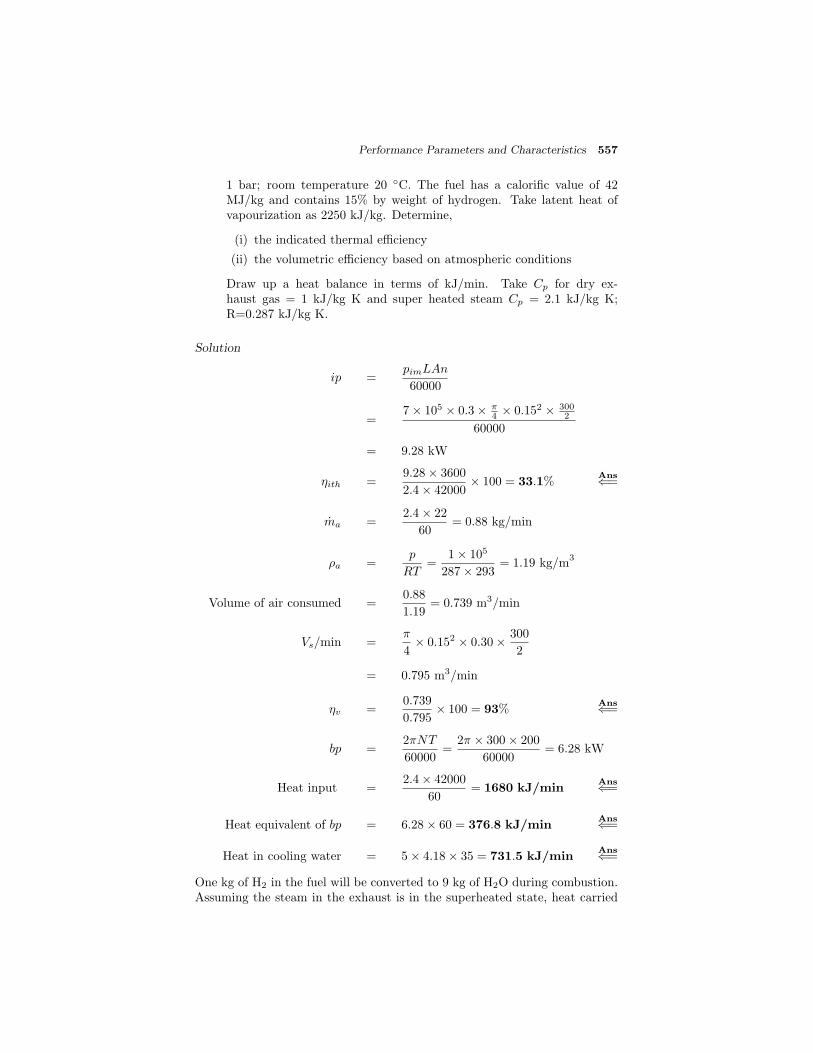
Performance Parameters and Characteristics 557
1 bar; room temperature 20 ◦C. The fuel has a calorific value of 42MJ/kg and contains 15% by weight of hydrogen. Take latent heat ofvapourization as 2250 kJ/kg. Determine,
(i) the indicated thermal efficiency
(ii) the volumetric efficiency based on atmospheric conditions
Draw up a heat balance in terms of kJ/min. Take Cp for dry ex-haust gas = 1 kJ/kg K and super heated steam Cp = 2.1 kJ/kg K;R=0.287 kJ/kg K.
Solution
ip =pimLAn
60000
=7× 105 × 0.3× π
4 × 0.152 × 3002
60000
= 9.28 kW
ηith =9.28× 3600
2.4× 42000× 100 = 33.1%
Ans⇐=
ma =2.4× 22
60= 0.88 kg/min
ρa =p
RT=
1× 10⁵
287× 293= 1.19 kg/m
3
Volume of air consumed =0.88
1.19= 0.739 m3/min
Vs/min =π
4× 0.152 × 0.30× 300
2
= 0.795 m3/min
ηv =0.739
0.795× 100 = 93%
Ans⇐=
bp =2πNT
60000=
2π × 300× 200
60000= 6.28 kW
Heat input =2.4× 42000
60= 1680 kJ/min
Ans⇐=
Heat equivalent of bp = 6.28× 60 = 376.8 kJ/minAns⇐=
Heat in cooling water = 5× 4.18× 35 = 731.5 kJ/minAns⇐=
One kg of H2 in the fuel will be converted to 9 kg of H2O during combustion.Assuming the steam in the exhaust is in the superheated state, heat carried

558 IC Engines
away by steam can be calculated as
Cpw(100− Ta) + hfg + Cpa(Tsup − 100)
where hfg is the latent heat of vapourization = 2250 kJ/kg.
Enthalpy of steam = 4.18× (100− 20) + 2250 + 2.1× (410− 100)
= 3235.4 kJ/kg
Heat carried away by steam
= ms(h− CpwtR)
= 9× 0.15× 2.4
60× (3225.4− 4.18× 20)
= 170.2 kJ/minAns⇐=
Heat carried away by exhaust gas
=
0.88 +
2.4
60− 9× 0.15× 2.4
60
× 1× (410− 20)
= 337.7Ans⇐=
Unaccounted loss (by difference)
= 1680− (376.8 + 731.5 + 170.2 + 337.7)
= 63.8 kJ/minAns⇐=
Heat input(kJ)
Heat expenditure(kJ)
(per minute) (per minute)Heat 1680 1. Heat equivalent to bp 376.8supplied 2. Heat lost to cooling medium 731.5by fuel 3. Heat carried away by steam 170.2
4. Heat lost in exhaust 337.75. Unaccounted losses 63.8
Total 1680.0
16.38 A four-stroke cycle gasoline engine has six single-acting cylinders of 8cm bore and 10 cm stroke. The engine is coupled to a brake havinga torque radius of 40 cm. At 3200 rpm, with all cylinders operatingthe net brake load is 350 N. When each cylinder in turn is renderedinoperative, the average net brake load produced at the same speed bythe remaining 5 cylinders is 250 N. Estimate the indicated mean effectivepressure of the engine. With all cylinders operating the fuel consumption
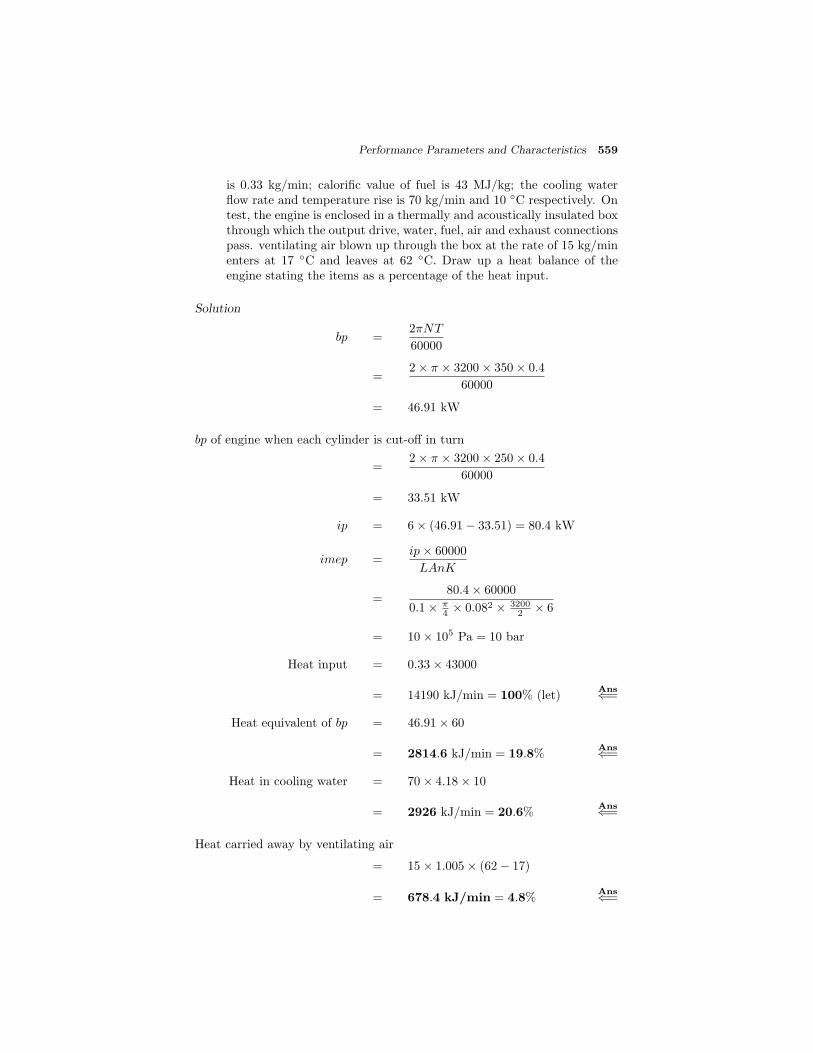
Performance Parameters and Characteristics 559
is 0.33 kg/min; calorific value of fuel is 43 MJ/kg; the cooling waterflow rate and temperature rise is 70 kg/min and 10 ◦C respectively. Ontest, the engine is enclosed in a thermally and acoustically insulated boxthrough which the output drive, water, fuel, air and exhaust connectionspass. ventilating air blown up through the box at the rate of 15 kg/minenters at 17 ◦C and leaves at 62 ◦C. Draw up a heat balance of theengine stating the items as a percentage of the heat input.
Solution
bp =2πNT
60000
=2× π × 3200× 350× 0.4
60000
= 46.91 kW
bp of engine when each cylinder is cut-off in turn
=2× π × 3200× 250× 0.4
60000
= 33.51 kW
ip = 6× (46.91− 33.51) = 80.4 kW
imep =ip× 60000
LAnK
=80.4× 60000
0.1× π4 × 0.082 × 3200
2 × 6
= 10× 105 Pa = 10 bar
Heat input = 0.33× 43000
= 14190 kJ/min = 100% (let)Ans⇐=
Heat equivalent of bp = 46.91× 60
= 2814.6 kJ/min = 19.8%Ans⇐=
Heat in cooling water = 70× 4.18× 10
= 2926 kJ/min = 20.6%Ans⇐=
Heat carried away by ventilating air
= 15× 1.005× (62− 17)
= 678.4 kJ/min = 4.8%Ans⇐=

560 IC Engines
Unaccounted loss (by difference)
= 14190− (2814.6 + 2926 + 678.4)
= 7771 kJ/min = 54.8%Ans⇐=
Heat input(kJ) %
Heat expenditure(kJ) %(per min) (per minute)
Heat 2866.7 100 1. Equivalent of bp 2814.6 19.8supplied 2. Lost to cooling 2926.0 20.6by fuel water
3. Lost to dry 678.4 4.8exhaust gas
4. Unaccounted 7771.0 54.8losses
Total 14190.0 100.0
16.39 A full load test on a two-stroke engine yielded the following results:speed 440 rpm; brake load 50 kg; imep 3 bar; fuel consumption 5.4kg/h; rise in jacket water temperature 36 ◦C; jacket water flow 440kg/h; air-fuel ratio by mass 30; temperature of exhaust gas 350 ◦C;temperature of the test room 17 ◦C; barometric pressure 76 cm of Hg;cylinder diameter 22 cm; stroke 25 cm; brake diameter 1.2 m; calorificvalue of fuel is 43 MJ/kg; proportion of hydrogen by mass in the fuel15%; R = 0.287 kJ/kg of mean specific heat of dry exhaust gases =1 kJ/kg K; specific heat of dry steam 2 kJ/kg K. Assume enthalpy ofsuper heated steam to be 3180 kJ/kg. Determine,
(i) the indicated thermal efficiency
(ii) the specific fuel consumption in g/kW h
(iii) volumetric efficiency based on atmospheric conditions
Draw up a heat balance for the test on the percentage basis indicatingthe content of each item in the balance.
Solution
bp =2πNT
60000=
2π × 440× 50× 9.81× 0.6
60000
= 13.56 kW
ip =pimLAn
60000
=3× 105 × 0.25× π
4 × 0.222 × 440
60000
= 20.91 kW
ηith =20.91× 605.460 × 43000
× 100 = 32.4%Ans⇐=
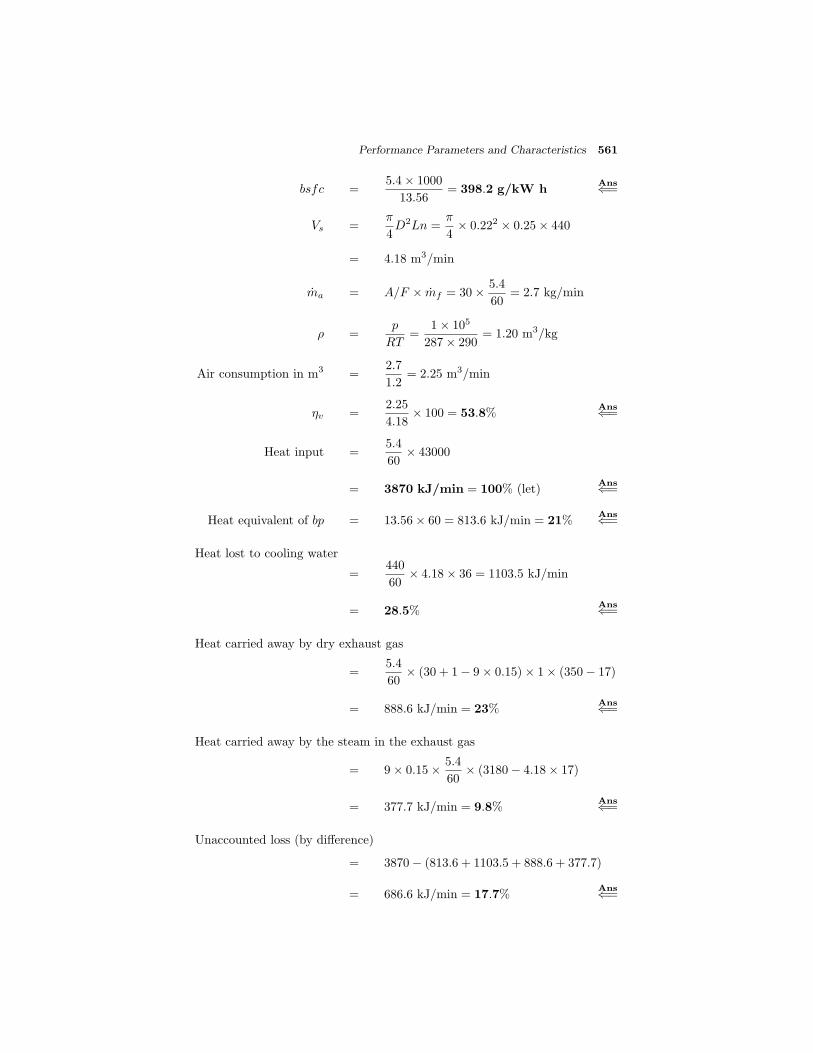
Performance Parameters and Characteristics 561
bsfc =5.4× 1000
13.56= 398.2 g/kW h
Ans⇐=
Vs =π
4D2Ln =
π
4× 0.222 × 0.25× 440
= 4.18 m3/min
ma = A/F × mf = 30× 5.4
60= 2.7 kg/min
ρ =p
RT=
1× 10⁵
287× 290= 1.20 m3/kg
Air consumption in m3 =2.7
1.2= 2.25 m3/min
ηv =2.25
4.18× 100 = 53.8%
Ans⇐=
Heat input =5.4
60× 43000
= 3870 kJ/min = 100% (let)Ans⇐=
Heat equivalent of bp = 13.56× 60 = 813.6 kJ/min = 21%Ans⇐=
Heat lost to cooling water
=440
60× 4.18× 36 = 1103.5 kJ/min
= 28.5%Ans⇐=
Heat carried away by dry exhaust gas
=5.4
60× (30 + 1− 9× 0.15)× 1× (350− 17)
= 888.6 kJ/min = 23%Ans⇐=
Heat carried away by the steam in the exhaust gas
= 9× 0.15× 5.4
60× (3180− 4.18× 17)
= 377.7 kJ/min = 9.8%Ans⇐=
Unaccounted loss (by difference)
= 3870− (813.6 + 1103.5 + 888.6 + 377.7)
= 686.6 kJ/min = 17.7%Ans⇐=
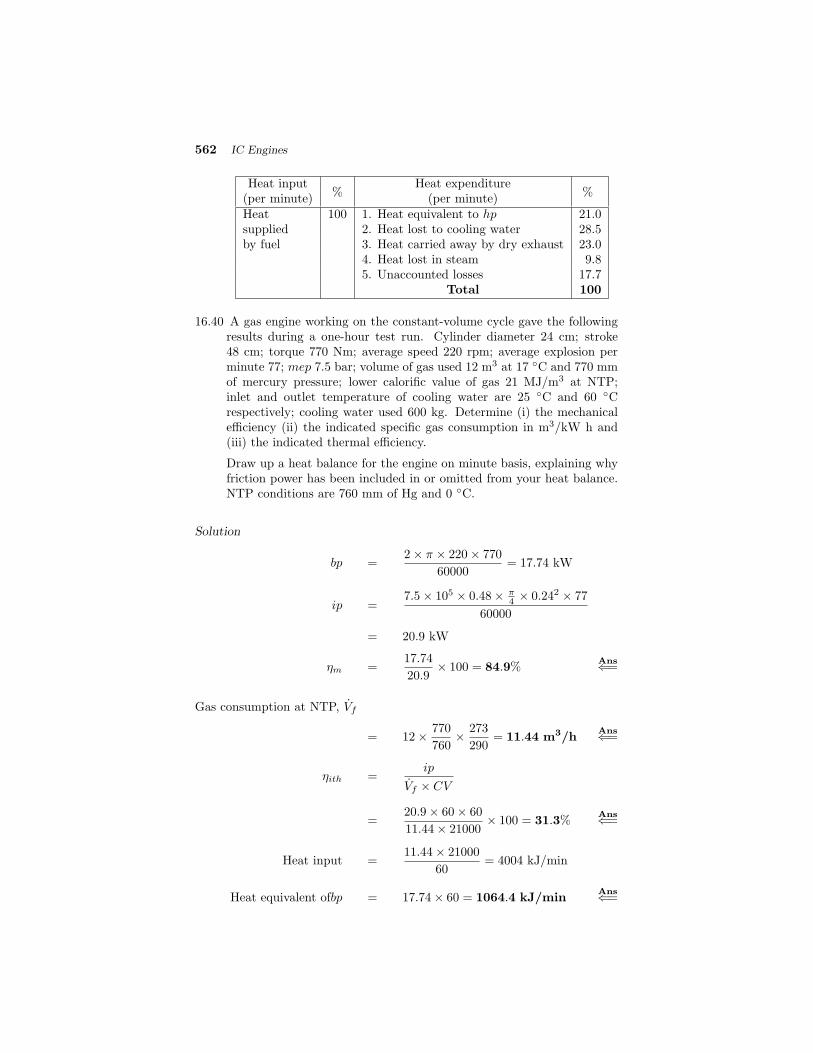
562 IC Engines
Heat input%
Heat expenditure%(per minute) (per minute)
Heat 100 1. Heat equivalent to hp 21.0supplied 2. Heat lost to cooling water 28.5by fuel 3. Heat carried away by dry exhaust 23.0
4. Heat lost in steam 9.85. Unaccounted losses 17.7
Total 100
16.40 A gas engine working on the constant-volume cycle gave the followingresults during a one-hour test run. Cylinder diameter 24 cm; stroke48 cm; torque 770 Nm; average speed 220 rpm; average explosion perminute 77; mep 7.5 bar; volume of gas used 12 m3 at 17 ◦C and 770 mmof mercury pressure; lower calorific value of gas 21 MJ/m3 at NTP;inlet and outlet temperature of cooling water are 25 ◦C and 60 ◦Crespectively; cooling water used 600 kg. Determine (i) the mechanicalefficiency (ii) the indicated specific gas consumption in m3/kW h and(iii) the indicated thermal efficiency.
Draw up a heat balance for the engine on minute basis, explaining whyfriction power has been included in or omitted from your heat balance.NTP conditions are 760 mm of Hg and 0 ◦C.
Solution
bp =2× π × 220× 770
60000= 17.74 kW
ip =7.5× 105 × 0.48× π
4 × 0.242 × 77
60000
= 20.9 kW
ηm =17.74
20.9× 100 = 84.9%
Ans⇐=
Gas consumption at NTP, Vf
= 12× 770
760× 273
290= 11.44 m3/h
Ans⇐=
ηith =ip
Vf × CV
=20.9× 60× 60
11.44× 21000× 100 = 31.3%
Ans⇐=
Heat input =11.44× 21000
60= 4004 kJ/min
Heat equivalent ofbp = 17.74× 60 = 1064.4 kJ/minAns⇐=

Performance Parameters and Characteristics 563
Heat in cooling water =600
60× 4.18× (60− 25)
= 1463 kJ/minAns⇐=
Heat in exhaust, radiation etc. (by difference)
= 4004− (1064.4 + 1463)
= 1476.6 kJ/minAns⇐=
Heat input(kJ)
Heat expenditure(kJ)(per minute) (per minute)
Heat 4004 1. Heat equivalent to bp 1064.4supplied 2. Heat lost to cooling medium 1463.0by fuel 3. Heat lost in exhaust 1476.6
Total 4004.0
The friction heat is not included since it is assumed that friction heat isrejected to cooling water, exhaust, radiation etc.
Review Questions
16.1 Mention the basic aspects covered by the engine performance.
16.2 List the parameters by which performance of an engine is evaluated.
16.3 Define mean effective pressure and distinguish between brake mean ef-fective pressure and indicated mean effective pressure.
16.4 Develop an expression for the calculation of indicated mean effectivepressure.
16.5 Derive the expression for calculating indicated power of an engine.
16.6 How is the torque of an engine is evaluated from them nomenclature ofthe engine?
16.7 Distinguish between the power and specific output.
16.8 Briefly discuss the various efficiency terms associated with an engine.
16.9 Define air-fuel ratio and briefly state its effect on power output, fuelconsumption and combustion pressure.
16.10 What is the importance of specific fuel consumption?
16.11 Schematically explain the use of the study of the heat balance of anengine.
564 IC Engines
16.12 Explain the effect of the following factors on the performance of an SIengine: (i) compression ratio (ii) air-fuel ratio (iii) spark timing (iv)engine speed (v) mass of inducted charge and (vi) heat losses.
16.13 Briefly explain the reason of poor part load thermal efficiency of the SIengine compared with CI engine.
16.14 What limits the brake power and brake mean effective pressure of a CIengine?
16.15 What are the methods available for improving the performance of anengine?
16.16 Draw a typical performance map for a four-stroke fast burn SI engineshowing contours of constant bsfc.
16.17 Draw a typical performance map showing the effect of fuel injectionparameters, air swirl and bowl in piston design and fraction of exhaustgas recirculation.
16.18 By means of a Sankey diagram explain the energy flow through an en-gine.
16.19 Draw a detailed Sankey diagram for SI engine and explain.
16.20 Explain the details of the analytical method of performance estimation.
Exercise
16.1 Find the bore of the single-cylinder diesel engine working on the four-stroke cycle and delivers 40 kW at 200 rpm from the following data:
Compression ratio : 14:1Fuel cut-off : 5% of stroke
Index of compression curve : 1.4Index for expansion curve : 1.3
Pressure at beginning of compression : 1 atmRatio of stroke to bore : 1.5 to 1
Ans: 34.5 cm
16.2 Determine the diameter of a gas engine cylinder to develop 18 kW whenmaking 100 explosions per minute, gives clearance volume 1/3 sweptvolume, law of compression and explosion pV 1.3, absolute maximumpressure is 3 times the absolute pressure at the end of the stroke. Takelength of stroke to be twice the bore. Ans: 24.7 cm
16.3 A four-stroke gas engine having a cylinder of 250 mm diameter andstroke 450 mm has a volumetric efficiency of 80%, ratio of air to gas is 8to 1, calorific value of gas is 20 MJ/m3 at NTP. Find the heat suppliedto the engine per working cycle. If the compression ratio is 5, whatis the heating value of the mixture per working stroke per m3 of totalcylinder volume? Ans: (i) 40 kJ (ii) 1428.6 kJ/m3

Performance Parameters and Characteristics 565
16.4 The swept volume of a gas engine is 9 litre and the clearance volume is2.25 litre. The engine consumes 3500 litre of gas per hour, when runningat 160 rpm firing every cycle and developing 4 kW. It has a mechanicalefficiency of 75%. What is the relative efficiency of the engine comparedwith air-standard cycle if the calorific value of gas is 20 MJ/m3. As-suming a volumetric efficiency of 0.87, find the ratio of air to gas usedby 1 m3 of the mixture in the cylinder. Ans: (i) 57.68% (ii) 9.73
16.5 In order to study the effect of mixture strength on the thermal effi-ciency of the engine, tests were made on a four-stroke gas engine andthe following heat balance results were obtained.
TestEngine A Engine B
Lean mixture Rich mixtureIndicated work 37 33Heat in exhaust gas 42 39Heat lost 21 28
100 1000
In the test A the supply of gas was 0.23 m3 per minute and in testB was 0.30 m3 per minute. The calorific value of the gas used was20 MJ/m3. Calculate the indicated power and the heat loss to thecylinder walls and piston per minute in the two cases. Calculate theindicated thermal efficiencies of the two engines and comment on theresult. Ans: (i) 1702 kJ/min; 1980 kJ/min (ii) 966 kJ; 1680 kJ
(iii) 37%; 33%
Reasons for higher thermal efficiency on lean mixtures
(i) With a weak mixture the temperature rise for a given heat inputis greater than with rich mixture since there is a little or no disso-ciation and the specific heat is less at the lower temperature.
(ii) The smaller maximum temperature reduces the heat flow to thecylinder walls.The more nearly the maximum temperature approaches the tem-perature at the end of compression will the Otto efficiency ap-proaches the Carnot.
16.6 An engine of 175 mm bore and 375 mm stroke is governed by hit andmiss type governor to 220 rpm. With a fixed setting of the gas sup-ply and ignition advance, indicator diagrams gave the following val-ues of mean effective pressure. Firing, positive loop 5.7 bar, negativeloop 0.25 bar; missing negative loop 0.42 bar. When developing 6 kWthe explosions were 100 per minute and the gas used was 0.1 m3 perminute. Calculate the friction power and assuming uniform gas sup-ply per explosion, find the gas consumption per minute at no load.
Ans: (i) 2.13 kW (ii) 0.032 m3
16.7 Calculate the maximum brake power which can be developed in thecylinder of a four-stroke gas engine which runs at 200 rpm. The diameter

566 IC Engines
of the piston is 300 mm and stroke 400 mm. Clearance volume is 25%of the swept volume. The gas supplied consists of CO = 19.7%; H2
= 28.8%; CO2 = 14.4%; N2 = 37.1%. Assume that the total mixtureat NTP admitted per suction stroke is 0.875 of total volume behindthe piston at the end of the stroke and that the thermal efficiency is35%. Calorific value of H2 = 121.4 MJ/kg; Calorific value of carbonburning from CO to CO2 = 23.4 MJ/kg; Density of air = 1.2 kg/m3.
Ans: 47 kW
16.8 The following observations were made in a test of a gas engine in whicha waste heat boiler served as an exhaust gas calorimeter. Gross calorificvalue of gas 20.0 MJ/m3 at NTP; gas consumption 9.35 m3/h at NTP;density of gas = 0.706 kg/m3; mass of water vapour of combustionproduced per m3 of gas (at NTP) = 0.72 kg; air consumption = 77.4kg/h; temperature of air and gas = 17 ◦C; rate of flow of water throughboiler = 168 kg/h; inlet and outlet temperature of water is 20 ◦C and80 ◦C. Temperature of exhaust gases leaving the boiler 127 ◦C. Calcu-late the heat per hour leaving the engine and express as a percentageof heat supplied. Assume the dew point of the exhaust gases as 50◦C; the total heat of dry saturated steam at 50 ◦C = 2580 kJ/kg; themean specific heat of steam as 2 kJ/kg K and the specific heat of fluegas as 1 kJ/kg K. Take atmospheric temperature = 17 ◦C as datum.
Ans: (i) 187000 kJ/h (ii) 36.39%
16.9 In olden days in order to compare the various forms and sizes of theengine a factor known as Tookey factor is defined. It is given by
TF =mep of the cycle in bar
Heat equivalent of 1 m3 of cylinder mixture in MJ
Calculate the value of the Tookey factor for an engine developing 10kW using the following data. Piston diameter = 200 mm; stroke = 300mm; explosion per minute = 100; calorific value of gas = 19 MJ/m3
gas per hour 6 m3; clearance volume = 25% of swept volume; volumet-ric efficiency = 87.5%. (Note: Modern engines will have a TF > 4).
Ans: 3.45
16.10 In a test of a gas engine, the gas used had the following composition byvolume : CH4 = 65%; H2 = 2%; N2 = 2%; CO2 = 31%. The dry exhaustgas analysis gave O2 = 5.3%; N2 = 83%; CO = 0.3% and CO2 = 11.4%.Find (i) the air-fuel ratio by volume, to give complete combustion (ii)the percentage of excess air actually used in the test. Air contains 79%by volume of nitrogen. Ans: (i) 6.238 (ii) 36.7%
16.11 Assume that an oil engine cylinder is not cooled. One kg of air and0.00518 of fuel are introduced into the cylinder at 17 ◦C and 1 bar andcompressed to 4 bar. Taking the specific heat of the product to 0.717kJ/kg K, find the maximum temperature and pressure at the end ofexplosion. The calorific value of the fuel is 46 MJ/kg. Take γ = 1.4.
Ans: (i) 761.55 K (ii) 7.07 bar

Performance Parameters and Characteristics 567
16.12 Assuming a volumetric efficiency of 75%, estimate the probable indi-cated power of a four-cylinder petrol engine, given the following data, di-ameter of cylinder = 180 mm; stroke = 210 mm; speed = 1000 rpm; air-fuel ratio = 16:1. Engine works on a four-stroke cycle, net calorific valueof the fuel = 44 MJ/kg; thermal efficiency is 30%. Assume ρa = 1.3.
Ans: 140.8 kW
16.13 A nine-cylinder petrol engine of bore 150 mm and stroke 200 mm has acompression ratio of 6:1 and develops 360 kW at 2000 rpm when runningon a mixture of 20% rich. The fuel used has a calorific value of 43 MJ/kgand contains 85.3% carbon and 14.7% hydrogen. Assuming volumetricefficiency of 70% at 17 ◦C and mechanical efficiency of 90%, find theindicated thermal efficiency of the engine. Air contains 23.3% by massof oxygen. Ans: 30.84%
16.14 In a test the percentage analysis of petrol is found to be C = 83.2%;H = 14.3% O2 = 2.5%. Calculate the mixture strength theoreticallyrequired for complete combustion of this fuel. Tests were conducted ona petrol engine at full throttle and constant speed, the quantity of fuelsupplied to the engine being varied by means of an adjustable needlevalve fitted to the jet of the carburettor. The results obtained were asfollows:
Speed Torque Fuel Air Air-fuel(rpm) (Nm) (kg/min) (kg/min) ratio1570 122.9 0.097 1.570 16.201570 128.5 0.100 1.560 15.601573 131.5 0.103 1.570 15.201569 138.0 0.110 1.560 14.201572 139.3 0.113 1.560 13.801563 141.5 0.118 1.560 13.201560 142.7 0.123 1.560 12.701572 141.2 0.129 1.560 12.10
Calorific value of fuel is 42 MJ/kg. Find the mixture strengthfor maximum brake power and maximum thermal efficiency.
Ans: (i) 12.1 (ii) 15.6
16.15 A four-cylinder automobile engine of 90 mm bore and 115 mm strokewas tested at constant speed over the complete practical range of mix-ture strength. The speed, the brake loads and the fuel consumption areas follows:

568 IC Engines
Test Brake load Speed Fuel consumptionNumber (kg) (rpm) (kg/h)
1 17.35 1510 10.992 17.39 1500 10.803 17.44 1510 10.534 17.48 1512 10.355 17.48 1510 9.996 17.48 1510 9.727 17.21 1509 9.178 16.35 1493 8.549 15.08 1513 8.08
The brake arm length was 1 m. Plot sfc vs bmep curve and findthe mixture strength for maximum power and maximum economy.
Ans: (i) 0.335 kg/kW h (ii) 0.36 kg/kW h
16.16 The following results were obtained from a set of trials at full throttle ona single cylinder four-stroke kerosene engine working of constant volumecycle has a bore of 110 mm and stroke of 200 mm. The speed was keptconstant at 1500 rpm and the compression ratio varied.
Compression ratio 3.8 4.2 4.6 5.0 5.4 5.8Fuel consumption/kg/min 0.113 0.112 0.112 0.112 0.111 0.111Brake torque (Nm) 112.03 119.77 126.69 131.99 135.92 139.32Frictional torque (Nm) 16.97 17.38 17.92 18.33 18.87 19.28
Calorific value of kerosene = 42 MJ/kg. Plot the curves of indicatedmean effective pressure and thermal efficiency with respect to a com-pression ratio and obtain the values at compression ratio of 5.5. Alsofind the relative efficiency at the above compression ratio. Ans: 58.3%
16.17 In a test of a four-cylinder, four-stroke petrol engine of 75 mm boreand 100 mm stroke, the following results were obtained at full throttleat a constant speed and with a fixed setting of the fuel supply of 0.082kg/min.
bp with all cylinders working = 15.24 kWbp with cylinder number 1 cut-off = 10.45 kWbp with cylinder number 2 cut-off = 10.38 kWbp with cylinder number 3 cut-off = 10.23 kWbp with cylinder number 4 cut-off = 10.45 kW
Estimate the indicated power of the engine under these condi-tions. If the calorific value of the fuel is 44 MJ/kg, find the indi-cated thermal efficiency of the engine. Compare this with the air-standard efficiency, the clearance volume of one cylinder being 115 cc.
Ans: (i) ip1 = 4.79; ip2 = 4.86; ip3 = 5.01; ip4 = 4.79;ip1234 = 19.45; (ii) 32.35% (iii) 69.1%
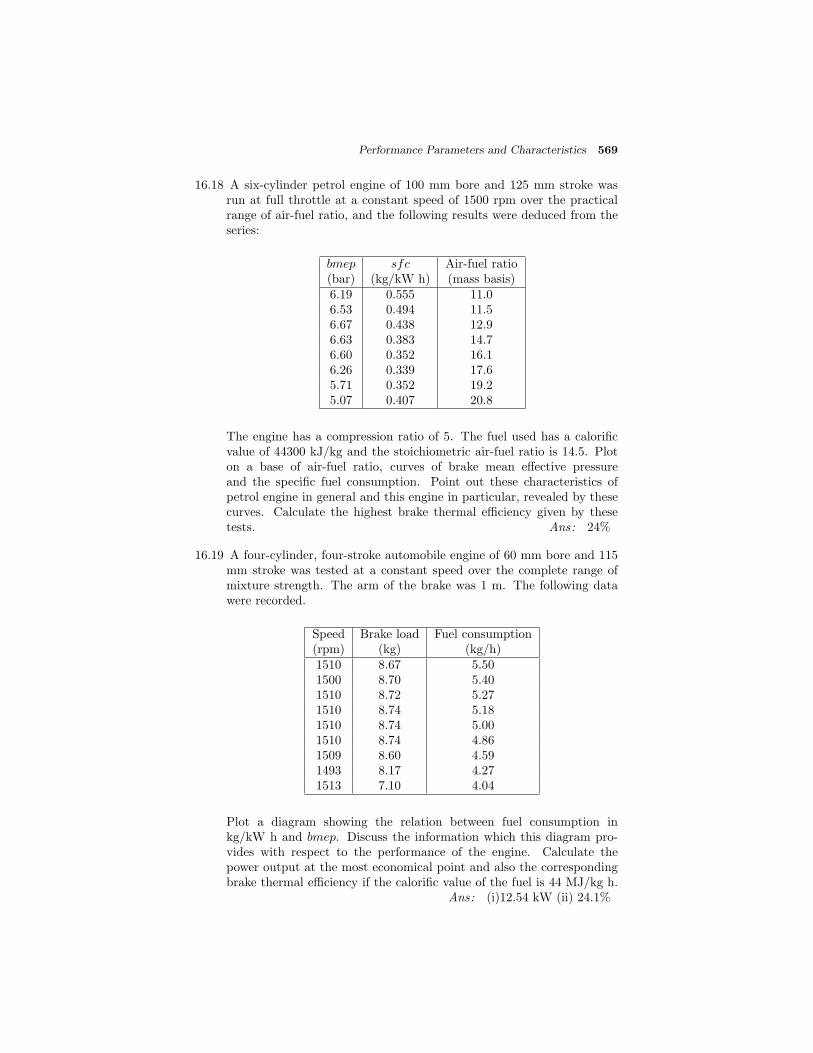
Performance Parameters and Characteristics 569
16.18 A six-cylinder petrol engine of 100 mm bore and 125 mm stroke wasrun at full throttle at a constant speed of 1500 rpm over the practicalrange of air-fuel ratio, and the following results were deduced from theseries:
bmep sfc Air-fuel ratio(bar) (kg/kW h) (mass basis)6.19 0.555 11.06.53 0.494 11.56.67 0.438 12.96.63 0.383 14.76.60 0.352 16.16.26 0.339 17.65.71 0.352 19.25.07 0.407 20.8
The engine has a compression ratio of 5. The fuel used has a calorificvalue of 44300 kJ/kg and the stoichiometric air-fuel ratio is 14.5. Ploton a base of air-fuel ratio, curves of brake mean effective pressureand the specific fuel consumption. Point out these characteristics ofpetrol engine in general and this engine in particular, revealed by thesecurves. Calculate the highest brake thermal efficiency given by thesetests. Ans: 24%
16.19 A four-cylinder, four-stroke automobile engine of 60 mm bore and 115mm stroke was tested at a constant speed over the complete range ofmixture strength. The arm of the brake was 1 m. The following datawere recorded.
Speed Brake load Fuel consumption(rpm) (kg) (kg/h)1510 8.67 5.501500 8.70 5.401510 8.72 5.271510 8.74 5.181510 8.74 5.001510 8.74 4.861509 8.60 4.591493 8.17 4.271513 7.10 4.04
Plot a diagram showing the relation between fuel consumption inkg/kW h and bmep. Discuss the information which this diagram pro-vides with respect to the performance of the engine. Calculate thepower output at the most economical point and also the correspondingbrake thermal efficiency if the calorific value of the fuel is 44 MJ/kg h.
Ans: (i)12.54 kW (ii) 24.1%

570 IC Engines
16.20 The fuel supplied to a Diesel engine has a gross calorific value of 44800kJ/kg and contains 85.4% C and 12.3% H2. The average tempera-ture of the exhaust gases is 260 ◦C and their volumetric analysis givesCO2 : 5.77%, CO : 0.12%, O2 : 13.09%, N2 (by difference) : 81.02%.Find (i) the heat carried away by the exhaust expressed as a percent-age of the heat supplied and (ii) the mass of air per kg of fuel inexcess of that theoretically required for complete combustion. Takemean specific heat of the dry exhaust gases as 1 kJ/kg K and atmo-spheric temperature as 17 ◦C. Air contains 23% oxygen on mass basis.
Ans: (i) 26.61% (ii) 21.42 kg
16.21 The following set of observations refer to a trial on a single-cylinder,four-stroke solid injection diesel engine of 200 mm bore and 400 mmstroke; gross mep = 6.20 bar, pumping mep = 0.44 bar, speed 262 rpm,brake torque = 468 Nm; fuel used 3.85 kg of oil per hour of gross calorificvalue 46600 kJ/kg, cooling water 6 kg/min raised 47 ◦C. Draw up a heatbalance sheet for the trial expressing various quantitative in kJ/min andcalculate the mechanical efficiency of the engine. If the fuel contains13.5% H2 (by mass) and the air supply to the engine 1.71 kg/min at17 ◦C. Estimate the heat carried away per minute by the exhaust gaseswhen their temperature is 280 ◦C. Assume a mean specific heat of 1kJ/kg and specific heat of fuel to be 4 kJ/kg K. Take sensible heat of airand fuel also in the heat balance. Ans: (i) 81.2% (ii) 678.26 kJ/min
16.22 A four-cylinder, four-stroke diesel engine develops 28 kW at 2000 rpm.Its bsfc is 0.26 kg/kW h. Calculate the power output of the en-gine and its bsfc when the fuel rate is reduced by 40% at the samespeed. Mechanical efficiency is 0.80. Assume that the indicated ther-mal efficiency changes linearly with equivalence ratio and there is 1%increase in indicated thermal efficiency for 6% increase in the equiv-alence ratio. Equivalence ratio (φ) at higher fuel flow rate is 0.6666.
Ans: (i) 16.1 kW (ii) 0.271 kg/kW h
16.23 An eight-cylinder SI engine with 90 mm bore and 110 mm stroke pro-duces 100 kW at a mean piston speed of 660 m/min at full throttle andthe bsfc is 0.39 kg/kW h. What will be the power produced by the en-gine and the bsfc when the engine runs with a mean piston speed of 440m/min with the throttle set at the same position. The fuel-air ratio andspark timing are adjusted for best power at each speed. From experi-mental curves of similar engine it is found that for the given percentagereduction in piston speed the air capacity of the engine is reduced by20%. Friction mep at piston speeds of 660 and 440 m/min are 1.9 and1.2 bar respectively. Ans: (i) 56.3 kW (ii) 0.369 kg/kW h
16.24 An eight-cylinder automobile petrol engine of 100 mm bore and 90 mmstroke has a compression ratio of 7. The engine develops 136 kW at4000 rpm. The engine operates at 20% rich in fuel and the atmosphericconditions are 27 ◦C and 760 mm of Hg barometer. The bsfc is 0.34kg/kW h. Estimate the power output and bsfc when
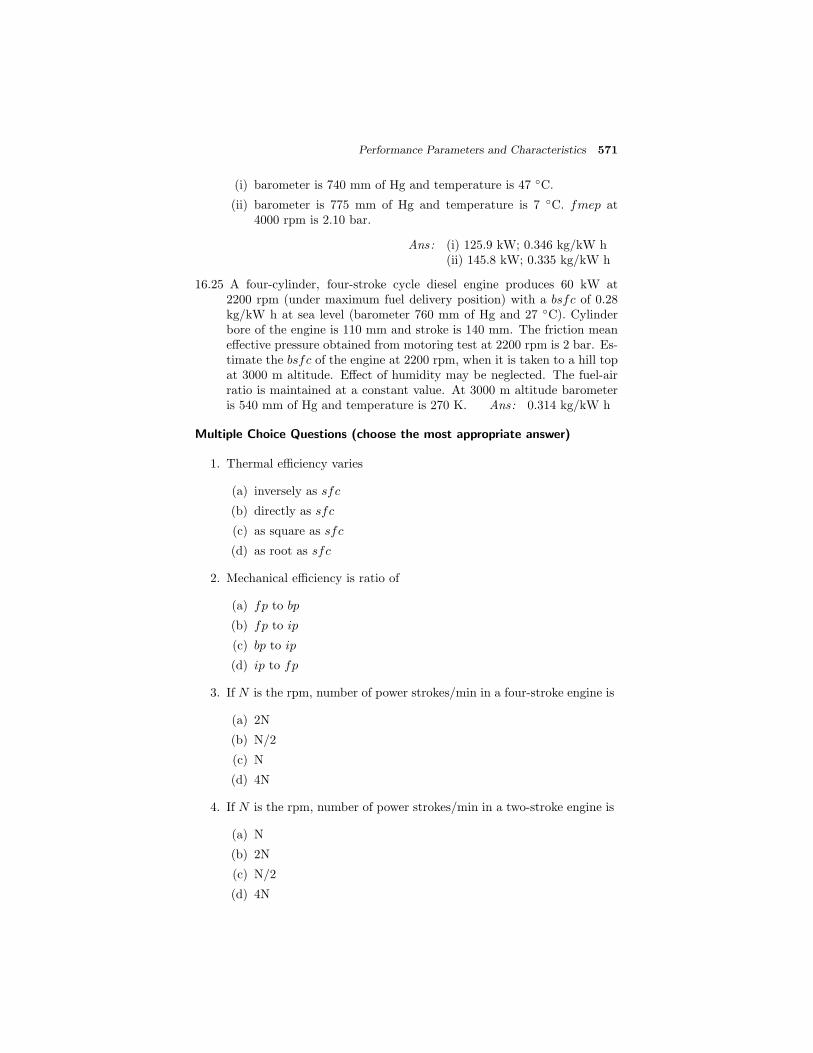
Performance Parameters and Characteristics 571
(i) barometer is 740 mm of Hg and temperature is 47 ◦C.
(ii) barometer is 775 mm of Hg and temperature is 7 ◦C. fmep at4000 rpm is 2.10 bar.
Ans: (i) 125.9 kW; 0.346 kg/kW h(ii) 145.8 kW; 0.335 kg/kW h
16.25 A four-cylinder, four-stroke cycle diesel engine produces 60 kW at2200 rpm (under maximum fuel delivery position) with a bsfc of 0.28kg/kW h at sea level (barometer 760 mm of Hg and 27 ◦C). Cylinderbore of the engine is 110 mm and stroke is 140 mm. The friction meaneffective pressure obtained from motoring test at 2200 rpm is 2 bar. Es-timate the bsfc of the engine at 2200 rpm, when it is taken to a hill topat 3000 m altitude. Effect of humidity may be neglected. The fuel-airratio is maintained at a constant value. At 3000 m altitude barometeris 540 mm of Hg and temperature is 270 K. Ans: 0.314 kg/kW h
Multiple Choice Questions (choose the most appropriate answer)
1. Thermal efficiency varies
(a) inversely as sfc
(b) directly as sfc
(c) as square as sfc
(d) as root as sfc
2. Mechanical efficiency is ratio of
(a) fp to bp
(b) fp to ip
(c) bp to ip
(d) ip to fp
3. If N is the rpm, number of power strokes/min in a four-stroke engine is
(a) 2N
(b) N/2
(c) N
(d) 4N
4. If N is the rpm, number of power strokes/min in a two-stroke engine is
(a) N
(b) 2N
(c) N/2
(d) 4N

572 IC Engines
5. An indicator from an engine has a length of 100 mm and an area of 2000mm2. If the indicator pointer deflects 10 mm for a pressure incrementof 2 bar, the mep is
(a) 2 bar
(b) 4 bar
(c) 8 bar
(d) 1 bar
6. The spark timing and combustion rate should be such that
(a) peak pressure occurs at TDC
(b) one half of the total pressure occurs at TDC
(c) ignition delay is reduced
(d) none of the above
7. Volumetric efficiency is a measure of
(a) speed of the engine
(b) power of the engine
(c) breathing capacity of the engine
(d) pressure rise in the cylinder
8. Indicated power is directly proportional to
(a) torque
(b) air consumption
(c) cylinder peak pressure
(d) none of the above
9. Turbocharger engines are those in which charge density is increased by
(a) separate air compressors
(b) compressors driven by exhaust gas turbine
(c) cooling inlet air
(d) none of the above
10. Brake thermal efficiency of SI engine is in the range
(a) 35% to 60%
(b) 25% to 35%
(c) 60% to 80%
(d) none of the above
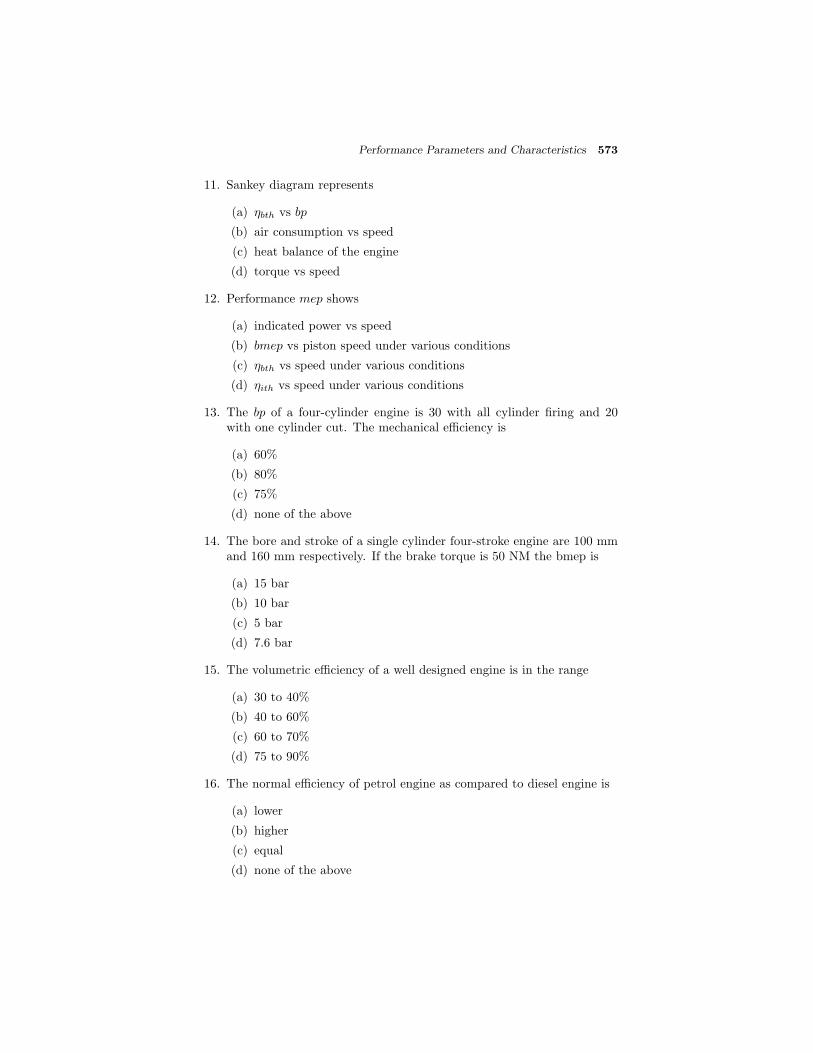
Performance Parameters and Characteristics 573
11. Sankey diagram represents
(a) ηbth vs bp
(b) air consumption vs speed
(c) heat balance of the engine
(d) torque vs speed
12. Performance mep shows
(a) indicated power vs speed
(b) bmep vs piston speed under various conditions
(c) ηbth vs speed under various conditions
(d) ηith vs speed under various conditions
13. The bp of a four-cylinder engine is 30 with all cylinder firing and 20with one cylinder cut. The mechanical efficiency is
(a) 60%
(b) 80%
(c) 75%
(d) none of the above
14. The bore and stroke of a single cylinder four-stroke engine are 100 mmand 160 mm respectively. If the brake torque is 50 NM the bmep is
(a) 15 bar
(b) 10 bar
(c) 5 bar
(d) 7.6 bar
15. The volumetric efficiency of a well designed engine is in the range
(a) 30 to 40%
(b) 40 to 60%
(c) 60 to 70%
(d) 75 to 90%
16. The normal efficiency of petrol engine as compared to diesel engine is
(a) lower
(b) higher
(c) equal
(d) none of the above

574 IC Engines
17. For SI engine with engine speed torque
(a) increases
(b) decreases
(c) increases and then decreases
(d) remains constant
18. For SI engine, air consumption with engine speed
(a) increases and then decreases
(b) increases
(c) decreases
(d) remains constant
19. Charge efficiency depend on
(a) mechanical efficiency
(b) compression ratio
(c) air-fuel ratio
(d) combustion efficiency
20. Indicated mean effective pressure is given by
(a) imep = fmep− bmep
(b) imep = fmep/bmep
(c) imep = fmep× bmep
(d) imep = fmep + bmep
21. At constant speed and constant air-fuel ratio for an SI engine
(a) bsfc is maximum at full load
(b) bsfc is minimum at full load
(c) bsfc is minimum at no load
(d) bsfc does not depend on load
Ans: 1. – (a) 2. – (c) 3. – (b) 4. – (a) 5. – (b)6. – (b) 7. – (c) 8. – (b) 9. – (b) 10. – (b)
11. – (c) 12. – (b) 13. – (c) 14. – (c) 15. – (d)16. – (a) 17. – (c) 18. – (a) 19. – (b) 20. – (d)21. – (b)

17ENGINE ELECTRONICS
17.1 INTRODUCTION
Engine development has become a challenge mainly because the user expectsimproved performance levels with reduced fuel consumption. Further, envi-ronmental considerations necessitate adopting the use of methods which loweremissions. Achieving the twin goal of low emissions with good performanceand drivability is a difficult task. It is in this context that electronic en-gine management has gained importance. The principal aims of an enginedeveloper is to achieve:
(i) High reliability and durability with lowest possible initial cost
(ii) High power output and torque
(iii) Low levels of gaseous and particulate emissions
(iv) Low fuel consumption
(v) Low noise levels and vibrations
Over the years, lots of developments in electronics have taken place. There-fore, in gasoline engines control of the following parameters is easily monitoredby using sensors and actuators linked to an electronic control module. Theimportant parameters that can be controlled are:
(i) Air-fuel ratio
(ii) Mixture distribution between cylinders
(iii) Ignition timing
(iv) Injection timing of the fuel
(v) Idle speed
As known a diesel engine uses a heterogeneous fuel air mixture. The loadis controlled by varying the amount of fuel injected. The fuel that is injectedhas to be atomized and mixed with air without leaving rich pockets so thatcombustion can take place properly. Too much mixing may lead to very leanmixtures. Again the fuel will not burn completely and this will result inhydrocarbon emission. Insufficient mixing will lead to high smoke, HC, COemissions and fuel consumption. Proper timing of the ignition can lead to lowcombustion temperatures and smooth engine operation. This will also reduceNOx emissions.

576 IC Engines
Modern emission standards and performance requirements cannot be metby conventional fuel injection systems operated mechanically. Injection tim-ing, pressure, duration etc. can be easily controlled electronically to minimizefuel consumption and emissions. Here again a set of sensors determines the en-gine operating conditions and this data is fed to the electronic control moduleto take suitable steps in order to control the engine operation via actuators.Electronic controls can also be used for engine speed governing. These sys-tems can give very close control over the engine speed under transients andwide load fluctuations.
In both SI and CI engines the electronic control module works on softwarespecially developed which uses sensor inputs and previously stored data aboutthe engine. Using this information it controls various parameters. The controlis achieved through actuators. The data about the engine is stored as a tablethat is analyzed to take appropriate decisions. In most cases the electroniccontrol module has to work in conjunctions with mechanical systems. In thischapter we will introduce different instrumentation and sensors that can beused in practice.
17.2 TYPICAL ENGINE MANAGEMENT SYSTEMS
In order to get an idea of the different types of sensors that are used in anengine let us take the example of a typical gasoline fuel injection system asshown in Fig.17.1. We can see that different sensors are used to detect crankshaft position, coolant temperature, engine speed, air flow rate, exhaust oxy-gen level, camshaft position, EGR valve position, exhaust manifold pressure,knock, manifold air pressure and manifold temperature.
Electric fuel pump Fuel filterPressure regulator
Ignition coil High tension
distributor
Injector
Temp.
sensor
Inductive sensor
Sensor wheel
Throttle poistion switch
Idle speed actuator
Electronic control unit
Air flow meter
λ-sensor
Fig. 17.1 Bosch motronic system
Figure 17.2 shows a typical common rail diesel fuel injection system. Inthis case we have sensors for engine speed, air mass flow, crank speed, camshaft position, turbo air boost pressure, fuel rail pressure, air temperature,
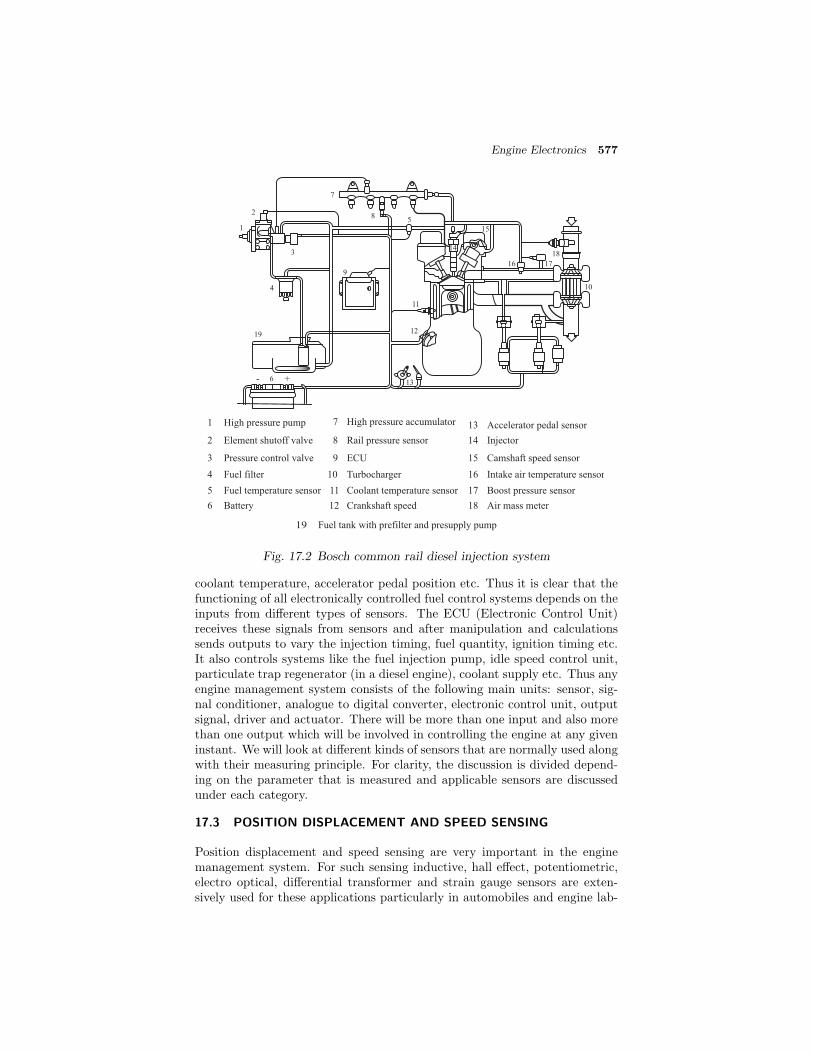
Engine Electronics 577
1
2
3
4
19
6
7
8
9
5
11
12
13
14
15
16 17
18
10
- +
19 Fuel tank with prefilter and presupply pump
9 ECU
7 High pressure accumulator
8 Rail pressure sensor
1 High pressure pump
2 Element shutoff valve
3 Pressure control valve
4 Fuel filter
6 Battery
5 Fuel temperature sensor 11 Coolant temperature sensor
12 Crankshaft speed
13 Accelerator pedal sensor
14 Injector
15 Camshaft speed sensor
18 Air mass meter
17 Boost pressure sensor
16 Intake air temperature sensor10 Turbocharger
Fig. 17.2 Bosch common rail diesel injection system
coolant temperature, accelerator pedal position etc. Thus it is clear that thefunctioning of all electronically controlled fuel control systems depends on theinputs from different types of sensors. The ECU (Electronic Control Unit)receives these signals from sensors and after manipulation and calculationssends outputs to vary the injection timing, fuel quantity, ignition timing etc.It also controls systems like the fuel injection pump, idle speed control unit,particulate trap regenerator (in a diesel engine), coolant supply etc. Thus anyengine management system consists of the following main units: sensor, sig-nal conditioner, analogue to digital converter, electronic control unit, outputsignal, driver and actuator. There will be more than one input and also morethan one output which will be involved in controlling the engine at any giveninstant. We will look at different kinds of sensors that are normally used alongwith their measuring principle. For clarity, the discussion is divided depend-ing on the parameter that is measured and applicable sensors are discussedunder each category.
17.3 POSITION DISPLACEMENT AND SPEED SENSING
Position displacement and speed sensing are very important in the enginemanagement system. For such sensing inductive, hall effect, potentiometric,electro optical, differential transformer and strain gauge sensors are exten-sively used for these applications particularly in automobiles and engine lab-

578 IC Engines
oratories. The details and working principle of various sensors are discussedin the following sections.
17.3.1 Inductive Transducers
A typical inductive transducer is shown in Fig.17.3. As can be seen, there is apermanent magnet. When the toothed piece moves it changes the permeanceof the magnetic circuit and this changes the magnetic flux. Thus a voltagegets developed when the flux field varies as the toothed piece moves. Thevoltage output alternates about the mean on the plus and minus sides. It canbe further sent to an electronic circuit to shape it into a square pulse. Thetoothed piece can be the teeth on the crank shaft of the engine as shown inFig.17.1, so that the frequency of the pulses can give the speed of the shaft.
N
S
Permanent magnet
To frequency meter or CRO
Fig. 17.3 Variable reluctance pickup
These transducers are often used for this application. Their output be-comes stronger as the variation in the flux rate becomes faster. Thus theyare used only for dynamic applications. They can also be used to determinethe position of the cam shaft if at some point on the shaft a tooth is removedas shown in Fig.17.1. In that case the signals will be as seen in Fig.17.4.The signal being essentially a sine wave where a tooth is missing that willbe indicted as a missed pulse (Fig.17.4). The ECU can use this informationeffectively. The speed is determined from the frequency of the pulses and thenumber of pulses before or after the missed pulse can give the crank position.The crank position will be used by the ECU to initiate the injection and/orthe ignition process(es). The zero of the sine wave occurs when the pickup isnear the apex of every tooth.
Inductive pickups can also be used to detect the actual timing of theinjection in a diesel engine. Inductive transducers can also be used in the rotorof distributors to initiate spark on the correct cylinder. Inductive pickups aresimple and reliable and give a strong voltage if the movement is rapid or thesensor is close to the moving part.
17.3.2 Hall Effect Pickup
In a hall effect pick up a suitable semiconductor material is supplied with aconstant current. When this sensor is subjected to a magnetic field which isperpendicular to the direction of the current, an emf gets developed at right

Engine Electronics 579
Missed pulse
Fig. 17.4 Output signal
angles to the supply current as seen in Fig.17.5. A permanent magnet canbe attached to the moving object. This sensor can be used to detect motionand here unlike the inductive transducer the velocity of the moving object isimmaterial. The sensor output varies with the strength of the magnetic field.The output is normally modified to give a square pulse which can be fed tothe ECU. This sensor can be used to detect shaft position and speed. It canalso be used to trigger the ignition system.
Constant
current source
Hall generator
Magnetic field
Fig. 17.5 Hall effect sensor
17.3.3 Potentiometers
Normally the position of the throttle is determined using a potentiometer. Thepotentiometer is a passive device and does not give any voltage output unlessit is exited. The potentiometer is basically a variable resistance. Across theresistance a constant voltage is applied. A moving leg slides on the resistanceand the voltage across the moving leg and one end of the resistance is theoutput. The contact motion can be rotational or translational. It can also behelical in the case of multi turn devices. The resistance elements can be wirewound, made of a conductive plastic or made with a conductive ceramic. Theresolution depends on the type of resistance element. To get a sufficientlyhigh resistance, wound wires are used. But in this case the resistance variesin small steps. The turns are usually 500 to 1000 per inch.
Non-wire wound potentiometers are used for applications like throttle po-sition sensing etc. They have infinite resolution. A typical device is seen in
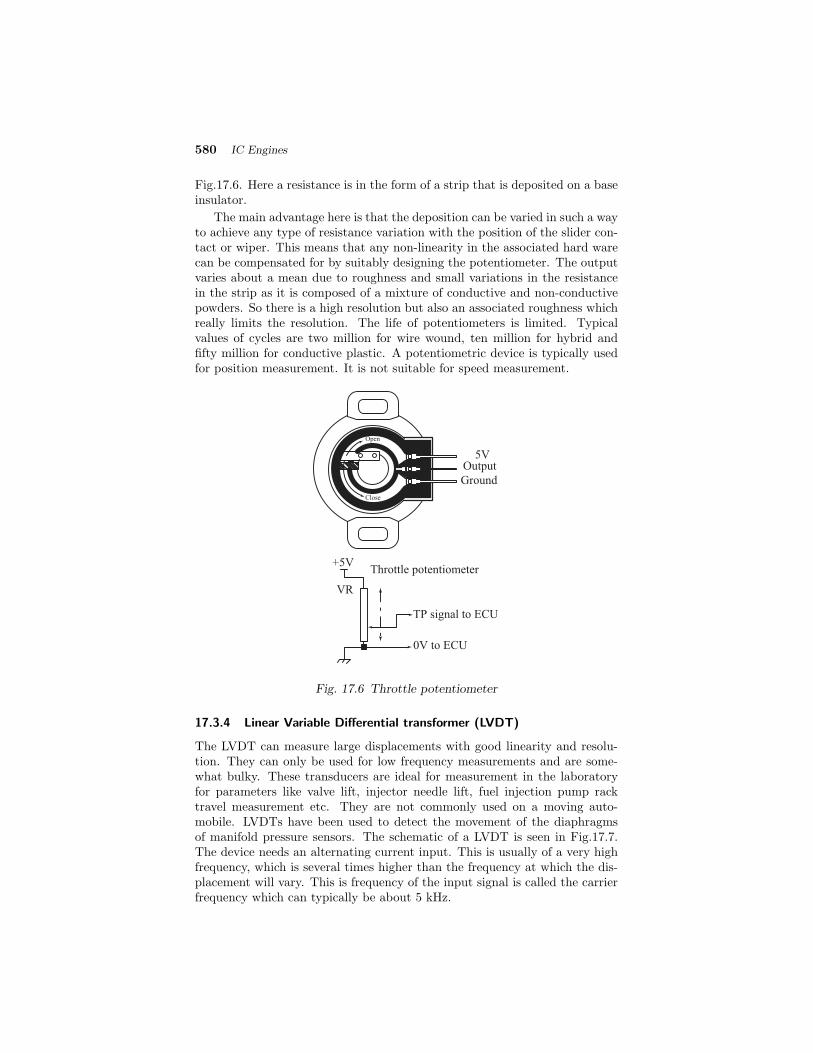
580 IC Engines
Fig.17.6. Here a resistance is in the form of a strip that is deposited on a baseinsulator.
The main advantage here is that the deposition can be varied in such a wayto achieve any type of resistance variation with the position of the slider con-tact or wiper. This means that any non-linearity in the associated hard warecan be compensated for by suitably designing the potentiometer. The outputvaries about a mean due to roughness and small variations in the resistancein the strip as it is composed of a mixture of conductive and non-conductivepowders. So there is a high resolution but also an associated roughness whichreally limits the resolution. The life of potentiometers is limited. Typicalvalues of cycles are two million for wire wound, ten million for hybrid andfifty million for conductive plastic. A potentiometric device is typically usedfor position measurement. It is not suitable for speed measurement.
+5V
VR
Throttle potentiometer
TP signal to ECU
0V to ECU
5VOutput
Ground
Close
Open
Fig. 17.6 Throttle potentiometer
17.3.4 Linear Variable Differential transformer (LVDT)
The LVDT can measure large displacements with good linearity and resolu-tion. They can only be used for low frequency measurements and are some-what bulky. These transducers are ideal for measurement in the laboratoryfor parameters like valve lift, injector needle lift, fuel injection pump racktravel measurement etc. They are not commonly used on a moving auto-mobile. LVDTs have been used to detect the movement of the diaphragmsof manifold pressure sensors. The schematic of a LVDT is seen in Fig.17.7.The device needs an alternating current input. This is usually of a very highfrequency, which is several times higher than the frequency at which the dis-placement will vary. This is frequency of the input signal is called the carrierfrequency which can typically be about 5 kHz.
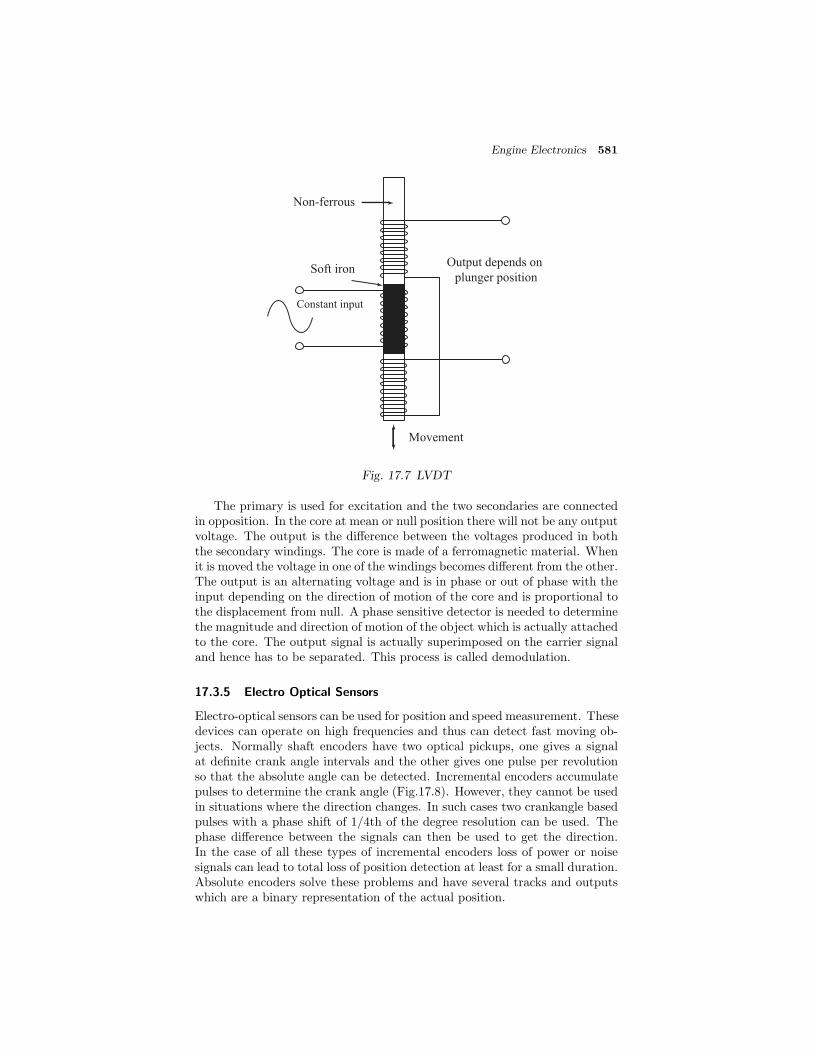
Engine Electronics 581
Output depends on
plunger position
Movement
Non-ferrous
Soft iron
Constant input
Fig. 17.7 LVDT
The primary is used for excitation and the two secondaries are connectedin opposition. In the core at mean or null position there will not be any outputvoltage. The output is the difference between the voltages produced in boththe secondary windings. The core is made of a ferromagnetic material. Whenit is moved the voltage in one of the windings becomes different from the other.The output is an alternating voltage and is in phase or out of phase with theinput depending on the direction of motion of the core and is proportional tothe displacement from null. A phase sensitive detector is needed to determinethe magnitude and direction of motion of the object which is actually attachedto the core. The output signal is actually superimposed on the carrier signaland hence has to be separated. This process is called demodulation.
17.3.5 Electro Optical Sensors
Electro-optical sensors can be used for position and speed measurement. Thesedevices can operate on high frequencies and thus can detect fast moving ob-jects. Normally shaft encoders have two optical pickups, one gives a signalat definite crank angle intervals and the other gives one pulse per revolutionso that the absolute angle can be detected. Incremental encoders accumulatepulses to determine the crank angle (Fig.17.8). However, they cannot be usedin situations where the direction changes. In such cases two crankangle basedpulses with a phase shift of 1/4th of the degree resolution can be used. Thephase difference between the signals can then be used to get the direction.In the case of all these types of incremental encoders loss of power or noisesignals can lead to total loss of position detection at least for a small duration.Absolute encoders solve these problems and have several tracks and outputswhich are a binary representation of the actual position.

582 IC Engines
LED Photo diode
Chopper wheel
Circuit
Amp
Fig. 17.8 Photo detector
17.4 MEASUREMENT OF PRESSURE
The measurement of manifold pressure, ambient pressure, cylinder pressure,lubricating oil pressure etc will involve the use of transducers like variablecapacitance, strain gauge, LVDT, Piezoelectric and piezoresistive. In mostcases, only an average variation in the pressure is needed. In others instanta-neous variations within a crank angle may be needed. For engine control av-erage pressure variations are sufficient. But in the laboratory when manifoldsor the combustion and injection systems are being optimized one will needpressure sensors with high frequency response. All pressure sensors will havea diaphragm and the method of detecting the movement of this diaphragmvaries. Sometimes the detecting element itself resists the movement of thediaphragm in others the diaphragm itself does this job by acting like a spring.
17.4.1 Strain Gauge Sensors
The strain gauge consists of a conductor which changes its dimensions alongwith the member whose strain is to be measured. The change in dimensionas well as the stress in the wire leads to a change in the resistance of the wire.Thus the change in the resistance of the strain gauge element can be used todetermine the strain on the element which is itself the strain on the member.Conventional strain gauges are indicated in Fig.17.9. Several types of straingauges are available. The most important ones are the:
(i) wire bonded on the member
(ii) wire or metal foil sandwiched between two insulators and bonded on themember
(iii) Thin metal film vacuum deposited on the member
(iv) Semiconductor bonded on the member
(v) Semiconductor diffused on a base material
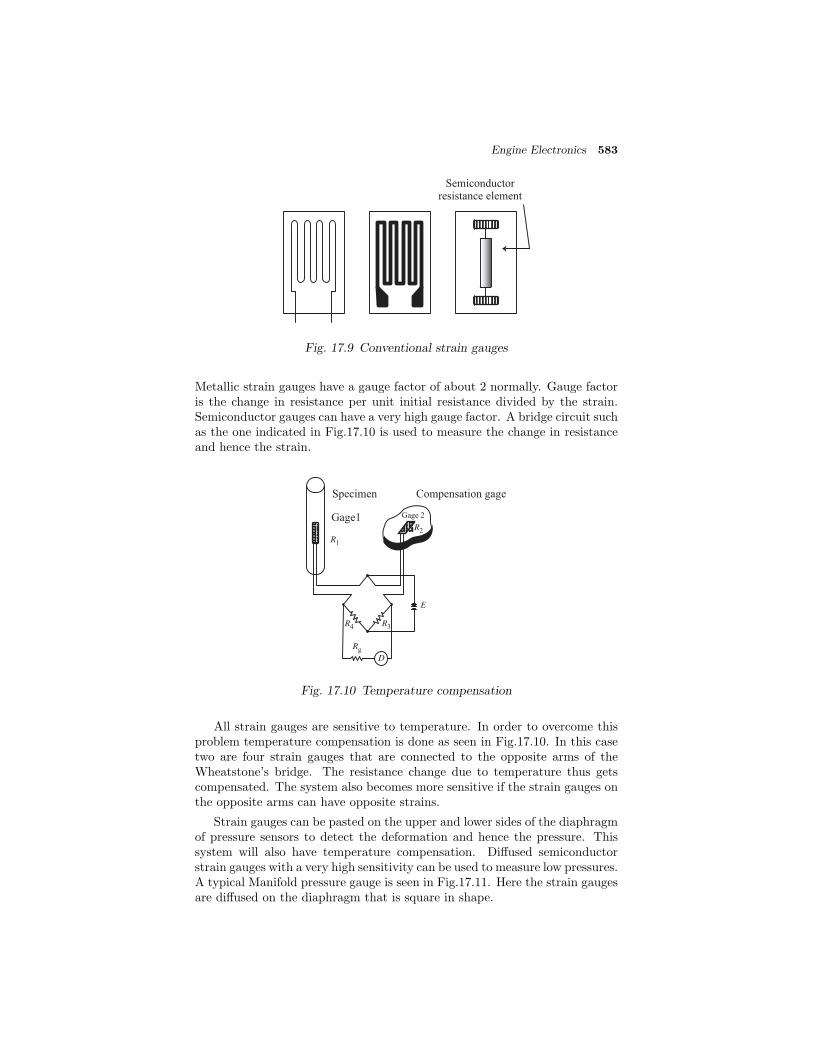
Engine Electronics 583
Semiconductorresistance element
Fig. 17.9 Conventional strain gauges
Metallic strain gauges have a gauge factor of about 2 normally. Gauge factoris the change in resistance per unit initial resistance divided by the strain.Semiconductor gauges can have a very high gauge factor. A bridge circuit suchas the one indicated in Fig.17.10 is used to measure the change in resistanceand hence the strain.
Specimen
Gage1
Compensation gage
Gage 2
E
R1
D
R2
R4 R3
Rg
Fig. 17.10 Temperature compensation
All strain gauges are sensitive to temperature. In order to overcome thisproblem temperature compensation is done as seen in Fig.17.10. In this casetwo are four strain gauges that are connected to the opposite arms of theWheatstone’s bridge. The resistance change due to temperature thus getscompensated. The system also becomes more sensitive if the strain gauges onthe opposite arms can have opposite strains.
Strain gauges can be pasted on the upper and lower sides of the diaphragmof pressure sensors to detect the deformation and hence the pressure. Thissystem will also have temperature compensation. Diffused semiconductorstrain gauges with a very high sensitivity can be used to measure low pressures.A typical Manifold pressure gauge is seen in Fig.17.11. Here the strain gaugesare diffused on the diaphragm that is square in shape.
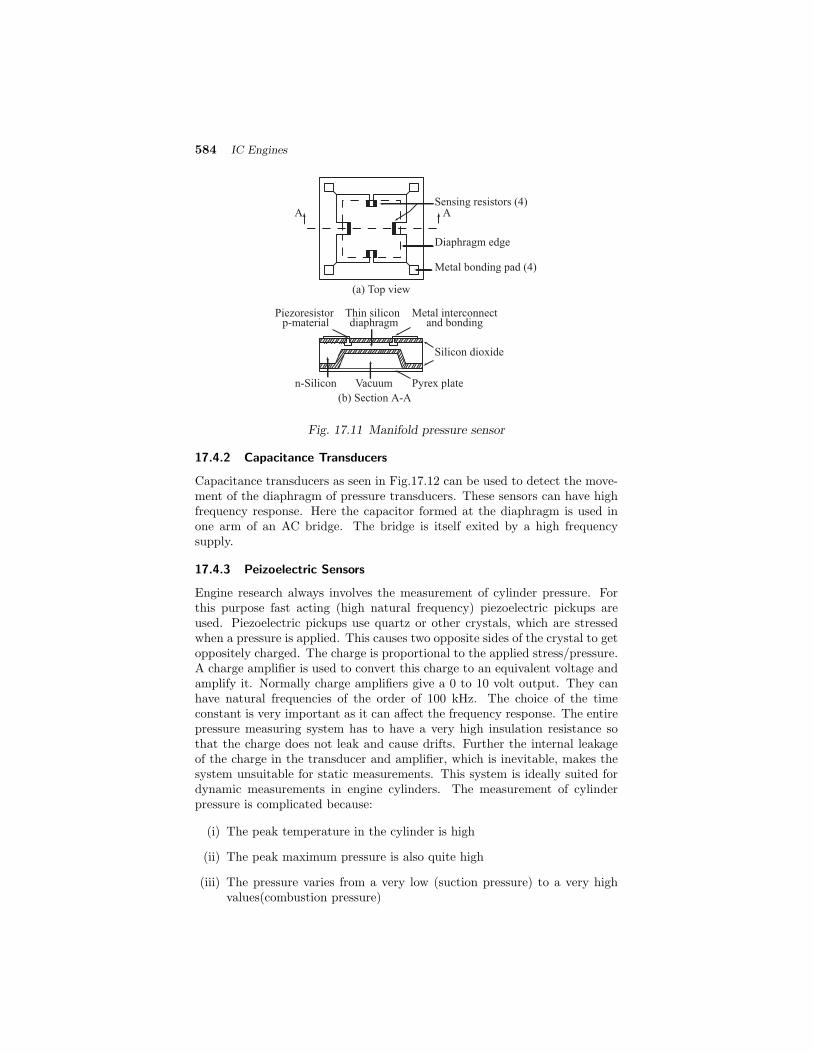
584 IC Engines
A ASensing resistors (4)
Diaphragm edge
Metal bonding pad (4)
(a) Top view
Piezoresistor p-material
Thin silicon diaphragm
Metal interconnectand bonding
Silicon dioxide
n-Silicon Pyrex plateVacuum
(b) Section A-A
Fig. 17.11 Manifold pressure sensor
17.4.2 Capacitance Transducers
Capacitance transducers as seen in Fig.17.12 can be used to detect the move-ment of the diaphragm of pressure transducers. These sensors can have highfrequency response. Here the capacitor formed at the diaphragm is used inone arm of an AC bridge. The bridge is itself exited by a high frequencysupply.
17.4.3 Peizoelectric Sensors
Engine research always involves the measurement of cylinder pressure. Forthis purpose fast acting (high natural frequency) piezoelectric pickups areused. Piezoelectric pickups use quartz or other crystals, which are stressedwhen a pressure is applied. This causes two opposite sides of the crystal to getoppositely charged. The charge is proportional to the applied stress/pressure.A charge amplifier is used to convert this charge to an equivalent voltage andamplify it. Normally charge amplifiers give a 0 to 10 volt output. They canhave natural frequencies of the order of 100 kHz. The choice of the timeconstant is very important as it can affect the frequency response. The entirepressure measuring system has to have a very high insulation resistance sothat the charge does not leak and cause drifts. Further the internal leakageof the charge in the transducer and amplifier, which is inevitable, makes thesystem unsuitable for static measurements. This system is ideally suited fordynamic measurements in engine cylinders. The measurement of cylinderpressure is complicated because:
(i) The peak temperature in the cylinder is high
(ii) The peak maximum pressure is also quite high
(iii) The pressure varies from a very low (suction pressure) to a very highvalues(combustion pressure)
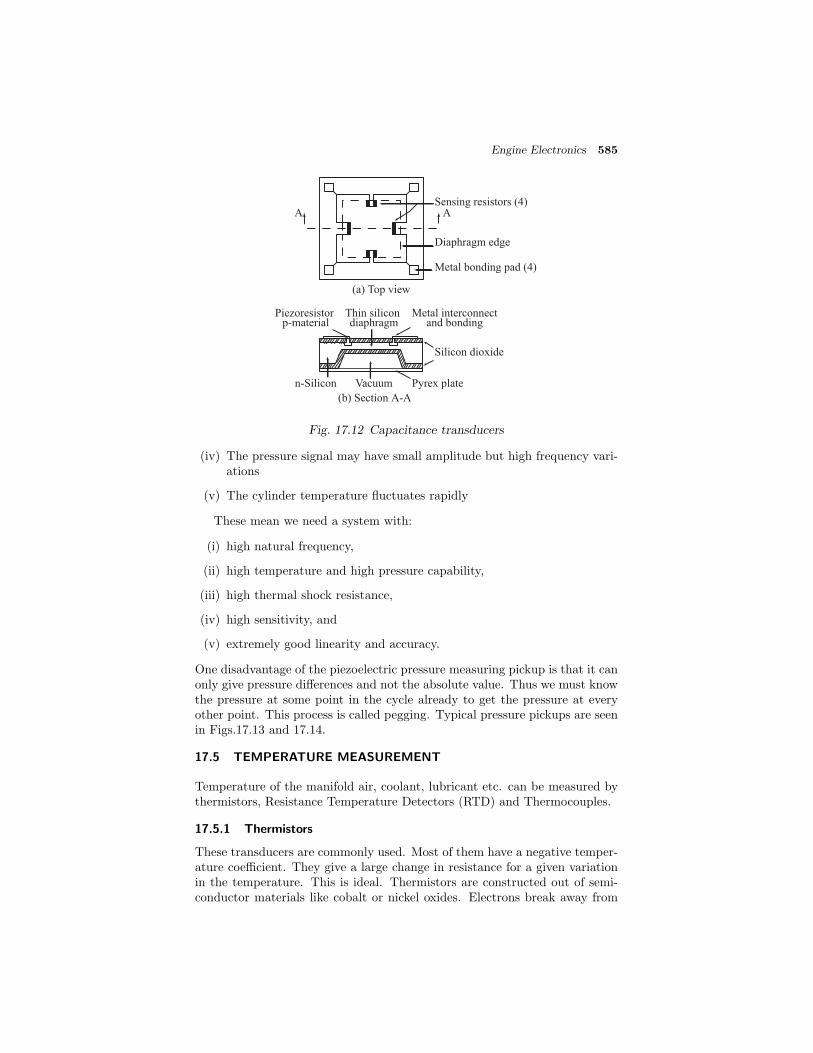
Engine Electronics 585
A ASensing resistors (4)
Diaphragm edge
Metal bonding pad (4)
(a) Top view
Piezoresistor p-material
Thin silicon diaphragm
Metal interconnectand bonding
Silicon dioxide
n-Silicon Pyrex plateVacuum
(b) Section A-A
Fig. 17.12 Capacitance transducers
(iv) The pressure signal may have small amplitude but high frequency vari-ations
(v) The cylinder temperature fluctuates rapidly
These mean we need a system with:
(i) high natural frequency,
(ii) high temperature and high pressure capability,
(iii) high thermal shock resistance,
(iv) high sensitivity, and
(v) extremely good linearity and accuracy.
One disadvantage of the piezoelectric pressure measuring pickup is that it canonly give pressure differences and not the absolute value. Thus we must knowthe pressure at some point in the cycle already to get the pressure at everyother point. This process is called pegging. Typical pressure pickups are seenin Figs.17.13 and 17.14.
17.5 TEMPERATURE MEASUREMENT
Temperature of the manifold air, coolant, lubricant etc. can be measured bythermistors, Resistance Temperature Detectors (RTD) and Thermocouples.
17.5.1 Thermistors
These transducers are commonly used. Most of them have a negative temper-ature coefficient. They give a large change in resistance for a given variationin the temperature. This is ideal. Thermistors are constructed out of semi-conductor materials like cobalt or nickel oxides. Electrons break away from

586 IC Engines
Electrical contact
Insulator
Passage way (water)
Electrode
Housing
Temperature compensator
Sensing surface Diaphragm
Cool passage
Quartz
Fig. 17.13 Piezoelectric transducers
Cap
Insulator
Conductor
Coolant passageway
Quartz crystal
half cylinder
Diaphragm
Connector thread
InsulatorDessicent
Backup cylinder
Optically flat
cylinder surface
Electrode
Housing
Temperature
compensator
Sensing surface
Coolant passageway
Fig. 17.14 Piezoelectric transducers
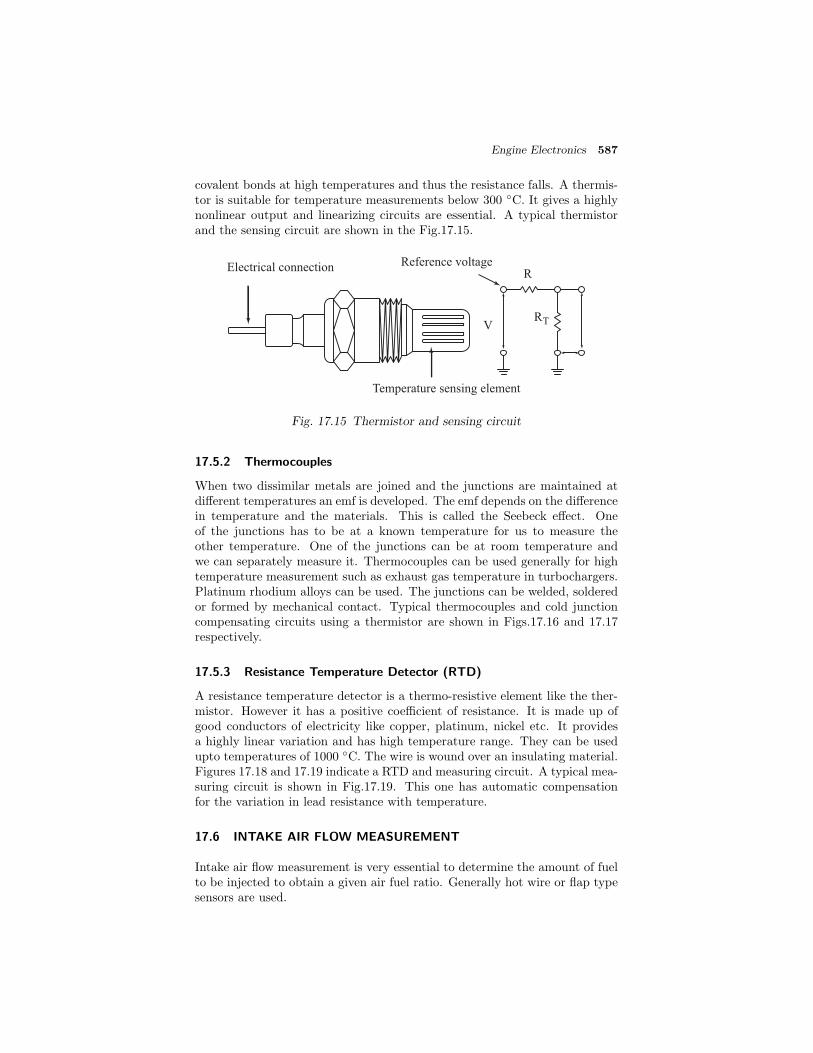
Engine Electronics 587
covalent bonds at high temperatures and thus the resistance falls. A thermis-tor is suitable for temperature measurements below 300 ◦C. It gives a highlynonlinear output and linearizing circuits are essential. A typical thermistorand the sensing circuit are shown in the Fig.17.15.
Electrical connection
Temperature sensing element
Reference voltageR
VRT
Fig. 17.15 Thermistor and sensing circuit
17.5.2 Thermocouples
When two dissimilar metals are joined and the junctions are maintained atdifferent temperatures an emf is developed. The emf depends on the differencein temperature and the materials. This is called the Seebeck effect. Oneof the junctions has to be at a known temperature for us to measure theother temperature. One of the junctions can be at room temperature andwe can separately measure it. Thermocouples can be used generally for hightemperature measurement such as exhaust gas temperature in turbochargers.Platinum rhodium alloys can be used. The junctions can be welded, solderedor formed by mechanical contact. Typical thermocouples and cold junctioncompensating circuits using a thermistor are shown in Figs.17.16 and 17.17respectively.
17.5.3 Resistance Temperature Detector (RTD)
A resistance temperature detector is a thermo-resistive element like the ther-mistor. However it has a positive coefficient of resistance. It is made up ofgood conductors of electricity like copper, platinum, nickel etc. It providesa highly linear variation and has high temperature range. They can be usedupto temperatures of 1000 ◦C. The wire is wound over an insulating material.Figures 17.18 and 17.19 indicate a RTD and measuring circuit. A typical mea-suring circuit is shown in Fig.17.19. This one has automatic compensationfor the variation in lead resistance with temperature.
17.6 INTAKE AIR FLOW MEASUREMENT
Intake air flow measurement is very essential to determine the amount of fuelto be injected to obtain a given air fuel ratio. Generally hot wire or flap typesensors are used.

588 IC Engines
Fig. 17.16 ThermocouplesIsothermal block
Voltmeter
Copper
Chromel
Alumel
Junction semiconductor
temperature sensor
Copper
Comp circuit
EcomprefT
refT
+ _
+
_
Fig. 17.17 Compensating circuit
Resistance element
Protective sheath
Plating port
Fig. 17.18 A resistance temperature detector
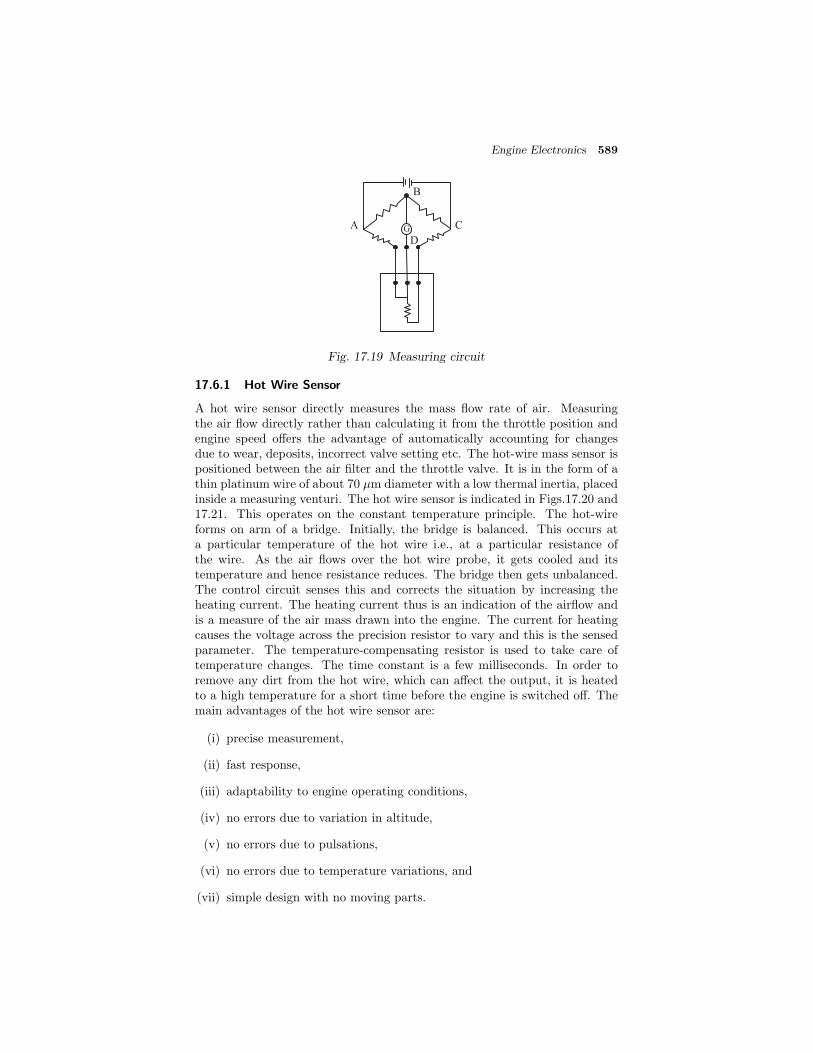
Engine Electronics 589
A
B
C
DG
Fig. 17.19 Measuring circuit
17.6.1 Hot Wire Sensor
A hot wire sensor directly measures the mass flow rate of air. Measuringthe air flow directly rather than calculating it from the throttle position andengine speed offers the advantage of automatically accounting for changesdue to wear, deposits, incorrect valve setting etc. The hot-wire mass sensor ispositioned between the air filter and the throttle valve. It is in the form of athin platinum wire of about 70 μm diameter with a low thermal inertia, placedinside a measuring venturi. The hot wire sensor is indicated in Figs.17.20 and17.21. This operates on the constant temperature principle. The hot-wireforms on arm of a bridge. Initially, the bridge is balanced. This occurs ata particular temperature of the hot wire i.e., at a particular resistance ofthe wire. As the air flows over the hot wire probe, it gets cooled and itstemperature and hence resistance reduces. The bridge then gets unbalanced.The control circuit senses this and corrects the situation by increasing theheating current. The heating current thus is an indication of the airflow andis a measure of the air mass drawn into the engine. The current for heatingcauses the voltage across the precision resistor to vary and this is the sensedparameter. The temperature-compensating resistor is used to take care oftemperature changes. The time constant is a few milliseconds. In order toremove any dirt from the hot wire, which can affect the output, it is heatedto a high temperature for a short time before the engine is switched off. Themain advantages of the hot wire sensor are:
(i) precise measurement,
(ii) fast response,
(iii) adaptability to engine operating conditions,
(iv) no errors due to variation in altitude,
(v) no errors due to pulsations,
(vi) no errors due to temperature variations, and
(vii) simple design with no moving parts.
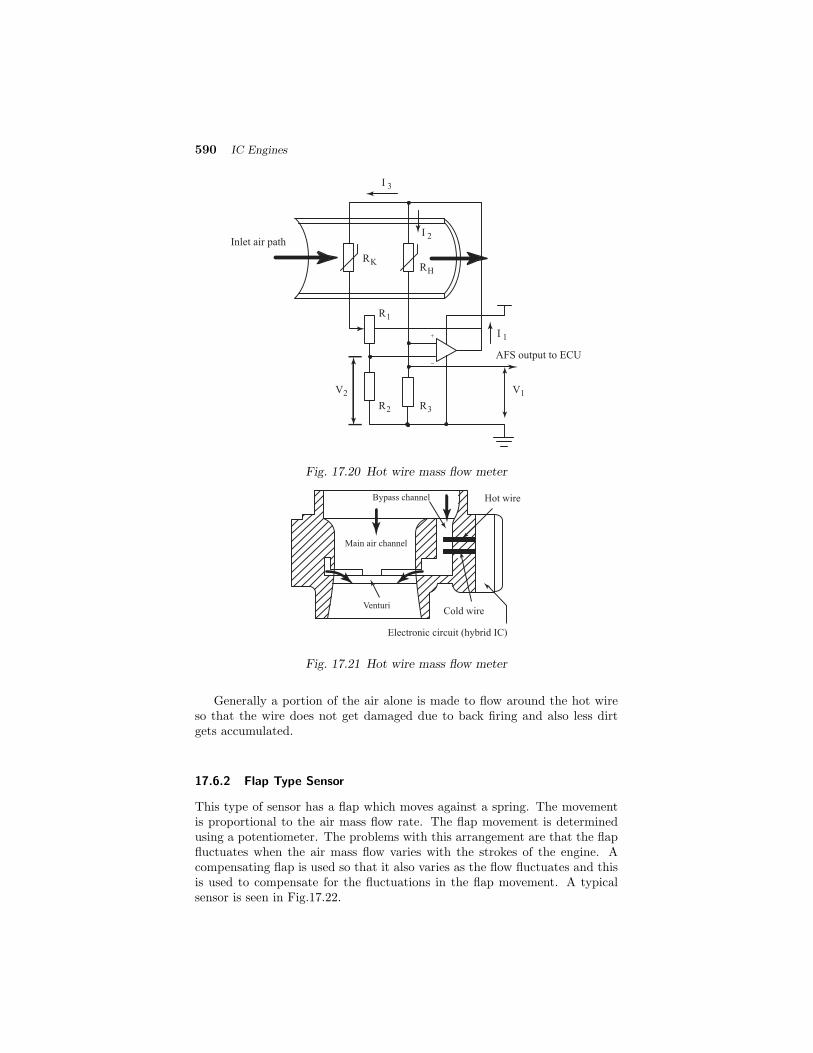
590 IC Engines
Inlet air path
AFS output to ECU
I 3
I 1
I 2
RKRH
R1
R2 R3
V1V2
+
_
Fig. 17.20 Hot wire mass flow meter
Main air channel
Bypass channel Hot wire
Cold wireVenturi
Electronic circuit (hybrid IC)
Fig. 17.21 Hot wire mass flow meter
Generally a portion of the air alone is made to flow around the hot wireso that the wire does not get damaged due to back firing and also less dirtgets accumulated.
17.6.2 Flap Type Sensor
This type of sensor has a flap which moves against a spring. The movementis proportional to the air mass flow rate. The flap movement is determinedusing a potentiometer. The problems with this arrangement are that the flapfluctuates when the air mass flow varies with the strokes of the engine. Acompensating flap is used so that it also varies as the flow fluctuates and thisis used to compensate for the fluctuations in the flap movement. A typicalsensor is seen in Fig.17.22.

Engine Electronics 591
Air outlet
Compensator flap
Air inlet
Air temperature
sensor
7 pin connector
Fuel pump contacts
Damping chamber
Spiral spring Potentiometer
Fig. 17.22 Flap type mass sensor
17.6.3 Vortex Sensor
Here a bluff body as seen in Fig.17.23 is located in the intake manifold. Asthe air passes vortices are shed by the bluff body. The frequency at whichthey are shed linearly depends on the flow velocity. These vortices producepressure disturbances which can be sensed by a microphone or piezo pressuredetector located on the downstream side of the bluff body. There are nomoving parts and wear. At idling this system produces signals of about 50 Hzand at maximum speed it may be about 1000 kHz. The output is shaped andsent out as a square pulse of varying frequency.
Side
Bluff body
PlanVortices
End
Flow
At low speed
0.1 s
At high speed
Outp
ut
volt
age
Air flow volume (l/s)
Outp
ut
signal
freq
uen
cy (
kH
z)
4.8 V
0.1 s
0.6 V
4.8 V0.6 V
Fig. 17.23 Vortex flow meter principle

592 IC Engines
17.7 EXHAUST OXYGEN SENSOR
Catalytic converters can operate efficiently only in a narrow band of air fuelratios. In order to maintain the excess air ratio, λ, within a narrow range, aclosed loop control of the air fuel ratio is needed. A schematic of the lambda(λ) sensor is indicated in Fig.17.24. The outer section of the ceramic body isin contact with the exhaust whilst the inner section is in contact with ambientair. The ceramic is made of zirconium dioxide. The surfaces are coated withporous platinum which acts as electrodes. A porous protective ceramic coatingis also applied on the outer surface.
O2
O2
O2
O2
O2
O2
AirElectron flow
Positive
Voltmeter (V)
Outer electrode
(porous platinum coat)
Exhaust gas
Boundary zones
Solid electrolyte
(zirconium dioxide ceramic)
Protective ceramic
porous coating
Oxygen ion with
two negative charges
Exhaust gas
Negative
Fig. 17.24 Oxygen level sensor
The lambda sensor measures the oxygen concentration in the exhaustgases. When the oxygen concentration on both sides of the cell is differ-ent there is a voltage output. The voltage characteristics of this sensor areindicated in Fig.17.25. The voltages given are for a sensor operating at about600 ◦C. The temperature of the sensor affects the conductivity of the ions.Thus the curve depends strongly on the sensor temperature. The responsealso depends on the sensor temperature. At the ideal operating temperatureof about 600 ◦C, the response time is less than 50 ms. Hence, the Lambdasensor and the closed loop control are active only after the sensor reaches atemperature of about 350 ◦C. The sensor must not be placed very close to theexhaust valve because temperatures in excess of about 850 ◦C can damage it.The sensor is heated electrically at low load conditions and by the exhaust athigh loads. A heated sensor can be located far away from the exhaust valveand also becomes operational fast.
17.7.1 Knock Sensor
On line knock control can allow the engine to be operated at high thermalefficiencies without damage due to knock. Knock control systems use a sensor,

Engine Electronics 593
Rich mixture (deficiency of air) Lean mixture (excess air)
+
+
+
+
+
++ _
_
_
_
_
_+
+
+
+ _
_
_
_
_
_
_
_
_O2
AirGas
+ve -ve800
mv O2
AirGas
+ve -ve50
mv
O2
200
600
800
400
00.8 0.9 1.0 1.1 1.2
12.0 13.5 15 16.5 18 Excess air factor (λ)
Air-fuel mixture ratio
V1
Flow of electrons
Fig. 17.25 Voltage characteristics
which is basically a piezoelectric vibration pickup. A typical knock sensoris seen in Fig.17.26. This is mounted on the cylinder block at a suitablelocation. This sensor has a high natural frequency. It has a mass held on apiezoelectric crystal. Any vibration makes the mass to alternatively compressand relieve the piezoelectric crystal thus producing a voltage variation as seenin the figure. This system will respond to engine vibrations also. Howeverknock frequency is particular to a given engine and depends on the size of thecylinder. Thus the signal is filtered to get the knock output. The intensity ofthis signal determined the knock level.
Typical signal when knock is registered
Piezoelectric crystal
Seismic mass
Bolt
Electrical output
Fig. 17.26 Knock sensor

594 IC Engines
The various sensors discussed above are attached to the engine at appro-priate places and the outputs are monitored by the ECU. The informationabout the engine is already stored in the ECU. From the input from all thesensors helps the ECU to alter the ignition and injection timings as well asthe fuel flow rates. It makes the engine to run at optimum condition therebythe engine gives the best performance possible at all operating conditions.Thus engine electronics will play a major role in the engine management inthe future.
Review Questions
17.1 What are the principle aims of an engine developer?
17.2 What are the important parameters that could be controlled in an engine?
17.3 Why modern engines are electronically controlled?
17.4 Briefly explain a typical electronic engine management system.
17.5 What are various sensors that can be used for displacement and positionsensing in an engine? Briefly explain them.
17.6 Explain the various sensors that can be used for pressure measurements.
17.7 Explain the sensors used for temperature measurements.
17.8 Explain with figures the various methods and sensors that are used forinlet air flow measurements.
17.9 Give a brief account of exhaust oxygen sensor.
17.10 Explain briefly the working of a knock sensor.
Multiple Choice Questions (choose the most appropriate answer)
1. Hall effect pickup use
(a) inductive transducers
(b) potentiometers
(c) thermistors
(d) semiconductors
2. LVDT is used to measure
(a) crank angle
(b) engine speed
(c) large displacements
(d) gas temperature

Engine Electronics 595
3. The disadvantage of the piezoelectric pressure pickup is that
(a) it can only give pressure difference
(b) it can measure only low pressure
(c) it is not suitable for dynamic measurement
(d) has too much sensitivity
4. Thermistors are desirable because of their
(a) linear output
(b) large temperature coefficient
(c) suitability for high temperature
(d) none of the above
5. Seebeck effect is used in
(a) thermistors
(b) thermocouples
(c) RTD
(d) hot-wire sensor
6. Hot-wire sensors are used for measurement of
(a) temperature
(b) pressure
(c) mass flow rate
(d) smoke intensity
7. Knock sensors use
(a) thermistors
(b) thermocouples
(c) piezoelectric pickup
(d) flap type sensors
8. Catalytic converters use lambda (λ) sensors to keep
(a) exhaust temperature constant
(b) exhaust pressure constant
(c) excess air ratio within a range
(d) flow rate of air constant
596 IC Engines
9. Strain gauges are mainly used to measure
(a) pressure
(b) temperature
(c) velocity
(d) viscosity
10. Electro-optical sensors are used for
(a) lubricating oil flow measurement
(b) cooling water flow measurement
(c) position and speed measurement
(d) piston temperature measurement
Ans: 1. – (d) 2. – (c) 3. – (a) 4. – (b) 5. – (b)6. – (c) 7. – (c) 8. – (c) 9. – (a) 10. – (c)
18SUPERCHARGING
18.1 INTRODUCTION
It will be the principal aim of the engine designer, to achieve the twin goals ofimproved power output and minimum exhaust emissions. The power outputof a naturally aspirated engine depends mainly on the following five factors:
(i) Amount of air inducted into the cylinder.
(ii) Extent of utilization of the inducted air.
(iii) The speed of the engine.
(iv) Quantity of fuel admitted and its combustion characteristics.
(v) Thermal efficiency of the engine.
The last two factors are inter-dependent and major modifications might berequired to achieve complete combustion and therefore may not be a preferredmethod. The brake power of the engine is given by
bp =pbm × Vs × n×K
60000(18.1)
There are two factors in the expression apart from number of cylinders andcubic capacity of the engine can increase the power output. They are (i) n, andpbm. Hence, for a given cubic capacity of the engine, (Vs ×K) by increasingthe speed (number of power strokes) power output can be increased. However,friction will also increase and therefore, there will be a limit to the speed.
The most preferred method of increasing the power output is by meansof increasing the mean effective pressure. This can be achieved by supplyingair or air-fuel mixture at a pressure which is higher than the atmosphericpressure. This will increase the density, thereby the mass of air or air-fuelmixture inducted for the same swept volume. This in turn will increase thepower output of the engine.
This method of supplying air or fuel-air mixture higher than the pres-sure at which the engine naturally aspirates, by means of a boosting deviceis called the supercharging. The device which boosts the pressure is calledsupercharger.
18.2 SUPERCHARGING
Supercharging of internal combustion engines is in practice for a long timeas a method for improving engine power output. Entering the millennium, anew trend is appearing. The trend points to small displacement engines in

598 IC Engines
order to meet emission legislation on fuel consumption and emission control.The consumers, however, still demand equally the same or better performancethey are used to.
A good way to meet these needs is to have supercharging which may becalled forced induction. As already stated, the purpose of supercharging anengine is to raise the density of the air charge, before it enters the cylinders.Thus, the increased mass of air will be inducted which will then be compressedin each cylinder. This makes more oxygen available for combustion than theconventional method of drawing the fresh air charge into the cylinder (natu-rally aspirated). Consequently, more air and fuel per cycle will be forced intothe cylinder, and this can be effectively burnt during the combustion processto raise the engine power output to a higher value than would otherwise bepossible.
The points to be noted in supercharging an engine summarized as:
(i) Supercharging increases the power output of the engine. It does notincrease the fuel consumption, per brake kW hour.
(ii) Certain percentage of power is consumed in compressing the air. Thispower has to be taken from the engine itself. This will lead to somepower loss. However, it is seen that the net power output will be morethan the power output of an engine of the same capacity, without su-percharging.
(iii) The engine should be designed to withstand the higher forces due tosupercharging.
(iv) The increased pressure and temperature as a result of supercharging,may lead to detonation, Therefore the fuel used must have better anti-knock characteristics.
In practice, racing car engines use supercharging. The most importantareas where supercharging is of vital importance are :
(i) Marine and automotive engines where weight and space are important.
(ii) Engines working at high altitudes. The power loss due to altitude canbe compensated by supercharging.
18.3 TYPES OF SUPERCHARGERS
Supercharger is a pressure-boosting device which supplies air (or mixture) ata higher pressure. A centrifugal or axial flow or displacement type compressoris normally used. If the supercharger is driven by the engine crankshaft, thenit is called mechanically driven supercharger. Some superchargers are drivenby a gas turbine, which derives its power from the engine exhaust gases. Sucha supercharger is called turbocharger. There are three types of superchargers
(i) Centrifugal type
(ii) Root’s type
(iii) Vane type
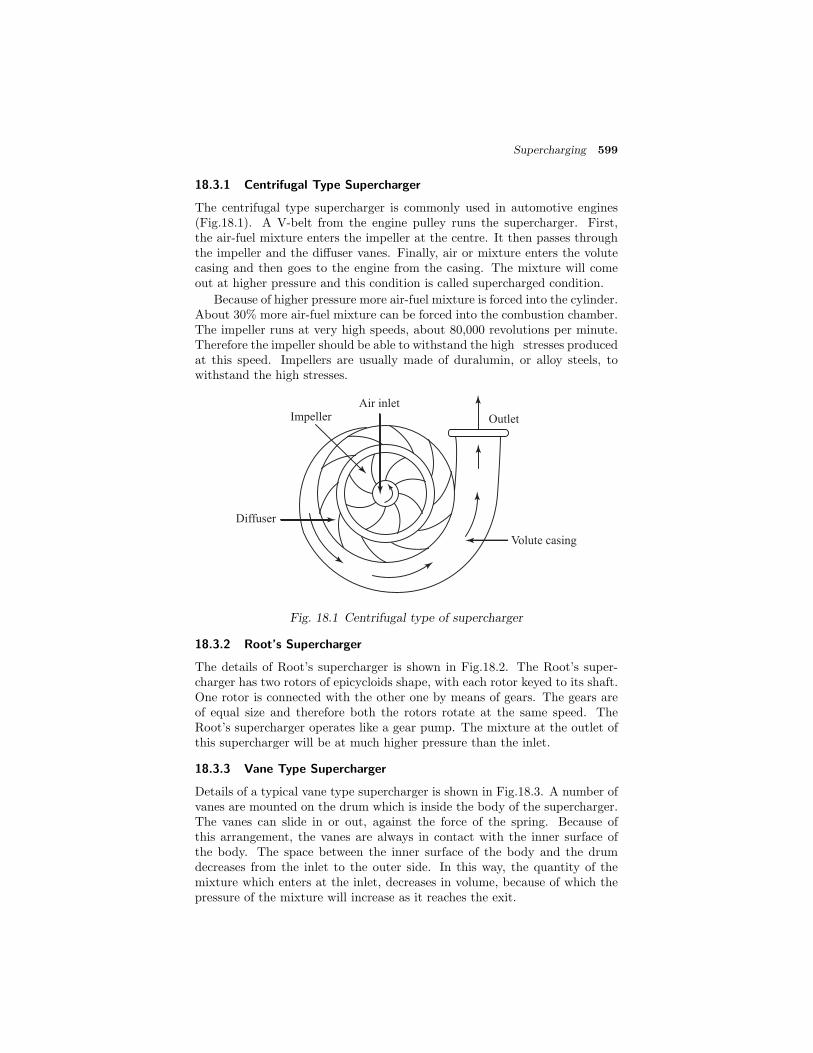
Supercharging 599
18.3.1 Centrifugal Type Supercharger
The centrifugal type supercharger is commonly used in automotive engines(Fig.18.1). A V-belt from the engine pulley runs the supercharger. First,the air-fuel mixture enters the impeller at the centre. It then passes throughthe impeller and the diffuser vanes. Finally, air or mixture enters the volutecasing and then goes to the engine from the casing. The mixture will comeout at higher pressure and this condition is called supercharged condition.
Because of higher pressure more air-fuel mixture is forced into the cylinder.About 30% more air-fuel mixture can be forced into the combustion chamber.The impeller runs at very high speeds, about 80,000 revolutions per minute.Therefore the impeller should be able to withstand the high stresses producedat this speed. Impellers are usually made of duralumin, or alloy steels, towithstand the high stresses.
Air inletImpeller
Diffuser
Volute casing
Outlet
Fig. 18.1 Centrifugal type of supercharger
18.3.2 Root’s Supercharger
The details of Root’s supercharger is shown in Fig.18.2. The Root’s super-charger has two rotors of epicycloids shape, with each rotor keyed to its shaft.One rotor is connected with the other one by means of gears. The gears areof equal size and therefore both the rotors rotate at the same speed. TheRoot’s supercharger operates like a gear pump. The mixture at the outlet ofthis supercharger will be at much higher pressure than the inlet.
18.3.3 Vane Type Supercharger
Details of a typical vane type supercharger is shown in Fig.18.3. A number ofvanes are mounted on the drum which is inside the body of the supercharger.The vanes can slide in or out, against the force of the spring. Because ofthis arrangement, the vanes are always in contact with the inner surface ofthe body. The space between the inner surface of the body and the drumdecreases from the inlet to the outer side. In this way, the quantity of themixture which enters at the inlet, decreases in volume, because of which thepressure of the mixture will increase as it reaches the exit.

600 IC Engines
Rotor
Inlet
Outlet
Fig. 18.2 Root’s supercharger
Vanes
Body
Drum
Inlet
Outlet
Fig. 18.3 Vane type supercharger
18.3.4 Comparison between the Three Superchargers
The required characteristics of a centrifugal type supercharger is poor andsuitable for only low speeds. The root’s supercharger is simple in construc-tion, requires only minimum maintenance and has longer life. The vane typesupercharger has a special problem of wear of tips of the vanes with time.Therefore, one has to take into account the application and then decide thetype of supercharger for that application.
18.4 METHODS OF SUPERCHARGING
Necessary amount of compressed air (or mixture) can be supplied to the enginein the following ways.
(i) Independently driven compressor or blower, usually driven by an electricmotor.
(ii) Ram effect.
(iii) Underpiston supercharging.
Supercharging 601
(iv) Kadenacy system (applied to two stroke engines).
(v) Engine driven compressor or blower.
The details of the above five methods of supercharging are briefly discussedin the following sections.
The two other important superchargers viz., gear driven supercharger andexhaust driven superchargers will be discussed in detail in subsequent sections.
18.4.1 Electric Motor Driven Supercharging
In this type the compressor is driven independently usually by an electricmotor. The speed of the supercharger can be varied independent of enginespeed and therefore control is comparatively easier.
18.4.2 Ram Effect of Supercharging
The ram effect of supercharging system consists primarily of tuned inlet pipes.These pipes induce resonant harmonic air oscillations. The kinetic energy ofthese oscillations provides a ramming effect. For the efficient operation of thissystem, the engine speed must be kept constant.
18.4.3 Under Piston Supercharging
Under piston method of supercharging has so far been confined to large marinefour stroke engines of the crosshead type. It utilizes the bottom side of thepiston for compressing the air. The bottom ends of the cylinder are closed offand provided with suitable valves. This system gives an adequate supply ofcompressed air, as there are two delivery strokes to each suction stroke of thecycle.
18.4.4 Kadenacy System of Supercharging
The kadenacy system utilizes the energy in the exhaust system to cause adepression of pressure in the cylinder. This depression makes the scavenge airto flow into the cylinder. A blower may also be used with this system, but itis not an essential.
The kadenacy system is based on the following principle: When the ex-haust ports or valves are opened rapidly during the end of expansion stroke,there is, within the first interval of a few thousandths of a second, an urge orimpulse in the gases to escape very rapidly from the cylinder. The escapinggases leave behind a pressure depression.
At the above moment, the fresh charge of air (or mixture) is allowed toenter the cylinder behind the exhaust gases by suitable timing of the admissionvalve or ports. For the best result a proper timing and skillful design of theexhaust system is a must.
The exhaust blowdown must be rapid to get a good-sized puff. In thisrespect, the exhaust ports are better than valves, and the ports with squareupper edges are better than those with rounded upper edges. The impulsemust arrive at the exhaust duct of the concerned cylinder at the right timesome 15 to 20◦, before exhaust valve closure. This will depend upon the

602 IC Engines
timing of the blow down and the travel time of the wave from the source ofits origin. In this method, the exhaust pressure is low (even sub-atmosphericduring the greater part of the scavenging period). Hence, scavenging takesplace against lower resistance and the intake pressure need not be high. Thistype of supercharging is also called exhaust pulse supercharging.
18.5 EFFECTS OF SUPERCHARGING
Before supercharging an engine one should understand its effects. The follow-ing are the effects of supercharging engines. Some of the points refer to CIengines:
(i) Higher power output
(ii) Greater induction of charge mass
(iii) Better atomization of fuel
(iv) Better mixing of fuel and air
(v) Better scavenging of products
(vi) Better torque characteristic over the whole speed range
(vii) Quicker acceleration of vehicle
(viii) More complete and smoother combustion
(ix) Inferior or poor ignition quality fuel usage
(x) Smoother operation and reduction in diesel knock tendency
(xi) Increased detonation tendency in SI engines
(xii) Improved cold starting
(xiii) Reduced exhaust smoke
(xiv) Reduced specific fuel consumption, in turbocharging
(xv) Increased mechanical efficiency
(xvi) Increased thermal stresses
(xvii) Increased heat losses due to increased turbulence
(xviii) Increased gas loading
(xix) Increased valve overlap period of 60 to 160◦ of crank angle
(xx) Increased cooling requirements of pistons and valves

Supercharging 603
18.6 LIMITATIONS TO SUPERCHARGING
Due to supercharging, thermal load on the various parts of the engine in-creases. In some engines, the piston crown is provided with a hollow space.Oil or water is circulated through this space and thereby the piston crown iscooled. In some engines, the piston crown and the seat and the edges of theexhaust valves are usually made of better materials that can withstand highertemperatures. Increased gas loading caused by supercharging necessitates theuse of larger bearing areas and heavier engine components
In an existing engine if supercharging has to be adopted, one should firststudy the factors that limit the extent of supercharging that can be tried.Further certain modifications have to be made to the engine to safeguard thesame and to get the full benefit of supercharging. These are discussed below:
The permissible extent of supercharging depends upon the ability of theengine to withstand the increased gas loading and thermal stresses. Durability,reliability and fuel economy are the main considerations that limit the degreeof supercharging of an engine Because of the increased heat generation andheat transfer, there is a greater tendency to bum the piston crown and theseat and edges of the exhaust valves. To overcome this problem, the valveoverlap is usually greater in supercharged engines. The valve overlap mayvary from about 80 to 160 degree of crank travel. Increased valve overlappermits greater time during which cooler air will flow past the valves and thepiston crown. This cools the exhaust valve seat, the exhaust valves and thepiston crown.
18.7 THERMODYNAMIC ANALYSIS OF SUPERCHARGED ENGINECYCLE
The ideal dual-combustion cycle of a mechanically driven supercharged engineis shown in Fig.18.4. The corresponding cycle for a naturally aspirated engineis shown in Fig.18.5. The pressure p1 represents the supercharging pressureand p6 = p7 , is the exhaust pressure. Area 9 − 10 − 1 − 11 − 9 representsthe work supplied from the engine to the super charger as it is mechanicallydriven. The various processes for the supercharged and naturally aspiratedengine are given in Table 18.1.
Table 18.1 Various processes for the supercharged and naturally aspiratedengine
Process S.C. engine N.A. engineInduction 8 → 1 7−6
Compression 1 → 2 1 − 2
Heat addition 2 → 3 − 4 2 − 3 − 4
Expansion 4 − 5 4 − 5
Heat rejection 5 − 1 5 − 1
As could be seen from the Figs.18.4 and Fig.18.5 the supercharged engineinducts air at a higher pressure (p8 = p1) compared to naturally aspirated
604 IC Engines
engine (p7 = p
6 = atmospheric). Hence the density and thereby the mass ofair (m) going into supercharged engine will be higher than the mass of airgoing into the naturally aspirated engine (m ). That is to say m > m .
From the Fig.18.4, it can be noted that the net work output of the super-charged engine cycle is a function of two positive work and one negative. Itis given by
Wsc = Engine work output (+ve) + Gas exchange work (+ve)−
Supercharger work (-ve) (18.2)
= (Area 1− 2− 3− 4− 5− 1) + (Area 8− 1− 6− 7− 8)−
(Area 9− 10− 11− 12− 9) (18.3)
It is to be noted that positive gas exchange area 8-1-6-7-8 may be greaterthan the negative area 9-10-11-12-9. It should be noted that there is a lossof work which is not recoverable. Further, it is to be kept in mind that withincrease in supercharging pressure the negative work, will also increase andtherefore there will be a limit for supercharging. The ideal efficiency of thesupercharged engine will decrease with increase in supercharging pressure.However, it is to be understood that the net increase in power output is dueto increase in mass of charge at condition 1 (Fig.18.4) for supercharged enginecompared to the mass of charge for naturally aspirated engine at conditions 1
(Fig.18.5). The density of charge at 1 is greater than the density of chargeat 1 for the same stroke volume Vs. Further, in naturally aspirated actualengines, there is a negative work due to gas exhaust process.
It is to be emphasized again that the gain in output of supercharged engineis mainly due to increase in the mass of air inducted for the same swept volume.The additional mass of air inducted may also be due to compression of theresidual gas volume to higher pressure. The rate of increase of maximumcylinder pressure is less than the rate of increase of brake mean effectivepressure for supercharged engine. Thus mechanical efficiency of superchargedengine is better than that of a naturally aspirated engine.
18.8 POWER INPUT FOR MECHANICAL DRIVEN SUPERCHARGER
Assuming adiabatic compression of air, the work done on the superchargerper kg of air is given by
w = −
vdp = h2 − h1 (18.4)
= Cp(T2 − T1) = CpT1
p2p1
γ−1
γ
− 1
(18.5)
where T1 = initial temperature, p1 = initial pressure p2 = delivery pressure.And, with the isentropic efficiency of ηc
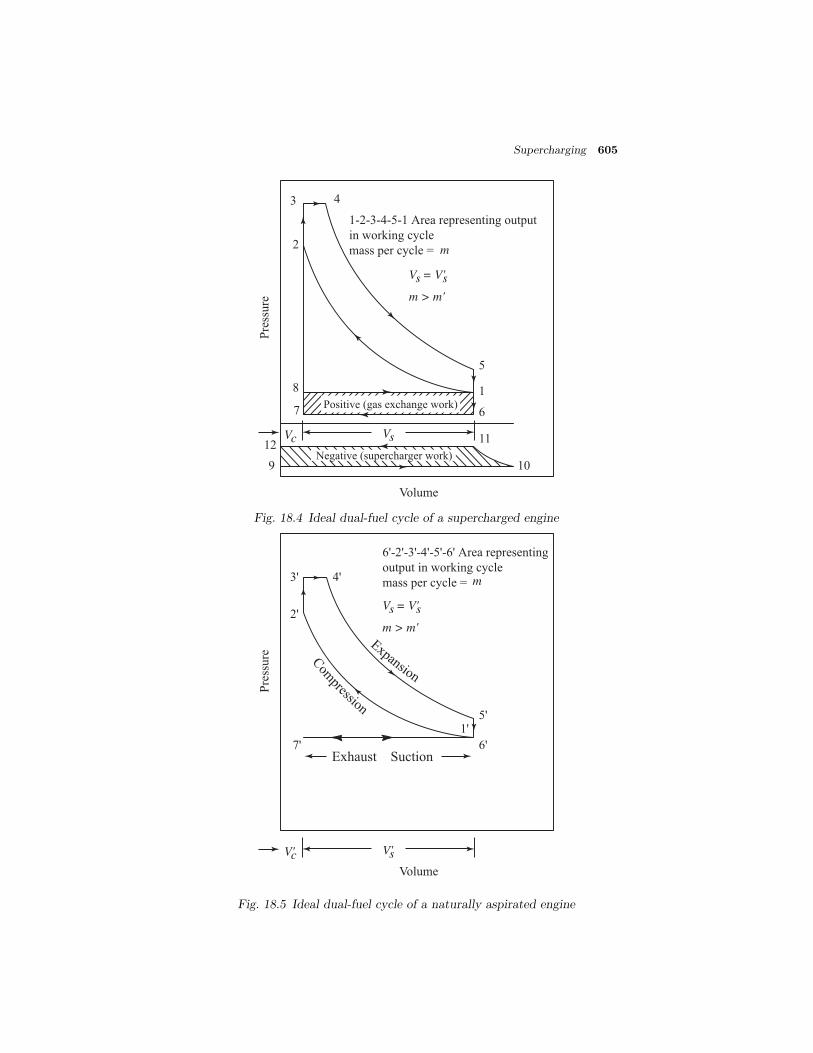
Supercharging 605
Pre
ssure
1-2-3-4-5-1 Area representing output
in working cycle
mass per cycle =
Volume
11
6
1
5
10
7
8
2
3 4
9
12Negative (supercharger work)
Positive (gas exchange work)
m
m > m'
V = V'ss
V sV c
Fig. 18.4 Ideal dual-fuel cycle of a supercharged engine
Pre
ssure
Volume
6'
1'5'
7'
2'
3' 4'
m > m'
V = V'ss
V' sV' c
6'-2'-3'-4'-5'-6' Area representing
output in working cycle
mass per cycle = m
Exhaust Suction
Com
pression
Expansion
Fig. 18.5 Ideal dual-fuel cycle of a naturally aspirated engine

606 IC Engines
w =CpT1ηc
p2p1
γ−1
γ
− 1
(18.6)
where wis the power input to the compressor per unit mass flow rate, ηc isthe isentropic efficiency of the compressor and T1 is the inlet temperature tothe compressor. Thus power required to drive the compressor is given by
=
maCpT1
p2p1
γ−1
γ − 1
60× ηc
kW (18.7)
where ma is mass of air supplied by supercharger in kg/min and Cp is specificheat of air in kJ/kg K. This power may be supplied by
(i) a separate drive viz. by a motor or any other prime mover driving thesuper charger
(ii) connecting the supercharger to engine output shaft
(iii) exhaust gas driven gas turbine which is called turbocharging .
18.9 GEAR DRIVEN AND EXHAUST DRIVEN SUPERCHARGINGARRANGEMENTS
Two main types of supercharging arrangements are shown in Fig.18.6 and18.7. Figure 18.6(a) shows the compressor coupled to the engine with step upgearing to increase the rotational speed of compressor. In this case a certainpercentage of engine output is utilized to drive the compressor. The netoutput increase due to supercharging is obtained by subtracting this powerfrom the engine gross output. The ideal indicator diagrams shown in Fig.18.4are based on this method. Aftercooler is also shown, by which the cool air tothe engine can be sent if so desired. This will further increase the density ofthe intake air.
Figure 18.6(b) shows an engine with free exhaust driven compressor. Theengines, so equipped are said to be turbo-supercharged. In this case theexhaust energy of the engine is used to drive the turbine which is coupledto a compressor. There is no mechanical coupling of compressor or turbinewith the engine. The exhaust pipe of engine is however connected to inlet ofturbine. In this case engine output is not utilized to drive the compressor.
In Fig.18.7(a), compressor, engine, and turbine are all geared together.The Wright Turbo-compound air plane engine is an example. In this case, ifthe turbine output is insufficient to run the compressor particularly at partloads, the engine power takes care of the remaining load of compressor. Also,the additional power from the turbine can be fed to the engine.
Figure 18.7(b) shows the gas generator type of arrangement. In this caseengine drives only the compressor. Air from the compressor flows through theengine and the exhaust gases drive a power turbine. Most free-piston engineswork on this principle.

Supercharging 607
Inlet to
compressor
Gear
Engine
Load
A
Exhaust from
engine
After cooler
Outlet from
compressor 23
4
1
Inlet to
engine
(a)
Engine
Exhaust
Exhaust from
turbine
Inlet to
compressor
After cooler
4
23
Inlet to
engine
Load
A
1
(b)
Fig. 18.6 Supercharging arrangements
18.10 TURBOCHARGING
In turbocharging, the supercharger is being driven by a gas turbine which usesthe energy in the exhaust gases. There is no mechanical linkage between theengine and the supercharger. The major parts of a turbocharger are turbinewheel, turbine housing, turboshaft, compressor wheel, compressor housingand bearing housing. Figures 18.8 and 18.9 show the principle of exhaustturbocharging of a single cylinder engine and a Vee type engine with chargecooling unit respectively.
During engine operation, hot exhaust gases blowout through the exhaustvalve opening into the exhaust manifold. The exhaust manifold and the con-necting tubing route these gases into the turbine housing. As the gases passthrough the turbine housing, they strike on the fins or blades on the turbinewheel. When the engine load is high enough, there is enough gas flow and

608 IC Engines
Engine
Inlet to
compressor
After cooler
43
Inlet to
engine
Load
A
Gear Exhaust
from turbine
1
Exhaust from
engine
5
Outlet from
compressor 2
Inlet to
compressor
Engine
Load
A
After cooler
Outl
et f
rom
com
pre
ssor
2
3
4
1
Inlet to
engine
Inlet to
turbine
Exhaust from
turbine
Exhaust from
engine
5
(a)
(b)
Fig. 18.7 Methods of supercharging
this makes the turbine wheel to spin rapidly. The turbine wheel is connectedto the compressor wheel by the turboshaft. As such, the compressor wheelrotates with the turbine which sucks air into the compressor housing. Cen-trifugal force throws the air outward. This causes the air to flow out of theturbocharger and into the engine cylinder under pressure. In the case of tur-bocharging, there is a phenomena called turbolag. It refers to the short delayperiod before the boost or manifold pressure increases. This is due to the timethe turbocharger assembly takes the exhaust gases to accelerate the turbineand compressor wheel to speed up.
In the turbocharger assembly, there is a control unit called waste gate.This unit limits the maximum boost pressure to prevent detonation in SIengines and the maximum pressure and engine damage. It is a diaphragmoperated valve that can bypass part of the gases around the turbine wheelwhen manifold pressure is quite high.
The computer controlled turbocharging system uses engine sensors, a mi-croprocessor and a waste gate solenoid. The solenoid when energized or deen-ergized by the computer, can open or close the waste gate. By this way, theboost pressure can be controlled closely. The exhaust smoke comparison for a

Supercharging 609
Exhaust valve
Engine
Spark plug
Inlet valve
Waste gate actuator
Exhaust waste gate
Exhaust gas
Exhaust gas turbine
Rotory compressorAir-fuel mixture
Gas
es
Mix
ture
Fig. 18.8 Principles of exhaust turbocharging of a single-cylinder engine
Compressed air
After cooler
Gases
Compressor
Turbine
Exhaust gas
Engine
Air
Fig. 18.9 Exhaust turbocharging of a ”V” type engine

610 IC Engines
diesel engine for a naturally aspirated and turbocharged version, for differentloads can be seen in Fig.18.10 There is an appreciable reduction in smoke inthe case of turbocharged engine in the overload operation.
50 70 90 110 % Load
0
20
40
60
80
100
Exhau
st s
moke
Turbocharged
Nat
ura
lly
aspir
ated
Fig. 18.10 Exhaust smoke comparison for naturally aspirated and tur-bocharged diesel engines
18.10.1 Charge Cooling
When air charge is compressed, it becomes hot. When air charge leaves thecompressor, it is at a much higher temperature than ambient air temperature.During supercharging, the temperature of air increases from 60 to 95 ◦C.When air gets heated, it expands and the density reduces. Because of this,the mass of air entering the cylinder becomes lesser. This reduces oxygenavailability in the cylinder for combustion. Further, supply of hot air tothe engine may increase engine operating temperature. As such, charge iscooled by way of intercooling and/or after cooling to overcome these problems.However, this adds to the complexity of the system.
Worked out Examples
18.1 A three-litre four-stroke diesel engine develops 12 kW per m3 of free airinducted per minute. The volumetric efficiency is 82% at 3600 rpm re-ferred to atmospheric condition of 1 bar and 27 ◦C. A rotary compressorwhich is mechanically coupled to the engine is used to supercharge theengine. The pressure ratio and the isentropic efficiency of the compres-sor are 1.6 and 75% respectively. Calculate the percentage increase inbrake power due to supercharging.
Supercharging 611
Assume mechanical efficiency of the engine to be 85% and air intaketo the cylinder to be at the pressure equal to delivery pressure fromcompressor and temperature equal to 5.6 ◦C less than the delivery tem-perature of the compressor. Also assume that cylinder contains volumeof charge equal to swept volume.
Solution
Naturally aspirated engine
Swept volume, Vs =3
1000× 3600
2= 5.4 m3/min
Actual volume/min of air inductedVa = Vs × ηv = 5.4× 0.82 = 4.428 m3/min
Indicated power developed by the engine
Va × P = 4.428× 12 = 53.136 kW
Brake power developed = 0.75× 53.136 = 39.852
Pressure ratio of the compressorp2p1
= r = 1.6
Delivery pressure of the compressor,pa
= 1× 1.6 = 1.6 bar
T
2
T1= (r)
γ−1
γ = (1.6)0.41.4 = 1.144
T
2 = 300× 1.144 = 343.2 K
ηc =T
2 − T1T2 − T1
= T
T2 = T1 +1
ηc(T
2 − T1)
= 300 +1
0.7× (343.2− 300) = 361.7 K
Actual temperature at the exit of the compressor
= 361.6− 273 = 88.7 K
Actual intake temperature of the engine
= 88.7− 5.7 = 83◦ C = 356 K
When supercharged, the engine takes in air at a pressure p2 of 1.6 bar ,a pressure p2 and temperature T2 of 356 K. The swept volume is still 5.4

612 IC Engines
m3/min and ηv will be > 100%. At atmospheric conditions the correspondingvolume, (V1) will be
p1V1T1
=p2V2T2
V1 =p2p1× T1
T2× V2 =
1.6
1× 300
356× 5.4
= 7.281 m3/min (Note ηv > 100
Increased intake volume rate of air due to supercharging is given by= 7.281− 4.428 = 2.853 m3/min
The corresponding increase in indicated power of the engine due to super-charging
= 2.853× 12 = 34.236 kW
Additional indicated power developed due to positive gas exchange work be-cause of increase in intake pressure
=Δp× Vs
1000× 60
=(1.6− 1)× 105 × 5.4
1000× 60
= 5.4 kW
Total increase in ip = 34.236 + 5.4 = 39.636 kW
Total increase in bp = ηmech × ip = 0.75× 39.636 = 29.727
ma =1.6× 105 × 5.4
0.287× 356= 8.46 kg/min
(Note that the delivery temperature from compressor is 361.6 K but massis calculated at 356 K since volume occupied by this mass is known only at356 K being the swept volume of cylinder)
Power required to run the compressor
= maCpΔTac
=8.46
60× 1.005× (361.6− 300) = 8.73 kW
Net increase in bp = 29.73− 8.73 = 21 kW
% increase in bp =21
39.852= 52.7%
Ans⇐=
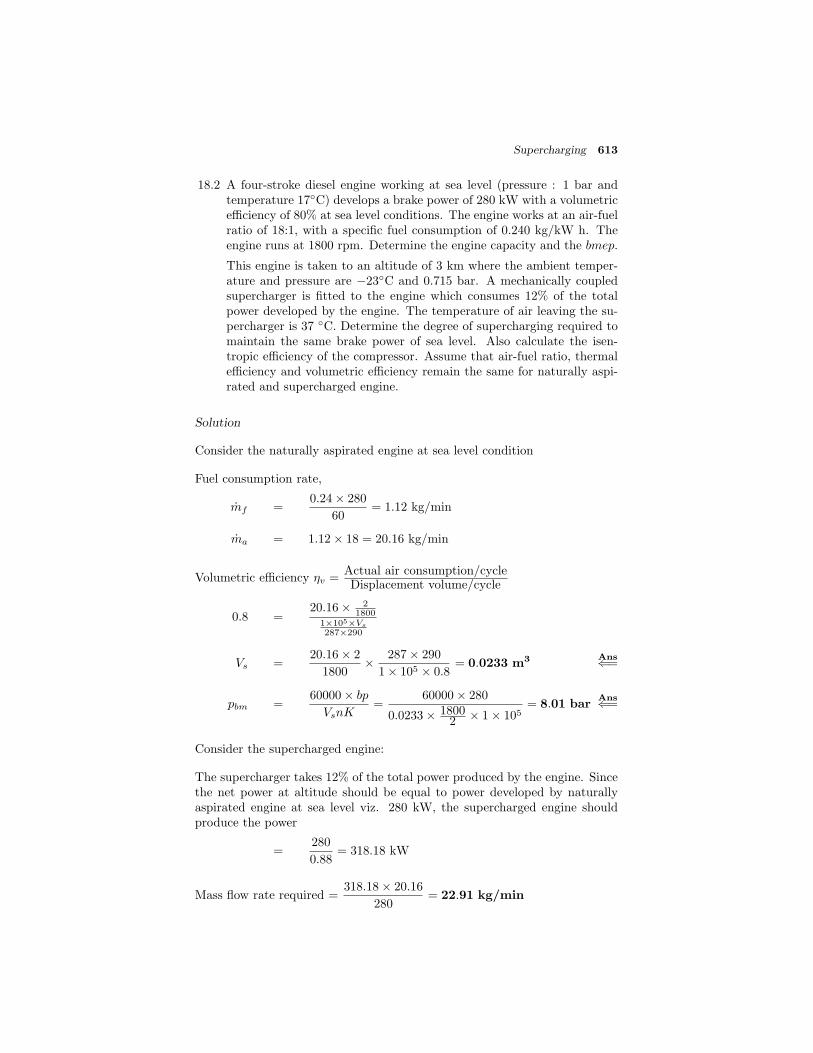
Supercharging 613
18.2 A four-stroke diesel engine working at sea level (pressure : 1 bar andtemperature 17◦C) develops a brake power of 280 kW with a volumetricefficiency of 80% at sea level conditions. The engine works at an air-fuelratio of 18:1, with a specific fuel consumption of 0.240 kg/kW h. Theengine runs at 1800 rpm. Determine the engine capacity and the bmep.
This engine is taken to an altitude of 3 km where the ambient temper-ature and pressure are −23◦C and 0.715 bar. A mechanically coupledsupercharger is fitted to the engine which consumes 12% of the totalpower developed by the engine. The temperature of air leaving the su-percharger is 37 ◦C. Determine the degree of supercharging required tomaintain the same brake power of sea level. Also calculate the isen-tropic efficiency of the compressor. Assume that air-fuel ratio, thermalefficiency and volumetric efficiency remain the same for naturally aspi-rated and supercharged engine.
Solution
Consider the naturally aspirated engine at sea level condition
Fuel consumption rate,
mf =0.24× 280
60= 1.12 kg/min
ma = 1.12× 18 = 20.16 kg/min
Volumetric efficiency ηv =Actual air consumption/cycleDisplacement volume/cycle
0.8 =20.16× 2
18001×105×Vs
287×290
Vs =20.16× 2
1800× 287× 290
1× 105 × 0.8= 0.0233 m3 Ans⇐=
pbm =60000× bp
VsnK=
60000× 280
0.0233× 18002 × 1× 105
= 8.01 barAns⇐=
Consider the supercharged engine:
The supercharger takes 12% of the total power produced by the engine. Sincethe net power at altitude should be equal to power developed by naturallyaspirated engine at sea level viz. 280 kW, the supercharged engine shouldproduce the power
=280
0.88= 318.18 kW
Mass flow rate required =318.18× 20.16
280= 22.91 kg/min
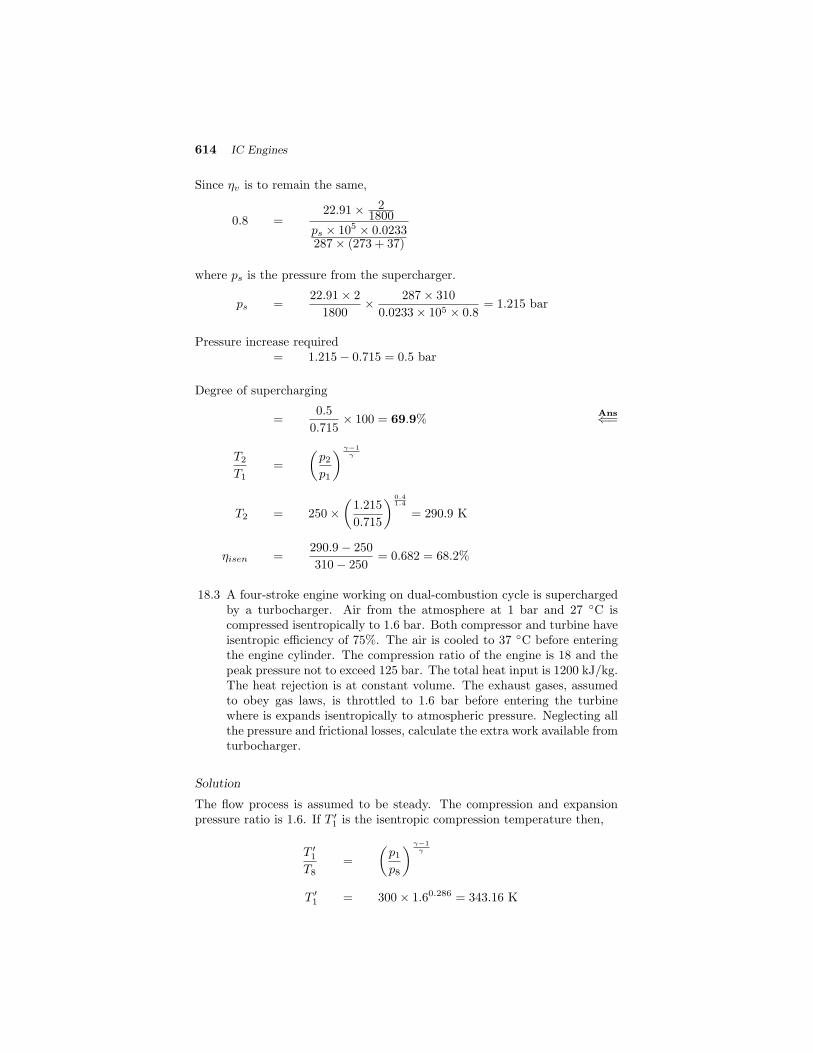
614 IC Engines
Since ηv is to remain the same,
0.8 =22.91× 2
1800ps × 105 × 0.0233287× (273 + 37)
where ps is the pressure from the supercharger.
ps =22.91× 2
1800× 287× 310
0.0233× 105 × 0.8= 1.215 bar
Pressure increase required= 1.215− 0.715 = 0.5 bar
Degree of supercharging
=0.5
0.715× 100 = 69.9%
Ans⇐=
T2T1
=
p2p1
γ−1
γ
T2 = 250×
1.215
0.715
0.41.4
= 290.9 K
ηisen =290.9− 250
310− 250= 0.682 = 68.2%
18.3 A four-stroke engine working on dual-combustion cycle is superchargedby a turbocharger. Air from the atmosphere at 1 bar and 27 ◦C iscompressed isentropically to 1.6 bar. Both compressor and turbine haveisentropic efficiency of 75%. The air is cooled to 37 ◦C before enteringthe engine cylinder. The compression ratio of the engine is 18 and thepeak pressure not to exceed 125 bar. The total heat input is 1200 kJ/kg.The heat rejection is at constant volume. The exhaust gases, assumedto obey gas laws, is throttled to 1.6 bar before entering the turbinewhere is expands isentropically to atmospheric pressure. Neglecting allthe pressure and frictional losses, calculate the extra work available fromturbocharger.
Solution
The flow process is assumed to be steady. The compression and expansionpressure ratio is 1.6. If T
1 is the isentropic compression temperature then,
T
1
T8=
p1p8
γ−1
γ
T
1 = 300× 1.60.286 = 343.16 K

Supercharging 615
3 4
2
5
16
7
8
0
9
Pre
ssure
Volume
Area 0-6-7-9-0 = Turbine work
Area 0-1-8-9-0 = Compressor work
Area 1-6-7-8-1 = Additional work
1-2-3-4-5-1
8-1-6-7
8-1
6-7
Ideal dual combustion cycle
Turbocharged cycle
Isentropic compression
Isentropic expansion
Throttling
Additional work
T1 = T8 +T
1 − T8ηc
= 300 +343.16− 300
0.75
= 357.55
Now work of compression in the turbocharger for unit mass flow rate
Wc = CpΔTactual = 1.005× (357.55− 300)
= 57.84 kJ/kg
The air is cooled in the after-cooler from 357.55 K to (273+37) = 310 K.Consider the engine cycle.
The temperature after compressionT2 = T1r
γ−1 = 310× 180.4 = 985.1 K
p2 = p1rγ = 1.6× 181.4 = 91.52 bar
T3 =p3p2× T2 =
125
91.52× 985.1 = 1345.5 K
Heat supplied during constant volume
qv = Cv(T3 − T2) = 0.717× (1345.5− 985.1)
= 258.41 kJ/kg
The heat added during constant pressure process
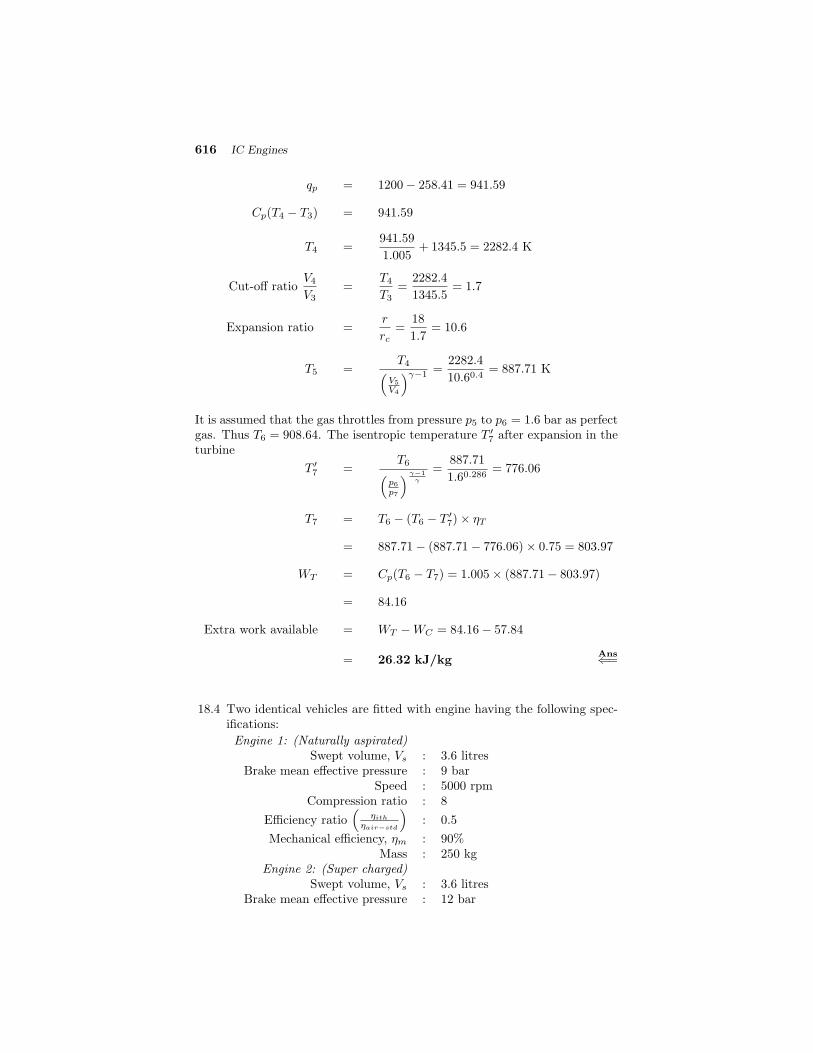
616 IC Engines
qp = 1200− 258.41 = 941.59
Cp(T4 − T3) = 941.59
T4 =941.59
1.005+ 1345.5 = 2282.4 K
Cut-off ratioV4V3
=T4T3
=2282.4
1345.5= 1.7
Expansion ratio =r
rc=
18
1.7= 10.6
T5 =T4
V5V4
γ−1 =2282.4
10.60.4= 887.71 K
It is assumed that the gas throttles from pressure p5 to p6 = 1.6 bar as perfectgas. Thus T6 = 908.64. The isentropic temperature T
7 after expansion in theturbine
T
7 =T6
p6p7
γ−1
γ
=887.71
1.60.286= 776.06
T7 = T6 − (T6 − T
7)× ηT
= 887.71− (887.71− 776.06)× 0.75 = 803.97
WT = Cp(T6 − T7) = 1.005× (887.71− 803.97)
= 84.16
Extra work available = WT −WC = 84.16− 57.84
= 26.32 kJ/kgAns⇐=
18.4 Two identical vehicles are fitted with engine having the following spec-ifications:
Engine 1: (Naturally aspirated)Swept volume, Vs : 3.6 litres
Brake mean effective pressure : 9 barSpeed : 5000 rpm
Compression ratio : 8
Efficiency ratio
ηithηair−std
: 0.5
Mechanical efficiency, ηm : 90%Mass : 250 kg
Engine 2: (Super charged)Swept volume, Vs : 3.6 litres
Brake mean effective pressure : 12 bar

Supercharging 617
Speed : 5000 rpmCompression ratio : 6
(lowered to avoid knocking)
Efficiency ratio
ηithηair−std
: 0.5
Mechanical efficiency, ηm : 90%Mass : 260 kg
Identify the engine first. If both engines are supplied with just enoughfuel for the test run, determine the duration of the test run so thatspecific mass (engine mass + fuel) is the same for both the arrangements.Take the calorific value of the fuel as 43 MJ/kg.
Solution
Since compression ratio is less than 10, they must be petrol engines. Considerfirst the naturally aspirated engine.
bp1 =pbmVsnK
60000=
9× 10⁵
60000× 3.6
1000× 5000
2
= 135 kWAns⇐=
ip1 =bp1ηm
=135
0.9= 150 kW
ηair−std = 1− 1
rγ−1= 1− 1
80.4= 0.5647 = 56.47%
ηith1 = ηair × ηratio = 0.5647× 0.5 = 0.2824
Mass flow rate of fuel mfna
mfna =ip
ηith× 3600
CV=
150
0.2824× 3600
43000= 44.47 kg/h
If the test duration is t hours then specific mass is given by
mass
ip1
$$$$na
=250 + 44.47t
150= 1.67 + 0.2965 t (1)
Now consider the supercharged engine
bp2 =pbmLAnK
60000=
12× 105
60000× 3.6
1000× 5000
2
= 180 kWAns⇐=
ip2 =bp2ηm
=180
0.9= 200 kW
ηair−std = 1− 1
rγ−1= 1− 1
60.4= 0.5116 = 51.16%
Ans⇐=

618 IC Engines
ηith2 = ηair × ηratio = 0.5116× 0.5 = 0.2558
mfsc =ip
ηith× 3600
CV=
200
0.2558× 3600
43000= 65.46 kg/h
If the test duration is t hours then specific mass is given by
mass
ip2
$$$$sc
=260 + 65.46t
180= 1.44 + 0.3637 t (2)
For the given condition,
1.67 + 0.2965t = 1.44 + 0.3637t
t = 3.42 hAns⇐=
18.5 A mechanically coupled supercharger is run by a four-stroke four-cylindersquare diesel engine with a bore of 100 mm as per the arrangementsshown in figure below.
340 K
me.
300 Kmc.
Air enters the compressor at 27 ◦C and the compressor pressure ratiois 1.6. From the compressor the air is passed on to a cooler where 1200kJ/min of heat is rejected. The air leaves the cooler at 67 ◦C. Some airfrom the compressor is bled after the cooler to supercharge the engine.The volumetric efficiency is 85% based on intake manifold pressure andtemperature. The other details about the engine are: bp is 50 kW, speedis 3000 rpm and mechanical efficiency ηm is 85%.
Determine
(i) imep of the engine
(ii) air consumption rate of the engine
(iii) the air handling capacity of the compressor in kg/min.
Take isentropic efficiency the compressor to be 85%.
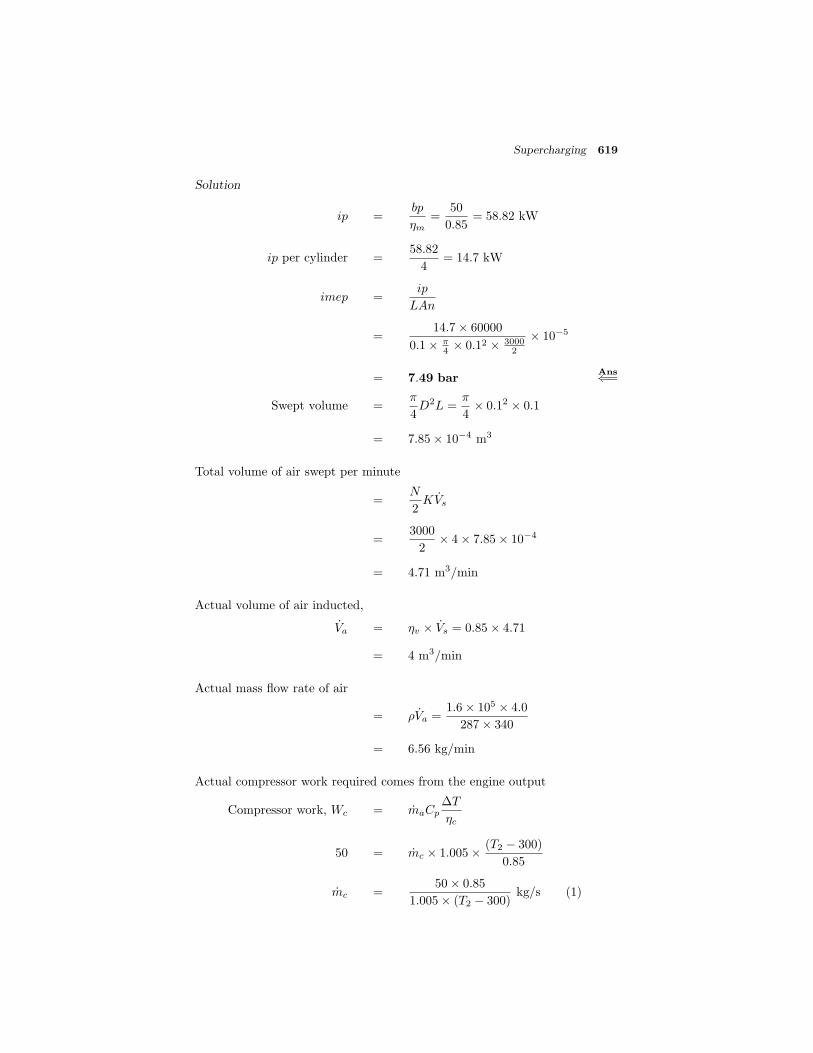
Supercharging 619
Solution
ip =bp
ηm=
50
0.85= 58.82 kW
ip per cylinder =58.82
4= 14.7 kW
imep =ip
LAn
=14.7× 60000
0.1× π4 × 0.12 × 3000
2
× 10−5
= 7.49 barAns⇐=
Swept volume =π
4D2L =
π
4× 0.12 × 0.1
= 7.85× 10⁻⁴ m3
Total volume of air swept per minute
=N
2KVs
=3000
2× 4× 7.85× 10−4
= 4.71 m3/min
Actual volume of air inducted,
Va = ηv × Vs = 0.85× 4.71
= 4 m3/min
Actual mass flow rate of air
= ρVa =1.6× 105 × 4.0
287× 340
= 6.56 kg/min
Actual compressor work required comes from the engine output
Compressor work, Wc = maCpΔT
ηc
50 = mc × 1.005× (T2 − 300)
0.85
mc =50× 0.85
1.005× (T2 − 300)kg/s (1)

620 IC Engines
Heat balance in the cooler gives
mc(T2 − 340) =Heat rejected in the cooler/min
60× Cp
mc =1200
60× 1.005× (T2 − 340)(2)
50× 0.85
1.005× (T2 − 300)=
1200
60× 1.005× (T2 − 340)
42.5
T2 − 300=
20
T2 − 340
T2 = 375.6 K
mc =42.5
375.6− 300= 0.5622 kg/s
= 0.5622× 60
= 33.732 kg/minAns⇐=
Review Questions
18.1 What are the factors that affect the power output of an engine? Explainhow supercharging helps to improve the power output.
18.2 What is meant by supercharging? What is its effect on engine perfor-mance?
18.3 Briefly explain the working of the following:
(i) Centrifugal supercharger
(ii) Roots supercharger
(iii) Vane type supercharger
Compare all the above superchargers.
18.4 Briefly explain the various methods of supercharging an engine.
18.5 Mention the effect of supercharging on engine performance.
18.6 What are the limitations of supercharging in an IC engine?
18.7 Make the thermodynamic analysis of a supercharged engine cycle.
18.8 With a neat sketch explain gear driven and exhaust driven superchargingmethods.
18.9 What do you understand by the term turbocharging?
18.10 Explain with a neat sketch the principle of exhaust turbocharging of asingle-cylinder engine.

Supercharging 621
Exercise
18.1 A 2.5-litre four-stroke diesel engine develops 10 kW per m3 of free airinducted per minute. The volumetric efficiency is 82% at 3600 rpmreferred to atmospheric condition of 1 bar and 27 ◦C.
A rotary compressor which is mechanically coupled to the engine isused to supercharge the engine. The pressure ratio and the isentropicefficiency of the compressor are 1.6 and 75% respectively. Calculate thepercentage increase in brake power due to supercharging.
Assume mechanical efficiency of the engine to be 82% and air intaketo the cylinder to be at the pressure equal to delivery pressure fromcompressor and temperature equal to 7 ◦C less than the delivery tem-perature of the compressor. Also assume that cylinder contains volumeof charge equal to swept volume. Ans: 77.26%
18.2 A four-stroke diesel engine working at sea level (pressure : 1 bar andtemperature 17◦C) develops a brake power of 300 kW with a volumetricefficiency of 85% at sea level conditions. The engine works at an air-fuelratio of 17:1, with a specific fuel consumption of 0.25 kg/kW-h. Theengine runs at 2000 rpm. Determine the engine capacity and the bmep.
This engine is taken to an altitude of 3 km where the ambienttemperature and pressure are −23◦C and 0.715 bar. A mechani-cally coupled supercharger is fitted to the engine which consumes12% of the total power developed by the engine. The tempera-ture of air leaving the supercharger is 35 ◦C. Determine the degreeof supercharging required to maintain the same brake power of sealevel. Also calculate the isentropic efficiency of the compressor. As-sume that air-fuel ratio, thermal efficiency and volumetric efficiencyremain the same for naturally aspirated and supercharged engine.
Ans: (i) 0.0208 m3 (ii) 8.65 bar (iii) 68.83% (iv) 69.6%
18.3 A four-stroke engine working on dual-combustion cycle is superchargedby a turbocharger. Air from the atmosphere at 1 bar and 30 ◦C iscompressed isentropically to 1.5 bar. Both compressor and turbine haveisentropic efficiency of 80%. The air is cooled to 37 ◦C before enteringthe engine cylinder. The compression ratio of the engine is 17 and thepeak pressure not to exceed 125 bar. The total heat input is 1200 kJ/kg.The heat rejection is at constant volume. The exhaust gases, assumedto obey gas laws, is throttled to 1.5 bar before entering the turbinewhere is expands isentropically to atmospheric pressure. Neglecting allthe pressure and frictional losses, calculate the extra work available fromturbocharger. Ans: 49.52 kJ/kg
18.4 Two identical vehicles are fitted with engine having the following spec-ifications:
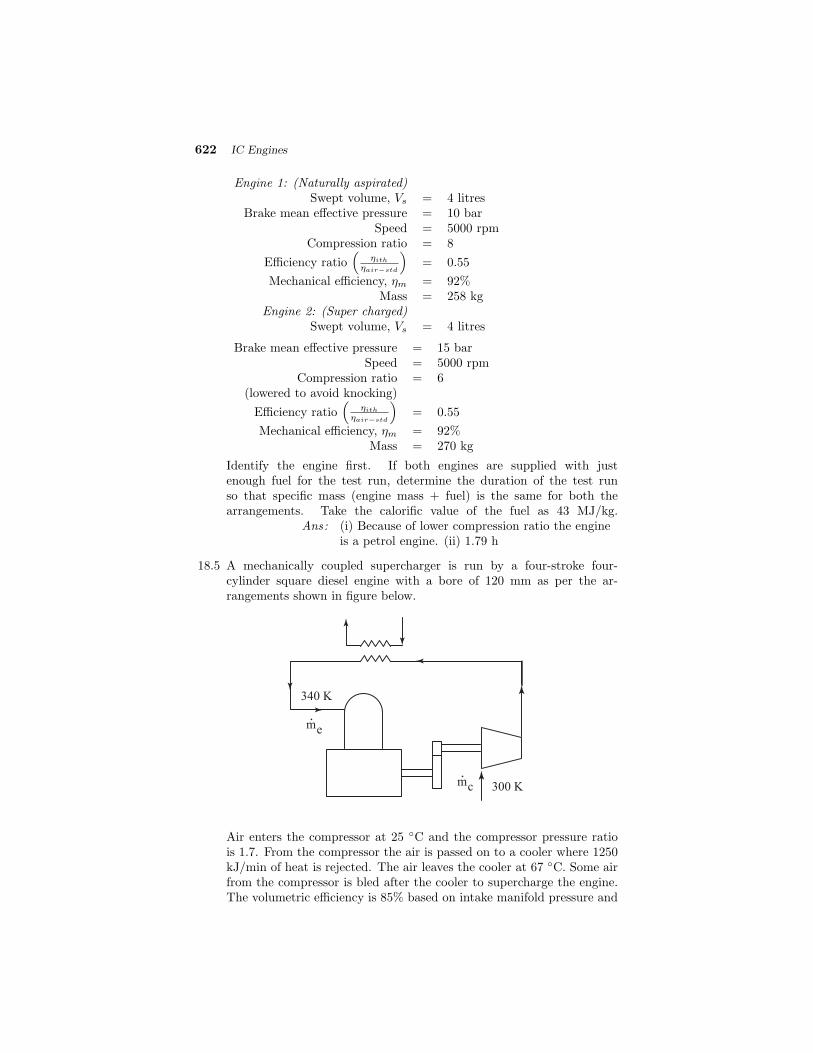
622 IC Engines
Engine 1: (Naturally aspirated)Swept volume, Vs = 4 litres
Brake mean effective pressure = 10 barSpeed = 5000 rpm
Compression ratio = 8
Efficiency ratio
ηithηair−std
= 0.55
Mechanical efficiency, ηm = 92%Mass = 258 kg
Engine 2: (Super charged)Swept volume, Vs = 4 litres
Brake mean effective pressure = 15 barSpeed = 5000 rpm
Compression ratio = 6(lowered to avoid knocking)
Efficiency ratio
ηithηair−std
= 0.55
Mechanical efficiency, ηm = 92%Mass = 270 kg
Identify the engine first. If both engines are supplied with justenough fuel for the test run, determine the duration of the test runso that specific mass (engine mass + fuel) is the same for both thearrangements. Take the calorific value of the fuel as 43 MJ/kg.
Ans: (i) Because of lower compression ratio the engineis a petrol engine. (ii) 1.79 h
18.5 A mechanically coupled supercharger is run by a four-stroke four-cylinder square diesel engine with a bore of 120 mm as per the ar-rangements shown in figure below.
340 K
me.
300 Kmc.
Air enters the compressor at 25 ◦C and the compressor pressure ratiois 1.7. From the compressor the air is passed on to a cooler where 1250kJ/min of heat is rejected. The air leaves the cooler at 67 ◦C. Some airfrom the compressor is bled after the cooler to supercharge the engine.The volumetric efficiency is 85% based on intake manifold pressure and
Supercharging 623
temperature. The other details about the engine are: bp is 55 kW, speedis 3500 rpm and mechanical efficiency ηm is 85%.
Determine
(i) imep of the engine
(ii) actual air consumption rate of the engine
(iii) the air handling capacity of the compressor in kg/min.
Take isentropic efficiency the compressor to be 85%.
Ans: (i) 4.09 bar (ii) 14.068 kg/min (iii) 35.95 kg/min
Multiple Choice Questions (choose the most appropriate answer)
1. Supercharging increases the power output of the engine by
(a) increasing the charge temperature
(b) increasing the charge pressure
(c) increasing the speed of the engine
(d) quantity of fuel admitted
2. The centrifugal type supercharger is preferable only for
(a) low speeds
(b) high speeds
(c) high pressures
(d) none of the above
3. The advantage of Root’s supercharger is
(a) high pressure
(b) minimum maintenance
(c) consumes less power
(d) occupies less space
4. Supercharging air compressor is driven by
(a) exhaust gas turbine
(b) engine itself
(c) separate electrical motor
(d) none of the above
5. If turbochargers compressor is driven by
(a) exhaust gas turbine
(b) engine itself

624 IC Engines
(c) separate electrical motor
(d) none of the above
6. Cooling after compression is necessary to
(a) increase the density of air
(b) reduce engine operating temperatures
(c) both (a) and (b)
(d) increase exhaust temperature
7. Volumetric efficiency of supercharged engine is
(a) between 100 – 110%
(b) between 90 – 100%
(c) between 80 – 90%
(d) between 70 – 80%
8. Supercharging is normally done in
(a) racing cars
(b) marine engines
(c) automotive diesel engines
(d) none of the above
9. Compared to engine driven supercharger the exhaust driven super-charger is
(a) easy to handle
(b) supplies more air
(c) utilizes the exhaust energy of the engine
(d) matching with engine is easy
10. Types of supercharger are
(a) reciprocating type
(b) gear type
(c) centrifugal type
(d) none of the above
Ans: 1. – (b) 2. – (a) 3. – (b) 4. – (b) 5. – (a)6. – (c) 7. – (a) 8. – (d) 9. – (c) 10. – (c)

19TWO–STROKE ENGINES
19.1 INTRODUCTION
A two-stroke engine is one which completes its cycle of operation in one rev-olution of the crankshaft or in two strokes of the piston. In this engine thefunctions of the intake and exhaust processes of the four-stroke engine aretaken care of by the incoming fresh charge which is compressed either in thecrankcase or by means of a separate blower while the engine piston is nearthe bottom dead center. The engine piston needs only to compress the freshcharge and expand the products of combustion. Since a two-stroke enginewill have twice as many cycles per minute as a four-stroke engine operatingat the same speed and with the same number of cylinders, theoretically it willdevelop twice the power when operating at the same mean effective pressure.As with the four-stroke engine, the power output of this engine also dependsupon the number of kilograms of air per minute available for combustion.
In many two-stroke engines the mechanical construction is greatly simpli-fied by using the piston as a slide valve in conjunction with intake and exhaustports cut in the side of the cylinder. If the engine is running on Otto cycle,the charge consists of correct mixture of fuel and air whereas for the dieselor dual combustion cycles the charge will consist of pure air. The applicationof two-stroke principle to small high speed CI engines involves many difficul-ties, although these are by no means insurmountable. In case of SI engines,the two-stroke cycle principle has been applied to a large number of enginesranging from tiny single cylinder model engines developing a fraction of a kWto the largest of the aircraft units developing 2500 kW or more.
19.2 TYPES OF TWO-STROKE ENGINES
Depending upon the scavenging method used there are basically two types oftwo-stroke engines:
(i) crankcase scavenged engine
(ii) separately scavenged engine
The details of the above two types of two-stroke engines are discussedbriefly in the following sections.
19.2.1 Crankcase Scavenged Engine
One of the simplest types of two-stroke engines is shown in Fig.19.1. Inthis engine, the charge (fuel-air mixture in SI engine and air in CI engine)is compressed in the crankcase by the underside of the piston during theexpansion stroke. There are three ports in this engine.
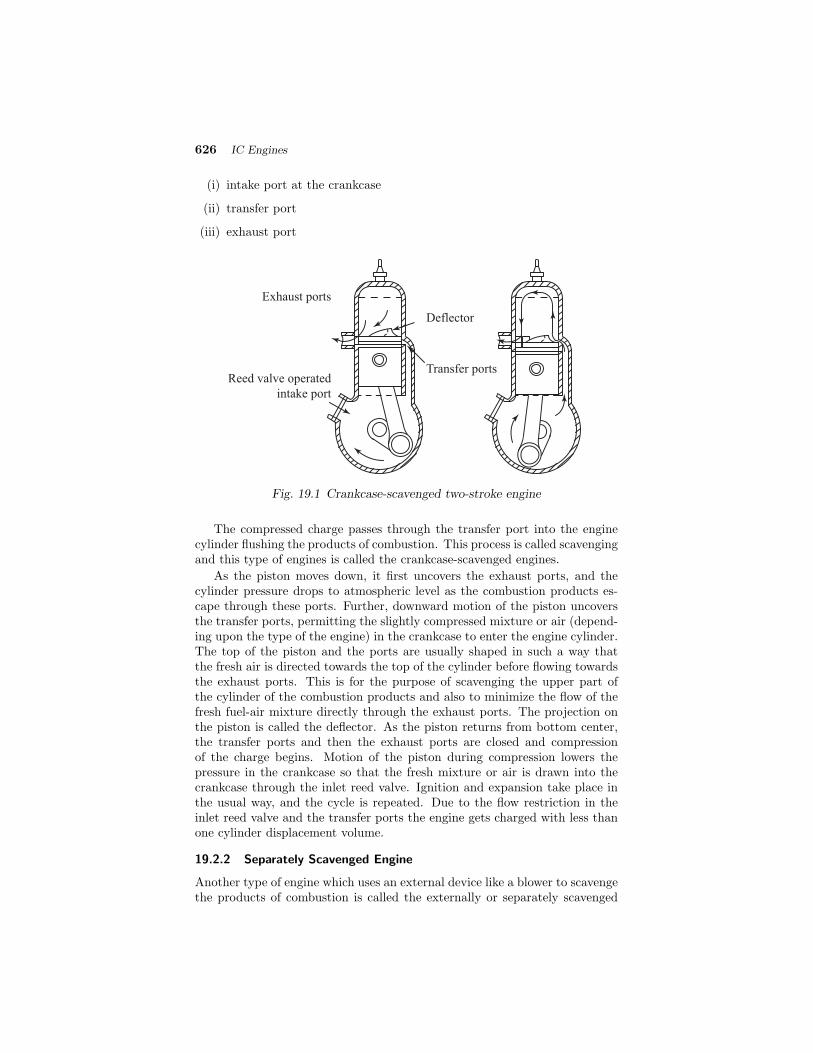
626 IC Engines
(i) intake port at the crankcase
(ii) transfer port
(iii) exhaust port
Exhaust ports
Reed valve operated
intake port
Deflector
Transfer ports
Fig. 19.1 Crankcase-scavenged two-stroke engine
The compressed charge passes through the transfer port into the enginecylinder flushing the products of combustion. This process is called scavengingand this type of engines is called the crankcase-scavenged engines.
As the piston moves down, it first uncovers the exhaust ports, and thecylinder pressure drops to atmospheric level as the combustion products es-cape through these ports. Further, downward motion of the piston uncoversthe transfer ports, permitting the slightly compressed mixture or air (depend-ing upon the type of the engine) in the crankcase to enter the engine cylinder.The top of the piston and the ports are usually shaped in such a way thatthe fresh air is directed towards the top of the cylinder before flowing towardsthe exhaust ports. This is for the purpose of scavenging the upper part ofthe cylinder of the combustion products and also to minimize the flow of thefresh fuel-air mixture directly through the exhaust ports. The projection onthe piston is called the deflector. As the piston returns from bottom center,the transfer ports and then the exhaust ports are closed and compressionof the charge begins. Motion of the piston during compression lowers thepressure in the crankcase so that the fresh mixture or air is drawn into thecrankcase through the inlet reed valve. Ignition and expansion take place inthe usual way, and the cycle is repeated. Due to the flow restriction in theinlet reed valve and the transfer ports the engine gets charged with less thanone cylinder displacement volume.
19.2.2 Separately Scavenged Engine
Another type of engine which uses an external device like a blower to scavengethe products of combustion is called the externally or separately scavenged
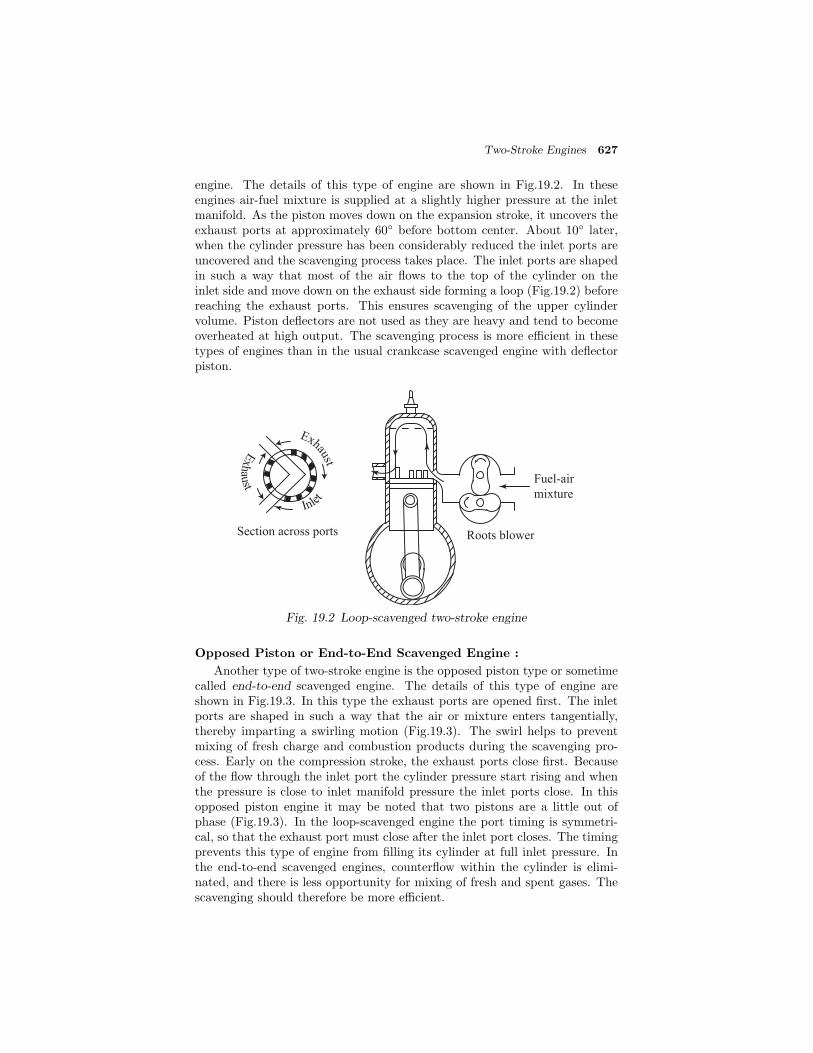
Two-Stroke Engines 627
engine. The details of this type of engine are shown in Fig.19.2. In theseengines air-fuel mixture is supplied at a slightly higher pressure at the inletmanifold. As the piston moves down on the expansion stroke, it uncovers theexhaust ports at approximately 60◦ before bottom center. About 10◦ later,when the cylinder pressure has been considerably reduced the inlet ports areuncovered and the scavenging process takes place. The inlet ports are shapedin such a way that most of the air flows to the top of the cylinder on theinlet side and move down on the exhaust side forming a loop (Fig.19.2) beforereaching the exhaust ports. This ensures scavenging of the upper cylindervolume. Piston deflectors are not used as they are heavy and tend to becomeoverheated at high output. The scavenging process is more efficient in thesetypes of engines than in the usual crankcase scavenged engine with deflectorpiston.
Roots blower
Fuel-air
mixtureInlet
Exhau
st
Exhaust
Section across ports
Fig. 19.2 Loop-scavenged two-stroke engine
Opposed Piston or End-to-End Scavenged Engine :
Another type of two-stroke engine is the opposed piston type or sometimecalled end-to-end scavenged engine. The details of this type of engine areshown in Fig.19.3. In this type the exhaust ports are opened first. The inletports are shaped in such a way that the air or mixture enters tangentially,thereby imparting a swirling motion (Fig.19.3). The swirl helps to preventmixing of fresh charge and combustion products during the scavenging pro-cess. Early on the compression stroke, the exhaust ports close first. Becauseof the flow through the inlet port the cylinder pressure start rising and whenthe pressure is close to inlet manifold pressure the inlet ports close. In thisopposed piston engine it may be noted that two pistons are a little out ofphase (Fig.19.3). In the loop-scavenged engine the port timing is symmetri-cal, so that the exhaust port must close after the inlet port closes. The timingprevents this type of engine from filling its cylinder at full inlet pressure. Inthe end-to-end scavenged engines, counterflow within the cylinder is elimi-nated, and there is less opportunity for mixing of fresh and spent gases. Thescavenging should therefore be more efficient.
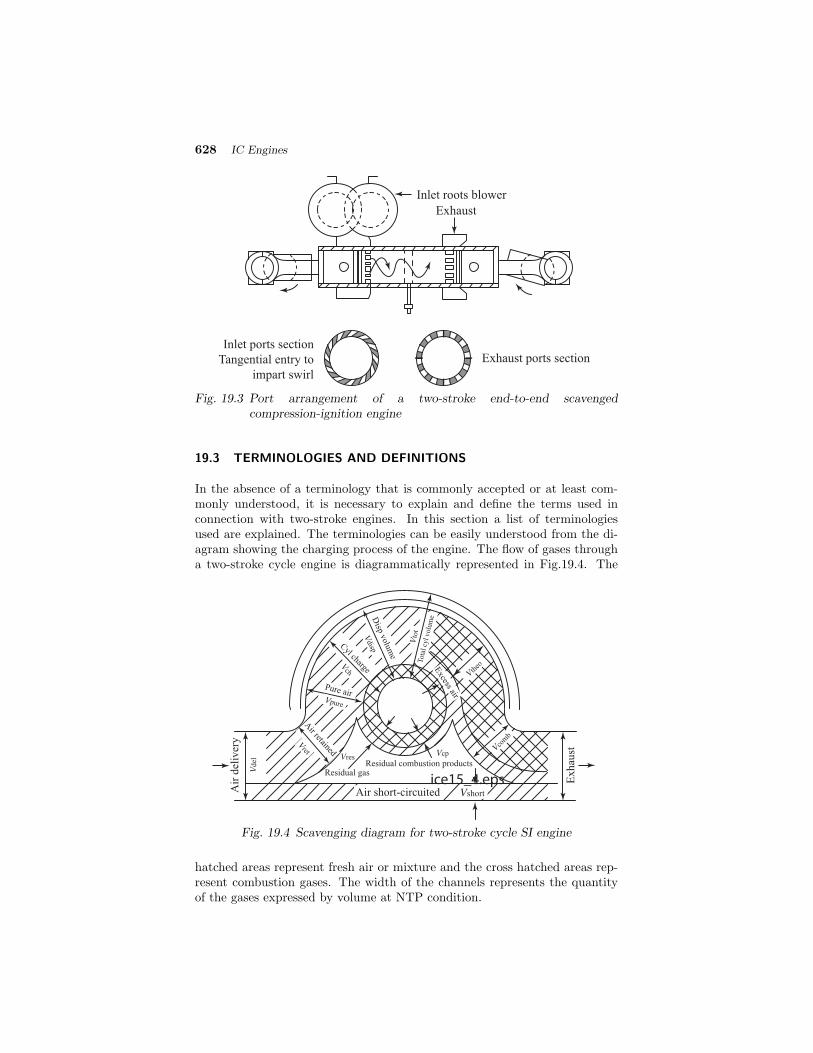
628 IC Engines
Inlet roots blower
Exhaust
Inlet ports section
Tangential entry to
impart swirl
Exhaust ports section
Fig. 19.3 Port arrangement of a two-stroke end-to-end scavengedcompression-ignition engine
19.3 TERMINOLOGIES AND DEFINITIONS
In the absence of a terminology that is commonly accepted or at least com-monly understood, it is necessary to explain and define the terms used inconnection with two-stroke engines. In this section a list of terminologiesused are explained. The terminologies can be easily understood from the di-agram showing the charging process of the engine. The flow of gases througha two-stroke cycle engine is diagrammatically represented in Fig.19.4. The
Air
del
iver
y
Air short-circuited
Residual gasResidual combustion products
Vshort
Air retained
Pure air
Cyl charge
Disp volum
e
Vtheo
Vcom
b
Tota
l cy
l volu
me
Exhau
st
Excess air
Vret
Vpure
Vch
Vdisp
Vto
t
VresVcp
Vdel
ice15_4.eps
Fig. 19.4 Scavenging diagram for two-stroke cycle SI engine
hatched areas represent fresh air or mixture and the cross hatched areas rep-resent combustion gases. The width of the channels represents the quantityof the gases expressed by volume at NTP condition.
Two-Stroke Engines 629
19.3.1 Delivery Ratio (Rdel)
In two-stroke cycle engines, air or mixture is supplied to the cylinders eitherby a separate pump or blower, or by the piston of the working cylinder actingas a pump. Depending on the relative capacity of the blower, the air delivered,Vdel, may be either more or less than the swept volume.. The delivery ratiois usually defined as
Rdel =Vdel
Vref(19.1)
The reference volume, Vref , has been variously chosen to be displacementvolume, effective displacement volume, total cylinder volume, or total effectivecylinder volume. Since, it is only the quantity of charge in the remaining totalcylinder volume at exhaust port closure that enters into the combustion, it isrecommended that the total effective cylinder volume should be preferred.
The delivery ratio, nowadays, is defined on mass basis. According to it,the delivery ratio is mass of fresh air delivered to the cylinder divided by areference mass, i.e.
Rdel =Mdel
Mref(19.2)
Thus the delivery ratio is a measure of the air supplied to the cylinder relativeto the cylinder content. If Rdel = 1, it means that the volume of the scavengingair supplied to the cylinder is equal to the cylinder volume (or displacementvolume whichever is taken as reference). Delivery ratio usually varies between1.2 and 1.5 except for crankcase scavenged engines where it is less than unity.
19.3.2 Trapping Efficiency
The air or mixture delivery, Vdel, is split into two parts (Fig.19.4): the shortcircuiting air, Vshort which leaves through the exhaust port or valve with-out remaining in the cylinder, and the retained air or mixture, Vret, which istrapped in the cylinder and takes part in the subsequent combustion. There-fore, an additional term, trapping efficiency, is used to indicate the abilityof the cylinder to retain the fresh charge. It is defined as the ratio of theamount of charge retained in the cylinder to the total charge delivered to theengine i.e.
ηtrap =Vret
Vdel(19.3)
Trapping efficiency indicates that fraction of the fresh air or mixture suppliedto the cylinder which is retained in the cylinder the rest being wasted throughthe exhaust. Short circuiting is naturally equal to (1 − ηtrap). The trappingefficiency, therefore, is a measure of the success of trapping the supplied airor mixture with minimum waste. It is mainly controlled by the geometry ofthe ports and the overlap time.
19.3.3 Relative Cylinder Charge
The air or mixture retained, Vret, together with the residual gas, Vres, remain-ing in the cylinder after flushing out the products of combustion constitutes

630 IC Engines
the cylinder charge, Vch. Relative cylinder charge is a measure of the successof filling the cylinder irrespective of the composition of charge and defined as
Cret =Vch
Vref=
Vret + Vres
Vref(19.4)
The relative cylinder charge may be either more or less than unity dependingupon the scavenging pressure and the port heights.
It must be noted that all volumes referred to are at NTP condition. How-ever, some authors, recommend the use of inlet temperature and exhaustpressure as the reference. In view of the use of different reference volumes aswell as different reference conditions, it should always be kept in mind thatthe published values may not be directly comparable.
The cylinder charge may also be considered as composed of pure air andresidual combustion products. By denoting
par =Vpure
Vret
as pure air ratio andVcp
Vret
as residual combustion products ratio.
Crel = par +Vcp
Vret
During combustion, part of the air (or, rather of the oxygen in the air)contained in the cylinder charge burns, while the remainder, the excess air,is not involved in the attendant chemical reactions. Part of this excess airescapes through the exhaust with the combustion products, and another part,Vres − Vcp, remains in the cylinder and participates in the subsequent cycle,where Vcp represents combustion products in the residual gas. Therefore,the cylinder charge consists of three parts: the retained portion of the airdelivered, part of the combustion products from the preceding cycle, and partof the excess air from the preceding cycle. As the cylinder charge, Vch iscontaminated by combustion products, Vcp,
ηp =Vpure
Vch=
Vch − Vcp
Vch= 1− Vcp
Vch
represents the purity of the charge andVcp
Vchconstitutes the pollution. It should
be realized that Vpure is more than that part of the air delivered which isretained in the cylinder; it includes some pure air contained in the residualgas remaining in the cylinder from the previous cycle.
19.3.4 Scavenging Efficiency
The purity of charge is a measure of the success of scavenging the cylinderfrom the combustion products of the preceding cycle. It is largely controlled by

Two-Stroke Engines 631
the shape of the combustion chamber and the scavenging arrangement (cross,loop or uniflow). Experimental determination of the purity is relatively simple,consisting only of analysis of a gas sample taken during the compression stroke.The difficulty lies in representative sample.
In German technical literature the term scavenging efficiency (spuelwirkungs-grad) has been widely used. It is defined as
ηsc =Vret
Vch=
Vret
Vret + Vres
It can be shown that the delivery ratio, scavenging and trapping efficienciesare related by the following equation
Rdel =Crel ηscηtrap
(19.5)
Scavenging efficiency is a term somewhat similar to purity and expresses themeasure of the success in clearing the cylinder of residual gases from thepreceding cycle.
Scavenging efficiency indicates to what extent the residual gases in thecylinder are replaced with fresh air. If it is equal to unity, it means that allthe gases existing in the cylinder at the beginning of scavenging have beenswept out.
The scavenging efficiency in diesel engines can be measured by drawing offa small sample of the products of combustion just before the exhaust valveopens or during the earlier part of blowdown. This sample is analyzed andthe results obtained are compared with standard curves of exhaust productsversus fuel-air ratio. This determines the fuel-air ratio that must have existedin the cylinder before combustion. Knowing the quantity of fuel injectedper cycle, the quantity of fresh air retained in the cylinder per cycle can becalculated. Air in the residual gas is not considered as it represents a constantquantity which does not take part in combustion.
19.3.5 Charging Efficiency
The amount of fresh charge in the cylinder is a measure of the power outputof the engine. The useful fresh charge divided by the displacement volume isthe charging efficiency defined as
ηch =Vret
Vref
Charging efficiency is a measure of the success of filling the cylinder with freshair. Naturally
ηch = Rdel ηtrap
as can be seen from Eqn.19.1 and 19.3. The charging efficiency is an importantindex as it most directly affects the power output of the engine.
19.3.6 Pressure Loss Coefficient (Pl)
The pressure loss coefficient is the ratio between the main upstream and down-stream pressures during the scavenging period and represents the loss of pres-sure to which the scavenge air is subjected to when it crosses the cylinder.
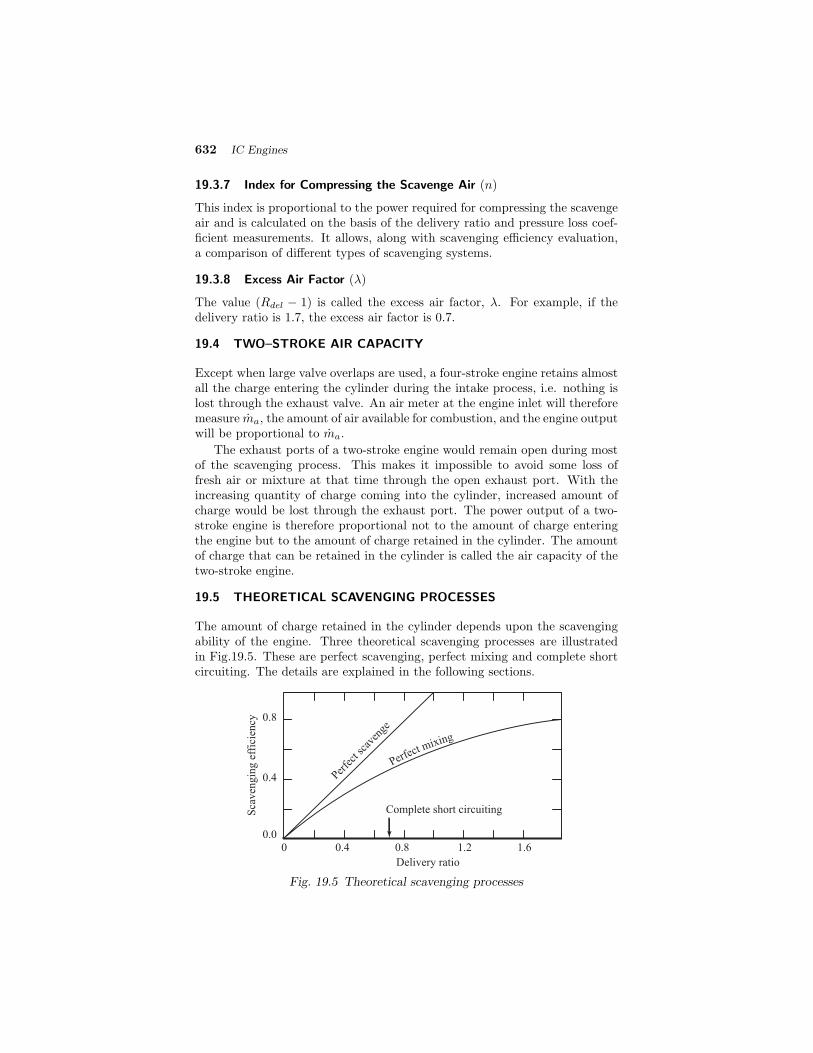
632 IC Engines
19.3.7 Index for Compressing the Scavenge Air (n)
This index is proportional to the power required for compressing the scavengeair and is calculated on the basis of the delivery ratio and pressure loss coef-ficient measurements. It allows, along with scavenging efficiency evaluation,a comparison of different types of scavenging systems.
19.3.8 Excess Air Factor (λ)
The value (Rdel − 1) is called the excess air factor, λ. For example, if thedelivery ratio is 1.7, the excess air factor is 0.7.
19.4 TWO–STROKE AIR CAPACITY
Except when large valve overlaps are used, a four-stroke engine retains almostall the charge entering the cylinder during the intake process, i.e. nothing islost through the exhaust valve. An air meter at the engine inlet will thereforemeasure ma, the amount of air available for combustion, and the engine outputwill be proportional to ma.
The exhaust ports of a two-stroke engine would remain open during mostof the scavenging process. This makes it impossible to avoid some loss offresh air or mixture at that time through the open exhaust port. With theincreasing quantity of charge coming into the cylinder, increased amount ofcharge would be lost through the exhaust port. The power output of a two-stroke engine is therefore proportional not to the amount of charge enteringthe engine but to the amount of charge retained in the cylinder. The amountof charge that can be retained in the cylinder is called the air capacity of thetwo-stroke engine.
19.5 THEORETICAL SCAVENGING PROCESSES
The amount of charge retained in the cylinder depends upon the scavengingability of the engine. Three theoretical scavenging processes are illustratedin Fig.19.5. These are perfect scavenging, perfect mixing and complete shortcircuiting. The details are explained in the following sections.
0 0.4 0.8 1.2 1.6
0.0
0.4
0.8
Sca
ven
gin
g e
ffic
iency
Delivery ratio
Perfe
ctsc
aven
ge
Perfect mixing
Complete short circuiting
Fig. 19.5 Theoretical scavenging processes

Two-Stroke Engines 633
19.5.1 Perfect Scavenging
Ideally the fresh fuel-air mixture should remain separated from the residualproducts of combustion with respect to both mass and heat transfer duringthe scavenging process. Fresh charge is pumped into the cylinder by theblower through the inlet ports at the lower end of the cylinder. This in turn,pushes the products of combustion in the cylinder out through the exhaustport/valve at the other end. It is assumed that there is no mixing of freshcharge and the products and as long as any products remain in the cylinderthe flow through the exhaust ports is considered to be products of combustiononly. However, when sufficient fresh air has entered to fill the entire cylindervolume the flow abruptly changes from one of products to one of air. Thisideal process would represent perfect scavenging without any short circuitingloss.
19.5.2 Perfect Mixing
The second theoretical scavenging process is perfect mixing, in which the in-coming fresh charge mixes completely and instantaneously with the cylindercontents, and a portion of this mixture passes out through the exhaust portsat a rate equal to that of the charge entering the cylinder. This homogeneousmixture consists initially of products of combustion only and then graduallychanges to pure air. This mixture flowing through the exhaust ports is iden-tical with that momentarily existing in the cylinder and changes with it. Forthe case of perfect mixing the scavenging efficiency can be represented by thefollowing equation
ηsc = 1− e−Rdel (19.6)
where ηsc and Rdel are scavenging efficiency and delivery ratio respectively.This is plotted in Fig.19.5. The result of this theoretical process closely ap-proximates the results of many actual scavenging processes, and is thus oftenused as a basis of comparison.
19.5.3 Short Circuiting
The third type of scavenging process is that of short circuiting in which thefresh charge coming from the scavenge manifold directly goes out of the ex-haust ports without removing any residual gas. This is a dead loss and itsoccurrence must be avoided.
19.6 ACTUAL SCAVENGING PROCESS
The actual scavenging process is neither one of perfect scavenging nor ofperfect mixing. It probably consists partially of perfect scavenging, mixingand short circuiting. Figure 19.6 shows the variation of delivery ratio andtrapping efficiency with crank angle for three different scavenging modes, i.e.perfect scavenging, perfect mixing and intermediate scavenging.
The scavenging parameters for the intermediate scavenging are shown inFig.19.7. This represents the actual scavenging process. It can be seen fromthis figure that a certain amount of combustion products is initially pushed

634 IC Engines
130 150 170 190 210 230 250
0.0
0.2
0.4
0.6
0.8
1.0
1.2
1.4
Crank angle (deg)
Delivery ratio intermediate
Displacement
Trapping efficiency
complete mixing
Rd
elη
tra
p,
Fig. 19.6 Delivery ratio and trapping efficiency variation for a crankcase scav-enged engine (different scavenging modes)
130 150 170 190 210 230 250
0.0
0.2
0.4
0.6
0.8
1.0
1.2
1.4
Crank angle (deg)
Del
iver
yra
tio
Trapping
Scavenging
Sca
ven
gin
g p
aram
eter
Fig. 19.7 Scavenging parameters for the intermediate scavenging
out of the cylinder without being diluted by fresh air. Gradually, mixing andshort circuiting causes the outflowing products to be diluted by more andmore fresh air until ultimately the situation is the same as for perfect mixing,i.e. the first phase of the scavenging process is a perfect scavenging processwhich then gradually changes into a complete mixing process.
19.7 CLASSIFICATION BASED ON SCAVENGING PROCESS
The simplest method of introducing the charge into the cylinder is to employcrankcase compression as shown in Fig.19.1. This type of engine is classifiedas the crankcase scavenged engine. In another type, a separate blower or apump (Fig.19.2) is used to introduce the charge through the inlet port, whichare classified as the separately scavenged engines.

Two-Stroke Engines 635
(a) (b) (c) (d)
(a) Cross scavenging
(b) Loop scavenging M.A.N. type
(c) Loop scavenging, Schnuerle type
(d) Loop scavenging, Curtis type
Fig. 19.8 Methods of scavenging
Another classification of two-stroke cycle engines is based on the air flow.The most common arrangement is cross scavenging, illustrated in Fig.19.8(a).The incoming airs is directed upward, and then down to force out the exhaustgases through the oppositely located exhaust ports. With loop or reversescavenging, the fresh air first sweeps across the piston top, moves up andthen down and finally out through the exhaust. In the M.A.N. type of loopscavenge, Fig.19.8(b), the exhaust and inlet ports are on the same side, theexhaust above the inlet. In the Schnuerle type, Fig.19.8(c), the ports are sideby side. The Curtis type of scavenging, Fig.19.8(d), is similar to the Schnuerletype, except that upwardly directed inlet ports are placed also opposite theexhaust ports.
The most perfect method of scavenging is the uniflow method, where thefresh air charge is admitted at one end of the cylinder and the exhaust escapesat the other end. The air flow is from end to end, and little short-circuitingbetween the intake and exhaust openings is possible. The three availablearrangements for uniflow scavenging are shown in Fig.19.9. A poppet valveis used in a to admit the inlet air or for the exhaust, as the case may be.In b the inlet and exhaust ports are both controlled by separate pistons thatmove in opposite directions. In c the inlet and exhaust ports are controlledby the combined motion of piston and sleeve. In an alternative arrangementone set of ports is controlled by the piston and the other set by a sleeveor slide valve. All uniflow systems permit unsymmetrical scavenging andsupercharging. Reverse flow scavenging is shown in Fig.19.10.
In this type the inclined ports are used and the scavenging air is forced onto the opposite wall of the cylinder where it is reversed to the outlet ports.One obvious disadvantage of this type is the limitation on the port area.For long stroke engines operating at low piston speeds, this arrangement hasproved satisfactory.
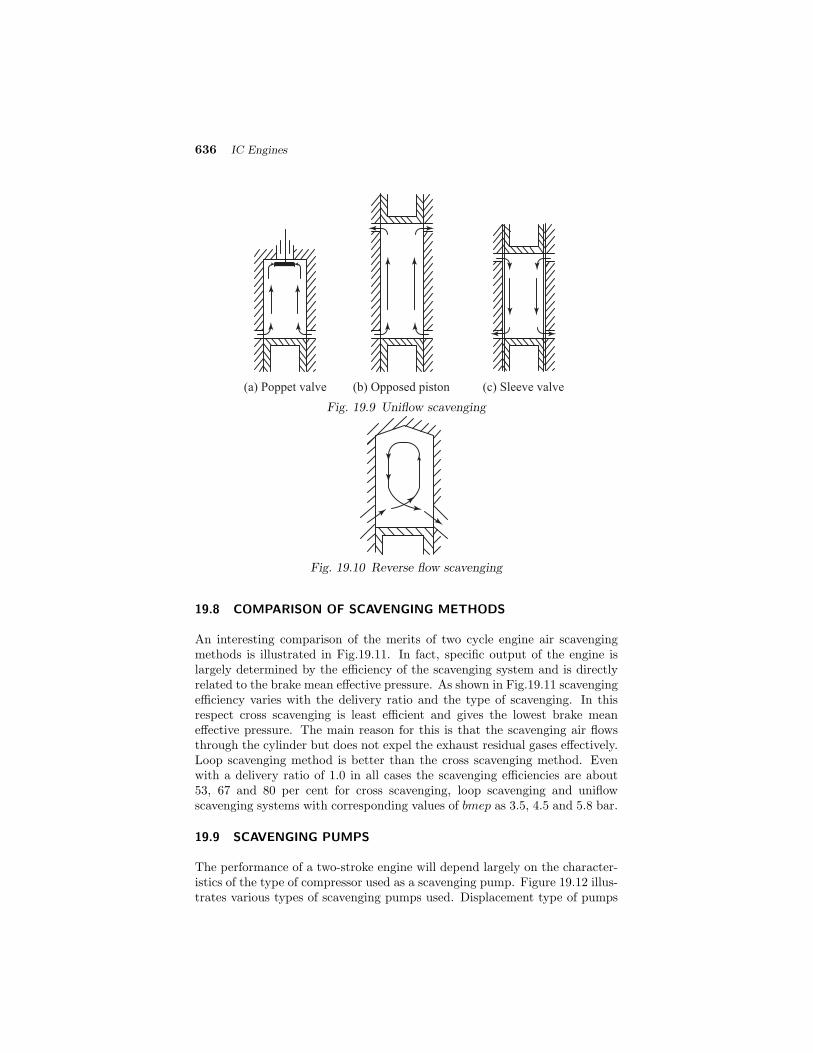
636 IC Engines
(a) Poppet valve (b) Opposed piston (c) Sleeve valve
Fig. 19.9 Uniflow scavenging
Fig. 19.10 Reverse flow scavenging
19.8 COMPARISON OF SCAVENGING METHODS
An interesting comparison of the merits of two cycle engine air scavengingmethods is illustrated in Fig.19.11. In fact, specific output of the engine islargely determined by the efficiency of the scavenging system and is directlyrelated to the brake mean effective pressure. As shown in Fig.19.11 scavengingefficiency varies with the delivery ratio and the type of scavenging. In thisrespect cross scavenging is least efficient and gives the lowest brake meaneffective pressure. The main reason for this is that the scavenging air flowsthrough the cylinder but does not expel the exhaust residual gases effectively.Loop scavenging method is better than the cross scavenging method. Evenwith a delivery ratio of 1.0 in all cases the scavenging efficiencies are about53, 67 and 80 per cent for cross scavenging, loop scavenging and uniflowscavenging systems with corresponding values of bmep as 3.5, 4.5 and 5.8 bar.
19.9 SCAVENGING PUMPS
The performance of a two-stroke engine will depend largely on the character-istics of the type of compressor used as a scavenging pump. Figure 19.12 illus-trates various types of scavenging pumps used. Displacement type of pumps

Two-Stroke Engines 637
0 40 80 120 160 200
Uni
flow
scavenge
Crossscavenge
3.5
4.5
5.8
0
40
80
0
40
80
0
40
80
Delivery ratio (%)
Sca
ven
gin
g e
ffic
iency
(%
)
0
2
4
6
0
2
4
6
Loop
scav
enge
0
2
4
6
bm
ep (
bar
)Fig. 19.11 Scavenging efficiency
include crankcase scavenging, piston and roots type blowers. An importantcharacteristic of the displacement pumps is that their volumetric efficiency,and therefore, the mass of air delivered per unit time are not seriously re-duced even by considerable increase in the outlet pressure. Thus it tends tomaintain constant scavenging ratio even though ports may become partiallyclogged with deposits etc.
In case of centrifugal pumps, however, the mass flow is heavily influencedby the engine and exhaust system resistance. The pressure ratio in this casevaries almost linearly with the rpm squared. Thus, the centrifugal type scav-enging pump is a very satisfactory type provided the resistance of the flowsystem is not suddenly altered.
19.10 ADVANTAGES AND DISADVANTAGES OF TWO–STROKE EN-GINES
Two-stroke engines have certain advantages as well as disadvantages comparedto four-stroke engines. In the following sections the main advantages anddisadvantages are discussed briefly.
19.10.1 Advantages of Two-stroke Engines
(i) As there is a working stroke for each revolution, the power developedwill be nearly twice that of a four-stroke engine of the same dimensionsand operating at the same speed.
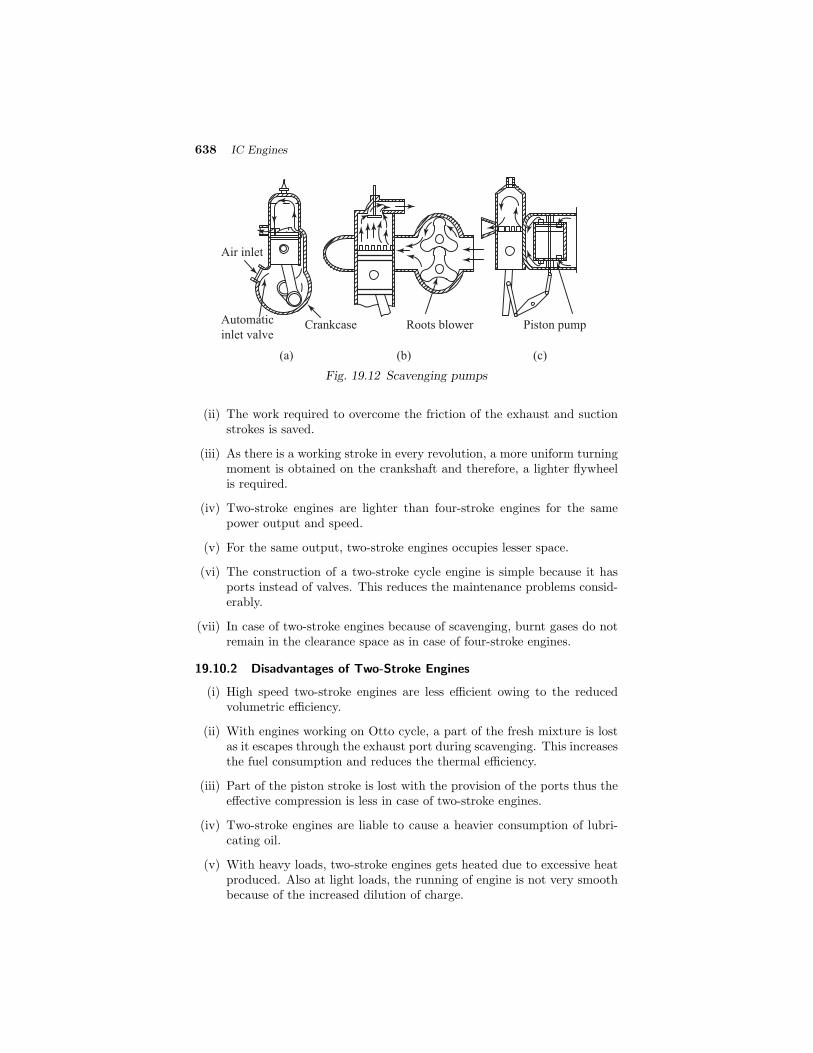
638 IC Engines
Air inlet
Automatic
inlet valveCrankcase Roots blower Piston pump
(a) (b) (c)
Fig. 19.12 Scavenging pumps
(ii) The work required to overcome the friction of the exhaust and suctionstrokes is saved.
(iii) As there is a working stroke in every revolution, a more uniform turningmoment is obtained on the crankshaft and therefore, a lighter flywheelis required.
(iv) Two-stroke engines are lighter than four-stroke engines for the samepower output and speed.
(v) For the same output, two-stroke engines occupies lesser space.
(vi) The construction of a two-stroke cycle engine is simple because it hasports instead of valves. This reduces the maintenance problems consid-erably.
(vii) In case of two-stroke engines because of scavenging, burnt gases do notremain in the clearance space as in case of four-stroke engines.
19.10.2 Disadvantages of Two-Stroke Engines
(i) High speed two-stroke engines are less efficient owing to the reducedvolumetric efficiency.
(ii) With engines working on Otto cycle, a part of the fresh mixture is lostas it escapes through the exhaust port during scavenging. This increasesthe fuel consumption and reduces the thermal efficiency.
(iii) Part of the piston stroke is lost with the provision of the ports thus theeffective compression is less in case of two-stroke engines.
(iv) Two-stroke engines are liable to cause a heavier consumption of lubri-cating oil.
(v) With heavy loads, two-stroke engines gets heated due to excessive heatproduced. Also at light loads, the running of engine is not very smoothbecause of the increased dilution of charge.
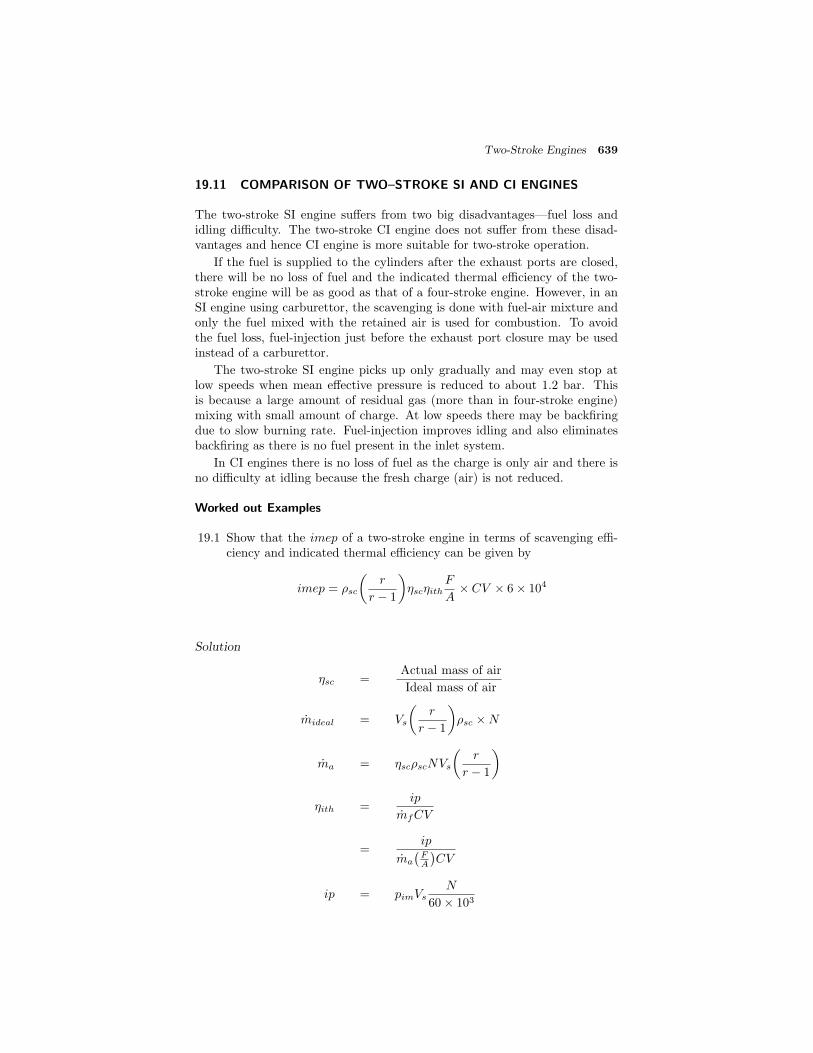
Two-Stroke Engines 639
19.11 COMPARISON OF TWO–STROKE SI AND CI ENGINES
The two-stroke SI engine suffers from two big disadvantages—fuel loss andidling difficulty. The two-stroke CI engine does not suffer from these disad-vantages and hence CI engine is more suitable for two-stroke operation.
If the fuel is supplied to the cylinders after the exhaust ports are closed,there will be no loss of fuel and the indicated thermal efficiency of the two-stroke engine will be as good as that of a four-stroke engine. However, in anSI engine using carburettor, the scavenging is done with fuel-air mixture andonly the fuel mixed with the retained air is used for combustion. To avoidthe fuel loss, fuel-injection just before the exhaust port closure may be usedinstead of a carburettor.
The two-stroke SI engine picks up only gradually and may even stop atlow speeds when mean effective pressure is reduced to about 1.2 bar. Thisis because a large amount of residual gas (more than in four-stroke engine)mixing with small amount of charge. At low speeds there may be backfiringdue to slow burning rate. Fuel-injection improves idling and also eliminatesbackfiring as there is no fuel present in the inlet system.
In CI engines there is no loss of fuel as the charge is only air and there isno difficulty at idling because the fresh charge (air) is not reduced.
Worked out Examples
19.1 Show that the imep of a two-stroke engine in terms of scavenging effi-ciency and indicated thermal efficiency can be given by
imep = ρsc
r
r − 1
ηscηith
F
A× CV × 6× 10⁴
Solution
ηsc =Actual mass of air
Ideal mass of air
mideal = Vs
r
r − 1
ρsc ×N
ma = ηscρscNVs
r
r − 1
ηith =ip
mfCV
=ip
ma
FA
CV
ip = pimVsN
60× 103

640 IC Engines
pimVsN
60000= ηithma
F
ACV
pimVsN
60000ρsc
r
r − 1= ηithma
F
ACV ρsc
r
r − 1
pimmideal = ηithmaF
ACV ρsc
r
r − 1× 60000
pimma
ηsc= ηithma
F
ACV ρsc
r
r − 1× 60000
pim = ρsc
r
r − 1
ηscηith × F
ACV × 60000
19.2 A two-stroke Diesel engine having a stroke to bore ratio of 1.2. Thecompression ratio is 16 and runs at 1500 rpm. During a trial run thefollowing observations were made:
Exhaust pressure : 1.05 barInlet air temperature : 37 ◦C
Fuel flow rate : 3 kg/hAir assumed is : 130 kg/h
Diameter of the cylinder : 100 mm
The fuel-air ratio was 0.045. Calculate the scavenging efficiency and thescavenging delivery ratio of the engine.
Solution
Fuel-air ratio = 0.045
Mass of air, ma =3.0
0.045= 66.67 kg/h
Swept volume, Vs =π
4×
100
1000
2×
120
1000
= 9.425× 10⁻⁴ m3
Vtot = 0.0009425× 16
15= 0.001005 m3/cycle
Mass of air supplied/cycle
mas =66.67
60× 1500
= 0.00074 m3/cycle
mref = 0.001005×
1.05× 105
287× 300
= 0.00122

Two-Stroke Engines 641
ηsc =mas
mref=
0.00074
0.00122= 0.606
Ans⇐=
Scavenging ratio =Fresh air supplied
Vref
=13060 × 1
1500
0.00122= 1.18
Ans⇐=
19.3 A twin cylinder two-stroke cross-scavenged diesel engine of 25 cm boreand 30 cm stroke runs at 400 rpm. The compression ratio is 16. Thefollowing observations are made:
Fuel flow : 15 kg/hInlet air temperature : 35 ◦C
Exhaust pressure : 1.05 barExhaust gas composition :
CO2 : 7.5%O2 : 9.0CO : negligible
Calculate the scavenging efficiency and indicated mean effective pressureof the engine. Take indicated thermal efficiency of the engine as 0.40.The light diesel oil (C12H26) has a heating value of 42.2 MJ/kg.
Solution
The exhaust gas composition is given. If the exhaust contains CO, CO2, COand N2 then we can write a dimensionally homogeneous equation as
kg of fuel
kg of air=
k mole of Ck mole of gas
× kg of Ck mole of C
× kg of N2
kg of air
k mole of N2
k mole of gas× kg of N
2
k mole of N2
× kg of C
kg of fuel
=( CO2 + CO)× 12× 0.768
N2 × 28×
11+h
= 0.33× (1 + h)× CO2 + CO
N2
where h is the carbon to hydrogen ratio.
h =26× 1
12× 12= 0.18
Fuel-air ratio = 0.33× (1 + 0.18)×
7.5
83.5
= 0.035
Mass flow of air =15
0.035= 428.6 kg/h = 7.14 kg/min
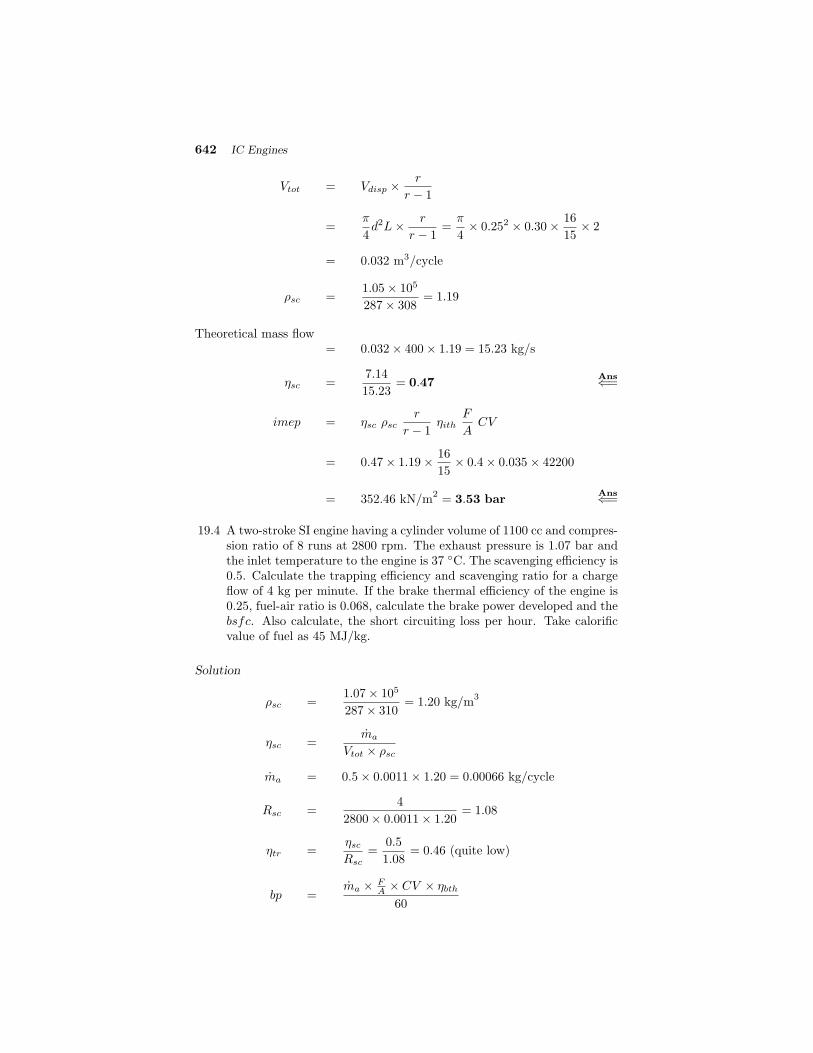
642 IC Engines
Vtot = Vdisp × r
r − 1
=π
4d2L× r
r − 1=
π
4× 0.252 × 0.30× 16
15× 2
= 0.032 m3/cycle
ρsc =1.05× 10⁵
287× 308= 1.19
Theoretical mass flow= 0.032× 400× 1.19 = 15.23 kg/s
ηsc =7.14
15.23= 0.47
Ans⇐=
imep = ηsc ρscr
r − 1ηith
F
ACV
= 0.47× 1.19× 16
15× 0.4× 0.035× 42200
= 352.46 kN/m2
= 3.53 barAns⇐=
19.4 A two-stroke SI engine having a cylinder volume of 1100 cc and compres-sion ratio of 8 runs at 2800 rpm. The exhaust pressure is 1.07 bar andthe inlet temperature to the engine is 37 ◦C. The scavenging efficiency is0.5. Calculate the trapping efficiency and scavenging ratio for a chargeflow of 4 kg per minute. If the brake thermal efficiency of the engine is0.25, fuel-air ratio is 0.068, calculate the brake power developed and thebsfc. Also calculate, the short circuiting loss per hour. Take calorificvalue of fuel as 45 MJ/kg.
Solution
ρsc =1.07× 10⁵
287× 310= 1.20 kg/m
3
ηsc =ma
Vtot × ρsc
ma = 0.5× 0.0011× 1.20 = 0.00066 kg/cycle
Rsc =4
2800× 0.0011× 1.20= 1.08
ηtr =ηscRsc
=0.5
1.08= 0.46 (quite low)
bp =ma × F
A × CV × ηbth
60
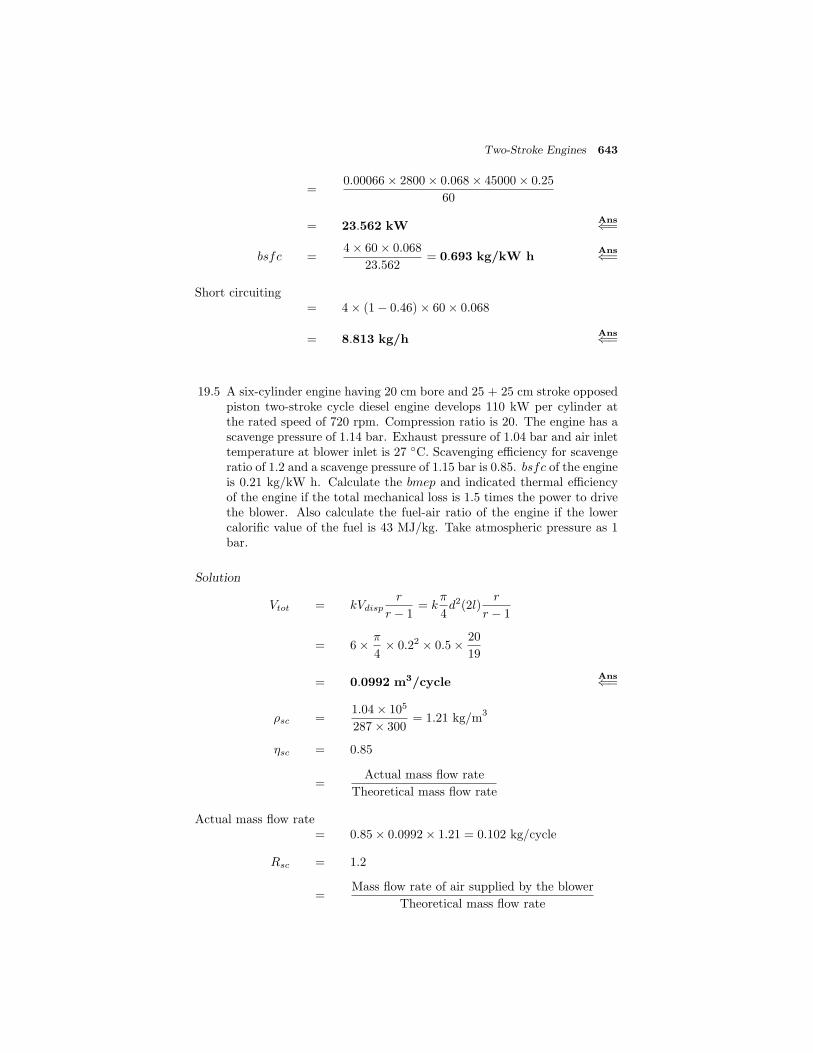
Two-Stroke Engines 643
=0.00066× 2800× 0.068× 45000× 0.25
60
= 23.562 kWAns⇐=
bsfc =4× 60× 0.068
23.562= 0.693 kg/kW h
Ans⇐=
Short circuiting= 4× (1− 0.46)× 60× 0.068
= 8.813 kg/hAns⇐=
19.5 A six-cylinder engine having 20 cm bore and 25 + 25 cm stroke opposedpiston two-stroke cycle diesel engine develops 110 kW per cylinder atthe rated speed of 720 rpm. Compression ratio is 20. The engine has ascavenge pressure of 1.14 bar. Exhaust pressure of 1.04 bar and air inlettemperature at blower inlet is 27 ◦C. Scavenging efficiency for scavengeratio of 1.2 and a scavenge pressure of 1.15 bar is 0.85. bsfc of the engineis 0.21 kg/kW h. Calculate the bmep and indicated thermal efficiencyof the engine if the total mechanical loss is 1.5 times the power to drivethe blower. Also calculate the fuel-air ratio of the engine if the lowercalorific value of the fuel is 43 MJ/kg. Take atmospheric pressure as 1bar.
Solution
Vtot = kVdispr
r − 1= k
π
4d2(2l)
r
r − 1
= 6× π
4× 0.22 × 0.5× 20
19
= 0.0992 m3/cycleAns⇐=
ρsc =1.04× 10⁵
287× 300= 1.21 kg/m
3
ηsc = 0.85
=Actual mass flow rate
Theoretical mass flow rate
Actual mass flow rate= 0.85× 0.0992× 1.21 = 0.102 kg/cycle
Rsc = 1.2
=Mass flow rate of air supplied by the blower
Theoretical mass flow rate

644 IC Engines
Mass flow rate of air supplied by the blower
= 1.2× 0.0992× 1.21 = 0.144 kg/cycle
ηblower =ΔTisen
ΔTactual
T
2
T1= r
γ−1
γ
T
2 = 300×
1.15
1
0.286= 312.2 K
ΔTactual =312.2− 300
0.75= 16.3 K
T2 = 300 + 16.3 = 316.3 K
Wc = mCpΔT = 0.102× 1.005× 16.3
= 1.6709 kJ/cycle
= 1.6709× 720
60= 20 kW
Vdisp = kπ
4d22l = 6× π
4× 0.22 × 0.5
= 0.0942 m3/cycle
bmep =bp
VsN=
120× 6
0.0942× 720× 105× 60× 1000
= 6.37 barAns⇐=
Total mechanical loss= 1.5× 20 = 30 kW
ip = bp + fp = 6× 120 + 30 = 750 kW
Fuel consumed per hour= bsfc× bp = 0.21× 720 = 151.2 h
ηith =ip
mfCV× 100 =
750× 3600
151.2× 44000
= 0.406 = 40.6%Ans⇐=
Fuel-air ratio =151.2
60× 720× 0.0992= 0.0353
Ans⇐=

Two-Stroke Engines 645
Review Questions
19.1 What is a two-stroke engine and how does it differ from a four strokeengine?
19.2 Explain with neat sketches the two different types of two-stroke engines.
19.3 What is an opposed piston engine? Explain.
19.4 Define the following :
(i) delivery ratio
(ii) trapping efficiency
(iii) relative cylinder charge
(iv) scavenging efficiency
(v) charging efficiency
(vi) pressure loss coefficients
(vii) excess air factor
(viii) index of compression
19.5 Explain with a graph the three possible theoretical scavenging processes.
19.6 How does the actual scavenging process differ from the theoretical one?Explain by means of suitable graphs.
19.7 Briefly explain the classification of two-stroke engines based on scaveng-ing process.
19.8 Compare the various scavenging methods.
19.9 Explain the various scavenging pumps used in a two-stroke engine.
19.10 What are the advantages and disadvantages of a two-stroke engine?Compare two-stroke SI and CI engines.
Exercise
19.1 A two-stroke SI engine with a cubic capacity of 1.5 litres and compres-sion ratio of 7 consumes 0.5 kg of fresh charge per minute when runningat 2500 rpm. The exhaust pressure is 1.02 bar and inlet temperatureis 37 ◦C. If ηsc = 0.6. Calculate the scavenging ratio and trappingefficiency.
If the indicated thermal efficiency of the engine is 0.29, fuel-air ratio is0.07 and calorific value of the fuel is 43 MJ/kg. Calculate the indicatedpower developed by the engine. Ans: (i)1.395 (ii) 0.43 (iii) 43.75 kW
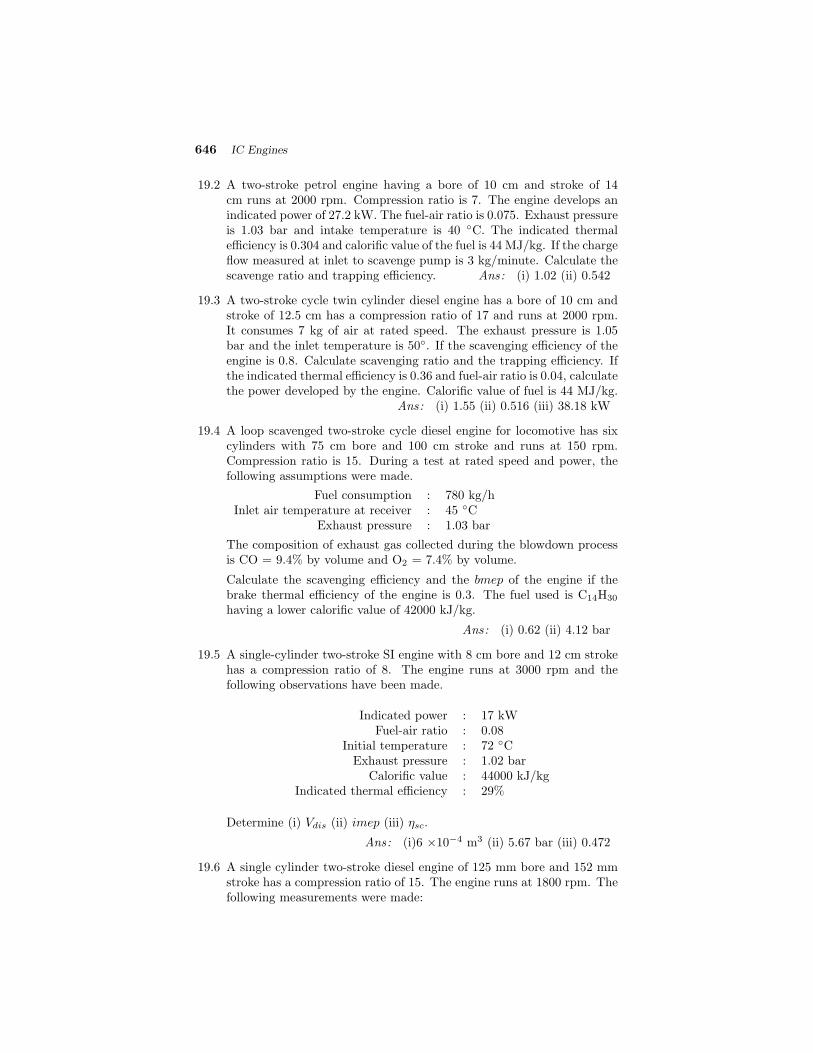
646 IC Engines
19.2 A two-stroke petrol engine having a bore of 10 cm and stroke of 14cm runs at 2000 rpm. Compression ratio is 7. The engine develops anindicated power of 27.2 kW. The fuel-air ratio is 0.075. Exhaust pressureis 1.03 bar and intake temperature is 40 ◦C. The indicated thermalefficiency is 0.304 and calorific value of the fuel is 44 MJ/kg. If the chargeflow measured at inlet to scavenge pump is 3 kg/minute. Calculate thescavenge ratio and trapping efficiency. Ans: (i) 1.02 (ii) 0.542
19.3 A two-stroke cycle twin cylinder diesel engine has a bore of 10 cm andstroke of 12.5 cm has a compression ratio of 17 and runs at 2000 rpm.It consumes 7 kg of air at rated speed. The exhaust pressure is 1.05bar and the inlet temperature is 50◦. If the scavenging efficiency of theengine is 0.8. Calculate scavenging ratio and the trapping efficiency. Ifthe indicated thermal efficiency is 0.36 and fuel-air ratio is 0.04, calculatethe power developed by the engine. Calorific value of fuel is 44 MJ/kg.
Ans: (i) 1.55 (ii) 0.516 (iii) 38.18 kW
19.4 A loop scavenged two-stroke cycle diesel engine for locomotive has sixcylinders with 75 cm bore and 100 cm stroke and runs at 150 rpm.Compression ratio is 15. During a test at rated speed and power, thefollowing assumptions were made.
Fuel consumption : 780 kg/hInlet air temperature at receiver : 45 ◦C
Exhaust pressure : 1.03 bar
The composition of exhaust gas collected during the blowdown processis CO = 9.4% by volume and O2 = 7.4% by volume.
Calculate the scavenging efficiency and the bmep of the engine if thebrake thermal efficiency of the engine is 0.3. The fuel used is C14H30
having a lower calorific value of 42000 kJ/kg.
Ans: (i) 0.62 (ii) 4.12 bar
19.5 A single-cylinder two-stroke SI engine with 8 cm bore and 12 cm strokehas a compression ratio of 8. The engine runs at 3000 rpm and thefollowing observations have been made.
Indicated power : 17 kWFuel-air ratio : 0.08
Initial temperature : 72 ◦CExhaust pressure : 1.02 bar
Calorific value : 44000 kJ/kgIndicated thermal efficiency : 29%
Determine (i) Vdis (ii) imep (iii) ηsc.
Ans: (i)6 ×10⁻⁴ m3 (ii) 5.67 bar (iii) 0.472
19.6 A single cylinder two-stroke diesel engine of 125 mm bore and 152 mmstroke has a compression ratio of 15. The engine runs at 1800 rpm. Thefollowing measurements were made:
Two-Stroke Engines 647
ma : 245 kg/hTi : 300 Kpe : 1.0275 bar
Calculate (i) the scavenge ratio (ii) the scavenging efficiency (iii) trap-ping efficiency. Ans: (i) 1.02 (ii) 0.639 (iii) 0.627
Multiple Choice Questions (choose the most appropriate answer)
1. A two-stroke engine can be identified by
(a) cooling system
(b) lubrication system
(c) absence of valves
(d) piston size
2. Advantage of two-stroke engine is
(a) more uniform torque
(b) lighter flywheel
(c) no valves
(d) all of the above
3. Charge pressure at the inlet port of a two-stroke engine is
(a) 20 bar
(b) vacuum
(c) atmospheric
(d) higher than atmospheric
4. The most perfect method of scavenging is
(a) cross scavenging
(b) uniflow scavenging
(c) loop scavenging
(d) reverse flow scavenging
5. Two-stroke SI engines suffer from
(a) fuel loss
(b) idling difficulty
(c) both (a) and (b) together
(d) none of the above

648 IC Engines
6. At the same speed two-stroke engine of the same size as a four-strokeengine will develop
(a) same power
(b) half the power
(c) twice the power
(d) four times the power
7. Two wheelers without deflector type piston use
(a) loop scavenging
(b) uniflow scavenging
(c) reverse flow scavenging
(d) cross scavenging
8. Crankcase scavenged engines have delivery ratio of
(a) greater than 1
(b) less than 1
(c) equal to 1
(d) none of the above
9. Short-circuiting in the case of two-stroke engines is equal to
(a) 1− ηtrap
(b) ηtrap/2
(c) ηtrap − 0.5
(d) none of the above
10. If the delivery ratio is 1.8, the excess air factor in the case of a two-strokeengine is
(a) 0.8
(b) 0.9
(c) 1.0
(d) none of the above
Ans : 1. – (c) 2. – (d) 3. – (d) 4. – (b) 5. – (a)6. – (c) 7. – (d) 8. – (c) 9. – (a) 10. – (a)

20NONCONVENTIONAL
ENGINES
20.1 INTRODUCTION
So far we have seen the details of the conventional engines, viz., Spark Ignition(SI) and Compression ignition (CI) engines. Conventionally, SI engine usescarburetion and CI engine employs mechanical injection. During the last fewdecades a lot of research has been carried out to improve the performance ofthese engines. Because of the sustained efforts a number of nonconventionalengines have been developed. In this chapter we will look into some of thenonconventional engines in a comprehensive manner. The typical nonconven-tional engines arranged in alphabetical order are:
(i) Common Rail Direct Injection (CRDI) engine
(ii) Dual fuel and multi-fuel engine
(iii) Free piston engine
(iv) Gasoline Direct Injection (GDI) engine
(v) Homogeneous Charge Compression Ignition (HCCI) engine
(vi) Lean burn engine
(vii) Stirling engine
(viii) Stratified charge engine
(ix) Variable Compression Ratio (VCR) engine
(x) Wankel engine
20.2 COMMON RAIL DIRECT INJECTION ENGINE
Conventional SI and CI engines use gasoline and diesel respectively as fuel.The problem with diesel fuel is that diesel particles are larger and heavier thangasoline. Therefore, it is comparatively more difficult to atomize. Imperfectatomization leads to more unburnt particles, causing more pollution, lowerfuel efficiency and less power. In order to overcome these problems highpressure fuel injection systems for both gasoline and diesel engines have beendeveloped. Engines that use this technology is called CRDI engines. However,CRDI is more suitable for diesel engines because common-rail technology isintended to improve the atomization process by means of very high (upto

650 IC Engines
1800 bar) injection pressures. Conventional DI diesel engines generates fuelpressure (around 300 bar) for each injection repeatedly. But in CRDI enginesthe pressure is built up independently of the injection sequence and is availableconstantly in the fuel line. CRDI system uses appropriate sensors to providereal-time combustion data for each cylinder.
The common rail which is placed upstream of the cylinders acts as anaccumulator. It distributes the fuel to the injectors at a constant pressure ofup to 1800 bar. High speed solenoid valves are used which are regulated by anelectronic engine management system. They separately control the injectiontiming and the amount of fuel to be injected for each cylinder as a functionof the cylinder’s actual need. In other words, pressure generation and fuelinjection are independent of each other. This is an important advantage ofcommon-rail injection over conventional injection.
Common rail direct injection increases the controllability of the individualinjection processes and improves fuel atomization. This helps in saving fueland also in reducing emissions. It is reported that fuel economy of around 30%is possible over a conventional diesel engine. A substantial noise reduction isalso achieved due to a more synchronized timing operation. The principle ofCRDI can also be employed in gasoline engines as Gasoline Direct Injection,which removes to a great extent the draw backs of the conventional carburetorsand the multi-point fuel injection system. GDI engines are discussed in detailin section 20.6.
20.2.1 The Working Principle
As already mentioned CRDI is meant for direct injection of the fuel into thecylinders of a diesel engine via a single, common line, called the common railwhich is connected to all the fuel injectors. A typical CRDI system is shown inFig.20.1. As can be seen, fuel from the fuel tank passes through a fuel filter toa low pressure pump where the pressure is raised to a reasonably high value.The fuel temperature is monitored by a temperature sensor. Then the fuelgoes to high pressure pump. A pressure regulator valve controls the pressure.In the modern CRDI system, the outlet pressure can be as high as 1800 bar.The highly pressurized fuel goes to an accumulator, which is called commonrail. The pressure in the common rail is monitored by the rail pressure sensor.
In the common rail system, a high pressure pump stores a reservoir offuel at very high pressure and supplies this high pressure fuel to the multipleinjectors. This simplifies the purpose of the high pressure pump because thesystem has to maintain only the designed pressure either mechanically orelectronically. The fuel injectors are typically ECU-controlled. When the fuelinjectors are electrically activated, a hydraulic valve (consisting of a nozzleand plunger) is mechanically or hydraulically opened and fuel is sprayed intothe cylinders at the desired pressure.
20.2.2 The Injector
A typical fuel injector used in CRDI is shown in Fig.20.2(a). The injector isnothing but an electronically controlled valve. It is supplied with pressurized
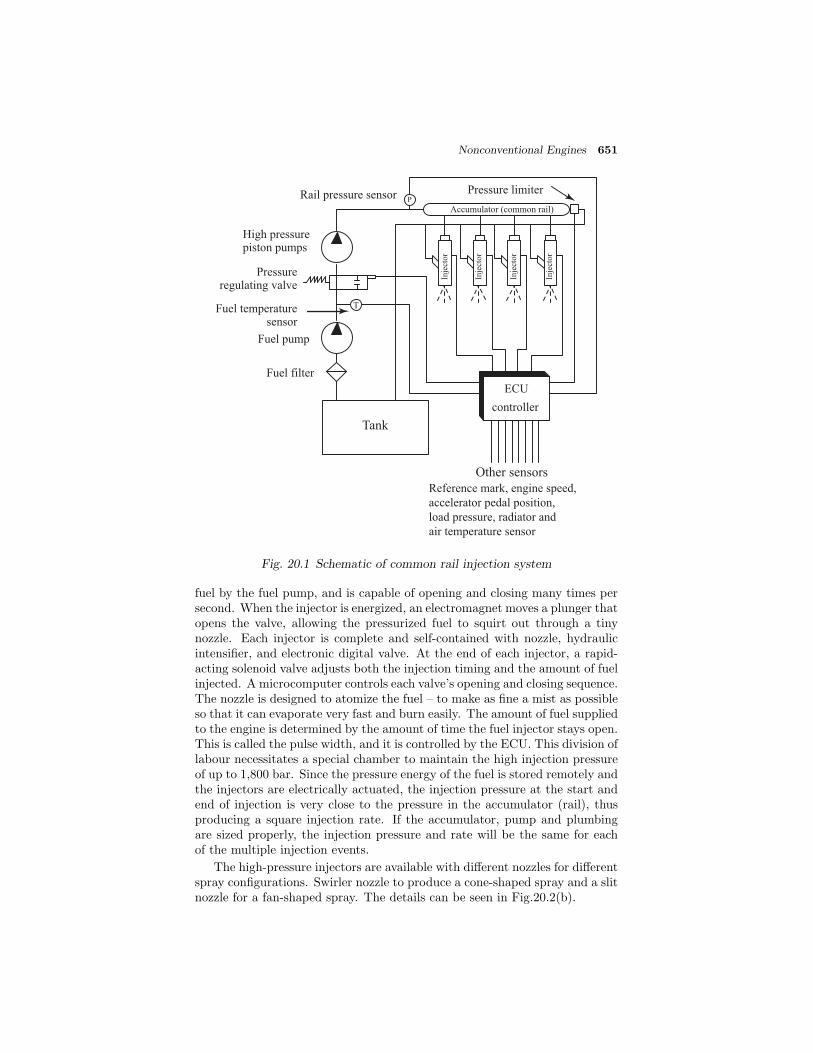
Nonconventional Engines 651
ECU
controller
Reference mark, engine speed,
accelerator pedal position,
load pressure, radiator and
air temperature sensor
Fuel filter
Fuel pump
Fuel temperaturesensor
Pressureregulating valve
High pressurepiston pumps
Rail pressure sensor Pressure limiter
T
P
Inje
ctor
Inje
ctor
Inje
ctor
Inje
ctor
Tank
Accumulator (common rail)
Other sensors
Fig. 20.1 Schematic of common rail injection system
fuel by the fuel pump, and is capable of opening and closing many times persecond. When the injector is energized, an electromagnet moves a plunger thatopens the valve, allowing the pressurized fuel to squirt out through a tinynozzle. Each injector is complete and self-contained with nozzle, hydraulicintensifier, and electronic digital valve. At the end of each injector, a rapid-acting solenoid valve adjusts both the injection timing and the amount of fuelinjected. A microcomputer controls each valve’s opening and closing sequence.The nozzle is designed to atomize the fuel – to make as fine a mist as possibleso that it can evaporate very fast and burn easily. The amount of fuel suppliedto the engine is determined by the amount of time the fuel injector stays open.This is called the pulse width, and it is controlled by the ECU. This division oflabour necessitates a special chamber to maintain the high injection pressureof up to 1,800 bar. Since the pressure energy of the fuel is stored remotely andthe injectors are electrically actuated, the injection pressure at the start andend of injection is very close to the pressure in the accumulator (rail), thusproducing a square injection rate. If the accumulator, pump and plumbingare sized properly, the injection pressure and rate will be the same for eachof the multiple injection events.
The high-pressure injectors are available with different nozzles for differentspray configurations. Swirler nozzle to produce a cone-shaped spray and a slitnozzle for a fan-shaped spray. The details can be seen in Fig.20.2(b).
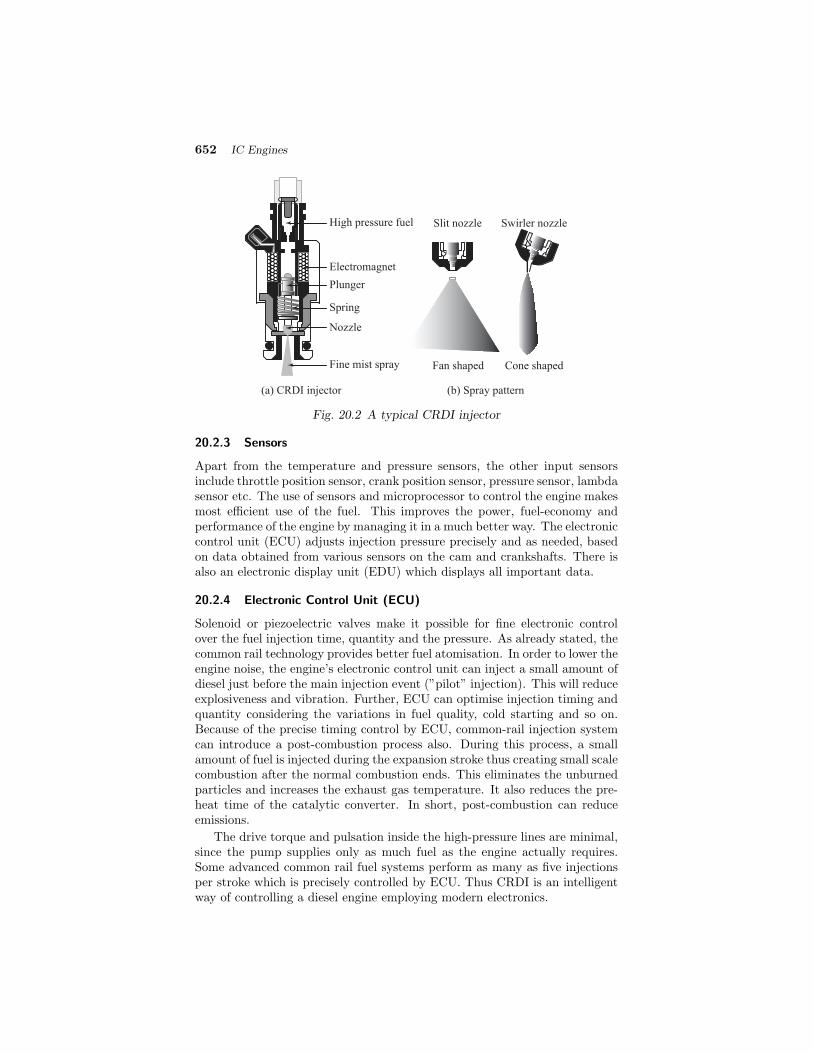
652 IC Engines
High pressure fuel
Electromagnet
Plunger
Spring
Nozzle
Fine mist spray
Slit nozzle
Fan shaped
Swirler nozzle
Cone shaped
(a) CRDI injector (b) Spray pattern
Fig. 20.2 A typical CRDI injector
20.2.3 Sensors
Apart from the temperature and pressure sensors, the other input sensorsinclude throttle position sensor, crank position sensor, pressure sensor, lambdasensor etc. The use of sensors and microprocessor to control the engine makesmost efficient use of the fuel. This improves the power, fuel-economy andperformance of the engine by managing it in a much better way. The electroniccontrol unit (ECU) adjusts injection pressure precisely and as needed, basedon data obtained from various sensors on the cam and crankshafts. There isalso an electronic display unit (EDU) which displays all important data.
20.2.4 Electronic Control Unit (ECU)
Solenoid or piezoelectric valves make it possible for fine electronic controlover the fuel injection time, quantity and the pressure. As already stated, thecommon rail technology provides better fuel atomisation. In order to lower theengine noise, the engine’s electronic control unit can inject a small amount ofdiesel just before the main injection event (”pilot” injection). This will reduceexplosiveness and vibration. Further, ECU can optimise injection timing andquantity considering the variations in fuel quality, cold starting and so on.Because of the precise timing control by ECU, common-rail injection systemcan introduce a post-combustion process also. During this process, a smallamount of fuel is injected during the expansion stroke thus creating small scalecombustion after the normal combustion ends. This eliminates the unburnedparticles and increases the exhaust gas temperature. It also reduces the pre-heat time of the catalytic converter. In short, post-combustion can reduceemissions.
The drive torque and pulsation inside the high-pressure lines are minimal,since the pump supplies only as much fuel as the engine actually requires.Some advanced common rail fuel systems perform as many as five injectionsper stroke which is precisely controlled by ECU. Thus CRDI is an intelligentway of controlling a diesel engine employing modern electronics.

Nonconventional Engines 653
In a conventional non-CRDI system, the interval between injections andthe fuel quantity is determined by mechanical components, but in a CRDI sys-tem this time interval and timing etc. are all controlled by a central computeror microprocessor based electronic control unit. In the current first generationdesign, the pipe withstands pressures as high as 1,600 bar. Precise timing re-duces the characteristic ”Diesel Knock” common to all diesel engines, directinjection or not.
To run a CRDI system effectively, the microprocessor must be programmedto ably handle input from multiple sensors. Based on the input from thesesensors, the microprocessor can calculate the precise amount of the diesel andthe timing when the diesel should be injected inside the cylinder. Using thesecalculations, the CRDI control system delivers the right amount of diesel atthe right time to allow best possible output with least emissions and leastpossible wastage of fuel.
20.2.5 Microcomputer
In modern CRDI system, direct-injection motors are regulated by a powerfulmicrocomputer linked via CAN (Controller Area Network) data bus to othercontrol devices on board. These devices are programmed to exchange data.The engine’s electrical controls are the central element of the common railsystem. It regulates injection pressure and, controls the solenoid valves fittedin each cylinder. It is indispensable for variable control of the motor. Thiselectronic engine management network is a critical element of the commonrail system because only the speed and spontaneity of electronics can ensureimmediate pressure injection adjustment and cylinder-specific control of theinjector solenoid valves.
The microcomputer regulates the amount of time the valves stay open andthus the amount of fuel injected, depending on operating conditions and howmuch output is needed. When it shuts the solenoid valves, fuel injection stopsimmediately. With the state-of-the-art common-rail direct fuel injection, anideal compromise can be achieved between economy, torque, ride comfort andlong life.
20.2.6 Status of CRDI Engines
This technology generates an ideal swirl in the combustion chamber. Coupledwith the common-rail injectors’ superior fuel-spray pattern and optimized pis-ton head design, allows the air-fuel mixture to form a perfect vertical vortex.This results in uniform combustion and greatly reduces NOx (nitrogen oxide)emissions by some 50% over the current generation of diesel engines.
The new common-rail engine (in addition to other improvements) cuts fuelconsumption by 30%, doubles torque at low engine speeds and increases powerby 25%. It also brings a significant reduction in the noise and vibrations ofconventional diesel engines. In emission, greenhouse gases (CO2) is reducedby 30%. At a constant level of NOx, carbon monoxide (CO) emissions are re-duced by 40%, unburnt hydrocarbons (HC) by 50%, and particulate emissionsby 60%.
654 IC Engines
20.2.7 Principle of CRDI in Gasoline Engines
Gasoline engines were using carburetors for supply of air-fuel mixture beforethe introduction of MPFI system. But even now carburetors are in use for itssimplicity and low cost. CRDI principle can be applied to gasoline enginesalso. Now a days the new technology, viz. Gasoline Direct Injection (GDI) isin use for gasoline engines. This is discussed in more detail in section20.6.
20.2.8 Advantages of CRDI Systems
By the introduction of CRDI a lot of advantages can be achieved, some ofthem are:
(i) Improved power, increased fuel efficiency and reduced noise.
(ii) Less emissions and reduced particulates in the exhaust.
(iii) Precise injection timing, very high injection pressure and better stability.
(iv) Better pulverization of fuel.
(v) Increased combustion quality due to pilot and post injection.
(vi) Doubling the torque at lower speeds.
The main disadvantage is that this technology increases the initial cost andthe maintenance of the engine.
20.3 DUAL FUEL AND MULTI-FUEL ENGINE
Conventional internal combustion engines operate on a mono fuel either liquidor gaseous. However, many large sized stationary engines operate on dualfuels. Of the two fuels, normally, one is gaseous and the other is liquid. Thetwo fuels can be taken in varying proportion to run the engine. Such anengine is usually called dual fuel engine. It may be noted that the very firstdiesel engine patented by Dr. Diesel was a dual fuel engine. The engine ranon gaseous fuel ignited by oil injection into the cylinder. World War I wasthe turning point when attention started to focus on dual-fuel engines. It wasdue to the shortage of liquid fuels at that time. Further gaseous fuels werefar more cheaper than liquid fuels. This has led to increased attention on thedual-fuel technology.
Large reserves of natural gas is available and this can be utilized locallyto produce power. The gaseous fuels require a high compression ratio to burnefficiently because they have high self-ignition temperatures. Natural gas iscomposed of mainly (about 95 percent) methane and other light paraffins.It has a higher self- ignition temperature of 740 ◦C compared to 470 ◦C forgasoline. For this reason, mainly diesel engines are more suitable as dual-fuelengines. Moreover, a diesel engine has the ability to run, over a wide rangeof fuels ranging from light fuels like JP-4 and kerosene to heavier fuels andcrude oils.
In short, dual-fuel operation combines in a simple manner the possibilityof operating a diesel engine on liquid fuels such as diesel oil or gas oil and
Nonconventional Engines 655
on gaseous fuels such as natural gas, sewage gas and cook oven gas, etc.The engine can be switched over from dual-fuel operation to diesel operationalmost instantaneously in case of emergency.
20.3.1 The Working Principle
The dual-fuel engine works on diesel cycle. The gaseous fuel which is calledthe primary fuel is inducted by the engine. If the engine is supercharged thenit is supplied by the supercharger at a pressure slightly above the atmosphericpressure. In a four-stroke cycle engine the gas is supplied in the inlet manifoldwhere it mixes with the incoming air to form a homogeneous mixture. In two-stroke cycle engines the gas may be injected at low pressures (1.5 to 3.5 bar)directly into the combustion chamber after the exhaust ports are closed. Thismixture of air and gaseous fuel is compressed in the cylinder just like air ina normal diesel operation. At some point in the compression stroke, neartop dead centre, a small charge of liquid fuel (about 5 to 7 per cent) calledpilot fuel (or the secondary fuel), is injected through a conventional diesel fuelsystem. This pilot injection acts as a source of ignition. The gas-air mixturein the vicinity of the injected spray ignites at number of places establishing anumber of flame-fronts. Thus combustion starts smoothly and rapidly.
It may be noted that in a dual-fuel engine the combustion starts in afashion similar to the CI engine. However, the flame front propagates in amanner similar to the SI engine. The power output of the engine is normallycontrolled by changing the amount of primary gaseous fuel. The pilot oilquantity is usually kept constant for a given engine and is about 5 to 7 percentof the total heat of the engine at full load. The dual-fuel engine is capableof running on either gas or diesel oil or a combination of these two over awide range of mixture ratios. Figure 20.3 shows a typical p-θ variation for adual-fuel engine showing the weak limit and rich limit of operation. It can beseen that transition from one fuel to another is quite smooth.
20.3.2 Combustion in Dual-Fuel Engines
The ignition of the gaseous fuel in a dual-fuel engine is achieved by introduc-ing a small amount of liquid fuel in the form of fine spray near TDC. Thecombustion following this injection is strongly dependent on the amount ofgaseous fuel supplied. The process of combustion can be divided into threemain stages:
(i) Without the gaseous fuel the pilot fuel burns similar to, in a dieselengine. However, it is not sufficient to maintain the speed of the engineat the desired level. It requires at least 10 to 14 percent of full load fuelto run the engine at no load. As already stated the pilot fuel injectedis only about 5 to 7 percent of full load value. As the gaseous fuel isintroduced, the weak gas-air mixture comes in contact with the injectedspray of the pilot fuel. Only that part of the mixture which is within thecombustible limit of the spray gets oxidized. The rest of the gas remainsunaffected and goes in exhaust. This results in very low efficiency atpart load operation of the engine.

656 IC Engines
060 40 20 60 80 100TDC 4020
10
20
30
40
50
60
70
Cyli
nder
pre
ssure
(bar
)
Compr
essi
on
Crank angle (degrees)
1
4
3
2
1. Pilot
2. Pilot + weak limit
3. Pilot + rich limit
4. Diesel
Fig. 20.3 Typical p− θ diagram for a dual fuel engine
(ii) As the amount of the gaseous fuel is increased, the gas air mixture in thevicinity of the injected fuel spray also gets oxidized and starts burningat a number of places. Flame-fronts start traveling from these ignitionpoints and combustion takes place rapidly and almost completely. Thecombustion then is exactly similar to combustion in an SI engine. Thep-θ diagram will be as shown in 20.4(a).
(iii) Further admission of the gaseous fuel results in very fast reaction rates.This is followed by ignition with very high rates of pressure rise and com-bustion becomes uncontrollable. This is the onset of knock. The highrates of pressure rise result in combustion noise and a marked change inthe shape of pressure-crank angle diagram as seen in Fig.20.4(b).
The very high peak pressure and the oscillations on the expansion curveare exactly similar to the knocking condition usually seen in SI engine. Thetransition from ’normal’ to knocking condition is quite sharp. A small increasein the gaseous fuel beyond a limit can result in very severe knock which candamage the engine. The ignition quality and the amount of pilot fuel seem tohave little influence on the quality of the charge at knocking conditions.
20.3.3 Nature of Knock in a Dual-Fuel Engine
The phenomenon of knock in a dual-fuel engine is of the nature of auto-ignitionof gaseous mixture in the neighbourhood of injected spray. When the pilotfuel is injected a series of pre-combustion reactions of chain type occur andheat energy is released. If this heat energy is more than that dissipated by thefuel droplets, the temperature in the vicinity of spray increases. This results
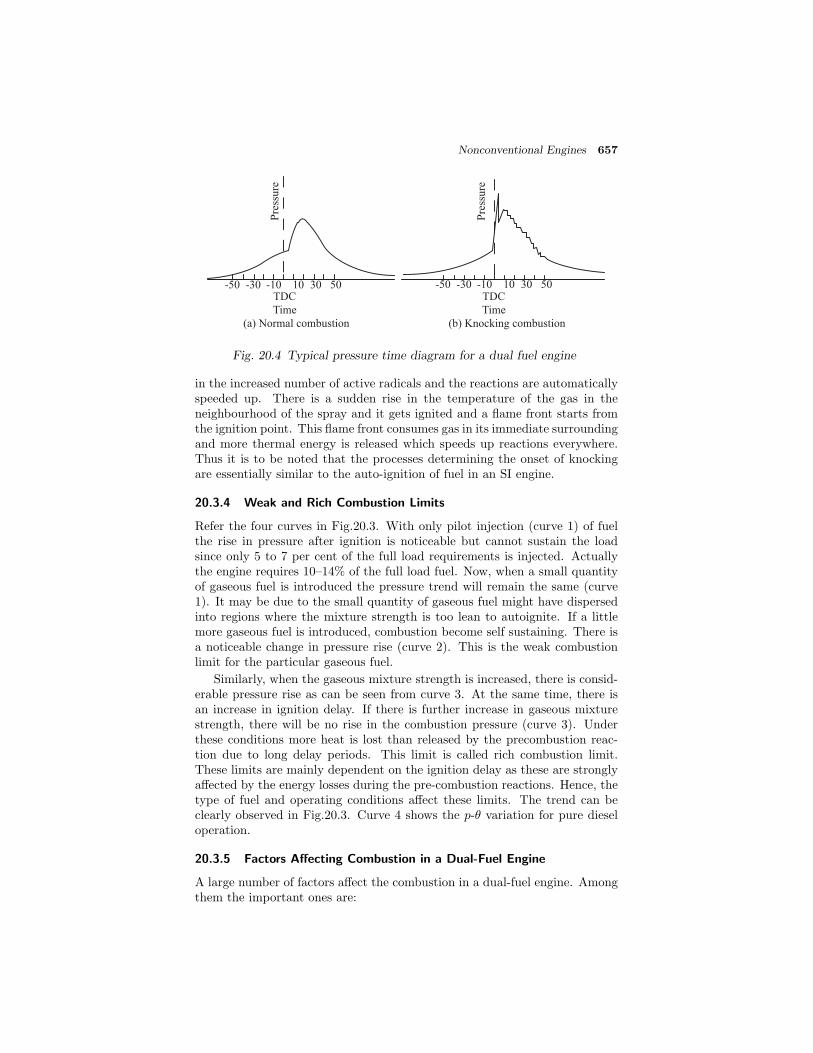
Nonconventional Engines 657
(b) Knocking combustion
10 30TDC
-10-30 50-50
Pre
ssure
Time
(a) Normal combustion
10 30TDC
-10-30 50-50
Time
Pre
ssure
Fig. 20.4 Typical pressure time diagram for a dual fuel engine
in the increased number of active radicals and the reactions are automaticallyspeeded up. There is a sudden rise in the temperature of the gas in theneighbourhood of the spray and it gets ignited and a flame front starts fromthe ignition point. This flame front consumes gas in its immediate surroundingand more thermal energy is released which speeds up reactions everywhere.Thus it is to be noted that the processes determining the onset of knockingare essentially similar to the auto-ignition of fuel in an SI engine.
20.3.4 Weak and Rich Combustion Limits
Refer the four curves in Fig.20.3. With only pilot injection (curve 1) of fuelthe rise in pressure after ignition is noticeable but cannot sustain the loadsince only 5 to 7 per cent of the full load requirements is injected. Actuallythe engine requires 10–14% of the full load fuel. Now, when a small quantityof gaseous fuel is introduced the pressure trend will remain the same (curve1). It may be due to the small quantity of gaseous fuel might have dispersedinto regions where the mixture strength is too lean to autoignite. If a littlemore gaseous fuel is introduced, combustion become self sustaining. There isa noticeable change in pressure rise (curve 2). This is the weak combustionlimit for the particular gaseous fuel.
Similarly, when the gaseous mixture strength is increased, there is consid-erable pressure rise as can be seen from curve 3. At the same time, there isan increase in ignition delay. If there is further increase in gaseous mixturestrength, there will be no rise in the combustion pressure (curve 3). Underthese conditions more heat is lost than released by the precombustion reac-tion due to long delay periods. This limit is called rich combustion limit.These limits are mainly dependent on the ignition delay as these are stronglyaffected by the energy losses during the pre-combustion reactions. Hence, thetype of fuel and operating conditions affect these limits. The trend can beclearly observed in Fig.20.3. Curve 4 shows the p-θ variation for pure dieseloperation.
20.3.5 Factors Affecting Combustion in a Dual-Fuel Engine
A large number of factors affect the combustion in a dual-fuel engine. Amongthem the important ones are:

658 IC Engines
(i) amount of the pilot fuel injection,
(ii) injection timing
(iii) Cetane number of pilot fuel
(iv) throttling
(v) nature of the gaseous fuel,
(vi) the mixture strength and its initial pressure and temperature.
20.3.6 Advantages of Dual Fuel Engines
In addition to the inherent advantage of using efficiently the available cheapergaseous fuel from various sources the dual fuel engine has substantial advan-tages over a single fuel engine. They are:
(i) The gas burns neatly and therefore the exhaust is clean which indirectlyhelps in reducing air pollution.
(ii) The clean combustion results in reduced wear of the engine parts andreduced consumption of the lubricating oil. Further it reduces the con-tamination of the lubricating oil.
(iii) The utility of the power plant is highly increased by its ability of instan-taneous change over from gas to diesel and vice-versa.
(iv) Only a small amount of liquid fuel is needed to run the engine andthereby there is a saving of precious fossil liquid fuel.
(v) The dual-fuel engine is highly suitable for total energy installation. Forexample the exhaust heat of the engine can be used for digesting thesludge in a sewage disposal plant and the sewage gas produced can beused to run the engine itself.
(vi) A typical use of the dual-fuel engine has been to produce synthetic gas,which is a mixture of CO and H2 by burning methane in it and alsoproducing power at the same time.
(vii) For LPG tankers, these engines are ideally suited as they can utilize thegas which mainly evaporates during transportation, by suitably arrest-ing it.
20.4 MULTIFUEL ENGINES
A multi-fuel engine is one which can be satisfactorily operated with compara-ble performance and efficiency on a wide variety of fuels ranging from dieseloil, crude oil, JP-4 to lighter fuels like gasoline, and even the normal lubricat-ing oil. The main reasons for developing multi-fuel engines have been mainlyfor the military requirements. The need of an engine which can satisfacto-rily run on any automotive fuel in case of emergency, a situation very oftenoccurring during the war.
Nonconventional Engines 659
Multifuel engine have a good idling and part-load efficiency, and low ex-haust smoke and noise under these operating conditions to avoid any possibledetection by the enemy. Further, shortage of middle range distillates hasstarted a trend for diesel engines seeking alternate fuels for their operation.The interest in the multifuel engine has further increased by the realizationof the possibilities, of getting fuel economy of CI engines using gasoline.
20.4.1 Characteristics of a Multi-Fuel Engine
Almost all diesel engines are capable of burning a wide variety of fuels. Theuse of low ignition quality fuels requires a higher compression ratio for satis-factory burning. It may be noted that raising the compression ratio of an SIengine is difficult because of knocking. Therefore, CI engines are most suit-able for multi-fuel operations. A multi-fuel engine must fulfill the followingrequirements:
(i) must have good combustion efficiency.
(ii) combustion chamber temperature must be comparatively higher.
(iii) easy starting under sub-zero temperature conditions.
(iv) must have low exhaust smoke and noise levels.
The above requirements give an indication of the design features essentialfor multi-fuel operation. These are:
(i) Higher compression ratio: Gasoline have a cetane number of less than20 which is an indication of their low ignition quality for use in a dieselengine. Therefore, the compression ratios of multi-fuel engines are usu-ally around 23:1 to increase the temperature at the end of compressionstroke for proper burning. Higher compression ratio will also ensure bet-ter mixing of fuel and air at higher temperatures. This will reduce themisfiring tendency of the engine when running on low ignition qualityfuels.
(ii) Stroke to bore ratio: It is very important to maintain the combustionchamber hot under all conditions of speed and load. A large stroke tobore ratio gives a compact combustion chamber. Stroke to bore ratio ashigh as 1.35:1 has been used.
(iii) Combustion chamber: An open combustion chamber is better suited formulti-fuel operation than a pre-combustion chamber. It is because inthe latter additional heat losses due to throat occur during compression.A spherical combustion chamber is ideally suitable for such engines dueto lowest surface to volume ratio. However, its air utilization is notoptimum.
(iv) Injection pump: The conventional jerk-type fuel pump can satisfactorilymeet the requirements of multi-fuel operation.
The difficulties of multi-fuel operation are:

660 IC Engines
(i) Tendency of vapour lock in the fuel pump while using lighter fuels.
(ii) Tendency of increased wear in fuel pump due to lower lubricity of thefuel.
(iii) Requirement of injecting different volumes of fuels due to differences intheir heating values and compressibility effect.
20.5 FREE PISTON ENGINE
Extensive use of fossil fuels as an energy source for both sea and land basedtransport leads to significant production of CO2 and other pollutants. Furtherthere is always a quest for increased power from a given cylinder size. Lotof research, particularly within the automotive industry, is in progress todevelop more environmental friendly fuel chains. However, the complete fuelchain (’well-to-wheel’) efficiencies are not yet superior to those of conventionaltechnology. Important steps in this direction are:
(i) improvements in the fuel properties and
(ii) component design changes for higher efficiencies, lower cost and weight.
However, a different approach in the direction of using different cycles ofoperation or modifications of existing cycle has also been pursued with greatinterest. In this respect to start with naturally aspirated I.C. engine was firstsupercharged to get increased power. Further, improvements in the super-charger design resulted in turbocharged engine development. Turbochargerutilizes exhaust heat to drive the compressor with the help of an exhaust gasdriven turbine. This idea of using exhaust energy has culminated to its logicalend in a free piston engine
After being abandoned in the mid-20th century, free-piston engines arebeing investigated nowadays by a number of research groups worldwide. Itis considered as an alternative to conventional engine-generator sets or forgenerating hydraulic power in off-highway vehicles. Reasons for the interestin developing the free-piston engine include:
(i) optimized combustion through variable compression ratio,
(ii) higher part load efficiency,
(iii) possible multi-fuel operation,
(iv) reduced frictional losses
(v) simple design
(vi) few moving parts.

Nonconventional Engines 661
20.5.1 Free-Piston Engine Basics
Due to the breadth of the term free-piston, many engine configurations willfall under this category. The free-piston term is most commonly used to dis-tinguish a linear engine from a rotating crankshaft engine. The piston is ’free’because its motion is not controlled by the position of a rotating crankshaft,as in the conventional engines. It is determined by the interaction between thegas forces and load acting upon it. This gives the free-piston engine some dis-tinct characteristics, including variable stroke length and the need for activecontrol of piston motion. Other important features of the free-piston engineare potential reductions in frictional losses and possibilities to optimize engineoperation using the variable compression ratio.
20.5.2 Categories of Free Piston Engine
Free-piston engines are usually divided into three categories based on thepiston/cylinder configuration. A fourth category is free-piston gas generatorsin which the load is extracted purely from an exhaust turbine. There is noseparate load device mechanically coupled to the engine. Various categoriesof free-piston engines are described in the following sections.
20.5.3 Single Piston
A single piston free-piston engine is shown in Fig.20.5. This engine essentiallyconsists of a combustion cylinder, a load device, and a rebound device to storethe energy required to compress the next cylinder charge.
The hydraulic cylinder in the engine serves as both load and rebounddevice. In some other designs these may be two individual devices, for exam-ple an electric generator and a gas filled bounce chamber. A simple designwith high controllability is the main strength of the single piston design com-pared to the other free-piston engine configurations. The rebound device maygive the opportunity to accurately control the amount of energy put into thecompression process and thereby regulating the compression ratio and strokelength.
LP HP
Combustion cylinder
Hydraulic load and rebound device
Fig. 20.5 Single piston free-piston engine
20.5.4 Dual Piston
A typical dual piston (or dual combustion chamber) configuration is shown inFig.20.6. It has been the topic for much of the recent research in free-piston

662 IC Engines
engine technology. A number of dual piston designs have been proposed and afew prototypes have emerged, both with hydraulic and electric power output.This configuration eliminates the need for a rebound device. It is because atany time working piston provides the work to drive the compression processin the other cylinder. This allows a simple and more compact device withhigher power to weight ratio.
Some problems with the dual piston design have, however, been reported.The control of piston motion, in particular stroke length and compressionratio, has proved difficult. This is due to the fact that the combustion processin one cylinder drives the compression in the other. A small variations inthe combustion will have large influence on the next compression. This is acontrol challenge because the combustion process is to be controlled accuratelyin order to optimize emissions and/or efficiency. Experimental work with thistype of dual piston engines has reported high sensitivity to load variationsand high cycle-to-cycle variations.
LP
HP
Rebound device
Combustion cylinder Combustion cylinder
Load device
Load device
Fig. 20.6 Dual piston free-piston engine
20.5.5 Opposed Piston
An opposed piston type free-piston engine essentially consists of two singlepiston units with a common combustion chamber. Each piston requires are-bound device, and a load device. The load device may be coupled to oneor both of the pistons. Figure 20.7 shows an opposed piston type free-pistonengine, with a mechanical piston synchronization mechanism.
Bounce chamber
Combustion chamber
Piston synchronisation
mechanism
Bounce chamber
Fig. 20.7 Opposed piston free-piston engine
The opposed piston principle was used almost exclusively in the early free-piston engine designs (1930-1960), and mechanical linkages connected the two

Nonconventional Engines 663
pistons to ensure symmetric piston motion, as illustrated in Fig.20.7. Theseengines served successfully as air compressors and later as gas generators inlarge-scale plants. A number of units are often used to feed a single powerturbine.
The main advantage of this opposed piston configuration is the perfectlybalanced and vibration-free design. This feature is not available with any ofthe other free-piston configurations. Therefore, in other designs alternativemeans of controlling vibrations is required. A further advantage of the op-posed piston design is reduced heat transfer losses due to the opposed pistoncylinder eliminating the cylinder head. This also allows uniflow scavengingto be used, giving high scavenging efficiency. The main disadvantage of thisdesign is the absolute need for a piston synchronization mechanism. This, to-gether with the need for a dual set of the main components, makes the enginecomplicated and bulky.
20.5.6 Free Piston Gas Generators
These are free-piston engines feeding hot gas to a power turbine. The only’load’ for the engine is that to supercharge the intake air. The output work istaken entirely from the power turbine. Free-piston gas generators were used insome large-scale marine and stationary power plants in the mid-20th century.Attempts were also made to use this principle in automotive applications.Figure 20.8 illustrates an opposed piston free-piston gas generator plant.
Bounce
cham
ber
Super
char
ge
pum
p
Intake air valve
Scavenge air box
Exhaust
gas receiver
Power turbine
Intake air valve
Fig. 20.8 Gas generator free-piston engine
Compared to a conventional gas turbine, the free-piston gas generator hasthe advantage of high compression and pressure ratios. In this arrangementthe work needed to compress the intake air is extracted from the gas which issupplied to the power turbine. Consequently, the gas fed to the turbine holdsa lower temperature which reduces the materials requirements. Further, itallows the turbine to be placed away from the combustor without extensiveheat transfer losses. The operational characteristics of a free-piston gas gen-erator do not differ much from those of other free-piston engines of the sameconfiguration. The opposed piston free-piston gas generator was the topic ofmuch research in the mid-20th century. However, as conventional gas turbinetechnology matured, the free-piston gas generator concept was abandoned.
664 IC Engines
20.5.7 Loading Requirements
Free-piston engines require a linear load. Further, for the overall systemto be efficient the load must provide efficient energy conversion. Internalcombustion engines and gas turbines are the main devices for many years forelectric power generation. A challenge for free-piston engine developers is tofind linear equivalents of these machines with comparable performance. Themechanical requirements for free-piston engine load devices are high since theload is coupled directly to the mover. Moreover, the load will be subjected tohigh acceleration forces. Secondary effects from the high accelerations suchas cavitations in hydraulic cylinders must also be considered. Furthermore,the load device may be subjected to heat transfer from the engine cylinders.Known free-piston engine loads include electric generators, hydraulic pumpsand air compressors.
20.5.8 Design Features
The simple design of the free-piston engine compared to conventional technol-ogy is one of the driving forces behind many of the recent free-piston enginedevelopments. The elimination of the crank mechanism reduces the numberof parts. The major design features of the free-piston engines are:
(i) Low frictional losses: Fewer moving parts in the free-piston engine givereduced frictional losses. Absence of a crankshaft eliminates losses dueto crankshaft bearing friction and pure linear motion leads to very lowside loads on the piston. This also reduces the cylinder lubricationrequirements
(ii) Reduced manufacturing costs: The reduced number of parts in the free-piston engine results in lower manufacturing costs
(iii) Compactness: This is again due to reduced number of parts. The sizeand weight of the free-piston engine can be reduced, giving a more com-pact unit.
(iv) Low maintenance costs and increased life: The reduced frictional lossesdue to reduced number of parts reduce the maintenance costs of thefree-piston engine which increases life.
20.5.9 The Combustion Process
It is believed that the combustion in free-piston engines benefits from the highpiston speed around TDC. This leads to higher air velocity and turbulencelevel in the cylinder. It helps air-fuel mixing and increase the reaction rateand flame speed. The high piston acceleration just after TDC leads to a rapidexpansion. The time dependent chemical reactions, such as NOx formation,are potentially reduced.
A particular feature of the free-piston engine is the ability of the combus-tion process to influence the speed of the expansion. It is due to the directcoupling of the combustion cylinder to the low-inertia moving part. A rapidcombustion process and pressure rise may lead to a faster expansion and vice

Nonconventional Engines 665
versa. In a conventional engine, the inertia of the crank system and flywheelensures that the speed of the engine stays constant in the time frame of thecombustion process.
20.5.10 Combustion Optimization
The variable compression ratio in the free piston engine may allow for op-timization of the combustion process not achievable in conventional engines.Nowadays, a sufficiently accurate piston motion control system can be real-ized. The compression ratio can be regulated even during operation to achievebest possible performance in terms of efficiency or emissions. Free-piston en-gines with compression ratio as high as 50:1 has been reported in the mid-20thcentury.
20.5.11 Advantages and Disadvantages of Free Piston Engine
Advantages:
(i) Simplicity: Vibration is very much reduced due to inherently balancedconfiguration of opposed piston The absence of crankshaft and connect-ing rods results in great mechanical simplicity.
(ii) Flexibility and reliability: Compared to conventional engines, the free-piston engine has certain flexibility of installation and the plant life fora free-piston engine is much higher compared to conventional engines.
(iii) Multifuel capability: The free piston engine has a characteristic of ad-justing to the ignition requirements by changing its compression ratio.The compression ratio varies from about 30 to 50. This property allowsit to utilize a wider variety of fuels than the conventional high speeddiesel engine.
(iv) Power to weight ratio: The power to weight ratio of a free piston engineis quite favorable
(v) Lower turbine operating temperatures: In gas generator free piston en-gines, the gas turbine in the free-piston engine does not have to supplycompression work to the compressor, unlike the conventional gas tur-bine power-plant. Turbine inlet temperatures of about 750 to 800 K arecommon in the free-piston engine as compared to that of about 1200 to1400 K in the conventional gas turbine plants.
(vi) Vibrations, noise and maintenance: Due to better balancing the vibra-tions and structure-borne noise are lower compared to diesel engine. Allthese, along with lower operating temperatures, result in low mainte-nance requirements.
(vii) Starting and control: Due to variable compression ratio, it is easy tostart a free-piston engine. The air required for starting the free pistonengine is much less compared to diesel engine of corresponding size.

666 IC Engines
(viii) Waste heat recovery: Free piston engine is highly suitable for wasteheat recovery. The nearly constant temperature and constant mass flowrate with load allows efficient waste heat recovery giving a reasonablyconstant output under all loads.
(ix) Application for marine or land traction: In marine application, it gives ahigh degree of maneuverability and the reverse speed compared to dieselengines or steam turbines. In road or rail traction the torque converterrequirements are reduced, thereby, less elaborate transmission system isrequired.
(x) Manufacturing cost: The manufacturing cost is much less compared toconventional engines due to reduced number of parts.
Disadvantages:
Though the free piston engine has many advantages it also suffers fromthe following disadvantages.
(i) Poor fuel economy: The specific fuel consumption of a free piston engineis much higher than the diesel engine.
(ii) Stability: Free-piston engines require a certain quantity of fuel per strokewhich varies according to load to maintain a stable operation. Anyfluctuation in the fuel or air supply will make the operation unstable.
(iii) Part load efficiency: At part loads the pistons reciprocate within a nar-row limit as the compression ratio is decided by the combustion pressureinside the cylinder. This results in poor part load efficiency especially atvery low load and at this condition a part of the gas has to be blown-off.
(iv) High combustion rates: Due to higher supercharge the rate of combus-tion per cylinder volume is 4 to 6 times higher compared to conventionaldiesel engines. This causes difficulty in wall lubrication, higher ring wearand cooling problems.
(v) Reduction gearing: The gearing arrangement necessary to couple highspeed turbine with the load, for example a marine propeller tends toincrease the initial cost and weight of the plant.
20.5.12 Applications of Free Piston Engine
As on today the free-piston engine has not established itself very much andhas limited use. However, with intensive research and development, it mayfind large number of industrial and other applications in the future such as
(i) submarine air compressor units,
(ii) power generation in medium power range,
(iii) ship propulsion, road and rail traction and even in aircrafts,
(iv) high speed centrifugal air compressors,
Nonconventional Engines 667
(v) pumping oil as no fire wall is necessary, and
(vi) mixed gas-steam cycle.
20.6 GASOLINE DIRECT INJECTION ENGINE
Until 1995, carburetor was the device that supplied fuel to the four-wheelerengine. Even today on many other machines, such as two-wheelers, lawnmow-ers and chainsaws, it still is. With improvements in the automobile design anddevelopment, the carburetor got more and more complicated trying to handleall of the operating requirements. To handle some of these tasks, carburetorshad five different circuits:
(i) Main circuit: Provides just enough fuel for fuel-efficient cruising
(ii) Idle circuit: Provides just enough fuel to keep the engine idling
(iii) Accelerator pump Provides an extra burst of fuel when the acceleratorpedal is depressed, reducing hesitation before the engine speeds up
(iv) Power enrichment: Provides extra fuel when the vehicle is going up ahill or towing a trailer
(v) Choke: Provides extra rich mixture when the engine is cold so that itwill start effortlessly
In order to meet stricter emissions requirements, catalytic converters wereintroduced. For the catalytic converter to be effective very careful control ofthe air-fuel ratio is a must. Oxygen sensors, monitor the amount of oxygen inthe exhaust. The engine control unit (ECU) uses this information to adjustthe air-to-fuel ratio in real-time. This is called closed loop control. It wasnot feasible to achieve this control with carburetors. There was a brief periodof electrically controlled carburetors before fuel injection systems took over.However, these electrical carburetors were even more complicated than themechanical ones.
The development of fuel feed system for SI engines can be seen fromFig.20.9. The carburettors were in vogue until 1995. Then carburetors slowlygot replaced with throttle body fuel injection systems between 1980 and 1995.They are also called as single point or central fuel injection systems. Theywere electrically controlled fuel-injector valves into the throttle body. Thesewere almost a bolt-in replacement for the carburetor. The automakers didnot have to make any drastic changes to their engine designs. Gradually,as new engines were designed, throttle body fuel injection was replaced bymulti-port fuel injection (1995–2005). These are also known as port, multi-point or sequential fuel injection. These systems have a fuel injector for eachcylinder. They are usually located in such a way that they spray right at theintake valve. These systems provide more accurate fuel metering and quickerresponse. Between 1995 and 2005, gasoline direct injection slowly got intofour-wheelers. After 2005, all major car manufacturers appear to be switchingover to this new gasoline engine technology. In internal combustion engines,

668 IC Engines
Carburettor
Throttle body and multipoint injection
Gasoline direct injection
1970 1980 1990 2000
Intake port
Fuel spray
2010
Carburettor Injector
Fig. 20.9 History for carburettor
gasoline direct injection (GDI) is a variant of fuel injection employed in mod-ern two-stroke and four-stroke gasoline engines. This is similar to CRDI indiesel engine. The gasoline is pressurized, and injected via a common rail fuelline directly into the combustion chamber of each cylinder. This is differentfrom conventional multi-point fuel injection (MPFI) in which injection takesplace in the intake manifold, or cylinder port. In some applications, gasolinedirect injection enables a stratified fuel charge (ultra lean burn) combustionfor improved fuel efficiency, and reduced emission levels at low load.
20.6.1 Modes of Operation
The major advantages of a GDI are increased fuel efficiency and higher poweroutput. Emission levels can also be more accurately controlled with the GDIsystem. The cited gains are achieved by the precise control over the amount offuel and injection timings that are varied according to the load conditions. Inaddition, there are no throttling losses in most GDI engines. In such enginesthe efficiency is greatly improved. Further, pumping losses are considerablyreduced because of the absence of the throttle plate. Engine speed is controlledby the engine control unit or engine management system (EMS). It regulatesfuel injection function and ignition timing. Adding this function to the EMSrequires considerable enhancement of its processing and memory of ECU.Direct injection plus the engine speed management must have very precisealgorithms for good performance and driveability.
The engine management system continually chooses among three combus-tion modes: ultra lean burn, stoichiometric, and full power output. Eachmode is characterized by the air-fuel ratio. The gravimetric stoichiometricair-fuel ratio for gasoline is 14.7:1. But, ultra lean mode can involve ratios ashigh as 60:1 for even higher in some engines, for very limited periods. Thesemixtures are much leaner than in a conventional engine and reduce fuel con-sumption quite considerably. Let us see the details of the three modes ofoperation briefly.
Nonconventional Engines 669
(i) Ultra lean burn mode is used for light-load running conditions, at con-stant or reducing road speeds, where no acceleration is required. Thefuel is not injected during the intake stroke but rather at the latterstages of the compression stroke. By this a small amount of air-fuelmixture is optimally placed near the spark plug. This stratified chargeis surrounded mostly by air. This keeps the fuel and the flame awayfrom the cylinder walls by which lowest emissions and heat losses areachieved. The combustion takes place in a toroidal (donut-shaped) cav-ity on the piston head. The cavity is displaced towards the fuel injectorside. This technique enables the use of ultra-lean mixtures that wouldbe impossible with carburetors or conventional fuel injection.
(ii) Stoichiometric mode is used for moderate load conditions. Fuel is in-jected during the intake stroke. This creates a homogenous fuel-airmixture in the cylinder. From the stoichiometric mixture, an optimumcombustion results. There is a good possibility of clean exhaust emis-sion, further cleaned by the catalytic converter.
(iii) Full power mode is used for rapid acceleration and heavy loads (climbinga hill). The air-fuel mixture is homogenous and the ratio is slightly richerthan stoichiometric. This can help in preventing knock. In this modefuel is injected during the intake stroke.
Direct injection may also be accompanied by other engine technologiessuch as variable valve timing (VVT) and tuned/multi path or variable lengthintake manifolding (VLIM, or VIM). Water injection or more commonly em-ployed exhaust gas recirculation (EGR) may help in reducing the high nitrogenoxides (NOx) emissions that can result from burning ultra lean mixtures.
Because of electronic control, it is also possible to inject more than onceduring a single cycle. After the first fuel charge has been ignited, it is possibleto add fuel as the piston descends. The benefits are more power and economy.However, certain octane fuels have been seen to cause exhaust valve erosion.For this reason, most manufacturers have ceased to use the Fuel StratifiedInjection (FSI) operation during normal running. Tuning up an early gener-ation FSI engine to generate higher power is difficult. This is because, onlyone injection is possible during the induction phase.
Conventional injection engines can inject throughout the four-stroke se-quence, as the injector squirts onto the back of a closed valve. A directinjection engine, where the injector injects directly into the cylinder, is lim-ited to the suction stroke of the piston. As the engine speed increases, thetime available to inject fuel decreases. Newer FSI systems that have sufficientfuel pressure to inject even late in compression phase do not suffer from thisdeficiency. However, they still do not inject during the exhaust cycle (theycould but it would just waste fuel). Hence, all other factors being equal, anFSI engine needs higher-capacity injectors to achieve the same power as aconventional engine.
670 IC Engines
20.7 HOMOGENEOUS CHARGE COMPRESSION IGNITION ENGINE
Homogeneous charge compression ignition (HCCI) is a form of internal com-bustion in which well-mixed fuel and air are compressed to the auto-ignitiontemperature of the fuel. The exothermic reaction releases chemical energyinto a sensible form that can be transformed in an engine into work and heat.
HCCI has characteristics of the two most popular forms of combustionused in engines:
(i) homogeneous charge spark ignition and
(ii) stratified charge compression ignition.
However, rather than using a spark to ignite the mixture, the density and tem-perature of the mixture are raised by compression. When the entire mixturereaches its self ignition temperature it reacts spontaneously.
The main characteristic of HCCI is that the ignition occurs at severalplaces. This makes the fuel-air mixture burn nearly simultaneously. There isno direct initiator of combustion. This poses a real challenge to control thecombustion. However, advances in microprocessors and physical understand-ing of the ignition process come to our help.
HCCI concept, if properly implemented, can achieve gasoline engine-likeemissions along with diesel engine-like efficiency. In fact, HCCI engines havebeen shown to achieve extremely low levels of nitrogen oxide (NOx) emissionswithout after-treatment in a catalytic converter. The unburned hydrocarbonand carbon monoxide emissions are still high (due to lower peak tempera-tures), as in gasoline engines. Therefore, exhaust gases must be treated tomeet automotive emission regulations.
Recent research has shown that the use of two fuels with different reac-tivities (such as gasoline and diesel) can help to solve some of the difficultiesof controlling HCCI ignition and burn rates. Reactivity Controlled Compres-sion Ignition (RCCI) has been demonstrated to provide highly efficient, lowemission operation over wide load and speed ranges. HCCI engines have along history. However, it may be noted that HCCI has not yet been as widelyimplemented as spark ignition or diesel injection.
HCCI engine is essentially works on an Otto cycle. In fact, HCCI waspopular before electronic spark ignition was used. One example is the hot-bulb engine which used a hot vaporization chamber to help mix fuel with air.The extra heat combined with compression induced conditions for combustionto occur.
A mixture of fuel and air will ignite when the concentration and tempera-ture of reactants are sufficiently high. The concentration and/or temperaturecan be increased either by increasing compression ratio, or pre-heating ofinduction gases, or forced induction, or retained or re-inducted exhaust gases.
Once ignited, combustion proceeds very rapidly. When auto-ignition oc-curs too early or with too much chemical energy, combustion is too fast. Thiscan cause very high in-cylinder pressures and may destroy the engine. For thisreason, HCCI is typically operated at lean overall fuel mixtures. Therefore,the challenging job in HCCI is the appropriate control of combustion.

Nonconventional Engines 671
20.7.1 Control
Controlling HCCI is a major problem, which causes major hurdle to morewidespread commercialization. In a typical gasoline engine, a spark is used toignite the pre-mixed fuel and air. In diesel engines, combustion begins whenthe fuel is injected into compressed air. In both cases, the timing of combus-tion is explicitly controlled. In an HCCI engine, however, the homogeneousmixture of fuel and air is compressed and combustion begins whenever theappropriate conditions are reached. This means that there is no well-definedcombustion initiator that can be directly controlled.
Engines can be designed so that the ignition conditions occur at a desirabletiming. To achieve this in an HCCI engine, the control system must come intoeffect to bring the conditions that induce combustion. As already mentioned,the control must be effected either by
(i) variable compression ratio, or
(ii) variable induction temperature, or
(iii) variable exhaust gas percentage, or
(iv) variable valve actuation, or
(v) variable fuel ignition quality.
Various control approaches mentioned above are briefly discussed in the fol-lowing sections.
20.7.2 Variable Compression Ratio
There are several methods for changing both the geometric and effective com-pression ratio. For example,
(i) The geometric compression ratio can be changed with a movable plungerat the top of the cylinder head.
(ii) The effective compression ratio can be changed from the geometric ratioby closing the intake valve either very late or very early with some formof variable valve actuation mechanism.
Both the approaches mentioned above require some additional power to achievefast responses. Further, implementation is expensive. However, control of anHCCI engine using variable compression ratio strategies is found to be effec-tive. The effect of compression ratio on HCCI combustion has been studiedextensively.
20.7.3 Variable Induction Temperature
In HCCI engines, the auto-ignition event is highly sensitive to temperature.Various methods have been tried, using temperature to control combustiontiming. The simplest method uses resistance heaters to vary the inlet tem-perature, but this approach is slow. It cannot change the temperature on a

672 IC Engines
cycle-to-cycle basis. Another technique is known as fast thermal management(FTM) method. It is achieved by rapidly varying the cycle to cycle intakecharge temperature by rapidly mixing hot and cold air streams. It is alsoequally expensive to implement and has limited range of application.
20.7.4 Variable Exhaust Gas Percentage
Incylinder exhaust gas is very hot if retained or relatively cool if re-inductedfrom the previous cycle through the intake as in conventional EGR systems.Both hot EGR and cool EGR have been tried. The exhaust has dual effectson HCCI combustion. Cool EGR dilutes the fresh charge, delaying ignitionand reducing the chemical energy and engine work. Hot EGR converselywill increase the temperature of the gases in the cylinder and will advanceignition. Control of combustion timing in HCCI engines using EGR has alsobeen studied extensively.
20.7.5 Variable Valve Actuation
Variable valve actuation (VVA) has proven to extend the HCCI operating re-gion by giving finer control over the temperature-pressure-time history withinthe combustion chamber. VVA can achieve this by two distinct methods:
(i) Controlling the effective compression ratio: A variable valve actuationsystem on intake can control the point at which the intake valve closes.If this is retarded past bottom dead center, then the compression ra-tio will change, altering the in-cylinder pressure-time history prior tocombustion.
(ii) Controlling the amount of hot exhaust gas retained in the combustionchamber: A VVA system can be used to control the amount of hot in-ternal exhaust gas recirculation (EGR) within the combustion chamber.This can be achieved either by including valve re-opening and changesin valve overlap. By balancing the percentage of cool EGR with the hotinternal EGR generated by a VVA system, it may be possible to controlthe in-cylinder temperature.
While electro-hydraulic and camless VVA systems can be used to give a greatdeal of control over the valve event, manufacturing of components for suchsystems is currently complicated and expensive. Mechanical variable lift andduration systems, however, are far cheaper and less complicated. If the desiredVVA characteristic is known, then it is relatively simple to configure suchsystems to achieve the necessary control over the valve lift curve
20.7.6 Variable Fuel Ignition Quality
Another means to extend the operating range is to control the onset of ignitionand the heat release rate by manipulating fuel ignition quality itself. This isusually carried out by adopting multiple fuels and blending. Examples couldbe blending of commercial gasoline and diesel or natural gas or ethanol. Thiscan be achieved by the following ways:
Nonconventional Engines 673
(i) Blending fuels upstream of the engine: Two fuels are mixed in the liquidphase, one with lower resistance to ignition (such as diesel fuel) anda second with a greater resistance (gasoline). The timing of ignitionis controlled by varying the ratio of these fuels. Fuel is then deliveredusing either as port or direct injection.
(ii) Having two fuel circuits: Dual fuel concept can be adopted. Fuel Acan be injected in the intake duct (port injection) and Fuel B using adirect injection (in-cylinder). The proportion of these fuels can be usedto control ignition, heat release rate and exhaust emissions.
20.7.7 Power
In both spark ignition and compression ignition engines, power can be in-creased by introducing more fuel into the combustion chamber. These en-gines can withstand the increased power, because the heat release rate inthese engines is slow. However, in HCCI engines the entire mixture burnsnearly simultaneously. Increasing the fuel-air ratio will result in even higherpeak pressures and heat release rates. In addition, many of the viable controlstrategies for HCCI require thermal preheating of the charge. This will re-duce the density and hence, the mass of the fuel-air charge in the combustionchamber, reducing power. These factors make it a challenging task to improvethe power output in HCCI engines.
One way to increase power is to use fuels with different autoignition prop-erties. This will lower the heat release rate and peak pressures and will makeit possible to increase the equivalence ratio. Another way is to thermallystratify the charge. This will make different points in the compressed chargeto have different temperatures and will burn at different times lowering theheat release rate. By this approach it is possible to increase power. A thirdway is to run the engine in HCCI mode only at part load conditions and runit as a diesel or spark ignition engine at full or near full load conditions. Sincemore research is required to successfully implement thermal stratification inthe compressed charge, the last approach is being pursued more vigorously.
20.7.8 Emissions
Because HCCI operates on lean mixtures, the peak temperatures are lowerin comparison to spark ignition and compression ignition engines. The lowerpeak temperatures reduces the formation of NOx . This leads to lower NOxemissions than those found in conventional engines. However, the low peaktemperatures also lead to incomplete burning of fuel, especially near the wallsof the combustion chamber. This leads to high carbon monoxide and hydro-carbon emissions. An oxidizing catalyst is required in removing the regulatedspecies because the exhaust is still oxygen rich.
20.7.9 Difference in Engine Knock
In conventional spark-ignition engine knock or pinging occurs when some ofthe unburnt gases ahead of the flame spontaneously auto ignite. This causesa shock wave to traverse from the end gas region and an expansion wave to

674 IC Engines
traverse into the end gas region. The two waves reflect off the boundaries of thecombustion chamber and interact to produce high amplitude standing waves.In HCCI engines, ignition occurs due to piston compression. In this engine,the entire reactant mixture ignites (nearly) simultaneously. Since there arevery little or no pressure differences between the different regions of the gas,there is no shock wave propagation and hence, no knocking. However, at highloads (i.e. high fuel-air ratios), knocking is a remote possibility even in HCCI.
20.7.10 Advantages and Disadvantages of HCCI Engine
Advantages:
(i) Thirty per cent fuel savings, while meeting current emissions norms.
(ii) They are fuel-lean and operate at a Diesel-like compression ratios.
(iii) It can achieve higher efficiencies than conventional SI engines.
(iv) Homogeneous mixing leads to cleaner combustion and lower emissions.
(v) Peak temperatures are lower than the typical SI engines,
(vi) NOx and soot emissions are almost negligible.
(vii) It can operate on gasoline and diesel; and almost all alternative fuels.
(viii) HCCI efficiency is comparatively more due to low throttling losses.
Disadvantages
(i) High in-cylinder peak pressures may cause damage to the engine.
(ii) Fast heat release and pressure rise rates contribute to engine wear.
(iii) The auto-ignition is difficult to control, unlike the SI and CI engine
(iv) HCCI engines have a small power range.
(v) There are constraints at low loads due to lean flammability limits.
(vi) Problem at high loads due to in-cylinder pressure restrictions.
(vii) CO emissions are higher compared conventional engines.
(viii) Pre-catalyst hydrocarbon emissions are higher.
20.8 LEAN BURN ENGINE
Conventional engines using gasoline and diesel operating at full throttle em-ploy an air-fuel mixture close to stoichiometric. For most of the hydrocarbonfuels the stoichiometric air-fuel ratio can be taken as 15:1. Beyond this ra-tio, the engine begins to misfire resulting in an unsteady combustion cycle.In the past, the air-fuel ratio was kept close to this figure, to prevent anycombustion problems. Since the end of World War II, however, governments

Nonconventional Engines 675
all over the world have started pushing the automotive industry to reduceautomobile exhaust emissions. This, along with the realisation of diminish-ing oil reserves, have forced automotive designers to look at higher air-fuelratio engines, in order to increase fuel efficiency. These higher than averageair-fuel ratio engines are called lean burn engines and are being developedsince the 1960s. The way that these engines work smoothly, despite burningair-fuel mixtures of about 18:1 has led to many new design features in leanburn technology. For smooth combustion, the amount of fuel and air enteringthe combustion chamber must be closely monitored. Even small variationswhen the mixture is so lean, can greatly affect the performance of the engine.The introduction of fuel injection combats this problem. Spraying of fuel di-rectly before the inlet valve closure provides more or less an uniform mixturedistribution. Modern lean burn engines use a lean mixture even greater than20:1. Because of this, considerably less fuel compared to the stoichiometricratio will be used.
In a lean burn engine the fuel must be injected into the combustion cham-ber where there is intensive swirling air motion. This concentrates the fuelaround the spark plug which keeps the ignition duration constant for everycycle, preventing misfiring. In order to concentrate the fuel around the sparkplug, the combustion chamber should be designed in such a way that the airmotion swirls up towards the spark plug. At the same time, the spark plugshould be placed in the centre of the combustion chamber. This makes thespark plug closer to the fuel. It prevents the fuel particles farthest from thespark plug self-igniting. This means that the compression ratio can be in-creased and higher fuel efficiency can be achieved. The above improvementsenable the air-fuel ratio to be increased thereby decreasing the specific fuelconsumption of the engine by 5–25%.
Lean burn engines also have the advantage of decreasing emissions. Theamount of carbon monoxide emitted is less, as there is plenty of oxygen avail-able to produce carbon dioxide. Unburned hydrocarbon emission is reducedby up to 80% in lean burn engines. This is because unburned hydrocarbonsare released when combustion is not complete. Fuel injection prevents fueldroplets settling in the intake passage, by spraying them directly just behindthe inlet valves. This helps to produce a homogeneous air-fuel mixture.
To put it in a nutshell, lean burn engines (both gasoline and diesel) enjoyhigher fuel economy and cleaner emissions than conventionally tuned engines.They use less fuel and emit fewer unburned hydrocarbons and greenhousegases while producing equivalent power of a like-sized ”normal” combustionengine. They achieve lean burn status by employing higher compression ratioswhich develop higher cylinder pressure, significant air intake swirl and preciselean metered direct fuel injection.
The negative side of lean burn technology is increased exhaust NOx emis-sions (due to higher heat and cylinder pressure) and a somewhat narrowerspeed-power-band (due to slower burn rates of lean mixtures). Vehicles thatuse these types of engines require more complex catalytic converters and areoften limited to light duty uses (passenger vehicles).

676 IC Engines
20.8.1 Basics of Lean Burn Technology
A lean burn mode is a way to reduce throttling losses. An engine in a typicalvehicle is designed for providing the power required for acceleration. At thesame time must operate well below that point in normal steady-speed oper-ation. Ordinarily, in SI engine, the power is reduced by partially closing athrottle. However, the extra work done in pumping air through the throttlereduces efficiency. If the air-fuel ratio is increased, then lower power can beachieved even at full throttle. At the same time the efficiency during normaldriving can be higher. The engines designed for lean burning can employhigher compression ratios and thus provide better performance, efficient fueluse and low exhaust hydrocarbon emissions than those found in conventionalgasoline engines. Ultra lean mixtures with very high air-fuel ratios can beachieved by direct injection engines only. Lean burn engines do not work wellwith modern three-way catalytic converter because they require a pollutantbalance at the exhaust port so that they can carry out both oxidation andreduction reactions. Most modern engines run at or near the stoichiometricpoint. Alternatively, ultra-lean ratios can reduce NOx emissions. Therefore,the main drawback of lean burning is that a complex catalytic converter sys-tem is required to reduce NOx emissions.
20.8.2 Lean Burn Combustion
Gaseous fuels are well suited for lean burn operation. Any air-fuel reactionrequires an energy source to initiate combustion. In lean burn engines, thecombustion process is enhanced by pre-mixing the air and fuel upstream ofthe turbocharger before introduction into the cylinder. This creates a morehomogenous mixture in the combustion chamber and reduces the occurrenceof ”knocking” or detonation. To prevent either knocking or misfiring, the com-bustion process must be controlled within a narrow operating window. Chargeair temperatures and volume, together with air to fuel ratio, are constantlymonitored. Engine controller regulates the fuel flow and air-gas mixture andignition timing. Modern lean burn engines are designed to operate at a leanair-gas ratio of λ = 1.7. (Traditional stoichiometric natural gas engines havean air-gas ratio of λ = 1.0). A richer mixture (< 0.7) can potentially produceknocking and higher NOx emissions; leaner mixture greater than λ = 1.7may not combust reliably and cause misfiring, which raises HC emissions.Fully instrumented electronic engines with sensors and microprocessors in thenew lean burn engines are critical for maintaining combustion within theseboundaries.
The design of the lean burn engine incorporates a simple open combustionchamber housed in the piston crown. The shape of the piston crown introducesturbulence to the incoming air-fuel mixture that promotes more completecombustion by thoroughly exposing it to the advancing flame front. Thecylinder head is flat and the spark plug is centrally located. The air andgaseous fuel are correctly mixed under the control of the engine managementsystem.
Nonconventional Engines 677
20.8.3 Combustion Monitoring
In-cylinder sensors provide important data on the timing and quality of thecombustion process, which is specifically important when engines are operatedwith lean mixtures or heavy EGR. Presently available techniques used to eval-uate these data are direct pressure measurement with a pressure sensor andindirect monitoring through spark-plug ionization current. The spark-plugvoltage ion method detects the ion density within the combustion chamberby measuring the decay time of voltage after a spark. Using this technique,the limits of lean burn or EGR can easily be detected. Another much cheapermethod is to derive a combustion quality value from piston acceleration. Toobtain this the crankshaft speed fluctuations are measured using the crankspeed sensor.
20.8.4 Lean Burn Emissions
Potential application for lean burn technology is for gas engine and electricgeneration. One of the benefits of this technology is significantly reducedemissions in the exhaust. New lean burn gas engine generators have NOxemissions as low as 0.85 g/bp-h, and produce low amounts of HC, CO andparticulate matter. This allows the generator sets to meet the most stringentair quality regulations without after-treatment devices in the exhaust stream.For lower emissions, lean burn gas engine generator sets are frequently coupledwith integrated after-treatment options such as Selective Catalytic Reduction(SCR) and Oxidation Catalysts, resulting in NOx levels at or below 0.15g/bp-h. With these after-treatment options, the gas engine generators havebeen shown to meet the most stringent prime power emissions regulationsanywhere in the world
20.8.5 Fuel Flexibility
Another advantage of the lean burn technology with full-fledged electronicengine controls is the ability to operate on gas with a wide range of quality.A measurement called the Methane Number (MN) is used to determine fuelgas suitability as an engine fuel. Most natural gas has an MN from 70 to 97,and pipeline quality gas typically has MN of about 75. Resource recovery gasfrom landfills or sewage treatment facilities is typically of lower quality, butis often suitable for use in lean burn engines. Modern lean burn gas enginegenerators operate on gas with an MN of 50 or greater, providing excellentfuel flexibility. However, gas with a MN below 70 may require derating of thegenerator output.
Lean burn gas engine generator sets are setting a new standard for fuelefficiency, high power output for their size, and for low emissions. In regionswith abundance of natural gas, these generator sets are providing highly re-liable electric power for utility peaking, distributed generation, prime powerand for combined heat and power systems.

678 IC Engines
20.8.6 Toyota Lean Burn Engine
A lean burn engine control system developed by Toyota is shown in Fig.20.10.It uses in-cylinder sensors to monitor combustion pressure (5), and a sequen-tial individual injection system (1) to control fuelling on a cylinder-by-cylinderbasis. The A/F ratio for the engine is monitored through a wide-range oxy-gen sensor installed in the exhaust down-pipe before the three-way catalyticconverter (7).
1. EFI (individual injection system)
2. Electronically controlled valve
3. Swirl control valve (SCV)
4. Newly designed helical port
5. Combustion pressure sensor
6. Electronically controlled EGR valve
7. Oxygen sensor
8. Three-way catalytic converter
9. Engine speed sensor
10. Electonic control unit
1 6
7
2
3 4
8
5
910
Fig. 20.10 Lean burn engine control system used on a Toyota engine
A novel feature incorporated is the use of a swirl control valve (3) mountedin the intake system. The intake tract for each cylinder is divided into twopassages. One passage is smooth, which allows maximum gas flow for goodcylinder charging. The other passage is fitted with a corkscrew-shaped flange(not shown) with helical port (4), which introduces swirl into the incoming air.The engine electronic control unit (10) can switch air flow in one of the twotracts by actuating the SCV. The engine operates in a lean burn mode whenit is running under light to medium load conditions. The ECU directs theSCV to open-up the curved inlet passage to have well mixed incoming vapourdue to a high level of turbulence through swirl. During combustion, theECU monitors the pressure sensor signals for any signs of slow or incompleteburning and then appropriately modifies the A/F ratio using electronicallycontrolled valve (2) or ignition timing on a cylinder-by-cylinder basis. Becauseof the continuous monitoring of the exhaust gas oxygen concentration, thesefacilities permit the engine to produce high efficiency at A/F ratios upto 25:1.Further, the engine speed is monitored by the speed sensor (9). There is alsoan EGR valve (6) to reduce NOx emissions. A three-way catalytic converter(8) is fitted in the exhaust pipe to reduce harmful emissions. When the engineruns under high load conditions, specifically during overtaking or hill climbing,the ECU switches to stoichiometric operation for maximum power. To achievethis the ECU directs the SCV to open the smooth intake passage and usesthe oxygen sensor signal to maintain an A/F ratio of 14.7:1.
20.8.7 Honda Lean Burn Systems
The newer Honda stratified charged lean burn engines operate on air-fuelratios as high as 22:1 using precise control of fuel injection with strong air-
Nonconventional Engines 679
fuel swirl created in the combustion chamber. It employs new linear air-fuelsensor and lean burn NOx catalyst to further reduce the NOx.
The amount of fuel drawn into the engine is much lower than a typicalgasoline engine, which operates at 14.7:1. This lean burn ability by the ne-cessity of the limits of physics, and the chemistry of combustion as it appliesto a current gasoline engine must be limited to light load and lower RPMconditions. A ”top” speed cut-off point is required since leaner gasoline fuelmixtures burn slower. For power to be produced combustion must be ”com-plete” by the time the exhaust valve opens. This stratified-charge approach tolean burn combustion means that the air-fuel ratio is not equal throughout thecylinder. Instead, precise control over fuel injection and intake flow dynam-ics allows a denser concentration of fuel closer to the spark plug tip (richer),which is required for successful ignition and flame spread for complete com-bustion. The remainder of the cylinder’s intake charge is progressively leanerwith an overall average air-fuel ratio falling into the lean burn category of upto 22:1.
The older Honda engines that used lean burn (not all did) accomplishedthis by having a parallel fuel and intake system that fed a pre-chamber withthe ”ideal” ratio for initial combustion. This is called Compound VortexControlled Combustion (CVCC), which allowed lower emissions without theneed for a catalytic converter. It had a normal inlet and exhaust valves plusa small auxiliary inlet valve which provided a relatively rich mixture near thespark plug. The remaining leaner air-fuel mixture is drawn into the cylinderthrough the main inlet valve. The volume near the spark plug is containedby a small perforated metal plate. Upon ignition, flame fronts emerge fromperforations and ignite the remainder of the air-fuel charge. This combinationof rich mixture near the spark plug and the lean mixture in the cylinder allowsstable running. Complete combustion could be achieved with reduction in COand HC emissions. It may be noted that these were carbureted engines andthe relative imprecise nature of such system limited their applications.
20.8.8 Mitsubishi Ultra Lean Burn Combustion Engines
The ultra lean burn control system developed by Mitsubishi is shown inFig.20.11. It uses a catalytic converter to reduce NOx emissions. As airpollution has become more important to automotive companies and govern-ments, the lean burn combustion technology is being developed and improved.Mitsubishi have created a lean burn engine that will operate a 40:1 air-fuelratio mixture.
It may be noted that the ”ultra lean burn mode” is not used for startingor accelerating the vehicle. For these tasks the engine uses a ”superior out-put mode” which uses a leaner mixture. The reason is that the lean burntechnique is not used during start up, is because more HC and CO emissionsare created at this stage. This means that there is no advantage in using thelean burn to lower the performance engine at the start up stage. The ”ultralean burn” engine does, however contain new technologies. Instead of makingthe air-fuel mixture spiral around the combustion chamber, [Fig.20.12(a)], theMitsubishi injector forces the mixture to tumble clockwise [Fig.20.12(b)] into

680 IC Engines
Air intake
Airflow meter
Linear soleniod (On/Off control)
Linear soleniod (Duty control)
High pressue fuel pump assembly
Low voltage regulator assembly
High voltage regulator assemblyLean NOx catalytic converter
Feed pump Fuel tank
Step motor type EGR valve
High pressure swirl injector
Idle speed control valve
Fig. 20.11 Mitsubishi ultra lean burn engine
(a) Swirl flow (b) Tumble flow
Cylinder
Air
Cylinder
Fig. 20.12 Diagrams of swirl and tumble flows
the chamber, using upright and straight intake ports. This system breaks upas the piston compresses, forming eddies that push the fuel even closer to thespark plug. A new injector system has also been introduced which providesa more reliable source of ignition for lean burn engines. The stratified chargesystem atomises the fuel across the spark plug. The particles of fuel pro-duced are much smaller than conventional processes, less than nine micronsas opposed to 27 microns in a high pressure direct injection system.
20.9 STIRLING ENGINE
A Stirling engine is a heat engine operating on cyclic compression and expan-sion of air or any other gas. It was once called hot air engine. This engine wasinvented much before the invention of gasoline and diesel engines. In Stirlingengine the working fluid is kept at different temperature levels. Because ofthis, there is a net conversion of heat energy to mechanical work.
The Stirling engine is vastly different from the internal-combustion engineused in automobiles. Invented by Robert Stirling in 1816, the Stirling enginehas the potential to be much more efficient than a gasoline or diesel engine.

Nonconventional Engines 681
But, as of now, Stirling engines are used only in some very specialized applica-tions, like in submarines or auxiliary power generators for yachts, where quietoperation is important. Although there hasn’t been a successful mass-marketapplication for the Stirling engine, many people are still working on it.
Like the steam engine, the Stirling engine is traditionally classified as anexternal combustion engine. All heat transfers to and from the working fluidtake place through the engine wall. This contrasts with an internal combustionengine where heat addition is by combustion of a fuel within the engine. It isalso different from steam engine (or more generally a Rankine cycle engine)where the working fluid is both in its liquid and gaseous phases.
In Stirling engine a fixed quantity of gaseous fluid such as air is used asthe working medium. In a typical heat engine, the general cycle consists ofcompressing the cool gas, heating the gas, expanding the hot gas, and finallycooling the gas before repeating the cycle. The efficiency of the process isrestricted by the efficiency of the Carnot cycle, which depends on the temper-ature difference between the hot and cold reservoir. Stirling engine uses theStirling cycle, which is different from the cycles used in internal combustionengines. For example:
• The gasses used inside a Stirling engine never leave the engine. Thereare no exhaust valves that vent high-pressure gasses, as in a gasoline ordiesel engine. There is no combustion taking place inside the engine.Because of this, Stirling engines are very quiet.
• The Stirling cycle uses an external heat source, which could be anythingfrom gasoline to solar energy to the heat produced by decaying plants.
The Stirling engine is noted for its high efficiency (compared to steamengines), quiet operation, and the ease with which it can use almost any heatsource. This compatibility with alternative and renewable energy sourceshas become increasingly significant as the price of conventional fuels rises.Further, there is great concern regarding oil crisis and climate change. Thisengine is evincing a lot of interest as the core component of combined heat andpower (CHP) units, in which it is more efficient and safer than a comparablesteam engine.
20.9.1 Principle of Operation
The engine is designed in such a way that the working gas is generally com-pressed in the colder portion of the engine and expanded in the hotter portion,resulting in a net conversion of heat into work. An internal Regenerative heatexchanger increases the Stirling engine’s thermal efficiency compared to sim-pler hot air engines which are lacking this feature.
The key principle of a Stirling engine is that there is always a fixed amountof a gas sealed inside the engine. The Stirling cycle involves a series of eventsthat change the pressure of the gas inside the engine, causing it to do work.There are several properties of gasses that are critical to the operation ofStirling engines. Important principles to keep in mind are:
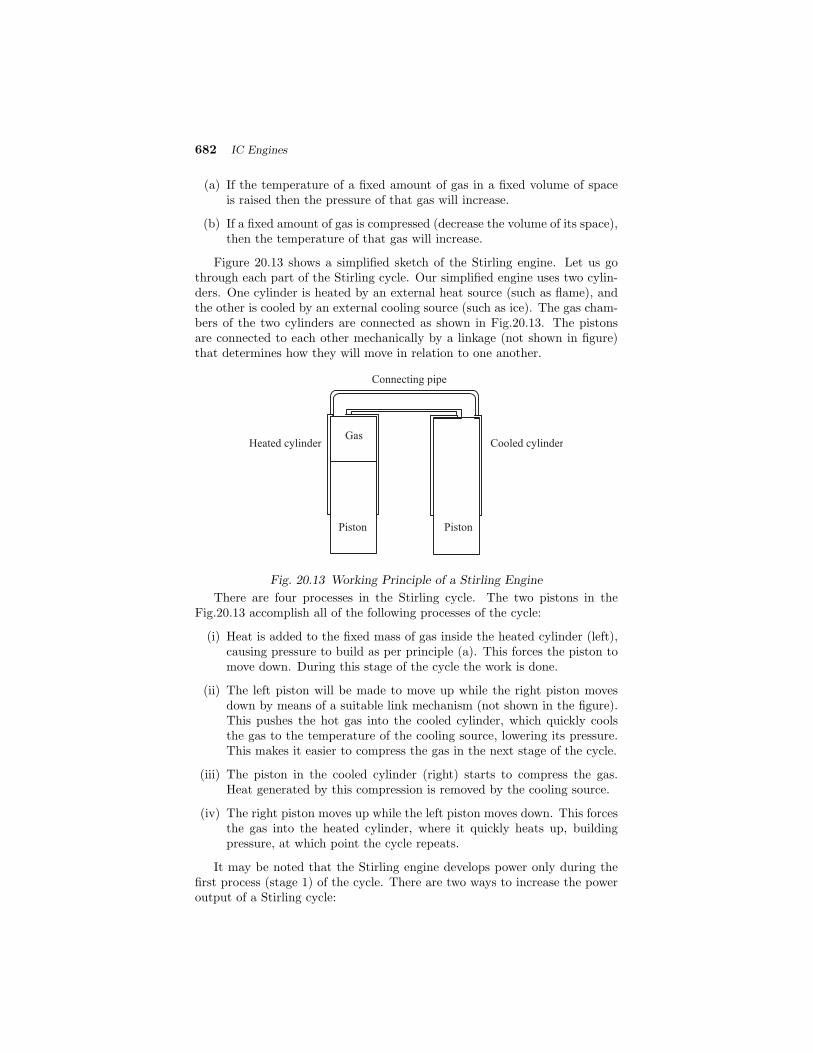
682 IC Engines
(a) If the temperature of a fixed amount of gas in a fixed volume of spaceis raised then the pressure of that gas will increase.
(b) If a fixed amount of gas is compressed (decrease the volume of its space),then the temperature of that gas will increase.
Figure 20.13 shows a simplified sketch of the Stirling engine. Let us gothrough each part of the Stirling cycle. Our simplified engine uses two cylin-ders. One cylinder is heated by an external heat source (such as flame), andthe other is cooled by an external cooling source (such as ice). The gas cham-bers of the two cylinders are connected as shown in Fig.20.13. The pistonsare connected to each other mechanically by a linkage (not shown in figure)that determines how they will move in relation to one another.
Cooled cylinderHeated cylinderGas
Connecting pipe
Piston Piston
Fig. 20.13 Working Principle of a Stirling Engine
There are four processes in the Stirling cycle. The two pistons in theFig.20.13 accomplish all of the following processes of the cycle:
(i) Heat is added to the fixed mass of gas inside the heated cylinder (left),causing pressure to build as per principle (a). This forces the piston tomove down. During this stage of the cycle the work is done.
(ii) The left piston will be made to move up while the right piston movesdown by means of a suitable link mechanism (not shown in the figure).This pushes the hot gas into the cooled cylinder, which quickly coolsthe gas to the temperature of the cooling source, lowering its pressure.This makes it easier to compress the gas in the next stage of the cycle.
(iii) The piston in the cooled cylinder (right) starts to compress the gas.Heat generated by this compression is removed by the cooling source.
(iv) The right piston moves up while the left piston moves down. This forcesthe gas into the heated cylinder, where it quickly heats up, buildingpressure, at which point the cycle repeats.
It may be noted that the Stirling engine develops power only during thefirst process (stage 1) of the cycle. There are two ways to increase the poweroutput of a Stirling cycle:

Nonconventional Engines 683
(i) Increase power output in stage one: In stage one of the cycle, the pres-sure of the heated gas which pushes the piston down performs work.Increasing the pressure during this stage of the cycle will increase thepower output of the engine. One way of increasing the pressure is byincreasing the temperature of the gas. When we take a look at a two-piston Stirling engine, we will see how a device called a regenerator canimprove the power output of the engine by temporarily storing heat.
(ii) Decrease power usage in stage three: In stage three of the cycle, thepistons perform work on the gas, using some of the power producedin stage one. Lowering the pressure during this stage of the cycle candecrease the power required during this stage of the cycle. In effect thiswill increase the power output of the engine. One way to decrease thepressure is to cool the gas to a lower temperature.
To summarize, the Stirling engine uses the temperature difference betweenits hot end and cold end to establish a cycle of a fixed mass of gas, heated andexpanded, and cooled and compressed, thus converting thermal energy intomechanical energy. Greater the temperature difference between the hot andcold sources, greater will be the thermal efficiency. The maximum theoreticalefficiency is equivalent to the Carnot cycle, however the efficiency of a realengine is less than this value due to friction and other losses.
20.9.2 Types of Stirling Engines
There are two major types of Stirling engines. They are distinguished by theway they move the air between the hot and cold sides of the cylinder:
(i) The two piston alpha type: In this design, pistons are in two independentcylinders, and gas is driven between the hot and cold spaces.
(ii) The displacement type: This design is known as beta and gamma types.This type uses an insulated mechanical displacer to push the workinggas between the hot and cold sides of the cylinder. The displacer islarge enough to insulate the hot and cold sides of the cylinder thermallyand to displace a large quantity of gas. There must be enough gapbetween the displacer and the cylinder wall to allow gas to flow aroundthe displacer easily.
20.9.3 Alpha Stirling Engine
An alpha Stirling contains two power pistons in separate cylinders, one hotand one cold. The hot cylinder is situated inside the high temperature heatexchanger and the cold cylinder is situated inside the low temperature heatexchanger. This type of engine has a high power-to-volume ratio. However,it has technical problems due to high temperature of the hot piston and thedurability of its seals. In practice, this piston usually carries a large insulat-ing head to move the seals away from the hot zone at the expense of someadditional dead space.

684 IC Engines
20.9.4 Working Principle of Alpha Stirling Engine
Figures 20.14 shows the working of an alpha Stirling engine. But they donot show internal heat exchangers in the compression and expansion spaces,which are needed to produce power. A regenerator would be placed in thepipe connecting the two cylinders. The crankshaft has also been omitted.There are four steps involved
(a) (b)
(c) (d)
Cooled cylinder
Cooling fins
Linkage mechanism Heated cylinder
Connecting passage with regenerator
Fig. 20.14 Stirling engine
(i) Refer Fig.20.14(a). Most of the working gas is in contact with the hotcylinder walls. During the first part of the cycle, the gas is heated andpressure builds up. This forces the piston to move to the left doing work.The gas in the hot cylinder is at its maximum volume. The cooled pistonstays approximately stationary because it is at the point of revolutionwhere it changes direction.
(ii) In the second stage [refer Fig.20.14(b)] both the pistons move. Theheated piston moves to the right and the cooled piston moves up. Thismakes most of the hot gas to move into the cooled piston cylinderthrough the connecting passage with regenerator.
The regenerator is a device that can temporarily store heat. It may be aheated mesh of wire through which the hot gas pass through. The largesurface area of the wire must quickly absorb most of the heat. Thisleaves less heat to be removed by the cooling fins. Because of coolingthe pressure drops.

Nonconventional Engines 685
(iii) In this stage all the gas is in the cooled cylinder and cooling continues[refer Fig.20.14(c)]. The cooled piston, powered by flywheel momentumstarts to compress the gas. The heat generated by the compression isremoved by the cooling fins. The gas in the cooled cylinder reaches themaximum volume.
(iv) In the last phase of the cycle, both pistons move – the cooled pistonmoves down while the heated piston moves to the left. This forces thegas across the regenerator (where it picks up the heat that was storedthere during the previous cycle) and into the heated cylinder. At thispoint, the cycle begins again.
20.9.5 Beta Stirling Engine
A beta Stirling has a single power piston arranged within the same cylinderon the same shaft as a displacer piston. The displacer piston is a loose fit anddoes not extract any power from the expanding gas but only serves to shuttlethe working gas from the hot heat exchanger to the cold heat exchanger.When the working gas is pushed to the hot end of the cylinder it expands andpushes the power piston. When it is pushed to the cold end of the cylinder itcontracts and the momentum of the machine, usually enhanced by a flywheel,pushes the power piston the other way to compress the gas. Unlike the alphatype, the beta type avoids the technical problems of hot moving seals.
20.9.6 Working Principle of Beta Stirling Engine
The following Fig.20.15(a–d) gives the details of beta Stirling engine, but donot show the internal heat exchangers or a regenerator, which will be placedin the gas path around the displacer. The working principle is as follows:
(a) (b) (c) (d)
Link mechanismFly wheel Power piston
Displacer piston Heat exchanger (Hot)
Heat exchanger (Cold)
Hot gas
Cold gas
Fig. 20.15 Working Principle of a Beta Type Stirling Engine
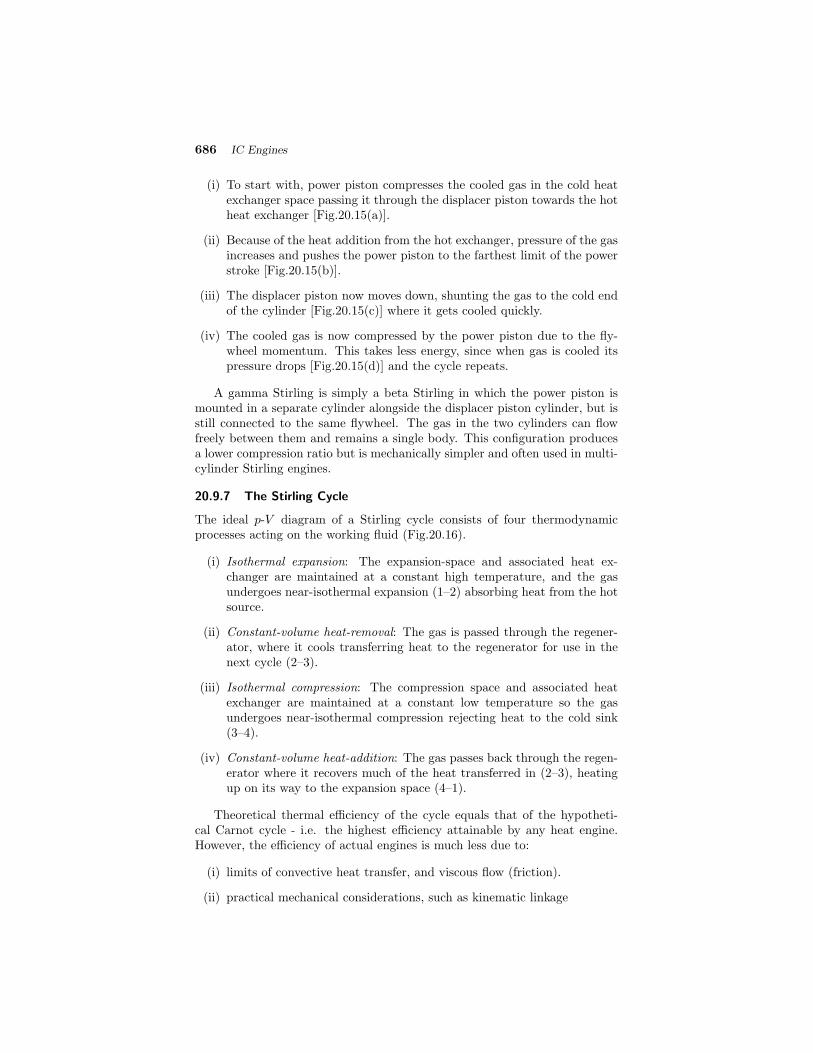
686 IC Engines
(i) To start with, power piston compresses the cooled gas in the cold heatexchanger space passing it through the displacer piston towards the hotheat exchanger [Fig.20.15(a)].
(ii) Because of the heat addition from the hot exchanger, pressure of the gasincreases and pushes the power piston to the farthest limit of the powerstroke [Fig.20.15(b)].
(iii) The displacer piston now moves down, shunting the gas to the cold endof the cylinder [Fig.20.15(c)] where it gets cooled quickly.
(iv) The cooled gas is now compressed by the power piston due to the fly-wheel momentum. This takes less energy, since when gas is cooled itspressure drops [Fig.20.15(d)] and the cycle repeats.
A gamma Stirling is simply a beta Stirling in which the power piston ismounted in a separate cylinder alongside the displacer piston cylinder, but isstill connected to the same flywheel. The gas in the two cylinders can flowfreely between them and remains a single body. This configuration producesa lower compression ratio but is mechanically simpler and often used in multi-cylinder Stirling engines.
20.9.7 The Stirling Cycle
The ideal p-V diagram of a Stirling cycle consists of four thermodynamicprocesses acting on the working fluid (Fig.20.16).
(i) Isothermal expansion: The expansion-space and associated heat ex-changer are maintained at a constant high temperature, and the gasundergoes near-isothermal expansion (1–2) absorbing heat from the hotsource.
(ii) Constant-volume heat-removal: The gas is passed through the regener-ator, where it cools transferring heat to the regenerator for use in thenext cycle (2–3).
(iii) Isothermal compression: The compression space and associated heatexchanger are maintained at a constant low temperature so the gasundergoes near-isothermal compression rejecting heat to the cold sink(3–4).
(iv) Constant-volume heat-addition: The gas passes back through the regen-erator where it recovers much of the heat transferred in (2–3), heatingup on its way to the expansion space (4–1).
Theoretical thermal efficiency of the cycle equals that of the hypotheti-cal Carnot cycle - i.e. the highest efficiency attainable by any heat engine.However, the efficiency of actual engines is much less due to:
(i) limits of convective heat transfer, and viscous flow (friction).
(ii) practical mechanical considerations, such as kinematic linkage
Nonconventional Engines 687
1
2
3
4
p
V
Fig. 20.16 p-V diagram of the ideal the Stirling cycle
(iii) limitations imposed by available non-ideal materials such as non-idealproperties of the working gas, thermal conductivity, tensile strength,creep, rupture strength, etc.
(iv) ideal isothermal expansion and compression is difficult to achieve
20.9.8 Displacer Type Stirling Engine
In this design there is one piston and one displacer. A temperature differenceis required between the top and bottom of the large cylinder in order to run theengine. In the case of the low-temperature difference (LTD) stirling engine,even the temperature difference between your hand and the surrounding airis enough to run the engine. The power piston in the displacer type stirlingengine, is tightly sealed and is controlled to move up and down as the gasinside expands. The displacer on the other hand is very loosely fitted so thatair can move freely between the hot and cold sections of the engine as thepiston moves up and down. The displacer moves up and down to control theheating and cooling of the gas in the engine.
20.9.9 Pressurization
In most high power Stirling engines, both the minimum pressure and meanpressure of the working fluid are above atmospheric. The initial engine pres-surization can be realized by any one of the following methods.
(i) a pump,
(ii) filling the engine from a compressed gas tank,
(iii) just by sealing the engine when the mean temperature is lower than themean operating temperature.
All of the above methods increase the mass of working fluid in the thermo-dynamic cycle. The heat exchangers must be sized appropriately to supplythe necessary heat transfer rates. If the heat exchangers are well designedthey can supply the heat flux needed for convective heat transfer. The en-gine will in a first approximation produce power in proportion to the meanpressure. In practice, the maximum pressure is limited to the safe pressure of

688 IC Engines
the pressure vessel. A difficulty of pressurization is that while it improves thepower, the heat input to the pressurized gas also increases proportionately tothe increased power. The higher heat transfer rate is difficult with pressur-ization. The increased pressure demands increased thicknesses of the walls ofthe engine. This, in turn, will increase the resistance to heat transfer.
20.9.10 Lubricants and Friction
A modern Stirling engine and generator can produce 55 kW electrical output,for combined heat and power (CHP) applications. At high temperatures andpressures, the oxygen in air-pressurized crankcases, or in the working gasof hot air engines, can combine with the engine’s lubricating oil and explode.Lubricants can also clog heat exchangers, especially the regenerator. For thesereasons, designers prefer non-lubricated, low-coefficient of friction materials(such as rulon or graphite), with low normal forces on the moving parts,especially for sliding seals. Some designs avoid sliding surfaces altogether byusing diaphragms for sealed pistons. These are some of the factors that allowStirling engines to have lower maintenance requirements and longer life thaninternal-combustion engines.
20.9.11 Comparison with Internal Combustion Engines
In contrast to internal combustion engines, Stirling engines have the potentialto use renewable heat sources more easily, to be quieter, and to be morereliable with lower maintenance. They are preferred for applications that valuethese unique advantages, particularly if the cost per unit energy generated ismore important than the capital cost per unit power. On this basis, Stirlingengines are cost competitive up to about 100 kW.
Compared to an internal combustion engine of the same power rating,Stirling engines currently have a higher capital cost and are usually largerand heavier. However, they are more efficient than most internal combustionengines. Their lower maintenance requirements make the overall energy costcomparable. The thermal efficiency is also comparable (for small engines),ranging from 15% to 30%. For applications such as micro-CHP, a Stirlingengine is often preferable to an internal combustion engine. However, Stirlingengines are generally not price-competitive as an automobile engine, due tohigh cost per unit power, low power density and high material costs.
20.9.12 Advantages and Disadvantages of Stirling Engine
Advantages:
(i) Stirling engines can run directly on any available heat source, not justone produced by combustion, so they can run on heat from biological,geothermal, nuclear sources, solar or waste heat from industrial pro-cesses.
(ii) A continuous combustion process can be used to supply heat, so thoseemissions associated with the intermittent combustion processes of areciprocating internal combustion engine can be reduced.

Nonconventional Engines 689
(iii) Most types of Stirling engines have the bearing and seals on the coolside of the engine. They require only less lubricant and last longer thanother reciprocating engine types.
(iv) The engine mechanisms are in some ways simpler than other recipro-cating engine types. No valves are needed, and the burner system canbe relatively simple. Crude Stirling engines can be made using commonhousehold materials.
(v) A Stirling engine uses a single-phase working fluid which maintains aninternal pressure close to the design pressure. Thus for a properly de-signed system the risk of explosion is low. In comparison, a steam engineuses a two-phase gas/liquid working fluid, so a faulty release valve cancause an explosion.
(vi) In some cases, low operating pressure allows the use of lightweight cylin-ders.
(vii) They can be built to run quietly and without an air supply, for air-independent propulsion use in submarines.
(viii) They start easily (albeit slowly, after warmup) and run more efficientlyin cold weather, whereas the internal combustion which starts quicklyin warm weather, but not in cold weather.
(ix) A Stirling engine used for pumping water can be configured so that thewater cools the compression space. This is most effective when pumpingcold water.
(x) They are extremely flexible.
(xi) They can be used as CHP in the winter and as a cooler in summer.
(xii) Waste heat is easily harvested (compared to waste heat from an internalcombustion engine) making Stirling engines useful for dual-output heatand power systems.
Disadvantages: Size and cost issues
(i) Stirling engine designs require heat exchangers for heat input and forheat output. They must be able to withstand the pressure of the work-ing fluid. Note that the pressure is proportional to the engine poweroutput. In addition, the expansion-side heat exchanger is often at veryhigh temperature, so the materials must resist the corrosive effects of theheat source, and have low creep (deformation). Typically these materialrequirements substantially increase the cost of the engine. The materi-als and assembly costs for a high temperature heat exchanger typicallyaccounts for 40% of the total engine cost.
(ii) All thermodynamic cycles require large temperature differentials for ef-ficient operation. In an external combustion engine, the heater temper-ature always equals or exceeds the expansion temperature. This means

690 IC Engines
that the metallurgical requirements for the heater material are very de-manding, which is similar to a gas turbine. But is in contrast to gasolineor diesel engine, where the expansion temperature can far exceed themetallurgical limit of the engine materials. This is because the inputheat source is not conducted through the engine, so engine materialsoperate closer to the average temperature of the working gas.
(iii) Dissipation of waste heat is especially complicated because the coolanttemperature is kept as low as possible to maximize thermal efficiency.This increases the size of the radiators, which can make packaging diffi-cult. Along with materials cost, this has been one of the factors limitingthe adoption of Stirling engines as automotive prime movers. For otherapplications such as ship propulsion and stationary micro-generationsystems using combined heat and power (CHP) high power density isnot required.
Power and torque issues
(i) Stirling engines, especially those that run on small temperature differ-entials, are quite large for the amount of power that they produce (i.e.,they have low specific power). This is primarily due to the heat transfercoefficient of gaseous convection which limits the heat flux that can beattained in a typical cold heat exchanger to about 500 W/(m2K), andin a hot heat exchanger to about 500-5000 W/(m2K).
Compared with internal combustion engines, this makes it more chal-lenging for the engine designer to transfer heat into and out of the work-ing gas. Because of the thermal efficiency, the required heat transferincreases with decrease in temperature difference. The heat exchangersurface (and cost) per kW output increases with 1/ΔT 2. Therefore, thespecific cost of very low temperature difference engines is very high.
(ii) A Stirling engine cannot start instantly. It literally needs to ”warm up”.This is true for all external combustion engines, but the warm up timemay be longer for Stirling engines than for others such as steam engines.Stirling engines are best option for constant speed engines.
(iii) Power output of a Stirling tends to be constant and to adjust it cansometimes require careful design and additional mechanisms. Typi-cally, changes in output are achieved by varying the displacement ofthe engine (often through use of a swashplate crankshaft arrangement),or by changing the quantity of working fluid, or by altering the pis-ton/displacer phase angle, or in some cases simply by altering the engineload.
Gas choice issues
(i) The used gas should have a low heat capacity, so that a given amount oftransferred heat leads to a large increase in pressure. Considering thisissue, helium would be the best gas because of its very low heat capacity.

Nonconventional Engines 691
Air is a viable working fluid, but the oxygen in a highly pressurized airengine can cause fatal accidents caused by lubricating oil explosions.
(ii) Hydrogen’s low viscosity and high thermal conductivity make it themost powerful working gas, primarily because the engine can run fasterthan with other gases. However, due to hydrogen absorption, and giventhe high diffusion rate associated with this low molecular weight gas,particularly at high temperatures, H2 will leak through the solid metal ofthe heater. Diffusion through carbon steel is too high to be practical, butmay be acceptably low for metals such as aluminum, or even stainlesssteel. Certain ceramics also greatly reduce diffusion.
Hermetic pressure vessel seals are necessary to maintain pressure insidethe engine without replacement of lost gas. For high temperature differ-ential (HTD) engines, auxiliary systems may need to be added to main-tain high pressure working fluid. These systems can be a gas storagebottle or a gas generator. Hydrogen can also cause the embrittlementof metals. Hydrogen is a flammable gas, which is a safety concern ifreleased from the engine.
(iii) Most technically advanced Stirling engines, like those developed forUnited States government labs, use helium as the working gas. It isbecause it functions close to the efficiency and power density of hy-drogen with fewer of the material containment issues. Helium is inert,which removes all risk of flammability, both real and perceived. Heliumis relatively expensive, and must be supplied as bottled gas.
(iv) Some engines use air or nitrogen as the working fluid. These gaseshave much lower power density (which increases engine costs). However,they are more convenient to use and they minimize the problems of gascontainment and supply (which decreases costs). The use of compressedair in contact with flammable materials or substances such as lubricatingoil, introduces an explosion hazard, because compressed air contains ahigh partial pressure of oxygen. However, oxygen can be removed fromair through an oxidation reaction or bottled nitrogen can be used, whichis nearly inert and very safe.
20.9.13 Applications
Applications of the Stirling engine range from heating and cooling to under-water power systems. A Stirling engine can function in reverse as a heat pumpfor heating or cooling. Other uses include: combined heat and power, solarpower generation, Stirling cryocoolers, heat pump, marine engines, and lowtemperature difference engines
20.9.14 Future of Stirling Engines
There are a couple of key characteristics that make Stirling engines impracticalfor use in many applications, including in most cars and trucks. Because theheat source is external, it takes a little while for the engine to respond tochanges in the amount of heat being applied to the cylinder – it takes time for
692 IC Engines
the heat to be conducted through the cylinder walls and into the gas insidethe engine. This means that:
(i) The engine requires some time to warm up before it can produce usefulpower.
(ii) The engine cannot change its power output quickly.
These shortcomings all but guarantee that it won’t replace the internal-combustion engine in cars. However, a Stirling engine powered hybrid carmight be feasible
20.10 STRATIFIED CHARGE ENGINE
Conventionally there are two types of internal combustion engines, viz., gaso-line and diesel which are well established. However, each one of them has itsown limitations. Gasoline engines have very good full load power characteris-tics, but have rather poor part load efficiency. Diesel engines have good partload characteristics but have low smoke-limited power and higher weight-to-power ratio. The use of higher compression ratios poses additional problemsof maintenance and higher losses in diesel operation. For an automotive en-gine both part load efficiency and full load power are very important becauseduring the operating life of the engines most of the time they work under partload conditions. The maximum power is controlled by the speed, accelerationand other characteristics of the vehicle.
Therefore, there is a need to develop an engine which combines the advan-tages of both gasoline and diesel engines. At the same time it should avoid,as far as possible, their disadvantages. Stratified charge engine is an attemptin this direction. It is an engine which is midway between the homogeneouscharge spark-ignition engine, and the heterogeneous charge compression igni-tion engine.
Charge stratification means providing different fuel-air mixture strengthsat various places in the combustion chamber – a relatively rich mixture atand in the vicinity of the spark plug and a leaner mixture in the rest of thecombustion chamber. That is, the whole fuel-air mixture is distributed inlayers or strata of different mixture strengths across the combustion chamberwhile the overall mixture is rather lean.
Thus, the stratified charge engine is usually defined as a spark ignitioninternal combustion engine in which the mixture in the zone of spark plug isvery much richer than that in the rest of the combustion chamber, i.e. onewhich burns leaner overall fuel-air mixtures.
20.10.1 Advantages of Burning Leaner Overall Fuel-Air Mixtures
(i) Higher thermodynamic efficiency: The spark ignition engine output iscontrolled by means of a throttle. This varies the quantity of the mixtureinducted during the suction stroke while keeping the mixture strengthnearly constant. The diesel engine which is unthrottled, the outputis controlled by varying the amount of fuel injected into a constant
Nonconventional Engines 693
amount of air every cycle. Thus the gasoline engine operates within avery narrow range of fuel air ratios whereas the diesel engine operatesover a much wider range of lean mixture strength.
The thermodynamic efficiency of the Otto cycle is given by
η = 1− 1
rγ−1(20.1)
The value of γ for air is 1.4 and for chemically correct carburetted fuelair mixture is around 1.3. A leaner mixture will have higher values of γwhich will be between 1.3 and 1.4. It is evident that the eqn.20.1 wouldresult in slightly higher thermodynamic efficiency for lean mixture, refercurve 1 in Fig.20.17. It is to be noted that the range of mixture strengthis quite narrow for spark-ignition engine (between 0.8 and 1.2). However,for diesel engine the range (between 0.1 and 0.8) is quite wide (curve2). This is one of the reasons for better part load efficiency of the dieselengine. The unthrottled diesel engine has an excess air of about 20 to40 per cent at full load which increases progressively at part load asreduced amounts of fuel are injected. This is in contrast to the almostconstant mixture strength operation of the gasoline engine.
Figure 20.17 shows the variation of theoretical efficiencies of Otto (1),diesel ((2) and stratified charge engine (3) for different mixture strengthsunder ideal conditions. It can be seen that the part load efficiency ofthe stratified charged engine is much better than the gasoline engine ofcomparable compression ratio, and almost approaches the efficiency ofthe diesel engine. However, it is to be noted that the diesel engine has amuch higher compression ratio and hence, has an advantage due to thisfactor.
Thus, with the use of leaner mixtures and a slightly higher compressionratio in a SI engine, a performance level approaching that of the CIengine can be achieved. This helps to overcome many disadvantagesof diesel operation. For example a mandatory high compression ratiofor better starting and good combustion over a wide range of mixturestrength, and poor air utilization are the main concern of the dieselengines. Use of high compression ratio brings with it a host of problems.It involves greater maintenance, higher mechanical losses and higherweight to power ratio. The poor air utilization results in poor fueleconomy and smoky operation at higher loads.
As already mentioned, another important point to note in Fig.20.17 isthe limited range of mixture strength (0.8 to 1.2) which can be usedin a gasoline engine. For complete combustion, propagation of flamethroughout the mixture is a must. In other words only those mixturesthrough which flame propagation is possible can be used. In a single-cylinder engine, a mixture strength below a relative fuel-air ratio of0.8 will result in misfiring. For a multi-cylinder engine this becomes0.85 due to imperfect distribution among the cylinders. The maximumoutput mixture strength is about 1.05 to 1.1 (1.2 for multi-cylinder

694 IC Engines
0 0.2 0.4 0.6 0.8 1.0 1.2 1.4
Relative mixture strength (φ)
0
0.2
0.4
0.6
0.8
Th
erm
al e
ffic
ien
cy
Sto
ich
iom
etri
c
Limit of spark ignition
Smoke limit
Diesel
Compression ratio : 16:1
Gasoline
Compression ratio : 9:1
Smoke limit
Stratified charge
Compression ratio : 12:1
Lean Rich
1
2
3
Fig. 20.17 Theoretical efficiencies of Otto, Diesel and stratified charge enginecycles for various mixture strength
engine). Minimum specific fuel consumption is obtained at a relativefuel-air ratio of 0.85 to 0.9 below which flame propagation becomesslow and cycle to cycle fluctuations occur. This limits the use of leanermixtures and hence limits the gain in thermodynamic efficiency in SIengine. In the stratified charge engine a relative fuel-air ratio as low as0.2 (corresponding to idling conditions) can be used.
Another disadvantage of the nearly constant mixture strength operationof the gasoline engine is that it results in almost constant peak cycletemperature over the full load range. This means that the losses dueto heat transfer, dissociation at high temperature, and variable specificheats would be much higher at part loads. This shortcoming of thegasoline engine can be avoided by using charge stratification.
(ii) Reduced air pollution: The use of overall lean mixture in stratified chargeengine results in reduced amount of oxides of nitrogen (NOx) and car-bon monoxide. The hydrocarbons are also low. In SI engine, higherhydrocarbons in exhaust are due to flame quenching at the combustionchamber walls. If charge stratification is used, this quenching effect isdrastically reduced. It is because, almost pure air will be present nearthe cold combustion chamber walls at part loads. There are three dis-tinct advantages of using charge stratification:
(a) no throttling losses,
(b) less prone for knock due to reduced residence time under high pres-sure and temperature conditions, and
(c) multi-fuel capability.

Nonconventional Engines 695
20.10.2 Methods of Charge Stratification
The stratified charge engines can be classified into two main categories, ac-cording to the method of formation of the heterogeneous mixture in the com-bustion chamber.
(i) Those using fuel injection and positive ignition (including swirl stratifiedcharge engines).
(ii) Those using carburetion alone.
20.10.3 Stratification by Fuel Injection and Positive Ignition
The first attempt to obtain charge stratification was made by Ricardo around1922. The details of which are shown in Fig.20.18. A relatively rich mixturewas formed at the vicinity of the spark plug by an auxiliary spray while an-other spray of fuel in the combustion chamber formed a leaner mixture. Thisarrangement could give combustion over a relatively wide range of mixturestrengths with overall very lean operation giving efficiencies as high as 35percent. However, the range was limited at higher speed. At loads higherthan about 50 per cent of the full load the engine did not work satisfactorily,presumably due to too rich a mixture near the spark plug.
InletExhaust
Relatively rich mixture Auxiliary spray
Relatively rich mixture Auxiliary spray
Fig. 20.18 Ricardo’s first charge stratification approach
Prechamber stratified charge engine: Later Ricardo used a small precham-ber (Fig.20.19) fitted with injector and the spark plug.
In this arrangement a rich mixture is formed near the spark plug by fuelsupply from the injector. A carburettor supplies lean mixture to the maincombustion chamber. The auxiliary charge burns in prechamber and comesout through its throat into the main chamber and burns the lean mixturepresent there. Thus a leaner overall mixture can be burned.
This approach involves many problems of engine operations such as
(i) getting good performance at the full load operation.
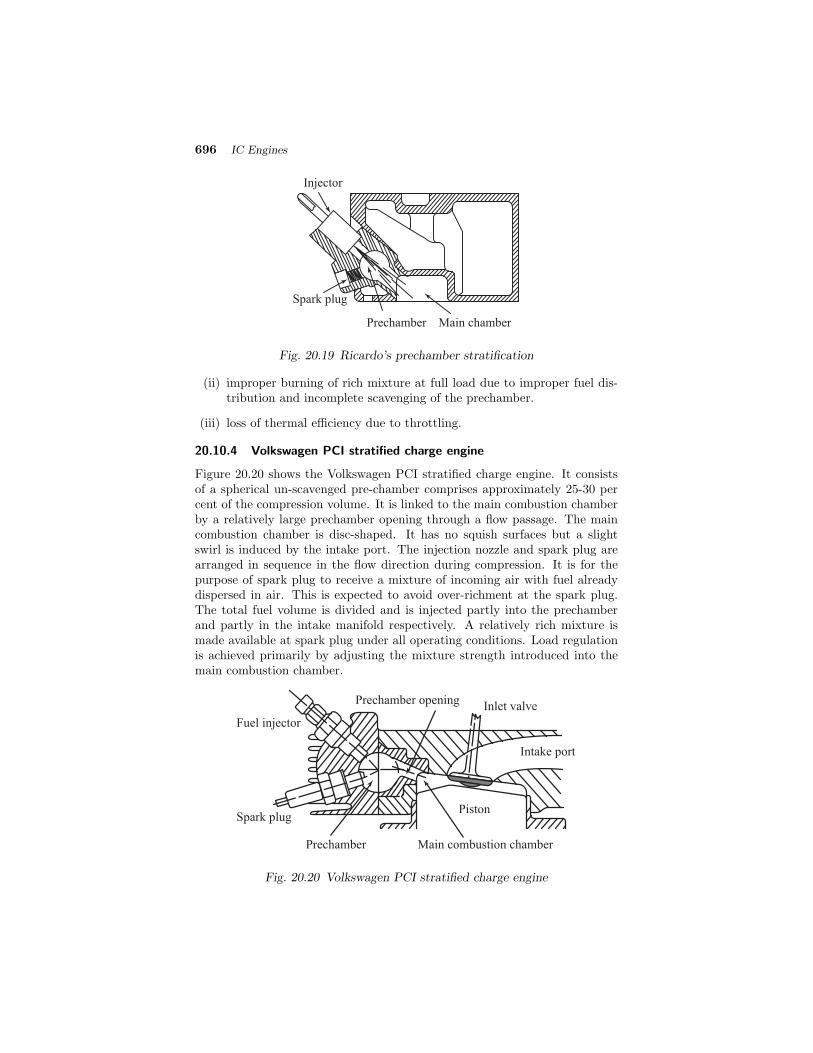
696 IC Engines
Prechamber Main chamber
Spark plug
Injector
Fig. 20.19 Ricardo’s prechamber stratification
(ii) improper burning of rich mixture at full load due to improper fuel dis-tribution and incomplete scavenging of the prechamber.
(iii) loss of thermal efficiency due to throttling.
20.10.4 Volkswagen PCI stratified charge engine
Figure 20.20 shows the Volkswagen PCI stratified charge engine. It consistsof a spherical un-scavenged pre-chamber comprises approximately 25-30 percent of the compression volume. It is linked to the main combustion chamberby a relatively large prechamber opening through a flow passage. The maincombustion chamber is disc-shaped. It has no squish surfaces but a slightswirl is induced by the intake port. The injection nozzle and spark plug arearranged in sequence in the flow direction during compression. It is for thepurpose of spark plug to receive a mixture of incoming air with fuel alreadydispersed in air. This is expected to avoid over-richment at the spark plug.The total fuel volume is divided and is injected partly into the prechamberand partly in the intake manifold respectively. A relatively rich mixture ismade available at spark plug under all operating conditions. Load regulationis achieved primarily by adjusting the mixture strength introduced into themain combustion chamber.
Inlet valve
Intake port
Prechamber opening
Main combustion chamber
PistonSpark plug
Fuel injector
Prechamber
Fig. 20.20 Volkswagen PCI stratified charge engine

Nonconventional Engines 697
The main advantage of this system is that unlike other stratification pro-cesses, the fuel injection timing need not to be varied. This is a good sim-plification. The octane requirement is comparatively low, especially at higherspeeds. It can be easily operated on very lean mixtures (relative air-fuel ra-tios greater than 2) which is also advantageous from exhaust emission pointof view.
20.10.5 Broderson Method of Stratification
Part load and full load performance of gasoline engines are not the same.There are two possibilities to tackle the problems of part load and full loadperformance. One way is to use fuel injection alone. Control the mixturestrengths in auxiliary and main combustion chambers by means of injectiontimings. Another way is to use carburetion alone to obtain stratification withor without prechamber.
Figure 20.21 shows the Broderson method of charge stratification. It con-sists of an engine with a divided combustion chamber. The small or auxiliarychamber contains the injector, the intake valve and the spark plug. Entirefuel is injected into the auxiliary chamber.
Main chamber
Exhaust valveInjector
ThroatSpark plug
Auxiliary chamber
Intake valve
Piston
Fig. 20.21 Broderson method of stratification
At light loads the fuel can be injected after bdc, i.e. after the start ofcompression stroke. This is a situation in which the air is moving from mainchamber into the auxiliary chamber. Almost all the fuel injected into theauxiliary chamber will remain there and will form an ignitable mixture nearthe spark plug. The main chamber will contain only air or very lean mixture.Due to the blast of flame from the auxiliary chamber due to torch effect, thelean mixture in the main chamber is burnt. For rapid and complete burningof this lean mixture the main chamber must be designed to ensure properturbulence. This will enable mixing of the hot burning mixture coming outof the chamber with the mixture in the main chamber.
At full load the fuel is injected before bdc, i.e. during the suction stroke.It is intimately mixed with whole of the air resulting in a mixture of uniformstrength throughout the combustion space. The flame produced by the sparkplug will spread into both the chambers just like in the normal spark ignitionoperation.
The Broderson method possess the advantage of altogether avoiding thepumping losses due to throttling. In addition, a higher part load efficiency
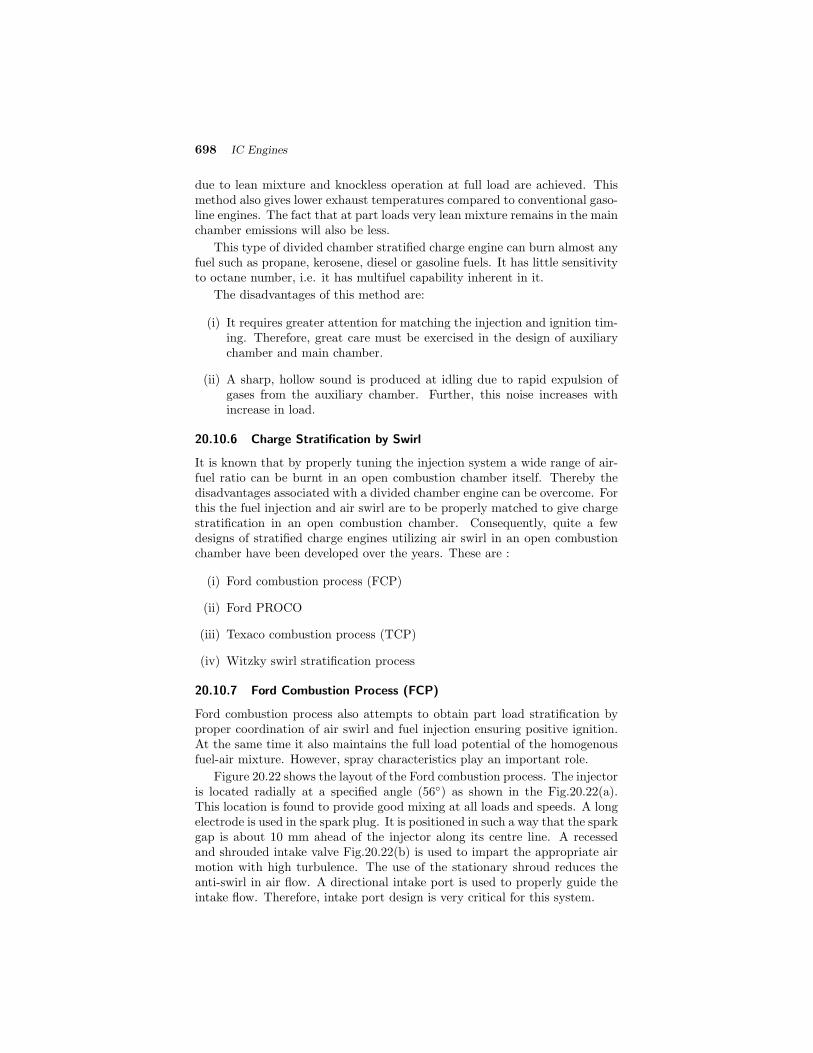
698 IC Engines
due to lean mixture and knockless operation at full load are achieved. Thismethod also gives lower exhaust temperatures compared to conventional gaso-line engines. The fact that at part loads very lean mixture remains in the mainchamber emissions will also be less.
This type of divided chamber stratified charge engine can burn almost anyfuel such as propane, kerosene, diesel or gasoline fuels. It has little sensitivityto octane number, i.e. it has multifuel capability inherent in it.
The disadvantages of this method are:
(i) It requires greater attention for matching the injection and ignition tim-ing. Therefore, great care must be exercised in the design of auxiliarychamber and main chamber.
(ii) A sharp, hollow sound is produced at idling due to rapid expulsion ofgases from the auxiliary chamber. Further, this noise increases withincrease in load.
20.10.6 Charge Stratification by Swirl
It is known that by properly tuning the injection system a wide range of air-fuel ratio can be burnt in an open combustion chamber itself. Thereby thedisadvantages associated with a divided chamber engine can be overcome. Forthis the fuel injection and air swirl are to be properly matched to give chargestratification in an open combustion chamber. Consequently, quite a fewdesigns of stratified charge engines utilizing air swirl in an open combustionchamber have been developed over the years. These are :
(i) Ford combustion process (FCP)
(ii) Ford PROCO
(iii) Texaco combustion process (TCP)
(iv) Witzky swirl stratification process
20.10.7 Ford Combustion Process (FCP)
Ford combustion process also attempts to obtain part load stratification byproper coordination of air swirl and fuel injection ensuring positive ignition.At the same time it also maintains the full load potential of the homogenousfuel-air mixture. However, spray characteristics play an important role.
Figure 20.22 shows the layout of the Ford combustion process. The injectoris located radially at a specified angle (56◦) as shown in the Fig.20.22(a).This location is found to provide good mixing at all loads and speeds. A longelectrode is used in the spark plug. It is positioned in such a way that the sparkgap is about 10 mm ahead of the injector along its centre line. A recessedand shrouded intake valve Fig.20.22(b) is used to impart the appropriate airmotion with high turbulence. The use of the stationary shroud reduces theanti-swirl in air flow. A directional intake port is used to properly guide theintake flow. Therefore, intake port design is very critical for this system.
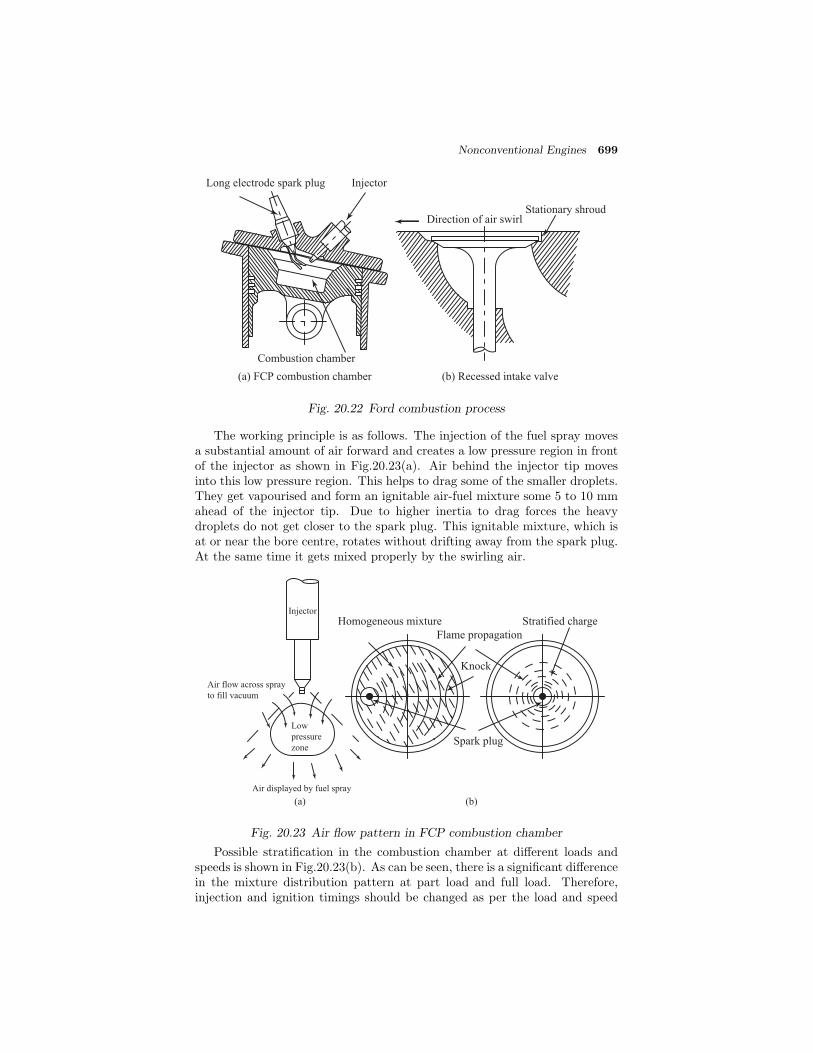
Nonconventional Engines 699
(a) FCP combustion chamber (b) Recessed intake valve
Direction of air swirlStationary shroud
Combustion chamber
Long electrode spark plug Injector
Fig. 20.22 Ford combustion process
The working principle is as follows. The injection of the fuel spray movesa substantial amount of air forward and creates a low pressure region in frontof the injector as shown in Fig.20.23(a). Air behind the injector tip movesinto this low pressure region. This helps to drag some of the smaller droplets.They get vapourised and form an ignitable air-fuel mixture some 5 to 10 mmahead of the injector tip. Due to higher inertia to drag forces the heavydroplets do not get closer to the spark plug. This ignitable mixture, which isat or near the bore centre, rotates without drifting away from the spark plug.At the same time it gets mixed properly by the swirling air.
Air flow across spray
to fill vacuum
Low
pressure
zone
Injector
Air displayed by fuel spray
Homogeneous mixture
Flame propagation
Knock
Stratified charge
Spark plug
(a) (b)
Fig. 20.23 Air flow pattern in FCP combustion chamber
Possible stratification in the combustion chamber at different loads andspeeds is shown in Fig.20.23(b). As can be seen, there is a significant differencein the mixture distribution pattern at part load and full load. Therefore,injection and ignition timings should be changed as per the load and speed

700 IC Engines
for proper and complete combustion. The injection timing is advanced withincrease in load for better air utilization. The spark timing is adjusted toachieve maximum cycle efficiency. This requires a spark advance mechanismas in normal gasoline engine. Though flame velocity increases with enginespeed it is not good enough to give appropriate heat release.
20.10.8 Ford PROCO
The Ford PROCO engine is the second generation of Ford combustion process(FCP). This was developed to give fuel economy and maximum power closeto a carburetted engine. PROCO process aims at minimising the exhaustemissions with maximum fuel economy. Unlike FCP, it uses air throttling forthis purpose.
Intake port design (Fig.20.24) is the most important in Ford PROCOengine. It is shaped to impart a swirl around the cylinder bore axis. Theswirl speed in the engine is about 4 to 5 times the crankshaft speed. Theswirling charge is compressed into a cup-shaped combustion chamber situatedconcentrically in the piston with about 70% squish area. The compressionratio is 11:1. Fuel is injected during the compression stroke. The injector islocated close to the centre of the cylinder bore. Injection provides a soft, low-penetrating, wide-angle conical spray. This results in a rich mixture at thecentre, surrounded by a lean mixture and excess air. The spark plug with itsgap located either near the bore centerline or just above the spray, ignites thecharge near tdc. Combustion is fast in rich mixture and then spreads into theleaner regions.
Fuel injector assembly
Spark plug
Spark gap
Combustion chamber
Piston
Fig. 20.24 Ford PROCO engine
20.10.9 Texaco Combustion Process (TCP)
Figure 20.25 shows the Texaco combustion process. In this process a highdegree of swirl is imparted to the incoming air by the suitable designs ofinlet manifold. The fuel is injected across the swirling air in the downstreamdirections. This enables the entire air to be impregnated by fuel. The ignitionsource, which may be a glow plug or a spark plug, is positioned directlydownstream and close to the injector. The spark plug is situated within theswirling air but is outside the spray envelope.
The fuel is injected towards the end of the compression stroke. The normalpractice is to inject about 30◦ before tdc or just after the initiation of the

Nonconventional Engines 701
spark. The first part of the injected fuel which mixes with air during itspassage to the spark plug forms a flame front.
Fuel injector
Spark plug
Combustion products
Flame front
Combustible mixture
Air swril
Fig. 20.25 Texaco combustion process engine
The rest of the injected fuel is now continuously fed into this alreadyestablished flame front after mixing with the swirling air. There must be agood coordination between air swirl and injection. Further, a positive ignitionis to be guaranteed for proper operation of TCP.
There are two important characteristics of this process.
(i) The residence time of the fuel-air mixture in the combustion zone isquite small. This results in almost knock-free operation. Further, it isinsensitive to the octane numbers of the fuel. In other words it givesthe engine the multifuel capability.
(ii) Very lean mixtures can be burned easily by terminating the fuel injectionbefore the complete utilization of the swirling air.
At part loads a small patch near the spark plug has an ignitable mixturewhile the rest of the chamber has very lean mixture. As the load increases thearea of this patch also increases. At full load it is just like the homogeneouslycharged gasoline engine.
The TCP gives good performance over the whole range of load and speed.A wide range of fuels ranging from premium gasoline to high cetane diesel fuelcan be used. In addition to giving better part load efficiency the starting andwarm-up characteristics of TCP are quite good. This is due to employment ofthe cup combustion chamber. The inherent knock resistance of TCP allows theuse of higher compression ratio or turbocharging. The lean overall mixturescan be used. The exhaust smoke is also very low.
The major difference between TCP and Ford PROCO system is the tim-ing of the fuel injection. In Texaco engine, combustion occurs near the endof the compression stroke when fuel is injected into the compressed air andimmediately ignited by the spark plug. In Ford engine, the fuel is injectedinto the cylinder over a longer period of time.

702 IC Engines
20.10.10 Witzky Swirl Stratification Process
The Witzky swirl stratification process is shown in Fig.20.26. This is basicallyan unthrottled spark ignition process with fuel injection. There is no carbu-retion. By the appropriate design of the intake port, high velocity swirl isimparted to the intake air during the suction stroke. The fuel is injected dur-ing the compression stroke against the swirl direction at some suitable angle.The swirling air, forces the fuel droplets to follow a spiral path by virtue ofdrag forces and directs them towards the centre of the combustion chamber.A spark plug is located at the carburettor for initiating the combustion. Thisproduces a good degree of stratification – a rich ignitable mixture near thespark plug over the full load range and leaner mixture away from the sparkplug. Close to the wall almost pure air is present. The thickness of this pureair layers decreases as the load is increased.
(a) Intake
stroke
(b) Compression
stroke (Injection)
(c) Compression
stroke (Ignition)
Air only
Flame propagation
(d) Expansion
stroke (TDC)
Stratified
fuel-air mixture
Exhaust valve Intake valve Spark plugAir swirl
Fig. 20.26 Witzky swirl stratification process
20.10.11 Honda CVCC Engine
Even though stratification are attempted by injection, there are attempts toachieve stratification by carburetion alone. In this compound vortex con-trolled combustion, Honda CVCC is a bold attempt.
The Honda Compound Vortex Controlled Combustion (CVCC) engine ob-tains charge stratification using a three barrel carburetor. The engine has twochambers. Prechamber is filled with a rich mixture. The prechamber is con-nected to the main chamber which is filled with lean mixture. Chambers arefilled using carburettors. Figure 20.27 shows the Honda CVCC engine. Thebasic structure of the engine is same as that of a conventional four-strokegasoline engine. However, it has an auxiliary combustion chamber aroundthe spark plug. There is also a small additional intake valve which is fit-ted to each cylinder. Two separate intake valves are used on each cylinder.One valve is located in the prechamber and the other in the main chamber.The smallest venturi of the three barrel carburettor supplies a rich mixtureto each prechamber. The other two venturies supply a very lean mixtureto the main chamber. A conventional ignition system and spark plugs (one
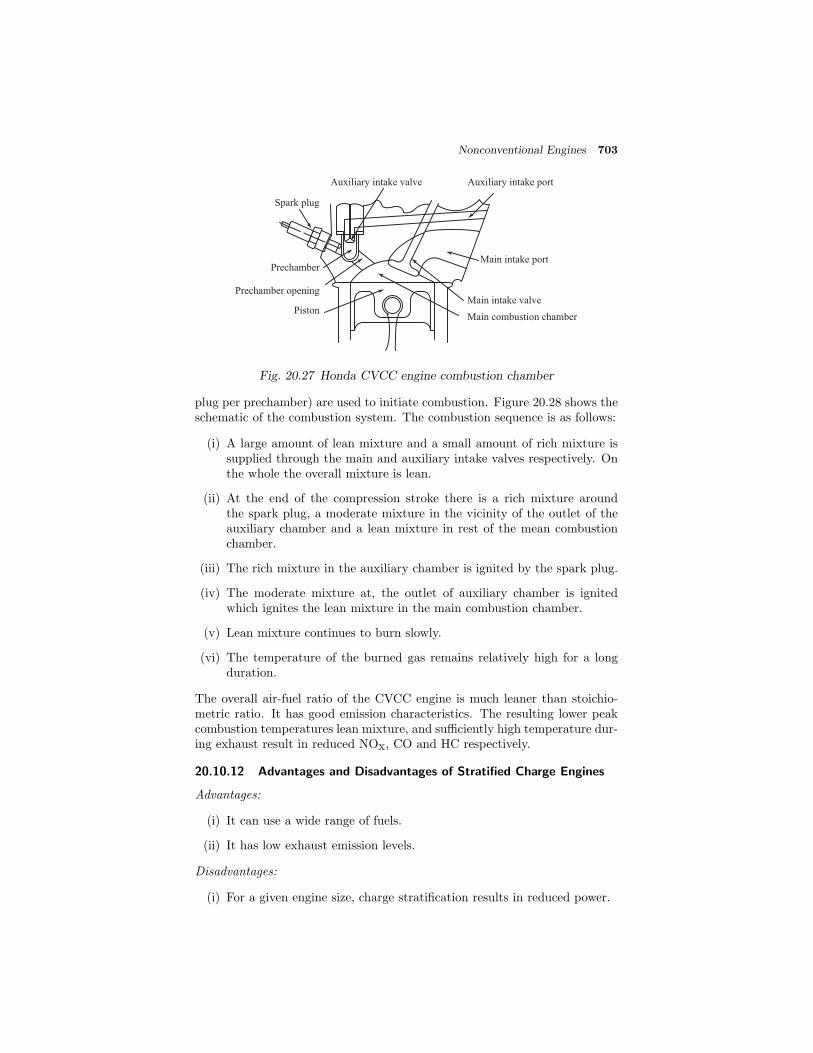
Nonconventional Engines 703
Auxiliary intake port
Main intake port
Main intake valve
Main combustion chamber
Auxiliary intake valve
Spark plug
Prechamber opening
Prechamber
Piston
Fig. 20.27 Honda CVCC engine combustion chamber
plug per prechamber) are used to initiate combustion. Figure 20.28 shows theschematic of the combustion system. The combustion sequence is as follows:
(i) A large amount of lean mixture and a small amount of rich mixture issupplied through the main and auxiliary intake valves respectively. Onthe whole the overall mixture is lean.
(ii) At the end of the compression stroke there is a rich mixture aroundthe spark plug, a moderate mixture in the vicinity of the outlet of theauxiliary chamber and a lean mixture in rest of the mean combustionchamber.
(iii) The rich mixture in the auxiliary chamber is ignited by the spark plug.
(iv) The moderate mixture at, the outlet of auxiliary chamber is ignitedwhich ignites the lean mixture in the main combustion chamber.
(v) Lean mixture continues to burn slowly.
(vi) The temperature of the burned gas remains relatively high for a longduration.
The overall air-fuel ratio of the CVCC engine is much leaner than stoichio-metric ratio. It has good emission characteristics. The resulting lower peakcombustion temperatures lean mixture, and sufficiently high temperature dur-ing exhaust result in reduced NOx, CO and HC respectively.
20.10.12 Advantages and Disadvantages of Stratified Charge Engines
Advantages:
(i) It can use a wide range of fuels.
(ii) It has low exhaust emission levels.
Disadvantages:
(i) For a given engine size, charge stratification results in reduced power.

704 IC Engines
Spark plug
Rich mixture
(a) Intake stroke
Lean
mixture
(c) Ignition
Intake valve for
precombustion chamber
(b) Compression stroke
(d) Power stroke (e) Bottom dead centre
Exhaust gas
(f) Exhaust stroke
Fig. 20.28 Combustion sequence of Honda CVCC engine
(ii) Compared to conventional engines, its weight is higher for the compa-rable power and its manufacturing cost is also higher. Its reliability anddurability are yet to be well established.
20.11 VARIABLE COMPRESSION RATIO ENGINE
There is a need for developing high specific power output engine from the pointof view of specific fuel consumption and emission. Further, the engine musthave high reliability and longer life. The maximum power output depends onthe utilization of full air capacity of the engine i.e. when maximum amountof fuel can be burnt effectively.
All the methods of increasing power output of an engine have their ownproblems. For example, increasing engine speed imposes dynamic loads andincreased wear. This reduces reliability and life. Further, increasing the speedincreases the pumping losses which may become unacceptable especially underpart load operation.

Nonconventional Engines 705
Use of turbochargers results in very high cycle peak pressures and sub-jects the engine to higher thermal loads. Further, the turbocharger cannotmaintain good isentropic efficiencies over a wide range of pressure ratios andairflows. Difficulties do arise in matching the turbocharger and the engineat higher specific outputs. At lower speeds torque becomes quite low forcertain applications such as for automotive use. Adding a positive displace-ment supercharger to overcome this difficulty creates more problems than thesolution.
One method of solving the high peak pressure problem, when the specificoutput is increased, is to reduce the compression ratio at full load. At thesame time keeping the compression ratio sufficiently high for good starting andpart load operation is a must. Thus, it becomes clear that a fixed compressionratio engine cannot meet these requirements of high specific output. Hence,there is a need for the development of a variable compression ratio (VCR)engine.
In the VCR engine a high compression ratio is employed for good stabilityat low load operation. A lower compression ratio is used at full load to allowthe turbocharger to boost the intake pressures without increasing the peakcycle pressure. At starting, the turbocharger output is almost zero, so ahigh compression ratio is needed. As the load increases the engine exhausttemperature increases. More energy becomes available for the turbocharger toboost the pressure. At full load the turbocharger boost capacity is quite high.Therefore, to utilize it efficiently without increasing the peak cycle pressure,lowering of the compression ratio is necessary. It should be noted that largerclearance volume at lower compression ratio would result in increased airintake for the same peak compression pressure and would give higher output.
VCR principle can be employed in both SI and CI engines. However, theconcept of variable compression ratio is more appropriate for turbochargeddiesel engines because of the following reasons:
(i) It is beneficial only at part load and the part load efficiency of the dieselengine is higher than that of the gasoline engine.
(ii) Diesel engine has better multifuel capability.
20.11.1 Cortina Variable Compression Engine
American inventor Paul Cortina is the latest entry into variable compressionengine development. The Cortina engine is the only variable compressionconcept that slides the entire reciprocating assembly toward and away fromthe cylinder head. The advantage of this approach is that there is no compli-cation to the workings of the reciprocating assembly itself, nor is there anycomplication outside the engine. The way this is accomplished is by slidingthe reciprocating assembly on a splined shaft that is positioned perpendicularto a typical engine’s output shaft. In other words the output shaft is inline orparallel with the sweep of the pistons such that the cylinders can be arrangedradially around it. This can be accomplished by two ways.
Model 1 : It uses a conventional crankshaft mounted in an internal sub-housing with bevel gears to shift the rotational force 90 degrees. See Fig.20.29(a).
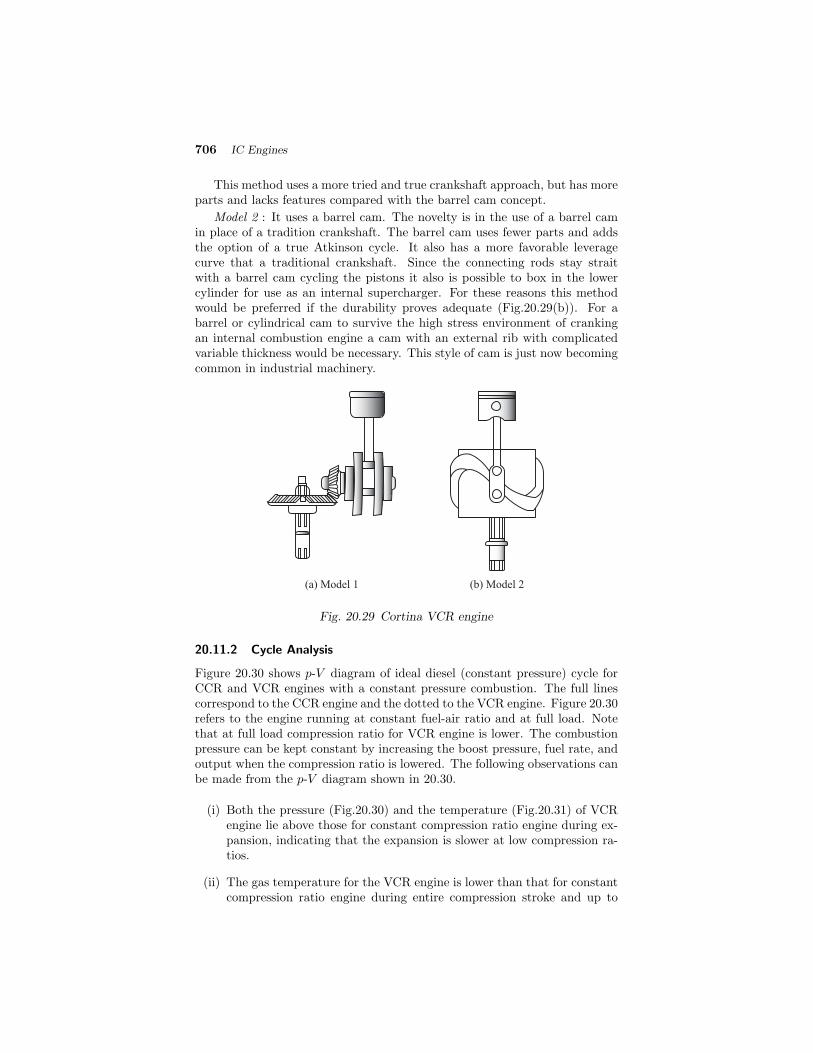
706 IC Engines
This method uses a more tried and true crankshaft approach, but has moreparts and lacks features compared with the barrel cam concept.
Model 2 : It uses a barrel cam. The novelty is in the use of a barrel camin place of a tradition crankshaft. The barrel cam uses fewer parts and addsthe option of a true Atkinson cycle. It also has a more favorable leveragecurve that a traditional crankshaft. Since the connecting rods stay straitwith a barrel cam cycling the pistons it also is possible to box in the lowercylinder for use as an internal supercharger. For these reasons this methodwould be preferred if the durability proves adequate (Fig.20.29(b)). For abarrel or cylindrical cam to survive the high stress environment of crankingan internal combustion engine a cam with an external rib with complicatedvariable thickness would be necessary. This style of cam is just now becomingcommon in industrial machinery.
(a) Model 1 (b) Model 2
Fig. 20.29 Cortina VCR engine
20.11.2 Cycle Analysis
Figure 20.30 shows p-V diagram of ideal diesel (constant pressure) cycle forCCR and VCR engines with a constant pressure combustion. The full linescorrespond to the CCR engine and the dotted to the VCR engine. Figure 20.30refers to the engine running at constant fuel-air ratio and at full load. Notethat at full load compression ratio for VCR engine is lower. The combustionpressure can be kept constant by increasing the boost pressure, fuel rate, andoutput when the compression ratio is lowered. The following observations canbe made from the p-V diagram shown in 20.30.
(i) Both the pressure (Fig.20.30) and the temperature (Fig.20.31) of VCRengine lie above those for constant compression ratio engine during ex-pansion, indicating that the expansion is slower at low compression ra-tios.
(ii) The gas temperature for the VCR engine is lower than that for constantcompression ratio engine during entire compression stroke and up to
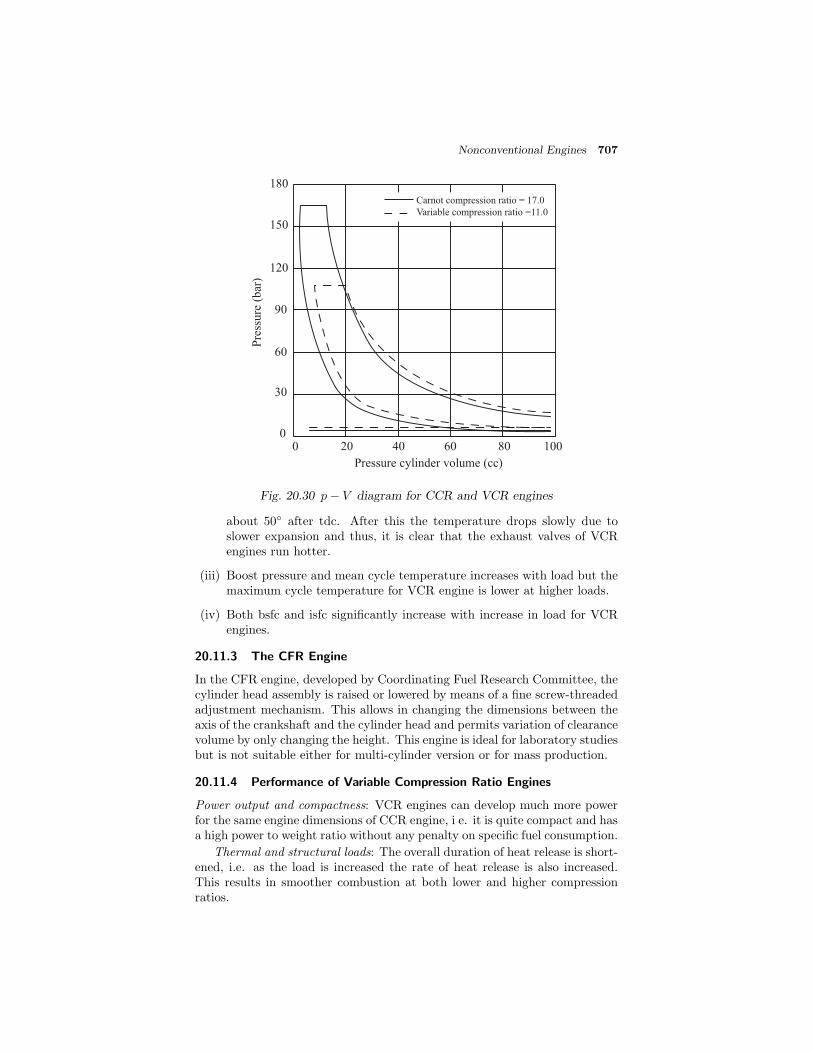
Nonconventional Engines 707
0 20 40 60 80 1000
30
60
90
120
150
180
Pre
ssu
re (
bar
)
Pressure cylinder volume (cc)
Carnot compression ratio = 17.0
Variable compression ratio =11.0
Fig. 20.30 p− V diagram for CCR and VCR engines
about 50◦ after tdc. After this the temperature drops slowly due toslower expansion and thus, it is clear that the exhaust valves of VCRengines run hotter.
(iii) Boost pressure and mean cycle temperature increases with load but themaximum cycle temperature for VCR engine is lower at higher loads.
(iv) Both bsfc and isfc significantly increase with increase in load for VCRengines.
20.11.3 The CFR Engine
In the CFR engine, developed by Coordinating Fuel Research Committee, thecylinder head assembly is raised or lowered by means of a fine screw-threadedadjustment mechanism. This allows in changing the dimensions between theaxis of the crankshaft and the cylinder head and permits variation of clearancevolume by only changing the height. This engine is ideal for laboratory studiesbut is not suitable either for multi-cylinder version or for mass production.
20.11.4 Performance of Variable Compression Ratio Engines
Power output and compactness: VCR engines can develop much more powerfor the same engine dimensions of CCR engine, i e. it is quite compact and hasa high power to weight ratio without any penalty on specific fuel consumption.
Thermal and structural loads: The overall duration of heat release is short-ened, i.e. as the load is increased the rate of heat release is also increased.This results in smoother combustion at both lower and higher compressionratios.
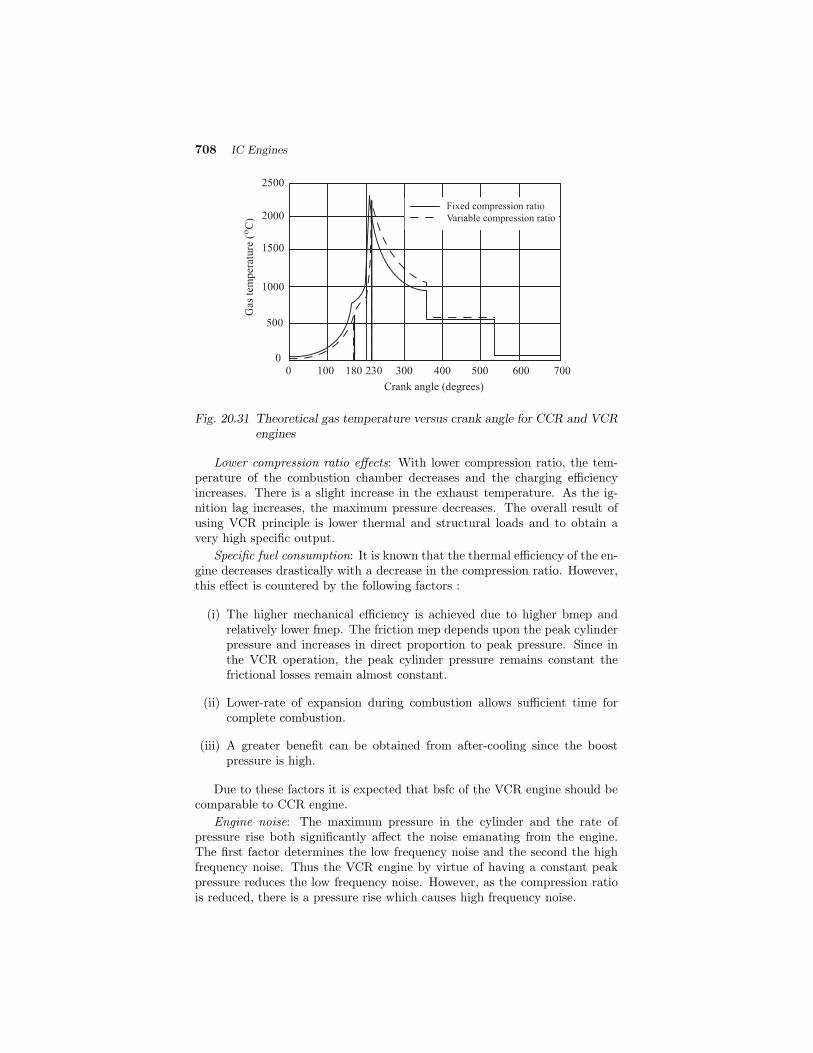
708 IC Engines
2500
0 100 400300 500 600 700
500
1000
1500
2000
0
Fixed compression ratio
Variable compression ratio
Crank angle (degrees)
Gas
tem
per
atu
re (
C
)o
180 230
Fig. 20.31 Theoretical gas temperature versus crank angle for CCR and VCRengines
Lower compression ratio effects: With lower compression ratio, the tem-perature of the combustion chamber decreases and the charging efficiencyincreases. There is a slight increase in the exhaust temperature. As the ig-nition lag increases, the maximum pressure decreases. The overall result ofusing VCR principle is lower thermal and structural loads and to obtain avery high specific output.
Specific fuel consumption: It is known that the thermal efficiency of the en-gine decreases drastically with a decrease in the compression ratio. However,this effect is countered by the following factors :
(i) The higher mechanical efficiency is achieved due to higher bmep andrelatively lower fmep. The friction mep depends upon the peak cylinderpressure and increases in direct proportion to peak pressure. Since inthe VCR operation, the peak cylinder pressure remains constant thefrictional losses remain almost constant.
(ii) Lower-rate of expansion during combustion allows sufficient time forcomplete combustion.
(iii) A greater benefit can be obtained from after-cooling since the boostpressure is high.
Due to these factors it is expected that bsfc of the VCR engine should becomparable to CCR engine.
Engine noise: The maximum pressure in the cylinder and the rate ofpressure rise both significantly affect the noise emanating from the engine.The first factor determines the low frequency noise and the second the highfrequency noise. Thus the VCR engine by virtue of having a constant peakpressure reduces the low frequency noise. However, as the compression ratiois reduced, there is a pressure rise which causes high frequency noise.

Nonconventional Engines 709
Cold starting and idling: Due to use of a higher compression ratio at lowloads the VCR engine has a good cold starting and idling performance evenat low ambient temperatures.
Multifuel capability: Due to higher compression ratio at starting and partload operation the VCR engine has good multifuel capability. The opposedpiston type engine is especially suited to multifuel operation.
20.11.5 Variable Compression Ratio Applications
In earlier days VCR engines were designed only in laboratories for the pur-poses of studying combustion processes. These designs usually have a secondadjustable piston set in the head opposing the working piston. Variable com-pression engines are highly desirable but technically not feasible for produc-tion vehicles. It is mainly due to the mechanical complexity and difficulty ofcontrolling all of the parameters. However, the advances in low cost micro-controllers and the experience gained over the years in their application toengine management now makes the control possible.
20.12 WANKEL ENGINE
Conventionally IC engines are reciprocating type. However, in the twentiethcentury, a rotary engine was invented. The engine invented by German en-gineer Felix Wankel, is a type of internal combustion engine using a rotarydesign to convert pressure into a rotating motion instead of using reciprocat-ing pistons. Its four-stroke cycle takes place in a space between the insideof an oval-like epitrochoid-shaped housing and a rotor that is similar in shapeto a Reuleaux triangle but with sides that are somewhat flatter. This designdelivers power smoothly even at very high speed. The engine is quite compactin size. It is the only internal combustion engine invented in the twentiethcentury to go into production. Since its introduction the engine has beencommonly considered rotary engine. However, this name is also applied toseveral completely different designs. Figure 20.32 shows the anatomy of aWankel engine kept in Deutsches Museum in Munich, Germany.
Fig. 20.32 A Wankel engine in Deutsches Museum in Munich, Germany
Because of its compact design, Wankel rotary engines have been installedin a variety of vehicles and devices such as automobiles (including racing

710 IC Engines
cars), along with aircraft, personal water craft, chain saws, and auxiliarypower units. The most extensive automotive use of the Wankel engine hasbeen by the Japanese company Mazda. Figure 20.33 illustrates the Mazda’sfirst Wankel engine, at the Mazda Museum in Hiroshima, Japan
Fig. 20.33 Mazda’s first Wankel engine, at the Mazda Museum in Hiroshima,Japan
20.12.1 Basic Design
A typical design of the Wankel engine is shown in the Fig.20.34. There arethree apexes as seen in the figure. The (8) marked in the figure is one of thethree apexes of the rotor. The (4) marked is the eccentric shaft and (7) isthe lobe of the eccentric shaft. The shaft turns three times for each rotationof the rotor around the housing. It rotates once for each orbital revolutionaround the eccentric shaft.
In the Wankel engine, the four strokes (Fig.20.35) of a typical Otto cycleoccur in the space between a three-sided symmetric rotor and the inside ofa housing. The expansion phase of the Wankel cycle is much longer thanthat of the Otto cycle. In the basic single-rotor Wankel engine, the oval-likeepitrochoid-shaped housing (2) surrounds a rotor. The configuration of rotoris triangular with bow-shaped flanks. It has three-pointed curve of constantwidth (Fig.20.34) having the bulge in the middle of each side. The shape ofthe rotor between the fixed corners is so designed to achieve minimum volumeof the geometric combustion chamber and to maximize the compression ratio.
1
2
3
4
5
6
7
8
9 3
3
1 Engine inlet
2 Housing
3 Combustion chamber
4 Eccentric shaft
5 Spark plug
6 Stationary gear
7 Internal gear
8 Rotor apex
9 Exhaust outlet
5
Fig. 20.34 A typical design of the Wankel engine
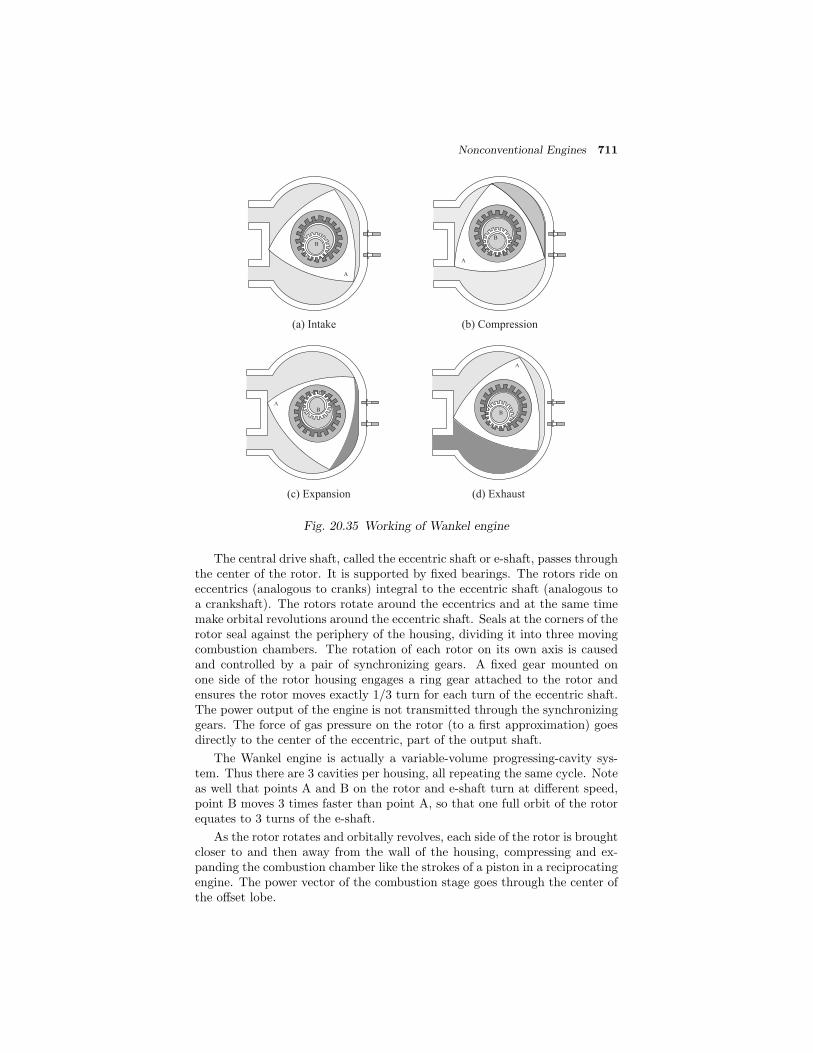
Nonconventional Engines 711
(a) Intake (b) Compression
A
B
A
BB
(c) Expansion (d) Exhaust
AB
A
B
Fig. 20.35 Working of Wankel engine
The central drive shaft, called the eccentric shaft or e-shaft, passes throughthe center of the rotor. It is supported by fixed bearings. The rotors ride oneccentrics (analogous to cranks) integral to the eccentric shaft (analogous toa crankshaft). The rotors rotate around the eccentrics and at the same timemake orbital revolutions around the eccentric shaft. Seals at the corners of therotor seal against the periphery of the housing, dividing it into three movingcombustion chambers. The rotation of each rotor on its own axis is causedand controlled by a pair of synchronizing gears. A fixed gear mounted onone side of the rotor housing engages a ring gear attached to the rotor andensures the rotor moves exactly 1/3 turn for each turn of the eccentric shaft.The power output of the engine is not transmitted through the synchronizinggears. The force of gas pressure on the rotor (to a first approximation) goesdirectly to the center of the eccentric, part of the output shaft.
The Wankel engine is actually a variable-volume progressing-cavity sys-tem. Thus there are 3 cavities per housing, all repeating the same cycle. Noteas well that points A and B on the rotor and e-shaft turn at different speed,point B moves 3 times faster than point A, so that one full orbit of the rotorequates to 3 turns of the e-shaft.
As the rotor rotates and orbitally revolves, each side of the rotor is broughtcloser to and then away from the wall of the housing, compressing and ex-panding the combustion chamber like the strokes of a piston in a reciprocatingengine. The power vector of the combustion stage goes through the center ofthe offset lobe.

712 IC Engines
A four-stroke piston engine makes one combustion stroke per cylinderfor every two rotations of the crankshaft (that is, one-half power stroke percrankshaft rotation per cylinder). However, each combustion chamber in theWankel generates one combustion stroke per each driveshaft rotation. That isto say, one power stroke per rotor orbital revolution and three power strokesper rotor rotation. Thus, power output of a Wankel engine is generally higherthan that of a four-stroke piston engine of similar engine displacement.
20.12.2 Comparison of Reciprocating and Wankel Rotary Engine
In the following sections, we will compare the Wankel engine with reciprocat-ing engine with respect to materials, sealing, fuel consumption and emissions.
20.12.3 Materials
In a piston engine, the cylinder is cooled by the incoming charge after beingheated by combustion. However, Wankel rotor housings are constantly heatedon one side and cooled on the other. This causes high local temperatures andunequal thermal expansion. While this places high demands on the materialsused, the simplicity of the Wankel makes it easier to use alternative materialslike exotic alloys and ceramics. With water cooling in a radial or axial flowdirection, with the hot water from the hot bowl heating the cold bowl, thethermal expansion remains tolerable.
20.12.4 Sealing
Early engine designs experienced sealing problems. The losses take place bothbetween the rotor and the housing and also between the various pieces makingup the housing. Also, in earlier model Wankel engines carbon particles couldbecome trapped between the seal and the casing. This started jamming theengine, requiring a partial rebuild.
It was common for very early Mazda engines to require rebuilding (nowsolved) in less than 100,000 km operation. Further, sealing problems arosefrom the uneven thermal distribution within the housings causing distortionand loss of sealing and compression. This thermal distortion also causesuneven wear between the apex seal and the rotor housing. Problem is en-countered when the engine is stressed before reaching operating temperature.However, Mazda seems to have solved these problems.
20.12.5 Fuel consumption and emissions
It may be noted that the shape of the Wankel combustion chamber is resistantto preignition. Therefore, it can run on lower-octane rating gasoline than acomparable piston engine. This also leads to relatively incomplete combustionof the air-fuel charge, with a larger amount of unburned hydrocarbons releasedinto the exhaust. However, NOx emissions are relatively low. Inexpensive’thermal reactor’ can be used where the unburned hydrocarbons (HC) can beoxidized. It is worth noting that piston-engine requires expensive catalyticconverters to deal with both unburned hydrocarbons and NOx emissions.Higher unburnt hydrocarbon emission raises fuel consumption. This is a weakpoint for the Wankel engine

Nonconventional Engines 713
20.12.6 Advantages and Disadvantages of Wankel Engines
Advantages:
(i) Wankel engines are considerably lighter, simpler, and contain far fewermoving part
(ii) There are no valves or complex valve trains
(iii) There are no connecting rods and there is no crankshaft.
(iv) The elimination of reciprocating mass and the elimination of the mosthighly stressed and failure prone parts of piston engines gives the Wankelengine high reliability, a smoother flow of power, and a high power-to-weight ratio.
(v) It has higher volumetric efficiency and a lower pumping loss
(vi) It is very quick to react to throttle changes and is able to quickly delivera surge of power when the demand arises, especially at higher rpm.
(vii) A further advantage of the Wankel engine for use in remotely pilotedaircrafts is the fact that a Wankel engine generally has a smaller frontalarea than a piston engine of equivalent power, allowing a more aerody-namic nose to be designed around it.
(viii) The simplicity of design and smaller size of the Wankel engine alsoallows for savings in construction costs, compared to piston engines ofcomparable power output.
(ix) Due to a 50% longer stroke duration compared to a four-cycle engine,there is more time to complete the combustion. This leads to greatersuitability for direct injection.
(x) A Wankel rotary engine has stronger flow of air-fuel mixture and a longeroperating cycle than a reciprocating engine
Disadvantages:
(i) In two dimensions the sealing system of a Wankel looks to be simplerthan that of a corresponding multi-cylinder piston engine. However, inthree dimensions the opposite is true. The rotor must also seal againstthe chamber ends which is comparatively difficult.
(ii) The less effective sealing of the Wankel is one factor reducing its ef-ficiency, limiting its use mainly to applications such as racing enginesand sports vehicles where neither efficiency nor long engine life are majorconsiderations.
(iii) The time available for fuel to be port-injected into a Wankel engine issignificantly shorter, compared to four-stroke piston engines, due to theway the three chambers rotate.
(iv) The fuel-air mixture cannot be pre-stored as there is no intake valve.
714 IC Engines
(v) Also the Wankel engine, compared to a piston engine, has 50% longerstroke duration. The four stroke Otto cycles last 1080◦ for a Wankelengine, whereas it is 720◦ for a four-stroke reciprocating piston engine.
(vi) The trailing side of the rotary engine’s combustion chamber develops asqueeze stream which pushes back the flamefront. That is why therecan be more carbon monoxide and unburnt hydrocarbons in a Wankel’sexhaust stream
(vii) All Wankel rotaries burn a small quantity of lubricating oil by design.periodically small amounts of oil is to be added, marginally increasingrunning costs
Review Questions
20.1 Name the nonconventional engines known to you.
20.2 Explain the working principle of CRDI engine.
20.3 Discuss the requirements for ECU and microcomputer in CRDI opera-tion.
20.4 What are the advantages and disadvantages of CRDI engine?
20.5 Why should we go for a dual fuel operation?
20.6 Describe the working principle of a dual fuel engine.
20.7 Explain the process of combustion in dual fuel engines.
20.8 What are the factors those affect the combustion in dual fuel engine?
20.9 What is a multi fuel engine and what are its characteristics?
20.10 What is a free piston engine and what are its characteristics?
20.11 Explain with sketches the working principle of various free piston engineconfigurations.
20.12 With a neat sketch explain the working principle of free piston gas gen-erator.
20.13 Mention the various advantages and disadvantages of a free piston en-gine.
20.14 Explain the evolution GDI engine over the period with a sketch.
20.15 Explain the principle of operation of a GDI engine.
20.16 Explain the concept of HCCI. Describe the various control mechanismsfor HCCI.
20.17 What are the advantages and disadvantages of HCCI engine?

Nonconventional Engines 715
20.18 Why should one go for lean burn operation? Explain the basics of leanburn technology.
20.19 With a neat sketch explain Toyota lean burn engine.
20.20 Give a brief account of Honda lean burn system.
20.21 With a neat sketch describe the Mitsubishi ultra lean burn combustionengine.
20.22 Explain the principle of operation of Stirling engine.
20.23 With neat sketches explain the working principle of alpha and beta Stir-ling engines.
20.24 Compare the Stirling engine with internal combustion engine.
20.25 What are the advantages and disadvantages of Stirling engine.
20.26 What are the applications of Stirling engine and what is its future?
20.27 What do you understand by charge stratification?
20.28 Explain the various methods of charge stratification.
20.29 Explain the various engines that use stratification by injection and pos-itive ignition.
20.30 With a sketch explain any one engine that uses the concept of chargestratification by swirl.
20.31 What are the advantages and the disadvantages of the stratified chargeengine.
20.32 What is the advantage of variable compression ratio concept?
20.33 Explain the principle of Cortina variable compression ratio engine.
20.34 Explain the performance of VCR engine over CCR engine.
20.35 What are the applications of VCRE?
20.36 What are the basic defects in a reciprocating engine? Why rotary engineis necessary?
20.37 With a diagram explain the configuration of a Wankel engine.
20.38 With neat sketches explain the working principle of a Wankel engine.
20.39 Compare the rotary Wankel engine with reciprocating I C engine.
20.40 What are the advantages and disadvantages of Wankel engine?

716 IC Engines
Multiple Choice Questions (choose the most appropriate answer)
1. Modern CRDI engines uses injection pressure of the order of
(a) 400 bar
(b) 800 bar
(c) 1200 bar
(d) 1600 bar
2. A dual fuel engine use two fuels in which
(a) one is gaseous and the other liquid
(b) both are liquid fuels
(c) both are gaseous fuels
(d) one is liquid and the other can be anything
3. A free piston engine will have
(a) a combustion chamber
(b) a load device
(c) a rebound device
(d) all of the above
4. GDI concept came in the year
(a) 1985
(b) 1990
(c) 1995
(d) 2005
5. HCCI combustion is similar to
(a) S I engine
(b) C I Engine
(c) Is a hybrid of both S I and C I Engine
(d) Wankel engine
6. Lean burn concept is more ideal for
(a) C I engine
(b) S I Engine
(c) Free piston engine
(d) Wankel engine
Nonconventional Engines 717
7. Stirling engine is noted for
(a) Quiet operation
(b) High efficiency
(c) Compatible with alternative and renewable energy
(d) All of the above
8. Charge stratification can be achieved by
(a) Injection
(b) Carburetion
(c) Injection as well as carburetion
(d) Lean burn technology
9. Variable compression ratio can be used in
(a) S I engine
(b) C I engine
(c) Wankel engine
(d) All of the above
10. Wankel engines
(a) have valve trains
(b) are lighter and simpler
(c) has lower volumetric efficiency
(d) has lower sfc compared to reciprocating engine
11. Stratified charge engines
(a) are more prone for knock
(b) have multifuel capabilities
(c) have lot of throttling losses
(d) uses overall rich mixture
12. CRDI
(a) increases the controllability
(b) improves fuel atomization
(c) helps in saving fuel
(d) all of the above

718 IC Engines
13. HCCI engines
(a) emits high NOx and soot
(b) have large power range
(c) efficiency is comparatively less
(d) pre-catalyst hydrocarbon emissions are higher.
14. Stirling engine
(a) uses a multi phase working fuel
(b) are extremely nonflexible
(c) requires only small temperature difference
(d) none of the above
15. Wankel engine
(a) is a rotary external combustion engine
(b) has less time to complete the combustion
(c) as a longer operating cycle
(d) is more expensive
Ans : 1. – (d) 2. – (a) 3. – (d) 4. – (a) 5. – (c)6. – (b) 7. – (d) 8. – (c) 9. – (a) 10. – (b)
11. – (b) 12. – (d) 13. – (d) 14. – (d) 15. – (c)
Index
abnormal combustion, 332acceleration pump system, 214acetone, 188actual and fuel-air cycles of CI engine,
144actual cycle, 133
analysis, 133actual engine, 13actual scavenging process, 634air capacity, 520air consumption, 479
air box method, 480viscous-flow air meter, 480
air pollutionIC engines, 419
air valve, 284air-bleed jet, 208air-cooled engine, 17air-cooled system, 411air-fuel mixture, 192air-fuel ratio, 22, 26air-standard cycles, 47
analysis, 47air-standard efficiency, 505alcohol, 168
CI engine, 172disadvantages, 168SI engine, 170
aldehydes, 485alkylation, 154alternate fuel, 165altitude compensation, 225
devices, 226analytical method of performance es-
timation, 518anti-dieseling, 213anti-oxidants, 390anticorrosive agents, 390antifoam agents, 392
aromatic series, 152aromatization, 155Atkinson cycle, 65atomization, 349automobile carburetor, 220auxiliary port, 212auxiliary valve, 212
back suction control mechanism, 210baffles, 413ballast resistor, 301battery, 300battery ignition system, 17, 299, 306benzol, 187best power mixture, 193best economy mixture, 193biodiesel, 175biogas, 186blast furnace gas, 187blending, 155blowby control, 451blowby loss, 367bore, 3bore ratio, 5bottom dead centre, 6brake mean effective pressure, 50, 504brake power, 22, 467, 502brake specific fuel consumption, 26brake thermal efficiency, 22, 23, 505Brayton cycle, 67breathing, 446
calorific value, 22, 27cams, 4camshaft, 4capacitance transducers, 585capacitive discharge ignition (CDI) sys-
tem, 314capacitor, 303
719
720 INDEX
carbon monoxide, 428carburetion, 191
definition, 191factors affecting, 191principle, 196
carburetoracceleration pump system, 214additional system, 212anti-dieseling, 213automobile, 220carter, 222constant choke, 216constant vacuum, 216dieseling, 213economizer, 214elementary, 198multi-barrel venturi, 219multijet, 218multiple venturi, 216parts, 203power enrichment system, 214richer coasting, 214S.U., 224simple, 198size, 203solex, 220types of, 215
carburetor depression, 199carburettor losses, 447Carnot cycle, 48carter carburetor, 222catalytic converter, 436centrifugal advance mechanism, 318centrifugal type superchargers, 600cetane number, 174characteristics, 499charcoal canister, 449charge efficiency, 507charging
method, 17charging efficiency, 632chassis dynamometer, 474chemical delay, 345chemically correct, 27chemiluminescence method, 483choke, 206CI engine
phenomenon of knock, 350
CI engines, 441classification of IC Engines, 13clearance volume, 6coefficient of viscosity, 372coke oven gas, 187cold start injector, 284combustion
CI engine, 341stages in CI engine, 344stages in SI engines, 326
combustion chamber, 4, 325air-cell, 358CI engine, 354cylindrical, 357direct-injection, 355F-head type, 341hemispherical, 357I-head type, 341indirect injection, 357indirect-injection, 355L-head type, 340overhead valve, 341precombustion, 357Ricardo swirl, 357shallow depth, 357SI engine, 338swirl, 357T-head type, 340toroidal, 357
combustion efficiency, 507combustion phenomenon, 491combustion process, 495common rail direct injection engine,
650advantage, 655disadvantage, 655ECU, 653injector, 651microcomputer, 654sensors, 653working principle, 651
commonrail fuel injection system, 292comparison
air-Standard and actual cycles, 133air-standard and fuel-air cycles,
116battery ignition and magneto ig-
nition system, 311
INDEX 721
four-stroke and two-stroke cycleengine, 14
four-stroke and two-stroke engine,12
knock in SI and CI engine, 352liquid and air-cooling system, 413Otto, Diesel and Dual, 61petrol and LPG, 184scavenging methods, 637SI and CI engines, 10, 11supercharger, 601two-stroke SI and CI engines, 640
compensating device, 208compensating jet, 209compressed natural gas, 182compression ratio, 6, 11compression stroke, 7, 9compression-ignition engine, 55compression-ignition engine, 3, 16connecting rod, 4constant choke carburetor, 216constant vacuum carburetor, 216constant-volume heat addition cycle,
52contact breaker, 302conventional fuel, 149cooling, 17, 395
power required, 402cooling fins, 411cooling system
advantages of air cooling, 414advantages of liquid cooling, 413air-cooled, 411characteristics, 403evaporative, 409forced circulation, 405need, 402pressure, 410types, 403
Cortina variable compression engine,706
cracking, 154crankcase, 4crankcase blowby, 450crankcase scavenged engine, 626, 627crankcase scavenged engine, 635crankcase ventilation, 385crankshaft, 4
creviceflow in, 424volume, 424
crevice volume, 424cross scavenging, 636cruising range, 195cubic capacity, 6Curtis type scavenging, 636cycle
actual, 133air-standard, 47Atkinson, 65Brayton, 67Carnot, 48constant-volume heat addition, 52Diesel, 55, 56dual, 58Ericsson, 51first law analysis, 21fuel-air, 109Lenoir, 64Otto, 52Stirling, 50
cycle of operation, 16cyclization, 155cylinder, 3
arrangement, 17opposed, 19
cylinder bank, 17cylinder block, 3cylinder bore, 5cylinder row, 17cylinder temperature distribution, 397
D-MPFI system, 280dead centre, 5
bottom, 6outer, 6top, 5
delay periodfactors affecting, 346
delivery ratio, 630delta type engine, 19design and performance data, 28detergent-dispersant, 391Diesel cycle, 55, 56dieseling, 213diethyl ether, 188

722 INDEX
direct frictional losses, 363direct or non-return system, 404displacement, 6dissociation, 113distributor, 303dry friction, 365dual cycle, 58dual fuel and multi-fuel engine, 655
advantage, 659combustion, 656combustion limits, 658knock, 657working principle, 656
dual fuel operation, 185duration of injection, 349dwell angle, 308dynamic viscosity, 372dynamometer, 468
chassis, 474eddy current, 471fan, 473hydraulic, 471swinging field DC, 473transmission, 469, 474
economizer, 214eddy current dynamometer, 471effect of operating variables, 117efficiency, 22
air-standard efficiency, 505brake thermal, 22, 23, 505charge, 507charging, 632combustion, 507engine, 505indicated, 505indicated thermal, 22mechanical, 22, 23, 364, 505ratio, 22, 24relative, 22, 24, 506scavenging, 507, 631trapping, 630volumetric, 22, 23, 506
efficiency ratio, 22, 24EFI system, 278elastohydrodynamic lubrication, 373electro optical sensors, 582electronic control system, 283
electronic control system (ECU), 283electronic control unit (ECU), 286electronic diesel injection control, 288,
289electronic fuel injection system, 277electronic indicator, 465electronic injection systems, 273electronically controlled injection pumps
(inline and distributor type),290
electronically controlled unit injectors,289
emission, 482aldehydes, 433, 485carbon monoxide, 428, 483chemical methods, 443control, 419control methods, 435flame ionization detector (FID),
485hydrocarbon from CI engines, 428lead, 434non-dispersive infra-red analyzer
(NDIR), 484oxides of nitrogen, 429, 482phosphorus, 435sulphur, 433unburned hydrocarbons, 484visible, 487
emission control methods, 435thermal converter, 435
emissionsengine, 420evaporative, 446exhaust, 421hydrocarbon, 423incomplete combustion, 423non-exhaust, 445other, 433
emulsion tube, 209end-to-end scavenged engine, 628energy conversion, 1energy flow, 21engine, 1
actual, 13air-cooled, 17application, 19, 20classification, 13

INDEX 723
comparison, 12, 14compression-ignition, 16, 55delta type, 19dual-fuel, 16electronics, 576emission, 419emission control, 419emissions, 420first law analysis, 21four-stroke, 6four-stroke compression-ignition,
8four-stroke diesel, 21four-stroke gasoline, 20gasoline, 16H type, 19heat, 1hydrogen, 179in-line, 17multicylinder, 17naturally aspirated, 17opposed cylinder, 18opposed piston, 18over-square, 5pancake, 19performance parameter, 22radial, 19reciprocating, 17, 21spark-ignition, 16square, 5supercharged, 17two-stroke, 10, 626two-stroke diesel, 20two-stroke gasoline, 19U type, 19under-square, 5V, 18water-cooled, 17working principle, 6X type, 19
engine capacity, 6engine components, 3
bore, 3cams, 4camshaft, 4combustion chamber, 4connecting rod, 4crankcase, 4
crankshaft, 4cylinder, 3cylinder block, 3exhaust manifold, 4exhaust valve, 4face, 3fly wheel, 4gudgeon pin, 4inlet manifold, 4inlet valve, 4piston, 4piston rings, 4spark plug, 4
engine efficiency, 505engine electronics, 576engine emission, 419engine emissions, 420engine friction, 363engine indicators, 465engine management systems, 577engine parameters, 316engine performance
methods for improving, 512engine performance characteristics, 507engine performance parameter, 22engine power, 500engine speed, 316equivalence ratio, 27Ericsson cycle, 51ethanol, 170Euro I norms, 420Euro II norms, 420evaporation loss control device (ELCD),
448evaporative emissions, 446excess air factor, 633exhaust and coolant temperature, 481exhaust blowdown, 139exhaust blowdown factor, 134exhaust blowdown loss, 367exhaust driven supercharging arrange-
ment, 607exhaust emissions, 421exhaust gas recirculation (EGR), 444exhaust gas recycle (EGR), 444exhaust manifold, 4exhaust oxygen sensor, 593exhaust stroke, 7, 9
724 INDEX
exhaust stroke loss, 367exhaust valve, 4expansion stroke, 7, 9external combustion engine, 1, 2extreme pressure additive, 391
fan dynamometer, 473film strength agents, 391firing order, 314first law of thermodynamics, 21first law analysis of engine cycle, 21flame front propagation, 328flame ionization detector (FID), 485flame propagation, 494flame speed, 329flame temperature measurement, 491flap type sensor, 591float chamber, 203flow in crevice, 424fluid-film friction, 365fly wheel, 4four-stroke compression-ignition engine,
8four-stroke diesel engine, 21four-stroke gasoline engine, 20four-stroke spark-ignition engine, 6free piston engine, 661
advantage, 666application, 667basics, 662combustion process, 665design, 665disadvantage, 667dual piston, 662gas generators, 664opposed piston, 663single piston, 662
frictiondry, 365fluid-film, 365hydrodynamic, 365journal bearing, 366mechanical, 368partial-film, 365piston position, 366rolling, 365
friction power, 457frictional power, 22
fuel, 16, 149acetone, 188alcohol, 168benzol, 187biodiesel, 175biogas, 186blast furnace gas, 187CI engine, 158coke oven gas, 187compressed natural gas, 182diethyl ether, 188dual, 16gaseous, 16, 149, 178liquefied petroleum gas, 182liquid, 150, 168natural gas, 180other possible, 186producer gas, 187qualities, 155quality, 349rating, 159SI engine, 156solid, 16, 149, 166vegetable oil, 174viscous, 16volatile liquid, 16
fuel consumption, 474fuel feed pump, 247fuel injector, 253fuel strainer, 203fuel-air, 26fuel-air cycle, 109
analysis, 109significance, 109
fuel-air ratio, 22
gaseous fuel, 149, 178hydrogen, 178
gasoline direct injection engine, 668operation, 669
gasoline engine, 16gasoline injection, 273gauge factor, 584gear driven supercharging arrangement,
607group gasoline injection system, 286gudgeon pin, 4

INDEX 725
H type engine, 19hall effect pickup, 579Hartridge smokemeter, 488heat balance, 513heat engine, 1
classification, 1external combustion, 1internal combustion, 1
heat exchanger effectiveness, 51heat loss factor, 134, 139heat rejection, 395heat transfer, 397
parameters affecting engine, 401theory of engine, 399
heterogeneous mixture, 326homogeneous charge compression ig-
nition engine, 671advantage, 675control, 672disadvantage, 675emissions, 674knock, 674power, 674variable compression ratio, 672variable exhaust gas percentage,
673variable fuel ignition quality, 673variable induction temperature, 672variable valve actuation, 673
homogeneous mixture, 325Honda CVCC engine, 703hot idling compensator, 206hot soak, 447hot wire sensor, 590hydraulic dynamometer, 471hydrocarbon, 423hydrocarbon emission, 423hydrocarbon emission from CI engines,
428hydrodynamic friction, 365hydrogen, 178
advantages, 178disadvantages, 178engines, 179
hydrogen engines, 179hydrogenation, 154
ideal indicator diagram, 10
idling range, 194idling system, 204ignition, 11, 17, 297
battery, 17energy requirements, 297limitations, 307magneto, 17types, 17
ignition coil, 301ignition component
ballast resistor, 301battery, 300capacitor, 303contact breaker, 302distributor, 303ignition coil, 301spark plug, 304switch, 301
ignition delay period, 344ignition switch, 301ignition system, 298
12 V, 309battery, 299magneto, 310modern, 311requirements, 299
ignition timing, 316ignition timing and exhaust emissions,
320in-line engine, 17incomplete combustion, 423index for compressing scavenge air, 633indicated efficiency, 505indicated mean effective pressure, 25,
50, 500indicated power, 22, 24, 463, 501indicated specific fuel consumption, 26indicated thermal efficiency, 22indicator diagram, 13, 464inductive transducer, 579injection
air injection system, 244classification, 244common rail system, 246commonrail fuel system, 292comparison of fuel-injection sys-
tems, 247components, 275
726 INDEX
continuous, 274distributor system, 247electronic diesel control, 289electronic fuel, 277electronic systems, 273electronically controlled pumps,
290gasoline, 273group gasoline, 286individual pump and nozzle sys-
tem, 245mechanical, 243multi-point fuel (MPFI), 279port, 279requirements, 243SI engine, 260solid injection system, 244throttle body, 280timed, 275timing, 285types of systems, 274unit injector system, 246
injection pump, 248distributor type, 250jerk type, 248
injection pump governor, 250injection pumps
distributor type, 290inline fuel, 290
injection systemcomponents, 275electronic fuel, 277
injection timing, 285, 349injector
electronically controlled unit, 289inlet manifold, 4inlet valve, 4inlet-valve Mach index, 22, 26intake air flow measurement, 588intake manifold return PCV system
(Open Type), 451intake stroke, 7intake stroke loss, 368intake valve, 142internal combustion engine, 1, 2isomerization, 154
journal bearing friction, 366
journal bearing lubrication, 374
knockphenomenon in SI engines, 332
knock limited parameters, 334knock sensor, 593
L-MPFI system , 281lambda sensor, 593lead, 434lean burn engine, 675
basics, 677combustion, 677emissions, 678fuel flexibility, 678Honda, 679Mitsubishi, 680Toyota, 679
lean mixture, 27, 192Lenoir cycle, 64linear variable differential transformer
(LVDT), 581liquefied petroleum gas
advantages, 183disadvantages, 183
liquefied petroleum gas (LPG), 182liquid cooled systems, 403liquid fuel, 150, 168
alcohol, 168ethanol, 170methanol, 169
load control, 11loss
blowby, 367exhaust blowdown, 367exhaust stroke, 367intake stroke, 368pumping, 367
loss due to gas exchange processes,140
loss due to rubbing friction, 144LPG (Propane) Fuel Feed System, 185lubricants
additives, 390properties, 386
lubrication, 363, 370elastohydrodynamic, 373engine components, 377
INDEX 727
journal bearing, 374mechanism, 370stable, 376
lubrication system, 379dump sump, 384mist, 379pressure feed, 382splash, 381splash and pressure, 382wet sump, 381
Lucas diesel systems, 294
magneto ignition system, 17, 310main metering, 204mean effective pressure, 22, 24, 50, 55,
58, 60mean piston speed, 22, 25measurements, 457mechanical efficiency, 22, 23, 364, 505mechanical friction, 365, 368mechanical governor, 252mechanical injection system, 243metallic strain gauge, 584methanol, 169mixture requirement
air-fuel, 194load, 192speed, 192
mixture strength, 318modern diesel engine, 442modern evaporative emission control
system, 449modern ignition system, 311Morse test, 459Motoring test, 461MPFI system
electronic control, 281functional divisions, 281
MPFI-air induction system, 281MPFI-fuel system, 281multi-barrel venturi carburetor, 219multi-hole nozzle, 256multi-point fuel injection (MPFI) sys-
tem, 279multifuel engine, 659
charactetistics, 660multijet carburetor, 218multiple venturi carburetor, 216
naphthene series, 152natural gas, 180
advantages, 181natural gas disadvantages, 181naturally aspirated, 17noise, 490non-dispersive infra-red analyzer (NDIR),
484non-exhaust emissions, 445non-wire wound potentiometer, 580normal force, 370nozzle, 254
multi-hole, 256pintaux-hole, 257pintle, 256single hole, 256types of, 255
oiliness, 391olefin series, 151open system, 21opposed cylinder, 19opposed cylinder engine, 18opposed piston engine, 18opposed piston scavenged engine, 628Otto cycle, 52outer dead centre, 6over-square engine, 5oxides of nitrogen, 429
pancake engine, 19paraffin series, 150part load operation, 318partial-film friction, 365particulate traps, 441particulates, 432perfect mixing, 634perfect scavenging, 634performance characteristics
air-fuel ratio, 512combustion, 511compression ratio, 512engine speed, 512heat losses, 512mass of inducted charge, 512spark timing, 511variables affecting, 511
performance curve, 510
728 INDEX
performance maps, 516CI engine, 516SI engine, 516
performance parameters, 499period of afterburning, 346period of controlled combustion, 346period of rapid combustion, 346petroleum, 150petroleum refining process, 153phenomenon of knock
CI engine, 350phosphorus, 435photochemical smog, 430physical delay, 345pintaux nozzle, 257pintle nozzle, 256piston, 4piston area, 5piston rings, 4piston temperature distribution, 396pneumatic governor, 253polymerization, 154port injection, 279position displacement, 578potentiometer, 580
non-wire wound, 580pour point depressors, 391power enrichment system, 214power input for mechanical driven su-
percharger, 605power range, 196power required to cool engine, 402power stroke, 7precombustion chamber, 357pressure
measurement, 583pressure cooling system, 410pressure loss coefficient, 632producer gas, 187prony brake, 469pumping loss, 363, 367
radial engine, 19rate of pressure rise, 331reciprocating engine, 21reformation, 155reformulated gasoline, 171relative cylinder charge, 630
relative efficiency, 22, 24, 506resistance temperature detector (RTD),
588retardation test, 461reverse flow scavenging, 636reversible, 47rich mixture, 27, 192richer coasting system, 214rolling friction, 365Root’s Supercharger, 600rope brake, 470
S.U. carburetor, 224scavenging efficiency, 507, 631scavenging pump, 637sensor
air flow, 277air inlet temperature, 277camshaft position, 277engine temperature, 277exhaust gas, 277exhaust oxygen, 593flap type, 591hot wire, 590knock, 277, 593lambda, 593manifold pressure, 277oxygen, 277throttle position, 277vortex, 592
sensorselectro optical, 582metallic strain gauge, 584strain gauge, 583
separately scavenged engine, 627, 635short circuiting, 634simple carburetor, 198single hole nozzle, 256solex carburetor, 220solid fuel, 149solid fuels, 166spark advance mechanism, 318spark energy, 298spark plug, 4, 304spark-assisted diesel, 174spark-ignition engine, 3, 16specific fuel consumption, 22, 26specific power output, 22, 25

INDEX 729
speed, 11, 481speed sensing, 578spray formation, 257square engine, 5stable lubrication, 376Stirling cycle, 50Stirling engine, 681
advantage, 689alpha, 684applications, 692beta, 686comparison, 689cycle, 687disadvantage, 690displacer type, 688friction, 689lubricants, 689operation, 682pressurization, 688types, 684
stoichiometric fuel-air ratio, 27stoichiometric mixture, 192strain gauge sensors, 583stratified charge engine, 693
advantage, 693, 704Broderson, 698combustion, 699disadvantage, 704Honda CVCC, 703stratification by fuel, 696swirl, 699Texaco combustion process, 701Volkswagon PCI, 697witzky swirl stratification process,
703working principle, 700
stroke, 5compression, 7, 9exhaust, 7, 9expansion, 7, 9intake, 7power, 7suction, 7, 8
suction stroke, 7, 8sulphur, 433supercharged engine, 17superchargers
centrifugal, 600
Root’s, 600types of, 599vane type, 600
supercharging, 598effects, 603electric motor driven, 602exhaust driven, 607gear driven, 607kadenacy system, 602limitations, 604methods, 601ram effect of, 602under piston, 602
surface-ignition alcohol, 173swept volume, 6swinging field, 473swinging field DC dynamometer, 473
temperature measurement, 586testing, 457Texaco combustion process, 701theoretical scavenging process, 633
perfect, 634perfect mixing, 634short circuiting, 634
thermal converter, 435thermal efficiency, 11, 53, 56, 58
Diesel cycle, 56dual cycle, 58Otto, 53
thermistors, 586thermocouples, 588thermodynamic analysis of supercharged
engine cycle, 604thermosyphon system, 405throttle, 206throttle body injection system, 280time loss factor, 134top dead centre, 5transistorized coil ignition (TCI) sys-
tem, 312transmission dynamometer, 469, 474trapping efficiency, 630turbocharging, 607, 608two-stroke
air capacity, 633two-stroke air capacity, 633two-stroke diesel engine, 20
730 INDEX
two-stroke engine, 10, 626advantages, 638classification based on scavenging
process, 635crankcase scavenged, 626, 627disadvantages, 638, 639externally scavenged, 627loop-scavenged, 628separately scavenged, 627types, 626
two-stroke gasoline engine, 19
U type engine, 19ultra lean burn mode, 670unburned hydrocarbons, 484under-square engine, 5
V engine, 18vacuum advance mechanism, 319valve overlap, 425Van Brand smokemeter, 489vane type supercharger, 600variable compression ratio engine, 705
applications, 710CFR, 708Cortina, 706cycle, 707
variable specific heats, 111variation of gas temperature, 395vegetable oil, 174
viscosity index improvers, 391visible emissions, 487
comparison method, 487continuous filtering type, 488Hartridge smokemeter, 488light extinction type, 487obscuration method, 487smoke, 487spot filtering type, 489Van Brand smokemeter, 489
volumetric efficiency, 22, 23, 141, 506volumetric type flowmeter, 475vortex sensor, 592
Wankel engine, 710advantages, 714comparison, 713design, 711disadvantages, 714
water-cooled engine, 17water-gasoline mixture, 171Willan’s line method, 458witzky swirl stratification process, 703work output, 54, 58, 60
Diesel cycle, 58dual cycle, 60Otto cycle, 54
X type engine, 19