Chapter 5: Continuous Probability Distributions
112
1 Chapter 5: Continuous Probability Distributions 5.1. Continuous Random Variables and Their Probability Distributions All of the random variables discussed in Chapter 4 were discrete, assuming only a finite number or a countably infinite number of values. However, many of the random variables seen in practice have more than a countable collection of possible values. Weights of adult patients coming into a clinic may be anywhere from, say 80 to 300 pounds. Diameters of machined rods from a certain industrial process may be anywhere from 1.2 to 1.5 centimeters. Proportions of impurities in ore samples may run from 0.10 to 0.80. These random variables can take on any value in an interval of real numbers. That is not to say that every value in the interval can be found in the sample data if one looks long enough; one may never observe a patient weighing exactly 182.38 pounds. Yet, no value can be ruled out as a possible observation; one might encounter a patient weighing 182.38 pounds, so this number must be considered in the set of possible outcomes. Since random variables of this type have a continuum of possible values, they are called continuous random variables. Probability distributions for continuous random variables are developed in this chapter, and the basic ideas are presented in the context of an experiment on life lengths. An experimenter is measuring the life length X of a transistor. In this case, X can assume an infinite number of possible values. We cannot assign a positive probability to each possible outcome of the experiment because, no matter how small we might make the individual probabilities, they would sum to a value greater than one when accumulated over the entire sample space. However, we can assign positive probabilities to intervals of real numbers in a manner consistent with the axioms of probability. To introduce the basic ideas involved here, let us consider a specific example in some detail. Suppose that we have measured the life lengths of 50 batteries of a certain type, selected from a larger population of such batteries. The observed life lengths are as given in Table 5.1. The relative frequency histogram for these data (Figure 5.1) shows clearly that most of the life lengths are near zero, and the frequency drops off rather smoothly as we look at longer life lengths. Here, 32% of the 50 observations fall into the first subinterval (0-1), and another 22% fall into the second (1-2). There is a decline in frequency as we proceed across the subintervals, until the last subinterval (8-9) contains a single observation. Table 5.1. Life Lengths of Batteries (in hundreds of hours) 0.406 0.685 4.778 1.725 8.223 2.343 1.401 1.507 0.294 2.230 0.538 0.234 4.025 3.323 2.920 5.088 1.458 1.064 0.774 0.761 5.587 0.517 3.246 2.330 1.064 2.563 0.511 3.246 2.330 1.064 0.023 0.225 1.514 3.214 3.810 3.334 2.325 0.333 7.514 0.968 3.491 2.921 1.624 0.334 4.490 1.267 1.702 2.634 1.849 0.186
Transcript of Chapter 5: Continuous Probability Distributions
1
Chapter 5: Continuous Probability Distributions
5.1. Continuous Random Variables and Their Probability Distributions All of the random variables discussed in Chapter 4 were discrete, assuming only a finite number or a countably infinite number of values. However, many of the random variables seen in practice have more than a countable collection of possible values. Weights of adult patients coming into a clinic may be anywhere from, say 80 to 300 pounds. Diameters of machined rods from a certain industrial process may be anywhere from 1.2 to 1.5 centimeters. Proportions of impurities in ore samples may run from 0.10 to 0.80. These random variables can take on any value in an interval of real numbers. That is not to say that every value in the interval can be found in the sample data if one looks long enough; one may never observe a patient weighing exactly 182.38 pounds. Yet, no value can be ruled out as a possible observation; one might encounter a patient weighing 182.38 pounds, so this number must be considered in the set of possible outcomes. Since random variables of this type have a continuum of possible values, they are called continuous random variables. Probability distributions for continuous random variables are developed in this chapter, and the basic ideas are presented in the context of an experiment on life lengths. An experimenter is measuring the life length X of a transistor. In this case, X can assume an infinite number of possible values. We cannot assign a positive probability to each possible outcome of the experiment because, no matter how small we might make the individual probabilities, they would sum to a value greater than one when accumulated over the entire sample space. However, we can assign positive probabilities to intervals of real numbers in a manner consistent with the axioms of probability. To introduce the basic ideas involved here, let us consider a specific example in some detail. Suppose that we have measured the life lengths of 50 batteries of a certain type, selected from a larger population of such batteries. The observed life lengths are as given in Table 5.1. The relative frequency histogram for these data (Figure 5.1) shows clearly that most of the life lengths are near zero, and the frequency drops off rather smoothly as we look at longer life lengths. Here, 32% of the 50 observations fall into the first subinterval (0-1), and another 22% fall into the second (1-2). There is a decline in frequency as we proceed across the subintervals, until the last subinterval (8-9) contains a single observation.
Table 5.1. Life Lengths of Batteries (in hundreds of hours) 0.406 0.685 4.778 1.725 8.2232.343 1.401 1.507 0.294 2.2300.538 0.234 4.025 3.323 2.9205.088 1.458 1.064 0.774 0.7615.587 0.517 3.246 2.330 1.0642.563 0.511 3.246 2.330 1.0640.023 0.225 1.514 3.214 3.8103.334 2.325 0.333 7.514 0.9683.491 2.921 1.624 0.334 4.4901.267 1.702 2.634 1.849 0.186
2
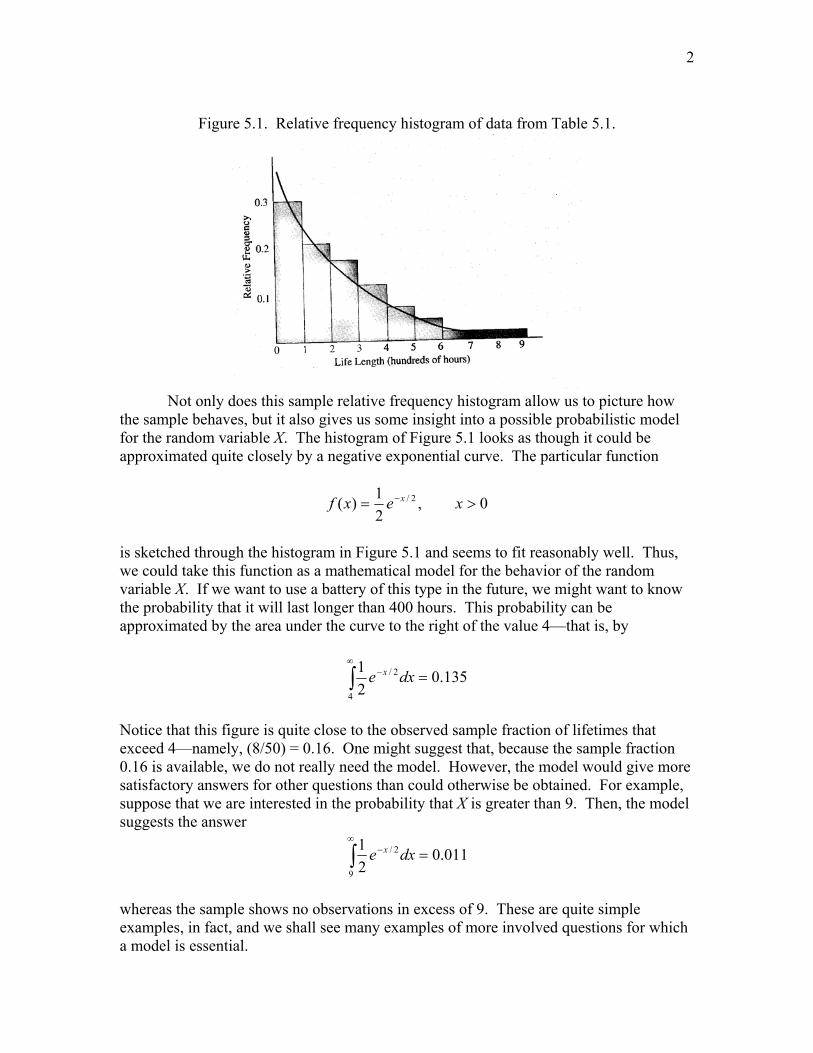
Figure 5.1. Relative frequency histogram of data from Table 5.1.
Not only does this sample relative frequency histogram allow us to picture how the sample behaves, but it also gives us some insight into a possible probabilistic model for the random variable X. The histogram of Figure 5.1 looks as though it could be approximated quite closely by a negative exponential curve. The particular function
0,21)( 2/ >= − xexf x
is sketched through the histogram in Figure 5.1 and seems to fit reasonably well. Thus, we could take this function as a mathematical model for the behavior of the random variable X. If we want to use a battery of this type in the future, we might want to know the probability that it will last longer than 400 hours. This probability can be approximated by the area under the curve to the right of the value 4—that is, by
135.021
4
2/ =∫∞
− dxe x
Notice that this figure is quite close to the observed sample fraction of lifetimes that exceed 4—namely, (8/50) = 0.16. One might suggest that, because the sample fraction 0.16 is available, we do not really need the model. However, the model would give more satisfactory answers for other questions than could otherwise be obtained. For example, suppose that we are interested in the probability that X is greater than 9. Then, the model suggests the answer
011.021
9
2/ =∫∞
− dxe x
whereas the sample shows no observations in excess of 9. These are quite simple examples, in fact, and we shall see many examples of more involved questions for which a model is essential.
3
Why did we choose the exponential function as a model here? Would some others not do just as well? The choice of a model is a fundamental problem, and we shall spend considerable time in later sections delving into theoretical and practical reasons for these choices. Here, in this preliminary discussion, we merely examine some models that look as though they might do the job. The function )(xf , which models the relative frequency behavior of X, is called the probability density function.
Notice that for a continuous random variable X,
0)()( === ∫a
a
dxxfaXP
for any specific value a . The need to assign zero probability to any specific value should not disturb us, because X can assume an infinite number of possible values. For example, given all the possible lengths of life of a battery, what is the probability that the battery we are using will last exactly 497.392 hours? Assigning probability zero to this event does not rule out 497.392 as a possible length, but it does imply that the chance of observing this particular length is extremely small. Example 5.1: The random variable X of the life lengths of batteries discussed above is associated with a probability density function of the form
⎪⎩
⎪⎨⎧ >=
−
elsewhere
xforexfx
,0
0,21
)(2/
Find the probability that the life of a particular battery of this type is less that 200 or greater than 400 hours.
Definition 5.1. A random variable X is said to be continuous if there is a function )(xf , called the probability density function, such that
1. xallforxf ,0)( ≥
2. 1)( =∫∞
∞−
dxxf
3. ∫=≤≤b
a
dxxfbXaP )()(
4
Solution: Let A denote the event that X is less than 2, and let B denote the event that X is greater than 4. Then, because A and B are mutually exclusive.
( ) ( )
767.0135.0368.01
1
21
21
)()()(
214
2/2
0
2/
=+−=+−=
+=
+=∪
−−
∞−− ∫∫
ee
dxedxe
BPAPBAP
xx
Example 5.2: Refer to Example 5.1. Find the probability that a battery of this type lasts more than 300 hours, given that it already has been in use for more than 200 hours. Solution: We are interested in P(X > 3|X > 2); and by the definition of conditional probability,
)2()3()2|3(
>>
=>>XPXPXXP
because the intersection of the events (X > 3) and (X > 2) is the event (X > 3).
606.0
2121
)2()3( 2/1
1
2/3
2
2/
3
2/
====>> −
−
−
∞−
∞−
∫
∫e
ee
dxe
dxe
XPXP
x
x
Sometimes it is convenient to look at cumulative probabilities of the form
)( bXP ≤ . To do this, we use the distribution function or cumulative distribution function, which we discussed for discrete distributions in Section 4.1. For continuous distributions we have the following definition:
5
In the battery example, X has a probability density function given by
⎪⎩
⎪⎨⎧ >
=−
elsewhere
xfordxexf
x
,0
0,21
)(2/
Thus,
⎩⎨⎧
≤>−
=
−=
=
≤=
−
−
−∫
0,00,1
|
21
)()(
2/
2/0
2/
bbe
e
dxe
bXPbF
b
ba
x
bx
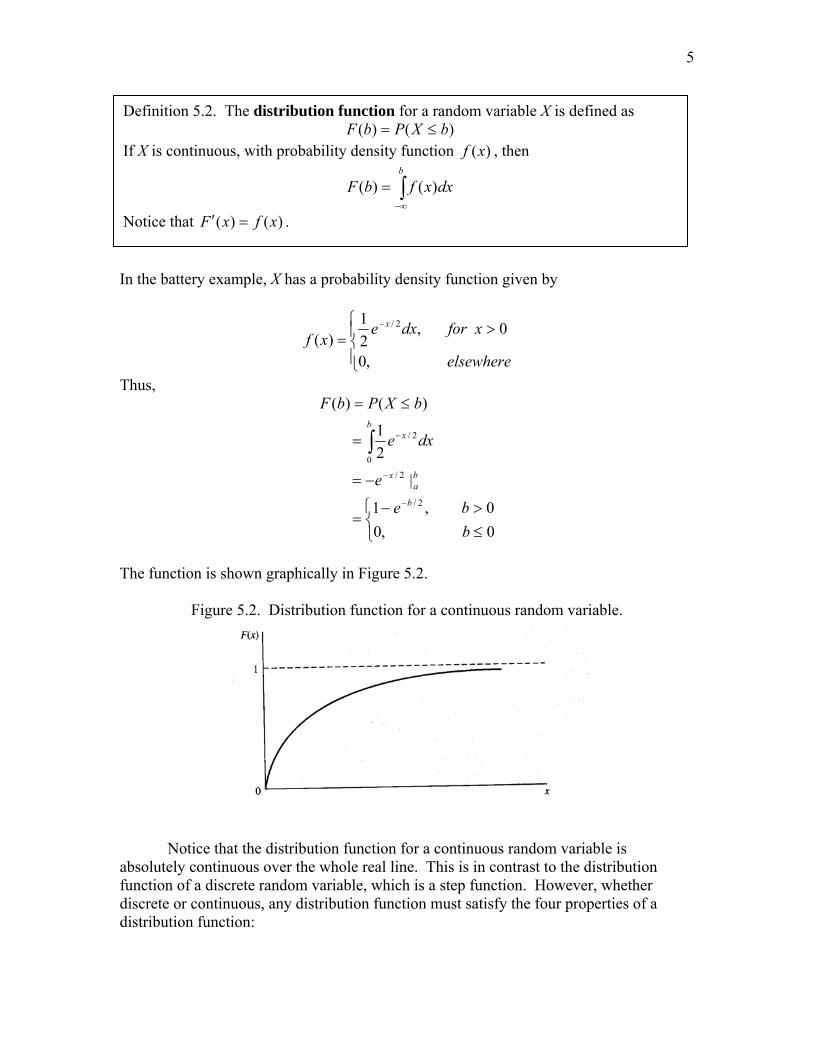
The function is shown graphically in Figure 5.2.
Figure 5.2. Distribution function for a continuous random variable.
Notice that the distribution function for a continuous random variable is
absolutely continuous over the whole real line. This is in contrast to the distribution function of a discrete random variable, which is a step function. However, whether discrete or continuous, any distribution function must satisfy the four properties of a distribution function:
Definition 5.2. The distribution function for a random variable X is defined as )()( bXPbF ≤=
If X is continuous, with probability density function )(xf , then
∫∞−
=b
dxxfbF )()(
Notice that )()( xfxF =′ .

6
1. 0)(lim =−∞→
xFx
2. 1)(lim =∞→
xFx
3. The distribution function is a non-decreasing function; that is, if a < b, F(a) ≤ F(b). The distribution function can remain constant, but it cannot decrease, as we increase from a to b.
4. The distribution function is right-hand continuous; that is, )()(lim0
xFhxFh
=++→
For a distribution function of a continuous random variable, not only is the distribution function right-hand continuous as specified in (4), it is left-hand continuous and thus, absolutely continuous (see Figures 5.2 and 5.3). We may also have a random variable that has discrete probabilities at some points and probability associated with some intervals. In this case, the distribution function will have some points of discontinuity (steps) at values of the variable with discrete probabilities and continuous increases over the intervals that have positive probability. These will be discussed more fully in Section 5.11.
Figure 5.3. Distribution function of a continuous random variable
As with discrete distribution functions, the probability density function of a continuous random variable may be derived from the distribution function. Just as the distribution function can be obtained from the probability density function of a continuous random variable through integration, the probability density may be found by differentiating the distribution function. Specifically, if X is a continuous random variable,
( ) ℜ∈= xxFdxdxf ,)()(

7
Example 5.3: The distribution function of the random variable X, the time (in months) from the diagnosis age until death for one population of AIDS patients, is as follows:
1.20.03( ) 1 , 0xF x e x−= − > 1. Find the probability that a randomly selected person from this population survives at least 12 months. 2. Find the probability density function of X. Solution: 1. The probability of surviving at least 12 months is
( )1.20.03(12)
( 12) 1 ( 12)1 (12)
1 1
1 0.55
0.45
P X P XF
e−
> = − ≤= −
= − −
= −
=
45% of this population will survive more than a year from the time of the diagnosis of AIDS.
⎩⎨⎧
≥<
== − 0,36.00,0
))(()( 2.103.02.0 xexx
xFdxdxf x
2. Notice that both the probability density function and the distribution function are
defined for all real values of X.
Exercises 5.1. For each of the following situations, define an appropriate random variable and state whether it is continuous or discrete. a, An entomologist observes the distance insects move after emerging from pupation. b. A neonatologist records how many stem cells differentiate into brain cells c. A toxicologist measures the proportion of toxins in the water. d. An ichthyologist measures the length of fish 5.2. For each of the following situations, define an appropriate random variable and state whether it is continuous or discrete. a. An astronomer observes the number of stars in a quadrant of the sky b. A physician records the diastolic blood pressure of a study participant c. A forester measures the dbh (diameter at breast height) of trees
8
d. A pathologist is looking for signs of disease in blood samples. 5.3. Suppose that a random variable X has a probability density function given by
2
, 1 2( ) 30,
x xf xotherwise
⎧− < <⎪= ⎨
⎪⎩
a. Find the probability that -1 < X < 1. b. Find the probability that 1 < X < 3. c. Find the probability that X ≤ 1 given X ≤ 1.5. d. Find the distribution function of X. 5.4. The weekly repair cost, X, for a certain machine has a probability density function given by
(1 ), 0 1
( )0,cx x x
f xotherwise
− ≤ ≤⎧= ⎨⎩
with measurements in $100s. a. Find the value of c that makes this function a valid probability density function. b. Find and sketch the distribution function of X. c. What is the probability that repair costs will exceed $75 during a week? d. What is the probability that the repair costs will exceed $75 given that they will exceed $50. 5.5. The effectiveness of solar-energy heating units depends on the amount of radiation available from the sun. During a typical October, daily total solar radiation in Tampa, Florida, approximately follows the following probability density function (units are hundreds of calories).
3 ( 2)(6 ), 2 6
32( )0,
x x xf x
otherwise
⎧ − − ≤ ≤⎪= ⎨⎪⎩
a. Find the probability that solar radiation will exceed 400 calories on a typical October day. b. What amount of solar radiation is exceeded on exactly 50% of the October days, according to this model? 5.6. Jerry is always early for appointments, arriving between 10 minutes early to exactly on time. The distribution function associated with X, the number of minutes early he arrives, is as follows:
9
⎪⎪⎪
⎩
⎪⎪⎪
⎨
⎧
>
≤≤−−
≤≤
<
=
01,1
104,60
4020
40,40
0,0
)(2
2
x
xxx
xxx
xF
a. Graph the distribution function. b. Find the probability that Jerry arrives at least five minutes early. c. Find the probability density function of X. d. Graph the probability density function of X. 5.7. The distribution function of a random variable X is as follows:
⎪⎪⎪
⎩
⎪⎪⎪
⎨
⎧
>
≤≤
≤≤
<
=
2,1
21,2
10,2
0,0
)(
3
x
xx
xxx
xF
a. Graph the distribution function. b. Find the probability that X is between 0.25 and 0.75. c. Find the probability density function of X. d. Graph the probability density function of X. 5.8. A firm has been monitoring its total daily telephone usage. The daily use of time conforms to the following probability density function (measured in hours).
23 (4 ), 0 4
64( )0,
x x xf x
otherwise
⎧ − ≤ ≤⎪= ⎨⎪⎩
a. Graph the probability density function. b. Find the distribution function F(x) for daily telephone usage X. c. Find the probability that the time telephone usage by the firm will exceed two hours for a selected week. d. The current budget of the firm covers only 3 hours of daily telephone usage. How often will the budgeted figure be exceeded? e. How much daily telephone time should be budgeted if this figure is to be exceeded with a probability of only 0.10?
10
5.9. The pH level, a measure of acidity, is important in studies of acid rain. For a certain lake, baseline measurements of acidity are made so that any changes caused by acid rain can be noted. The pH for water samples from the lake is a random variable X, with probability density function
23 (7 ) , 5 7
( ) 80,
x xf x
otherwise
⎧ − ≤ ≤⎪= ⎨⎪⎩
a. Sketch the curve of f(x). b. Find the distribution function F(x) for X. c. Find the probability that the pH for a water sample from this lake will be less than 6. d. Find the probability that the pH of a water sample from this lake will be less than 5.5 given that it is known to be less than 6. 5.10. The “on” temperature of a thermostatically controlled switch for an air conditioning system is set at 60o, but the actual temperature X at which the switch turns on is a random variable having the probability density function
1 , 71 73
( ) 20,
xf x
otherwise
⎧ ≤ ≤⎪= ⎨⎪⎩
a. Find the probability that a temperature in excess of 72o is required to turn the switch on. b. If two such switches are used independently, find the probability that a temperature in excess of 73o is required to turn both on. 5.11. The proportion of time, during a 40-hour work week, that an industrial robot was in operation was measured for a large number of weeks. The measurements can be modeled by the probability density function
⎩⎨⎧ ≤≤
=otherwise
xxxf
,010,2
)(
If X denotes the proportion of time this robot will be in operation during a coming week, find the following values a. P(X > ½) b. P(X > 1/2|X > ¼) c. P(X > ¼|X > ½) d. F(x). Graph this function. Is F(x) continuous? 5.12. The proportion of impurities by weight X in certain copper ore samples is a random variable having a probability density function of
11
212 (1 ), 0 1
( ) 0,x x x
f x otherwise⎧ − ≤ ≤⎪= ⎨⎪⎩
If four such samples are independently selected, find the probabilities of the following events. a. Exactly one sample has a proportion of impurities exceeding 0.5. b. At least one sample has a proportion of impurities exceeding 0.5. 5.2 Expected Values of Continuous Random Variables As in the discrete case, we often want to summarize the information contained in a continuous variable’s probability distribution by calculating expected values for the random variable and for certain functions of the random variable.
For functions of random variables, we have the following theorem.
The definitions of variance and of standard deviation given in Definitions 4.5 and 4.6 and the properties given in Theorems 4.2 and 4.3 hold for the continuous case, as well.
Definition 5.3. The expected value of a continuous random variable X that has a probability density function )(xf is given by
∫∞
∞−
= dxxxfXE )()(
Note: We assume the absolute convergence of all integrals so that the expectations exist.
Theorem 5.1. If X is a continuous random variable with probability distribution )(xf , and if )(xg is any real-valued function of X, then
∫∞
∞−
= dxxfxgXgE )()()]([
The proof of Theorem 5.1 will not be given here.

12
For constants a and b ,
bXaEbaXE +=+ )()(
and )()( 2 XVabaXV =+
We illustrate the expectations of continuous random variables in the following two examples. Example 5.4: For a given teller in a bank, let X denote the percentage of time, out of a 40-hour work week, that he is directly serving customers. Suppose that X has a probability density function given by
23 , 0 1( )
0,x x
f xotherwise
⎧ ≤ ≤= ⎨⎩
Find the mean and variance of X. Solution: From Definition 5.3,
For a random variable X with probability density function )(xf , the variance of X is given by
[ ]
( ) 22
2
2
)()(
)()(
μ
μ
μ
−=
−=
−=
∫∞+
∞−
XE
dxxfx
XEXV
where )(XE=μ .
13
( )
75.043
43
3
3
)()(
1
0
4
1
0
3
1
0
2
=
=
⎥⎦
⎤⎢⎣
⎡=
=
=
=
∫
∫
∫∞
∞−
x
dxx
dxxx
dxxxfXE
Thus, on average, the teller spends 75% of his time each week directly serving customers. To compute V(X), we first find E(X2):
( )
75.043
43
3
3
)()(
1
0
4
1
0
3
1
0
2
=
=
⎥⎦
⎤⎢⎣
⎡=
=
=
=
∫
∫
∫∞
∞−
x
dxx
dxxx
dxxxfXE
Then, [ ]
0375.05625.060.0
)75.0(60.0)()()(
2
22
=−=−=
−= XEXEXV
Example 5.5: The weekly demand X, in hundreds of gallon, for propane at a certain supply station has a density function given by

14
⎪⎪⎪
⎩
⎪⎪⎪
⎨
⎧
≤<
≤≤
=
elsewhere
x
xx
xf
,0
32,21
20,4
)(
Find the expected weekly demand. Solution:
( ) ( )
92.145
32
49418
121
221
341
21
41
21
4
)()(
3
2
22
0
3
2
0
3
2
2
2
0
3
2
=
+=
−⎟⎠⎞
⎜⎝⎛+=
⎥⎦
⎤⎢⎣
⎡⎟⎠⎞
⎜⎝⎛+⎥
⎦
⎤⎢⎣
⎡⎟⎠⎞
⎜⎝⎛=
⎟⎠⎞
⎜⎝⎛+⎟
⎠⎞
⎜⎝⎛=
⎟⎠⎞
⎜⎝⎛+⎟
⎠⎞
⎜⎝⎛=
=
∫ ∫
∫ ∫
∫∞
∞−
xx
xdxdxx
dxxdxxx
dxxxfXE
On average, the weekly demand for propane will be 192 gallons at this supply center. Tchbysheff’s Theorem (Theorem 4.3) holds for continuous random variables, just as it does for discrete ones. Thus, if X is continuous, with mean μ and standard deviation σ,
211)|(|k
kXP −≥<− σμ
for any positive number k. We illustrate the use of this result in the next example. Example 5.6: The weekly amount Y spent for chemicals by a certain firm has a mean of $1565 and a variance of $428. Within what interval should these weekly costs for chemicals be expected to lie in at least 75% of the time.
15
Solution: To find an interval guaranteed to contain at least 75% of the probability mass for Y, we specify
75.011 2 =−k
which yields
24
25.01
25.01
2
2
==
=
=
k
k
k
Thus, the interval μ - 2σ to μ + 2σ will contain at least 75% of the probability. This interval is given by
38.160662.1523
38.41156538.411565
4282156542821565
to
to
to
+−
+−
75% of the weekly chemical costs will be between $1523.62 and $1606.38. The expected value of the random variable X can be found using the distribution function without first finding the probability density function. That is, for any nonnegative continuous random variable with distribution function F(x) and finite mean E(X),
∫∞
−=0
)](1[)( dxxFXE .
This can be proven using integration by parts.
Exercises 5.13. The weekly repair cost, X, for a certain machine has a probability density function given by
6 (1 ), 0 1( )
0,x x x
f xotherwise
− ≤ ≤⎧= ⎨⎩
with measurements in $100s.

16
a. Find the mean and variance of the repair costs. b. Find an interval within which these weekly repair costs should lie at least 75% of the time. 5.14. The effectiveness of solar-energy heating units depends on the amount of radiation available form the sun. During a typical October, daily total solar radiation in Tampa, Florida, approximately follows the following probability density function (units are hundreds of calories).
3 ( 2)(6 ), 2 632( )0,
x x xf x
otherwise
⎧ − − ≤ ≤⎪= ⎨⎪⎩
Find the mean, variance and standard deviation of the daily total solar radiation in Tampa in October. 5.15. A firm has been monitoring its total daily telephone usage. The daily use of time conforms to the following probability density function (measured in hours).
23 (4 ), 0 4
64( )0,
x x xf x
otherwise
⎧ − ≤ ≤⎪= ⎨⎪⎩
a. Find the mean, variance, and standard deviation of the firm’s daily telephone usage. b. Find an interval in which the daily telephone usage should lie at least 90% of the time. 5.16. The pH level, a measure of acidity, is important in studies of acid rain. For a certain lake, baseline measurements of acidity are made so that any changes caused by acid rain can be noted. The pH for water samples from the lake is a random variable X, with probability density function
23 (7 ) , 5 7( ) 8
0,
x xf x
otherwise
⎧ − ≤ ≤⎪= ⎨⎪⎩
a. Find the mean, variance, and standard deviation of the pH of water in this lake. b. Find an interval shorter than (5, 7) within which at least ¾ of the pH measurements must lie. c. Would you expect to see a pH measurement of less than 5.5 very often? Why? d. Give an interval within which 80% of the pH measurements of the lake should lie. 5.17. The “on” temperature of a thermostatically controlled switch for an air conditioning system is set at 60o, but the actual temperature X at which the switch turns on is a random variable having the probability density function

17
⎪⎩
⎪⎨⎧ ≤≤=
otherwise
xxf,0
7371,21
)(
Find the mean and standard deviation of the temperature at which the switch turns on. 5.18. The proportion of time, during a 40-hour work week, that an industrial robot was in operation was measured for a large number of weeks. The measurements can be modeled by the probability density function
2 , 0 1
( )0,
x xf x
otherwise≤ ≤⎧
= ⎨⎩
Let X denotes the proportion of time this robot will be in operation during a coming week. a. Find E(X) and V(X). b. For the robot under study, the profit Y for a week is given by Y = 400X - 80. Find E(Y) and V(Y). c. Find an interval in which the profit should lie for at least 75% of the weeks that the robot is in use. 5.19. A retail grocer has a daily demand X for a certain food sold by the pound, such that, X (measured in hundreds of pounds) has a probability density function of
23 , 0 1
( )0,
x xf x
otherwise
⎧ ≤ ≤⎪= ⎨⎪⎩
The grocer, who cannot stock more than 100 pounds, wants to order 100k pounds of food on a certain day. He buys the food at 10 cents per pound and sells it at 15 cents per pound. What value of k will maximize his expected daily profit? (There is no salvage value for food not sold.) 5.20. The proportion of impurities by weight X in certain copper ore samples is a random variable having a probability density function of
212 (1 ), 0 1
( ) 0,x x x
f x otherwise⎧ − ≤ ≤⎪= ⎨⎪⎩
a. Find the mean and standard deviation of the proportion of impurities in these copper ore samples. b. The value Y of 100 pounds of copper ore is )1(200 XY −= dollars. Find the mean and standard deviation of the value of 100 pounds of copper from this sample. 5.21. The distribution function of the random variable X, the time (in years) from the time a machine is serviced until it breaks down is as follows:
18
0,1)( 4 >−= − xexF x
Find the mean time until the machine breaks down after service. 5.22. Jerry is always early for appointments, arriving between 10 minutes early to exactly on time. The distribution function associated with X, the number of minutes early he arrives, is as follows:
⎪⎪⎪
⎩
⎪⎪⎪
⎨
⎧
>
≤≤−−
≤≤
<
=
01,1
104,60
4020
40,40
0,0
)(2
2
x
xxx
xxx
xF
Find the mean number of minutes Jerry is early for appointments. 5.3 The Uniform Distribution 5.3.1 Probability Density Function We now move from a general discussion of continuous random variables to discussions of specific models that have been found useful in practice. Consider an experiment that consists of observing events in a certain time frame, such as buses arriving at a bus stop or telephone calls coming into a switchboard during a specified period. Suppose that we know that one such event has occurred in the time interval ),( ba : a bus arrived between 8:00 and 8:10. It may then be of interest to place a probability distribution on the actual time of occurrence of the event under observation, which we will denote by X. A very simple model assumes that X is equally likely to lie in any small subinterval—say, of length d—no matter where that subinterval lies within ),( ba . This assumption leads to the uniform probability distribution, which has the probability density function given by
⎪⎩
⎪⎨⎧ ≤≤
−=elsewhere
bxaabxf
,0
,1)(
This density function is graphed in Figure 5.4.
19
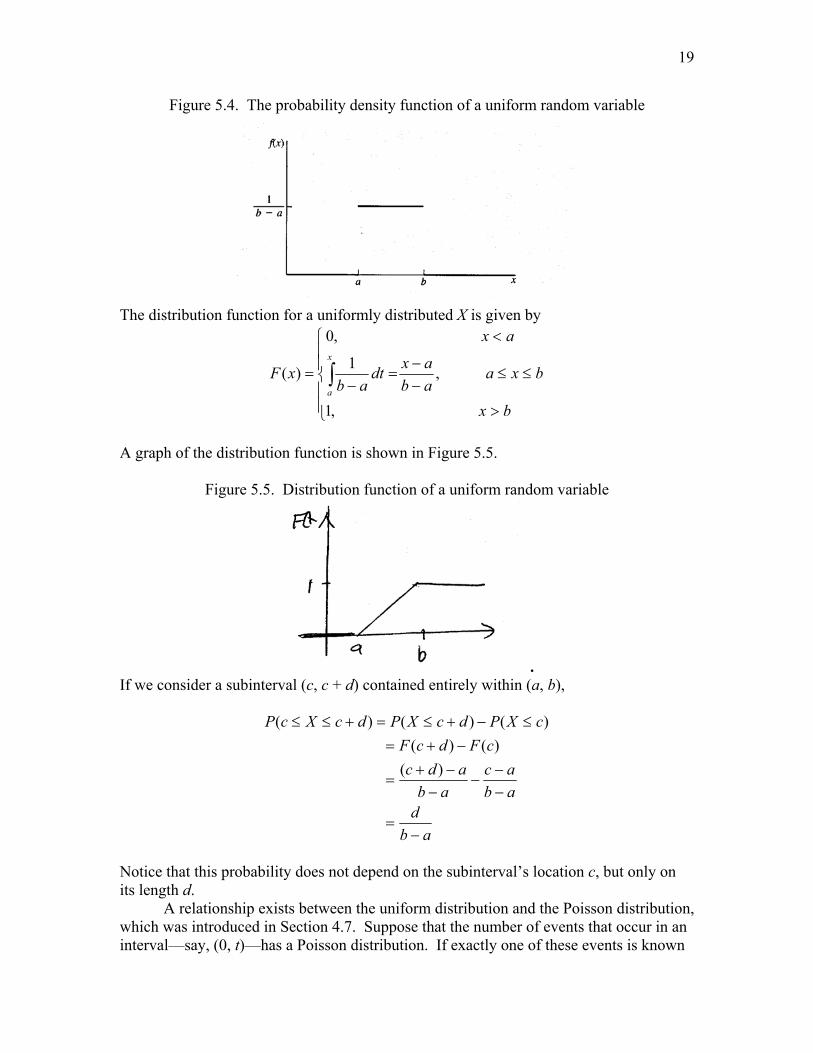
Figure 5.4. The probability density function of a uniform random variable
The distribution function for a uniformly distributed X is given by
⎪⎪⎩
⎪⎪⎨
⎧
>
≤≤−−
=−
<
= ∫bx
bxaabaxdt
ab
ax
xFx
a
,1
,1
,0
)(
A graph of the distribution function is shown in Figure 5.5.
Figure 5.5. Distribution function of a uniform random variable
. If we consider a subinterval (c, c + d) contained entirely within (a, b),
abd
abac
abadc
cFdcFcXPdcXPdcXcP
−=
−−
−−
−+=
−+=≤−+≤=+≤≤
)()()(
)()()(
Notice that this probability does not depend on the subinterval’s location c, but only on its length d. A relationship exists between the uniform distribution and the Poisson distribution, which was introduced in Section 4.7. Suppose that the number of events that occur in an interval—say, (0, t)—has a Poisson distribution. If exactly one of these events is known
20
to have occurred in the interval ),( ba with 0≥a and b ≤ t, then the conditional probability distribution of the actual time of occurrence for this event (given that it has occurred) is uniform over ),( ba . 5.3.2 Mean and Variance Paralleling our approach in Chapter 4, we now look at the mean and the variance of the uniform distribution. From Definition 5.3,
2
21
1
)()(
22
ba
abab
dxab
x
dxxxfXE
b
a
+=
⎟⎟⎠
⎞⎜⎜⎝
⎛ −⎟⎠⎞
⎜⎝⎛
−=
⎟⎠⎞
⎜⎝⎛
−=
=
∫
∫∞
∞−
This result is an intuitive one. Because the probability density function is constant over the interval, the mean value of a uniformly distribution random variable should lie at the midpoint of the interval. Recall from Theorem 4.2 that [ ] ( ) 222)()( μμ −=−= XEXEXV , we have, in the uniform case,
( )
3
31
1
)(
22
33
2
22
aabb
abab
dxab
x
dxxfxXE
b
a
++=
⎟⎟⎠
⎞⎜⎜⎝
⎛ −⎟⎠⎞
⎜⎝⎛
−=
⎟⎠⎞
⎜⎝⎛
−=
=
∫
∫∞
∞−
Then,
( )[ ]2
222
222
)(121
)(34121
23)(
ab
baaabb
baaabbXV
−=
+−++=
⎟⎠⎞
⎜⎝⎛ +
−++
=

21
This result may not be intuitive, but we see that the variance depends only on the length of the interval ),( ba . Example 5.7: A farmer living in western Nebraska has an irrigation system to provide water for crop, primarily corn, on a large farm. Although he has thought about buying a back-up pump, he has not done so. If the pump fails, delivery time X for a new pump to arrive is uniformly distributed over the interval from one to four days. The pump fails. It is a critical time in the growing season in that the yield will be greatly reduced if the crop is not watered within the next 3 days. Assuming the pump is ordered immediately and installation time is negligible, what is the probability the farmer will suffer major yield loss? Solution: Let T be the time until the pump is delivered. T is uniformly distributed over the interval (1, 4). The probability of major loss is the probability that the time until delivery exceeds three days. Thus,
4
3
1 1( 3)3 3
P T dt> = =∫
Notice that the bounds of integration go from 3 to 4. The upper bound is 4 because the probability density function is zero for all values outside the interval [1, 4]. Section 5.3.3. History and Applications The term “uniform distribution” appears in 1937 in Introduction to Mathematical Probability by J. V. Uspensky. On page 237 of this text, it is noted that "A stochastic variable is said to have uniform distribution of probability if probabilities attached to two equal intervals are equal." In practice, the distribution is generally used when every point in an interval is equally likely to occur or at least insufficient knowledge to propose another model.
We now review the properties of the uniform distribution
The Uniform Distribution
⎪⎩
⎪⎨⎧ ≤≤
−=elsewhere
bxaabxf
,0
,1)(
2)( baXE += and
12)()(
2abXV −=
22
Exercises 5.23. Suppose X has a uniform distribution over the interval ),( ba . a. Derive F(x). b. Find P(X > c) for some point c between a and b. c. If bdca ≤≤≤ , find P(X > d|X > c). 5.24. Henry is to be at Megan’s apartment at 6:30. From past experience, Megan knows that Henry will be up to 20 minutes late (never early) and that he is equally likely to arrive any time up to 20 minutes after the scheduled arrival time. a. What is the probability that Henry will be more than 15 minutes late? b. What is the mean and standard deviation of the amount of time that Megan waits for Henry? 5.25. The space shuttle has a two-hour window during which it can launch for an upcoming mission. Although efforts are made to launch at the start of the window, launch time is uniformly distributed in the launch window. Find the probability that the launch will occur as follows a. During the first 30 minutes of the launch window b. During the last 10 minutes of the launch window c. Within 10 minutes of the center of the launch window 5.26. If a point is randomly located in an interval ),( ba , and if X denotes the distance of the point from a , then X is assumed to have a uniform distribution over ),( ba . A plant efficiency expert randomly picks a spot along a 500-foot assembly line from which to observe work habits. Find the probability that the point she selects is located as follows. a. Within 25 feet of the end of the line b. Within 25 feet of the beginning of the line c. Closer to the beginning of the line than to the end of the line. 5.27. A bomb is to be dropped along a 1-mile-long line that stretches across a practice target zone. The target zone’s center is at the midpoint of the line. The target will be destroyed if the bomb falls within 0.1 mile on either side of the center. Find the probability that the target will be destroyed, given that the bomb falls at a random location along the line. 5.28. The number of defective DVD players among those produced by a large manufacturing firm follows a Poisson distribution. For a particular 8-hour day, one defective player is found. a. Find the probability that it was produced during the first hour of operation for that day. b. Find the probability that it was produced during the last hour of operation for that day. c. Given that no defective players were seen during the first four hours of operation, find the probability that the defective player was produced during the fifth hour.

23
5.29. A volcanist (one who studies volcanoes) has been observing a certain volcano for a long time. He knows that an eruption imminent and is equally likely to occur any time in the next 24 hours. a. What is the probability that the volcano will not erupt for at least 15 hours? b. Find a time such that there is only a 10% chance that the volcano would not have erupted by that time? 5.30. In determining the range of an acoustic source by triangulation, one must accurately measure the time at which the spherical wave front arrives at a receiving sensor. According to Perruzzi and Hilliard (1984), errors in measuring these arrival times can be modeled as having uniform distributions. Suppose that measurement errors are uniformly distribution from -0.04 to +0.05 microseconds. a. Find the probability that a particular arrival time measurement will be in error by less than 0.01 microsecond. b. Find the mean and the variance of these measurement errors. 5.31. In the setting of Exercise 5.30, suppose that the measurement errors are distributed uniformly from -0 02 to +0.05 microseconds. a. Find the probability that a particular arrival time measurement will be in error by less than 0.01 microsecond. b. Find the mean and the variance of the measurement errors. 5.32. According to Y. Zimmels (1983), the sizes of particles used in sedimentation experiments often have uniform distributions. It is important to study both the mean and the variance of particle sizes because, in sedimentation with mixtures of various-size particles, the larger particles hinder the movements of the smaller particles. Suppose that spherical particles have diameters uniformly distributed between 0.01 and 0.05 centimeters. Find the mean and the variance of the volumes of these particles. (Recall that the volume of a sphere is (4/3)πr3.) 5.33. Arrivals of customers at a bank follow a Poisson distribution. During a given 30-minute period, one customer arrives at a bank. a. Find the probability that he arrives during the first 5 minutes of the period. b. Find the probability that he arrives during the last 5 minutes of the period. c. Find the probability that he arrives during the last 5 minutes of the period given that he did not arrive during the first 15 minutes. 5.34. In ecology, the broken stick model is sometimes used to describe the allocation of environmental resources among species. For two species, assume that one species is assigned one end of the stick; the other end represents the resources for the other species. A point is randomly selected along a stick of unit length. The stick is broken at the selected point, and each species receives the proportion of the environmental resources equal to the proportion of the stick it receives. For this model, find the probability of the following events. a. The two species have equal proportions of resources b. One species gets at least twice as much resource as the other species
24
c. If each species is known to have received at least 10% of the resources, what is the probability that one received at least twice as much as the other species. 5.35. In tests of stopping distance for automobiles, cars traveling 30 miles per hour before the brakes were applied tended to travel distances that appeared to be uniformly distributed between two points a and b. Find the probabilities of the following events. a. One of these automobiles, selected at random, stops closer to a than to b. b. One of these automobiles, selected at random, stops at a point where the distance to a is more than three times the distance to b. c. Suppose that three automobiles are used in the test. Find the probability that exactly one of the three travels past the midpoint between a and b. 5.36. The cycle time for trucks hauling concrete to a highway construction site is uniformly distributed over the interval from 50 to 70 minutes. a. Find the expected value and the variance for these cycle times. b. How many trucks should you expect to have to schedule for this job so that a truckload of concrete can be dumped at the site every 15 minutes. 5.4 The Exponential Distribution 5.4.1 Probability Density Function The life-length data of Section 5.1 displayed a nonuniform probabilistic behavior; the probability over intervals of constant length decreased as the intervals moved farther to the right. We saw that an exponential curve seemed to fit these data rather well, and we now discuss the exponential probability distribution in more detail. In general, the exponential density function is given by
⎪⎩
⎪⎨⎧ ≥
=−
elsewhere
xforexf
x
,0
0,1)(
/θ
θ
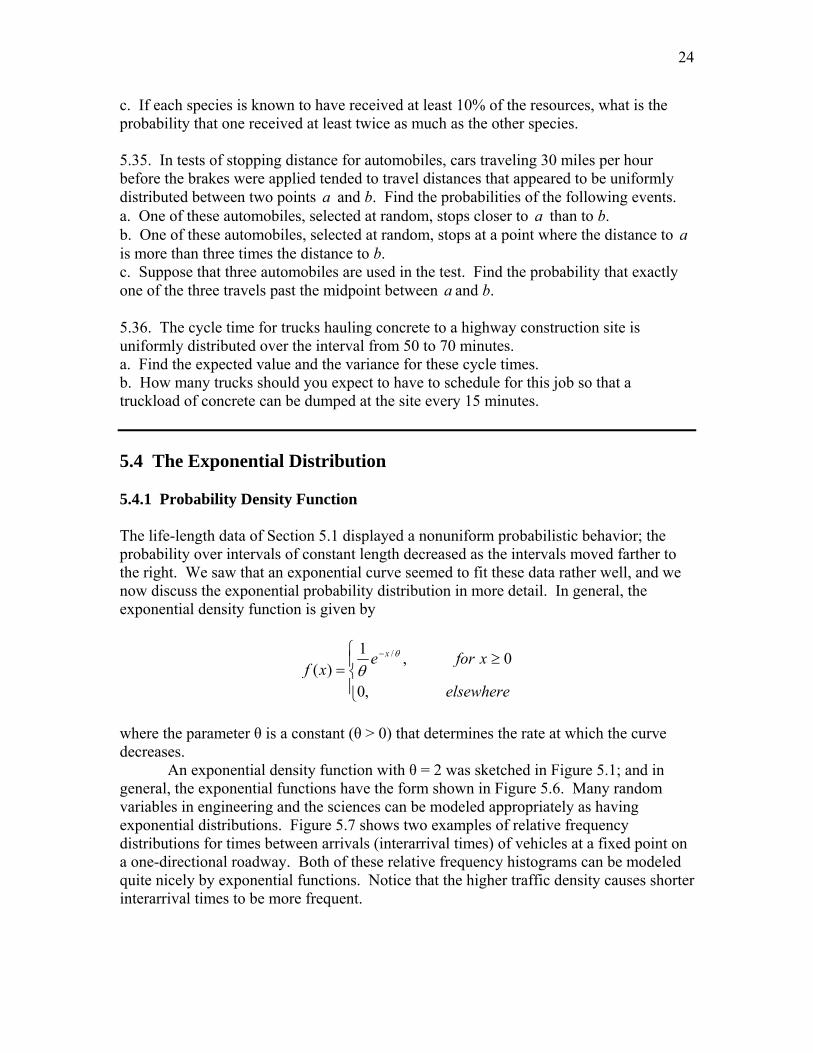
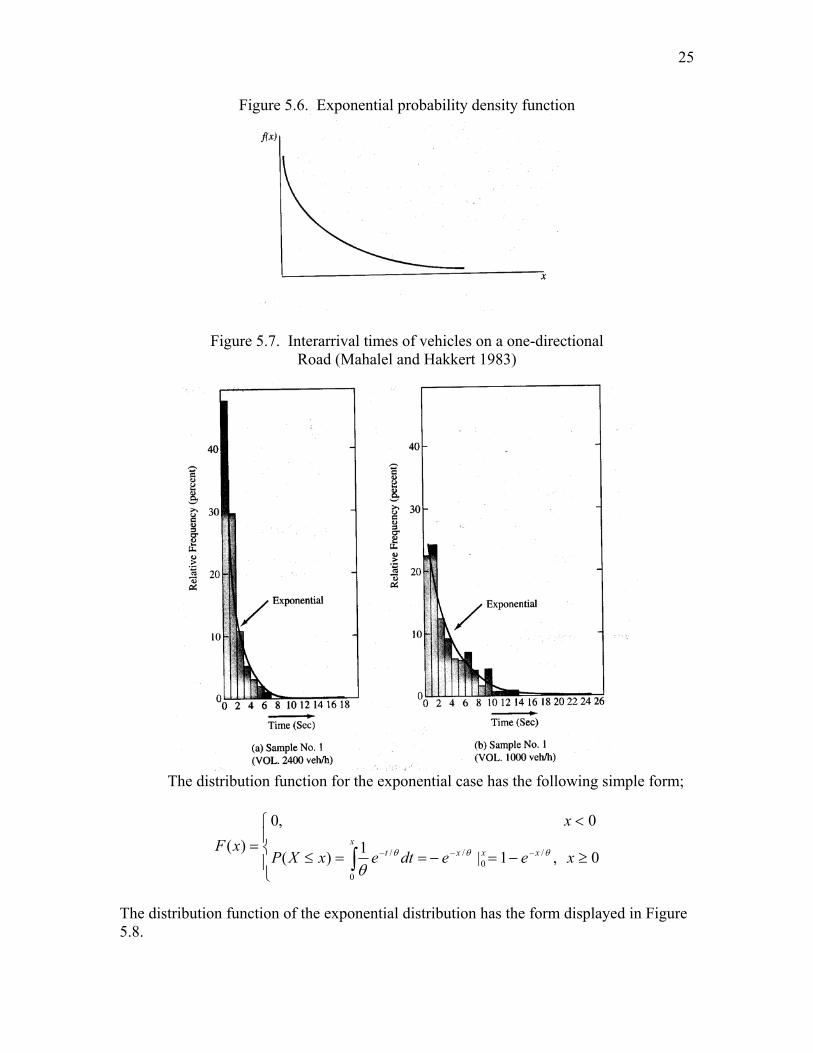
where the parameter θ is a constant (θ > 0) that determines the rate at which the curve decreases. An exponential density function with θ = 2 was sketched in Figure 5.1; and in general, the exponential functions have the form shown in Figure 5.6. Many random variables in engineering and the sciences can be modeled appropriately as having exponential distributions. Figure 5.7 shows two examples of relative frequency distributions for times between arrivals (interarrival times) of vehicles at a fixed point on a one-directional roadway. Both of these relative frequency histograms can be modeled quite nicely by exponential functions. Notice that the higher traffic density causes shorter interarrival times to be more frequent.
25
Figure 5.6. Exponential probability density function
Figure 5.7. Interarrival times of vehicles on a one-directional Road (Mahalel and Hakkert 1983)
The distribution function for the exponential case has the following simple form;
⎪⎩
⎪⎨
⎧
≥−=−==≤
<
= −−−∫ 0,1|1)(
0,0)( /
0/
0
/ xeedtexXP
xxF xxx
xt θθθ
θ
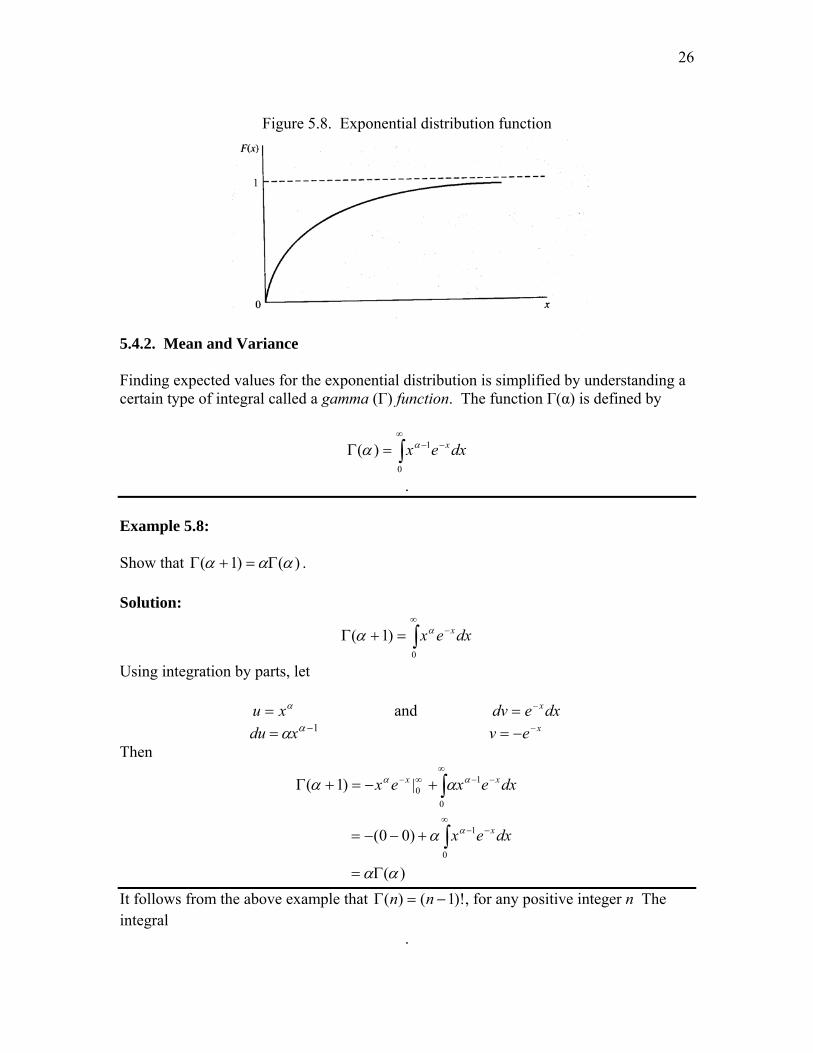
The distribution function of the exponential distribution has the form displayed in Figure 5.8.
26
Figure 5.8. Exponential distribution function
5.4.2. Mean and Variance Finding expected values for the exponential distribution is simplified by understanding a certain type of integral called a gamma (Γ) function. The function Γ(α) is defined by
∫∞
−−=Γ0
1)( dxex xαα
. Example 5.8: Show that )()1( ααα Γ=+Γ . Solution:
∫∞
−=+Γ0
)1( dxex xαα
Using integration by parts, let
αxu = and dxedv x−= 1−= ααxdu xev −−=
Then
)(
)00(
|)1(
0
1
0
10
αα
α
αα
α
αα
Γ=
+−−=
+−=+Γ
∫
∫∞
−−
∞−−∞−
dxex
dxexex
x
xx
It follows from the above example that )!1()( −=Γ nn , for any positive integer n The integral
.
27
,0
/1∫∞
−− dxex x βα
for positive constants α and β, can be evaluated by making the transformation β/xy = , or yx β= , where dydx β= We have then
∫∫∞
−−∞
−− Γ==0
1
0
1 )()( αβββ αααβα dyeydyey yy
It is left as an exercise to show that π=Γ )2/1( . Using the properties of the gamma function, we see that, for the exponential distribution,
θ
θθ
θ
θ
θ
θ
=
Γ=
=
⎟⎠⎞
⎜⎝⎛=
=
∫
∫
∫
∞−
∞−
∞
∞−
2
0
/
0
/
)2(1
1
1
)()(
dxxe
dxex
dxxxfXE
x
x
Thus, the parameter θ actually is the mean of the distribution. To evaluate the variance of the exponential distribution, we start by finding
2
3
0
/2
0
/2
22
2
)3(1
1
1
)()(
θ
θθ
θ
θ
θ
θ
=
Γ=
=
⎟⎠⎞
⎜⎝⎛=
=
∫
∫
∫
∞−
∞−
∞
∞−
dxex
dxex
dxxfxXE
x
x
It follows that

28
( )
2
22
22
2)(
θ
θθ
μ
=
−=
−= XEXV
and θ becomes the standard deviation as well as the mean. Example 5.9: A sugar refinery has three processing plants, all of which receive raw sugar in bulk. The amount of sugar that one plant can process in one day can be modeled as having an exponential distribution with a mean of 4 tons for each of the three plants. If the plants operate independently, find the probability that exactly two of the three plants will process more than 4 tons on a given day. Solution: The probability that any given plant will process more than 4 tons on a given day, with X denoting the amount used, is
37.0
|
41
)()4(
14
4/4
4/
4
==
−=
=
=>
−
∞−
∞−
∞
∫
∫
ee
dxe
dxxfXP
x
x
Note: P(X > 4) ≠ 0.5, even though the mean of X is 4. The median is less than the mean indicating the distribution is skewed.
Knowledge of the distribution function would allow us to evaluate this immediately as
( )37.0
11)4(1)4(
1
4/4
==
−−=
≤−=>
−
−
ee
XPXP
Assuming that the three plants operate independently the problem is to find the probability of two successes out of three tries, where the probability of success is 0.37. This is a binomial problem, and the solution is
29
26.0)63.0()37.0(3
)63.0()37.0(23
)4(
2
2
==
⎟⎟⎠
⎞⎜⎜⎝
⎛=tonsthanmoreuseplantstwoExactlyP
Example 5.10: Consider a particular plant in Example 5.9. How much raw sugar should be stocked for that plant each day so that the chance of running out of product is only 0.05? Solution: Let a denote the amount to be stocked. Since the amount to be used X has an exponential distribution
∫∞
−− ==>a
ax edxeaXP 4/4/
41)(
We want to choose a so that
05.0)( 4/ ==> −aeaXP
and solving this equation yields 98.11=a
5.4.3. Properties Recall that, in Section 4.5, we learned that the geometric distribution is the discrete distribution with the memoryless property. The exponential distribution is the continuous distribution with the memoryless property. To verify this, suppose that X has an exponential distribution with parameter θ. Then,
30
( )( )
)()(1
1(111
)(1)(1)(
)()(
)]()[()|(
/
/
/)(
bXPbF
ee
eaF
baFaXP
baXPaXP
aXbaXPaXbaXP
b
a
ba
>=−=
=
−−−−
=
−+−
=
>+>
=
>>∩+>
=>+>
−
−
+−
θ
θ
θ
This memoryless property sometimes causes concerns about the exponential distribution’s usefulness as a model. As an illustration, the length of time a light bulb burns may be modeled with an exponential distribution. The memoryless property implies that, if a bulb has burned for 1000 hours, the probability it will burn at least 1000 more hours is the same as the probability that the bulb would burn more than 1000 hours when new. This failure to account for the deterioration of the bulb over time is the property that causes one to question the appropriateness of the exponential model for life-time data though it is still used often. A relationship also exists between the exponential distribution and the Poisson distribution. Suppose that events are occurring in time according to a Poisson distribution with a rate of λ events per hour. Thus, in t hours, the number of events—say, Y—will have a Poisson distribution with mean value λt. Suppose that we start at time zero and ask the question, How long do I have to wait to see the first event occur? Let X denote the length of time until this first event. Then,
t
t
e
et
tervaltheonYPtXP
λ
λλ
−
−
=
=
==>
!0)(
)],0(int0[)(0
and tetXPtXP λ−−=>−=≤ 1)(1)(
We see that )()( tFtXP =≤ , the distribution function for X, has the form of an exponential distribution function, with ( )θλ /1= . Upon differentiating, we see that the probability density function of X is given by
31
( )
0,1
1
)()(
/ >=
=
−=
=
−
−
−
te
edt
eddt
tdFtf
t
t
t
θ
λ
λ
θ
λ
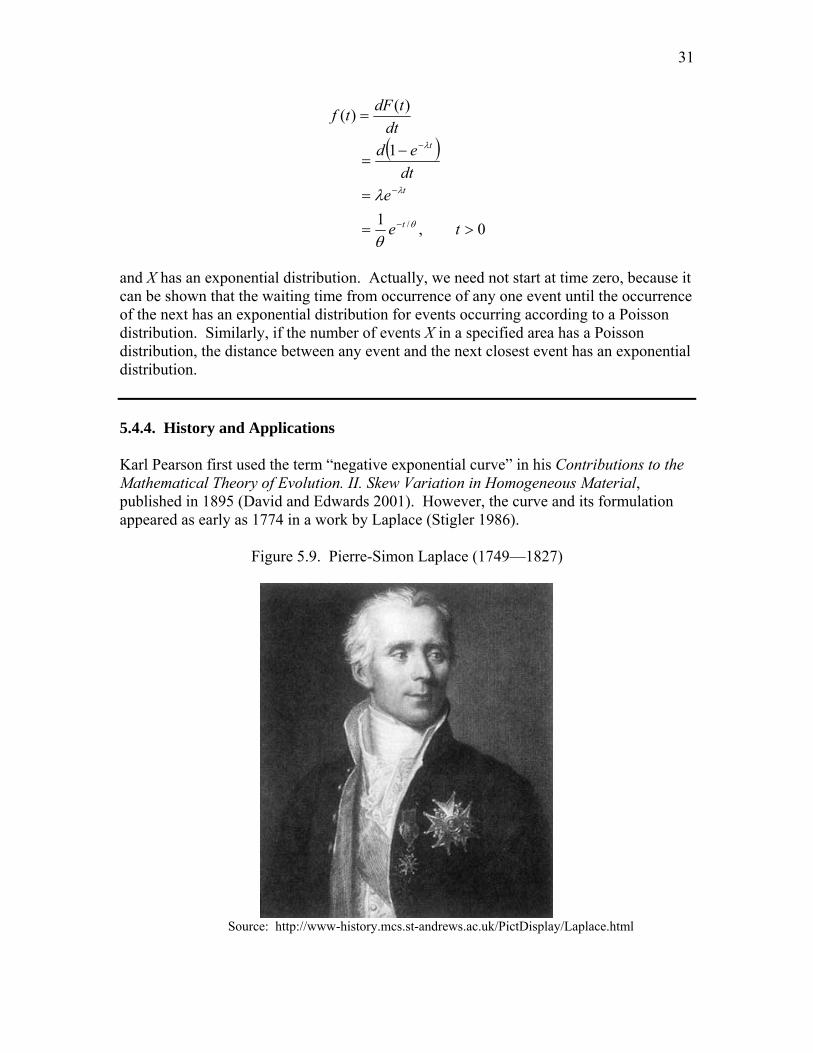
and X has an exponential distribution. Actually, we need not start at time zero, because it can be shown that the waiting time from occurrence of any one event until the occurrence of the next has an exponential distribution for events occurring according to a Poisson distribution. Similarly, if the number of events X in a specified area has a Poisson distribution, the distance between any event and the next closest event has an exponential distribution. 5.4.4. History and Applications Karl Pearson first used the term “negative exponential curve” in his Contributions to the Mathematical Theory of Evolution. II. Skew Variation in Homogeneous Material, published in 1895 (David and Edwards 2001). However, the curve and its formulation appeared as early as 1774 in a work by Laplace (Stigler 1986).
Figure 5.9. Pierre-Simon Laplace (1749—1827)
Source: http://www-history.mcs.st-andrews.ac.uk/PictDisplay/Laplace.html

32
The primary application of the exponential distribution has been to model the distance , whether in time or space, between events in a Poisson process. Thus the time between the emissions of radioactive particles, the time between telephone calls, the time between equipment failures, the distance between defects of a copper wire, the distance between soil insects are just some of the many types of data that have been modeled using the exponential distribution.
Exercises 5.37. The magnitudes of earthquakes recorded in a region of North America can be modeled by an exponential distribution with a mean of 2.4, as measured on the Richter scale. Find the probabilities that the next earthquake to strike this region will have the following characteristics. a. It will be no more than 2.5 on the Richter scale. b. It will exceed 4.0 on the Richter scale. c. It will fall between 2.0 and 3.0 on the Richter scale. 5.38. Referring to Exercise 5.37, find the probability that, of the next ten earthquakes to strike the region, at least one will exceed 5.0 on the Richter scale. 5.39. Referring to Exercise 5.37, find the following a. The variance and standard deviation of the magnitudes of earthquakes for this region b. The magnitude of earthquakes that we can assured that no more than 10% of the earthquakes will have larger magnitudes on the Richter scale. 5.40. A pumping station operator observes that the demand for water at a certain hour of the day can be modeled as an exponential random variable with a mean of 100 cfs (cubic feet per second). a. Find the probability that the demand will exceed 200 cfs on a randomly selected day. b. What is the maximum water producing capacity that the station should keep on line for this hour so that the demand will have a probability of only 0.01 of exceeding this production capacity? 5.41. Suppose the customers arrive at a certain convenience store checkout counter at a rate of one per minute. a. Find the mean and the variance of the waiting time between successive customer arrivals.
The Exponential Distribution
⎪⎩
⎪⎨⎧ ≥
=−
elsewhere
xforexf
x
,0
0,1)(
/θ
θ
θ=)(XE and 2)( θ=XV
33
b. If a clerk takes 3 minutes to serve the first customer arriving at the counter, what is the probability that at least one more customer will be waiting when the service provided to the first customer is completed? 5.42. The length of time X required to complete a certain key task in house construction is an exponentially distributed random variable, with a mean of 10 hours. The cost C of completing this task is related to the square of the time required for completion by the formula
C = 100 + 40X + 3X2 a. Find the expected value and the variance of C. b. Would you expect C to exceed 2000 very often? Justify your response. 5.43. In a particular forest, the distance between any randomly selected tree and the tree nearest to it is exponentially distributed with a mean of 40 feet. a. Find the probability that the distance from a randomly selected tree to the tree nearest to it is more than 30 feet? b. Find the probability that the distance from a randomly selected tree to the tree nearest to it is more than 80 feet given that the distance is at least 50 feet? c. Find the minimum distance that separates at least 50% of the trees from their nearest neighbor. 5.44. A roll of copper wire has flaws that occur according to a Poisson process with a rate of 1.5 flaws per meter. Find the following. a. The mean and variance of the distance between successive flaws on the wire. b. The probability that the distance between a randomly selected flaw and the next flaw is at least a meter c. The probability that the distance between a randomly selected flaw and the next flaw is no more than 0.2 meters. d. The probability that the distance between a randomly selected flaw and the next flaw is between 0.5 and 1.5 meters. 5.45. The number of hurricanes coming within 250 miles of Honolulu has been modeled according to a Poisson process with a mean of 0.45 per year (http://www.math.hawaii.edu/~ramsey/Hurricane.html). Find the following: a. The mean and variance of the time between successive hurricanes b. Given that a hurricane has just occurred, what is the probability that it will be less than 3 months until the next hurricane. c. Given that a hurricane has just occurred, what is the probability that it will be at least a year until the next hurricane will be observed within 250 miles of Honolulu. d. Suppose the last hurricane was six months ago. What is the probability that it will be at least another 6 months before the next hurricane comes within 250 miles of Honolulu? 5.46. The inter-accident times (times between accidents) for all fatal accidents on scheduled American domestic passenger airplane flights for the period 1948 to 1961 were

34
found to follow an exponential distribution, with a mean of approximately 44 days (Pyke 1965). a. If one of those accidents occurred on July 1, find the probability that another one occurred in that same (31-day) month. b. Find the variance of the interaccident times. c. What does this information suggest about the clumping of airline accidents? 5.47. Under average driving conditions, the life lengths of automobile tires of a certain brand are found to follow an exponential distribution, with a mean of 30,000 miles. Find the probability that one of these tires, bought today, will last the following numbers of miles. a. Over 30,000 miles b. Over 30,000 miles, given that it already has gone 15,000 miles 5.48. The breakdowns of an industrial robot follow a Poisson distribution, with an average of 0.5 breadkdowns per 8-hour workday. If this robot is placed in service at the beginning of the day, find the probabilities of the following events. a. It will not break down during the day b. It will work for at least 4 hours without breaking down c. Does what happened the day before have any effect on you answers? Justify your answer. 5.49. Air samples from a large city are found to have 1-hour carbon monoxide concentration that are well modeled by an exponential distribution, with a mean of 3.6 ppm (Zammers 1984, p. 637). a. Find the probability that a concentration will exceed 9 parts per million (ppm) b. A traffic control strategy reduced the mean to 2.5 ppm. Now find the probability that a concentration will exceed 9 ppm. 5.50. The weekly rainfall totals for a section of the Midwestern United States follow an exponential distribution, with a mean of 1.6 inches. a. Find the probability that a randomly chosen weekly rainfall total in this section will exceed 2 inches. b. Find the probability that the weekly rainfall totals will not exceed 2 inches in either of the next two weeks. 5.51. Chu (2003) used the exponential distribution to model the time between goals during the 90-minutes of regulation play in World Cup soccer games from 1990 to 2002. The mean time until the first goal was 33.7 minutes. Assuming that the average time between goals is 33.7 minutes, find the following probabilities of the following events. a. The time between goals is less than 10 minutes. b. The time between goals is at least 45 minutes c. The time between goals is between 5 and 20 minutes 5.52. Referring to Exercise 5.51, again assume that the time between soccer goals is exponentially distributed with a mean of 33.7 minutes. Suppose that four random

35
selections of the times between consecutive goals are made. Find the probabilities of the following events. a. All four times are less than 30 minutes b. At least one of the four times is more than 45 minutes 5.53. The service times at teller windows in a bank were found to follow an exponential distribution with a mean of 3.4 minutes. A customer arrives at a window at 4:00 p.m. a. Find the probability that he will still be there at 4:02 p.m. b. Find the probability that he will still be there at 4:04 p.m. given that he was there at 4:02. 5.54. In deciding how many customer service representatives to hire and in planning their schedules, a firm that markets lawnmowers studies repair times for the machines. One such study revealed that repair times have an approximately exponential distribution, with a mean of 36 minutes. a. Find the probability that a randomly selected repair time will be less than 10 minutes. b. The charge for lawnmower repairs is $60 for each half hour (or part thereof) for labor. What is the probability that a repair job will result in a charge for labor of $120. c. In planning schedules, how much time should the firm allow for each repair to ensure the chance of any one repair time’s exceeding this allowed time is only 0.01? 5.55. Explosive devices used in a mining operation cause nearly circular craters to form in a rocky surface. The radii of these craters are exponentially distributed, with a mean of 10 feet. Find the mean and the variance of the area covered by such a crater. 5.56 The function ( )uΓ is defined by
( ) 1
0
u yu y e dy∞
− −Γ = ∫
Integrate by parts to show that
( ) ( 1) ( 1)u u uΓ = − Γ −
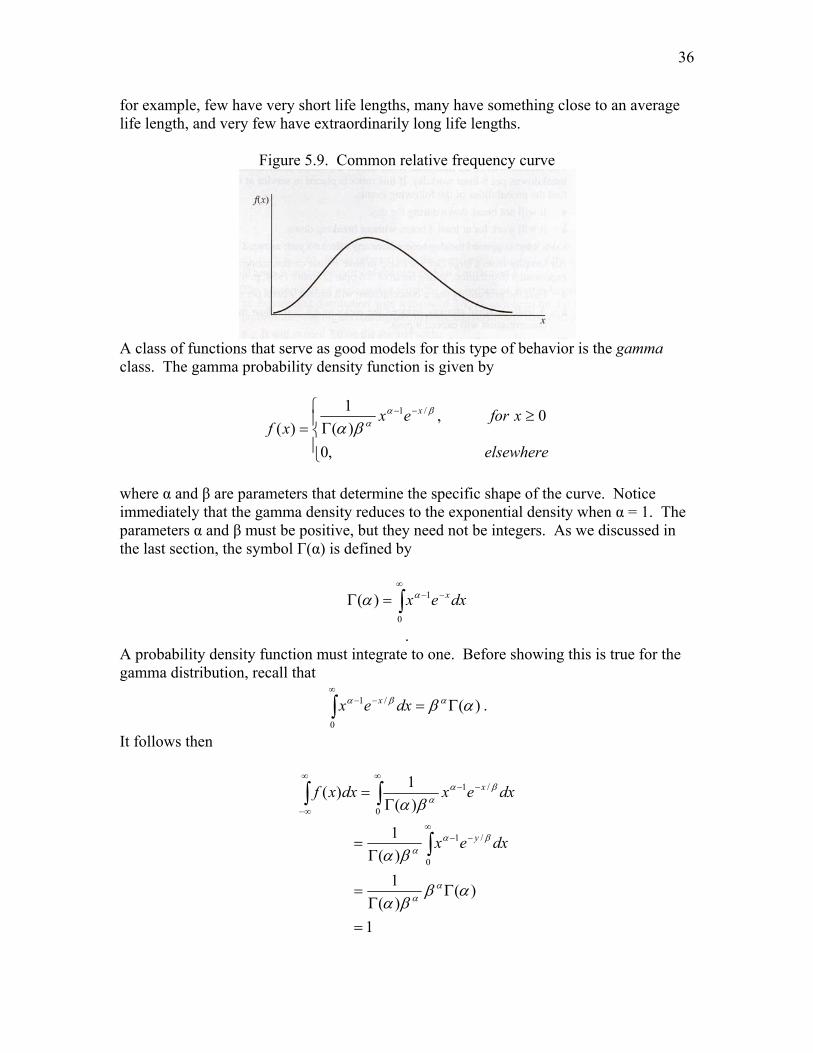
Hence, if n is a positive integer, then ( ) ( 1)!n nΓ = − 5.5. The Gamma Distribution 5.5.1. Probability Density Function Many sets of data, of course, do not have relative frequency curves with the smooth decreasing trend found in the exponential model. It is perhaps more common to see distributions that have low probabilities for intervals close to zero, with the probability increasing for a while as the interval moves to the right (in the positive direction) and then decreasing as the interval moves out even further; that is, the relative frequency curves follow the pattern graphed as in Figure 5.9. In the case of electronic components,
36
for example, few have very short life lengths, many have something close to an average life length, and very few have extraordinarily long life lengths.
Figure 5.9. Common relative frequency curve
A class of functions that serve as good models for this type of behavior is the gamma class. The gamma probability density function is given by
⎪⎩
⎪⎨
⎧ ≥Γ=
−−
elsewhere
xforexxf
x
,0
0,)(
1)(
/1 βααβα
where α and β are parameters that determine the specific shape of the curve. Notice immediately that the gamma density reduces to the exponential density when α = 1. The parameters α and β must be positive, but they need not be integers. As we discussed in the last section, the symbol Γ(α) is defined by
∫∞
−−=Γ0
1)( dxex xαα
. A probability density function must integrate to one. Before showing this is true for the gamma distribution, recall that
)(0
/1 αβ αβα Γ=∫∞
−− dxex x .
It follows then
1
)()(
1)(
1
)(1)(
0
/1
0
/1
=
ΓΓ
=
Γ=
Γ=
∫
∫∫∞
−−
∞−−
∞
∞−
αββα
βα
βα
αα
βαα
βαα
dxex
dxexdxxf
y
x
37
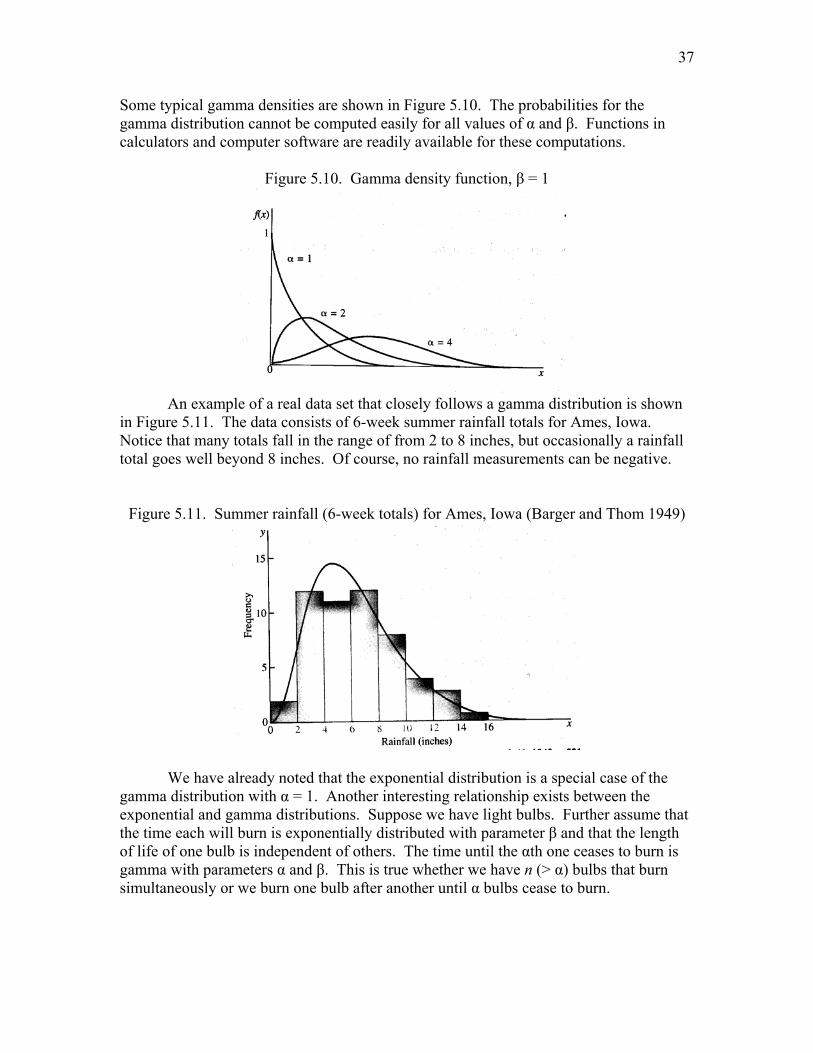
Some typical gamma densities are shown in Figure 5.10. The probabilities for the gamma distribution cannot be computed easily for all values of α and β. Functions in calculators and computer software are readily available for these computations.
Figure 5.10. Gamma density function, β = 1
An example of a real data set that closely follows a gamma distribution is shown in Figure 5.11. The data consists of 6-week summer rainfall totals for Ames, Iowa. Notice that many totals fall in the range of from 2 to 8 inches, but occasionally a rainfall total goes well beyond 8 inches. Of course, no rainfall measurements can be negative.
Figure 5.11. Summer rainfall (6-week totals) for Ames, Iowa (Barger and Thom 1949)
We have already noted that the exponential distribution is a special case of the gamma distribution with α = 1. Another interesting relationship exists between the exponential and gamma distributions. Suppose we have light bulbs. Further assume that the time each will burn is exponentially distributed with parameter β and that the length of life of one bulb is independent of others. The time until the αth one ceases to burn is gamma with parameters α and β. This is true whether we have n (> α) bulbs that burn simultaneously or we burn one bulb after another until α bulbs cease to burn.
38
5.5.2. Mean and Variance As might be anticipated because of the relationship of the exponential and gamma distributions, the derivations of expectations here is very similar to the exponential case of Section 5.4. We have
αβ
βαβα
βα
βα
αα
βαα
βαα
=
+ΓΓ
=
Γ=
Γ=
=
+
∞−
∞−−
∞
∞−
∫
∫
∫
1
0
/
0
/1
)1()(
1)(
1
)(1
)()(
dxex
dxexx
dxxxfXE
x
x
Similar manipulations yield ( ) 22 )1( βαα +=XE ; and hence,
( )
2
222
22
)1()(
αβ
βαβαα
μ
=
−+=
−= XEXV
A simple and often-used property of sums of identically distributed, independent gamma random variables will be stated, but not proved, at this point. Suppose that X1,X2, …, Xn represent independent gamma random variables with parameters α and β, as just used. If
∑=
=n
iiXY
1
Then Y also has a gamma distribution with parameters nα and β. Thus, one can immediately see that
αβnYE =)( and
2)( αβnYE =
Example 5.11: A certain electronic system has a life length of X1, which has an exponential distribution with a mean of 450 hours. The system is supported by an identical backup system that has a life length of X2. The backup system takes over immediately when the system fails.
39
If the systems operate independently, find the probability distribution and expected value for the total life length of the primary and backup systems. Solution: Letting Y denote the total life length, we have Y = X1 + X2, where X1 and X2 are independent exponential random variables, each with a mean β = 450. By the results stated earlier, Y has a gamma distribution with α = 2 and β = 450; that is
⎪⎩
⎪⎨⎧ >Γ=
−
elsewhere
yyeyfy
Y,0
0,)450)(2(
1)(
450/2
The mean value is given by 900)450(2)( ===αβYE
which is intuitively reasonable. Example 5.12: Suppose that the length of time Y needed to conduct a periodic maintenance check on a pathology lab’s microscope (known from previous experience) follows a gamma distribution with α = 3 and β = 2 (minutes). Suppose that a new repair person requires 20 minutes to check a particular microscope. Does this time required to perform a maintenance check seem out-of-line with prior experience? Solution: The mean and the variance for the length of maintenance time (prior experience) are
μ = αβ and σ2 = αβ2
Then, for our example,
446.312
12)2)(3(6)2)(3(222
==
===
===
σ
αβσ
αβμ
and the observed deviation (Y – μ) is 20 – 6 =14 minutes. For our example, y = 20 minutes exceeds the mean μ = 6 by k = 14/3.46 standard deviations. Then, from Tchebysheff’s Theorem,
2
1(| | )P Y kk
μ σ− ≥ ≤
or
06.0)14()46.3(1)14|6(| 2
2
2 ==≤≥−k
YP
40
Notice that this probability is based on the assumption that the distribution of maintenance times has not changed from prior experience. Then, observing that P(Y ≥ 20 minutes) is small, we must conclude either that our new maintenance person has encountered a machine needing an unusually lengthy maintenance time (which occurs with low probability) or that the person is somewhat slower than previous repairers. Noting the low probability for P(Y ≥ 20), we would be inclined to favor the latter view. 5.5.2. History and Applications In 1893, Karl Pearon presented the first of what would become a whole family of skewed curves; this curve is now known as the gamma distribution (Stigler 1986). It was derived as an approximation to an asymmetric binomial. Pearson initially called this a “generalised form of the normal curve of an asymmetrical character.” Later it became known as a Type III curve. It was not until the 1930s and 40s that the distribution became known as the gamma distribution.
Figure 5.13. Karl Pearson (1857—1936)
Source: http://www-history.mcs.st-andrews.ac.uk/PictDisplay/Pearson.html
The gamma distribution often provides a good model to non-negative, skewed data. Applications include fish lengths, rainfall amounts, and survival times. Its relationship to the exponential makes it considered whenever the time or distance between two or more Poisson events is to be modeled.
41
Exercises 5.57. For each month, the daily rainfall (in mm) recorded at the Goztepe rainfall station in the Asian part of Istanbul from 1961 to 1990 was modeled well using a gamma distribution (Aksoy 2000). However, the parameters differed quite markedly from month to month. For September, α =0.4 and β = 20. Find the following: a. The mean and standard deviation of rainfall during a randomly selected September day at this station. b. Find an interval that will include the daily rainfall for a randomly selected September day with probability at least 0.75. 5.58. Refer again to Exercise 5.57. For June, α =0.5 and β = 7. Find the following: a. The mean and standard deviation of rainfall during a randomly selected June day at this station. b. Find an interval that will include the daily rainfall for a randomly selected June day with probability at least 0.75. c. Compare the results for September and June. 5.59. The weekly downtime Y (in hours) for a certain industrial machine has approximately a gamma distribution, with α =3.5 and β = 1.5. The loss L (in dollars) to the industrial operation as a result of this downtime is given by
L = 30Y + 2Y2
a. Find the expected value and the variance of L. b. Find an interval that will contain L on approximately 89% of the weeks that the machine is in use. 5.60. Customers arrived to the checkout counter of a convenience store according to a Poisson process, at a rate of two per minute. Find the mean, the variance, and the probability density function of the waiting time between the opening of the counter and the following events. a. The arrival of the second customer b. The arrival of the third customer 5.61. Suppose that two houses are to be built, each involving the completion of a certain key task. Completion of the task has an exponentially distributed time, with a mean of 10
The Gamma Distribution
⎪⎩
⎪⎨
⎧ ≥Γ=
−−
elsewhere
xforexxf
x
,0
0,)(
1)(
/1 βααβα
αβ=)(XE and 2)( αβ=XV
42
hours. Assuming that the completion times are independent for the two houses, find the expected value and the variance of the following times. a. The total time to complete both tasks b. The average time to complete the two tasks 5.62. A population often increases in size until it reaches some equilibrium abundance. However, if the population growth of a particular organism is observed for numerous populations, the populations are not all exactly the same size when they reach equilibrium. Instead, the size fluctuates about some average size. Dennis and Costantino (1988) suggested the gamma distribution as a model of the equilibrium population size. When studying the flour beetle Tribolium castanean, the gamma distribution, with parameters α = 5.5 and β = 5, provided a good model for these equilibrium population sizes. a. Find the mean and variance of the equilibrium population size for the flour beetle. b. Find an interval that will include 75% of the equilibrium population sizes of this flour beetle. 5.63. Over a 30-minute time interval the distance largemouth bass traveled were found to be well modeled using an exponential distribution with a mean of 20 meters (Essington and Kitchell 1999). a. Give the probability density function, including parameters, of the distance that a largemouth bass moves in one hour. b. Find the probability that a randomly selected largemouth bass will move more than 50 meters in an hour. c. Find the probability that a randomly selected largemouth bass will move less than 10 meters in an hour. d. Find the probability that a randomly selected largemouth bass will move between 20 and 60 meters in an hour. 5.64. Refer to the setting in Exercise 5.63. a. Find the mean and variance of the total distance two randomly selected largemouth bass will travel in an hour. b. Give an interval that will include the total distance two randomly selected largemouth bass will travel in an hour with 75% probability. 5.65. The total sustained load on the concrete footing of a planned building is the sum of the dead load plus the occupancy load. Suppose that the dead load X1 has a gamma distribution with α1 = 50 and β1 = 2; whereas the occupancy load X2 also has a gamma distribution, but with α2 = 20 and β2 = 2. (Units are in kips, or thousands of pounds.) a. Find the mean, the variance, and the probability density function of the total sustained load on the footing. b. Find a value for the sustained load that should be exceeded only with a probability of less than 1/16. 5.66. A 40-year history of annual maximum river flows for a certain small river in the United States shows a relative frequency histogram that can be modeled by a gamma density function, with α = 1.6 and β = 150 (measurements in cubic feet per second).
43
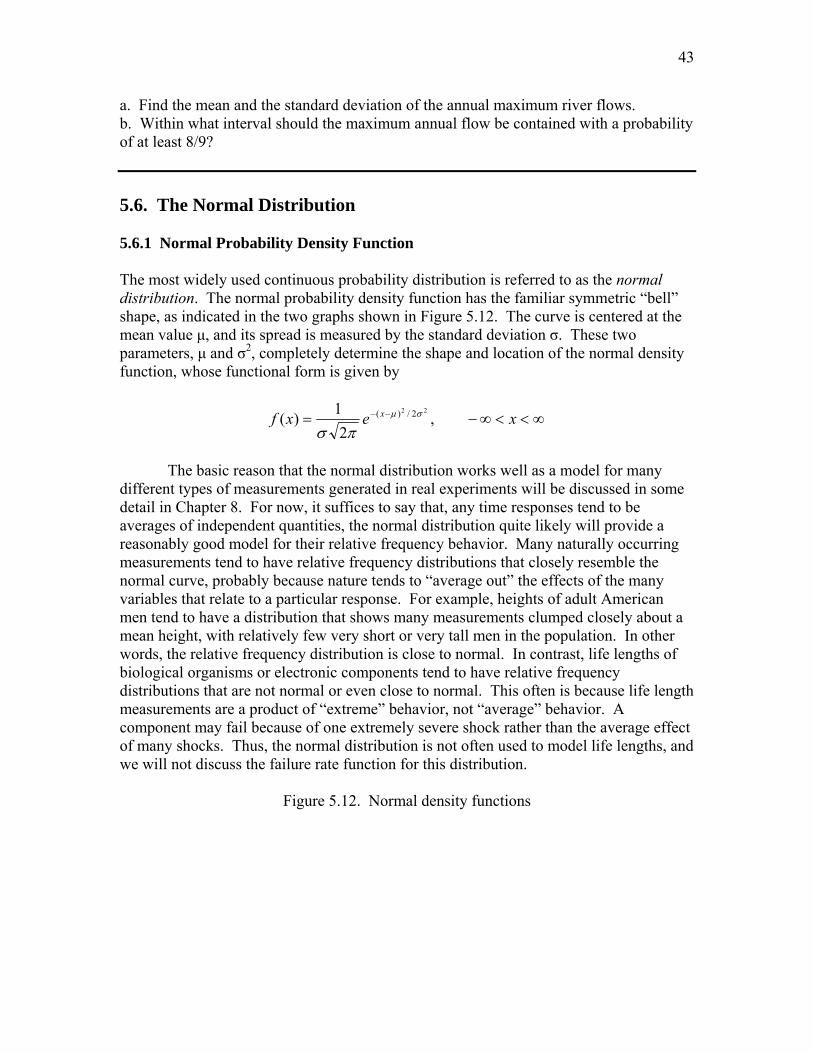
a. Find the mean and the standard deviation of the annual maximum river flows. b. Within what interval should the maximum annual flow be contained with a probability of at least 8/9? 5.6. The Normal Distribution 5.6.1 Normal Probability Density Function The most widely used continuous probability distribution is referred to as the normal distribution. The normal probability density function has the familiar symmetric “bell” shape, as indicated in the two graphs shown in Figure 5.12. The curve is centered at the mean value μ, and its spread is measured by the standard deviation σ. These two parameters, μ and σ2, completely determine the shape and location of the normal density function, whose functional form is given by
∞<<∞−= −− xexf x ,2
1)(22 2/)( σμ
πσ
The basic reason that the normal distribution works well as a model for many different types of measurements generated in real experiments will be discussed in some detail in Chapter 8. For now, it suffices to say that, any time responses tend to be averages of independent quantities, the normal distribution quite likely will provide a reasonably good model for their relative frequency behavior. Many naturally occurring measurements tend to have relative frequency distributions that closely resemble the normal curve, probably because nature tends to “average out” the effects of the many variables that relate to a particular response. For example, heights of adult American men tend to have a distribution that shows many measurements clumped closely about a mean height, with relatively few very short or very tall men in the population. In other words, the relative frequency distribution is close to normal. In contrast, life lengths of biological organisms or electronic components tend to have relative frequency distributions that are not normal or even close to normal. This often is because life length measurements are a product of “extreme” behavior, not “average” behavior. A component may fail because of one extremely severe shock rather than the average effect of many shocks. Thus, the normal distribution is not often used to model life lengths, and we will not discuss the failure rate function for this distribution.
Figure 5.12. Normal density functions
44
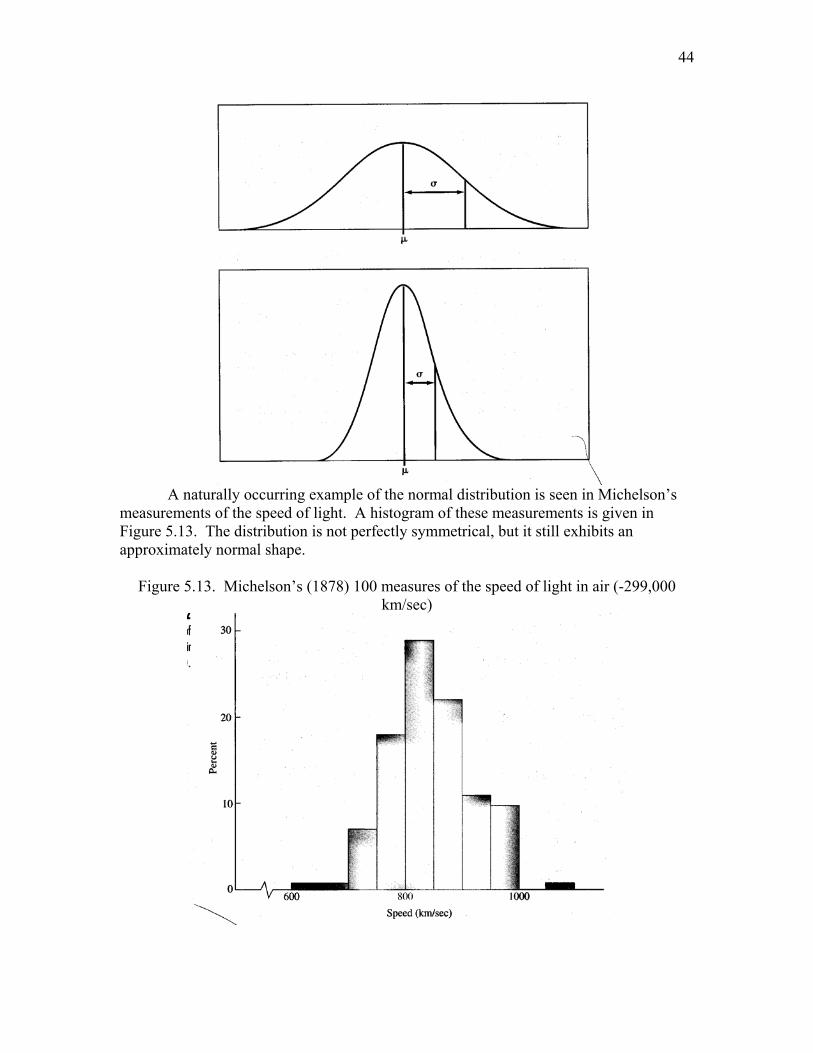
A naturally occurring example of the normal distribution is seen in Michelson’s
measurements of the speed of light. A histogram of these measurements is given in Figure 5.13. The distribution is not perfectly symmetrical, but it still exhibits an approximately normal shape.
Figure 5.13. Michelson’s (1878) 100 measures of the speed of light in air (-299,000
km/sec)

45
5.6.2. Mean and Variance A very important property of the normal distribution (which will be proved in Section 5.9) is that any linear function of a normally distributed random variable also is normally distributed; that is, if X has a normal distribution with mean μ and variance σ2, and if
baXY += for constants a and b, then Y also is normally distributed. It can easily be seen that
baYE += μ)( and 22)( σaYV =
Suppose that Z has a normal distribution, with μ = 0 and σ = 1. This random variable Z is said to have a standard normal distribution. Direct integration will show that 0)( =ZE and 1)( =ZV . We have
[ ]0
2121
21
)()(
2/
2/
2
2
2
=
−=
=
=
=
∞
∞−−
∞
∞−
−
∞
∞−
−
∞
∞−
∫
∫
∫
z
z
z
e
zdze
dzez
dzzzfZE
π
π
π
Similarly,
∫
∫∞
−
∞
∞−
−
=
=
0
2/2
22
2
2
)2(21
21)(
dzez
dzezZE
z
z
π
π
On our making the transformation 2zu = , the integral become
121
2121
)2(23
21
21)(
2/1
2/3
2/2/12
=
⎟⎠⎞
⎜⎝⎛Γ⎟
⎠⎞
⎜⎝⎛=
⎟⎠⎞
⎜⎝⎛Γ=
= ∫∞
∞−
−
π
π
πdueuZE u
since π=Γ )2/1( . Therefore, E(Z) = 0 and 1)()()( 222 ==−= ZEZEZV μ .

46
For any normally distributed random variable X, with parameters μ and σ2,
σμ−
=XZ
will have a standard normal distribution. Then
μσ += ZX ,
μμσ =+= )()( ZEXE
and 22 )()( σσ == ZVXV
. This shows that the parameters μ and σ2 do, indeed, measure the mean and the variance of the distribution. 5.6.3. Calculating Normal Probabilities Since any normally distributed random variable can be transformed into standard normal form, probabilities can be evaluated for any normal distribution simply by evaluating the appropriate standard normal integral. By inspecting any standard normal integral over the interval ),( ba , it quickly becomes evident that this is no trivial task; there is no closed form solution for these integrals. Numerous software packages and calculators have built-in functions that can quickly evaluate these integrals. Tables of standard normal integrals can also be used; one such table is given in Table 4 of the Appendix. Table 4 gives numerical values for
∫ −=≤≤z
z dzezZP0
2/2
21)0(π
Values of the integral are given for values of z between 0.00 and 3.09. We shall now use Table 4 to find P(-0.5 ≤ Z ≤ 1.5) for a standard normal variable X. Figure 5.14 will help us visualize the necessary areas.
Figure 5.14. Standard normal density function
47
We first must write the probability in terms of intervals to the left and to the right of zero (the mean of the distribution). This produces
)05.0()5.10()5.15.0( ≤≤−+≤≤=≤≤− ZPZPZP
. Now 1)5.15.0( AZ =≤≤− in Figure 5.14, and this value can be found by looking up z = 1.5 in Table 4. The result is A1 = 0.4332. Similarly, 2)05.0( AZP =≤≤− in Figure 5.14, and this value can be found by looking up z = 0.5 in Table 4. Areas under the standard normal curve for negative z-values are equal to those for corresponding positive z-values, since the curve is symmetric around zero. We find A2 = 0.1915. It follows that
6247.01915.04332.0)5.15.0( 21 =+=+=≤≤− AAZP
Example 5.13: If Z denotes a standard normal variable, find the following probabilities. 1. P(Z ≤ 1.5) 2. P(Z ≥ 1.5) 3. P(Z < -2) 4. P(-2 ≤ Z ≤ 1) Also find a value of z—say z0—such that P(0 ≤ Z ≤ z0) = 0.35. Solution: This example provides practice in reading Table 4. We see from the table that the following values are correct. 1.
9332.04332.05.0
)5.10()0()5.1(
=+=
≤≤+≤=≤ ZPZPZP
2.
0668.09332.01
)5.1(1)5.1(1)5.1(
=−=
≤−=<−=≥
ZPZPZP
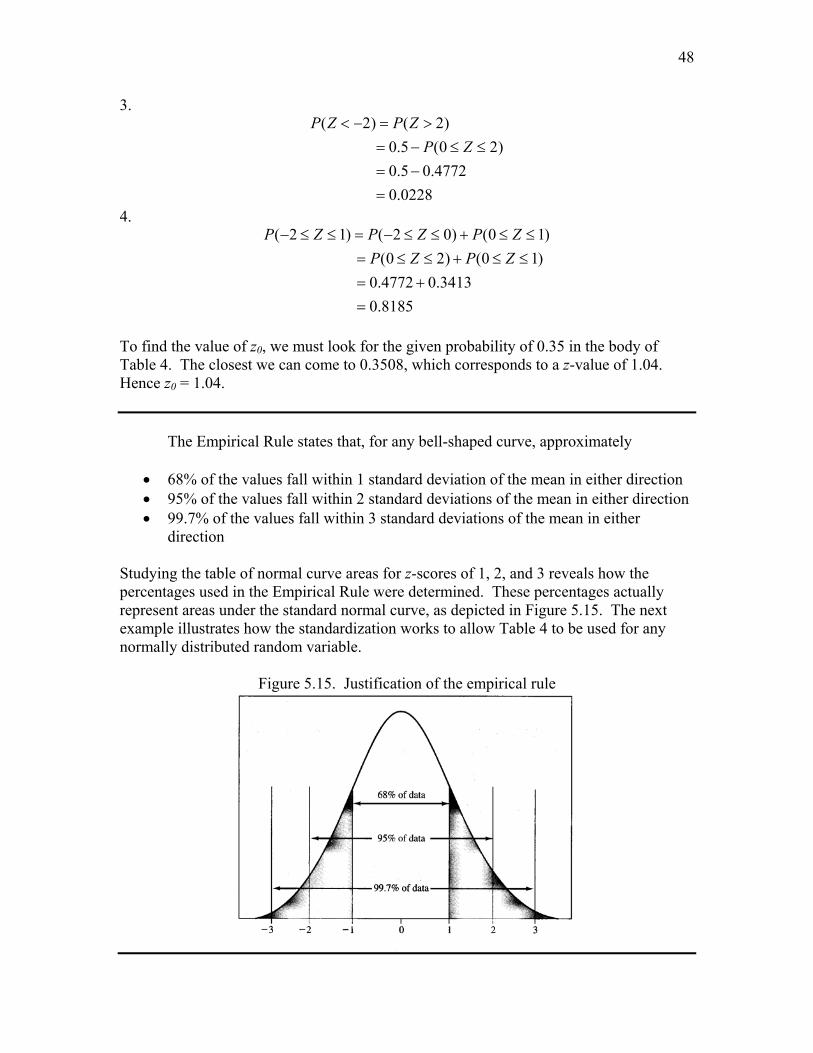
48
3.
0228.04772.05.0
)20(5.0)2()2(
=−=
≤≤−=>=−<
ZPZPZP
4.
8185.03413.04772.0
)10()20()10()02()12(
=+=
≤≤+≤≤=≤≤+≤≤−=≤≤−
ZPZPZPZPZP
To find the value of z0, we must look for the given probability of 0.35 in the body of Table 4. The closest we can come to 0.3508, which corresponds to a z-value of 1.04. Hence z0 = 1.04. The Empirical Rule states that, for any bell-shaped curve, approximately
• 68% of the values fall within 1 standard deviation of the mean in either direction • 95% of the values fall within 2 standard deviations of the mean in either direction • 99.7% of the values fall within 3 standard deviations of the mean in either
direction Studying the table of normal curve areas for z-scores of 1, 2, and 3 reveals how the percentages used in the Empirical Rule were determined. These percentages actually represent areas under the standard normal curve, as depicted in Figure 5.15. The next example illustrates how the standardization works to allow Table 4 to be used for any normally distributed random variable.
Figure 5.15. Justification of the empirical rule
49
Example 5.14: A firm that manufactures and bottles apple juice has a machine that automatically fills bottles with 16 ounces of juice. (The bottle can hold up to 17 ounces.) Over a long period of time, the average amount dispensed into the bottle has been 16 ounces. However, there is variability in how much juice is put in each bottle; the measurements have a standard deviation of one ounce. If the ounces of fill per bottle can be assumed to be normally distributed, find the probability that the machine will overflow any one bottle. Solution: A bottle will overflow if the machine attempts to put more than 17 ounces in it. Let X denote the amount of liquid (in ounces) dispensed into one bottle by the filling machine. Then X is assumed to be normally distributed, with a mean of 16 and a standard deviation of 1. Hence,
17( 17)
17 161
( 1)0.1587
XP X P
P Z
P Z
μ μσ σ− −⎛ ⎞> = >⎜ ⎟
⎝ ⎠−⎛ ⎞= >⎜ ⎟
⎝ ⎠= >=
The answer can be found from Table 4, since Z = (X – μ)/σ has a standard normal distribution. ________________________________________________________________________ Example 5.15: Suppose that another machine, similar to the one described in Example 5.14, operating in such a way that the ounces of fill have a mean value equal to the dial setting for “amount of liquid” but also has a standard deviation of 1.2 ounces. Find the proper setting for the dial so that 17-ouce bottle will overflow only 5% of the time. Assume that the amounts dispensed have a normal distribution. Solution: Let X denote the amount of liquid dispensed, we now look for a value of μ such that
05.0)17( =>XP
. This is represented graphically in Figure 5.16. Now
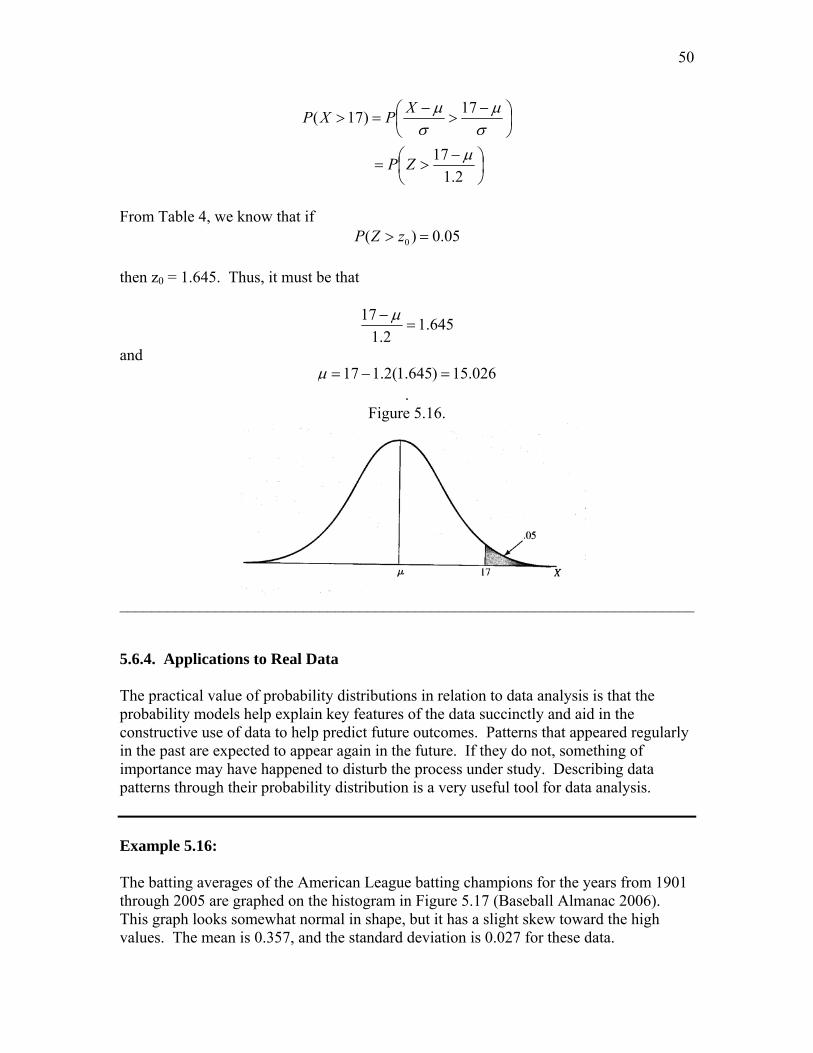
50
⎟⎠⎞
⎜⎝⎛ −
>=
⎟⎠⎞
⎜⎝⎛ −
>−
=>
2.117
17)17(
μσμ
σμ
ZP
XPXP
From Table 4, we know that if
0( ) 0.05P Z z> =
then z0 = 1.645. Thus, it must be that
645.12.1
17=
− μ
and 026.15)645.1(2.117 =−=μ
. Figure 5.16.
________________________________________________________________________ 5.6.4. Applications to Real Data The practical value of probability distributions in relation to data analysis is that the probability models help explain key features of the data succinctly and aid in the constructive use of data to help predict future outcomes. Patterns that appeared regularly in the past are expected to appear again in the future. If they do not, something of importance may have happened to disturb the process under study. Describing data patterns through their probability distribution is a very useful tool for data analysis. Example 5.16: The batting averages of the American League batting champions for the years from 1901 through 2005 are graphed on the histogram in Figure 5.17 (Baseball Almanac 2006). This graph looks somewhat normal in shape, but it has a slight skew toward the high values. The mean is 0.357, and the standard deviation is 0.027 for these data.
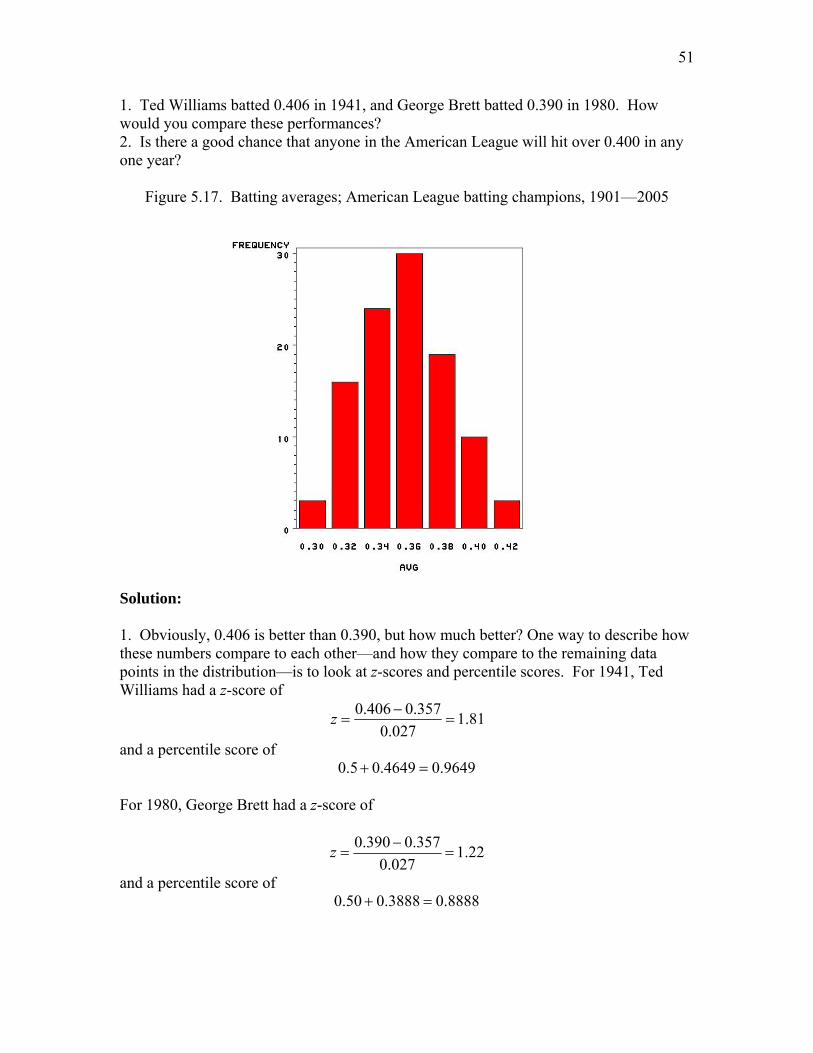
51
1. Ted Williams batted 0.406 in 1941, and George Brett batted 0.390 in 1980. How would you compare these performances? 2. Is there a good chance that anyone in the American League will hit over 0.400 in any one year?
Figure 5.17. Batting averages; American League batting champions, 1901—2005
Solution: 1. Obviously, 0.406 is better than 0.390, but how much better? One way to describe how these numbers compare to each other—and how they compare to the remaining data points in the distribution—is to look at z-scores and percentile scores. For 1941, Ted Williams had a z-score of
81.1027.0
357.0406.0=
−=z
and a percentile score of 9649.04649.05.0 =+
For 1980, George Brett had a z-score of
22.1027.0
357.0390.0=
−=z
and a percentile score of 8888.03888.050.0 =+
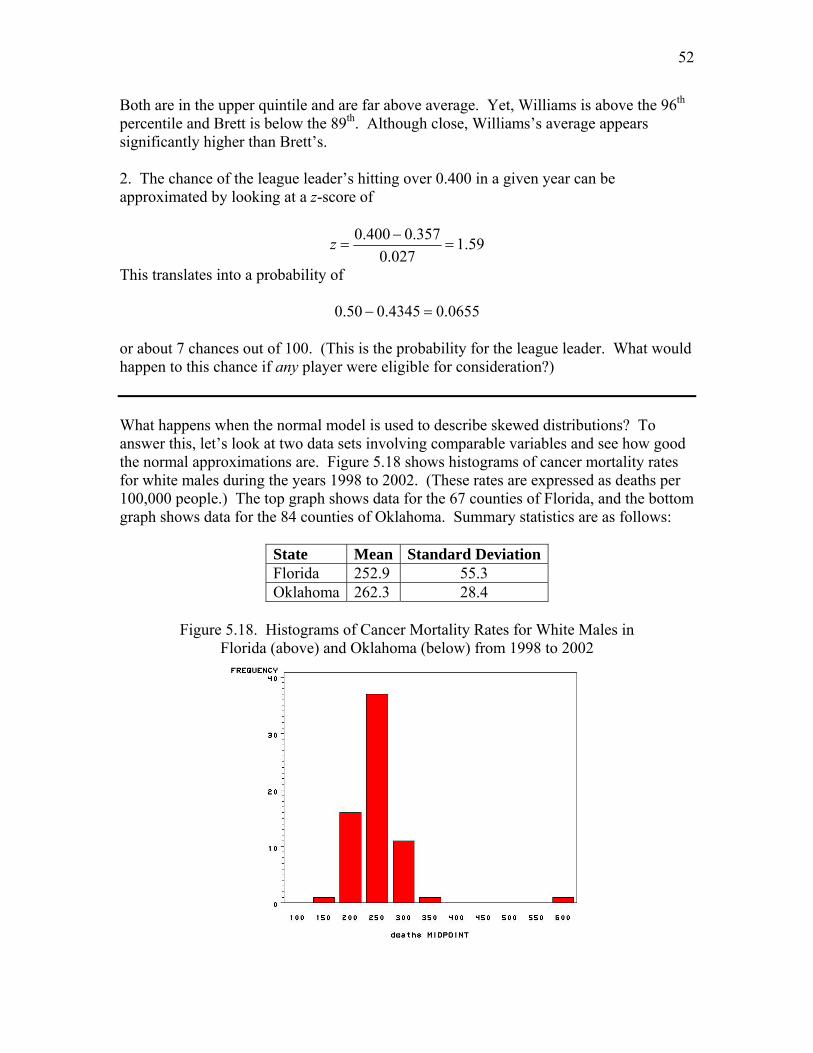
52
Both are in the upper quintile and are far above average. Yet, Williams is above the 96th percentile and Brett is below the 89th. Although close, Williams’s average appears significantly higher than Brett’s. 2. The chance of the league leader’s hitting over 0.400 in a given year can be approximated by looking at a z-score of
59.1027.0
357.0400.0=
−=z
This translates into a probability of
0655.04345.050.0 =−
or about 7 chances out of 100. (This is the probability for the league leader. What would happen to this chance if any player were eligible for consideration?) What happens when the normal model is used to describe skewed distributions? To answer this, let’s look at two data sets involving comparable variables and see how good the normal approximations are. Figure 5.18 shows histograms of cancer mortality rates for white males during the years 1998 to 2002. (These rates are expressed as deaths per 100,000 people.) The top graph shows data for the 67 counties of Florida, and the bottom graph shows data for the 84 counties of Oklahoma. Summary statistics are as follows:
State Mean Standard DeviationFlorida 252.9 55.3 Oklahoma 262.3 28.4
Figure 5.18. Histograms of Cancer Mortality Rates for White Males in
Florida (above) and Oklahoma (below) from 1998 to 2002

53
On average, the states perform about the same, but the distributions are quite different. Key features of the difference can be observed by looking at empirical versus theoretical relative frequencies, as shown in Table 5.2.
Table 5.2. Empirical and Theoretical Relative Frequencies for
County Cancer Rates in Florida and Oklahoms Observed Proportion Interval Florida Oklahoma
Theoretical Proportion
sx ± 896.0
6760
= 75.08463
= 0.68
sx 2± 985.0
6766
= 964.08481
=0.95
For Oklahoma, observation and theory are close together, although the one-standard deviation interval and the two-standard deviation interval, to a lesser extent, pick up a few too many data points. For Florida, observation and theory are not close. In this case, the large outlier inflates the standard deviation so that the one-standard-deviation interval is far too wide to agree with normal theory. The two-standard-deviation interval also has an observed relative frequency larger than expected. This is typical of performance of relative frequencies in highly skewed situations; be careful in interpreting standard deviation under skewed conditions. 5.6.5. Quantile-Quantile (Q-Q) Plots The normal model is popular for describing data distributions; but as we have just seen, it often does not work well in instances where the data distribution is skewed. How can we recognize such instances and avoid using the normal model in situations where it would be inappropriate? One way, as we have seen, is to look carefully at histograms, dotplots, and stemplots to gauge symmetry and outliers visually. Another way, presented in this
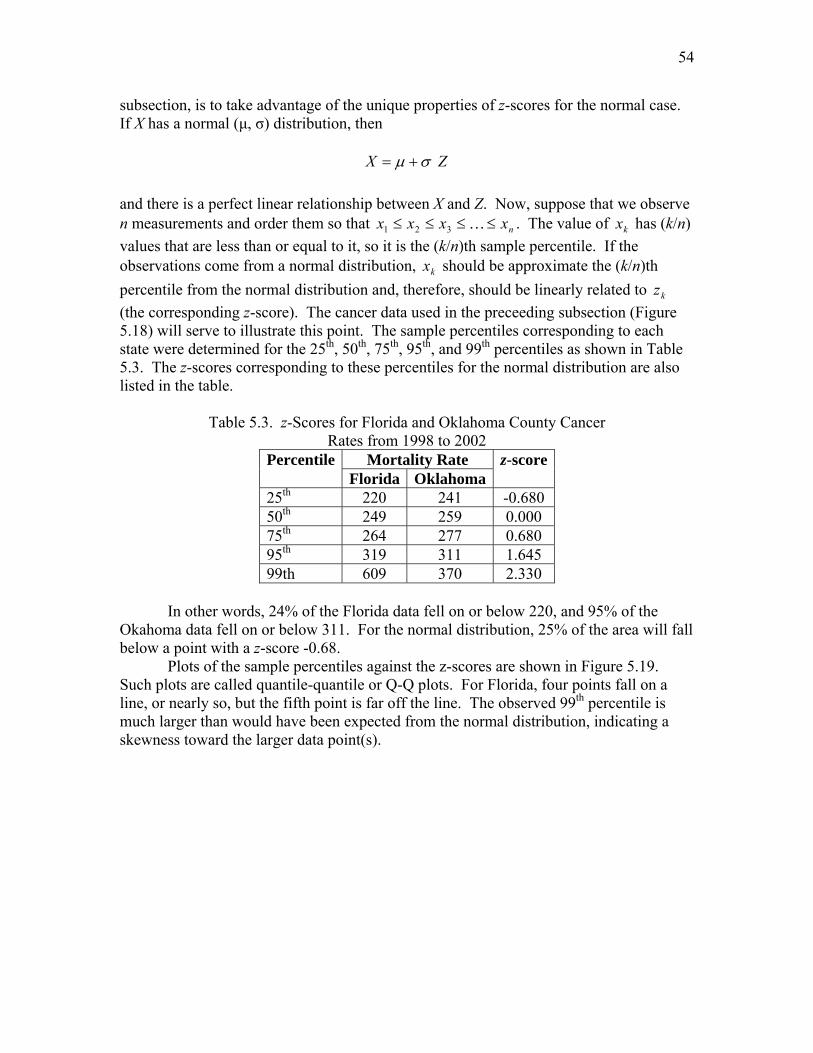
54
subsection, is to take advantage of the unique properties of z-scores for the normal case. If X has a normal (μ, σ) distribution, then
ZX σμ +=
and there is a perfect linear relationship between X and Z. Now, suppose that we observe n measurements and order them so that nxxxx ≤≤≤≤ …321 . The value of kx has (k/n) values that are less than or equal to it, so it is the (k/n)th sample percentile. If the observations come from a normal distribution, kx should be approximate the (k/n)th percentile from the normal distribution and, therefore, should be linearly related to kz (the corresponding z-score). The cancer data used in the preceeding subsection (Figure 5.18) will serve to illustrate this point. The sample percentiles corresponding to each state were determined for the 25th, 50th, 75th, 95th, and 99th percentiles as shown in Table 5.3. The z-scores corresponding to these percentiles for the normal distribution are also listed in the table.
Table 5.3. z-Scores for Florida and Oklahoma County Cancer Rates from 1998 to 2002
Mortality Rate PercentileFlorida Oklahoma
z-score
25th 220 241 -0.680 50th 249 259 0.000 75th 264 277 0.680 95th 319 311 1.645 99th 609 370 2.330
In other words, 24% of the Florida data fell on or below 220, and 95% of the Okahoma data fell on or below 311. For the normal distribution, 25% of the area will fall below a point with a z-score -0.68. Plots of the sample percentiles against the z-scores are shown in Figure 5.19. Such plots are called quantile-quantile or Q-Q plots. For Florida, four points fall on a line, or nearly so, but the fifth point is far off the line. The observed 99th percentile is much larger than would have been expected from the normal distribution, indicating a skewness toward the larger data point(s).
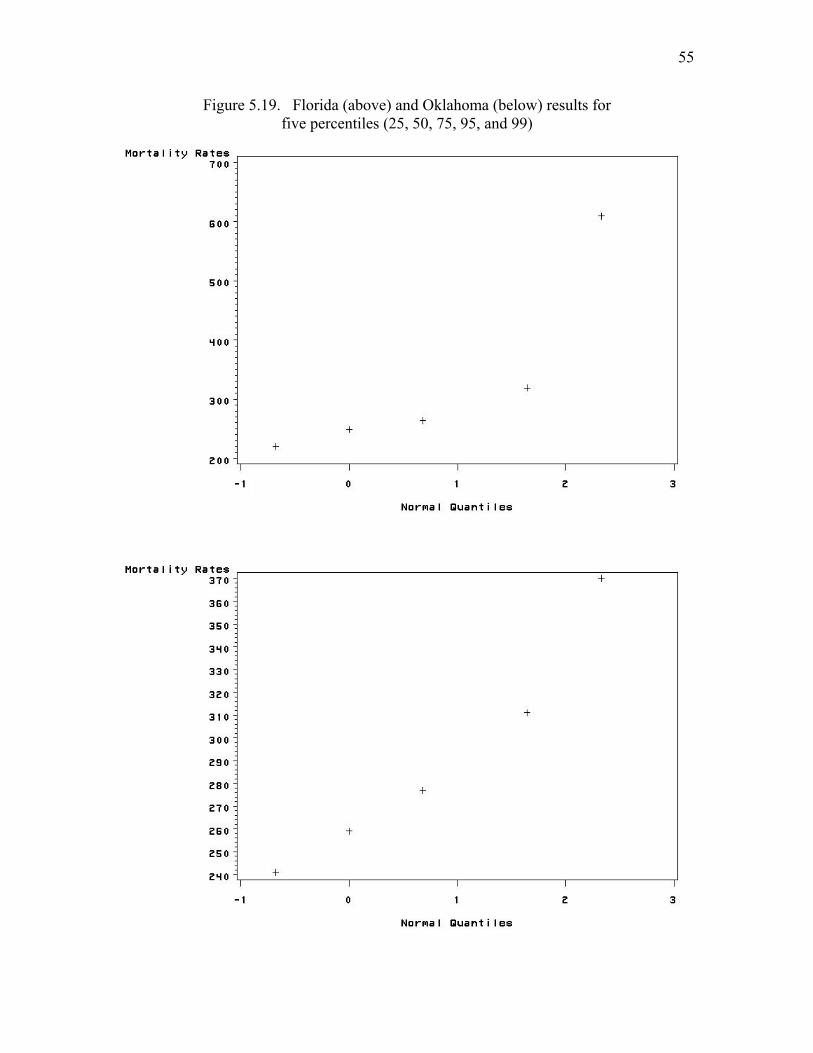
55
Figure 5.19. Florida (above) and Oklahoma (below) results for five percentiles (25, 50, 75, 95, and 99)

56
Figure 5.20. Q-Q plots for all of Florida (above) and Oklahoma (below) counties
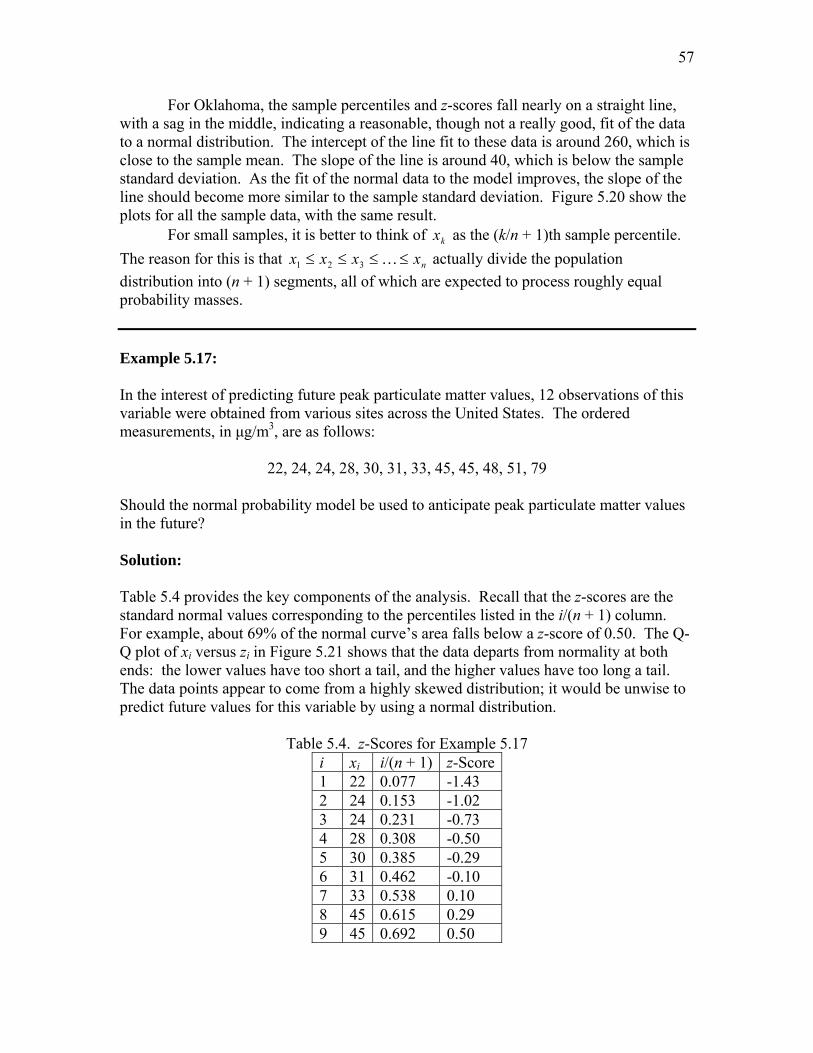
57
For Oklahoma, the sample percentiles and z-scores fall nearly on a straight line, with a sag in the middle, indicating a reasonable, though not a really good, fit of the data to a normal distribution. The intercept of the line fit to these data is around 260, which is close to the sample mean. The slope of the line is around 40, which is below the sample standard deviation. As the fit of the normal data to the model improves, the slope of the line should become more similar to the sample standard deviation. Figure 5.20 show the plots for all the sample data, with the same result. For small samples, it is better to think of kx as the (k/n + 1)th sample percentile. The reason for this is that nxxxx ≤≤≤≤ …321 actually divide the population distribution into (n + 1) segments, all of which are expected to process roughly equal probability masses. Example 5.17: In the interest of predicting future peak particulate matter values, 12 observations of this variable were obtained from various sites across the United States. The ordered measurements, in μg/m3, are as follows:
22, 24, 24, 28, 30, 31, 33, 45, 45, 48, 51, 79
Should the normal probability model be used to anticipate peak particulate matter values in the future? Solution: Table 5.4 provides the key components of the analysis. Recall that the z-scores are the standard normal values corresponding to the percentiles listed in the i/(n + 1) column. For example, about 69% of the normal curve’s area falls below a z-score of 0.50. The Q-Q plot of xi versus zi in Figure 5.21 shows that the data departs from normality at both ends: the lower values have too short a tail, and the higher values have too long a tail. The data points appear to come from a highly skewed distribution; it would be unwise to predict future values for this variable by using a normal distribution.
Table 5.4. z-Scores for Example 5.17
i xi i/(n + 1) z-Score1 22 0.077 -1.43 2 24 0.153 -1.02 3 24 0.231 -0.73 4 28 0.308 -0.50 5 30 0.385 -0.29 6 31 0.462 -0.10 7 33 0.538 0.10 8 45 0.615 0.29 9 45 0.692 0.50
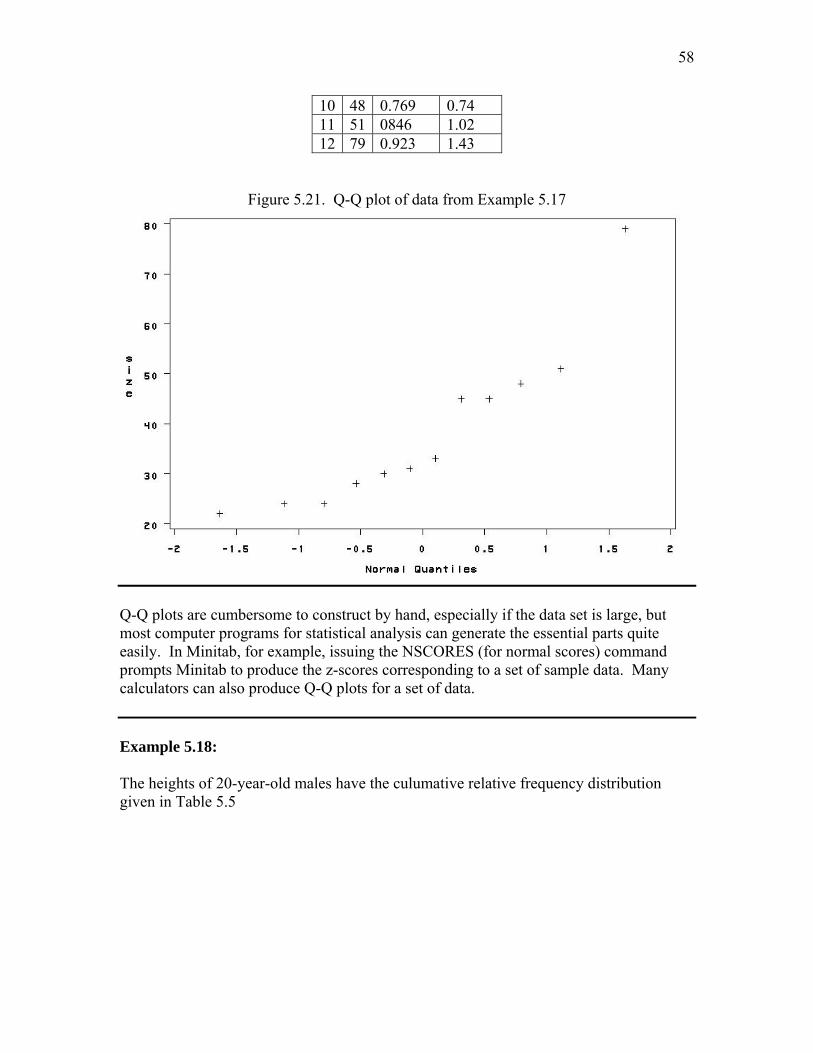
58
10 48 0.769 0.74 11 51 0846 1.02 12 79 0.923 1.43
Figure 5.21. Q-Q plot of data from Example 5.17
Q-Q plots are cumbersome to construct by hand, especially if the data set is large, but most computer programs for statistical analysis can generate the essential parts quite easily. In Minitab, for example, issuing the NSCORES (for normal scores) command prompts Minitab to produce the z-scores corresponding to a set of sample data. Many calculators can also produce Q-Q plots for a set of data. Example 5.18: The heights of 20-year-old males have the culumative relative frequency distribution given in Table 5.5
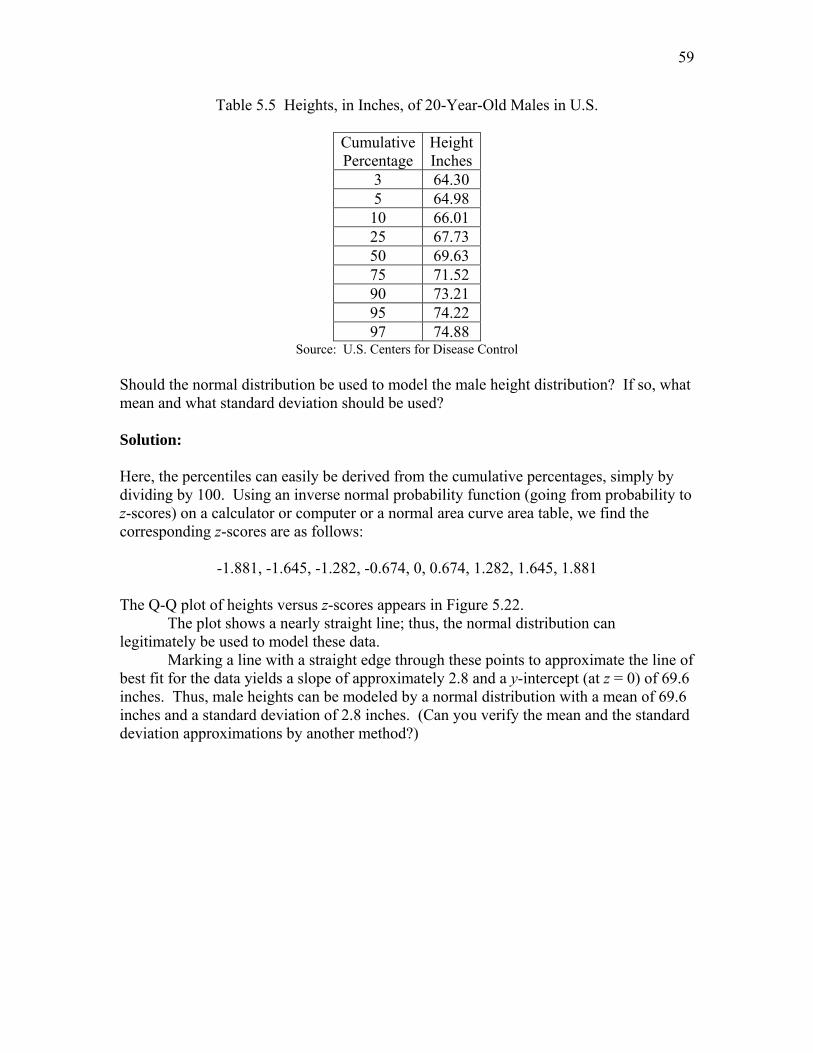
59
Table 5.5 Heights, in Inches, of 20-Year-Old Males in U.S.
CumulativePercentage
HeightInches
3 64.30 5 64.98 10 66.01 25 67.73 50 69.63 75 71.52 90 73.21 95 74.22 97 74.88
Source: U.S. Centers for Disease Control Should the normal distribution be used to model the male height distribution? If so, what mean and what standard deviation should be used? Solution: Here, the percentiles can easily be derived from the cumulative percentages, simply by dividing by 100. Using an inverse normal probability function (going from probability to z-scores) on a calculator or computer or a normal area curve area table, we find the corresponding z-scores are as follows:
-1.881, -1.645, -1.282, -0.674, 0, 0.674, 1.282, 1.645, 1.881
The Q-Q plot of heights versus z-scores appears in Figure 5.22. The plot shows a nearly straight line; thus, the normal distribution can
legitimately be used to model these data. Marking a line with a straight edge through these points to approximate the line of best fit for the data yields a slope of approximately 2.8 and a y-intercept (at z = 0) of 69.6 inches. Thus, male heights can be modeled by a normal distribution with a mean of 69.6 inches and a standard deviation of 2.8 inches. (Can you verify the mean and the standard deviation approximations by another method?)
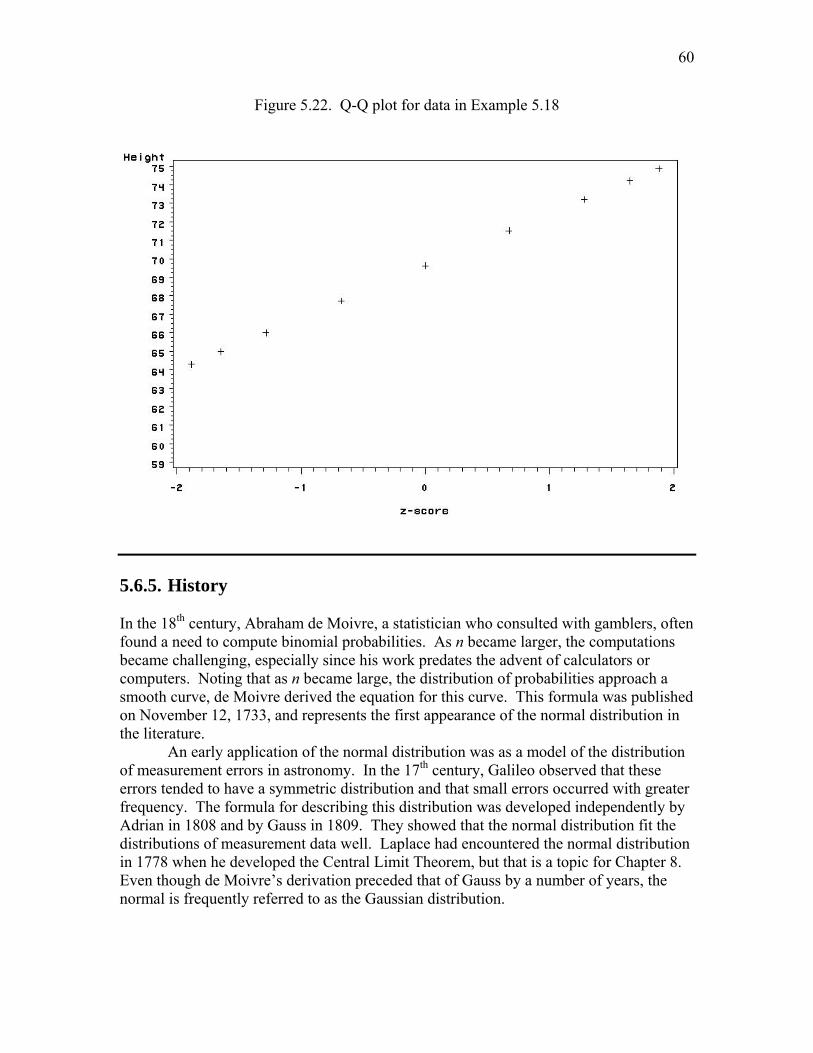
60
Figure 5.22. Q-Q plot for data in Example 5.18
5.6.5. History In the 18th century, Abraham de Moivre, a statistician who consulted with gamblers, often found a need to compute binomial probabilities. As n became larger, the computations became challenging, especially since his work predates the advent of calculators or computers. Noting that as n became large, the distribution of probabilities approach a smooth curve, de Moivre derived the equation for this curve. This formula was published on November 12, 1733, and represents the first appearance of the normal distribution in the literature. An early application of the normal distribution was as a model of the distribution of measurement errors in astronomy. In the 17th century, Galileo observed that these errors tended to have a symmetric distribution and that small errors occurred with greater frequency. The formula for describing this distribution was developed independently by Adrian in 1808 and by Gauss in 1809. They showed that the normal distribution fit the distributions of measurement data well. Laplace had encountered the normal distribution in 1778 when he developed the Central Limit Theorem, but that is a topic for Chapter 8. Even though de Moivre’s derivation preceded that of Gauss by a number of years, the normal is frequently referred to as the Gaussian distribution.
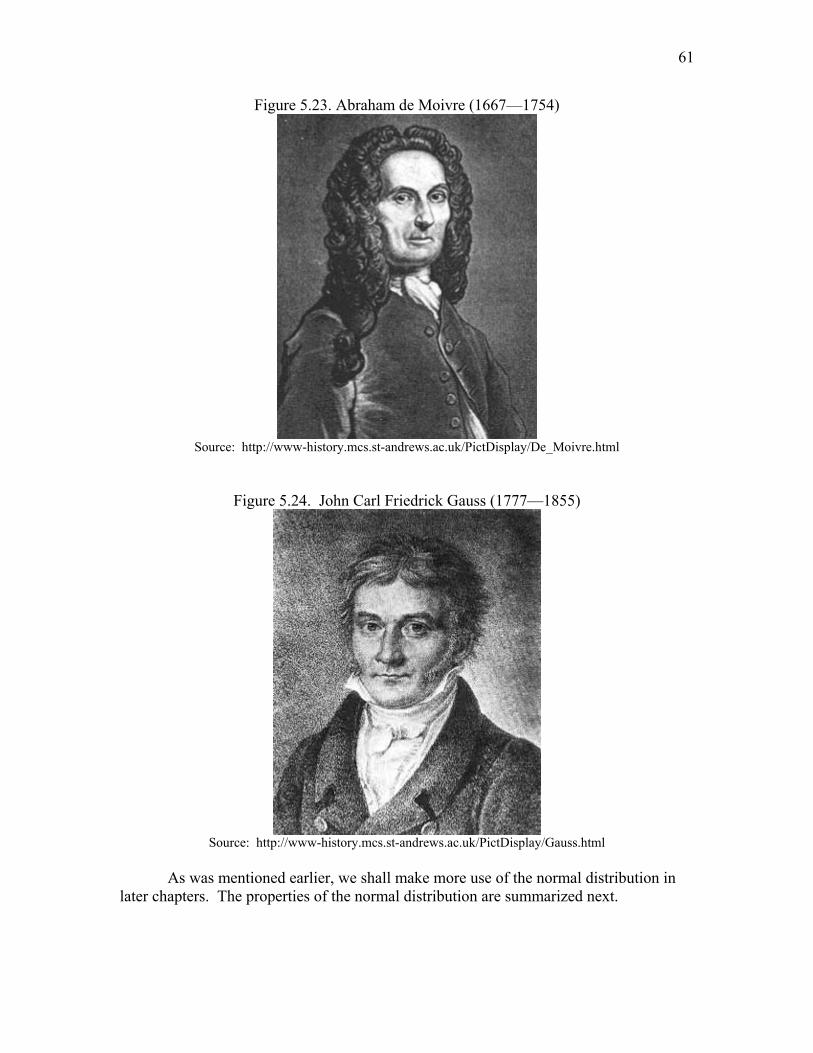
61
Figure 5.23. Abraham de Moivre (1667—1754)
Source: http://www-history.mcs.st-andrews.ac.uk/PictDisplay/De_Moivre.html
Figure 5.24. John Carl Friedrick Gauss (1777—1855)
Source: http://www-history.mcs.st-andrews.ac.uk/PictDisplay/Gauss.html
As was mentioned earlier, we shall make more use of the normal distribution in
later chapters. The properties of the normal distribution are summarized next.
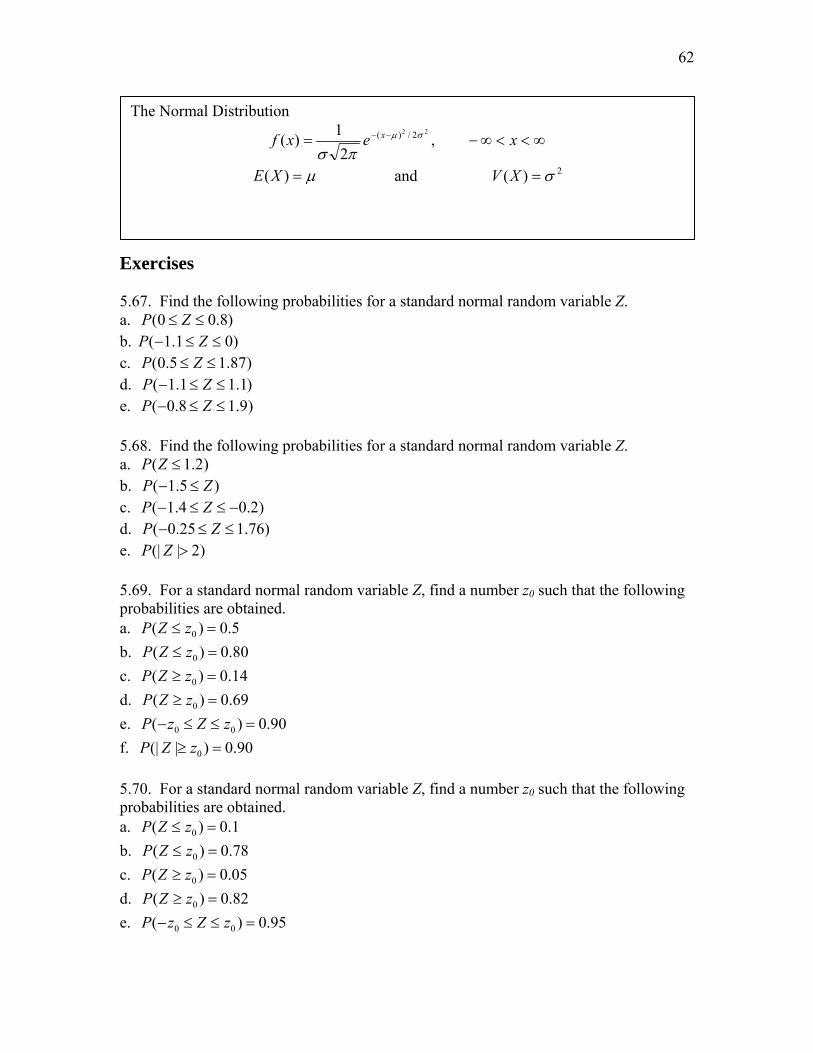
62
Exercises 5.67. Find the following probabilities for a standard normal random variable Z. a. )8.00( ≤≤ ZP b. )01.1( ≤≤− ZP c. )87.15.0( ≤≤ ZP d. )1.11.1( ≤≤− ZP e. )9.18.0( ≤≤− ZP 5.68. Find the following probabilities for a standard normal random variable Z. a. )2.1( ≤ZP b. )5.1( ZP ≤− c. )2.04.1( −≤≤− ZP d. )76.125.0( ≤≤− ZP e. )2|(| >ZP 5.69. For a standard normal random variable Z, find a number z0 such that the following probabilities are obtained. a. 5.0)( 0 =≤ zZP b. 80.0)( 0 =≤ zZP c. 14.0)( 0 =≥ zZP d. 69.0)( 0 =≥ zZP e. 90.0)( 00 =≤≤− zZzP f. 90.0)|(| 0 =≥ zZP 5.70. For a standard normal random variable Z, find a number z0 such that the following probabilities are obtained. a. 1.0)( 0 =≤ zZP b. 78.0)( 0 =≤ zZP c. 05.0)( 0 =≥ zZP d. 82.0)( 0 =≥ zZP e. 95.0)( 00 =≤≤− zZzP
The Normal Distribution
∞<<∞−= −− xexf x ,2
1)(22 2/)( σμ
πσ
μ=)(XE and 2)( σ=XV
63
f. 50.0)|(| 0 =≥ zZP 5.71. The weekly amount spent for maintenance and repairs in a certain company has an approximately normal distribution, with a mean of $600 and a standard deviation of $40. If $700 is budgeted to cover repairs for next week, what is the probability that the actual costs will exceed the budgeted amount? 5.72. In the setting of Exercise 5.71, how much should be budgeted weekly for maintenance and repairs to ensure that the probability that the budgeted amount will be exceeded in any given week is only 0.1? 5.73. A machining operation produces steel shafts were diameters have a normal distribution, with a mean of 1.005 inches and a standard deviation of 0.01 inch. Specifications call for diameters to fall within the interval 1.00 ± 0.02 inches. What percentage of the output of this operation will fail to meet specifications? 5.74. Referring to Exercise 5.73, what should be the mean diameter of the shafts produced to minimize the fraction that fail to meet specifications? 5.75. Wires manufactured for a certain computer system are specified to have a resistance of between 0.12 and 0.14 ohm. The actual measured resistances of the wires produced by Company A have a normal probability distribution, with a mean of 0.13 ohms, and a standard deviation of 0.005 ohms. a. What is the probability that a randomly selected wire from Company A’s production lot will meet the specifications? b. If four such wires are used in a single system and all are selected from Company A, what is the probability that all four will meet the specifications? 5.76. Refer to the setting in Exercise 5.75. Company B also produces the wires used in the computer system. The actual measured resistances of the wires produced by Company B have a normal probability distribution, with a mean of 0.136 ohms, and a standard deviation of 0.003 ohms. The computer firm orders 70% of the wires used in its systems from Company A and 30% from Company B. a. What is the probability that a randomly selected wire from Company B’s production lot will meet the specifications? b. If four such wires are used in a single system and all are selected from Company B, what is the probability that all four will meet the specifications? c. Suppose that all four wires placed in any one computer system are all from the same company and that the computer system will fail testing if any one of the four wires does not meet specifications. A computer system is selected at random and tested. It meets specifications. What is the probability that Company A’s wires were used in it? 5.77. The batting averages of the National League batting champions for the years from 1901 through 2005 are graphed on the histogram below. This graph looks somewhat normal in shape, but it has a slight skew toward the high values. The mean is 0.353 and the standard deviation is 0.021 for these data.

64
a. Barry Bonds batted 0.362 in 2004, and Tony Gwynn batted 0.394 in 1994. How would you compare these performances? b. Is there a good chance that anyone in the National League will hit over 0.400 in any one year?
5.78. At a temperature of 25oC, the resistances of a type of thermistor are normally distributed with a mean of 10,000 ohms and a standard deviation of 4000 ohms. The thermistors are to be sorted, and those having resistances between 8000 and 15,000 ohms are to be shipped to a vendor. What fraction of these thermistors will actually be shipped? 5.79. A vehicle driver gauges the relative speed of the next vehicle ahead by observing the speed with which the image of the width of that vehicle varies. This speed is proportional to X, the speed of variation of the angle at which the eye subtends this width. According to P. Ferrani and others (1984, p. 50, 51), a study of many drivers revealed X to be normally distributed with a mean of 0 and a standard deviation of 10 (10-4 radian per second). a. What fraction of these measurements is more than 5 units away from 0? b. What fraction is more than 10 units away from 0? 5.80. A type of capacitor has resistances that vary according to a normal distribution, with a mean of 800 megohms and a standard deviation of 200 megohms (see Nelson 1967, p. 261-268, for a more thorough discussion). A certain application specifies capacitors with resistance of between 900 and 1000 megohms. a. What proportion of these capacitors will meet this specification?
65
b. If two capacitors are randomly chosen from a lot of capacitors of this type, what is the probability that both will satisfy the specifications? 5.81. When fishing off the shores of Florida, a spotted sea trout must be between 14 and 24-inches long before it can be kept; otherwise, it must be returned to the waters. In a region of the Gulf of Mexico, the lengths of spotted sea trout are normally distributed with a mean of 22 inches and a standard deviation of 4 inches. Assume that each spotted sea trout is equally likely to be caught by a fisherman. a. What is the probability that a fisherman catches a spotted sea trout within the legal limits? b. The fisherman caught a large spotted sea trout. He wants to know whether the length is in the top 5% of the lengths of spotted sea trout in that region. Find the length for which only 5% of the spotted sea trout in this region will be larger than. c. What is the probability that the fisherman will catch three trout outside the legal limits before catching his first legal spotted sea trout (between 14 and 24 inches)? 5.82. Sick leave time used by employees of a firm in the course of one month has approximately a normal distribution wit a mean of 180 hours and a variance of 350 hours. a. Find the probability that total sick leave for next month will be less than 150 hours. b. In planning schedules for next month, how much time should be budgeted for sick leave if that amount is to be exceeded with a probability of only 0.10? 5.83. Men’s shirt sizes are determined by their neck sizes. Suppose that men’s neck sizes are approximately normally distributed with mean 16.2 inches and standard deviation 0.9 inch. A retailer sells men’s shirts in sizes S, M, L, and XL, where the shirt sizes are defined in the table below:
Shirt Size Neck Size S 14 ≤ neck size < 15M 15 ≤ neck size < 16L 16 ≤ neck size < 17
XL 17 ≤ neck size < 18 a. Because the retailer only stocks the sizes listed above, what proportion of customers will find that the retailer does not carry any shirts in their sizes? b. Calculate the proportion of men whose shirt size is M. c. Of 10 randomly selected customers, what is the probability that exactly 3 request size M? 5.84. A machine for filling cereal boxes has a standard deviation of 1 ounce in relation to ounces of fill per box. Assume that the ounces of fill per box are normally distributed. a. What setting of the mean ounces of fill per box will allow 14-ounce boxes to overflow only 1% of the time? b. The company advertises that the box holds 12.8 ounces of cereal. What is the probability that a randomly selected box will have less than 12.8 ounces of cereal?
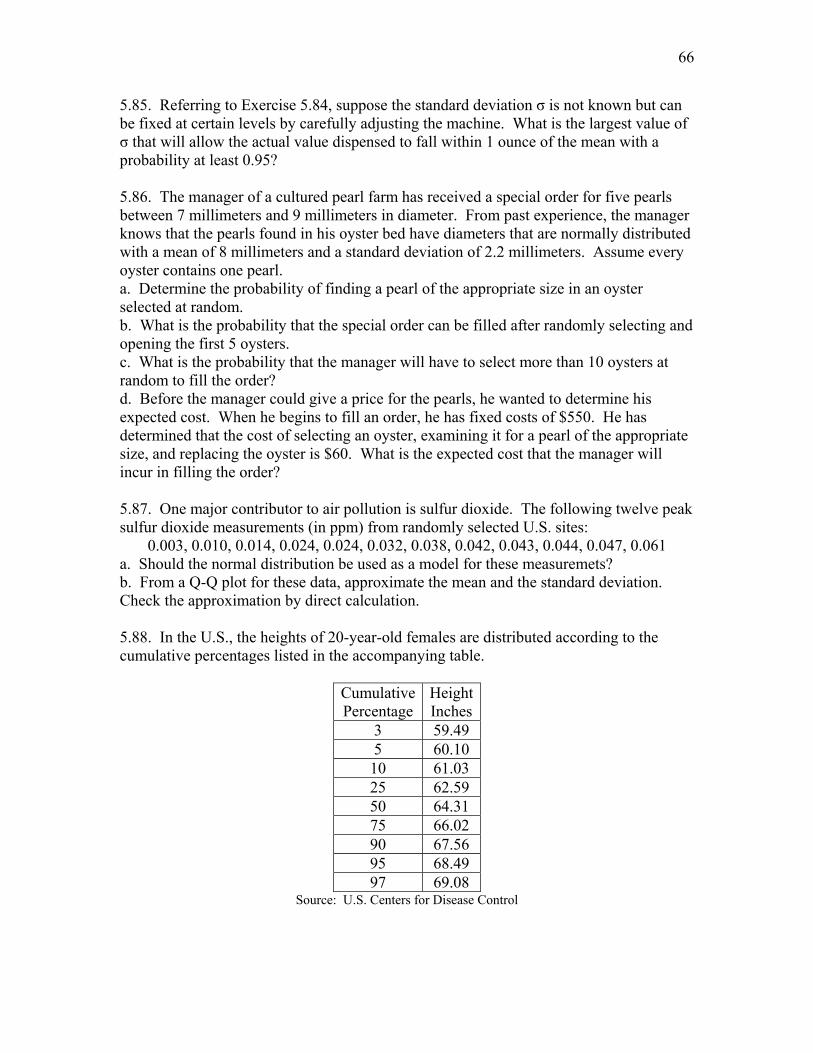
66
5.85. Referring to Exercise 5.84, suppose the standard deviation σ is not known but can be fixed at certain levels by carefully adjusting the machine. What is the largest value of σ that will allow the actual value dispensed to fall within 1 ounce of the mean with a probability at least 0.95? 5.86. The manager of a cultured pearl farm has received a special order for five pearls between 7 millimeters and 9 millimeters in diameter. From past experience, the manager knows that the pearls found in his oyster bed have diameters that are normally distributed with a mean of 8 millimeters and a standard deviation of 2.2 millimeters. Assume every oyster contains one pearl. a. Determine the probability of finding a pearl of the appropriate size in an oyster selected at random. b. What is the probability that the special order can be filled after randomly selecting and opening the first 5 oysters. c. What is the probability that the manager will have to select more than 10 oysters at random to fill the order? d. Before the manager could give a price for the pearls, he wanted to determine his expected cost. When he begins to fill an order, he has fixed costs of $550. He has determined that the cost of selecting an oyster, examining it for a pearl of the appropriate size, and replacing the oyster is $60. What is the expected cost that the manager will incur in filling the order? 5.87. One major contributor to air pollution is sulfur dioxide. The following twelve peak sulfur dioxide measurements (in ppm) from randomly selected U.S. sites:
0.003, 0.010, 0.014, 0.024, 0.024, 0.032, 0.038, 0.042, 0.043, 0.044, 0.047, 0.061 a. Should the normal distribution be used as a model for these measuremets? b. From a Q-Q plot for these data, approximate the mean and the standard deviation. Check the approximation by direct calculation. 5.88. In the U.S., the heights of 20-year-old females are distributed according to the cumulative percentages listed in the accompanying table.
CumulativePercentage
HeightInches
3 59.49 5 60.10 10 61.03 25 62.59 50 64.31 75 66.02 90 67.56 95 68.49 97 69.08
Source: U.S. Centers for Disease Control
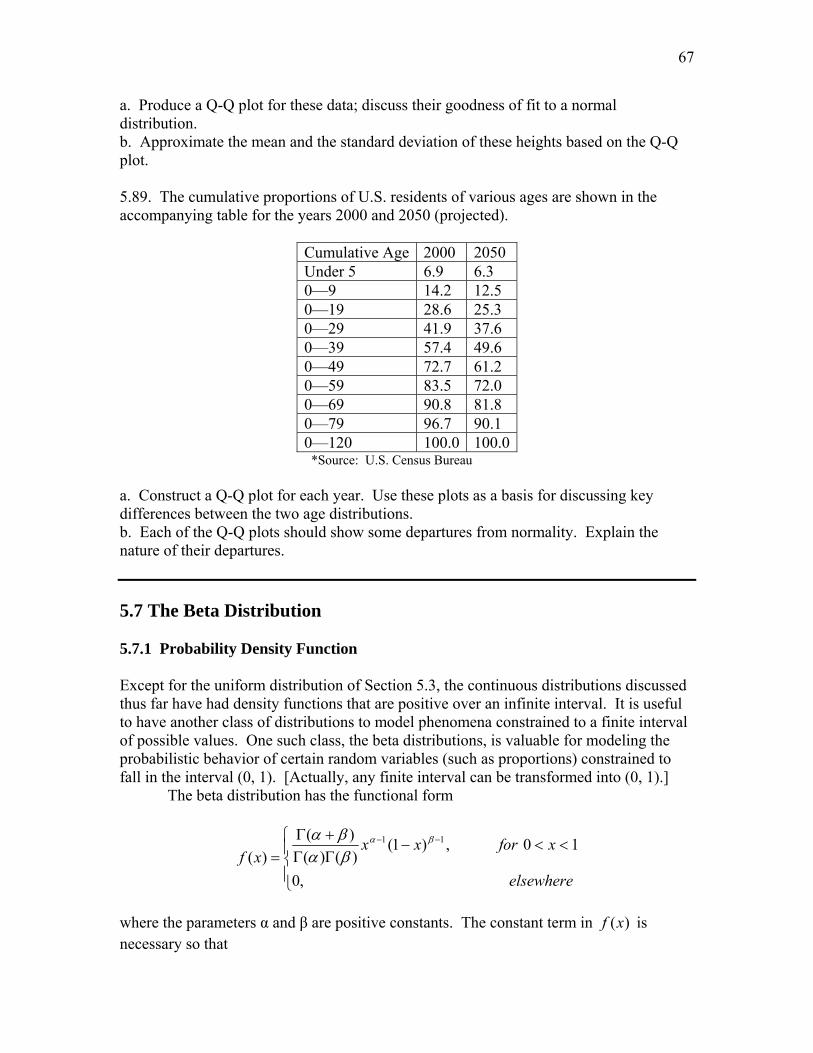
67
a. Produce a Q-Q plot for these data; discuss their goodness of fit to a normal distribution. b. Approximate the mean and the standard deviation of these heights based on the Q-Q plot. 5.89. The cumulative proportions of U.S. residents of various ages are shown in the accompanying table for the years 2000 and 2050 (projected).
Cumulative Age 2000 2050 Under 5 6.9 6.3 0—9 14.2 12.5 0—19 28.6 25.3 0—29 41.9 37.6 0—39 57.4 49.6 0—49 72.7 61.2 0—59 83.5 72.0 0—69 90.8 81.8 0—79 96.7 90.1 0—120 100.0 100.0
*Source: U.S. Census Bureau a. Construct a Q-Q plot for each year. Use these plots as a basis for discussing key differences between the two age distributions. b. Each of the Q-Q plots should show some departures from normality. Explain the nature of their departures. 5.7 The Beta Distribution 5.7.1 Probability Density Function Except for the uniform distribution of Section 5.3, the continuous distributions discussed thus far have had density functions that are positive over an infinite interval. It is useful to have another class of distributions to model phenomena constrained to a finite interval of possible values. One such class, the beta distributions, is valuable for modeling the probabilistic behavior of certain random variables (such as proportions) constrained to fall in the interval (0, 1). [Actually, any finite interval can be transformed into (0, 1).] The beta distribution has the functional form
⎪⎩
⎪⎨⎧ <<−
ΓΓ+Γ
=−−
elsewhere
xforxxxf
,0
10,)1()()()(
)(11 βα
βαβα
where the parameters α and β are positive constants. The constant term in )(xf is necessary so that
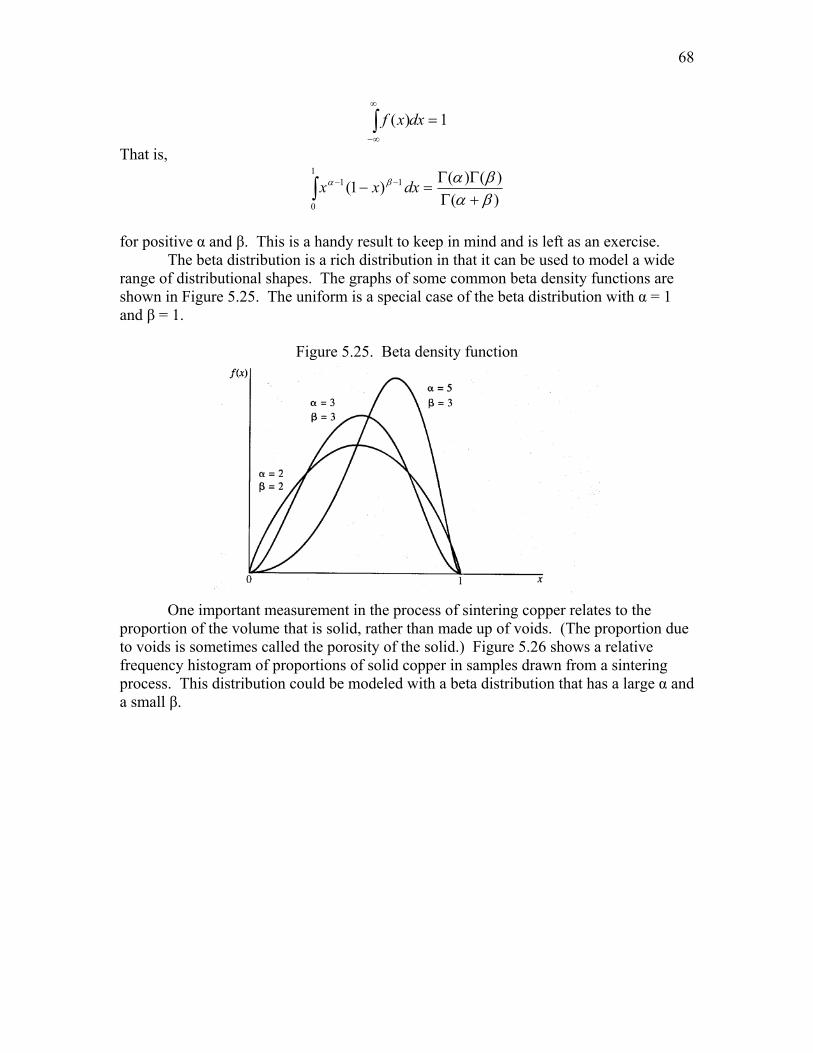
68
1)( =∫∞
∞−
dxxf
That is,
∫ +ΓΓΓ
=− −−1
0
11
)()()()1(
βαβαβα dxxx
for positive α and β. This is a handy result to keep in mind and is left as an exercise.
The beta distribution is a rich distribution in that it can be used to model a wide range of distributional shapes. The graphs of some common beta density functions are shown in Figure 5.25. The uniform is a special case of the beta distribution with α = 1 and β = 1.
Figure 5.25. Beta density function
One important measurement in the process of sintering copper relates to the proportion of the volume that is solid, rather than made up of voids. (The proportion due to voids is sometimes called the porosity of the solid.) Figure 5.26 shows a relative frequency histogram of proportions of solid copper in samples drawn from a sintering process. This distribution could be modeled with a beta distribution that has a large α and a small β.

69
Figure 5.26. Solid mass in sintered linde copper
Source: Department of Materials Science, University of Florida
5.7.2. Mean and Variance The expected value of a beta random variable can easily be found because
βαα
βαβα
βαβα
βαβα
βαβα
βα
βα
+=
++ΓΓ+Γ
×ΓΓ+Γ
=
−ΓΓ+Γ
=
−ΓΓ+Γ
=
=
∫
∫
∫
−
−−
∞
∞−
)1()()1(
)()()(
)1()()()(
)1()()()(
)()(
1
0
1
1
0
11
dxxx
dxxxx
dxxxfXE
[Recall that )()1( nnn Γ=+Γ .] Similar manipulations reveal that
)1()()( 2 +++=
βαβααβXV
We illustrate the use of this density function in an example.
70
Example 5.19: A gasoline wholesale distributor uses bulk storage tanks to hold a fixed supply. The tanks are filled every Monday. Of interest to the wholesaler is the proportion of the supply sold during the week. Over many weeks, this proportion has been observed to match fairly well a beta distribution with α = 4 and β = 2. 1. Find the expected value of this proportion. 2. Is it highly likely that the wholesaler will sell at least 90% of the stock in a given week? Solution: 1. By the results given earlier, with X denoting the proportion of the total supply sold in a given week,
32
64)( ==
+=
βααXE
2. Now we are interested in
( )08.0)004.0(20
20
)1()2()4()24()9.0(
1
9.0
43
1
9.0
3
==
−=
−ΓΓ+Γ
=>
∫
∫
dxxx
dxxxXP
Therefore, it is not very likely that 90% of the stock will be sold in a given week. 5.7.3. History and Applications Reverend Thomas Bayes first encountered the beta distribution as he considered allowing the probability of success p to vary. The difficulty he encountered was in the integration process. If α and β are small, the integration is simple, but the computations quickly become challenging as the parameters get large. In 1781, Laplace determined how to derive an arbitrarily close series approximation to the integral. When Karl Pearson categorized density functions into types, his type II curves were the symmetric beta density, and the type III curves were the asymmetric beta density. Although the beta distribution was generally referred to as a Pearson curve of type II or III in the English literature of the early 1900s, the texts of the 1940s adopted the name beta distribution, which is used here. The beta distribution is frequently used to model any data that occur over an interval because, as we noted earlier, any interval can be transformed to a (0, 1) interval. Applications include studying the time to complete a task or the proportions in a mixture.

71
Figure 5.27. Reverend Thomas Bayes (1702—1761)
Source: http://www-history.mcs.st-andrews.ac.uk/PictDisplay/Bayes.html
The basic properties of the beta distribution are summarized next.
Exercises 5.90. Suppose that X has a probability density function given by
⎪⎩
⎪⎨⎧ <<−
=elsewhere
xforxkxxf
,0
10,)1()(
24
a. Find the value of k that makes this a probability density function. b. Find E(X) and V(X). 5.91. The weekly repair cost, X, for a certain machine has a probability density function given by
⎩⎨⎧ ≤≤−
=otherwise
xxcxxf
,010),1(
)(
The Beta Distribution
⎪⎩
⎪⎨⎧ <<−
ΓΓ+Γ
=−−
elsewhere
xforxxxf
,0
10,)1()()()(
)(11 βα
βαβα
βαα+
=)(XE and )1()(
)( 2 +++=
βαβααβXV

72
with measurements in $100s. a. Find the value of c that makes this function a valid probability density function. b. Find and sketch the distribution function of X. c. What is the probability that repair costs will exceed $75 during a week? d. By simply looking at the probability density function, state the distribution of X, including the parameters. 5.92. If X has a beta distribution with parameters α and β, show that
)1()()( 2 +++=
βαβααβXV
5.93. The proportion of impurities per batch in a certain type of industrial chemical is a random variable X that has the probability density function
⎩⎨⎧ ≤≤−
=otherwise
xxxxf
,010),1(20
)(3
a. Suppose that a batch with more than 30% impurities cannot be sold. What is the probability that a randomly selected batch cannot be sold for this reason? b. Suppose that the dollar value of each batch is given by V = 10 – 0.75X. Find the expected value and variance of V. 5.94. During an 8-hour shift, the proportion of time X that a sheet-metal stamping machine is down for maintenance or repairs has a beta distribution, with α = 1 and β = 2; that is,
⎪⎩
⎪⎨⎧ <<−
=elsewhere
xforxxf
,0
10,)1(2)(
The cost (in $100s) of this downtime, in lost production and repair expenses, is given by
C = 10 + 20X + 4X2
a. Find the mean and the variance of C. b. Find an interval within which C has a probability of at least 0.75 of lying. 5.95. In trees, foliage distribution as a function of height is termed the foliage surface area density (FSAD), or needle surface area density (NSAD) for conifers, and is the foliage surface area per unit volume of space at a given height above the ground. Dividing the distance from the ground by the height of the tree, rescales the height of the tree to the interval (0, 1). The NSAD has been found to be modeled well using the beta distribution (Massman 1982). For a certain old-growth Douglas fir, the mean and the variance of its NSAD are 1 and 1/12, respectively. a. Find α and β.

73
b. What proportion of the NSAD lies in the upper half of the tree? c. What proportion of the NSAD lies in the middle half of the tree? 5.96. To study the dispersal of pollutants emerging from a power plant, researchers measure the prevailing wind direction for a large number of days. The direction is measured on a scale of 0o to 360o; but by dividing each daily direction by 360, one can rescale the measurements to the interval (0, 1). These rescaled measurements X prove to follow a beta distribution, with α = 4 and β = 2. Find E(X). To what angle does this mean correspond? 5.97. Errors in measuring the arrival time (in microsconds) of a wavefront from an acoustic source can sometimes be modeled by a beta distribution (Perruzzi and Hilliard 1984). Suppose that these errors have a beta distribution, with α = 1 and β = 2. a. Find the probability that a particular measurement error will be less than 0.5 microseconds. b. Find the mean and the standard deviation of these measurements. 5.98. Exposure to an airborne contaminant is defined as the time-weighted average breathing-zone concentration over an interval T (Flynn 2004). The concentration is the proportion of the volume of air breathed that has the contaminant. It has been found that this exposure is well modeled by the beta distribution. For benzene in a particular region, it was found that α = 1 and β = 344. a. Find the mean and variance of the exposure to benzene in this region. b. What is the probability that the exposure by a randomly selected individual is less than 0.01? 5.99. The broken stick model is sometimes used to describe the allocation of environmental resources among species. For two species, assume that one species is assigned one end of the stick; the other end represents the resources for the other species. A point is randomly selected along a stick of unit length and broken at that point. The length of the stick each species receives is proportional to the available resources it has. The proportion of resources the species getting the short end of the stick is then modeled using the beta distribution with α = 1 and β = 2. a. Find the mean and variance of the proportion of resources the species getting the short end of the stick receives. b. Find the probability that the proportion of resources received by the species getting the short end of the stick is greater than 40%. c. Find the probability that the resources received by the species getting the short end of the stick is less than 10%. 5.100. Refer to the setting in Exercise 5.99. The proportion of resources the species receiving the long end of the stick is modeled by a beta with α = 2 and β = 1. a. Find the mean and variance of the proportion of resources the species getting the long end of the stick receives. b. Find the probability that the proportion of resources received by the species getting the long end of the stick is greater than 40%.
74
c. Find the probability that the resources received by the species getting the long end of the stick is less than 10%. 5.101. The proper blending of fine and coarse powders in copper sintering is essential for uniformity in the finished product. One way to check the blending is to select many small samples of the blended powders and to measure the weight fractions of the fine particles. These measurements should be relatively constant if good blending has been achieved. a. Suppose that the weight fractions have a beta distribution, with α = β = 3. Find the mean and the variance of these fractions. b. Repeat part (a) for α = β = 2. c. Repeat part (a) for α = β = 1. d. Which case—(a), (b), or (c)—would exemplify the best blending? 5.102. The proportion of pure iron in certain ore samples has a beta distribution, with α = 3 and β = 1. a. Find the probability that one of these samples will have more than 50% pure iron. b. Find the probability that two out of three samples will have less than 30% pure iron. 4.8. The Weibull Distribution 4.8.1. Probability Density Function We have observed that the gamma distribution often can serve as a probabilistic model for life lengths of components or systems. However, the failure rate function for the gamma distribution has an upper bound that limits its applicability to real systems. For this and other reasons, other distributions often provide better models for life-length data. One such distribution is the Weibull, which is explored in this section. A Weibull density function has the form
⎪⎩
⎪⎨⎧ >
=−−
elsewhere
xforexxf
x
,0
0,)(
/1 θγ γ
θγ
for positive parameters θ and γ. For γ = 1, this becomes an exponential density. For γ > 1, the functions look something like the gamma functions of Section 5.5, but they have somewhat different mathematical properties. We can integrate directly to see that
⎪⎩
⎪⎨
⎧
≥−=−==≤
<
= −−−−∫ 0,1|)(
0,0)( /
0/
0
/1 xeedtetxXP
xxF xxt
xt θθθγ γγγ
θγ
75
A convenient way to look at properties of the Weibull density is to use the transformation γXY = . Then,
( )( )
( )
0,11
)(
)()(
/
/
/1
/1
/1
>−=
−=
=
≤=
≤=
≤=
−
−
yee
yFyXP
yXP
yYPyF
y
y
X
Y
θ
θ
γ
γ
γ
γγ
Hence,
0,1)()( / >== − yedy
ydFyf yYY
θ
θ;
that is, Y has the familiar exponential density. 5.8.2. Mean and Variance If we want to find E(X) for a variable X that has the Weibull distribution, we take advantage of the transformation γXY = or γ/1YX = . Then
( )
⎟⎟⎠
⎞⎜⎜⎝
⎛+Γ=
⎟⎟⎠
⎞⎜⎜⎝
⎛+Γ=
=
=
=
+
∞−
∞−
∫
∫
γθ
θγθ
θ
θ
γ
γ
θγ
θγ
γ
11
111
1
1
)(
/1
)/11(
0
//1
0
//1
/1
dyey
dyey
YEXE
y
y
This result follows from recognizing the integral to be of the gamma type. If we let γ = 2 in the Weibull density, we see that 2XY = has an exponential distribution. To reverse the idea just outlined, If we start with an exponentially distributed random variable Y, then the square root of Y will have a Weibull distribution with γ = 2. We can illustrate this empirically by taking the square roots of the data from an exponential distribution given in Table 5.1. These square roots are given in Table 5.6, and a relative frequency histogram for these data is given in Figure 5.28. Notice that the exponential form has now disappeared and that the curve given by the Weibull density,

76
with γ = 2 and θ = 2 (shown in Figure 5.29) is a much more plausible model for these observations.
Table 5.6 Square Roots of the battery Life Lengths of Table 5.1
0.637 0.828 2.186 1.313 2.868 1.531 1.184 1.223 0.542 1.459 0.733 0.484 2.006 1.823 1.700 2.256 1.207 1.032 0.880 0.872 2.364 1.305 1.623 1.360 0.431 1.601 0.719 1.802 1.526 1.032 0.152 0.715 1.668 2.535 0.914 1.826 0.474 1.230 1.793 0.617 1.868 1.525 0.477 2.746 0.984 1.126 1.709 1.274 0.578 2.119
5.28. Relative frequency histogram for the data of Table 5.6
Figure 5.29. Weibull density function, γ = 2, θ = 2
We illustrate the use of the Weibull distribution in the following example.
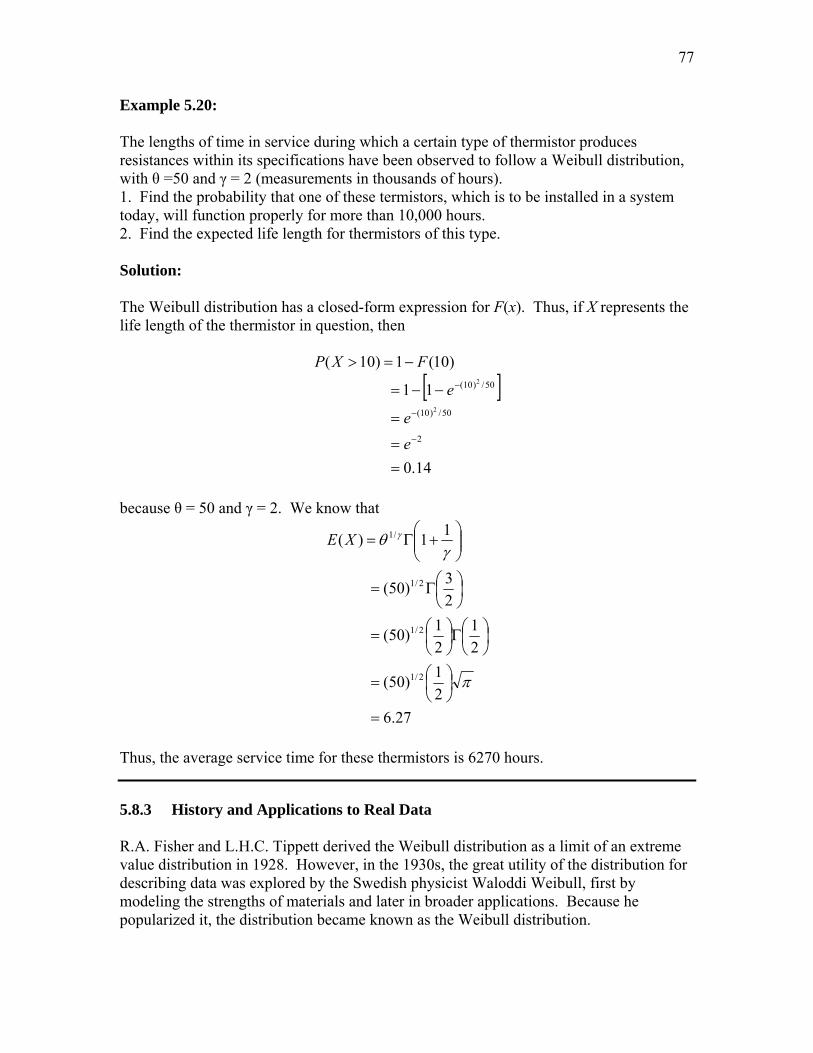
77
Example 5.20: The lengths of time in service during which a certain type of thermistor produces resistances within its specifications have been observed to follow a Weibull distribution, with θ =50 and γ = 2 (measurements in thousands of hours). 1. Find the probability that one of these termistors, which is to be installed in a system today, will function properly for more than 10,000 hours. 2. Find the expected life length for thermistors of this type. Solution: The Weibull distribution has a closed-form expression for F(x). Thus, if X represents the life length of the thermistor in question, then
[ ]
14.0
11
)10(1)10(
2
50/)10(
50/)10(
2
2
==
=
−−=
−=>
−
−
−
ee
e
FXP
because θ = 50 and γ = 2. We know that
27.621)50(
21
21)50(
23)50(
11)(
2/1
2/1
2/1
/1
=
⎟⎠⎞
⎜⎝⎛=
⎟⎠⎞
⎜⎝⎛Γ⎟
⎠⎞
⎜⎝⎛=
⎟⎠⎞
⎜⎝⎛Γ=
⎟⎟⎠
⎞⎜⎜⎝
⎛+Γ=
π
γθ γXE
Thus, the average service time for these thermistors is 6270 hours.
5.8.3 History and Applications to Real Data R.A. Fisher and L.H.C. Tippett derived the Weibull distribution as a limit of an extreme value distribution in 1928. However, in the 1930s, the great utility of the distribution for describing data was explored by the Swedish physicist Waloddi Weibull, first by modeling the strengths of materials and later in broader applications. Because he popularized it, the distribution became known as the Weibull distribution.
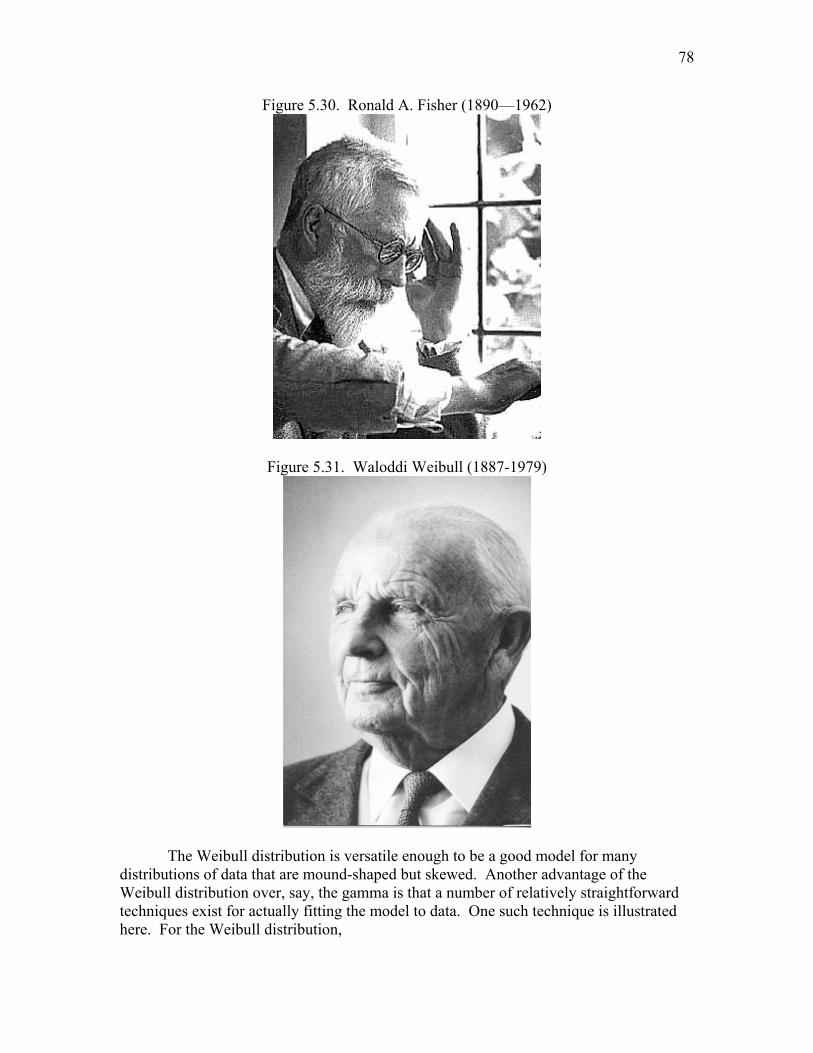
78
Figure 5.30. Ronald A. Fisher (1890—1962)
Figure 5.31. Waloddi Weibull (1887-1979)
The Weibull distribution is versatile enough to be a good model for many distributions of data that are mound-shaped but skewed. Another advantage of the Weibull distribution over, say, the gamma is that a number of relatively straightforward techniques exist for actually fitting the model to data. One such technique is illustrated here. For the Weibull distribution,

79
0,)(1)(/
>=−=> − xexFxXP x θν
Therefore, using ln to denote natural logarithm, we have
θ
γxxF
−=⎥⎦
⎤⎢⎣
⎡− )(1
1ln
and
)ln()ln()(1
1lnln θγ −=⎟⎟⎠
⎞⎜⎜⎝
⎛⎥⎦
⎤⎢⎣
⎡−
− xxF
For simplicity, let’s call the double ln expression on the left LF(x). Plotting LF(x) as a function of )ln(x produces a straight line with slope γ and intercept – )ln(θ . Now let’s see how this works with real data. Peak particulate matter counts from locations across the United States did not appear to fit the normal distribution. Do they fit the Weibull? In ascending order the counts (in μg/m3) used earlier (see Table 5.4) were as follows:
22, ,24, 24, 28, 30, 31, 33, 45, 45, 48, 51, 79 Checking for outliers (by using a boxplot, for example) reveals that 79 is an extreme outlier. No smooth distribution will do a good job of picking it, so we remove it from the data set. Proceeding then, as in the normal case, to produce sample percentiles as approximations to F(x), we obtain the data listed in Table 5.7.
Table 5.7. Analysis of Particulate Matter Data
I x ln(x) i/(n + 1) Approximate LF(x)1 2 3 4 5 6 7 8 9 10 11
22 24 24 28 30 31 33 45 45 48 51
3.091043.178053.178053.332203.401203.433993.496513.806663.806663.871203.93183
0.0833330.1666670.2500000.3333330.4166670.5000000.5833330.6666670.7500000.8333330.916667
-2.44172 -1.70198 -1.24590 -0.90272 -0.61805 -0.36651 -0.13300 0.09405 0.32663 0.58320 0.91024
Here, i/(n + 1) is used to approximate F(xi) in LF(x). Figure 5.32 shows the plot of LF(x) versus ln(x). The points lie rather close to a straight line that has a slope of about 3.2 and a y-intercept of about -11.6. (This line can be approximated by drawing a straight line with a straightedge through the middle of the scatterplot.) Thus, the particulate counts appear to be adequately modeled by a Weibull distribution, with γ ≈ 3.2 and ln(θ) ≈11.6.
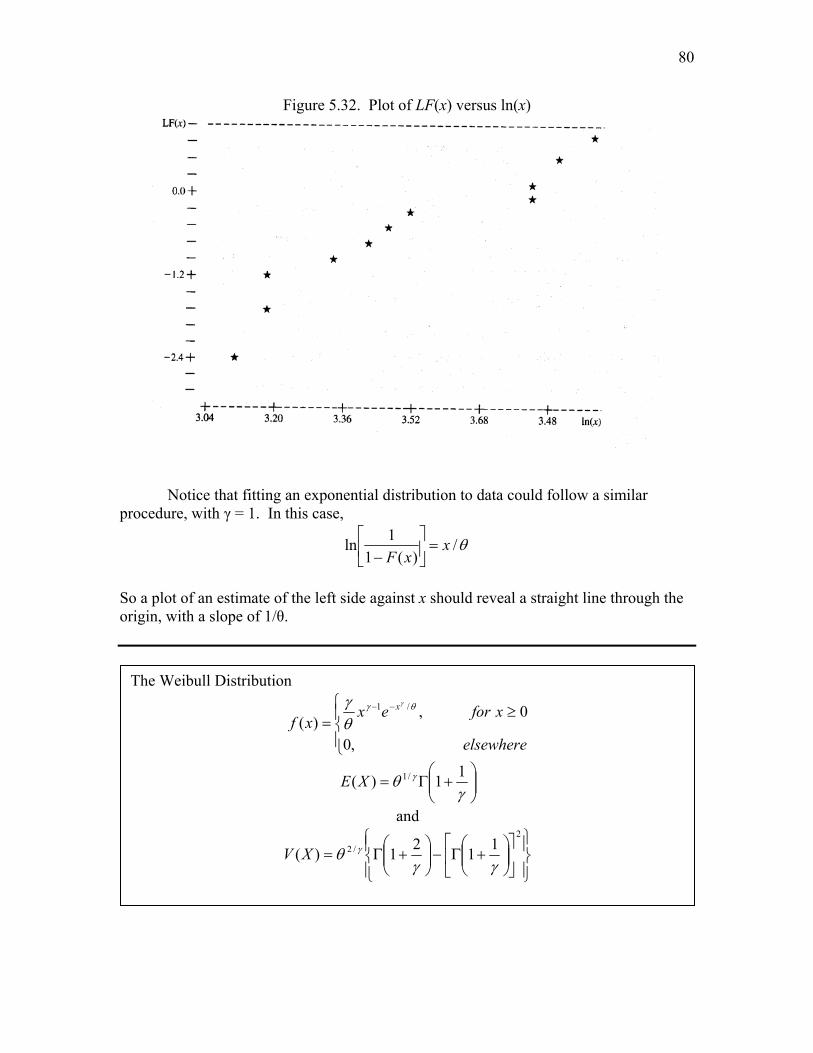
80
Figure 5.32. Plot of LF(x) versus ln(x)
Notice that fitting an exponential distribution to data could follow a similar procedure, with γ = 1. In this case,
θ/)(1
1ln xxF
=⎥⎦
⎤⎢⎣
⎡−
So a plot of an estimate of the left side against x should reveal a straight line through the origin, with a slope of 1/θ.
The Weibull Distribution
⎪⎩
⎪⎨⎧ ≥
=−−
elsewhere
xforexxf
x
,0
0,)(
/1 θγ γ
θγ
⎟⎟⎠
⎞⎜⎜⎝
⎛+Γ=γ
θ γ 11)( /1XE
and
⎪⎭
⎪⎬⎫
⎪⎩
⎪⎨⎧
⎥⎦
⎤⎢⎣
⎡⎟⎟⎠
⎞⎜⎜⎝
⎛+Γ−⎟⎟
⎠
⎞⎜⎜⎝
⎛+Γ=
2
/2 1121)(γγ
θ γXV

81
Exercises 5.103. Fatigue life (in hundreds of hours) for a certain type of bearings has approximately a Weibull distribution, with γ = 2 and θ = 4. a. Find the probability that a randomly selected bearing of this type will fail in less than 200 hours. b. Find the expected value of the fatigue life for these bearings. 5.104. The yearly maximum flood levels (in millions of cubic feet per second) for a certain United States river have a Webull distribution, with γ =1.5 and θ = 0.6 (see Cohen, et al. 1984). Find the probabilities that the maximum flood level for next year will have the following characteristics. a. It will exceed 0.6 b. It will be less than 0.8. 5.105. The times necessary to achieve proper blending of copper powders before sintering were found to have a Weibull distribution, with γ = 1.1 and θ = 2 (measurements in minutes). Find the probability that proper blending in a particular case will take less than 2 minutes. 5.106. The ultimate tensile strength of steel wire used to wrap concrete pipe was found to have a Weibull distribution, with γ = 1.2 and θ = 270 (measurements in thousands of pounds). Pressure in the pipe at a certain point may require an ultimate tensile strength of at least 300,000 pounds. What is the probability that a randomly selected wire will possess this strength? 5.107. The Weibull distribution has been used to model survivorship, the probability of surviving to time t (Pinder, et al. 1978). If the random variable T denotes the age at which an organism dies, the probability of survival until time t is P(T > t). For a certain population of Dall sheep, survival (in years) was found to be well modeled using a Weibull distribution with θ =8.5 and γ = 2. a. Find the mean and variance of the time a randomly selected Dall sheep survives. b. Find the probability that a randomly selected Dall sheep survives at least a year. c. Find the age at which 50% of the Dall sheep survive. 5.108. The yield strengths of certain steel beams have a Weibull distribution, with γ = 2 and θ = 3600 (measurement in thousands of pounds per square inch). Two such beams are used in a construction project, which calls for yield strengths in excess of 70,000 psi. Find the probability that both beams will meet the specifications for the project. 5.109. The pressure (in thousands of psi) exerted on the tank of a steam boiler has a Weibull distribution, with γ = 1.8 and θ = 1.5. The tank is built to withstand pressure of up to 2000 psi. Find the probability that this limit will be exceeded. 5.110. Resistors used in an aircraft guidance system have life lengths that follow a Weibull distribution, with γ = 2 and θ = 10 (measurements in thousands of hours.)

82
a. Find the probability that a randomly selected resistor of this type has a life length that exceeds 5000 hours. b. If three resistors of this type operate independently, find the probability that exactly one of the three will burn out prior to 5000 hours of use. c. Find the mean and the variance of the life length of such a resistor. 5.111. Failures in the bleed systems of jet engines were causing some concern at an air base. It was decided to model the failure-time distribution for these systems so that future failures could be anticipated better. The following randomly identified failure times (in operating hours since installation) were observed (Abbernethy, et al. 1983):
1198, 884, 1251, 1249, 708, 1082, 884, 1105, 828, 1013
Does a Weibull distribution appear to be a good model for these data? If so, what values should be used for γ and θ? 5.112. Maximum wind-gust velocities in summer thunderstorms were found to follow a Weibull distribution, with γ = 200 and θ = 400 (measurements in feet per second). Engineers who design structures in areas where these thunderstorms occur are interested in finding a gust velocity that will be exceeded only with a probability of 0.01. Find such a value. 5.113. The velocities of gas particles can be modeled by the Maxwell distribution, with the probability density function given by
⎪⎩
⎪⎨
⎧≥⎟
⎠⎞
⎜⎝⎛
=−
elsewhere
vforevKTm
vfKTv
,0
0,2
4)(2/2
2/32
ππ
where m is the mass of the particle, K is Boltzmann’s constant, and T is the absolute temperature. a. Find the mean velocity of these particles. b. The kinetic energy of a particle is given by (1/2)mV2. Find the mean kinetic energy of these particles. 5.9 Reliability One important measure of the quality of products is their reliability, or probability of working for a specified period of time. We want products—whether they be cars, television sets, or shoes—that do not break down or wear out for some definite period of time, and we want to know how long this time period can be expected to last. The study of reliability is a probabilistic exercise because data or models on component lifetimes are used to predict future behavior: how long a process will operate before it fails.
83
In reliability studies, the underlying random variable of interest, X, is usually lifetime.
It follows that, for exponentially distributed lifetimes,
0,)( / ≥= − tetR t θ
and for lifetimes following a Weibull distribution,
0,)( / ≥= − tetR t θγ
Reliability functions for gamma and normal distributions do not exist in closed form. In fact, the normal model is not often used to model life-length data since length of life tends to exhibit positively skewed behavior. 5.9.1 Failure Rate Function Besides probability density and distribution functions and the reliability function, another function is useful in work with life-length data. Suppose that X denotes the life-length of a component with density function )(xf and distribution function )(xF . The failure rate function )(tr is defined as
1)(,0,)(1
)()( <>−
= tFttF
tftr
For an intuitive look at what )(tr is measuring, suppose that dt denotes a very small interval around the point t. Then dttf )( is approximately the probability that X will take on a value in ),( dttt + . Further, )()(1 tXPtF >=− . Thus,
[ ]tXdtttXPtF
dttfdttr
>+∈≈−
=
|),()(1
)()(
In other words, dttr )( represents the probability of failure during the time interval
),( dttt + , given that the component has survived up to time t. For the exponential case,
Definition 5.4. If a component has lifetime X with distribution function F, then the reliability of the component is
)(1)()( tFtXPtR −=>=
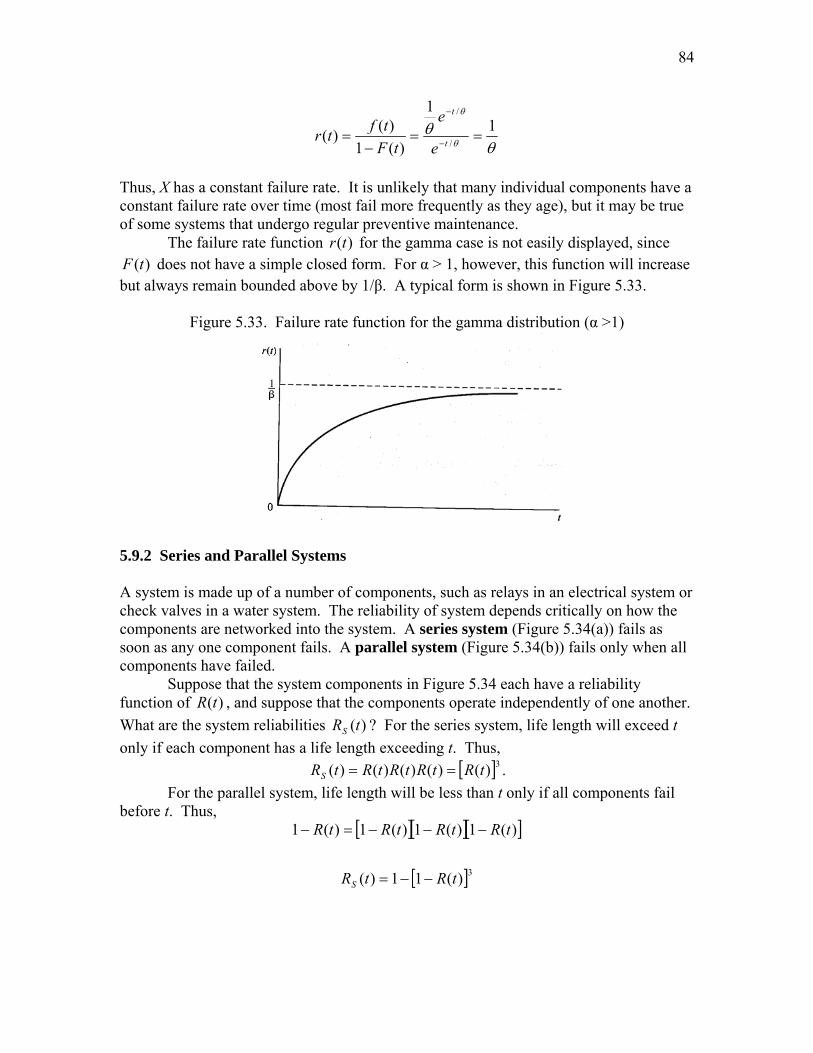
84
θθ
θ
θ
11
)(1)()( /
/
==−
= −
−
t
t
e
e
tFtftr
Thus, X has a constant failure rate. It is unlikely that many individual components have a constant failure rate over time (most fail more frequently as they age), but it may be true of some systems that undergo regular preventive maintenance. The failure rate function )(tr for the gamma case is not easily displayed, since
)(tF does not have a simple closed form. For α > 1, however, this function will increase but always remain bounded above by 1/β. A typical form is shown in Figure 5.33.
Figure 5.33. Failure rate function for the gamma distribution (α >1)
5.9.2 Series and Parallel Systems A system is made up of a number of components, such as relays in an electrical system or check valves in a water system. The reliability of system depends critically on how the components are networked into the system. A series system (Figure 5.34(a)) fails as soon as any one component fails. A parallel system (Figure 5.34(b)) fails only when all components have failed. Suppose that the system components in Figure 5.34 each have a reliability function of )(tR , and suppose that the components operate independently of one another. What are the system reliabilities )(tRS ? For the series system, life length will exceed t only if each component has a life length exceeding t. Thus,
[ ]3)()()()()( tRtRtRtRtRS == . For the parallel system, life length will be less than t only if all components fail before t. Thus,
[ ][ ][ ])(1)(1)(1)(1 tRtRtRtR −−−=−
[ ]3)(11)( tRtRS −−=
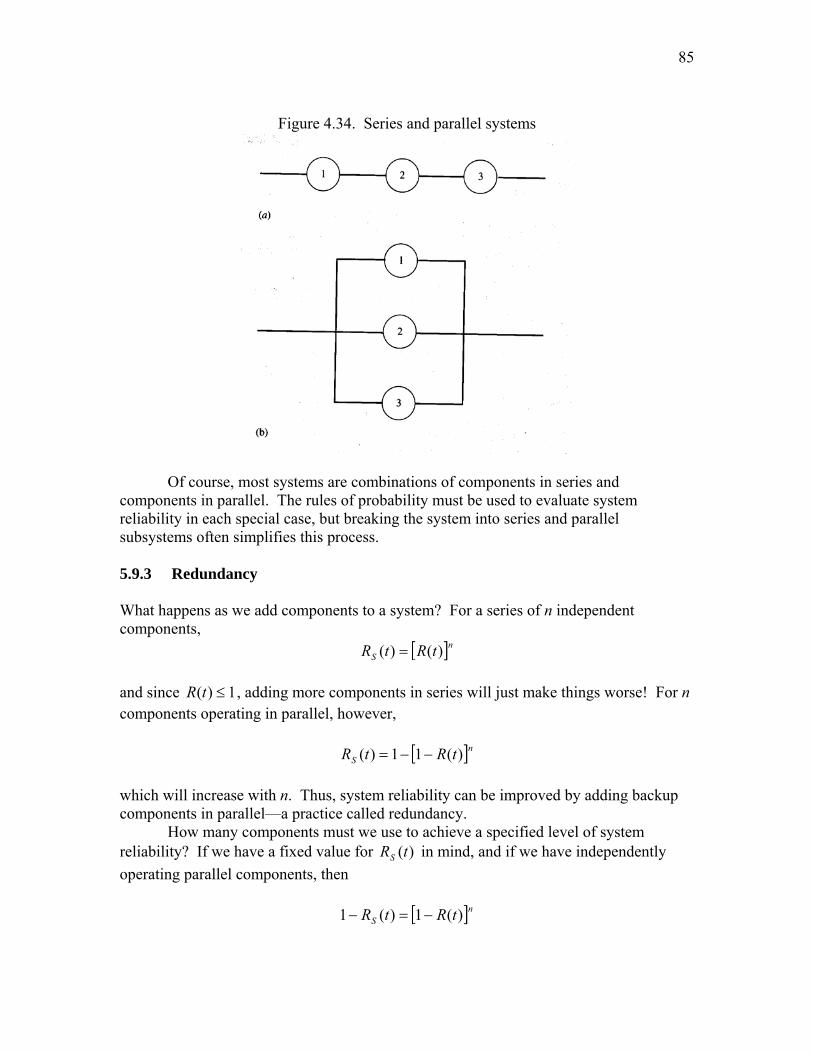
85
Figure 4.34. Series and parallel systems
Of course, most systems are combinations of components in series and components in parallel. The rules of probability must be used to evaluate system reliability in each special case, but breaking the system into series and parallel subsystems often simplifies this process. 5.9.3 Redundancy What happens as we add components to a system? For a series of n independent components,
[ ]nS tRtR )()( = and since 1)( ≤tR , adding more components in series will just make things worse! For n components operating in parallel, however,
[ ]nS tRtR )(11)( −−=
which will increase with n. Thus, system reliability can be improved by adding backup components in parallel—a practice called redundancy. How many components must we use to achieve a specified level of system reliability? If we have a fixed value for )(tRS in mind, and if we have independently operating parallel components, then
[ ]nS tRtR )(1)(1 −=−
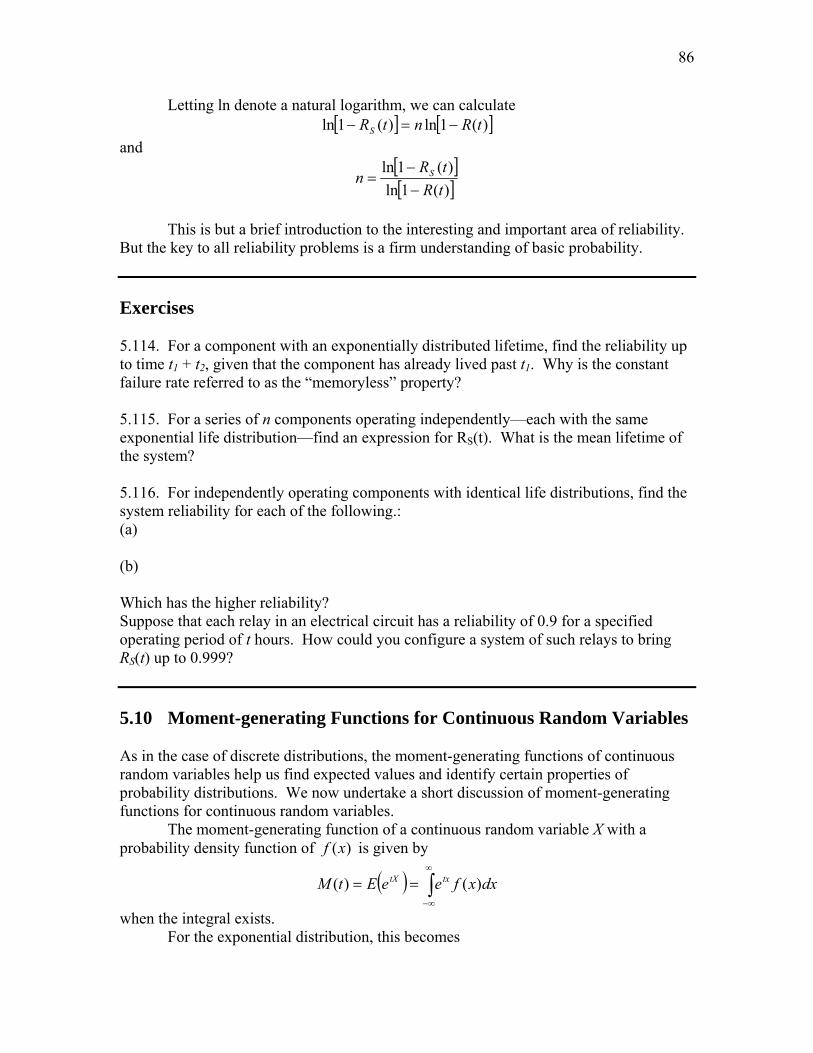
86
Letting ln denote a natural logarithm, we can calculate [ ] [ ])(1ln)(1ln tRntRS −=−
and [ ][ ])(1ln
)(1lntRtR
n S
−−
=
This is but a brief introduction to the interesting and important area of reliability. But the key to all reliability problems is a firm understanding of basic probability. Exercises 5.114. For a component with an exponentially distributed lifetime, find the reliability up to time t1 + t2, given that the component has already lived past t1. Why is the constant failure rate referred to as the “memoryless” property? 5.115. For a series of n components operating independently—each with the same exponential life distribution—find an expression for RS(t). What is the mean lifetime of the system? 5.116. For independently operating components with identical life distributions, find the system reliability for each of the following.: (a) (b) Which has the higher reliability? Suppose that each relay in an electrical circuit has a reliability of 0.9 for a specified operating period of t hours. How could you configure a system of such relays to bring RS(t) up to 0.999? 5.10 Moment-generating Functions for Continuous Random Variables As in the case of discrete distributions, the moment-generating functions of continuous random variables help us find expected values and identify certain properties of probability distributions. We now undertake a short discussion of moment-generating functions for continuous random variables. The moment-generating function of a continuous random variable X with a probability density function of )(xf is given by
( ) ∫∞
∞−
== dxxfeeEtM txtX )()(
when the integral exists. For the exponential distribution, this becomes

87
1
0
/)1(
0
)1/1(
0
/
)1(1
)1(1
1
1
1)(
−
∞−−
∞−−
∞−
−=
⎟⎠⎞
⎜⎝⎛−
Γ=
=
=
=
∫
∫
∫
tt
dxe
dxe
dxeetM
tx
x
xtx
θθθ
θ
θ
θ
θ
θθ
θ
θ
We can now use )(tM to find )(XE , because
)()0(' XEM =
and for the exponential distribution we have
[ ]θ
θθ=
−−−=
=
=−
02 )()1(
)0(')(
ttMXE
Similarly, we could find )( 2XE and then )(XV by using the moment-generating function. An argument analogous to the one used for the exponential distribution shows that, for the gamma distribution,
αβ −−= )1()( ttM
From this we can see that, if X has a gamma distribution,
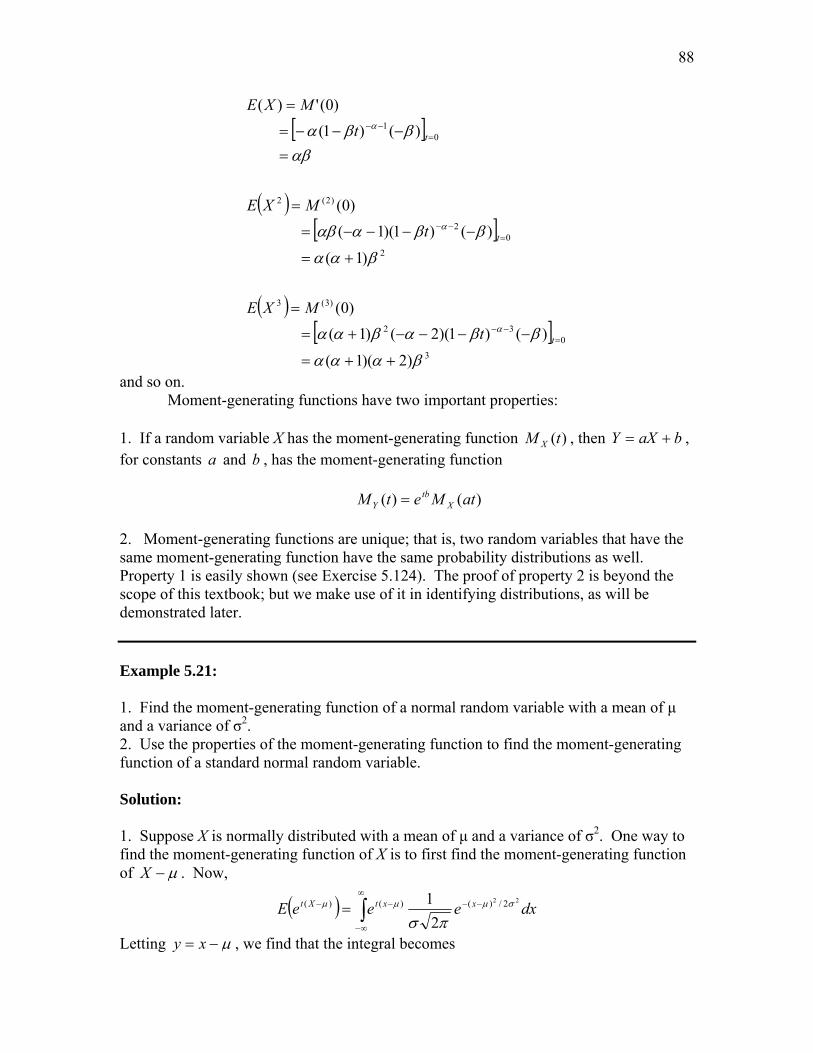
88
[ ]
( )[ ]
( )[ ]
30
32
)3(3
20
2
)2(2
01
)2)(1(
)()1)(2()1()0(
)1(
)()1)(1()0(
)()1()0(')(
βααα
ββαβαα
βαα
ββααβ
αβββα
α
α
α
++=
−−−−+=
=
+=
−−−−=
=
=
−−−=
=
=−−
=−−
=−−
t
t
t
tMXE
tMXE
tMXE
and so on. Moment-generating functions have two important properties: 1. If a random variable X has the moment-generating function )(tM X , then baXY += , for constants a and b , has the moment-generating function
)()( atMetM X
tbY =
2. Moment-generating functions are unique; that is, two random variables that have the same moment-generating function have the same probability distributions as well. Property 1 is easily shown (see Exercise 5.124). The proof of property 2 is beyond the scope of this textbook; but we make use of it in identifying distributions, as will be demonstrated later. Example 5.21: 1. Find the moment-generating function of a normal random variable with a mean of μ and a variance of σ2. 2. Use the properties of the moment-generating function to find the moment-generating function of a standard normal random variable. Solution: 1. Suppose X is normally distributed with a mean of μ and a variance of σ2. One way to find the moment-generating function of X is to first find the moment-generating function of μ−X . Now,
( ) ∫∞
∞−
−−−− = dxeeeE xxtXt 22 2/)()()(
21 σμμμ
πσ
Letting μ−= xy , we find that the integral becomes
89
∫ ∫∞
∞−
∞
∞−
−⎥⎦⎤
⎢⎣⎡ −−= dytyydye yty )2(
21exp
21
21 22
22/ 22
σσπσπσ
σ
Completing the square in the exponent, we have
( ) ( )
( ) 22222
2224222
222
21
21
212
212
21
σσσ
σσσσ
σσ
tty
tttyytyy
+−−=
++−−=−−
so the integral becomes
( ) 2/222
2/ 2222
21exp
21 σσ σ
σπσtt edytye =⎥⎦
⎤⎢⎣⎡ −−∫
∞
∞−
because the remaining integrand forms a normal probability density that integrates to unity. Thus, μ−= XY has the moment-generating function given by
2/22
)( σtY etM =
Thus, by property 1 (stated earlier),
μ+= YX
has the moment-generating function given by
2/
2/
22
22
)()(
σμ
σμ
μ
tt
tt
Yt
X
e
ee
tMetM
+=
=
=
2. Now we will find the distribution of the standardized normal random variable Z. We begin with the random variable X, which is normally distributed with a mean of μ and a variance of σ2. Let
σμ
σσμ
−=−
= XXZ 1
Then, by property 1,
2/
2///
2
222
)(t
tttZ
e
eetM
=
= +− σσσμσμ
90
The moment-generating function of Z has the form of a moment-generating function for a normal random variable with a mean of 0 and a variance of 1. Thus, by property 2, Z must have that distribution. Exercises 5.117. Derive the moment-generating function for the uniform distribution on the interval ),( ba . 5.118. Suppose X has the uniform distribution on the interval ),( ba . a. Using the properties of the moment generating function, derive the moment generating function of dcXY += . b. By looking at the moment generating function derived in part (a), identify the distribution, including parameters of Y. 5.119. Show that a gamma distribution with parameters α and β has the moment- generating function
αβ −−= )1()( ttM 5.120. Using the moment-generating of the gamma distribution with parameters α and β derived in Exercise 5.119, find the mean and variance of that distribution. 5.121. Using the moment-generating function for the exponential distribution with mean θ, find E(X2). Use this result to show that V(X) = θ2. 5.122. Let Z denote a standard normal random variable. Find the moment-generating function of Z directly from the definition. 5.123. Let Z denote a standard normal random variable. Find the moment-generating function of Z2. What does the uniqueness property of the moment-generating function tell you about the distribution of Z2? 5.124. Using the moment-generating function for a normal distribution with parameters μ and σ, verify that the mean is μ and the variance is σ2. 5.125. If a random variable X has the moment-generating function )(tM X , then
baXY += , for constants a and b , has the moment-generating function )()( atMetM X
tbY =
91
5.11. Expectations of Discontinuous Functions and Mixed Probability
Distributions Problems in probability and statistics frequently involve functions that are partly continuous and partly discrete in one of two ways. First, we may be interested in the properties—perhaps the expectation—of a random variable )(Xg that is a discontinuous function of a discrete or continuous random variable X. Second, the random variable of interest may itself have a probability distribution made up of isolated points having discrete probabilities and of intervals having continuous probability. The first of these two situations is illustrated by the following example. Example 5.22: A certain retailer for a petroleum product sells a random amount X each day. Suppose that X (measured in hundreds of gallons) has the probability density function
⎪⎩
⎪⎨⎧
≤≤⎟⎠⎞
⎜⎝⎛
=elsewhere
xxxf,,0
20,83
)(2
The retailer’s profit turns out to be $5 for each 100 gallons sold (5 cents per gallon) if X ≤ 1, and $8 per 10 gallons if X > 1. Find the retailer’s expected profit for any given day. Solution: Let g(X) denote the retailer’s daily profit. Then
⎩⎨⎧
≤<≤≤
=21,810,5
)(XXXX
xg
We want to find expected profit, and
92
[ ] [ ]
72.1132
)24)(15(
)15(3224)1(
3215
)4)(8(24
)4)(8(15
838
835
)()()]([
21
410
4
2
1
21
0
2
=
=
+=
+=
⎥⎦
⎤⎢⎣
⎡⎟⎠⎞
⎜⎝⎛+⎥
⎦
⎤⎢⎣
⎡⎟⎠⎞
⎜⎝⎛=
=
∫∫
∫∞
∞−
xx
dxxxdxxx
dxxfxgXgE
Thus, the retailer can expect to profit by $11.72 on the daily sale of this particular product. A random variable X that has some of its probability at discrete points and the remainder spread over intervals is said to have a mixed distribution. Let )(xF denote a distribution function representing a mixed distribution. For practical purposes, any mixed distribution function )(xF can be written uniquely as
)()()( 2211 xFcxFcxF +=
where )(1 xF is a step distribution function, )(2 xF is a continuous distribution function,
1c is the accumulated probability of all discrete points, and 12 1 cc −= is the accumulated probability of all continuous portions. The following example offers an instance of a mixed distribution. Example 5.23: Let X denote the life length (in hundreds of hours) of a certain type of electronic component. These components frequently fail immediately upon insertion into a system; the probability of immediate failure is ¼. If a component does not fail immediately, its life-length distribution has the exponential density
⎩⎨⎧ >
=−
elsewherexe
xfx
,00,
)(
Find the distribution function for X, and evaluate P(X > 10).
93
Solution: There is only one discrete point, X = 0, and this point has probability ¼. Hence, c1 = ¼ and c2 = ¾. It follows that X is a mixture of two random variables, X1 and X2, where X1 has a probability of 1 at the point 0 and X2 has the given exponential density; that is
⎩⎨⎧
≥<
=0,10,0
)(1 xx
xF
and
0,1
)(0
1
>−=
=
−
−∫xe
dyexF
x
xy
Now,
)(43)(
41)( 21 xFxFxF ⎟
⎠⎞
⎜⎝⎛+⎟
⎠⎞
⎜⎝⎛=
Hence,
10
10
10
43
)]1(1[43
)1(43)1(
411
)10(1)10(1)10(
−
−
−
⎟⎠⎞
⎜⎝⎛=
−−⎟⎠⎞
⎜⎝⎛=
⎥⎦⎤
⎢⎣⎡ −+−=
−=≤−=>
e
e
e
FXPXP
An easy method for finding expectations of random variables that have mixed distributions is given in Definition 5.5.
Definition 5.5. Let X have the mixed distribution function )()()( 2211 xFcxFcxF +=
And suppose that 1X is a discrete random variable having distribution function )(1 xF and 2X is a continuous random variable having distribution function )(2 xF . Let
)(Xg denote a function of X. Then )]([)]([)]([ 2211 XgEcXgEcXgE +=

94
Example 5.24: Find the mean and the variance of the random variable defined in Example 5.23. Solution: With all definitions remaining as given in Example 5.23, it follows that
E(X1) = 0
and
∫∞
− ==0
2 1)( dyyeXE y
Therefore,
43
)(43)(
41
)(
21
=
⎟⎠⎞
⎜⎝⎛+⎟
⎠⎞
⎜⎝⎛=
=
XEXE
XEμ
Also, 0)( 2
1 =XE and
∫∞
− ==0
222 2)( dyeyXE y
Therefore,
23
)2(43)0(
41
)(43)(
41)( 2
221
2
=
⎟⎠⎞
⎜⎝⎛+⎟
⎠⎞
⎜⎝⎛=
⎟⎠⎞
⎜⎝⎛+⎟
⎠⎞
⎜⎝⎛= XEXEXE
Then,
165
43
23
)()(2
22
=
⎟⎠⎞
⎜⎝⎛−=
−= μXEXV
95
For any nonnegative random variable X, the mean can be expressed as
∫∞
−=0
)](1[)( dttFxE
where )(tF is the distribution function for X. To see this, write
∫ ∫ ∫∞ ∞ ∞
⎟⎟⎠
⎞⎜⎜⎝
⎛=−
0 0 1
)()](1[ dtdxxfdttF
Upon changing the order of integration, we find that the integral becomes
∫∫ ∫∞∞
==⎟⎟⎠
⎞⎜⎜⎝
⎛
00 0
)()()( XEdxxxfdXdttfx
Employing this result for the mixed distribution of Examples 5.23 and 5.24, we see that
0,43)(1 >=− − xforexF x
and
[ ]
4343
43
)](1[)(
0
0
0
=
−=
=
−=
∞
∞−
∞
∫
∫
t
t
e
dte
dttFXE
< Exercises 5.126. A retail grocer has daily demand X for a certain food that is sold by the pound wholesale. Food left over at the end of the day is a total loss. The grocer buys the food for $6 per pound and sells it for $10 per pound. If demand is uniformly distributed over the interval 0 to 1 pound, how much of this food should the grocer order to maximize his expected daily profit?

96
5.127. Suppose that a distribution function has the form
⎪⎪⎩
⎪⎪⎨
⎧
≤<≤
<≤+<
=
xxx
xxx
xF
1,115.0,5.00,1.00,0
)(2
a. Describe F1(x) and F2(x), the discrete and continuous components of F(x). b. Write F(X) as
)()( 2211 xFcxFc +
c. Sketch F(x).
d. Find the expected value of the random variable whose distribution function is F(x). 5.128. Let X denote the length of time a sensitive plant survives after transplant. 20% of the plants die immediately after transplant (time = 0). For the plants that survive transplant, the distribution of the time the plant survives is exponentially distributed with a mean of one. Thus, the distribution of the time that a plant lives after transplant is a mixture distribution. a. State and graph the distribution function for the discrete distribution in the mixture. b. State and graph the distribution function for the continuous distribution in the mixture. c. Find the mixture distribution function and sketch it. 5.129. The duration X of telephone calls coming through a cellular phone is a random variable whose distribution function is
⎪⎩
⎪⎨⎧
>−−
≤= −− 0,
31
321
0,0)( ]3/[3/ xee
xxF xx
where [y] denotes the greatest integer less than or equal to y. a. Sketch F(x) b. Find P(X ≤ 6). c. Find P(X > 4). d. Describe the discrete and continuous parts that make up F(x). e. Find E(X). 5.12. Activities for Students: Simulation When generating random variables from a continuous distribution with a (cumulative) distribution function (CDF) of F(x), we may wish to use the inverse transformation method or inverse CDF method. The procedure for this method is as follows: 1. Generate Ri, which is uniform over the interval (0, 1). This is denoted as Ri ~ U(0, 1).

97
2. Let Ri = F(X), where F(x) is the CDF for the distribution of values of x. 3. Evaluate step 2 for X, which gives X = F-1(R). 5.12.1. Uniform Distribution The probability density function (pdf) for the uniform distribution is defined as
)/(1)( abxf −= , bxa ≤≤ . The CDF is given by )/()()( abaxxF −−= . Using the inverse CDF method to generate uniform random numbers xi, we let )/()( abaxr ii −−= . Solving for xi, we obtain ii rabax )( −+= . 5.12.2. Exponential Distribution The pdf for exponential distribution is defined as θθ /)/1()( xexf −= , for x ≥ 0. The CDF is given by θ/1)( xexF −−= . Using the inverse CDF method, we can generate exponential random numbers xi, by letting θ/1 ix
i er −−= . Solving for xi, we get
ix re i −=− 1/θ . Taking the ln on both sides, we obtain )1ln( ii rx −−= θ . Because (1 – ri)
~ U(0, 1), we let )ln( ii rx θ−= . 5.12.3. Gamma Distribution If Xi is a random variable from the gamma distribution, with parameters (α, β), and if α is an integer n, then Xi is the convolution (sum) of n exponential random variables Yj, with parameter β. Thus, to simulate a gamma random variable Xi, generate n exponential random variables as described earlier. Then, ∑= ji YX , where j = 1, 2, …, n. 5.12.4. Poisson Distribution We noted in Chapter 4 that the method of generating Poisson random variables would appear in this chapter. The procedure that follows requires us to make use of exponential random variables. If the number of events in an interval of a specified unit length follows the Poisson distribution, then the waiting time between successive events in the interval follows an exponential distribution with θ = 1/λ, where λ is the average value of the Poisson random variable. Thus, we can generate exponential random variables as many times as are necessary until the sum of these exponential random variables exceeds the length of the interval (L) under consideration. Let n represent the number of exponential random variables generated. The Poisson random variable will be given by Yj = n – 1. For example, suppose that we desire to generate Poisson random variables from a distribution with a mean rate of λ = 2 arrivals per day. Let L = 1 day. We proceed to generate exponential random variables with mean θ = ½ until the sum of the exponentials exceeds L = 1. The Poisson random variable Yj is given by n – 1. We can simplify this procedure. Let ii RX ln)/1( λ−= . The random variable Yj is defined as the value of (n –
98
1) such that ∑∑=
−
=
<≤n
ii
n
ii XLX
1
1
1
. Replacing Xi, we have ∑∑=
−
=
−<≤−n
ii
n
ii RLR
1
1
1ln)(ln λ .
Recall that ∏∑ = ii RR ln)ln( . Multiplying by (–1), we have
∏∏=
−
=
>−≥n
ii
n
ii RLR
1
1
1
ln)(ln λ
∏∏=
−−
=
>≥n
ii
Ln
ii ReR
1
)(1
1
λ
Therefore, the method for generating Poisson random variables can be stated as follows: 1. Let )(Lew λ−= , with z = 1 and i = 0. 2. Generate Ri ~ U(0, 1). Replace z by zRi. If z < w, then output Y = i and return to step 1; otherwise, proceed to step 3. 3. Replace i by i + 1 and return to step 2. 5.12.5. Normal Distribution In attempting to use the inverse CDF method to generate normal random variables, we encounter the problem that there is no explicit closed-form expression for the CDF of x, given by F(x), or of the inverse function F-1(R). Methods of approximation have been developed, however, that work well in simulating normal random variables. A few of these will be discussed briefly here. Box-Muller Polar Method for Standard Normal Variables This method can be used to generate a pair of standard normal random variables. The following steps are involved. 1. Generate R1 and R2, which are two uniform numbers on (0, 1). 2. Evaluate )2cos()ln2( 21 RRZ i π−= and )2sin()ln2( 22 RRZ i π−= . 3. The normal random variables X1 and X2, with mean μX and standard deviation σX, are given be 1111 σμ ZX += and 2222 σμ ZX += . Central Limit Theorem Method Discussion of this method will be deferred until Chapter 8. Let us now consider some situations where simulation in regard to the distributions mentioned earlier might be useful. First, we look at the discrete Poisson distribution. Suppose that a local business firm is interested in comparing the number of local telephone calls to the number of long-distance calls coming into their switchboard. Assuming independence, we define X as representing the number of local calls received during a 15-minute period. A random variable of interest would be W = X/Y, where X and Y represent Poisson random variables with parameters λ1 and λ2, respectively. How will the distribution of W behave, given the restriction that Y cannot take on the value of 0?
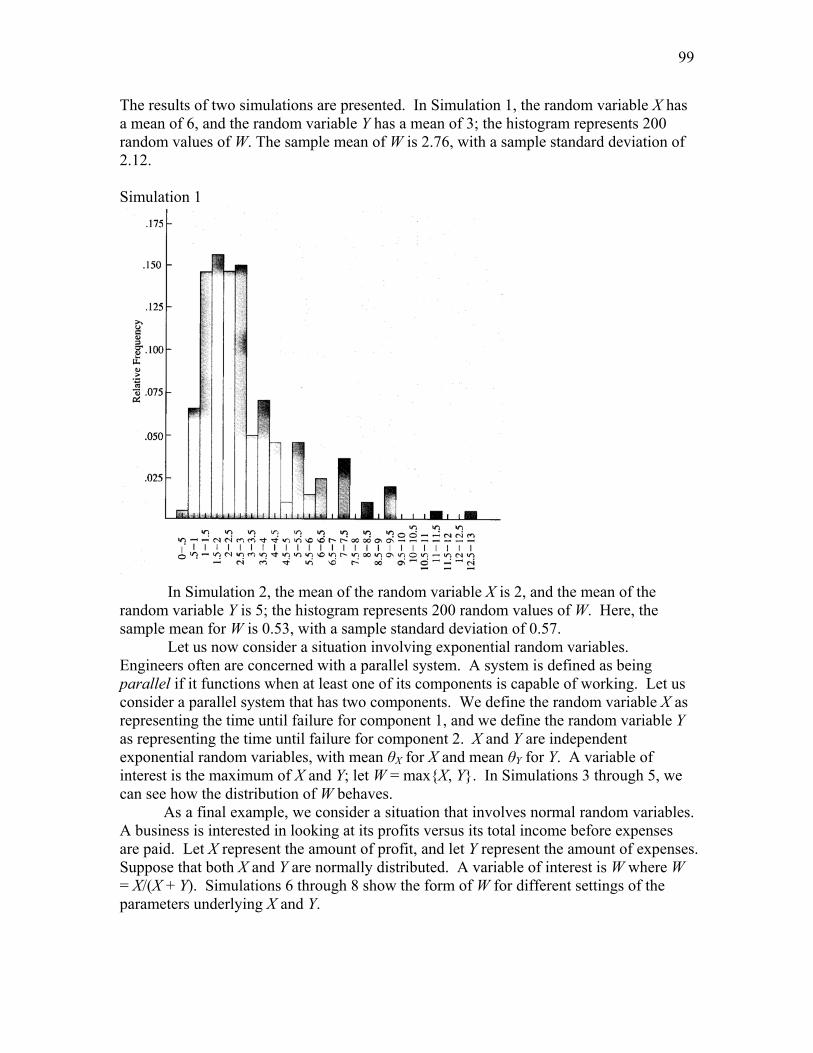
99
The results of two simulations are presented. In Simulation 1, the random variable X has a mean of 6, and the random variable Y has a mean of 3; the histogram represents 200 random values of W. The sample mean of W is 2.76, with a sample standard deviation of 2.12. Simulation 1
In Simulation 2, the mean of the random variable X is 2, and the mean of the
random variable Y is 5; the histogram represents 200 random values of W. Here, the sample mean for W is 0.53, with a sample standard deviation of 0.57. Let us now consider a situation involving exponential random variables. Engineers often are concerned with a parallel system. A system is defined as being parallel if it functions when at least one of its components is capable of working. Let us consider a parallel system that has two components. We define the random variable X as representing the time until failure for component 1, and we define the random variable Y as representing the time until failure for component 2. X and Y are independent exponential random variables, with mean θX for X and mean θY for Y. A variable of interest is the maximum of X and Y; let W = max{X, Y}. In Simulations 3 through 5, we can see how the distribution of W behaves. As a final example, we consider a situation that involves normal random variables. A business is interested in looking at its profits versus its total income before expenses are paid. Let X represent the amount of profit, and let Y represent the amount of expenses. Suppose that both X and Y are normally distributed. A variable of interest is W where W = X/(X + Y). Simulations 6 through 8 show the form of W for different settings of the parameters underlying X and Y.
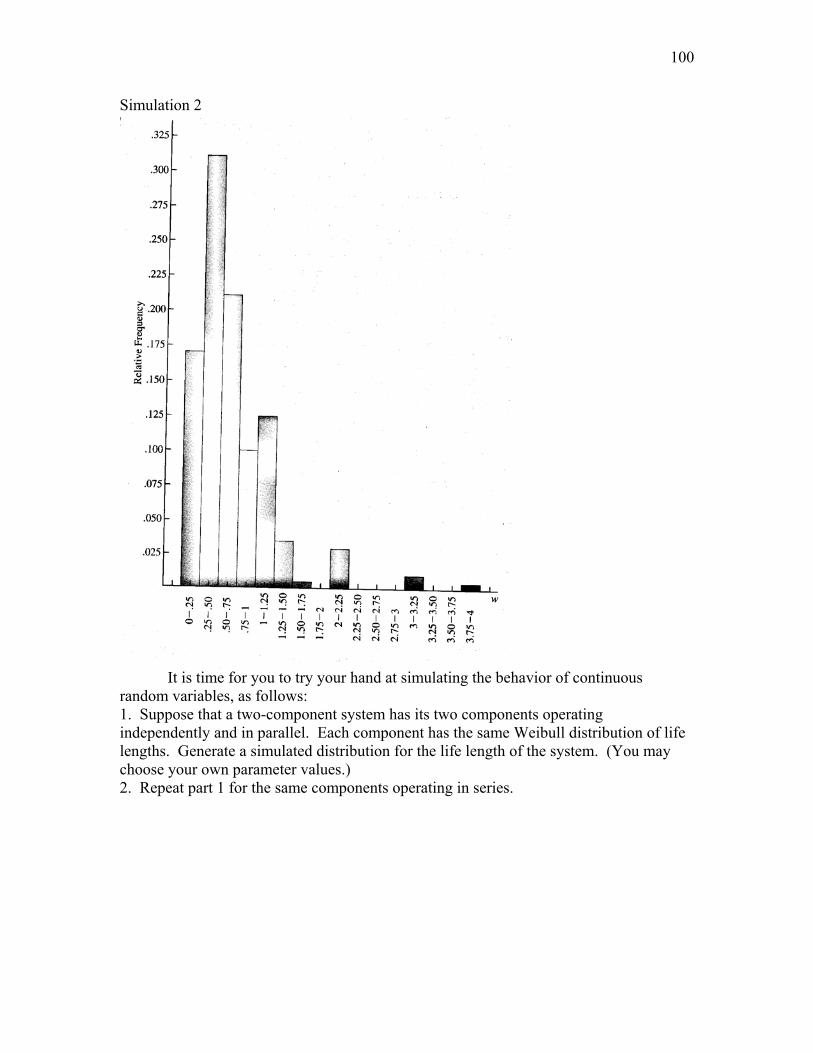
100
Simulation 2
It is time for you to try your hand at simulating the behavior of continuous random variables, as follows: 1. Suppose that a two-component system has its two components operating independently and in parallel. Each component has the same Weibull distribution of life lengths. Generate a simulated distribution for the life length of the system. (You may choose your own parameter values.) 2. Repeat part 1 for the same components operating in series.
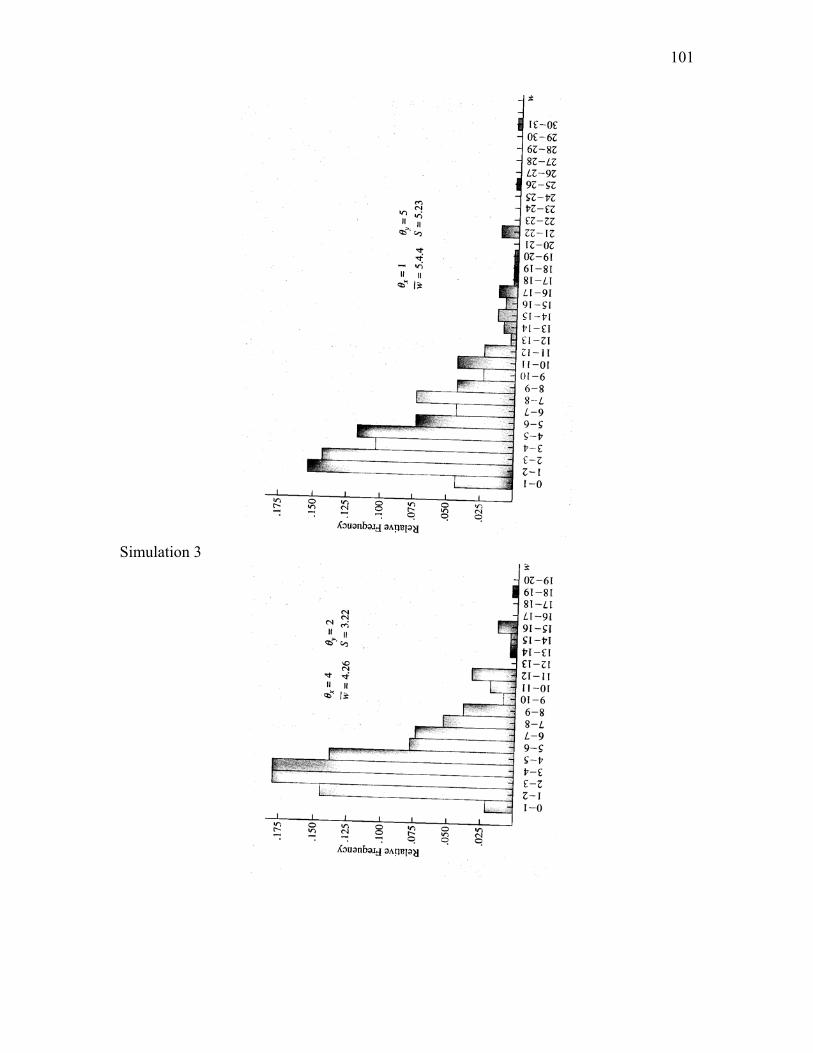
101
Simulation 3
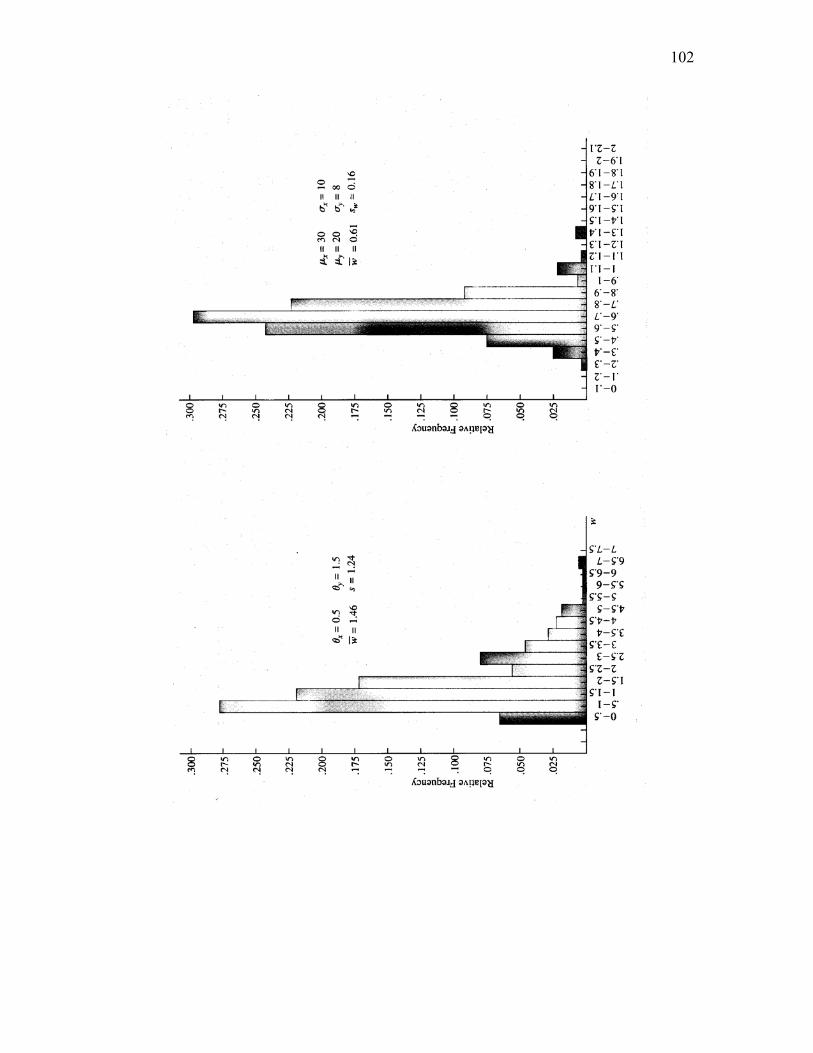
102
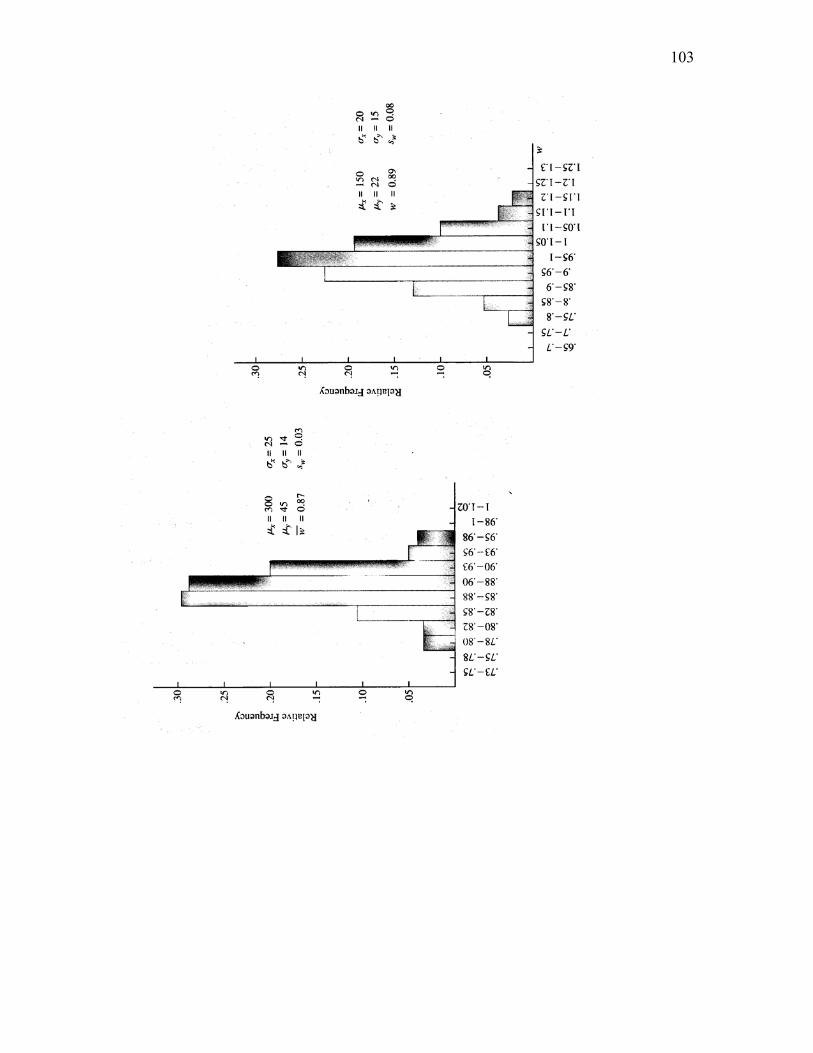
103
104
5.13. Summary Practical applications of measurement, such as to improve the quality of a system, often require careful study of the behavior of observations measured on a continuum (time, weight, distance, or the like). Probability distributions for such measurements are characterized by probability density functions and cumulative distribution functions. The uniform distribution models the waiting time for an event that is equally likely to occur anywhere on a finite interval. The exponential model is useful for modeling the lengths of time between occurrences of random events. The gamma model fits the behavior of sums of exponential variables and, therefore, models the total waiting time until a number of random events have occurred. The most widely used continuous probability model is the normal, which exhibits the symmetric mound-shaped behavior often seen in data. For data that is mound-shaped, but skewed, the Weibull provides a useful and versatile model. All models are approximations to reality, but the ones discussed here are relatively easy to use and yet provide good approximations in a variety of settings. ________________________________________________________________________ Supplementary Exercises 5.130. Let Y possess a density function
⎪⎩
⎪⎨⎧ ≤≤
= elsewhere
ycyyf ,0
40,)(
a. Find c. b. Find F(y). c. Graph f(y) and F(y). d. Use F(y) from part (b) to find P(1 ≤ Y ≤ 2). d. Use the geometric figure for f(y) from part (c) to calculate P(1 ≤ Y ≤ 2). 5.131. Let Y possess a density function
⎪⎩
⎪⎨⎧ ≤≤+
=elsewhere
ycyyyf
,0
20,)(
2
a. Find c. b. Find F(y). c. Graph f(y) and F(y). d. Use F(y) from part (b) to find F(-1), F(0), and F(1). e. Find P(1 ≤ Y ≤ 2.5). f. Find the mean and the variance of Y. 5.132. Let Y possess a density function

105
⎪⎪⎩
⎪⎪⎨
⎧
≤<+
≤≤−
=elsewhere
ycyy
yf,0
10,2.001,2.0
)(
a. Find c. b. Find F(y). c. Graph f(y) and F(y). d. Use F(y) from part (b) to find F(-1), F(0), and F(1). e. Find P(-0.5 ≤ Y ≤ 0.25). f. Find the mean and the variance of Y. 5.133. Refer to Exercise 5.132. a. Find the moment generating function for Y. b. Find the mean and the variance of Y using the moment generating function. 5.134. Suppose Y has the following distribution function:
( )⎪⎪⎩
⎪⎪⎨
⎧
>
≤<−
≤
=
3,1
30,2927
0,0
)(2
y
yxxy
yF
a. Verify that F is a distribution function. b. Find f(y). c. Graph f(y) and F(y). d. Find P(0.5 ≤ Y ≤ 1.5). e. Find the mean and the variance of Y. 5.135. Suppose Y has the following distribution function:
( )⎪⎪⎩
⎪⎪⎨
⎧
>≤<+
≤
=2,120,2.01.00,0
)(yyyyy
yF
a. Verify F is a distribution function. b. Find f(y). c. Graph f(y) and F(y). d. Find P(0.5 ≤ Y ≤ 1.5). e. Find the mean and the variance of Y. 5.136. The grade-point averages of a large population of college students are approximately normally distributed, with a mean equal to 2.4 and a standard deviation equal to 0.5. What fraction of the students possess a grade-point average in excess of 3.0?

106
5.137. Referring to Exercise 5.136, if students who possess a grade-point average equal to or less than 1.9 are dropped from college, what percentage of the students will be dropped? 5.138. Referring to Exercise 5.136, suppose that three students are selected at random from the student body. What is the probability that all three possess a grade-point average in excess of 3.0? 5.139. A machine operation produces bearings whose diameters are normally distributed, with mean and standard deviation of 3.005 and 0.001, respectively. Customer specifications require that the bearing diameters lie in the interval 3.000 ± 0.0020. Units falling outside the interval are considered scrap and must be remachined or used as stock for smaller bearings. At the current machine setting, what fraction of total production will be scrap? 5.140. Let Y have the density function
⎪⎩
⎪⎨⎧ ∞<≤
=
−
elsewhere
ycyeyf
y
,0
0,)(
2
a. Find the value of c. b. Give the mean and the variance for Y. c. Give the moment-generating function for Y. 5.141. The yield force of a steel reinforcing bar of a certain type is found to be normally distributed, with a mean of 8500 pounds and a standard deviation of 80 pounds. If three such bars are to be used on a certain project, find the probability that all three will have yield forces in excess of 8700 pounds. 5.142. An engineer has observed that the gap times between vehicles passing a certain point on a highway have an exponential distribution, with a mean of 8 seconds. a. Find the probability that the next gap observed will be no longer than 1 minute. b. Find the probability density function for the sum of the next four gap times to be observed. What assumptions must be true for this answer to be correct? 5.143. The proportion of time, per day, that all checkout counters in a supermarket are busy is a random variable X that has the probability density function
⎩⎨⎧ ≤≤−
=elsewhere
cxkxyf
,010,)1(
)(42
a. Find the value of k that makes this a probability density function. b. Find the mean and the variance of X.
107
5.144. Based on the 1988 National Survey of Families and Households, it was reported that men spent a mean of 18.1 hours per week doing housework. Suppose the standard deviation was 12.9 hours. a. Assuming a normal distribution, sketch the approximate distribution of the number of hours a randomly selected man spent doing housework in 1988. b. Based on the graph in the previous question, explain why the population distribution is very unlikely to be normal and why it is most likely skewed to the right. c. What proportion of men spent an average of 20 hours or more on housework each week in 1988? d. What proportion of men spent less than an average of 5 hour on housework each week in 1988? 5.145. Refer to the setting in Exercise 5.144. Suppose now that we use the Weibull distribution to model these data. a. What values of the parameters would be used? b. What proportion of men spent an average of 20 hours or more on housework each week in 1988? c. What proportion of men spent less than an average of 5 hours on housework each week in 1988? d. Compare the results in (b) and (c) to those obtained using the gamma distribution. 5.146. If the life length X of a certain type of battery has a Weibull distribution, with γ = 2 and θ = 3 (with measurement in years), find the probability that such a battery will last less than 4 years given that it is now 2 years old. 5.147. The time (in hours) a manager takes to interview an applicant has an exponential distribution with θ = ½. Three applicants arrive at 8:00 a.m., and the interviews begin. A fourth applicant arrives at 8:45 a.m. What is the probability that the latecomer must wait before seeing the manager. 5.148. The weekly repair cost Y for a certain machine has a probability density function given by
⎪⎩
⎪⎨⎧ ≤≤−
=elsewhere
yyyf
,0
10,)1(3)(
2
with measurements in $100s. How much money should be budgeted each week for repair cost to ensure that the actual cost exceeds the budgeted amount only 10% of the time? 5.149. If the life length X of a certain type of battery has a Weibull distribution with γ = 2 and θ = 3 (with measurements in years), find the probability that such a battery will last less than 3 years given that it is now 2 years old. 5.150. The relationship between incomplete gamma integrals and sums of Poisson probabilities is given by
108
11
0
1( ) !
y yy
y
ey e dyy
αα
λ
λα
∞ −−− −
=
=Γ ∑∫
for integer values of α. If Y has a gamma distribution, with α = 2 and β = 1, find P(Y > 1) by using this equality. 5.151. A random variable X is said to have a log-normal distribution if Y = ln(X) has a normal distribution. (The symbol ln denotes natural logarithm.) In this case, X must not be negative. The shape of the log-normal probability density function is similar to that of the gamma. The shape of the log-normal probability density function is similar to that of the gamma distribution, with long tails to the right. The equation of the log-normal density function is
2 2(ln( ) ) / 21 , 0( ) 2
0,
xe xf x x
elsewhere
μ σ
σ π− −⎧ >⎪= ⎨
⎪⎩
Since ln(x) is a monotonic function of x,
( ) [ln( ) ln( )] [ ln( )]P X x P X x p Y x≤ = ≤ = ≤
where Y has a normal distribution with mean μ and variance σ2. Thus probabilities in the log-normal case can be found by transforming them into probabilities in the normal case. If X has a log-normal distribution, with μ = 4 and σ2 = 1, find the following probabilities. a. P(X ≤ 5) b. P(X > 7) 5.152. If X has a log-normal distribution, with parameters μ and variance σ2, it can be shown that
2 / 2( )E X eμ σ+= and
( )2 22( ) 1V X e eμ σ σ+= −
The grains composing polycrystalline metals tend to have weights that follow a log normal distribution. For a certain type of aluminum, grain weights hae a log normal distribution with μ = 3 and σ = 4 (in units of 10-2 gram), a. Find the mean and the variance of the grain weights. b. Find an interval within which at least 75% of the grain weights should lie (use Tchebysheff’s Theorem). 5.153. The lethal dose, the amount of a chemical or other toxin that will cause death, varies from individual to individual. The distribution of the lethal dose for a population is often modeled using a log-normal distribution; that is, the proportion of individuals who die with a dose X of the chemical or toxin is distributed according to the log-normal
109
distribution. In a study of the mortality of a particular beetle, beetles were exposed to varying levels of gaseous carbon disulfide for 5 hours. The log-normal distribution with μ = 4 log mg/liter and σ = 1 mg/liter of carbon disulfide described the data well. a. Find the mean and the variance of the lethal dose of carbon disulfide after 5 hours of exposure for this population of beetles. b. Find an interval of carbon disulfide within which at least 75% of the beetles would perish. 5.154. Refer to Exercise 5.153. A large study explored the dose-response relation for inhalation anthrax in a certain type of monkeys. The log-normal distribution provided a good model for the data. Suppose the median lethal dose was 4200 spores. The standard deviation of the lethal dose was found to be 400 spores. a. Find the mean lethal dose. (Recall: Because the lognormal is not symmetric, the median and mean are not equal.) b. Find the parameters μ and σ2. 5.155. Let Y denote a random variable whose probability density function is given by
| |1( ) ,
2yf y e y−⎛ ⎞= −∞ < < ∞⎜ ⎟
⎝ ⎠
Find the moment-generating function of Y, and use it to find E(Y). 5.156. The life length Y of a certain component in a complex electronic system is known to have an exponential density with a mean of 100 hours. The component is replaced at failure or at age 200 hours, whichever comes first. a. Find the distribution function for X, the length of time that the component is in use. b. Find E(X). 5.157. We can show that the normal density function integrates to unity by showing that
2(1/ 2)1 1
2uye dy
uπ
∞−
−∞
=∫
This, in turn, can be shown by considering the product of two such integrals,
( )2 22 2 (1/ 2)(1/ 2) (1/ 2)1 1
22u x yuy uxe dy e dx e dxdy
ππ
∞ ∞ ∞ ∞− +− −
−∞ −∞ −∞ −∞
⎛ ⎞⎛ ⎞ ⎛ ⎞=⎜ ⎟⎜ ⎟ ⎜ ⎟
⎝ ⎠⎝ ⎠ ⎝ ⎠∫ ∫ ∫ ∫
By transforming the expression to polar coordinates, show that the double integral is equal to 1/u. 5.158. The function ( )uΓ is defined by
110
1
0
( ) u yu y e dy∞
− −Γ = ∫
Integrate by parts to show that ( ) ( 1) ( 1)u u uΓ = − Γ −
Hence, if n is a positive integer, then ( ) ( 1)!n nΓ = − Show that π=Γ )2/1( , by writing
∫∞
−−=⎟⎠⎞
⎜⎝⎛Γ
0
2/1
21 dyey y
and making the transformation y = (1/2)x2, and employing the result of Exercise 5.157. 5.159. The function B(α, β) is defined by
1
1 1
0
( , ) (1 )B y y dyα βα β − −= −∫
a. Let y = sin2θ, and show that / 2
2 1 2 1
0
( , ) 2 sin cosB dπ
α βα β θ θ θ− −= ∫
b. Write ( ) ( )α βΓ Γ as a double integral, transform the integral to polar coordinates, and conclude that
( ) ( )( , )( )
B α βα βα β
Γ Γ=Γ +
5.160. The lifetime X of a certain electronic component is a random variable with density function
/801 , 080( )
0,
xe xf x
elsewhere
−⎧⎛ ⎞ >⎜ ⎟⎪⎝ ⎠= ⎨⎪⎩
Three of these components operate independently in a piece of equipment. The equipment fails if at least two of the components fail. Find the probability that the equipment will operate for at least 150 hours without failure. References Abernethy, Robert B., J. E. Breneman, C. H. Medlin and G. L. Reinman. 1983. Weibull Analysis Handbook, U.S. Air Force AFWAL-TR-83-2079, AD #A143100
111
Aksoy, Hafzullah. 2000. Us of gamma distribution in hydrological analysis. Turkish Journal of Engineering and Environmental Sciences 24: 419-428. Barger, G.L.and H.C.S. Thom. 1949. A method for characterizing drought intensity in Iowa. Agronomy Journal 41: 13-19. Baseball Almanac. 2006. http://www.baseball-almanac.com/. Chu, Singfat. 2003. Using soccer goals to motivate the Poisson process. INFORMS Transactions on Education 3(2): http://ite.pubs.informs.org/Vol3No2/Chu/. Cohen A. C., Whitten B. J., Ding Y. 1984. Modified moment estimation for the three-parameter Weibull distribution. Journal of Quality Technology 16: 159-167. David, H.A and A.W.F. Edwards. 2001. Annotated Readings in the History of Statistics. Springer: New York. Essington, T.E., and J.F. Kitchell. 1999. New perspectives in the analysis of fish distributions: A case study on the spatial distribution of largemouth bass. Canadian Journal of Fisheries and Aquatic Sciences 56:52-60. Flynn, Michael R. 2004. A stochastic differential equation for exposure yields a beta distribution. Annals of Occupational Hygiene 48: 491-497. Folks, J. L. (1981). Ideas of Statistics. New York: John Wiley & Sons. Mahalel, D. and A.S. Hakkert. 1983. Traffic arrival patterns on a cross section of a multilane highway. Transportation Research 4: 263-270. Massman, W.J. 1982. Foliage distribution in old-growth coniferous tree canopies. Canadian Journal of Forest Research 12: 10-17. Michelson, A.A. 1878. Experimental determination of the velocity of light. Proceedings of the American Association for the Advancement of Science 27: 71-77. Perruzzi, Joseph J. and E.J. Hilliard, Jr. 1984. Modeling time-delay measurement errors using a generalized beta density function. The Journal of the Acoustical Society of America 75: 197-201. Pinder, John E. III, James G. Wiener, and Michael H. Smith. 1978. The Weibull distribution: A new method of summarizing survivorship data. Ecology 59: 175-179. Pyke. R. 1965. Spacings, with discussion. Journal of the Royal Statisticsl Society, series B 27: 394-449.

112
Stigler, Stephen M. (1986). The History of Statistics: The Measurement of Uncertainty before 1900. Cambridge, Massachusetts: The Belknap Press of Harvard University Press. Uspensky, V. 1937. Introduction to Mathematical Probability. McGraw-Hill Book Company, Inc.: New York. Zimmels, Y. 1983. Theory of hindered sedimentation of polydisperse mixturess. American Institute Chemical Engineers Journal 29: 669-75.