ECO220Y Continuous Probability Distributions: Uniform and...
20
ECO220Y Continuous Probability Distributions: Uniform and Triangle Readings: Chapter 9, sections 9.8-9.9 Fall 2011 Lecture 8 Part 1 (Fall 2011) Probability Distributions Lecture 8 Part 1 1 / 19
Transcript of ECO220Y Continuous Probability Distributions: Uniform and...
ECO220YContinuous Probability Distributions:
Uniform and TriangleReadings: Chapter 9, sections 9.8-9.9
Fall 2011
Lecture 8 Part 1
(Fall 2011) Probability Distributions Lecture 8 Part 1 1 / 19
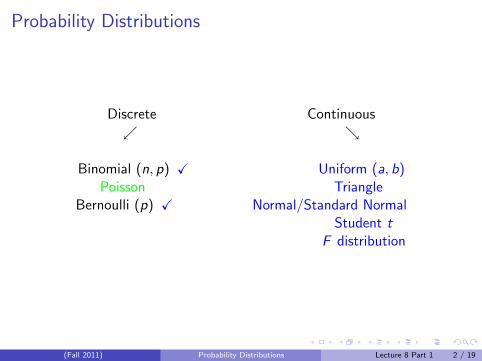
Probability Distributions
Discrete Continuous↙ ↘
Binomial (n, p) X Uniform (a, b)Poisson Triangle
Bernoulli (p) X Normal/Standard NormalStudent t
F distribution
(Fall 2011) Probability Distributions Lecture 8 Part 1 2 / 19
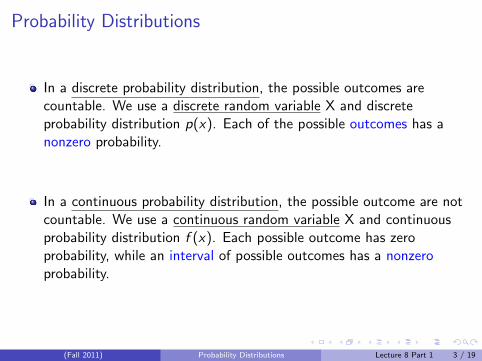
Probability Distributions
In a discrete probability distribution, the possible outcomes arecountable. We use a discrete random variable X and discreteprobability distribution p(x). Each of the possible outcomes has anonzero probability.
In a continuous probability distribution, the possible outcome are notcountable. We use a continuous random variable X and continuousprobability distribution f (x). Each possible outcome has zeroprobability, while an interval of possible outcomes has a nonzeroprobability.
(Fall 2011) Probability Distributions Lecture 8 Part 1 3 / 19
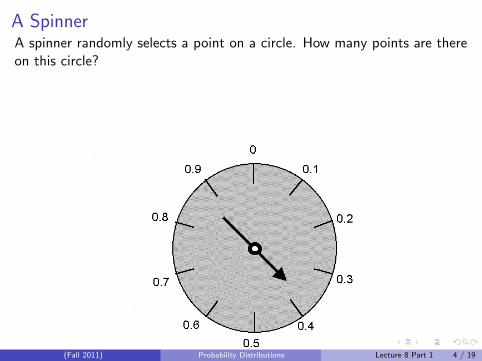
A SpinnerA spinner randomly selects a point on a circle. How many points are thereon this circle?
(Fall 2011) Probability Distributions Lecture 8 Part 1 4 / 19
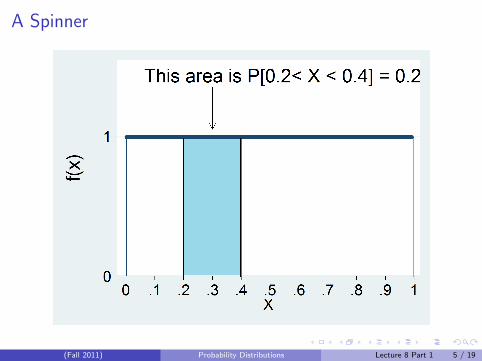
A Spinner
(Fall 2011) Probability Distributions Lecture 8 Part 1 5 / 19
Probability Density Function
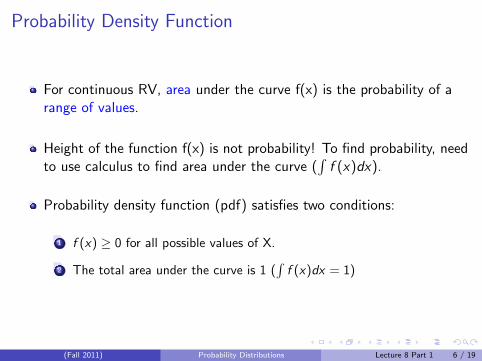
For continuous RV, area under the curve f(x) is the probability of arange of values.
Height of the function f(x) is not probability! To find probability, needto use calculus to find area under the curve (
∫f (x)dx).
Probability density function (pdf) satisfies two conditions:
1 f (x) ≥ 0 for all possible values of X.
2 The total area under the curve is 1 (∫
f (x)dx = 1)
(Fall 2011) Probability Distributions Lecture 8 Part 1 6 / 19
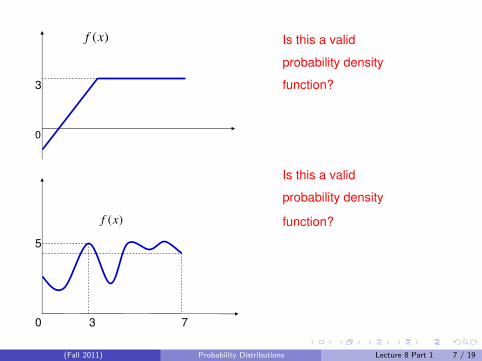
)(xf
Is this a valid
probability density
3 function?
0
Is this a valid
probability density
)(xf function?
5
0 3 7
(Fall 2011) Probability Distributions Lecture 8 Part 1 7 / 19
Uniform Distribution
All outcomes are equally likely.
All values have equal chance - 0. (Why?)
Often referred as Rectangular distribution because the graph of thepdf has the form of a rectangle.
P(X < x) = P(X ≤ x). Why?
(Fall 2011) Probability Distributions Lecture 8 Part 1 8 / 19
Uniform Probability Distribution
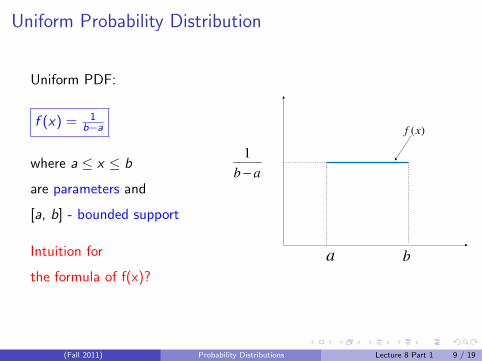
Uniform PDF:
f (x) = 1b−a
where a ≤ x ≤ b
are parameters and
[a, b] - bounded support
Intuition for
the formula of f(x)?
)(xf
ab −
1
a b
(Fall 2011) Probability Distributions Lecture 8 Part 1 9 / 19
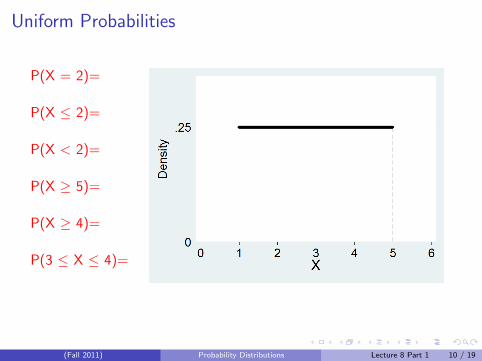
Uniform Probabilities
P(X = 2)=
P(X ≤ 2)=
P(X < 2)=
P(X ≥ 5)=
P(X ≥ 4)=
P(3 ≤ X ≤ 4)=
(Fall 2011) Probability Distributions Lecture 8 Part 1 10 / 19
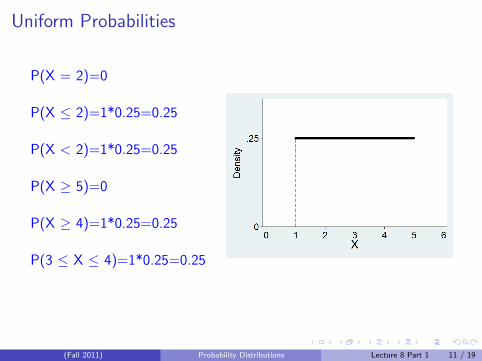
Uniform Probabilities
P(X = 2)=0
P(X ≤ 2)=1*0.25=0.25
P(X < 2)=1*0.25=0.25
P(X ≥ 5)=0
P(X ≥ 4)=1*0.25=0.25
P(3 ≤ X ≤ 4)=1*0.25=0.25
(Fall 2011) Probability Distributions Lecture 8 Part 1 11 / 19
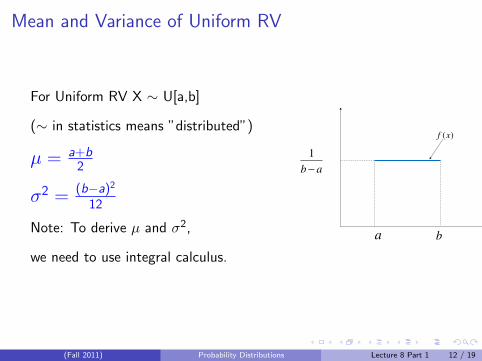
Mean and Variance of Uniform RV
For Uniform RV X ∼ U[a,b]
(∼ in statistics means ”distributed”)
µ = a+b2
σ2 = (b−a)2
12
Note: To derive µ and σ2,
we need to use integral calculus.
)(xf
ab −
1
a b
(Fall 2011) Probability Distributions Lecture 8 Part 1 12 / 19
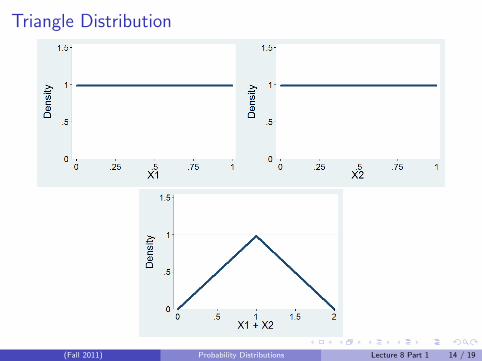
Triangle Distribution
We can create triangle distribution by adding up two independent andidentically distributed uniform random variables.
Why do we need independence?What does identically distributed mean?
X1∼U[a, b]X2∼U[a, b]X1 and X2 are independentT=X1+X2T∼T[2a, 2b]
(Fall 2011) Probability Distributions Lecture 8 Part 1 13 / 19
Triangle Distribution
(Fall 2011) Probability Distributions Lecture 8 Part 1 14 / 19
Triangle Distribution: Mean and SD
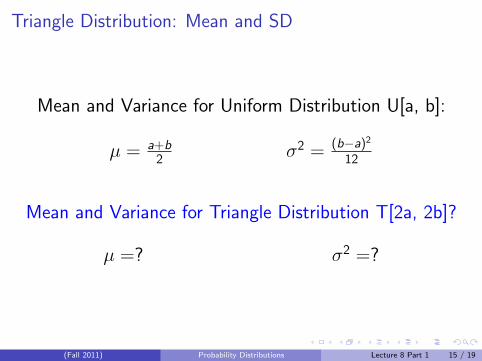
Mean and Variance for Uniform Distribution U[a, b]:
µ = a+b2 σ2 = (b−a)2
12
Mean and Variance for Triangle Distribution T[2a, 2b]?
µ =? σ2 =?
(Fall 2011) Probability Distributions Lecture 8 Part 1 15 / 19
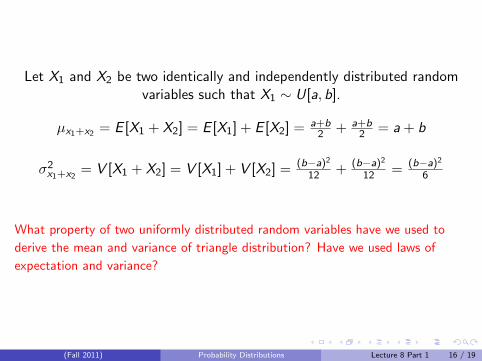
Let X1 and X2 be two identically and independently distributed randomvariables such that X1 ∼ U[a, b].
µx1+x2 = E [X1 + X2] = E [X1] + E [X2] = a+b2 + a+b
2 = a + b
σ2x1+x2
= V [X1 + X2] = V [X1] + V [X2] = (b−a)2
12 + (b−a)2
12 = (b−a)2
6
What property of two uniformly distributed random variables have we used to
derive the mean and variance of triangle distribution? Have we used laws of
expectation and variance?
(Fall 2011) Probability Distributions Lecture 8 Part 1 16 / 19
(Fall 2011) Probability Distributions Lecture 8 Part 1 17 / 19
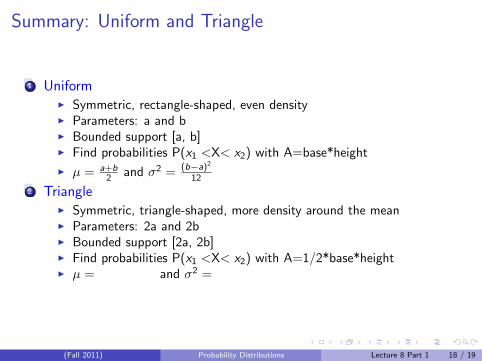
Summary: Uniform and Triangle
1 UniformI Symmetric, rectangle-shaped, even densityI Parameters: a and bI Bounded support [a, b]I Find probabilities P(x1 <X< x2) with A=base*height
I µ = a+b2 and σ2 = (b−a)2
12
2 TriangleI Symmetric, triangle-shaped, more density around the meanI Parameters: 2a and 2bI Bounded support [2a, 2b]I Find probabilities P(x1 <X< x2) with A=1/2*base*heightI µ = and σ2 =
(Fall 2011) Probability Distributions Lecture 8 Part 1 18 / 19
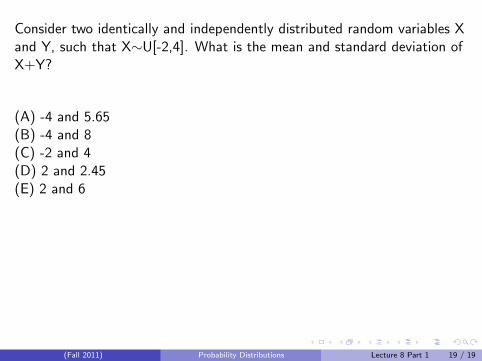
Consider two identically and independently distributed random variables Xand Y, such that X∼U[-2,4]. What is the mean and standard deviation ofX+Y?
(A) -4 and 5.65(B) -4 and 8(C) -2 and 4(D) 2 and 2.45(E) 2 and 6
X+Y∼ T[-4,8]E[X+Y]=a+b=-2+4=2
V[X+Y]= (b−a)2
6 = (4+2)2
6 = 6
SD[X+Y]=√
V [X + Y ] =√
6 = 2.45
(Fall 2011) Probability Distributions Lecture 8 Part 1 19 / 19
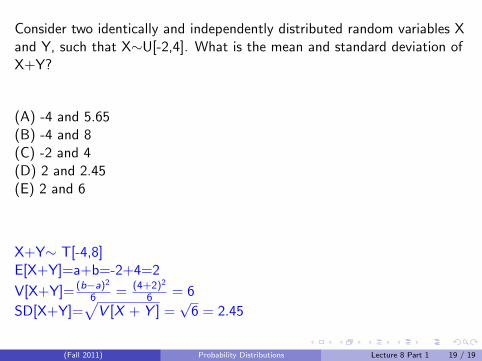