
2018 INVESTOR CONFERENCE - Seeking Alpha
83
2018 INVESTOR CONFERENCE
Transcript of 2018 INVESTOR CONFERENCE - Seeking Alpha

2018 INVESTOR CONFERENCE

INTRODUCTIONHEATHER ROSS
DIRECTOR, INVESTOR RELATIONS

2
FORWARD-LOOKING STATEMENTS
This presentation and comments made by Global Payments' management during the investor conference may contain certain forward-looking statements within the meaning of the “safe-harbor” provisions of the Private Securities Litigation Reform Act of 1995. Statements that are not historical facts, including revenue and earnings estimates and management’s expectations regarding future events and developments, are forward-looking statements and are subject to significant risks and uncertainties. Important factors that may cause actual events or results to differ materially from those anticipated by such forward-looking statements include our ability to safeguard our data; increased competition from larger companies and non-traditional competitors, our ability to update our services in a timely manner; our ability to maintain Visa and MasterCard registration and financial institution sponsorship; our reliance on financial institutions to provide clearing services in connection with our settlement activities; our potential failure to comply with card network requirements; potential systems interruptions or failures; software defects or undetected errors; increased attrition of merchants, referral partners or independent sales organizations; our ability to increase our share of existing markets and expand into new markets; a decline in the use of cards for payment generally; unanticipated increases in chargeback liability; increases in credit card network fees; change in laws, regulations or network rules or interpretations thereof; foreign currency exchange and interest rate risks; political, economic and regulatory changes in the foreign countries in which we operate; future performance, integration and conversion of acquired operations; including without limitation difficulties and delays in integrating or fully realizing cost savings and other benefits of our acquisitions at all or within the expected time period; fully realizing anticipated annual interest expense savings from refinancing our corporate debt facilities; our loss of key personnel and other risk factors presented in our most recent Annual Report on Form 10-K and any subsequent SEC filings, which we advise you to review. Our forward-looking statements speak only as of the date they are made and should not be relied upon as representing our plans and expectations as of any subsequent date. We undertake no obligation to revise any of these statements to reflect future circumstances or the occurrence of unanticipated events.
Reconciliation to U.S. GAAP Financial InformationThe following presentation may include certain "non-GAAP financial measures" as defined in Regulation G under the Securities Exchange Act of 1934. A schedule which reconciles our results as reported under Generally Accepted Accounting Principles and the non-GAAP financial measures included in the following presentation is attached as an Appendix hereto and is also posted on the Company's website at www.globalpaymentsinc.com (in the “Events” section).

3
AGENDA
Strategic Overview, Jeff Sloan
Strategy in Action, David Mangum
Financial Outcomes, Cameron Bready
Q&A

STRATEGIC OVERVIEWJEFF SLOAN
CHIEF EXECUTIVE OFFICER

Adjusted Net Revenue
CAGR
+20%Adjusted
EPS CAGR
+26%
COMPOUNDED GROWTH OVER THREE YEARS
+120bpsAdjusted
Operating MarginExpansion
Note: For the fiscal year ended May 31, 2015 through the calendar year ended December 31, 2017 2

2017 HIGHLIGHTS
+24%Adjusted Net
Revenue
~$450MEcomm & Omni
Adjusted Net Revenue
~$1BSoftware Driven
Adjusted Net Revenue
+26%Adjusted
EPS
+120bpsAdjusted
Operating Margin
BY THE NUMBERS
+50bpsRealized Revenue
Synergies
+200KNew
Merchants
3

STRATEGY EVOLUTION
2013To be the payments
technology leader worldwide
2018-2020Software Driven
Wrapping value around the transaction
2015-2017Technology Enabled
4

5
BUSINESS MIX SHIFT
2020 TARGETADJ NET REVENUE
+ NETWORK FEES
2017ADJ NET
REVENUE
Technology Enabled Relationship Led
Technology Enabled Relationship Led
2015 ADJ NET
REVENUE
Technology Enabled Relationship Led

NewACQUISITIONS & PARTNERSHIPS
ACCELERATING GROWTH
New GEOGRAPHIES
New VERTICAL MARKETS
6

BUSINESS MODEL EVOLUTION
INTEGRATED & VERTICAL MARKETS
2020 TARGET2015 2017
ECOMM & OMNI SOLUTIONS
~$450M
~$250M
~$1,000M
~$450M
Expanding Globally
Expanding Globally
7Note: All figures are Adjusted Net Revenue
Low Double DigitOrganic Growth
Mid-teens Organic Growth
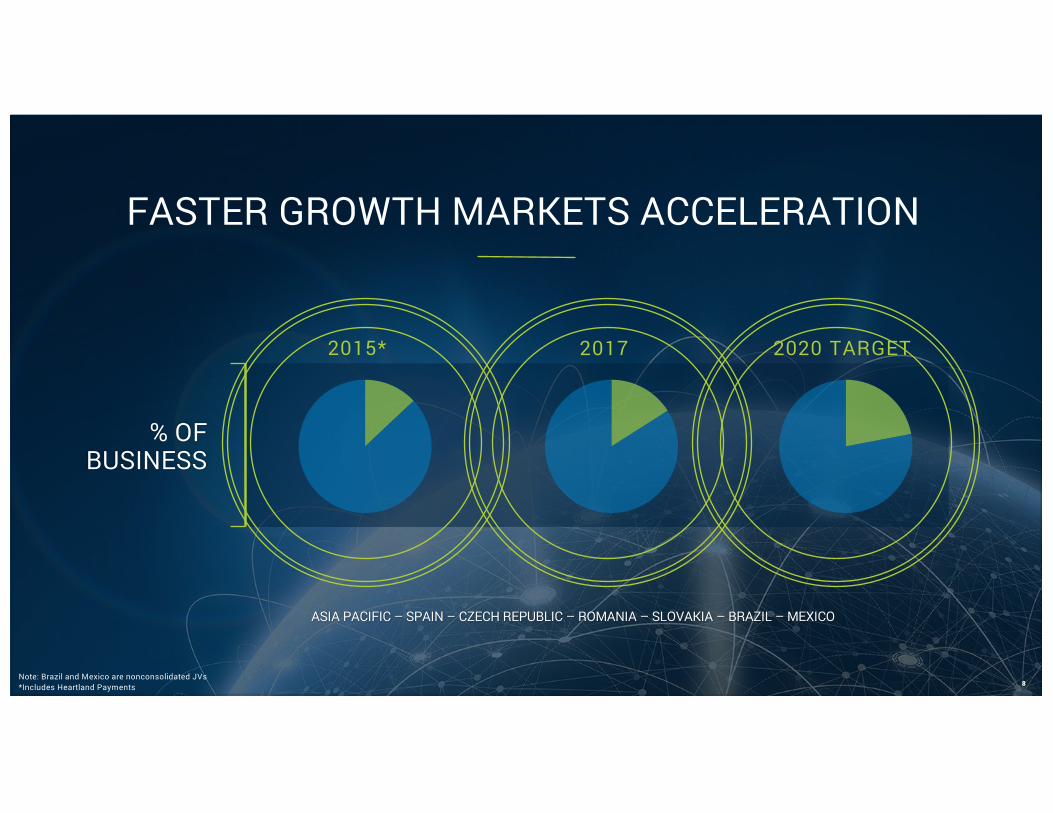
FASTER GROWTH MARKETS ACCELERATION
% OF BUSINESS
2020 TARGET2015* 2017
8
ASIA PACIFIC – SPAIN – CZECH REPUBLIC – ROMANIA – SLOVAKIA – BRAZIL – MEXICO
Note: Brazil and Mexico are nonconsolidated JVs*Includes Heartland Payments

$1.75BAcquisitions
$1.0BShare Repurchases
>$100MRe-invested in Growth
DELIVER INNOVATIVE PRODUCTS GLOBALLY
LEVERAGE TECHNOLOGY & OPERATIONS
OPTIMIZE CAPITAL DEPLOYMENT
GROW AND CONTROL DISTRIBUTION
*FY 2013 – October 2015
*
2015 SCORECARD
9
10
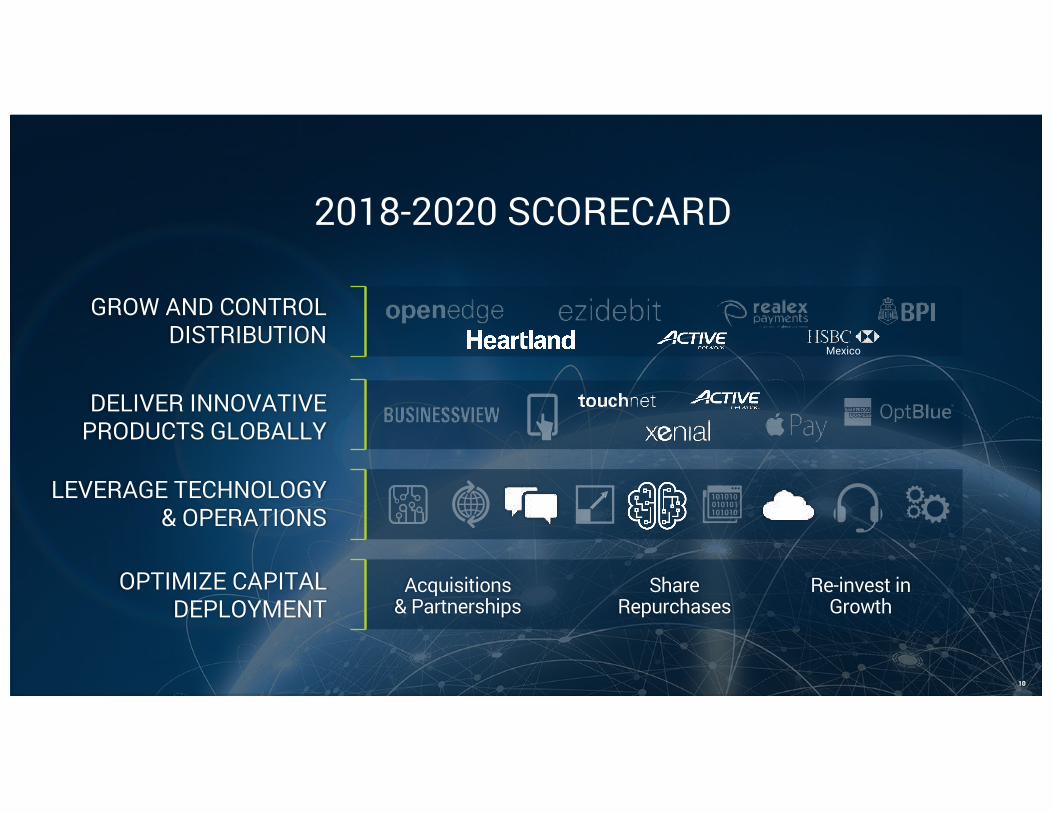
DELIVER INNOVATIVE PRODUCTS GLOBALLY
LEVERAGE TECHNOLOGY & OPERATIONS
OPTIMIZE CAPITAL DEPLOYMENT
GROW AND CONTROL DISTRIBUTION
Acquisitions & Partnerships
Share Repurchases
Re-invest in Growth
Mexico
2018-2020 SCORECARD

11
SOFTWARE DIFFERENTIATION
HIGHER PREDICTABILITY
DISTINCTIVE DEFENSIBLE
DISTRIBUTION
VERTICAL MARKET FOCUS
FASTER GROWTH

12
SOFTWARE DIFFERENTIATION
FASTER GROWTH
Market Share GainsDigital Payments
Economic Decoupling

DISTINCTIVE DEFENSIBLE
DISTRIBUTION
SMB Focus
Face-to-face Centric
Cross-border Corporates
13
SOFTWARE DIFFERENTIATION

14
SOFTWARE DIFFERENTIATION
HIGHER PREDICTABILITY
SaaS Orientation
Increased Retention
Ecosystem

15
SOFTWARE DIFFERENTIATION
VERTICAL MARKET FOCUS
Specialization
Barrier to Entry
First Mover Advantage

SOFTWARE IS A LARGE AND GROWING MARKET
$4.0
$5.9
$6.2
$6.8
$9.4
$12.9
$16.3
$16.1
$24.0
$27.9
$1.8
$1.8
$2.8
$2.9
$4.6
$6.0
$6.4
$6.6
$10.4
$11.4
Education
Healthcare Providers
Utilities
Transportation
Retail
Insurance
Manufacturing and Natural Resources
Communications, Media and Services
Banking and Securities
Government
2016 Spend 2021 Spend
$22.7
$39.2
$34.4
$22.7
$18.9
$14.0
$9.6
$9.0
$7.8
$5.9
Vertical-Specific Software Markets ($B)
Source: Gartner, Inc. 16

PRODUCT-LED INNOVATION
ACTIVE WORKSTOUCHNET
MYSCHOOLBUCKS
BILLING SOLUTIONS
ALIPAY HK
AUCTIONPAY
ANDROID PAY
ACTIVE ENGAGEMENT
HEARTLAND ANALYTICS
U.COMMERCEONECARD VIP
MEALVIEWERAPPLE PAY
DECLINE MINIMIZER
EDGE SHIELD
XENIAL
360UWAVERIDER
BPAYACTIVE REWARDS
ACTIVE ENDURANCE
GOOGLE PAY
PAYROLL
17

INTEGRATED & VERTICAL MARKETS
2020 TARGET2015 2017
18
Verticals
DENTAL VETERINARIAN
~$450M Adj Net Revenue
Geography1
Verticals
AUTO SERVICES HOSPITALITY EVENTS
~$1,000MAdj Net Revenue
Geographies5
Verticals
EXPANDING
Geographies10
LOW DOUBLE DIGITOrganic Growth

BanksISOs
INTEGRATED COMPETITIVE LANDSCAPE
>70 verticals and >2,000 ISV partners
INTEGRATEDPartnered with ISVs
5 verticalsVERTICALLY
INTEGRATEDOwned software
>2,500 Global Sales Professionals
SEMI-INTEGRATED
19
NONE

ECOMM AND OMNI SOLUTIONS
2020 TARGET2015 2017
20
ADDITIONAL
Market Capabilities
MID-TEENSOrganic Growth
Currencies
EXPANDING
Currencies
>135
~$450M Adj Net Revenue
Markets Served55
Currencies
~100
~$250M Adj Net Revenue
Markets Served50

ECOMM AND OMNI COMPETITIVE LANDSCAPE
ECOMM + REGIONAL OMNI
OMNI CAPABILITIES GLOBALLY
ECOMMPREDOMINANT
21
NONE
SMB Focus
Cross-border Corporates
Worldwide Support Model

UNIQUE STRATEGY
22
FullOMNICHANNEL
Capabilities
SOFTWARE DRIVENPartnered & Owned
FASTER GROWTHMarket Exposure

STRATEGY IN ACTIONDAVID MANGUM
PRESIDENT & CHIEF OPERATING OFFICER

LEADING WITH TECHNOLOGY AND DISTRIBUTION
DISTINCTIVE DISTRIBUTION
95% Direct Distribution 40% Technology
Enabled
TECHNOLOGY SOLUTIONS+
2
UNPARALLELED TECHNOLOGY ON A GLOBAL SCALE

3
Solutions
TECH-ENABLED SOFTWARE DRIVEN
Singular, global tech and op
PLATFORM
GLOBALFootprint
Best-in-class
SALES MODEL
World-class
CUSTOMER SERVICE
UNIQUE GO-TO-MARKET STRATEGY

4
Global Sales Professionals
>2,500
>30Primary
Languages
~15KUS Sales Calls
Per Day
~65%US Sales
Tech-enabled
+200KNew Merchants
UNIQUE GO-TO-MARKET STRATEGY

5
Tech Enabled
DISTINCTIVE DISTRIBUTION CHANNELS
Ownership Model Partnership Model Relationship Model
ECOMM & OMNI SOLUTIONS

6
Tech Enabled
Ownership Model Partnership Model Relationship Model
DISTINCTIVE DISTRIBUTION CHANNELSDELIVER DISTINCTIVE SOLUTIONS
MicroPayments
ECOMM & OMNI SOLUTIONS
7
MicroPaymentsHighlander
DISTINCTIVE DISTRIBUTION CHANNELS
ECOMM & OMNI SOLUTIONS

8
SMB focus with multinational capabilitiesDistribution across all channels
Unmatched support infrastructure
>50Countries with
omni capabilitiesCurrencies
>135>140Alternative payments
supported
UNMATCHED ECOMM AND OMNI CAPABILITIES

9
2018 – 2020 GROWTH ENGINES
SALES ACCELERATION
ANALYTICS AND ENGAGEMENT
ENRICHED SOFTWARE SOLUTIONS

10
2018 – 2020 GROWTH ENGINES
Best-in-class sales
SALES ACCELERATION
Global leverage

EXPANDING DIRECT SALES GLOBALLY
11

12
2018 – 2020 GROWTH ENGINES
ENRICHED SOFTWARE SOLUTIONS
SaaSVertical Integration
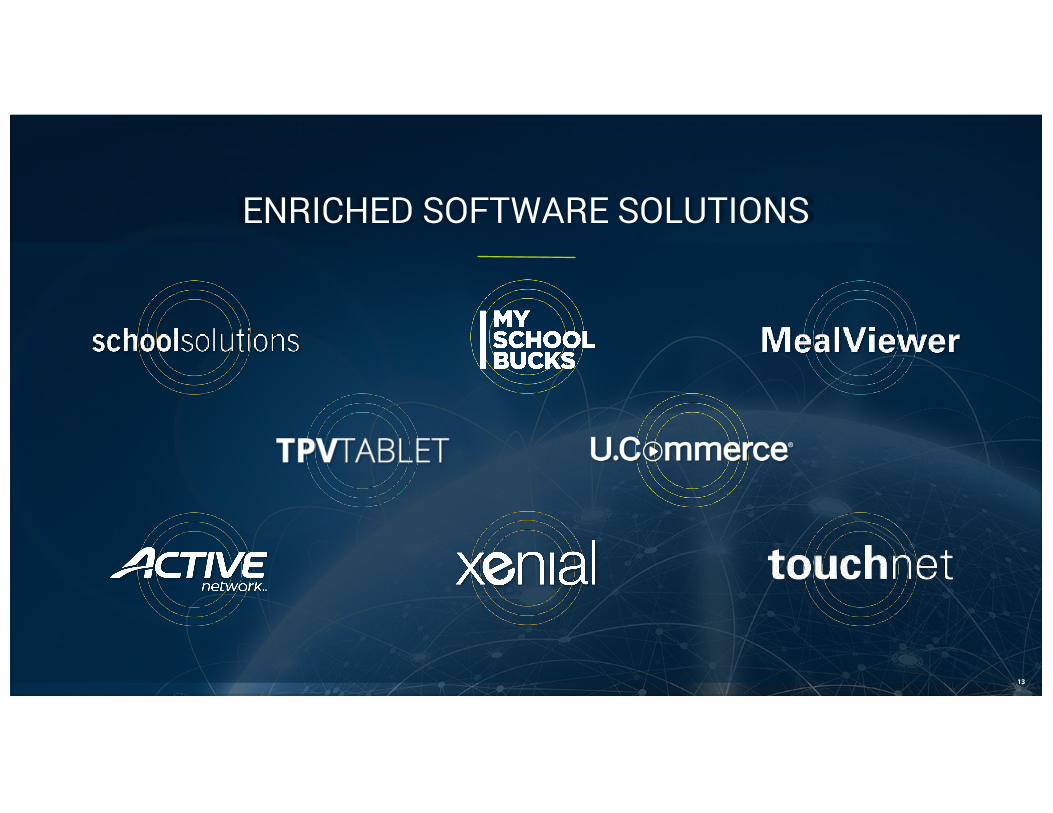
13
ENRICHED SOFTWARE SOLUTIONS

14
CLOUD-BASED SOLUTIONS TO MANAGE CAMPUS COMMERCE
Intuitive Dashboards
Branding & Marketing
Omnichannel ERP Integrations Specialized Payments
Real-time Monitoring
Seamless Integration
Student Experience

15
END-TO-END SOLUTIONS FOR EVENT AND PARTICIPANT MANAGEMENT
Plan Payment
$Operate
Measure
Promote
Demand Generation
Registration Email Notifications & Marketing

COMPLETE CLOUD-BASED PLATFORM FOR HOSPITALITY MANAGEMENT
Customer Engagement
Ordering Inventory Labor Management
Drive Thru
Dynamic Menus Rewards Reporting
16

17
2018 – 2020 GROWTH ENGINES
Demand GenerationAnalysis and Reporting
ANALYTICS AND ENGAGEMENT

18
ANALYTICS AND ENGAGEMENT

19
ANALYTICS & ENGAGEMENT

HOW DOES IT ALL COME TOGETHER?
20

21
MunicipalityNon-Profit Education Pharmacy Restaurant B2B Petro/C-StoreRetail
Welcome to East Brunswick, NJ
Pub & GrillRX
UtilitiesUniversity GOVERNMENTRetail
Analytics
Integration
Payroll
Online Biller
Omni
Xenial
Dealer POS
Integration
Analytics
Gift/Loyalty
EcommOnline Order
Payroll
Omni
Level 3Acceptance
Online Biller
Ecomm
Payroll
POS
Integration
Omni
ACTIVE
GreaterGiving
Payroll
Community
Share
Analytics
Omni
Analytics
Gift/Loyalty
Ecomm
Payroll
POS
Integration
Omni
Fleet Cards
POS
Payroll
Pay At Pump
Integration
Analytics
Omni
Parking
ConvenienceFees
Integration
Online Biller
Analytics
Ecomm
Payroll
Omni
Higher Ed
K-12
Parking
ConvenienceFees
Integration
Online Biller
Analytics
Ecomm
Payroll
ACTIVE
Omni
Online Marketplace
GASConvenience
27

22
WRAPPING VALUE AROUND THE TRANSACTION
Services
IntegrationApps
Software
Analytics
Reporting PAYMENTS

FINANCIAL OUTCOMESCAMERON BREADY
SENIOR EVP & CHIEF FINANCIAL OFFICER

2
UNIQUEVALUE
PROPOSITIONSoftware Driven
Partnered & Owned
Full OmnichannelCapabilities
Faster Growth Market Exposure

FY 2014 FY 2015 CY 2016 CY 2017 CY 2018**
74%
18%
8%
ADJUSTED NET REVENUE*
$ 3 .5 2 Bin 2 0 1 7
3
CONSISTENTLY STRONG GROWTH
19% CAGR
North America Europe Asia Pacific
*All periods reflect Adjusted Net Revenue except CY 2018, which is Adjusted Net Revenue + Network Fees**CY 2018 figures represent mid-point of Adjusted Net Revenue + Network Fees guidance provided February 15, 2018

FY 2014 FY 2015 CY 2016 CY 2017 CY 2018*
4
COMPOUNDED EARNINGS GROWTHADJUSTED EPS GROWTH
26%
26%
n/a
17%13%
26% CAGR
*CY 2018 figures represent mid-point of Adjusted EPS guidance provided February 15, 2018

FY 2014 FY 2015 CY 2016 CY 2017 CY 2018*
5
COMPOUNDED EARNINGS GROWTH
13%
17%
n/a
26%
26%
S&P500
Direct Peers
Networks
GPN
GPN ADJUSTED EPS GROWTH EARNINGS PERFORMANCE (CAGR)**
*CY 2018 figures represent mid-point of Adjusted EPS guidance provided February 15, 2018**Reflects Adjusted EPS for GPN and non-GAAP earnings metrics for comparison companies

6
DELIVER INNOVATIVE PRODUCTS GLOBALLY
LEVERAGE TECHNOLOGY & OPERATIONS
OPTIMIZE CAPITAL DEPLOYMENT
GROW AND CONTROL DISTRIBUTION
Acquisitions & Partnerships
Share Repurchases
Re-invest in Growth
Mexico
STRATEGY DRIVING ACCELERATED GROWTH

STRATEGY DRIVING ACCELERATED GROWTH
7
OPTIMIZE CAPITAL DEPLOYMENT
ORGANIC ADJUSTED NET REVENUE + NETWORK FEES*
%
ADJUSTED OPERATING MARGINS
ADJUSTED EARNINGSPER SHARE
High Single to Low Double Digit Growth
Expanding Up to 75 bps Annually
Mid to High TeensGrowth
DELIVER INNOVATIVE PRODUCTS GLOBALLY
LEVERAGE TECHNOLOGY & OPERATIONS
OPTIMIZE CAPITAL DEPLOYMENT
GROW AND CONTROL DISTRIBUTION
*Excludes North America wholesale business

STRATEGY DRIVING ACCELERATED GROWTH
8
OPTIMIZE CAPITAL DEPLOYMENT
ORGANIC ADJUSTED NET REVENUE + NETWORK FEES*
High Single to Low Double Digit Growth
%
*Excludes North America wholesale business

STRATEGY DRIVING ACCELERATED GROWTH
9
%
ADJUSTED OPERATING MARGINS
Expanding Up to 75 bps Annually
OPTIMIZE CAPITAL DEPLOYMENT
*Excludes North America wholesale business

STRATEGY DRIVING ACCELERATED GROWTH
10
ADJUSTED EARNINGSPER SHARE
Mid to High TeensGrowth
OPTIMIZE CAPITAL DEPLOYMENT
%
*Excludes North America wholesale business

11
CONTINUING MIX SHIFT TOWARD HIGHER GROWTH CHANNELS
ADJUSTED NET REVENUE
74%
18%
8%
$ 3 .5 2 Bin 2 0 1 7
North America Europe Asia Pacific
North America RL36%
Asia Pacific
RL6%
Integrated & Vertical Markets
28%
Ecomm/Omni12%
EuropeRL 13%
Wholesale5%
Tech-enabled40%
RL = Relationship Led

12
CONTINUING MIX SHIFT TOWARD HIGHER GROWTH CHANNELS
2020 TARGET*
Tech-enabled60%
Relationship Led40%
2017ADJUSTED NET REVENUE
North America RL36%
Asia Pacific
RL6%
Integrated & Vertical Markets
28%
Ecomm/Omni12%
EuropeRL 13%
Wholesale5%
Tech-enabled40%
RL = Relationship Led
*Adjusted Net Revenue + Network Fees

13
ORGANIC GROWTH - NORTH AMERICA
Tech-enabled41%
Relationship Led53%
Wholesale6%
ORGANIC GROWTH EXPECTATIONS*
High single to low double digit
GROWTH DRIVERSVertical ExpansionSales Acceleration
Analytics & Engagement
MARKET GROWTH: ~6%Source: McKinsey & Co.
*Organic Adjusted Net Revenue + Network Fees, excludes North America Wholesale

14
ORGANIC GROWTH - EUROPE
Tech-enabled28%
Relationship Led 72%
GROWTH DRIVERSSales Acceleration
Enriched Software SolutionsFaster Growth Markets
ORGANIC GROWTH EXPECTATIONS*
High single digit
MARKET GROWTH: ~4%Source: McKinsey & Co.
*Organic Adjusted Net Revenue + Network Fees

15
ORGANIC GROWTH - ASIA PACIFIC
GROWTH DRIVERSSales Acceleration
Faster Growth MarketsVertical Market Expansion
ORGANIC GROWTH EXPECTATIONS*
Low double digit
Source: McKinsey & Co.
MARKET GROWTH: ~8%Tech-enabled40%
Relationship Led 60%
*Organic Adjusted Net Revenue + Network Fees

16
PREVIOUS MARGIN CYCLE GUIDANCE
Mid 20s& Flat
Direct Distribution
Innovative Products
& Services
Technology & Operations
Low 30s & Expanding

17
CONTINUED MOMENTUM FOR MARGIN EXPANSION
Sales Acceleration
Enriched Software Solutions
Common Infrastructure
Mid 30s & Expanding
Low 30s & Expanding
Analytics & Engagement
Note: Adjusted Operating Margin calculated based on Adjusted Net Revenue + Network Fees metric

18
DISCIPLINED APPROACH TO CAPITAL DEPLOYMENT
CAPITAL DEPLOYMENT
FREE CASH FLOW GENERATION
EBITDA GROWTH
STRONG TOPLINE GROWTH Acquisitions & Partnerships
Investments for Growth
Efficiently Return Capital
Debt Reduction

19
DISCIPLINED APPROACH TO CAPITAL DEPLOYMENT
CAPITAL DEPLOYMENT
EBITDA GROWTH
$777M2017 Adjusted FCF Generation
Current Leverage Ratio 3.6x
3-3.5xTarget Leverage Ratio
FREE CASH FLOW GENERATION
STRONG TOPLINE GROWTH

TBD 2018
Mexico
SEPT 2017
JUN 2016
APR 2016
AUG 2015
JUN 2015
MAR 2015
INVESTING FOR GROWTH THROUGH ACQUISITIONS
20
GREATER THAN $7 BILLION INVESTED
OCT 2014
MAR 2014
OCT 2012

CORPORATE DEVELOPMENT LANDSCAPE
21
ASIA PACIFICEUROPENORTH AMERICA

EUROPE
NORTH AMERICAVertical market software
Complementary scale
CORPORATE DEVELOPMENT LANDSCAPE
22
ASIA PACIFIC

CORPORATE DEVELOPMENT LANDSCAPE
23
NORTH AMERICA ASIA PACIFIC
EUROPEComplementary scale
Omnichannel alignmentVertical market software

EUROPE
CORPORATE DEVELOPMENT LANDSCAPE
24
NORTH AMERICA
ASIA PACIFICComplementary scale
Omnichannel alignmentVertical market software

DRIVERS OF LONG-TERM EARNINGS GROWTH
25
TOPLINE GROWTH
OPERATING LEVERAGE
CAPITAL ALLOCATION
Software Driven
Full OmniCapabilities
Faster Growth Markets
Sales Acceleration
Sales Acceleration
Enriched Software Solutions
Analytics & Engagement
Capital ReturnsM&ARe-Invest
MID TO HIGH TEENS ADJUSTED EPS GROWTH

PREMIUM VALUATION DRIVERS
26
TRADITIONAL ACQUIRERS
VALUATION DIFFERS ACROSS BUSINESSES
SOFTWARE &ECOMM
~40%
~60%
2017 2020 TARGET
Valu
atio
n

27
UNIQUE STRATEGY
FullOMNICHANNEL
Capabilities
SOFTWARE DRIVENPartnered & Owned
FASTER GROWTHMarket Exposure

APPENDIX

RECONCILIATION OF NON-GAAP FINANCIAL MEASURES (UNAUDITED)
1 Represents adjustments to revenues for gross-up related payments (included in operating expenses) associated with certain lines of business to reflect economic benefits to the company. For the year ended December 31, 2017, includes $7.2 million to eliminate the effect of acquisition accounting fair value adjustments for software deferred revenue associated with the ACTIVE Network transaction.2 Earnings adjustments to operating income for the year ended December 31, 2017 include reductions of $342.2 million and $143.0 million in cost of service and selling, general and administrative expenses, respectively. Adjustments to cost of service include amortization of acquired intangibles of $340.0 million, employee termination costs of $1.9 million, and acquisition and integration costs of $0.3 million. Adjustments to selling, general and administrative expenses include share-based compensation expense of $39.4 million, acquisition and integration costs of $94.3 million, $6.0 million of platform integration costs, and employee termination costs and other adjustments of $3.3 million. Net income attributable to Global Payments also reflects an adjustment to remove a non-cash charge of $6.8 million associated with the refinancing of our corporate credit facility.
Earnings adjustments to operating income for the year ended December 31, 2016 include $269.6 million in cost of service and $189.9 million in selling, general and administrative expenses. Adjustments to cost of service represent amortization of acquired intangibles of $261.5 million and employee termination costs, litigation-related costs of $6.8 million and other adjustments of $1.3 million. Adjustments to selling, general and administrative expenses include share-based compensation expense of $32.6 million, acquisition and integration costs of $143.3 million, litigation related costs of $10.2 million and employee termination costs and other adjustments of $3.8 million. Net income attributable to Global Payments also reflects an adjustment to remove a gain on the sale of membership interests in Visa Europe of $41.2 million.3 Income taxes on adjustments reflect the tax effect of earnings adjustments to income before income taxes. The tax rate used in determining the tax impact of earnings adjustments is either the jurisdictional statutory rate in effect at the time of the adjustment or the jurisdictional expected annual effective tax rate for the period, depending on the nature and timing of the adjustment. In addition, income taxes on adjustments for the year ended December 31, 2017 reflect the removal of a $158.7 million income tax benefit recorded in connection with the U.S. Tax Cuts and Jobs Act of 2017 and other income tax benefits of $4.1 million. For the year ended December 31, 2016, income taxes on adjustments reflect the removal of a $10.9 million tax benefit associated with our decision at that time to indefinitely reinvest earnings in Canada.4 Adjusted EPS is calculated by dividing adjusted net income attributable to Global Payments by the diluted weighted-average number of shares outstanding.
Year Ended December 31, 2017
GAAPNet Revenue Adjustment1
Earnings Adjustments2
Income Taxes on Adjustments3 Non-GAAP
Revenues 3,975.2 (454.0) --- --- 3,521.2Operating income 558.9 7.2 485.2 --- 1,051.3Net income attributable to Global Payments 468.4 7.2 484.8 (336.5) 624.0Diluted earnings per share4 3.01 0.05 3.12 (2.16) 4.01
Year Ended December 31, 2016
GAAPNet Revenue Adjustment1
Earnings Adjustments2
Income Taxes on Adjustments3 Non-GAAP
Revenues 3,371.0 (527.0) --- --- 2,844.0Operating income 356.3 --- 459.5 --- 815.9Net income attributable to Global Payments 201.8 --- 420.6 (153.7) 468.6Diluted earnings per share4 1.37 --- 2.86 (1.05) 3.19
Years Ended December 31, 2017 and 2016Global Payments Inc. and Subsidiaries(In millions, except per share data)
$$$$
$$$$
$$$
$$$
$$$
$$$$
$$$$
$$$
$$$
$$$
$$$
$$$
1

RECONCILIATION OF NON-GAAP FINANCIAL MEASURES (UNAUDITED)
1 Represents adjustments to revenues for gross-up related payments (included in operating expenses) associated with certain wholesale lines of business to reflect economic benefits to the company.2 Earnings adjustments to operating income for the year ended May 31, 2016 include reductions of $114.3 million and $94.4 million in cost of service and selling, general and administrative expenses, respectively. Adjustments to cost of service include amortization of acquired intangibles of $115.9 million partially offset by recoveries associated with a U.K. vendor outage. Adjustments to selling, general and administrative expenses include share-based compensation expense of $30.1 million, acquisition-related costs of $51.3 million, employee termination costs and a reserve for litigation in Russia. Earnings adjustments to net income attributable to Global Payments include the items affecting operating income as well as noncontrolling interests, net of tax.
Earnings adjustments to revenues for the year ended May 31, 2015 reflect payments to select U.K. customers related to a vendor outage. Earnings adjustments to operating income also include reductions of $72.6 million and $28.9 million in cost of service and selling, general and administrative expenses, respectively. Adjustments to cost of service represent amortization of acquired intangibles. Adjustments to selling, general and administrative expenses include share-based compensation expense of $20.3 million and other adjustments of $8.6 million, including employee termination costs, non-cash losses from the retirement of property and equipment, a transaction-related tax associated with our acquisition of Realex, certain business tax assessments in the U.S. for prior periods and a gain on the sale of our Russia ATM business. Earnings adjustments to net income attributable to Global Payments include the items affecting operating income and the reversal of previously recorded interest expense associated with a previously uncertain tax position as well as noncontrolling interests, net of tax.3 Income taxes on adjustments reflects the tax effect of earnings adjustments to operating income and, for the three months ended May 31, 2016, the removal of a tax benefit of $10.9 million associated with our decision to indefinitely reinvest earnings in Canada. The tax rate used in determining the tax impact of earnings adjustments is either the jurisdictional statutory rate in effect at the time of the adjustment or the jurisdictional expected annual effective tax rate for the period, depending on the nature and timing of the adjustment.4 Adjusted diluted EPS is calculated by dividing adjusted net income attributable to Global Payments by the diluted weighted-average number of shares outstanding. The shares outstanding and diluted earnings per share for prior periods have been adjusted for a two-for-one stock split in the form of a stock dividend paid on November 2, 2015.
Year Ended May 31, 2016
GAAPNet Revenue Adjustment1
Earnings Adjustments2
Income Taxes on Adjustments3 Non-GAAP
Revenues 2,898.2 (725.1) --- --- 2,173.1Operating income 424.9 --- 208.7 --- 633.6Net income attributable to Global Payments 271.7 --- 204.7 (79.8) 396.6Diluted earnings per share4 2.04 --- 1.54 (0.60) 2.98
Year Ended May 31, 2015
GAAPNet Revenue Adjustment1
Earnings Adjustments2
Income Taxes on Adjustments3 Non-GAAP
Revenues 2,773.7 (822.7) 1.9 --- 1,952.9Operating income 456.6 --- 103.4 --- 560.0Net income attributable to Global Payments 278.0 --- 95.3 (33.3) 340.1Diluted earnings per share4 2.06 --- 0.71 (0.25) 2.52
Years Ended May 31, 2016 and 2015Global Payments Inc. and Subsidiaries(In millions, except per share data)
$$$$
$$$$
$$$
$$$
$$$
$$$
$$$$
$$$$
$$$
$$$
$$$
$$$
2

RECONCILIATION OF NON-GAAP FINANCIAL MEASURES (UNAUDITED)
1 Represents adjustments to revenues for gross-up related payments (included in operating expenses) associated with certain wholesale lines of business to reflect economic benefits to the company.
2 Represents adjustments to exclude acquisition-related amortization expense and share-based compensation expense and the related income tax effects of each.
3 Represents an adjustment to exclude charges associated with a FY2012 processing system intrusion, acceleration of equity awards and other costs associated with the retirement of our former Chairman and CEO, a charge associated with our retained interest in Brazil, an adjustment to the costs associated with the debt refinancing we completed in February 2014, non-cash losses from the retirement of fixed assets, charges related to employee termination costs and the related income tax effects of each.4 Adjusted diluted EPS is calculated by dividing adjusted net income attributable to Global Payments by the diluted weighted-average number of shares outstanding. The shares outstanding and diluted earnings per share for prior periods have been adjusted for a two-for-one stock split in the form of a stock dividend paid on November 2, 2015.
Year Ended May 31, 2014
GAAPNet Revenue Adjustment1
Earnings Adjustments2 Other3 Non-GAAP
Revenues 2,554.2 (780.7) --- --- 1,773.6Operating income 405.5 --- 82.2 13.2 500.8Net income attributable to Global Payments 245.3 --- 49.5 17.6 312.3Diluted earnings per share4 1.69 --- 0.34 0.12 2.15
Year Ended May 31, 2014Global Payments Inc. and Subsidiaries(In millions, except per share data)
$$$$
$$$$
$$$
$$$
$$$
$$$
3

RECONCILIATION OF SEGMENT NON-GAAPFINANCIAL MEASURES (UNAUDITED)
1 Represents adjustments to revenues for gross-up related payments (included in operating expenses) associated with certain lines of business to reflect economic benefits to the company. For the year ended December 31, 2017, the North America segment includes $7.2 million to eliminate the effect of acquisition accounting fair value adjustments for software deferred revenue associated with the ACTIVE Network transaction.
Year Ended December 31, 2017
GAAPNet Revenue Adjustment1 Non-GAAP
Revenues:North America 2,929.5 (334.1) 2,595.4Europe 767.5 (119.8) 647.7Asia-Pacific 278.1 --- 278.1
3,975.2 (453.8) 3,521.2
Year Ended December 31, 2017Global Payments Inc. and Subsidiaries(In millions, except per share data)
$ $$
$ $$
4
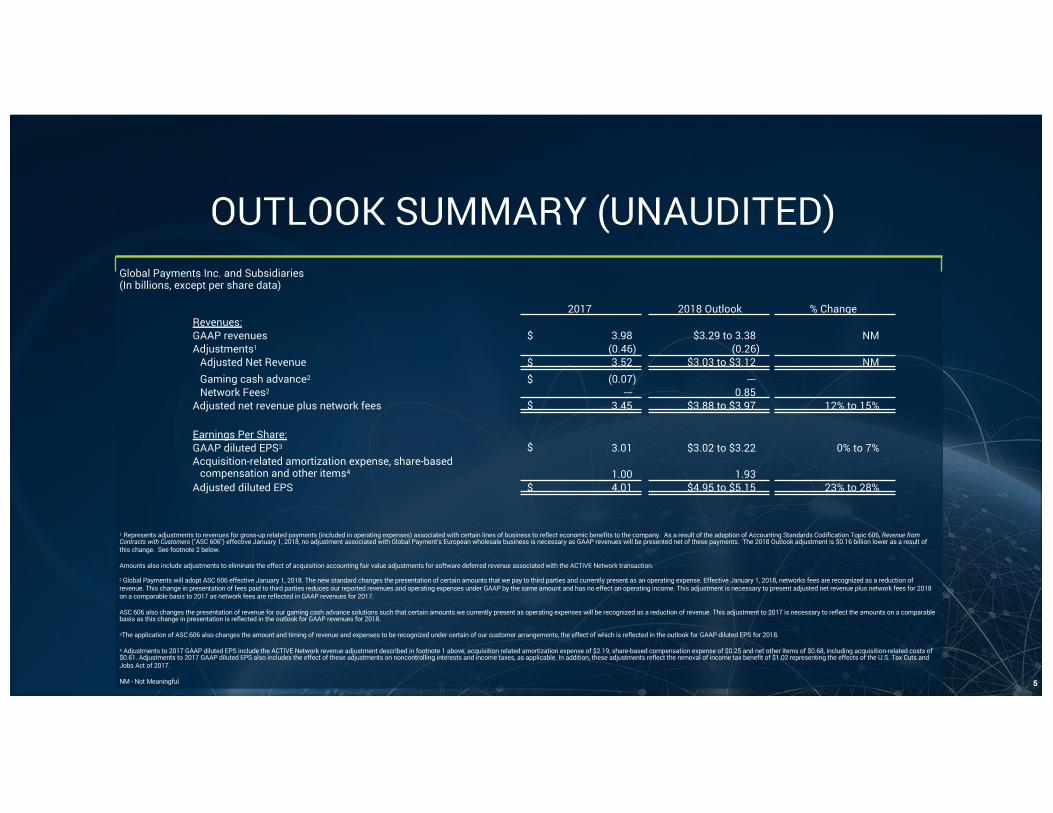
OUTLOOK SUMMARY (UNAUDITED)
1 Represents adjustments to revenues for gross-up related payments (included in operating expenses) associated with certain lines of business to reflect economic benefits to the company. As a result of the adoption of Accounting Standards Codification Topic 606, Revenue from Contracts with Customers ("ASC 606") effective January 1, 2018, no adjustment associated with Global Payment’s European wholesale business is necessary as GAAP revenues will be presented net of these payments. The 2018 Outlook adjustment is $0.16 billion lower as a result of this change. See footnote 2 below.
Amounts also include adjustments to eliminate the effect of acquisition accounting fair value adjustments for software deferred revenue associated with the ACTIVE Network transaction.
2 Global Payments will adopt ASC 606 effective January 1, 2018. The new standard changes the presentation of certain amounts that we pay to third parties and currently present as an operating expense. Effective January 1, 2018, networks fees are recognized as a reduction of revenue. This change in presentation of fees paid to third parties reduces our reported revenues and operating expenses under GAAP by the same amount and has no effect on operating income. This adjustment is necessary to present adjusted net revenue plus network fees for 2018 on a comparable basis to 2017 as network fees are reflected in GAAP revenues for 2017.
ASC 606 also changes the presentation of revenue for our gaming cash advance solutions such that certain amounts we currently present as operating expenses will be recognized as a reduction of revenue. This adjustment to 2017 is necessary to reflect the amounts on a comparable basis as this change in presentation is reflected in the outlook for GAAP revenues for 2018.
3The application of ASC 606 also changes the amount and timing of revenue and expenses to be recognized under certain of our customer arrangements, the effect of which is reflected in the outlook for GAAP diluted EPS for 2018.
4 Adjustments to 2017 GAAP diluted EPS include the ACTIVE Network revenue adjustment described in footnote 1 above, acquisition related amortization expense of $2.19, share-based compensation expense of $0.25 and net other items of $0.68, including acquisition-related costs of $0.61. Adjustments to 2017 GAAP diluted EPS also includes the effect of these adjustments on noncontrolling interests and income taxes, as applicable. In addition, these adjustments reflect the removal of income tax benefit of $1.02 representing the effects of the U.S. Tax Cuts and Jobs Act of 2017.
NM - Not Meaningful
2017 2018 Outlook % ChangeRevenues:GAAP revenues 3.98 $3.29 to 3.38 NMAdjustments1 (0.46) (0.26)
Adjusted Net Revenue 3.52 $3.03 to $3.12 NMGaming cash advance2 (0.07) ---Network Fees2 --- 0.85
Adjusted net revenue plus network fees 3.45 $3.88 to $3.97 12% to 15%
Global Payments Inc. and Subsidiaries(In billions, except per share data)
$
$$
$
Earnings Per Share:GAAP diluted EPS3 3.01 $3.02 to $3.22 0% to 7%Acquisition-related amortization expense, share-based
compensation and other items4 1.00 1.93Adjusted diluted EPS 4.01 $4.95 to $5.15 23% to 28%
$
$
5

RECONCILIATION OF NON-GAAP FINANCIAL MEASURES (UNAUDITED)
Years Ended December 31, 2017Global Payments Inc. and Subsidiaries(In millions, except per share data)
1 Management believes adjusted free cash flow is a useful measure of the company's ability to service debt, return capital to shareholders, invest in the business and demonstrate value creation of our underlying operations. Adjusted free cash flow, a non-GAAP measure, is calculated as net operating cash flows, excluding the impact of settlement processing assets and obligations and acquisition and integration costs, less capital expenditures and distributions to non-controlling interests. On January 1, 2017, we adopted Accounting Standards Update ("ASU") 2016-09 - “Compensation – Stock Compensation (Topic 718): Improvements to Employee Share-Based Accounting.” In accordance with this new standard, excess tax benefits from share-based compensation plans, which were previously reflected as a financing activity in our consolidated statements of cash flows, are now presented as an operating activity (included in “Other, net”) using a retrospective transition method for all periods presented. Our measure of adjusted free cash flow reflects management's judgment of particular items and may not be comparable to similarly titled measures reported by other companies.
Year Ended December 31, 2017Adjusted Free Cash Flow1:Cash flow from operating activities 512.4
Changes in settlement processing assets and obligations, net 361.7Acquisition and integration costs 94.6Capital expenditures (181.9)Distributions to noncontrolling interests (9.3)
Adjusted Free Cash Flow 777.5
$
$
6

NON-GAAP FINANCIAL MEASURES
Global Payments supplements revenues, income and EPS information determined in accordance with U.S. GAAP by providing these measures, and other measures, with certain adjustments (such measures being non-GAAP financial measures) in this document to assist with evaluating our performance. In addition to GAAP measures, management uses these non-GAAP financial measures to focus on the factors the company believes are pertinent to the daily management of our operations. Management believes adjusted net revenue and adjusted net revenue plus network fees more closely reflect the economic benefits to the company's core business and, in the case of adjusted net revenue, allows for better comparisons with industry peers. Management uses these non-GAAP financial measures, together with other metrics, to set goals for and measure the performance of the business and to determine incentive compensation. Adjusted net revenue, adjusted net revenue plus network fees, organic adjusted net revenue, adjusted operating income, adjusted operating margin, adjusted net income and adjusted EPS and adjusted free cash flow should be considered in addition to, and not as substitutes for, revenues, operating income, net income and EPS and cash flows from operating, investing and financing activities determined in accordance with GAAP. The non-GAAP financial measures reflect management's judgment of particular items, and may not be comparable to similarly titled measures reported by other companies.
Adjusted net revenue excludes gross-up related payments associated with certain lines of business to reflect economic benefits to the company. On a GAAP basis, these payments are presented gross in both revenues and operating expenses.
Adjusted operating income, adjusted net income and adjusted EPS exclude acquisition-related amortization expense, share-based compensation and certain other items specific to each reporting period as more fully described in the accompanying reconciliations. Beginning in 2018, adjusted operating margin is derived by dividing adjusted operating income by adjusted net revenue plus network fees. The tax rate used in determining the net income impact of earnings adjustments is either the jurisdictional statutory rate in effect at the time of the adjustment or the jurisdictional expected annual effective tax rate for the period, depending on the nature and timing of the adjustment.
Adjusted free cash flow, a non-GAAP measure, is calculated as net operating cash flows, excluding the impact of settlement processing assets and obligations and acquisition and integration costs, less capital expenditures and distributions to non-controlling interests. Management believes adjusted free cash flow is a useful measure of the company's ability to service debt, return capital to shareholders, invest in the business and demonstrate value creation of our underlying operations.
Long-Term TargetsWe are not able to reconcile our long-term targets for organic adjusted net revenue growth + network fees, adjusted operating margin and adjusted EPS to our long-term projections for the most directly comparable GAAP financial measures without unreasonable efforts because we are unable to predict with a reasonable degree of certainty the actual impact of changes to the business and global economy, the exact timing of acquisitions, and the aforementioned risks and uncertainties in this statement.
7