TATH - Seeking Alpha
39
November 6, 2020 The National Stock Exchange of India Ltd. Exchange PIaza,5th floor Plot No. C/1,G Block Bandra Kurla Complex Bandra (E) Mumbai400051 Scrip Code ~ TATACONSUM ^ TATH BSE Ltd. Corporate Relationship Dept. 1 Floor, New Trading Wing R-otunda Building, PJ Towers Dalal Street Mumbai400001 Scrip Code - 500800 The Calcutta Stock Exchange Ltd. 7 Lyons Range Kolkata700001 Scrip Code - 10000027 (Demat) 27 (Physical) Sub: Analysts Presentation - financial results for the quarter and half year ended September 30, 2020 Dear Sir/Madam, Further to our letter dated October 20 and October 27, 2020 we enclose herewith a copy of the Presentation for the analysts/investors on the financial results for the quarter and half year ended September 30, 2020. The same is also uploaded on the Company's website www.tataconsumer.com. This is for your information and records. Yours faithfully, For Tata Consumer Products Limited Neelabja Chakrabarti Company Secretary TATA CONSUMER PRODUCTS LIMITED (Formerly known asTata Global Beverages Limited) 11/13 Botawala Building 1st Floor Office No 2-6 Horniman Circle Fort Mumbai 400 001 India Tel: 91-22-6121-8400 | Fax: 91-22-61218499 Registered Office: 1, Bishop Lefroy Road, Kolkata - 700 020 Corporate Identity Number (CIN): L15491WB1962PLC031425 Email: [email protected] Website: www.tataconsumer.com
Transcript of TATH - Seeking Alpha

November 6, 2020
The National Stock Exchange ofIndia Ltd.Exchange PIaza,5th floorPlot No. C/1,G BlockBandra Kurla Complex
Bandra (E)Mumbai400051Scrip Code ~ TATACONSUM
T̂ATH
BSE Ltd.Corporate Relationship Dept.1 Floor, New Trading WingR-otunda Building, PJ Towers
Dalal StreetMumbai400001Scrip Code - 500800
The Calcutta StockExchange Ltd.
7 Lyons RangeKolkata700001Scrip Code - 10000027(Demat)27 (Physical)
Sub: Analysts Presentation - financial results for the quarter and half year ended September 30,
2020
Dear Sir/Madam,
Further to our letter dated October 20 and October 27, 2020 we enclose herewith a copy of thePresentation for the analysts/investors on the financial results for the quarter and half year ended
September 30, 2020.
The same is also uploaded on the Company's website www.tataconsumer.com.
This is for your information and records.
Yours faithfully,For Tata Consumer Products Limited
Neelabja ChakrabartiCompany Secretary
TATA CONSUMER PRODUCTS LIMITED(Formerly known asTata Global Beverages Limited)
11/13 Botawala Building 1st Floor Office No 2-6 Horniman Circle Fort Mumbai 400 001 IndiaTel: 91-22-6121-8400 | Fax: 91-22-61218499
Registered Office: 1, Bishop Lefroy Road, Kolkata - 700 020Corporate Identity Number (CIN): L15491WB1962PLC031425
Email: [email protected]
Website: www.tataconsumer.com

Investor PresentationFor the quarter ended September 2020
6th November’20

2
Certain statements made in this presentation relating to the Company’s objectives, projections, outlook, expectations, estimates,
among others may constitute ‘forward-looking statements’ within the meaning of applicable laws and regulations. Actual results
may differ from such expectations, projections etc., whether express or implied. These forward-looking statements are based on
various assumptions, expectations and other factors which are not limited to, risk and uncertainties regarding fluctuations in
earnings, competitive intensity, pricing environment in the market, economic conditions affecting demand and supply, change in
input costs, ability to maintain and manage key customer relationships and supply chain sources, new or changed priorities of
trade, significant changes in political stability in India and globally, government regulations and taxation, climatic conditions,
natural calamity, commodity price fluctuations, currency rate fluctuations, litigation among others over which the Company does
not have any direct control. These factors may affect our ability to successfully implement our business strategy. The company
cannot, therefore, guarantee that the ‘forward-looking’ statements made herein shall be realized. The Company, may alter, amend,
modify or make necessary corrective changes in any manner to any such forward looking statement contained herein or make
written or oral forward-looking statements as may be required from time to time on the basis of subsequent developments and
events.
Disclaimer

Executive Summary Integration Update Business Performance –
India
Business Performance –
International
Financial Performance
Agenda
Responsible Business
Outlook and Priorities

4
We are Tata Consumer Products
Integrated F&B company
with rich heritage of Tata,
aspiring for a larger share
of the FMCG World
In a nutshell
Largest salt brand in India 4th largest tea brand in UK &
largest tea brand in Canada
2nd Largest tea brand in
India
4th largest R&G coffee
brand in USA
Leading National brand
in pulses in India
2,250+ employees
worldwide
₹ 9.6K crore consolidated
revenue in FY20 and current
market cap of ~₹47k Cr.
#1 natural mineral water
brand in India
Among the top 10 F&B
companies in India
#2 branded tea player
globally
Reach to almost 200mn
households in India and
distribution to ~2.2mm retail
outlets

Executive Summary (for the Qtr ending 30th Sep’20)
6
• India Business grew strongly; while there was demand normalization in International markets with unwinding of pantry loading
• Consolidated Revenue grew 19% to INR 2,781Cr driven by strong growth in India Business
• Consolidated EBITDA grew 26% to INR 402Cr despite significant inflation in raw tea prices
• Overall, India Business# grew 25% led by
• India Packaged Beverages Business grew by 29%; driven by volume and pricing
• India Foods Business grew by 13%
• Sequential improvement in NourishCo’s performance
• Branded International Beverage Business, excluding Foodservice, grew 11%
• Consolidated PBT (bei^) for the Quarter is higher by 31% at INR 345Cr.
• While we have gained market share in tea and salt; navigating the unprecedented inflation in raw tea prices will be critical
• The integration of India Foods business with India Beverages business is progressing ahead of plan
• The reworking of S&D system showing results; expansion of outlet reach, significant increase in E-com contribution
#including impact of NourishCo as a subsidiary effective May’20.
^ bei - PBT before exceptional items

International Beverages
In ₹ Cr
(unless specified)India Beverages India
Foods
US Coffee International
Tea
Foodservice
(International)
Tata Coffee
(incl. Vietnam)
Consolidated
Revenue 1,120 580 301 444 56 243 2,781
Revenue GrowthConstant currency growth
32% 13% 11%
4%
11%
1%
-23%
-29%
17%
15%
19%
16%
Volume Growth 11% 6% -3% 0% -19% 8%
Key Businesses snapshot
Key Brands
Note:
a) India Beverages includes Middle East and NourishCo (subsidiary effective May’20)
b) International tea business includes UK, Canada, US, Aus and Europe.
c) Tata Coffee incl. Vietnam and excl. USCoffee (EOC)
d) Consolidated revenue includes other non-branded business and Inter-segment eliminations
7

₹ 2,781 Cr. ₹ 402 Cr. ₹ 345 Cr. ₹ 273 Cr. ~₹ 1,439 Cr.
Revenue EBITDA PBT (bei)^ Group Net Profit Net Cash$
Growth (Y-on-Y) 19% 26% 31% 31%
Margin% 14.4% 12.4% 9.8%
Margin expansion
(Y-on-Y)+90 bps +120 bps +100 bps
EPS / Cash EPS2.79 (EPS)
4.08 (Cash EPS)
EPS Growth (Y-on-Y)+33% (EPS)
+30% (Cash EPS)
Group Performance at a glance
^ PBT before exceptional items
$ Cash and Cash equivalents (net of total borrowings) as at Sep 30, 2020
8

Macro and Commodity Overview
• India GDP growth was severely impacted in Q1FY21 with all segments,
except agriculture, contracting. However, Q2FY21 GDP decline is expected to
be lower with the economy seeing some recovery.
• US & UK GDP growth also registered significant decline in Apr-June.
However, a sharp economic rebound is expected in Jul-Sep period.
Source: NSO, tradingeconomics.com and Kotak Institutional Research
Volatile commodity prices
%
156 155
272
101 92
163
227 190 188
Q2 FY19 Q2 FY20 Q2 FY21
North India Tea South India Tea
Kenya Tea
Tea Prices Coffee Prices
₹ / KG
$c / KG
₹ / KG
107101
115
72 61 61
Q2 FY19 Q2 FY20 Q2 FY21
Arabica Coffee Robusta Coffee
$c/ LB
$c/ LB
• Both North India Tea and South India Tea prices witnessed unprecedented inflation during
the quarter. However, prices have started to taper off from Sep’20.
• Kenyan tea prices have remained stable YoY.
• Arabica coffee prices saw an uptick while Robusta coffee prices remained stable YoY.
Source: North India and South India tea auction (Tea Board of India) | Mombasa tea
auction (EATTA) | International Coffee Exchange
9
5.2 4.4 4.1 3.1
-23.9
-10.4
2.0
2.1 2.3
0.3
-9.0-2.81.3 1.0 1.0
-2.1
-21.5
-10.1
Q1FY20 Q2FY20 Q3FY20 Q4FY20 Q1FY21 Q2FY21 E
India GDP growth US GDP growth UK GDP growth
Sharp recovery in economic activity, post
weakness in Q1

Quarterly Category Performance
10
US UK Canada India
• Regular black tea growth has
softened in US and Canada as
compared to high levels seen in Q1.
In UK, Regular black tea growth is
driven by competitive price
landscape at Key retailer during
July-Sep (while Sep grew modestly
by 0.3%)
• Non-black tea (Fruit & Herbal,
Specialty, Decaf, Cold Infusions,
etc.) continue growth momentum in
the International markets, led by
health & wellness products, but the
growth rates have reduced.
• With gradual lifting of lockdown/
restrictions, Indian market has
recovered from a decline of ~6%
(Apr-Jun) to a growth of ~6% (Jul-
Sep) in Branded tea with sequential
improvement.
• US Coffee (both Bags and K-cups)
Coffee continue to grow driven by
strong promotional activity.
US Regular Black Tea
US Bags Coffee
UK Regular Black Tea
UK Fruit & Herbals Tea
Canada Regular Black Tea
Canada Speciality Tea
India Branded Tea
Mixed performance across categories and regions
+1.0%
+12.0%
+3.0%
+18.0%
+5.6%
+1.6%
+13.2% +10.3
%
US K-cup Coffee
Source: Nielsen: 12 weeks (Value) – Sep’20

12
Key Integration milestones: UpdateBroad timelines and Status
Outlet expansion (2x)
Other / Digital
India Supply
Chain
India S&D
Q4 ‘21Q3 ‘21Q2 ‘21Q1 ‘21Mar’20
Integrated Org structure
Complete Integration & Process Harmonization
S&D structure design
Integrated S&D design implementation
Digitization across partners and field force
Synergies Identification On track to realize synergy estimates
CFA Consolidation and Direct Delivery
Integrated Business Planning
Organisation
ERP Integration*
Transport and Warehouse Management system
Process Automation across functions
Completed
S&D structure design
• Integration expected to be substantially completed by Q4 FY21; to enable better execution of strategic roadmap
• Synergy identification completed; on track to start realising benefits from Q3 FY21
• 2 of 3 stages of Distributor consolidation done; process expected to be completed by Q4 FY21
• Outlet reach expanded by ~12% till Sep’20
Impact
In Process Yet to start


14
• Margins stable YoY despite unprecedented inflation in raw tea prices, delivered through dynamic P&L management.
• Navigating unprecedented tea inflation, balancing the volume and margin will be the key challenge in short term
• Robust revenue growth
across the portfolio, driven by
higher volume and price
realization
• Market share gains (both in
volume and value terms)*
India Packaged Beverages
Chakra Gold Poly-pack
launched in TN
• Continued focus on evoking
regional pride through hyper-
local campaigns across brands
• Leveraging IPL association
with Chennai Super Kings for
Chakra Gold
Performance commentary
Other updates
*Source : Nielsen (Sep’20)
• Tata Tea Premium won
Gold in 6 categories at the
‘ET BE Shark Awards
2020’, along with ‘Brand of
the Year 2020’.
Celebrating local artisanship &
pride in local culture(Independence
Day: #DeshkaKulhad campaign)
Festival Special Packaging: Durga
Puja pack (Tata Tea Gold) and
Chhat Puja pack (Tata Tea Leaf)
+29%Revenue Growth
+12%Volume Growth

15
• Double-digit revenue growth
across the Salt and Tata
Sampann portfolio.
• Salt revenues grew 10% in
Q2 with market share gains*.
• Value added salt portfolio has
grown by ~100%.
• Pulses continue to deliver
robust growth, up 35%.
• Our new launches Poha and
nutria-mixes are showing
strong traction and consumer
offtake.
• Tata Sampann
#spiceupyourhealth
campaign positively
impacting brand health
parameters
• TATA Salt awarded as the
‘Most Trusted Brand in
India’ by consumers in the
Brandz survey done by WPP
and Kantar
India Foods
+13%Revenue Growth
+6%Volume Growth
Performance commentary
Products from Tata Sampann portfolio *Source : Kantar World Panel
“TATA Salt” is a co-sponsor for KBC 2020
Other updates

NourishCo (100% Subsidiary)#
Virtual events conducted themed #RawConversations, in
partnership with Conde Nast, with renowned Chefs, Wellness
experts, etc. on social media.
• Geographic expansion plan
on track.
• Portfolio expansion plan
underway.
Performance commentary
• Sequential recovery in sales,
both volume and value.
• Highest ever volumes achieved
for Tata Water Plus in Sep’20
• Himalayan continues to face
some headwinds with
lockdown restrictions.
However, gradual recovery
of sales seen month-on-
month.
16
#NourishCo performance for the quarter as separate legal entity
• Successfully transitioned
Himalayan to own
distribution network in
Sep’20.
37%
91%
67%
101%
Mar May July Sep
Sa
les
as
a %
of
PY
38 CrRevenue
87%of Pre-Covid
Revenue levels Other updates

Tata Coffee (inc Vietnam) (~58% Subsidiary)
+17%#
Revenue Growth
+6%Plantations
Volume Growth
• Topline grew by 17% (15% in
constant currency terms) led
by Vietnam primarily
Plantations
• Plantations business grew by
26% in value terms
• Significant growth in pepper
volumes
Extractions
• Overall extraction business
grew by 13% (+11% volume
growth) led by Vietnam
business
• Profits impacted by non-
accrual of Export incentive
(MEIS) on exports of coffee
extraction
Performance commentary
• Vietnam plant now operating
at ~90% capacity.
State-of-the-art Freeze-Dried Instant Coffee manufacturing
facility in Vietnam with a capacity of 5,000 MT per annum.
+11%Extractions
Volume Growth
17
# Tata Coffee including Vietnam. Does not include EOC
Other updates
Arabica berries from our Coffee Estate

Tata Starbucks (JV)
‘
• Revenue recovering month-
on-month, Sept ~70% of
previous year.
• Significant savings achieved
through rental renegotiations
• Launched dedicated store for
Starbucks merchandise on
Flipkart
• Opened 11 new stores and added
one new city (Lucknow)
• MSR members: 8.13 lakhs :
YoY%: +20%
• Launched the Mobile Order and
Pay feature to allow customers to
pre-order beverages on the
Starbucks India App
• Presence across all home
delivery platforms.
• #StarbucksAtHome : Launch
of 1 Litre Freshly brewed
beverages created strong
customer engagement on
social media and led to strong
sales
▪ #GiftAStarbucks campaign
established a strong range of
gifting options
Three All women
stores opened during
this year.
• Recognized as ‘India’s top
100 companies to work for
women’ by Great Places to
Work and Working Mothers
and Avtar, 2020
Performance commentary
86%Stores re-opened
196Stores
12Cities
18
1%
27%
54%
71%
Apr Jun Aug Sep
Sa
les
as
a %
of
PY
Strong month on month recovery
Other updates


20
UK
• Cold Infusions category under
pressure due to slowdown in
OOH consumption.
• Revenue growth of 4%
(constant currency) with
volume growth of 7%
• Discounter channel continues
to be the biggest growth
driver, with growth across Key
Accounts.
• OOH and Wholesale channel
continue to face headwinds
due to lockdowns.
• Improved profitability on
account of higher sales and
improved gross margins
• Good Earth Tea and
Kombucha performing well
Performance commentary
4%Revenue Growth^
20.5%Value Market share
(in everyday black)*
Tetley Herbals new range
launched: Caffeine-free and
natural ingredients.
Strong performance by Good
Earth, achieved ~1% share (week)
of Sainsbury’s Tea Category
Other updates
Source: *Nielsen - Moving Annual Total (MAT) basis – Sep’20
^ constant currency

USA
New Good Earth Sensorial
blends launched supported by
product focused social media
marketing
• Coffee: Good revenue growth
of 4% (constant currency),
while volumes declined 3%
• Tea (excluding Empirical):
Strong revenue growth of 11%
against volume growth of 8%
• Food service (Empirical)
business continues to face
headwinds. However, the
business is recovering month-
on-month.
4%Coffee Revenue
Growth^
5.4%*Bags Coffee Market
Share
Performance commentary
21
New Tetley British blends launched. Each blend is uniquely crafted with
character notes from around the world
• Good Earth Sensorial Blends
seeing good traction
Other updates
Source: *Nielsen - Moving Annual Total (MAT) basis – Sep’20
^ constant currency

Canada
• Tetley #1 in Specialty tea
category now in value
terms also^
• Post a surge in Q1,
demand in regular tea sales
has seen a marginal down-
tick.
• Revenue growth of 1%
(constant currency)
• , against a volume decline
of 7%; driven by a decline
in foodservice business and
discontinuation of ethnic
teas.
• Improved profitability driven
by rationalization of
overheads
Digital campaigns for Tetley
Immune+ Super teas
Performance commentary
1%Underlying Revenue
Growth^^
25%Revenue growth in
Specialty tea^^
New Tetley Super Tea (Immune+
and Sunshine) together with
Herbal teas (Turmeric and
Cinnamon) launched
22
Source: Nielsen
*Moving Annual Total (MAT) basis – Sept’20
^latest 12 weeks (Sept’20)
^ ^ constant currency
• Cold infusions campaign
supported with Digital video,
TV and In-store activities
during the quarter.
29.5%*Market share
Other updates

23
Brand Campaigns
Tetley Canada Cold
Infusions brand
support carried out on
Digital and TV during
the quarter, featuring
Olympic gold medalist
swimmer Penny
Oleksiak
Eight O’ Clock Coffee USA partnered with Evette Rios
to celebrate National Coffee day over social media.
https://www.facebook.com/watch/?v=423952188573696
Tetley UK launched its new Herbals range
with Need a ‘me’ moment? campaign
across social media.
https://www.facebook.com/watch/?v=38878
4245475371
23
Tata Sampann #spiceupyourhealth campaign
driving brand health across media – TV,
Digital/Social media and Print.
Tetley Mango
launched,
supported by
Local promotions
and Digital
campaigns.

24
Awards & Recognition
1. Most Trusted BrandTata Salt won the title of India's
Most Trusted Brand for 2020 –
third time in a row.
3. Great WorkplaceStarbucks recognized as Top #100
Work places for Women in India
2020 by ‘Great Place To Work’ and
‘Avtar and Working Mother’ (5
consecutive years)
2. Brand of the YearTata Tea Premium won awards in 6
categories at the ‘ET Brand Equity
Shark Awards 2020’, along with
‘Brand of the Year 2020’.
5. SustainabilitySampla and Pullivasal Packeting
Centres awarded Silver prize in the
6th edition of the India Green
Manufacturing Challenge
4. Great Taste Awards Tetley UK won 6 Great Taste
Awards for 2020
6. PackagingHimalayan Sparkling and Tata Tea
Tulsi Green won ‘India Star
awards’ for excellence in
packaging from IIP


Climate LeadershipWe are one of the 6 companies
in India on CDP A- list
Decoupling Emissions
from growthCarbon footprint decreased
26% in 2010-20
Water StewardshipProject Jalodari in Himachal
and Assam with Tata Trust
Circular EconomyUK Plastics Pact – 100%
recyclable, reusable, compostable
by 2025.
Sustainability: Value Chain, Communities & Climate
26
Tata Consumer
Products aims
to support
development
programs for
1 million community members
Trustea Program verifies 650
Mn. kgs of Indian Tea,
positively impacting over
600,000 workers and 57,000
Small Tea growers.
UNICEF Malawi project on
childhood development
initiated. #DeshKaKulhad supports
Okhai artisans.
Tetley’s Follow the Frog
campaign gets 500,000
impressions
FOR BETTER PLANETFOR BETTER COMMUNITIES


317
85 402
Q2FY20 Growth Q2FY21
1,427 309 1,736
Q2FY20 Growth Q2FY21
205
49 254
Q2FY20 Growth Q2FY21
2,347 434 2,781
Q2FY20 Growth Q2FY21
Highlights – for the quarter ended Sep’20
(in ₹ Cr)Standalone (in ₹ Cr)Consolidated
Reven
ue f
rom
op
era
tio
ns
EB
ITD
A
+22% +19%
+26%+24%
28
REVENUE:
Group Revenue grew by 19% (constant currency 16%)
• India Beverages (including RTD) grew by 32%.
• India Foods higher by 13%.
• International Business excluding foodservice,
grew by 11% (+2% in constant currency terms)
• Tata Coffee incl. Vietnam, achieved 17% growth
EBITDA:
Group EBITDA growth of 26%
• India Foods and Beverages profits improved
with better realizations and cost saving
initiatives
• International business, excluding foodservice,
profit improvement across most geographies.
• Other Non-branded business in India also
impacted due to uncertainty of Export
incentives (non-accrual)

Financials: Standalone
29
Quarter ended Sep’20 Profit and Loss statement
(all nos. in ₹ Crores)
Year to date Sep’20
Q2FY21 Q2FY20 Change % 1HFY21 1HFY20 Change %
1,736 1,427 22 % Revenue from operations 3,342 2,891 16 %
254 205 24 % EBITDA 579 439 32 %
14.6 % 14.4% 0.2 % % 17.3 % 15.2 % 2.1 %
223 178 25 % EBIT 519 387 34 %
12.8 % 12.5% 0.3 % % 15.5 % 13.4 % 2.1 %
250 206 21 % PBT before exceptional items 585 449 30 %
(19) (2) Exceptional items (40) (10)
(61) (49) Tax (143) (130)
169 155 9 % PAT 402 310 30 %
9.8 % 10.9 % (1.1%) % 12.0 % 10.7 % 1.3%
Standalone Net Profits for the Quarter is higher by 9% on account of :
• Higher revenue and dynamic cost management, despite unprecedented tea inflation.
• Partly offset by higher exceptional items (mainly costs related to Integration of India Foods & Beverages and
redundancy costs)

Financials: Consolidated
30
Quarter ended Sep’20 Profit and Loss statement
(all nos. in ₹ Crores)
Year to date Sep’20
Q2FY21 Q2FY20 Change % 1HFY21 1HFY20 Change %
2,781 2,347 19 % Revenue from operations 5,495 4,739 16 %
402 317 26 % EBITDA 888 671 32 %
14.4 % 13.5 % 0.9 % % 16.2 % 14.2 % 2.0 %
339 259 31 % EBIT 763 555 37 %
12.2 % 11.0% 1.2 % % 13.9 % 11.7 % 2.2 %
345 264 31 % PBT before exceptional items 782 572 37 %
(24) (1) Exceptional items 39 (10)
(87) (64) Tax (198) (166)
234 199 18 % PAT 623 396 57 %
8.4% 8.5 % (0.1%) % 11.3 % 8.4 % 2.9%
273 208 31 % Group Net Profit (incl. JVs & Associates) 619 398 55 %
Group Consolidated Net Profits for the quarter grew by ~31% against previous year on account of following :
• Increase in EBIDTA – with higher revenue and effective management of discretionary costs, despite unprecedented tea inflation in India.
• Higher share of profit from JV / Associates
• Partly offset by higher exceptional items (mainly costs related to Integration of India Foods & Beverages, redundancy costs and non-cash
impairment loss on assets relating to a business in Australia)
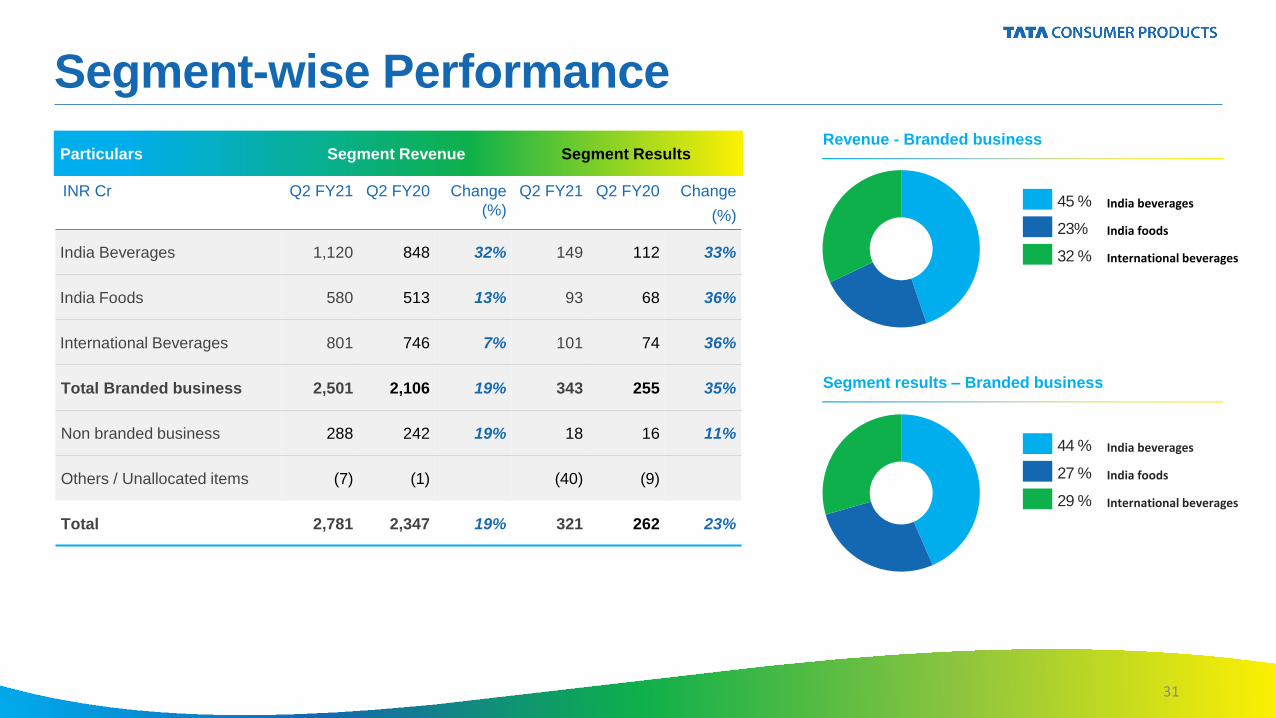
Particulars Segment Revenue Segment Results
INR Cr Q2 FY21 Q2 FY20 Change
(%)
Q2 FY21 Q2 FY20 Change
(%)
India Beverages 1,120 848 32% 149 112 33%
India Foods 580 513 13% 93 68 36%
International Beverages 801 746 7% 101 74 36%
Total Branded business 2,501 2,106 19% 343 255 35%
Non branded business 288 242 19% 18 16 11%
Others / Unallocated items (7) (1) (40) (9)
Total 2,781 2,347 19% 321 262 23%
Segment-wise Performance
31
Revenue - Branded business
Segment results – Branded business
45 % India beverages
23% India foods
32 % International beverages
44 % India beverages
27 % India foods
29 % International beverages

32
All no.s in Rs Crores1HFY21 1HFY20
Total Equity 15,221 14,525
Goodwill and Brands (Indefinite life) 9,520 9,460
Fixed Assets and other intangibles including Lease assets (net) 1,954 1,978
Working Capital (Net) 1,964 1,834
Operating Capital Employed 13,438 13,272
Other Non-operating Assets (mainly Investments) 344 769
Net (Debt)/Cash & Cash Equivalents# 1,439 484
Total Assets 15,221 14,525
Operating Cash flow (Before Capex and taxes) 578 303
ROE % (Group Net Profit / Equity) – not annualised 4.1% 2.7%
ROCE % (EBIT / Operating CE) – not annualised 5.7% 4.2%
ROCE % (excluding Goodwill and Brand with indefinite life) – not annualised 19.5% 14.6%
Consolidated Balance Sheet and Cash Flow
# Cash and Cash equivalents include other bank balances, current investments and ICDs

Outlook
34
Macros
• Covid-19 second wave in Europe and parts of the US, while new case rate is on a decline in India.
• Indian economy seems to be on a recovery path, albeit the pace of recovery will depend on further stimulus measures.
• Several measures of consumer sentiment registered a sharp decline; green shoots visible in rural consumption.
Business
• Tea Inflation in India remains a headwind in the short term; need to balance growth ambition with margin delivery.
• With the distribution expansion in progress and new product launches, the growth momentum in India Foods to continue.
• The OOH business in India recovering well; food service business in International markets continues to face headwinds.
• Integration of Foods & Beverages businesses is on track; synergy benefits have started to flow ahead of estimates.

Focus & Priorities
Build on
Core BusinessUnlock
Synergies
Drive Digital &
Innovation
Create Future
Ready Org.Care for our
Society
Explore New
Opportunities
35

Thank You
36

Shareholding Information Quarter Ended June’20
37
Pattern as on Sept 30, 2020 Stock data
BSE Ticker 500800
NSE Ticker TATACONSUM
Market Capitalization (Oct 30, 2020) ₹454.2bn
Number of Shares Outstanding 921.55 Mn.
Promoter and promoter Group35%
ForeignInstitutionalInvestors23%
Insurance Companies/ Banks5%
MFs/ UTI/ AIFs12%
Individual22%
Others 3%

For more information
38
Contact us:
Rakesh R Sony
Global Head of Strategy and M&A
Nidhi Verma
Head – Investor Relations & Comm.
Abhishek Musahib
Satya Muniasamy
Write to us at
tataconsumer.com TataConsumer tata-consumer-products/
Call us at
+91-22-61218400
tataconsumerproducts/