
Bernstein - Seeking Alpha
32
Bernstein 35 th Annual Strategic Decisions Conference David Wichmann, CEO John Rex, CFO Brett Manderfeld, IR May 30, 2019
Transcript of Bernstein - Seeking Alpha

Bernstein35th Annual StrategicDecisions Conference
David Wichmann, CEOJohn Rex, CFOBrett Manderfeld, IR
May 30,2019
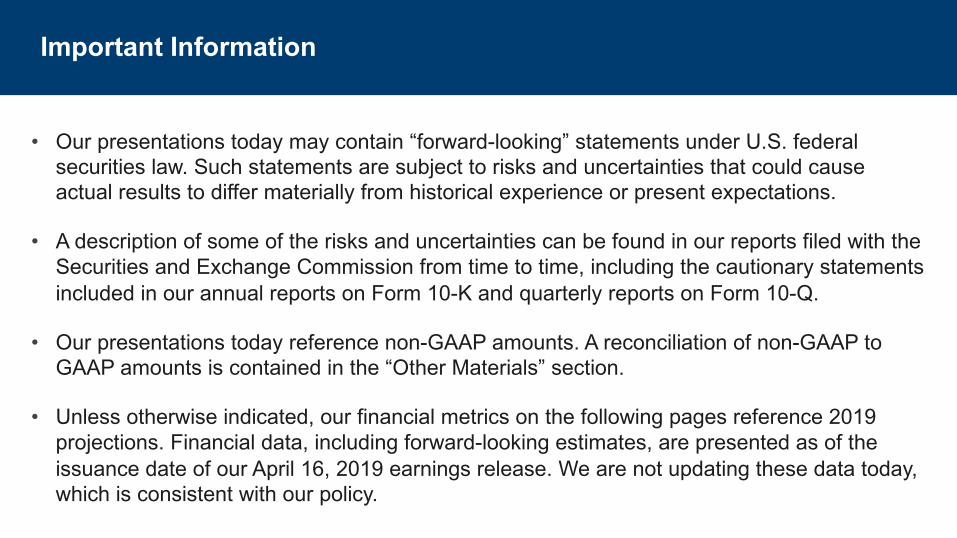
• Our presentations today may contain “forward-looking” statements under U.S. federal securities law. Such statements are subject to risks and uncertainties that could cause actual results to differ materially from historical experience or present expectations.
• A description of some of the risks and uncertainties can be found in our reports filed with the Securities and Exchange Commission from time to time, including the cautionary statements included in our annual reports on Form 10-K and quarterly reports on Form 10-Q.
• Our presentations today reference non-GAAP amounts. A reconciliation of non-GAAP to GAAP amounts is contained in the “Other Materials” section.
• Unless otherwise indicated, our financial metrics on the following pages reference 2019 projections. Financial data, including forward-looking estimates, are presented as of the issuance date of our April 16, 2019 earnings release. We are not updating these data today, which is consistent with our policy.
Important Information

Helping people live healthier lives and helping make the health system work better for everyone
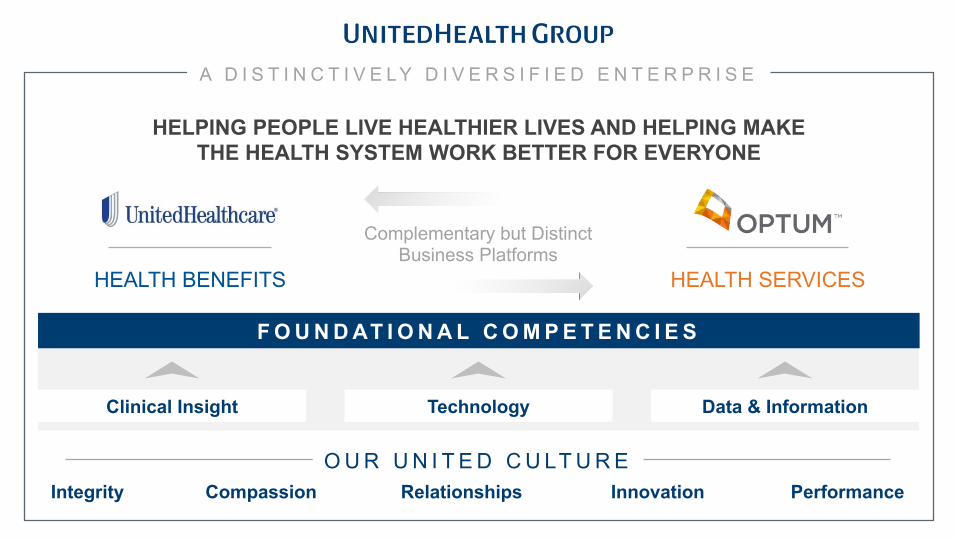
HEALTH BENEFITS HEALTH SERVICES
A D I S T I N C T I V E L Y D I V E R S I F I E D E N T E R P R I S E
Integrity Compassion Relationships Innovation PerformanceO U R U N I T E D C U LT U R E
Clinical Insight
F O U N D AT I O N A L C O M P E T E N C I E S
Data & InformationTechnology
Complementary but Distinct Business Platforms
HELPING PEOPLE LIVE HEALTHIER LIVES AND HELPING MAKE THE HEALTH SYSTEM WORK BETTER FOR EVERYONE
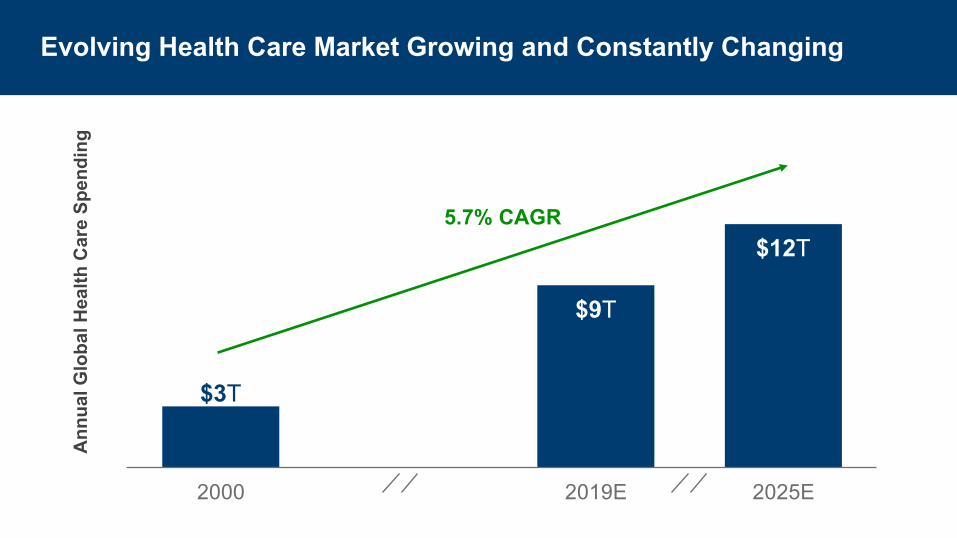
2000 2019E 2025E
$3T
$9T
$12T
Ann
ual G
loba
l Hea
lth C
are
Spen
ding
5.7% CAGR
Evolving Health Care Market Growing and Constantly Changing
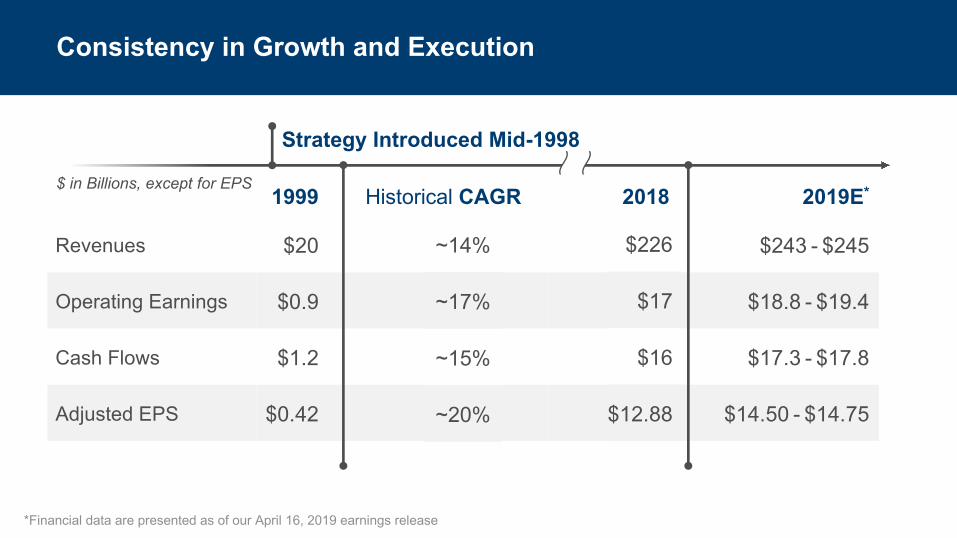
1999 Historical CAGR 2018 2019E*
Revenues $20 $243 - $245
Operating Earnings $0.9 $18.8 - $19.4
Cash Flows $1.2 $17.3 - $17.8
Adjusted EPS $0.42 $14.50 - $14.75
Consistency in Growth and Execution
$ in Billions, except for EPS
Strategy Introduced Mid-1998
$226
$17
$16
$12.88
~14%
~17%
~15%
~20%
*Financial data are presented as of our April 16, 2019 earnings release
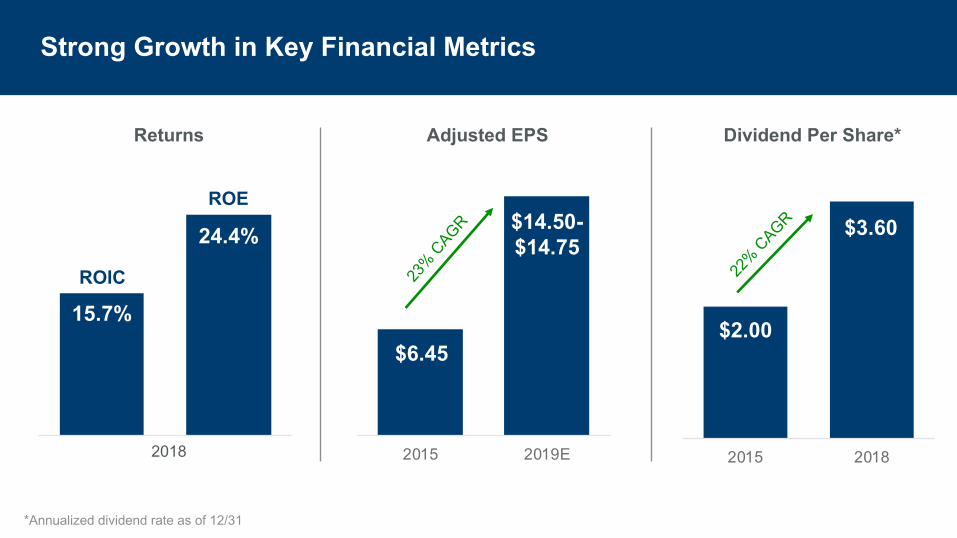
*Annualized dividend rate as of 12/31
Strong Growth in Key Financial Metrics
24.4%
Returns
15.7%
2015 2019E
Adjusted EPS
2015 2018
Dividend Per Share*
23% C
AGR
$6.45
$14.50-$14.75
$2.00
$3.60
22% C
AGR
ROE
ROIC
2018
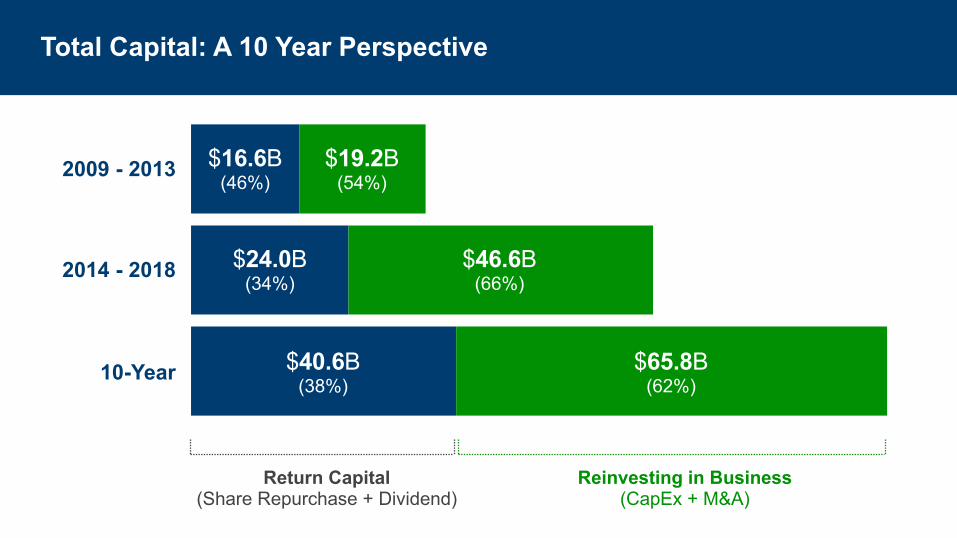
$16.6B(46%)
Return Capital(Share Repurchase + Dividend)
Reinvesting in Business(CapEx + M&A)
2009 - 2013
2014 - 2018
10-Year
$19.2B(54%)
$24.0B(34%)
$46.6B(66%)
$40.6B(38%)
$65.8B(62%)
Total Capital: A 10 Year Perspective
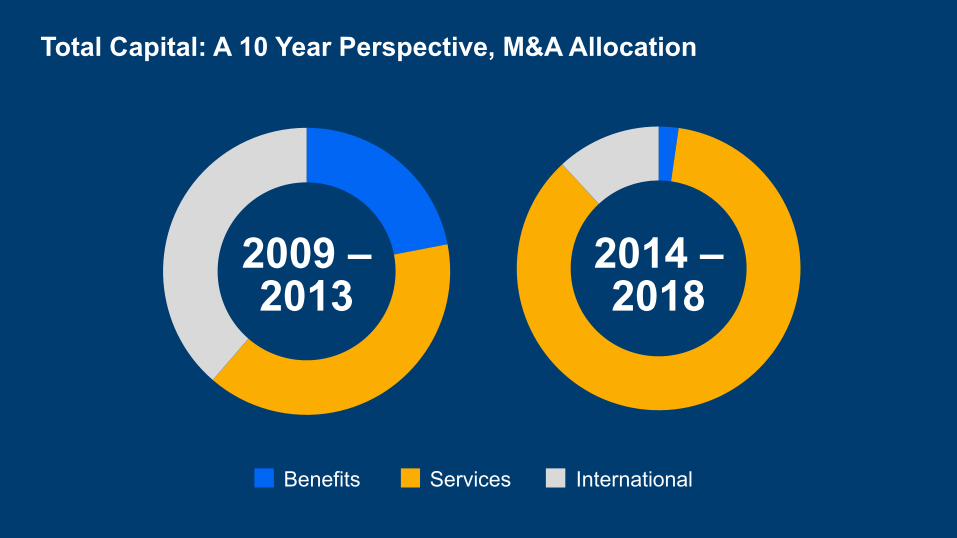
Benefits Services International
2014 –2018
2009 –2013
Total Capital: A 10 Year Perspective, M&A Allocation
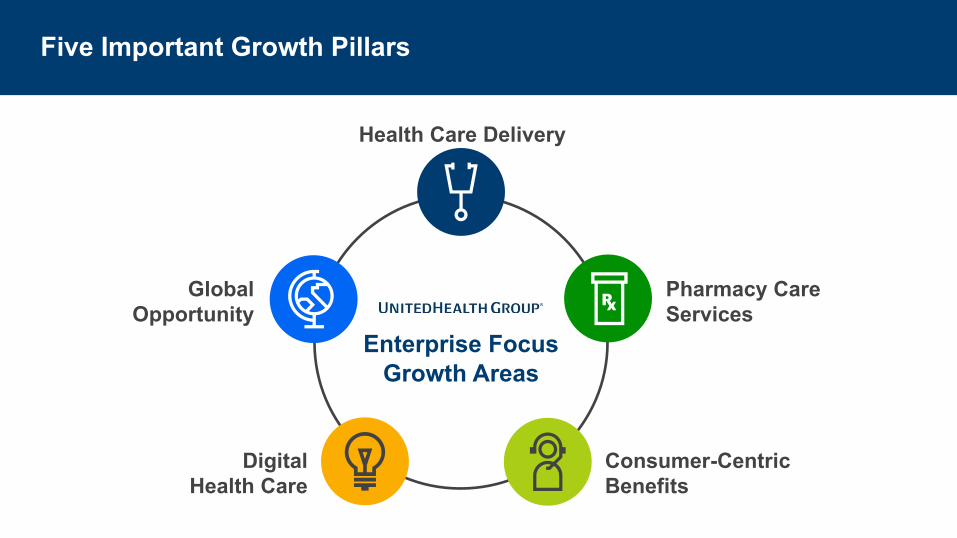
Global Opportunity
Digital Health Care
Consumer-Centric Benefits
Health Care Delivery
Enterprise Focus Growth Areas
Pharmacy Care Services
Five Important Growth Pillars
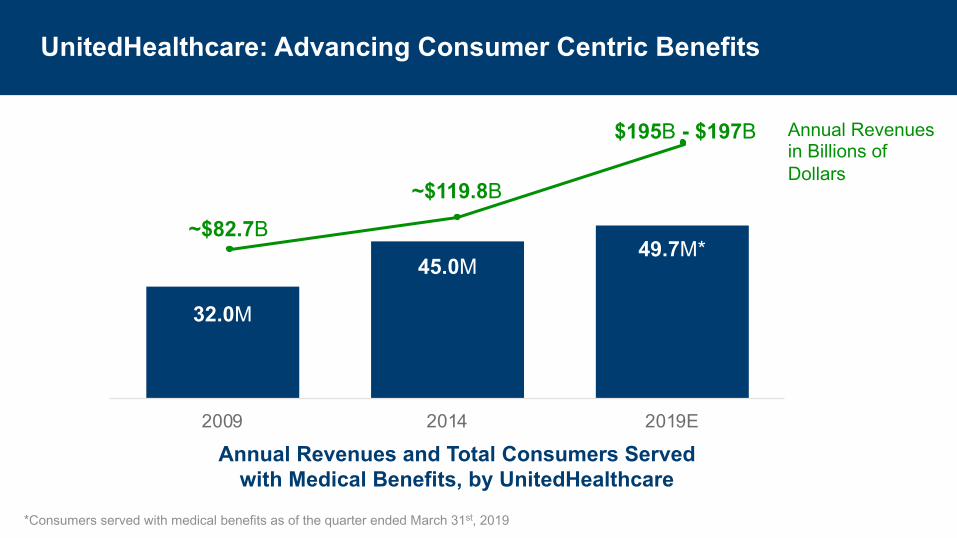
UnitedHealthcare: Advancing Consumer Centric Benefits
2009 2014 2019E
~$82.7B
~$119.8B
$195B - $197B Annual Revenuesin Billions of Dollars
Annual Revenues and Total Consumers Served
with Medical Benefits, by UnitedHealthcare
*Consumers served with medical benefits as of the quarter ended March 31st, 2019
32.0M
45.0M49.7M*

UnitedHealthcare: Advancing Consumer-Centric Benefits
2009 2019E
Medicare$83.0B
Employer & Individual$57.0B
Medicaid$45.0B
Employer & Individual$42.3B
Medicare$30.6B
Medicaid$9.8B
Annual Domestic Revenues
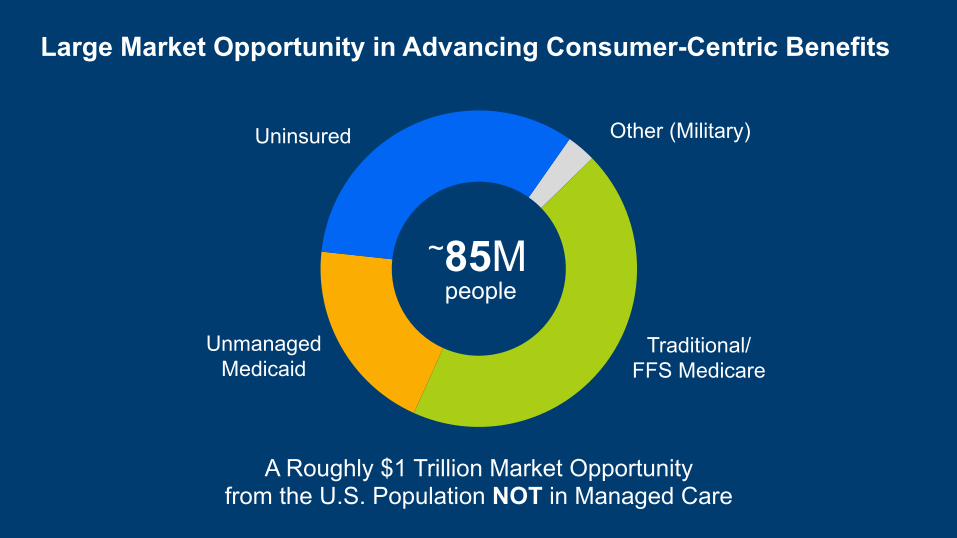
Large Market Opportunity in Advancing Consumer-Centric Benefits
~85Mpeople
Traditional/FFS Medicare
Other (Military)Uninsured
UnmanagedMedicaid
A Roughly $1 Trillion Market Opportunityfrom the U.S. Population NOT in Managed Care
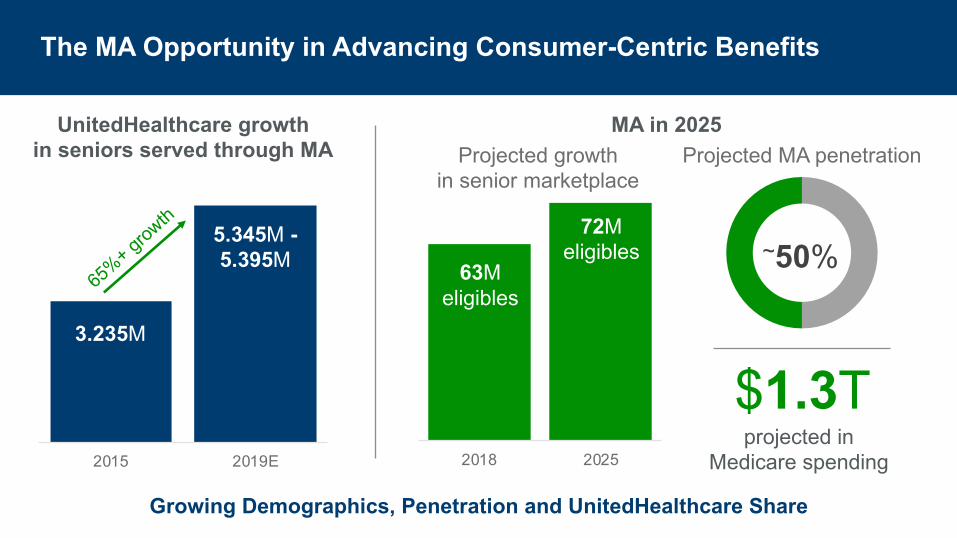
The MA Opportunity in Advancing Consumer-Centric Benefits
Growing Demographics, Penetration and UnitedHealthcare Share
2015 2019E
3.235M
UnitedHealthcare growth in seniors served through MA
MA in 2025
~50%
$1.3Tprojected in
Medicare spending
Projected MA penetrationProjected growthin senior marketplace
5.345M -5.395M
65%+ gr
owth
2018 2025
63Meligibles
72Meligibles

Advancing Consumer-Centric Benefits as the Dual Special Needs Plans (DSNP) Category Leader
people eligible for DSNPs in the U.S.11M
people served by UnitedHealthcare850K+
Strong Growth inDual Special Needs Plans
in managed care2.5M

Advancing Consumer-Centric Benefits through the Rally Platform

Advancing Consumer-Centric Benefits through the Rally Platform
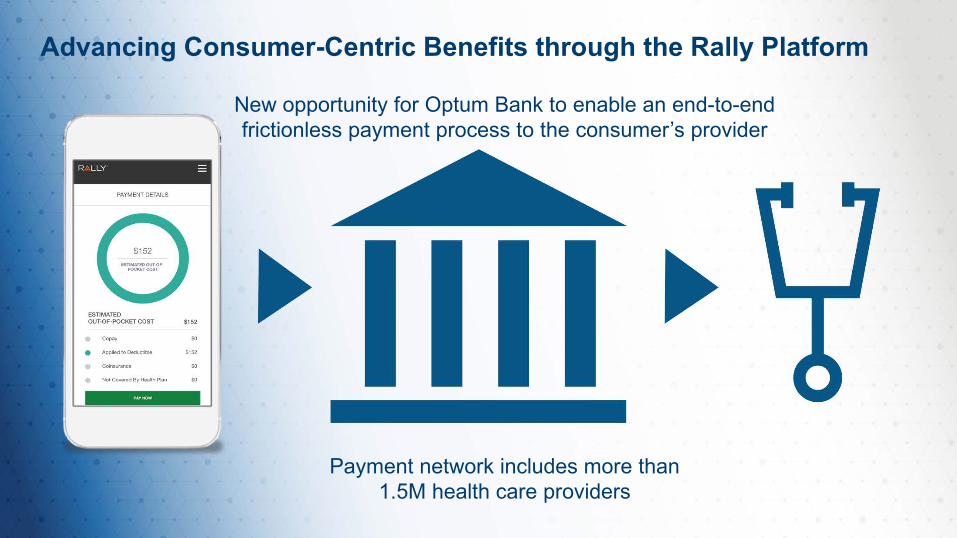
New opportunity for Optum Bank to enable an end-to-end frictionless payment process to the consumer’s provider
Advancing Consumer-Centric Benefits through the Rally Platform
Payment network includes more than 1.5M health care providers

2009 2014 2019E
OptumHealth
$4.2B$11.0B
~$28.0B
21% CAGR2009 2014 2019E
$72$175
~$292
4-fold increase over 10 years
2009 2014 2019E
58M 63M~96M
Serving 38 million more consumers2009 2014 2019E
$0.6B $1.1B
~$2.9B
17% CAGR
Revenues Yearly Revenue Per Consumer Served
Consumers Served Operating Earnings
Key Services:OptumCare
Behavioral HealthPopulation Health
Optum Bank
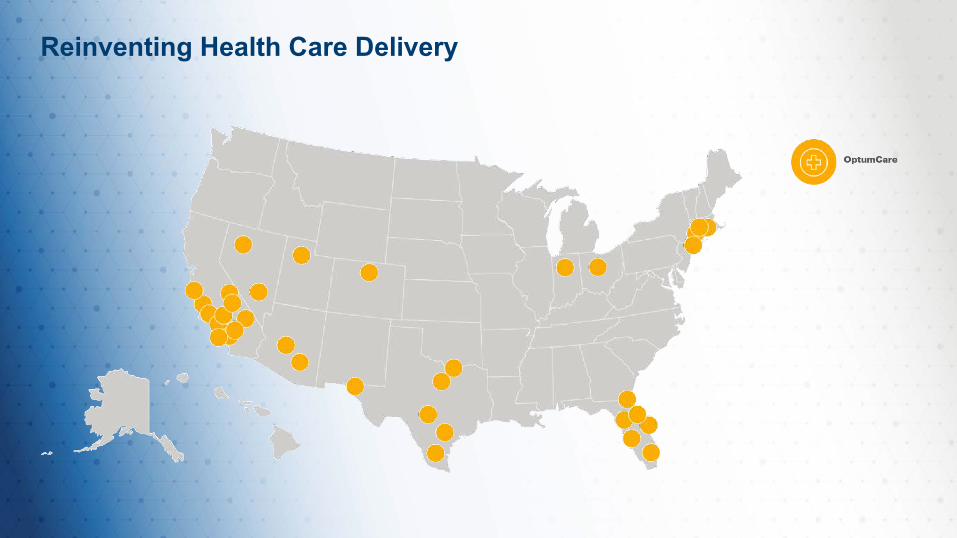
Reinventing Health Care Delivery

Reinventing Health Care Delivery

OptumInsight
Key Services:Revenue Management
Payment IntegrityData/Analytics
Advisory Services2009 2014 2019E
$1.8B$5.2B
~$10.3B
19% CAGR
Revenues
2009 2014 2019E
$2.2B$8.6B
~$18.8B
24% CAGR
Backlog
2009 2014 2019E
$0.2B$1.0B
~$2.5B
29% CAGR
Operating Earnings

Click image to view animated IHR demo
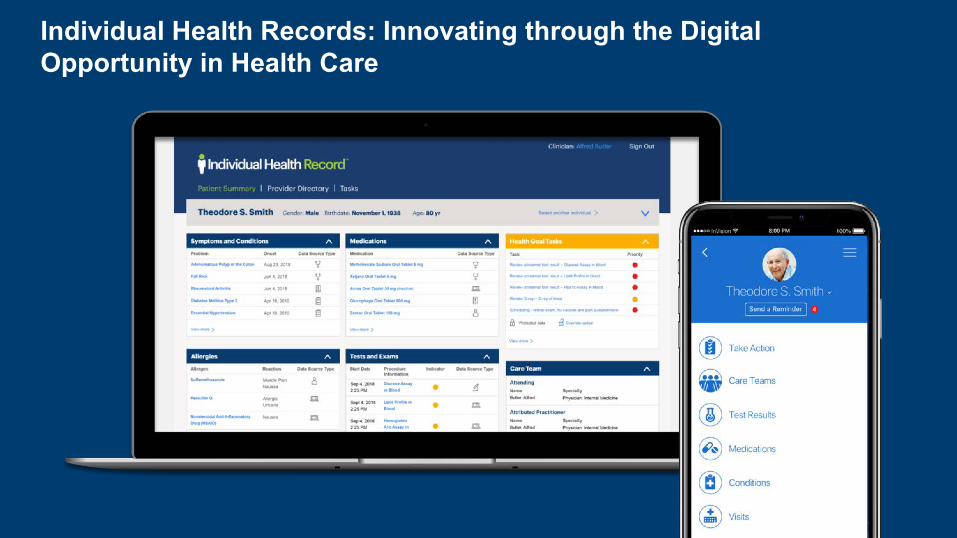
Individual Health Records: Innovating through the DigitalOpportunity in Health Care

2009 2014 2019E
$14B$32B
~$75B
OptumRx
18% CAGR
Revenues
2009 2014 2019E
320M570M
~1.38B
Growth of 1B+ scripts
Adjusted Scripts
18% CAGR
Operating Earnings
2009 2014 2019E
$0.7B $1.2B
~$3.8B
Key Services:Pharmacy Care Services
In-Home Infusion ServicesSpecialty Services
Community Health Center Dispensing
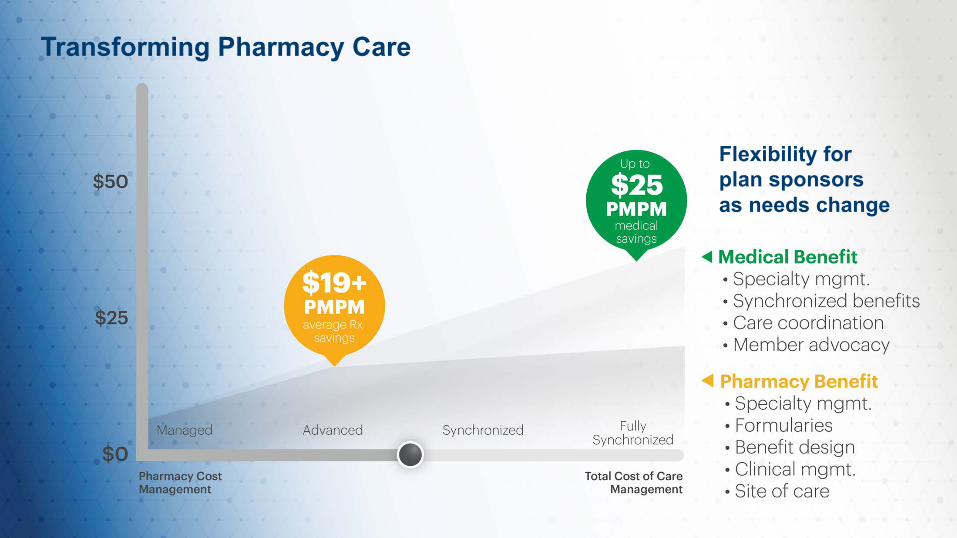
Transforming Pharmacy Care
Flexibility for plan sponsors as needs change
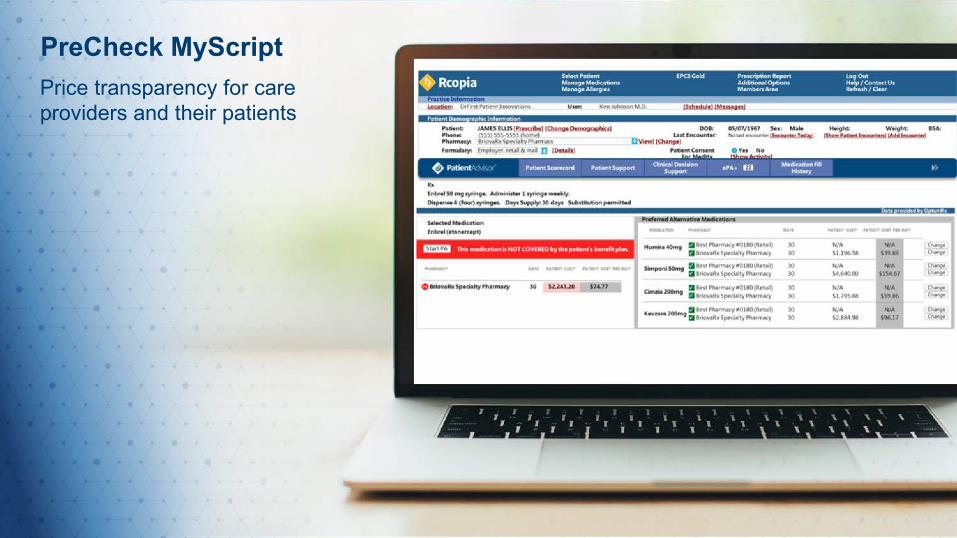
PreCheck MyScriptPrice transparency for care providers and their patients

2014 2019E
9% CAGR
Going Global
$6.9B
~$10.8BSouth American Presence
people in health benefits
6M+Serving
people in dental benefits
2M+hospitals55OperatingServing
Global Revenues

Helping people live healthier lives and helping make the health system work better for everyone

UNITEDHEALTH GROUP USE OF NON-GAAP FINANCIAL MEASURES
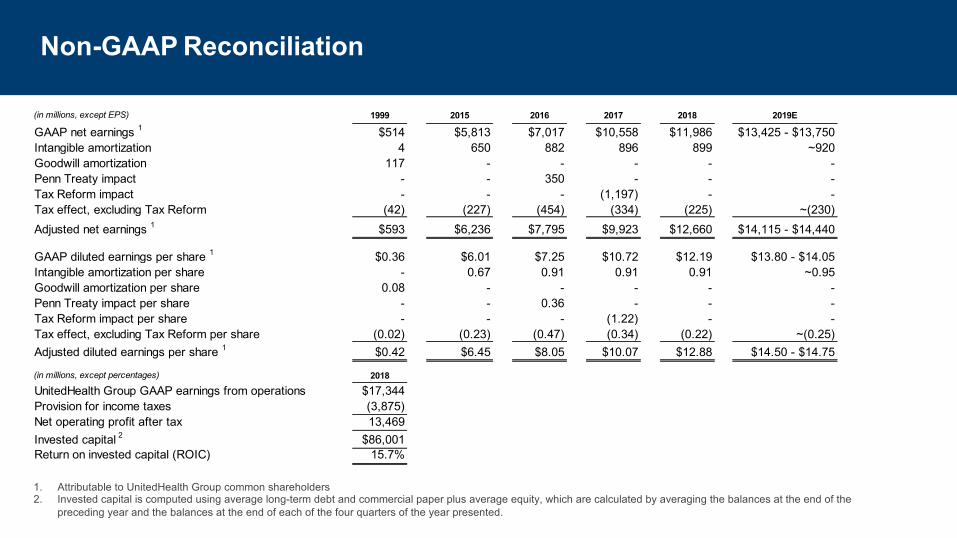
Non-GAAP Reconciliation
Adjusted net earnings per share and return on invested capital (ROIC) are non-GAAP financial measures. Non-GAAP financial measures should be considered in addition to, but not as a substitute for, or superior to, financial measures preparedin accordance with GAAP.
Adjusted net earnings per share excludes from the relevant GAAP metric, as applicable, intangible amortization and other items, if any, that do not relate to the Company's underlying business performance. Management believes that the use of adjusted net earnings per share provides investors and management useful information about the earnings impact of acquisition-related intangible asset amortization. In addition, adjusted net earnings per share excludes the earnings impact of the deferred tax revaluation recognized after The Tax Cuts and Jobs Act of 2017 (Tax Reform) was enacted in December 2017 and the recognition of the Company's estimated share of guaranty association assessments resulting from the liquidation of Penn Treaty Network America Insurance Company and its subsidiary (Penn Treaty). Management believes the exclusion of these items provides a more useful comparison of the Company's underlying business performance from period to period.
ROIC is a non-GAAP financial measure that management believes is useful to investors as a measure of performance and the effectiveness of the use of capital in the Company’s operations.
These non-GAAP financial measures have limitations in that they do not reflect all of the expenses associated with the operations of our business as determined in accordance with GAAP. As a result, one should not consider these measures in isolation. We compensate for this limitation by analyzing current and future results on a GAAP basis as well as non-GAAP basis, disclosing these GAAP financial measures, and providing reconciliations from GAAP to non-GAAP financial measures.
Non-GAAPReconciliation
(in millions, except EPS) 1999 2015 2016 2017 2018 2019E
GAAP net earnings 1
$514 $5,813 $7,017 $10,558 $11,986 $13,425 - $13,750
Intangible amortization 4 650 882 896 899 ~920
Goodwill amortization 117 - - - - -
Penn Treaty impact - - 350 - - -
Tax Reform impact - - - (1,197) - -
Tax effect, excluding Tax Reform (42) (227) (454) (334) (225) ~(230)
Adjusted net earnings 1
$593 $6,236 $7,795 $9,923 $12,660 $14,115 - $14,440
GAAP diluted earnings per share 1
$0.36 $6.01 $7.25 $10.72 $12.19 $13.80 - $14.05
Intangible amortization per share - 0.67 0.91 0.91 0.91 ~0.95
Goodwill amortization per share 0.08 - - - - -
Penn Treaty impact per share - - 0.36 - - -
Tax Reform impact per share - - - (1.22) - -
Tax effect, excluding Tax Reform per share (0.02) (0.23) (0.47) (0.34) (0.22) ~(0.25)
Adjusted diluted earnings per share 1
$0.42 $6.45 $8.05 $10.07 $12.88 $14.50 - $14.75
(in millions, except percentages) 2018
UnitedHealth Group GAAP earnings from operations $17,344
Provision for income taxes (3,875)
Net operating profit after tax 13,469
Invested capital 2
$86,001
Return on invested capital (ROIC) 15.7%
1. Attributable to UnitedHealth Group common shareholders2. Invested capital is computed using average long-term debt and commercial paper plus average equity, which are calculated by averaging the balances at the end of the
preceding year and the balances at the end of each of the four quarters of the year presented.

The statements, estimates, projections, guidance or outlook contained in this presentation include “forward-looking” statements within the meaning of the Private Securities Litigation Reform Act of 1995 (PSLRA). These statements are intended to take advantage of the “safe harbor” provisions of the PSLRA. Generally the words “believe,” “expect,” “intend,” “estimate,” “anticipate,” “forecast,” “outlook,” “plan,” “project,” “should” and similar expressions identify forward-looking statements, which generally are not historical in nature. These statements may contain information about financial prospects, economic conditions and trends and involve risks and uncertainties. We caution that actual results could differ materially from those that management expects, depending on the outcome of certain factors.
Some factors that could cause actual results to differ materially from results discussed or implied in the forward-looking statements include: our ability to effectively estimate, price for and manage our medical costs, including the impact of any new coverage requirements; new laws or regulations, or changes in existing laws or regulations, or their enforcement or application, including increases in medical, administrative, technology or other costs or decreases in enrollment resulting from U.S., South American and other jurisdictions’ regulations affecting the health care industry; the outcome of the DOJ’s legal action relating to the risk adjustment submission matter; our ability to maintain and achieve improvement in CMS star ratings and other quality scores that impact revenue; reductions in revenue or delays to cash flows received under Medicare, Medicaid and other government programs, including the effects of a prolonged U.S. government shutdown or debt ceiling constraints; changes in Medicare, including changes in payment methodology, the CMS star ratings program or the application of risk adjustment data validation audits; cyber-attacks or other privacy or data security incidents; failure to comply with privacy and data security regulations; regulatory and other risks and uncertainties of the pharmacy benefits management industry; competitive pressures, which could affect our ability to maintain or increase our market share; changes in or challenges to our public sector contract awards; our ability to execute contracts on competitive terms with physicians, hospitals and other service providers; failure to achieve targeted operating cost productivity improvements, including savings resulting from technology enhancement and administrative modernization; increases in costs and other liabilities associated with increased litigation, government investigations, audits or reviews; failure to manage successfully our strategic alliances or complete or receive anticipated benefits of acquisitions and other strategic transactions, fluctuations in foreign currency exchange rates on our reported shareholders’ equity and results of operations; downgrades in our credit ratings; the performance of our investment portfolio; impairment of the value of our goodwill and intangible assets if estimated future results do not adequately support goodwill and intangible assets recorded for our existing businesses or the businesses that we acquire; failure to maintain effective and efficient information systems or if our technology products do not operate as intended; and our ability to obtain sufficient funds from our regulated subsidiaries or the debt or capital markets to fund our obligations, to maintain our debt to total capital ratio at targeted levels, to maintain our quarterly dividend payment cycle or to continue repurchasing shares of our common stock.
This list of important factors is not intended to be exhaustive. We discuss certain of these matters more fully, as well as certain risk factors that may affect our business operations, financial condition and results of operations, in our filings with the Securities and Exchange Commission, including our annual reports on Form 10-K, quarterly reports on Form 10-Q and current reports on Form 8-K. Any or all forward-looking statements we make may turn out to be wrong, and can be affected by inaccurate assumptions we might make or by known or unknown risks and uncertainties. By their nature, forward-looking statements are not guarantees of future performance or results and are subject to risks, uncertainties and assumptions that are difficult to predict or quantify. Actual future results may vary materially from expectations expressed or implied in this document or any of our prior communications. You should not place undue reliance on forward-looking statements, which speak only as of the date they are made. We do not undertake to update or revise any forward-looking statements, except as required by applicable securities laws.
Forward-Looking Statements