January 2020 - Seeking Alpha
41
Corporate presentation January 2020
Transcript of January 2020 - Seeking Alpha
Corporate presentation
January 2020

Cautionary statements
The information in this presentation includes “forward-looking statements” within the meaning of
Section 27A of the Securities Act of 1933, as amended, and Section 21E of the Securities Exchange
Act of 1934, as amended. All statements other than statements of historical fact are forward-looking
statements. The words “anticipate,” “assume,” “believe,” “budget,” “estimate,” “expect,”
“forecast,” “initial,” “intend,” “may,” “model,” “plan,” “potential,” “project,” “should,” “will,”
“would,” and similar expressions are intended to identify forward-looking statements. The forward-
looking statements in this presentation relate to, among other things, future contracts and contract
terms, expected partners and customers, the parties’ ability to complete contemplated
transactions (including, where applicable, to enter into definitive agreements related to those
transactions), margins, returns and payback periods, future cash flows, production, delivery of LNG,
liquefaction capacity additions, required infrastructure, future costs, prices, financial results,
projected sources and uses of capital, liquidity and financing, including equity funding and debt
syndication, regulatory and permitting developments, construction and permitting of pipelines and
other facilities, reaching FID, future demand and supply affecting LNG and general energy markets
and other aspects of our business and our prospects and those of other industry participants.
Our forward-looking statements are based on assumptions and analyses made by us in light of our
experience and our perception of historical trends, current conditions, expected future
developments, and other factors that we believe are appropriate under the circumstances. These
statements are subject to numerous known and unknown risks and uncertainties which may cause
actual results to be materially different from any future results or performance expressed or implied
by the forward-looking statements. These risks and uncertainties include those described in the “Risk
Factors” section of our Annual Report on Form 10-K for the fiscal year ended December 31, 2018,
and our other filings with the Securities and Exchange Commission, which are incorporated by
reference in this presentation. Many of the forward-looking statements in this presentation relate to
events or developments anticipated to occur numerous years in the future, which increases the
likelihood that actual results will differ materially from those indicated in such forward-looking
statements.
Plans for the Permian Global Access Pipeline, Haynesville Global Access Pipeline and Delhi
Connector Pipeline projects discussed herein are in the early stages of development and numerous
aspects of the projects, such as detailed engineering and permitting, have not commenced.
Accordingly, the nature, timing, scope and benefits of those projects may vary significantly from our
current plans due to a wide variety of factors, including future changes to the proposals. Although
the Driftwood pipeline project is significantly more advanced in terms of engineering, permitting
and other factors, its construction, budget and timing are also subject to significant risks and
uncertainties.
Projected future cash flows as set forth herein may differ from cash flows determined in
accordance with GAAP.
We may not be able to complete the anticipated transactions described in the presentation. FID is
subject to the completion of financing arrangements that may not be completed within the time
frame expected or at all. Achieving FID will require substantial amounts of financing in addition to
that contemplated by the agreements between Tellurian and each of Total and Petronet LNG
discussed in this presentation, and Tellurian believes that it may enter into discussions with potential
sources of such financing and Total and Petronet LNG in order to achieve commercial terms
acceptable to all parties. Accordingly, each of the final agreements may have terms that differ
significantly from those described in the presentation.
The financial information included on slides 9,10, 12, 15 and 18-20 is meant for illustrative purposes
only and does not purport to show estimates of actual future financial performance. The
information on those slides assumes the completion of certain acquisition, financing and other
transactions. Such transactions may not be completed on the assumed terms or at all. Actual
commodity prices may vary materially from the commodity prices assumed for the purposes of the
illustrative financial performance information.
The forward-looking statements made in or in connection with this presentation speak only as of the
date hereof. Although we may from time to time voluntarily update our prior forward-looking
statements, we disclaim any commitment to do so except as required by securities laws.
Forward-looking statements
2
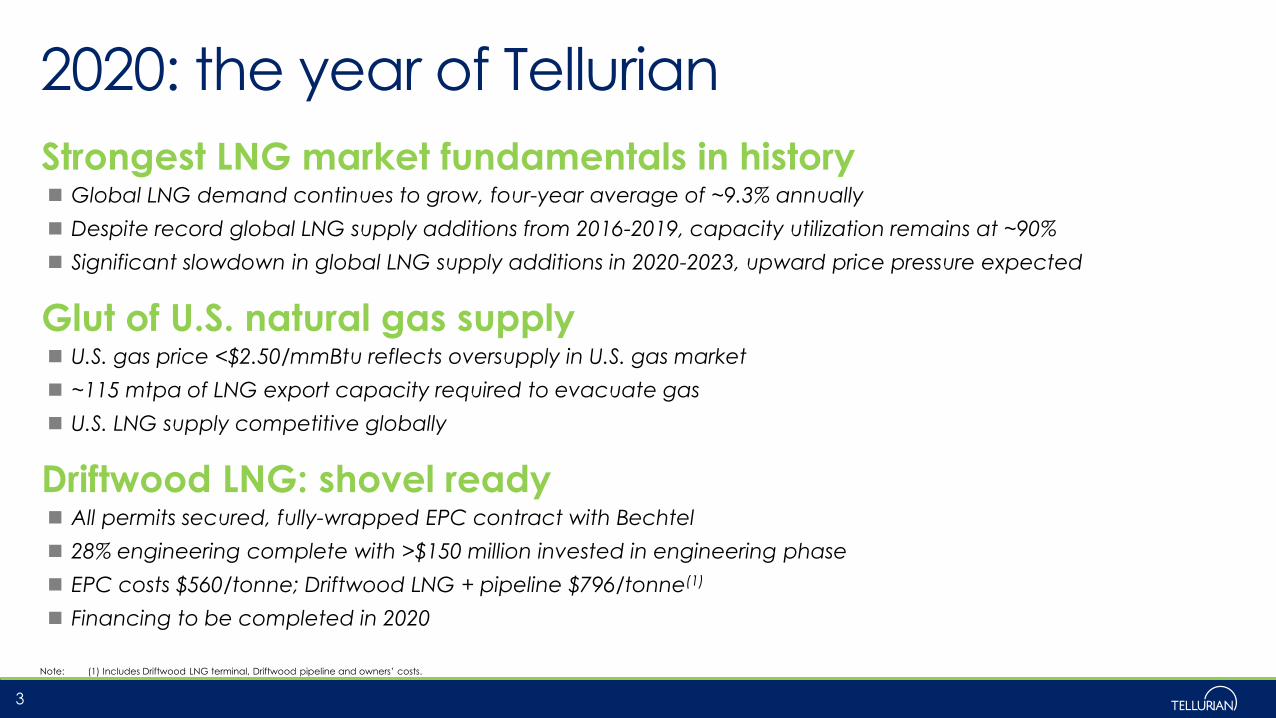
2020: the year of Tellurian
3
Strongest LNG market fundamentals in history◼ Global LNG demand continues to grow, four-year average of ~9.3% annually
◼ Despite record global LNG supply additions from 2016-2019, capacity utilization remains at ~90%
◼ Significant slowdown in global LNG supply additions in 2020-2023, upward price pressure expected
Glut of U.S. natural gas supply◼ U.S. gas price <$2.50/mmBtu reflects oversupply in U.S. gas market
◼ ~115 mtpa of LNG export capacity required to evacuate gas
◼ U.S. LNG supply competitive globally
Driftwood LNG: shovel ready◼ All permits secured, fully-wrapped EPC contract with Bechtel
◼ 28% engineering complete with >$150 million invested in engineering phase
◼ EPC costs $560/tonne; Driftwood LNG + pipeline $796/tonne(1)
◼ Financing to be completed in 2020
Note: (1) Includes Driftwood LNG terminal, Driftwood pipeline and owners’ costs.
24
26
28
30
32
34
36
38
Jan Feb Mar Apr May Jun Jul Aug Sep Oct Nov Dec
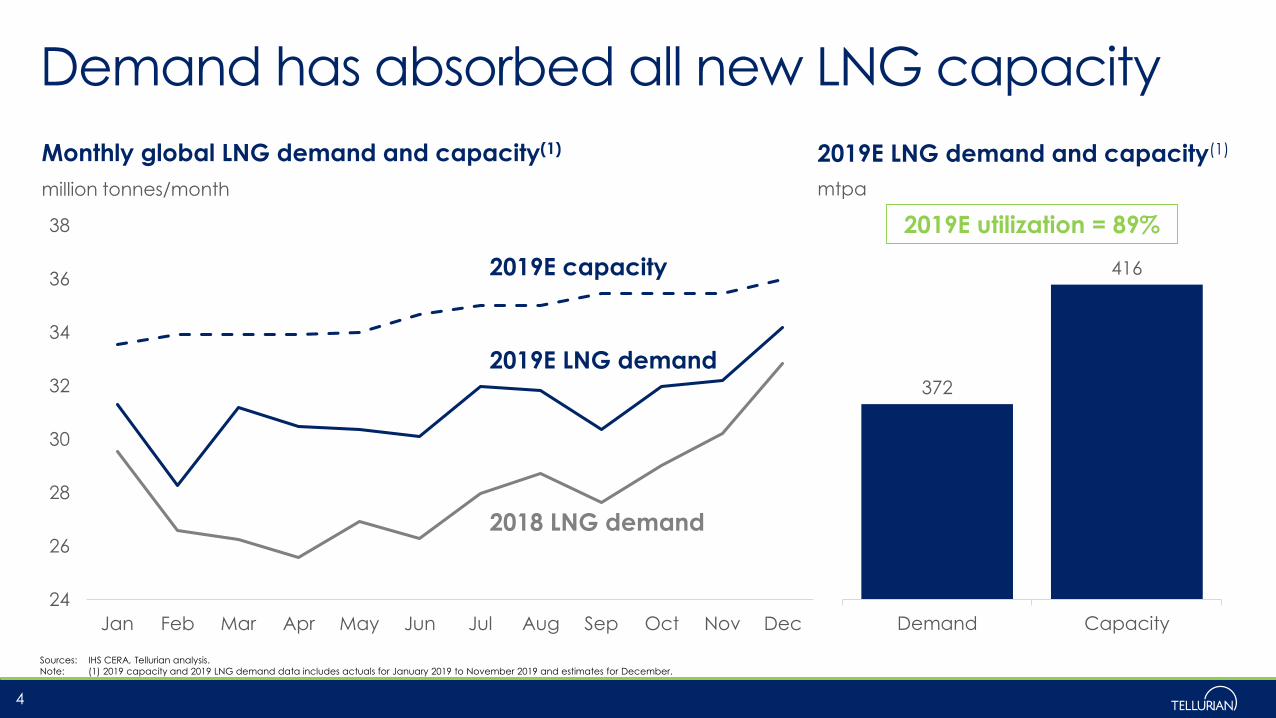
Demand has absorbed all new LNG capacity
Sources: IHS CERA, Tellurian analysis.
Note: (1) 2019 capacity and 2019 LNG demand data includes actuals for January 2019 to November 2019 and estimates for December.
4
2019E capacity
2019E LNG demand372
416
Demand Capacity
2019E utilization = 89%
2018 LNG demand
Monthly global LNG demand and capacity(1) 2019E LNG demand and capacity(1)
mtpamillion tonnes/month
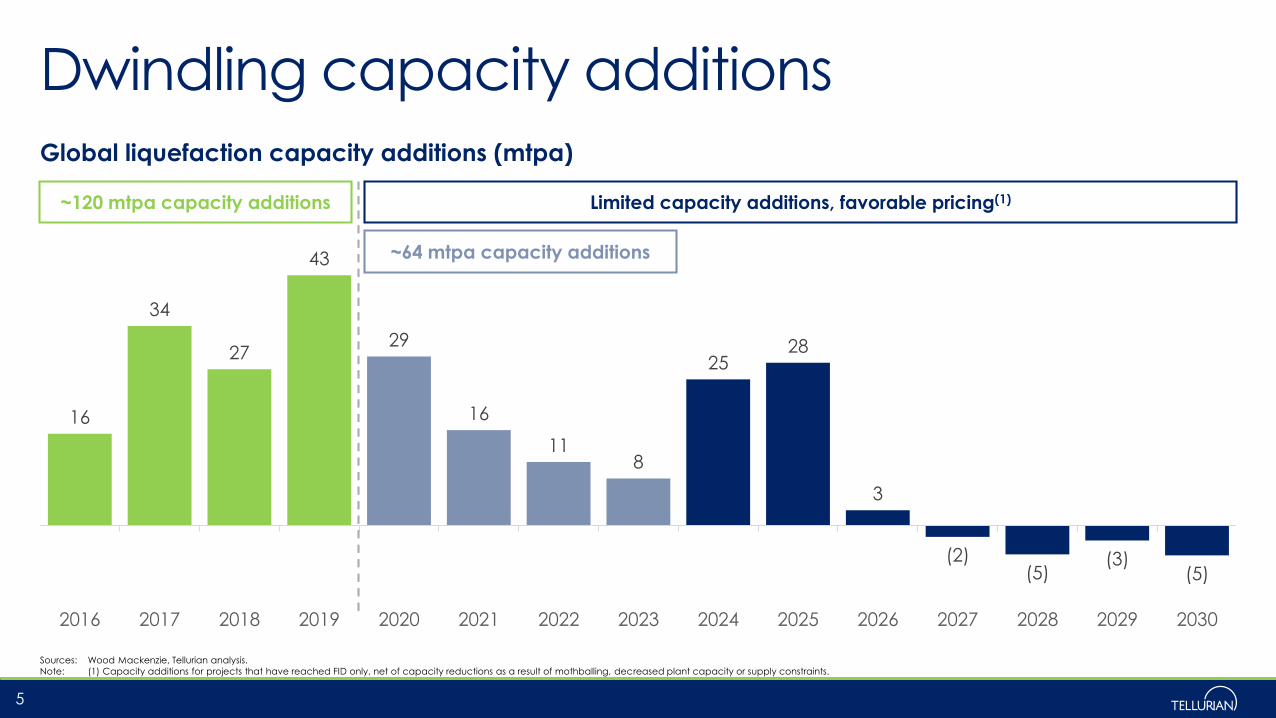
Dwindling capacity additions
Sources: Wood Mackenzie, Tellurian analysis.
Note: (1) Capacity additions for projects that have reached FID only, net of capacity reductions as a result of mothballing, decreased plant capacity or supply constraints.
5
16
34
27
43
29
16
11 8
25 28
3
(2)(5)
(3)(5)
2016 2017 2018 2019 2020 2021 2022 2023 2024 2025 2026 2027 2028 2029 2030
~120 mtpa capacity additions Limited capacity additions, favorable pricing(1)
Global liquefaction capacity additions (mtpa)
~64 mtpa capacity additions

-
100
200
300
400
500
600
700
800
2015 2016 2017 2018 2019 2020 2021 2022 2023 2024 2025
Global LNG capacity call: ~100-200 mtpa
Sources: Wood Mackenzie, Bernstein, Morgan Stanley and Tellurian Research.
Notes: (1) Assumes 86.5% utilization rate.
(2) Assuming sustained 2015-2019 annual demand growth rate of ~9.3% from 2020-2025.
(3) Assumes 6.6% annual demand growth rate from 2020-2025.
(4) Assumes 107 mtpa of projects under construction coming online by 2025, including Portovaya, Petronas FLNG 2, Coral FLNG, Petronas FLNG 2, Tortue LNG, LNG Canada, Calcasieu Pass, Mozambique LNG, Golden Pass LNG, Arctic LNG 2 and NLNG T7.
6
Capacity required(1)
9.3%(2)
6.6%(3)
~100 mtpa
~200 mtpa9.3% p.a. growth rate
mtpa
Under construction(4)
In operation
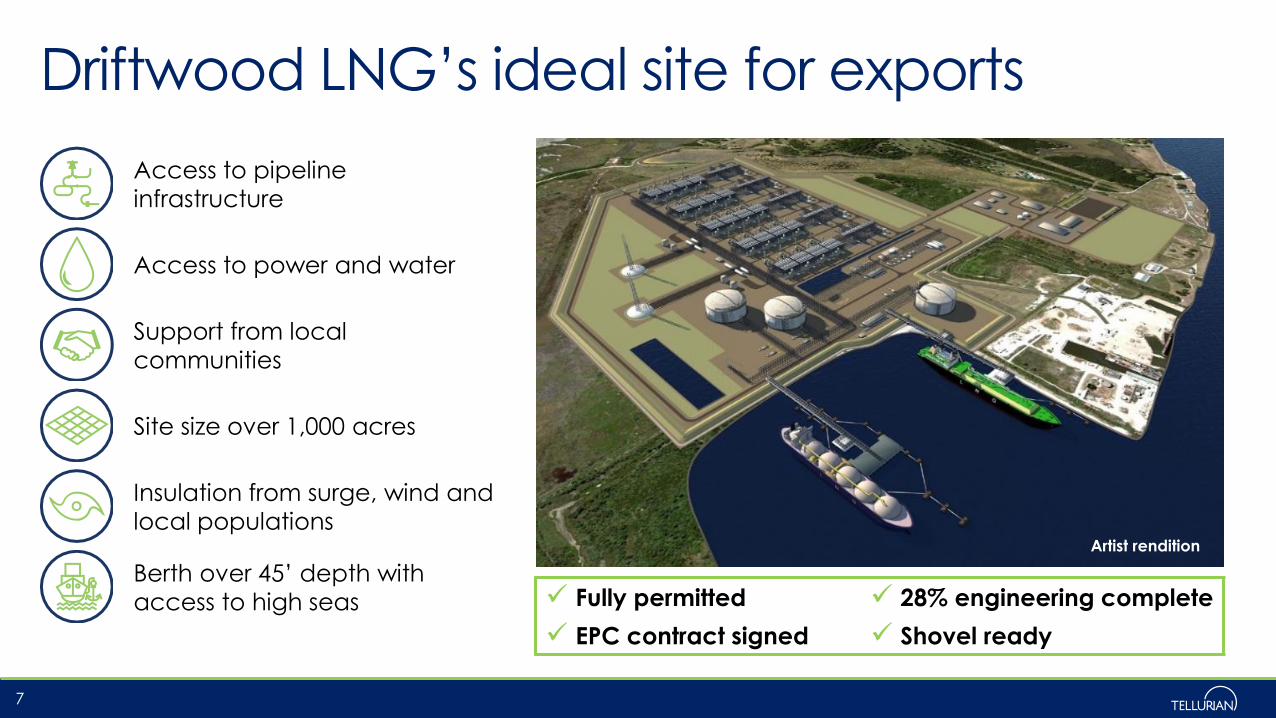
Driftwood LNG’s ideal site for exports
7
Access to power and water
Berth over 45’ depth with
access to high seas
Support from local
communities
Access to pipeline
infrastructure
Site size over 1,000 acres
Insulation from surge, wind and
local populationsArtist rendition
✓ Fully permitted ✓ 28% engineering complete
✓ EPC contract signed ✓ Shovel ready

Driftwood pipeline: fully permitted
◼ 96 mile, up to 48” diameter pipeline
◼ Three compressor stations totaling 274,000 hp
◼ ~4 bcf/d capacity
◼ 15 meter stations
◼ 14 interconnects including Transco, TETCO, TGP and Trunkline
◼Connecting pipelines provide access to >30 bcf/day of flowing gas
◼ FERC approved
Note: All locations approximate.
Driftwood LNG facility
Creole Trail
DWLNG
Cameron Pipeline
Trunkline
TETCO 1
Tennessee Gas
Egan
Texas Gas
Florida Gas &
Pine Prairie
ANR
TETCO 2
Transco
CGT
CS 01 Gillis
CS 02 Basile
CS 03 Mamou
TE
XA
S
L O U I S I A N A
KMLP
Driftwood pipeline route map
8
Meter station
Driftwood pipeline
Compressor station
Interconnect

Driftwood expects to deliver LNG FOB at $3-$4/mmBtu
Notes: (1) Includes operating expenses for Driftwood LNG plant and Driftwood pipeline, G&A and management fee.
(2) ~$14 billion of project finance debt amortized over 20-year period.
9
Gas
sourcing
LNG
plant +
pipeline(1)
Debt
service(2)
$2.00/mmBtu
+$0.75/mmBtu
+$0.75/mmBtu
$3.50/mmBtu
Average cost on the water
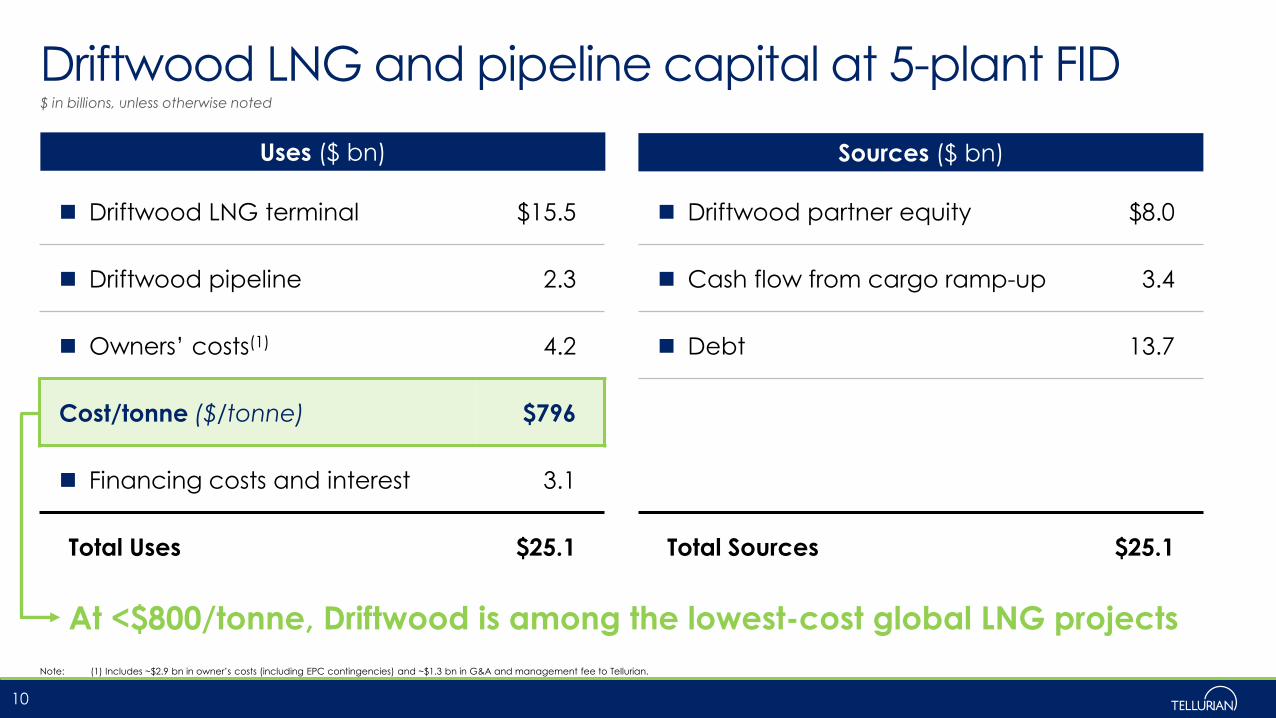
Driftwood LNG and pipeline capital at 5-plant FID
Note: (1) Includes ~$2.9 bn in owner’s costs (including EPC contingencies) and ~$1.3 bn in G&A and management fee to Tellurian.
10
Uses ($ bn) Sources ($ bn)
◼ Driftwood LNG terminal $15.5
◼ Driftwood pipeline 2.3
◼ Owners’ costs(1) 4.2
Cost/tonne ($/tonne) $796
◼ Financing costs and interest 3.1
Total Uses $25.1
◼ Driftwood partner equity $8.0
◼ Cash flow from cargo ramp-up 3.4
◼ Debt 13.7
Total Sources $25.1
$ in billions, unless otherwise noted
At <$800/tonne, Driftwood is among the lowest-cost global LNG projects

Commercial momentum
Notes: (1) Represents required equity contribution at $500/tonne.
(2) Based on Memorandum of Understanding (MOU) announced on September 21, 2019 with volume of up to 5 mtpa.
11
(1)
(2)
retained purchased
Driftwood capacity, by partner share
mtpa

Key investment highlights
✓Driftwood LNG and pipeline are shovel ready, all permits secured
✓Engineering 28% complete, >$150 mm invested
✓Implied replacement enterprise value of $5.8 billion, or >$20/share(1)
✓At full operations, projected $8/share in cash flow(2)
12
Note: (1) Value of Tellurian’s carried interest of 11.6 mtpa at a value of $500 million/mtpa assuming ~268 million shares outstanding after issuance of ~20 million shares pursuant to Total common stock purchase agreement dated April 3, 2019 and conversion of
~6.1 million shares of existing Series C convertible preferred stock issued to Bechtel.
(2) See assumptions discussed in note 1 on slide 15.

Social media
Contact us
▪ Kian Granmayeh
Director, Investor Relations
+1 832 320 9293
▪ Joi Lecznar
SVP, Public Affairs & Communication
+1 832 962 4044
13
@TellurianLNG
Driftwood project overview
14
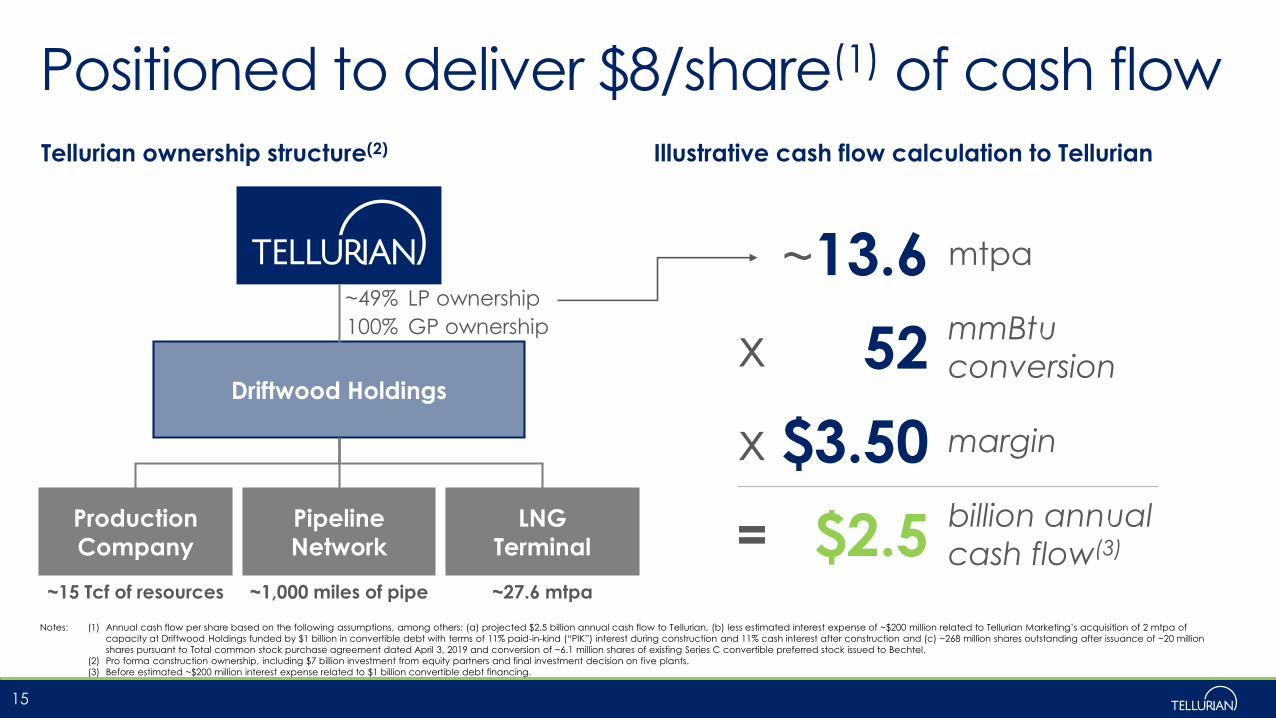
~13.6 mtpa
x 52mmBtu
conversion
x $3.50 margin
= $2.5billion annual
cash flow(3)
Positioned to deliver $8/share(1) of cash flow
15
Production
Company
Pipeline
Network
LNG
Terminal
Driftwood Holdings
~15 Tcf of resources ~1,000 miles of pipe ~27.6 mtpa
Illustrative cash flow calculation to TellurianTellurian ownership structure(2)
Notes: (1) Annual cash flow per share based on the following assumptions, among others: (a) projected $2.5 billion annual cash flow to Tellurian, (b) less estimated interest expense of ~$200 million related to Tellurian Marketing’s acquisition of 2 mtpa of
capacity at Driftwood Holdings funded by $1 billion in convertible debt with terms of 11% paid-in-kind (“PIK”) interest during construction and 11% cash interest after construction and (c) ~268 million shares outstanding after issuance of ~20 million
shares pursuant to Total common stock purchase agreement dated April 3, 2019 and conversion of ~6.1 million shares of existing Series C convertible preferred stock issued to Bechtel.
(2) Pro forma construction ownership, including $7 billion investment from equity partners and final investment decision on five plants.
(3) Before estimated ~$200 million interest expense related to $1 billion convertible debt financing.
~49% LP ownership
100% GP ownership

$700
$490 $500
$380
~$550
$710
$500 $510
$390
~$560
Phase 1 Phase 2 Phase 3 Phase 4 Total
Bechtel LSTK secures project execution
◼ Leading LNG EPC contractor
― 44 LNG trains delivered to 18
customers in 9 countries
― ~30% of global LNG liquefaction
capacity (>125 mtpa)
◼ Tellurian and Bechtel relationship
― 16 trains(1) delivered with Tellurian’s
executive team
― Invested $50 million in Tellurian Inc.
◼ Price refresh in April 2019 resulted in ~2%
increase after ~24 months
Sources: Tellurian-Bechtel agreements; Bechtel website.
Note: (1) Includes all trains from Sabine Pass LNG, Corpus Christi LNG, Atlantic LNG, QCLNG and ELNG.
16
Capacity (mtpa)
11.0 5.5 5.5 5.5 27.6
Plants 1&2 Plant 3 Plant 4 Plant 5
Increase from price refresh
Driftwood EPC contract costs ($ per tonne)

2
3
4
Pipeline network
Note: (1) Included in Driftwood Holdings at full development.
17
Driftwood Pipeline(1)
▪ Capacity (Bcf/d) 4.0
▪ Cost ($ billions) $2.3
▪ Length (miles) 96
▪ Diameter (inches) 48
▪ Compression (HP) 274,000
▪ Status FERC approval complete
Haynesville Global Access Pipeline(1)
▪ Capacity (Bcf/d) 2.0
▪ Cost ($ billions) $1.4
▪ Length (miles) 200
▪ Diameter (inches) 42
▪ Compression (HP) 23,000
▪ Status Binding open season complete
Permian Global Access Pipeline(1)
▪ Capacity (Bcf/d) 2.0
▪ Cost ($ billions) $4.2
▪ Length (miles) 625
▪ Diameter (inches) 42
▪ Compression (HP) 258,000
▪ Status Submitted pre-filing review with FERC
1
2
3
4 Delhi Connector Pipeline
▪ Capacity (Bcf/d) 2.0
▪ Cost ($ billions) $1.4
▪ Length (miles) 180
▪ Diameter (inches) 42
▪ Compression (HP) 72,000
▪ Status Binding open season complete
1
~1,000 miles of pipe
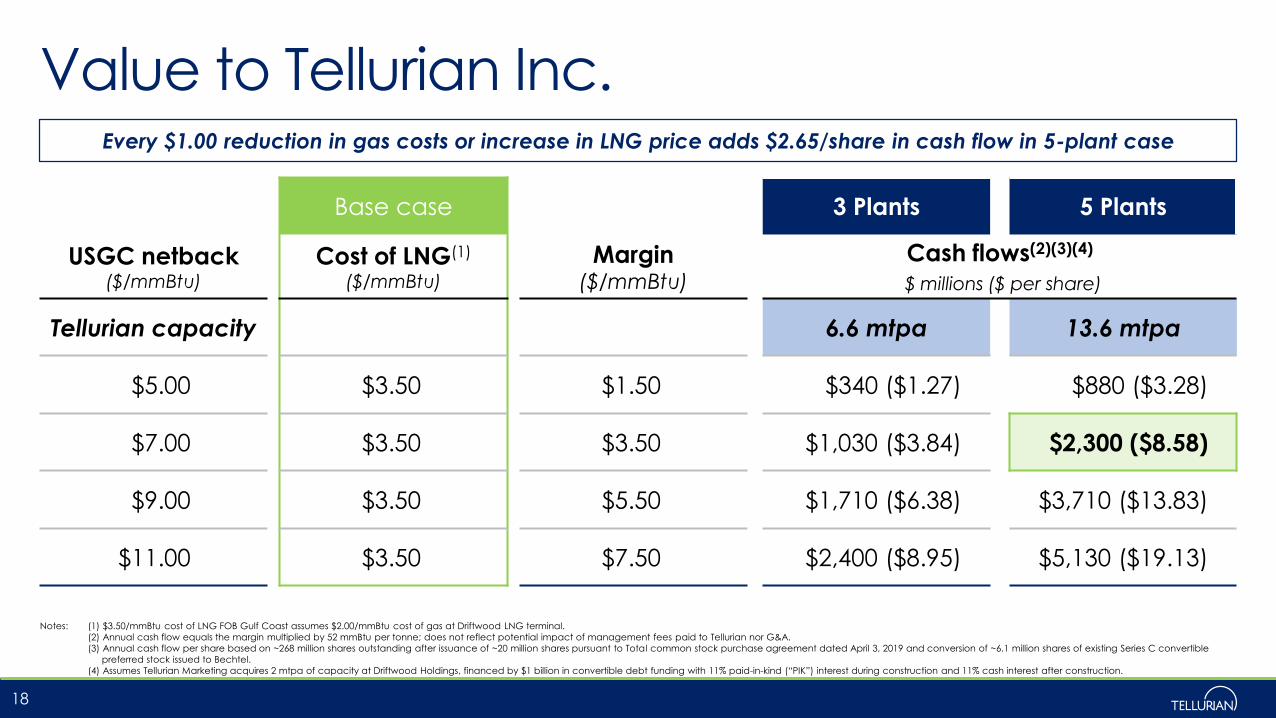
Every $1.00 reduction in gas costs or increase in LNG price adds $2.65/share in cash flow in 5-plant case
Base case 3 Plants 5 Plants
USGC netback ($/mmBtu)
Cost of LNG(1)
($/mmBtu)
Margin($/mmBtu)
Cash flows(2)(3)(4)
$ millions ($ per share)
Tellurian capacity 6.6 mtpa 13.6 mtpa
$5.00 $3.50 $1.50 $340 ($1.27) $880 ($3.28)
$7.00 $3.50 $3.50 $1,030 ($3.84) $2,300 ($8.58)
$9.00 $3.50 $5.50 $1,710 ($6.38) $3,710 ($13.83)
$11.00 $3.50 $7.50 $2,400 ($8.95) $5,130 ($19.13)
Value to Tellurian Inc.
18
Notes: (1) $3.50/mmBtu cost of LNG FOB Gulf Coast assumes $2.00/mmBtu cost of gas at Driftwood LNG terminal.
(2) Annual cash flow equals the margin multiplied by 52 mmBtu per tonne; does not reflect potential impact of management fees paid to Tellurian nor G&A.
(3) Annual cash flow per share based on ~268 million shares outstanding after issuance of ~20 million shares pursuant to Total common stock purchase agreement dated April 3, 2019 and conversion of ~6.1 million shares of existing Series C convertible
preferred stock issued to Bechtel.
(4) Assumes Tellurian Marketing acquires 2 mtpa of capacity at Driftwood Holdings, financed by $1 billion in convertible debt funding with 11% paid-in-kind (“PIK”) interest during construction and 11% cash interest after construction.

Returns to Driftwood Holdings’ partners
19
U.S. Gulf Coast netback price ($/mmBtu)
$5.00 $7.00 $9.00 $11.00
Driftwood LNG, FOB U.S. Gulf Coast($/mmBtu)
$(3.50) $(3.50) $(3.50) $(3.50)
Margin($/mmBtu)
$1.50 $3.50 $5.50 $7.50
Annual partner cash flow(1)
($ millions per tonne)$80 $180 $285 $390
Cash on cash return(2) 16% 36% 57% 78%
Payback(3)
(years)6 3 2 1
Notes: (1) Annual partner cash flow equals the margin multiplied by 52 mmBtu per tonne.
(2) Based on 1 mtpa of capacity in Driftwood Holdings; all estimates before federal income tax; does not reflect potential impact of management fees paid to Tellurian.
(3) Payback period based on full production.

Driftwood Holdings’ financing
20
Notes: (1) Based on engineering, procurement and construction agreements
executed with Bechtel.
(2) Approximately half of owners’ costs represent contingency; the
remaining amounts consist of cost estimates related to staffing prior to
commissioning, estimated impact of inflation and foreign exchange
rates, spare parts and other estimated costs.
(3) Represents estimated costs of development of Driftwood pipeline (in phases),
HGAP and PGAP.
(4) Preliminary estimate of certain costs associated with potential management fee
to be paid by Driftwood Holdings to Tellurian and certain transaction costs.
(5) Net of cash reserves.
(6) Project finance debt to be borrowed by Driftwood Holdings.
(7) Cash flow from LNG `and upstream operations prior to commercial operations
date of Plant 3 and Plant 5 in the 3-Plant and 5-Plant cases, respectively.
(8) Assumes Tellurian Marketing acquires 2 mtpa of capacity at Driftwood Holdings,
financed by $1.0 billion of convertible debt with interest of ~11% and funded by
private equity.
3-Plant 5-Plant@ FID Fully-integrated @ FID Fully-integrated
Capacity (mtpa) 16.6 16.6 27.6 27.6Capital investment ($ billions)
― Liquefaction terminal(1) $10.6 $10.6 $15.5 $15.5― Owners’ cost & contingency(2) 1.8 1.8 2.9 2.9― Driftwood pipeline(3) 1.5 1.5 2.3 1.6― HGAP(3) -- -- -- 1.4― PGAP(3) -- 4.2 -- 4.2― Upstream -- 1.8 -- 1.8
― Fees(4) 1.1 1.4 1.3 1.5― Interest during construction(5) 2.2 3.5 3.1 4.7
Total capital $17.2 $24.8 $25.1 $33.6― Debt financing(6) $(9.5) $(16.7) $(13.7) $(20.5)― Pre-COD cash flows(7) (1.7) (2.1) (3.4) (5.1)
Net equity $6.0 $6.0 $8.0 $8.0
Transaction price ($ per tonne) $500 $500 $500 $500Capacity split mtpa % mtpa % mtpa % mtpa %
― Partner 10.0 ~60% 10.0 ~60% 14.0 ~51% 14.0 ~51%― Tellurian (purchased)(8) 2.0 ~12% 2.0 ~12% 2.0 ~7% 2.0 ~7%― Tellurian (retained) 4.6 ~28% 4.6 ~28% 11.6 ~42% 11.6 ~42%
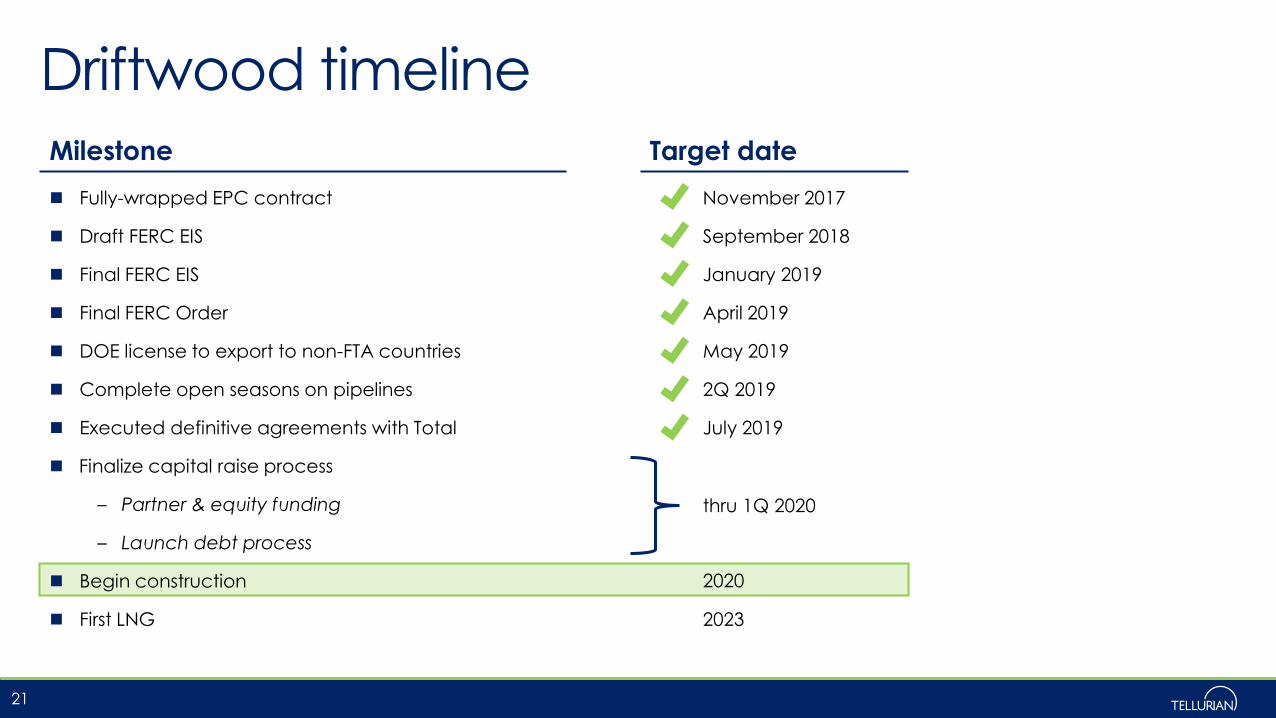
Driftwood timeline
21
◼ Fully-wrapped EPC contract
◼ Draft FERC EIS
◼ Final FERC EIS
◼ Final FERC Order
◼ DOE license to export to non-FTA countries
◼ Complete open seasons on pipelines
◼ Executed definitive agreements with Total
◼ Finalize capital raise process
– Partner & equity funding
– Launch debt process
◼ Begin construction
◼ First LNG
Milestone Target date
November 2017
September 2018
January 2019
April 2019
May 2019
2Q 2019
July 2019
2023
thru 1Q 2020
2020
April
Driftwood LNG receives
Final Orderfrom FERC
July
Finalize $500 million equity investment and LNG purchase agreements in Driftwood with Total
September
Announce MOU for Driftwood equity investmentwith Petronet LNG
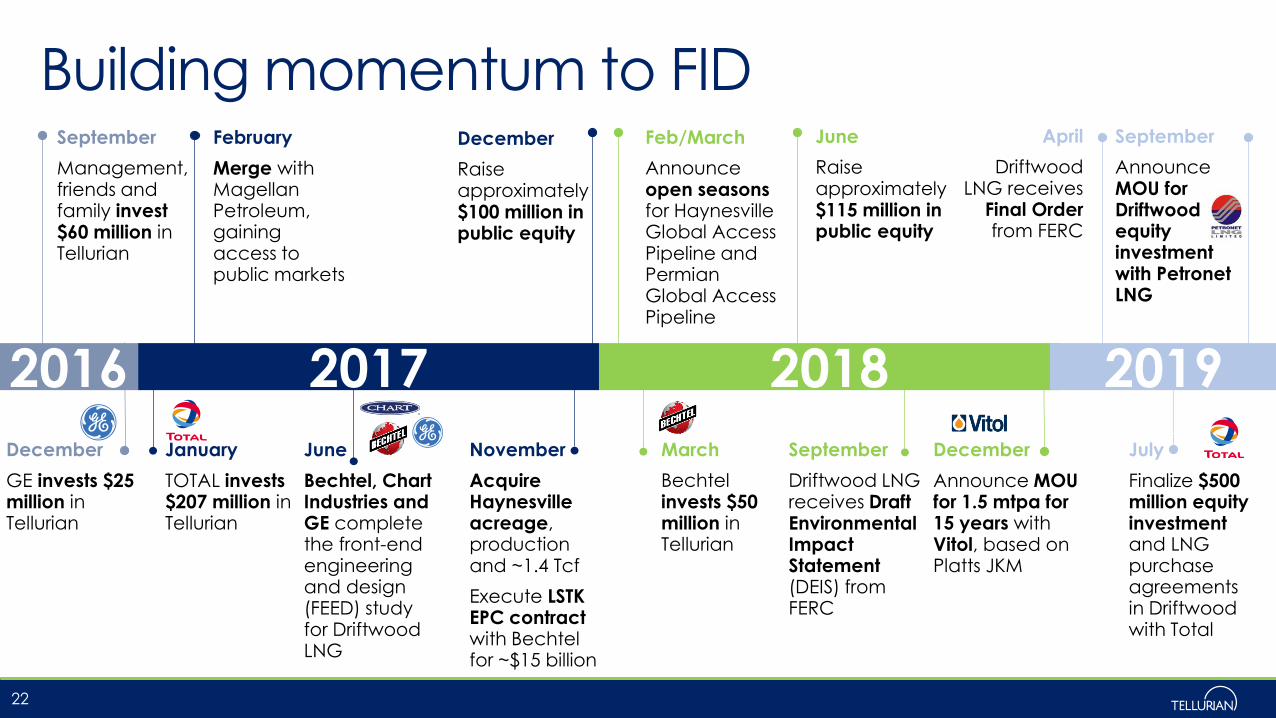
Building momentum to FID
22
June
Raise approximately $115 million in public equity
March
Bechtel invests $50 million in Tellurian
Feb/March
Announce open seasons for Haynesville Global Access Pipeline and Permian Global Access Pipeline
December
Raise approximately $100 million in public equity
November
Acquire Haynesville acreage, production and ~1.4 Tcf
Execute LSTKEPC contract with Bechtel for ~$15 billion
June
Bechtel, Chart Industries and GE complete the front-end engineering and design (FEED) study for Driftwood LNG
February
Merge with Magellan Petroleum, gaining access to public markets
January
TOTAL invests $207 million in Tellurian
December
GE invests $25 million in Tellurian
September
Management, friends and family invest$60 million in Tellurian
2016 2017 2018
September
Driftwood LNG receives Draft Environmental Impact Statement (DEIS) from FERC
December
Announce MOU for 1.5 mtpa for 15 years with Vitol, based on Platts JKM
2019

Commercial momentum
23

Partner Off-take Volume Credit rating(3)
Driftwood
project
Equity investor 1.0 mtpa A+/Aa3/AA-
Equity investor(1) Up to 5.0 mtpaBaa2
(Moody’s)
Equity investor 2.0 mtpa --
Tellurian
Marketing
JKM linked 1.5 mtpa A+/Aa3/AA-
JKM linked(2)
(Equity investment
under review)
1.5 mtpa Unrated
Growing list of expected partners and customers
24
Notes: (1) Per Memorandum of Understanding.
(2) Per Memorandum of Understanding.
(3) Parent credit ratings denote S&P/Moody’s/Fitch, unless noted otherwise.
Marketing

Tellurian Marketing investment in Driftwood
Common stock purchase agreement with Total
Driftwood equity investment and SPA
Tellurian agreements with Total
▪ On July 10, 2019, Total agreed to make a $500 million equity investment in Driftwood project and to purchase 1 mtpa of LNG
▪ Total also agreed to purchase 1.5 mtpa of LNG from Tellurian Marketing’s LNG offtake volumes from the Driftwood LNG export terminal
― FOB, minimum term of 15 years
― Price based on Platts Japan Korea Marker (“JKM”)
Notes: (1) Common stock purchase agreement executed with Total Delaware, Inc. at $10.064/share.
(2) Tellurian Marketing to purchase 7.2% equity interest in Driftwood project.
25
▪ Tellurian Marketing to purchase an equity interest(2)
in Driftwood project and 2 mtpa of LNG with anticipated private equity funding
― Tellurian’s LNG volumes from Driftwood project will increase to 13.6 mtpa at full development
▪ Total to purchase ~20 million additional shares in Tellurian for $200 million upon(1):
― Final investment decision (“FID”)
― Tellurian’s purchase of 7.2% of Driftwood equity
Tellurian MOU with Petronet LNG
26
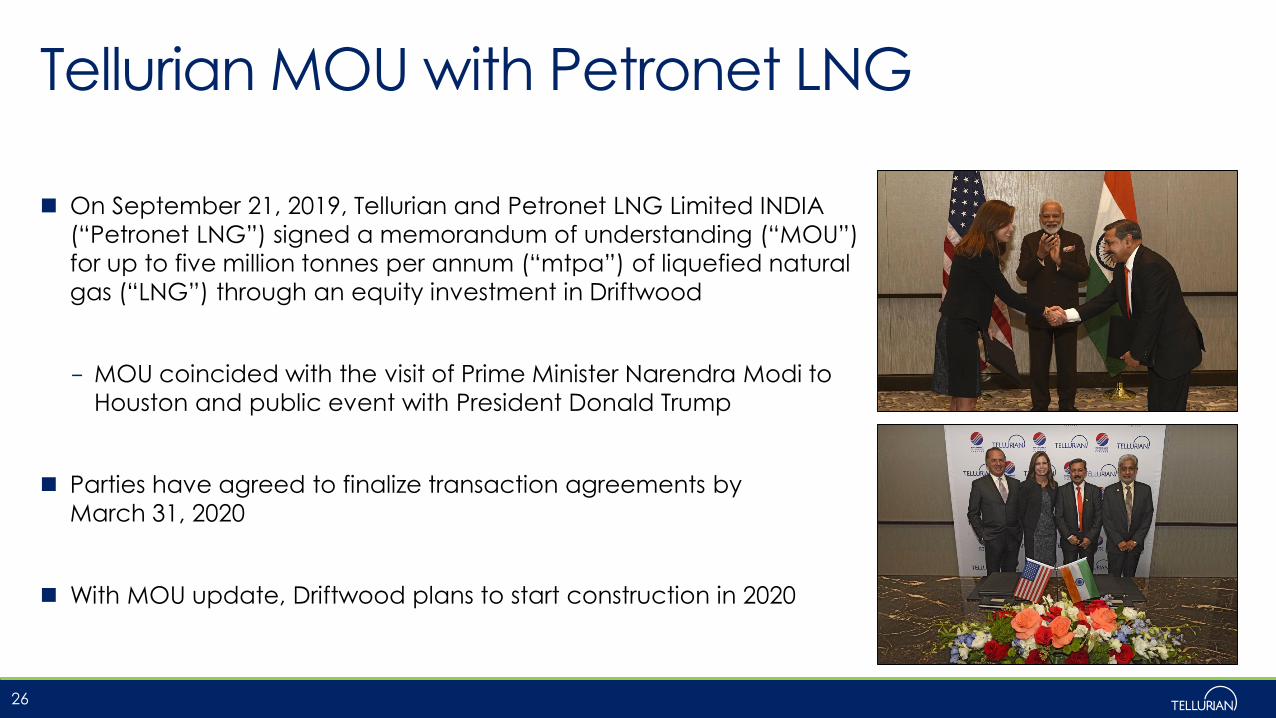
◼ On September 21, 2019, Tellurian and Petronet LNG Limited INDIA
(“Petronet LNG”) signed a memorandum of understanding (“MOU”)
for up to five million tonnes per annum (“mtpa”) of liquefied natural
gas (“LNG”) through an equity investment in Driftwood
- MOU coincided with the visit of Prime Minister Narendra Modi to
Houston and public event with President Donald Trump
◼ Parties have agreed to finalize transaction agreements by
March 31, 2020
◼ With MOU update, Driftwood plans to start construction in 2020
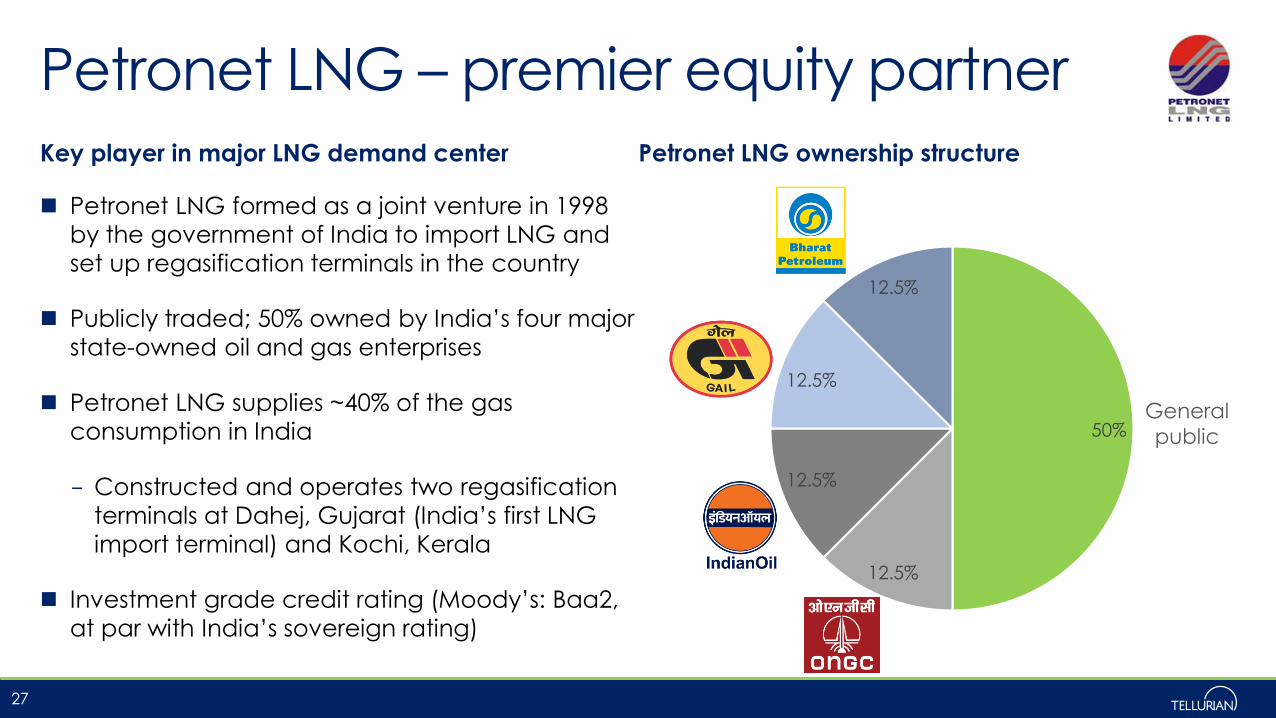
Petronet LNG – premier equity partner
27
50%
12.5%
12.5%
12.5%
12.5%
Petronet LNG ownership structure
General
public
Key player in major LNG demand center
◼ Petronet LNG formed as a joint venture in 1998
by the government of India to import LNG and
set up regasification terminals in the country
◼ Publicly traded; 50% owned by India’s four major
state-owned oil and gas enterprises
◼ Petronet LNG supplies ~40% of the gas
consumption in India
- Constructed and operates two regasification
terminals at Dahej, Gujarat (India’s first LNG
import terminal) and Kochi, Kerala
◼ Investment grade credit rating (Moody’s: Baa2,
at par with India’s sovereign rating)
LNG macro updates
28

2019A 2025E
8 bcf/d
30 bcf/d
~17 bcf/dadditional U.S. natural gas export capacity required(1)
U.S. must export ~30 bcf/d of LNG by 2025
Sources: RBN, Tellurian analysis.
Notes: (1) Assumes U.S. domestic gas demand grows at 0.6% p.a. and liquefaction capacity utilization rate of 85.6%.
(2) Includes 99 mtpa (~13 bcf/d) of operational and under construction liquefaction export capacity.
29
U.S. natural gas export requirements
115 mtpaof additional LNG capacity required(2)
LNGexport
capacity(2)

Permian gas to drive U.S. LNG export growth
Sources: EIA, BP Energy Outlook and Bloomberg.
30
Permian oil and gas production forecast
-
4
8
12
2013 2025E
Crude oil
Dry gas
mmboe/d
~19 bcf/d2025E Permian dry gas production
Permian oil drilling activity expected to double Permian gas production from 2018 to 2025
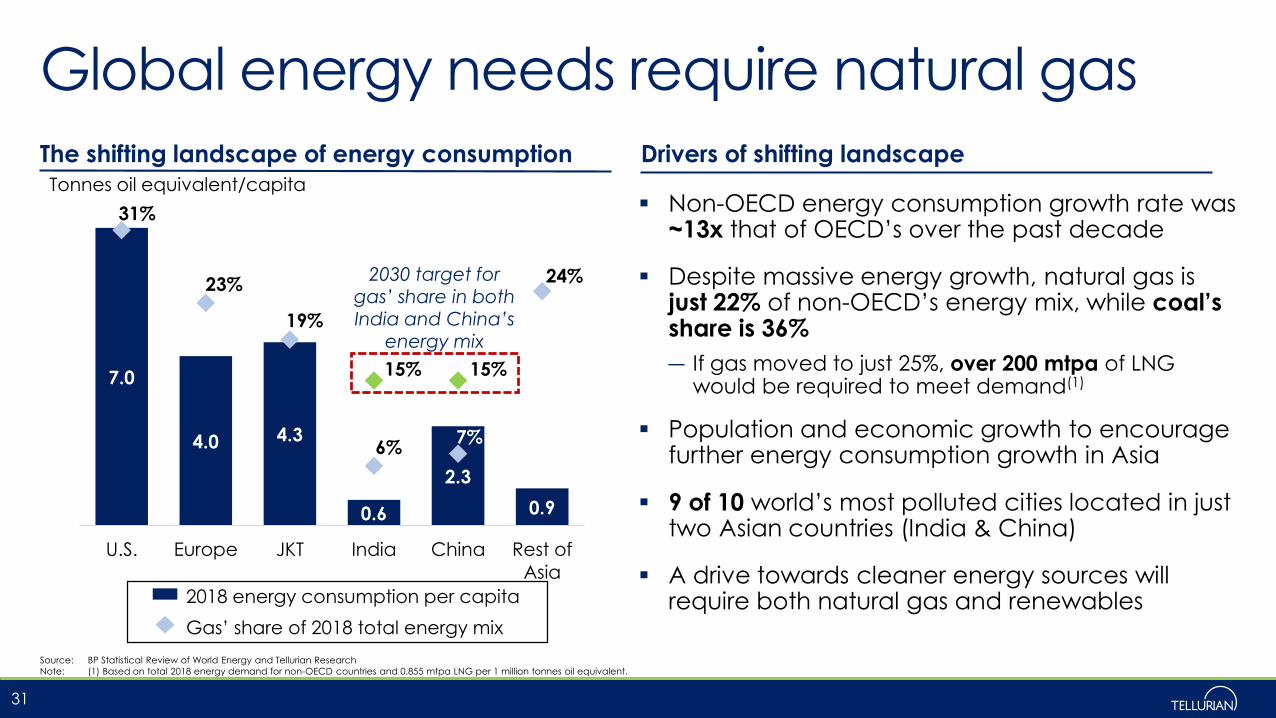
Global energy needs require natural gas
Source: BP Statistical Review of World Energy and Tellurian Research
Note: (1) Based on total 2018 energy demand for non-OECD countries and 0.855 mtpa LNG per 1 million tonnes oil equivalent.
31
7.0
4.0 4.3
0.6
2.3
0.9
31%
23%
19%
6%7%
24%
15% 15%
0%
5%
10%
15%
20%
25%
30%
35%
-
1
2
3
4
5
6
7
8
U.S. Europe JKT India China Rest of
Asia
Tonnes oil equivalent/capita
2030 target for gas’ share in both India and China’s
energy mix
Gas’ share of 2018 total energy mix
2018 energy consumption per capita
The shifting landscape of energy consumption Drivers of shifting landscape
▪ Non-OECD energy consumption growth rate was ~13x that of OECD’s over the past decade
▪ Despite massive energy growth, natural gas is just 22% of non-OECD’s energy mix, while coal’s share is 36%
― If gas moved to just 25%, over 200 mtpa of LNG would be required to meet demand(1)
▪ Population and economic growth to encourage further energy consumption growth in Asia
▪ 9 of 10 world’s most polluted cities located in just two Asian countries (India & China)
▪ A drive towards cleaner energy sources will require both natural gas and renewables

▪ Infrastructure:
― ~2x growth in India’s pipeline grid by 2025
― ~2x growth in India’s regas capacity by 2025
― ~1.5x growth in China’s pipeline grid by 2025
― ~2x growth in China’s regas capacity by 2025
▪ Policy:
― India and China’s infrastructure growth allows
each to remain on track to reach their targets
of 15% for gas’ share in the energy mix by 2030
▪ Latent demand:
― India and China’s total latent demand for
cleaner energy is equivalent to ~885 mtpa(3)
China & India: ~90 mtpa growth potential
Sources: BP Statistical Review of Energy, WoodMac, SIA and Tellurian Research.
Notes: (1) Based on WoodMac’s LNG demand outlook for both India and China.
(2) Based on existing, firm and likely regas capacity in addition to downstream pipeline infrastructure projects, per project sponsors.
(3) Based on 2018 coal-fired power generation.
32
LNG demand growth (2019-2025) Key growth drivers
15.3
45.5
India
21.0
43.3
China
mtpa
Based on consultant forecast(1)
Based on existing and planned infrastructure(2)

19 2132 36
14 19
23 158
7
15 28
75
41 48
70
153
2018 2020 2025 2030
Incremental supply required for 15% target
Uncontracted LNG
Contracted LNG
Indigenous Production
India’s targets suggest even higher gas use
33
India natural gas demand – primary sources
Sources: Wood Mackenzie, BP Energy Outlook 2019 Edition.
Notes: (1) Based on BP Energy Outlook’s estimate of India’s total primary energy consumption and Prime Minister Narendra Modi’s 15% target for natural gas’ share of India’s total primary energy consumption by 2030; 52.17 mmBtu per tonne of LNG.
(2) Per India Oil Minister Dharmendra Pradhan.
(1)
India’s gas demand drivers
▪ Prime Minister Modi has set a target of 15% for
natural gas’ share of India’s energy mix by 2030
▪ ~$100 billion in energy infrastructure investment
currently underway(2)
▪ Industrial use will lead gas demand growth as
India seeks food security for ~1.3 billion people
― India seeks to become a self-reliant supplier of urea,
triggering a revival of closed fertilizer plants and the
conversion of naphtha-based plants to gas
▪ India’s build-out of city gas distribution networks
is expected to connect an incremental ~35
million homes to the national gas grid
mtpa
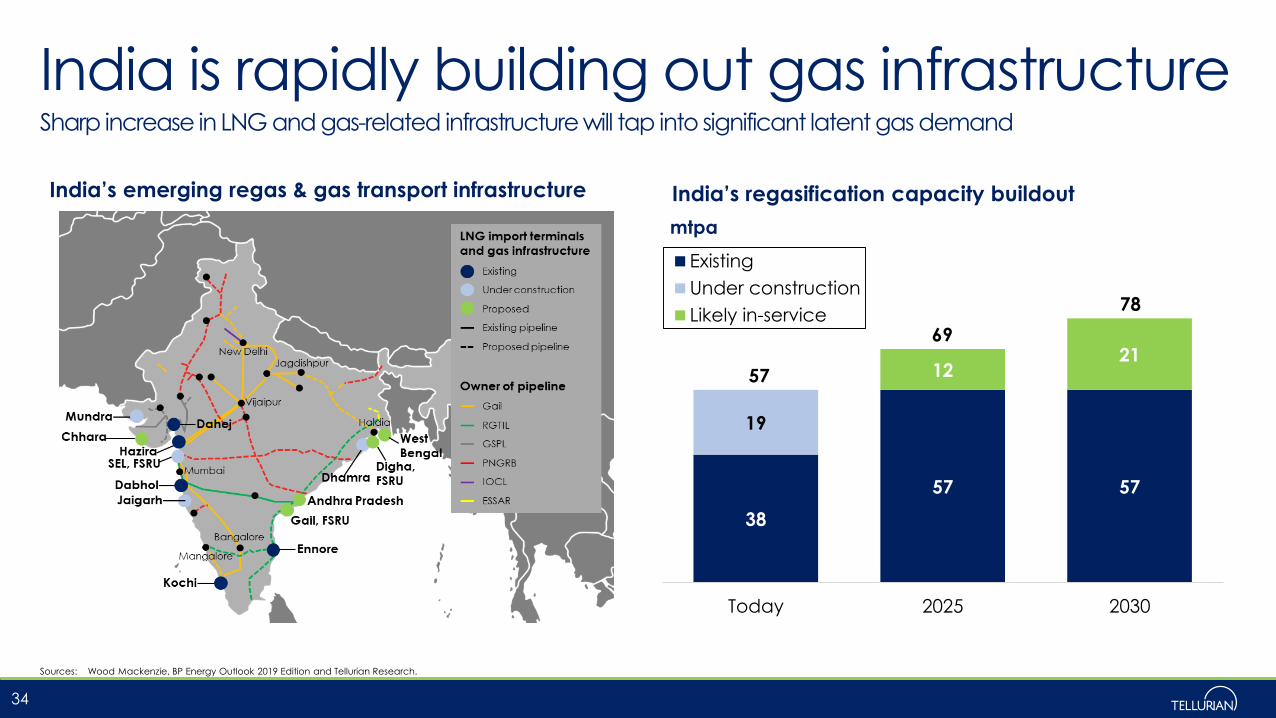
India is rapidly building out gas infrastructureSharp increase in LNG and gas-related infrastructure will tap into significant latent gas demand
Sources: Wood Mackenzie, BP Energy Outlook 2019 Edition and Tellurian Research.
34
India’s emerging regas & gas transport infrastructure India’s regasification capacity buildout
38
57 57
19
1221
57
69
78
Today 2025 2030
mtpa
Existing
Under construction
Likely in-service
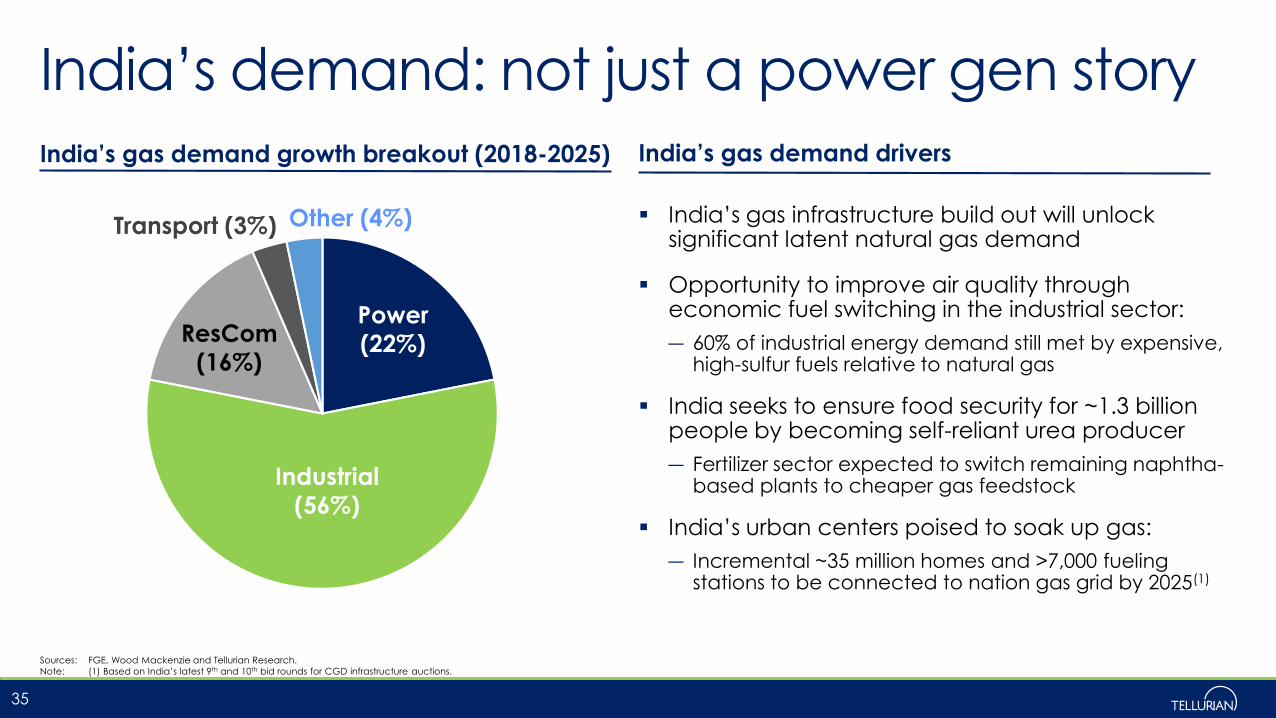
India’s demand: not just a power gen story
35
India’s gas demand growth breakout (2018-2025)
Sources: FGE, Wood Mackenzie and Tellurian Research.
Note: (1) Based on India’s latest 9th and 10th bid rounds for CGD infrastructure auctions.
India’s gas demand drivers
▪ India’s gas infrastructure build out will unlock significant latent natural gas demand
▪ Opportunity to improve air quality through economic fuel switching in the industrial sector:
― 60% of industrial energy demand still met by expensive, high-sulfur fuels relative to natural gas
▪ India seeks to ensure food security for ~1.3 billion people by becoming self-reliant urea producer
― Fertilizer sector expected to switch remaining naphtha-based plants to cheaper gas feedstock
▪ India’s urban centers poised to soak up gas:
― Incremental ~35 million homes and >7,000 fueling stations to be connected to nation gas grid by 2025(1)
Industrial
(56%)
Power
(22%)ResCom
(16%)
Other (4%)Transport (3%)
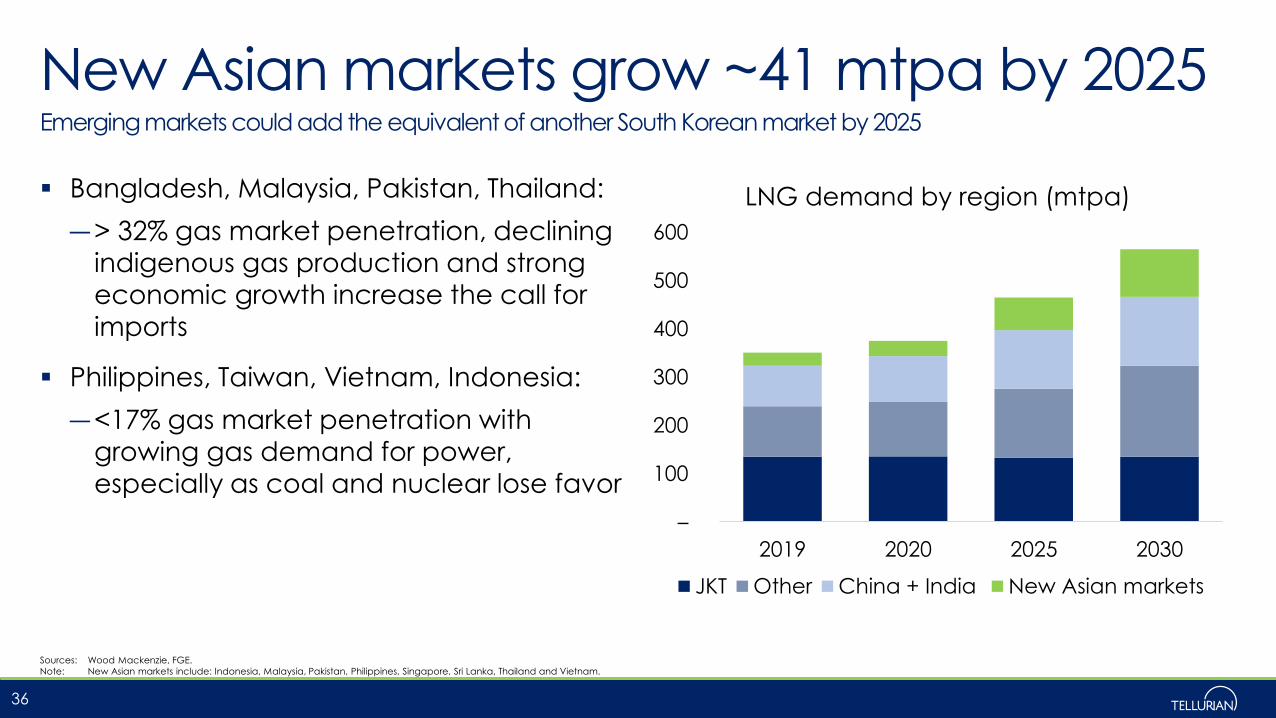
New Asian markets grow ~41 mtpa by 2025Emerging markets could add the equivalent of another South Korean market by 2025
▪ Bangladesh, Malaysia, Pakistan, Thailand:
― > 32% gas market penetration, declining
indigenous gas production and strong
economic growth increase the call for imports
▪ Philippines, Taiwan, Vietnam, Indonesia:
― <17% gas market penetration with
growing gas demand for power,
especially as coal and nuclear lose favor
Sources: Wood Mackenzie, FGE.
Note: New Asian markets include: Indonesia, Malaysia, Pakistan, Philippines, Singapore, Sri Lanka, Thailand and Vietnam.
36
–
100
200
300
400
500
600
2019 2020 2025 2030
LNG demand by region (mtpa)
JKT Other China + India New Asian markets
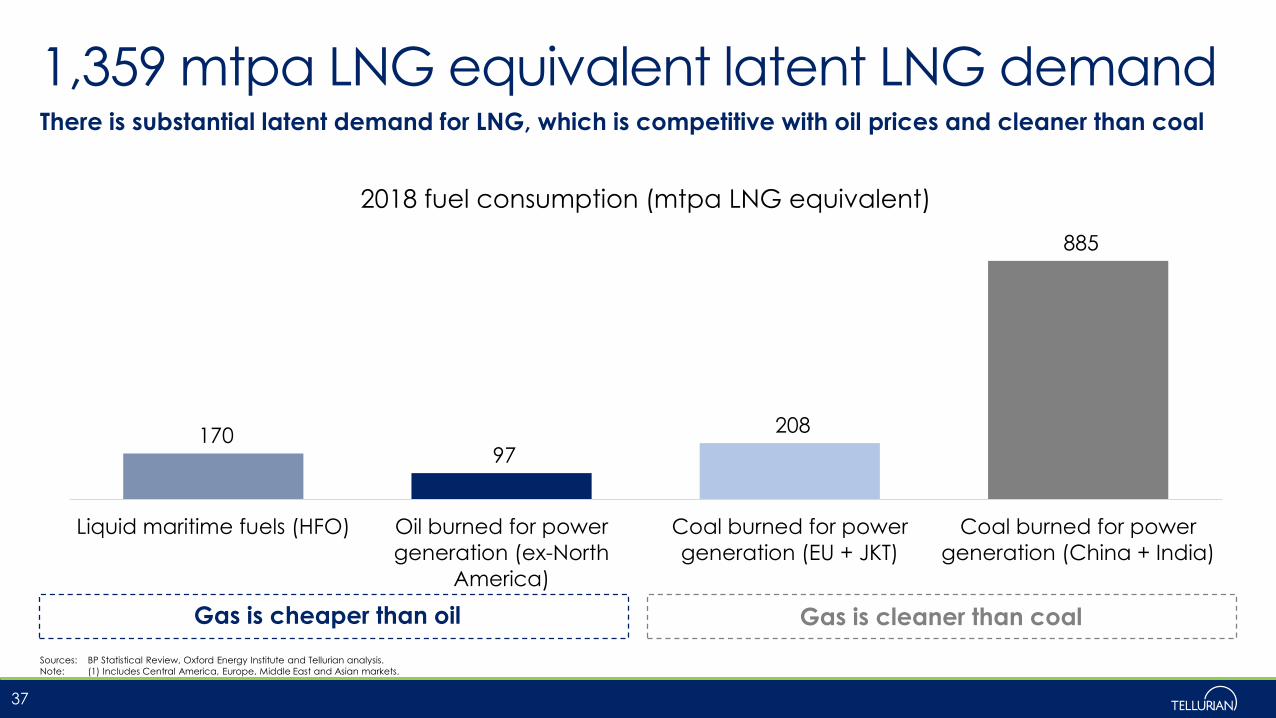
170 97
208
885
Liquid maritime fuels (HFO) Oil burned for power
generation (ex-North
America)
Coal burned for power
generation (EU + JKT)
Coal burned for power
generation (China + India)
2018 fuel consumption (mtpa LNG equivalent)
1,359 mtpa LNG equivalent latent LNG demandThere is substantial latent demand for LNG, which is competitive with oil prices and cleaner than coal
Sources: BP Statistical Review, Oxford Energy Institute and Tellurian analysis.
Note: (1) Includes Central America, Europe, Middle East and Asian markets.
37
Gas is cheaper than oil Gas is cleaner than coal

JKM growing as price reference for Asia
JKM swaps clearedSpot and short-term LNG trade
Source: Platts, GIIGNL.
38
59
65
70 68
75 78
99
2012 2013 2014 2015 2016 2017 2018
Total trade (mtpa)
Share of total trade (%)
25%
28%28%29%
28%27%
32%
0 0 0 1 3
10
35
87
2012 2013 2014 2015 2016 2017 2018 2019E
mtpa equivalent

ESG
39
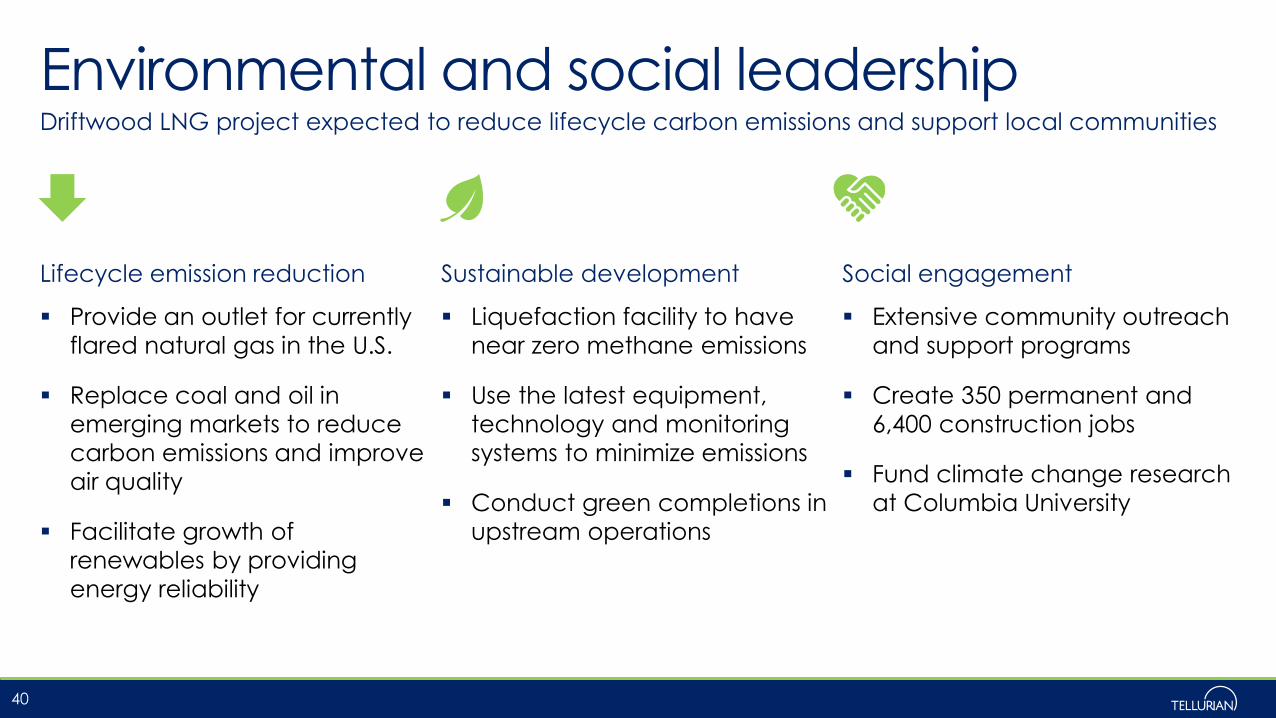
Environmental and social leadership
▪ Provide an outlet for currently
flared natural gas in the U.S.
▪ Replace coal and oil in
emerging markets to reduce
carbon emissions and improve
air quality
▪ Facilitate growth of
renewables by providing
energy reliability
Driftwood LNG project expected to reduce lifecycle carbon emissions and support local communities
40
Lifecycle emission reduction Sustainable development
▪ Liquefaction facility to have
near zero methane emissions
▪ Use the latest equipment,
technology and monitoring
systems to minimize emissions
▪ Conduct green completions in
upstream operations
▪ Extensive community outreach
and support programs
▪ Create 350 permanent and
6,400 construction jobs
▪ Fund climate change research
at Columbia University
Social engagement
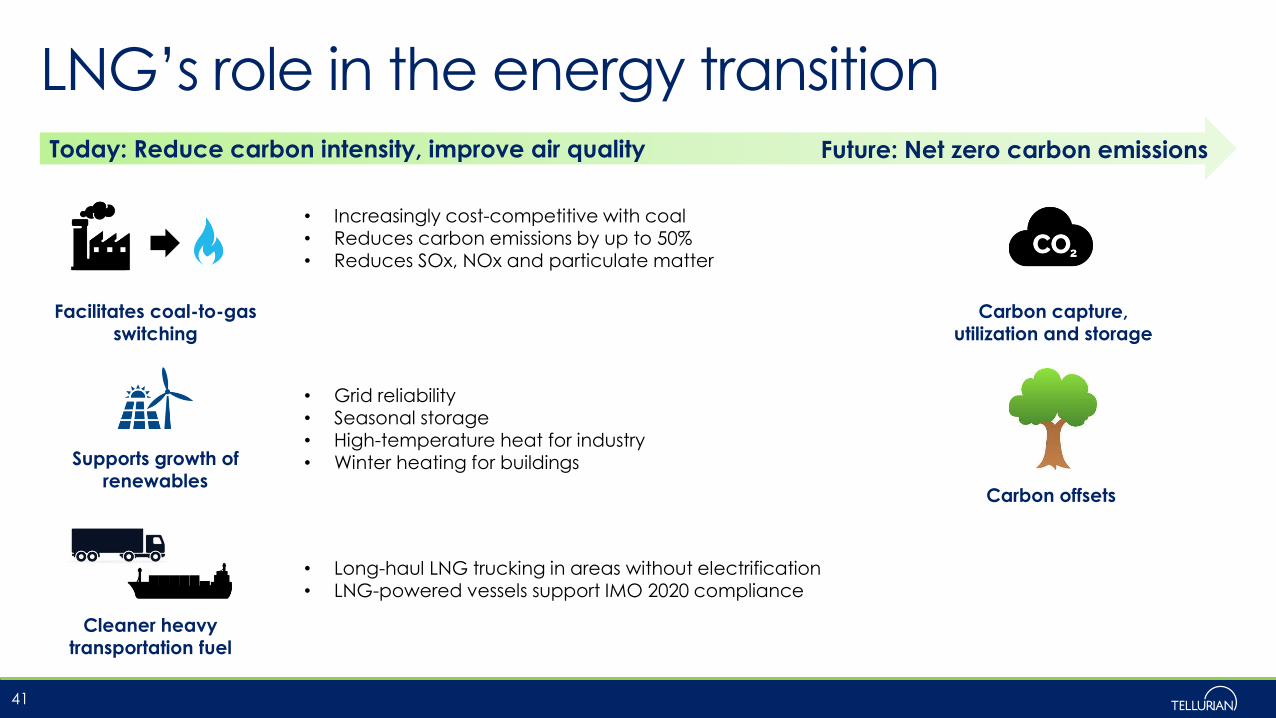
LNG’s role in the energy transition
41
Today: Reduce carbon intensity, improve air quality Future: Net zero carbon emissions
Carbon capture, utilization and storage
Carbon offsets
Facilitates coal-to-gas switching
Supports growth of renewables
• Increasingly cost-competitive with coal• Reduces carbon emissions by up to 50%• Reduces SOx, NOx and particulate matter
• Grid reliability• Seasonal storage• High-temperature heat for industry• Winter heating for buildings
Cleaner heavy transportation fuel
• Long-haul LNG trucking in areas without electrification• LNG-powered vessels support IMO 2020 compliance