TUTORIAL ON CENTRIFUGAL COMPRESSOR SURGE CONTROL Dr ...
29
Copyright© 2018 by Turbomachinery Laboratory, Texas A&M Engineering Experiment Station TUTORIAL ON CENTRIFUGAL COMPRESSOR SURGE CONTROL Dr. Jeffrey Moore Institute Engineer Southwest Research Institute San Antonio, Texas USA Dr. Klaus Brun Machinery Program Director Southwest Research Institute San Antonio, Texas USA Dr. Rainer Kurz Manager, Systems Analysis Solar Turbines Incorporated San Diego, California USA Dr. Jeffrey Moore is an Institute Engineer in the Machinery Section at Southwest Research Institute in San Antonio, TX. He holds a B.S., M.S., and Ph.D. in Mechanical Engineering from Texas A&M University. His professional experience over the last 27 years includes engineering and management responsibilities related to centrifugal compressors and gas turbines at Solar Turbines Inc. in San Diego, CA, Dresser-Rand in Olean, NY, and Southwest Research Institute in San Antonio, TX. His interests include advanced power cycles and compression methods, rotordynamics, seals and bearings, computational fluid dynamics, finite element analysis, machine design, controls and aerodynamics. He has authored over 40 technical papers related to turbomachinery and has three patents issued and two pending. Dr. Moore has held positions as the Vanguard Chair of the Structures and Dynamics Committee and Chair of Oil and Gas Committee for IGTI Turbo Expo, and the Associate Editor for the Journal of Tribology. He is also a member of the Turbomachinery Symposium Advisory Committee, the IFToMM International Rotordynamics Conference Committee, and the API 616 and 684 Task Forces. Dr. Rainer Kurz is the Manager, Systems Analysis at Solar Turbines Incorporated, in San Diego, California. His organization is responsible for predicting compressor and gas turbine performance, for conducting application studies, and for field performance testing. Dr. Kurz attended the Universitaet der Bundeswehr in Hamburg Germany, where he received the degree of a Dr.-Ing. in 1991. He joined Solar Turbines in 1993, and holds his current position since 1995. Dr. Kurz is the past chair of the ASME/IGTI Oil and Gas Applications Committee, a member of the Gas Machinery Research Council Project Supervisory Committee, the GMC Conference Organizing Committee, the Texas A&M Turbomachinery Symposium Advisory Committee, the Asian Turbomachinery Symposium Advisory Committee, and the SDSU Aerospace Engineering Advisory Committee. He was elected ASME Fellow in 2003. He has authored numerous publications on turbomachinery related topics, with an emphasis on compressor applications, dynamic behavior, and gas turbine operation and degradation. He has received several ‘Best Paper’ and ‘Best Tutorial’ Awards at the ASME TurboExpo Conferences and is the recipient of the 2013 Industrial Gas Turbine Technology award. Dr. Klaus Brun is the Machinery Program Director at Southwest Research Institute where he leads an organization of more than 60 that focuses on R&D for the energy industry. His past experience includes positions in engineering, project management, and management at Solar Turbines, General Electric, and Alstom. He holds eight patents, authored over 350 papers, and published three textbooks on energy systems and turbomachinery. Dr. Brun is a Fellow of the ASME and won an R&D 100 award in 2007 for his Semi-Active Valve invention. He also won the ASME Industrial Gas Turbine Award in 2016 and ASME Oil & Gas Committee Best Paper/Tutorial awards in 1998, 2000, 2005, 2009, 2010, 2012, 2014, 2016, and 2017. Dr. Brun is the past chair of the ASME-IGTI Board of Directors, the ASME Oil & Gas Applications Committee, and ASME sCO2 Power Cycle Committee. He is also a member of the API 616 Task Force, the ASME PTC- 10 task force, the Asia Turbomachinery Symposiums Committee, the Fan Conference Advisory Committee, and the Supercritical CO2 Symposium Advisory Committee. Dr. Brun is the past Editor of Gas Turbine News and currently the Executive Correspondent of Turbomachinery International Magazine and Associate Editor of the ASME Journal of Gas Turbines for Power.
Transcript of TUTORIAL ON CENTRIFUGAL COMPRESSOR SURGE CONTROL Dr ...

Copyright© 2018 by Turbomachinery Laboratory, Texas A&M Engineering Experiment Station
TUTORIAL ON CENTRIFUGAL COMPRESSOR SURGE CONTROL
Dr. Jeffrey Moore Institute Engineer Southwest Research Institute San Antonio, Texas USA Dr. Klaus Brun Machinery Program Director Southwest Research Institute San Antonio, Texas USA
Dr. Rainer Kurz Manager, Systems Analysis Solar Turbines Incorporated San Diego, California USA
Dr. Jeffrey Moore is an Institute Engineer in the Machinery Section at Southwest Research Institute in San Antonio, TX. He holds a B.S., M.S., and Ph.D. in Mechanical Engineering from Texas A&M University. His professional experience over the last 27 years includes engineering and management responsibilities related to centrifugal compressors and gas turbines at Solar Turbines Inc. in San Diego, CA, Dresser-Rand in Olean, NY, and Southwest Research Institute in San Antonio, TX. His interests include advanced power cycles and compression methods, rotordynamics, seals and bearings, computational fluid dynamics, finite element analysis, machine design, controls and aerodynamics. He has authored
over 40 technical papers related to turbomachinery and has three patents issued and two pending. Dr. Moore has held positions as the Vanguard Chair of the Structures and Dynamics Committee and Chair of Oil and Gas Committee for IGTI Turbo Expo, and the Associate Editor for the Journal of Tribology. He is also a member of the Turbomachinery Symposium Advisory Committee, the IFToMM International Rotordynamics Conference Committee, and the API 616 and 684 Task Forces.
Dr. Rainer Kurz is the Manager, Systems Analysis at Solar Turbines Incorporated, in San Diego, California. His organization is responsible for predicting compressor and gas turbine performance, for conducting application studies, and for field performance testing. Dr. Kurz attended the Universitaet der Bundeswehr in Hamburg Germany, where he received the degree of a Dr.-Ing. in 1991. He joined Solar Turbines in 1993, and holds his current position since 1995. Dr. Kurz is the past chair of the ASME/IGTI Oil and Gas Applications Committee, a member of the Gas Machinery Research Council Project Supervisory Committee, the GMC Conference Organizing Committee, the Texas A&M
Turbomachinery Symposium Advisory Committee, the Asian Turbomachinery Symposium Advisory Committee, and the SDSU Aerospace Engineering Advisory Committee. He was elected ASME Fellow in 2003. He has authored numerous publications on turbomachinery related topics, with an emphasis on compressor applications, dynamic behavior, and gas turbine operation and degradation. He has received several ‘Best Paper’ and ‘Best Tutorial’ Awards at the ASME TurboExpo Conferences and is the recipient of the 2013 Industrial Gas Turbine Technology award.
Dr. Klaus Brun is the Machinery Program Director at Southwest Research Institute where he leads an organization of more than 60 that focuses on R&D for the energy industry. His past experience includes positions in engineering, project management, and management at Solar Turbines, General Electric, and Alstom. He holds eight patents, authored over 350 papers, and published three textbooks on energy systems and turbomachinery. Dr. Brun is a Fellow of the ASME and won an R&D 100 award in 2007 for his Semi-Active Valve invention. He also won the ASME Industrial Gas Turbine Award in 2016 and ASME Oil & Gas Committee Best Paper/Tutorial awards in 1998, 2000, 2005, 2009, 2010, 2012, 2014, 2016, and 2017. Dr. Brun is the past chair of the ASME-IGTI Board of Directors, the ASME Oil & Gas
Applications Committee, and ASME sCO2 Power Cycle Committee. He is also a member of the API 616 Task Force, the ASME PTC-10 task force, the Asia Turbomachinery Symposiums Committee, the Fan Conference Advisory Committee, and the Supercritical CO2 Symposium Advisory Committee. Dr. Brun is the past Editor of Gas Turbine News and currently the Executive Correspondent of Turbomachinery International Magazine and Associate Editor of the ASME Journal of Gas Turbines for Power.
Copyright© 2018 by Turbomachinery Laboratory, Texas A&M Engineering Experiment Station
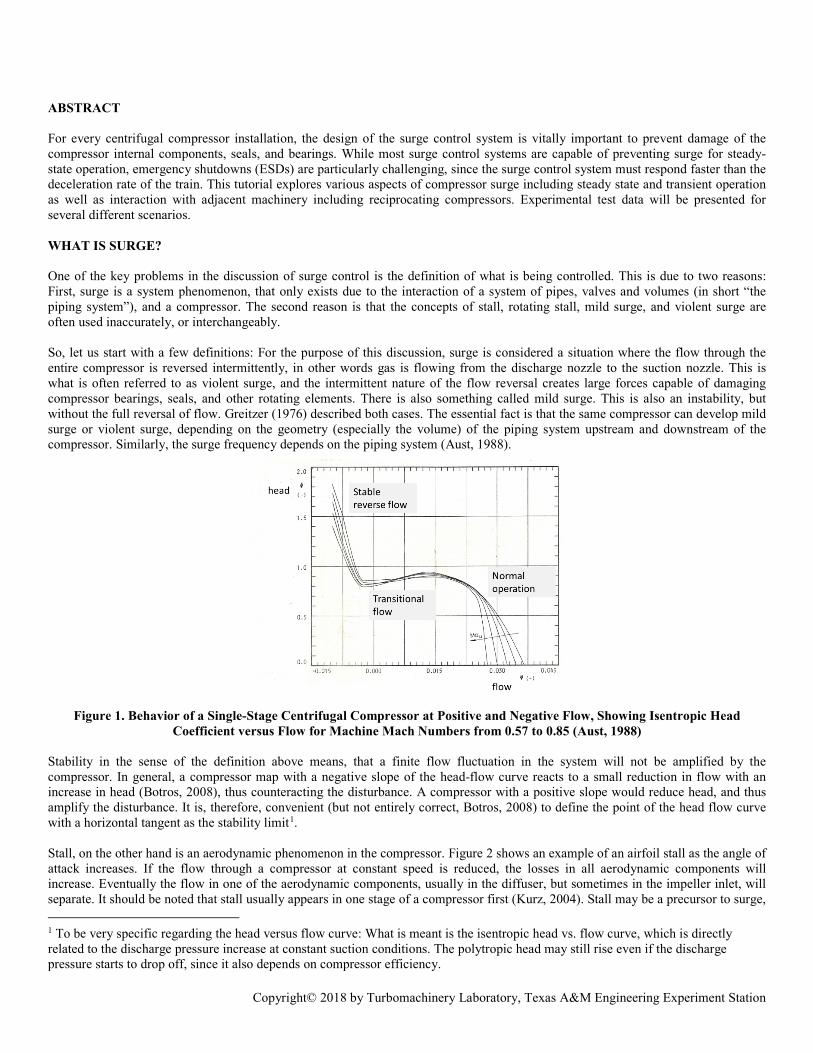
ABSTRACT For every centrifugal compressor installation, the design of the surge control system is vitally important to prevent damage of the compressor internal components, seals, and bearings. While most surge control systems are capable of preventing surge for steady-state operation, emergency shutdowns (ESDs) are particularly challenging, since the surge control system must respond faster than the deceleration rate of the train. This tutorial explores various aspects of compressor surge including steady state and transient operation as well as interaction with adjacent machinery including reciprocating compressors. Experimental test data will be presented for several different scenarios. WHAT IS SURGE? One of the key problems in the discussion of surge control is the definition of what is being controlled. This is due to two reasons: First, surge is a system phenomenon, that only exists due to the interaction of a system of pipes, valves and volumes (in short “the piping system”), and a compressor. The second reason is that the concepts of stall, rotating stall, mild surge, and violent surge are often used inaccurately, or interchangeably. So, let us start with a few definitions: For the purpose of this discussion, surge is considered a situation where the flow through the entire compressor is reversed intermittently, in other words gas is flowing from the discharge nozzle to the suction nozzle. This is what is often referred to as violent surge, and the intermittent nature of the flow reversal creates large forces capable of damaging compressor bearings, seals, and other rotating elements. There is also something called mild surge. This is also an instability, but without the full reversal of flow. Greitzer (1976) described both cases. The essential fact is that the same compressor can develop mild surge or violent surge, depending on the geometry (especially the volume) of the piping system upstream and downstream of the compressor. Similarly, the surge frequency depends on the piping system (Aust, 1988).
Figure 1. Behavior of a Single-Stage Centrifugal Compressor at Positive and Negative Flow, Showing Isentropic Head
Coefficient versus Flow for Machine Mach Numbers from 0.57 to 0.85 (Aust, 1988) Stability in the sense of the definition above means, that a finite flow fluctuation in the system will not be amplified by the compressor. In general, a compressor map with a negative slope of the head-flow curve reacts to a small reduction in flow with an increase in head (Botros, 2008), thus counteracting the disturbance. A compressor with a positive slope would reduce head, and thus amplify the disturbance. It is, therefore, convenient (but not entirely correct, Botros, 2008) to define the point of the head flow curve with a horizontal tangent as the stability limit1. Stall, on the other hand is an aerodynamic phenomenon in the compressor. Figure 2 shows an example of an airfoil stall as the angle of attack increases. If the flow through a compressor at constant speed is reduced, the losses in all aerodynamic components will increase. Eventually the flow in one of the aerodynamic components, usually in the diffuser, but sometimes in the impeller inlet, will separate. It should be noted that stall usually appears in one stage of a compressor first (Kurz, 2004). Stall may be a precursor to surge, 1 To be very specific regarding the head versus flow curve: What is meant is the isentropic head vs. flow curve, which is directly related to the discharge pressure increase at constant suction conditions. The polytropic head may still rise even if the discharge pressure starts to drop off, since it also depends on compressor efficiency.
Copyright© 2018 by Turbomachinery Laboratory, Texas A&M Engineering Experiment Station
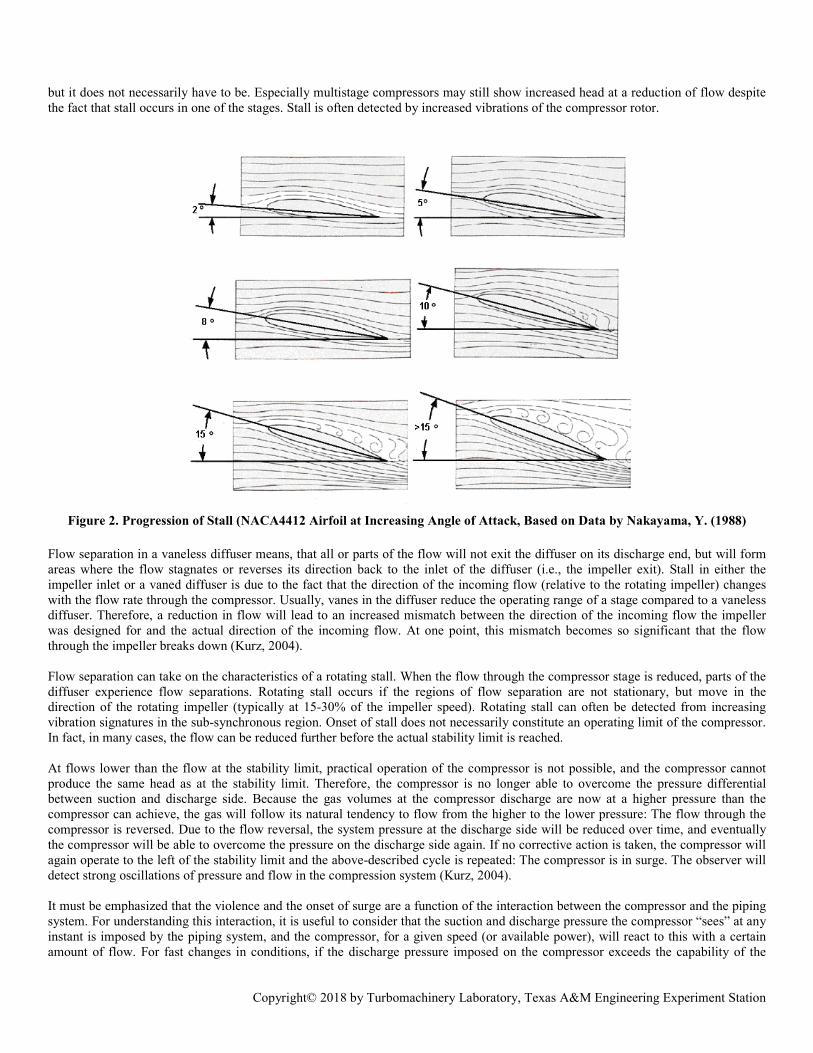
but it does not necessarily have to be. Especially multistage compressors may still show increased head at a reduction of flow despite the fact that stall occurs in one of the stages. Stall is often detected by increased vibrations of the compressor rotor.
Figure 2. Progression of Stall (NACA4412 Airfoil at Increasing Angle of Attack, Based on Data by Nakayama, Y. (1988)
Flow separation in a vaneless diffuser means, that all or parts of the flow will not exit the diffuser on its discharge end, but will form areas where the flow stagnates or reverses its direction back to the inlet of the diffuser (i.e., the impeller exit). Stall in either the impeller inlet or a vaned diffuser is due to the fact that the direction of the incoming flow (relative to the rotating impeller) changes with the flow rate through the compressor. Usually, vanes in the diffuser reduce the operating range of a stage compared to a vaneless diffuser. Therefore, a reduction in flow will lead to an increased mismatch between the direction of the incoming flow the impeller was designed for and the actual direction of the incoming flow. At one point, this mismatch becomes so significant that the flow through the impeller breaks down (Kurz, 2004). Flow separation can take on the characteristics of a rotating stall. When the flow through the compressor stage is reduced, parts of the diffuser experience flow separations. Rotating stall occurs if the regions of flow separation are not stationary, but move in the direction of the rotating impeller (typically at 15-30% of the impeller speed). Rotating stall can often be detected from increasing vibration signatures in the sub-synchronous region. Onset of stall does not necessarily constitute an operating limit of the compressor. In fact, in many cases, the flow can be reduced further before the actual stability limit is reached. At flows lower than the flow at the stability limit, practical operation of the compressor is not possible, and the compressor cannot produce the same head as at the stability limit. Therefore, the compressor is no longer able to overcome the pressure differential between suction and discharge side. Because the gas volumes at the compressor discharge are now at a higher pressure than the compressor can achieve, the gas will follow its natural tendency to flow from the higher to the lower pressure: The flow through the compressor is reversed. Due to the flow reversal, the system pressure at the discharge side will be reduced over time, and eventually the compressor will be able to overcome the pressure on the discharge side again. If no corrective action is taken, the compressor will again operate to the left of the stability limit and the above-described cycle is repeated: The compressor is in surge. The observer will detect strong oscillations of pressure and flow in the compression system (Kurz, 2004). It must be emphasized that the violence and the onset of surge are a function of the interaction between the compressor and the piping system. For understanding this interaction, it is useful to consider that the suction and discharge pressure the compressor “sees” at any instant is imposed by the piping system, and the compressor, for a given speed (or available power), will react to this with a certain amount of flow. For fast changes in conditions, if the discharge pressure imposed on the compressor exceeds the capability of the
Copyright© 2018 by Turbomachinery Laboratory, Texas A&M Engineering Experiment Station
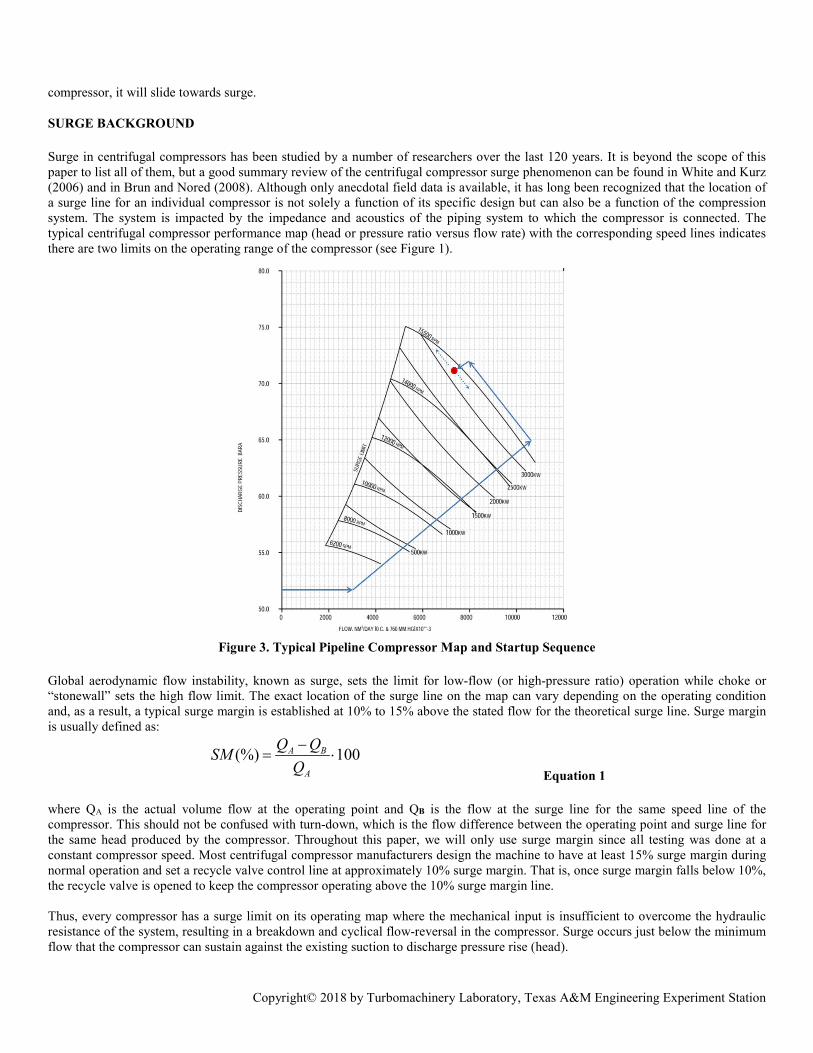
compressor, it will slide towards surge. SURGE BACKGROUND Surge in centrifugal compressors has been studied by a number of researchers over the last 120 years. It is beyond the scope of this paper to list all of them, but a good summary review of the centrifugal compressor surge phenomenon can be found in White and Kurz (2006) and in Brun and Nored (2008). Although only anecdotal field data is available, it has long been recognized that the location of a surge line for an individual compressor is not solely a function of its specific design but can also be a function of the compression system. The system is impacted by the impedance and acoustics of the piping system to which the compressor is connected. The typical centrifugal compressor performance map (head or pressure ratio versus flow rate) with the corresponding speed lines indicates there are two limits on the operating range of the compressor (see Figure 1).
Figure 3. Typical Pipeline Compressor Map and Startup Sequence
Global aerodynamic flow instability, known as surge, sets the limit for low-flow (or high-pressure ratio) operation while choke or “stonewall” sets the high flow limit. The exact location of the surge line on the map can vary depending on the operating condition and, as a result, a typical surge margin is established at 10% to 15% above the stated flow for the theoretical surge line. Surge margin is usually defined as:
100(%) ⋅−
=A
BA
QQQSM
Equation 1 where QA is the actual volume flow at the operating point and QB is the flow at the surge line for the same speed line of the compressor. This should not be confused with turn-down, which is the flow difference between the operating point and surge line for the same head produced by the compressor. Throughout this paper, we will only use surge margin since all testing was done at a constant compressor speed. Most centrifugal compressor manufacturers design the machine to have at least 15% surge margin during normal operation and set a recycle valve control line at approximately 10% surge margin. That is, once surge margin falls below 10%, the recycle valve is opened to keep the compressor operating above the 10% surge margin line. Thus, every compressor has a surge limit on its operating map where the mechanical input is insufficient to overcome the hydraulic resistance of the system, resulting in a breakdown and cyclical flow-reversal in the compressor. Surge occurs just below the minimum flow that the compressor can sustain against the existing suction to discharge pressure rise (head).
Copyright© 2018 by Turbomachinery Laboratory, Texas A&M Engineering Experiment Station
Once surge occurs, the flow reversal reduces the discharge pressure or increases the suction pressure, thus allowing forward flow to resume until the pressure rise again reaches the surge point. This surge cycle continues at a low frequency (<10 Hz) until some change takes place in the process or the compressor conditions. The frequency and magnitude of the surge flow-reversing cycle depend on the design and operating condition of the machine, but in most cases, it is sufficient to cause damage to the seals and bearings and sometimes even the shaft and impellers of the machine. Surge is a global instability in a compressor's flow that results in a complete breakdown and flow reversal through the compressor. This classic compressor performance map is appropriate for the characterization of steady state and slowly changing operating conditions, but it is not fully applicable for rapidly transient or high frequency periodic compressor flow inputs. It is acceptable to assume that the relatively fast flow transients (above 1-2 Hz) experienced by the centrifugal compressor do not affect the compressor’s operational speed (Brun and Kurz, 2010). The centrifugal compressor continues to operate at a constant speed due to the rotational inertia of the compressor (and its driver). Thus, the compressor will operate on a fixed head-flow speed line. However, when the compressor experiences suction or discharge flow fluctuations superimposed on the mean-flow, these fluctuations can often be enough to momentarily move the compressor operating point on the map’s speed line across the surge limit and affect the forward flow stability of the compressor. Although this flow reversal event may be very short-lived (depending on the frequency of the flow fluctuation), it is usually sufficient to drive the compressor into a full surge cycle. Thus, even if a compressor is operating with an adequate surge margin based on the mean-flow, high inlet or discharge side pulsations have the potential to cause the compressor to operate in periodic unsteady surge cycles. WHAT IS SURGE CONTROL? A surge control system is designed to prevent surge in the compression system. It consists of the compressor, a controller, one or several recycle loops with valves, and instrumentation to measure relevant process variables. Its function should cover three fundamentally different scenarios:
• Process control • Surge avoidance in fast transients, such as emergency shutdown • Surge avoidance during start up
This list requires a few comments: For one, only one function (process control) is actually a classical control function. Surge avoidance during start up usually requires to set the recycle valve to a fixed position, and to close that valve once the unit is on line. Surge avoidance during fast transients, for example, during an emergency shutdown, where the power to the compressor driver is instantaneously turned off, usually requires opening the recycle valves as fast as possible. In other words, there is no particular control function, but the design of the system has to ensure that no damaging surge of the compressor occurs in that situation. It is also important to understand, that not every shutdown is an emergency shutdown. During a normal shutdown, the valve opens gradually, and in a controlled fashion while the power from the driver is reduced. The three functions could be covered by separate independent valves. In general, a solution where all three functions can be covered by a single valve are preferred, but require some understanding of the system. This will be a point discussed in some detail. In cases where a single valve cannot accomplish the task, two valves, either in combination or separately, can be used to accommodate the process control and start up, as well as the fast transients. FUNCTION The surge avoidance system prevents surge by modulating a surge control (bypass) valve around the compressor. A typical system consists of pressure and temperature transmitters on the compressor suction and discharge lines, a flow differential pressure transmitter across the compressor flow meter, an algorithm in the control system, and a surge control valve with corresponding accessories.
Copyright© 2018 by Turbomachinery Laboratory, Texas A&M Engineering Experiment Station
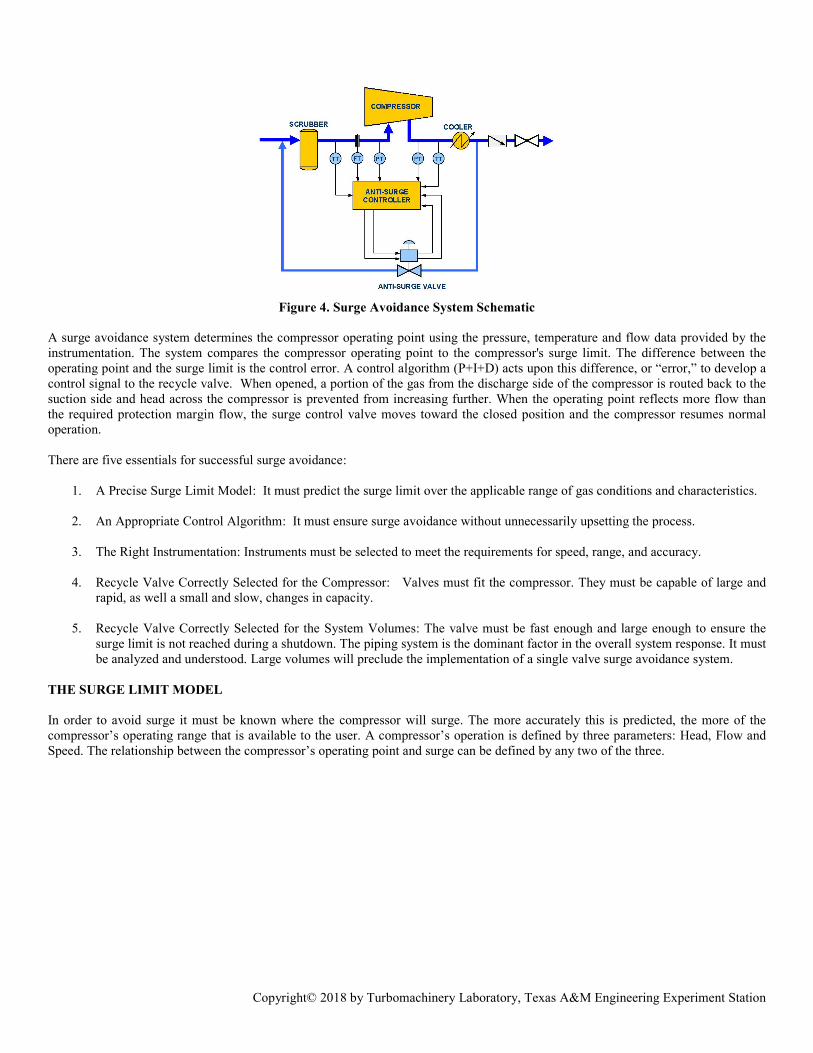
Figure 4. Surge Avoidance System Schematic
A surge avoidance system determines the compressor operating point using the pressure, temperature and flow data provided by the instrumentation. The system compares the compressor operating point to the compressor's surge limit. The difference between the operating point and the surge limit is the control error. A control algorithm (P+I+D) acts upon this difference, or “error,” to develop a control signal to the recycle valve. When opened, a portion of the gas from the discharge side of the compressor is routed back to the suction side and head across the compressor is prevented from increasing further. When the operating point reflects more flow than the required protection margin flow, the surge control valve moves toward the closed position and the compressor resumes normal operation. There are five essentials for successful surge avoidance:
1. A Precise Surge Limit Model: It must predict the surge limit over the applicable range of gas conditions and characteristics.
2. An Appropriate Control Algorithm: It must ensure surge avoidance without unnecessarily upsetting the process.
3. The Right Instrumentation: Instruments must be selected to meet the requirements for speed, range, and accuracy.
4. Recycle Valve Correctly Selected for the Compressor: Valves must fit the compressor. They must be capable of large and rapid, as well a small and slow, changes in capacity.
5. Recycle Valve Correctly Selected for the System Volumes: The valve must be fast enough and large enough to ensure the surge limit is not reached during a shutdown. The piping system is the dominant factor in the overall system response. It must be analyzed and understood. Large volumes will preclude the implementation of a single valve surge avoidance system.
THE SURGE LIMIT MODEL In order to avoid surge it must be known where the compressor will surge. The more accurately this is predicted, the more of the compressor’s operating range that is available to the user. A compressor’s operation is defined by three parameters: Head, Flow and Speed. The relationship between the compressor’s operating point and surge can be defined by any two of the three.
Copyright© 2018 by Turbomachinery Laboratory, Texas A&M Engineering Experiment Station
N H
Q
H
N2 Q2
H = Head Q = Flow N = Speed
SurgeMargin
Head Riseto Surge Turndown
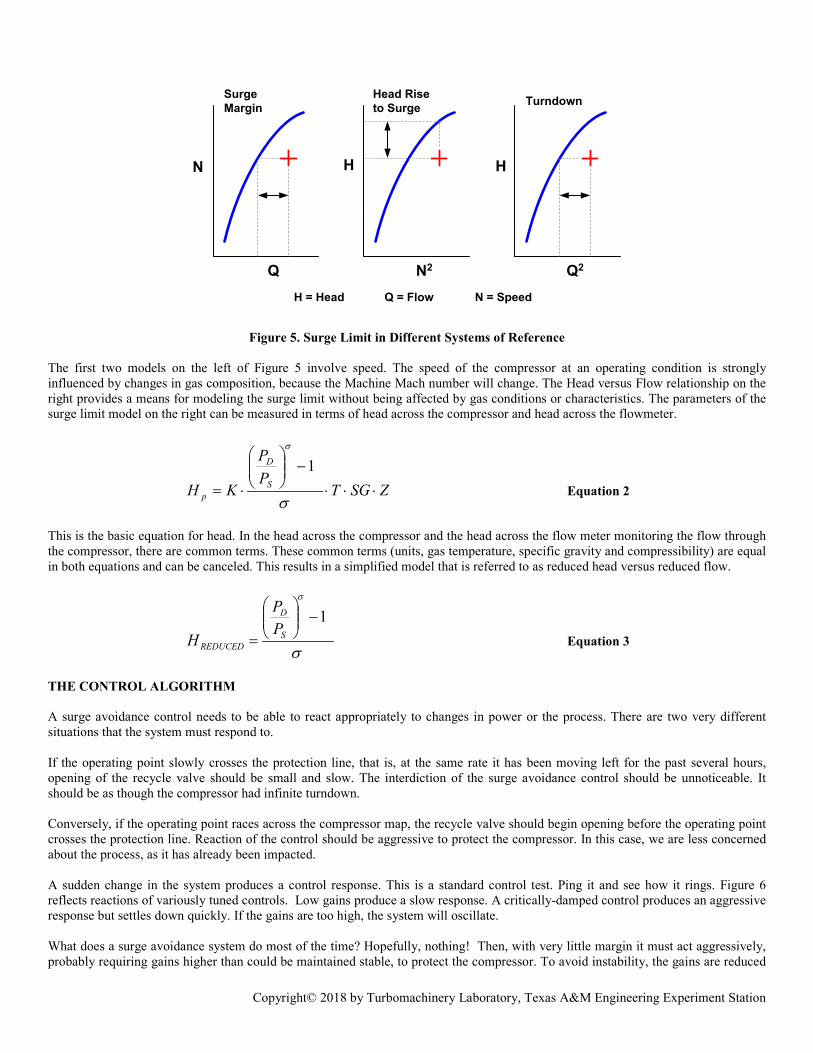
Figure 5. Surge Limit in Different Systems of Reference The first two models on the left of Figure 5 involve speed. The speed of the compressor at an operating condition is strongly influenced by changes in gas composition, because the Machine Mach number will change. The Head versus Flow relationship on the right provides a means for modeling the surge limit without being affected by gas conditions or characteristics. The parameters of the surge limit model on the right can be measured in terms of head across the compressor and head across the flowmeter.
ZSGTPP
KH S
D
p ⋅⋅⋅−
⋅=σ
σ
1 Equation 2
This is the basic equation for head. In the head across the compressor and the head across the flow meter monitoring the flow through the compressor, there are common terms. These common terms (units, gas temperature, specific gravity and compressibility) are equal in both equations and can be canceled. This results in a simplified model that is referred to as reduced head versus reduced flow.
σ
σ
1−
= S
D
REDUCEDPP
H Equation 3
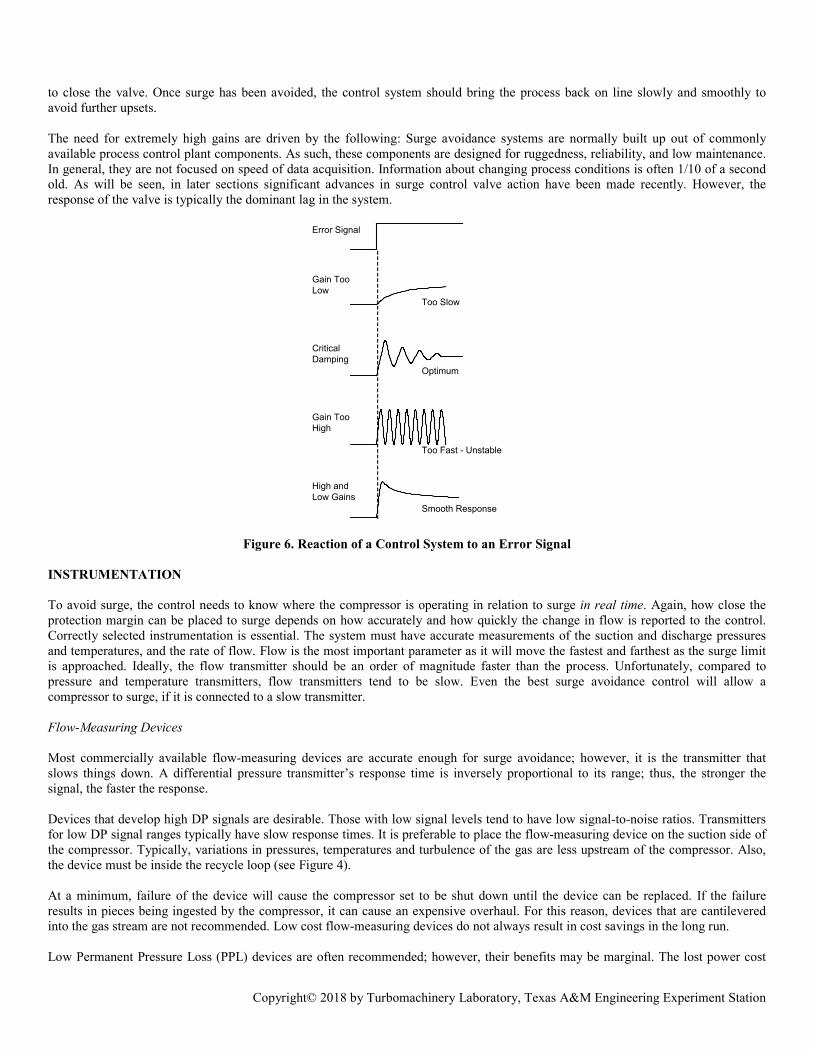
THE CONTROL ALGORITHM A surge avoidance control needs to be able to react appropriately to changes in power or the process. There are two very different situations that the system must respond to. If the operating point slowly crosses the protection line, that is, at the same rate it has been moving left for the past several hours, opening of the recycle valve should be small and slow. The interdiction of the surge avoidance control should be unnoticeable. It should be as though the compressor had infinite turndown. Conversely, if the operating point races across the compressor map, the recycle valve should begin opening before the operating point crosses the protection line. Reaction of the control should be aggressive to protect the compressor. In this case, we are less concerned about the process, as it has already been impacted. A sudden change in the system produces a control response. This is a standard control test. Ping it and see how it rings. Figure 6 reflects reactions of variously tuned controls. Low gains produce a slow response. A critically-damped control produces an aggressive response but settles down quickly. If the gains are too high, the system will oscillate. What does a surge avoidance system do most of the time? Hopefully, nothing! Then, with very little margin it must act aggressively, probably requiring gains higher than could be maintained stable, to protect the compressor. To avoid instability, the gains are reduced
Copyright© 2018 by Turbomachinery Laboratory, Texas A&M Engineering Experiment Station
to close the valve. Once surge has been avoided, the control system should bring the process back on line slowly and smoothly to avoid further upsets. The need for extremely high gains are driven by the following: Surge avoidance systems are normally built up out of commonly available process control plant components. As such, these components are designed for ruggedness, reliability, and low maintenance. In general, they are not focused on speed of data acquisition. Information about changing process conditions is often 1/10 of a second old. As will be seen, in later sections significant advances in surge control valve action have been made recently. However, the response of the valve is typically the dominant lag in the system.
Error Signal
Gain TooLow
CriticalDamping
Gain TooHigh
High andLow Gains
Too Slow
Optimum
Too Fast - Unstable
Smooth Response
Figure 6. Reaction of a Control System to an Error Signal
INSTRUMENTATION To avoid surge, the control needs to know where the compressor is operating in relation to surge in real time. Again, how close the protection margin can be placed to surge depends on how accurately and how quickly the change in flow is reported to the control. Correctly selected instrumentation is essential. The system must have accurate measurements of the suction and discharge pressures and temperatures, and the rate of flow. Flow is the most important parameter as it will move the fastest and farthest as the surge limit is approached. Ideally, the flow transmitter should be an order of magnitude faster than the process. Unfortunately, compared to pressure and temperature transmitters, flow transmitters tend to be slow. Even the best surge avoidance control will allow a compressor to surge, if it is connected to a slow transmitter. Flow-Measuring Devices Most commercially available flow-measuring devices are accurate enough for surge avoidance; however, it is the transmitter that slows things down. A differential pressure transmitter’s response time is inversely proportional to its range; thus, the stronger the signal, the faster the response. Devices that develop high DP signals are desirable. Those with low signal levels tend to have low signal-to-noise ratios. Transmitters for low DP signal ranges typically have slow response times. It is preferable to place the flow-measuring device on the suction side of the compressor. Typically, variations in pressures, temperatures and turbulence of the gas are less upstream of the compressor. Also, the device must be inside the recycle loop (see Figure 4). At a minimum, failure of the device will cause the compressor set to be shut down until the device can be replaced. If the failure results in pieces being ingested by the compressor, it can cause an expensive overhaul. For this reason, devices that are cantilevered into the gas stream are not recommended. Low cost flow-measuring devices do not always result in cost savings in the long run. Low Permanent Pressure Loss (PPL) devices are often recommended; however, their benefits may be marginal. The lost power cost
Copyright© 2018 by Turbomachinery Laboratory, Texas A&M Engineering Experiment Station
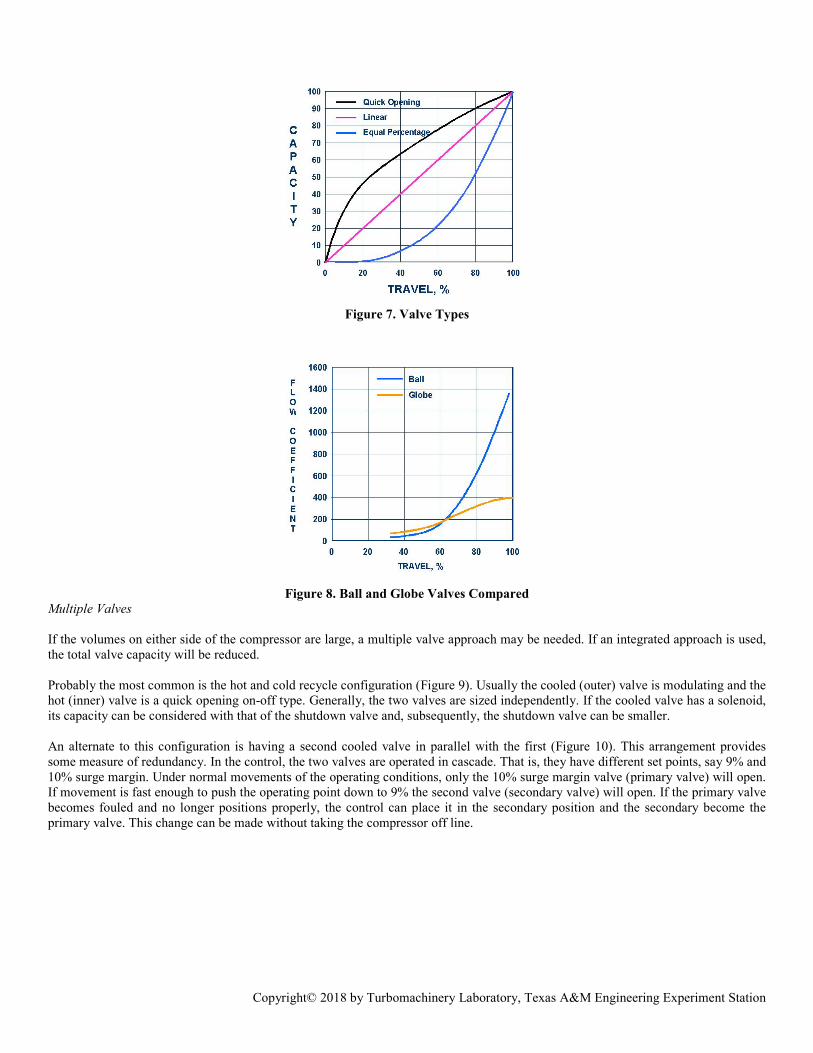
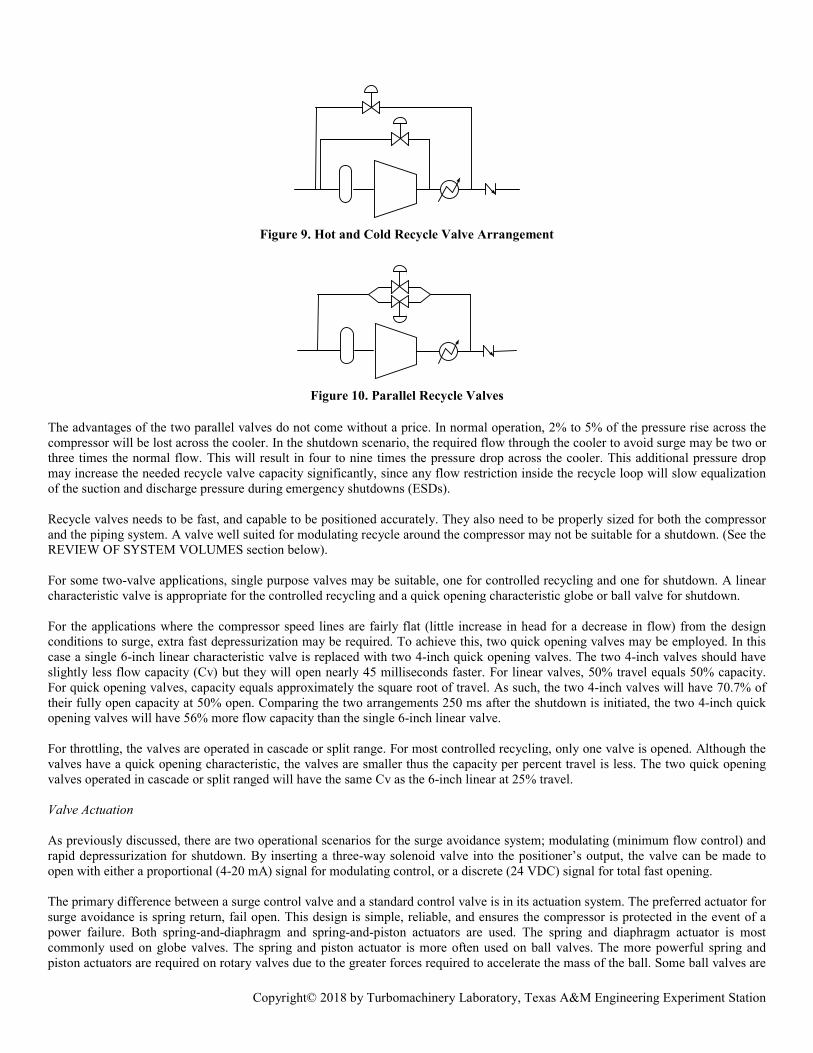
impact of operating a device can be calculated. For example, a flow meter developing a 100-inch H2O signal and a 50% PPL flowing 100 MMSCFD (50 lbm/sec) is equivalent to about 20 hp. As noted, strong signal devices are highly preferred. Pitot types (Annubars & Verabars) have a relatively low signal level, around 25 inches H2O. In the middle are orifices and venturis with a moderate signal of around 100 inches H2O. Compressor suction-to-eye provides a strong signal, around 700 inches” H2O) with the added benefit of not causing any additional pressure loss. Suction-to-Eye Flow Measuring Suction-to-eye uses the inlet shroud or inlet volute of the compressor as a flow-measuring device. This feature is now available on many compressors. The design requirements for the inlet volute and the flow measuring device have several things in common. Performance of the first stage impeller and the device is dependent on the uniform direction and velocity of the flow presented to it. Critical to the operation of suction-to-eye flow measurement is the placement of the eye port. As the impeller approaches surge an area of recirculation begins to develop at the outer perimeter of the inlet to the impeller. If the eye port is placed too close to the impeller’s outer perimeter, the relationship of the DP to flow will be affected. Fortunately, the meter factor (C’) typically remains nearly the same for the same surge margin (independent of flow). Hence, selecting the meter factor at the desired surge protection margin will contribute to effective surge avoidance. In a typical pipeline application (600 psi suction pressure) suction-to-eye will develop 25 psid (692 inches H2O). This is nearly seven times the differential of an orifice plate. Typically, the signal-to-noise ratio is low and there is no additional permanent pressure loss. For surge avoidance, the suction-to-eye method is strongly recommended. Since upstream piping can affect flow distributions in the compressor inlet, the suction-to-eye flow measurement should be verified once in the field. Compressor Instrumentation Optimal performance of any control system is dependent on the speed, accuracy, and resolution of the instrumented process conditions. To achieve optimal performance, the instruments should have performance specifications in an order of magnitude better than the requirements for the system. Typical gas compressor systems have a first-time constant of about 1 second; hence, no instrument should have a first-time constant of greater than 100 ms. The surge control system is expected to discriminate between single-digit percentages of surge margin; hence, measurement of the process parameters should be accurate to 0.1%. The final control elements (recycle valves) probably can resolve 1% changes in their command signals; hence, the process variables should be resolved to at least 0.1% (10 bits) of their normal operating range. Over-ranging transmitters degrades resolution. THE SURGE CONTROL VALVE Characteristics Earlier it was discussed how the control should react differently to gradual and rapid approaches to surge. Likewise, the valve must address these two very different requirements. For the gradual approach, it should behave like a small valve and produce smooth throttling. For the rapid approach case, it should act like a large fast valve to handle sudden major changes. There are three general valve characteristics (Figure 7): quick opening, where most of the valve’s capacity is reached early in its travel; linear, where capacity is equal to travel; and equal percentage, where most of the capacity is made available towards the end of the valve’s travel. All three types of valves have been used in various configurations as recycle valves. Equal percentage valves, and in particular noise-attenuating ball valves, are recommended for surge avoidance systems with a single surge control valve. They perform like smaller valves when nearly closed and larger valves when close to fully open. Figure 8 is a comparison of two types of equal percentage valve. For a given valve size, the noise-attenuating ball valve is often twice the cost of the globe valve, but it provides approximately three times the Flow Coefficient (Cv) or capacity. Also, it is more reliable as it is less susceptible to fouling and improper maintenance. Employing a valve with an equal percentage characteristic may provide the capacity needed to avoid surge during a shutdown while maintaining enough resolution at less than 50% capacity to provide good control at partial recycle. With an equal percentage characteristic, the valve typically has greater resolution than a single linear valve selected to fit the compressor.
Copyright© 2018 by Turbomachinery Laboratory, Texas A&M Engineering Experiment Station
Figure 7. Valve Types
Figure 8. Ball and Globe Valves Compared
Multiple Valves If the volumes on either side of the compressor are large, a multiple valve approach may be needed. If an integrated approach is used, the total valve capacity will be reduced. Probably the most common is the hot and cold recycle configuration (Figure 9). Usually the cooled (outer) valve is modulating and the hot (inner) valve is a quick opening on-off type. Generally, the two valves are sized independently. If the cooled valve has a solenoid, its capacity can be considered with that of the shutdown valve and, subsequently, the shutdown valve can be smaller. An alternate to this configuration is having a second cooled valve in parallel with the first (Figure 10). This arrangement provides some measure of redundancy. In the control, the two valves are operated in cascade. That is, they have different set points, say 9% and 10% surge margin. Under normal movements of the operating conditions, only the 10% surge margin valve (primary valve) will open. If movement is fast enough to push the operating point down to 9% the second valve (secondary valve) will open. If the primary valve becomes fouled and no longer positions properly, the control can place it in the secondary position and the secondary become the primary valve. This change can be made without taking the compressor off line.
Copyright© 2018 by Turbomachinery Laboratory, Texas A&M Engineering Experiment Station
Figure 9. Hot and Cold Recycle Valve Arrangement
Figure 10. Parallel Recycle Valves
The advantages of the two parallel valves do not come without a price. In normal operation, 2% to 5% of the pressure rise across the compressor will be lost across the cooler. In the shutdown scenario, the required flow through the cooler to avoid surge may be two or three times the normal flow. This will result in four to nine times the pressure drop across the cooler. This additional pressure drop may increase the needed recycle valve capacity significantly, since any flow restriction inside the recycle loop will slow equalization of the suction and discharge pressure during emergency shutdowns (ESDs). Recycle valves needs to be fast, and capable to be positioned accurately. They also need to be properly sized for both the compressor and the piping system. A valve well suited for modulating recycle around the compressor may not be suitable for a shutdown. (See the REVIEW OF SYSTEM VOLUMES section below). For some two-valve applications, single purpose valves may be suitable, one for controlled recycling and one for shutdown. A linear characteristic valve is appropriate for the controlled recycling and a quick opening characteristic globe or ball valve for shutdown. For the applications where the compressor speed lines are fairly flat (little increase in head for a decrease in flow) from the design conditions to surge, extra fast depressurization may be required. To achieve this, two quick opening valves may be employed. In this case a single 6-inch linear characteristic valve is replaced with two 4-inch quick opening valves. The two 4-inch valves should have slightly less flow capacity (Cv) but they will open nearly 45 milliseconds faster. For linear valves, 50% travel equals 50% capacity. For quick opening valves, capacity equals approximately the square root of travel. As such, the two 4-inch valves will have 70.7% of their fully open capacity at 50% open. Comparing the two arrangements 250 ms after the shutdown is initiated, the two 4-inch quick opening valves will have 56% more flow capacity than the single 6-inch linear valve. For throttling, the valves are operated in cascade or split range. For most controlled recycling, only one valve is opened. Although the valves have a quick opening characteristic, the valves are smaller thus the capacity per percent travel is less. The two quick opening valves operated in cascade or split ranged will have the same Cv as the 6-inch linear at 25% travel. Valve Actuation As previously discussed, there are two operational scenarios for the surge avoidance system; modulating (minimum flow control) and rapid depressurization for shutdown. By inserting a three-way solenoid valve into the positioner’s output, the valve can be made to open with either a proportional (4-20 mA) signal for modulating control, or a discrete (24 VDC) signal for total fast opening. The primary difference between a surge control valve and a standard control valve is in its actuation system. The preferred actuator for surge avoidance is spring return, fail open. This design is simple, reliable, and ensures the compressor is protected in the event of a power failure. Both spring-and-diaphragm and spring-and-piston actuators are used. The spring and diaphragm actuator is most commonly used on globe valves. The spring and piston actuator is more often used on ball valves. The more powerful spring and piston actuators are required on rotary valves due to the greater forces required to accelerate the mass of the ball. Some ball valves are
Copyright© 2018 by Turbomachinery Laboratory, Texas A&M Engineering Experiment Station
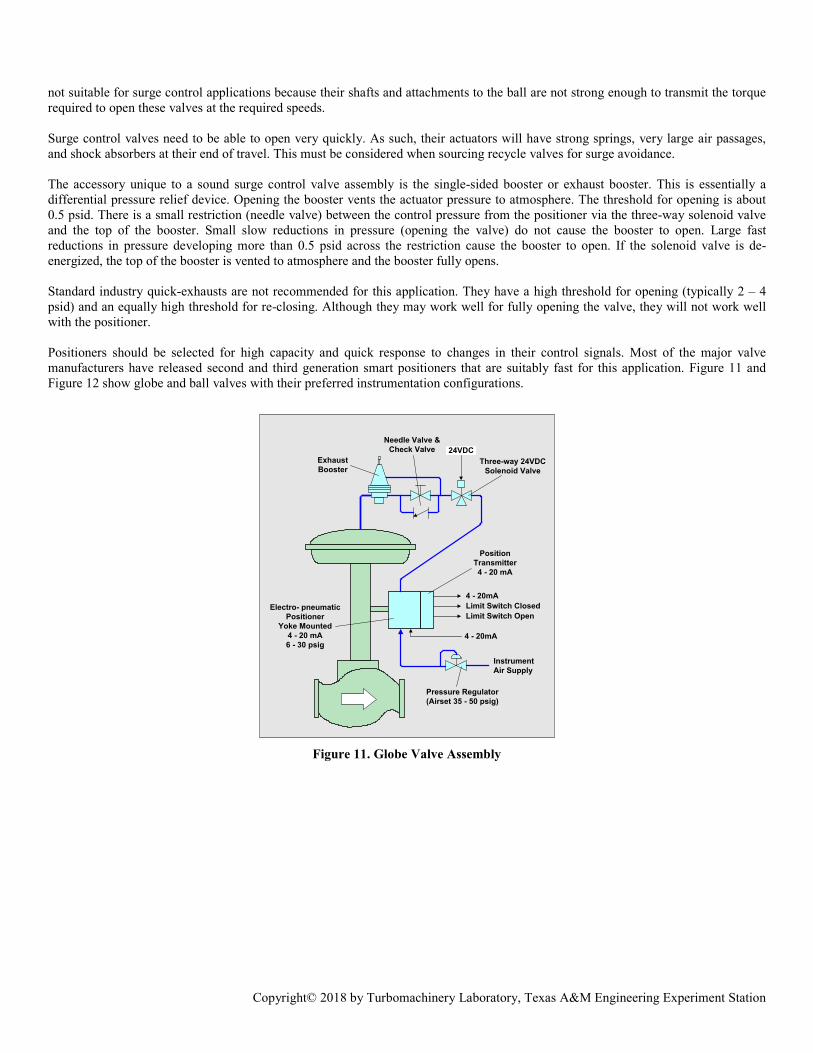
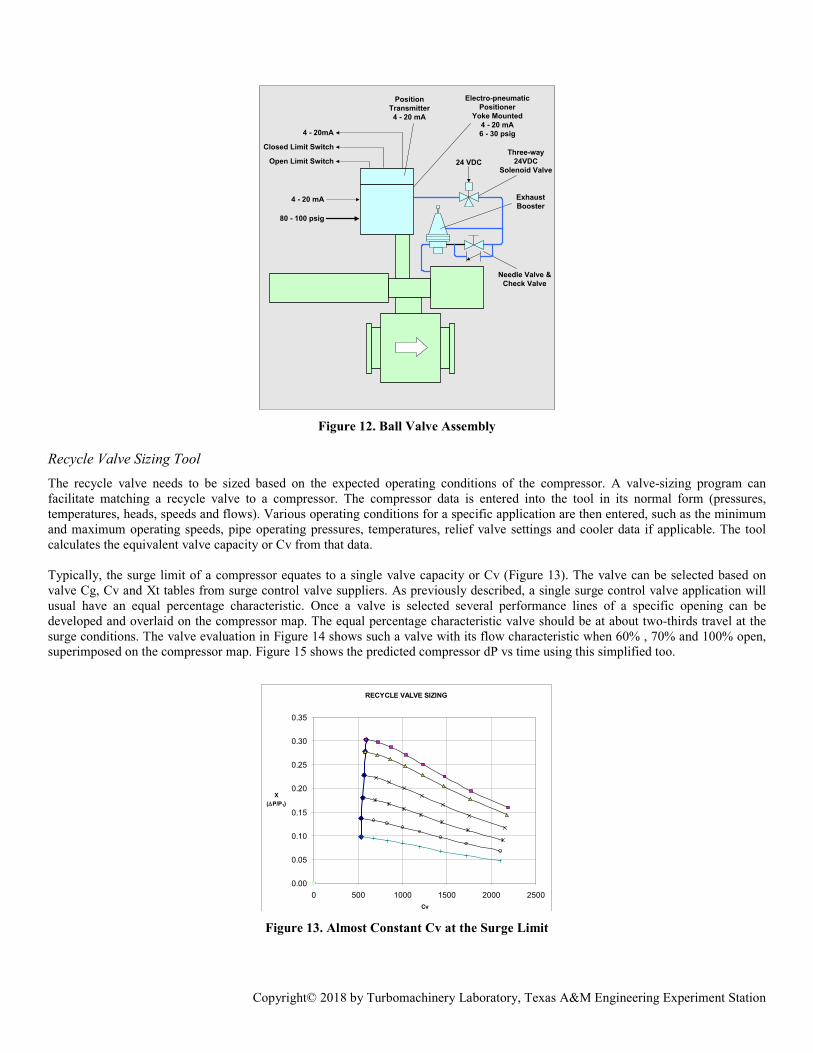
not suitable for surge control applications because their shafts and attachments to the ball are not strong enough to transmit the torque required to open these valves at the required speeds. Surge control valves need to be able to open very quickly. As such, their actuators will have strong springs, very large air passages, and shock absorbers at their end of travel. This must be considered when sourcing recycle valves for surge avoidance. The accessory unique to a sound surge control valve assembly is the single-sided booster or exhaust booster. This is essentially a differential pressure relief device. Opening the booster vents the actuator pressure to atmosphere. The threshold for opening is about 0.5 psid. There is a small restriction (needle valve) between the control pressure from the positioner via the three-way solenoid valve and the top of the booster. Small slow reductions in pressure (opening the valve) do not cause the booster to open. Large fast reductions in pressure developing more than 0.5 psid across the restriction cause the booster to open. If the solenoid valve is de-energized, the top of the booster is vented to atmosphere and the booster fully opens. Standard industry quick-exhausts are not recommended for this application. They have a high threshold for opening (typically 2 – 4 psid) and an equally high threshold for re-closing. Although they may work well for fully opening the valve, they will not work well with the positioner. Positioners should be selected for high capacity and quick response to changes in their control signals. Most of the major valve manufacturers have released second and third generation smart positioners that are suitably fast for this application. Figure 11 and Figure 12 show globe and ball valves with their preferred instrumentation configurations.
4 - 20mALimit Switch ClosedLimit Switch Open
24VDCExhaustBooster
Needle Valve &Check Valve
Three-way 24VDCSolenoid Valve
PositionTransmitter4 - 20 mA
Pressure Regulator(Airset 35 - 50 psig)
InstrumentAir Supply
Electro- pneumaticPositioner
Yoke Mounted4 - 20 mA6 - 30 psig
4 - 20mA
Figure 11. Globe Valve Assembly
Copyright© 2018 by Turbomachinery Laboratory, Texas A&M Engineering Experiment Station
4 - 20mA
Closed Limit Switch
Open Limit Switch
4 - 20 mA
80 - 100 psig
24 VDC
Electro-pneumaticPositioner
Yoke Mounted4 - 20 mA6 - 30 psig
PositionTransmitter4 - 20 mA
Three-way24VDC
Solenoid Valve
ExhaustBooster
Needle Valve &Check Valve
Figure 12. Ball Valve Assembly
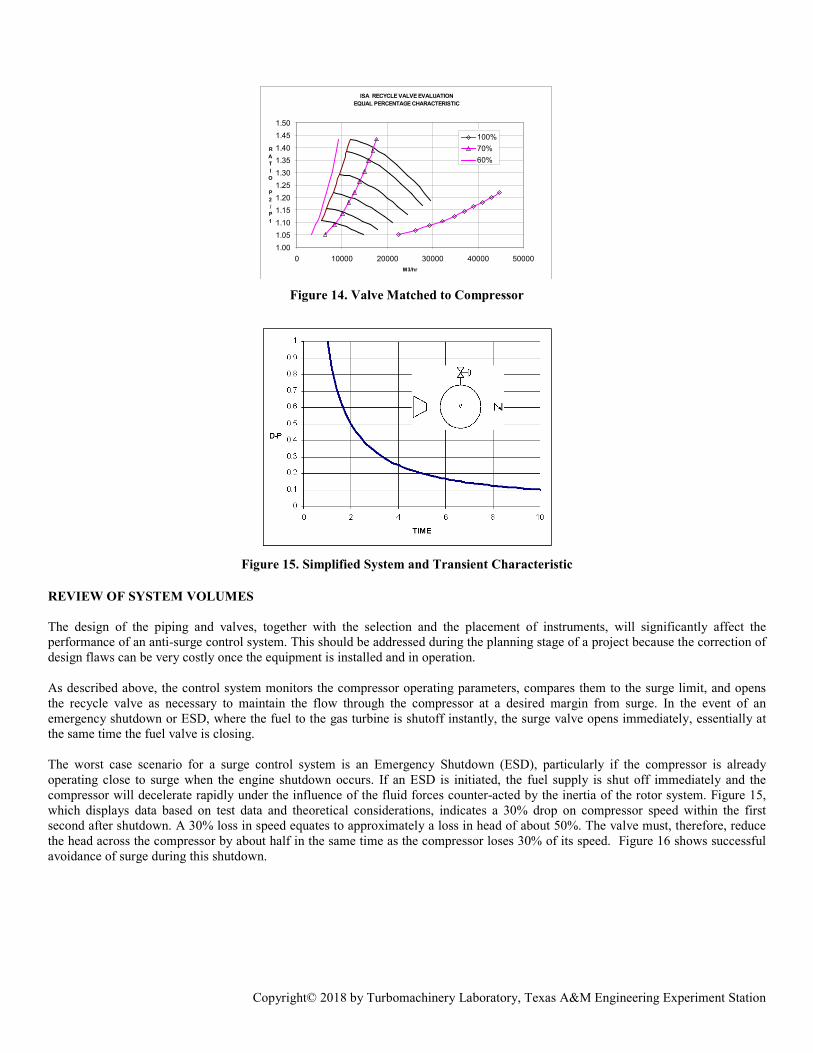
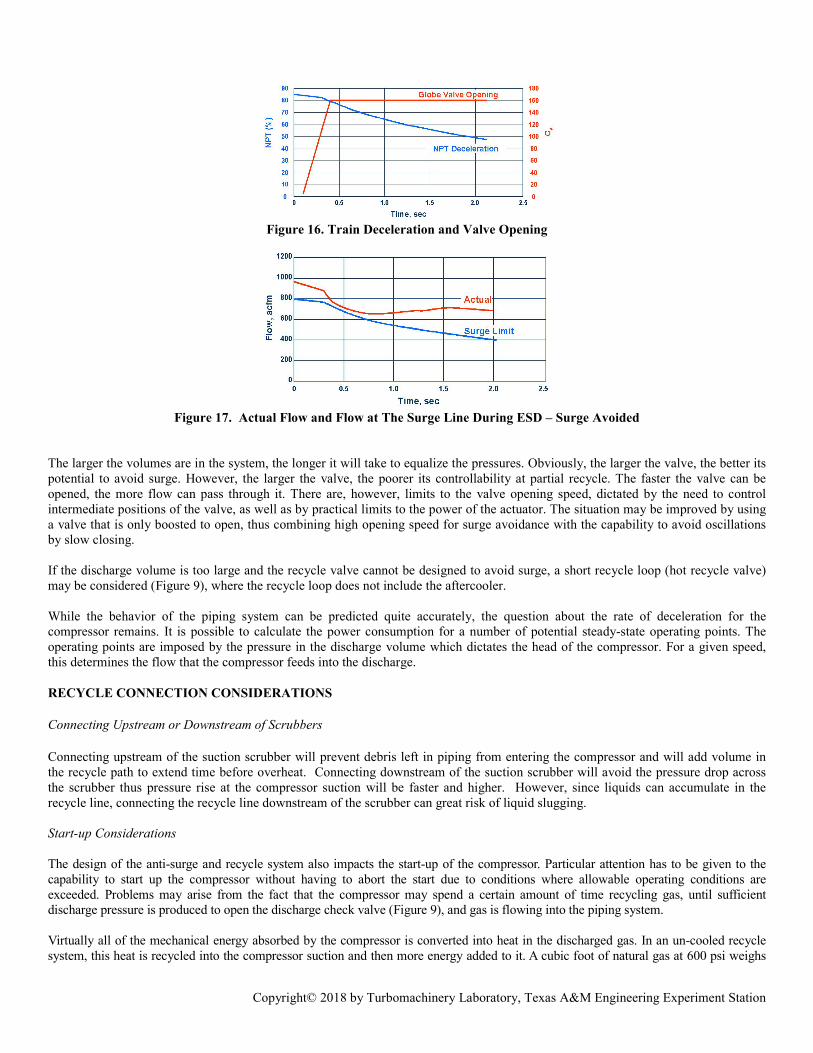
Recycle Valve Sizing Tool The recycle valve needs to be sized based on the expected operating conditions of the compressor. A valve-sizing program can facilitate matching a recycle valve to a compressor. The compressor data is entered into the tool in its normal form (pressures, temperatures, heads, speeds and flows). Various operating conditions for a specific application are then entered, such as the minimum and maximum operating speeds, pipe operating pressures, temperatures, relief valve settings and cooler data if applicable. The tool calculates the equivalent valve capacity or Cv from that data. Typically, the surge limit of a compressor equates to a single valve capacity or Cv (Figure 13). The valve can be selected based on valve Cg, Cv and Xt tables from surge control valve suppliers. As previously described, a single surge control valve application will usual have an equal percentage characteristic. Once a valve is selected several performance lines of a specific opening can be developed and overlaid on the compressor map. The equal percentage characteristic valve should be at about two-thirds travel at the surge conditions. The valve evaluation in Figure 14 shows such a valve with its flow characteristic when 60% , 70% and 100% open, superimposed on the compressor map. Figure 15 shows the predicted compressor dP vs time using this simplified too.
RECYCLE VALVE SIZING
0.00
0.05
0.10
0.15
0.20
0.25
0.30
0.35
0 500 1000 1500 2000 2500Cv
X(∆P/P1)
Figure 13. Almost Constant Cv at the Surge Limit
Copyright© 2018 by Turbomachinery Laboratory, Texas A&M Engineering Experiment Station
ISA RECYCLE VALVE EVALUATIONEQUAL PERCENTAGE CHARACTERISTIC
1.001.051.101.151.201.251.301.351.401.451.50
0 10000 20000 30000 40000 50000M3/hr
RATIO P2/P1
100%70%60%
Figure 14. Valve Matched to Compressor
Figure 15. Simplified System and Transient Characteristic
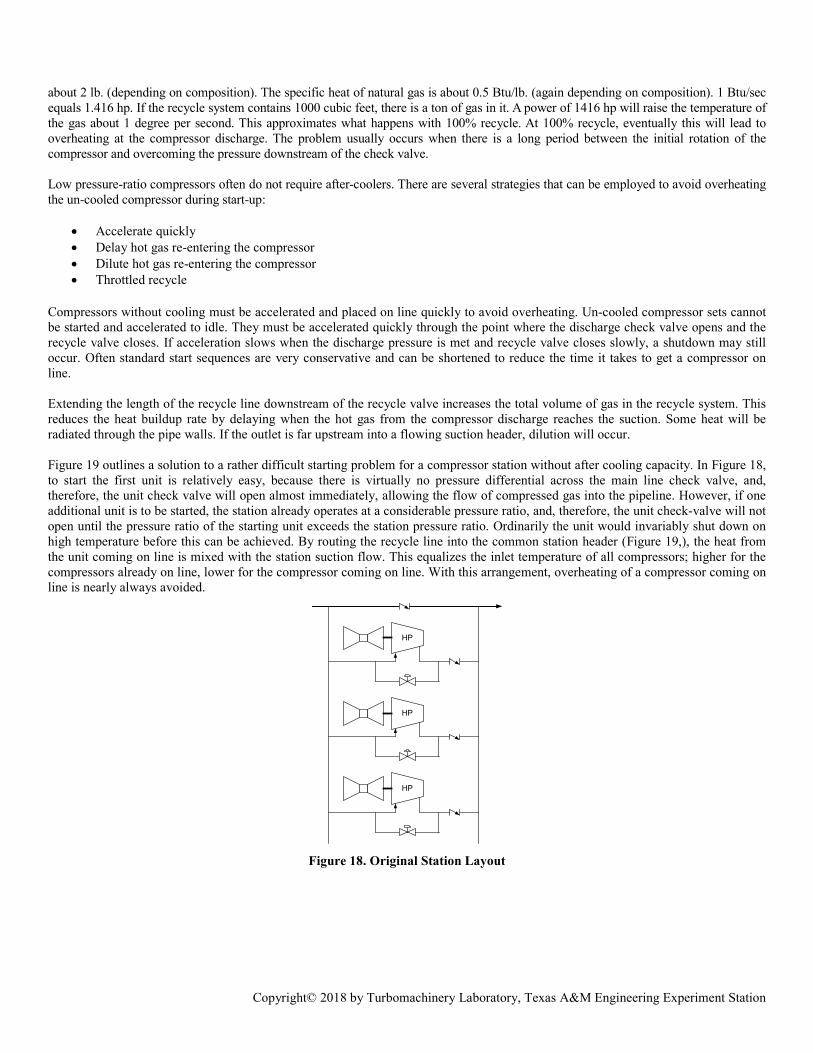
REVIEW OF SYSTEM VOLUMES The design of the piping and valves, together with the selection and the placement of instruments, will significantly affect the performance of an anti-surge control system. This should be addressed during the planning stage of a project because the correction of design flaws can be very costly once the equipment is installed and in operation. As described above, the control system monitors the compressor operating parameters, compares them to the surge limit, and opens the recycle valve as necessary to maintain the flow through the compressor at a desired margin from surge. In the event of an emergency shutdown or ESD, where the fuel to the gas turbine is shutoff instantly, the surge valve opens immediately, essentially at the same time the fuel valve is closing. The worst case scenario for a surge control system is an Emergency Shutdown (ESD), particularly if the compressor is already operating close to surge when the engine shutdown occurs. If an ESD is initiated, the fuel supply is shut off immediately and the compressor will decelerate rapidly under the influence of the fluid forces counter-acted by the inertia of the rotor system. Figure 15, which displays data based on test data and theoretical considerations, indicates a 30% drop on compressor speed within the first second after shutdown. A 30% loss in speed equates to approximately a loss in head of about 50%. The valve must, therefore, reduce the head across the compressor by about half in the same time as the compressor loses 30% of its speed. Figure 16 shows successful avoidance of surge during this shutdown.
Copyright© 2018 by Turbomachinery Laboratory, Texas A&M Engineering Experiment Station
Figure 16. Train Deceleration and Valve Opening
Figure 17. Actual Flow and Flow at The Surge Line During ESD – Surge Avoided
The larger the volumes are in the system, the longer it will take to equalize the pressures. Obviously, the larger the valve, the better its potential to avoid surge. However, the larger the valve, the poorer its controllability at partial recycle. The faster the valve can be opened, the more flow can pass through it. There are, however, limits to the valve opening speed, dictated by the need to control intermediate positions of the valve, as well as by practical limits to the power of the actuator. The situation may be improved by using a valve that is only boosted to open, thus combining high opening speed for surge avoidance with the capability to avoid oscillations by slow closing. If the discharge volume is too large and the recycle valve cannot be designed to avoid surge, a short recycle loop (hot recycle valve) may be considered (Figure 9), where the recycle loop does not include the aftercooler. While the behavior of the piping system can be predicted quite accurately, the question about the rate of deceleration for the compressor remains. It is possible to calculate the power consumption for a number of potential steady-state operating points. The operating points are imposed by the pressure in the discharge volume which dictates the head of the compressor. For a given speed, this determines the flow that the compressor feeds into the discharge. RECYCLE CONNECTION CONSIDERATIONS Connecting Upstream or Downstream of Scrubbers Connecting upstream of the suction scrubber will prevent debris left in piping from entering the compressor and will add volume in the recycle path to extend time before overheat. Connecting downstream of the suction scrubber will avoid the pressure drop across the scrubber thus pressure rise at the compressor suction will be faster and higher. However, since liquids can accumulate in the recycle line, connecting the recycle line downstream of the scrubber can great risk of liquid slugging. Start-up Considerations The design of the anti-surge and recycle system also impacts the start-up of the compressor. Particular attention has to be given to the capability to start up the compressor without having to abort the start due to conditions where allowable operating conditions are exceeded. Problems may arise from the fact that the compressor may spend a certain amount of time recycling gas, until sufficient discharge pressure is produced to open the discharge check valve (Figure 9), and gas is flowing into the piping system. Virtually all of the mechanical energy absorbed by the compressor is converted into heat in the discharged gas. In an un-cooled recycle system, this heat is recycled into the compressor suction and then more energy added to it. A cubic foot of natural gas at 600 psi weighs
Copyright© 2018 by Turbomachinery Laboratory, Texas A&M Engineering Experiment Station
about 2 lb. (depending on composition). The specific heat of natural gas is about 0.5 Btu/lb. (again depending on composition). 1 Btu/sec equals 1.416 hp. If the recycle system contains 1000 cubic feet, there is a ton of gas in it. A power of 1416 hp will raise the temperature of the gas about 1 degree per second. This approximates what happens with 100% recycle. At 100% recycle, eventually this will lead to overheating at the compressor discharge. The problem usually occurs when there is a long period between the initial rotation of the compressor and overcoming the pressure downstream of the check valve. Low pressure-ratio compressors often do not require after-coolers. There are several strategies that can be employed to avoid overheating the un-cooled compressor during start-up:
• Accelerate quickly • Delay hot gas re-entering the compressor • Dilute hot gas re-entering the compressor • Throttled recycle
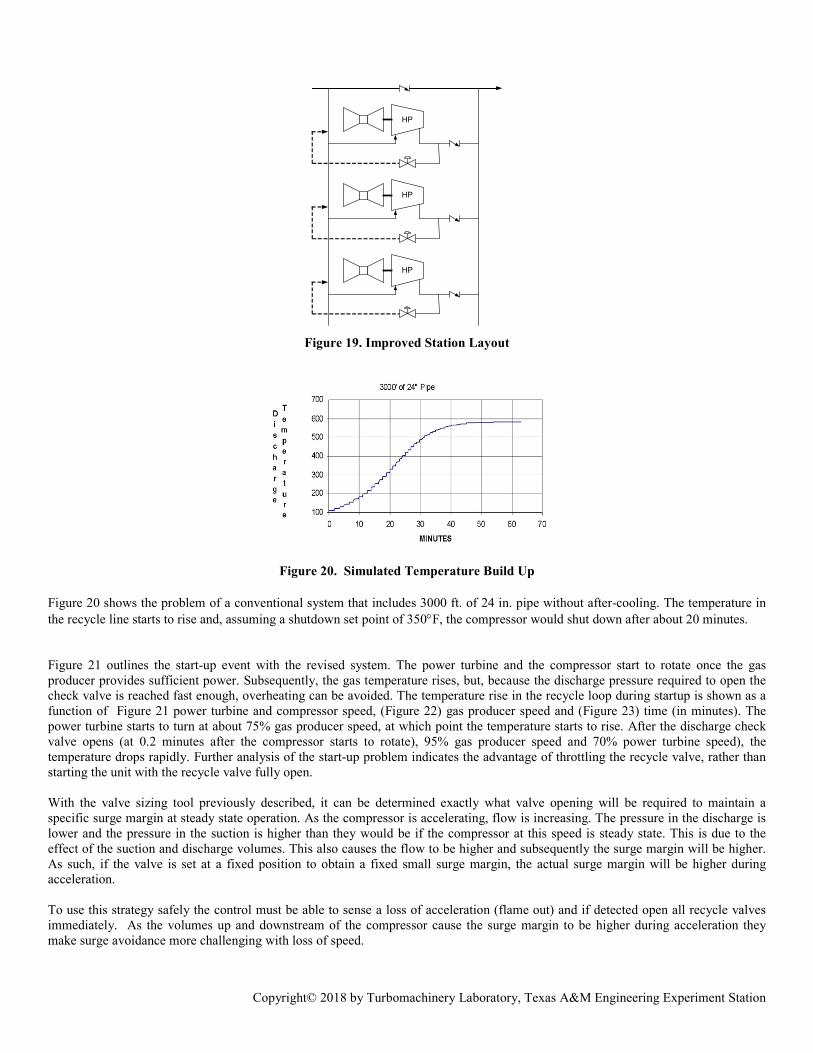
Compressors without cooling must be accelerated and placed on line quickly to avoid overheating. Un-cooled compressor sets cannot be started and accelerated to idle. They must be accelerated quickly through the point where the discharge check valve opens and the recycle valve closes. If acceleration slows when the discharge pressure is met and recycle valve closes slowly, a shutdown may still occur. Often standard start sequences are very conservative and can be shortened to reduce the time it takes to get a compressor on line. Extending the length of the recycle line downstream of the recycle valve increases the total volume of gas in the recycle system. This reduces the heat buildup rate by delaying when the hot gas from the compressor discharge reaches the suction. Some heat will be radiated through the pipe walls. If the outlet is far upstream into a flowing suction header, dilution will occur. Figure 19 outlines a solution to a rather difficult starting problem for a compressor station without after cooling capacity. In Figure 18, to start the first unit is relatively easy, because there is virtually no pressure differential across the main line check valve, and, therefore, the unit check valve will open almost immediately, allowing the flow of compressed gas into the pipeline. However, if one additional unit is to be started, the station already operates at a considerable pressure ratio, and, therefore, the unit check-valve will not open until the pressure ratio of the starting unit exceeds the station pressure ratio. Ordinarily the unit would invariably shut down on high temperature before this can be achieved. By routing the recycle line into the common station header (Figure 19,), the heat from the unit coming on line is mixed with the station suction flow. This equalizes the inlet temperature of all compressors; higher for the compressors already on line, lower for the compressor coming on line. With this arrangement, overheating of a compressor coming on line is nearly always avoided.
HP
HP
HP
Figure 18. Original Station Layout
Copyright© 2018 by Turbomachinery Laboratory, Texas A&M Engineering Experiment Station
HP
HP
HP
Figure 19. Improved Station Layout
Figure 20. Simulated Temperature Build Up
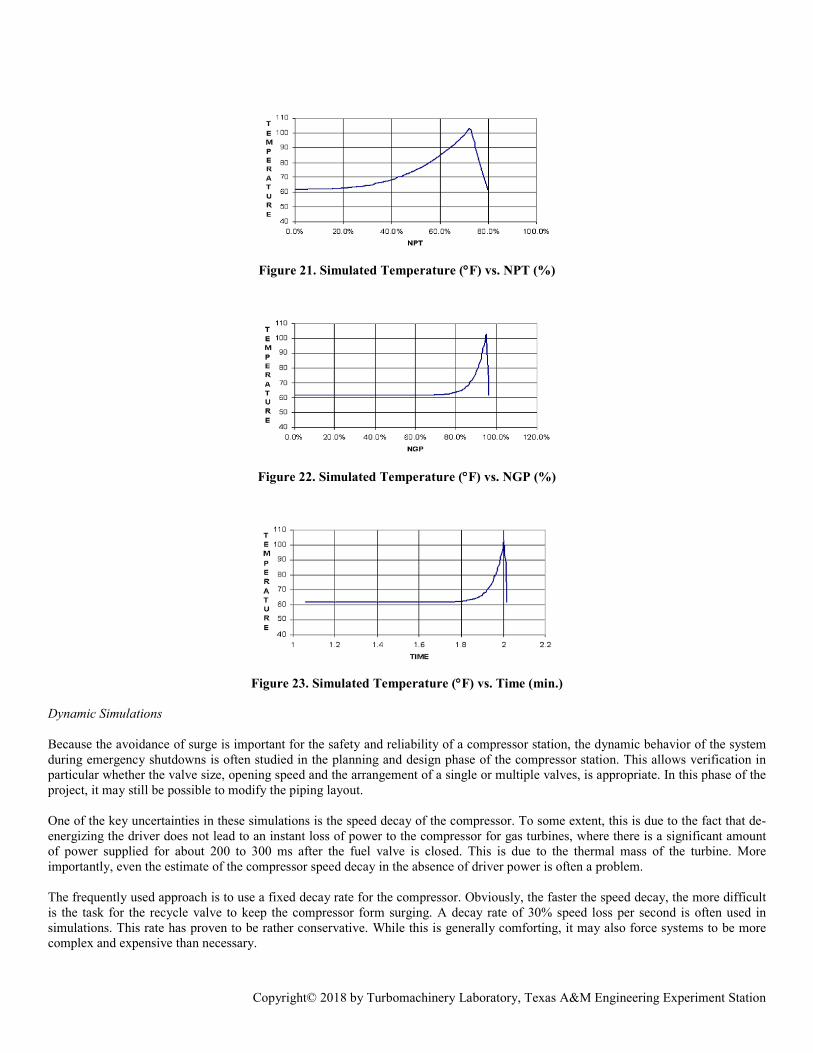
Figure 20 shows the problem of a conventional system that includes 3000 ft. of 24 in. pipe without after-cooling. The temperature in the recycle line starts to rise and, assuming a shutdown set point of 350°F, the compressor would shut down after about 20 minutes. Figure 21 outlines the start-up event with the revised system. The power turbine and the compressor start to rotate once the gas producer provides sufficient power. Subsequently, the gas temperature rises, but, because the discharge pressure required to open the check valve is reached fast enough, overheating can be avoided. The temperature rise in the recycle loop during startup is shown as a function of Figure 21 power turbine and compressor speed, (Figure 22) gas producer speed and (Figure 23) time (in minutes). The power turbine starts to turn at about 75% gas producer speed, at which point the temperature starts to rise. After the discharge check valve opens (at 0.2 minutes after the compressor starts to rotate), 95% gas producer speed and 70% power turbine speed), the temperature drops rapidly. Further analysis of the start-up problem indicates the advantage of throttling the recycle valve, rather than starting the unit with the recycle valve fully open. With the valve sizing tool previously described, it can be determined exactly what valve opening will be required to maintain a specific surge margin at steady state operation. As the compressor is accelerating, flow is increasing. The pressure in the discharge is lower and the pressure in the suction is higher than they would be if the compressor at this speed is steady state. This is due to the effect of the suction and discharge volumes. This also causes the flow to be higher and subsequently the surge margin will be higher. As such, if the valve is set at a fixed position to obtain a fixed small surge margin, the actual surge margin will be higher during acceleration. To use this strategy safely the control must be able to sense a loss of acceleration (flame out) and if detected open all recycle valves immediately. As the volumes up and downstream of the compressor cause the surge margin to be higher during acceleration they make surge avoidance more challenging with loss of speed.
Copyright© 2018 by Turbomachinery Laboratory, Texas A&M Engineering Experiment Station
Figure 21. Simulated Temperature (°F) vs. NPT (%)
Figure 22. Simulated Temperature (°F) vs. NGP (%)
Figure 23. Simulated Temperature (°F) vs. Time (min.)
Dynamic Simulations Because the avoidance of surge is important for the safety and reliability of a compressor station, the dynamic behavior of the system during emergency shutdowns is often studied in the planning and design phase of the compressor station. This allows verification in particular whether the valve size, opening speed and the arrangement of a single or multiple valves, is appropriate. In this phase of the project, it may still be possible to modify the piping layout. One of the key uncertainties in these simulations is the speed decay of the compressor. To some extent, this is due to the fact that de-energizing the driver does not lead to an instant loss of power to the compressor for gas turbines, where there is a significant amount of power supplied for about 200 to 300 ms after the fuel valve is closed. This is due to the thermal mass of the turbine. More importantly, even the estimate of the compressor speed decay in the absence of driver power is often a problem. The frequently used approach is to use a fixed decay rate for the compressor. Obviously, the faster the speed decay, the more difficult is the task for the recycle valve to keep the compressor form surging. A decay rate of 30% speed loss per second is often used in simulations. This rate has proven to be rather conservative. While this is generally comforting, it may also force systems to be more complex and expensive than necessary.
Copyright© 2018 by Turbomachinery Laboratory, Texas A&M Engineering Experiment Station
Another issue that also should be considered comes from the assumption of the compressor operating point at the moment of the initiation of shutdown. If that point is close to the surge line, the system has to react very fast to avoid surge (Moore et al, 2009). It is thus important to select the starting points for the study so that they reflect realistic, actually achievable operating conditions. The governing equations consider the following:
• Mass conservation in the piping system • Torque balance of the rotor system • Friction losses in the piping • Wave propagation in the pipe • Flow through the valve (based on the instantaneous valve flow area, and the pressure ratio over the valve)
Regarding speed decay, the situation during rundown is as follows: The inertia of the rotor keeps the rotor running, while the power the impeller transfers to the gas slows the compressor down. In other words, (Kurz and White, 2004):
( )dtdNNJNTP ⋅⋅⋅−=⋅⋅= 222 ππ Equation 4
, where T is torque, N is speed, and J is rotational inertia. If the rundown would follow through operating points along the fan law, then P=K N3, which would lead to a rundown behavior of:
( ) ( )( )
∫ ∫=
−
−−−=→+=→=
02
22
2
2
12
1)(22
tNt
JktNcdt
JkdNNN
Jk
dtdN
πππ
Equation 5
The time constant (dN/dt(t=0)) for the rundown event is proportional to K N2(t=0)/J. However, the higher the surge margin is at the moment of the trip, the more head increase can be achieved by the compressor at constant speed. Dimensional analysis suggests a parameter K related to deceleration (Moore et al., 2009):
3)2( NJ
PKπ
= Equation 6
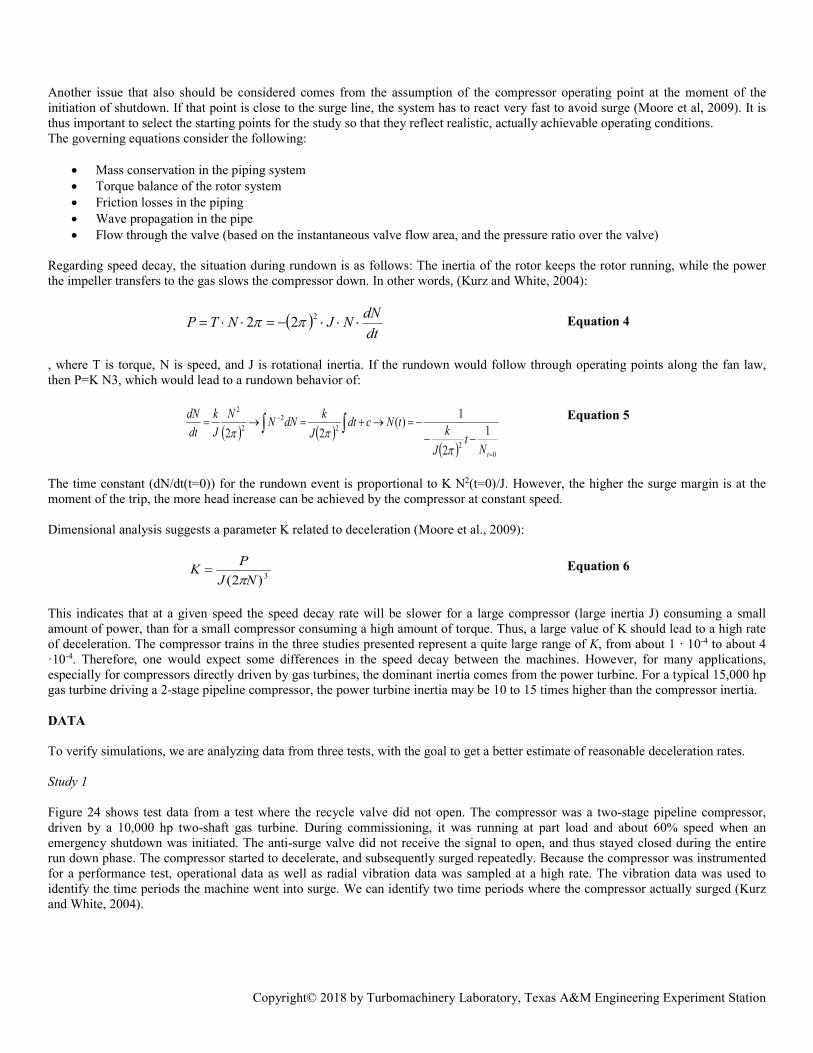
This indicates that at a given speed the speed decay rate will be slower for a large compressor (large inertia J) consuming a small amount of power, than for a small compressor consuming a high amount of torque. Thus, a large value of K should lead to a high rate of deceleration. The compressor trains in the three studies presented represent a quite large range of K, from about 1 · 10-4 to about 4 ·10-4. Therefore, one would expect some differences in the speed decay between the machines. However, for many applications, especially for compressors directly driven by gas turbines, the dominant inertia comes from the power turbine. For a typical 15,000 hp gas turbine driving a 2-stage pipeline compressor, the power turbine inertia may be 10 to 15 times higher than the compressor inertia. DATA To verify simulations, we are analyzing data from three tests, with the goal to get a better estimate of reasonable deceleration rates. Study 1 Figure 24 shows test data from a test where the recycle valve did not open. The compressor was a two-stage pipeline compressor, driven by a 10,000 hp two-shaft gas turbine. During commissioning, it was running at part load and about 60% speed when an emergency shutdown was initiated. The anti-surge valve did not receive the signal to open, and thus stayed closed during the entire run down phase. The compressor started to decelerate, and subsequently surged repeatedly. Because the compressor was instrumented for a performance test, operational data as well as radial vibration data was sampled at a high rate. The vibration data was used to identify the time periods the machine went into surge. We can identify two time periods where the compressor actually surged (Kurz and White, 2004).
Copyright© 2018 by Turbomachinery Laboratory, Texas A&M Engineering Experiment Station
Figure 24. Emergency shutdown against closed recycle valve – Test data versus simulation with complete model. Time spans in
surge based on vibration data from test (Kurz and White, 2004).
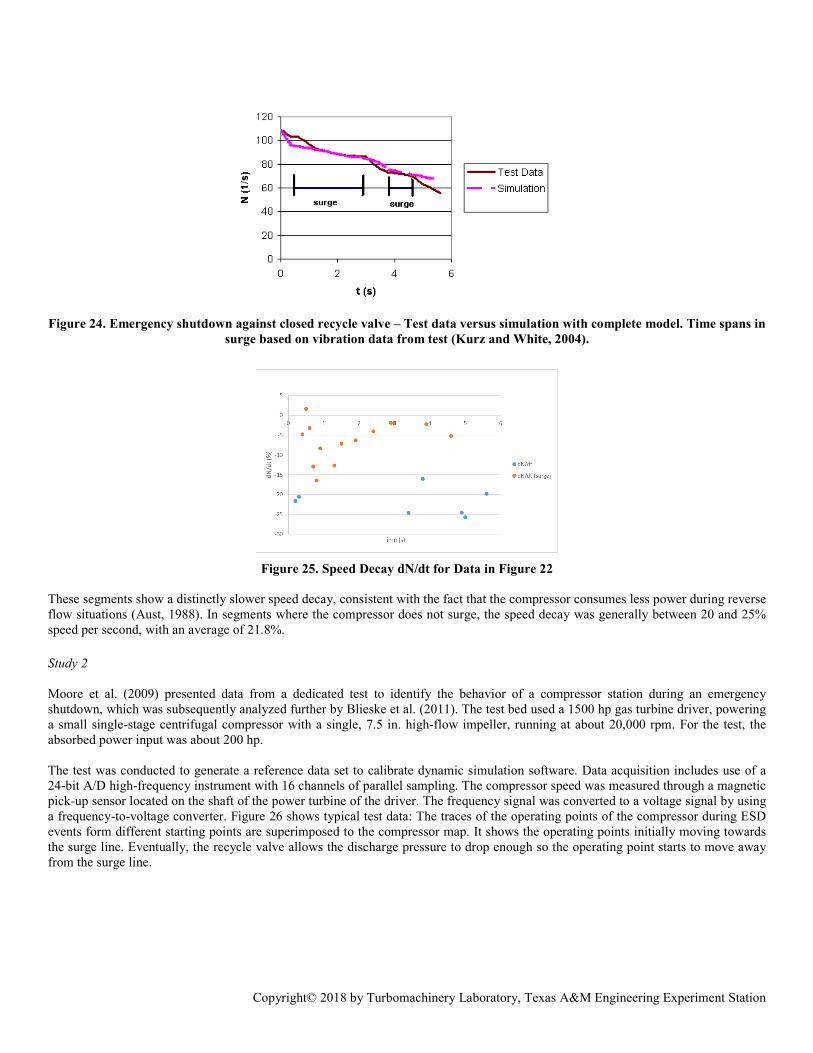
Figure 25. Speed Decay dN/dt for Data in Figure 22
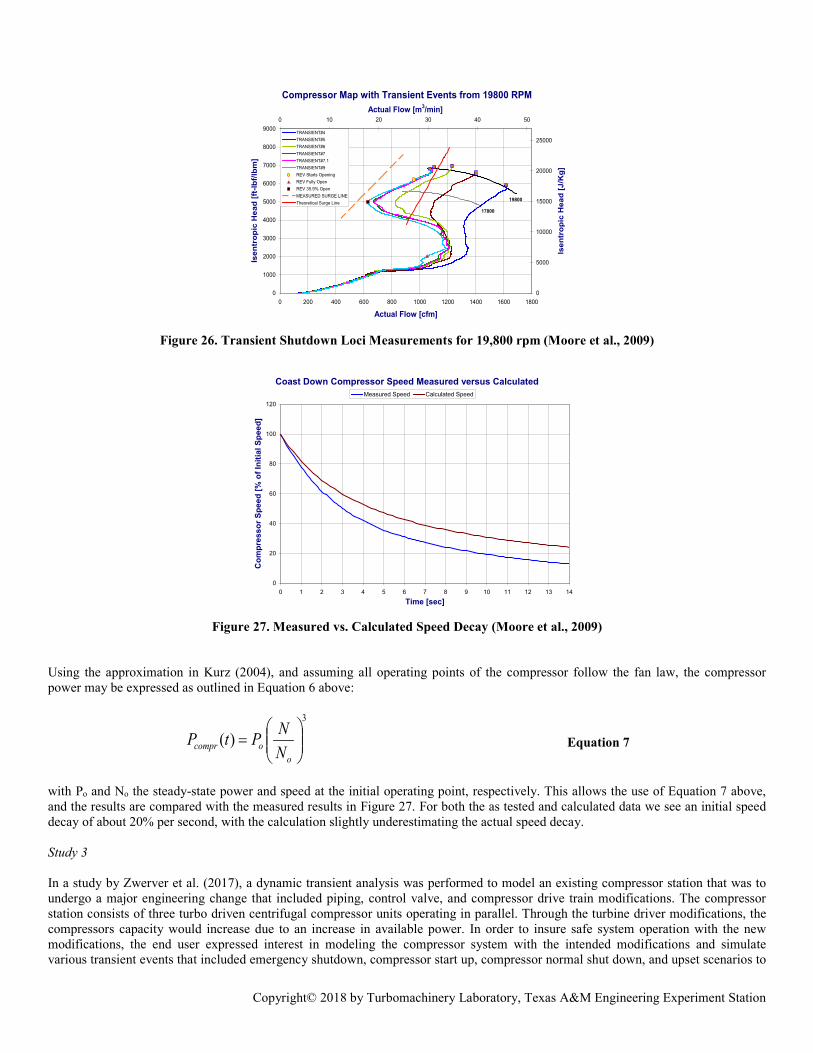
These segments show a distinctly slower speed decay, consistent with the fact that the compressor consumes less power during reverse flow situations (Aust, 1988). In segments where the compressor does not surge, the speed decay was generally between 20 and 25% speed per second, with an average of 21.8%. Study 2 Moore et al. (2009) presented data from a dedicated test to identify the behavior of a compressor station during an emergency shutdown, which was subsequently analyzed further by Blieske et al. (2011). The test bed used a 1500 hp gas turbine driver, powering a small single-stage centrifugal compressor with a single, 7.5 in. high-flow impeller, running at about 20,000 rpm. For the test, the absorbed power input was about 200 hp. The test was conducted to generate a reference data set to calibrate dynamic simulation software. Data acquisition includes use of a 24-bit A/D high-frequency instrument with 16 channels of parallel sampling. The compressor speed was measured through a magnetic pick-up sensor located on the shaft of the power turbine of the driver. The frequency signal was converted to a voltage signal by using a frequency-to-voltage converter. Figure 26 shows typical test data: The traces of the operating points of the compressor during ESD events form different starting points are superimposed to the compressor map. It shows the operating points initially moving towards the surge line. Eventually, the recycle valve allows the discharge pressure to drop enough so the operating point starts to move away from the surge line.
Copyright© 2018 by Turbomachinery Laboratory, Texas A&M Engineering Experiment Station
Compressor Map with Transient Events from 19800 RPM
0
1000
2000
3000
4000
5000
6000
7000
8000
9000
0 200 400 600 800 1000 1200 1400 1600 1800
Actual Flow [cfm]
Isen
trop
ic H
ead
[ft-lb
f/lbm
]
0
5000
10000
15000
20000
25000
0 10 20 30 40 50Actual Flow [m3/min]
Isen
trop
ic H
ead
[J/K
g]
TRANSIENT#4TRANSIENT#5TRANSIENT#6TRANSIENT#7TRANSIENT#7.1TRANSIENT#9REV Starts OpeningREV Fully OpenREV 35.9% OpenMEASURED SURGE LINETheoretical Surge Line 19800
17800
Figure 26. Transient Shutdown Loci Measurements for 19,800 rpm (Moore et al., 2009)
Coast Down Compressor Speed Measured versus Calculated
0
20
40
60
80
100
120
0 1 2 3 4 5 6 7 8 9 10 11 12 13 14Time [sec]
Com
pres
sor S
peed
[% o
f Ini
tial S
peed
]
Measured Speed Calculated Speed
Figure 27. Measured vs. Calculated Speed Decay (Moore et al., 2009)
Using the approximation in Kurz (2004), and assuming all operating points of the compressor follow the fan law, the compressor power may be expressed as outlined in Equation 6 above:
3
)(
=
oocompr N
NPtP Equation 7
with Po and No the steady-state power and speed at the initial operating point, respectively. This allows the use of Equation 7 above, and the results are compared with the measured results in Figure 27. For both the as tested and calculated data we see an initial speed decay of about 20% per second, with the calculation slightly underestimating the actual speed decay. Study 3 In a study by Zwerver et al. (2017), a dynamic transient analysis was performed to model an existing compressor station that was to undergo a major engineering change that included piping, control valve, and compressor drive train modifications. The compressor station consists of three turbo driven centrifugal compressor units operating in parallel. Through the turbine driver modifications, the compressors capacity would increase due to an increase in available power. In order to insure safe system operation with the new modifications, the end user expressed interest in modeling the compressor system with the intended modifications and simulate various transient events that included emergency shutdown, compressor start up, compressor normal shut down, and upset scenarios to
Copyright© 2018 by Turbomachinery Laboratory, Texas A&M Engineering Experiment Station
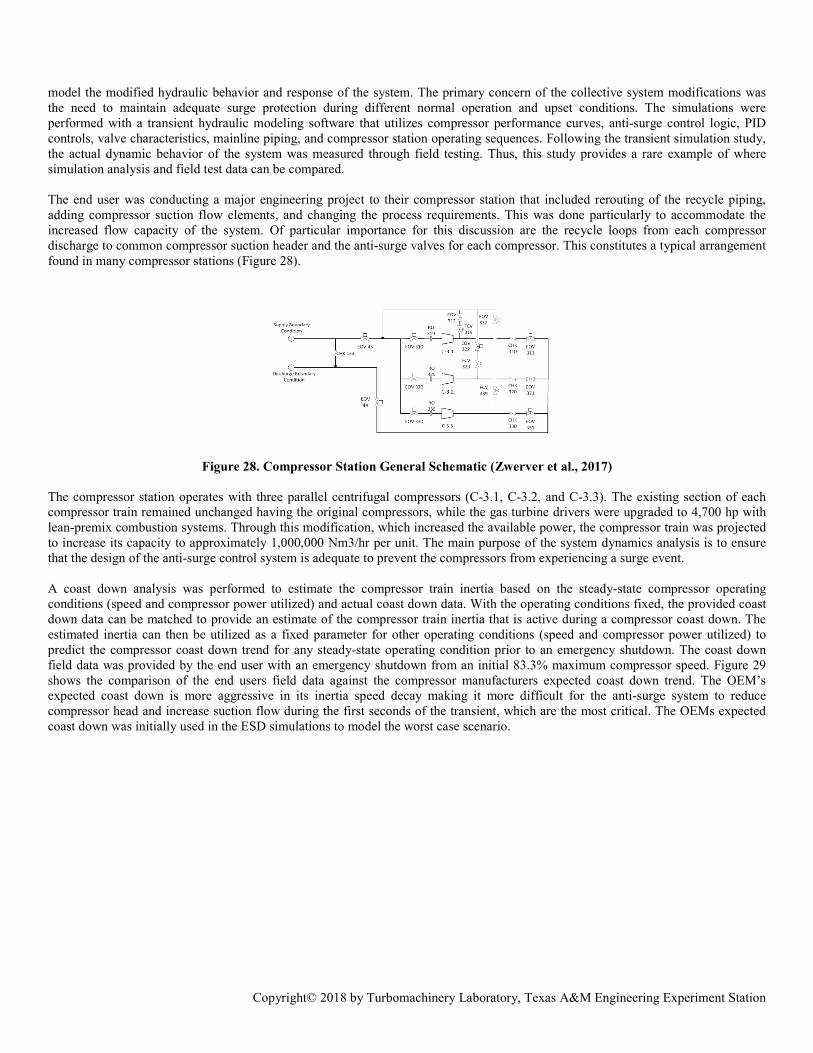
model the modified hydraulic behavior and response of the system. The primary concern of the collective system modifications was the need to maintain adequate surge protection during different normal operation and upset conditions. The simulations were performed with a transient hydraulic modeling software that utilizes compressor performance curves, anti-surge control logic, PID controls, valve characteristics, mainline piping, and compressor station operating sequences. Following the transient simulation study, the actual dynamic behavior of the system was measured through field testing. Thus, this study provides a rare example of where simulation analysis and field test data can be compared. The end user was conducting a major engineering project to their compressor station that included rerouting of the recycle piping, adding compressor suction flow elements, and changing the process requirements. This was done particularly to accommodate the increased flow capacity of the system. Of particular importance for this discussion are the recycle loops from each compressor discharge to common compressor suction header and the anti-surge valves for each compressor. This constitutes a typical arrangement found in many compressor stations (Figure 28).
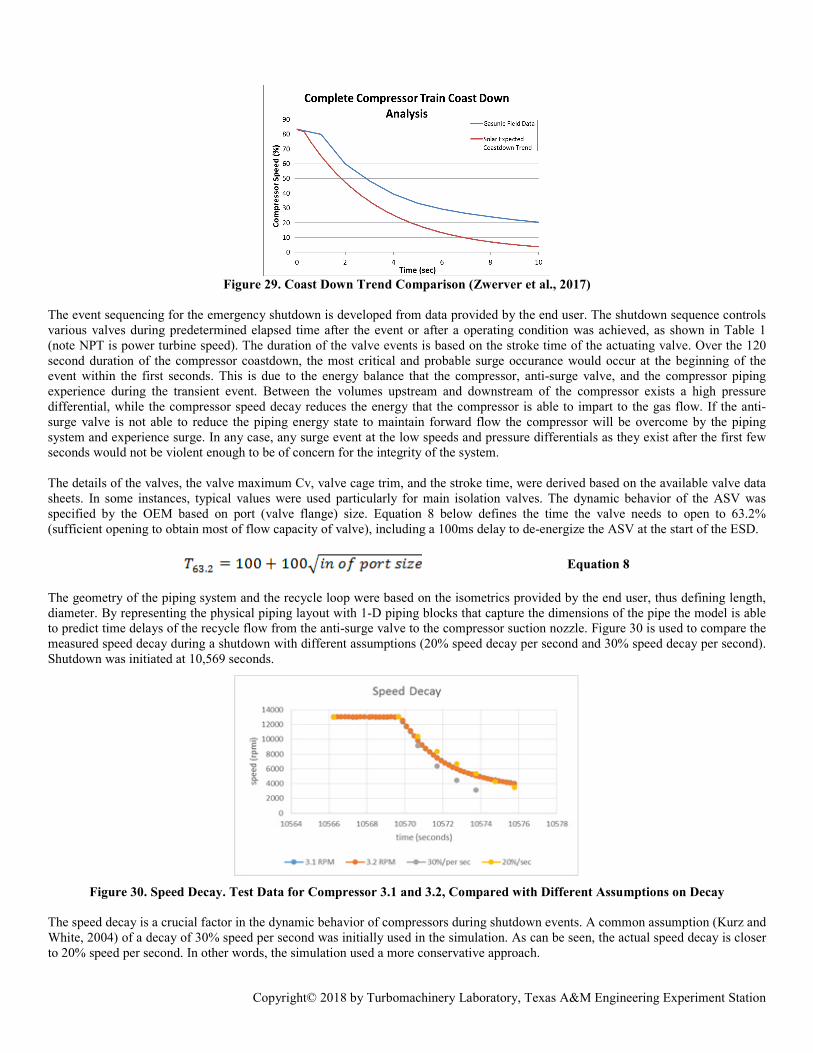
Figure 28. Compressor Station General Schematic (Zwerver et al., 2017) The compressor station operates with three parallel centrifugal compressors (C-3.1, C-3.2, and C-3.3). The existing section of each compressor train remained unchanged having the original compressors, while the gas turbine drivers were upgraded to 4,700 hp with lean-premix combustion systems. Through this modification, which increased the available power, the compressor train was projected to increase its capacity to approximately 1,000,000 Nm3/hr per unit. The main purpose of the system dynamics analysis is to ensure that the design of the anti-surge control system is adequate to prevent the compressors from experiencing a surge event. A coast down analysis was performed to estimate the compressor train inertia based on the steady-state compressor operating conditions (speed and compressor power utilized) and actual coast down data. With the operating conditions fixed, the provided coast down data can be matched to provide an estimate of the compressor train inertia that is active during a compressor coast down. The estimated inertia can then be utilized as a fixed parameter for other operating conditions (speed and compressor power utilized) to predict the compressor coast down trend for any steady-state operating condition prior to an emergency shutdown. The coast down field data was provided by the end user with an emergency shutdown from an initial 83.3% maximum compressor speed. Figure 29 shows the comparison of the end users field data against the compressor manufacturers expected coast down trend. The OEM’s expected coast down is more aggressive in its inertia speed decay making it more difficult for the anti-surge system to reduce compressor head and increase suction flow during the first seconds of the transient, which are the most critical. The OEMs expected coast down was initially used in the ESD simulations to model the worst case scenario.
Copyright© 2018 by Turbomachinery Laboratory, Texas A&M Engineering Experiment Station
Figure 29. Coast Down Trend Comparison (Zwerver et al., 2017)
The event sequencing for the emergency shutdown is developed from data provided by the end user. The shutdown sequence controls various valves during predetermined elapsed time after the event or after a operating condition was achieved, as shown in Table 1 (note NPT is power turbine speed). The duration of the valve events is based on the stroke time of the actuating valve. Over the 120 second duration of the compressor coastdown, the most critical and probable surge occurance would occur at the beginning of the event within the first seconds. This is due to the energy balance that the compressor, anti-surge valve, and the compressor piping experience during the transient event. Between the volumes upstream and downstream of the compressor exists a high pressure differential, while the compressor speed decay reduces the energy that the compressor is able to impart to the gas flow. If the anti-surge valve is not able to reduce the piping energy state to maintain forward flow the compressor will be overcome by the piping system and experience surge. In any case, any surge event at the low speeds and pressure differentials as they exist after the first few seconds would not be violent enough to be of concern for the integrity of the system. The details of the valves, the valve maximum Cv, valve cage trim, and the stroke time, were derived based on the available valve data sheets. In some instances, typical values were used particularly for main isolation valves. The dynamic behavior of the ASV was specified by the OEM based on port (valve flange) size. Equation 8 below defines the time the valve needs to open to 63.2% (sufficient opening to obtain most of flow capacity of valve), including a 100ms delay to de-energize the ASV at the start of the ESD.
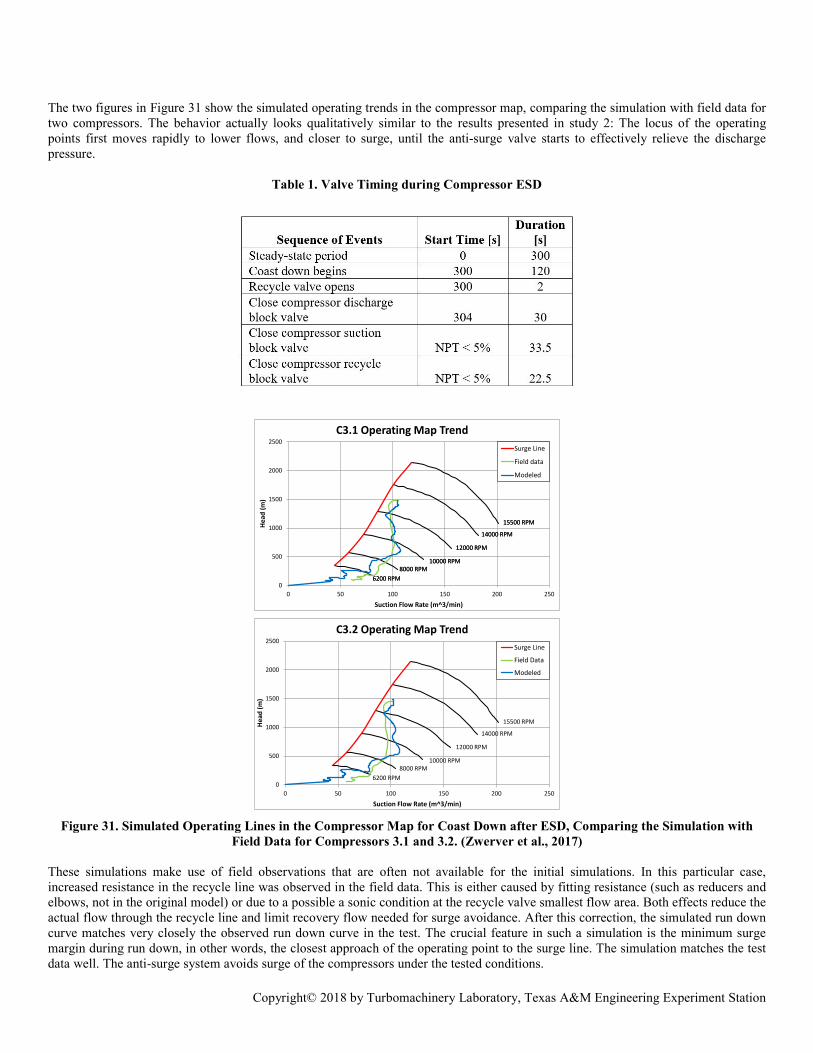
Equation 8 The geometry of the piping system and the recycle loop were based on the isometrics provided by the end user, thus defining length, diameter. By representing the physical piping layout with 1-D piping blocks that capture the dimensions of the pipe the model is able to predict time delays of the recycle flow from the anti-surge valve to the compressor suction nozzle. Figure 30 is used to compare the measured speed decay during a shutdown with different assumptions (20% speed decay per second and 30% speed decay per second). Shutdown was initiated at 10,569 seconds.
Figure 30. Speed Decay. Test Data for Compressor 3.1 and 3.2, Compared with Different Assumptions on Decay
The speed decay is a crucial factor in the dynamic behavior of compressors during shutdown events. A common assumption (Kurz and White, 2004) of a decay of 30% speed per second was initially used in the simulation. As can be seen, the actual speed decay is closer to 20% speed per second. In other words, the simulation used a more conservative approach.
Copyright© 2018 by Turbomachinery Laboratory, Texas A&M Engineering Experiment Station
The two figures in Figure 31 show the simulated operating trends in the compressor map, comparing the simulation with field data for two compressors. The behavior actually looks qualitatively similar to the results presented in study 2: The locus of the operating points first moves rapidly to lower flows, and closer to surge, until the anti-surge valve starts to effectively relieve the discharge pressure.
Table 1. Valve Timing during Compressor ESD
0
500
1000
1500
2000
2500
0 50 100 150 200 250
Hea
d (m
)
Suction Flow Rate (m^3/min)
C3.1 Operating Map TrendSurge Line
Field data
Modeled
6200 RPM8000 RPM
10000 RPM
12000 RPM
14000 RPM
15500 RPM
6200 RPM8000 RPM
10000 RPM
12000 RPM
14000 RPM
15500 RPM
0
500
1000
1500
2000
2500
0 50 100 150 200 250
Hea
d (m
)
Suction Flow Rate (m^3/min)
C3.2 Operating Map TrendSurge Line
Field Data
Modeled
6200 RPM8000 RPM
10000 RPM
12000 RPM
14000 RPM
15500 RPM
Figure 31. Simulated Operating Lines in the Compressor Map for Coast Down after ESD, Comparing the Simulation with
Field Data for Compressors 3.1 and 3.2. (Zwerver et al., 2017) These simulations make use of field observations that are often not available for the initial simulations. In this particular case, increased resistance in the recycle line was observed in the field data. This is either caused by fitting resistance (such as reducers and elbows, not in the original model) or due to a possible a sonic condition at the recycle valve smallest flow area. Both effects reduce the actual flow through the recycle line and limit recovery flow needed for surge avoidance. After this correction, the simulated run down curve matches very closely the observed run down curve in the test. The crucial feature in such a simulation is the minimum surge margin during run down, in other words, the closest approach of the operating point to the surge line. The simulation matches the test data well. The anti-surge system avoids surge of the compressors under the tested conditions.
Copyright© 2018 by Turbomachinery Laboratory, Texas A&M Engineering Experiment Station
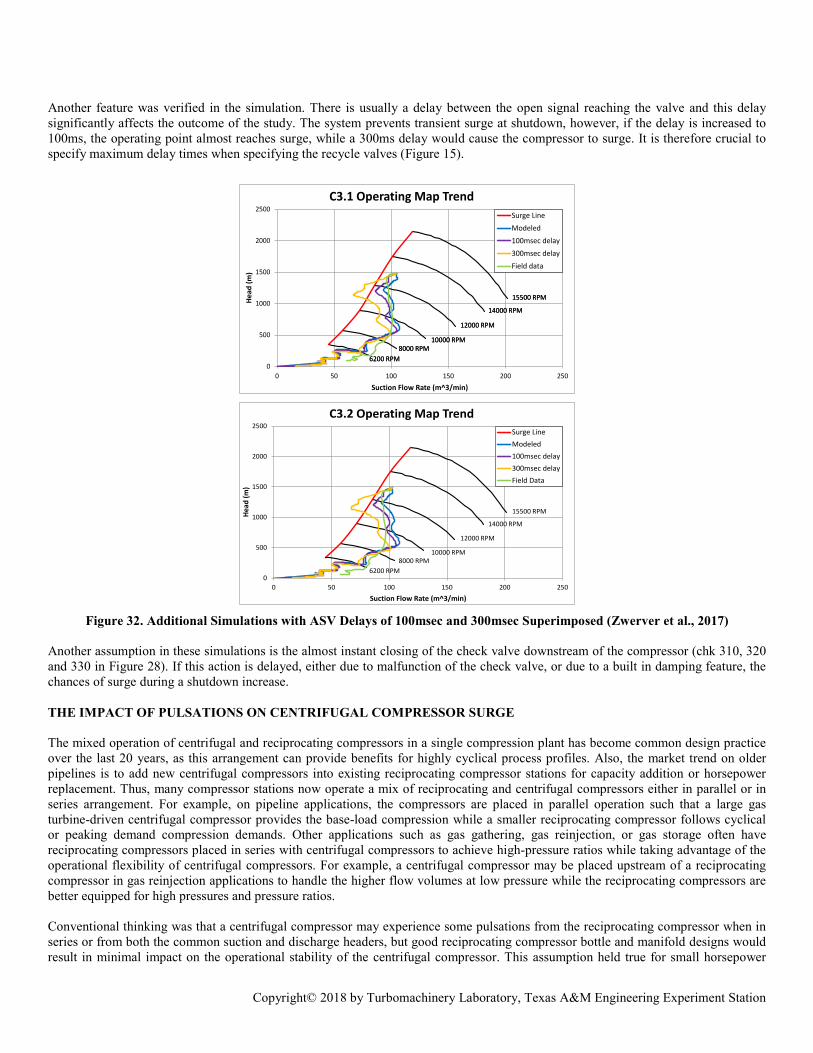
Another feature was verified in the simulation. There is usually a delay between the open signal reaching the valve and this delay significantly affects the outcome of the study. The system prevents transient surge at shutdown, however, if the delay is increased to 100ms, the operating point almost reaches surge, while a 300ms delay would cause the compressor to surge. It is therefore crucial to specify maximum delay times when specifying the recycle valves (Figure 15).
0
500
1000
1500
2000
2500
0 50 100 150 200 250
Hea
d (m
)
Suction Flow Rate (m^3/min)
C3.1 Operating Map TrendSurge LineModeled100msec delay300msec delayField data
6200 RPM8000 RPM
10000 RPM
12000 RPM
14000 RPM
15500 RPM
6200 RPM8000 RPM
10000 RPM
12000 RPM
14000 RPM
15500 RPM
0
500
1000
1500
2000
2500
0 50 100 150 200 250
Head
(m)
Suction Flow Rate (m^3/min)
C3.2 Operating Map TrendSurge LineModeled100msec delay300msec delayField Data
6200 RPM8000 RPM
10000 RPM
12000 RPM
14000 RPM
15500 RPM
Figure 32. Additional Simulations with ASV Delays of 100msec and 300msec Superimposed (Zwerver et al., 2017)
Another assumption in these simulations is the almost instant closing of the check valve downstream of the compressor (chk 310, 320 and 330 in Figure 28). If this action is delayed, either due to malfunction of the check valve, or due to a built in damping feature, the chances of surge during a shutdown increase. THE IMPACT OF PULSATIONS ON CENTRIFUGAL COMPRESSOR SURGE The mixed operation of centrifugal and reciprocating compressors in a single compression plant has become common design practice over the last 20 years, as this arrangement can provide benefits for highly cyclical process profiles. Also, the market trend on older pipelines is to add new centrifugal compressors into existing reciprocating compressor stations for capacity addition or horsepower replacement. Thus, many compressor stations now operate a mix of reciprocating and centrifugal compressors either in parallel or in series arrangement. For example, on pipeline applications, the compressors are placed in parallel operation such that a large gas turbine-driven centrifugal compressor provides the base-load compression while a smaller reciprocating compressor follows cyclical or peaking demand compression demands. Other applications such as gas gathering, gas reinjection, or gas storage often have reciprocating compressors placed in series with centrifugal compressors to achieve high-pressure ratios while taking advantage of the operational flexibility of centrifugal compressors. For example, a centrifugal compressor may be placed upstream of a reciprocating compressor in gas reinjection applications to handle the higher flow volumes at low pressure while the reciprocating compressors are better equipped for high pressures and pressure ratios. Conventional thinking was that a centrifugal compressor may experience some pulsations from the reciprocating compressor when in series or from both the common suction and discharge headers, but good reciprocating compressor bottle and manifold designs would result in minimal impact on the operational stability of the centrifugal compressor. This assumption held true for small horsepower
Copyright© 2018 by Turbomachinery Laboratory, Texas A&M Engineering Experiment Station
and low speed applications and with older, high-pressure drop and often significantly oversized pulsation control systems. However, recent experience with mixed compressor stations utilizing large power and high speed modern separable reciprocating compressors with modern efficient pulsation control systems shows that the centrifugal compressor can be moved into pulsation induced operational instability for both parallel or series arrangements. This clearly presents a station design challenge, operational range limitation, and a basic safety concern. For example, centrifugal compressors are often installed downstream of one or multiple reciprocating compressors in gas gathering applications where multiple, very low pressure streams from the reciprocating compressors are combined into one larger volume medium pressure stream to be compressed to pipeline pressure by the centrifugal compressor. These plant arrangements can lead to high relative pulsations on the centrifugal compressor, and the operational stability of the compressor may be affected. Specifically, a centrifugal compressor operating with a suction pressure of 40 bar (600 psi) and discharge pressure of 70 bar (1,000 psi) may experience upstream pulsations from a reciprocating compressor exceeding 10 bar (150 psi) peak-to-peak, if under-designed pulsation attenuation devices (bottles, choke tube, or orifice plates) are utilized or an acoustic pipe resonance exists. These suction pressure variations will clearly present a challenge for any centrifugal compressor aerodynamic stability, especially if the compressor operates near its surge line. Thus, the piping arrangement between reciprocating and centrifugal compressors must be properly analyzed to avoid acoustic resonance conditions and/or further attenuate the pressure pulsations from the reciprocating compressor. Interfacing a centrifugal and a reciprocating compressor within the same piping system, introduces two transient fluid mechanisms that have the potential to create damaging inlet/outlet conditions on the centrifugal compressor. These mechanisms are: (i) pulsations generated by the reciprocating compressor and (ii) pulsations generated by the reciprocating compressor that are amplified by an acoustic resonance within the piping system. Both mechanisms can move the centrifugal compressor operating point into a surge or choke (stonewall) condition and, thus, should be avoided or at least controlled. Whereas the first pulsation mechanism can be mostly analyzed using a classic acoustic pulsation analysis, for, the second mechanism the model is more complex and must include the physical and thermodynamic functions of the compressors. Thus, it is recognized that strong pulsations in pressure and flow have the capability to move a centrifugal compressor into surge or choke. Figure 33 shows the velocity fluctuations in time at the inlet to a centrifugal compressor (Brun and Kurz (2010)). Inlet pulsations (velocity fluctuations shown on the y-axis) became periodically negative given the acoustic and impedance system effects in the 6-8 second period. This corresponds to short duration surge cycles at a frequency equal to that of the inlet pulsations. The dynamic behavior of the compressor system near the surge line was outlined by Sparks (1983), further discussed by Kurz et al. (2006), and then implemented into a numerical analysis tool by Brun et al. (2014). They explained how pulsations are amplified or attenuated by a compression system’s acoustic and piping response characteristic superimposed on the compressor head-flow map. Kurz et al. (2006) also noted that centrifugal compressor stability is sensitive to highly pulsating flows, especially in cases where operating at piping acoustic resonance frequencies cannot be avoided. Choke should be avoided, as it is an inefficient operating regime and may result in damage to the compressor. On the other hand, it is critical to avoid any kind of surge event, as these can cause bearing or seal damage, blade rubbing, or even catastrophic compressor failures.
-6-4-202468
1012
0 1 2 3 4 5 6 7 8 9
Time [s]
CC In
let F
low
[m/s
]
Figure 33. Centrifugal Compressor Inlet Velocity versus Time (Brun and Kurz (2010))
COMPRESSOR DYNAMIC RESPONSE THEORY A piping system’s acoustic impedance, Z, is given by (Equation 9):
~ Equation 9 where Z is the acoustic impedance, A is the pipe cross section area, p is the sound pressure, U is acoustic volume flow, z is the specific acoustic impedance, ρ is the fluid density, u is the molecular particle bulk velocity, and c is the local speed of sound. This impedance
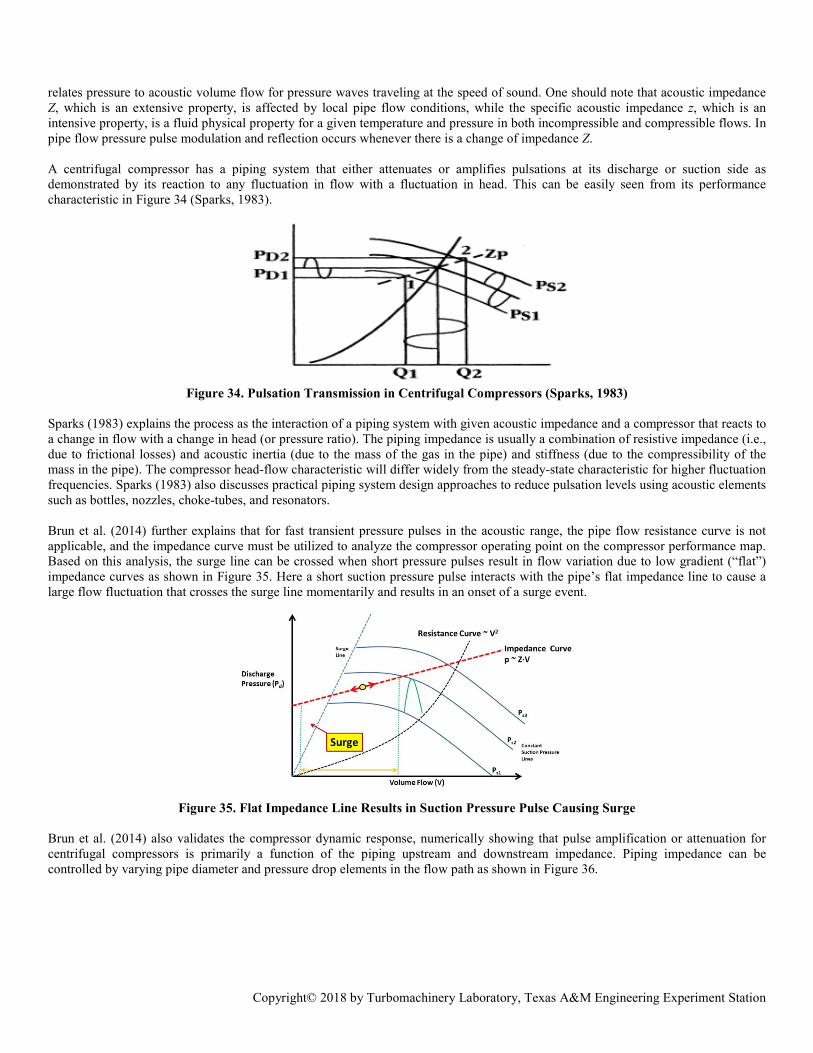
Copyright© 2018 by Turbomachinery Laboratory, Texas A&M Engineering Experiment Station
relates pressure to acoustic volume flow for pressure waves traveling at the speed of sound. One should note that acoustic impedance Z, which is an extensive property, is affected by local pipe flow conditions, while the specific acoustic impedance z, which is an intensive property, is a fluid physical property for a given temperature and pressure in both incompressible and compressible flows. In pipe flow pressure pulse modulation and reflection occurs whenever there is a change of impedance Z. A centrifugal compressor has a piping system that either attenuates or amplifies pulsations at its discharge or suction side as demonstrated by its reaction to any fluctuation in flow with a fluctuation in head. This can be easily seen from its performance characteristic in Figure 34 (Sparks, 1983).
Figure 34. Pulsation Transmission in Centrifugal Compressors (Sparks, 1983)
Sparks (1983) explains the process as the interaction of a piping system with given acoustic impedance and a compressor that reacts to a change in flow with a change in head (or pressure ratio). The piping impedance is usually a combination of resistive impedance (i.e., due to frictional losses) and acoustic inertia (due to the mass of the gas in the pipe) and stiffness (due to the compressibility of the mass in the pipe). The compressor head-flow characteristic will differ widely from the steady-state characteristic for higher fluctuation frequencies. Sparks (1983) also discusses practical piping system design approaches to reduce pulsation levels using acoustic elements such as bottles, nozzles, choke-tubes, and resonators. Brun et al. (2014) further explains that for fast transient pressure pulses in the acoustic range, the pipe flow resistance curve is not applicable, and the impedance curve must be utilized to analyze the compressor operating point on the compressor performance map. Based on this analysis, the surge line can be crossed when short pressure pulses result in flow variation due to low gradient (“flat”) impedance curves as shown in Figure 35. Here a short suction pressure pulse interacts with the pipe’s flat impedance line to cause a large flow fluctuation that crosses the surge line momentarily and results in an onset of a surge event.
Figure 35. Flat Impedance Line Results in Suction Pressure Pulse Causing Surge
Brun et al. (2014) also validates the compressor dynamic response, numerically showing that pulse amplification or attenuation for centrifugal compressors is primarily a function of the piping upstream and downstream impedance. Piping impedance can be controlled by varying pipe diameter and pressure drop elements in the flow path as shown in Figure 36.
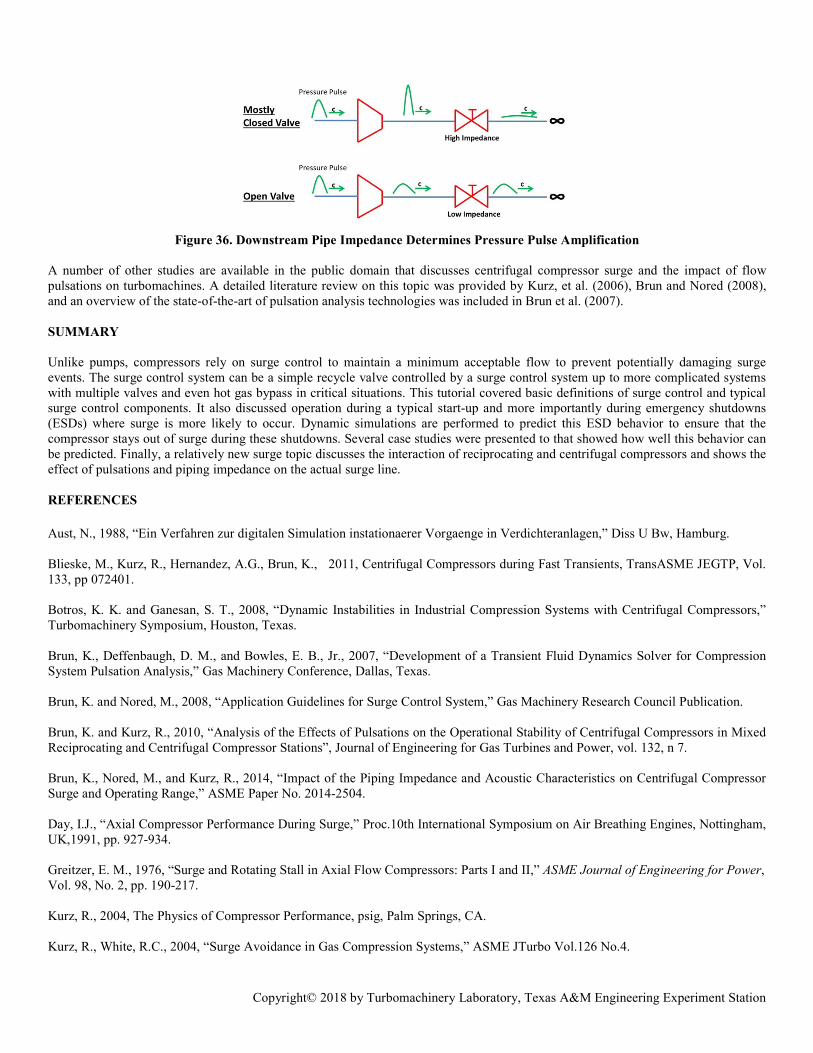
Copyright© 2018 by Turbomachinery Laboratory, Texas A&M Engineering Experiment Station
Figure 36. Downstream Pipe Impedance Determines Pressure Pulse Amplification
A number of other studies are available in the public domain that discusses centrifugal compressor surge and the impact of flow pulsations on turbomachines. A detailed literature review on this topic was provided by Kurz, et al. (2006), Brun and Nored (2008), and an overview of the state-of-the-art of pulsation analysis technologies was included in Brun et al. (2007). SUMMARY Unlike pumps, compressors rely on surge control to maintain a minimum acceptable flow to prevent potentially damaging surge events. The surge control system can be a simple recycle valve controlled by a surge control system up to more complicated systems with multiple valves and even hot gas bypass in critical situations. This tutorial covered basic definitions of surge control and typical surge control components. It also discussed operation during a typical start-up and more importantly during emergency shutdowns (ESDs) where surge is more likely to occur. Dynamic simulations are performed to predict this ESD behavior to ensure that the compressor stays out of surge during these shutdowns. Several case studies were presented to that showed how well this behavior can be predicted. Finally, a relatively new surge topic discusses the interaction of reciprocating and centrifugal compressors and shows the effect of pulsations and piping impedance on the actual surge line. REFERENCES Aust, N., 1988, “Ein Verfahren zur digitalen Simulation instationaerer Vorgaenge in Verdichteranlagen,” Diss U Bw, Hamburg. Blieske, M., Kurz, R., Hernandez, A.G., Brun, K., 2011, Centrifugal Compressors during Fast Transients, TransASME JEGTP, Vol. 133, pp 072401. Botros, K. K. and Ganesan, S. T., 2008, “Dynamic Instabilities in Industrial Compression Systems with Centrifugal Compressors,” Turbomachinery Symposium, Houston, Texas. Brun, K., Deffenbaugh, D. M., and Bowles, E. B., Jr., 2007, “Development of a Transient Fluid Dynamics Solver for Compression System Pulsation Analysis,” Gas Machinery Conference, Dallas, Texas. Brun, K. and Nored, M., 2008, “Application Guidelines for Surge Control System,” Gas Machinery Research Council Publication. Brun, K. and Kurz, R., 2010, “Analysis of the Effects of Pulsations on the Operational Stability of Centrifugal Compressors in Mixed Reciprocating and Centrifugal Compressor Stations”, Journal of Engineering for Gas Turbines and Power, vol. 132, n 7. Brun, K., Nored, M., and Kurz, R., 2014, “Impact of the Piping Impedance and Acoustic Characteristics on Centrifugal Compressor Surge and Operating Range,” ASME Paper No. 2014-2504. Day, I.J., “Axial Compressor Performance During Surge,” Proc.10th International Symposium on Air Breathing Engines, Nottingham, UK,1991, pp. 927-934. Greitzer, E. M., 1976, “Surge and Rotating Stall in Axial Flow Compressors: Parts I and II,” ASME Journal of Engineering for Power, Vol. 98, No. 2, pp. 190-217. Kurz, R., 2004, The Physics of Compressor Performance, psig, Palm Springs, CA. Kurz, R., White, R.C., 2004, “Surge Avoidance in Gas Compression Systems,” ASME JTurbo Vol.126 No.4.
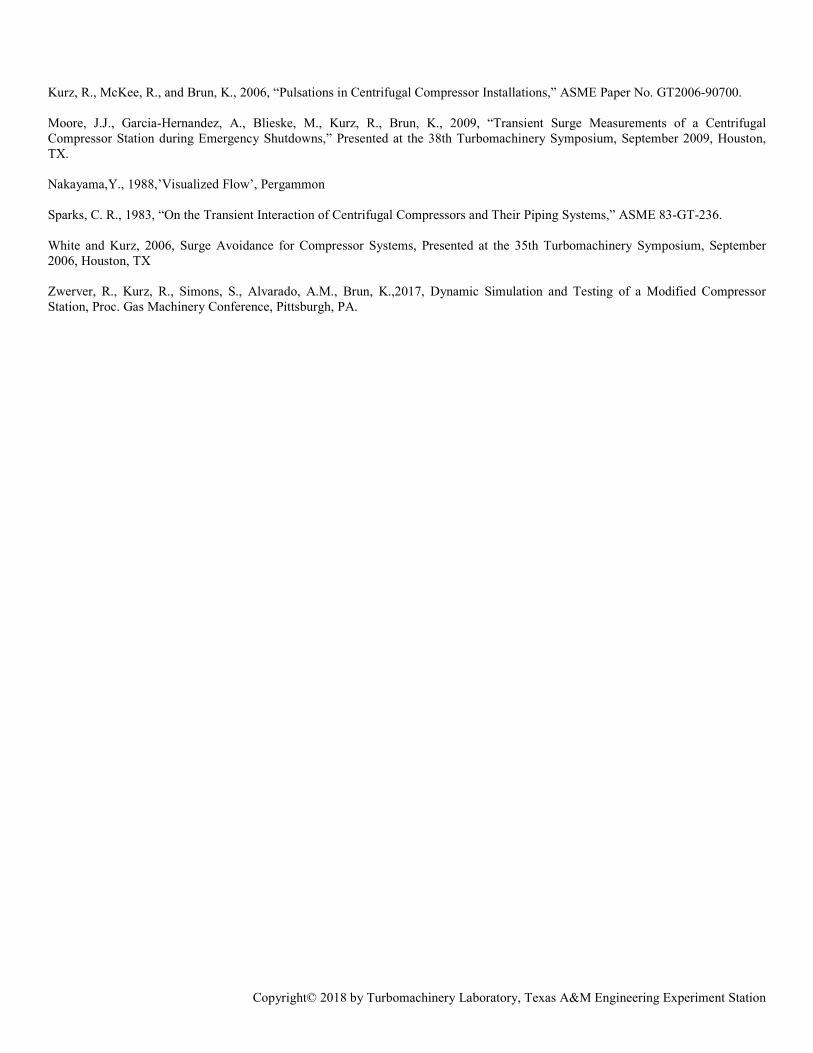
Copyright© 2018 by Turbomachinery Laboratory, Texas A&M Engineering Experiment Station
Kurz, R., McKee, R., and Brun, K., 2006, “Pulsations in Centrifugal Compressor Installations,” ASME Paper No. GT2006-90700. Moore, J.J., Garcia-Hernandez, A., Blieske, M., Kurz, R., Brun, K., 2009, “Transient Surge Measurements of a Centrifugal Compressor Station during Emergency Shutdowns,” Presented at the 38th Turbomachinery Symposium, September 2009, Houston, TX. Nakayama,Y., 1988,’Visualized Flow’, Pergammon Sparks, C. R., 1983, “On the Transient Interaction of Centrifugal Compressors and Their Piping Systems,” ASME 83-GT-236. White and Kurz, 2006, Surge Avoidance for Compressor Systems, Presented at the 35th Turbomachinery Symposium, September 2006, Houston, TX Zwerver, R., Kurz, R., Simons, S., Alvarado, A.M., Brun, K.,2017, Dynamic Simulation and Testing of a Modified Compressor Station, Proc. Gas Machinery Conference, Pittsburgh, PA.


![Model Predictive Compressor Surge Control - TU/e · In Willems [2000] active surge control of a centrifugal compressor is simu- lated and implemented on a gas turbine installation.](https://static.fdocuments.in/doc/165x107/5b52daa17f8b9af4408e25ea/model-predictive-compressor-surge-control-tue-in-willems-2000-active-surge.jpg)