TSMC ANNUAL REPORT 2009 (I) · TSMC ANNUAL REPORT 2009 Technology, Capacity and CustomersWhile the...
172
Taiwan Stock Exchange Market Observation Post System: http://newmops.tse.com.tw TSMC annual report is available at http://www.tsmc.com/english/e_investor/e02_annual/e02_annual.htm Printed on March 12, 2010 TSMC ANNUAL REPORT 2009 (I) TWSE: 2330 NYSE: TSM
Transcript of TSMC ANNUAL REPORT 2009 (I) · TSMC ANNUAL REPORT 2009 Technology, Capacity and CustomersWhile the...

Taiwan Stock Exchange Market Observation Post System: http://newmops.tse.com.tw TSMC annual report is available at http://www.tsmc.com/english/e_investor/e02_annual/e02_annual.htm Printed on March 12, 2010
TSMC ANNUAL REPORT 2009 (I)
TWSE: 2330
NYSE: TSM
TSMC VISION & CORE VALUES
TSMC’s Vision
Our vision is to be the most advanced and largest technology and foundry services provider to fabless companies and IDMs, and in
partnership with them, to forge a powerful competitive force in the semiconductor industry.
To realize our vision, we must have a trinity of strengths:
(1) be a technology leader, competitive with the leading IDMs
(2) be the manufacturing leader
(3) be the most reputable, service-oriented and maximum-total-benefits silicon foundry.
TSMC Core Values
Integrity – Integrity is our most basic and most important core value. We tell the truth. We believe the record of our
accomplishments is the best proof of our merit. Hence, we do not brag. We do not make commitments lightly. Once we make a
commitment, we devote ourselves completely to meeting that commitment. We compete to our fullest within the law, but we do
not slander our competitors and we respect the intellectual property rights of others. With vendors, we maintain an objective,
consistent, and impartial attitude. We do not tolerate any form of corrupt behavior or politicking. When selecting new employees,
we place emphasis on the candidates’ qualifications and character, not connections or access.
Commitment – TSMC is committed to the welfare of customers, suppliers, employees, shareholders, and society. These stakeholders
all contribute to TSMC’s success, and TSMC is dedicated to serving their best interests. In return, TSMC hopes all these stakeholders
will make a mutual commitment to the Company.
Innovation – Innovation is the wellspring of TSMC’s growth, and is a part of all aspects of our business, from strategic planning,
marketing and management, to technology and manufacturing. At TSMC, innovation means more than new ideas, it means putting
ideas into practice.
Customer Partnership – At TSMC, customers come first. Their success is our success, and we value their ability to compete as we
value our own. We strive to build deep and enduring relationships with our customers, who trust and rely on us to be part of their
success over the long term.
TSM
C A
NN
UA
L R
EPO
RT
20
09
TSM
C V
ISIO
N &
CO
RE V
ALU
ES

1. LETTER TO SHAREHOLDERS 2
2. COMPANY PROFILE 6 2.1 An Introduction to TSMC 7 2.2 Market/Business Summary 8 2.3 Organization 10 2.4 Board Members 12 2.5 Management Team 18
3. CORPORATE GOVERNANCE 24 3.1 Board of Directors 25 3.2 Taiwan Corporate Governance Implementation as Required by 27 the Taiwan Financial Supervisory Commission 3.3 Major Resolutions of Shareholders’ Meeting and Board Meetings 29 3.4 Internal Control System Execution Status 30 3.5 Status of Personnel Responsible for Preparing Financial Reports 31 3.6 Information Regarding TSMC’s Independent Auditor 31 3.7 Material Information Management Procedure 31
4. CAPITAL AND SHARES 32 4.1 Capital and Shares 33 4.2 Issuance of Corporate Bonds 39 4.3 Preferred Shares 39 4.4 Issuance of American Depositary Shares 40 4.5 Status of Employee Stock Option Plan 42 4.6 Status of New Share Issuance in Connection with Mergers and Acquisitions 42 4.7 Financing Plans and Implementation 42
5. OPERATIONAL HIGHLIGHTS 44 5.1 Business Activities 45 5.2 Technology Leadership 46 5.3 Manufacturing Excellence 50 5.4 Customer Partnership 52 5.5 Employees 54 5.6 Material Contracts 56
6. FINANCIAL HIGHLIGHTS 58 6.1 Financial Status and Operating Results 59 6.2 Risk Management 62
7. CORPORATE SOCIAL RESPONSIBILITY 68 7.1 Typhoon Morakot Disaster Relief Project 69 7.2 Environmental, Safety and Health (ESH) Management 70 7.3 TSMC Education and Culture Foundation 74
8. AFFILIATE INFORMATION AND 76 OTHER SPECIAL NOTES 8.1 Affiliates 77 8.2 Status of TSMC Common Shares and ADRs Acquired, Disposed of, 81 and Held by Subsidiaries 8.3 Special Notes 81
TABLE OF CONTENTS

2
TSM
C A
NN
UA
L R
EPO
RT
20
09
LETT
ER T
O S
HA
REH
OLD
ERS
3
Dear Shareholders,
At the start of 2009, we managed the sharp business downturn that gripped the global economy, and then enhanced our core strengths by
committing more resources into technology innovations, recruiting talents, and expanding our production capacity to meet customers’ needs.
Now the global economy is on its gradual recovery course and the outlook for semiconductor industry in 2010 appears robust, TSMC is in a
stronger position to compete.
The steep downturn in the global semiconductor industry in 4Q’08 and 1Q’09 was followed by a recovery the rate of which was unprecedented
in the history of the foundry segment. At the start of the slump, management moved with speed to minimize the negative financial impact. Later
on, when demand fast recovered, we demonstrated remarkable agility in quickly ramping up production capacity and capturing the pursuant
recovery. In the process, the Company lowered its breakeven utilization rate and maintained profitability throughout the downturn.
TSMC is now headed forward on a course to capture greater share within the dedicated foundry segment through continued development of the
leading-edge process technology nodes, while aggressively broadening the Company’s business portfolio into derivative technologies across all
legacy technology nodes.
Financial Results
Total consolidated revenue for 2009 was NT$295.74 billion, an 11.2 percent decrease compared with NT$333.16 billion in 2008. Net income
decreased 10.7 percent to NT$89.22 billion from NT$99.93 billion, while diluted earnings per share decreased 9.6 percent to NT$3.44 compared
with NT$3.81 a year earlier.
In US dollars, TSMC’s 2009 revenue was US$9 billion and net income was US$2.71 billion, compared with revenue of US$10.61 billion and net
income of US$3.18 billion in 2008.
Among other highlights in 2009, TSMC achieved:
● �Gross profit margin of 43.7 percent; and
● �Operating profit margin of 31.1 percent.
During the year, TSMC shipped 7.74 million eight-inch equivalent wafers, representing about 7.6 percent of global IC wafer shipments,
compared with 7.4 percent a year ago.
1. LETTER TO SHAREHOLDERS
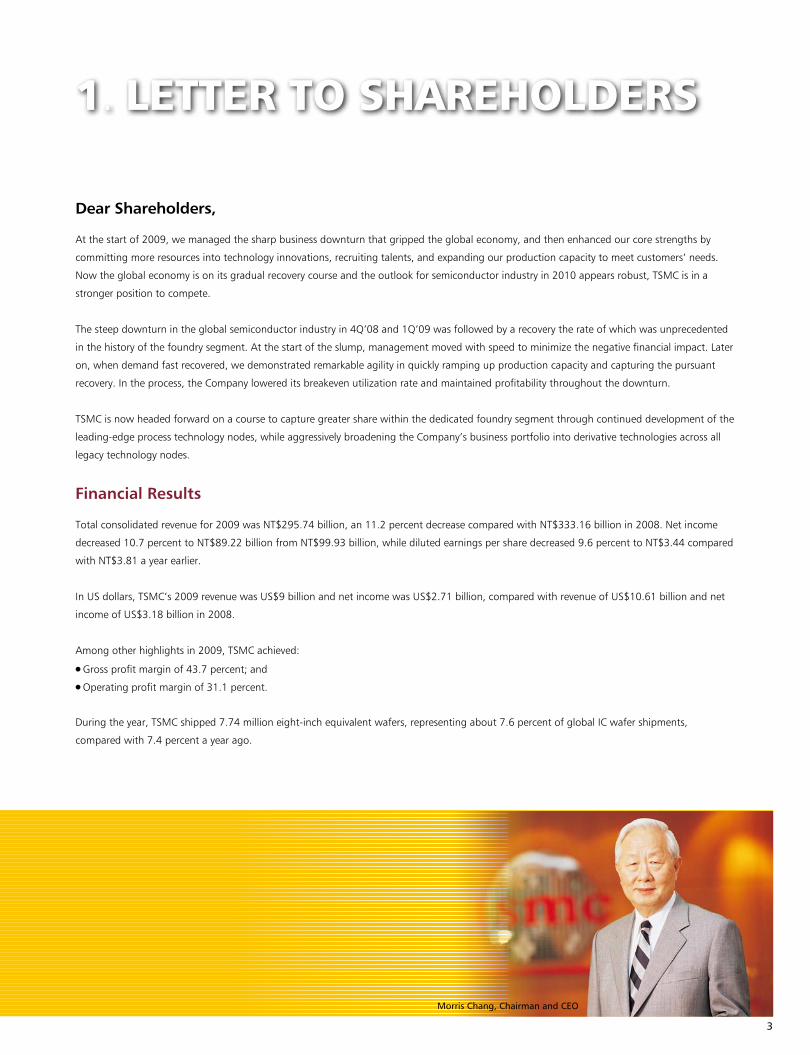
Morris Chang, Chairman and CEO
4
TSM
C A
NN
UA
L R
EPO
RT
20
09
Technology, Capacity and Customers
While the semiconductor industry will grow strongly in 2010, it is likely to grow at an average mid-single-digit rate in the 2011- 2016
period. On the one hand, it is vital for TSMC to maintain and augment its leadership position in the foundry segment by intensifying the
pace of semiconductor manufacturing innovation and by expanding its own capabilities to enlarge market opportunities. On the other
hand, TSMC also embarked on a vigorous program to expand the base of our business to encompass adjacent opportunities that fit our
strengths in engineering capabilities and the ability to manage massive scale operations. In addition, to start the development of new
businesses, Dr. Rick Tsai has been assigned to devote his full time to this task as President of New Businesses, starting June 12, 2009.
Meanwhile, I resumed CEO responsibility.
Today, TSMC serves more than four hundred customers and manufactures more than seven thousand products for them in a year. We
are proud to count every major player in each of the semiconductor logic applications as our customers. We build customer partnership
with our technology leadership and manufacturing excellence, both of which are executed under an overall corporate culture centered
on servicing customers’ needs. In order to better focus on strengthening our customer partnership, the Company has further
re-organized to form an Operations Organization to facilitate manufacturing operations excellence, and a Business Development
Organization to coordinate customer partnership.
We continue to focus resources on strengthening our leading position in our core business of outsourced manufacturing for advanced IC
producers. The Company has invested US$2.7 billion in 2009 to further expand its advanced technology capacity for 12-inch wafer fabs,
with 85% of the spending on capacities for 40/45nm and 65nm technologies, which are expected to contribute over 40% of our wafer
revenue in 2010.
Technology Innovation
TSMC continues to be a technology leader in the semiconductor industry with the development of the most advanced logic technologies
both with conventional (poly SiON) as well as high-K/metal gate (HKMG) stacks at the 28-nanometer (28nm) node. Early in 2009, we
became the first foundry to achieve 28nm functional 64Mb SRAM yield on our high performance (28HP) as well as low leakage (28HPL)
HKMG technologies. With our 28nm shuttle program, functional silicon was delivered in both conventional and HKMG platforms. We are
well on track for qualification and risk production in 2010 for our 28nm technology offerings.
Corporate Developments
In November, TSMC agreed to a settlement with SMIC. The litigation and settlement have resulted in the full protection of TSMC’s trade
secrets in the possession of SMIC. Under the new settlement agreement and the related stipulated judgment, SMIC has agreed to make
cash payments totaling US$200 million and other valuable considerations to TSMC. Both parties also agreed to terminate the patent
cross-licensing agreement signed in 2005.
TSMC also invested US$193 million for a 20% equity stake in Motech, the largest solar cell manufacturer in Taiwan. The Motech
investment allows TSMC to accelerate our time to market, to better evaluate opportunities along the solar value chain, and to further
formulate our overall solar strategy.
LETT
ER T
O S
HA
REH
OLD
ERS

5
Honors and Awards
TSMC continued to garner recognition and awards from around the world as a corporate role model. TSMC’s disclosure and transparency and its
focus on shareholder value have won top honors from AsiaMoney, The Asset Magazine, Corporate Governance Asia, FinanceAsia, GlobalView
Magazine, and the IR Magazine in the areas of Corporate Governance, Management, Investor Relations, and Corporate Social Responsibilities.
Both the Wall Street Journal and CommonWealth Magazine voted TSMC as Taiwan’s Overall Most Admired Company. As a leader in good
corporate citizenship, TSMC is included in the Dow Jones Sustainability Index.
Outlook
Improvement in the global macroeconomic environment is likely to continue into 2011. With the fast growing emerging economies consuming
an increasing amount of semiconductors, we expect the industry to grow at a rate in the teens and the foundry segment to outpace the overall
semiconductor industry at a growth rate exceeding 20 percent in 2010. TSMC has aggressive plans to gain market share in this upturn by further
strengthening our technology leadership and by providing sufficient capacity to meet the strong demand from our customers. Management
believes TSMC can surpass both the Company’s 2008 revenue record and its 2006 net income record, after adjusting for employee profit sharing,
in 2010.
Annual Growth Rate
Capacity: 8-inch equivalent wafers
13%
9.38million
13%
11.28million
9.96million
6%2009
2010
2008
Capacity Plan
2010 wafer shipment is expected to be
approximately 10.8 million 8-inch equivalent wafers.
≥ 0.15 μm
≤ 0.13 μm
100%
64%36%
67%33%
74%26%
Sales Breakdown by Technology
2009
2010
0%
2008
Morris Chang
Chairman and Chief Executive Officer
6
TSM
C A
NN
UA
L R
EPO
RT
20
09
CO
MPA
NY
PRO
FILE
7
2.1 An Introduction to TSMC
TSMC is the world’s largest pure-play semiconductor foundry. Founded on February 21, 1987 and headquartered in Hsinchu, Taiwan, TSMC pioneered the business model of focusing solely on manufacturing customers’ semiconductor designs. As a pure-play semiconductor foundry, the Company does not design, manufacture, or market semiconductor products under its own brand name, ensuring that TSMC does not compete directly with its customers.
With a diverse global customer base, TSMC-manufactured microchips are used in a broad variety of applications that cover various segments of the computer, communications and consumer electronics markets.
Total capacity of the manufacturing facilities managed by TSMC, including subsidiaries and joint ventures, totaled 9.96 million 8-inch equivalent wafers in 2009. In Taiwan, TSMC operates two advanced 12-inch wafer fabs, four 8-inch wafer fabs, and one 6-inch wafer fab. TSMC also manages two 8-inch fabs at wholly owned subsidiaries: WaferTech in the United States and TSMC China Company Limited. In addition, TSMC obtains 8-inch wafer capacity from other companies in which the Company has an equity interest.
TSMC provides customer service through its account management and engineering services offices in North America, Europe, Japan, China, South Korea, and India. The Company employed more than 24,000 people worldwide as of the end of 2009.
TSMC continued to lead the foundry segment of the semiconductor industry in advanced process technologies. Already the first foundry to provide 65nm and 40nm production capacity, TSMC also announced it will deliver 28nm as a full node technology, and, in 2009, reported the addition of 28HPL (High-k metal gate with low power) to enrich its 28nm offering. In addition to general-purpose logic process technology, TSMC supports the wide-ranging needs of its customers with embedded non-volatile memory, embedded DRAM, mixed signal/RF, high voltage, CMOS image sensor, color filter, MEMS, and silicon germanium technologies. In December 2009, TSMC also announced the automotive industry’s first process qualification specification and service package for automotive-grade semiconductor manufacturing in the China market. TSMC Fab 10 in Shanghai, along with multiple fabs in Taiwan, is capable of supporting the automotive service package.
In addition, in order to better manage TSMC’s long-term strategic growth opportunities, TSMC has decided to invest in LED lighting and solar energy related-industries. With differentiated technology offerings and with unique value proposition to customers, TSMC will pursue new opportunities in these fields.
The Company is listed on the Taiwan Stock Exchange (TWSE) under ticker number 2330, and its American Depositary Shares trade on the New York Stock Exchange (NYSE) under the symbol “TSM”.
2. COMPANY PROFILE

8
TSM
C A
NN
UA
L R
EPO
RT
20
09
2.2 Market/Business Summary
2.2.1 TSMC Achievements
In 2009, TSMC maintained its leading position in the pure-play foundry segment of the global semiconductor industry, with an estimated market segment share of 48%. TSMC achieved this result amid fierce competition from both established players and relatively new entrants to the business.
Leadership in advanced process technologies is a key factor in TSMC’s strong market position. In 2009, 67% of TSMC’s wafer revenue came from manufacturing processes with geometries of 0.13μm and below. A critical milestone was reached in September 2009, when TSMC shipped its one-millionth 65nm 12-inch wafer. Moreover, TSMC also achieved volume production of the 45/40nm process as well as development of the leading-edge 28nm process, both foundry firsts. As of the fourth quarter of 2009, 39% of TSMC’s wafer revenue came from 65nm processes and below.
In addition to advanced technologies, TSMC also offers innovative services in line with its unwavering focus on customer partnership. Among the many innovative services unveiled in 2009 was automotive process qualification specification and automotive service package, tapping the growth momentum of automotive electronics. TSMC also launched foundry’s first integrated sign-off flow, mixed signal/radio frequency (RF) reference design kit and interoperable process design kit, which enriched the Open Innovation PlatformTM to facilitate timely innovation among the semiconductor design community.
TSMC continued to advance the semiconductor roadmap in 2009. Examples of technologies the Company developed or rolled out include:● �28nm low power technology with functional static random access
memory (SRAM)● �40nm technology for low power and radio frequency (RF) ● �55nm low power technology● �65nm multi-time programmable non-volatile memory technology● �0.11μm hybrid general performance technology● �0.11μm high voltage process for small panel single chip drivers● �0.13μm slim platform for analog and power management
System-on-Chip (SoC) applications● �0.15μm high voltage process for large panel source drivers
In addition, TSMC further strengthened its comprehensive development of specialty technologies in 2009, including 90/65nm embedded flash, 90/65nm CMOS image sensor and 0.13μm analog technologies. In 2009, TSMC also revealed foundry-first 3D Micro-Electro-Mechanical Systems (MEMS) platform for the integration of CMOS and motion sensors. These specialty technologies are key differentiators from our competitors and provide customers more value.
2.2.2 Market Overview
It is estimated that the semiconductor market in 2009 reached US$226 billion in revenue, a 9% decrease compared to 2008. According to IC Insights, total foundry, a manufacturing sub-segment of the semiconductor industry, generated total revenues of US$22 billion in 2009, -11% year-on-year. Revenues from pure-play foundries
such as TSMC reached US$19 billion, or 8% of total semiconductor industry revenue, and TSMC’s total revenue was US$9 billion. In 2009, the largest geographic market (based on the location of customers’ corporation headquarters) for pure-play foundry services, North America was accounting for 61% of overall pure-play foundry revenue. The second largest geographic market was Asia Pacific (excluding Japan), which accounted for 27% of pure-play foundry revenue in 2009. European-based customers accounted for 9%, and orders from companies based in Japan contributed 3%.
2.2.3 Industry Outlook, Opportunities and Threats
Industry Demand and Supply Outlook2009 was a challenging year for the semiconductor industry, which experienced a decline of 9% year-over-year (YoY). After the sharp market decline in the final quarter of 2008, foundry sales bottomed out in the first quarter of 2009. Driven by better-than-expected demand and supply chain inventory replenishment, foundry sales recovered significantly throughout the rest of 2009. According to IC Insights, pure-play foundry sales declined by 10% in 2009 compared to 2008.
IC Insights forecasts pure-play foundry sales to grow at 24% YoY in 2010. As for the longer term, with improving global economic outlook, increasing semiconductor content in electronics devices and the increasing IDM outsourcing, pure-play foundry sales are expected to display an 14% compound annual growth rate (CAGR) from 2009 through 2014, higher than the 11% CAGR for total IC industry.
As the upstream supplier in the semiconductor supply chain, the foundry segment is tightly correlated with the market health of the 3Cs: computer, communications and consumer.
● ComputerThe computer sector posted an impressive year despite the economic downturn, with a positive unit shipment growth of 3%. The consumer PC segment showed stronger momentum, offsetting the weak corporate PC segment. Lower cost PCs (e.g., netbooks) and new usage models, such as telecom carrier bundled promotion with netbook, also helped to lift the PC market. Market momentum was especially strong in China and the US. Moving into 2010, it is expected the corporate PC refresh, together with the launch of new Microsoft Windows 7 Operating System, will help drive the market while consumer PC continues to maintain its growth momentum. New applications and form factors such as touch screen, thin-and-light PC, “smartbook”, and “virtualization” will also help spur PC sales. In terms of IC product design, the requirements of lower power and higher performance for key components in computers, such as CPU, GPU, Chipset, etc., will drive near-term demand for advanced process technologies such as 40nm and 28nm.
● CommunicationsThe communications sector, particularly the handsets segment, declined by 4% in unit shipment for 2009 from 2008. However, the growing number of new subscribers in emerging countries such as China and India has helped to offset the sales drop in developed countries. In the
CO
MPA
NY
PRO
FILE
9
meantime, high-end smartphone, which has much higher semiconductor content, has been a bright spot in the overall handset market. The growing popularity of 3G cellular phones will add positive momentum to the market. Smartphones with increasing performance, lower power and more intelligent applications will continue to propel the buying momentum of new handsets in the coming 2010. Low power IC design is a must-have feature in the handset segment. The System on Chip (SoC) design and the hunger for higher performance to run complicated software will also speed up the migration to advanced process technologies in which TSMC is already the leader. ● ConsumerAggregated digital consumer electronics device unit shipments resulted in 1% YoY growth in 2009, despite the economic downturn. Government (e.g., China and Japan) incentive programs, analog-to-digital TV transition in the US and EU, and “stay-at-home” economics drove demand during the economic downturn. Sharp average selling price (ASP) declines for consumer products, such as LCD TV and Blu-ray DVD, have also spurred the buying sentiment.
Moving into 2010, new products with attractive features may stimulate sales of consumer products. Continuing the trend toward the transition of analog-to-digital broadcast in certain countries and the unceasing drop of ASP will still be the catalysts to drive sales of products like DTV, STB and Blu-ray DVD.
Increasing innovations in the digital consumer sector have encouraged new usage models, such as motion recognition for game consoles and internet-enabled home appliances. Besides the need for advanced technologies, “More Than Moore” technologies such as CIS, High-voltage drivers and MEMS are becoming prominent requirements. With its comprehensive technology portfolio, TSMC will be able to capitalize on these trends.
Supply ChainThe electronics industry comprises a long and complex supply chain, the elements of which are highly dependent and correlated with each other. At the upstream IC manufacturing stage, it is important for IC vendors to have sufficient and flexible supply to support the dynamic market situation. IC foundry vendors are playing an important role to ensure the health of the supply chain. As a leader in the IC foundry services segment, TSMC provides leading technologies and large scale capacity to complement the innovations created along the downstream chain.
2.2.4 TSMC Position, Differentiation and Strategy
PositionAs the leader in the pure-play foundry segment of the semiconductor manufacturing industry, TSMC commanded a 48% share of this segment in 2009, with total consolidated revenue of US$9 billion. In terms of geographic distribution of wafer revenue, 69% came from companies headquartered in North America, 15% from the Asia Pacific region, excluding China and Japan, 10% from Europe, 3% from China and 3% from Japan. In terms of end product application, 28% of total wafer revenue came from the computer sector, 41% from
communications, 16% from consumer products, and 15% from other categories, such as industrial products.
DifferentiationTSMC’s leadership position is based on a trinity of key differentiating strengths: technology leadership, manufacturing excellence, and customer partnership. As a technology leader, TSMC has consistently been the first pure-play foundry to develop the next generation of leading-edge technologies. As a manufacturing leader, TSMC is renowned for its yield management, and offers best-in-class support services to expedite time-to-market and time-to-volume. And, in customer partnership, TSMC works closely with its customers on end-to-end collaboration to optimize design and manufacturing efficiencies. Going forward, TSMC will continue building on this trinity of strengths to provide the best overall value to its customers.
StrategyTSMC is confident its differentiating strengths will enable it to leverage the attractive growth opportunities in the foundry sector going forward. TSMC works constantly to ensure that these strengths are maintained and improved. For example, TSMC is intensively working on the leading-edge 28nm and 20nm processes to maintain its technology leadership position. Numerous efforts are also underway to ensure manufacturing excellence, such as continuing enhancement of Design-For-Manufacturing (DFM) support services to increase yield and efficiency. TSMC also expanded its Open Innovation PlatformTM initiative, a set of ecosystem interfaces and collaborative components initiated and supported by TSMC that efficiently empowers innovation throughout the supply chain to enhance timely innovation. Finally, TSMC conducted throughout the year customer reviews and surveys to better understand customer needs and wants, and accordingly may adjust its offerings in response, thereby strengthening its partnership with customers.
To address the challenges of falling wafer prices and fiercer competition from other semiconductor manufacturing companies, TSMC persists in strengthening its core competitiveness, and properly deploys its short-term and long-term technology and business development plans in order to hold ROI and growth.
● Short-term business development plan 1) To substantially ramp up the business and sustain market segment
share of advanced technologies with further investment in capacity.2) To maintain market segment share of mainstream technology by
expanding business into new customers and market segments with off-the-shelf technologies.
3) To grow business with IDMs by deepening the partnership on technology development and business model arrangement.
● Long-term business development plan 1) To continue developing the leading edge technologies consistent
with Moore’s law.2) To broaden “More-than-Moore” business contribution by further
developing derivative technologies.3) To further expand TSMC’s business and service infrastructure into
emerging and developing markets.4) To explore and establish new businesses to a significant level
within the next 5 years, such as solar energy and LED lighting.

10
TSM
C A
NN
UA
L R
EPO
RT
20
09
2.3 Organization
2.3.1 Organization Chart
2.3.2 Major Corporate Functions
New Businesses● �Develop and build new businesses for the Company’s long-term
revenue and profitability growth
Operations● �Manufacturing operations, new fab planning, manufacturing
technology integration, advanced product engineering, backend
technology and service, mask manufacturing
Business Development● �Solidify customer partnership, identify new applications and
markets, build new partnership in computer business, consumer,
communication business, and industrial business
Corporate Planning ● �Operation resources planning, production and demand planning,
and business process integration
Quality and Reliability● �Quality and reliability management
Shareholders’Meeting
Board of DirectorsChairman
Vice Chairman
CEO
Audit Committee
Compensation Committee
New Businesses
Research and Development
Worldwide Sales and Marketing
Quality and ReliabilityCorporate PlanningBusiness
DevelopmentOperations
Worldwide Sales and Marketing● �Brand management, market research, customer service, and
regional operations
Research and Development● �Advanced technology research and development, exploratory
research and development and design services and technology
platform development
Information Technology● �Technology and business system integration, Information
technology infrastructure, and IT development and operation
Materials Management and Risk Management● �Purchasing, warehousing, import and export, logistics support,
industrial safety, and environmental protection
Human Resources● �Human resources management and organizational development
Note: To meet our long-term growth projection, a New Businesses organization was established on May 6, 2009.
CO
MPA
NY
PRO
FILE

11
Internal Audit
Information Technology
Materials Management and Risk Management
Human Resources Finance & Spokesperson Legal
Shareholders’Meeting
Board of DirectorsChairman
Vice Chairman
CEO
Audit Committee
Compensation Committee
New Businesses
Research and Development
Worldwide Sales and Marketing
Quality and ReliabilityCorporate PlanningBusiness
DevelopmentOperations
Finance & Spokesperson● �Corporate finance, accounting, investor relations, public relations,
tax, financial planning, investment management, and strategic
program● �Corporate spokesperson
Legal● �Corporate legal affairs, litigation, commercial transactions, patents
and other intellectual property management
Internal Audit● �Internal audit and process compliance
12
TSM
C A
NN
UA
L R
EPO
RT
20
09
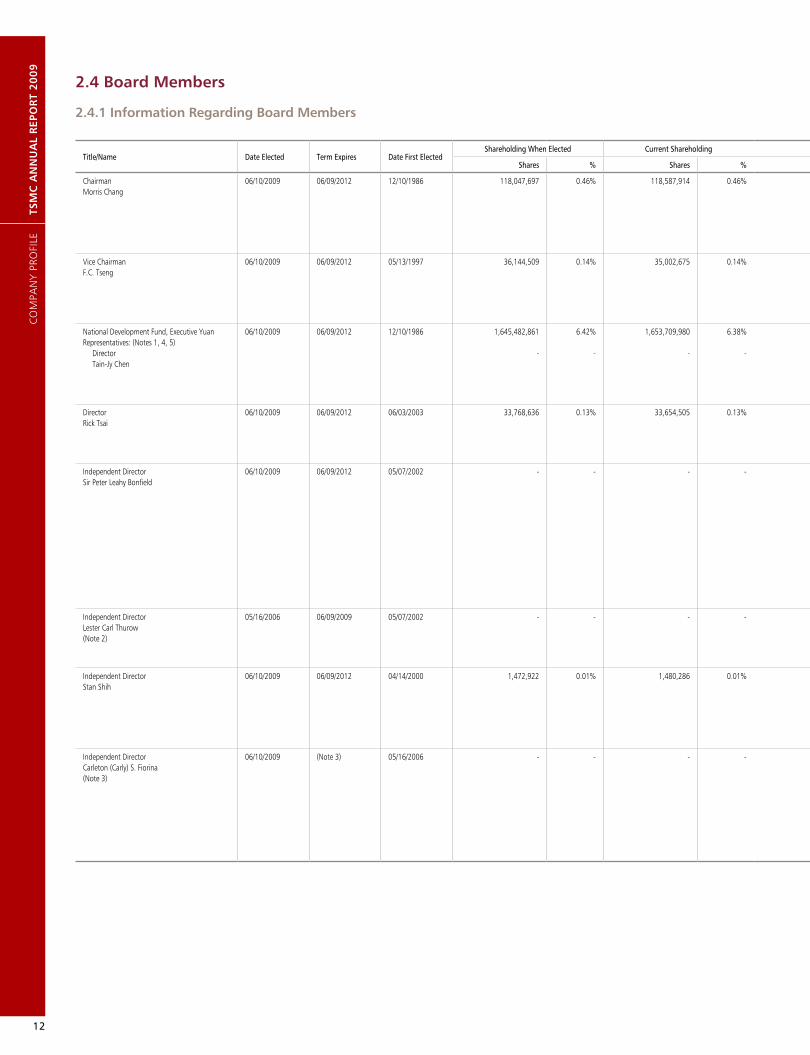
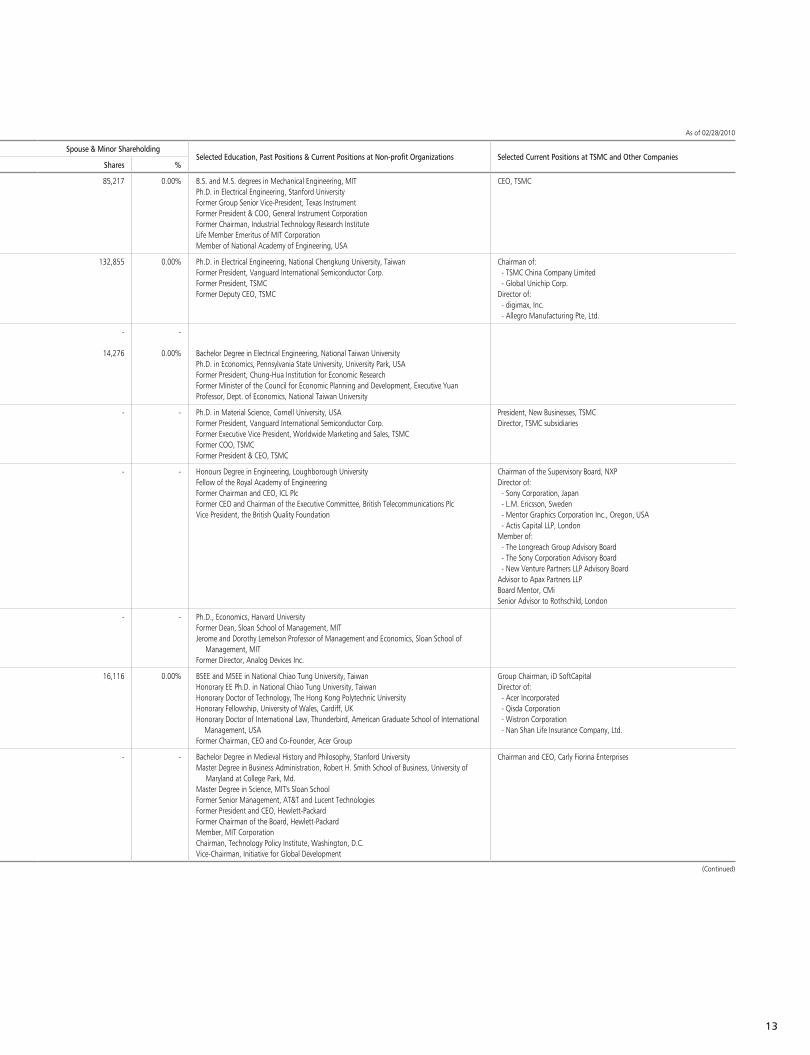
2.4 Board Members
2.4.1 Information Regarding Board Members
Title/Name Date Elected Term Expires Date First ElectedShareholding When Elected Current Shareholding Spouse & Minor Shareholding
Selected Education, Past Positions & Current Positions at Non-profit Organizations Selected Current Positions at TSMC and Other CompaniesShares % Shares % Shares %
ChairmanMorris Chang
06/10/2009 06/09/2012 12/10/1986 118,047,697 0.46% 118,587,914 0.46% 85,217 0.00% B.S. and M.S. degrees in Mechanical Engineering, MITPh.D. in Electrical Engineering, Stanford UniversityFormer Group Senior Vice-President, Texas InstrumentFormer President & COO, General Instrument CorporationFormer Chairman, Industrial Technology Research InstituteLife Member Emeritus of MIT CorporationMember of National Academy of Engineering, USA
CEO, TSMC
Vice ChairmanF.C. Tseng
06/10/2009 06/09/2012 05/13/1997 36,144,509 0.14% 35,002,675 0.14% 132,855 0.00% Ph.D. in Electrical Engineering, National Chengkung University, TaiwanFormer President, Vanguard International Semiconductor Corp.Former President, TSMCFormer Deputy CEO, TSMC
Chairman of: - TSMC China Company Limited - Global Unichip Corp.Director of: - digimax, Inc. - Allegro Manufacturing Pte, Ltd.
National Development Fund, Executive Yuan Representatives: (Notes 1, 4, 5)
DirectorTain-Jy Chen
06/10/2009 06/09/2012 12/10/1986 1,645,482,861
-
6.42%
-
1,653,709,980
-
6.38%
-
-
14,276
-
0.00% Bachelor Degree in Electrical Engineering, National Taiwan UniversityPh.D. in Economics, Pennsylvania State University, University Park, USAFormer President, Chung-Hua Institution for Economic ResearchFormer Minister of the Council for Economic Planning and Development, Executive YuanProfessor, Dept. of Economics, National Taiwan University
DirectorRick Tsai
06/10/2009 06/09/2012 06/03/2003 33,768,636 0.13% 33,654,505 0.13% - - Ph.D. in Material Science, Cornell University, USAFormer President, Vanguard International Semiconductor Corp.Former Executive Vice President, Worldwide Marketing and Sales, TSMCFormer COO, TSMCFormer President & CEO, TSMC
President, New Businesses, TSMCDirector, TSMC subsidiaries
Independent DirectorSir Peter Leahy Bonfield
06/10/2009 06/09/2012 05/07/2002 - - - - - - Honours Degree in Engineering, Loughborough UniversityFellow of the Royal Academy of EngineeringFormer Chairman and CEO, ICL PlcFormer CEO and Chairman of the Executive Committee, British Telecommunications PlcVice President, the British Quality Foundation
Chairman of the Supervisory Board, NXPDirector of: - Sony Corporation, Japan - L.M. Ericsson, Sweden - Mentor Graphics Corporation Inc., Oregon, USA - Actis Capital LLP, LondonMember of: - The Longreach Group Advisory Board - The Sony Corporation Advisory Board - New Venture Partners LLP Advisory BoardAdvisor to Apax Partners LLPBoard Mentor, CMiSenior Advisor to Rothschild, London
Independent DirectorLester Carl Thurow(Note 2)
05/16/2006 06/09/2009 05/07/2002 - - - - - - Ph.D., Economics, Harvard UniversityFormer Dean, Sloan School of Management, MITJerome and Dorothy Lemelson Professor of Management and Economics, Sloan School of
Management, MITFormer Director, Analog Devices Inc.
Independent DirectorStan Shih
06/10/2009 06/09/2012 04/14/2000 1,472,922 0.01% 1,480,286 0.01% 16,116 0.00% BSEE and MSEE in National Chiao Tung University, TaiwanHonorary EE Ph.D. in National Chiao Tung University, TaiwanHonorary Doctor of Technology, The Hong Kong Polytechnic UniversityHonorary Fellowship, University of Wales, Cardiff, UKHo norary Doctor of International Law, Thunderbird, American Graduate School of International
Management, USAFormer Chairman, CEO and Co-Founder, Acer Group
Group Chairman, iD SoftCapitalDirector of: - Acer Incorporated - Qisda Corporation - Wistron Corporation - Nan Shan Life Insurance Company, Ltd.
Independent DirectorCarleton (Carly) S. Fiorina(Note 3)
06/10/2009 (Note 3) 05/16/2006 - - - - - - Bachelor Degree in Medieval History and Philosophy, Stanford UniversityMa ster Degree in Business Administration, Robert H. Smith School of Business, University of
Maryland at College Park, Md.Master Degree in Science, MIT's Sloan SchoolFormer Senior Management, AT&T and Lucent TechnologiesFormer President and CEO, Hewlett-PackardFormer Chairman of the Board, Hewlett-PackardMember, MIT CorporationChairman, Technology Policy Institute, Washington, D.C.Vice-Chairman, Initiative for Global Development
Chairman and CEO, Carly Fiorina Enterprises
CO
MPA
NY
PRO
FILE
13
Title/Name Date Elected Term Expires Date First ElectedShareholding When Elected Current Shareholding Spouse & Minor Shareholding
Selected Education, Past Positions & Current Positions at Non-profit Organizations Selected Current Positions at TSMC and Other CompaniesShares % Shares % Shares %
ChairmanMorris Chang
06/10/2009 06/09/2012 12/10/1986 118,047,697 0.46% 118,587,914 0.46% 85,217 0.00% B.S. and M.S. degrees in Mechanical Engineering, MITPh.D. in Electrical Engineering, Stanford UniversityFormer Group Senior Vice-President, Texas InstrumentFormer President & COO, General Instrument CorporationFormer Chairman, Industrial Technology Research InstituteLife Member Emeritus of MIT CorporationMember of National Academy of Engineering, USA
CEO, TSMC
Vice ChairmanF.C. Tseng
06/10/2009 06/09/2012 05/13/1997 36,144,509 0.14% 35,002,675 0.14% 132,855 0.00% Ph.D. in Electrical Engineering, National Chengkung University, TaiwanFormer President, Vanguard International Semiconductor Corp.Former President, TSMCFormer Deputy CEO, TSMC
Chairman of: - TSMC China Company Limited - Global Unichip Corp.Director of: - digimax, Inc. - Allegro Manufacturing Pte, Ltd.
National Development Fund, Executive Yuan Representatives: (Notes 1, 4, 5)
DirectorTain-Jy Chen
06/10/2009 06/09/2012 12/10/1986 1,645,482,861
-
6.42%
-
1,653,709,980
-
6.38%
-
-
14,276
-
0.00% Bachelor Degree in Electrical Engineering, National Taiwan UniversityPh.D. in Economics, Pennsylvania State University, University Park, USAFormer President, Chung-Hua Institution for Economic ResearchFormer Minister of the Council for Economic Planning and Development, Executive YuanProfessor, Dept. of Economics, National Taiwan University
DirectorRick Tsai
06/10/2009 06/09/2012 06/03/2003 33,768,636 0.13% 33,654,505 0.13% - - Ph.D. in Material Science, Cornell University, USAFormer President, Vanguard International Semiconductor Corp.Former Executive Vice President, Worldwide Marketing and Sales, TSMCFormer COO, TSMCFormer President & CEO, TSMC
President, New Businesses, TSMCDirector, TSMC subsidiaries
Independent DirectorSir Peter Leahy Bonfield
06/10/2009 06/09/2012 05/07/2002 - - - - - - Honours Degree in Engineering, Loughborough UniversityFellow of the Royal Academy of EngineeringFormer Chairman and CEO, ICL PlcFormer CEO and Chairman of the Executive Committee, British Telecommunications PlcVice President, the British Quality Foundation
Chairman of the Supervisory Board, NXPDirector of: - Sony Corporation, Japan - L.M. Ericsson, Sweden - Mentor Graphics Corporation Inc., Oregon, USA - Actis Capital LLP, LondonMember of: - The Longreach Group Advisory Board - The Sony Corporation Advisory Board - New Venture Partners LLP Advisory BoardAdvisor to Apax Partners LLPBoard Mentor, CMiSenior Advisor to Rothschild, London
Independent DirectorLester Carl Thurow(Note 2)
05/16/2006 06/09/2009 05/07/2002 - - - - - - Ph.D., Economics, Harvard UniversityFormer Dean, Sloan School of Management, MITJerome and Dorothy Lemelson Professor of Management and Economics, Sloan School of
Management, MITFormer Director, Analog Devices Inc.
Independent DirectorStan Shih
06/10/2009 06/09/2012 04/14/2000 1,472,922 0.01% 1,480,286 0.01% 16,116 0.00% BSEE and MSEE in National Chiao Tung University, TaiwanHonorary EE Ph.D. in National Chiao Tung University, TaiwanHonorary Doctor of Technology, The Hong Kong Polytechnic UniversityHonorary Fellowship, University of Wales, Cardiff, UKHo norary Doctor of International Law, Thunderbird, American Graduate School of International
Management, USAFormer Chairman, CEO and Co-Founder, Acer Group
Group Chairman, iD SoftCapitalDirector of: - Acer Incorporated - Qisda Corporation - Wistron Corporation - Nan Shan Life Insurance Company, Ltd.
Independent DirectorCarleton (Carly) S. Fiorina(Note 3)
06/10/2009 (Note 3) 05/16/2006 - - - - - - Bachelor Degree in Medieval History and Philosophy, Stanford UniversityMa ster Degree in Business Administration, Robert H. Smith School of Business, University of
Maryland at College Park, Md.Master Degree in Science, MIT's Sloan SchoolFormer Senior Management, AT&T and Lucent TechnologiesFormer President and CEO, Hewlett-PackardFormer Chairman of the Board, Hewlett-PackardMember, MIT CorporationChairman, Technology Policy Institute, Washington, D.C.Vice-Chairman, Initiative for Global Development
Chairman and CEO, Carly Fiorina Enterprises
As of 02/28/2010
(Continued)
14
TSM
C A
NN
UA
L R
EPO
RT
20
09
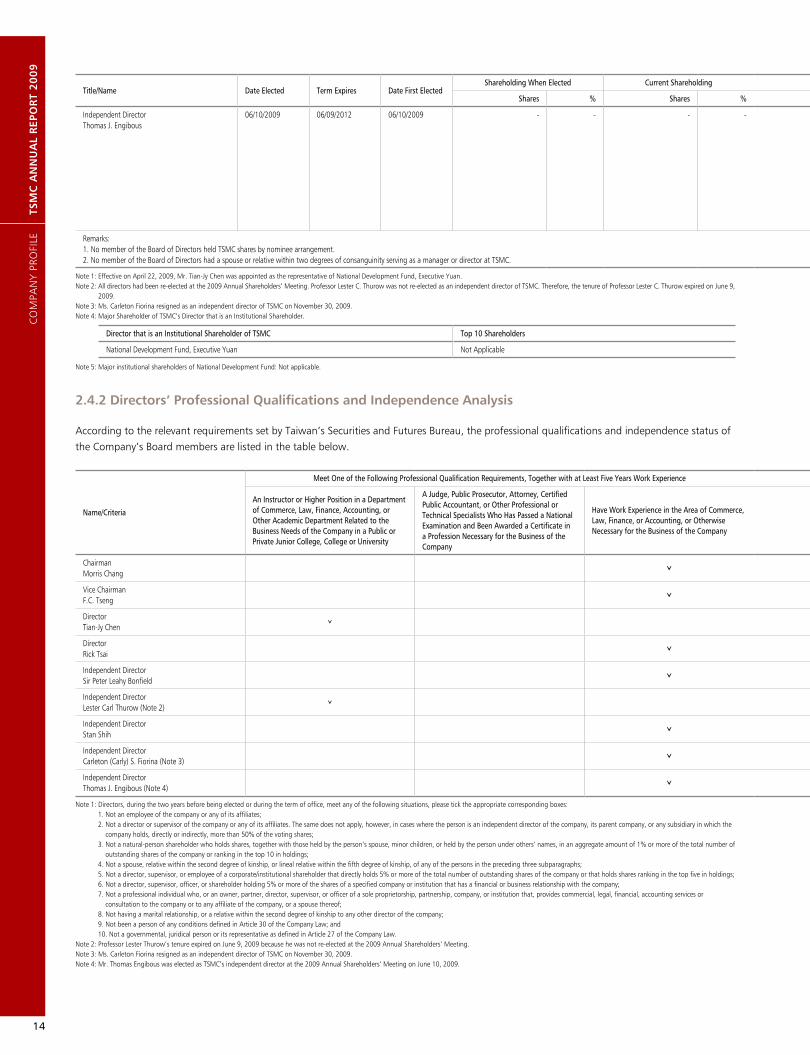
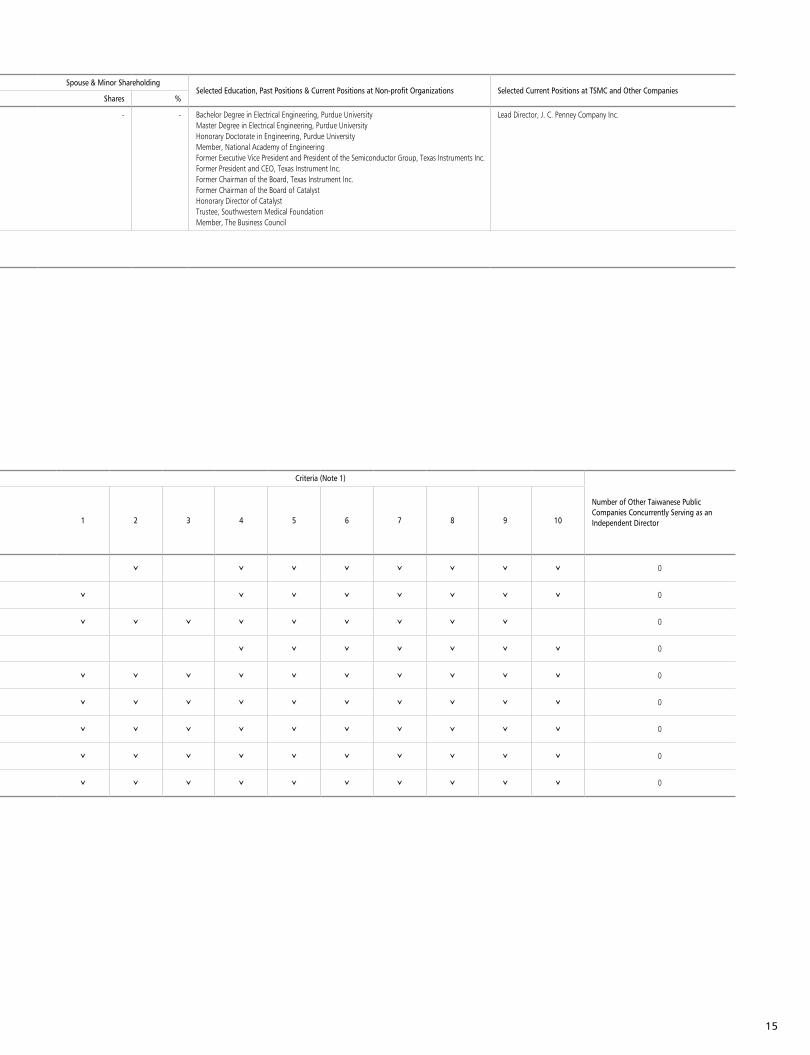
2.4.2 Directors’ Professional Qualifications and Independence Analysis
According to the relevant requirements set by Taiwan’s Securities and Futures Bureau, the professional qualifications and independence status of
the Company’s Board members are listed in the table below.
Title/Name Date Elected Term Expires Date First ElectedShareholding When Elected Current Shareholding Spouse & Minor Shareholding
Selected Education, Past Positions & Current Positions at Non-profit Organizations Selected Current Positions at TSMC and Other CompaniesShares % Shares % Shares %
Independent DirectorThomas J. Engibous
06/10/2009 06/09/2012 06/10/2009 - - - - - - Bachelor Degree in Electrical Engineering, Purdue UniversityMaster Degree in Electrical Engineering, Purdue UniversityHonorary Doctorate in Engineering, Purdue UniversityMember, National Academy of EngineeringFormer Executive Vice President and President of the Semiconductor Group, Texas Instruments Inc.Former President and CEO, Texas Instrument Inc.Former Chairman of the Board, Texas Instrument Inc.Former Chairman of the Board of CatalystHonorary Director of CatalystTrustee, Southwestern Medical FoundationMember, The Business Council
Lead Director, J. C. Penney Company Inc.
Remarks:1. No member of the Board of Directors held TSMC shares by nominee arrangement.2. No member of the Board of Directors had a spouse or relative within two degrees of consanguinity serving as a manager or director at TSMC.
Director that is an Institutional Shareholder of TSMC Top 10 Shareholders
National Development Fund, Executive Yuan Not Applicable
Note 1: Effective on April 22, 2009, Mr. Tian-Jy Chen was appointed as the representative of National Development Fund, Executive Yuan.Note 2: All directors had been re-elected at the 2009 Annual Shareholders’ Meeting. Professor Lester C. Thurow was not re-elected as an independent director of TSMC. Therefore, the tenure of Professor Lester C. Thurow expired on June 9,
2009.Note 3: Ms. Carleton Fiorina resigned as an independent director of TSMC on November 30, 2009.Note 4: Major Shareholder of TSMC’s Director that is an Institutional Shareholder.
Note 5: Major institutional shareholders of National Development Fund: Not applicable.
Name/Criteria
Meet One of the Following Professional Qualification Requirements, Together with at Least Five Years Work Experience Criteria (Note 1)
Number of Other Taiwanese Public Companies Concurrently Serving as an Independent Director
An Instructor or Higher Position in a Department of Commerce, Law, Finance, Accounting, or Other Academic Department Related to the Business Needs of the Company in a Public or Private Junior College, College or University
A Judge, Public Prosecutor, Attorney, Certified Public Accountant, or Other Professional or Technical Specialists Who Has Passed a National Examination and Been Awarded a Certificate in a Profession Necessary for the Business of the Company
Have Work Experience in the Area of Commerce, Law, Finance, or Accounting, or Otherwise Necessary for the Business of the Company
1 2 3 4 5 6 7 8 9 10
ChairmanMorris Chang ˇ ˇ ˇ ˇ ˇ ˇ ˇ ˇ ˇ 0
Vice ChairmanF.C. Tseng ˇ ˇ ˇ ˇ ˇ ˇ ˇ ˇ ˇ 0
DirectorTian-Jy Chen ˇ ˇ ˇ ˇ ˇ ˇ ˇ ˇ ˇ ˇ 0
DirectorRick Tsai ˇ ˇ ˇ ˇ ˇ ˇ ˇ ˇ 0
Independent DirectorSir Peter Leahy Bonfield ˇ ˇ ˇ ˇ ˇ ˇ ˇ ˇ ˇ ˇ ˇ 0
Independent DirectorLester Carl Thurow (Note 2) ˇ ˇ ˇ ˇ ˇ ˇ ˇ ˇ ˇ ˇ ˇ 0
Independent DirectorStan Shih ˇ ˇ ˇ ˇ ˇ ˇ ˇ ˇ ˇ ˇ ˇ 0
Independent DirectorCarleton (Carly) S. Fiorina (Note 3) ˇ ˇ ˇ ˇ ˇ ˇ ˇ ˇ ˇ ˇ ˇ 0
Independent DirectorThomas J. Engibous (Note 4) ˇ ˇ ˇ ˇ ˇ ˇ ˇ ˇ ˇ ˇ ˇ 0
Note 1: Directors, during the two years before being elected or during the term of office, meet any of the following situations, please tick the appropriate corresponding boxes:1. Not an employee of the company or any of its affiliates;2. Not a director or supervisor of the company or any of its affiliates. The same does not apply, however, in cases where the person is an independent director of the company, its parent company, or any subsidiary in which the
company holds, directly or indirectly, more than 50% of the voting shares;3. Not a natural-person shareholder who holds shares, together with those held by the person’s spouse, minor children, or held by the person under others’ names, in an aggregate amount of 1% or more of the total number of
outstanding shares of the company or ranking in the top 10 in holdings;4. Not a spouse, relative within the second degree of kinship, or lineal relative within the fifth degree of kinship, of any of the persons in the preceding three subparagraphs;5. Not a director, supervisor, or employee of a corporate/institutional shareholder that directly holds 5% or more of the total number of outstanding shares of the company or that holds shares ranking in the top five in holdings;6. Not a director, supervisor, officer, or shareholder holding 5% or more of the shares of a specified company or institution that has a financial or business relationship with the company;7. Not a professional individual who, or an owner, partner, director, supervisor, or officer of a sole proprietorship, partnership, company, or institution that, provides commercial, legal, financial, accounting services or
consultation to the company or to any affiliate of the company, or a spouse thereof;8. Not having a marital relationship, or a relative within the second degree of kinship to any other director of the company;9. Not been a person of any conditions defined in Article 30 of the Company Law; and10. Not a governmental, juridical person or its representative as defined in Article 27 of the Company Law.
Note 2: Professor Lester Thurow’s tenure expired on June 9, 2009 because he was not re-elected at the 2009 Annual Shareholders’ Meeting.Note 3: Ms. Carleton Fiorina resigned as an independent director of TSMC on November 30, 2009.Note 4: Mr. Thomas Engibous was elected as TSMC’s independent director at the 2009 Annual Shareholders’ Meeting on June 10, 2009.
CO
MPA
NY
PRO
FILE
15
Title/Name Date Elected Term Expires Date First ElectedShareholding When Elected Current Shareholding Spouse & Minor Shareholding
Selected Education, Past Positions & Current Positions at Non-profit Organizations Selected Current Positions at TSMC and Other CompaniesShares % Shares % Shares %
Independent DirectorThomas J. Engibous
06/10/2009 06/09/2012 06/10/2009 - - - - - - Bachelor Degree in Electrical Engineering, Purdue UniversityMaster Degree in Electrical Engineering, Purdue UniversityHonorary Doctorate in Engineering, Purdue UniversityMember, National Academy of EngineeringFormer Executive Vice President and President of the Semiconductor Group, Texas Instruments Inc.Former President and CEO, Texas Instrument Inc.Former Chairman of the Board, Texas Instrument Inc.Former Chairman of the Board of CatalystHonorary Director of CatalystTrustee, Southwestern Medical FoundationMember, The Business Council
Lead Director, J. C. Penney Company Inc.
Remarks:1. No member of the Board of Directors held TSMC shares by nominee arrangement.2. No member of the Board of Directors had a spouse or relative within two degrees of consanguinity serving as a manager or director at TSMC.
Name/Criteria
Meet One of the Following Professional Qualification Requirements, Together with at Least Five Years Work Experience Criteria (Note 1)
Number of Other Taiwanese Public Companies Concurrently Serving as an Independent Director
An Instructor or Higher Position in a Department of Commerce, Law, Finance, Accounting, or Other Academic Department Related to the Business Needs of the Company in a Public or Private Junior College, College or University
A Judge, Public Prosecutor, Attorney, Certified Public Accountant, or Other Professional or Technical Specialists Who Has Passed a National Examination and Been Awarded a Certificate in a Profession Necessary for the Business of the Company
Have Work Experience in the Area of Commerce, Law, Finance, or Accounting, or Otherwise Necessary for the Business of the Company
1 2 3 4 5 6 7 8 9 10
ChairmanMorris Chang ˇ ˇ ˇ ˇ ˇ ˇ ˇ ˇ ˇ 0
Vice ChairmanF.C. Tseng ˇ ˇ ˇ ˇ ˇ ˇ ˇ ˇ ˇ 0
DirectorTian-Jy Chen ˇ ˇ ˇ ˇ ˇ ˇ ˇ ˇ ˇ ˇ 0
DirectorRick Tsai ˇ ˇ ˇ ˇ ˇ ˇ ˇ ˇ 0
Independent DirectorSir Peter Leahy Bonfield ˇ ˇ ˇ ˇ ˇ ˇ ˇ ˇ ˇ ˇ ˇ 0
Independent DirectorLester Carl Thurow (Note 2) ˇ ˇ ˇ ˇ ˇ ˇ ˇ ˇ ˇ ˇ ˇ 0
Independent DirectorStan Shih ˇ ˇ ˇ ˇ ˇ ˇ ˇ ˇ ˇ ˇ ˇ 0
Independent DirectorCarleton (Carly) S. Fiorina (Note 3) ˇ ˇ ˇ ˇ ˇ ˇ ˇ ˇ ˇ ˇ ˇ 0
Independent DirectorThomas J. Engibous (Note 4) ˇ ˇ ˇ ˇ ˇ ˇ ˇ ˇ ˇ ˇ ˇ 0
16
TSM
C A
NN
UA
L R
EPO
RT
20
09
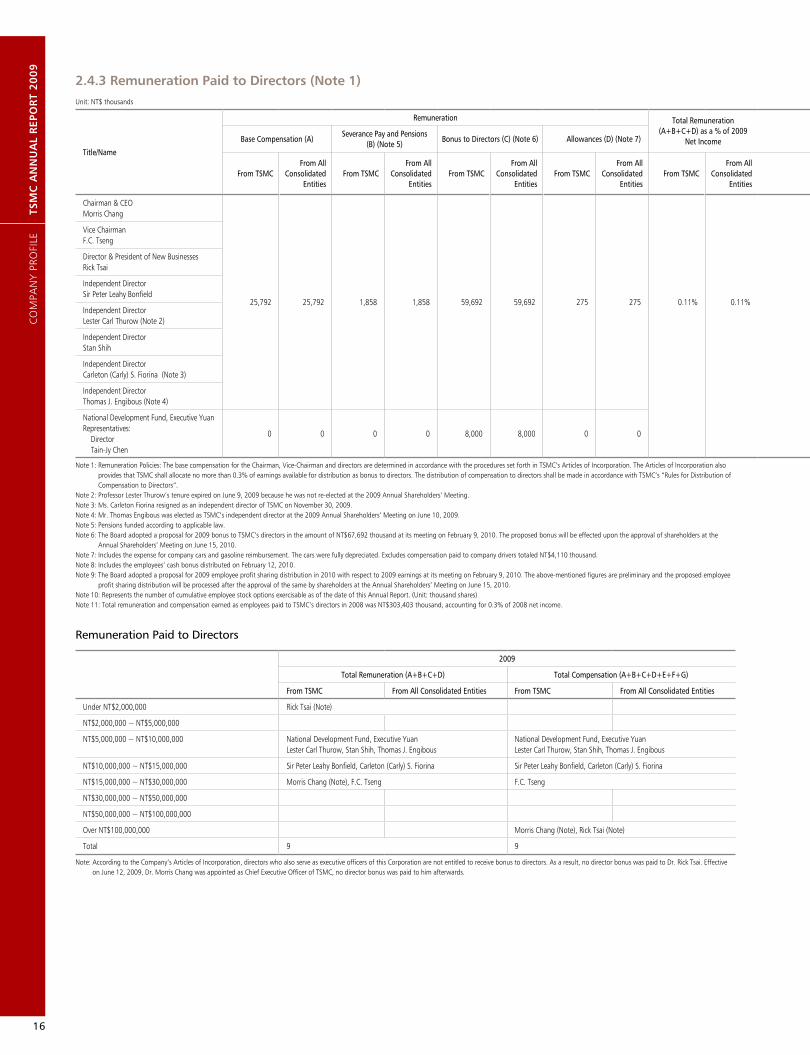
2.4.3 Remuneration Paid to Directors (Note 1)Unit: NT$ thousands
Note 1: Remuneration Policies: The base compensation for the Chairman, Vice-Chairman and directors are determined in accordance with the procedures set forth in TSMC’s Articles of Incorporation. The Articles of Incorporation also provides that TSMC shall allocate no more than 0.3% of earnings available for distribution as bonus to directors. The distribution of compensation to directors shall be made in accordance with TSMC’s “Rules for Distribution of Compensation to Directors“.
Note 2: Professor Lester Thurow’s tenure expired on June 9, 2009 because he was not re-elected at the 2009 Annual Shareholders’ Meeting. Note 3: Ms. Carleton Fiorina resigned as an independent director of TSMC on November 30, 2009.Note 4: Mr. Thomas Engibous was elected as TSMC’s independent director at the 2009 Annual Shareholders’ Meeting on June 10, 2009. Note 5: Pensions funded according to applicable law.Note 6: The Board adopted a proposal for 2009 bonus to TSMC’s directors in the amount of NT$67,692 thousand at its meeting on February 9, 2010. The proposed bonus will be effected upon the approval of shareholders at the
Annual Shareholders’ Meeting on June 15, 2010.Note 7: Includes the expense for company cars and gasoline reimbursement. The cars were fully depreciated. Excludes compensation paid to company drivers totaled NT$4,110 thousand.Note 8: Includes the employees’ cash bonus distributed on February 12, 2010.Note 9: The Board adopted a proposal for 2009 employee profit sharing distribution in 2010 with respect to 2009 earnings at its meeting on February 9, 2010. The above-mentioned figures are preliminary and the proposed employee
profit sharing distribution will be processed after the approval of the same by shareholders at the Annual Shareholders’ Meeting on June 15, 2010.Note 10: Represents the number of cumulative employee stock options exercisable as of the date of this Annual Report. (Unit: thousand shares)Note 11: Total remuneration and compensation earned as employees paid to TSMC’s directors in 2008 was NT$303,403 thousand, accounting for 0.3% of 2008 net income.
2009
Total Remuneration (A+B+C+D) Total Compensation (A+B+C+D+E+F+G)
From TSMC From All Consolidated Entities From TSMC From All Consolidated Entities
Under NT$2,000,000 Rick Tsai (Note)
NT$2,000,000 ~ NT$5,000,000
NT$5,000,000 ~ NT$10,000,000 National Development Fund, Executive Yuan Lester Carl Thurow, Stan Shih, Thomas J. Engibous
National Development Fund, Executive Yuan Lester Carl Thurow, Stan Shih, Thomas J. Engibous
NT$10,000,000 ~ NT$15,000,000 Sir Peter Leahy Bonfield, Carleton (Carly) S. Fiorina Sir Peter Leahy Bonfield, Carleton (Carly) S. Fiorina
NT$15,000,000 ~ NT$30,000,000 Morris Chang (Note), F.C. Tseng F.C. Tseng
NT$30,000,000 ~ NT$50,000,000
NT$50,000,000 ~ NT$100,000,000
Over NT$100,000,000 Morris Chang (Note), Rick Tsai (Note)
Total 9 9
Note: According to the Company’s Articles of Incorporation, directors who also serve as executive officers of this Corporation are not entitled to receive bonus to directors. As a result, no director bonus was paid to Dr. Rick Tsai. Effective on June 12, 2009, Dr. Morris Chang was appointed as Chief Executive Officer of TSMC, no director bonus was paid to him afterwards.
Remuneration Paid to Directors
Title/Name
Remuneration Total Remuneration (A+B+C+D) as a % of 2009
Net Income
Compensation Earned as Employees of TSMC or of TSMC’s Consolidated Entities Total Compensation (A+B+C+D+E+F+G) as a % of 2009 Net Income (Note 11)
Compensation Paid to
Directors from Non-
consolidated Affiliates
Base Compensation (A)Severance Pay and Pensions
(B) (Note 5)Bonus to Directors (C) (Note 6) Allowances (D) (Note 7)
Base Compensation, Bonuses, and Allowances (E) (Note 8)
Severance Pay and Pensions (F) (Note 5)
Employee Profit Sharing (G) (Note 9)Exercisable Employee Stock
Options (H) (Note 10)
From TSMCFrom All
Consolidated Entities
From TSMCFrom All
Consolidated Entities
From TSMCFrom All
Consolidated Entities
From TSMCFrom All
Consolidated Entities
From TSMCFrom All
Consolidated Entities
From TSMCFrom All
Consolidated Entities
From TSMCFrom All
Consolidated Entities
From TSMC From All Consolidated Entities
From TSMCFrom All
Consolidated Entities
From TSMCFrom All
Consolidated EntitiesCash
Stock (Fair Market Value)
Cash Stock (Fair
Market Value)
Chairman & CEOMorris Chang
25,792 25,792 1,858 1,858 59,692 59,692 275 275 0.11% 0.11% 149,806 149,806 671 671 140,814 0 140,814 0 827 827 0.43% 0.43% None
Vice Chairman F.C. Tseng
Director & President of New BusinessesRick Tsai
Independent Director Sir Peter Leahy Bonfield
Independent Director Lester Carl Thurow (Note 2)
Independent Director Stan Shih
Independent Director Carleton (Carly) S. Fiorina (Note 3)
Independent Director Thomas J. Engibous (Note 4)
National Development Fund, Executive YuanRepresentatives: Director Tain-Jy Chen
0 0 0 0 8,000 8,000 0 0 0 0 0 0 0 0 0 0 0 0
CO
MPA
NY
PRO
FILE

17
Title/Name
Remuneration Total Remuneration (A+B+C+D) as a % of 2009
Net Income
Compensation Earned as Employees of TSMC or of TSMC’s Consolidated Entities Total Compensation (A+B+C+D+E+F+G) as a % of 2009 Net Income (Note 11)
Compensation Paid to
Directors from Non-
consolidated Affiliates
Base Compensation (A)Severance Pay and Pensions
(B) (Note 5)Bonus to Directors (C) (Note 6) Allowances (D) (Note 7)
Base Compensation, Bonuses, and Allowances (E) (Note 8)
Severance Pay and Pensions (F) (Note 5)
Employee Profit Sharing (G) (Note 9)Exercisable Employee Stock
Options (H) (Note 10)
From TSMCFrom All
Consolidated Entities
From TSMCFrom All
Consolidated Entities
From TSMCFrom All
Consolidated Entities
From TSMCFrom All
Consolidated Entities
From TSMCFrom All
Consolidated Entities
From TSMCFrom All
Consolidated Entities
From TSMCFrom All
Consolidated Entities
From TSMC From All Consolidated Entities
From TSMCFrom All
Consolidated Entities
From TSMCFrom All
Consolidated EntitiesCash
Stock (Fair Market Value)
Cash Stock (Fair
Market Value)
Chairman & CEOMorris Chang
25,792 25,792 1,858 1,858 59,692 59,692 275 275 0.11% 0.11% 149,806 149,806 671 671 140,814 0 140,814 0 827 827 0.43% 0.43% None
Vice Chairman F.C. Tseng
Director & President of New BusinessesRick Tsai
Independent Director Sir Peter Leahy Bonfield
Independent Director Lester Carl Thurow (Note 2)
Independent Director Stan Shih
Independent Director Carleton (Carly) S. Fiorina (Note 3)
Independent Director Thomas J. Engibous (Note 4)
National Development Fund, Executive YuanRepresentatives: Director Tain-Jy Chen
0 0 0 0 8,000 8,000 0 0 0 0 0 0 0 0 0 0 0 0
18
TSM
C A
NN
UA
L R
EPO
RT
20
09
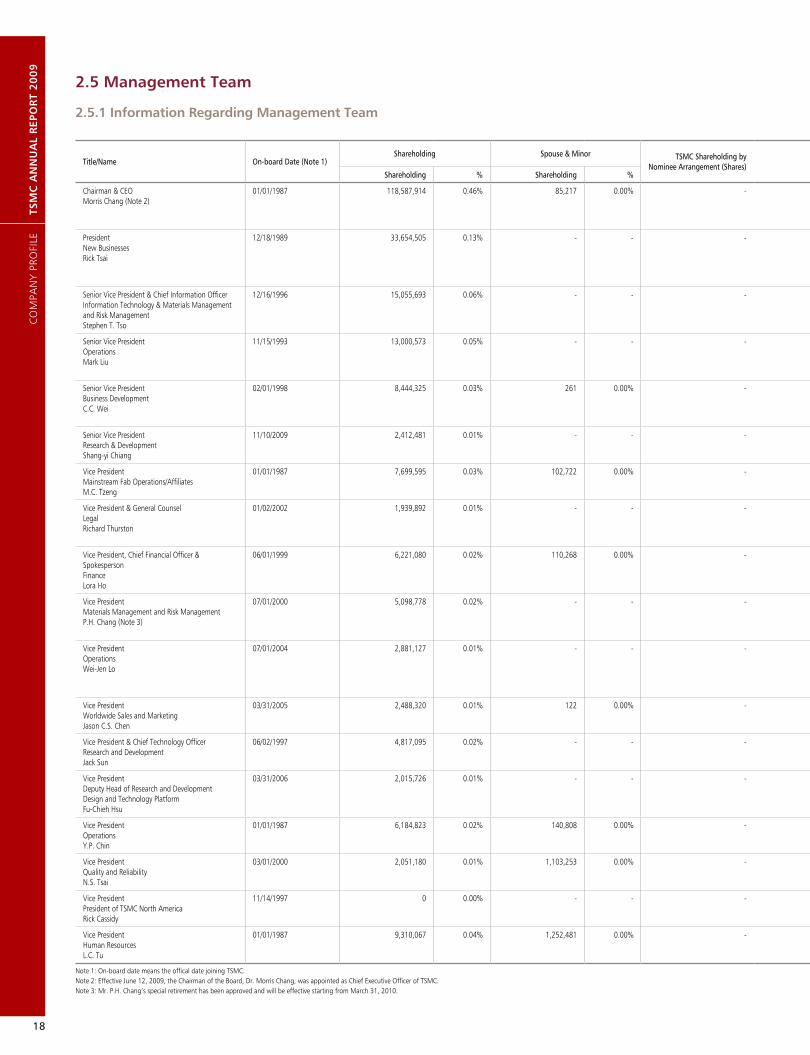
2.5 Management Team
2.5.1 Information Regarding Management Team
Title/Name On-board Date (Note 1)Shareholding Spouse & Minor TSMC Shareholding by
Nominee Arrangement (Shares) Education & Selected Past Positions Selected Current Positions at Other Companies
Managers Who are Spouses or within Second-degree Relative of Consanguinity to Each Other
Shareholding % Shareholding % Title Name Relation
Chairman & CEO Morris Chang (Note 2)
01/01/1987 118,587,914 0.46% 85,217 0.00% - Ph.D., Electrical Engineering, Stanford University, USA Chairman, Industrial Technology Research Institute President & Chief Operation Officer, General Instrument CorporationGroup Senior Vice-President, Texas Instrument
None
President New Businesses Rick Tsai
12/18/1989 33,654,505 0.13% - - - Ph.D., Material Science, Cornell University, USA Chief Executive Officer, TSMC Chief Operating Officer, TSMC Executive Vice President, Worldwide Marketing and Sales, TSMC President, Vanguard International Semiconductor Corp.
Director, TSMC subsidiaries - - -
Senior Vice President & Chief Information Officer Information Technology & Materials Management and Risk Management Stephen T. Tso
12/16/1996 15,055,693 0.06% - - - Ph.D., Materials Science & Engineering, University of California, Berkeley, USA President, WaferTech, L.L.C. Senior Vice President, Operations, TSMC
Director, TSMC subsidiaries - - -
Senior Vice President Operations Mark Liu
11/15/1993 13,000,573 0.05% - - - Ph.D., Electrical Engineering & Computer Science, University of California, Berkeley, USA Senior Vice President, Advanced Technology Business, TSMC Vice President, South Site Operation, TSMC President, Worldwide Semiconductor Manufacturing Corp.
None - - -
Senior Vice President Business Development C.C. Wei
02/01/1998 8,444,325 0.03% 261 0.00% - Ph.D., Electrical Engineering, Yale University, USA Senior Vice President, Mainstream Technology Business, TSMC Vice President, South Site Operation, TSMC Senior Vice President, Chartered Semiconductor Manufacturing Ltd.
Director, TSMC subsidiaries Director, TSMC affiliates
- - -
Senior Vice President Research & Development Shang-yi Chiang
11/10/2009 2,412,481 0.01% - - - Ph.D., Electrical Engineering, Stanford University, USA Senior Vice President, Research and Development, TSMC
Director, TSMC subsidiariesDirector, TSMC affiliates
- - -
Vice President Mainstream Fab Operations/Affiliates M.C. Tzeng
01/01/1987 7,699,595 0.03% 102,722 0.00% - Master, Applied Chemistry, Chungyuan University, Taiwan Vice President, Mainstream Technology Business, TSMC Senior Director, Fab 2 Operation, TSMC
None Department Manager
M.J. Tzeng Siblings
Vice President & General Counsel Legal Richard Thurston
01/02/2002 1,939,892 0.01% - - - J.D., Rutgers School of Law, State University of New Jersey, USA Ph.D., History, University of Virginia, USA Partner, Haynes Boone, LLP. Vice President Corporate Staff, Assistant General Counsel, Texas Instruments Incorporated
Director, TSMC subsidiaries Director, TSMC affiliates
- - -
Vice President, Chief Financial Officer & Spokesperson Finance Lora Ho
06/01/1999 6,221,080 0.02% 110,268 0.00% - Master, Business Administration, National Taiwan University, Taiwan Director, Accounting, TSMC Vice President & CFO, TI-Acer Semiconductor Manufacturing Corp.
Director and/or Supervisor, TSMC subsidiaries Director, TSMC affiliates
- - -
Vice President Materials Management and Risk Management P.H. Chang (Note 3)
07/01/2000 5,098,778 0.02% - - - Ph.D., Materials Science & Engineering, Purdue University, USA Vice President, Human Resources, TSMC Senior Director, Materials Management, TSMC Vice President, Worldwide Semiconductor Manufacturing Corp.
None - - -
Vice President Operations Wei-Jen Lo
07/01/2004 2,881,127 0.01% - - - Ph.D., Solid State Physics & Surface Chemistry, University of California, Berkeley, USA Vice President, Advanced Technology Business, TSMC Vice President, Research & Development, TSMC Vice President, Operation II, TSMC Director, Advanced Technology Development & CTM Plant Manager, Intel
None - - -
Vice President Worldwide Sales and Marketing Jason C.S. Chen
03/31/2005 2,488,320 0.01% 122 0.00% - Master, Business Administration, University of Missouri-Columbia, USA Vice President & Co-Director of Worldwide Sales & Marketing Group, Intel
Director, TSMC subsidiaries - - -
Vice President & Chief Technology Officer Research and Development Jack Sun
06/02/1997 4,817,095 0.02% - - - Ph.D., Electrical Engineering, University of Illinois at Urbana-Champaign, USA Senior Director, Logic Technology Division, TSMC R&D, International Business Machines
None - - -
Vice President Deputy Head of Research and Development Design and Technology Platform Fu-Chieh Hsu
03/31/2006 2,015,726 0.01% - - - Ph.D., Electrical Engineering and Computer Sciences, University of California, Berkeley, USA Chairman, Monolithic System Technology Inc. Chairman, Myson Technology Inc.Vice President, Integrated Device Technology Inc.
Director, TSMC subsidiaries - - -
Vice President Operations Y.P. Chin
01/01/1987 6,184,823 0.02% 140,808 0.00% - Master, Electrical Engineering, National Cheng Kung University, Taiwan Vice President, Advanced Technology Business, TSMC Senior Director, Product Engineering & Services, TSMC
None - - -
Vice President Quality and Reliability N.S. Tsai
03/01/2000 2,051,180 0.01% 1,103,253 0.00% - Ph.D., Material Science, Massachusetts Institute of Technology, USA Senior Director, Assembly Test Technology & Service, TSMC Vice President, Operations, Vanguard International Semiconductor Corp.
None - - -
Vice President President of TSMC North America Rick Cassidy
11/14/1997 0 0.00% - - - Bachelor, Engineering Technology, United States Military Academy at West Point, USA Vice President of TSMC North America Account Management
Director, TSMC North America - - -
Vice President Human Resources L.C. Tu
01/01/1987 9,310,067 0.04% 1,252,481 0.00% - Master, Business Administration, Tulane University, USA Senior Director, Corporate Planning Organization, TSMC Senior Director, Fab 5 Operation, TSMC
None - - -
Note 1: On-board date means the offical date joining TSMC.Note 2: Effective June 12, 2009, the Chairman of the Board, Dr. Morris Chang, was appointed as Chief Executive Officer of TSMC.Note 3: Mr. P.H. Chang’s special retirement has been approved and will be effective starting from March 31, 2010.
CO
MPA
NY
PRO
FILE

19
Title/Name On-board Date (Note 1)Shareholding Spouse & Minor TSMC Shareholding by
Nominee Arrangement (Shares) Education & Selected Past Positions Selected Current Positions at Other Companies
Managers Who are Spouses or within Second-degree Relative of Consanguinity to Each Other
Shareholding % Shareholding % Title Name Relation
Chairman & CEO Morris Chang (Note 2)
01/01/1987 118,587,914 0.46% 85,217 0.00% - Ph.D., Electrical Engineering, Stanford University, USA Chairman, Industrial Technology Research Institute President & Chief Operation Officer, General Instrument CorporationGroup Senior Vice-President, Texas Instrument
None
President New Businesses Rick Tsai
12/18/1989 33,654,505 0.13% - - - Ph.D., Material Science, Cornell University, USA Chief Executive Officer, TSMC Chief Operating Officer, TSMC Executive Vice President, Worldwide Marketing and Sales, TSMC President, Vanguard International Semiconductor Corp.
Director, TSMC subsidiaries - - -
Senior Vice President & Chief Information Officer Information Technology & Materials Management and Risk Management Stephen T. Tso
12/16/1996 15,055,693 0.06% - - - Ph.D., Materials Science & Engineering, University of California, Berkeley, USA President, WaferTech, L.L.C. Senior Vice President, Operations, TSMC
Director, TSMC subsidiaries - - -
Senior Vice President Operations Mark Liu
11/15/1993 13,000,573 0.05% - - - Ph.D., Electrical Engineering & Computer Science, University of California, Berkeley, USA Senior Vice President, Advanced Technology Business, TSMC Vice President, South Site Operation, TSMC President, Worldwide Semiconductor Manufacturing Corp.
None - - -
Senior Vice President Business Development C.C. Wei
02/01/1998 8,444,325 0.03% 261 0.00% - Ph.D., Electrical Engineering, Yale University, USA Senior Vice President, Mainstream Technology Business, TSMC Vice President, South Site Operation, TSMC Senior Vice President, Chartered Semiconductor Manufacturing Ltd.
Director, TSMC subsidiaries Director, TSMC affiliates
- - -
Senior Vice President Research & Development Shang-yi Chiang
11/10/2009 2,412,481 0.01% - - - Ph.D., Electrical Engineering, Stanford University, USA Senior Vice President, Research and Development, TSMC
Director, TSMC subsidiariesDirector, TSMC affiliates
- - -
Vice President Mainstream Fab Operations/Affiliates M.C. Tzeng
01/01/1987 7,699,595 0.03% 102,722 0.00% - Master, Applied Chemistry, Chungyuan University, Taiwan Vice President, Mainstream Technology Business, TSMC Senior Director, Fab 2 Operation, TSMC
None Department Manager
M.J. Tzeng Siblings
Vice President & General Counsel Legal Richard Thurston
01/02/2002 1,939,892 0.01% - - - J.D., Rutgers School of Law, State University of New Jersey, USA Ph.D., History, University of Virginia, USA Partner, Haynes Boone, LLP. Vice President Corporate Staff, Assistant General Counsel, Texas Instruments Incorporated
Director, TSMC subsidiaries Director, TSMC affiliates
- - -
Vice President, Chief Financial Officer & Spokesperson Finance Lora Ho
06/01/1999 6,221,080 0.02% 110,268 0.00% - Master, Business Administration, National Taiwan University, Taiwan Director, Accounting, TSMC Vice President & CFO, TI-Acer Semiconductor Manufacturing Corp.
Director and/or Supervisor, TSMC subsidiaries Director, TSMC affiliates
- - -
Vice President Materials Management and Risk Management P.H. Chang (Note 3)
07/01/2000 5,098,778 0.02% - - - Ph.D., Materials Science & Engineering, Purdue University, USA Vice President, Human Resources, TSMC Senior Director, Materials Management, TSMC Vice President, Worldwide Semiconductor Manufacturing Corp.
None - - -
Vice President Operations Wei-Jen Lo
07/01/2004 2,881,127 0.01% - - - Ph.D., Solid State Physics & Surface Chemistry, University of California, Berkeley, USA Vice President, Advanced Technology Business, TSMC Vice President, Research & Development, TSMC Vice President, Operation II, TSMC Director, Advanced Technology Development & CTM Plant Manager, Intel
None - - -
Vice President Worldwide Sales and Marketing Jason C.S. Chen
03/31/2005 2,488,320 0.01% 122 0.00% - Master, Business Administration, University of Missouri-Columbia, USA Vice President & Co-Director of Worldwide Sales & Marketing Group, Intel
Director, TSMC subsidiaries - - -
Vice President & Chief Technology Officer Research and Development Jack Sun
06/02/1997 4,817,095 0.02% - - - Ph.D., Electrical Engineering, University of Illinois at Urbana-Champaign, USA Senior Director, Logic Technology Division, TSMC R&D, International Business Machines
None - - -
Vice President Deputy Head of Research and Development Design and Technology Platform Fu-Chieh Hsu
03/31/2006 2,015,726 0.01% - - - Ph.D., Electrical Engineering and Computer Sciences, University of California, Berkeley, USA Chairman, Monolithic System Technology Inc. Chairman, Myson Technology Inc.Vice President, Integrated Device Technology Inc.
Director, TSMC subsidiaries - - -
Vice President Operations Y.P. Chin
01/01/1987 6,184,823 0.02% 140,808 0.00% - Master, Electrical Engineering, National Cheng Kung University, Taiwan Vice President, Advanced Technology Business, TSMC Senior Director, Product Engineering & Services, TSMC
None - - -
Vice President Quality and Reliability N.S. Tsai
03/01/2000 2,051,180 0.01% 1,103,253 0.00% - Ph.D., Material Science, Massachusetts Institute of Technology, USA Senior Director, Assembly Test Technology & Service, TSMC Vice President, Operations, Vanguard International Semiconductor Corp.
None - - -
Vice President President of TSMC North America Rick Cassidy
11/14/1997 0 0.00% - - - Bachelor, Engineering Technology, United States Military Academy at West Point, USA Vice President of TSMC North America Account Management
Director, TSMC North America - - -
Vice President Human Resources L.C. Tu
01/01/1987 9,310,067 0.04% 1,252,481 0.00% - Master, Business Administration, Tulane University, USA Senior Director, Corporate Planning Organization, TSMC Senior Director, Fab 5 Operation, TSMC
None - - -
As of 02/28/2010

20
TSM
C A
NN
UA
L R
EPO
RT
20
09
2.5.2 Compensation Paid to CEO, President and Vice Presidents (Note 1)
Title Name
Salary Severance Pay and Pensions (Note 5) Bonuses and Allowances (Note 6) Employee Profit Sharing (Note 7) Total Compensation as a % of 2009 Net Income (Note 8)
Exercisable Employee Stock Options (Note 9) Compensation
Received from Non-consoildated AffiliatesFrom TSMC
From All Consoildated
EntitiesFrom TSMC
From All Consoildated
EntitiesFrom TSMC
From All Consoildated
Entities
From TSMC From All Consoildated Entities
From TSMCFrom All
Consoildated Entities
From TSMCFrom All
Consoildated EntitiesCash Stock
(Fair Market Value) Cash Stock (Fair Market Value)
Chairman & Chief Executive Officer Morris Chang (Note 2)
54,570 65,621 5,575 13,008 420,989 487,275 395,314 0 395,314 0 0.98% 1.08% 2,626 3,597 None
PresidentNew Businesses
Rick Tsai
Senior Vice President & Chief Information Officer Information Technology & Materials Management and Risk Management
Stephen T. Tso
Senior Vice President Operations
Mark Liu
Senior Vice President Business Development
C.C. Wei
Senior Vice President Research and Development
Shang-yi Chiang (Note 3)
Vice President Mainstream Fab Operations/Affiliates
M.C. Tzeng
Vice President & General CounselLegal
Richard Thurston
Vice President, Chief Financial Officer & Spokesperson Finance
Lora Ho
Vice President Materials Management and Risk Management
P.H. Chang
Vice President Operations
Wei-Jen Lo
Vice President Worldwide Sales and Marketing
Jason C.S. Chen
Vice President & Chief Technology Officer Research and Development
Jack Sun
Vice President Deputy Head of Research and DevelopmentDesign and Technology Platform
Fu-Chieh Hsu
Vice President Operations
Y.P. Chin
Vice President Quality and Reliability
N.S. Tsai
Vice President President of TSMC North America
Rick Cassidy
Vice President Human Resources
L.C. Tu (Note 4)
Note 1: Compensation Policy: The cash compensation and profit sharing paid to CEO, the President and each vice president are also reviewed by the Compensation Committee individually based on their job responsibility, contribution, performance and projected future risks facing the Company before the compensation and profit sharing proposals are submitted to the Board of Directors for approval.
Note 2: Effective June 12, 2009, the Chairman of the Board, Dr. Morris Chang, was appointed as Chief Executive Officer of TSMC.Note 3: Mr. Shang-yi Chiang was appointed as Senior Vice President on November 10, 2009.Note 4: Mr. L.C. Tu was promoted on August 11, 2009.Note 5: Pensions funded according to applicable law.Note 6: Includes the expense for company cars, gasoline reimbursement and employees’ cash bonus distributed on February 12, 2010. Excludes compensation paid to company drivers totaled NT$3,285 thousand.Note 7: The Board adopted a proposal for 2009 employee profit sharing distribution in 2010 with respect to 2009 earnings at its meeting on February 9, 2010. The above-mentioned figures are preliminary and the proposed employee
profit sharing distribution will be processed after the approval of the same by shareholders at the Annual Shareholders’ Meeting on June 15, 2010.Note 8: Total compensation paid to TSMC’s President and vice presidents in 2008 was NT$784,464 thousand, accounting for 0.78% of 2008 net income.Note 9: Represents cumulative employee stock options exercisable as of the date of this Annual Report.
2009
From TSMC From All Consolidated Entities
Under NT$2,000,000 - -
From NT$2,000,000 ~ NT$5,000,000 - -
From NT$5,000,000 ~ NT$10,000,000 - -
From NT$10,000,000 ~ NT$15,000,000 - -
From NT$15,000,000 ~ NT$30,000,000 Shang-yi Chiang, Y.P. Chin, N.S. Tsai, L.C. Tu
From NT$30,000,000 ~ NT$50,000,000 M.C. Tzeng, Richard Thurston, Lora Ho, P.H. Chang, Wei-Jen Lo, Jason C.S. Chen, Jack Sun, Fu-Chieh Hsu
From NT$50,000,000 ~ NT$100,000,000 Stephen T. Tso, Mark Liu, C.C. Wei, Rick Cassidy
Over NT$100,000,000 Morris Chang, Rick Tsai
Total 18
Compensation Paid to CEO, President and Vice Presidents
Unit: NT$ thousands
CO
MPA
NY
PRO
FILE

21
Title Name
Salary Severance Pay and Pensions (Note 5) Bonuses and Allowances (Note 6) Employee Profit Sharing (Note 7) Total Compensation as a % of 2009 Net Income (Note 8)
Exercisable Employee Stock Options (Note 9) Compensation
Received from Non-consoildated AffiliatesFrom TSMC
From All Consoildated
EntitiesFrom TSMC
From All Consoildated
EntitiesFrom TSMC
From All Consoildated
Entities
From TSMC From All Consoildated Entities
From TSMCFrom All
Consoildated Entities
From TSMCFrom All
Consoildated EntitiesCash Stock
(Fair Market Value) Cash Stock (Fair Market Value)
Chairman & Chief Executive Officer Morris Chang (Note 2)
54,570 65,621 5,575 13,008 420,989 487,275 395,314 0 395,314 0 0.98% 1.08% 2,626 3,597 None
PresidentNew Businesses
Rick Tsai
Senior Vice President & Chief Information Officer Information Technology & Materials Management and Risk Management
Stephen T. Tso
Senior Vice President Operations
Mark Liu
Senior Vice President Business Development
C.C. Wei
Senior Vice President Research and Development
Shang-yi Chiang (Note 3)
Vice President Mainstream Fab Operations/Affiliates
M.C. Tzeng
Vice President & General CounselLegal
Richard Thurston
Vice President, Chief Financial Officer & Spokesperson Finance
Lora Ho
Vice President Materials Management and Risk Management
P.H. Chang
Vice President Operations
Wei-Jen Lo
Vice President Worldwide Sales and Marketing
Jason C.S. Chen
Vice President & Chief Technology Officer Research and Development
Jack Sun
Vice President Deputy Head of Research and DevelopmentDesign and Technology Platform
Fu-Chieh Hsu
Vice President Operations
Y.P. Chin
Vice President Quality and Reliability
N.S. Tsai
Vice President President of TSMC North America
Rick Cassidy
Vice President Human Resources
L.C. Tu (Note 4)

22
TSM
C A
NN
UA
L R
EPO
RT
20
09
2.5.3 Employee Profit Sharing Granted to Management Team (Note 1)
Title NameStock
(Fair Market Value)Cash Total Employee Profit Sharing
Total Employee Profit Sharing Paid to Management Team as a % of 2009 Net Income
Chairman & Chief Executive Officer Morris Chang (Note 2)
0 421,097 421,097 0.47%
PresidentNew Businesses
Rick Tsai
Senior Vice President & Chief Information Officer Information Technology & Materials Management and Risk Management
Stephen T. Tso
Senior Vice President Operations
Mark Liu
Senior Vice President Business Development
C.C. Wei
Senior Vice President Research and Development
Shang-yi Chiang (Note 3)
Vice President Mainstream Fab Operations/Affiliates
M.C. Tzeng
Vice President & General Counsel Legal
Richard Thurston
Vice President, Chief Financial Officer & Spokesperson Finance
Lora Ho
Vice President Materials Management and Risk Management
P.H. Chang
Vice President Operations
Wei-Jen Lo
Vice President Worldwide Sales and Marketing
Jason C.S. Chen
Vice President & Chief Technical Officer Research and Development
Jack Sun
Vice PresidentDeputy Head of Research and Development Design and Technology Platform
Fu-Chieh Hsu
Vice President Operations
Y.P. Chin
Vice President Quality and Reliability
N.S. Tsai
Vice President Human Resources
L.C. Tu (Note 4)
Senior Director Finance
Jan Kees van Vliet
Senior Director New Businesses
Y.C. Chao (Note 5)
Senior Director Corporate Planning
Irene Sun (Note 6)
Note 1: The Board adopted a proposal for 2009 employee profit sharing distribution in 2010 with respect to 2009 earnings at its meeting on February 9, 2010. The above-mentioned figures are preliminary and the proposed employee profit sharing distribution will be processed after the approval of the same by shareholders at the Annual Shareholders’ Meeting on June 15, 2010.
Note 2: Effective June 12, 2009, the Chairman of the Board, Dr. Morris Chang, was appointed as Chief Executive Officer of TSMC.Note 3: Mr. Shang-yi Chiang was appointed as Senior Vice President on November 10, 2009.Note 4: Mr. L.C. Tu was promoted on August 11, 2009.Note 5: Mr. Y.C. Chao was promoted on May 6, 2009.Note 6: Ms. Irene Sun was promoted on August 11, 2009.
Unit: NT$ thousands
CO
MPA
NY
PRO
FILE

23
Title NameStock
(Fair Market Value)Cash Total Employee Profit Sharing
Total Employee Profit Sharing Paid to Management Team as a % of 2009 Net Income
Chairman & Chief Executive Officer Morris Chang (Note 2)
0 421,097 421,097 0.47%
PresidentNew Businesses
Rick Tsai
Senior Vice President & Chief Information Officer Information Technology & Materials Management and Risk Management
Stephen T. Tso
Senior Vice President Operations
Mark Liu
Senior Vice President Business Development
C.C. Wei
Senior Vice President Research and Development
Shang-yi Chiang (Note 3)
Vice President Mainstream Fab Operations/Affiliates
M.C. Tzeng
Vice President & General Counsel Legal
Richard Thurston
Vice President, Chief Financial Officer & Spokesperson Finance
Lora Ho
Vice President Materials Management and Risk Management
P.H. Chang
Vice President Operations
Wei-Jen Lo
Vice President Worldwide Sales and Marketing
Jason C.S. Chen
Vice President & Chief Technical Officer Research and Development
Jack Sun
Vice PresidentDeputy Head of Research and Development Design and Technology Platform
Fu-Chieh Hsu
Vice President Operations
Y.P. Chin
Vice President Quality and Reliability
N.S. Tsai
Vice President Human Resources
L.C. Tu (Note 4)
Senior Director Finance
Jan Kees van Vliet
Senior Director New Businesses
Y.C. Chao (Note 5)
Senior Director Corporate Planning
Irene Sun (Note 6)

24
TSM
C A
NN
UA
L R
EPO
RT
20
09
CO
RPO
RATE
GO
VER
NA
NC
E

25
TSMC advocates and acts upon the principles of operational transparency and respect for shareholder rights. We believe that the basis for successful corporate governance is a sound and effective Board of Directors. In line with this principle, TSMC’s Board of Directors established an Audit Committee in 2002 and a Compensation Committee in 2003.
TSMC’s corporate governance won international recognition in 2009: Corporate Governance Asia honored TSMC with its “Corporate Governance Asia Recognition in Taiwan”. FinanceAsia Magazine ranked TSMC’s corporate governance as the best among all companies in Taiwan with its “Best at Corporate Governance” for the Taiwan region.
3.1 Board of DirectorsTSMC’s Board of Directors consists of seven (Note) distinguished members with a great breadth of experience as world-class business leaders or scholars. Three of the seven members are independent directors: former British Telecommunications Chief Executive Officer, Sir Peter Bonfield; former Acer Group Chairman, Mr. Stan Shih; and former Texas Instrument Inc. Chairman of the Board, Mr. Thomas J. Engibous. Under the leadership of Chairman Morris Chang, TSMC’s Board of Directors takes a serious and forthright approach to its duties and is a serious, competent and independent Board.
In the spirit of Chairman Chang’s approach to corporate governance, a board of directors’ primary duty is to supervise. The Board should supervise the Company’s: compliance with relevant laws and regulations; financial transparency; timely disclosure of material information, and maintaining of highest integrity within the Company. TSMC’s Board of Directors strives to perform through the Audit Committee and the Compensation Committee, the hiring of a financial expert for the Audit Committee, coordination with the Internal Audit department, and through the ombudsman reporting system.
The second duty of the board of directors is to provide guidance to the management team of the Company. Quarterly, TSMC’s management reports to the TSMC Board on a variety of subjects. The management also reviews the Company’s business strategies with the Board. Furthermore, the management often reviews with and updates TSMC’s Board on the progress of the strategies, obtaining Board guidance as appropriate.
The third duty of the Board of Directors is to evaluate the management’s performance and to dismiss officers of the Company when necessary. TSMC’s management has maintained a healthy and functional communication with TSMC Board of Directors, has been devoted in executing guidance of TSMC Board of Directors, and is dedicated in running the business operations, all to achieve the best interests for TSMC shareholders.
Note: Throughout most of 2009, TSMC’s Board of Directors consisted of eight directors. Ms. Carleton Fiorina resigned as an independent director of TSMC on November 30, 2009, because she planned to devote her full time and energy to US senatorial campaign.
3. CORPORATE GOVERNANCE

26
TSM
C A
NN
UA
L R
EPO
RT
20
09
Board of Directors Meeting StatusDr. Morris Chang, the Chairman of the Board of Directors, convened four regular meetings and three special meetings in 2009. The directors’ attendance status is as follows:
Title Name Attendancein Person By Proxy Attendance Rate
in Person (%) Notes
Chairman Morris Chang 7 0 100% Renewal of office (Re-elected on June 10)
Vice Chairman F.C. Tseng 7 0 100% Renewal of office (Re-elected on June 10)
Director National Development Fund, Executive Yuan Representative: Tian-Jy Chen
2 5 29% Renewal of office (Re-elected on June 10)The former representative of the National Development Fund, Mr. Chintay Shih, resigned on November 10, 2008. Mr. Tian-Jy Chen was appointed as the representative on April 22, 2009.
Director Rick Tsai 7 0 100% Renewal of office (Re-elected on June 10)
Independent Director Sir Peter Leahy Bonfield 4 3 57% Renewal of office (Re-elected on June 10)Sir Peter Bonfield participated in the discussion through telephone at two Special Meetings, represented by proxy.
Independent Director Lester Carl Thurow 0 2 0% Term Expired (Professor Thurow’s tenure expired on June 9, 2009 because he was not re-elected at the 2009 Annual Shareholders’ Meeting.)
Independent Director Stan Shih 7 0 100% Renewal of office (Re-elected on June 10)
Independent Director Carleton (Carly) S. Fiorina 1 5 17% Renewal of office (Re-elected on June 10)Ms. Fiorina resigned as an independent director of TSMC on November 30, 2009.Ms. Fiorina participated in the discussion through telephone at one special meeting, represented by proxy.
Independent Director Thomas J. Engibous 3 0 75% New office assumed (Elected on June 10)Mr. Engibous attended via telephone at one special meeting.
Annotations:1. In 2009, there were no written or otherwise recorded resolutions on which an independent director had a dissenting opinion or qualified opinion.2. There were no recusals of Directors due to conflicts of interests in 2009.3. Measures taken to strengthen the functionality of the Board: We believe that the basis for successful corporate governance is a sound and effective Board of Directors. In line with this principle, TSMC’s Board of
Directors has established an Audit Committee and a Compensation Committee to assist the Board in carrying out its various duties.
3.1.1 Audit Committee
The Audit Committee assists the Board in carrying out its financial oversight responsibilities and other duties as set forth in the Company Act, the Securities and Exchange Act, and other applicable laws and regulations. Matters required to be reviewed by the Audit Committee include the Company’s: financial reports; auditing and accounting policies and procedures; internal control systems; material asset or derivatives transactions; offering or issuance of any equity-type securities; hiring or dismissal of an attesting CPA, or the compensation given thereto; and appointment or discharge of financial, accounting, or internal auditing officers.
TSMC’s Audit Committee is empowered by its Charter to conduct any study or investigation it deems appropriate to fulfill its responsibilities. It has direct access to TSMC’s internal auditors, the Company’s independent auditors, and all employees of the Company. The Committee is authorized to retain and oversee special legal, accounting, or other consultants as it deems appropriate to fulfill its mandate.
As of February 2010, the Audit Committee was comprised of all three independent directors and had engaged a financial expert consultant. The Audit Committee Charter is available on TSMC’s corporate website.
Audit Committee Meeting StatusSir Peter Bonfield, Chairman of the Audit Committee, convened four regular meetings and three special meetings in 2009. The Committee members’ attendance status is as follows:
Title Name Attendancein Person By Proxy Attendance Rate
in Person (%) Notes
Chair Sir Peter Leahy Bonfield 7 0 100% Renewal of office (Note)
Member Lester Carl Thurow 1 2 33% Term Expired (After the re-election of the Board of Directors at the 2009 Annual Shareholders’ Meeting on June 10, 2009, Professor Thurow did not become a member of the Audit Committee.)
Member Stan Shih 7 0 100% Renewal of office (Note)
Member Carleton (Carly) S. Fiorina 3 2 43% Renewal of office (Note)Ms. Fiorina resigned on November 30, 2009.
Member Thomas J. Engibous 4 0 100% New office assumed (Note)
Financial Expert J.C. Lobbezoo 7 0 100% None
Annotations:1. Resolution under Securities and Exchange Act §14-5 that was not submitted to the Audit Committee* but approved by all directors at the Board of Director’s special meeting held on December 9, 2009: Resolution: To approve investment in an amount not exceeding NT$6,300 million in Motech Industries, Inc. * The urgency of the matter required an immediate resolution. Since most of the Audit Committee members were overseas, the meeting could not be effectively convened. Therefore, the matter was not submitted
to the Audit Committee for approval, but it was approved by all the directors present at the Board of Director’s special meeting held on December 9, 2009.2. There were no recusals of independent directors due to conflicts of interests in 2009.3. Descriptions of the communications between the independent directors, the internal auditors, and the independent auditors in 2009 (e.g. the channels, items and/or results of the audits on the corporate finance
and/or operations, etc.):1) The internal auditors have sent the audit reports to the members of the Audit Committee periodically, and presented the findings of all audit reports in the quarterly meetings of the Audit Committee. The head of
Internal Audit will immediately report to the members of the Audit Committee any material matters. During 2009, the head of Internal Audit did not report any irregularity. The communication channel between the Audit Committee and the internal auditor functioned well.
2) The Company’s independent auditors have presented the findings of their quarterly audits on the company’s financial results. Under applicable laws and regulations, the independent auditors are also required to immediately communicate to the Audit Committee any material matters that they have discovered. During 2009, the Company’s independent auditors did not report any irregularity. The communication channel between the Audit Committee and the independent auditors functioned well.
Note: Sir Peter Leahy Bonfield, Mr. Stan Shih, Ms. Carleton Fiorina and Mr. Thomas J. Engibous were elected as TSMC’s independent directors and became members of the Audit Committee on June 10, 2009.
CO
RPO
RATE
GO
VER
NA
NC
E
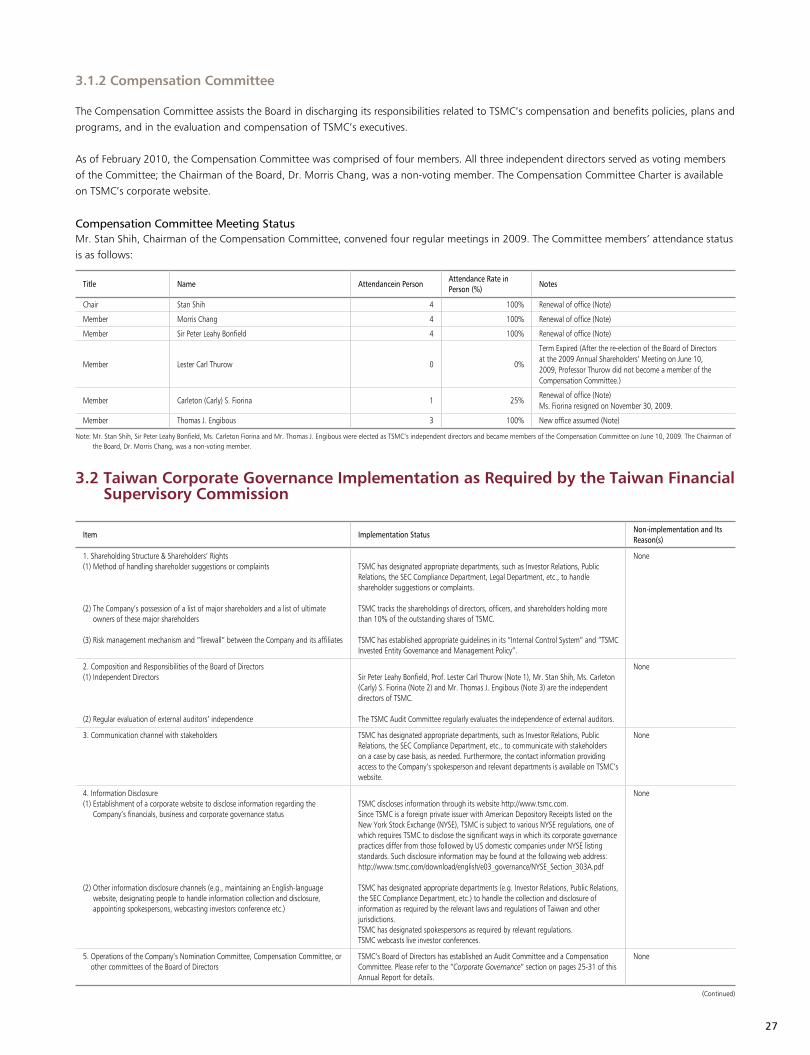
27
3.1.2 Compensation Committee
The Compensation Committee assists the Board in discharging its responsibilities related to TSMC’s compensation and benefits policies, plans and
programs, and in the evaluation and compensation of TSMC’s executives.
As of February 2010, the Compensation Committee was comprised of four members. All three independent directors served as voting members
of the Committee; the Chairman of the Board, Dr. Morris Chang, was a non-voting member. The Compensation Committee Charter is available
on TSMC’s corporate website.
Compensation Committee Meeting StatusMr. Stan Shih, Chairman of the Compensation Committee, convened four regular meetings in 2009. The Committee members’ attendance status
is as follows:
Item Implementation StatusNon-implementation and Its Reason(s)
1. Shareholding Structure & Shareholders’ Rights(1) Method of handling shareholder suggestions or complaints
(2) The Company’s possession of a list of major shareholders and a list of ultimate owners of these major shareholders
(3) Risk management mechanism and “firewall” between the Company and its affiliates
TSMC has designated appropriate departments, such as Investor Relations, Public Relations, the SEC Compliance Department, Legal Department, etc., to handle shareholder suggestions or complaints.
TSMC tracks the shareholdings of directors, officers, and shareholders holding more than 10% of the outstanding shares of TSMC.
TSMC has established appropriate guidelines in its “Internal Control System” and “TSMC Invested Entity Governance and Management Policy”.
None
2. Composition and Responsibilities of the Board of Directors(1) Independent Directors
(2) Regular evaluation of external auditors’ independence
Sir Peter Leahy Bonfield, Prof. Lester Carl Thurow (Note 1), Mr. Stan Shih, Ms. Carleton (Carly) S. Fiorina (Note 2) and Mr. Thomas J. Engibous (Note 3) are the independent directors of TSMC.
The TSMC Audit Committee regularly evaluates the independence of external auditors.
None
3. Communication channel with stakeholders TSMC has designated appropriate departments, such as Investor Relations, Public Relations, the SEC Compliance Department, etc., to communicate with stakeholders on a case by case basis, as needed. Furthermore, the contact information providing access to the Company’s spokesperson and relevant departments is available on TSMC’s website.
None
4. Information Disclosure(1) Establishment of a corporate website to disclose information regarding the
Company’s financials, business and corporate governance status
(2) Other information disclosure channels (e.g., maintaining an English-language website, designating people to handle information collection and disclosure, appointing spokespersons, webcasting investors conference etc.)
TSMC discloses information through its website http://www.tsmc.com.Since TSMC is a foreign private issuer with American Depository Receipts listed on the New York Stock Exchange (NYSE), TSMC is subject to various NYSE regulations, one of which requires TSMC to disclose the significant ways in which its corporate governance practices differ from those followed by US domestic companies under NYSE listing standards. Such disclosure information may be found at the following web address: http://www.tsmc.com/download/english/e03_governance/NYSE_Section_303A.pdf
TSMC has designated appropriate departments (e.g. Investor Relations, Public Relations, the SEC Compliance Department, etc.) to handle the collection and disclosure of information as required by the relevant laws and regulations of Taiwan and other jurisdictions.TSMC has designated spokespersons as required by relevant regulations.TSMC webcasts live investor conferences.
None
5. Operations of the Company’s Nomination Committee, Compensation Committee, or other committees of the Board of Directors
TSMC’s Board of Directors has established an Audit Committee and a Compensation Committee. Please refer to the “Corporate Governance” section on pages 25-31 of this Annual Report for details.
None
3.2 Taiwan Corporate Governance Implementation as Required by the Taiwan Financial Supervisory Commission
Title Name Attendancein PersonAttendance Rate in Person (%)
Notes
Chair Stan Shih 4 100% Renewal of office (Note)
Member Morris Chang 4 100% Renewal of office (Note)
Member Sir Peter Leahy Bonfield 4 100% Renewal of office (Note)
Member Lester Carl Thurow 0 0%
Term Expired (After the re-election of the Board of Directors at the 2009 Annual Shareholders’ Meeting on June 10, 2009, Professor Thurow did not become a member of the Compensation Committee.)
Member Carleton (Carly) S. Fiorina 1 25%Renewal of office (Note)Ms. Fiorina resigned on November 30, 2009.
Member Thomas J. Engibous 3 100% New office assumed (Note)
(Continued)
Note: Mr. Stan Shih, Sir Peter Leahy Bonfield, Ms. Carleton Fiorina and Mr. Thomas J. Engibous were elected as TSMC’s independent directors and became members of the Compensation Committee on June 10, 2009. The Chairman of the Board, Dr. Morris Chang, was a non-voting member.

28
TSM
C A
NN
UA
L R
EPO
RT
20
09
Continuing Education/Training of Directors in 2009
Note: Selected speeches on corporate governance and related topics.
Name Date Host by Training/Speech Title Duration
Morris Chang (Note) 11/20 Taiwan GreTai Securities Market Corporate Social Responsibility in Taiwan 0.5 hour
F.C. Tseng 08/13 Taiwan Corporate Governance Association Facing the global financial crisis, how do companies deal with and create sustaining capabilities
3 hours
Sir Peter Leahy Bonfield 02/19 Ericsson Corporate Board Governance Programme 1 day
11/23 Mentor Graphics Corporation Inc. Corporate Governance 0.5 day
Morris ChangF.C. TsengSir Peter Leahy BonfieldStan ShihThomas J. EngibousRick Tsai
06/11 TSMC Speech: “Outlook of Taiwan Economy”by Minister Chen Tain-Jy, Council for Economic Planning and Development, the Executive Yuan
0.5 hour
1. From time to time, TSMC provides directors with information concerning regulatory requirements and developments as related to directors’ activities. TSMC management also regularly presents updates on the Company’s business and other information to directors.
2. Regular regulatory update reports are provided by TSMC’s General Counsel and by the Company’s independent auditors at the Audit Committee meetings.
Continuing Education/Training of Management in 2009
Title/Name Date Host by Training Duration
Director Accounting DivisionJessica Chou
09/24 Accounting Research and Development Foundation
Summary on the latest industrial developments and key points to financial analysis 3 hours
11/11 Discussion on the advantages and action plans from directors, supervisors and executives in response to the implementation of IFRS (International Financial Reporting Standard)
3 hours
11/11 Notice on the adoption of XBRL (Extensible Business Reporting Language) – Practice and best implementation actions
3 hours
12/10 The legal responsibility, action plans and case study of “insider transactions” for insider in publicly-held companies
3 hours
Director Internal AuditJohn Liang
12/21 Institute of Internal Audit – ROC (IIA) Control Self-assessment: Facilitation Skills for Financial Reporting 6 hours
03/06 - 03/07 2009 IIA Conference: IA Value Creation & Corporate Governance 12 hours
11/19 The Second Annual Chief Audit Executive Forum 8 hours
Vice Presidents:Stephen T. TsoMark LiuC.C. WeiRichard ThurstonLora HoP.H. ChangWei-Jen LoJason ChenJack SunFu-Chieh HsuY.P. ChinN.S. Tsai
06/11 TSMC Speech: “Outlook of Taiwan Economy”by Minister Chen Tain-Jy, Council for Economic Planning and Development, the Executive Yuan
0.5 hour
Note 1: Professor Lester Thurow’s tenure expired on June 9, 2009 because he was not re-elected at the 2009 Annual Shareholders’ Meeting.Note 2: Ms. Carleton Fiorina resigned as an independent director of TSMC on November 30, 2009.Note 3: Mr. Thomas Engibous was elected as TSMC’s independent director at the 2009 Annual Shareholders' Meeting on June 10, 2009.
6. If the Company has established corporate governance policies based on TSE Corporate Governance Best Practice Principles, please describe any discrepancy between the policies and their implementation.
TSMC does not establish corporate governance policies. For the status of TSMC’s corporate governance, please refer to the “Corporate Governance” section on pages 25-31 of this Annual Report.
7. Other important information to facilitate better understanding of the Company’s corporate governance practices (e.g., employee rights, employee wellness, investor relations, supplier relations, rights of stakeholders, directors’ training records, the implementation of risk management policies and risk evaluation measures, the implementation of customer relations policies, and purchasing insurance for directors):
(1) Status of employee rights and employee wellness: Please refer to the “Employees” section on pages 54-56 of this Annual Report.(2) Status of investor relations, supplier relations and rights of stakeholders: Please refer to the “Corporate Social Responsibility” on pages 69-75 of this Annual Report.(3) Status of Risk Management Policies and Risk Evaluation: Please refer to the “Risk Management” section on pages 62-67 of this Annual Report.(4) Status of Customer Relations Policies: Please refer to the “Customer Partnership” section on pages 52-53 of this Annual Report.(5) TSMC maintains D&O Insurance for its directors and officers.
8. If the Company has a self corporate governance evaluation or has authorized any other professional organization to conduct such an evaluation, the evaluation results, major deficiencies or suggestions, and improvements are stated as follows: None
TSMC’s corporate governance won international recognition in 2009: Corporate Governance Asia honored TSMC with its “Corporate Governance Asia Recognition in Taiwan”. FinanceAsia Magazine ranked TSMC’s corporate governance as the best among all companies in Taiwan with its “Best at Corporate Governance” for the Taiwan region.
CO
RPO
RATE
GO
VER
NA
NC
E
29
3.3 Major Resolutions of Shareholders’ Meeting and Board Meetings
3.3.1 Major Resolutions of Shareholders’ Meeting and Implementation Status
TSMC’s 2009 regular Shareholders’ Meeting was held in Hsinchu,
Taiwan on June 10, 2009. At the meeting, shareholders present in
person or by proxy approved the following resolutions:
(1) The 2008 Business Report and Financial Statements
(2) The distribution of 2008 profits
(3) The capitalization of 2008 dividends, 2008 employee profit
sharing, and capital surplus
(4) The amendments to internal policies and rules as follows:● Procedures for Lending Funds to Other Parties● Procedures for Endorsement and Guarantee
(5) Election of eight directors (including four independent directors)
Implementation Status: All the resolutions of the Shareholders’
Meeting have been fully implemented in accordance with the
resolutions.
The eight newly elected directors: Morris Chang, F.C. Tseng, Peter
Leahy Bonfield (Independent Director), Stan Shih (Independent
Director), Carleton Sneed Fiorina (Independent Director), Thomas
J. Engibous (Independent Director), Tain-Jy Chen (representative
of National Development Fund, Executive Yuan) and Rick Tsai
3.3.2 Major Resolutions of Board Meetings
During the 2009 calendar year, and through the period of January 1
to February 28, 2010, five regular board meetings and three special
board meetings were convened. Major resolutions approved at these
meetings are summarized below:
(1) Regular Board Meeting of February 10, 2009:● approving 2008 business report and financial statements● �approving distribution of 2008 profits, and the capitalization of dividends, employee profit sharing and capital surplus● convening the 2009 Annual Shareholders’ Meeting● appointment of Dr. L. John Liang as the head of Internal Audit of TSMC
(2) Special Board Meeting of April 17, 2009:● listing four qualified candidates for independent directors to stand for election at TSMC’s 2009 regular Shareholders’
Meeting
(3) Regular Board Meeting of June 11, 2009:● election of Dr. Morris Chang as the Chairman and Dr. F.C. Tseng as the Vice Chairman of the Board of Directors● �appointment of Dr. Morris Chang as Chief Executive Officer concurrent with his position as Chairman of the Board, effective
June 12, 2009
● appointment of Dr. Rick Tsai as President of New Businesses, effective June 12, 2009● approving capital appropriation of US$130 million
(4) Regular Board Meeting of August 11, 2009:● �approving capital appropriations of US$1,166.8 million● approving 2009 semi-annual financial statements● appointment of L.C. Tu as Vice President of TSMC
(5) Regular Board Meeting of November 10, 2009:● approving capital appropriations of US$2,541.4 million● appointment of Dr. Shang-yi Chiang as Senior Vice President of TSMC● �appointment of Dr. Jack Sun as Chief Technology Officer of TSMC●��approving acquisition of shares of Semiconductor
Manufacturing International Corporation (SMIC) in accordance
with relevant agreements executed between TSMC and SMIC.
The actual acquisition of the SMIC shares shall be subject to the
approval of the relevant regulatory authorities in charge.
(6) Special Board Meeting of December 9, 2009● �approving investment in an amount not exceeding
NT$6,300 million in Motech Industries, Inc.
(7) Regular Board Meeting of February 8 & 9, 2010:● approving 2009 business report and financial statements● �approving distribution of 2009 profits, and cash dividends and employee profit sharing● �approving 2010 R&D and sustaining capital appropriations of US$534.6 million● approving capital appropriations of US$2,272.4 million● �approving amendments to TSMC’s Articles of Incorporation
expanding the Company’s business scope to encompass LED
lighting and solar energy● �convening the 2010 Annual Shareholders’ Meeting
3.3.3 Major Issues of Record or Written Statements Made by Any Director Dissenting to Important Resolutions Passed by the Board of Directors from January 1, 2009 to February 28, 2010: None.
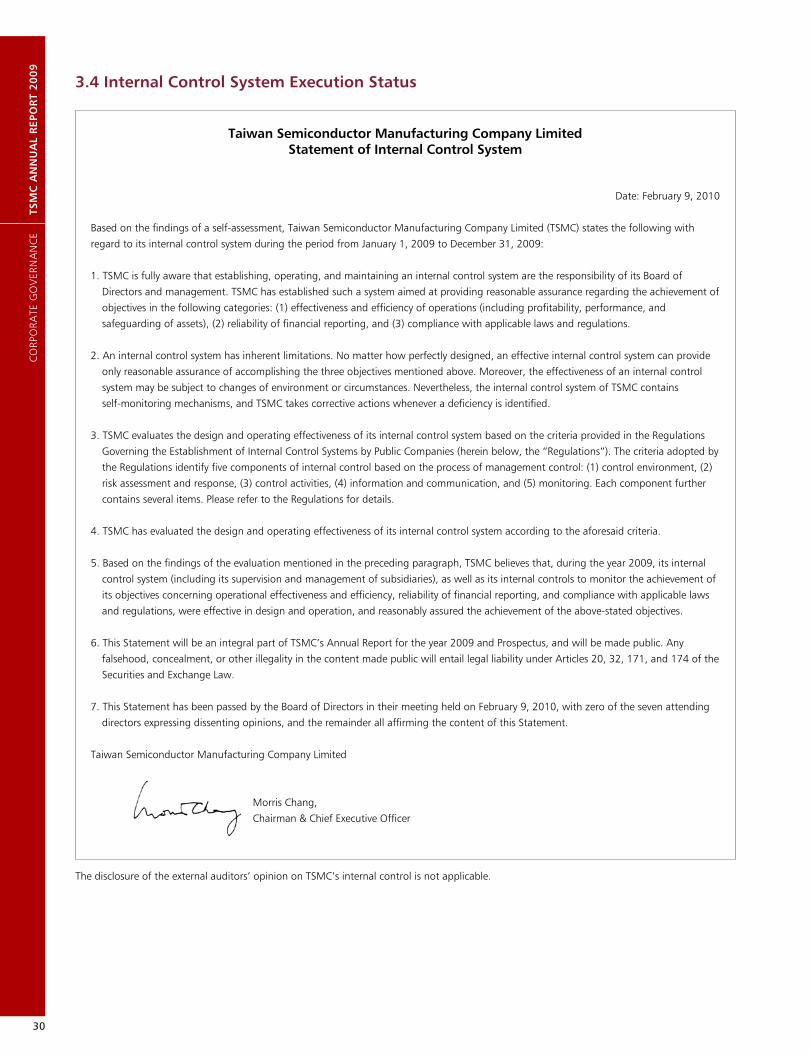
30
TSM
C A
NN
UA
L R
EPO
RT
20
09
3.4 Internal Control System Execution Status
Taiwan Semiconductor Manufacturing Company Limited Statement of Internal Control System
Date: February 9, 2010
Based on the findings of a self-assessment, Taiwan Semiconductor Manufacturing Company Limited (TSMC) states the following with
regard to its internal control system during the period from January 1, 2009 to December 31, 2009:
1. TSMC is fully aware that establishing, operating, and maintaining an internal control system are the responsibility of its Board of
Directors and management. TSMC has established such a system aimed at providing reasonable assurance regarding the achievement of
objectives in the following categories: (1) effectiveness and efficiency of operations (including profitability, performance, and
safeguarding of assets), (2) reliability of financial reporting, and (3) compliance with applicable laws and regulations.
2. An internal control system has inherent limitations. No matter how perfectly designed, an effective internal control system can provide
only reasonable assurance of accomplishing the three objectives mentioned above. Moreover, the effectiveness of an internal control
system may be subject to changes of environment or circumstances. Nevertheless, the internal control system of TSMC contains
self-monitoring mechanisms, and TSMC takes corrective actions whenever a deficiency is identified.
3. TSMC evaluates the design and operating effectiveness of its internal control system based on the criteria provided in the Regulations
Governing the Establishment of Internal Control Systems by Public Companies (herein below, the “Regulations”). The criteria adopted by
the Regulations identify five components of internal control based on the process of management control: (1) control environment, (2)
risk assessment and response, (3) control activities, (4) information and communication, and (5) monitoring. Each component further
contains several items. Please refer to the Regulations for details.
4. TSMC has evaluated the design and operating effectiveness of its internal control system according to the aforesaid criteria.
5. Based on the findings of the evaluation mentioned in the preceding paragraph, TSMC believes that, during the year 2009, its internal
control system (including its supervision and management of subsidiaries), as well as its internal controls to monitor the achievement of
its objectives concerning operational effectiveness and efficiency, reliability of financial reporting, and compliance with applicable laws
and regulations, were effective in design and operation, and reasonably assured the achievement of the above-stated objectives.
6. This Statement will be an integral part of TSMC’s Annual Report for the year 2009 and Prospectus, and will be made public. Any
falsehood, concealment, or other illegality in the content made public will entail legal liability under Articles 20, 32, 171, and 174 of the
Securities and Exchange Law.
7. This Statement has been passed by the Board of Directors in their meeting held on February 9, 2010, with zero of the seven attending
directors expressing dissenting opinions, and the remainder all affirming the content of this Statement.
Taiwan Semiconductor Manufacturing Company Limited
Morris Chang,
Chairman & Chief Executive Officer
The disclosure of the external auditors’ opinion on TSMC’s internal control is not applicable.
CO
RPO
RATE
GO
VER
NA
NC
E

31
3.5 Status of Personnel Responsible for Preparing Financial Reports
3.5.1 Resignation or Dismissal of Personnel Responsible for Financial Report
3.6.2 TSMC did not replace its independent auditor during 2008, 2009, and as of February 28, 2010.
3.6.3 TSMC’s Chairman, Chief Executive Officer, Chief Financial Officer, and managers in charge of its finance and accounting operations did not hold any positions within TSMC’s independent audit firm or its affiliates during 2009.
3.7 Material Information Management Procedure
TSMC has established relevant procedures for material information management and disclosure. All relevant departments and employees are
required to comply with the procedures and other applicable regulations when they become aware of any potential material information and the
disclosure thereof.
3.5.2 Certification Details of Employees Whose Jobs are Related to the Release of the Company’s Financial Information
CertificationNumber of Employees
Internal Audit Finance
Certified Public Accountants (CPA) 1 16
US Certified Public Accountants (US CPA) 1 6
Certified Internal Auditor (CIA) 4 4
Chartered Financial Analyst (CFA) 0 3
Certified Management Accountant (CMA) 0 1
Financial Risk Manager (FRM) 0 2
Cerficate in Financial Management (CFM) 0 1
Certification in Control Self-Assessment (CCSA) 2 0
Certified Information Systems Auditor (CISA) 2 0
BS7799/ISO 27001 Lead Auditor 1 0
3.6 Information Regarding TSMC’s Independent Auditor
3.6.1 Audit Fees
Accounting Firm Name of CPA Audit Fee
Non-audit FeeWhether the CPA’s Audit Period Covers an
Entire Fiscal YearNote
SystemDesign
CompanyRegistration
HumanResource
Others Subtotal Yes NoAudit Period
Deloitte & Touche Hung-Peng Lin,Shu-Chieh Huang,and others
74,166 - 285 - 600 885 ˇ
Unit: NT$ thousands
Note: Article 10-4 of Regulation Governing Information to be published in Annual Report of Public Companies was not applicable to TSMC.
Title Name Date Effective Date Resigned/Dismissed Reasons for Resignation or Dismissal
President & CEO Rick Tsai 07/01/2005 06/11/2009 Dr. Tsai was assigned as President of New Businesses, effective on June 12, 2009.
Senior DirectorInternal Audit
Jan Kees van Vliet 12/02/2003 02/10/2009 Mr. van Vliet was transferred to other department.

32
TSM
C A
NN
UA
L R
EPO
RT
20
09
CA
PITA
L A
ND
SH
ARE
S

33
4. CAPITAL AND SHARES
4.1 Capital and Shares
4.1.1 Capitalization
Month/ Year
Issue Price (Per Share)
Authorized Share Capital Capital Stock Remark
Shares Amount Shares Amount Sources of CapitalCapital Increase by Assets Other than Cash
Date of Approval & Approval Document No.
03/2009 10 28,050,000,000 280,500,000,000 25,625,437,256 256,254,372,560 Exercise of Employee Stock Options: NT$1,462,990
None 03/09/2009 Yuan Shang Tzu No. 0980005952
08/2009 10 28,050,000,000 280,500,000,000 25,626,012,160 256,260,121,600 Exercise of Employee Stock Options: NT$5,749,040
None 08/17/2009 Yuan Shang Tzu No. 0980023001
08/2009 10 28,050,000,000 280,500,000,000 25,896,009,261 258,960,092,610 Capitalization of Profits: NT$1,931,207,890 Capitalization of Surplus: NT$768,763,120
None 08/18/2009 Yuan Shang Tzu No. 0980023041
09/2009 10 28,050,000,000 280,500,000,000 25,896,353,344 258,963,533,440 Exercise of Employee Stock Options: NT$3,440,830
None 09/16/2009 Yuan Shang Tzu No. 0980026364
12/2009 10 28,050,000,000 280,500,000,000 25,900,662,339 259,006,623,390 Exercise of Employee Stock Options: NT$43,089,950
None 12/02/2009 Yuan Shang Tzu No. 0980034205
Unit: Share/NT$ As of 02/28/2010
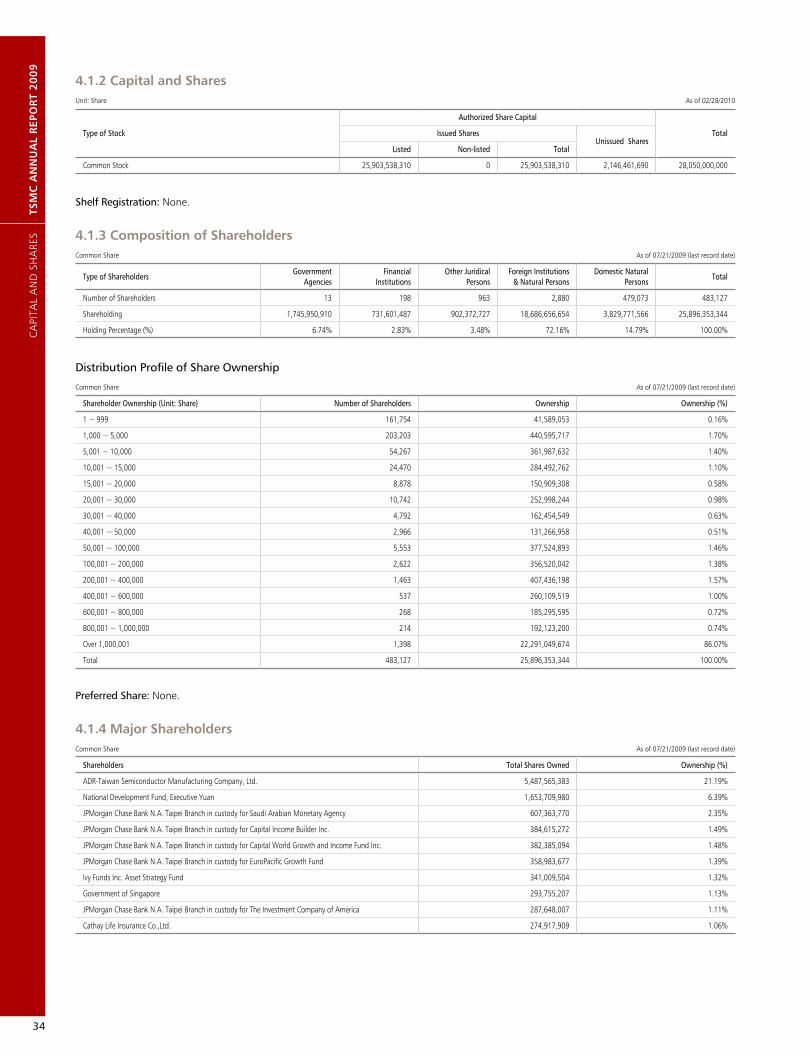
34
TSM
C A
NN
UA
L R
EPO
RT
20
09
Common Share As of 07/21/2009 (last record date)
4.1.2 Capital and SharesUnit: Share As of 02/28/2010
Type of Stock
Authorized Share Capital
TotalIssued SharesUnissued Shares
Listed Non-listed Total
Common Stock 25,903,538,310 0 25,903,538,310 2,146,461,690 28,050,000,000
Shelf Registration: None.
4.1.3 Composition of Shareholders
Type of ShareholdersGovernment
Agencies Financial
InstitutionsOther Juridical
PersonsForeign Institutions
& Natural PersonsDomestic Natural
PersonsTotal
Number of Shareholders 13 198 963 2,880 479,073 483,127
Shareholding 1,745,950,910 731,601,487 902,372,727 18,686,656,654 3,829,771,566 25,896,353,344
Holding Percentage (%) 6.74% 2.83% 3.48% 72.16% 14.79% 100.00%
Shareholder Ownership (Unit: Share) Number of Shareholders Ownership Ownership (%)
1 ~ 999 161,754 41,589,053 0.16%
1,000 ~ 5,000 203,203 440,595,717 1.70%
5,001 ~ 10,000 54,267 361,987,632 1.40%
10,001 ~ 15,000 24,470 284,492,762 1.10%
15,001 ~ 20,000 8,878 150,909,308 0.58%
20,001 ~ 30,000 10,742 252,998,244 0.98%
30,001 ~ 40,000 4,792 162,454,549 0.63%
40,001 ~ 50,000 2,966 131,266,958 0.51%
50,001 ~ 100,000 5,553 377,524,893 1.46%
100,001 ~ 200,000 2,622 356,520,042 1.38%
200,001 ~ 400,000 1,463 407,436,198 1.57%
400,001 ~ 600,000 537 260,109,519 1.00%
600,001 ~ 800,000 268 185,295,595 0.72%
800,001 ~ 1,000,000 214 192,123,200 0.74%
Over 1,000,001 1,398 22,291,049,674 86.07%
Total 483,127 25,896,353,344 100.00%
Distribution Profile of Share Ownership
Common Share As of 07/21/2009 (last record date)
Preferred Share: None.
4.1.4 Major Shareholders
Shareholders Total Shares Owned Ownership (%)
ADR-Taiwan Semiconductor Manufacturing Company, Ltd. 5,487,565,383 21.19%
National Development Fund, Executive Yuan 1,653,709,980 6.39%
JPMorgan Chase Bank N.A. Taipei Branch in custody for Saudi Arabian Monetary Agency 607,363,770 2.35%
JPMorgan Chase Bank N.A. Taipei Branch in custody for Capital Income Builder Inc. 384,615,272 1.49%
JPMorgan Chase Bank N.A. Taipei Branch in custody for Capital World Growth and Income Fund Inc. 382,385,094 1.48%
JPMorgan Chase Bank N.A. Taipei Branch in custody for EuroPacific Growth Fund 358,983,677 1.39%
Ivy Funds Inc. Asset Strategy Fund 341,009,504 1.32%
Government of Singapore 293,755,207 1.13%
JPMorgan Chase Bank N.A. Taipei Branch in custody for The Investment Company of America 287,648,007 1.11%
Cathay Life Insurance Co.,Ltd. 274,917,909 1.06%
Common Share As of 07/21/2009 (last record date)
CA
PITA
L A
ND
SH
ARE
S
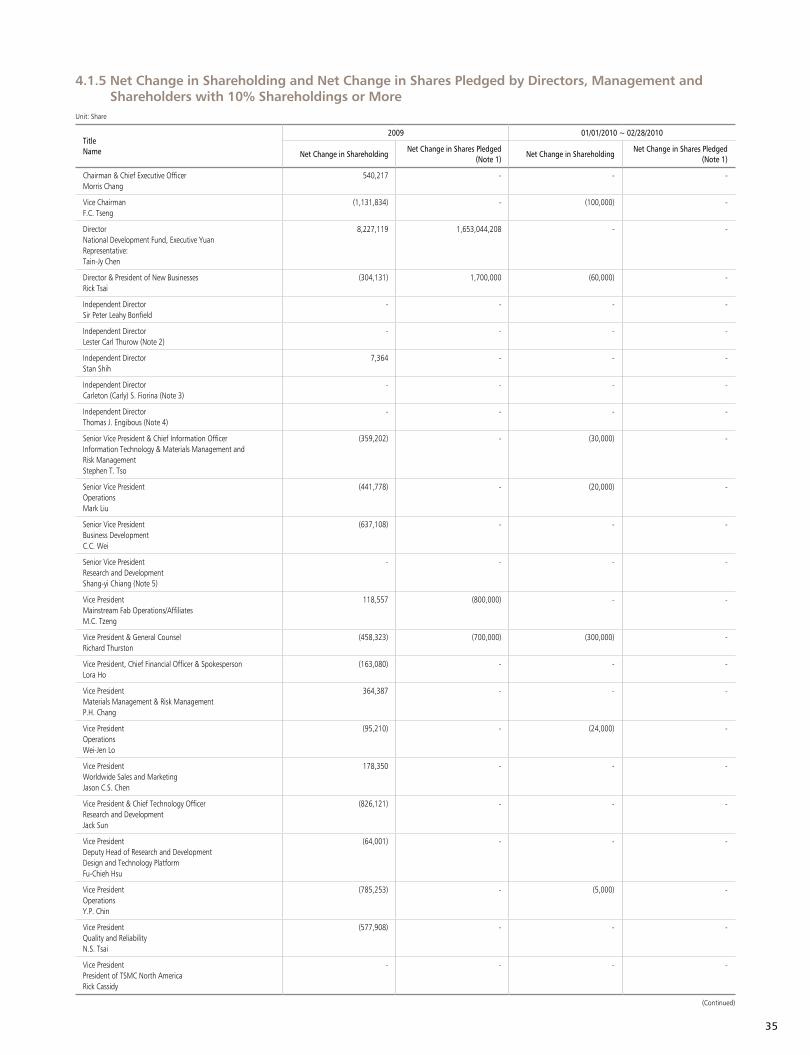
35
4.1.5 Net Change in Shareholding and Net Change in Shares Pledged by Directors, Management and Shareholders with 10% Shareholdings or More
Title Name
2009 01/01/2010 ~ 02/28/2010
Net Change in ShareholdingNet Change in Shares Pledged
(Note 1)Net Change in Shareholding
Net Change in Shares Pledged (Note 1)
Chairman & Chief Executive Officer Morris Chang
540,217 - - -
Vice Chairman F.C. Tseng
(1,131,834) - (100,000) -
Director National Development Fund, Executive YuanRepresentative:Tain-Jy Chen
8,227,119 1,653,044,208 - -
Director & President of New Businesses Rick Tsai
(304,131) 1,700,000 (60,000) -
Independent DirectorSir Peter Leahy Bonfield
- - - -
Independent DirectorLester Carl Thurow (Note 2)
- - - -
Independent DirectorStan Shih
7,364 - - -
Independent Director Carleton (Carly) S. Fiorina (Note 3)
- - - -
Independent Director Thomas J. Engibous (Note 4)
- - - -
Senior Vice President & Chief Information Officer Information Technology & Materials Management and Risk ManagementStephen T. Tso
(359,202) - (30,000) -
Senior Vice President Operations Mark Liu
(441,778) - (20,000) -
Senior Vice PresidentBusiness Development C.C. Wei
(637,108) - - -
Senior Vice PresidentResearch and Development Shang-yi Chiang (Note 5)
- - - -
Vice President Mainstream Fab Operations/AffiliatesM.C. Tzeng
118,557 (800,000) - -
Vice President & General CounselRichard Thurston
(458,323) (700,000) (300,000) -
Vice President, Chief Financial Officer & SpokespersonLora Ho
(163,080) - - -
Vice President Materials Management & Risk Management P.H. Chang
364,387 - - -
Vice President Operations Wei-Jen Lo
(95,210) - (24,000) -
Vice President Worldwide Sales and MarketingJason C.S. Chen
178,350 - - -
Vice President & Chief Technology OfficerResearch and Development Jack Sun
(826,121) - - -
Vice PresidentDeputy Head of Research and Development Design and Technology PlatformFu-Chieh Hsu
(64,001) - - -
Vice President Operations Y.P. Chin
(785,253) - (5,000) -
Vice President Quality and ReliabilityN.S. Tsai
(577,908) - - -
Vice PresidentPresident of TSMC North AmericaRick Cassidy
- - - -
Unit: Share
(Continued)
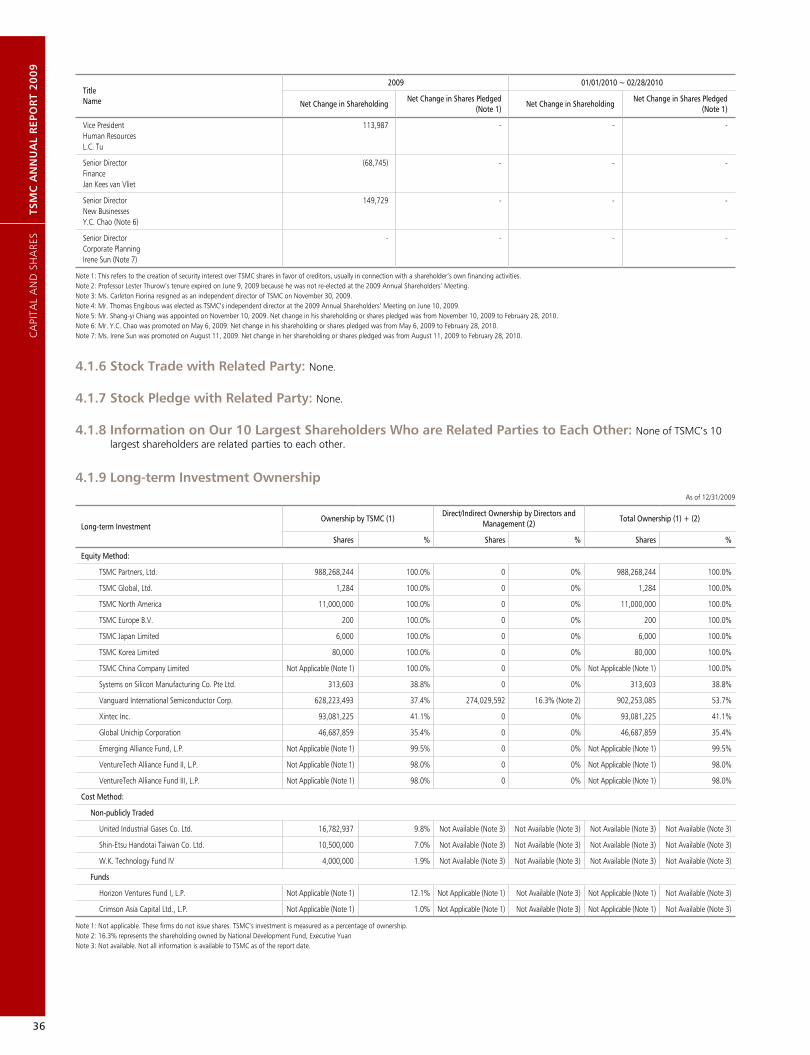
36
TSM
C A
NN
UA
L R
EPO
RT
20
09
Title Name
2009 01/01/2010 ~ 02/28/2010
Net Change in ShareholdingNet Change in Shares Pledged
(Note 1)Net Change in Shareholding
Net Change in Shares Pledged (Note 1)
Vice President Human Resources L.C. Tu
113,987 - - -
Senior Director Finance Jan Kees van Vliet
(68,745) - - -
Senior Director New Businesses Y.C. Chao (Note 6)
149,729 - - -
Senior Director Corporate Planning Irene Sun (Note 7)
- - - -
Note 1: This refers to the creation of security interest over TSMC shares in favor of creditors, usually in connection with a shareholder’s own financing activities.Note 2: Professor Lester Thurow’s tenure expired on June 9, 2009 because he was not re-elected at the 2009 Annual Shareholders’ Meeting.Note 3: Ms. Carleton Fiorina resigned as an independent director of TSMC on November 30, 2009.Note 4: Mr. Thomas Engibous was elected as TSMC’s independent director at the 2009 Annual Shareholders’ Meeting on June 10, 2009. Note 5: Mr. Shang-yi Chiang was appointed on November 10, 2009. Net change in his shareholding or shares pledged was from November 10, 2009 to February 28, 2010.Note 6: Mr. Y.C. Chao was promoted on May 6, 2009. Net change in his shareholding or shares pledged was from May 6, 2009 to February 28, 2010.Note 7: Ms. Irene Sun was promoted on August 11, 2009. Net change in her shareholding or shares pledged was from August 11, 2009 to February 28, 2010.
4.1.6 Stock Trade with Related Party: None.
4.1.7 Stock Pledge with Related Party: None.
4.1.8 Information on Our 10 Largest Shareholders Who are Related Parties to Each Other: None of TSMC’s 10 largest shareholders are related parties to each other.
4.1.9 Long-term Investment Ownership
Long-term InvestmentOwnership by TSMC (1)
Direct/Indirect Ownership by Directors and Management (2)
Total Ownership (1) + (2)
Shares % Shares % Shares %
Equity Method:
TSMC Partners, Ltd. 988,268,244 100.0% 0 0% 988,268,244 100.0%
TSMC Global, Ltd. 1,284 100.0% 0 0% 1,284 100.0%
TSMC North America 11,000,000 100.0% 0 0% 11,000,000 100.0%
TSMC Europe B.V. 200 100.0% 0 0% 200 100.0%
TSMC Japan Limited 6,000 100.0% 0 0% 6,000 100.0%
TSMC Korea Limited 80,000 100.0% 0 0% 80,000 100.0%
TSMC China Company Limited Not Applicable (Note 1) 100.0% 0 0% Not Applicable (Note 1) 100.0%
Systems on Silicon Manufacturing Co. Pte Ltd. 313,603 38.8% 0 0% 313,603 38.8%
Vanguard International Semiconductor Corp. 628,223,493 37.4% 274,029,592 16.3% (Note 2) 902,253,085 53.7%
Xintec Inc. 93,081,225 41.1% 0 0% 93,081,225 41.1%
Global Unichip Corporation 46,687,859 35.4% 0 0% 46,687,859 35.4%
Emerging Alliance Fund, L.P. Not Applicable (Note 1) 99.5% 0 0% Not Applicable (Note 1) 99.5%
VentureTech Alliance Fund II, L.P. Not Applicable (Note 1) 98.0% 0 0% Not Applicable (Note 1) 98.0%
VentureTech Alliance Fund III, L.P. Not Applicable (Note 1) 98.0% 0 0% Not Applicable (Note 1) 98.0%
Cost Method:
Non-publicly Traded
United Industrial Gases Co. Ltd. 16,782,937 9.8% Not Available (Note 3) Not Available (Note 3) Not Available (Note 3) Not Available (Note 3)
Shin-Etsu Handotai Taiwan Co. Ltd. 10,500,000 7.0% Not Available (Note 3) Not Available (Note 3) Not Available (Note 3) Not Available (Note 3)
W.K. Technology Fund IV 4,000,000 1.9% Not Available (Note 3) Not Available (Note 3) Not Available (Note 3) Not Available (Note 3)
Funds
Horizon Ventures Fund I, L.P. Not Applicable (Note 1) 12.1% Not Applicable (Note 1) Not Available (Note 3) Not Applicable (Note 1) Not Available (Note 3)
Crimson Asia Capital Ltd., L.P. Not Applicable (Note 1) 1.0% Not Applicable (Note 1) Not Available (Note 3) Not Applicable (Note 1) Not Available (Note 3)
As of 12/31/2009
Note 1: Not applicable. These firms do not issue shares. TSMC’s investment is measured as a percentage of ownership.Note 2: 16.3% represents the shareholding owned by National Development Fund, Executive YuanNote 3: Not available. Not all information is available to TSMC as of the report date.
CA
PITA
L A
ND
SH
ARE
S
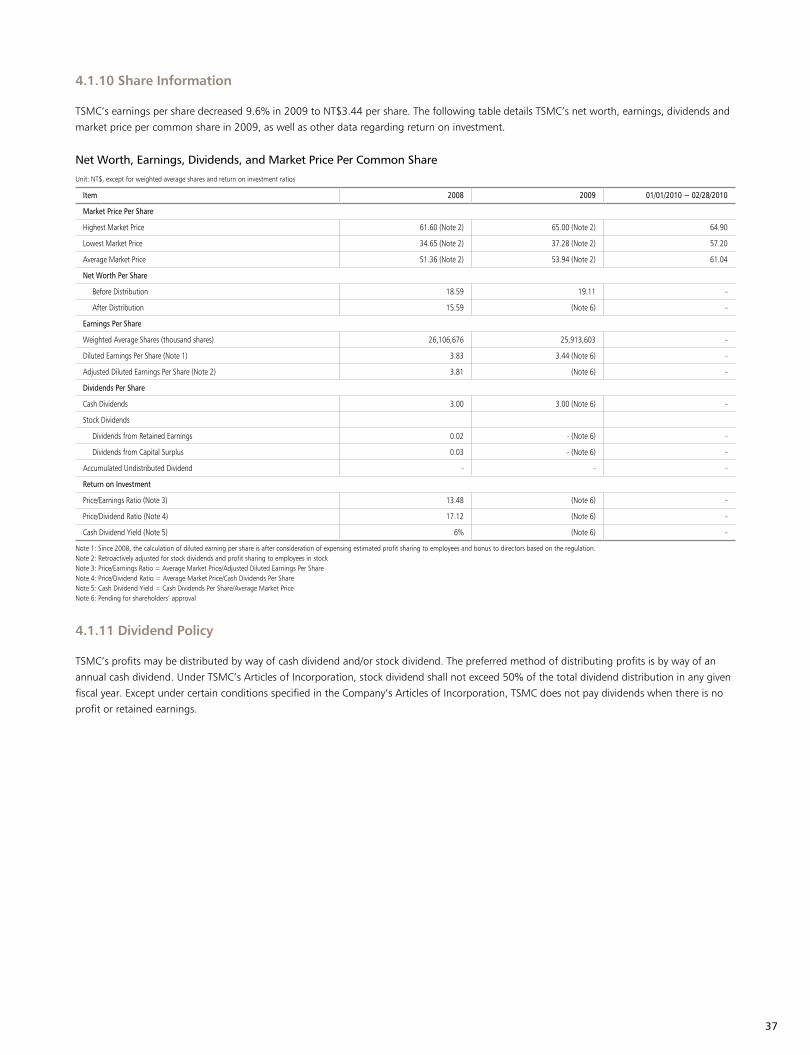
37
4.1.10 Share Information
TSMC’s earnings per share decreased 9.6% in 2009 to NT$3.44 per share. The following table details TSMC’s net worth, earnings, dividends and
market price per common share in 2009, as well as other data regarding return on investment.
Net Worth, Earnings, Dividends, and Market Price Per Common Share
Item 2008 2009 01/01/2010 ~ 02/28/2010
Market Price Per Share
Highest Market Price 61.60 (Note 2) 65.00 (Note 2) 64.90
Lowest Market Price 34.65 (Note 2) 37.28 (Note 2) 57.20
Average Market Price 51.36 (Note 2) 53.94 (Note 2) 61.04
Net Worth Per Share
Before Distribution 18.59 19.11 -
After Distribution 15.59 (Note 6) -
Earnings Per Share
Weighted Average Shares (thousand shares) 26,106,676 25,913,603 -
Diluted Earnings Per Share (Note 1) 3.83 3.44 (Note 6) -
Adjusted Diluted Earnings Per Share (Note 2) 3.81 (Note 6) -
Dividends Per Share
Cash Dividends 3.00 3.00 (Note 6) -
Stock Dividends
Dividends from Retained Earnings 0.02 - (Note 6) -
Dividends from Capital Surplus 0.03 - (Note 6) -
Accumulated Undistributed Dividend - - -
Return on Investment
Price/Earnings Ratio (Note 3) 13.48 (Note 6) -
Price/Dividend Ratio (Note 4) 17.12 (Note 6) -
Cash Dividend Yield (Note 5) 6% (Note 6) -
Unit: NT$, except for weighted average shares and return on investment ratios
Note 1: Since 2008, the calculation of diluted earning per share is after consideration of expensing estimated profit sharing to employees and bonus to directors based on the regulation.Note 2: Retroactively adjusted for stock dividends and profit sharing to employees in stockNote 3: Price/Earnings Ratio = Average Market Price/Adjusted Diluted Earnings Per ShareNote 4: Price/Dividend Ratio = Average Market Price/Cash Dividends Per ShareNote 5: Cash Dividend Yield = Cash Dividends Per Share/Average Market PriceNote 6: Pending for shareholders’ approval
4.1.11 Dividend Policy
TSMC’s profits may be distributed by way of cash dividend and/or stock dividend. The preferred method of distributing profits is by way of an
annual cash dividend. Under TSMC’s Articles of Incorporation, stock dividend shall not exceed 50% of the total dividend distribution in any given
fiscal year. Except under certain conditions specified in the Company’s Articles of Incorporation, TSMC does not pay dividends when there is no
profit or retained earnings.

38
TSM
C A
NN
UA
L R
EPO
RT
20
09
4.1.12 Distribution of Profit
The Board adopted a proposal for 2009 profit distribution at its Meeting on February 9, 2010. The proposal will be effected according to the
relevant regulations, upon the approval of shareholders at the Annual Shareholders’ Meeting on June 15, 2010.
In addition, according to the Company’s Articles of Incorporation, TSMC shall allocate no more than 0.3% of earnings available for distribution
(net income after a regulatory required deduction for prior years’ losses and contributions to legal and special reserves) as a bonus to directors,
and not less than 1% as a bonus to employees. Profit sharing to employees to be distributed after 2010 Annual Shareholders’ Meeting was
recorded as a charge to earnings of approximately 7.5% of net income in year 2009; bonuses to directors were accrued with an estimate based
on historical experience. The proposal will be effected according to the relevant regulations, upon the approval of shareholders at the Annual
Shareholders’ Meeting on June 15, 2010. If the actual amounts subsequently resolved by the shareholders differ from the above estimated
amounts, the differences will be recorded in the year of shareholders’ resolution as a change in accounting estimate.
Proposal to Distribute 2009 Profits
Board Resolution (02/10/2009) Actual Result (Note 1)
Amount (NT$) Amount (NT$) Underlying Number of Shares Dilution (%)
Directors’ Bonus (Cash) 158,080,488 158,080,488 - -
Employee Profit Sharing in Cash 7,494,987,577 7,494,987,577 - -
Employee Profit Sharing in Stock 7,494,987,578 7,494,987,578 141,869,914 (Note 2) 0.55%
Total 15,148,055,643 15,148,055,643 - -
Unit: NT$
Cash Dividends to Common Shareholders (NT$3.0 per share) 77,708,119,866
2008 Directors’ Bonus and Employee Profit Sharing
4.1.13 Impact to 2010 Business Performance and EPS Resulting from Stock Dividend Distribution: Not
applicable.
4.1.14 Buyback of Common Stock: Not applicable.
Note 1: Each of the above three items, being approved by the Board, has been expensed at the same amount under the company’s 2008 income statements. Note 2: The number of shares was calculated based on the closing price one day prior to the 2009 Annual Shareholders’ Meeting on an ex-dividend basis, i.e., NT$52.83 per share. The fractional share, being less than one full share, was
distributed in cash.
CA
PITA
L A
ND
SH
ARE
S
Note: Employees’ cash bonus and profit sharing and bonus to directors for the year 2009 which have been expensed under the Company’s income statements are listed below: -NT$6,691,337,704 distributed employees’ cash bonus -NT$6,691,337,704 employees’ cash profit sharing to be distributed after 2010 Annual Shareholders’ Meeting -NT$67,692,222 directors’ bonus to be paid after 2010 Annual Shareholders’ Meeting

39
4.2 Issuance of Corporate Bonds
4.2.1 Corporate Bonds
Issuance Domestic Unsecured Bond (V)
Issuing Date 01/10/2002 - 01/24/2002
Denomination NT$1,000,000 NT$5,000,000
Offering Price Par
Total Amount NT$15,000,000,000
Coupon Rate Tranche A: 2.60% p.a.Tranche B: 2.75% p.a.Tranche C: 3.00% p.a.
Tenure Tranche A: 5 yearsMaturity: 01/10/2007 - 01/22/2007 Tranche B: 7 yearsMaturity: 01/10/2009 - 01/24/2009 Tranche C: 10 yearsMaturity: 01/10/2012 - 01/24/2012
Guarantor None
Trustee TC Bank
Underwriter Not Applicable
Legal Counsel Yan-an International Law Office
Auditor TN Soong & Co (now Deloitte & Touche)
Repayment Bullet
Outstanding NT$4,500,000,000
Redemption or Early Repayment Clause None
Covenants Customary Covenants
Credit Rating twAAA (Taiwan Ratings Corporation, 09/21/2009)
Other Rights of Bondholders Conversion Right None
Amount of Converted or Exchanged Common Shares, ADRs or Other Securities
Not Applicable
Dilution Effect and Other Adverse Effects on Existing Shareholders None
Custodian None
As of 02/28/2010
4.2.2 Convertible Bond: None.
4.2.3 Exchangeable Bond: None.
4.2.4 Shelf Registration: None.
4.2.5 Bond with Warrants: None.
4.3 Preferred Shares
4.3.1 Preferred Share: None.
4.3.2 Preferred Share with Warrants: None.
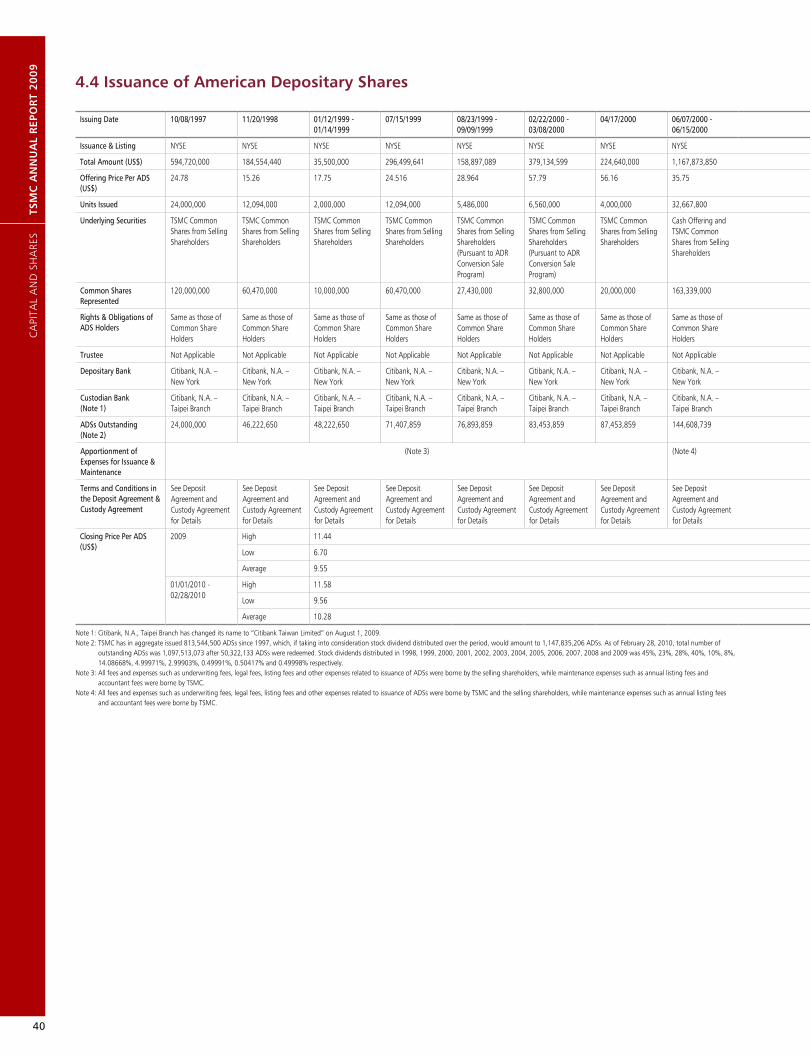
40
TSM
C A
NN
UA
L R
EPO
RT
20
09
4.4 Issuance of American Depositary Shares
Issuing Date 10/08/1997 11/20/1998 01/12/1999 - 01/14/1999
07/15/1999 08/23/1999 - 09/09/1999
02/22/2000 - 03/08/2000
04/17/2000 06/07/2000 - 06/15/2000
05/14/2001 - 06/11/2001
06/12/2001 11/27/2001 02/07/2002 - 02/08/2002
11/21/2002 - 12/19/2002
07/14/2003 - 07/21/2003
11/14/2003 08/10/2005 - 09/08/2005
05/23/2007
Issuance & Listing NYSE NYSE NYSE NYSE NYSE NYSE NYSE NYSE NYSE NYSE NYSE NYSE NYSE NYSE NYSE NYSE NYSE
Total Amount (US$) 594,720,000 184,554,440 35,500,000 296,499,641 158,897,089 379,134,599 224,640,000 1,167,873,850 240,999,660 297,649,640 320,600,000 1,001,650,000 160,097,914 908,514,880 1,077,000,000 1,402,036,500 2,563,200,000
Offering Price Per ADS (US$)
24.78 15.26 17.75 24.516 28.964 57.79 56.16 35.75 20.63 20.63 16.03 16.75 8.73 10.40 10.77 8.60 10.68
Units Issued 24,000,000 12,094,000 2,000,000 12,094,000 5,486,000 6,560,000 4,000,000 32,667,800 11,682,000 14,428,000 20,000,000 59,800,000 18,348,000 87,357,200 100,000,000 163,027,500 240,000,000
Underlying Securities TSMC Common Shares from Selling Shareholders
TSMC Common Shares from Selling Shareholders
TSMC Common Shares from Selling Shareholders
TSMC Common Shares from Selling Shareholders
TSMC Common Shares from Selling Shareholders (Pursuant to ADR Conversion Sale Program)
TSMC Common Shares from Selling Shareholders (Pursuant to ADR Conversion Sale Program)
TSMC Common Shares from Selling Shareholders
Cash Offering and TSMC Common Shares from Selling Shareholders
TSMC Common Shares from Selling Shareholders (Pursuant to ADR Conversion Sale Program)
TSMC Common Shares from Selling Shareholders
TSMC Common Shares from Selling Shareholders
TSMC Common Shares from Selling Shareholders
TSMC Common Shares from Selling Shareholders (Pursuant to ADR Conversion Sale Program)
TSMC Common Shares from Selling Shareholders
TSMC Common Shares from Selling Shareholders
TSMC Common Shares from Selling Shareholders
TSMC Common Shares from Selling Shareholders
Common Shares Represented
120,000,000 60,470,000 10,000,000 60,470,000 27,430,000 32,800,000 20,000,000 163,339,000 58,410,000 72,140,000 100,000,000 299,000,000 91,740,000 436,786,000 500,000,000 815,137,500 1,200,000,000
Rights & Obligations of ADS Holders
Same as those of Common Share Holders
Same as those of Common Share Holders
Same as those of Common Share Holders
Same as those of Common Share Holders
Same as those of Common Share Holders
Same as those of Common Share Holders
Same as those of Common Share Holders
Same as those of Common Share Holders
Same as those of Common Share Holders
Same as those of Common Share Holders
Same as those of Common Share Holders
Same as those of Common Share Holders
Same as those of Common Share Holders
Same as those of Common Share Holders
Same as those of Common Share Holders
Same as those of Common Share Holders
Same as those of Common Share Holders
Trustee Not Applicable Not Applicable Not Applicable Not Applicable Not Applicable Not Applicable Not Applicable Not Applicable Not Applicable Not Applicable Not Applicable Not Applicable Not Applicable Not Applicable Not Applicable Not Applicable Not Applicable
Depositary Bank Citibank, N.A. –New York
Citibank, N.A. –New York
Citibank, N.A. –New York
Citibank, N.A. –New York
Citibank, N.A. –New York
Citibank, N.A. –New York
Citibank, N.A. –New York
Citibank, N.A. –New York
Citibank, N.A. –New York
Citibank, N.A. –New York
Citibank, N.A. –New York
Citibank, N.A. –New York
Citibank, N.A. –New York
Citibank, N.A. –New York
Citibank, N.A. –New York
Citibank, N.A. –New York
Citibank, N.A. –New York
Custodian Bank(Note 1)
Citibank, N.A. – Taipei Branch
Citibank, N.A. – Taipei Branch
Citibank, N.A. – Taipei Branch
Citibank, N.A. – Taipei Branch
Citibank, N.A. – Taipei Branch
Citibank, N.A. – Taipei Branch
Citibank, N.A. – Taipei Branch
Citibank, N.A. – Taipei Branch
Citibank, N.A. – Taipei Branch
Citibank, N.A. – Taipei Branch
Citibank, N.A. – Taipei Branch
Citibank, N.A. – Taipei Branch
Citibank, N.A. – Taipei Branch
Citibank, N.A. – Taipei Branch
Citibank, N.A. – Taipei Branch
Citibank, N.A. – Taipei Branch
Citibank, N.A. – Taipei Branch
ADSs Outstanding (Note 2)
24,000,000 46,222,650 48,222,650 71,407,859 76,893,859 83,453,859 87,453,859 144,608,739 156,290,739 170,718,739 259,006,235 318,806,235 369,019,413 485,898,166 585,898,166 864,210,597 1,128,739,639
Apportionment of Expenses for Issuance & Maintenance
(Note 3) (Note 4) (Note 3)
Terms and Conditions in the Deposit Agreement & Custody Agreement
See Deposit Agreement and Custody Agreement for Details
See Deposit Agreement and Custody Agreement for Details
See Deposit Agreement and Custody Agreement for Details
See Deposit Agreement and Custody Agreement for Details
See Deposit Agreement and Custody Agreement for Details
See Deposit Agreement and Custody Agreement for Details
See Deposit Agreement and Custody Agreement for Details
See Deposit Agreement and Custody Agreement for Details
See Deposit Agreement and Custody Agreement for Details
See Deposit Agreement and Custody Agreement for Details
See Deposit Agreement and Custody Agreement for Details
See Deposit Agreement and Custody Agreement for Details
See Deposit Agreement and Custody Agreement for Details
See Deposit Agreement and Custody Agreement for Details
See Deposit Agreement and Custody Agreement for Details
See Deposit Agreement and Custody Agreement for Details
See Deposit Agreement and Custody Agreement for Details
Closing Price Per ADS (US$)
2009 High 11.44
Low 6.70
Average 9.55
01/01/2010 - 02/28/2010
High 11.58
Low 9.56
Average 10.28
Note 1: Citibank, N.A., Taipei Branch has changed its name to “Citibank Taiwan Limited” on August 1, 2009.Note 2: TSMC has in aggregate issued 813,544,500 ADSs since 1997, which, if taking into consideration stock dividend distributed over the period, would amount to 1,147,835,206 ADSs. As of February 28, 2010, total number of
outstanding ADSs was 1,097,513,073 after 50,322,133 ADSs were redeemed. Stock dividends distributed in 1998, 1999, 2000, 2001, 2002, 2003, 2004, 2005, 2006, 2007, 2008 and 2009 was 45%, 23%, 28%, 40%, 10%, 8%, 14.08668%, 4.99971%, 2.99903%, 0.49991%, 0.50417% and 0.49998% respectively.
Note 3: All fees and expenses such as underwriting fees, legal fees, listing fees and other expenses related to issuance of ADSs were borne by the selling shareholders, while maintenance expenses such as annual listing fees and accountant fees were borne by TSMC.
Note 4: All fees and expenses such as underwriting fees, legal fees, listing fees and other expenses related to issuance of ADSs were borne by TSMC and the selling shareholders, while maintenance expenses such as annual listing fees and accountant fees were borne by TSMC.
CA
PITA
L A
ND
SH
ARE
S

41
Issuing Date 10/08/1997 11/20/1998 01/12/1999 - 01/14/1999
07/15/1999 08/23/1999 - 09/09/1999
02/22/2000 - 03/08/2000
04/17/2000 06/07/2000 - 06/15/2000
05/14/2001 - 06/11/2001
06/12/2001 11/27/2001 02/07/2002 - 02/08/2002
11/21/2002 - 12/19/2002
07/14/2003 - 07/21/2003
11/14/2003 08/10/2005 - 09/08/2005
05/23/2007
Issuance & Listing NYSE NYSE NYSE NYSE NYSE NYSE NYSE NYSE NYSE NYSE NYSE NYSE NYSE NYSE NYSE NYSE NYSE
Total Amount (US$) 594,720,000 184,554,440 35,500,000 296,499,641 158,897,089 379,134,599 224,640,000 1,167,873,850 240,999,660 297,649,640 320,600,000 1,001,650,000 160,097,914 908,514,880 1,077,000,000 1,402,036,500 2,563,200,000
Offering Price Per ADS (US$)
24.78 15.26 17.75 24.516 28.964 57.79 56.16 35.75 20.63 20.63 16.03 16.75 8.73 10.40 10.77 8.60 10.68
Units Issued 24,000,000 12,094,000 2,000,000 12,094,000 5,486,000 6,560,000 4,000,000 32,667,800 11,682,000 14,428,000 20,000,000 59,800,000 18,348,000 87,357,200 100,000,000 163,027,500 240,000,000
Underlying Securities TSMC Common Shares from Selling Shareholders
TSMC Common Shares from Selling Shareholders
TSMC Common Shares from Selling Shareholders
TSMC Common Shares from Selling Shareholders
TSMC Common Shares from Selling Shareholders (Pursuant to ADR Conversion Sale Program)
TSMC Common Shares from Selling Shareholders (Pursuant to ADR Conversion Sale Program)
TSMC Common Shares from Selling Shareholders
Cash Offering and TSMC Common Shares from Selling Shareholders
TSMC Common Shares from Selling Shareholders (Pursuant to ADR Conversion Sale Program)
TSMC Common Shares from Selling Shareholders
TSMC Common Shares from Selling Shareholders
TSMC Common Shares from Selling Shareholders
TSMC Common Shares from Selling Shareholders (Pursuant to ADR Conversion Sale Program)
TSMC Common Shares from Selling Shareholders
TSMC Common Shares from Selling Shareholders
TSMC Common Shares from Selling Shareholders
TSMC Common Shares from Selling Shareholders
Common Shares Represented
120,000,000 60,470,000 10,000,000 60,470,000 27,430,000 32,800,000 20,000,000 163,339,000 58,410,000 72,140,000 100,000,000 299,000,000 91,740,000 436,786,000 500,000,000 815,137,500 1,200,000,000
Rights & Obligations of ADS Holders
Same as those of Common Share Holders
Same as those of Common Share Holders
Same as those of Common Share Holders
Same as those of Common Share Holders
Same as those of Common Share Holders
Same as those of Common Share Holders
Same as those of Common Share Holders
Same as those of Common Share Holders
Same as those of Common Share Holders
Same as those of Common Share Holders
Same as those of Common Share Holders
Same as those of Common Share Holders
Same as those of Common Share Holders
Same as those of Common Share Holders
Same as those of Common Share Holders
Same as those of Common Share Holders
Same as those of Common Share Holders
Trustee Not Applicable Not Applicable Not Applicable Not Applicable Not Applicable Not Applicable Not Applicable Not Applicable Not Applicable Not Applicable Not Applicable Not Applicable Not Applicable Not Applicable Not Applicable Not Applicable Not Applicable
Depositary Bank Citibank, N.A. –New York
Citibank, N.A. –New York
Citibank, N.A. –New York
Citibank, N.A. –New York
Citibank, N.A. –New York
Citibank, N.A. –New York
Citibank, N.A. –New York
Citibank, N.A. –New York
Citibank, N.A. –New York
Citibank, N.A. –New York
Citibank, N.A. –New York
Citibank, N.A. –New York
Citibank, N.A. –New York
Citibank, N.A. –New York
Citibank, N.A. –New York
Citibank, N.A. –New York
Citibank, N.A. –New York
Custodian Bank(Note 1)
Citibank, N.A. – Taipei Branch
Citibank, N.A. – Taipei Branch
Citibank, N.A. – Taipei Branch
Citibank, N.A. – Taipei Branch
Citibank, N.A. – Taipei Branch
Citibank, N.A. – Taipei Branch
Citibank, N.A. – Taipei Branch
Citibank, N.A. – Taipei Branch
Citibank, N.A. – Taipei Branch
Citibank, N.A. – Taipei Branch
Citibank, N.A. – Taipei Branch
Citibank, N.A. – Taipei Branch
Citibank, N.A. – Taipei Branch
Citibank, N.A. – Taipei Branch
Citibank, N.A. – Taipei Branch
Citibank, N.A. – Taipei Branch
Citibank, N.A. – Taipei Branch
ADSs Outstanding (Note 2)
24,000,000 46,222,650 48,222,650 71,407,859 76,893,859 83,453,859 87,453,859 144,608,739 156,290,739 170,718,739 259,006,235 318,806,235 369,019,413 485,898,166 585,898,166 864,210,597 1,128,739,639
Apportionment of Expenses for Issuance & Maintenance
(Note 3) (Note 4) (Note 3)
Terms and Conditions in the Deposit Agreement & Custody Agreement
See Deposit Agreement and Custody Agreement for Details
See Deposit Agreement and Custody Agreement for Details
See Deposit Agreement and Custody Agreement for Details
See Deposit Agreement and Custody Agreement for Details
See Deposit Agreement and Custody Agreement for Details
See Deposit Agreement and Custody Agreement for Details
See Deposit Agreement and Custody Agreement for Details
See Deposit Agreement and Custody Agreement for Details
See Deposit Agreement and Custody Agreement for Details
See Deposit Agreement and Custody Agreement for Details
See Deposit Agreement and Custody Agreement for Details
See Deposit Agreement and Custody Agreement for Details
See Deposit Agreement and Custody Agreement for Details
See Deposit Agreement and Custody Agreement for Details
See Deposit Agreement and Custody Agreement for Details
See Deposit Agreement and Custody Agreement for Details
See Deposit Agreement and Custody Agreement for Details
Closing Price Per ADS (US$)
2009 High 11.44
Low 6.70
Average 9.55
01/01/2010 - 02/28/2010
High 11.58
Low 9.56
Average 10.28

42
TSM
C A
NN
UA
L R
EPO
RT
20
09
4.5 Status of Employee Stock Option Plan
4.5.1 Issuance of Employee Stock Options
ESOP Granted First Grant Second Grant Third Grant Fourth Grant Fifth Grant Sixth Grant Seventh Grant Eighth Grant Ninth Grant
Approval Date by The Securities & Futures Bureau 06/25/2002 06/25/2002 06/25/2002 06/25/2002 10/29/2003 10/29/2003 10/29/2003 10/29/2003 01/06/2005
Issue (Grant) Date 08/22/2002 11/08/2002 03/07/2003 06/06/2003 12/03/2003 02/19/2004 05/11/2004 08/11/2004 05/17/2005
Number of Options Granted 18,909,700 1,085,000 6,489,514 23,090,550 842,900 15,720 11,167,817 135,300 10,742,350
Percentage of Shares Exercisable to Outstanding Common Shares 0.10154% 0.00583% 0.03485% 0.12399% 0.00416% 0.00008% 0.05510% 0.00058% 0.04620%
Option Duration 10 years 10 years 10 years 10 years 10 years 10 years 10 years 10 years 10 years
Source of Option Shares New Common Share New Common Share New Common Share New Common Share New Common Share New Common Share New Common Share New Common Share New Common Share
Vesting Schedule 2nd Year: up to 50%3rd Year: up to 75%4th Year: up to 100%
2nd Year: up to 50%3rd Year: up to 75%4th Year: up to 100%
2nd Year: up to 50%3rd Year: up to 75%4th Year: up to 100%
2nd Year: up to 50%3rd Year: up to 75%4th Year: up to 100%
2nd Year: up to 50%3rd Year: up to 75%4th Year: up to 100%
2nd Year: up to 50%3rd Year: up to 75%4th Year: up to 100%
2nd Year: up to 50%3rd Year: up to 75%4th Year: up to 100%
2nd Year: up to 50%3rd Year: up to 75%4th Year: up to 100%
2nd Year: up to 50%3rd Year: up to 75%4th Year: up to 100%
Shares Exercised 2,027,605 0 497,904 2,041,274 111,535 0 1,024,198 6,482 1,563,267
Value of Shares Exercised (NT$) 59,047,051 0 11,911,017 65,671,305 5,587,907 0 44,268,630 247,614 73,799,714
Shares Unexercised 4,894,232 390,445 4,869,254 11,025,557 219,002 9,941 3,343,695 31,711 4,026,307
Original Grant Price Per Share (NT$) NT$53.0 NT$51.0 NT$41.6 NT$58.5 NT$66.5 NT$63.5 NT$57.5 NT$43.8 NT$54.3
Adjusted Exercise Price Per Share (NT$) NT$29.0 NT$27.9 NT$22.8 NT$32.0 NT$50.1 NT$47.8 NT$43.2 NT$38.0 NT$47.2
Percentage of Shares Unexercised to Outstanding Common Shares 0.01889% 0.00151% 0.01880% 0.04257% 0.00085% 0.00004% 0.01291% 0.00012% 0.01554%
Impact to Shareholders’ Equity Dilution to Shareholders’ Equity is limited
Dilution to Shareholders’ Equity is limited
Dilution to Shareholders’ Equity is limited
Dilution to Shareholders’ Equity is limited
Dilution to Shareholders’ Equity is limited
Dilution to Shareholders’ Equity is limited
Dilution to Shareholders’ Equity is limited
Dilution to Shareholders’ Equity is limited
Dilution to Shareholders’ Equity is limited
Title NameNumber of Options Granted
(Note 2)% of Shares Exercisable to
Outstanding Common Shares
Exercised Unexercised
Shares ExercisedExercise Price
Per ShareValue of Shares Exercised (NT$)
% of Shares Exercised to Outstanding
Common SharesShares Unexercised
Adjusted Grant Price Per Share
Value of Shares Unexercised (NT$)
% of Shares Unexercised to
Outstanding Common Shares
Chairman & Chief Executive Officer Morris Chang (Note 1)
5,261,152 0.02031% 1,664,091 28.0 46,575,976 0.00642% 3,597,061 25.2 90,819,287 0.01389%
President Rick Tsai (Note 1)
Senior Vice President Stephen T. Tso (Note 1)
Senior Vice President Mark Liu (Note 1)
Senior Vice President C.C. Wei (Note 1)
Vice President & General Counsel Richard Thurston (Note 1)
Vice President Jack Sun (Note 1)
Vice President Rick Cassidy
Vice President L.C. Tu (Note 1)
4.5.2 Employee Stock Options Granted to Management Team and to Top 10 Employees with an Individual Grant Value over NT$30,000,000
Note 1: TSMC granted options to certain of its officers (as listed above) as a result of their voluntary selection to exchange part of their profit sharing for stock options in 2003. This includes a voluntary exchange by Chairman Morris Chang in his capacity as Chief Executive Officer.
Note 2: Number of options granted includes the additional shares due to stock dividend distributed in 2004, 2005, 2006, 2007, 2008 and 2009.
4.6 Status of New Share Issuance in Connection with Mergers and Acquisitions
TSMC did not issue new shares in connection with mergers or acquisitions in 2009, and as of the date of this Annual Report.
4.7 Financing Plans and Implementation: Not applicable.
CA
PITA
L A
ND
SH
ARE
S

43
ESOP Granted First Grant Second Grant Third Grant Fourth Grant Fifth Grant Sixth Grant Seventh Grant Eighth Grant Ninth Grant
Approval Date by The Securities & Futures Bureau 06/25/2002 06/25/2002 06/25/2002 06/25/2002 10/29/2003 10/29/2003 10/29/2003 10/29/2003 01/06/2005
Issue (Grant) Date 08/22/2002 11/08/2002 03/07/2003 06/06/2003 12/03/2003 02/19/2004 05/11/2004 08/11/2004 05/17/2005
Number of Options Granted 18,909,700 1,085,000 6,489,514 23,090,550 842,900 15,720 11,167,817 135,300 10,742,350
Percentage of Shares Exercisable to Outstanding Common Shares 0.10154% 0.00583% 0.03485% 0.12399% 0.00416% 0.00008% 0.05510% 0.00058% 0.04620%
Option Duration 10 years 10 years 10 years 10 years 10 years 10 years 10 years 10 years 10 years
Source of Option Shares New Common Share New Common Share New Common Share New Common Share New Common Share New Common Share New Common Share New Common Share New Common Share
Vesting Schedule 2nd Year: up to 50%3rd Year: up to 75%4th Year: up to 100%
2nd Year: up to 50%3rd Year: up to 75%4th Year: up to 100%
2nd Year: up to 50%3rd Year: up to 75%4th Year: up to 100%
2nd Year: up to 50%3rd Year: up to 75%4th Year: up to 100%
2nd Year: up to 50%3rd Year: up to 75%4th Year: up to 100%
2nd Year: up to 50%3rd Year: up to 75%4th Year: up to 100%
2nd Year: up to 50%3rd Year: up to 75%4th Year: up to 100%
2nd Year: up to 50%3rd Year: up to 75%4th Year: up to 100%
2nd Year: up to 50%3rd Year: up to 75%4th Year: up to 100%
Shares Exercised 2,027,605 0 497,904 2,041,274 111,535 0 1,024,198 6,482 1,563,267
Value of Shares Exercised (NT$) 59,047,051 0 11,911,017 65,671,305 5,587,907 0 44,268,630 247,614 73,799,714
Shares Unexercised 4,894,232 390,445 4,869,254 11,025,557 219,002 9,941 3,343,695 31,711 4,026,307
Original Grant Price Per Share (NT$) NT$53.0 NT$51.0 NT$41.6 NT$58.5 NT$66.5 NT$63.5 NT$57.5 NT$43.8 NT$54.3
Adjusted Exercise Price Per Share (NT$) NT$29.0 NT$27.9 NT$22.8 NT$32.0 NT$50.1 NT$47.8 NT$43.2 NT$38.0 NT$47.2
Percentage of Shares Unexercised to Outstanding Common Shares 0.01889% 0.00151% 0.01880% 0.04257% 0.00085% 0.00004% 0.01291% 0.00012% 0.01554%
Impact to Shareholders’ Equity Dilution to Shareholders’ Equity is limited
Dilution to Shareholders’ Equity is limited
Dilution to Shareholders’ Equity is limited
Dilution to Shareholders’ Equity is limited
Dilution to Shareholders’ Equity is limited
Dilution to Shareholders’ Equity is limited
Dilution to Shareholders’ Equity is limited
Dilution to Shareholders’ Equity is limited
Dilution to Shareholders’ Equity is limited
As of 12/31/2009
As of 12/31/2009
Title NameNumber of Options Granted
(Note 2)% of Shares Exercisable to
Outstanding Common Shares
Exercised Unexercised
Shares ExercisedExercise Price
Per ShareValue of Shares Exercised (NT$)
% of Shares Exercised to Outstanding
Common SharesShares Unexercised
Adjusted Grant Price Per Share
Value of Shares Unexercised (NT$)
% of Shares Unexercised to
Outstanding Common Shares
Chairman & Chief Executive Officer Morris Chang (Note 1)
5,261,152 0.02031% 1,664,091 28.0 46,575,976 0.00642% 3,597,061 25.2 90,819,287 0.01389%
President Rick Tsai (Note 1)
Senior Vice President Stephen T. Tso (Note 1)
Senior Vice President Mark Liu (Note 1)
Senior Vice President C.C. Wei (Note 1)
Vice President & General Counsel Richard Thurston (Note 1)
Vice President Jack Sun (Note 1)
Vice President Rick Cassidy
Vice President L.C. Tu (Note 1)
44
TSM
C A
NN
UA
L R
EPO
RT
20
09
OPE
RATI
ON
AL
HIG
HLI
GH
TS
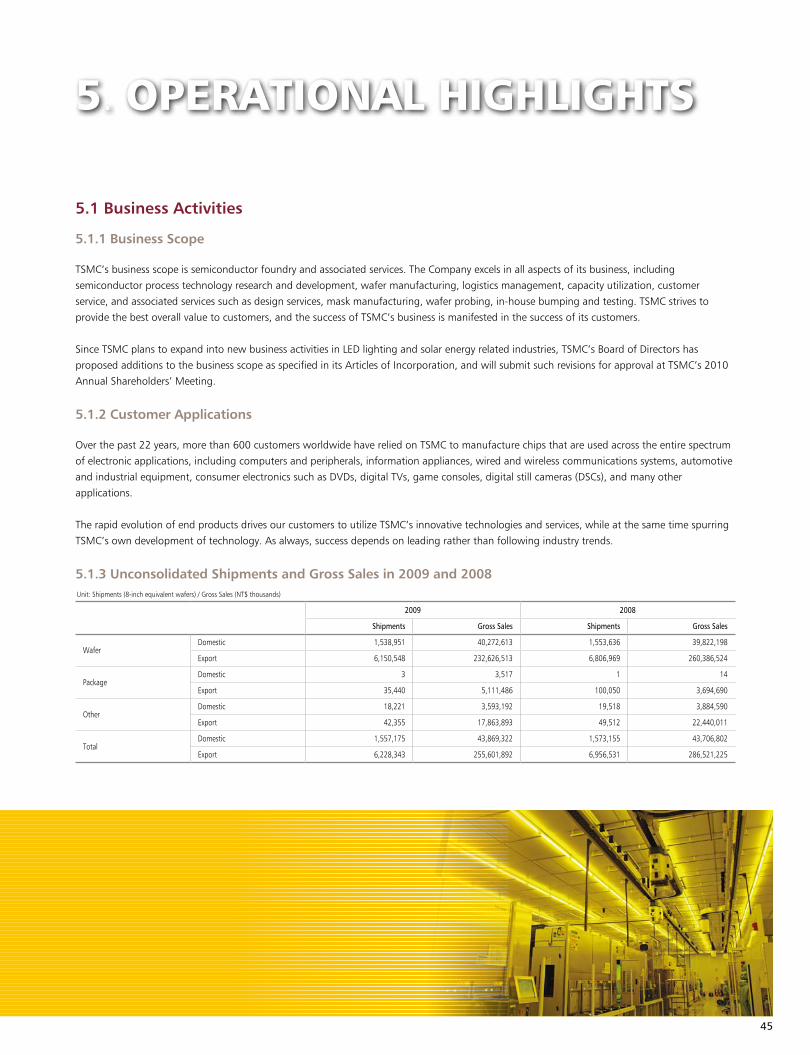
45
5. OPERATIONAL HIGHLIGHTS
5.1 Business Activities
5.1.1 Business Scope
TSMC’s business scope is semiconductor foundry and associated services. The Company excels in all aspects of its business, including
semiconductor process technology research and development, wafer manufacturing, logistics management, capacity utilization, customer
service, and associated services such as design services, mask manufacturing, wafer probing, in-house bumping and testing. TSMC strives to
provide the best overall value to customers, and the success of TSMC’s business is manifested in the success of its customers.
Since TSMC plans to expand into new business activities in LED lighting and solar energy related industries, TSMC’s Board of Directors has
proposed additions to the business scope as specified in its Articles of Incorporation, and will submit such revisions for approval at TSMC’s 2010
Annual Shareholders’ Meeting.
5.1.2 Customer Applications
Over the past 22 years, more than 600 customers worldwide have relied on TSMC to manufacture chips that are used across the entire spectrum
of electronic applications, including computers and peripherals, information appliances, wired and wireless communications systems, automotive
and industrial equipment, consumer electronics such as DVDs, digital TVs, game consoles, digital still cameras (DSCs), and many other
applications.
The rapid evolution of end products drives our customers to utilize TSMC’s innovative technologies and services, while at the same time spurring
TSMC’s own development of technology. As always, success depends on leading rather than following industry trends.
5.1.3 Unconsolidated Shipments and Gross Sales in 2009 and 2008Unit: Shipments (8-inch equivalent wafers) / Gross Sales (NT$ thousands)
2009 2008
Shipments Gross Sales Shipments Gross Sales
WaferDomestic 1,538,951 40,272,613 1,553,636 39,822,198
Export 6,150,548 232,626,513 6,806,969 260,386,524
PackageDomestic 3 3,517 1 14
Export 35,440 5,111,486 100,050 3,694,690
OtherDomestic 18,221 3,593,192 19,518 3,884,590
Export 42,355 17,863,893 49,512 22,440,011
TotalDomestic 1,557,175 43,869,322 1,573,155 43,706,802
Export 6,228,343 255,601,892 6,956,531 286,521,225

46
TSM
C A
NN
UA
L R
EPO
RT
20
09
5.1.4 Production in 2009 and 2008
Wafers
Year Capacity Output Amount
2009 9,954,558 7,582,664 150,572,709
2008 9,376,612 8,350,692 154,242,282
Unit: Capacity / Output (8-inch equivalent wafers) / Amount (NT$ thousands)
5.2 Technology Leadership
5.2.1 R&D Organization and Investment
TSMC expanded its Research and Development in 2009 to further
enhance one of its three strategic pillars: Technology Leadership. In
2009 the total R&D budget increased to 8% of total revenue. This level
of R&D investment is on par with, if not more than, many leading edge
technology companies. Along with the budget increase, the R&D
organization increased staffing by over 25%.
TSMC also brought one of its venerated leaders, Dr. Shang-yi Chiang,
Chairman of VisEra and Xintec, back as Senior Vice President of R&D.
TSMC recognizes that the technology challenge required to extend
Moore’s Law, the business law behind CMOS scaling, is getting more
and more difficult. The R&D organization is further strengthening its
capability, and Dr. Chiang brings his rich industry experience to lead the
R&D team navigating through the challenges. To assist Dr. Chiang, TSMC also appointed Dr. Jack Sun as Vice President and Chief Technology
Officer to ensure the technology pipeline is both full and ahead of the competition.
In 2009, TSMC offered the foundry segment’s first 40nm technology. After intense work on ramping this technology, customers started to enjoy
some benefits of stable and improved yield.
TSMC accelerated the development of advanced transistors, embedded memories, and Cu/low-K interconnect technologies. During 2009, the
R&D organization once again proved its capabilities by offering a first-to-market 45/40nm foundry technology portfolio as well as establishing
28nm HKMG capability.
TSMC also expanded its external R&D partnerships and alliances with world-class research institutions. For example, TSMC is a core partner of
IMEC, the respected European R&D consortium. TSMC also has a partnership agreement with NXP to conduct exploratory researches in special
“More Than Moore” technologies. In addition, TSMC strengthened its collaborations with key partners on design-process optimization. TSMC
provides funding for nanotechnology researches at major universities worldwide to promote innovation and the advancement of technology.
These research efforts enable the Company continuously to offer its customers the foundry-leading, first-to-market technology and design
solutions that contribute to their product success in the complex and challenging market environment.
OPE
RATI
ON
AL
HIG
HLI
GH
TS
(Amount: NT$ thousands)
2008
2009
01/01/2010~02/28/2010
21,593,398
21,480,937
4,082,623
R&D Expenditures

47
5.2.2 R&D Accomplishments in 2009
R&D Highlights●28nm TechnologyTSMC continued to lead the foundry segment with the development of the most advanced logic technologies both with conventional as well as high-K/metal gate (HKMG) stacks. The high performance (28HP) platform is aimed at high-speed GPU and CPU applications. The 28HP platform also serves as the technology backbone for high-end FPGA and SoC application domains through additional device customization for leakage management. The low-leakage (28LP and 28HPL) technologies are designed to support low-cost mobile applications as well as low-end FPGA requirements.
TSMC achieved 64Mb SRAM yield breakthroughs of the foundry segment’s highest density cell (0.127μm2) early in 2009. TSMC also achieved 64Mb SRAM yield on its 28HP and 28HPL HKMG technologies. Record high transistor performances, 5th generation Cu and low-k interconnect, and the 2nd generation immersion lithography effectively establish TSMC’s continued leadership in the foundry segment’s technology development.
The Company also successfully supported customer design (test-chip) evaluations through TSMC’s 28nm shuttle program. Functional silicon was delivered in both conventional poly SiON and HKMG technology platforms. TSMC’s 28nm technology offerings are all well on track for qualification and risk production in 2010, supporting a broad range of application domains from high-performance to low-leakage.
●20nm TechnologyIn 2009, TSMC continued to focus on 20nm technology pathfinding. To offer a leading-edge technology for both analog and digital application, the Company adopted the most advanced 193nm immersion and enhanced lithography process for smaller feature size. With the 2nd generation high-K/metal gate (HKMG), more Si strain, and new device structure, the intrinsic transistor performance continues to boost up following Moore’s Law. Meanwhile, external resistance can be effectively reduced and controlled by a specially designed process technique. The BEOL interconnect process features extreme low-K inter-metal dielectric materials and copper metallization with the novel low RC scheme. The logic transistor and SRAM bit-cell offering, using the 20nm process, will cover high performance and mobile product application.
Recognizing the increasing importance of the interdependence of circuit design and process technologies, TSMC has paid attention to and made efforts to design and process co-optimization. TSMC was invited to join the special session, “Confluence of Technology and Design – Design Issues on 32/22nm and Beyond”, in the 2009 International Electron Device Meeting, and presented a paper entitled “Design and Process Co-optimization for 28/22nm and Beyond – A foundry’s Perspective”. Starting from the path-finding stage, the Company has considered the design-process correlation by including the complex layout effects in the test vehicle, generating a design-friendly design package (DRM/DRC, SPICE model, and other design enablement), and enhancing process variation monitoring. Early engagement with customers has been launched. The mindset change from developing a new technology by foundry itself to co-optimizing the design and process should help our customers in
terms of minimizing the design risk and shortening the time to market.
● LithographyThe 20nm optimal design gate density was achieved and is compliant with semiconductor-industry-standard double-patterning design rules by the design-integration-litho co-optimization. This accomplishment ensures the extendibility of 193nm immersion technology to 20nm and possibly to 15nm, before the next-generation lithography (NGL) matures.
Another challenge is reducing k1, which enables the use of lasers with low NA, and results in lower equipment costs. This challenge was overcome with aggressive resolution-enhancement technologies and the multi-layered optical proximity correction (OPC).
Low-single-digit immersion defects were achieved with track/material co-optimization. It evolved from and is better than the previous generation. To deal with various product requirements, customized OPC was used. It smoothed the 40nm manufacturing ramping up. Low-cost solutions were developed for 0.11μm logics and multi-generation technologies.
For NGL technology development, a mulitple e-beam maskless pre-A tool was installed in TSMC’s fab besides the satisfactory EUV mask making and wafer exposures.
●Mask TechnologyMask technology is an integral part of advanced lithography technology. TSMC has developed proprietary resolution-enhancement techniques (RET) that are co-optimized with our in-house mask-making technology. The Company integrates OPC, scanner parameter optimization, and masks together to provide a total solution in 193nm immersion lithography. TSMC’s mask-making facilities feature state-of-the-art electron-beam mask writers, etchers, inspection, repair, and verification tools for production at 28nm and R&D at 20nm. In 2009, the Company collaborated with blank suppliers to develop super-binary blanks for the 20nm generation to improve the lithography process window, mask quality and cycle time. TSMC also started to develop mask technologies for double patterning with 193nm immersion lithography and extreme-UV lithography for applications to the 20nm generation and beyond. TSMC’s strength in mask technology gives significant and unique benefits to its customers in terms of technical excellence, top quality, fast cycle time, and one-stop service.
Integrated Interconnect and PackagingThe Integrated Interconnect and Package Development Division (IIPD) was formed in late 2008 to develop and deliver an integrated technology solution combining the advanced interconnect with packaging technology. The introduction of extreme low-K dielectric (ELK) in 45/40nm adds more challenges among many others to the given tasks. In 2009, the major focus was to resolve interconnect/package related bottlenecks and ensure smooth ramp of 45/40nm first wave customers’ products. Enhancement in Si backend/bump structure designs, and process optimization in bumping/assembly processes have paved the way for customers’ products delivery with reliable quality. Customers including GPU and FPGA products are in volume production (with die size >20×20mm2).

48
TSM
C A
NN
UA
L R
EPO
RT
20
09
● Advanced InterconnectIn 2009, TSMC continued to lead the foundry segment in demonstrating the lowest RC-delay interconnect technology in the segment, which is also compatible with advanced package technology.
Cu interconnect resistivity is trending up by generation node because of the size effect. To keep the RC performance for the advanced interconnect, TSMC has developed an extreme low resistance Cu – interconnect solution for 28nm and beyond technology nodes. On the 28nm test vehicle it showed an effective resistivity significantly lower than that projected by the ITRS roadmap and demonstrated promising reliability performance.
On the counterpart approach, the reduction of K value of low-K material is the conventional way to drive RC delay for advanced generations. However, the package becomes main challenge for low-K with K less than 2.5. TSMC has evaluated and created advanced CVD and SOD low-K materials with much better mechanical strength and adhesion to adjacent layers for 20nm and beyond generations. Integration work based on the two key indices of RC and package performance is going on smoothly.
● Advanced Package DevelopmentTo achieve “Green package” requirements and to follow the EU code for RoHS, the traditional tin-lead (Sn-Pb) based solder interconnect will be replaced by lead-free (Sn-Ag or Cu post) technology step-by-step. TSMC will continue to develop lead-free package technology (including die sizes, bump pitches, substrate types, etc.) in 2010 to further enhance customer’s product performance.
Advanced Transistor ResearchTSMC continues to make great strides in advanced transistor research. We believe that as the conventional scaling is coming to its end, Moore’s Law can be extended by other means of scaling by equivalence. 3D transistor technology, such as FinFET, should help, and the Company has spent great efforts to make the technology toward perfection.
TSMC also believes that transistor architecture needs to be complemented by material system change. R&D investigated an array of new materials that might be more suitable for the transistor channel or the contacts. TSMC, which plans to roll out these new materials in the next few nodes, formed strong collaborations with the worlds’ leading institutes on these advanced material researches. By combining TSMC’s Si capability and academic know-how, most technical issues have been overcome.
Although the technology challenges ahead are great, TSMC believes that by overcoming these challenges it can produce true differentiating value to customers. These challenges, therefore, are great opportunities for TSMC, and its strategy is to move aggressively to solve them ahead of time.
Spectrum of TechnologyBeyond the highlights above, TSMC continued to develop a broad mix of new technologies. The Company accelerated its SoC roadmap, including embedded DRAM (eDRAM) and RF with earlier availability, higher integration and more variants.
● Embedded DRAMEmbedded DRAM is important for many applications, such as game consoles, digital TVs, networking, base stations, and hard-disk drives. In 2009, TSMC successfully demonstrated 40nm low-power (N40LP) eDRAM for games and hand-held applications, with low standby power. Fully functional macro was also demonstrated with reasonable yield in 40G general-purpose eDRAM technology, for high performance networking applications with 412MHz clock rate.
● Silicon Germanium BiCMOS RF TechnologyHaving resolved thermal stress challenges, high resistive silicon-on-insulator (HR-SOI) substrate was successfully implemented into TSMC’s 0.18μm CMOS and SiGe BiCMOS process flow. On this substrate, CMOS, NPN and PNP SiGe HBTs are all demonstrated successfully. Furthermore, inductors with 60% higher Q is achieved using this technology. Lower density, no-cost-adding metal-oxide-metal (MOM) capacitors was developed in 2009 to accommodate >10V applications.
● Mixed Signal/Radio Frequency (MS/RF) TechnologyTSMC qualified a 40nm low-power RF process design kit with silicon-validated model to facilitate design launch for an advanced Blue-Tooth chip. Challenges in multi-finger RFMOSFET-related device drive current behavior is investigated and resolved by analyzing with distributing source/drain into multi-segments. To deliver accurate model for small unit metal-oxide-metal (MOM) capacitors for high frequency (67GHz, e.g.) applications, an innovated correlation methodology along with smart MOM modeling array is successfully implemented for 40nm, 45nm, 65nm and 90nm MOM modeling. Small capacitor with ~1fF unit could be predicted accurately and the total variation specification is thus tightened from 25% to 15% or even down to 12%. This enhances the precision level for analog and RF designs. For high-speed data link (≥10Gbits/s) needing inductor-based LC oscillators in most advanced CMOS technologies (28nm, e.g.), simulation-based RF design packages are under development and implemented to significantly shorten design cycle.
● Power IC/BCD TechnologyTSMC has driven multiple power IC platforms into production, including 0.35μm 3.3/5/12~40V BCD & 0.25μm 2.5/5/12~40+60V BCD. Fruitful features were enabled in these platform solutions, such as world-leading Rdson performance, cost-effective modular flexibility & customized characterization reports for friendly power IC design. 0.18μm BCD, for highly integrated SoC applications, has been officially released for 24/40V phase, while an extension phase offering more comprehensive components was qualified. TSMC also dominated technology for CCD V-drivers with 0.18μm 1.8/3.3/32V technology, together with a cost-competitive shrinkage path to 0.16μm 1.8/3.3/24V technology. Furthermore, TSMC’s offering of 0.6μm 60V BCD also achieved best-in-class Rdson, which is expected to enable competitive LED drivers for the customers.
● Panel Driver TechnologyTSMC has completed development of 0.13μm 32V technology for small panel driver IC applications. The technology has the smallest SRAM in the world.
TSMC has also provided three high-performance and cost-effective technologies for large panel driver applications. Following them, there are newly defined technologies in development to support customer
OPE
RATI
ON
AL
HIG
HLI
GH
TS

49
demands. These technologies will enable SoC with power benefits for next generation products.
● CMOS Image Sensor TechnologyIn 2009, TSMC was the first semiconductor company to have 1.4μm pixel with Back Side Illumination (BSI) technology in production that propelled our key customer to their performance leadership position.
On top of that, we also successfully demonstrated world-first 12” bulk Si BSI technology with 1.1μm pixel size using 65nm design rules, with optical performance surpassing 1.75μm pixel. This technology would allow high performance sensors at density up to 16M pixels to achieve the performance not attainable by the conventional front side illumination at the same pixel size.
● Flash/Embedded Flash TechnologyIn 2009, TSMC qualified the low power, ultra low leakage 0.18μm Flash for MCU applications. Followed the scaling path, the 90nm split gate technology also achieved excellent yield and passed the pre-qualification, and readied for first customer new product tape-outs.
TSMC also attracted many IDM companies to co-develop embedded Flash solutions for automotive and consumers applications, using both 90nm and 65nm as the foundation platforms.
5.2.3 Technology Platform
Modern IC designers need sophisticated design infrastructure to achieve acceptable productivity and cycle time. This includes design flow for electronic design automation (EDA), silicon proven building blocks such as libraries and IPs, simulation and verification design kits such as process design kit (PDK) and tech files. All these are built on top of the technology foundation, and each technology needs its own design infrastructure to be usable for designers. This is the concept of a technology platform.
For years, TSMC and its alliance partners spent considerable effort to build TSMC technology platforms. The Company unveiled its Open Innovation PlatformTM initiative in 2008 to further enhance TSMC technology platforms. More OIP deliverables were rolled out in 2009. In April 2009, TSMC announced the foundry segment’s first Mixed Signal/Radio Frequency Reference Design Kit (MS/RF RDK). The new RDK helps resolve the long-standing challenge of full chip verification of SoCs with both analog, mixed signal and digital content. It enables a top-down MS/RF design methodology and a system-level simulation flow to reduce design cycle time and encourage IP reuse.
In May 2009, TSMC unveiled iRCX, an interoperable EDA data format, for TSMC 65nm and 40nm technologies. Interconnect modeling data is getting more important as chip designs in advanced technologies require detailed views of parasitic effects for the accurate evaluation of chip performance and power consumption. EDA tools that support the iRCX format will be able to receive accurate interconnect modeling data from the iRCX files developed and supported by TSMC.
Two more unified EDA data formats – interoperable design rule check (iDRC) and interoperable layout-versus-schematic (iLVS) – for TSMC 40nm process technology were announced in July 2009. Design rules
for advanced process technologies are more complex and require detailed and accurate descriptions for correct chip layout creation and post-layout analyses. TSMC iDRC and iLVS formats, based on TSMC process requirements, unify process design rules specification and technology file generation, simplify data delivery, and ensure data integrity and interpretation.
The Company also unveiled Reference Flow 10.0 and industry-first interoperable process design kit (iPDK) in July 2009. TSMC iPDK unified data model on industry-standard OpenAccess database enables design reuse that is not possible with multiple proprietary PDKs and design databases. It eliminates duplicate PDK development efforts, significantly reduces PDK development, validation and support costs across the design ecosystem, and promotes innovation in analog and full custom design.
Reference Flow 10.0 continues the tradition of driving advances in design methodology and addresses new design challenges of 28nm process technology. To drive greater performance, advanced stage-based On-Chip Variation (OCV) optimization and analysis is made available for the first time, enabling customers to get a more realistic look at timing for the purpose of removing redundant design margins. A new electrical DFM feature was introduced for customers to take into consideration the timing impact of “silicon stress effect”, thus helping to increase yields.
System-in-Package (SiP) is a viable alternative for many customers to realize their end product with the best cost and cycle time. Reference Flow 10.0 also delivers innovations to enable SiP design for the first time. It includes SiP package design, electrical analysis of package extraction, timing, signal integrity, IR drop, and thermal to physical verification of DRC and LVS.
5.2.4 Intellectual Property
A strong portfolio of intellectual property rights strengthens TSMC’s technology leadership and protects our advanced and leading edge technologies. In 2009, TSMC received 308 U.S. patents, 226 Taiwanese patents, 264 PRC patents, and other patents issued in various other countries. TSMC’s patent portfolio now exceeds 12,000 patents worldwide. We continue to implement a unified model for TSMC’s intellectual capital management. Strategic considerations and close alignment with business objectives drive the timely creation, management and use of our intellectual property.
At TSMC, we have built a process to extract value from our intellectual property by aligning our intellectual property strategy with our R&D, business objectives, marketing, and corporate development strategies. Intellectual property rights protect our freedom to operate, enhance our competitive position, and give us leverage to participate in many profit-generating activities.
We have worked continuously to improve the quality of our intellectual property portfolio and to reduce the cost of maintaining it. We plan to continue investing in our intellectual property portfolio and intellectual property management system to ensure that we protect our technology leadership and receive maximum business value from our intellectual property rights.

50
TSM
C A
NN
UA
L R
EPO
RT
20
09
5.2.5 Future R&D Plans
Following the significant successes of TSMC’s advanced technologies in 2009, the Company plans to continue to grow the R&D organization. TSMC will further expand its 300mm R&D pilot line to speed up 28nm qualification with its early engagement customers and the 20nm path-finding programs with world-leading research institutions. The Company plans to reinforce its exploratory development work on new transistors and technologies such as 3D structures, strained-layer CMOS, high mobility materials, and novel 3D-IC devices with TSV. These studies of the fundamental physics of nanometer CMOS transistors are core aspects of our efforts to improve the understanding and guide the design of transistors at advanced nodes. The findings of these studies are being applied to ensure our continued industry leadership at the 28nm and 20nm nodes. One of TSMC’s goals is to extend Moore’s Law through innovative in-house work, as well as by collaborating with industry leaders and academia to push the envelope in finding cost-effective technologies and manufacturing solutions.
TSMC will continue working closely with international consortia and photolithography equipment suppliers to ensure the timely development of 193nm high-NA scanner technology, liquid immersion lithography, EUV lithography, and massively parallel E-Beam direct-write technologies. These technologies are now fundamental to TSMC’s process development efforts at the 20nm and 15nm nodes and beyond.
TSMC continues to work with mask inspection equipment suppliers to develop viable inspection techniques, a collaborative partnership to help ensure the Company maintains its leadership position in mask quality and cycle time and continue to meet aggressive R&D, prototyping and production requirements.
With a highly competent and dedicated R&D team, and unwavering commitment to innovation, TSMC is confident of its ability to deliver the best and most cost-effective SoC technologies for customers, and to support the Company’s business growth and profitability.
TSMC R&D future major project summary:
Project Name DescriptionRisk Production (Estimated Target Schedule)
28nm logic platform technology and applications
28nm technology for both digital and analog products
2010
20nm logic platform technology and applications
Next-generation technology for both digital and analog products
2012
15nm logic platform technology and applications
Exploratory technology for both digital and analog products
2014
3D-IC Cost-effective solution with better form factor and performance for SIP
2011
Next-generation lithography
EUV and multiple E-Beam to extend Moore’s Law
2011 - 2012
Long-term research Special SoC technology (including new NVM, MEMS, RF, analog) and 15nm transistors
2012 - 2014
The above plans account for roughly 70% of the total corporate R&D budget in 2010, which will be around 7~8% of 2010 revenue.
5.3 Manufacturing Excellence
5.3.1 Efficiency
Fast Yield RampFast yield ramp for new products is an important factor to help TSMC’s customers shorten their time-to-market. TSMC has developed a comprehensive technology transfer methodology extending from R&D to production in order to shorten the yield learning curve of leading edge technologies.
Accurate DeliveryTSMC has a proven record of providing customers with consistent on-time delivery. The Company has equipped a state-of-the-art supply chain management system in an effort try to improve both our customers’ forecast processes and TSMC’s delivery schedule accuracy. In 2009, the Company was able to make over 98 percent of deliveries within one day of the scheduled delivery date.
Best-in-Class Cycle Time ManagementFast manufacturing cycle time is another important factor behind TSMC’s continued competitive success and that of our customers. Accordingly, TSMC has developed a sophisticated manufacturing scheduling and dispatching system, implemented industry-leading automated materials handling systems, and employed effective lean manufacturing approaches. In 2009, the Company unceasingly strived to optimize manufacturing processes and cycle time management techniques, and continued to break cycle time records.
Flexible Manufacturing ManagementFlexible Manufacturing is a crucial element that addresses the fluctuations in demand forecast. In many cases, TSMC has the ability to meet unanticipated customer demand surges, thanks in large part to our cluster fab capability as well as to our extensive know-how in performance matching for both tools and fabs.
Knowledge ManagementTSMC has built the industry’s leading, state-of-the-art knowledge management, and Best Known Method (BKM) systems. TSMC maintains a vast database of key TSMC knowledge, which features a sophisticated expert system that embeds captured knowledge into TSMC’s engineering system.
Inventory ManagementAs semiconductor devices become more diverse, inventory management becomes more critical. TSMC has built integrated supply and demand information into its inventory management system to improve the Company’s responsiveness to the variability of wafer demand forecasts. The speed and accuracy of TSMC’s response has been improved through real-time demand information sharing.
OPE
RATI
ON
AL
HIG
HLI
GH
TS

51
5.3.2 GIGAFABTM Fabrications
TSMC’s 12-inch fabs are a key part of its manufacturing strategy. TSMC currently operates two 12-inch GIGAFABTM fabrication facilities – Fab 12 and Fab 14. The combined capacity of the two GIGAFABTMs reached 486,000 12-inch wafers in the fourth quarter of 2009. Production within these two facilities supports 0.13μm, 90nm, 65nm and 40nm process technologies, and their sub-nodes. Part of the capacity is reserved for research and development work and currently supports 28nm, 20nm and beyond technology development.
The GIGAFABTMs are the cornerstones of TSMC’s unceasing efforts to improve manufacturing excellence and to deliver manufacturing breakthroughs. GIGAFABTMs have the inherent scale advantages over smaller fabs and also enable greater flexibility to adapt to demand fluctuations, improve product quality and yields, accelerate yield learning and time-to-volume, shorten cycle times, and minimize costly product re-qualification.
5.3.3 450mm Wafer Manufacturing Transition
TSMC and other leading semiconductor companies have reached a pro-competitive agreement on the need for industry-wide collaboration to target a transition to larger, 450mm-sized wafers. The transition to larger wafers will help lower production costs and energy consumption per chip and enable continued growth of the semiconductor industry.
TSMC will continue to work with International Sematech (ISMI), and material and equipment suppliers to collaborate on new materials, next wafer size transition, lithography strategy, efficient tool platform, and eco-friendly process.
5.3.4 Raw Materials and Supply Chain Risk Management
In 2009, TSMC continued running monthly Supply Chain Risk Management meetings to integrate Company resources from materials management, fab operations, risk management and quality management in lowering supply chain risk. TSMC worked with its suppliers to enhance the performance of quality, delivery, risk management, and to support Green procurement, environmental protection and safety.
Raw Materials Supply
Major Materials Major Suppliers Market Status Procurement Strategy
Raw Wafers F.S.T.MEMCS.E.H.SiltronicSUMCO
These five suppliers together provide over 85% of the world’s wafer supply.
Each supplier has multiple manufacturing sites in order to meet customer demand, including plants in North America, Asia, and Europe.
● �TSMC’s suppliers of silicon wafers are required to pass stringent quality certification procedures.
● �TSMC procures wafers from multiple sources to ensure adequate supplies for volume manufacturing and to appropriately manage supply risk.
● �TSMC maintains competitive price and service agreements with its wafer suppliers, and, when necessary, enters into strategic and collaborative agreements with key suppliers.
● �TSMC regularly reviews the quality, delivery, cost and service performance of its wafer suppliers. The results of these reviews are incorporated into TSMC’s subsequent purchasing decisions.
● �A periodic audit of each wafer supplier’s quality assurance systems ensures that TSMC can maintain the highest quality in its own products.
Chemicals Air ProductsATMIBASFDowMGCTYS
These six companies are the major suppliers for bulk and specialty chemicals.
● �Most suppliers have relocated many of their operations closer to TSMC’s major manufacturing facilities, thereby significantly improving procurement logistics.
● �The suppliers’ products are regularly reviewed to ensure that TSMC’s specifications are met and product quality is satisfactory.
Photoresist AZNissanShin-Etsu ChemicalSumitomoT.O.K.
These five companies are the major suppliers for photoresist.
● �TSMC works closely with its suppliers to ensure that they have adequate production lead time to supply the required products to TSMC.
● �TSMC conducts periodic audits of the suppliers’ quality assurance systems to ensure that they meet TSMC’s standards.
Gases Air LiquideAir ProductsLindeTaiyo Nippon Sanso
These four companies are the major suppliers of specialty gases.
The products of these four suppliers are interchangeable.
● �The majority of the four suppliers are located in different geographic locations, minimizing supply risk to TSMC.
● �TSMC has long-term contracts with these suppliers to ensure supply stability and service quality. In addition, the availability of other domestic suppliers enables TSMC to secure better purchase terms for these gases.
● �TSMC conducts periodic audits of the suppliers’ quality assurance systems to ensure that they meet TSMC’s standards.
Slurry, Pad, Disk 3MCabotDA NanoKinikPlanar SolutionsDow
These six companies are the major suppliers for CMP materials.
● �Most suppliers have relocated many of their operations closer to TSMC’s major manufacturing facilities, thereby improving procurement logistics and mitigating supply chain risk.
● �TSMC conducts periodic audits of the suppliers’ quality assurance systems to ensure that they meet TSMC’s standards.
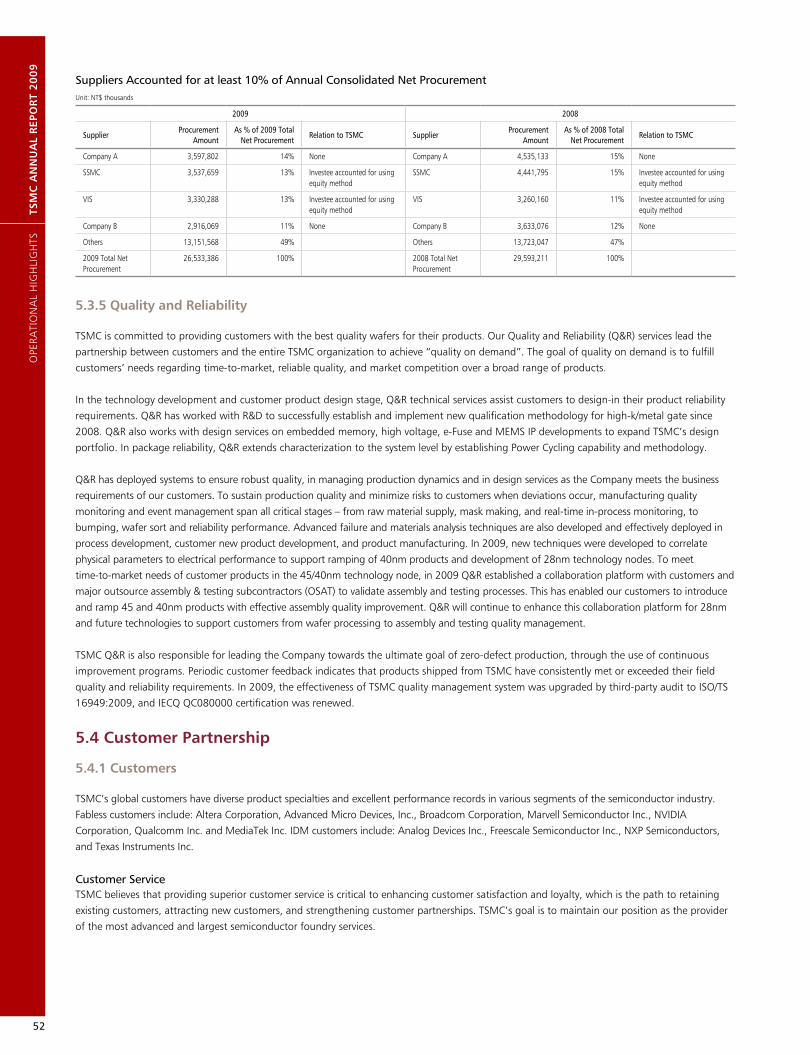
52
TSM
C A
NN
UA
L R
EPO
RT
20
09
Suppliers Accounted for at least 10% of Annual Consolidated Net Procurement
5.3.5 Quality and Reliability
TSMC is committed to providing customers with the best quality wafers for their products. Our Quality and Reliability (Q&R) services lead the
partnership between customers and the entire TSMC organization to achieve “quality on demand”. The goal of quality on demand is to fulfill
customers’ needs regarding time-to-market, reliable quality, and market competition over a broad range of products.
In the technology development and customer product design stage, Q&R technical services assist customers to design-in their product reliability
requirements. Q&R has worked with R&D to successfully establish and implement new qualification methodology for high-k/metal gate since
2008. Q&R also works with design services on embedded memory, high voltage, e-Fuse and MEMS IP developments to expand TSMC’s design
portfolio. In package reliability, Q&R extends characterization to the system level by establishing Power Cycling capability and methodology.
Q&R has deployed systems to ensure robust quality, in managing production dynamics and in design services as the Company meets the business
requirements of our customers. To sustain production quality and minimize risks to customers when deviations occur, manufacturing quality
monitoring and event management span all critical stages – from raw material supply, mask making, and real-time in-process monitoring, to
bumping, wafer sort and reliability performance. Advanced failure and materials analysis techniques are also developed and effectively deployed in
process development, customer new product development, and product manufacturing. In 2009, new techniques were developed to correlate
physical parameters to electrical performance to support ramping of 40nm products and development of 28nm technology nodes. To meet
time-to-market needs of customer products in the 45/40nm technology node, in 2009 Q&R established a collaboration platform with customers and
major outsource assembly & testing subcontractors (OSAT) to validate assembly and testing processes. This has enabled our customers to introduce
and ramp 45 and 40nm products with effective assembly quality improvement. Q&R will continue to enhance this collaboration platform for 28nm
and future technologies to support customers from wafer processing to assembly and testing quality management.
TSMC Q&R is also responsible for leading the Company towards the ultimate goal of zero-defect production, through the use of continuous
improvement programs. Periodic customer feedback indicates that products shipped from TSMC have consistently met or exceeded their field
quality and reliability requirements. In 2009, the effectiveness of TSMC quality management system was upgraded by third-party audit to ISO/TS
16949:2009, and IECQ QC080000 certification was renewed.
5.4 Customer Partnership
5.4.1 Customers
TSMC’s global customers have diverse product specialties and excellent performance records in various segments of the semiconductor industry.
Fabless customers include: Altera Corporation, Advanced Micro Devices, Inc., Broadcom Corporation, Marvell Semiconductor Inc., NVIDIA
Corporation, Qualcomm Inc. and MediaTek Inc. IDM customers include: Analog Devices Inc., Freescale Semiconductor Inc., NXP Semiconductors,
and Texas Instruments Inc.
Customer ServiceTSMC believes that providing superior customer service is critical to enhancing customer satisfaction and loyalty, which is the path to retaining
existing customers, attracting new customers, and strengthening customer partnerships. TSMC’s goal is to maintain our position as the provider
of the most advanced and largest semiconductor foundry services.
OPE
RATI
ON
AL
HIG
HLI
GH
TS
2009 2008
SupplierProcurement
Amount As % of 2009 Total
Net ProcurementRelation to TSMC Supplier
Procurement Amount
As % of 2008 Total Net Procurement
Relation to TSMC
Company A 3,597,802 14% None Company A 4,535,133 15% None
SSMC 3,537,659 13% Investee accounted for using equity method
SSMC 4,441,795 15% Investee accounted for using equity method
VIS 3,330,288 13% Investee accounted for using equity method
VIS 3,260,160 11% Investee accounted for using equity method
Company B 2,916,069 11% None Company B 3,633,076 12% None
Others 13,151,568 49% Others 13,723,047 47%
2009 Total Net Procurement
26,533,386 100% 2008 Total Net Procurement
29,593,211 100%
Unit: NT$ thousands
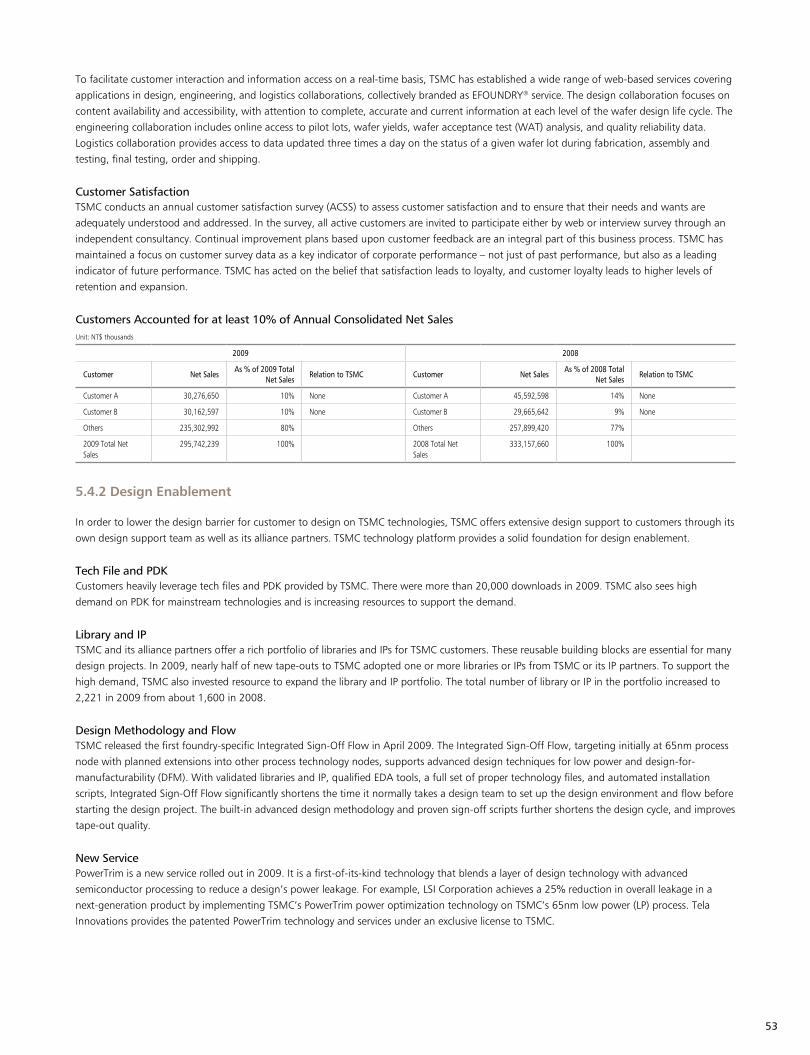
53
To facilitate customer interaction and information access on a real-time basis, TSMC has established a wide range of web-based services covering
applications in design, engineering, and logistics collaborations, collectively branded as EFOUNDRY® service. The design collaboration focuses on
content availability and accessibility, with attention to complete, accurate and current information at each level of the wafer design life cycle. The
engineering collaboration includes online access to pilot lots, wafer yields, wafer acceptance test (WAT) analysis, and quality reliability data.
Logistics collaboration provides access to data updated three times a day on the status of a given wafer lot during fabrication, assembly and
testing, final testing, order and shipping.
Customer SatisfactionTSMC conducts an annual customer satisfaction survey (ACSS) to assess customer satisfaction and to ensure that their needs and wants are
adequately understood and addressed. In the survey, all active customers are invited to participate either by web or interview survey through an
independent consultancy. Continual improvement plans based upon customer feedback are an integral part of this business process. TSMC has
maintained a focus on customer survey data as a key indicator of corporate performance – not just of past performance, but also as a leading
indicator of future performance. TSMC has acted on the belief that satisfaction leads to loyalty, and customer loyalty leads to higher levels of
retention and expansion.
5.4.2 Design Enablement
In order to lower the design barrier for customer to design on TSMC technologies, TSMC offers extensive design support to customers through its
own design support team as well as its alliance partners. TSMC technology platform provides a solid foundation for design enablement.
Tech File and PDKCustomers heavily leverage tech files and PDK provided by TSMC. There were more than 20,000 downloads in 2009. TSMC also sees high
demand on PDK for mainstream technologies and is increasing resources to support the demand.
Library and IPTSMC and its alliance partners offer a rich portfolio of libraries and IPs for TSMC customers. These reusable building blocks are essential for many
design projects. In 2009, nearly half of new tape-outs to TSMC adopted one or more libraries or IPs from TSMC or its IP partners. To support the
high demand, TSMC also invested resource to expand the library and IP portfolio. The total number of library or IP in the portfolio increased to
2,221 in 2009 from about 1,600 in 2008.
Design Methodology and FlowTSMC released the first foundry-specific Integrated Sign-Off Flow in April 2009. The Integrated Sign-Off Flow, targeting initially at 65nm process
node with planned extensions into other process technology nodes, supports advanced design techniques for low power and design-for-
manufacturability (DFM). With validated libraries and IP, qualified EDA tools, a full set of proper technology files, and automated installation
scripts, Integrated Sign-Off Flow significantly shortens the time it normally takes a design team to set up the design environment and flow before
starting the design project. The built-in advanced design methodology and proven sign-off scripts further shortens the design cycle, and improves
tape-out quality.
New ServicePowerTrim is a new service rolled out in 2009. It is a first-of-its-kind technology that blends a layer of design technology with advanced
semiconductor processing to reduce a design’s power leakage. For example, LSI Corporation achieves a 25% reduction in overall leakage in a
next-generation product by implementing TSMC’s PowerTrim power optimization technology on TSMC’s 65nm low power (LP) process. Tela
Innovations provides the patented PowerTrim technology and services under an exclusive license to TSMC.
Customers Accounted for at least 10% of Annual Consolidated Net Sales
2009 2008
Customer Net Sales As % of 2009 Total
Net SalesRelation to TSMC Customer Net Sales
As % of 2008 Total Net Sales
Relation to TSMC
Customer A 30,276,650 10% None Customer A 45,592,598 14% None
Customer B 30,162,597 10% None Customer B 29,665,642 9% None
Others 235,302,992 80% Others 257,899,420 77%
2009 Total Net Sales
295,742,239 100% 2008 Total Net Sales
333,157,660 100%
Unit: NT$ thousands

54
TSM
C A
NN
UA
L R
EPO
RT
20
09
5.5 Employees
5.5.1 Human Capital
Human capital is one of the most important assets of TSMC. TSMC
strives to provide employees with a challenging, enjoyable and
rewarding work environment. In 2009, TSMC was named the “Most
Admired Company in Taiwan” by Commonwealth Magazine for the
13th consecutive year.
At the end of 2009, TSMC had more than 24,000 employees
worldwide, including 2,792 managers and 9,861 professionals.
Female managers comprised 11.2% of all managers, and
non-Taiwanese nationals comprised 10.1% of all TSMC managers
and professionals. The following tables summarize TSMC’s workforce
structure at the end of February, 2010:
TSMC Workforce Structure
12/31/2008 12/31/2009 02/28/2010
Job
Managers 2,618 2,792 2,826
Professionals 8,830 9,861 10,102
Assistant Engineer/Clerical
824 761 774
Technician 10,571 11,052 11,558
GenderMale (%) 48.6% 50.7% 50.7%
Female (%) 51.4% 49.3% 49.3%
Education
Ph.D. 3.1% 3.5% 3.5%
Master’s 30.6% 32.8% 32.6%
Bachelor’s 20.2% 20.7% 21.2%
Other higher education
18.2% 16.5% 16.3%
High school 27.9% 26.5% 26.4%
Average Age (years) 32.7 37.8 33.0
Average Years of Service (years) 6.5 6.0 6.4
Total 22,843 24,466 25,260
5.5.2 Recruitment
Attracting new employees and retaining and motivating existing
employees are key to the success of TSMC’s human resources
strategy. TSMC believes in equal opportunity employment.
Recruitment is conducted via an open selection process and is based
on the candidate’s ability to fulfill the needs of each position,
regardless of race, gender, age, religion, nationality, or political
affiliation. In order to seek out the best talents around the world,
TSMC employs a number of recruiting programs, including academic/
corporate collaboration programs, Joint Development Program in
Campus, summer internships, job fairs, and Technology Talents
Career Symposium. During 2009, TSMC recruited 143 managers,
2,289 professionals and 1,567 technicians.
5.5.3 People Development
Continuous learning is the cornerstone of TSMC’s employee
development strategy. It is especially important for Company success
in this tough economic environment. A tailor-made individual
development plan is established for each employee appropriate to
the employee’s development needs. Employees are provided with a
comprehensive network of resources, including on-the-job training,
coaching, mentoring, job rotation, on-site courses, e-learning, and
external learning opportunities.
TSMC provides employees with a wide range of on-site general,
professional and management training programs. In addition to
external experts engaged as trainers, hundreds of TSMC employees
are trained as qualified instructors for training courses. During 2009,
TSMC conducted 726 internal training sessions totaling 506,907
training hours. A total of 255,311 attendees participated in those
trainings. The total training expenses were NT$58 million. TSMC’s
training programs include:
● �Management Training: includes development training programs tailored to the needs of managers at all levels. These include New
Manager Program, Experienced Manager Program, and Senior
Manager Program, as well as other elective courses.● �General Training: refers to training required by government
regulations and Company policies. Such training includes
industry-specific safety, workplace health and safety, quality, fab
emergency response team, languages, and personal effectiveness
training.● �Professional/Functional Training: provides technical and
professional training required by various functions within the
Company, offering training courses on equipment engineering,
process engineering, accounting, and information technology,
among others.● �Direct Labor (DL) Training: DL training enables production line
employees to acquire the knowledge, skills and attitudes they need
to perform their job well. It also helps employees pass required
tests in order to be certified for operating equipment. Training
includes DL Skill Training, Technician “Train-the-Trainer” Training,
and Manufacturing Leader Training.● �New Employee Training: includes pre-job training, new employee
basic training and job orientation.
TSMC has established the “Procedure of Employee Training and
Education”, which not only enables the on-site training courses but
also best suits company and individual development objectives
through external training courses. Under the guideline, employees
are encouraged to participate in various training programs, and
subsidies are provided when taking short courses, credit courses and
degrees.
OPE
RATI
ON
AL
HIG
HLI
GH
TS
55
5.5.4 Employee Satisfaction
To enhance employee career satisfaction, TSMC has continuously
promoted programs devoted to employee benefits, employee care,
employee rewards, and employee communication. TSMC works hard
to enrich its employees’ working experience by providing an
environment that is challenging yet enjoyable.
Employee Benefits Programs● �TSMC Employee Welfare Committee plans and implements various
welfare programs, including hobby clubs, art and cultural seminars,
employee outings, TSMC Sports Day, and TSMC Family Day. In
addition, TSMC provides holiday bonuses, wedding bonuses,
funeral and emergency subsidies.● �To ensure that employees have all the conveniences they need
while at work, TSMC provides on-site cafeteria, dry-cleaning, travel,
banking, haircut services, housing, and commuting assistances.● �Health improvement programs and psychological consultation
services are provided to employees to ensure the physical and
psychological well being of all employees.● �In order to promote healthy living, the Company established TSMC
Sports Center. It is open to all employees and their family members.
And it provides a variety of workout facilities. TSMC provides
Children Centers at Hsinchu and Tainan sites to meet employees’
needs for childcare.
Employee RecognitionIn order to recognize employees’ outstanding achievement, TSMC
applies various award programs including the Outstanding Engineer
Award for each fab and the Total Quality Excellence Conference
Award. In 2009, TSMC employees were recognized nationally,
including: the National Model Worker Award, the Top 10 National
Outstanding Managers Award, the Outstanding Engineer Award,
and the Outstanding Young Engineer Award.
Employee CommunicationTSMC is committed to keeping an open communication channel with
its employees. Regular communication meetings are held for the
various levels of managers and employees. Periodic employee
satisfaction surveys are conducted. eSilicon Garden, a quarterly
electronic TSMC internal publication, is issued covering things from
work to fun. These all help maintain the free flow of information
between TSMC and its employees.
In order to ensure that employees’ opinions and voices can be heard,
responded to, and resolved, impartial and smooth voice submission
mechanisms have been established:
● �Whistleblower channels for complaints related to major management, financial and auditing issues directed to:
1) Independent Audit Committee Chairman
2) “Ombudsman”, headed by a vice president● �Suggestion Box for employees to express their opinions regarding
their work and the working environment in general.● �HR Call Center and employee care teams in each fab to deal with
issues related to employees’ work and personal life.
The company also endeavors to establish and promote policies and
measures for ensuring gender equality in accordance with
employment laws and sexual harassment prevention policies to
create a fair working environment for employees of both sexes.
As a result of TSMC’s 2008 annual performance management and
development (PMD) appraisal, some employees separated from the
Company filed complaints with the Science Park Administration
seeking mediations of labor disputes arising from the PMD process
and result. The Company continuously communicated with those
ex-employees and resolved most of the disputes amicably, by
offering to reinstate those ex-employees, or provide financial
assistance to those who refused reinstatement. The disputes did not
have a material impact on the Company’s operations or financial
condition.
We firmly believe that harmonious labor relations provide an
essential basis to sustain the Company’s growth. The Company’s
management team has become even more devoted to cultivating
positive employee relations. To harmonize labor relations and create
a win-win situation for the Company and its employees, execution of
the Performance Management and Development system (PMD)
should be done in a positive and constructive manner, and mutual
and timely employee communication based on existing platforms
should be enforced.
5.5.5 Retention
From the employee’s initial adjustment to professional and career
development, TSMC works hard to retain outstanding employees
through creating an innovative, challenging, and developmental
environment. We are committed to:
● �Setting up retention and counseling plans for different groups. For example, TSMC employs a “Buddy System” to help new employees
to fit in quickly through assistance provided by senior employees.● �Enabling employees to enhance professional knowledge and to
pursue further career development through numerous employee
development programs.● �Establishing a synergized welfare platform and providing a
work-life balanced environment to all employees; Enhancing
employees’ loyalty and commitment through employee
engagement programs.
5.5.6 Compensation
TSMC’s compensation program includes cash compensation and
profit sharing bonus. Cash compensation includes a monthly salary
and a variable incentive bonus. The employee is entitled to profit
sharing of no less than one percent of TSMC’s net income after
deducting the losses of previous years and contributions to legal and
special reserves. The purpose of this profit sharing bonus is to reward
employees’ contributions appropriately, to encourage employees to
work consistently to ensure the success of TSMC, and to link
employees’ interests with those of TSMC’s shareholders.

56
TSM
C A
NN
UA
L R
EPO
RT
20
09
The amount and form of the profit distribution are determined by
the Board of Directors based on the Compensation Committee’s
recommendation and are subject to shareholders’ approval at the
Annual Shareholders’ Meeting. The Company determines the amount
of the profit sharing based on operating results and industry practice
in the Republic of China. Individual awards are based on each
employee’s job responsibility, contribution and performance.
To raise TSMC’s competitiveness in recruiting, TSMC made a
structural salary increase in 2010, and distributes employees’ cash
bonus from the Company’s profits on a quarterly bases to share the
rewards of employees’ hard work in a timely fashion.
In addition to providing employees of TSMC’s overseas subsidiaries
with a locally competitive base salary, the Company grants
short-term and long-term bonuses as a part of total compensation.
The performance bonus is a short-term incentive and is granted in
line with local regulations, market practices, and the overall
operating performance of each subsidiary. The long-term incentive
bonus is awarded based on TSMC’s financial performance and is
vested over the course of several years in order to encourage
long-term employee commitment and development within the
Company.
5.5.7 Retirement Policy
TSMC’s retirement policy is in accordance with the provisions in the
Labor Standards Law and Labor Pension Act of the Republic of China.
5.5.8 Code of Ethics and Business Conduct
Purpose & ScopeHonorable, honest and legitimate business practice is one of TSMC’s
foundations for its long-term success. TSMC is known as a company
with an outstanding reputation for high ethical standards.
This Code covers the behavioral norms for all Employees and Board
of Directors in their dealings with each other as well as with the
Company, customers, suppliers, investors and the general public.
Statement of Commitments and ObligationsIn addition to strictly abiding by laws and regulations of Taiwan, ROC
and the other countries where TSMC engages in business activities,
TSMC requires all Employees to employ individual integrity at all
times, and clearly understand and act in accordance with business
ethics principles that meet or exceed the public’s heightened
expectations of global companies.
Compliance with Laws and Regulations; Social ResponsibilityAll Employees and Board members should comply with all applicable
laws, regulations, and in-house policies, including this Code, in every
aspect of the Company’s corporate activities at all times, including
the following:
1) Internal Controls, Keeping Accurate Books and Records
2) Respect for Intellectual Property and Proprietary Information
Protection
3) Export Control
4) Principle of Fair Dealing
5) Corporate Social Responsibility
Conflicts of Interest and Insider Trading Prevention1) Avoid Conflicts of Interest
As a member of TSMC, one should maintain the highest
business ethics when encountering a conflict or potential
conflict of interest situation.
2) Gifts and Hospitality
TSMC’s business practice is based on objective norms and
integrity, and TSMC Employees do not accept gifts or special
favors exceeding company policy allowed limit.
3) Insider Trading Prevention
It is prohibited for TSMC Employees to trade any TSMC or other
company’s securities while in possession of material non-public
information or to pass such information to others for personal
financial interests.
Company AssetsAll Employees should properly manage the Company’s assets in
accordance with in-house policies and rules and will not use them for
private purposes.
Implementation1) Issues & Questions
If Employees have any question concerning this Code, they can
consult or seek help from: immediate supervisors, Human
Resources, Company website, Legal, Employees Suggestion
Boxes, and the Ombudsman system
2) Prevention and Reporting Violations
All Employees must look out for any violation of this Code. When
Employees find or reasonably suspect any violation of this Code,
it should be reported to their supervisors immediately.
3) Exceptions to this Code need to be approved by CEO.
4) Disciplinary Actions
Violation of this Code is subject to disciplinary actions.
5.6 Material Contracts
Shareholders AgreementTerm of Agreement:Effective as of 03/30/1999 and may be terminated as provided in the
agreement
Contracting Parties:Koninklijke Philips Electronics N.V. (Philips) and EDB Investments Pte
Ltd. (EDBI)
(In September 2006, Philips assigned its rights and obligations under
this agreement to Philips Semiconductors International B.V. which
has now been renamed NXP B.V. In November 2006, NXP B.V. and
TSMC purchased all SSMC shares owned by EDBI; EDBI is no longer a
contracting party to this agreement.)
Summary:TSMC, Philips and EDBI had formed a Singapore joint venture
“Systems on Silicon Manufacturing Company Pte Ltd.” (SSMC) for
providing IC foundry services. Philips Semiconductor (now NXP B.V.)
and TSMC are committed to purchasing a certain percentage of
SSMC’s capacity.
OPE
RATI
ON
AL
HIG
HLI
GH
TS
57
Technology Cooperation AgreementTerm of Agreement:03/30/1999 - 03/29/2004, automatically renewable for successive
five-year terms until and unless either party gives written notice to
terminate one year before the end of then existing term
Contracting Party:Systems on Silicon Manufacturing Company Pte Ltd. (SSMC)
Summary:TSMC agreed to transfer certain process technologies to SSMC, and
SSMC agreed to pay TSMC a certain percentage of the net selling
price of SSMC products.
Patent License AgreementTerm of Agreement:12/20/2007 - 12/31/2017
Contracting Party:A multinational company
Summary:The parties entered into a cross licensing arrangement for certain
semiconductor patents. TSMC pays license fees to the contracting
company.
Manufacturing, License, and Technology Transfer AgreementTerm of Agreement:04/01/2004 - 03/31/2006, automatically renewable for successive
one-year terms until and unless both parties decide otherwise by
mutual consent in writing
Contracting Party:Vanguard International Semiconductor Corporation (VIS)
Summary:VIS reserves certain capacity to manufacture TSMC products on
mutually agreed terms. TSMC may also transfer certain technologies
to VIS, for which it will in return receive royalties from VIS.
Patent License AgreementTerm of Agreement:11/01/2002 - 10/31/2012
Contracting Party:A multinational company
Summary:The parties entered into a cross licensing arrangement for certain
semiconductor patents. TSMC pays license fees to the contracting
party.
Patent License AgreementTerm of Agreement:07/01/2002 - 06/30/2009
Contracting Party:A multinational company
Summary:The parties entered into a cross licensing arrangement for certain
semiconductor patents. TSMC pays license fees to the contracting
party.
Patent License AgreementTerm of Agreement:01/01/2001 - 12/31/2011
Contracting Party:A multinational company
Summary:The parties entered into a cross licensing arrangement for certain
semiconductor patents. TSMC pays license fees to the contracting
party.
Settlement AgreementEffective Date of Agreement:11/09/2009
Contracting Parties:Semiconductor Manufacturing International Corp. (SMIC) and certain
of its subsidiaries
Summary:The parties settled their trade secret misappropriation and breach of
2005 settlement agreement disputes, whereby SMIC agrees to pay
TSMC US$200 million, which are in addition to $135 million
previously paid to TSMC under the 2005 settlement agreement, and
other valuable consideration.
Amended Research and Development Collaboration AgreementTerm of Agreement:01/01/2009 - 12/31/2009, renewable on annual basis upon mutual
agreement
Contracting Party:NXP B.V.
Summary:The parties entered into research and development collaboration to
develop advanced semiconductor technologies.
Share Subscription AgreementEffective Date of Agreement:12/09/2009
Contracting Parties:Motech Industries, Inc. (Motech)
Summary:In accordance with the terms and conditions of the Share Purchase
Agreement, TSMC agreed to subscribe through a private placement
for new shares of Motech Industries Inc. (“Motech”), which
represents 20% of the total outstanding shares of Motech. The total
consideration is approximately NT$6.2 billion (US$193 million).
Note: TSMC is not currently party to any other material contract,
other than contracts entered into in the ordinary course of our
business. The Company’s “Significant Commitments and
Contingencies” are disclosed in the “Financial Information” of
Annual Report (II), pages 66-67.
58
TSM
C A
NN
UA
L R
EPO
RT
20
09
FIN
AN
CIA
L H
IGH
LIG
HTS

59
TSMC’s trinity of strengths, technology leadership, manufacturing excellence, and customer partnership, are built on a foundation of financial
strength. In 2009, we generated positive free cash flow (equal to operating cash flow minus capital expenditure) for the 8th consecutive year. We
also returned a significant amount of cash to our shareholders through cash dividends. With our strong balance sheet and our consistent
profitability, we believe we are well positioned for our future growth and for delivering increasing long-term returns to our shareholders.
6.1 Financial Status and Operating Results
6.1.1 Financial Status
Unconsolidated
Item 2009 2008 Difference %
Current Assets 185,831,537 179,849,479 5,982,058 3%
Fixed Assets 254,751,526 219,282,502 35,469,024 16%
Other Assets 18,415,746 17,242,603 1,173,143 7%
Total Assets 577,426,622 540,559,247 36,867,375 7%
Current Liabilities 72,571,095 53,099,467 19,471,628 37%
Long-term Liabilities 9,772,815 11,082,669 (1,309,854) -12%
Total Liabilities 82,343,910 64,182,136 18,161,774 28%
Capital Stock 259,027,066 256,254,373 2,772,693 1%
Capital Surplus 55,486,010 49,875,255 5,610,755 11%
Retained Earnings 181,882,682 170,053,667 11,829,015 7%
Total Shareholders’ Equity 495,082,712 476,377,111 18,705,601 4%
Unit: NT$ thousands
● Analysis of Deviation over 20%The increase in both current liabilities and total liabilities was mainly due to an increase in payables to contractors and equipment suppliers.
● Major Impact on Financial PositionThe above deviations over 20% had no major impact on TSMC’s financial position.
● Future Plan on Financial Position: Not applicable.
6. FINANCIAL HIGHLIGHTS

60
TSM
C A
NN
UA
L R
EPO
RT
20
09
Consolidated
Item 2009 2008 Difference %
Current Assets 259,803,748 252,618,431 7,185,317 3%
Fixed Assets 273,674,787 243,645,350 30,029,437 12%
Other Assets 23,372,182 22,671,293 700,889 3%
Total Assets 594,696,220 558,916,589 35,779,631 6%
Current Liabilities 79,133,288 56,806,756 22,326,532 39%
Long-term Liabilities 16,514,384 21,737,366 (5,222,982) -24%
Total Liabilities 95,647,672 78,544,122 17,103,550 22%
Capital Stock 259,027,066 256,254,373 2,772,693 1%
Capital Surplus 55,486,010 49,875,255 5,610,755 11%
Retained Earnings 181,882,682 170,053,667 11,829,015 7%
Equity Attributable to Shareholders of the Parent 495,082,712 476,377,111 18,705,601 4%
Total Shareholders’ Equity 499,048,548 480,372,467 18,676,081 4%
Unit: NT$ thousands
● Analysis of Deviation over 20%The increase in current liabilities was mainly due to an increase in payables to contractors and equipment suppliers.
The decrease in long-term liabilities was mainly due to the reclassification of payables for acquisition of property, plant and equipment, long-term
bank loans and payable for royalties from long-term liabilities to current.
The increase in total liabilities was mainly due to an increase in payables to contractors and equipment suppliers.
● Major Impact on Financial PositionThe above deviations over 20% had no major impact on TSMC’s financial position.
● Future Plan on Financial Position: Not applicable.
6.1.2 Operating Results
UnconsolidatedUnit: NT$ thousands
Item 2009 2008 Difference %
Gross Sales 299,471,214 330,228,027 (30,756,813) -9%
Sales Returns & Allowances (13,728,346) (8,460,944) (5,267,402) 62%
Net Sales 285,742,868 321,767,083 (36,024,215) -11%
Cost of Sales 159,106,619 183,589,540 (24,482,921) -13%
Gross Profit 126,636,249 138,177,543 (11,541,294) -8%
Realized (Unrealized) Gross Profit From Affiliates (160,279) 72 (160,351) -100%
Realized Gross Profit 126,475,970 138,177,615 (11,701,645) -8%
Operating Expenses 31,953,617 31,887,383 66,234 0%
Income from Operations 94,522,353 106,290,232 (11,767,879) -11%
Non-operating Income & Gains 4,121,509 6,725,625 (2,604,116) -39%
Non-operating Expenses & Losses 3,662,840 2,257,039 1,405,801 62%
Income before Income Tax 94,981,022 110,758,818 (15,777,796) -14%
Income Tax Expenses (5,763,186) (10,825,650) 5,062,464 -47%
Income after Income Tax 89,217,836 99,933,168 (10,715,332) -11%
● Analysis of Deviation over 20%Increase in sales returns and allowance: The increase was the result of higher provision on the potential sales returns and allowances.
Increase in unrealized gross profit from affiliates: The increase was due to higher sales to the affiliates in 4Q’09.
Decrease in non-operating income and gains: The decrease was primarily due to lower interest income and foreign exchange gain.
Increase in non-operating expenses and losses: The increase was primarily due to higher equity in losses of equity method investees but offset by
lower valuation loss on financial instruments.
Decrease in income tax expenses: The decrease was primarily due to lower taxable income and an increase in tax credit attributed to higher
capital expenditure.
● Sales Volume Forecast and Related InformationFor additional details, please refer to “Letter to Shareholders” on pages 3-5 of this Annual Report.
FIN
AN
CIA
L H
IGH
LIG
HTS

61
Unit: NT$ thousands
Item 2009 2008 Difference %
Gross Sales 309,655,614 341,983,355 (32,327,741) -9%
Sales Returns & Allowances (13,913,375) (8,825,695) (5,087,680) 58%
Net Sales 295,742,239 333,157,660 (37,415,421) -11%
Cost of Sales 166,413,628 191,408,099 (24,994,471) -13%
Gross Profit 129,328,611 141,749,561 (12,420,950) -9%
Operating Expenses 37,366,725 37,314,193 52,532 0%
Income from Operations 91,961,886 104,435,368 (12,473,482) -12%
Non-operating Income & Gains 5,653,548 10,821,449 (5,167,901) -48%
Non-operating Expenses & Losses 2,152,787 3,784,571 (1,631,784) -43%
Income before Income Tax 95,462,647 111,472,246 (16,009,599) -14%
Income Tax Expenses (5,996,424) (10,949,009) 4,952,585 -45%
Net Income 89,466,223 100,523,237 (11,057,014) -11%
Net Income Attributable to Shareholders of the Parent 89,217,836 99,933,168 (10,715,332) -11%
● Analysis of Deviation over 20%Increase in sales return and allowances: The increase was the result of higher provision on the potential sales return and allowances.
Decrease in non-operating income and gains: The decrease was primarily due to lower interest income and foreign exchange gain.
Decrease in non-operating expenses and losses: The decrease was primarily due to lower loss on impairment of financial assets and valuation loss
on financial instruments.
Decrease in income tax expenses: The decrease was primarily due to lower taxable income and an increase in tax credit attributed to higher
capital expenditure.
● Sales Volume Forecast and Related InformationFor additional details, please refer to “Letter to Shareholders” on pages 3-5 of this Annual Report.
6.1.3 Cash Flow
Unconsolidated
Consolidated
Cash Balance 12/31/2008Net Cash Provided by Operating
Activities in 2009Net Cash Outflows from Investing
and Financing Activities in 2009Cash Balance 12/31/2009
Remedy for Cash Shortfall
Investment Plan Financing Plan
138,208,360 155,902,046 (177,066,863) 117,043,543 - -
● Analysis of Cash FlowNT$155.9 billion net cash provided by operating activities: Mainly from net income and depreciation/amortization.
NT$92.0 billion net cash used in investing activities: Primarily for capital expenditures.
NT$85.1 billion net cash used in financing activities: Mostly for the payout of cash dividends and repayment of corporate bonds.
● Remedial Actions for Cash Shortfall: In view of positive cash flows and ample cash on-hand, remedial actions are not required.
● Cash Flow Projection for Next Year: Not applicable.
Consolidated
Unit: NT$ thousands
Unit: NT$ thousands
Cash Balance 12/31/2008Net Cash Provided by Operating
Activities in 2009Net Cash Outflows from Investing
and Financing Activities in 2009Cash Balance 12/31/2009
Remedy for Cash Shortfall
Investment Plan Financing Plan
194,613,752 159,966,465 (183,303,876) 171,276,341 - -
● Analysis of Cash FlowNT$160.0 billion net cash provided by operating activities: Mainly from net income and depreciation/amortization.
NT$97.8 billion net cash used in investing activities: Primarily for capital expenditures.
NT$85.5 billion net cash used in financial activities: Mostly for the payout of cash dividends and repayment of corporate bonds.
● Remedial Actions for Cash Shortfall: In view of positive cash flows and ample cash on-hand, remedial actions are not required.
● Cash Flow Projection for Next Year: Not applicable.
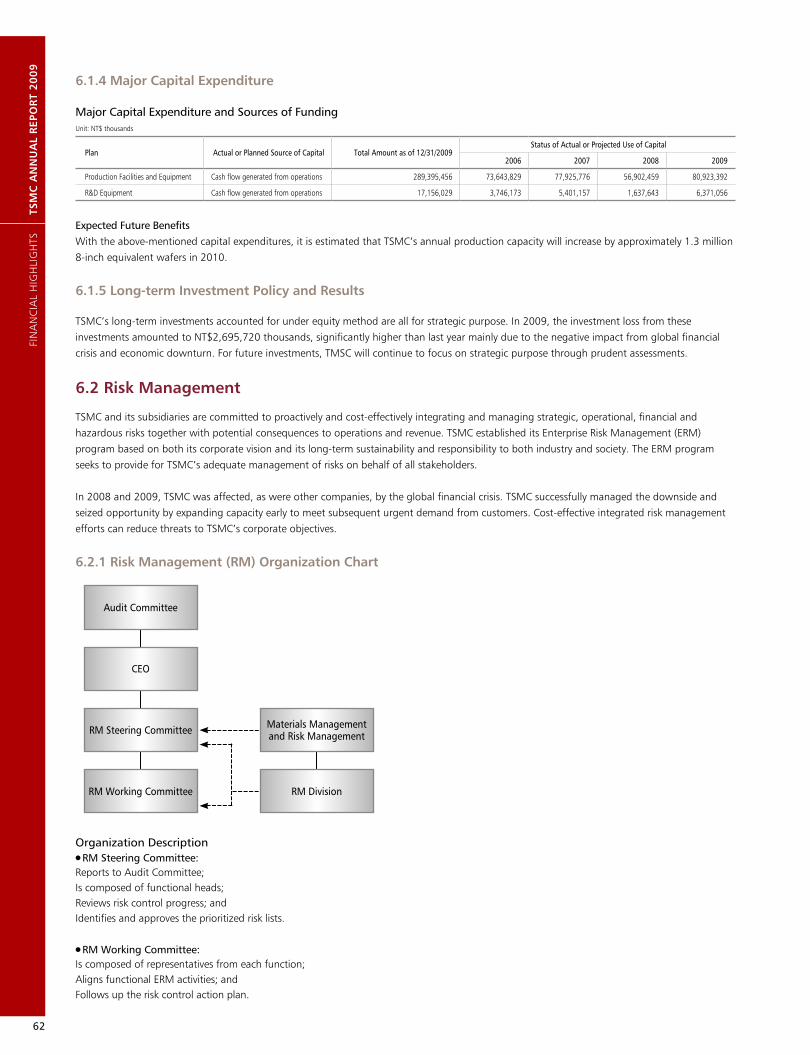
62
TSM
C A
NN
UA
L R
EPO
RT
20
09
6.1.4 Major Capital Expenditure
Major Capital Expenditure and Sources of FundingUnit: NT$ thousands
Plan Actual or Planned Source of Capital Total Amount as of 12/31/2009 Status of Actual or Projected Use of Capital
2006 2007 2008 2009
Production Facilities and Equipment Cash flow generated from operations 289,395,456 73,643,829 77,925,776 56,902,459 80,923,392
R&D Equipment Cash flow generated from operations 17,156,029 3,746,173 5,401,157 1,637,643 6,371,056
Expected Future BenefitsWith the above-mentioned capital expenditures, it is estimated that TSMC’s annual production capacity will increase by approximately 1.3 million
8-inch equivalent wafers in 2010.
6.1.5 Long-term Investment Policy and Results
TSMC’s long-term investments accounted for under equity method are all for strategic purpose. In 2009, the investment loss from these
investments amounted to NT$2,695,720 thousands, significantly higher than last year mainly due to the negative impact from global financial
crisis and economic downturn. For future investments, TMSC will continue to focus on strategic purpose through prudent assessments.
6.2 Risk Management
TSMC and its subsidiaries are committed to proactively and cost-effectively integrating and managing strategic, operational, financial and
hazardous risks together with potential consequences to operations and revenue. TSMC established its Enterprise Risk Management (ERM)
program based on both its corporate vision and its long-term sustainability and responsibility to both industry and society. The ERM program
seeks to provide for TSMC’s adequate management of risks on behalf of all stakeholders.
In 2008 and 2009, TSMC was affected, as were other companies, by the global financial crisis. TSMC successfully managed the downside and
seized opportunity by expanding capacity early to meet subsequent urgent demand from customers. Cost-effective integrated risk management
efforts can reduce threats to TSMC’s corporate objectives.
6.2.1 Risk Management (RM) Organization Chart
Audit Committee
CEO
RM Steering Committee
RM Working Committee
Materials Management and Risk Management
RM Division
Organization Description●RM Steering Committee:Reports to Audit Committee;Is composed of functional heads;Reviews risk control progress; andIdentifies and approves the prioritized risk lists.
●RM Working Committee:Is composed of representatives from each function;Aligns functional ERM activities; andFollows up the risk control action plan.
FIN
AN
CIA
L H
IGH
LIG
HTS
63
●RM Division:Coordinates the RM Working Committee activities;Facilitates functional risk management activities; andConsolidates ERM reports into the RM Steering Committee.
6.2.2 Strategic Risks
Industry DevelopmentsThe semiconductor market and microelectronics industries have historically been cyclical and subject to significant, and often rapid, increases and decreases in product demand. TSMC’s semiconductor foundry business is affected by market conditions in such highly cyclical semiconductor and microelectronics industries. Most of the Company’s customers operate in these industries. Variations in order levels from customers result in volatility in the Company’s revenues and earnings.
From time to time, the semiconductor and microelectronics industries have experienced significant, and sometimes prolonged, periods of downturns and overcapacity. Because TSMC is, and will continue to be, dependent on the requirements of semiconductor and microelectronics companies for its services, periods of downturns and overcapacity in the general semiconductor and microelectronics industries lead to reduced demand for overall semiconductor foundry services, including the Company’s services. If it cannot take appropriate actions such as reducing TSMC’s costs to sufficiently offset declines in demand, the Company’s revenues, margin and earnings will suffer during periods of downturns and overcapacity.
Changes in TechnologyThe semiconductor industry and the technologies used in it are constantly changing. TSMC competes by developing process technologies using increasingly smaller nodes and on manufacturing products with multiple or more advanced functions. If it does not anticipate these changes in technologies in a timely manner and rapidly develop new and innovative technologies, or if the Company’s competitors unforeseeably gain sudden access to more advanced technologies, TSMC may not be able to provide advanced foundry services on competitive terms. Although it has concentrated on maintaining a competitive edge in research and development, if TSMC fails to achieve advances in technologies or processes, or to obtain access to advanced technologies or processes developed by others, it may become less competitive.
Decrease in Demand and Average Selling PriceA vast majority of the Company’s sales revenue is derived from customers who use TSMC’s services in communication devices, personal computers, consumer electronics products and industrial devices. Any significant decrease in the demand for the products may decrease the demand for overall global semiconductor foundry services, including TSMC’s services, and may adversely affect the Company’s revenues. In addition, the historical and current trend of declining average selling prices of end-use applications places downward pressure on the prices of the components that go into such applications. If the average selling prices of end use applications continue to decrease, the pricing pressure on components produced by us may lead to a reduction of TSMC’s revenues, margin and earnings.
CompetitionTSMC competes internationally and domestically with pure-play foundry service providers, as well as with integrated device manufacturers that devote a significant portion of their manufacturing capacity to foundry operations. Some of these companies may have access to more advanced technologies and greater financial and other resources than us, (such as the possibility of receiving direct or indirect government bailout/economic stimulus funds or other incentives that are unavailable to us). The Company’s competition may, from time to time, also decide to undertake aggressive pricing initiatives in one or more technology nodes. Competitive activities may cause us to lose customers or to decrease TSMC’s customer base, or TSMC’s average selling prices, or both.
The Company competes primarily on the basis of process technology, quality and service. The level of competition differs according to the process technology involved. For example, in more mature technologies, the competition tends to be more intense. Some companies compete with TSMC in selected geographic regions or application end markets. In recent years, substantial investments have been made by others to establish new pure-play foundry companies in mainland China and elsewhere; or to spin off Integrated Device Manufacturers’ manufacturing operations and transform them into a pure-play foundry company.
Risks Associated with Changes in the Government Policies and Regulatory EnvironmentTSMC’s management team always closely monitors domestic and foreign governmental policies and regulations that might have impacts on TSMC’s business and financial operations, and establish relevant risk management procedures. 2009 saw the following changes or developments in governmental policies and regulations that may influence the Company’s business operations.
Article 5 of “Income Tax Act” was amended in May 2009. The corporate income tax rate was reduced from 25% to 20% effective from 2010, which will reduce the Company’s tax burden. The tax incentive schemes under the “Statute of Upgrading Industries” expired on December 31, 2009. As of the print date of this annual report, the Taiwan legislative authority has not passed any statute containing similar or identical tax incentives. Therefore, there is a likelihood that the Company’s tax burden will increase. TSMC has taken into account the various factors which may impact its financial management, and will continue to monitor developments of relevant tax regulations.
In an effort to liberalize doing business or investing in mainland China, in February 2010 the competent authority amended and promulgated relevant regulations for Taiwanese investment or technical cooperation projects in mainland China. Such liberalization will enable TSMC to adopt a more flexible mainland China investment and business strategy.
The Taiwan Financial Supervisory Commission (FSC) requires listed companies to prepare financial statements in accordance with International Financial Reporting Standards (IFRS) starting from January 1, 2013. TSMC has setup an IFRS project team and has launched the project plan for its IFRS adoption. In addition, the progress of such adoption has been regularly reported to the Board. The impact of the IFRS adoption may include changes of accounting

64
TSM
C A
NN
UA
L R
EPO
RT
20
09
treatment for certain types of transactions and certain modification in the presentation of its financial report. We will keep monitoring the update of IFRS and the development of related laws and regulations in Taiwan and evaluate the respective impact to TSMC.
In addition, the Taiwan legislative authority has been studying the relevant laws relating to environmental protection, e.g. “Greenhouse Gas Reduction Act” and Energy Tax. Since there has been no concrete guidance or laws issuing from the Taiwan government as of yet, the impacts of such laws are indeterminable at the moment. However, it is very likely that such laws may increase the operating cost of the Company.
Other than the above laws and regulations, it is not expected that the relevant governmental policies and regulatory changes would materially impact TSMC’s operations and financial condition.
6.2.3 Operational Risks
Risks Associated with Capacity ExpansionIn response to customer demand, since 2004, TSMC has steadily ramped up the production of 12-inch wafer fabs in the Hsinchu Science Park and Tainan Science Park, respectively. Total monthly capacity of the Company’s 12-inch wafer fabs was increased from 154,300 wafers in December 31, 2008 to 171,400 wafers in December 31, 2009. Overall, TSMC increased its annual production capacity by approximately 0.6 million 8-inch equivalent wafers in 2009. The total average billing utilization rate for 2009 was 75% as a result of the global economic recession in the first half. Expansion and modification of the Company’s production facilities will, among other factors, increase TSMC’s costs. For example, the Company will need to purchase additional equipment, train personnel to operate the new equipment or hire additional personnel. If it does not increase its net sales accordingly in order to offset these higher costs, TSMC’s financial performance may be adversely affected.
As of the date of this Annual Report, the benefits brought about by such capacity expansion were in line with TSMC’s expectations. TSMC has established systems to evaluate and forecast market demand and refers to these forecasts and evaluations when considering whether to expand or reduce capacity.
Risks Associated with Sales ConcentrationWhile it generates revenue from hundreds of customers worldwide, TSMC’s ten largest customers accounted for approximately 53% of net sales in both 2008 and 2009, and the Company’s largest customer accounted for approximately 14% and 10% of net sales in 2008 and 2009, respectively. The loss of, or significant curtailment of purchases by, one or more of the Company’s top customers, including curtailments due to a change in the design or manufacturing sourcing policies or practices of these customers, or the timing of customer or distributor inventory adjustments, may adversely affect TSMC’s results of operations and financial condition.
Risks Associated with Purchase Concentration●Raw MaterialsTSMC’s production operations require that it obtain adequate supplies of raw materials, such as silicon wafers, gases, chemicals, and photoresist, on a timely basis. Shortages in the supply of some
materials experienced by specific vendors or by the semiconductor industry generally have in the past resulted in occasional industry-wide price adjustments and delivery delays. Also, since TSMC procures some raw materials from sole-source suppliers, there is a risk that the Company’s need for such raw materials may not be met when needed. The Company’s revenue and earnings could decline if it is unable to obtain adequate supplies of the necessary raw materials in a timely manner or if there are significant increases in the costs of raw materials that it cannot pass on to its customers.
●EquipmentThe Company’s operations and ongoing expansion plans depend on its ability to obtain an appropriate amount of equipment and related services from a limited number of suppliers in a market that is characterized by limited supply and long delivery cycles. During such times, supplier-specific or industry-wide lead times for delivery can be as long as nine months. To better manage its supply chain, the Company has implemented various business models and risk management contingencies with suppliers to shorten the procurement lead time. TSMC also provides its projected demand for various items to many of the Company’s equipment suppliers to help them plan their production in advance. If it is unable to obtain equipment in a timely manner and at a reasonable cost, TSMC may be unable to fulfill customers’ orders, which could negatively impact its financial condition and results of operations.
Risks Associated with Intellectual Property RightsOur ability to compete successfully and to achieve future growth may depend in part on the continued strength of our intellectual property portfolio. While we actively procure, enforce and protect our intellectual property rights, there can be no assurance that our efforts will be adequate to prevent the misappropriation or improper use of our proprietary technology, trade secrets, software or know-how. Also, we cannot assure you that, as our business or business models expand into new areas, we will be able to independently develop the technology, trade secrets, software or know-how necessary to conduct our business or that we can do so without the intellectual property rights of others. As a result, we may have to rely increasingly on obtaining licenses to certain technologies from third parties. To the extent that we rely on licenses from others, there can be no assurance that we will be able to obtain any or all of the necessary licenses in the future on terms we consider reasonable or at all. The lack of necessary licenses could expose us to claims for damages and/or injunctions from third parties, as well as claims for indemnification by our customers in instances where we have contractually agreed to indemnify our customers against damages resulting from infringement claims.
We have received, from time-to-time, communications from third parties asserting that our technologies, manufacturing processes, the design of the integrated circuits made by us or the use by our customers of semiconductors made by us may infringe their patents or other intellectual property rights. And, because of the nature of the semiconductor industry, we may continue to receive such communications in the future. In some instances, these disputes have resulted in litigation. If we fail to obtain or maintain certain government, technology or intellectual property licenses and, if litigation relating to an intellectual property claim occurs, it could prevent us from manufacturing or selling certain products or using
FIN
AN
CIA
L H
IGH
LIG
HTS

65
certain manufacturing processes or technologies, which could reduce our opportunities to compete or generate revenues.
Risks Associated with LitigationAs is the case with many companies in the semiconductor industry, we have received from time-to-time communications from third parties asserting that our technologies, manufacturing processes, the design of the integrated circuits made by us or the use by our customers of semiconductors made by us may infringe upon patents or other intellectual property rights of others. In some instances, these disputes have resulted in litigation by or against us and certain settlement payments by us in some cases. Irrespective of the validity of these claims, we could incur significant costs in the defense thereof or could suffer adverse effects on our operations.
In August 2006, we filed a lawsuit against SMIC in the Superior Court of California for Alameda County for breach of a 2005 agreement that settled an earlier trade secret misappropriation and patent infringement litigation between the parties, as well as for trade secret misappropriation, seeking injunctive relief and monetary damages. In September 2006, SMIC filed a cross-complaint against us in the same court alleging breach of settlement agreement, implied covenant of good faith and fair dealing. SMIC also filed a civil action against us in November 2006 with the Beijing People’s High Court alleging defamation and breach of good faith. The Beijing People’s High Court on June 10, 2009 ruled in favor of TSMC and dismissed SMIC’s lawsuit. On November 4, 2009, after a two-month trial, a jury in the California action found SMIC to have both breached the 2005 settlement agreement and misappropriated TSMC’s trade secrets. We have subsequently settled both lawsuits with SMIC. Pursuant to the new settlement agreement, the parties have agreed to the entry of a stipulated judgment in favor of TSMC in the California action, and to the dismissal of SMIC’s appeal against the Beijing High Court’s finding in favor of TSMC. Under the new settlement agreement and the related stipulated judgment, SMIC has agreed to make cash payments to TSMC totaling US$200 million, which are in addition to the US$135 million previously paid to TSMC under the 2005 settlement agreement, and to provide TSMC with other valuable consideration.
Other than the matters described above, we were not involved in any other material litigation in 2009 and are not currently involved in any material litigation.
Risks Associated with Mergers and AcquisitionsIn 2009, and as of the date of this Annual Report, there were no such risks for TSMC.
Risks Associated with Recruiting and Retaining Qualified PersonnelThe Company depends on the continued services and contributions of its executive officers and skilled technical and other personnel. TSMC’s business could suffer if it lost, for whatever reasons, the services and contributions of some of these personnel and it cannot adequately replace them. The Company may be required to increase the number of employees in connection with any business expansion, and since there is intense competition for the recruitment of these personnel, it cannot ensure it will be able to fulfill its personnel requirements in a timely manner.
Therefore, the Compensation Committee of the Board of Directors decided to change the compensation system, including a structural increase on base salary and timely distribution of employees' cash bonus from the Company's profits in order to attract and retain talent.
Future R&D Plans and Expected R&D SpendingFor additional details, please refer to “Future R&D Plans” on page 50 of this Annual Report.
Changes in Corporate Image and Impact on Company’s Crisis ManagementTSMC has established an excellent corporate image for its firm belief in its core values, its rigorous corporate governance, its outstanding operations, and its vision of a society that works together towards sustainable development, equality and justice, and a harmonious environment to live and work. For its efforts the Company has won wide recognition, such as:
● The Executive Yuan’s Enterprise Sustainable Development Award● �The Ministry of Economic Affairs’ Outstanding Innovation
Achievement Award● �The Council of Labor Affairs’ National Workplace Safety Award● �The Environmental Protection Administration’s National Enterprise
Environmental Protection Award● �Commonwealth Magazine’s benchmark for Most Admired Company
in Taiwan● �Commonwealth Magazine’s Best Corporate Citizenship for a large
company● �GlobalViews Magazine’s Corporate Social Responsibility award● �Number one in the Asian Wall Street Journal’s survey of the top 10
companies in Taiwan● �First place in Cheers Magazine’s survey of Company Most Admired
by the New Generation● �IR Magazine’s award for Best Corporate Governance and Best
Investor Relations in Taiwan and Hong Kong
Management believes this recognition is the strongest evidence of TSMC’s corporate image.
In addition, the Company has established departments such as Brand Management, Customer Service, Public Relations, Employee Relations, Investor Relations, Risk Management, Internal Audit, and the TSMC Education and Culture Foundation to further improve TSMC’s corporate image and to make preparations for prevention and control of potential risks.
Risks Associated with Change in ManagementOn June 11, 2009, TSMC’s Board of Directors approved two major personnel appointments, effective June 12, 2009:
● �Appointed Dr. Morris Chang to serve as Chief Executive Officer concurrent with his position as Chairman of the Board
● �Appointed Dr. Rick Tsai to serve as President, New Businesses, reporting directly to the Chairman & CEO

66
TSM
C A
NN
UA
L R
EPO
RT
20
09
6.2.4 Financial Risks
Internal Management of Economic Risks● �Interest Rate FluctuationTSMC’s exposure to interest rate risks derives primarily from long-term debt obligations incurred in the normal course of business. In order to limit its exposure to interest rate risks, TSMC finances its funding needs through internal generation of cash and the occasional issuance of long-term, fixed-rate debt. On the asset side, the primary objective of TSMC’s investments in fixed income securities is to preserve principal in highly liquid markets. In order to maintain the Company’s liquidity profile, the majority of fixed income securities are at the short end of the yield curve.
● �Foreign Exchange VolatilityOver half of TSMC’s capital expenditures and manufacturing costs are denominated in currencies other than NT dollars, primarily in US dollars, Japanese yen and Euros. More than 90% of the Company’s sales are denominated in U.S. dollars and currencies other than NT dollars. Therefore, any significant fluctuation to the Company’s disadvantage in such exchange rates would have an adverse effect on TSMC’s financial condition. TSMC hedged its foreign exchange exposure mainly through cross currency swaps and currency forward contracts.
In addition, fluctuations in the exchange rate between the US dollar and the NT dollar may affect the US dollar value of the Company’s common shares and the market price of the Company’s American Depositary Shares (ADSs) and of any cash dividends paid in NT dollars on TSMC’s common shares represented by ADSs.
● �Inflation & DeflationTSMC’s most significant export market is North America, and management does not believe that inflation or deflation in the R.O.C. or North America had a material impact on the Company’s results of operations in 2009. However, TSMC cannot provide assurance that there will be no significant variations in the nature, extent or scope of inflation or deflation within any of the Company’s key markets in the future or whether deflation possibly arising from the global economic crisis would not have a material impact on TSMC’s results of operations.
Risks Associated with High-risk/High-leveraged Investment; Lending, Endorsements, and Guarantees for Other Parties; and Financial Derivative TransactionsTSMC did not make high-risk or high-leveraged financial investments during 2009 and up to the date of this report. Neither did TSMC provide lending, endorsements or guarantees for other parties in the period.
The financial transactions of a “derivative” nature that TSMC entered into were strictly for hedging purposes and not for any trading or speculative purpose. For more information, please refer to the “Financial Information” on pages 52-53 of Annual Report (II).
The fair market value of our trading and available for sale financial investments are subject to prevailing market conditions and may fluctuate from TSMC’s carrying value from time to time, which may
impact the returns of those investments. To control various types of financial transactions, the Company has established internal policies and procedures based on sound financial and business practices, all in compliance with the relevant rules and regulations issued by the Taiwan Securities and Futures Bureau. TSMC policies and procedures include “Policies and Procedures for Financial Derivative Transactions”, “Procedures for Lending Funds to Other Parties”, “Procedures for Acquisition or Disposal of Assets”, and “Procedures for Endorsement and Guarantee”.
Risks Associated with Impairment ChargesUnder Generally Accepted Accounting Principles (GAAP) of both the Republic of China and the United States, TSMC is required to evaluate its long-lived assets and intangible assets for impairment whenever there is an indication of impairment. If certain criteria are met, TSMC is required to record an impairment charge. TSMC is also required under ROC GAAP and US GAAP to evaluate goodwill for impairment at least on an annual basis or whenever a so-called “triggering event” or an indication of impairment occurs.
Management currently is unable to estimate the extent or timing of any impairment charge for future years. Any impairment charge required may have a material adverse effect on the Company’s net income.
The determination of an impairment charge at any given time is substantially based on the expected results of the Company’s operations over a number of years subsequent to that time. As a result, an impairment charge is more likely to occur during a period when the Company’s operating results are otherwise already depressed. TSMC has established the process and system to closely monitor and access the outlook of capacity utilization and economic cycle.
6.2.5 Hazardous Risks
TSMC maintains a comprehensive risk management system dedicated to the conservation of natural resources, safety of people, and protection of property. In order to effectively handle emergencies and natural disasters at each facility, management has developed comprehensive plans and procedures that focus on risk prevention, emergency response, crisis management, and business continuity. TSMC has adopted local and international standards for ESH management. All TSMC fabs have been ISO 14001 certified (Environmental Management System), OHSAS 18001 certified (Occupational Health and Safety Management System) and QC080000 certified (Hazardous Substance Process Management System); all fabs in Taiwan have also been TOSHMS (Taiwan Occupational Safety and Health Management System) certified.
TSMC pays special attention to emergency preparedness for disasters, such as typhoon, flood, drought caused by climate change, earthquakes, environmental contamination, large-scale product returns, disruption of IT systems, strikes, pandemic (such as H1N1 influenza) and disruptions to the supply of raw materials or water, electricity, gases, and public utilities. TSMC has established a
FIN
AN
CIA
L H
IGH
LIG
HTS
67
company-wide task force managing water shortage risk that might be a key issue due to climate change. This task force keeps watch on external supply and internal demand of water. Cross-company consolidations and external collaborations with public agencies are also ongoing in the industrial parks to sustain stable water supply.
TSMC further strengthened its business continuity plans, which include risk assessment, control implementation and the establishment of emergency task forces when necessary; the preparation of a thorough analysis of the emergency, its impact, alternatives, and solution for each possible scenario; and appropriate precautionary and/or recovery measures. Each task force is given the responsibility to ensure TSMC’s ability to conduct business while minimizing personal injuries, business disruption, and financial impact under the circumstances. Customers are informed of TSMC’s strong business continuity plan to establish their supply chain resilience and insurance placement. For the year 2009, and up to the date of this Annual Report, there are no reportable material events that have necessitated the activation of such contingency plans. In 2009, the Company also conducted the continuous improvement project for building anti-seismic capability evaluation, earthquake response drills and tool anchorage fixation and enhanced TSMC business continuity procedures reference to BS 25999 business continuity management.
Some combustible materials are used in TSMC’s manufacturing processes and are therefore subject to explosion and fire risk. The Company maintains many overlapping risk prevention and protection systems, as well as comprehensive fire and casualty insurance, including insurance for loss of property and loss of profit resulting from business interruption. Nonetheless, TSMC’s risk management and insurance coverage may, in certain circumstances, be insufficient to cover all of the Company’s potential losses. If any of TSMC’s fabs were to be damaged or cease operations as a result of an explosion, fire, or environmental excursions, it could reduce the Company’s manufacturing capacity and might cause us to lose important customers, thereby having a potentially material adverse impact on TSMC’s financial performance. In addition to periodic fire protection system inspection and fire fighting drills, the Company also carried out a corporate-wide fire risk mitigation project focused on management and hardware improvements.
Changes may cause unpredictable production interruption. In order to reduce such uncertainty, TSMC has adopted a number of standards to maintain operational continuity ranging from design, procurement, and construction, to operation and decommission.
6.2.6 Climate Change Risks
If applicable laws, regulations or international accords directly or indirectly requires us: (a) to use certain alternative chemicals or raw materials in; and/or (b) exclude prohibited chemicals or raw materials from our products, processes and designs, we cannot offer any assurances that the resulting product, processes or designs would be as reliable or efficient. Also, our failure to manage the import, export, use, transportation, emissions, discharge, storage, recycling, or disposal of such chemicals and materials could subject us to increased costs or future liabilities.
Any of the above contingencies resulting from the actual and potential impact of local or international laws and regulations as well as international accords on environmental or climate change could harm our business and results of operations by increasing our expenses or requiring us to alter our manufacturing and assembly and test processes.
Increasing climate change and environmental concerns also presents other commercial challenges because some of our customers and suppliers may request us to exceed the legal standard set for environmentally compliant products and services. If we are unable to offer such products or services, we may lose market share to our competitors.
Further, energy costs in general could increase significantly to be driven by climate change regulations. Therefore our energy costs may increase significantly if utility or power companies pass on their costs, such as those associated with carbon taxes, emission cap and carbon credit trading programs, or other similar programs imposed locally or worldwide.
6.2.7 Other Risks
Potential Impact and Risks Associated with Sales of Significant Numbers of Shares by TSMC’s Directors, and Major Shareholders Who Own 10% or More of TSMC’s Total Outstanding SharesThe value of TSMC shareholders’ investment may be reduced by possible future sales of TSMC shares owned by the major shareholders.
One or more of our existing shareholders may, from time to time, dispose of significant numbers of our common shares or ADSs. For example, the National Development Fund, who owned 6.4% of TSMC’s outstanding shares as of February 28, 2010, had sold our shares in the form of ADSs in several transactions during the period between 1997 and 2005.
There is currently no shareholder who owns 10% or more of TSMC’s total outstanding shares.
Other Material RisksDuring 2009 and as of the date of this Annual Report, TSMC’s management is not aware of any other risk event that could impart a potentially material impact on the financial status of the Company.

68
TSM
C A
NN
UA
L R
EPO
RT
20
09
CO
RPO
RATE
SO
CIA
L RE
SPO
NSI
BILI
TY

TSMC’s core values of Integrity, Commitment, Innovation, and Customer Partnership extend to every facet of its business. TSMC believes that a
corporation’s most important responsibility to society is to help bring about healthy and positive changes. To fulfill this responsibility:
1) We are honest to our shareholders, to the public, and to our tens of thousands of employees.
2) We respect the rule of law, and we do not engage in illegal activity.
3) We abhor cronyism. We do not seek favoritism from the government or any government official, and we do not bribe.
4) We practice good corporate governance.
5) We do not engage in politics.
6) We aim to provide not just job opportunities, but well-paying job opportunities in a good work environment.
7) We emphasize protection of the environment and climate.
8) We practice unceasing innovation.
9) We invest in LED lighting and solar energy to directly contribute to a greener world through innovation.
10) Within our corporate means, we make contributions to cultural and educational and community activities.
7.1 Typhoon Morakot Disaster Relief Project
Typhoon Morakot struck south Taiwan, causing Taiwan’s most severe flooding in 50 years. TSMC and all its employees are deeply saddened by
the suffering caused by this typhoon, and we have assembled a “Typhoon Morakot Project Team” and have decided to donate NT$200 million
to provide some small measure of relief to the people and places affected by this disaster.
1) Distributed NT$50 million in relief funds to more than 1,000 employees affected by the floods.
As TSMC employees come from all over Taiwan, many colleagues and their families live in areas severely affected by this disaster. We therefore
asked managers at all levels to inquire whether their staff was affected by the flooding and whether they need assistance. Currently, about
1,000 of our employees and their relatives live in severely flooded areas, and the great majority are production-line technicians. To provide the
fastest and most direct support, TSMC will disburse up to NT$50 million in aid funds. Our employees’ direct supervisors will conduct site
visits, and we will also use all our available resources to help our employees find missing family members. We hope that these efforts will
demonstrate TSMC’s commitment to its employees and also reduce some of the government’s relief burden.
69
7. CORPORATE SOCIAL RESPONSIBILITY

2) Provided NT$50 million to assist in the repair and restoration of
damaged middle and elementary schools around the South
Taiwan Science Park to reopen before the beginning of the school
year.
Many Schools near TSMC’s Tainan site were severely affected by
this disaster, with heavy damage to fences, classrooms,
computers, schools, and other equipment. Students would be
unable to begin classes on schedule if they were not restored
quickly. TSMC disbursed NT$50 million to take direct responsibility
for repairing, cleaning, and rebuilding in a safe and timely fashion.
We believe this was the most direct and efficient fashion to help
restore damaged schools, help students return to school on time,
and do our part for the disaster area.
At the same time, colleagues in TSMC began a book collection
drive inside and outside the company, which received enthusiastic
support. TSMC received more than 50,000 books and donated
them to schools in Tainan, Chiayi, Kaohsiung, Pingtung, Nantou,
and Taitung that were affected by Typhoon Morakot
3) Pledged NT$100 million to assist in the government’s overall relief
efforts.
Aboriginal villages were among the main disaster areas of
Typhoon Morakot, and aborigines have long been an
underprivileged minority in Taiwan. TSMC has focused its relief
efforts on aboriginal villages to support the government. Our goal
is to quickly and effectively find the appropriate roles for
government, villagers, and the private sector in building a model
of cooperation that will provide long-term support to these
villages.
7.2 Environmental, Safety and Health (ESH) Management
TSMC believes its environmental, safety and health practices should
not only comply with legal requirements, but also measure up to
recognized international practices. The Company aims to prevent
pollution, efficiently use all resources, prevent accidents, improve
employee safety and health, protect property, and establish a work
environment that promotes the well-being of our employees and of
the communities in which we operate.
All TSMC manufacturing facilities have received ISO 14001:2004
certification for environmental management systems and OHSAS
18001:2007 certification for occupational health and safety
management systems. All fabs in Taiwan have also been TOSHMS
(Taiwan Occupational Safety and Health Management System)
certified in 2009. TSMC strives for continuous improvement and
actively seeks to enhance pollution prevention, power and resource
conservation, waste reduction, health and safety management, fire
and explosion prevention and other risks, such as earthquakes, in
order to reduce overall environmental, safety and health risk. In
2006, TSMC began to adopt the IECQ QC080000 Hazardous
Substance Process Management (HSPM) System in order to meet
customer needs for management of hazardous materials and to
meet the European Union’s Restriction of Hazardous Substances
(RoHS) directive. All TSMC manufacturing facilities were QC080000
certified in 2007.
TSMC communicates with suppliers and contractors on
environmental, safety and health issues and encourages them to
improve their ESH performance. In line with this policy, TSMC uses
priority work management and self-management to govern work
performed by contractors. TSMC requires contractors performing
high-risk operations to complete certification for technicians, and to
establish their own OHSAS 18001 safety and health management
system before bidding on contracts. This self-management is aimed
at increasing contractors’ sense of ownership and responsibility, with
the goal of promoting safety awareness and technical improvement
for contractors in the industry.
TSMC has also conducted on-site ESH audits of local material
suppliers’ and testing/assembly subcontractors since 2005. TSMC
requires suppliers or subcontractors that performed poorly on ESH
audits to take preventive and corrective action to improve their ESH
management. TSMC also assists them to improve their ESH
management.
In 2009, TSMC maintained its supplier ESH management program,
which is tied to a sustainability index that includes three
components: Green Index, Social Index and Risk Index. “Green Index”
includes environmental management system, regulatory compliance,
hazardous substance management, greenhouse gases inventory and
green activities. “Social Index” includes labor & ethical conduct and
participation of social activities. “Risk Index” includes: safety &
health, fire, natural disaster, transportation, supply chain
management, pandemic plan and business continuity plan. The
sustainability index is applied to TSMC’s critical suppliers.
7.2.1 Environmental Protection
Greenhouse Gases (GHG) Emission ReductionTSMC is an active participant in international environmental
protection programs. In 2005, TSMC was Taiwan’s first
semiconductor company to make a complete inventory of its GHG
and to gain ISO 14064 certification for its processes and outputs.
The purpose of the inventory was to serve as a baseline reference for
TSMC’s strategy to reduce GHG, to meet future domestic regulatory
requirements, and to prepare for carbon trading and corporate
carbon asset management. All TSMC facilities continue to conduct a
GHG inventory on an annual basis. The inventory result shows that
the major direct GHG emission is perfluorinated compounds (PFCs),
which are used in the semiconductor manufacturing process. The
primary indirect GHG emission is electricity consumption.
70
TSM
C A
NN
UA
L R
EPO
RT
20
09
CO
RPO
RATE
SO
CIA
L RE
SPO
NSI
BILI
TY

TSMC is also taking measures to reduce its emission of greenhouse
gases. TSMC has endorsed a memorandum of understanding
between the Taiwan Semiconductor Industry Association, the ROC
Environmental Protection Administration, and the World
Semiconductor Council, whereby TSMC is committed to reducing PFC
emissions to 10% below the average of 1997 and 1999 by 2010. This
emissions target remains fixed as TSMC continues to grow and
expand its manufacturing facilities. The Company is taking the
following measures to reduce emissions in line with recommendations
provided by the Intergovernmental Panel on Climate Change (IPCC):
●��Accurate measurement of PFC gas production and the effectiveness of exhaust gas abatement equipment in order to calculate actual
PFC emission volumes.●��Evaluation of feasible alternatives to greenhouse gases and
gradually replacement of greenhouse gases at all manufacturing
facilities, 97% has been deployed in 2009.●��Evaluation and installation of PFC exhaust gas abatement
equipment, in line with effectiveness and safety considerations. The
installation will be carried out from 2008 to 2010, 33% of which
was completed in 2009.
Coal-fired power generators are a major source of electricity in
Taiwan and emit large amounts of carbon dioxide (CO2). TSMC
makes continuous efforts to conserve energy, which reduces both
carbon dioxide gas emissions and costs. TSMC has not only adopted
energy-conservative designs for both manufacturing fabs and offices,
but has also improved the energy efficiency of facilities during
operation. In 2009, the Company collaborated with vendors to
improve the energy and lighting efficiency assisted by some energy
efficiency consulting companies.
Air and Water Pollution ControlTSMC has installed effective air and water pollution control
equipment in each wafer fab to meet regulatory emissions standards.
In addition, TSMC maintains backup pollution control systems,
including emergency power supplies, to lower the risk of pollutant
emission in the event of equipment breakdown. TSMC monitors the
operations of air and water pollution control equipment centrally
around the clock and tracks system effectiveness to ensure emitted
air and discharged water quality.
Water ConservationTo make the most effective use of Taiwan’s limited water resources,
all TSMC fabs make efforts to increase water reclamation rates by
adjusting the water usage of manufacturing equipment and
improving wastewater reclamation systems. New fabs are able to
reclaim more than 85% of process water, meeting or exceeding the
standards of the Science Park Administration and outperforming
most semiconductor fabs around the world. TSMC also strives to
reduce non-manufacturing-related water consumption, including
water used in air conditioning systems, sanitary facilities, cleaning,
landscaping and kitchens.
Waste Management and RecyclingTSMC has established a designated unit responsible for waste
recycling and disposal. To meet the goal of sustainable resource
utilization, TSMC’s first priority is to reduce process waste before
considering recycling or disposal. TSMC carefully selects waste
disposal and recycling contractors and performs annual audits of
certification documents, site operations and transportation routes to
ensure legal and proper disposal of waste. Waste recycling has
achieved the goal of 90% in 2009, and the Company’s landfill rate
has been reduced to less than 1%.
Other Environmental Protection ProgramsTSMC has implemented an environmental accounting system,
allowing each fab to calculate cost savings or profits created by each
environmental program.
In addition, TSMC conducts “Product Life Cycle Assessments”
(Product LCA), collecting and analyzing data from the entire
semiconductor manufacturing chain from raw materials suppliers to
finished products, including statistics for such items as energy, raw
materials consumption, and pollution. The product LCA study has
established “Eco-Profiles” for all TSMC fabs and will help the
Company to meet future international regulations such as the
European Union’s “Energy-Using Product” directive. These
“Eco-Profiles” can also be provided to customers who require such
documentation. In 2009, TSMC collaborated with its assembly
subcontractor, Advanced Semiconductor Engineering Group (ASE) to
complete the world’s first Integrated Circuit Product Category Rule
(IC PCR). This IC PCR follows ISO 14025 standards, and addresses the
unique nature of semiconductor manufacturing. It was compiled
based on input from major semiconductor companies around the
world. The content of the IC PCR covers energy and water
consumption, pollutant production, waste production, air pollution,
carbon footprint, and other factors. It can act as a reference for
global semiconductor companies when completing an Environmental
Product Declaration Type III (EPD), and also support the global
electronics supply chain in meeting requirements from Wal-Mart, the
world’s largest retailer, for all suppliers to provide eco-labeling within
5 years. Meanwhile, TSMC and ASE followed this IC PCR to complete
an EPD Type III for integrated circuits and obtained a Carbon
Footprint Certification from the Taiwan Electrical and Electronic
Manufacturers’ Association (TEEMA), taking a major step forward in
manufacturing low-carbon products.
TSMC also maintains “green procurement” procedures, requiring raw
materials suppliers to declare that the materials they supply to TSMC
do not contain any prohibited substances. This ensures that products
manufactured by TSMC comply with customer requirements and the
regulatory requirements of the European Union’s RoHS directive. TSMC
also encourages employees to use “Green Mark” products in offices,
such as recycled paper, desktop PCs, LCD monitors, and batteries.
TSMC has adopted the standards of Taiwan “Green Building” and the
US Leadership in Energy and Environmental Design (LEED) to apply on
future new fab and office building design, which may achieve better
71

energy and resource efficiency than usual designs. In the meantime,
TSMC plans to upgrade existing office buildings to comply with the
LEED standard year by year starting in 2008. In August 2008, TSMC
Fab 14 Phase III facility based in Southern Taiwan Science Park won
certification from the US Green Building Council’s Leadership in
Energy and Environmental Design – New Construction (LEED-NC)
green building rating system with a “gold class” score. TSMC Fab 12
Phase IV facility based in Taiwan Hsinchu also won the same
certification in 2009. Fab 14 Phase III is the first building in Taiwan to
receive certification from the US Green Building Council. In December
2008, Fab 14 Phase III also has passed Taiwan’s “Diamond Class
Ecology, Energy Saving, Waste Reduction, and Health (EEWH)”
certification, which is the second “Diamond” class in Taiwan and the
first recognized factory; TSMC Fab 12 Phase IV facility based in
Taiwan Hsinchu also won the same certification in 2009.
TSMC initiated a “Taiwan Corporate Sustainability Forum (TCSF)”,
which unites 20 Taiwan leading companies as founders. The forum
also welcomes new members. TSMC’s 2008 Green Forum is the first
of a series of Taiwan Corporate Sustainability Forum events. At this
meeting, TSMC shared its hands-on experience in obtaining the US
Green Building Council’s LEED certification, and applying for
Taiwan’s Ecology, Energy Saving, Waste Reduction, and Health
(EEWH) certification for its Fab 14 Phase III facility. TSMC also
proposed working with green building experts to draft guidelines for
green industrial buildings in Taiwan, helping more domestic
companies construct their own green factories and promote green
manufacturing. In 2009, the TCSF continued to invite Taiwan leading
companies to join the TCSF. Epson Taiwan and Mediatek have
become new members. TCSF held an experience sharing for
performing corporate social responsibility in November 2009.
In 2009, TSMC completed the first “Supply Chain Carbon Inventory
Assistance Plan” in Taiwan. With the assistance of the Taiwan
Ministry of Economic Affairs Industrial Development Bureau, TSMC in
June 2009 became the first company in Taiwan to lead its suppliers
in successfully completing and registering a carbon inventory. TSMC
not only actively inventories and reduces its own greenhouse gas
emissions, but also requires suppliers to inventory greenhouse gas
emissions. Under this plan, TSMC as well as 36 factories at 20
partner companies registered and disclosed greenhouse gas
emissions under the guidance of the Taiwan Green Productivity
Foundation. Together with our supplier partners, TSMC both
supports the Taiwan government’s carbon emission reduction policy,
and helps the industry prepare for the coming global trend of
product carbon footprint labeling and eco-labeling. This move by
TSMC demonstrates that corporations can take a long-term,
macro-level view when making plans regarding climate change and
global warming, and effectively implement these plans pragmatically
through the supply chain.
Environmental Compliance RecordThere were no environmental penalties or fines in 2009.
7.2.2 Safety and Health
Safety and Health ManagementTSMC’s safety and health management is built on the framework of
the OHSAS 18001 system, and adheres to the management principle
of “Plan, Do, Check, Act” to prevent accidents and protect employee
safety and health as well as Company assets. In 2009, TSMC fabs in
Taiwan have simultaneously received OHSAS 18001 certification and
TOSHMS certification for Taiwan occupational safety and health
management system.
Besides accident prevention, TSMC has established emergency
response procedures to protect the lives of employees and
contractors if disasters should occur, as well as to minimize the
negative impact on society and the environment. TSMC
communicates to suppliers to reduce potential risks in the operation
of production equipment and follows safety control procedures
when installing production equipment. The Company places
stringent controls on high-risk operations and also evaluates the
seismic tolerance of facilities and equipment to reduce the risk of
earthquake damage. In health management, TSMC maintains regular
wellness and professional health programs, such as kitchen GHP
(Good Health Practice) establish, metal health appraisal and control
and specific group health examination alignment. It also establishes
Company-level prevention committees when infectious diseases such
as H1N1 influenza, Severe Acute Respiratory Syndrome (SARS) or
Avian Influenza pose a potential risk to the Company.
Working Environment and Employee Safety ProtectionTSMC’s ESH policy commits to preventing adverse incidents,
improving employees’ safety and health, protecting property and
establishing a secure working environment. TSMC safety and health
management operations apply to:
●��Hardware Safety of Equipment Used by Process, Facilities, IT, and General Services Departments
In addition to meeting regulatory and internal standards when
building or rebuilding facilities, TSMC also maintains procedures
governing new equipment and raw materials management, safety
approvals for bringing new tools online, revising safety rules, seismic
protection measures, and other safety measures.
●��General Safety Management, Training and AuditAll TSMC manufacturing facilities hold environmental, safety and
health committee meetings on a monthly basis. TSMC takes
preventive measures such as controls on high-risk work, contractor
management, chemical safety management, personal protective
equipment requirements, and safety audit management. In addition,
TSMC also maintains detailed disaster response procedures and
performs regular drills to minimize harm to employees and property,
as well as the impact on society and the environment in the event of
a disaster.
72
TSM
C A
NN
UA
L R
EPO
RT
20
09
CO
RPO
RATE
SO
CIA
L RE
SPO
NSI
BILI
TY

●��Working Environment MeasurementTSMC conducts working environment physical and chemical
measurements every six months to safeguard employees’ health,
including measurement of factors such as noise, air quality, chemical
exposure, and illumination. The measurement results for each item
must be compliant with regulatory requirements; otherwise
corrective action is undertaken.
●��H1N1 InfluenzaSince World Health Organization (WHO) announced the H1N1
influenza global pandemic alert during April 2009, TSMC Corporate
Pandemic Influenza Response Committee has convened to monitor
the global pandemic status and developed the response strategies.
These strategies include educating its employees’ H1N1 prevention
and response knowledge (such as poster everywhere, all-user mail
announcement, dedicated H1N1 web) publishing the managers’
H1N1 handling guideline, guideline of employee sick-leave due to flu
and installing the alcohol-based hand sanitizers. The Committee also
monitors the status of employee leaves due to flu status and, at the
same time, develops the continuous plan of manpower shortage to
address both the employees’ health and business impact.
●��Emergency ResponsePlanning and execution of an effective emergency response requires
big-picture thinking, continuous improvement and practice drills.
TSMC’s emergency response plans include procedures for rapid
response to accidents and disaster recovery as well as establishing
response procedures for potential disasters.
All TSMC fabs conduct major annual emergency response exercises
and evacuation drills. TSMC’s on-site service contractors also
participate in emergency response planning and exercises to ensure
cooperation in handling accidents and to effectively minimize
damage caused by disasters.
In addition to regular emergency response drills held by engineering
and facilities departments each quarter, the Company’s laboratory,
canteen, dormitory, and shuttle bus personnel also hold emergency
response drills to prepare for events such as earthquake, chemical
leakage, ammonia release, fires, and automobile accidents.
●��Employee Health EnhancementTSMC provides healthcare and staff assistance services in every fab.
TSMC employees enjoy health services such as 24-hour nursing care,
annual physical examinations, psychological consultations, stress
management programs, workshops, and staff assistance projects. In
addition, the Company also provides clinical and dental care services,
women’s healthcare, acupuncture and massage services and
programs.
Health enhancement activities include nutritional consultation,
weight-loss classes, an acupuncture weight-loss program, carotid
and thyroid ultrasound examinations, an endocrinology clinic, a
dermatology clinic, bone mineral densitometry examinations and
cancer screenings. Canteens also provide healthy meals with high
fiber and low fat, as well as all-fruit meals. TSMC fabs have fitness
centers with treadmills, exercise equipment, and aerobics classrooms
to encourage employees to participate in athletic activity. In addition,
all employees can find health information through the Company’s
healthcare website.
Supplier and Contractor ManagementFor the purpose of enhancing its supply chain management, TSMC is
committed to communicating with and encouraging its contractors
and suppliers to improve their environmental, safety and health
performance. By means of communication between senior
managers, site audits and experience sharing, TSMC collaborates
with major suppliers and contractors to enhance partnership and
ensure continual improvement for increased joint contributions to
society. Contractors performing high-risk activities must lay out
clearly defined safety precautions and preventative measures. In
addition, contractors working on high-risk engineering projects must
establish OHSAS 18001 systems and the workers must successfully
complete work skill training.
In 2009, the global recession affected most companies and caused
some of them operational difficulty because of financial issues. TSMC
quickly evaluated each key supplier’s financial status and took
appropriate actions to help our suppliers continue their operation
and support TSMC fab operations.
Environmental, Safety and Health-related Awards in 2009●��Chosen for membership in the Dow Jones Sustainability World
Index for a 9th consecutive year, and the only Taiwan member from
2003 to 2007●��Recognized by the Taiwan Institute of Sustainable Energy for “Gold
Award for Taiwan Corporate Sustainability Report Award”●��Recognized by the Atomic Energy Council for “Excellence in
Radiation Protection”●��Fab 12 Phase IV was recognized by the U.S. Green Building Council
(USGBC) for “Golden Award for Leadership in Energy and
Environmental Design of New Construction (LEED-NC)” ●��Fab 12 Phase IV has passed Taiwan’s “Diamond Class Ecology,
Energy Saving, Waste Reduction, and Health (EEWH)” certification●��Fab 8 was recognized by the Science Park Administration (SPA) for
“Low Carbon Enterprise Award”●��Fab 12 was recognized by the Science Park Administration (SPA) for
“Excellence in Labor Safety and Hygiene”●��Fab 6 and Fab 14 were recognized by the Southern Taiwan Science
Park Administration for “Excellence in Environmental Protection”
73

7.3 TSMC Education and Culture Foundation
In 2009, financial crisis engulfed the global economy and Taiwan
was gravely affected. To help minimize the impact to the society and
sustain our confidence, TSMC continues to contribute substantial
amount of resources to education and culture sponsorship.
The TSMC Education and Culture Foundation, established in 1988 to
coordinate the Company’s sponsorship as part of its efforts in
corporate social responsibility, continues to devote its resources
towards education, sponsorships of art and culture events,
communities building, and the employee volunteer program. We are
committed to cultivating talents and improving the education
infrastructure. In 2009, Tzi-Shueh Hall of the Chemistry Department
in National Taiwan University, donated by the TSMC Foundation, was
inaugurated. The new research building will provide a strong base
for scientific research and development in Taiwan.
7.3.1 Commitment to Education
Talents are essential to the development of the economy. As a leader
of Taiwan’s knowledge-based industry, TSMC regards cultivating
talented people for society as a major responsibility.
Tzi-Shueh Hall of the Chemistry Department in National Taiwan
University, to which the TSMC Foundation donated 120 million NT
dollars, was completed and inaugurated in November 2009. The
naming of the new building was to honor the donation of TSMC by
combining the word “Tzi” from the Chinese name of TSMC, with the
word “Shueh” taken from the Department of Chemistry. Literally
meaning the accumulation of knowledge in Chinese, Tzi-Shueh Hall
will help to prepare true talents. The Company hopes that this
building will continue to support state of the art research activities,
foster top-notch talents, and eventually will lead basic scientific
research in Taiwan.
In the meantime, TSMC continues to devote resources to various
programs targeting a whole range of education at different age
levels. For secondary schools, we emphasize developing students’
potential in both science and humanities. For science education, the
Foundation keeps supporting the Wu Chien-Shiung and the Wu
Ta-You Science Camps for talented science students to meet with
world-class scholars. For humanity education, the Company
continues to sponsor the second TSMC Youth Chinese Calligraphy
Contest, providing high school students an opportunity to compete
and learn both from masters and peers. This year the TSMC
Foundation also organized various programs of calligraphy education
to extend the social participation in calligraphy arts. In addition, it
continued the 6th TSMC Youth Literature Award to encourage young
writers. For the past years, the contest has developed numerous
talented young writers, and cultivated an appreciation of literature in
the community. The TSMC Youth Literature Award has made an
impact, and is now an important channel for encouraging young
students to read and write. At the primary-school level, TSMC’s focus
is on aesthetic education. TSMC Foundation has been organizing the
TSMC Aesthetic Tour to bring elementary students to visit museums
for the 7th consecutive year. In 2009, the Company also sponsored
the exhibition “Smiling Kingdom - The Terracotta Warriors of Han
Yang Ling” to give children in remote townships opportunities to
appreciate Chinese traditional art and culture.
7.3.2 Contributions to Communities
The Foundation continues to promote arts and cultural activities in
TSMC site communities of Hsinchu and Tainan. Every year the
Company organizes the TSMC Hsin-Chu Art Festival to bring the
culture activities to these high-tech cities and encourage a greater art
appreciation in the communities.
In an effort to minimize the local impact of the financial crisis that
swept the world last year, the TSMC Foundation chose “Find a New
World” as the theme of Hsin-Chu Art Festival to arrange a series of
educational and cultural programs. Through these programs, we
hope to sustain the confidence of our community to fight the tough
situation, and to look forward to a better future.
The festival opened with a series of lectures. Writers and experts were
invited to guide people through the difficult economic situation.
Promoting Chinese Theatre as an important feature of the festival,
the festival brought Kunqu Opera “The Jade Hairpin” to present the
beauty of Kunqu. Also, the Hsinchu-born maestro Shao-chia Lu led
the National Orchestra to present a wonderful concert. Taiwan writer
Chun-Ming Huang invited Hsinchu local children to take part in the
drama performance. Through their participation, children developed
the correct attitude toward the environment. Meanwhile, several
charity programs encouraged the care of the underprivileged from
every corner, especially in difficult situations.
7.3.3 Sponsorship of Arts
To promote the Chinese classics and culture, the TSMC Foundation
continued to support the broadcasting program “Analects in Hsin’s
View”. The program received overwhelming positive response from
the society and overseas. As an extension of the program, the TSMC
Foundation also sponsored the publishing of the records of the
broadcasting program to let more people easily understand the
wisdom of the Confucianism.
TSMC continued its support of the Taiwan Literature Camp, which
provides workshop and lectures by distinguished authors to people
interested in literature. In 2009, 400 literary devotees from across
Taiwan convened at Cheng Kung University at Tainan for
opportunities to meet masters form Taiwan and China and to receive
three days of training and pure inspiration. TSMC also hopes that by
holding the camp to infuse the technology campus with humanities.
74
TSM
C A
NN
UA
L R
EPO
RT
20
09
CO
RPO
RATE
SO
CIA
L RE
SPO
NSI
BILI
TY
7.3.4 Employee Volunteer Program
In addition to sponsoring education and art programs, the TSMC
Foundation encourages TSMC employees to devote themselves to
promote education, bridge the resources gap, and pursue energy
conservation. The newly formed Energy-Saving Volunteer team
provided two Hsin-chu high schools with the means to evaluate the
safety and efficiency in their power usage with counseling in
energy-saving programs. The result was extraordinary, with positive
responses from the schools and the community. In 2009, the service
has extended to 5 high schools in Hsin-chu and Tainan. The team will
continue to help to reduce carbon emission and to build a better and
safer community.
In addition to the Energy-Saving Volunteer team, TSMC employees
have also served as guides to introduce the electronic industry at the
National Science Museums during weekends, and read books to the
elementary students in remote townships on weekdays. Several
hundred of TSMC “Museum Touring” and “Book Reading” volunteers
have already served for six years. Since 2003, there are total 3,000
TSMC employees to devote themselves to the society.
75

76
TSM
C A
NN
UA
L R
EPO
RT
20
09
AFF
ILIA
TE IN
FORM
ATI
ON
AN
D O
THER
SPE
CIA
L N
OTE
S

TSMC’s affiliates support our core foundry business with related services such as design service and back-end assembly and test, enabling TSMC
to provide customers with complete solutions meeting their needs.
8.1 Affiliates
8.1.1 TSMC Affiliated Companies Chart
Note: To simplify the organization structure of investment, TSMC Partners, Ltd. merged TSMC International Investment Ltd. in June 2009.
TSMC Europe B.V.Shareholding: 100%
TSMC Japan LimitedShareholding: 100%
TSMC Korea LimitedShareholding: 100%
TSMC China Company LimitedShareholding: 100%
TSMC Partners, Ltd.Shareholding: 100%
Xintec Inc.Shareholding: 41.09%
Emerging Alliance Fund, L.P.Shareholding: 99.5%
VentureTech Alliance Fund II, L.P.Shareholding: 98%
VentureTech Alliance Fund III, L.P.Shareholding: 98%
As of 12/31/2009
InveStar Semiconductor Development Fund, Inc. (II) LDC.Shareholding: 97.09%
TSMC Technology, Inc.Shareholding: 100%
InveStar Semiconductor Development Fund, Inc.Shareholding: 97.09%
TSMC Development, Inc.Shareholding: 100%
WaferTech, LLCShareholding: 99.99%
TSMC Design Technology Canada Inc.Shareholding: 100%
Global Unichip Japan Co., Ltd.Shareholding: 100%
Global Unichip Corporation-NAShareholding: 100%
Global Unichip (BVI) Corp.Shareholding: 100%
Global Unichip Europe B.V.Shareholding: 100%
Mutual-Pak Technology Co., Ltd.Shareholding: 58.96%
Growth Fund LimitedShareholding: 100%
Taiwan Semiconductor Manufacturing Company Limited
TSMC North AmericaShareholding: 100%
Global Unichip CorporationShareholding: 35.38%
VentureTech Alliance Holdings, LLCShareholding: 100%
TSMC Global Ltd.Shareholding: 100%
As of 12/31/2009
77
8. AFFILIATE INFORMATION AND OTHER SPECIAL NOTES

8.1.2 Business Scope of TSMC and Its Affiliated Companies
TSMC’s affiliates support the Company’s core business of providing dedicated foundry services and other related businesses. Some of TSMC’s
affiliated companies are focused on investing in companies involved in design, manufacturing, and other related businesses in the semiconductor
industry. TSMC and its affiliates provide mutual support in technology, capacity, marketing and services to maximize synergy within the group,
enabling TSMC to provide its customers with the most complete dedicated foundry services worldwide and ensure TSMC’s leading position in the
global foundry market.
8.1.3 TSMC Affiliated Companies
Company Date of Incorporation Place of Registration Capital Stock Business Activities
TSMC North America Jan. 18, 1988 San Jose, California, U.S.A. US$ 11,000 Selling and marketing of integrated circuits and semiconductor devices
TSMC Europe B.V. Mar. 04, 1994 Amsterdam, The Netherlands EUR 100 Marketing and engineering supporting activities
TSMC Japan Limited Sep. 10, 1997 Yokohama, Japan JPY 300,000 Marketing activities
TSMC Korea Limited May 02, 2006 Seoul, Korea KRW 400,000 Customer service and technical supporting activities
TSMC China Company Limited Aug. 04, 2003 Shanghai, China RMB 3,070,623 Manufacturing and selling of integrated circuits at the order of and pursuant to product design specifications provided by customers
TSMC Technology, Inc. Feb. 20, 1996 Delaware, U.S.A. US$ 0.001 Engineering supporting activities
InveStar Semiconductor Development Fund, Inc. Sep. 10, 1996 Cayman Islands US$ 7,911 Investing in new start-up technology companies
InveStar Semiconductor Development Fund, Inc.(II) LDC.
Aug. 25, 2000 Cayman Islands US$ 22,058 Investing in new start-up technology companies
TSMC Development, Inc. Feb. 16, 1996 Delaware, U.S.A. US$ 0.001 Investment activities
WaferTech, LLC Jun. 03, 1996 Washington, U.S.A. US$ 330,000 Manufacturing, selling, testing and computer-aided designing of integrated circuits and other semiconductor devices
TSMC Partners, Ltd. Mar. 26, 1998 Tortola, British Virgin Islands US$ 988,268 Investment in companies involved in the design, manufacture, and other related business in the semiconductor industry.
TSMC Design Technology Canada Inc. May 28, 2007 Ontario, Canada CAD 2,434 Engineering support activities
TSMC Global Ltd. Jul. 13, 2006 Tortola, British Virgin Islands US$ 1,284,000 Investment activities
Global Unichip Corporation Jan. 22, 1998 Hsin-Chu, Taiwan NT$ 1,319,749 Researching, developing, manufacturing, testing and marketing of integrated circuits
Global Unichip Japan Co., Ltd. Jun. 16, 2005 Japan JPY 30,000 Products consulting services
Global Unichip Corporation-NA Feb. 02, 2004 U.S.A. US$ 800 Products consulting services
Global Unichip Europe B.V. May 08, 2008 The Netherlands EUR 100 Products consulting services
Global Unichip (BVI) Corp. Feb. 20, 2009 Tortola, British Virgin Islands US$ 550 Investment activities
Xintec Inc. Sep. 11, 1998 Taoyuan, Taiwan NT$ 2,265,287 Wafer level chip size packaging service
Mutual-Pak Technology Co., Ltd. Mar. 22, 2006 Taipei, Taiwan NT$ 155,690 Manufacturing and selling of electronic parts and researching, developing and testing of RFID
Emerging Alliance Fund, L.P. Jan. 10, 2001 Cayman Islands US$ 28,095 Investing in new start-up technology companies
VentureTech Alliance Fund II, L.P. Feb. 27, 2004 Cayman Islands US$ 33,055 Investing in new start-up technology companies
VentureTech Alliance Fund III, L.P. Mar. 25, 2006 Cayman Islands US$ 52,950 Investing in new start-up technology companies
Growth Fund Limited May 30, 2007 Cayman Islands US$ 1,550 Investing in new start-up technology companies
VentureTech Alliance Holdings, LLC Apr. 25, 2007 Delaware, U.S.A. N/A Investing in new start-up technology companies
Unit: NT(US, EUR, JPY, KRW, RMB, CAD)$ thousands As of 12/31/2009
8.1.4 Common Shareholders of TSMC and Its Subsidiaries or Its Affiliates with Deemed Control: None.
78
TSM
C A
NN
UA
L R
EPO
RT
20
09
AFF
ILIA
TE IN
FORM
ATI
ON
AN
D O
THER
SPE
CIA
L N
OTE
S

8.1.5 Rosters of Directors, Supervisors, and Presidents of TSMC’s Affiliated Companies
Company Title Name Shareholding
Shares (Investment Amount) % (Investment Holding %)
TSMC North America DirectorDirectorPresident
Jason ChenRick CassidyRick Cassidy
- - -
TSMC holds 11,000,000 shares
- - -
100%
TSMC Europe B.V. DirectorDirectorDirectorPresident
Jason ChenWendell HuangMaria MarcedMaria Marced
- - - -
TSMC holds 200 shares
--- -
100%
TSMC Japan Limited ChairmanDirectorDirectorSupervisorPresident
Rick TsaiJason ChenMakoto OnoderaLora HoMakoto Onodera
- - - - -
TSMC holds 6,000 shares
- - - - -
100%
TSMC Korea Limited DirectorDirector
C.C. Pan Chih-Chun Tsai
- -
TSMC holds 80,000 shares
- -
100%
TSMC China Company Limited ChairmanDirectorDirectorSupervisorPresident
F.C.TsengC.C.WeiY.C. ChaoLora HoC.H. Chen
- - - - -
(TSMC’s investment US$371,000,000)
- - - - -
(100%)
TSMC Partners, Ltd. DirectorDirectorPresident
Lora HoRichard ThurstonLora Ho
- - -
TSMC holds 988,268,244shares
- - -
100%
TSMC Technology, Inc. ChairmanDirectorPresident
Lora HoRichard ThurstonLora Ho
- - -
TSMC Partners, Ltd. holds 1,000 shares
- - -
100%
InveStar Semiconductor Development Fund, Inc.
Director Wendell Huang - TSMC Partners, Ltd. holds 7,680,107 share
- 97.09%
InveStar Semiconductor Development Fund, Inc. (II) LDC.
Director Wendell Huang - TSMC Partners, Ltd. holds 21,415,133 shares
-97.09%
TSMC Design Technology Canada Inc. DirectorDirectorDirectorPresident
Fu-Chieh HsuSreedhar NatarajanRichard ThurstonCliff Hou
---
- TSMC Partners, Ltd. holds 2,300,000 shares
- - - -
100%
TSMC Development, Inc. ChairmanDirectorPresident
Lora HoRichard ThurstonLora Ho
- - -
TSMC Partners, Ltd.holds 1,000 shares
- - -
100%
WaferTech, LLC ChairmanDirectorPresident
Rick TsaiSteve TsoKuo-Chin Hsu
- - -
TSMC Development, Inc.holds 293,636,833 shares
- - -
99.99%
TSMC Global Ltd. DirectorDirector
Lora HoRichard Thurston
- -
TSMC holds 1,284 shares
- -
100%
Global Unichip Corporation ChairmanDirectorDirectorDirectorDirector
Director
Independent DirectorIndependent DirectorIndependent DirectorPresident
Representative of TSMC: F.C. Tseng Representative of TSMC: Lora HoRepresentative of TSMC: Jim LaiRepresentative of TSMC: Fu-Chieh HsuRe presentative of Chin Yu Investment Ltd.: C.C.
ShiueRe presentative of Chuang Yi Investment Ltd.: K.C.
ShihC.W. JenW.C. LiuW.Y. WangJim Lai
46,687,859 shares 46,687,859 shares
47,470,644 shares 46,687,859 shares 1,391,531 shares
5,318,765 shares
- - -
782,785 shares
35.38%35.38%35.97%35.38%1.05%
4.03%
---
0.59%
Unit: US/EUR$, except shareholding As of 12/31/2009
(Continued)
79

Company Title Name Shareholding
Shares (Investment Amount) % (Investment Holding %)
Global Unichip Japan Co., Ltd. DirectorDirectorDirectorSupervisorPresident
Jim LaiChung-Lin TsaiJames ChengK.C. ShihChung-Lin Tsai
- - - -
- GUC holds 600 shares
- - - - -
100%
Global Unichip Corporation-NA DirectorDirectorPresident
James ChengJim LaiJim Lai
- - -
GUC holds 800,000 shares
- - -
100%
Global Unichip Europe B.V. Director Hwang, Yawlin - (GUC’s investment EUR$100,000)
- (100%)
Global Unichip (BVI) Corp. DirectorDirector
Representative of GUC: Jim LaiRepresentative of GUC: Chien, Pei-Lun
- -
GUC holds 550,000 shares
- -
100%
Xintec Inc. ChairmanDirectorDirectorDirector
DirectorSupervisor
Supervisor
President
Representative of TSMC: Shang-yi ChiangRepresentative of TSMC: C.C.Wei Representative of TSMC: Lora HoRe presentative of OmniVision Investment Holding
Inc.: XinPing HeTzun Zing ChenRe presentative of Cheng Xin Technology
Development Corp.: Toang Chiou LuRe presentative of VisEra Holding Company: W.M.
ShengLidon Chen
93,081,225 shares93,081,225 shares93,081,225 shares9,616,150 shares
1,614,985 shares1,205,793 shares
36,502,320 shares
368,813 shares
41.09%41.09%41.09%4.25%
0.71%0.53%
16.11%
0.16%
Mutual-Pak Technology Co., Ltd. ChairmanDirectorDirector
SupervisorPresident
Hsu-Tung ChenLewis HwanRe prsentative of VentureTech Alliance Fund III, L.P.:
Juine-Kei TsengWei-Pong LinLewis Hwan
80,000 shares1,759,000 shares9,180,000 shares
30,000 shares1,759,000 shares
0.51%11.30%58.96%
0.19%11.30%
Emerging Alliance Fund, L.P. None None (TSMC’s investment US$27,954,767) (99.5%)
VentureTech Alliance Fund II, L.P. None None (TSMC’s investment US$32,394,351) (98%)
VentureTech Alliance Fund III, L.P. None None (TSMC’s investment US$51,891,000) (98%)
Growth Fund Limited None None (VentureTech Alliance Fund III, L.P.’s investment US$1,550,000)
(100%)
VentureTech Alliance Holdings, LLC None None None (100%)
80
TSM
C A
NN
UA
L R
EPO
RT
20
09
AFF
ILIA
TE IN
FORM
ATI
ON
AN
D O
THER
SPE
CIA
L N
OTE
S

8.1.6 Operational Highlights of TSMC Affiliated Companies (Note)
Company Capital Stock Assets Liabilities Net Worth Net Sales Income from
Operation Net Income (Net of Tax)
Basic EPS (Net of Tax)*
Remark
TSMC North America 352,330 26,484,291 23,622,179 2,862,112 163,703,629 287,821 197,076 17.92
TSMC Europe B.V. 4,625 243,450 83,983 159,467 344,790 43,374 35,445 177,225
TSMC Japan Limited 104,520 169,182 33,519 135,663 232,726 10,578 4,203 700.50
TSMC Korea Limited 11,000 20,406 1,887 18,519 14,224 1,293 2,392 29.90
TSMC China Company Limited 14,410,434 13,416,228 10,457,521 2,958,707 4,244,911 (3,068,425) (3,244,458) N/A
TSMC Technology, Inc. 0.03 340,224 49,695 290,529 420,441 20,021 21,879 21,879
InveStar Semiconductor Development Fund, Inc. 253,389 242,192 160 242,032 8,074 (49,405) (49,673) (6.28)
InveStar Semiconductor Development Fund, Inc. (II) LDC.
706,518 453,515 200 453,315 365,640 32,443 31,724 1.44
TSMC Development, Inc. 0.03 6,289,511 143 6,289,368 - (2,932) 185,091 185,091
WaferTech, LLC 10,569,900 5,763,134 552,447 5,210,687 5,556,299 (16,467) (4,139) (0.01)
TSMC Partners, Ltd. 31,654,232 32,638,619 93,000 32,545,619 480,345 (54,907) (54,907) (0.06)
TSMC Design Technology Canada Inc. 74,281 122,951 20,686 102,265 156,653 14,300 6,939 3.02
TSMC Global Ltd. 41,126,520 45,401,566 4,310 45,397,256 714,607 505,232 505,232 393,482.87
Global Unichip Corporation 1,319,749 4,074,386 1,296,078 2,778,308 8,269,806 397,234 412,771 3.15
Global Unichip Japan Co., Ltd. 10,452 14,812 1,869 12,943 39,992 1,904 1,614 2,690
Global Unichip Corporation-NA 25,624 41,140 2,474 38,666 158,175 7,353 5,617 7.02
Global Unichip Europe B.V. 4,625 5,244 14 5,230 7,484 365 354 N/A
Global Unichip (BVI) Corp. 17,617 17,488 - 17,488 - (134) (133) (0.24)
Xintec Inc. 2,265,287 4,958,081 1,459,941 3,498,140 2,354,536 (1,963) 10,597 0.05
Mutual-Pak Technology Co., Ltd. 155,690 95,624 5,120 90,504 - (43,537) (36,515) (2.35)
Emerging Alliance Fund, L.P. 899,891 307,410 7 307,403 11,078 (92,606) (92,606) N/A
VentureTech Alliance Fund II, L.P. 1,058,752 1,141,194 610 1,140,584 53,786 (178,442) (178,442) N/A
VentureTech Alliance Fund III, L.P. 1,695,989 1,318,787 - 1,318,787 3,100 (224,620) (224,620) N/A
Growth Fund Limited 49,647 26,354 - 26,354 1 (4,200) (4,200) N/A
VentureTech Alliance Holdings, LLC - - - - - - - N/A
Unit: NT$ thousands, except EPS ($) As of 12/31/2009
*TSMC Japan Limited, TSMC Europe B.V., TSMC Korea Limited, Global, TSMC Design Technology Canada Inc., Unichip Japan Co., Ltd. and Global Unichip (BVI) Corp., the basic EPS of each group entity is calculated based on audit figures.Note: Foreign exchange rates for balance sheet amounts are as follows: $1 USD = $32.030 NT, $1 EUR = $46.250 NT, $1 JPY = $0.3484 NT, $1 RMB = $4.693NT, $1 KRW = $0.0275 NT, $1 CAD= $30.52 NT Foreign exchange rates for income statement amounts are as follows: $1 USD = $33.036 NT, $1 EUR = $46.192 NT, $1 JPY = $0.3550 NT, $1 RMB = $4.838 NT, $1 KRW = $0.0260NT, $1 CAD= $29.07 NT
8.2 Status of TSMC Common Shares and ADRs Acquired, Disposed of, and Held by Subsidiaries: None.
8.3 Special Notes
8.3.1 Private Placement Securities in 2009 and as of the Date of this Annual Report: None.
8.3.2 Regulatory Authorities’ Legal Penalties to the Company or Its Employees, and the Company’s Resulting Punishment on Its Employees for Violations of Internal Control System Provisions, Principal Deficiencies, and the State of Any Efforts to Make Improvements in 2009 and as of the Date of this Annual Report
The authorities inspected TSMC’s human resources management procedure and job time records and issued fines totalling NT$42,000 for
incompleteness of the relevant records. TSMC will work closely with the authorities to address the concerns of both sides fairly.
8.3.3 Any Events in 2009 and as of the Date of this Annual Report that Had Significant Impacts on Shareholders’ Right or Security Prices as Stated in Item 2 Paragraph 2 of Article 36 of Securities and Exchange Law of Taiwan: None.
8.3.4 Other Necessary Supplement: None.
81
Taiwan Stock Exchange Market Observation Post System: http://newmops.tse.com.tw TSMC annual report is available at http://www.tsmc.com/english/e_investor/e02_annual/e02_annual.htm Printed on March 12, 2010
TWSE: 2330NYSE: TSM
TSMC ANNUAL REPORT 2009 (II) FINANCIAL INFORMATION

TABLE OF CONTENTS1. Condensed Balance Sheet 2
2. Condensed Statement of Income 3
3. Financial Analysis 4
4. Auditors’ Opinions from 2005 to 2009 6
5. Audit Committee’s Report 6
6. Financial Difficulties 6
7. Financial Statements for the Years Ended 7
December 31, 2009 and 2008 and
Independent Auditors’ Report
8. Consolidated Financial Statements for the 42
Years Ended December 31, 2009 and 2008
and Independent Auditors’ Report
9. U.S. GAAP Financial Information 87
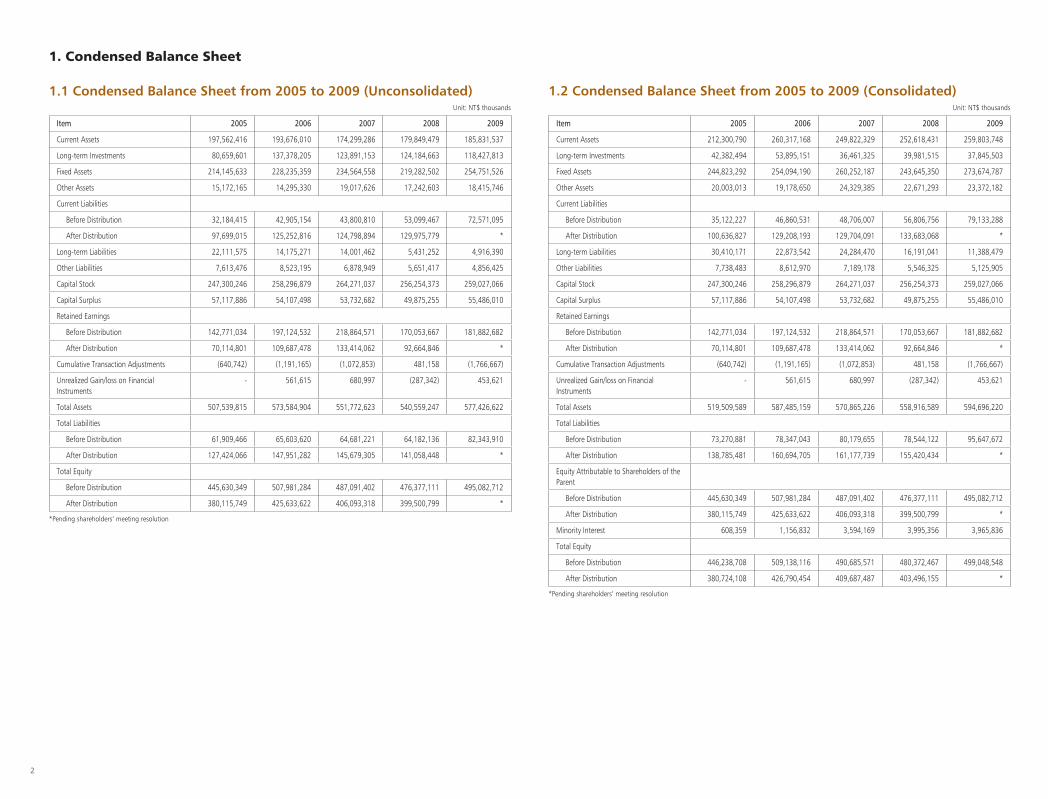
2
1. Condensed Balance Sheet
1.1 Condensed Balance Sheet from 2005 to 2009 (Unconsolidated)
Item 2005 2006 2007 2008 2009
Current Assets 197,562,416 193,676,010 174,299,286 179,849,479 185,831,537
Long-term Investments 80,659,601 137,378,205 123,891,153 124,184,663 118,427,813
Fixed Assets 214,145,633 228,235,359 234,564,558 219,282,502 254,751,526
Other Assets 15,172,165 14,295,330 19,017,626 17,242,603 18,415,746
Current Liabilities
Before Distribution 32,184,415 42,905,154 43,800,810 53,099,467 72,571,095
After Distribution 97,699,015 125,252,816 124,798,894 129,975,779 *
Long-term Liabilities 22,111,575 14,175,271 14,001,462 5,431,252 4,916,390
Other Liabilities 7,613,476 8,523,195 6,878,949 5,651,417 4,856,425
Capital Stock 247,300,246 258,296,879 264,271,037 256,254,373 259,027,066
Capital Surplus 57,117,886 54,107,498 53,732,682 49,875,255 55,486,010
Retained Earnings
Before Distribution 142,771,034 197,124,532 218,864,571 170,053,667 181,882,682
After Distribution 70,114,801 109,687,478 133,414,062 92,664,846 *
Cumulative Transaction Adjustments (640,742) (1,191,165) (1,072,853) 481,158 (1,766,667)
Unrealized Gain/loss on Financial Instruments
- 561,615 680,997 (287,342) 453,621
Total Assets 507,539,815 573,584,904 551,772,623 540,559,247 577,426,622
Total Liabilities
Before Distribution 61,909,466 65,603,620 64,681,221 64,182,136 82,343,910
After Distribution 127,424,066 147,951,282 145,679,305 141,058,448 *
Total Equity
Before Distribution 445,630,349 507,981,284 487,091,402 476,377,111 495,082,712
After Distribution 380,115,749 425,633,622 406,093,318 399,500,799 *
Unit: NT$ thousands
*Pending shareholders’ meeting resolution
1.2 Condensed Balance Sheet from 2005 to 2009 (Consolidated)
Item 2005 2006 2007 2008 2009
Current Assets 212,300,790 260,317,168 249,822,329 252,618,431 259,803,748
Long-term Investments 42,382,494 53,895,151 36,461,325 39,981,515 37,845,503
Fixed Assets 244,823,292 254,094,190 260,252,187 243,645,350 273,674,787
Other Assets 20,003,013 19,178,650 24,329,385 22,671,293 23,372,182
Current Liabilities
Before Distribution 35,122,227 46,860,531 48,706,007 56,806,756 79,133,288
After Distribution 100,636,827 129,208,193 129,704,091 133,683,068 *
Long-term Liabilities 30,410,171 22,873,542 24,284,470 16,191,041 11,388,479
Other Liabilities 7,738,483 8,612,970 7,189,178 5,546,325 5,125,905
Capital Stock 247,300,246 258,296,879 264,271,037 256,254,373 259,027,066
Capital Surplus 57,117,886 54,107,498 53,732,682 49,875,255 55,486,010
Retained Earnings
Before Distribution 142,771,034 197,124,532 218,864,571 170,053,667 181,882,682
After Distribution 70,114,801 109,687,478 133,414,062 92,664,846 *
Cumulative Transaction Adjustments (640,742) (1,191,165) (1,072,853) 481,158 (1,766,667)
Unrealized Gain/loss on Financial Instruments
- 561,615 680,997 (287,342) 453,621
Total Assets 519,509,589 587,485,159 570,865,226 558,916,589 594,696,220
Total Liabilities
Before Distribution 73,270,881 78,347,043 80,179,655 78,544,122 95,647,672
After Distribution 138,785,481 160,694,705 161,177,739 155,420,434 *
Equity Attributable to Shareholders of the Parent
Before Distribution 445,630,349 507,981,284 487,091,402 476,377,111 495,082,712
After Distribution 380,115,749 425,633,622 406,093,318 399,500,799 *
Minority Interest 608,359 1,156,832 3,594,169 3,995,356 3,965,836
Total Equity
Before Distribution 446,238,708 509,138,116 490,685,571 480,372,467 499,048,548
After Distribution 380,724,108 426,790,454 409,687,487 403,496,155 *
Unit: NT$ thousands
*Pending shareholders’ meeting resolution
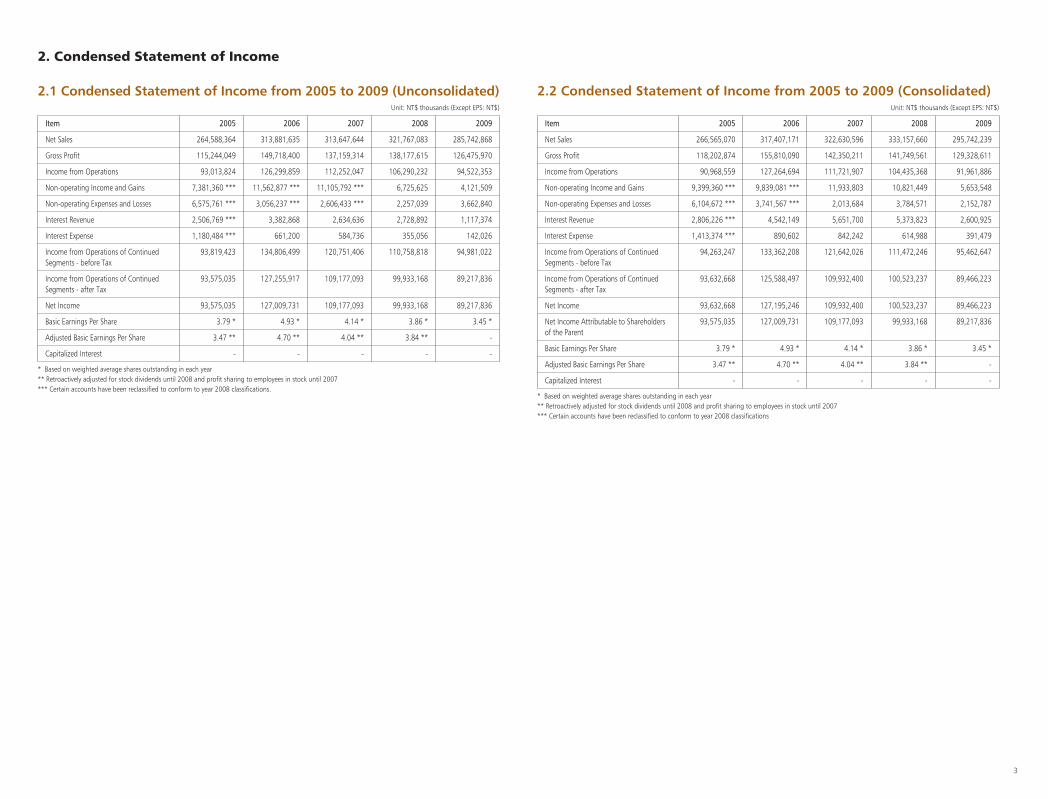
3
Item 2005 2006 2007 2008 2009
Net Sales 264,588,364 313,881,635 313,647,644 321,767,083 285,742,868
Gross Profit 115,244,049 149,718,400 137,159,314 138,177,615 126,475,970
Income from Operations 93,013,824 126,299,859 112,252,047 106,290,232 94,522,353
Non-operating Income and Gains 7,381,360 *** 11,562,877 *** 11,105,792 *** 6,725,625 4,121,509
Non-operating Expenses and Losses 6,575,761 *** 3,056,237 *** 2,606,433 *** 2,257,039 3,662,840
Interest Revenue 2,506,769 *** 3,382,868 2,634,636 2,728,892 1,117,374
Interest Expense 1,180,484 *** 661,200 584,736 355,056 142,026
Income from Operations of Continued Segments - before Tax
93,819,423 134,806,499 120,751,406 110,758,818 94,981,022
Income from Operations of Continued Segments - after Tax
93,575,035 127,255,917 109,177,093 99,933,168 89,217,836
Net Income 93,575,035 127,009,731 109,177,093 99,933,168 89,217,836
Basic Earnings Per Share 3.79 * 4.93 * 4.14 * 3.86 * 3.45 *
Adjusted Basic Earnings Per Share 3.47 ** 4.70 ** 4.04 ** 3.84 ** -
Capitalized Interest - - - - -
2. Condensed Statement of Income
2.1 Condensed Statement of Income from 2005 to 2009 (Unconsolidated)Unit: NT$ thousands (Except EPS: NT$)
2.2 Condensed Statement of Income from 2005 to 2009 (Consolidated)Unit: NT$ thousands (Except EPS: NT$)
* Based on weighted average shares outstanding in each year** Retroactively adjusted for stock dividends until 2008 and profit sharing to employees in stock until 2007*** Certain accounts have been reclassified to conform to year 2008 classifications.
Item 2005 2006 2007 2008 2009
Net Sales 266,565,070 317,407,171 322,630,596 333,157,660 295,742,239
Gross Profit 118,202,874 155,810,090 142,350,211 141,749,561 129,328,611
Income from Operations 90,968,559 127,264,694 111,721,907 104,435,368 91,961,886
Non-operating Income and Gains 9,399,360 *** 9,839,081 *** 11,933,803 10,821,449 5,653,548
Non-operating Expenses and Losses 6,104,672 *** 3,741,567 *** 2,013,684 3,784,571 2,152,787
Interest Revenue 2,806,226 *** 4,542,149 5,651,700 5,373,823 2,600,925
Interest Expense 1,413,374 *** 890,602 842,242 614,988 391,479
Income from Operations of Continued Segments - before Tax
94,263,247 133,362,208 121,642,026 111,472,246 95,462,647
Income from Operations of Continued Segments - after Tax
93,632,668 125,588,497 109,932,400 100,523,237 89,466,223
Net Income 93,632,668 127,195,246 109,932,400 100,523,237 89,466,223
Net Income Attributable to Shareholders of the Parent
93,575,035 127,009,731 109,177,093 99,933,168 89,217,836
Basic Earnings Per Share 3.79 * 4.93 * 4.14 * 3.86 * 3.45 *
Adjusted Basic Earnings Per Share 3.47 ** 4.70 ** 4.04 ** 3.84 ** -
Capitalized Interest - - - - -
* Based on weighted average shares outstanding in each year** Retroactively adjusted for stock dividends until 2008 and profit sharing to employees in stock until 2007*** Certain accounts have been reclassified to conform to year 2008 classifications

4
2005 2006 2007 2008 2009
Capital Structure Analysis Debt Ratio (%) 12.20 11.44 11.72 11.87 14.26
Long-term Fund to Fixed Assets Ratio (%) 218.42 228.78 213.63 219.72 196.27
Liquidity Analysis Current Ratio (%) 613.84 451.40 397.94 338.70 256.07
Quick Ratio (%) 560.93 404.49 348.53 312.83 228.94
Times Interest Earned (Times) 80.48 204.39 207.51 312.95 669.76
Operating Performance Analysis Average Collection Turnover (Times) 8.08 9.26 8.82 11.08 11.17
Days Sales Outstanding 45.18 39.40 41.40 32.93 32.66
Average Inventory Turnover (Times) 9.82 9.27 8.78 10.86 10.06
Average Inventory Turnover Days 37.19 39.37 41.57 33.59 36.29
Average Payment Turnover (Times) 14.24 15.81 16.05 20.40 18.46
Fixed Assets Turnover (Times) 1.24 1.38 1.34 1.47 1.12
Total Assets Turnover (Times) 0.52 0.55 0.57 0.60 0.49
Profitability Analysis Return on Total Assets (%) 19.01 23.60 19.49 18.35 15.98
Return on Equity (%) 22.16 26.64 21.94 20.74 18.37
Operating Income to Paid-in Capital Ratio (%) 37.61 48.90 42.48 41.48 36.49
Pre-tax Income to Paid-in Capital Ratio (%) 37.94 52.06 45.69 43.22 36.67
Net Margin (%) 35.37 40.46 34.81 31.06 31.22
Basic Earnings Per Share (NT$) (Note 1) 3.47 4.70 4.04 3.84 3.45
Diluted Earnings Per Share (NT$) (Note 1) 3.46 4.69 4.04 3.81 3.44
Cash Flow Cash Flow Ratio (%) 468.02 457.01 397.52 399.16 214.83
Cash Flow Adequacy Ratio (%) 150.88 153.75 139.35 134.79 122.02
Cash Flow Reinvestment Ratio (%) 12.50 14.18 9.73 12.95 6.99
Leverage Operating Leverage 2.30 2.04 2.23 2.50 2.46
Financial Leverage 1.01 1.01 1.01 1.00 1.00
Analysis of Deviation over 20% for 2009 vs. 2008:1. The debt ratio increased by 20% as a result of an increase of current liabilities, primarily due to an increase of payables to contractors and equipment suppliers.2. The current ratio decreased by 24% and quick ratio decreased by 27%, mainly due to an increase in current liabilities.3. The times interest earned increased by 114%, as a result of a decrease in interest expense at a higher percentage than the decrease in earning before interest and taxes.4. The fixed asset turnover decreased by 24%, primarily due to an increase in net fixed assets and a decrease in net sales.5. The cash flow ratio decreased by 46%, mainly due to a decrease in cash provided by operating activities and an increase in current liabilities.6. The cash flow reinvestment ratio decreased by 46%, resulting from a decrease in cash provided by operating activities and an increase in gross fixed assets.
3. Financial Analysis
3.1 Financial Analysis from 2005 to 2009 (Unconsolidated)
*Glossary1. Capital Structure Analysis (1) Debt Ratio = Total Liabilities / Total Assets (2) Long-term Fund to Fixed Assets Ratio = (Shareholders’ Equity + Long-term Liabilities) / Net
Fixed Assets2. Liquidity Analysis (1) Current Ratio = Current Assets / Current Liabilities (2) Quick Ratio = (Current Assets - Inventories - Prepaid Expenses) /
Current Liabilities (3) Times Interest Earned = Earnings before Interest and Taxes / Interest Expenses3. Operating Performance Analysis (1) Average Collection Turnover = Net Sales / Average Trade Receivables (2) Days Sales Ooutstanding = 365 / Average Collection Turnover (3) Average Inventory Turnover = Cost of Sales / Average Inventory
Note 1: Retroactively adjusted for stock dividends until 2008 and profit sharing to employees in stock until 2007.Note 2: Certain accounts of year 2005 have been reclassified to conform to year 2006 classifications.
(4) Average Inventory Turnover Days = 365 / Average Inventory Turnover (5) Average Payment Turnover = Cost of Sales / Average Trade Payables (6) Fixed Assets Turnover = Net Sales / Net Fixed Assets (7) Total Assets Turnover = Net Sales / Total Assets4. Profitability Analysis (1) Return on Total Assets = (Net Income + Interest Expenses * (1 - Effective Tax
Rate) ) / Average Total Assets (2) Return on Equity = Net Income / Average Shareholders’ Equity (3) Operating Income to Paid-in Capital
Ratio= Operating Income / Paid-in Capital
(4) Pre-tax Income to Paid-in Capital Ratio = Income before Tax / Paid-in Capital (5) Net Margin = Net Income / Net Sales (6) Earnings Per Share = (Net Income - Preferred Stock Dividend) / Weighted
Average Number of Shares Outstanding
5. Cash Flow (1) Cash Flow Ratio = Net Cash Provided by Operating Activities / Current
Liabilities (2) Cash Flow Adequacy Ratio = Five-year Sum of Cash from Operations / Five-year
Sum of Capital Expenditures, Inventory Additions, and Cash Dividend
(3) Cash Flow Reinvestment Ratio = (Cash Provided by Operating Activities - Cash Dividends) / (Gross Fixed Assets + Investments + Other Assets + Working Capital)
6. Leverage (1) Operating Leverage = (Net Sales - Variable Cost) / Income from Operations (2) Financial Leverage = Income from Operations / (Income from Operations -
Interest Expenses)

5
3.2 Financial Analysis from 2005 to 2009 (Consolidated)
2005 2006 2007 2008 2009
Capital Structure Analysis Debts Ratio (%) 14.10 13.34 14.05 14.05 16.08
Long-term Fund to Fixed Assets (%) 194.69 209.38 197.87 203.81 186.51
Liquidity Analysis Current Ratio (%) 604.46 555.51 512.92 444.70 328.31
Quick Ratio (%) 549.94 506.39 461.11 415.32 300.15
Times Interest Earned (Times) 67.69 152.46 145.43 182.26 244.85
Operating Performance Analysis Average Collection Turnover (Times) 7.84 8.84 8.55 10.73 10.78
Days Sales Outstanding 46.54 41.28 42.69 34.01 33.86
Average Inventory Turnover (Times) 8.91 8.25 7.96 9.88 9.30
Average Inventory Turnover Days 40.94 44.22 45.85 36.94 39.25
Average Payment Turnover (Times) 14.37 15.41 15.76 20.02 18.77
Fixed Assets Turnover (Times) 1.09 1.25 1.24 1.37 1.08
Total Assets Turnover (Times) 0.51 0.54 0.57 0.60 0.50
Profitability Analysis Return on Total Assets (%) 18.89 23.12 19.10 17.89 15.57
Return on Equity (%) 22.16 26.64 21.94 20.74 18.37
Operating Income to Paid-in Capital Ratio (%) 36.78 49.27 42.28 40.75 35.50
Pre-tax Income to Paid-in Capital Ratio (%) 38.12 52.22 46.03 43.50 36.85
Net Margin (%) 35.13 40.07 34.07 30.17 30.25
Basic Earnings Per Share (NT$) (Note 1) 3.47 4.70 4.04 3.84 3.45
Diluted Earnings Per Share (NT$) (Note 1) 3.46 4.69 4.04 3.81 3.44
Cash Flow Cash Flow Ratio (%) 447.65 437.46 377.30 389.91 202.15
Cash Flow Adequacy Ratio (%) 154.53 156.75 142.46 139.50 126.39
Cash Flow Reinvestment Ratio (%) 12.64 14.36 10.07 12.98 6.90
Leverage Operating Leverage 2.31 1.99 2.21 2.53 2.53
Financial Leverage 1.02 1.01 1.01 1.01 1.00
Industry Specific Key Performance Indicator
Billing Utilization Rate (%) 94 102 93 (Note2) 88 (Note2) 76 (Note2)
Advanced Technologies (0.13-micron and below) Percentage of Wafer Sales (%)
45 49 55 64 67
Sales Growth (%) 3.6 19.1 1.6 3.3 -11.2
Net Income Growth (%) 1.4 35.7 -14.0 -8.5 -10.7
Analysis of Deviation over 20% for 2009 vs. 2008:1. The current ratio decreased by 26% and quick ratio decreased by 28%, mainly due to an increase in current liabilities.2. The times interest earned increased by 34%, as a result of a decrease in interest expense at a higher percentage than the decrease in earnings before interest and taxes.3. The fixed asset turnover decreased by 21%, primarily due to an increase in net fixed assets and a decrease in net sales.4. The cash flow ratio decreased by 48%, mainly due to a decrease in cash provided by operating activities.5. The cash flow reinvestment ratio decreased by 47%, resulting from a decrease in cash provided by operating activities and an increase in gross fixed assets
Note 1: Retroactively adjusted for stock dividends until 2008 and profit sharing to employees in stock until 2007.
Note 2: Capacity includes wafers committed by Vanguard.Note 3: Certain accounts of year 2005 have been reclassified to conform to year 2006 classifications.
*Glossary1. Capital Structure Analysis (1) Debt Ratio = Total Liabilities / Total Assets (2) Long-term Fund to Fixed Assets Ratio = (Shareholders’ Equity + Long-term Liabilities) / Net
Fixed Assets2. Liquidity Analysis (1) Current Ratio = Current Assets / Current Liabilities (2) Quick Ratio = (Current Assets - Inventories - Prepaid Expenses) /
Current Liabilities (3) Times Interest Earned = Earnings before Interest and Taxes / Interest Expenses
3. Operating Performance Analysis (1) Average Collection Turnover = Net Sales / Average Trade Receivables (2) Days Sales Outstanding = 365 / Average Collection Turnover (3) Average Inventory Turnover = Cost of Sales / Average Inventory (4) Average Inventory Turnover Days = 365 / Average Inventory Turnover (5) Average Payment Turnover = Cost of Sales / Average Trade Payables (6) Fixed Assets Turnover = Net Sales / Net Fixed Assets (7) Total Assets Turnover = Net Sales / Total Assets4. Profitability Analysis (1) Return on Total Assets = (Net Income + Interest Expenses * (1 - Effective Tax
Rate) ) / Average Total Assets (2) Return on Equity = Net Income / Average Shareholders’ Equity (3) Operating Income to Paid-in Capital
Ratio= Operating Income / Paid-in Capital
(4) Pre-tax Income to Paid-in Capital Ratio = Income before Tax / Paid-in Capital (5) Net Margin = Net Income / Net Sales
(6) Earnings Per Share = (Net Income - Preferred Stock Dividend) / Weighted Average Number of Shares Outstanding
5. Cash Flow (1) Cash Flow Ratio = Net Cash Provided by Operating Activities / Current
Liabilities (2) Cash Flow Adequacy Ratio = Five-year Sum of Cash from Operations / Five-year
Sum of Capital Expenditures, Inventory Additions, and Cash Dividend
(3) Cash Flow Reinvestment Ratio = (Cash Provided by Operating Activities - Cash Dividends) / (Gross Fixed Assets + Investments + Other Assets + Working Capital)
6. Leverage (1) Operating Leverage = (Net Sales - Variable Cost) / Income from Operations (2) Financial Leverage = Income from Operations / (Income from Operations -
Interest Expenses)

6
Year CPA Audit Opinion
2005 Hung-Wen Huang, Ming-Cheng Chang An Unqualified Opinion
2006 Hung-Wen Huang, Ming-Cheng Chang An Unqualified Opinion
2007 Hung-Wen Huang, Ming-Cheng Chang An Unqualified Opinion
2008 Hung-Peng Lin, Shu-Chieh Huang An Unqualified Opinion with explanatory paragraph referring to adoption of new accounting standards
2009 Hung-Peng Lin, Shu-Chieh Huang An Unqualified Opinion with explanatory paragraph referring to adoption of new accounting standards
4. Auditors’ Opinions from 2005 to 2009
Deloitte & Touche12F, No. 156, Sec. 3, Min-Sheng E. Rd., Taipei, Taiwan, R.O.C.Tel: 886-2-2545-9988
5. Audit Committee’s Report
The Board of Directors has prepared the Company’s 2009 Business Report, Financial Statements, and proposal for allocation of profits. The CPA firm of Deloitte & Touche was retained to audit TSMC’s Financial Statements and has issued an audit report relating to the Financial Statements. The Business Report, Financial Statements, and profit allocation proposal have been reviewed and determined to be correct and accurate by the Audit Committee members of Taiwan Semiconductor Manufacturing Company Limited. According to Article 14-4 of the Securities and Exchange Act and Article 219 of the Company Law, we hereby submit this report.
Taiwan Semiconductor Manufacturing Company Limited
Chairman of the Audit Committee: Sir Peter Leahy Bonfield
February 9, 2010
6. Financial Difficulties
The Company should disclose the financial impact to the Company if the Company and its affiliated companies have incurred any financial or cash flow difficulties in 2009 and as of the date of this Annual Report: None

7
Notice to Readers
The accompanying financial statements are intended only to present the financial position, results of operations and cash flows in accordance with accounting principles and practices generally accepted in the Republic of China and not those of any other jurisdiction. The standards, procedures and practices to audit such financial statements are those generally accepted and applied in the Republic of China.
For the convenience of readers, the auditors’ report and the accompanying financial statements have been translated into English from the original Chinese version prepared and used in the Republic of China. If there is any conflict between the English version and the original Chinese version or any difference in the interpretation of the two versions, the Chinese-language auditors’ report and financial statements shall prevail.
7. Financial Statements for the Years Ended December 31, 2009 and 2008 and Independent Auditors’ Report
INDEPENDENT AUDITORS’ REPORT
The Board of Directors and Shareholders
Taiwan Semiconductor Manufacturing Company Limited
We have audited the accompanying balance sheets of Taiwan Semiconductor Manufacturing Company Limited as of December 31, 2009 and 2008, and the related statements of income, changes in shareholders’ equity and cash flows for the years then ended. These financial statements are the responsibility of the Company’s management. Our responsibility is to express an opinion on these financial statements based on our audits.
We conducted our audits in accordance with the Rules Governing the Audit of Financial Statements by Certified Public Accountants and auditing standards generally accepted in the Republic of China. Those rules and standards require that we plan and perform the audit to obtain reasonable assurance about whether the financial statements are free of material misstatement. An audit includes examining, on a test basis, evidence supporting the amounts and disclosures in the financial statements. An audit also includes assessing the accounting principles used and significant estimates made by management, as well as evaluating the overall financial statement presentation. We believe that our audits provide a reasonable basis for our opinion.
In our opinion, the financial statements referred to above present fairly, in all material respects, the financial position of Taiwan Semiconductor Manufacturing Company Limited as of December 31, 2009 and 2008, and the results of its operations and its cash flows for the years then ended in conformity with the Guidelines Governing the Preparation of Financial Reports by Securities Issuers, requirements of the Business Accounting Law and Guidelines Governing Business Accounting with respect to financial accounting standards, and accounting principles generally accepted in the Republic of China.
As discussed in Note 3 to the financial statements, effective January 1, 2009, Taiwan Semiconductor Manufacturing Company Limited adopted the newly revised Statements of Financial Accounting Standards No. 10, “Accounting for Inventories”. In addition, effective January 1, 2008, Taiwan Semiconductor Manufacturing Company Limited adopted Interpretation 2007-052, “Accounting for Bonuses to Employees, Directors and Supervisors”, issued by the Accounting Research and Development Foundation of the Republic of China and relevant requirements promulgated by the Financial Supervisory Commission of the Executive Yuan.
We have also audited, in accordance with the Rules Governing the Audit of Financial Statements by Certified Public Accountants and auditing standards generally accepted in the Republic of China, the consolidated financial statements of Taiwan Semiconductor Manufacturing Company Limited and subsidiaries as of and for the years ended December 31, 2009 and 2008, and expressed an unqualified opinion with an explanatory paragraph relating to the adoption of the newly revised Statement of Financial Accounting Standard, Accounting for Inventories, and the adoption of Interpretation 2007-052, respectively, on such consolidated financial statements.
January 22, 2010
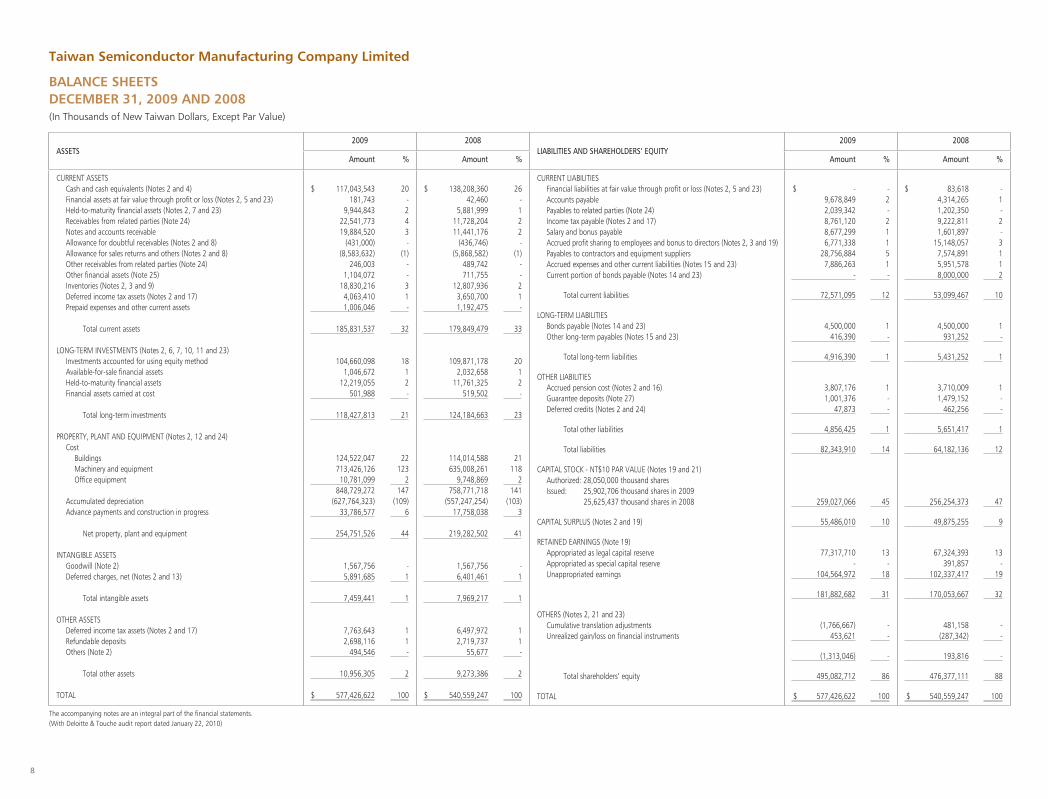
8
ASSETS2009 2008
LIABILITIES AND SHAREHOLDERS’ EQUITY 2009 2008
Amount % Amount % Amount % Amount %
CURRENT ASSETSCash and cash equivalents (Notes 2 and 4)Financial assets at fair value through profit or loss (Notes 2, 5 and 23)Held-to-maturity financial assets (Notes 2, 7 and 23)Receivables from related parties (Note 24)Notes and accounts receivableAllowance for doubtful receivables (Notes 2 and 8)Allowance for sales returns and others (Notes 2 and 8)Other receivables from related parties (Note 24)Other financial assets (Note 25)Inventories (Notes 2, 3 and 9)Deferred income tax assets (Notes 2 and 17)Prepaid expenses and other current assets
Total current assets
LONG-TERM INVESTMENTS (Notes 2, 6, 7, 10, 11 and 23)Investments accounted for using equity methodAvailable-for-sale financial assetsHeld-to-maturity financial assetsFinancial assets carried at cost
Total long-term investments
PROPERTY, PLANT AND EQUIPMENT (Notes 2, 12 and 24)Cost
BuildingsMachinery and equipmentOffice equipment
Accumulated depreciationAdvance payments and construction in progress
Net property, plant and equipment
INTANGIBLE ASSETSGoodwill (Note 2)Deferred charges, net (Notes 2 and 13)
Total intangible assets
OTHER ASSETSDeferred income tax assets (Notes 2 and 17)Refundable depositsOthers (Note 2)
Total other assets
TOTAL
$ 117,043,543181,743
9,944,84322,541,77319,884,520
(431,000)(8,583,632)
246,0031,104,072
18,830,2164,063,4101,006,046
185,831,537
104,660,0981,046,672
12,219,055501,988
118,427,813
124,522,047713,426,12610,781,099
848,729,272(627,764,323)
33,786,577
254,751,526
1,567,7565,891,685
7,459,441
7,763,6432,698,116
494,546
10,956,305
$ 577,426,622
20-243-
(1)--31-
32
1812-
21
22123
2147
(109)6
44
-1
1
11-
2
100
$ 138,208,36042,460
5,881,99911,728,20411,441,176
(436,746)(5,868,582)
489,742711,755
12,807,9363,650,7001,192,475
179,849,479
109,871,1782,032,658
11,761,325519,502
124,184,663
114,014,588635,008,261
9,748,869758,771,718
(557,247,254)17,758,038
219,282,502
1,567,7566,401,461
7,969,217
6,497,9722,719,737
55,677
9,273,386
$ 540,559,247
26-122-
(1)--21-
33
2012-
23
21118
2141
(103)3
41
-1
1
11-
2
100
CURRENT LIABILITIESFinancial liabilities at fair value through profit or loss (Notes 2, 5 and 23)Accounts payablePayables to related parties (Note 24)Income tax payable (Notes 2 and 17)Salary and bonus payableAccrued profit sharing to employees and bonus to directors (Notes 2, 3 and 19)Payables to contractors and equipment suppliersAccrued expenses and other current liabilities (Notes 15 and 23)Current portion of bonds payable (Notes 14 and 23)
Total current liabilities
LONG-TERM LIABILITIESBonds payable (Notes 14 and 23)Other long-term payables (Notes 15 and 23)
Total long-term liabilities
OTHER LIABILITIESAccrued pension cost (Notes 2 and 16)Guarantee deposits (Note 27)Deferred credits (Notes 2 and 24)
Total other liabilities
Total liabilities
CAPITAL STOCK - NT$10 PAR VALUE (Notes 19 and 21)Authorized: 28,050,000 thousand sharesIssued: 25,902,706 thousand shares in 2009 25,625,437 thousand shares in 2008
CAPITAL SURPLUS (Notes 2 and 19)
RETAINED EARNINGS (Note 19)Appropriated as legal capital reserveAppropriated as special capital reserveUnappropriated earnings
OTHERS (Notes 2, 21 and 23)Cumulative translation adjustmentsUnrealized gain/loss on financial instruments
Total shareholders’ equity
TOTAL
$ -9,678,8492,039,3428,761,1208,677,2996,771,338
28,756,8847,886,263
-
72,571,095
4,500,000416,390
4,916,390
3,807,1761,001,376
47,873
4,856,425
82,343,910
259,027,066
55,486,010
77,317,710-
104,564,972
181,882,682
(1,766,667)453,621
(1,313,046)
495,082,712
$ 577,426,622
-2-21151-
12
1-
1
1--
1
14
45
10
13 -
18
31
--
-
86
100
$ 83,6184,314,2651,202,3509,222,8111,601,897
15,148,0577,574,8915,951,5788,000,000
53,099,467
4,500,000931,252
5,431,252
3,710,0091,479,152
462,256
5,651,417
64,182,136
256,254,373
49,875,255
67,324,393391,857
102,337,417
170,053,667
481,158(287,342)
193,816
476,377,111
$ 540,559,247
-1-2-3112
10
1-
1
1--
1
12
47
9
13-
19
32
--
-
88
100
Taiwan Semiconductor Manufacturing Company Limited
BALANCE SHEETSDECEMBER 31, 2009 AND 2008(In Thousands of New Taiwan Dollars, Except Par Value)
The accompanying notes are an integral part of the financial statements.(With Deloitte & Touche audit report dated January 22, 2010)

9
Taiwan Semiconductor Manufacturing Company Limited
STATEMENTS OF INCOMEFOR THE YEARS ENDED DECEMBER 31, 2009 AND 2008(In Thousands of New Taiwan Dollars, Except Earnings Per Share)
2009 2008
Amount % Amount %
GROSS SALES (Notes 2 and 24)
SALES RETURNS AND ALLOWANCES (Notes 2 and 8)
NET SALES
COST OF SALES (Notes 3, 9, 18 and 24)
GROSS PROFIT
REALIZED (UNREALIZED) GROSS PROFIT FROM AFFILIATES (Note 2)
REALIZED GROSS PROFIT
OPERATING EXPENSES (Notes 18 and 24)Research and developmentGeneral and administrativeMarketing
Total operating expenses
INCOME FROM OPERATIONS
NON-OPERATING INCOME AND GAINSSettlement income (Note 27)Interest income (Note 2)Valuation gain on financial instruments, net (Notes 2, 5 and 23)Technical service income (Notes 24 and 27)Ga in on settlement and disposal of financial assets, net (Notes 2 and
23)Foreign exchange gain, net (Note 2)Equity in earnings of equity method investees, net (Notes 2 and 10)Others (Notes 2 and 24)
Total non-operating income and gains
$ 299,471,214
13,728,346
285,742,868
159,106,619
126,636,249
(160,279)
126,475,970
19,688,03210,238,1312,027,454
31,953,617
94,522,353
1,464,9151,117,374
587,151375,118
53,364--
523,587
4,121,509
100
56
44
-
44
731
11
33
1---
----
1
$ 330,228,027
8,460,944
321,767,083
183,589,540
138,177,543
72
138,177,615
19,737,0389,895,6172,254,728
31,887,383
106,290,232
951,1802,728,892
-619,237
452,1591,113,406
72,568788,183
6,725,625
100
57
43
-
43
631
10
33
-1--
-1--
2
(Continued)
2009 2008
Amount % Amount %
NON-OPERATING EXPENSES AND LOSSESEquity in losses of equity method investees, net (Notes 2 and 10)Foreign exchange loss, net (Note 2)Interest expenseValuation loss on financial instruments, net (Notes 2, 5 and 23)Impairment of financial assets (Notes 2 and 11)Loss on idle assets (Note 2)Others (Note 2)
Total non-operating expenses and losses
INCOME BEFORE INCOME TAX
INCOME TAX EXPENSE (Notes 2 and 17)
NET INCOME
$ 2,695,720630,455142,026
---
194,639
3,662,840
94,981,022
5,763,186
$ 89,217,836
1------
1
33
2
31
$ --
355,0561,230,966
247,488210,477213,052
2,257,039
110,758,818
10,825,650
$ 99,933,168
---1---
1
34
3
31
2009 2008
BeforeIncome Tax
AfterIncome Tax
BeforeIncome Tax
AfterIncome Tax
EARNINGS PER SHARE (NT$, Note 22)Basic earnings per shareDiluted earnings per share
$ 3.68$ 3.67
$ 3.45$ 3.44
$ 4.25$ 4.22
$ 3.84$ 3.81
Certain pro forma information (after income tax) is shown as follows, based on the assumption that the Company’s stock held by subsidiaries is treated as available-for-sale financial assets instead of treasury stock for the year ended December 31, 2008 (Notes 2 and 21):
2008
NET INCOME
EARNINGS PER SHARE (NT$)Basic earnings per shareDiluted earnings per share
$ 100,035,447
$ 3.84$ 3.81
The accompanying notes are an integral part of the financial statements.(With Deloitte & Touche audit report dated January 22, 2010)
(Concluded)

10
Capital Stock - Common Stock
Capital Surplus
Retained Earnings Others
TotalShareholders’
EquityShares
(In Thousands)Amount
Legal CapitalReserve
Special CapitalReserve
UnappropriatedEarnings
TotalCumulativeTranslation
Adjustments
Unrealized Gain (Loss)
on Financial Instruments
Treasury Stock
BALANCE, JANUARY 1, 2008
Appropriations of prior year’s earningsLegal capital reserveReversal of special capital reserveProfit sharing to employees - in cashProfit sharing to employees - in stockCash dividends to shareholders - NT$3.00 per shareStock dividends to shareholders - NT$0.02 per shareBonus to directors
Capital surplus transferred to capital stockNet income in 2008Ad justment arising from changes in percentage of ownership in
equity method investeesTranslation adjustmentsIssuance of stock from exercising stock optionsCash dividends received by subsidiaries from the CompanyValuation loss on available-for-sale financial assetsNe t change in unrealized gain (loss) on financial instruments from
equity method investeesTreasury stock repurchasedTreasury stock retired
BALANCE, DECEMBER 31, 2008
Appropriations of prior year’s earningsLegal capital reserveReversal of special capital reserveCash dividends to shareholders - NT$3.00 per shareStock dividends to shareholders - NT$0.02 per share
Profit sharing to employees - in stockCapital surplus transferred to capital stockNet income in 2009Ad justment arising from changes in percentage of ownership in
equity method investeesTranslation adjustmentsIssuance of stock from exercising stock optionsValuation gain on available-for-sale financial assetsNe t change in unrealized gain (loss) on financial instruments from
equity method investees
BALANCE, DECEMBER 31, 2009
26,427,104
---
393,988-
51,254-
76,881-
--
6,027--
--
(1,329,817)
25,625,437
---
51,251141,87076,876
-
--
7,272-
-
25,902,706
$ 264,271,037
---
3,939,883-
512,542-
768,813-
--
60,266--
--
(13,298,168)
256,254,373
---
512,5091,418,699
768,763-
--
72,722-
-
$ 259,027,066
$ 53,732,682
-------
(768,813)-
(137,063)-
166,884102,279
-
--
(3,220,714)
49,875,255
----
6,076,289(768,763)
-
115,418-
187,811-
-
$ 55,486,010
$ 56,406,684
10,917,709--------
-----
---
67,324,393
9,993,317------
----
-
$ 77,317,710
$ 629,550
-(237,693)
-------
-----
---
391,857
-(391,857)
-----
----
-
$ -
$ 161,828,337
(10,917,709)237,693
(3,939,883)(3,939,883)
(76,881,311)(512,542)(176,890)
-99,933,168
-----
--
(63,293,563)
102,337,417
(9,993,317)391,857
(76,876,312)(512,509)
--
89,217,836
----
-
$ 104,564,972
$ 218,864,571
--
(3,939,883)(3,939,883)
(76,881,311)(512,542)(176,890)
-99,933,168
-----
--
(63,293,563)
170,053,667
--
(76,876,312)(512,509)
--
89,217,836
----
-
$ 181,882,682
$ (1,072,853)
---------
-1,554,011
---
---
481,158
-------
-(2,247,825)
--
-
$ (1,766,667)
$ 680,997
---------
----
(233,915)
(734,424)--
(287,342)
-------
---
14,014
726,949
$ 453,621
$ (49,385,032)
---------
-----
-(30,427,413)
79,812,445
-
-------
----
-
$ -
$ 487,091,402
--
(3,939,883)-
(76,881,311)-
(176,890)-
99,933,168
(137,063)1,554,011
227,150102,279
(233,915)
(734,424)(30,427,413)
-
476,377,111
--
(76,876,312)-
7,494,988-
89,217,836
115,418(2,247,825)
260,53314,014
726,949
$ 495,082,712
Taiwan Semiconductor Manufacturing Company Limited
STATEMENTS OF CHANGES IN SHAREHOLDERS’ EQUITYFOR THE YEARS ENDED DECEMBER 31, 2009 AND 2008(In Thousands of New Taiwan Dollars, Except Dividends Per Share)
Note: Profit sharing to employees and bonus to directors in the amount of NT$6,771,338 thousand and NT$15,148,057 thousand, respectively, had been charged against earnings of 2009 and 2008.The accompanying notes are an integral part of the financial statements.(With Deloitte & Touche audit report dated January 22, 2010)
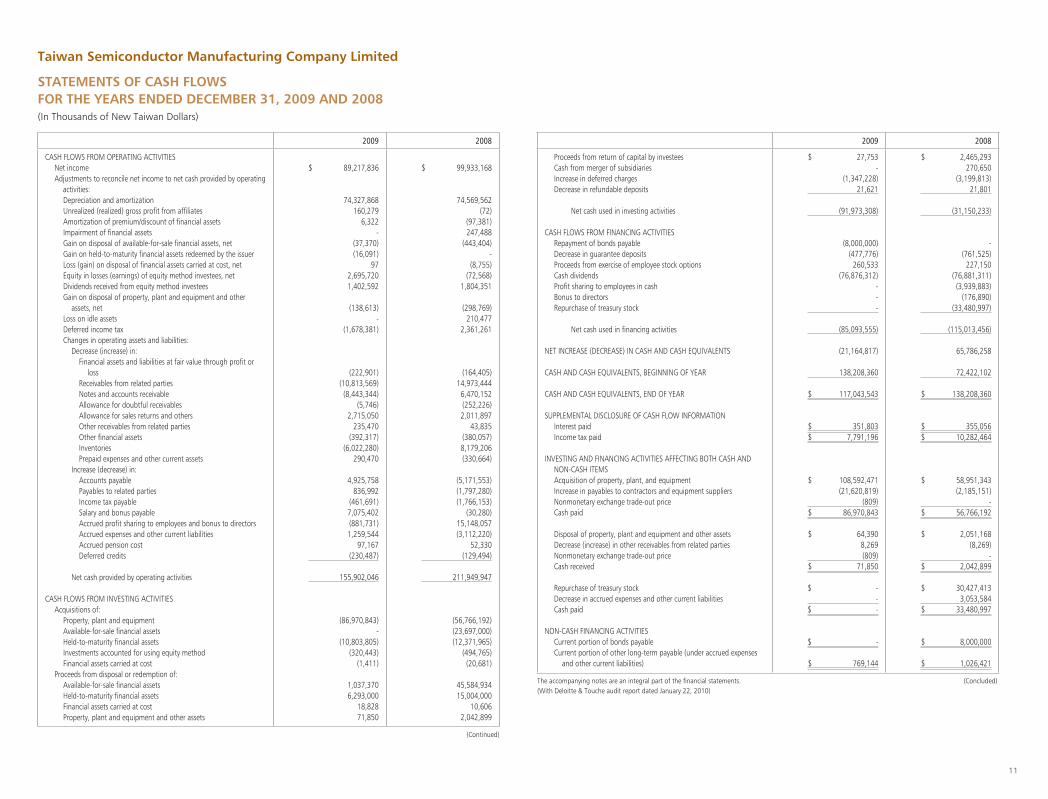
11
Taiwan Semiconductor Manufacturing Company Limited
STATEMENTS OF CASH FLOWSFOR THE YEARS ENDED DECEMBER 31, 2009 AND 2008(In Thousands of New Taiwan Dollars)
2009 2008
CASH FLOWS FROM OPERATING ACTIVITIESNet incomeAd justments to reconcile net income to net cash provided by operating
activities:Depreciation and amortizationUnrealized (realized) gross profit from affiliatesAmortization of premium/discount of financial assetsImpairment of financial assetsGain on disposal of available-for-sale financial assets, netGain on held-to-maturity financial assets redeemed by the issuerLoss (gain) on disposal of financial assets carried at cost, netEquity in losses (earnings) of equity method investees, netDividends received from equity method investeesGa in on disposal of property, plant and equipment and other
assets, netLoss on idle assetsDeferred income taxChanges in operating assets and liabilities:
Decrease (increase) in:Fin ancial assets and liabilities at fair value through profit or
lossReceivables from related partiesNotes and accounts receivableAllowance for doubtful receivablesAllowance for sales returns and othersOther receivables from related partiesOther financial assetsInventoriesPrepaid expenses and other current assets
Increase (decrease) in:Accounts payablePayables to related partiesIncome tax payableSalary and bonus payableAccrued profit sharing to employees and bonus to directorsAccrued expenses and other current liabilitiesAccrued pension costDeferred credits
Net cash provided by operating activities
CASH FLOWS FROM INVESTING ACTIVITIESAcquisitions of:
Property, plant and equipmentAvailable-for-sale financial assetsHeld-to-maturity financial assetsInvestments accounted for using equity methodFinancial assets carried at cost
Proceeds from disposal or redemption of:Available-for-sale financial assetsHeld-to-maturity financial assetsFinancial assets carried at costProperty, plant and equipment and other assets
$ 89,217,836
74,327,868160,279
6,322-
(37,370)(16,091)
972,695,7201,402,592
(138,613)-
(1,678,381)
(222,901)(10,813,569)(8,443,344)
(5,746)2,715,050
235,470(392,317)
(6,022,280)290,470
4,925,758836,992
(461,691)7,075,402(881,731)1,259,544
97,167(230,487)
155,902,046
(86,970,843)-
(10,803,805)(320,443)
(1,411)
1,037,3706,293,000
18,82871,850
$ 99,933,168
74,569,562(72)
(97,381)247,488
(443,404)-
(8,755)(72,568)
1,804,351
(298,769)210,477
2,361,261
(164,405)14,973,4446,470,152(252,226)2,011,897
43,835(380,057)8,179,206(330,664)
(5,171,553)(1,797,280)(1,766,153)
(30,280)15,148,057(3,112,220)
52,330(129,494)
211,949,947
(56,766,192)(23,697,000)(12,371,965)
(494,765)(20,681)
45,584,93415,004,000
10,6062,042,899
2009 2008
Proceeds from return of capital by investeesCash from merger of subsidiariesIncrease in deferred chargesDecrease in refundable deposits
Net cash used in investing activities
CASH FLOWS FROM FINANCING ACTIVITIESRepayment of bonds payableDecrease in guarantee depositsProceeds from exercise of employee stock optionsCash dividendsProfit sharing to employees in cashBonus to directorsRepurchase of treasury stock
Net cash used in financing activities
NET INCREASE (DECREASE) IN CASH AND CASH EQUIVALENTS
CASH AND CASH EQUIVALENTS, BEGINNING OF YEAR
CASH AND CASH EQUIVALENTS, END OF YEAR
SUPPLEMENTAL DISCLOSURE OF CASH FLOW INFORMATIONInterest paidIncome tax paid
INVESTING AND FINANCING ACTIVITIES AFFECTING BOTH CASH AND NON-CASH ITEMSAcquisition of property, plant, and equipmentIncrease in payables to contractors and equipment suppliersNonmonetary exchange trade-out priceCash paid
Disposal of property, plant and equipment and other assetsDecrease (increase) in other receivables from related partiesNonmonetary exchange trade-out priceCash received
Repurchase of treasury stockDecrease in accrued expenses and other current liabilitiesCash paid
NON-CASH FINANCING ACTIVITIESCurrent portion of bonds payableCu rrent portion of other long-term payable (under accrued expenses
and other current liabilities)
$ 27,753-
(1,347,228)21,621
(91,973,308)
(8,000,000)(477,776)
260,533(76,876,312)
---
(85,093,555)
(21,164,817)
138,208,360
$ 117,043,543
$ 351,803$ 7,791,196
$ 108,592,471(21,620,819)
(809)$ 86,970,843
$ 64,3908,269(809)
$ 71,850
$ --
$ -
$ -
$ 769,144
$ 2,465,293270,650
(3,199,813)21,801
(31,150,233)
-(761,525)
227,150(76,881,311)(3,939,883)
(176,890)(33,480,997)
(115,013,456)
65,786,258
72,422,102
$ 138,208,360
$ 355,056$ 10,282,464
$ 58,951,343(2,185,151)
-$ 56,766,192
$ 2,051,168(8,269)
-$ 2,042,899
$ 30,427,4133,053,584
$ 33,480,997
$ 8,000,000
$ 1,026,421
(Continued)
The accompanying notes are an integral part of the financial statements. (Concluded)(With Deloitte & Touche audit report dated January 22, 2010)

12
Taiwan Semiconductor Manufacturing Company Limited
NOTES TO FINANCIAL STATEMENTSFOR THE YEARS ENDED DECEMBER 31, 2009 AND 2008(Amounts in Thousands of New Taiwan Dollars, Unless Specified Otherwise)
1. GENERAL
Taiwan Semiconductor Manufacturing Company Limited (the “Company” or “TSMC”), a Republic of China (R.O.C.) corporation, was incorporated on February 21, 1987. The Company is a dedicated foundry in the semiconductor industry which engages mainly in the manufacturing, selling, packaging, testing and computer-aided designing of integrated circuits and other semiconductor devices and the manufacturing of masks. On September 5, 1994, its shares were listed on the Taiwan Stock Exchange (TSE). On October 8, 1997, TSMC listed some of its shares of stock on the New York Stock Exchange (NYSE) in the form of American Depositary Shares (ADSs).
As of December 31, 2009 and 2008, the Company had 22,292 and 20,425 employees, respectively.
2. SUMMARY OF SIGNIFICANT ACCOUNTING POLICIES
The financial statements are presented in conformity with the Guidelines Governing the Preparation of Financial Reports by Securities Issuers, Business Accounting Law, Guidelines Governing Business Accounting, and accounting principles generally accepted in the R.O.C.
For the convenience of readers, the accompanying financial statements have been translated into English from the original Chinese version prepared and used in the R.O.C. If there is any conflict between the English version and the original Chinese version or any difference in the interpretation of the two versions, the Chinese-language financial statements shall prevail.
Significant accounting policies are summarized as follows:
Use of EstimatesThe preparation of financial statements in conformity with the aforementioned guidelines, law and principles requires management to make reasonable assumptions and estimates of matters that are inherently uncertain. The actual results may differ from management’s estimates.
Classification of Current and Noncurrent Assets and LiabilitiesCurrent assets are assets held for trading purposes and assets expected to be converted to cash, sold or consumed within one year from the balance sheet date. Current liabilities are obligations incurred for trading purposes and obligations expected to be settled within one year from the balance sheet date. Assets and liabilities that are not classified as current are noncurrent assets and liabilities, respectively.
Cash EquivalentsRepurchase agreements collateralized by government bonds acquired with maturities of less than three months from the date of purchase are classified as cash equivalents. The carrying amount approximates fair value.
Financial Assets/Liabilities at Fair Value Through Profit or LossDerivatives that do not meet the criteria for hedge accounting are initially recognized at fair value, with transaction costs expensed as incurred. The derivatives are remeasured at fair value subsequently with changes in fair value recognized in earnings. A regular way purchase or sale of financial assets is accounted for using settlement date accounting.
Fair value is estimated using valuation techniques incorporating estimates and assumptions that are consistent with prevailing market conditions. When the fair value is positive, the derivative is recognized as a financial asset; when the fair value is negative, the derivative is recognized as a financial liability.
Available-for-sale Financial AssetsAvailable-for-sale financial assets are initially recognized at fair value plus transaction costs that are directly attributable to the acquisition. Changes in fair value from subsequent remeasurement are reported as a separate component of shareholders’ equity. The corresponding accumulated gains or losses are recognized in earnings when the financial asset is derecognized from the balance sheet. A regular way purchase or sale of financial assets is accounted for using settlement date accounting.
The fair value of debt securities is determined using the average of bid and asked prices at the end of the year.
Any difference between the initial carrying amount of a debt security and the amount due at maturity is amortized using the effective interest method, with the amortization recognized in earnings.
If there is objective evidence which indicates that a financial asset is impaired, a loss is recognized. If, in a subsequent period, the amount of the impairment loss decreases, for equity securities, the previously recognized impairment loss is reversed to the extent of the decrease and recorded as an adjustment to shareholders’ equity; for debt securities, the amount of the decrease is recognized in earnings, provided that the decrease is clearly attributable to an event which occurred after the impairment loss was recognized.
Held-to-maturity Financial AssetsDebt securities for which the Company has a positive intention and ability to hold to maturity are categorized as held-to-maturity financial assets and are carried at amortized cost. Those financial assets are initially recognized at fair value plus transaction costs that are directly attributable to the acquisition. Gains or losses are recognized at the time of derecognition, impairment or amortization. A regular way purchase or sale of financial assets is accounted for using settlement date accounting.
If there is objective evidence which indicates that a financial asset is impaired, a loss is recognized. If, in a subsequent period, the amount of the impairment loss decreases and the decrease is clearly attributable to an event which occurred after the impairment loss was recognized, the previously recognized impairment loss is reversed to the extent of the decrease. The reversal may not result in a carrying amount that exceeds the amortized cost that would have been determined as if no impairment loss had been recognized.
Allowance for Doubtful ReceivablesAn allowance for doubtful receivables is provided based on a review of the collectability of receivables. The Company determines the amount of the allowance for doubtful receivables with a charge of 1% of the amount of outstanding receivables considering the account aging analysis and current trends in the credit quality of its customers.
13
Revenue Recognition and Allowance for Sales Returns and OthersThe Company recognizes revenue when evidence of an arrangement exists, the rewards of ownership and significant risk of the goods has been transferred to the buyer, price is fixed or determinable, and collectability is reasonably assured. Provisions for estimated sales returns and others are recorded in the year the related revenue is recognized, based on historical experience, management’s judgment, and any known factors that would significantly affect the allowance.
Sales prices are determined using fair value taking into account related sales discounts agreed to by the Company and its customers. Sales agreements typically provide that payment is due 30 days from invoice date for a majority of the customers and 30 to 45 days after the end of the month in which sales occur for some customers. Since the receivables from sales are collectible within one year and such transactions are frequent, fair value of the receivables is equivalent to the nominal amount of the cash to be received.
InventoriesInventories are recorded at standard cost and adjusted to approximate weighted-average cost on the balance sheet date.
Prior to January 1, 2009, inventories were stated at the lower of cost or market value. Any write-down was made on a total-inventory basis. Market value represented replacement cost for raw materials, supplies and spare parts and net realizable value for work in process and finished goods.
As stated in Note 3, effective January 1, 2009, inventories are stated at the lower of cost or net realizable value. Inventory write-downs are made on an item-by-item basis, except where it may be appropriate to group similar or related items. Net realizable value is the estimated selling price of inventories less all estimated costs of completion and necessary selling costs.
Investments Accounted for Using Equity MethodInvestments in companies wherein the Company exercises significant influence over the operating and financial policy decisions are accounted for using the equity method. The Company’s share of the net income or net loss of an investee is recognized in the “equity in earnings/losses of equity method investees, net” account. The cost of an investment shall be analyzed and the cost of investment in excess of the fair value of identifiable net assets acquired, representing goodwill, shall not be amortized. If the fair value of identifiable net assets acquired exceeds the cost of investment, the excess shall be proportionately allocated as reductions to fair values of non-current assets (except for financial assets other than investments accounted for using the equity method and deferred income tax assets). When an indication of impairment is identified, the carrying amount of the investment is reduced, with the related impairment loss recognized in earnings.
When the Company subscribes for additional investee’s shares at a percentage different from its existing ownership percentage, the resulting carrying amount of the investment in the investee differs from the amount of the Company’s share of the investee’s equity. The Company records such a difference as an adjustment to long-term investments with the corresponding amount charged or credited to capital surplus.
Gains or losses on sales from the Company to equity method investees are deferred in proportion to the Company’s ownership percentages in the investees until such gains or losses are realized through transactions with third parties. The entire amount of the gains or losses on sales to investees over which the
Company has a controlling interest is deferred until such gains or losses are realized through subsequent sales of the related products to third parties. Gains or losses on sales from equity method investees to the Company are deferred in proportion to the Company’s ownership percentages in the investees until they are realized through transactions with third parties. Gains or losses on sales between equity method investees over each of which the Company has control are deferred in proportion to the Company’s weighted-average ownership percentage in the investee which records gains or losses. In transactions between equity method investees over either or both of which the Company has no control, gains or losses on sales are deferred in proportion to the multiplication of the Company’s weighted-average ownership percentages in the investees. Such gains or losses are recorded until they are realized through transactions with third parties.
If an investee’s functional currency is a foreign currency, differences will result from the translation of the investee’s financial statements into the reporting currency of the Company. Such differences are charged or credited to cumulative translation adjustments, a separate component of shareholders’ equity.
Financial Assets Carried at CostInvestments for which the Company does not exercise significant influence and that do not have a quoted market price in an active market and whose fair value cannot be reliably measured, such as non-publicly traded stocks and mutual funds, are carried at their original cost. The costs of non-publicly traded stocks and mutual funds are determined using the weighted-average method. If there is objective evidence which indicates that a financial asset is impaired, a loss is recognized. A subsequent reversal of such impairment loss is not allowed.
Cash dividends are recognized as investment income upon resolution of shareholders of an investee but are accounted for as a reduction to the original cost of investment if such dividends are declared on the earnings of the investee attributable to the period prior to the purchase of the investment. Stock dividends are recorded as an increase in the number of shares held and do not affect investment income. The cost per share is recalculated based on the new total number of shares.
Property, Plant and Equipment, Assets Leased to Others and Idle AssetsProperty, plant and equipment and assets leased to others are stated at cost less accumulated depreciation. When an indication of impairment is identified, any excess of the carrying amount of an asset over its recoverable amount is recognized as a loss. If the recoverable amount increases in a subsequent period, the amount previously recognized as impairment would be reversed and recognized as a gain. However, the adjusted amount may not exceed the carrying amount that would have been determined, net of depreciation, as if no impairment loss had been recognized. Significant additions, renewals and betterments incurred during the construction period are capitalized. Maintenance and repairs are expensed as incurred.
Depreciation is computed using the straight-line method over the following estimated service lives: buildings - 10 to 20 years; machinery and equipment - 5 years; and office equipment - 3 to 5 years.
Upon sale or disposal of property, plant and equipment and assets leased to others, the related cost and accumulated depreciation are deducted from the corresponding accounts, with any gain or loss recorded as non-operating gains or losses in the year of sale or disposal.
When property, plant and equipment are determined to be idle or useless, they are transferred to idle assets at the lower of the net realizable value or carrying amount. Depreciation on the idle assets is provided
14
continuously, and the idle assets are tested for impairment on a periodical basis.
Intangible AssetsGoodwill represents the excess of the consideration paid for acquisition over the fair value of identifiable net assets acquired. Goodwill is no longer amortized and instead is tested for impairment annually. If an event occurs or circumstances change which indicate that the fair value of goodwill is more likely than not below its carrying amount, an impairment loss is recognized. A subsequent reversal of such impairment loss is not allowed.
Deferred charges consist of technology license fees, software and system design costs and other charges. The amounts are amortized over the following periods: Technology license fees - the shorter of the estimated life of the technology or the term of the technology transfer contract; software and system design costs and other charges - 3 years. When an indication of impairment is identified, any excess of the carrying amount of an asset over its recoverable amount is recognized as a loss. If the recoverable amount increases in a subsequent period, the previously recognized impairment loss would be reversed and recognized as a gain. However, the adjusted amount may not exceed the carrying amount that would have been determined, net of amortization, as if no impairment loss had been recognized.
Expenditures related to research activities and those related to development activities that do not meet the criteria for capitalization are charged to expenses when incurred.
Pension CostsFor employees who participate in defined contribution pension plans, pension costs are recorded based on the actual contributions made to employees’ individual pension accounts during their service periods. For employees who participate in defined benefit pension plans, pension costs are recorded based on actuarial calculations.
Income TaxThe Company applies an inter-period allocation for its income tax whereby deferred income tax assets and liabilities are recognized for the tax effects of temporary differences and unused tax credits. Valuation allowances are provided to the extent, if any, that it is more likely than not that deferred income tax assets will not be realized. A deferred tax asset or liability is classified as current or noncurrent in accordance with the classification of its related asset or liability. However, if a deferred tax asset or liability does not relate to an asset or liability in the financial statements, then it is classified as either current or noncurrent based on the expected length of time before it is realized or settled.
Any tax credits arising from purchases of machinery, equipment and technology, research and development expenditures, personnel training expenditures, and investments in important technology-based enterprises are recognized using the flow-through method.
Adjustments of prior years’ tax liabilities are added to or deducted from the current year’s tax provision.
Income tax on unappropriated earnings at a rate of 10% is expensed in the year of shareholder approval which is the year subsequent to the year the earnings are generated.
Stock-based CompensationEmployee stock options that were granted or modified in the period from January 1, 2004 to December 31, 2007 are accounted for by the interpretations issued by the Accounting Research and Development Foundation of the Republic of China. The Company adopted the intrinsic value method and any compensation cost determined using this method is recognized in earnings over the employee vesting period. Employee stock option plans that were granted or modified after December 31, 2007 are accounted for using fair value method in accordance with Statement of Financial Accounting Standards No. 39, “Accounting for Share-based Payment”. The Company did not grant or modify any employee stock options since January 1, 2008.
Profit Sharing to Employees and Bonus to DirectorsEffective January 1, 2008, the Company adopted Interpretation 2007-052, “Accounting for Bonuses to Employees, Directors and Supervisors”, which requires companies to record profit sharing to employees and bonus to directors as an expense rather than as an appropriation of earnings.
Treasury StockTreasury stock is stated at cost and shown as a deduction in shareholders’ equity. When the Company retires treasury stock, the treasury stock account is reduced and the common stock as well as the capital surplus - additional paid-in capital are reversed on a pro rata basis. When the book value of the treasury stock exceeds the sum of the par value and additional paid-in capital, the difference is charged to capital surplus - treasury stock transactions and to retained earnings for any remaining amount.
The Company’s stock held by its subsidiaries is treated as treasury stock and reclassified from investments accounted for using equity method to treasury stock. The gains resulted from disposal of the treasury stock held by subsidiaries and cash dividends received by subsidiaries from the Company are recorded under capital surplus - treasury stock transactions.
Foreign-currency TransactionsForeign-currency transactions other than derivative contracts are recorded in New Taiwan dollars at the rates of exchange in effect when the transactions occur. Exchange gains or losses derived from foreign-currency transactions or monetary assets and liabilities denominated in foreign currencies are recognized in earnings.
At the balance sheet date, monetary assets and liabilities denominated in foreign currencies are revalued at prevailing exchange rates with the resulting gains or losses recognized in earnings.
3. ACCOUNTING CHANGES
Effective January 1, 2009, the Company adopted the newly revised Statement of Financial Accounting Standards (SFAS) No. 10, “Accounting for Inventories”. The main revisions are (1) inventories are stated at the lower of cost or net realizable value, and inventories are written down to net realizable value on an item-by-item basis except when the grouping of similar or related items is appropriate; (2) unallocated overheads are recognized as expenses in the year in which they are incurred; and (3) abnormal cost, write-downs of inventories and any reversal of write-downs are recorded as cost of sales for the year. Such changes in accounting principle did not have significant effect on the Company’s financial statements for the year ended December 31, 2009.

15
Effective January 1, 2008, the Company adopted Interpretation 2007-052, “Accounting for Bonuses to Employees, Directors and Supervisors”, issued in March 2007 by the ARDF, which requires companies to record profit sharing to employees and bonus to directors and supervisors as an expense rather than as an appropriation of earnings. The adoption of this interpretation resulted in a decrease in net income and earnings per share (after income tax and retroactively adjusted for the issuance of stock dividend) of NT$12,627,332 thousand and NT$0.48, respectively, for the year ended December 31, 2008.
Effective January 1, 2008, the Company adopted SFAS No. 39, “Accounting for Share-based Payment”, which requires companies to record share-based payment transactions in the financial statements at fair value. Such a change in accounting principle did not have any effect on the Company’s financial statements as of and for the year ended December 31, 2008.
4. CASH AND CASH EQUIVALENTS
December 31
2009 2008
Cash and deposits in banksRepurchase agreements collateralized by government bonds
$ 114,023,3073,020,236
$ 117,043,543
$ 129,538,0478,670,313
$ 138,208,360
5. FINANCIAL ASSETS AND LIABILITIES AT FAIR VALUE THROUGH PROFIT OR LOSS
December 31
2009 2008
Trading financial assets
Forward exchange contractsCross currency swap contracts
Trading financial liabilities
Forward exchange contractsCross currency swap contracts
$ -181,743
$ 181,743
$ --
$ -
$ 28,41114,049
$ 42,460
$ 34,24349,375
$ 83,618
The Company entered into derivative contracts during the years ended December 31, 2009 and 2008 to manage exposures due to fluctuations of foreign exchange rates. The derivative contracts entered into by the Company did not meet the criteria for hedge accounting. Therefore, the Company did not apply hedge accounting treatment for its derivative contracts.
Maturity Date Contract Amount (In Thousands)
December 31, 2008
Sell US$/Buy NT$Sell EUR/Buy NT$
January 2009 to February 2009January 2009
US$135,000/NT$4,430,925EUR1,500/NT$63,150
Outstanding cross currency swap contracts consisted of the following:
Maturity DateContract Amount
(In Thousands)Range of
Interest Rates PaidRange of
Interest Rates Received
December 31, 2009
January 2010 to February 2010
December 31, 2008
January 2009
US$750,000/NT$24,201,706
US$307,000/NT$10,061,232
0.24% - 0.70%
0.54% - 5.00%
0.00% - 0.38%
0.00% - 3.83%
For the years ended December 31, 2009 and 2008, changes in fair value related to derivative financial instruments recognized in earnings was a net gain of NT$587,151 thousand and a net loss of NT$1,230,966 thousand, respectively.
6. AVAILABLE-FOR-SALE FINANCIAL ASSETS
7. HELD-TO- MATURITY FINANCIAL ASSETS
December 31
2009 2008
Corporate bonds $ 1,046,672 $ 2,032,658
Outstanding forward exchange contracts consisted of the following:
December 31
2009 2008
Corporate bondsStructured time depositsGovernment bonds
Current portion
$ 12,266,3117,000,0002,897,587
22,163,898(9,944,843)
$ 12,219,055
$ 16,136,752-
1,506,57217,643,324(5,881,999)
$ 11,761,325

16
8. ALLOWANCES FOR DOUBTFUL RECEIVABLES, SALES RETURNS AND OTHERS
Movements of the allowance for doubtful receivables were as follows:
Years Ended December 31
2009 2008
Balance, beginning of yearProvision Write-off
Balance, end of year
$ 436,746238,061
(243,807)
$ 431,000
$ 688,972-
(252,226)
$ 436,746
Movements of the allowance for sales returns and others were as follows:
Years Ended December 31
2009 2008
Balance, beginning of yearProvisionWrite-off
Balance, end of year
$ 5,868,58213,728,346
(11,013,296)
$ 8,583,632
$ 3,856,6858,460,944
(6,449,047)
$ 5,868,582
9. INVENTORIES
Write-down of inventories to net realizable value in the amount of NT$199,732 thousand and NT$879,434 thousand, respectively, were included in the cost of sales for the years ended December 31, 2009 and 2008.
December 31
2009 2008
Finished goodsWork in processRaw materialsSupplies and spare parts
$ 2,355,23214,230,3181,420,466
824,200
$ 18,830,216
$ 4,444,6577,117,049
716,870529,360
$ 12,807,936
10. INVESTMENTS ACCOUNTED FOR USING EQUITY METHOD
December 31
2009 2008
Carrying Amount
% of Ownership
Carrying Amount
% of Ownership
TSMC Global Ltd. (TSMC Global)TSMC Partners, Ltd. (TSMC Partners)Vanguard International Semiconductor Corporation (VIS)Systems on Silicon Manufacturing Company Pte Ltd. (SSMC)TSMC China Company Limited (TSMC China)TSMC North America Xintec Inc. (Xintec)VentureTech Alliance Fund III, L.P. (VTAF III)VentureTech Alliance Fund II, L.P. (VTAF II)Global UniChip Corporation (GUC)Emerging Alliance Fund, L.P. (Emerging Alliance)Ta iwan Semiconductor Manufacturing Company Europe B.V. (TSMC
Europe)TSMC Japan Limited (TSMC Japan)TSMC Korea Limited (TSMC Korea)TSMC International Investment Ltd. (TSMC International)
$ 45,397,25632,545,6199,365,2326,157,1412,961,0432,723,7271,475,0141,309,6151,122,810
983,126305,866
159,467135,66318,519
-
$ 104,660,098
1001003739
1001004198983599
100100100
-
$ 45,756,5193,730,9139,787,2756,808,1926,267,1282,435,6661,506,3841,305,605
975,367950,263433,481
124,594137,61715,117
29,637,057
$ 109,871,178
1001003739
1001004298983699
100100100100
The Company will subscribe through a private placement for new shares of Motech Industries Inc. (“Motech”) under a Share Subscription Agreement entered into on December 9, 2009. The total consideration is approximately NT$6.2 billion (US$193 million). After the subscription of shares, the Company will own 20% of the Motech shares. The transaction is still subject to Motech’s shareholders’ approval and regulatory approval.
TSMC Partners and TSMC International were both 100% owned subsidiaries of the Company. To simplify the organization structure of investment, TSMC Partners merged TSMC International in June 2009.
Chi Cherng and Hsin Ruey, both 100% owned subsidiaries of the Company, were engaged in investing activities. To simplify the organization structure of investment, the Company merged Chi Cherng and Hsin Ruey into the Company in the third quarter of 2008.
For the years ended December 31, 2009 and 2008, equity in earnings/losses of equity method investees was a net loss of NT$2,695,720 thousand and a net gain of NT$72,568 thousand, respectively. Related equity in earnings/losses of equity method investees were determined based on the audited financial statements, except those of TSMC Japan, TSMC Europe and TSMC Korea for the year ended December 31, 2009. The Company believes that, had TSMC Japan, TSMC Europe and TSMC Korea’s financial statements been audited, any adjustments arising would have had no material effect on the Company’s financial statements.
As of December 31, 2009 and 2008, fair values of publicly traded stocks in investments accounted for using equity method (VIS and GUC) were NT$18,027,990 thousand and NT$9,889,107 thousand, respectively.
Structured time deposits categorized as held-to-maturity financial assets consisted of the following:
Principal Amount Interest Receivable Range of Interest Rates Maturity Date
December 31, 2009
Callable domestic deposits $ 7,000,000 $ 4,308 0.36% - 0.95% Ju ly 2010 to August 2011
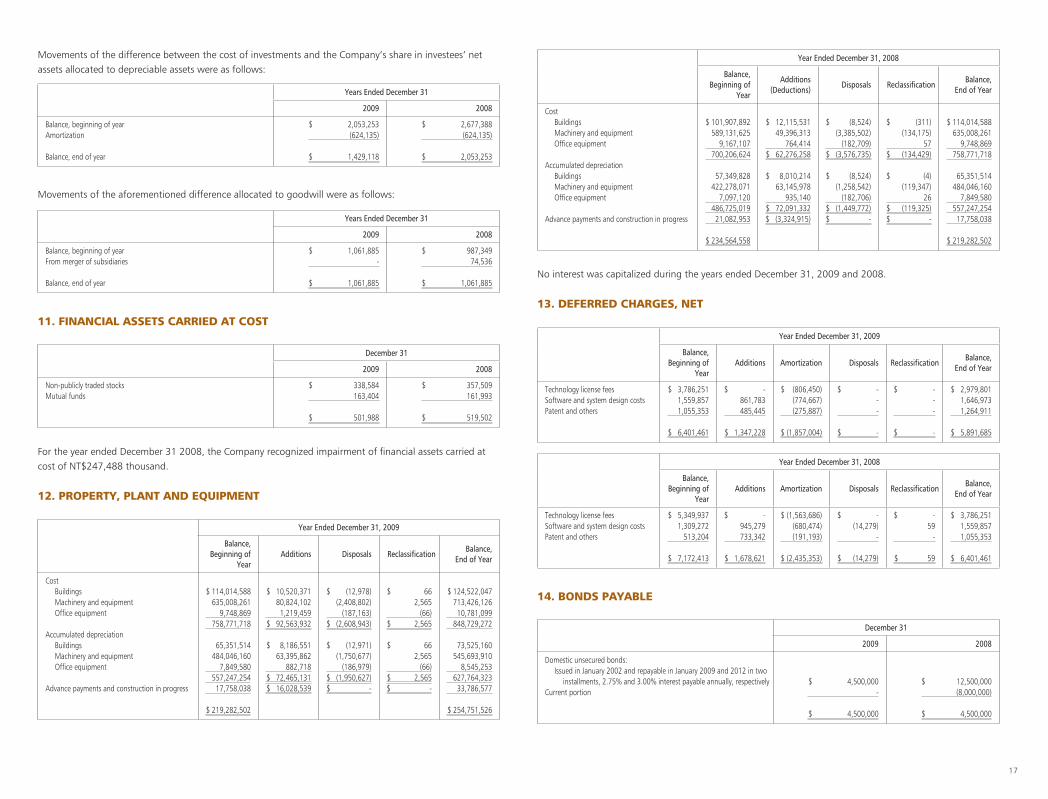
17
Movements of the difference between the cost of investments and the Company’s share in investees’ net assets allocated to depreciable assets were as follows:
Years Ended December 31
2009 2008
Balance, beginning of yearAmortization
Balance, end of year
$ 2,053,253(624,135)
$ 1,429,118
$ 2,677,388(624,135)
$ 2,053,253
Movements of the aforementioned difference allocated to goodwill were as follows:
Years Ended December 31
2009 2008
Balance, beginning of yearFrom merger of subsidiaries
Balance, end of year
$ 1,061,885-
$ 1,061,885
$ 987,34974,536
$ 1,061,885
11. FINANCIAL ASSETS CARRIED AT COST
December 31
2009 2008
Non-publicly traded stocksMutual funds
$ 338,584163,404
$ 501,988
$ 357,509161,993
$ 519,502
For the year ended December 31 2008, the Company recognized impairment of financial assets carried at cost of NT$247,488 thousand.
12. PROPERTY, PLANT AND EQUIPMENT
Year Ended December 31, 2009
Balance, Beginning of
YearAdditions Disposals Reclassification
Balance,End of Year
CostBuildingsMachinery and equipmentOffice equipment
Accumulated depreciationBuildingsMachinery and equipmentOffice equipment
Advance payments and construction in progress
$ 114,014,588635,008,261
9,748,869758,771,718
65,351,514484,046,160
7,849,580557,247,25417,758,038
$ 219,282,502
$ 10,520,37180,824,1021,219,459
$ 92,563,932
$ 8,186,55163,395,862
882,718$ 72,465,131$ 16,028,539
$ (12,978)(2,408,802)
(187,163)$ (2,608,943)
$ (12,971)(1,750,677)
(186,979)$ (1,950,627)$ -
$ 662,565
(66)$ 2,565
$ 662,565
(66)$ 2,565$ -
$ 124,522,047713,426,126 10,781,099
848,729,272
73,525,160545,693,910
8,545,253627,764,32333,786,577
$ 254,751,526
Year Ended December 31, 2008
Balance, Beginning of
Year
Additions(Deductions)
Disposals Reclassification Balance,
End of Year
CostBuildingsMachinery and equipmentOffice equipment
Accumulated depreciationBuildingsMachinery and equipmentOffice equipment
Advance payments and construction in progress
$ 101,907,892589,131,625
9,167,107700,206,624
57,349,828422,278,071
7,097,120486,725,01921,082,953
$ 234,564,558
$ 12,115,53149,396,313
764,414$ 62,276,258
$ 8,010,21463,145,978
935,140$ 72,091,332$ (3,324,915)
$ (8,524)(3,385,502)
(182,709)$ (3,576,735)
$ (8,524)(1,258,542)
(182,706)$ (1,449,772)$ -
$ (311)(134,175)
57$ (134,429)
$ (4)(119,347)
26$ (119,325)$ -
$ 114,014,588635,008,261
9,748,869758,771,718
65,351,514484,046,160
7,849,580557,247,25417,758,038
$ 219,282,502
No interest was capitalized during the years ended December 31, 2009 and 2008.
13. DEFERRED CHARGES, NET
Year Ended December 31, 2009
Balance,Beginning of
YearAdditions Amortization Disposals Reclassification
Balance,End of Year
Technology license feesSoftware and system design costsPatent and others
$ 3,786,2511,559,8571,055,353
$ 6,401,461
$ -861,783485,445
$ 1,347,228
$ (806,450)(774,667)(275,887)
$ (1,857,004)
$ ---
$ -
$ ---
$ -
$ 2,979,8011,646,9731,264,911
$ 5,891,685
Year Ended December 31, 2008
Balance,Beginning of
YearAdditions Amortization Disposals Reclassification
Balance,End of Year
Technology license feesSoftware and system design costsPatent and others
$ 5,349,9371,309,272
513,204
$ 7,172,413
$ -945,279733,342
$ 1,678,621
$ (1,563,686)(680,474)(191,193)
$ (2,435,353)
$ -(14,279)
-
$ (14,279)
$ -59
-
$ 59
$ 3,786,2511,559,8571,055,353
$ 6,401,461
14. BONDS PAYABLE
December 31
2009 2008
Domestic unsecured bonds:Issued in January 2002 and repayable in January 2009 and 2012 in two
installments, 2.75% and 3.00% interest payable annually, respectivelyCurrent portion
$ 4,500,000-
$ 4,500,000
$ 12,500,000(8,000,000)
$ 4,500,000
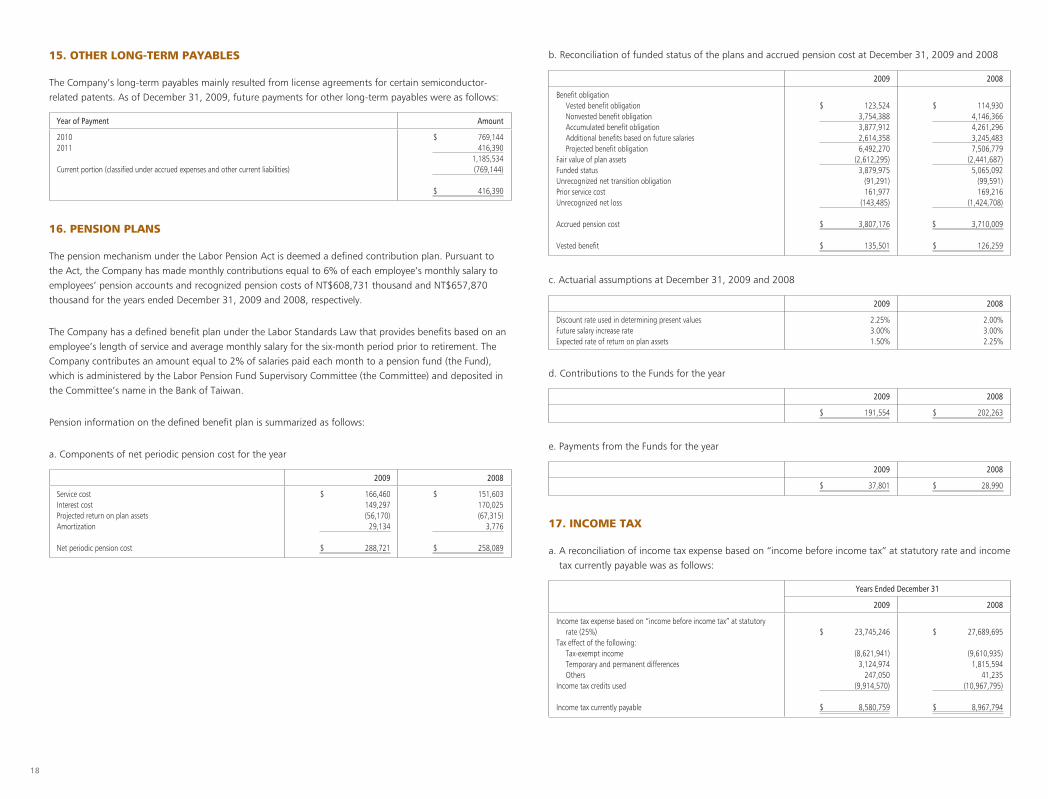
18
15. OTHER LONG-TERM PAYABLES
The Company’s long-term payables mainly resulted from license agreements for certain semiconductor-related patents. As of December 31, 2009, future payments for other long-term payables were as follows:
Year of Payment Amount
20102011
Current portion (classified under accrued expenses and other current liabilities)
$ 769,144416,390
1,185,534(769,144)
$ 416,390
16. PENSION PLANS
The pension mechanism under the Labor Pension Act is deemed a defined contribution plan. Pursuant to the Act, the Company has made monthly contributions equal to 6% of each employee’s monthly salary to employees’ pension accounts and recognized pension costs of NT$608,731 thousand and NT$657,870 thousand for the years ended December 31, 2009 and 2008, respectively.
The Company has a defined benefit plan under the Labor Standards Law that provides benefits based on an employee’s length of service and average monthly salary for the six-month period prior to retirement. The Company contributes an amount equal to 2% of salaries paid each month to a pension fund (the Fund), which is administered by the Labor Pension Fund Supervisory Committee (the Committee) and deposited in the Committee’s name in the Bank of Taiwan.
Pension information on the defined benefit plan is summarized as follows:
a. Components of net periodic pension cost for the year
2009 2008
Service costInterest costProjected return on plan assetsAmortization
Net periodic pension cost
$ 166,460149,297(56,170)
29,134
$ 288,721
$ 151,603170,025(67,315)
3,776
$ 258,089
b. Reconciliation of funded status of the plans and accrued pension cost at December 31, 2009 and 2008
2009 2008
Benefit obligationVested benefit obligationNonvested benefit obligationAccumulated benefit obligationAdditional benefits based on future salariesProjected benefit obligation
Fair value of plan assetsFunded statusUnrecognized net transition obligationPrior service costUnrecognized net loss
Accrued pension cost
Vested benefit
$ 123,5243,754,3883,877,9122,614,3586,492,270
(2,612,295)3,879,975
(91,291)161,977
(143,485)
$ 3,807,176
$ 135,501
$ 114,9304,146,3664,261,2963,245,4837,506,779
(2,441,687)5,065,092
(99,591)169,216
(1,424,708)
$ 3,710,009
$ 126,259
2009 2008
Discount rate used in determining present valuesFuture salary increase rateExpected rate of return on plan assets
2.25%3.00%1.50%
2.00%3.00%2.25%
c. Actuarial assumptions at December 31, 2009 and 2008
2009 2008
$ 191,554 $ 202,263
d. Contributions to the Funds for the year
2009 2008
$ 37,801 $ 28,990
e. Payments from the Funds for the year
17. INCOME TAX
a. A reconciliation of income tax expense based on “income before income tax” at statutory rate and income tax currently payable was as follows:
Years Ended December 31
2009 2008
Income tax expense based on “income before income tax” at statutory rate (25%)
Tax effect of the following:Tax-exempt incomeTemporary and permanent differencesOthers
Income tax credits used
Income tax currently payable
$ 23,745,246
(8,621,941)3,124,974
247,050(9,914,570)
$ 8,580,759
$ 27,689,695
(9,610,935)1,815,594
41,235(10,967,795)
$ 8,967,794
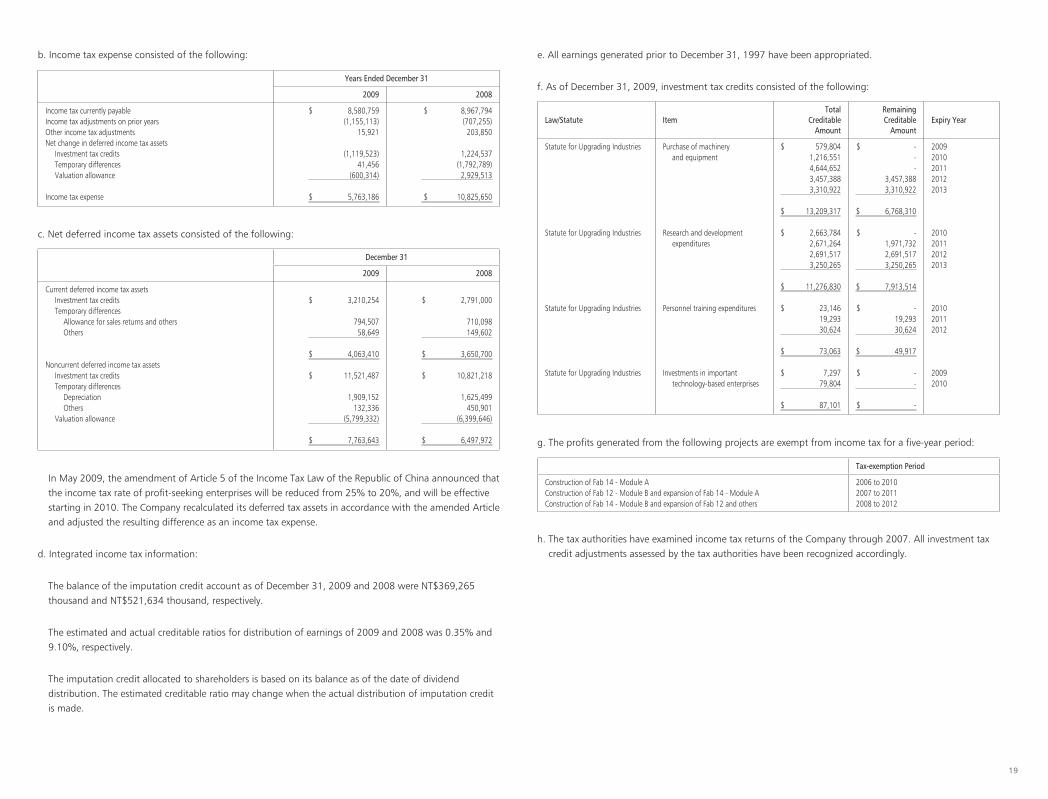
19
b. Income tax expense consisted of the following:
Years Ended December 31
2009 2008
Income tax currently payableIncome tax adjustments on prior yearsOther income tax adjustmentsNet change in deferred income tax assets
Investment tax creditsTemporary differencesValuation allowance
Income tax expense
$ 8,580,759(1,155,113)
15,921
(1,119,523)41,456
(600,314)
$ 5,763,186
$ 8,967,794(707,255)
203,850
1,224,537(1,792,789)
2,929,513
$ 10,825,650
c. Net deferred income tax assets consisted of the following:
December 31
2009 2008
Current deferred income tax assetsInvestment tax creditsTemporary differences
Allowance for sales returns and othersOthers
Noncurrent deferred income tax assetsInvestment tax creditsTemporary differences
DepreciationOthers
Valuation allowance
$ 3,210,254
794,50758,649
$ 4,063,410
$ 11,521,487
1,909,152132,336
(5,799,332)
$ 7,763,643
$ 2,791,000
710,098149,602
$ 3,650,700
$ 10,821,218
1,625,499450,901
(6,399,646)
$ 6,497,972
In May 2009, the amendment of Article 5 of the Income Tax Law of the Republic of China announced that the income tax rate of profit-seeking enterprises will be reduced from 25% to 20%, and will be effective starting in 2010. The Company recalculated its deferred tax assets in accordance with the amended Article and adjusted the resulting difference as an income tax expense.
d. Integrated income tax information:
The balance of the imputation credit account as of December 31, 2009 and 2008 were NT$369,265 thousand and NT$521,634 thousand, respectively.
The estimated and actual creditable ratios for distribution of earnings of 2009 and 2008 was 0.35% and 9.10%, respectively.
The imputation credit allocated to shareholders is based on its balance as of the date of dividend distribution. The estimated creditable ratio may change when the actual distribution of imputation credit is made.
e. All earnings generated prior to December 31, 1997 have been appropriated.
f. As of December 31, 2009, investment tax credits consisted of the following:
Law/Statute ItemTotal
CreditableAmount
RemainingCreditable
AmountExpiry Year
Statute for Upgrading Industries
Statute for Upgrading Industries
Statute for Upgrading Industries
Statute for Upgrading Industries
Purchase of machinery and equipment
Research and development expenditures
Personnel training expenditures
Investments in important technology-based enterprises
$ 579,8041,216,5514,644,6523,457,3883,310,922
$ 13,209,317
$ 2,663,7842,671,2642,691,5173,250,265
$ 11,276,830
$ 23,14619,29330,624
$ 73,063
$ 7,29779,804
$ 87,101
$ ---
3,457,3883,310,922
$ 6,768,310
$ -1,971,7322,691,5173,250,265
$ 7,913,514
$ -19,29330,624
$ 49,917
$ --
$ -
20092010201120122013
2010201120122013
201020112012
20092010
g. The profits generated from the following projects are exempt from income tax for a five-year period:
h. The tax authorities have examined income tax returns of the Company through 2007. All investment tax credit adjustments assessed by the tax authorities have been recognized accordingly.
Tax-exemption Period
Construction of Fab 14 - Module AConstruction of Fab 12 - Module B and expansion of Fab 14 - Module AConstruction of Fab 14 - Module B and expansion of Fab 12 and others
2006 to 20102007 to 20112008 to 2012

20
18. LABOR COST, DEPRECIATION AND AMORTIZATION
Year Ended December 31, 2009
Classified asCost of Sales
Classified as Operating Expenses
Total
Labor costSalary and bonusLabor and health insurance Pension MealWelfareOthers
DepreciationAmortization
$ 15,874,268630,735557,206414,749155,79597,229
$ 17,729,982
$ 68,606,242$ 1,199,386
$ 12,218,675385,013340,181180,54297,28219,108
$ 13,240,801
$ 3,842,623$ 657,618
$ 28,092,9431,015,748
897,387595,291253,077116,337
$ 30,970,783
$ 72,448,865$ 1,857,004
The Company’s Articles of Incorporation provide that, when allocating the net profits for each fiscal year, the Company shall first offset its losses in previous years and then set aside the following items accordingly:
a. Legal capital reserve at 10% of the profits left over, until the accumulated legal capital reserve equals the Company’s paid-in capital;
b. Special capital reserve in accordance with relevant laws or regulations or as requested by the authorities in charge;
c. Bonus to directors and profit sharing to employees of the Company of not more than 0.3% and not less than 1% of the remainder, respectively. Directors who also serve as executive officers of the Company are not entitled to receive the bonus to directors. The Company may issue profit sharing to employees in stock of an affiliated company meeting the conditions set by the Board of Directors or, by the person duly authorized by the Board of Directors;
d. Any balance left over shall be allocated according to the resolution of the shareholders’ meeting.
The Company’s Articles of Incorporation also provide that profits of the Company may be distributed by way of cash dividend and/or stock dividend. However, distribution of profits shall be made preferably by way of cash dividend. Distribution of profits may also be made by way of stock dividend; provided that the ratio for stock dividend shall not exceed 50% of the total distribution.
Any appropriations of the profits are subject to shareholder’s approval in the following year.
The Company has recorded profit sharing to employees as a charge to earnings of approximately 7.5% and 15% of net income for the years ended December 2009 and 2008, respectively; bonuses to directors were accrued with an estimate based on historical experience. If the actual amounts subsequently resolved by the shareholders differ from the estimated amounts, the differences are recorded in the year of shareholders’ resolution as a change in accounting estimate. If profit sharing is resolved to be distributed to employees in stock, the number of shares is determined by dividing the amount of profit sharing by the closing price (after considering the effect of dividends) of the shares on the day preceding the shareholders’ meeting.
The Company no longer has supervisors since January 1, 2007. The required duties of supervisors are being fulfilled by the Audit Committee.
19. SHAREHOLDERS’ EQUITY
As of December 31, 2009, 1,097,513 thousand ADSs of the Company were traded on the NYSE. The number of common shares represented by the ADSs is 5,487,565 thousand (one ADS represents five common shares).
Capital surplus can only be used to offset a deficit under the Company Law. However, the capital surplus generated from donations and the excess of the issuance price over the par value of capital stock (including the stock issued for new capital, mergers, convertible bonds and the surplus from treasury stock transactions) may be appropriated as stock dividends, which are limited to a certain percentage of the Company’s paid-in capital. In addition, the capital surplus from long-term investments may not be used for any purpose.
December 31
2009 2008
Additional paid-in capitalFrom mergerFrom convertible bondsFrom long-term investmentsDonations
$ 23,457,80522,805,3908,893,190
329,57055
$ 55,486,010
$ 17,962,46822,805,3908,893,190
214,15255
$ 49,875,255
Year Ended December 31, 2008
Classified asCost of Sales
Classified as Operating Expenses
Total
Labor costSalary and bonusLabor and health insurancePension MealWelfareOthers
DepreciationAmortization
$ 17,088,512677,817587,281437,910174,641190,323
$ 19,156,484
$ 68,373,886$ 1,771,919
$ 11,989,661379,196328,669174,906100,98915,979
$ 12,989,400
$ 3,701,241$ 663,434
$ 29,078,1731,057,013
915,950612,816275,630206,302
$ 32,145,884
$ 72,075,127$ 2,435,353
Capital surplus consisted of the following:
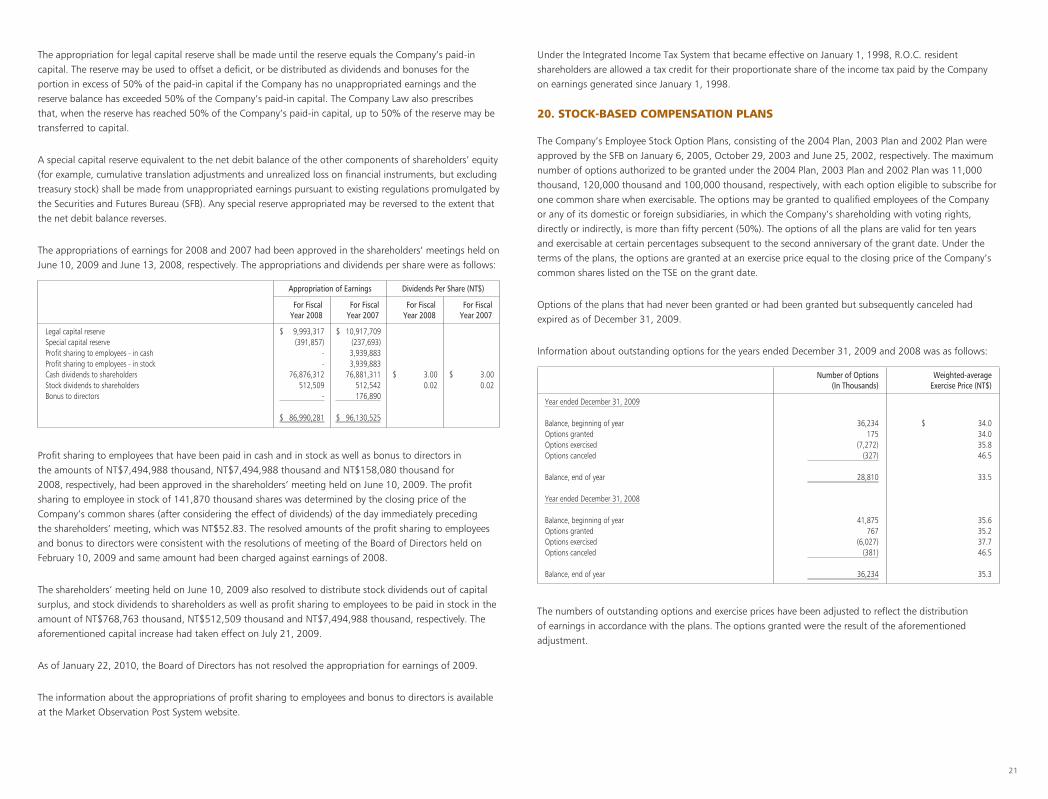
21
The appropriation for legal capital reserve shall be made until the reserve equals the Company’s paid-in capital. The reserve may be used to offset a deficit, or be distributed as dividends and bonuses for the portion in excess of 50% of the paid-in capital if the Company has no unappropriated earnings and the reserve balance has exceeded 50% of the Company’s paid-in capital. The Company Law also prescribes that, when the reserve has reached 50% of the Company’s paid-in capital, up to 50% of the reserve may be transferred to capital.
A special capital reserve equivalent to the net debit balance of the other components of shareholders’ equity (for example, cumulative translation adjustments and unrealized loss on financial instruments, but excluding treasury stock) shall be made from unappropriated earnings pursuant to existing regulations promulgated by the Securities and Futures Bureau (SFB). Any special reserve appropriated may be reversed to the extent that the net debit balance reverses.
The appropriations of earnings for 2008 and 2007 had been approved in the shareholders’ meetings held on June 10, 2009 and June 13, 2008, respectively. The appropriations and dividends per share were as follows:
Appropriation of Earnings Dividends Per Share (NT$)
For FiscalYear 2008
For FiscalYear 2007
For FiscalYear 2008
For FiscalYear 2007
Legal capital reserveSpecial capital reserveProfit sharing to employees - in cashProfit sharing to employees - in stockCash dividends to shareholdersStock dividends to shareholdersBonus to directors
$ 9,993,317(391,857)
--
76,876,312512,509
-
$ 86,990,281
$ 10,917,709(237,693)3,939,8833,939,883
76,881,311512,542176,890
$ 96,130,525
$ 3.000.02
$ 3.000.02
Profit sharing to employees that have been paid in cash and in stock as well as bonus to directors in the amounts of NT$7,494,988 thousand, NT$7,494,988 thousand and NT$158,080 thousand for 2008, respectively, had been approved in the shareholders’ meeting held on June 10, 2009. The profit sharing to employee in stock of 141,870 thousand shares was determined by the closing price of the Company’s common shares (after considering the effect of dividends) of the day immediately preceding the shareholders’ meeting, which was NT$52.83. The resolved amounts of the profit sharing to employees and bonus to directors were consistent with the resolutions of meeting of the Board of Directors held on February 10, 2009 and same amount had been charged against earnings of 2008.
The shareholders’ meeting held on June 10, 2009 also resolved to distribute stock dividends out of capital surplus, and stock dividends to shareholders as well as profit sharing to employees to be paid in stock in the amount of NT$768,763 thousand, NT$512,509 thousand and NT$7,494,988 thousand, respectively. The aforementioned capital increase had taken effect on July 21, 2009.
As of January 22, 2010, the Board of Directors has not resolved the appropriation for earnings of 2009.
The information about the appropriations of profit sharing to employees and bonus to directors is available at the Market Observation Post System website.
Under the Integrated Income Tax System that became effective on January 1, 1998, R.O.C. resident shareholders are allowed a tax credit for their proportionate share of the income tax paid by the Company on earnings generated since January 1, 1998.
20. STOCK-BASED COMPENSATION PLANS
The Company’s Employee Stock Option Plans, consisting of the 2004 Plan, 2003 Plan and 2002 Plan were approved by the SFB on January 6, 2005, October 29, 2003 and June 25, 2002, respectively. The maximum number of options authorized to be granted under the 2004 Plan, 2003 Plan and 2002 Plan was 11,000 thousand, 120,000 thousand and 100,000 thousand, respectively, with each option eligible to subscribe for one common share when exercisable. The options may be granted to qualified employees of the Company or any of its domestic or foreign subsidiaries, in which the Company’s shareholding with voting rights, directly or indirectly, is more than fifty percent (50%). The options of all the plans are valid for ten years and exercisable at certain percentages subsequent to the second anniversary of the grant date. Under the terms of the plans, the options are granted at an exercise price equal to the closing price of the Company’s common shares listed on the TSE on the grant date.
Options of the plans that had never been granted or had been granted but subsequently canceled had expired as of December 31, 2009.
Information about outstanding options for the years ended December 31, 2009 and 2008 was as follows:
Number of Options(In Thousands)
Weighted-averageExercise Price (NT$)
Year ended December 31, 2009
Balance, beginning of yearOptions grantedOptions exercisedOptions canceled
Balance, end of year
Year ended December 31, 2008
Balance, beginning of yearOptions grantedOptions exercisedOptions canceled
Balance, end of year
36,234175
(7,272)(327)
28,810
41,875767
(6,027)(381)
36,234
$ 34.034.035.846.5
33.5
35.635.237.746.5
35.3
The numbers of outstanding options and exercise prices have been adjusted to reflect the distribution of earnings in accordance with the plans. The options granted were the result of the aforementioned adjustment.
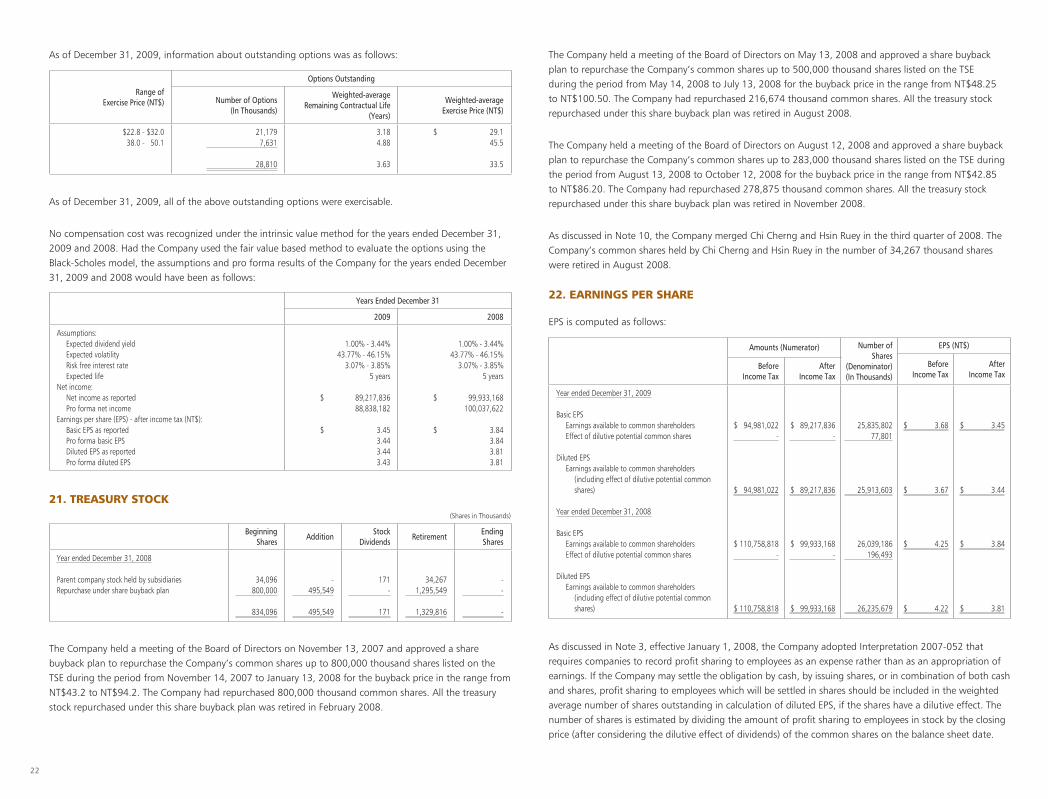
22
Range of Exercise Price (NT$)
Options Outstanding
Number of Options (In Thousands)
Weighted-averageRemaining Contractual Life
(Years)
Weighted-averageExercise Price (NT$)
$22.8 - $32.038.0 - 50.1
21,1797,631
28,810
3.184.88
3.63
$ 29.145.5
33.5
As of December 31, 2009, all of the above outstanding options were exercisable.
No compensation cost was recognized under the intrinsic value method for the years ended December 31, 2009 and 2008. Had the Company used the fair value based method to evaluate the options using the Black-Scholes model, the assumptions and pro forma results of the Company for the years ended December 31, 2009 and 2008 would have been as follows:
Years Ended December 31
2009 2008
Assumptions:Expected dividend yieldExpected volatilityRisk free interest rateExpected life
Net income:Net income as reportedPro forma net income
Earnings per share (EPS) - after income tax (NT$):Basic EPS as reportedPro forma basic EPSDiluted EPS as reportedPro forma diluted EPS
1.00% - 3.44%43.77% - 46.15%
3.07% - 3.85%5 years
$ 89,217,83688,838,182
$ 3.453.443.443.43
1.00% - 3.44%43.77% - 46.15%
3.07% - 3.85%5 years
$ 99,933,168100,037,622
$ 3.843.843.813.81
21. TREASURY STOCK
BeginningShares
AdditionStock
DividendsRetirement
EndingShares
Year ended December 31, 2008
Parent company stock held by subsidiariesRepurchase under share buyback plan
34,096800,000
834,096
-495,549
495,549
171-
171
34,2671,295,549
1,329,816
--
-
(Shares in Thousands)
The Company held a meeting of the Board of Directors on November 13, 2007 and approved a share buyback plan to repurchase the Company’s common shares up to 800,000 thousand shares listed on the TSE during the period from November 14, 2007 to January 13, 2008 for the buyback price in the range from NT$43.2 to NT$94.2. The Company had repurchased 800,000 thousand common shares. All the treasury stock repurchased under this share buyback plan was retired in February 2008.
The Company held a meeting of the Board of Directors on May 13, 2008 and approved a share buyback plan to repurchase the Company’s common shares up to 500,000 thousand shares listed on the TSE during the period from May 14, 2008 to July 13, 2008 for the buyback price in the range from NT$48.25 to NT$100.50. The Company had repurchased 216,674 thousand common shares. All the treasury stock repurchased under this share buyback plan was retired in August 2008.
The Company held a meeting of the Board of Directors on August 12, 2008 and approved a share buyback plan to repurchase the Company’s common shares up to 283,000 thousand shares listed on the TSE during the period from August 13, 2008 to October 12, 2008 for the buyback price in the range from NT$42.85 to NT$86.20. The Company had repurchased 278,875 thousand common shares. All the treasury stock repurchased under this share buyback plan was retired in November 2008.
As discussed in Note 10, the Company merged Chi Cherng and Hsin Ruey in the third quarter of 2008. The Company’s common shares held by Chi Cherng and Hsin Ruey in the number of 34,267 thousand shares were retired in August 2008.
22. EARNINGS PER SHARE
EPS is computed as follows:
Amounts (Numerator) Number ofShares
(Denominator)(In Thousands)
EPS (NT$)
Before Income Tax
AfterIncome Tax
BeforeIncome Tax
AfterIncome Tax
Year ended December 31, 2009
Basic EPSEarnings available to common shareholdersEffect of dilutive potential common shares
Diluted EPSEarnings available to common shareholders
(including effect of dilutive potential common shares)
Year ended December 31, 2008
Basic EPSEarnings available to common shareholdersEffect of dilutive potential common shares
Diluted EPSEarnings available to common shareholders
(including effect of dilutive potential common shares)
$ 94,981,022 -
$ 94,981,022
$ 110,758,818-
$ 110,758,818
$ 89,217,836-
$ 89,217,836
$ 99,933,168-
$ 99,933,168
25,835,80277,801
25,913,603
26,039,186196,493
26,235,679
$ 3.68
$ 3.67
$ 4.25
$ 4.22
$ 3.45
$ 3.44
$ 3.84
$ 3.81
As discussed in Note 3, effective January 1, 2008, the Company adopted Interpretation 2007-052 that requires companies to record profit sharing to employees as an expense rather than as an appropriation of earnings. If the Company may settle the obligation by cash, by issuing shares, or in combination of both cash and shares, profit sharing to employees which will be settled in shares should be included in the weighted average number of shares outstanding in calculation of diluted EPS, if the shares have a dilutive effect. The number of shares is estimated by dividing the amount of profit sharing to employees in stock by the closing price (after considering the dilutive effect of dividends) of the common shares on the balance sheet date.
As of December 31, 2009, information about outstanding options was as follows:
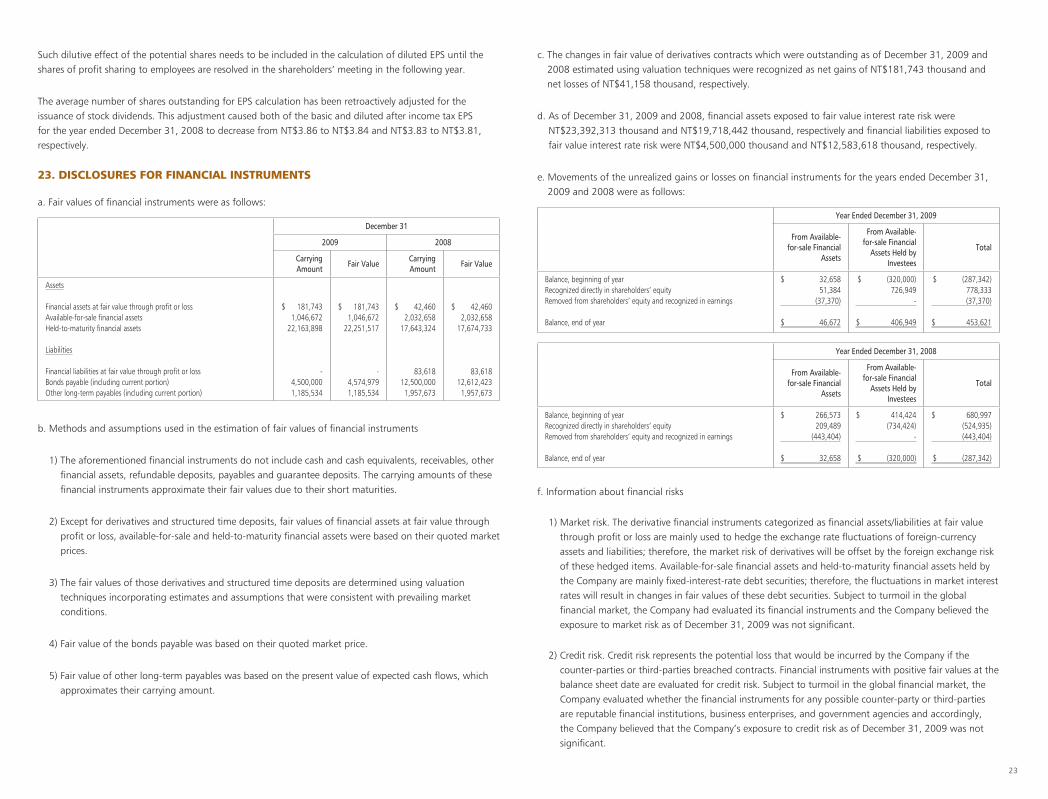
23
December 31
2009 2008
CarryingAmount
Fair ValueCarryingAmount
Fair Value
Assets
Financial assets at fair value through profit or lossAvailable-for-sale financial assets Held-to-maturity financial assets
Liabilities
Financial liabilities at fair value through profit or lossBonds payable (including current portion)Other long-term payables (including current portion)
$ 181,7431,046,672
22,163,898
-4,500,0001,185,534
$ 181,7431,046,672
22,251,517
-4,574,9791,185,534
$ 42,4602,032,658
17,643,324
83,61812,500,0001,957,673
$ 42,4602,032,658
17,674,733
83,61812,612,4231,957,673
b. Methods and assumptions used in the estimation of fair values of financial instruments
1) The aforementioned financial instruments do not include cash and cash equivalents, receivables, other financial assets, refundable deposits, payables and guarantee deposits. The carrying amounts of these financial instruments approximate their fair values due to their short maturities.
2) Except for derivatives and structured time deposits, fair values of financial assets at fair value through profit or loss, available-for-sale and held-to-maturity financial assets were based on their quoted market prices.
3) The fair values of those derivatives and structured time deposits are determined using valuation techniques incorporating estimates and assumptions that were consistent with prevailing market conditions.
4) Fair value of the bonds payable was based on their quoted market price.
5) Fair value of other long-term payables was based on the present value of expected cash flows, which approximates their carrying amount.
Such dilutive effect of the potential shares needs to be included in the calculation of diluted EPS until the shares of profit sharing to employees are resolved in the shareholders’ meeting in the following year.
The average number of shares outstanding for EPS calculation has been retroactively adjusted for the issuance of stock dividends. This adjustment caused both of the basic and diluted after income tax EPS for the year ended December 31, 2008 to decrease from NT$3.86 to NT$3.84 and NT$3.83 to NT$3.81, respectively.
23. DISCLOSURES FOR FINANCIAL INSTRUMENTS
a. Fair values of financial instruments were as follows:
c. The changes in fair value of derivatives contracts which were outstanding as of December 31, 2009 and 2008 estimated using valuation techniques were recognized as net gains of NT$181,743 thousand and net losses of NT$41,158 thousand, respectively.
d. As of December 31, 2009 and 2008, financial assets exposed to fair value interest rate risk were NT$23,392,313 thousand and NT$19,718,442 thousand, respectively and financial liabilities exposed to fair value interest rate risk were NT$4,500,000 thousand and NT$12,583,618 thousand, respectively.
e. Movements of the unrealized gains or losses on financial instruments for the years ended December 31, 2009 and 2008 were as follows:
Year Ended December 31, 2009
From Available-for-sale Financial
Assets
From Available-for-sale Financial
Assets Held by Investees
Total
Balance, beginning of yearRecognized directly in shareholders’ equityRemoved from shareholders’ equity and recognized in earnings
Balance, end of year
$ 32,65851,384
(37,370)
$ 46,672
$ (320,000)726,949
-
$ 406,949
$ (287,342)778,333(37,370)
$ 453,621
Year Ended December 31, 2008
From Available-for-sale Financial
Assets
From Available-for-sale Financial
Assets Held by Investees
Total
Balance, beginning of yearRecognized directly in shareholders’ equityRemoved from shareholders’ equity and recognized in earnings
Balance, end of year
$ 266,573209,489
(443,404)
$ 32,658
$ 414,424(734,424)
-
$ (320,000)
$ 680,997(524,935)(443,404)
$ (287,342)
f. Information about financial risks
1) Market risk. The derivative financial instruments categorized as financial assets/liabilities at fair value through profit or loss are mainly used to hedge the exchange rate fluctuations of foreign-currency assets and liabilities; therefore, the market risk of derivatives will be offset by the foreign exchange risk of these hedged items. Available-for-sale financial assets and held-to-maturity financial assets held by the Company are mainly fixed-interest-rate debt securities; therefore, the fluctuations in market interest rates will result in changes in fair values of these debt securities. Subject to turmoil in the global financial market, the Company had evaluated its financial instruments and the Company believed the exposure to market risk as of December 31, 2009 was not significant.
2) Credit risk. Credit risk represents the potential loss that would be incurred by the Company if the counter-parties or third-parties breached contracts. Financial instruments with positive fair values at the balance sheet date are evaluated for credit risk. Subject to turmoil in the global financial market, the Company evaluated whether the financial instruments for any possible counter-party or third-parties are reputable financial institutions, business enterprises, and government agencies and accordingly, the Company believed that the Company’s exposure to credit risk as of December 31, 2009 was not significant.
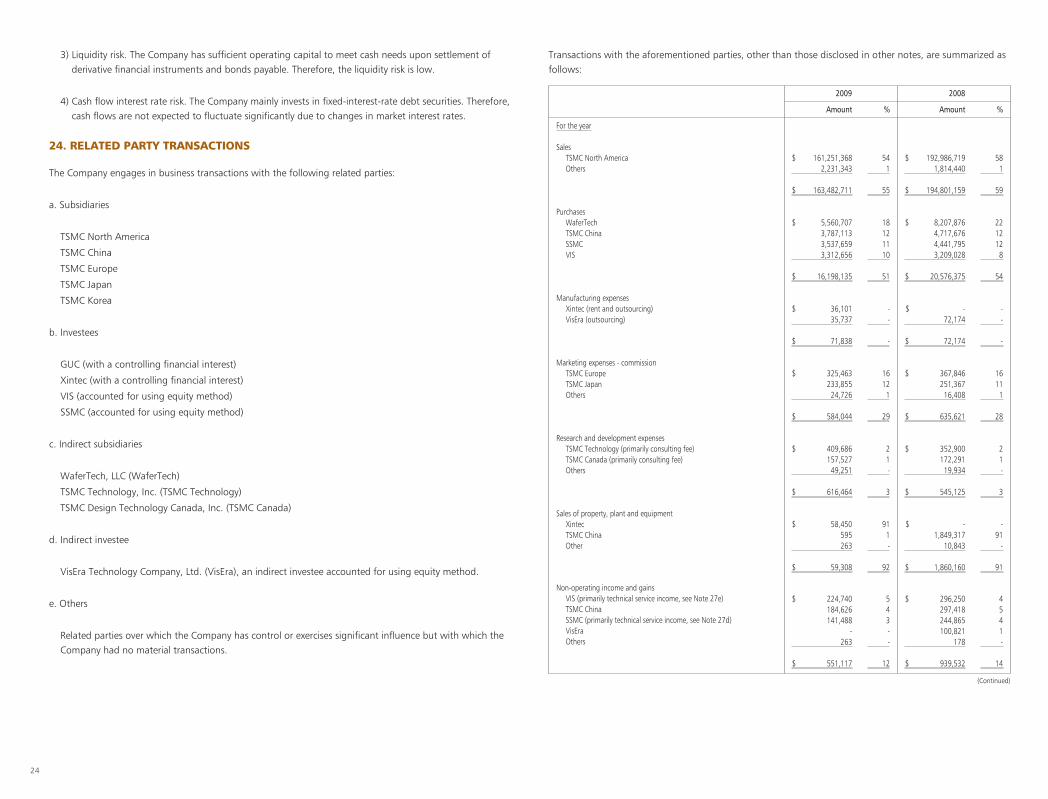
24
2009 2008
Amount % Amount %
For the year
SalesTSMC North AmericaOthers
PurchasesWaferTechTSMC ChinaSSMCVIS
Manufacturing expensesXintec (rent and outsourcing)VisEra (outsourcing)
Marketing expenses - commissionTSMC EuropeTSMC JapanOthers
Research and development expensesTSMC Technology (primarily consulting fee)TSMC Canada (primarily consulting fee)Others
Sales of property, plant and equipmentXintecTSMC ChinaOther
Non-operating income and gainsVIS (primarily technical service income, see Note 27e)TSMC China SSMC (primarily technical service income, see Note 27d)VisEra Others
$ 161,251,3682,231,343
$ 163,482,711
$ 5,560,7073,787,1133,537,6593,312,656
$ 16,198,135
$ 36,10135,737
$ 71,838
$ 325,463233,85524,726
$ 584,044
$ 409,686157,52749,251
$ 616,464
$ 58,450595263
$ 59,308
$ 224,740184,626141,488
-263
$ 551,117
541
55
18121110
51
--
-
16121
29
21-
3
911-
92
5 43--
12
$ 192,986,7191,814,440
$ 194,801,159
$ 8,207,8764,717,6764,441,7953,209,028
$ 20,576,375
$ -72,174
$ 72,174
$ 367,846251,36716,408
$ 635,621
$ 352,900172,29119,934
$ 545,125
$ -1,849,317
10,843
$ 1,860,160
$ 296,250297,418244,865100,821
178
$ 939,532
581
59
2212128
54
--
-
16111
28
21-
3
-91
-
91
4541-
14
(Continued)
3) Liquidity risk. The Company has sufficient operating capital to meet cash needs upon settlement of derivative financial instruments and bonds payable. Therefore, the liquidity risk is low.
4) Cash flow interest rate risk. The Company mainly invests in fixed-interest-rate debt securities. Therefore, cash flows are not expected to fluctuate significantly due to changes in market interest rates.
24. RELATED PARTY TRANSACTIONS
The Company engages in business transactions with the following related parties:
a. Subsidiaries
TSMC North America
TSMC China
TSMC Europe
TSMC Japan
TSMC Korea
b. Investees
GUC (with a controlling financial interest)
Xintec (with a controlling financial interest)
VIS (accounted for using equity method)
SSMC (accounted for using equity method)
c. Indirect subsidiaries
WaferTech, LLC (WaferTech)
TSMC Technology, Inc. (TSMC Technology)
TSMC Design Technology Canada, Inc. (TSMC Canada)
d. Indirect investee
VisEra Technology Company, Ltd. (VisEra), an indirect investee accounted for using equity method.
e. Others
Related parties over which the Company has control or exercises significant influence but with which the Company had no material transactions.
Transactions with the aforementioned parties, other than those disclosed in other notes, are summarized as follows:

25
2009 2008
Amount % Amount %
As of December 31
ReceivablesTSMC North AmericaOthers
Other receivablesTSMC ChinaVISSSMCTSMC North AmericaOthers
PayablesWaferTechVISTSMC ChinaSSMCTSMC TechnologyTSMC North AmericaOthers
Deferred creditsTSMC China
$ 22,203,242338,531
$ 22,541,773
$ 111,10381,66339,6298,6764,932
$ 246,003
$ 561,165529,060481,500238,741109,220
4,222115,434
$ 2,039,342
$ 7,970
982
100
45331642
100
272624125-6
100
17
$ 11,512,777215,427
$ 11,728,204
$ 112,93342,96956,949
256,62420,267
$ 489,742
$ 171,089317,491117,417162,80741,904
327,25064,392
$ 1,202,350
$ 183,896
982
100
239
12524
100
142610143
285
100
40
The sales prices and payment terms to related parties were not significantly different from those of sales to third parties. For other related party transactions, prices and terms were determined in accordance with mutual agreements.
The Company leased certain buildings, facilities, and machinery and equipment from Xintec. The lease terms and prices were determined in accordance with mutual agreements. The rental expense was classified under manufacturing expenses.
The Company deferred the net gains (classified under the deferred credits) derived from sales of property, plant and equipment to TSMC China and VisEra, and then recognized such gains (classified under non-operating income and gains) over the depreciable lives of the disposed assets.
The Company leased certain buildings and facilities to VisEra. The rental income was classified under non-operating income and gains. The lease terms and prices were determined in accordance with mutual agreements. The lease agreement between the Company and VisEra expired in April 2008.
Years Ended December 31
2009 2008
Salaries, incentives and special compensationBonus
$ 588,508411,358
$ 999,866
$ 272,325705,376
$ 977,701
The information about the compensation of directors and management personnel is available in the annual report for the shareholders’ meeting. Total compensation expense for the year ended December 31, 2009 includes estimated profit sharing to employees and bonus to directors of the Company that relate to 2009 but will be paid in the following year. The actual amount will be finalized and approved upon the resolution of the shareholders’ meeting in 2010. The total compensation for the year ended December 31, 2008 included the bonuses appropriated from earnings of 2008 which was approved by the shareholders’ meeting held in 2009.
25. PLEDGED OR MORTGAGED ASSETS
As of December 31, 2009, the Company had pledged time deposits of NT$824,797 thousand (classified as other financial assets) as collateral for land lease agreements and customs duty guarantee.
26. SIGNIFICANT LONG-TERM LEASES
The Company leases several parcels of land from the Science Park Administration. These operating leases expire on various dates from March 2010 to December 2029 and can be renewed upon expiration.
As of December 31, 2009, future lease payments were as follows:
(Concluded)
Compensation of directors and management personnel:
Year Amount
2010201120122013 20142015 and thereafter
$ 355,842353,566353,566331,921318,935
2,754,388
$ 4,468,218
27. SIGNIFICANT COMMITMENTS AND CONTINGENCIES
Significant commitments and contingencies of the Company as of December 31, 2009, excluding those disclosed in other notes, were as follows:
a. Under a technical cooperation agreement with ITRI, the R.O.C. Government or its designee approved by the Company can use up to 35% of the Company’s capacity if the Company’s outstanding commitments to its customers are not prejudiced. The term of this agreement is for five years beginning from January 1, 1987 and is automatically renewed for successive periods of five years unless otherwise terminated by either party with one year prior notice.
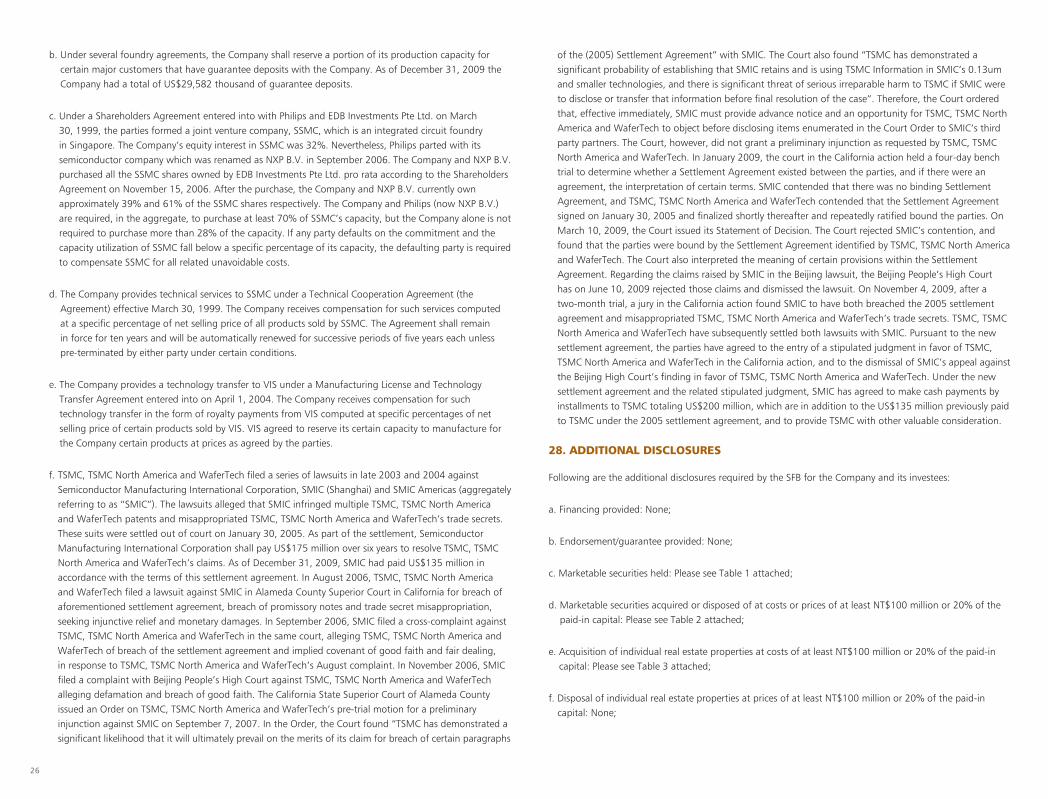
26
b. Under several foundry agreements, the Company shall reserve a portion of its production capacity for certain major customers that have guarantee deposits with the Company. As of December 31, 2009 the Company had a total of US$29,582 thousand of guarantee deposits.
c. Under a Shareholders Agreement entered into with Philips and EDB Investments Pte Ltd. on March 30, 1999, the parties formed a joint venture company, SSMC, which is an integrated circuit foundry in Singapore. The Company’s equity interest in SSMC was 32%. Nevertheless, Philips parted with its semiconductor company which was renamed as NXP B.V. in September 2006. The Company and NXP B.V. purchased all the SSMC shares owned by EDB Investments Pte Ltd. pro rata according to the Shareholders Agreement on November 15, 2006. After the purchase, the Company and NXP B.V. currently own approximately 39% and 61% of the SSMC shares respectively. The Company and Philips (now NXP B.V.) are required, in the aggregate, to purchase at least 70% of SSMC’s capacity, but the Company alone is not required to purchase more than 28% of the capacity. If any party defaults on the commitment and the capacity utilization of SSMC fall below a specific percentage of its capacity, the defaulting party is required to compensate SSMC for all related unavoidable costs.
d. The Company provides technical services to SSMC under a Technical Cooperation Agreement (the Agreement) effective March 30, 1999. The Company receives compensation for such services computed at a specific percentage of net selling price of all products sold by SSMC. The Agreement shall remain in force for ten years and will be automatically renewed for successive periods of five years each unless pre-terminated by either party under certain conditions.
e. The Company provides a technology transfer to VIS under a Manufacturing License and Technology Transfer Agreement entered into on April 1, 2004. The Company receives compensation for such technology transfer in the form of royalty payments from VIS computed at specific percentages of net selling price of certain products sold by VIS. VIS agreed to reserve its certain capacity to manufacture for the Company certain products at prices as agreed by the parties.
f. TSMC, TSMC North America and WaferTech filed a series of lawsuits in late 2003 and 2004 against Semiconductor Manufacturing International Corporation, SMIC (Shanghai) and SMIC Americas (aggregately referring to as “SMIC”). The lawsuits alleged that SMIC infringed multiple TSMC, TSMC North America and WaferTech patents and misappropriated TSMC, TSMC North America and WaferTech’s trade secrets. These suits were settled out of court on January 30, 2005. As part of the settlement, Semiconductor Manufacturing International Corporation shall pay US$175 million over six years to resolve TSMC, TSMC North America and WaferTech’s claims. As of December 31, 2009, SMIC had paid US$135 million in accordance with the terms of this settlement agreement. In August 2006, TSMC, TSMC North America and WaferTech filed a lawsuit against SMIC in Alameda County Superior Court in California for breach of aforementioned settlement agreement, breach of promissory notes and trade secret misappropriation, seeking injunctive relief and monetary damages. In September 2006, SMIC filed a cross-complaint against TSMC, TSMC North America and WaferTech in the same court, alleging TSMC, TSMC North America and WaferTech of breach of the settlement agreement and implied covenant of good faith and fair dealing, in response to TSMC, TSMC North America and WaferTech’s August complaint. In November 2006, SMIC filed a complaint with Beijing People’s High Court against TSMC, TSMC North America and WaferTech alleging defamation and breach of good faith. The California State Superior Court of Alameda County issued an Order on TSMC, TSMC North America and WaferTech’s pre-trial motion for a preliminary injunction against SMIC on September 7, 2007. In the Order, the Court found “TSMC has demonstrated a significant likelihood that it will ultimately prevail on the merits of its claim for breach of certain paragraphs
of the (2005) Settlement Agreement” with SMIC. The Court also found “TSMC has demonstrated a significant probability of establishing that SMIC retains and is using TSMC Information in SMIC’s 0.13um and smaller technologies, and there is significant threat of serious irreparable harm to TSMC if SMIC were to disclose or transfer that information before final resolution of the case”. Therefore, the Court ordered that, effective immediately, SMIC must provide advance notice and an opportunity for TSMC, TSMC North America and WaferTech to object before disclosing items enumerated in the Court Order to SMIC’s third party partners. The Court, however, did not grant a preliminary injunction as requested by TSMC, TSMC North America and WaferTech. In January 2009, the court in the California action held a four-day bench trial to determine whether a Settlement Agreement existed between the parties, and if there were an agreement, the interpretation of certain terms. SMIC contended that there was no binding Settlement Agreement, and TSMC, TSMC North America and WaferTech contended that the Settlement Agreement signed on January 30, 2005 and finalized shortly thereafter and repeatedly ratified bound the parties. On March 10, 2009, the Court issued its Statement of Decision. The Court rejected SMIC’s contention, and found that the parties were bound by the Settlement Agreement identified by TSMC, TSMC North America and WaferTech. The Court also interpreted the meaning of certain provisions within the Settlement Agreement. Regarding the claims raised by SMIC in the Beijing lawsuit, the Beijing People’s High Court has on June 10, 2009 rejected those claims and dismissed the lawsuit. On November 4, 2009, after a two-month trial, a jury in the California action found SMIC to have both breached the 2005 settlement agreement and misappropriated TSMC, TSMC North America and WaferTech’s trade secrets. TSMC, TSMC North America and WaferTech have subsequently settled both lawsuits with SMIC. Pursuant to the new settlement agreement, the parties have agreed to the entry of a stipulated judgment in favor of TSMC, TSMC North America and WaferTech in the California action, and to the dismissal of SMIC’s appeal against the Beijing High Court’s finding in favor of TSMC, TSMC North America and WaferTech. Under the new settlement agreement and the related stipulated judgment, SMIC has agreed to make cash payments by installments to TSMC totaling US$200 million, which are in addition to the US$135 million previously paid to TSMC under the 2005 settlement agreement, and to provide TSMC with other valuable consideration.
28. ADDITIONAL DISCLOSURES
Following are the additional disclosures required by the SFB for the Company and its investees:
a. Financing provided: None;
b. Endorsement/guarantee provided: None;
c. Marketable securities held: Please see Table 1 attached;
d. Marketable securities acquired or disposed of at costs or prices of at least NT$100 million or 20% of the paid-in capital: Please see Table 2 attached;
e. Acquisition of individual real estate properties at costs of at least NT$100 million or 20% of the paid-in capital: Please see Table 3 attached;
f. Disposal of individual real estate properties at prices of at least NT$100 million or 20% of the paid-in capital: None;
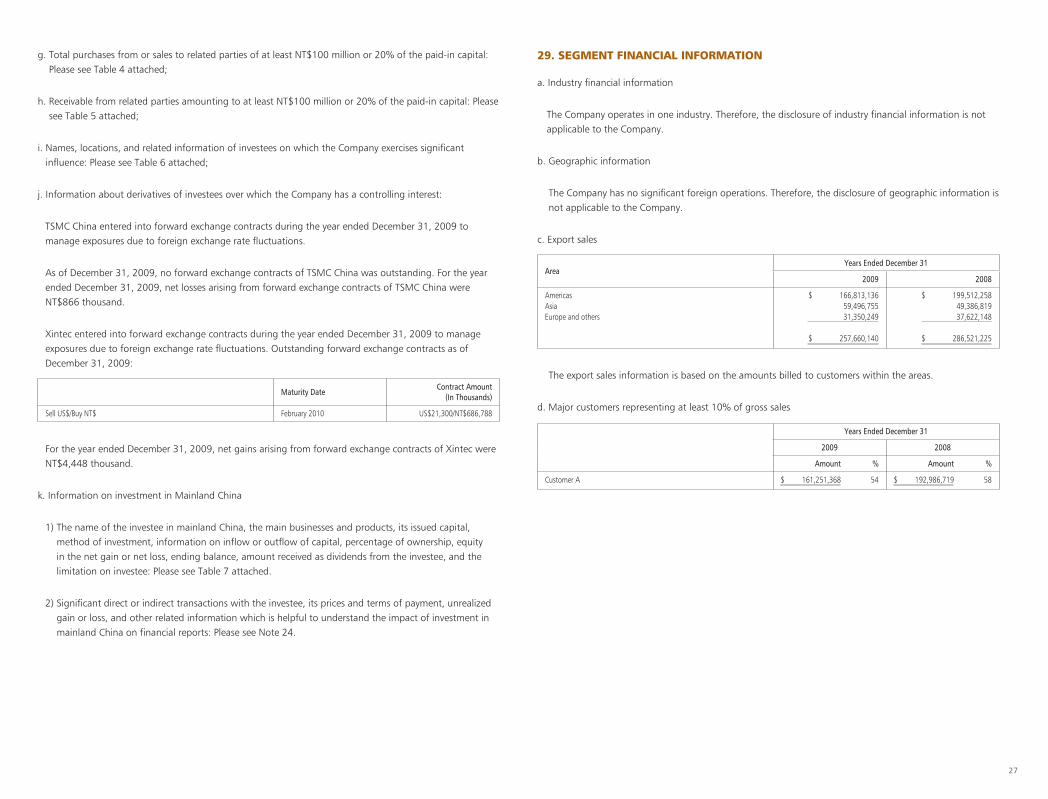
27
For the year ended December 31, 2009, net gains arising from forward exchange contracts of Xintec were NT$4,448 thousand.
k. Information on investment in Mainland China
1) The name of the investee in mainland China, the main businesses and products, its issued capital, method of investment, information on inflow or outflow of capital, percentage of ownership, equity in the net gain or net loss, ending balance, amount received as dividends from the investee, and the limitation on investee: Please see Table 7 attached.
2) Significant direct or indirect transactions with the investee, its prices and terms of payment, unrealized gain or loss, and other related information which is helpful to understand the impact of investment in mainland China on financial reports: Please see Note 24.
Maturity DateContract Amount
(In Thousands)
Sell US$/Buy NT$ February 2010 US$21,300/NT$686,788
AreaYears Ended December 31
2009 2008
AmericasAsiaEurope and others
$ 166,813,13659,496,75531,350,249
$ 257,660,140
$ 199,512,25849,386,81937,622,148
$ 286,521,225
The export sales information is based on the amounts billed to customers within the areas.
d. Major customers representing at least 10% of gross sales
Years Ended December 31
2009 2008
Amount % Amount %
Customer A $ 161,251,368 54 $ 192,986,719 58
g. Total purchases from or sales to related parties of at least NT$100 million or 20% of the paid-in capital: Please see Table 4 attached;
h. Receivable from related parties amounting to at least NT$100 million or 20% of the paid-in capital: Please see Table 5 attached;
i. Names, locations, and related information of investees on which the Company exercises significant influence: Please see Table 6 attached;
j. Information about derivatives of investees over which the Company has a controlling interest:
TSMC China entered into forward exchange contracts during the year ended December 31, 2009 to manage exposures due to foreign exchange rate fluctuations.
As of December 31, 2009, no forward exchange contracts of TSMC China was outstanding. For the year ended December 31, 2009, net losses arising from forward exchange contracts of TSMC China were NT$866 thousand.
Xintec entered into forward exchange contracts during the year ended December 31, 2009 to manage exposures due to foreign exchange rate fluctuations. Outstanding forward exchange contracts as of December 31, 2009:
29. SEGMENT FINANCIAL INFORMATION
a. Industry financial information
The Company operates in one industry. Therefore, the disclosure of industry financial information is not applicable to the Company.
b. Geographic information
The Company has no significant foreign operations. Therefore, the disclosure of geographic information is not applicable to the Company.
c. Export sales

28
TABLE 1
Taiwan Semiconductor Manufacturing Company Limited and Investees
MARKETABLE SECURITIES HELD DECEMBER 31, 2009(Amounts in Thousands of New Taiwan Dollars, Unless Specified Otherwise)
(Continued)
Held Company Name Marketable Securities Type and NameRelationship with the Company
Financial Statement Account
December 31, 2009
NoteShares/Units(In Thousands)
Carrying Value(US$ in Thousands)
Percentage of Ownership (%)
Market Value or Net Asset Value
(US$ in Thousands)
TSMC Corporate bondTaiwan Mobile Co., Ltd. - Available-for-sale financial assets - $ 1,046,672 N/A $ 1,046,672Formosa Petrochemical Corporation - Held-to-maturity financial assets - 3,178,551 N/A 3,200,302Taiwan Power Company - 〃 - 3,004,941 N/A 3,011,743Nan Ya Plastics Corporation - 〃 - 2,000,145 N/A 2,029,935Formosa Plastics Corporation - 〃 - 1,671,815 N/A 1,685,345China Steel Corporation - 〃 - 1,512,130 N/A 1,528,117CPC Corporation, Taiwan - 〃 - 500,031 N/A 499,913Taipei Fubon Commercial Bank Co., Ltd. - 〃 - 298,884 N/A 298,751First Commercial Bank Co., Ltd. - 〃 - 99,814 N/A 99,815
Government bondEuropean Investment Bank Bonds - Held-to-maturity financial assets - 2,003,877 N/A 2,025,5002003 Asian Development Bank Govt. Bond - 〃 - 893,710 N/A 875,103
StockTSMC Global Subsidiary In vestments accounted for using
equity method1 45,397,256 100 45,397,256
TSMC Partners Subsidiary 〃 988,268 32,545,619 100 32,545,619VIS Investee accounted for using
equity method〃 628,223 9,365,232 37 10,114,398
SSMC Investee accounted for using equity method
〃 314 6,157,141 39 5,581,994
TSMC North America Subsidiary 〃 11,000 2,723,727 100 2,723,727Xintec Investee with a controlling
financial interest〃 93,081 1,475,014 41 1,437,395
GUC Investee with a controlling financial interest
〃 46,688 983,126 35 7,913,592
TSMC Europe Subsidiary 〃 - 159,467 100 159,467TSMC Japan Subsidiary 〃 6 135,663 100 135,663TSMC Korea Subsidiary 〃 80 18,519 100 18,519United Industrial Gases Co., Ltd. - Financial assets carried at cost 16,783 193,584 10 297,655Shin-Etsu Handotai Taiwan Co., Ltd. - 〃 10,500 105,000 7 332,943W.K. Technology Fund IV - 〃 4,000 40,000 2 43,975
FundHorizon Ventures Fund - Financial assets carried at cost - 103,992 12 103,992Crimson Asia Capital - 〃 - 59,412 1 59,412
CapitalTSMC China Subsidiary In vestments accounted for using
equity method- 2,961,043 100 2,958,707
VTAF III Subsidiary 〃 - 1,309,615 98 1,292,412VTAF II Subsidiary 〃 - 1,122,810 98 1,117,773Emerging Alliance Subsidiary 〃 - 305,866 99 305,866
TSMC Partners Corporate bondGeneral Elec Cap Corp. Mtn - Held-to-maturity financial assets - US$ 20,543 N/A US$ 21,312General Elec Cap Corp. Mtn - 〃 - US$ 20,219 N/A US$ 21,182

29
Held Company Name Marketable Securities Type and NameRelationship with the Company
Financial Statement Account
December 31, 2009
NoteShares/Units(In Thousands)
Carrying Value(US$ in Thousands)
Percentage of Ownership (%)
Market Value or Net Asset Value
(US$ in Thousands)
Common stockTSMC Development, Inc. (TSMC Development) Subsidiary In vestments accounted for using
equity method 1 US$ 340,387 100 US$ 340,387
VisEra Holding Company In estee accounted for using equity method
〃 43,000 US$ 70,967 49 US$ 70,967
InveStar Semiconductor Development Fund, Inc. (II) LDC. (ISDF II) Subsidiary 〃 21,415 US$ 13,741 97 US$ 13,741TSMC Technology Subsidiary 〃 1 US$ 9,071 100 US$ 9,071InveStar Semiconductor Development Fund, Inc. (ISDF) Subsidiary 〃 7,680 US$ 7,336 97 US$ 7,336TSMC Canada Subsidiary 〃 2,300 US$ 3,193 100 US$ 3,193Mcube Inc. In vestee accounted for using
equity method〃 5,333 US$ 800 70 US$ 800
Preferred stockMcube Inc. In vestee accounted for using
equity methodIn vestments accounted for using
equity method1,000 US$ 1,000 10 US$ 1,000
TSMC Development Corporate bondGE Capital Corp. - Held-to-maturity financial assets - US$ 20,334 N/A US$ 21,182JP Morgan Chase & Co. - 〃 - US$ 15,000 N/A US$ 15,000
StockWaferTech Subsidiary In vestments accounted for using
equity method293,637 US$ 154,432 100 US$ 154,432
Emerging Alliance Common stockRichWave Technology Corp. - Financial assets carried at cost 4,247 US$ 1,648 10 US$ 1,648Global Investment Holding Inc. - 〃 10,000 US$ 3,065 6 US$ 3,065
Preferred stockAudience, Inc. - Financial assets carried at cost 1,654 US$ 250 1 US$ 250Axiom Microdevices, Inc. - 〃 1,000 US$ 24 1 US$ 24Mosaic Systems, Inc. - 〃 2,481 US$ 12 6 US$ 12Next IO, Inc. - 〃 800 US$ 500 1 US$ 500Optichron, Inc. - 〃 1,281 US$ 1,072 2 US$ 1,072Pixim, Inc. - 〃 4,641 US$ 1,137 2 US$ 1,137QST Holdings, LLC - 〃 - US$ 131 4 US$ 131Teknovus, Inc. - 〃 6,977 US$ 1,327 2 US$ 1,327
CapitalVentureTech Alliance Holdings, LLC (VTA Holdings) Subsidiary In vestments accounted for using
equity method- - 7 -
VTAF II Common stockLeadtrend - Av ailable-for-sale financial assets 1,515 US$ 9,721 4 US$ 9,721RichWave Technology Corp. - Financial assets carried at cost 1,043 US$ 730 1 US$ 730Sentelic - 〃 1,200 US$ 2,040 15 US$ 2,040
Preferred stock5V Technologies, Inc. - Financial assets carried at cost 2,890 US$ 2,168 4 US$ 2,168
(Continued)

30
Held Company Name Marketable Securities Type and NameRelationship with the Company
Financial Statement Account
December 31, 2009
NoteShares/Units(In Thousands)
Carrying Value(US$ in Thousands)
Percentage of Ownership (%)
Market Value or Net Asset Value
(US$ in Thousands)
Aquantia - Financial assets carried at cost 3,974 US$ 3,816 5 US$ 3,816Audience, Inc. - 〃 7,956 US$ 1,838 2 US$ 1,838Axiom Microdevices, Inc. - 〃 759 US$ 650 13 US$ 650Beceem Communications - 〃 834 US$ 1,701 1 US$ 1,701Impinj, Inc. - 〃 475 US$ 1,000 - US$ 1,000Next IO, Inc. - 〃 3,795 US$ 953 2 US$ 953Optichron, Inc. - 〃 2,784 US$ 2,664 4 US$ 2,664Pixim, Inc. - 〃 33,347 US$ 1,878 2 US$ 1,878Power Analog Microelectronics - 〃 7,027 US$ 3,383 19 US$ 3,383QST Holdings, LLC - 〃 - US$ 593 13 US$ 593Teknovus, Inc. - 〃 1,599 US$ 454 - US$ 454Xceive - 〃 3,936 US$ 1,516 2 US$ 1,516
CapitalVTA Holdings Subsidiary In vestments accounted for using
equity method- - 31 -
VTAF III Common stockMutual-Pak Technology Co., Ltd. Subsidiary In vestments accounted for using
equity method9,180 US$ 2,112 59 US$ 2,112
Acionn Technology Corporation In vestee accounted for using equity method
〃 4,500 US$ 566 42 US$ 566
Preferred stockAuramicro, Inc. - Financial assets carried at cost 4,694 US$ 1,408 20 US$ 1,408BridgeLux, Inc. - 〃 4,955 US$ 6,391 4 US$ 6,391Exclara, Inc. - 〃 21,708 US$ 4,568 18 US$ 4,568GTBF, Inc. - 〃 1,154 US$ 1,500 N/A US$ 1,500InvenSense, Inc. - 〃 816 US$ 1,000 1 US$ 1,000LiquidLeds Lighting Corp. - 〃 1,600 US$ 800 11 US$ 800M2000, Inc. - 〃 3,000 US$ 3,000 5 US$ 3,000Neoconix, Inc. - 〃 3,283 US$ 4,608 6 US$ 4,608Powervation, Ltd. - 〃 310 US$ 4,678 16 US$ 4,678Quellan, Inc. - 〃 3,106 US$ 457 6 US$ 457Silicon Technical Services, LLC - 〃 1,055 US$ 1,208 1 US$ 1,208Tilera, Inc. - 〃 3,222 US$ 2,781 3 US$ 2,781Validity Sensors, Inc. - 〃 8,070 US$ 3,089 3 US$ 3,089
CapitalGrowth Fund Limited (Growth Fund) Subsidiary In vestments accounted for using
equity method- US$ 823 100 US$ 823
VTA Holdings Subsidiary 〃 - - 62 -
Growth Fund Common stockStaccato - Financial assets carried at cost 10 US$ 25 - US$ 25SiliconBlue Technologies, Inc. - 〃 5,107 US$ 762 2 US$ 762
ISDF Common stockMemsic, Inc. - Available-for-sale financial assets 1,364 US$ 4,472 6 US$ 4,472Capella Microsystems (Taiwan), Inc. - Financial assets carried at cost 557 US$ 154 2 US$ 154
Preferred stockIntegrated Memory Logic, Inc. - Financial assets carried at cost 2,872 US$ 1,221 9 US$ 1,221IP Unity, Inc. - 〃 1,008 US$ 290 1 US$ 290Sonics, Inc. - 〃 230 US$ 497 2 US$ 497
ISDF II Common stockMemsic, Inc. - Available-for-sale financial assets 1,145 US$ 3,754 5 US$ 3,754Sonics, Inc. - Financial assets carried at cost 278 US$ 10 3 US$ 10
(Continued)
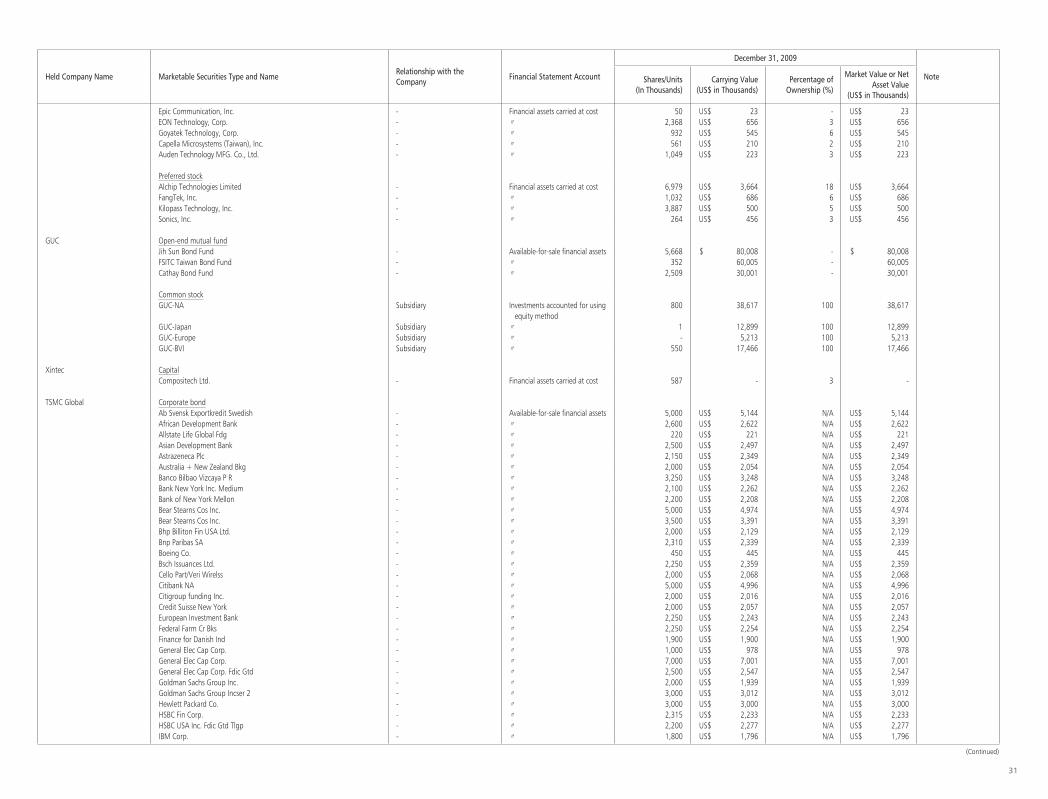
31
Held Company Name Marketable Securities Type and NameRelationship with the Company
Financial Statement Account
December 31, 2009
NoteShares/Units(In Thousands)
Carrying Value(US$ in Thousands)
Percentage of Ownership (%)
Market Value or Net Asset Value
(US$ in Thousands)
Epic Communication, Inc. - Financial assets carried at cost 50 US$ 23 - US$ 23EON Technology, Corp. - 〃 2,368 US$ 656 3 US$ 656Goyatek Technology, Corp. - 〃 932 US$ 545 6 US$ 545Capella Microsystems (Taiwan), Inc. - 〃 561 US$ 210 2 US$ 210Auden Technology MFG. Co., Ltd. - 〃 1,049 US$ 223 3 US$ 223
Preferred stockAlchip Technologies Limited - Financial assets carried at cost 6,979 US$ 3,664 18 US$ 3,664FangTek, Inc. - 〃 1,032 US$ 686 6 US$ 686Kilopass Technology, Inc. - 〃 3,887 US$ 500 5 US$ 500Sonics, Inc. - 〃 264 US$ 456 3 US$ 456
GUC Open-end mutual fundJih Sun Bond Fund - Available-for-sale financial assets 5,668 $ 80,008 - $ 80,008FSITC Taiwan Bond Fund - 〃 352 60,005 - 60,005Cathay Bond Fund - 〃 2,509 30,001 - 30,001
Common stockGUC-NA Subsidiary In vestments accounted for using
equity method800 38,617 100 38,617
GUC-Japan Subsidiary 〃 1 12,899 100 12,899GUC-Europe Subsidiary 〃 - 5,213 100 5,213GUC-BVI Subsidiary 〃 550 17,466 100 17,466
Xintec CapitalCompositech Ltd. - Financial assets carried at cost 587 - 3 -
TSMC Global Corporate bondAb Svensk Exportkredit Swedish - Available-for-sale financial assets 5,000 US$ 5,144 N/A US$ 5,144African Development Bank - 〃 2,600 US$ 2,622 N/A US$ 2,622Allstate Life Global Fdg - 〃 220 US$ 221 N/A US$ 221Asian Development Bank - 〃 2,500 US$ 2,497 N/A US$ 2,497Astrazeneca Plc - 〃 2,150 US$ 2,349 N/A US$ 2,349Australia + New Zealand Bkg - 〃 2,000 US$ 2,054 N/A US$ 2,054Banco Bilbao Vizcaya P R - 〃 3,250 US$ 3,248 N/A US$ 3,248Bank New York Inc. Medium - 〃 2,100 US$ 2,262 N/A US$ 2,262Bank of New York Mellon - 〃 2,200 US$ 2,208 N/A US$ 2,208Bear Stearns Cos Inc. - 〃 5,000 US$ 4,974 N/A US$ 4,974Bear Stearns Cos Inc. - 〃 3,500 US$ 3,391 N/A US$ 3,391Bhp Billiton Fin USA Ltd. - 〃 2,000 US$ 2,129 N/A US$ 2,129Bnp Paribas SA - 〃 2,310 US$ 2,339 N/A US$ 2,339Boeing Co. - 〃 450 US$ 445 N/A US$ 445Bsch Issuances Ltd. - 〃 2,250 US$ 2,359 N/A US$ 2,359Cello Part/Veri Wirelss - 〃 2,000 US$ 2,068 N/A US$ 2,068Citibank NA - 〃 5,000 US$ 4,996 N/A US$ 4,996Citigroup funding Inc. - 〃 2,000 US$ 2,016 N/A US$ 2,016Credit Suisse New York - 〃 2,000 US$ 2,057 N/A US$ 2,057European Investment Bank - 〃 2,250 US$ 2,243 N/A US$ 2,243Federal Farm Cr Bks - 〃 2,250 US$ 2,254 N/A US$ 2,254Finance for Danish Ind - 〃 1,900 US$ 1,900 N/A US$ 1,900General Elec Cap Corp. - 〃 1,000 US$ 978 N/A US$ 978General Elec Cap Corp. - 〃 7,000 US$ 7,001 N/A US$ 7,001General Elec Cap Corp. Fdic Gtd - 〃 2,500 US$ 2,547 N/A US$ 2,547Goldman Sachs Group Inc. - 〃 2,000 US$ 1,939 N/A US$ 1,939Goldman Sachs Group Incser 2 - 〃 3,000 US$ 3,012 N/A US$ 3,012Hewlett Packard Co. - 〃 3,000 US$ 3,000 N/A US$ 3,000HSBC Fin Corp. - 〃 2,315 US$ 2,233 N/A US$ 2,233HSBC USA Inc. Fdic Gtd Tlgp - 〃 2,200 US$ 2,277 N/A US$ 2,277IBM Corp. - 〃 1,800 US$ 1,796 N/A US$ 1,796
(Continued)

32
Held Company Name Marketable Securities Type and NameRelationship with the Company
Financial Statement Account
December 31, 2009
NoteShares/Units(In Thousands)
Carrying Value(US$ in Thousands)
Percentage of Ownership (%)
Market Value or Net Asset Value
(US$ in Thousands)
International Business Machs - Available-for-sale financial assets 3,000 US$ 3,027 N/A US$ 3,027Intl Bk Recon + Develop - 〃 2,000 US$ 2,069 N/A US$ 2,069JP Morgan Chase + Co. - 〃 2,500 US$ 2,523 N/A US$ 2,523JP Morgan Chase + Co. Fdic Gtd Tlg - 〃 3,000 US$ 3,030 N/A US$ 3,030Kfw - 〃 2,230 US$ 2,236 N/A US$ 2,236Kfw Medium Term Nts Book Entry - 〃 1,950 US$ 1,953 N/A US$ 1,953Kreditanstalt Fur Wiederaufbau - 〃 650 US$ 673 N/A US$ 673Lloyds Tsb Bank Plc Ser 144A - 〃 5,950 US$ 6,049 N/A US$ 6,049Mellon Fdg Corp. - 〃 3,500 US$ 3,419 N/A US$ 3,419Met Life Glob Funding I - 〃 2,100 US$ 2,142 N/A US$ 2,142Met Life Glob Funding I - 〃 500 US$ 502 N/A US$ 502Metlife Inc. - 〃 2,000 US$ 2,017 N/A US$ 2,017Metropolitan Life Global Fdg - 〃 750 US$ 739 N/A US$ 739Metropolitan Life Global Fdg I - 〃 3,340 US$ 3,278 N/A US$ 3,278Morgan Stanley - 〃 2,200 US$ 2,212 N/A US$ 2,212Morgan Stanley - 〃 2,000 US$ 2,032 N/A US$ 2,032Morgan Stanley Fdic Gtd Tlgp - 〃 2,210 US$ 2,244 N/A US$ 2,244Morgan Stanley for Equity - 〃 2,000 US$ 1,943 N/A US$ 1,943Nordea Bank Fld Plc - 〃 2,250 US$ 2,240 N/A US$ 2,240Oesterreichische Kontrollbank - 〃 2,000 US$ 2,059 N/A US$ 2,059Ontario (Province of) - 〃 2,000 US$ 1,980 N/A US$ 1,980Paccar Finl Corp. Mtn Bk Ent - 〃 1,000 US$ 1,007 N/A US$ 1,007Pricoa Global Fdg I Med Term - 〃 1,750 US$ 1,638 N/A US$ 1,638Pricoa Global Funding 1 - 〃 1,200 US$ 1,167 N/A US$ 1,167Pricoa Global Fdg I Medium - 〃 2,200 US$ 2,130 N/A US$ 2,130Royal Bk of Scotland Plc - 〃 5,000 US$ 5,078 N/A US$ 5,078Royal Bk Scotlnd Grp Plc 144A - 〃 9,450 US$ 9,578 N/A US$ 9,578Southern Co. - 〃 600 US$ 602 N/A US$ 602Sovereign Bancorp Fdic Gtd Tlg - 〃 2,200 US$ 2,246 N/A US$ 2,246State Str Corp. - 〃 1,940 US$ 1,920 N/A US$ 1,920Suncorp Metway Ltd. - 〃 2,000 US$ 2,004 N/A US$ 2,004Suncorp Metway Ltd. - 〃 5,000 US$ 5,170 N/A US$ 5,170Svenska Handelsbanken Ab - 〃 2,200 US$ 2,214 N/A US$ 2,214Swedbank Ab - 〃 2,000 US$ 1,994 N/A US$ 1,994Swedbank Foreningssparbanken A - 〃 1,500 US$ 1,537 N/A US$ 1,537Ubs Ag Stamford - 〃 1,300 US$ 1,300 N/A US$ 1,300US Central Federal Cred - 〃 4,800 US$ 4,799 N/A US$ 4,799Verizon Communications Inc. - 〃 2,200 US$ 2,294 N/A US$ 2,294Verizon Global Fdg Corp. - 〃 500 US$ 528 N/A US$ 528Wachovia Corp. New - 〃 4,000 US$ 4,246 N/A US$ 4,246Wells Fargo + Company - 〃 2,000 US$ 2,013 N/A US$ 2,013Westfield Cap Corp. Ltd. - 〃 500 US$ 514 N/A US$ 514Westpac Banking Corp. - 〃 2,100 US$ 2,112 N/A US$ 2,112Westpac Banking Corp. - 〃 2,170 US$ 2,168 N/A US$ 2,168Nationwide Building Society - Held-to-maturity financial assets 8,000 US$ 8,000 N/A US$ 8,008Westpac Banking Corp. 12/12 Frn - 〃 5,000 US$ 5,000 N/A US$ 4,999
Agency bondFannif Mae - Available-for-sale financial assets 2,820 US$ 2,814 N/A US$ 2,814Fed Hm Ln Pc Pool 1b2830 - 〃 2,554 US$ 2,635 N/A US$ 2,635Fed Hm Ln Pc Pool 1g0115 - 〃 2,271 US$ 2,315 N/A US$ 2,315Fed Hm Ln Pc Pool 1k1210 - 〃 2,053 US$ 2,121 N/A US$ 2,121Fed Hm Ln Pc Pool 780741 - 〃 2,121 US$ 2,181 N/A US$ 2,181Federal Farm Cr Bks - 〃 2,000 US$ 2,117 N/A US$ 2,117Federal Farm Credit Bank - 〃 3,000 US$ 2,990 N/A US$ 2,990Federal Farm Credit Bank - 〃 2,200 US$ 2,258 N/A US$ 2,258Federal Home Ln Bank - 〃 11,000 US$ 11,028 N/A US$ 11,028Federal Home Ln Mtg Corp. - 〃 1,350 US$ 1,352 N/A US$ 1,352Federal Home Ln Mtg Corp. - 〃 3,421 US$ 3,533 N/A US$ 3,533
(Continued)
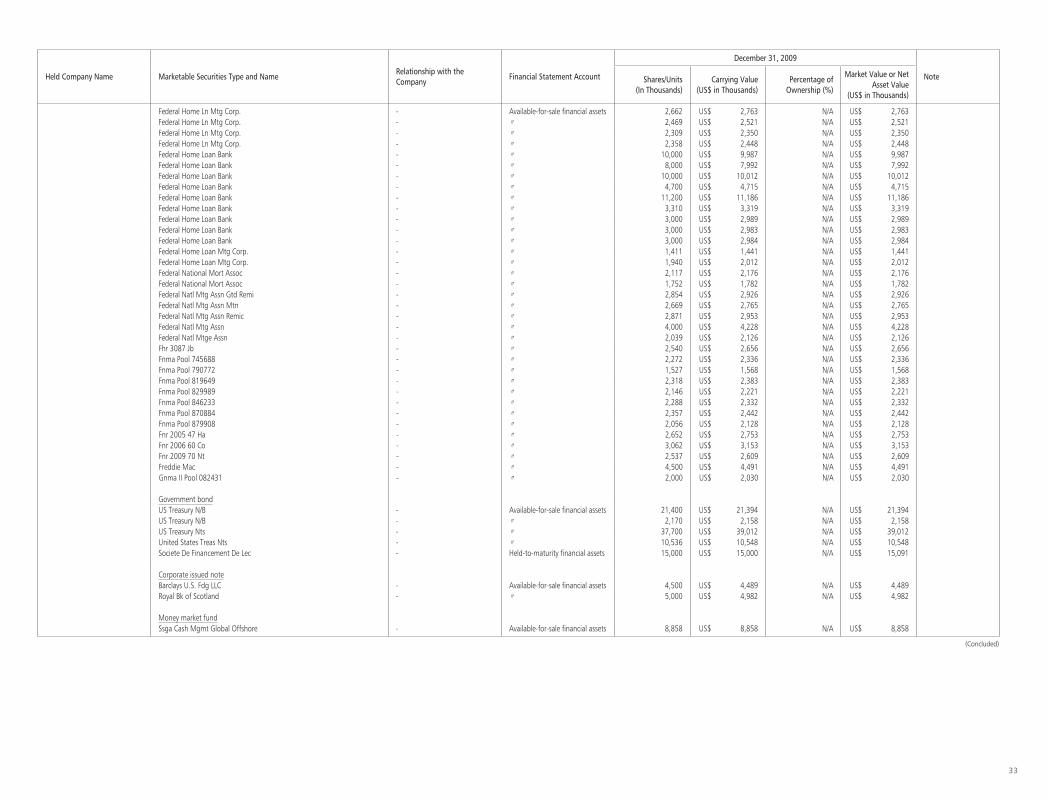
33
Held Company Name Marketable Securities Type and NameRelationship with the Company
Financial Statement Account
December 31, 2009
NoteShares/Units(In Thousands)
Carrying Value(US$ in Thousands)
Percentage of Ownership (%)
Market Value or Net Asset Value
(US$ in Thousands)
Federal Home Ln Mtg Corp. - Available-for-sale financial assets 2,662 US$ 2,763 N/A US$ 2,763Federal Home Ln Mtg Corp. - 〃 2,469 US$ 2,521 N/A US$ 2,521Federal Home Ln Mtg Corp. - 〃 2,309 US$ 2,350 N/A US$ 2,350Federal Home Ln Mtg Corp. - 〃 2,358 US$ 2,448 N/A US$ 2,448Federal Home Loan Bank - 〃 10,000 US$ 9,987 N/A US$ 9,987Federal Home Loan Bank - 〃 8,000 US$ 7,992 N/A US$ 7,992Federal Home Loan Bank - 〃 10,000 US$ 10,012 N/A US$ 10,012Federal Home Loan Bank - 〃 4,700 US$ 4,715 N/A US$ 4,715Federal Home Loan Bank - 〃 11,200 US$ 11,186 N/A US$ 11,186Federal Home Loan Bank - 〃 3,310 US$ 3,319 N/A US$ 3,319Federal Home Loan Bank - 〃 3,000 US$ 2,989 N/A US$ 2,989Federal Home Loan Bank - 〃 3,000 US$ 2,983 N/A US$ 2,983Federal Home Loan Bank - 〃 3,000 US$ 2,984 N/A US$ 2,984Federal Home Loan Mtg Corp. - 〃 1,411 US$ 1,441 N/A US$ 1,441Federal Home Loan Mtg Corp. - 〃 1,940 US$ 2,012 N/A US$ 2,012Federal National Mort Assoc - 〃 2,117 US$ 2,176 N/A US$ 2,176Federal National Mort Assoc - 〃 1,752 US$ 1,782 N/A US$ 1,782Federal Natl Mtg Assn Gtd Remi - 〃 2,854 US$ 2,926 N/A US$ 2,926Federal Natl Mtg Assn Mtn - 〃 2,669 US$ 2,765 N/A US$ 2,765Federal Natl Mtg Assn Remic - 〃 2,871 US$ 2,953 N/A US$ 2,953Federal Natl Mtg Assn - 〃 4,000 US$ 4,228 N/A US$ 4,228Federal Natl Mtge Assn - 〃 2,039 US$ 2,126 N/A US$ 2,126Fhr 3087 Jb - 〃 2,540 US$ 2,656 N/A US$ 2,656Fnma Pool 745688 - 〃 2,272 US$ 2,336 N/A US$ 2,336Fnma Pool 790772 - 〃 1,527 US$ 1,568 N/A US$ 1,568Fnma Pool 819649 - 〃 2,318 US$ 2,383 N/A US$ 2,383Fnma Pool 829989 - 〃 2,146 US$ 2,221 N/A US$ 2,221Fnma Pool 846233 - 〃 2,288 US$ 2,332 N/A US$ 2,332Fnma Pool 870884 - 〃 2,357 US$ 2,442 N/A US$ 2,442Fnma Pool 879908 - 〃 2,056 US$ 2,128 N/A US$ 2,128Fnr 2005 47 Ha - 〃 2,652 US$ 2,753 N/A US$ 2,753Fnr 2006 60 Co - 〃 3,062 US$ 3,153 N/A US$ 3,153Fnr 2009 70 Nt - 〃 2,537 US$ 2,609 N/A US$ 2,609Freddie Mac - 〃 4,500 US$ 4,491 N/A US$ 4,491Gnma II Pool 082431 - 〃 2,000 US$ 2,030 N/A US$ 2,030
Government bondUS Treasury N/B - Available-for-sale financial assets 21,400 US$ 21,394 N/A US$ 21,394US Treasury N/B - 〃 2,170 US$ 2,158 N/A US$ 2,158US Treasury Nts - 〃 37,700 US$ 39,012 N/A US$ 39,012United States Treas Nts - 〃 10,536 US$ 10,548 N/A US$ 10,548Societe De Financement De Lec - Held-to-maturity financial assets 15,000 US$ 15,000 N/A US$ 15,091
Corporate issued noteBarclays U.S. Fdg LLC - Available-for-sale financial assets 4,500 US$ 4,489 N/A US$ 4,489Royal Bk of Scotland - 〃 5,000 US$ 4,982 N/A US$ 4,982
Money market fundSsga Cash Mgmt Global Offshore - Available-for-sale financial assets 8,858 US$ 8,858 N/A US$ 8,858
(Concluded)

34
TABLE 2
Taiwan Semiconductor Manufacturing Company Limited and Investees
MARKETABLE SECURITIES ACQUIRED AND DISPOSED OF AT COSTS OR PRICES OF AT LEAST NT$100 MILLION OR 20% OF THE PAID-IN CAPITALFOR THE YEAR ENDED DECEMBER 31, 2009(Amounts in Thousands of New Taiwan Dollars, Unless Specified Otherwise)
Company Name
Marketable Securities Type and Name
Financial Statement Account
Counter-partyNature of Relationship
Beginning Balance Acquisition Disposal (Note 2) Ending Balance (Note 3)
Shares/Units(In Thousands)
Amount(US$ in
Thousands)
Shares/Units(In Thousands)
(Note 1)
Amount(US$ in
Thousands)
Shares/Units(In Thousands)
Amount(US$ in
Thousands)
Carrying Value (US$ in
Thousands)
Gain (Loss) or Disposal (US$ in Thousands)
Shares/Units(In Thousands)
Amount (US$ in Thousands)
TSMC Corporate bondTaiwan Mobile Co., Ltd. Available-for-sale
financial assetsGrand Cathay Securities Corp. and
several financial institutions- - $ 2,032,658 - $ - - $ 1,037,370 $ 1,000,000 $ 37,370 - $ 1,046,672
Formosa Petrochemical Corporation Held-to-maturity financial assets
〃 - - 3,554,908 - 457,351 - - - - - 3,178,551
Taiwan Power Company 〃 〃 - - 4,209,629 - 203,892 - - - - - 3,004,941Formosa Plastic Corporation 〃 〃 - - 2,385,285 - 203,994 - - - - - 1,671,815China Steel Corporation 〃 〃 - - 1,000,000 - 514,672 - - - - - 1,512,130Taipei Fubon Commercial Bank Co.,
Ltd.〃 〃 - - - - 298,677 - - - - - 298,884
Government bondEuropean Investment Bank Bonds Held-to-maturity
financial assetsGrand Cathay Securities Corp. and
several financial institutions- - 383,387 - 2,025,500 - 400,000 383,909 16,091 - 2,003,876
CapitalVTAF III Investments
accounted for using equity method
- Subsidiary - 1,305,605 - 262,922 - - - - - 1,309,615
TSMC Corporate bond Development JP Morgan Chase & Co. Held-to-maturity
financial assetsJP Morgan Securitied Inc. - - - - US$ 15,000 - - - - - US$ 15,000
GUC Open-end mutual fundJih Sun Bond Fund Av ailable-for-sale
financial assetsJih Sun Investment Trust Co., Ltd. - - - 19,143 270,000 13,475 190,120 190,000 120 5,668 80,008
FSITC Taiwan Bond Fund 〃 First Securities Investment Trust Co., Ltd.
- - - 1,146 195,000 794 135,206 135,000 206 352 60,005
Prudential Financial Bond Fund 〃 Prudential Financial Securities Investment Trust Enterprise
- - - 11,261 170,000 11,261 170,319 170,000 319 - -
PCA Well Pool Fund 〃 PCA Securities Investment Trust Co., Ltd.
- - - 13,121 170,000 13,121 170,241 170,000 241 - -
Hua Nan Phoenix Bond Fund 〃 Hua Nan Investment Trust Co., Ltd. - - - 10,287 160,000 10,287 160,143 160,000 143 - -
T SMC Global Corporate bondAb Svensk Exportkredit Swedish Av ailable-for-sale
financial assets- - - - 5,000 US$ 5,185 - - - - 5,000 US$ 5,144
Banco Bilbao Vizcaya P R 〃 - - - - 3,250 US$ 3,250 - - - - 3,250 US$ 3,248Bear Stearns Cos Inc. 〃 - - - - 5,000 US$ 4,965 - - - - 5,000 US$ 4,974Bear Stearns Cos Inc. 〃 - - - - 3,500 US$ 3,360 - - - - 3,500 US$ 3,391Chase Manhattan Corp. New 〃 - - 3,250 US$ 3,353 - - 3,250 US$ 3,380 US$ 3,480 US$ (100) - -Citibank NA 〃 - - - - 3,000 US$ 3,002 3,000 US$ 3,002 US$ 3,002 - - -Citibank NA 〃 - - - - 5,000 US$ 4,995 - - - - 5,000 US$ 4,996Deutsche Bank Ag London 〃 - - 2,995 US$ 3,013 - - 2,995 US$ 3,021 US$ 3,041 US$ (20) - -General Elec Cap Corp. 〃 - - - - 5,000 US$ 4,834 4,000 US$ 3,880 US$ 3,868 US$ 12 1,000 US$ 978General Elec Cap Corp. 〃 - - - - 7,000 US$ 7,002 - - - - 7,000 US$ 7,001Goldman Sachs Group Incser 2 〃 - - - - 3,000 US$ 3,016 - - - - 3,000 US$ 3,012
(Continued)

35
Company Name
Marketable Securities Type and Name
Financial Statement Account
Counter-partyNature of Relationship
Beginning Balance Acquisition Disposal (Note 2) Ending Balance (Note 3)
Shares/Units(In Thousands)
Amount(US$ in
Thousands)
Shares/Units(In Thousands)
(Note 1)
Amount(US$ in
Thousands)
Shares/Units(In Thousands)
Amount(US$ in
Thousands)
Carrying Value (US$ in
Thousands)
Gain (Loss) or Disposal (US$ in Thousands)
Shares/Units(In Thousands)
Amount (US$ in Thousands)
International Business Machs Av ailable-for-sale financial assets
- - - US$ - 3,000 US$ 3,030 - US$ - US$ - US$ - 3,000 US$ 3,027
JP Morgan Chase + Co. Fdic Gtd Tlg 〃 - - - - 3,000 US$ 3,030 - - - - 3,000 US$ 3,030Keycorp Fdic Gtd Tlgp 〃 - - - - 5,000 US$ 5,061 5,000 US$ 5,061 US$ 5,061 - - -Lloyds Tsb Bank Plc Ser 144A 〃 - - - - 5,950 US$ 6,077 - - - - 5,950 US$ 6,049Mellon Fdg Corp. 〃 - - - - 3,500 US$ 3,404 - - - - 3,500 US$ 3,419Metropolitan Life Global Fdg I 〃 - - - - 3,340 US$ 3,245 - - - - 3,340 US$ 3,278Morgan Stanley 〃 - - 4,855 US$ 4,552 - - 4,855 US$ 4,751 US$ 4,768 US$ (17) - -Royal Bk of Scotland Plc 〃 - - - - 5,000 US$ 5,106 - - - - 5,000 US$ 5,078Royal Bk Scotlnd Grp Plc 144A 〃 - - - - 9,450 US$ 9,596 - - - - 9,450 US$ 9,578Suncorp Metway Ltd. 〃 - - - - 5,000 US$ 5,192 - - - - 5,000 US$ 5,170US Central Federal Cred 〃 - - - - 4,800 US$ 4,799 - - - - 4,800 US$ 4,799Wachovia Corp. New 〃 - - - - 4,000 US$ 4,239 - - - - 4,000 US$ 4,246Wachovia Corp. New 〃 - - 3,130 US$ 3,135 - - 3,130 US$ 3,195 US$ 3,100 US$ 95 - -Wells Fargo + Co. New Med Trm 〃 - - 4,500 US$ 4,493 - - 4,500 US$ 4,524 US$ 4,282 US$ 242 - -Nationwide Building Society He ld-to-maturity
financial assets- - - - 8,000 US$ 8,000 - - - - 8,000 US$ 8,000
Westpac Banking Corp. 12/12 Frn 〃 - - - - 5,000 US$ 5,000 - - - - 5,000 US$ 5,000
Agency bondFed Hm Ln Pc Pool 1g1282 Av ailable-for-sale
financial assets- - 3,215 US$ 3,285 - - 3,179 US$ 3,281 US$ 3,171 US$ 110 - -
Fed Hm Ln Pc Pool b19205 〃 - - 5,449 US$ 5,501 - - 5,335 US$ 5,511 US$ 5,225 US$ 286 - -Fed Home Ln Bank 〃 - - 5,000 US$ 5,305 - - 5,000 US$ 5,282 US$ 5,035 US$ 247 - -Federal Farm Cr Bks 〃 - - 3,400 US$ 3,610 - - 3,400 US$ 3,590 US$ 3,411 US$ 179 - -Federal Farm Credit Bank 〃 - - 3,375 US$ 3,433 - - 3,375 US$ 3,429 US$ 3,370 US$ 59 - -Federal Home Ln Bank 〃 - - - - 11,000 US$ 11,038 - - - - 11,000 US$ 11,028Federal Home Ln Bks 〃 - - 3,725 US$ 3,854 - - 3,725 US$ 3,851 US$ 3,721 US$ 130 - -Federal Home Ln Bks 〃 - - 5,000 US$ 5,320 - - 5,000 US$ 5,312 US$ 5,098 US$ 214 - -Federal Home Ln Bks 〃 - - 4,000 US$ 4,148 - - 4,000 US$ 4,151 US$ 4,136 US$ 15 - -Federal Home Ln Mtg 〃 - - 5,000 US$ 5,340 - - 5,000 US$ 5,334 US$ 5,186 US$ 148 - -Federal Home Ln Mtg Corp. 〃 - - 3,340 US$ 3,428 - - 3,340 US$ 3,431 US$ 3,335 US$ 96 - -Federal Home Ln Mtg Corp. 〃 - - 3,500 US$ 3,560 - - 3,500 US$ 3,561 US$ 3,494 US$ 67 - -Federal Home Ln Mtg Corp. 〃 - - 3,500 US$ 3,743 - - 3,500 US$ 3,749 US$ 3,786 US$ (37) - -Federal Home Ln Mtg Corp. 〃 - - - - 3,679 US$ 3,824 - - - - 3,421 US$ 3,533Federal Home Ln Mtg Corp. 〃 - - 3,060 US$ 3,108 - - 3,005 US$ 3,078 US$ 3,003 US$ 75 - -Federal Home Loan Bank 〃 - - - - 10,000 US$ 9,996 - - - - 10,000 US$ 9,987Federal Home Loan Bank 〃 - - - - 10,000 US$ 10,002 2,000 US$ 2,000 US$ 2,000 - 8,000 US$ 7,992Federal Home Loan Bank 〃 - - - - 10,000 US$ 10,035 - - - - 10,000 US$ 10,012Federal Home Loan Bank 〃 - - - - 4,700 US$ 4,723 - - - - 4,700 US$ 4,715Federal Home Loan Bank 〃 - - - - 11,200 US$ 11,200 - - - - 11,200 US$ 11,186Federal Home Loan Bank 〃 - - - - 3,310 US$ 3,310 - - - - 3,310 US$ 3,319Federal Home Loan Bank 〃 - - - - 3,000 US$ 3,000 - - - - 3,000 US$ 2,984Federal Home Loan Bank 〃 - - 4,500 US$ 4,710 - - 4,500 US$ 4,709 US$ 4,518 US$ 191 - -Federal Natl Mtg Assn 〃 - - - - 9,246 US$ 9,474 9,246 US$ 9,461 US$ 9,474 US$ (13) - -Federal Natl Mtg Assn 〃 - - 3,700 US$ 3,713 - - 3,700 US$ 3,712 US$ 3,700 US$ 12 - -Federal Natl Mtg Assn 〃 - - 4,000 US$ 4,169 - - 4,000 US$ 4,180 US$ 4,117 US$ 63 - -Federal Natl Mtg Assn 〃 - - 3,500 US$ 3,809 - - 3,500 US$ 3,801 US$ 3,645 US$ 156 - -Federal Natl Mtg Assn 〃 - - - - 4,000 US$ 4,261 - - - - 4,000 US$ 4,228Federal Natl Mtg Assn 〃 - - 3,750 US$ 4,134 - - 3,750 US$ 4,127 US$ 4,151 US$ (24) - -
(Continued)
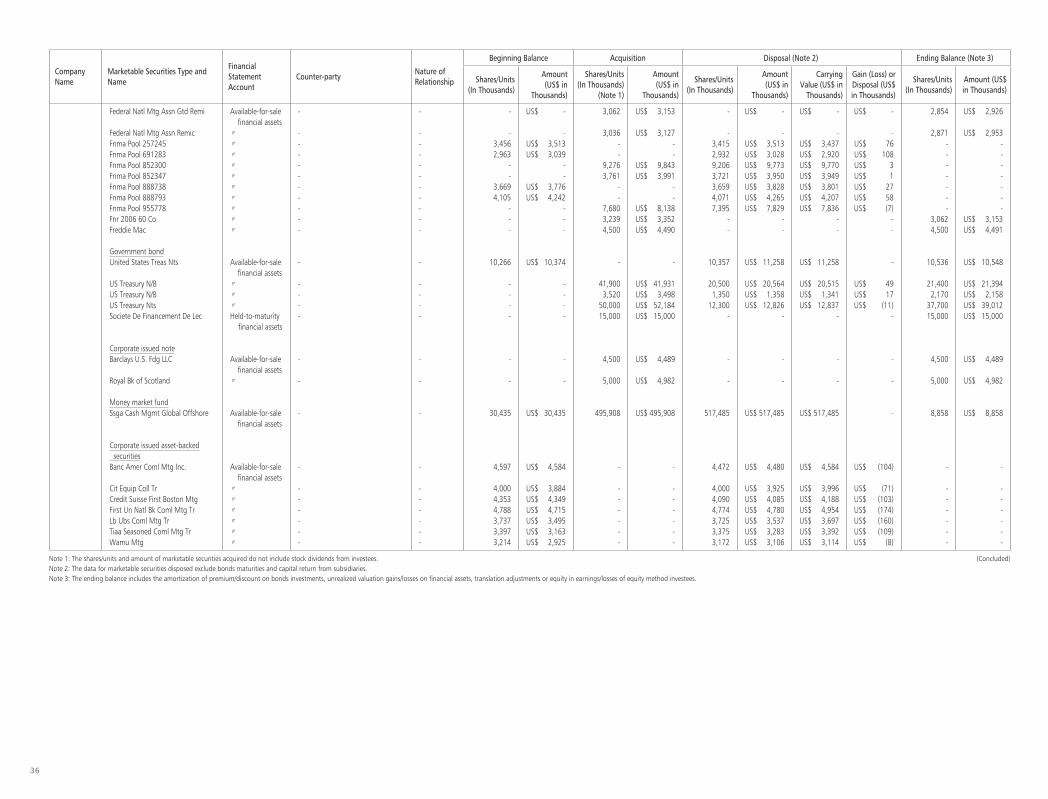
36
Company Name
Marketable Securities Type and Name
Financial Statement Account
Counter-partyNature of Relationship
Beginning Balance Acquisition Disposal (Note 2) Ending Balance (Note 3)
Shares/Units(In Thousands)
Amount(US$ in
Thousands)
Shares/Units(In Thousands)
(Note 1)
Amount(US$ in
Thousands)
Shares/Units(In Thousands)
Amount(US$ in
Thousands)
Carrying Value (US$ in
Thousands)
Gain (Loss) or Disposal (US$ in Thousands)
Shares/Units(In Thousands)
Amount (US$ in Thousands)
Federal Natl Mtg Assn Gtd Remi Av ailable-for-sale financial assets
- - - US$ - 3,062 US$ 3,153 - US$ - US$ - US$ - 2,854 US$ 2,926
Federal Natl Mtg Assn Remic 〃 - - - - 3,036 US$ 3,127 - - - - 2,871 US$ 2,953Fnma Pool 257245 〃 - - 3,456 US$ 3,513 - - 3,415 US$ 3,513 US$ 3,437 US$ 76 - -Fnma Pool 691283 〃 - - 2,963 US$ 3,039 - - 2,932 US$ 3,028 US$ 2,920 US$ 108 - -Fnma Pool 852300 〃 - - - - 9,276 US$ 9,843 9,206 US$ 9,773 US$ 9,770 US$ 3 - -Fnma Pool 852347 〃 - - - - 3,761 US$ 3,991 3,721 US$ 3,950 US$ 3,949 US$ 1 - -Fnma Pool 888738 〃 - - 3,669 US$ 3,776 - - 3,659 US$ 3,828 US$ 3,801 US$ 27 - -Fnma Pool 888793 〃 - - 4,105 US$ 4,242 - - 4,071 US$ 4,265 US$ 4,207 US$ 58 - -Fnma Pool 955778 〃 - - - - 7,680 US$ 8,138 7,395 US$ 7,829 US$ 7,836 US$ (7) - -Fnr 2006 60 Co 〃 - - - - 3,239 US$ 3,352 - - - - 3,062 US$ 3,153Freddie Mac 〃 - - - - 4,500 US$ 4,490 - - - - 4,500 US$ 4,491
Government bondUnited States Treas Nts Av ailable-for-sale
financial assets- - 10,266 US$ 10,374 - - 10,357 US$ 11,258 US$ 11,258 - 10,536 US$ 10,548
US Treasury N/B 〃 - - - - 41,900 US$ 41,931 20,500 US$ 20,564 US$ 20,515 US$ 49 21,400 US$ 21,394US Treasury N/B 〃 - - - - 3,520 US$ 3,498 1,350 US$ 1,358 US$ 1,341 US$ 17 2,170 US$ 2,158US Treasury Nts 〃 - - - - 50,000 US$ 52,184 12,300 US$ 12,826 US$ 12,837 US$ (11) 37,700 US$ 39,012Societe De Financement De Lec He ld-to-maturity
financial assets- - - - 15,000 US$ 15,000 - - - - 15,000 US$ 15,000
Corporate issued noteBarclays U.S. Fdg LLC Av ailable-for-sale
financial assets- - - - 4,500 US$ 4,489 - - - - 4,500 US$ 4,489
Royal Bk of Scotland 〃 - - - - 5,000 US$ 4,982 - - - - 5,000 US$ 4,982
Money market fundSsga Cash Mgmt Global Offshore Av ailable-for-sale
financial assets- - 30,435 US$ 30,435 495,908 US$ 495,908 517,485 US$ 517,485 US$ 517,485 - 8,858 US$ 8,858
Corporate issued asset-backed securitiesBanc Amer Coml Mtg Inc. Av ailable-for-sale
financial assets- - 4,597 US$ 4,584 - - 4,472 US$ 4,480 US$ 4,584 US$ (104) - -
Cit Equip Coll Tr 〃 - - 4,000 US$ 3,884 - - 4,000 US$ 3,925 US$ 3,996 US$ (71) - -Credit Suisse First Boston Mtg 〃 - - 4,353 US$ 4,349 - - 4,090 US$ 4,085 US$ 4,188 US$ (103) - -First Un Natl Bk Coml Mtg Tr 〃 - - 4,788 US$ 4,715 - - 4,774 US$ 4,780 US$ 4,954 US$ (174) - -Lb Ubs Coml Mtg Tr 〃 - - 3,737 US$ 3,495 - - 3,725 US$ 3,537 US$ 3,697 US$ (160) - -Tiaa Seasoned Coml Mtg Tr 〃 - - 3,397 US$ 3,163 - - 3,375 US$ 3,283 US$ 3,392 US$ (109) - -Wamu Mtg 〃 - - 3,214 US$ 2,925 - - 3,172 US$ 3,106 US$ 3,114 US$ (8) - -
Note 1: The shares/units and amount of marketable securities acquired do not include stock dividends from investees.Note 2: The data for marketable securities disposed exclude bonds maturities and capital return from subsidiaries.Note 3: The ending balance includes the amortization of premium/discount on bonds investments, unrealized valuation gains/losses on financial assets, translation adjustments or equity in earnings/losses of equity method investees.
(Concluded)

37
Company Name Types of Property Transaction DateTransaction
AmountPayment Term Counter-party
Nature of Relationships
Prior Transaction of Related Counter-partyPrice Reference
Purpose of Acquisition
Other TermsOwner Relationships Transfer Date Amount
TSMC Fab Oc tober 25, 2009 to December 30, 2009
$ 514,777 By the construction progress
Fu Tsu Construction Co., Ltd. and China Steel Structure Co., Ltd.
- N/A N/A N/A N/A Public bidding Ma nufacturing purpose
None
TABLE 3
Taiwan Semiconductor Manufacturing Company Limited
ACQUISITION OF INDIVIDUAL REAL ESTATE PROPERTIES AT COSTS OF AT LEAST NT$100 MILLION OR 20% OF THE PAID-IN CAPITALFOR THE YEAR ENDED DECEMBER 31, 2009(Amounts in Thousands of New Taiwan Dollars)
TABLE 4
Taiwan Semiconductor Manufacturing Company Limited and Investees
TOTAL PURCHASES FROM OR SALES TO RELATED PARTIES OF AT LEAST NT$100 MILLION OR 20% OF THE PAID-IN CAPITALFOR THE YEAR ENDED DECEMBER 31, 2009(Amounts in Thousands of New Taiwan Dollars)
Company Name Related Party Nature of Relationships
Transaction Details Abnormal Transaction Notes/Accounts Payable or Receivable
NotePurchases/Sales Amount % to Total Payment Terms Unit Price (Note)
Payment Terms(Note)
Ending Balance % to Total
TSMC TSMC North America Subsidiary Sales $ 161,251,368 54 Net 30 days after invoice date - - $ 22,203,242 52GUC Investee with a controlling financial interest Sales 2,023,612 1 Net 30 days after monthly closing - - 338,502 1VIS Investee accounted for using equity method Sales 139,044 - Net 30 days after invoice date - - - -WaferTech Indirect subsidiary Purchases 5,560,707 18 Net 30 days after monthly closing - - (561,165) 5TSMC China Subsidiary Purchases 3,787,113 12 Net 30 days after monthly closing - - (481,500) 4SSMC Investee accounted for using equity method Purchases 3,537,659 11 Net 30 days after monthly closing - - (238,741) 2VIS Investee accounted for using equity method Purchases 3,312,656 10 Net 30 days after monthly closing - - (529,060) 5
GUC TSMC North America Same parent company Purchases 937,160 28 Ne t 30 days after invoice date/net 45 days after monthly closing
- - (173,789) 25
Xintec OmniVision Pa rent company of director (represented for Xintec)
Sales 1,801,655 77 Net 30 days after monthly closing - - 397,695 73
Note: The sales prices and payment terms to related parties were not significantly different from those of sales to third parties. For other related party transactions, prices and terms were determined in accordance with mutual agreements.

38
TABLE 5
Taiwan Semiconductor Manufacturing Company Limited and Investees
RECEIVABLES FROM RELATED PARTIES AMOUNTING TO AT LEAST NT$100 MILLION OR 20% OF THE PAID-IN CAPITALDECEMBER 31, 2009(Amounts in Thousands of New Taiwan Dollars)
Company Name Related Party Nature of Relationships Ending BalanceTurnover Days
(Note 1)
Overdue Amounts Received in Subsequent Period
Allowance for Bad DebtsAmounts Action Taken
TSMC TSMC North America Subsidiary $ 22,211,918 38 $ 6,438,761 - $ 8,899,170 $ -GUC Investee with a controlling financial interest 338,502 50 - - - -TSMC China Subsidiary 111,103 (Note 2) - - - -
Xintec OmniVision Parent company of director (represented for Xintec) 397,695 81 160 - 127,130 -
Note 1: The calculation of turnover days excludes other receivables from related parties.Note 2: The ending balance primarily consisted of other receivables, which is not applicable for the calculation of turnover days.

39
TABLE 6
Taiwan Semiconductor Manufacturing Company Limited and Investees
NAMES, LOCATIONS, AND RELATED INFORMATION OF INVESTEES OVER WHICH THE COMPANY EXERCISES SIGNIFICANT INFLUENCEDECEMBER 31, 2009(Amounts in Thousands of New Taiwan Dollars, Unless Specified Otherwise)
Investor Company Investee Company Location Main Businesses and Products
Original Investment Amount Balance as of December 31, 2009Net Income (Losses) of
the Investee (Foreign
Currencies in Thousands)
Equity in the Earnings
(Losses) (Note 1)(Foreign
Currencies in Thousands)
NoteDecember 31, 2009 (Foreign Currencies in
Thousands)
December 31, 2008 (Foreign Currencies in
Thousands)
Shares (In Thousands)
Percentage of Ownership
Carrying Value (Foreign
Currencies in Thousands)
TSMC TSMC Global Tortola, British Virgin Islands Investment activities $ 42,327,245 $ 42,327,245 1 100 $ 45,397,256 $ 505,232 $ 505,232 SubsidiaryTSMC Partners Tortola, British Virgin Islands Investment in companies involved in the design,
manufacture, and other related business in the semiconductor industry.
31,456,130 31,456,130 988,268 100 32,545,619 (54,907) (54,907) Subsidiary
VIS Hsin-Chu, Taiwan Research, design, development, manufacture, packaging, testing and sale of memory integrated
circuits, LSI, VLSI and related parts
13,232,288 13,232,288 628,223 37 9,365,232 89,241 (368,710) Investee accounted for using equity method
SSMC Singapore Fabrication and supply of integrated circuits 5,120,028 5,120,028 314 39 6,157,141 1,608,714 427,022 Investee accounted for using equity method
TSMC China Shanghai, China Manufacturing and selling of integrated circuits at the order of and pursuant to product design
specifications provided by customers
12,180,367 12,180,367 - 100 2,961,043 (3,244,458) (3,242,122) Subsidiary
TSMC North America San Jose, California, U.S.A. Sales and marketing of integrated circuits and semiconductor devices
333,718 333,718 11,000 100 2,723,727 360,562 360,562 Subsidiary
Xintec Taoyuan, Taiwan Wafer level chip size packaging service 1,357,890 1,357,890 93,081 41 1,475,014 10,597 (20,659) Investee with a controlling financial interest
VTAF III Cayman Islands Investing in new start-up technology companies 1,703,163 1,440,241 - 98 1,309,615 (224,620) (223,546) SubsidiaryVTAF II Cayman Islands Investing in new start-up technology companies 1,093,943 1,036,422 - 98 1,122,810 (178,442) (174,873) SubsidiaryGUC Hsin-Chu, Taiwan Researching, developing, manufacturing, testing
and marketing of integrated circuits386,568 386,568 46,688 35 983,126 412,771 146,384 Investee with a controlling
financial interestEmerging Alliance Cayman Islands Investing in new start-up technology companies 959,044 986,797 - 99 305,866 (92,606) (92,143) SubsidiaryTSMC Europe Amsterdam, the Netherlands Marketing and engineering supporting activities 15,749 15,749 - 100 159,467 35,445 35,445 Subsidiary (Note 3)TSMC Japan Yokohama, Japan Marketing activities 83,760 83,760 6 100 135,663 4,203 4,203 Subsidiary (Note 3)TSMC Korea Seoul, Korea Customer service and technical support activities 13,656 13,656 80 100 18,519 2,392 2,392 Subsidiary (Note 3)
TSMC Partners TSMC Development Delaware, U.S.A. Investment activities US$ 0.001 US$ 0.001 1 100 US$ 340,387 US$ 9,293 Note 2 SubsidiaryVisEra Holding Company Cayman Islands Investment in companies involved in the design,
manufacturing, and other related businesses in the semiconductor industry
US$ 43,000 US$ 43,000 43,000 49 US$ 70,967 US$ 322 Note 2 Investee accounted for using equity method
ISDF II Cayman Islands Investing in new start-up technology companies US$ 21,415 US$ 32,289 21,415 97 US$ 13,741 US$ 960 Note 2 SubsidiaryTSMC Technology Delaware, U.S.A. Engineering support activities US$ 0.001 US$ 0.001 1 100 US$ 9,071 US$ 662 Note 2 SubsidiaryISDF Cayman Islands Investing in new start-up technology companies US$ 7,680 US$ 7,680 7,680 97 US$ 7,336 US$ (1,504) Note 2 SubsidiaryTSMC Canada Ontario, Canada Engineering support activities US$ 2,300 US$ 2,300 2,300 100 US$ 3,193 US$ 210 Note 2 Subsidiary (Note 3)Mcube Inc. (Common Stock) Delaware, U.S.A. Research, development, and sale of micro-
semiconductor deviceUS$ 800 - 5,333 70 US$ 800 US$ (24) Note 2 Investee accounted for
using equity methodMcube Inc. (Preferred Stock) Delaware, U.S.A. Research, development, and sale of micro-
semiconductor deviceUS$ 1,000 - 1,000 10 US$ 1,000 US$ (24) Note 2 Investee accounted for
using equity method
TSMC Development WaferTech Washington, U.S.A. Manufacturing, selling, testing and computer- aided designing of integrated circuits and other
semiconductor devices
US$ 330,000 US$ 380,000 293,637 100 US$ 154,432 US$ (125) Note 2 Subsidiary
VisEra Holding Company
VisEra Hsin-Chu, Taiwan Manufacturing and selling of electronic parts and providing turn-key services in back-end color filter
fabrication, package, test, and optical solutions
US$ 91,041 US$ 91,041 253,120 89 US$ 125,983 US$ 313 Note 2 Subsidiary
(Continued)

40
Investor Company Investee Company Location Main Businesses and Products
Original Investment Amount Balance as of December 31, 2009Net Income (Losses) of
the Investee (Foreign
Currencies in Thousands)
Equity in the Earnings
(Losses) (Note 1)(Foreign
Currencies in Thousands)
NoteDecember 31, 2009 (Foreign Currencies in
Thousands)
December 31, 2008 (Foreign Currencies in
Thousands)
Shares (In Thousands)
Percentage of Ownership
Carrying Value (Foreign
Currencies in Thousands)
VTAF III Mutual-Pak Technology Co., Ltd. Taipei, Taiwan Manufacturing and selling of electronic parts and researching, developing, and testing of RFID
US$ 3,088 US$ 1,705 9,180 59 US$ 2,112 US$ (1,105) Note 2 Subsidiary
Aiconn Technology Corp. Taipei, Taiwan Wholesaling telecommunication equipments, and manufacturing wired and wireless communication
equipments
US$ 1,777 US$ 1,777 4,500 42 US$ 566 US$ (1,239) Note 2 Investee accounted for using equity method
Growth Fund Cayman Islands Investing in new start-up technology companies US$ 1,550 US$ 700 - 100 US$ 823 US$ (127) Note 2 Subsidiary (Note 3)VTA Holdings Delaware, U.S.A. Investing in new start-up technology companies - - - 62 - - Note 2 Subsidiary (Note 3)
VTAF II VTA Holdings Delaware, U.S.A. Investing in new start-up technology companies - - - 31 - - Note 2 Subsidiary (Note 3)
GUC GUC-NA U.S.A. Consulting services in main products US$ 800 US$ 800 800 100 $ 38,617 $ 5,617 Note 2 Subsidiary GUC-Japan Japan Consulting services in main products JPY 30,000 JPY 30,000 1 100 12,899 1,608 Note 2 Subsidiary (Note 3)GUC-Europe The Netherlands Consulting services in main products EUR 100 EUR 50 - 100 5,213 353 Note 2 Subsidiary (Note 3)GUC-BVI British Virgin Islands Investment activities US$ 550 - 550 100 17,466 (133) Note 2 Subsidiary (Note 3)
Emerging Alliance VTA Holdings Delaware, U.S.A. Investing in new start-up technology companies - - - 7 - - Note 2 Subsidiary (Note 3)
(Concluded)Note 1: Equity in earnings/losses of investees include the effect of unrealized gross profit from affiliates.Note 2: The equity in the earnings/losses of the investee company is not reflected herein as such amount is already included in the equity in the earnings/losses of the investor company.Note 3: Equity in earnings/losses was determined based on the unaudited financial statements.

41
TABLE 7
Taiwan Semiconductor Manufacturing Company Limited
INFORMATION OF INVESTMENT IN MAINLAND CHINAFOR THE YEAR ENDED DECEMBER 31, 2009(Amounts in Thousands of New Taiwan Dollars, Unless Specified Otherwise)
Equity in the Earnings (Losses)(Note 2)
Carrying Value as of December 31, 2009
Accumulated Inward Remittance of Earnings as of
December 31, 2009
Accumulated Investment in Mainland China as of December 31, 2009 (US$ in Thousand)
Investment Amounts Authorized byInvestment Commission, MOEA (US$ in Thousand)
Upper Limit on Investment (US$ in Thousand)
$ (3,242,122) $ 2,961,043 $ - $ 12,180,367(US$ 371,000)
$ 12,180,367(US$ 371,000)
$ 12,180,367(US$ 371,000)
Investee Company Main Businesses and ProductsTotal Amount of Paid-in Capital
(RMB in Thousand)Method of Investment
Accumulated Outflow of Investment from Taiwan as of
January 1, 2009(US$ in Thousand)
Investment Flows Accumulated Outflow of Investment from Taiwan as of
December 31, 2009 (US$ in Thousand)
Percentage of OwnershipOutflow Inflow
TSMC China Ma nufacturing and selling of integrated circuits at the order of and pursuant to product design specifications provided by customers
$ 12,180,367(RMB 3,070,623)
(Note 1) $ 12,180,367(US$ 371,000)
$ - $ - $ 12,180,367(US$ 371,000)
100%
Note 1: Direct investments US$371,000 thousand in TSMC China.Note 2: Amount was recognized based on the audited financial statements.
42
REPRESENTATION LETTER
The entities that are required to be included in the combined financial statements of Taiwan Semiconductor Manufacturing Company Limited as of and for the year ended December 31, 2009, under the Criteria Governing the Preparation of Affiliation Reports, Consolidated Business Reports and Consolidated Financial Statements of Affiliated Enterprises are the same as those included in the consolidated financial statements prepared in conformity with the revised Statement of Financial Accounting Standards No. 7, “Consolidated Financial Statements”. In addition, the information required to be disclosed in the combined financial statements is included in the consolidated financial statements. Consequently, Taiwan Semiconductor Manufacturing Company Limited and Subsidiaries do not prepare a separate set of combined financial statements.
Very truly yours,
TAIWAN SEMICONDUCTOR MANUFACTURING COMPANY LIMITED
By
MORRIS CHANG
Chairman
January 22, 2010
8. Consolidated Financial Statements for the Years Ended December 31, 2009 and 2008 and Independent Auditors’ Report

43
IINDEPENDENT AUDITORS’ REPORT
The Board of Directors and Shareholders
Taiwan Semiconductor Manufacturing Company Limited
We have audited the accompanying consolidated balance sheets of Taiwan Semiconductor Manufacturing Company Limited and subsidiaries as of December 31, 2009 and 2008, and the related consolidated statements of income, changes in shareholders’ equity and cash flows for the years then ended. These consolidated financial statements are the responsibility of the Company’s management. Our responsibility is to express an opinion on these consolidated financial statements based on our audits.
We conducted our audits in accordance with the Rules Governing the Audit of Financial Statements by Certified Public Accountants and auditing standards generally accepted in the Republic of China. Those rules and standards require that we plan and perform the audit to obtain reasonable assurance about whether the financial statements are free of material misstatement. An audit includes examining, on a test basis, evidence supporting the amounts and disclosures in the financial statements. An audit also includes assessing the accounting principles used and significant estimates made by management, as well as evaluating the overall financial statement presentation. We believe that our audits provide a reasonable basis for our opinion.
In our opinion, the consolidated financial statements referred to above present fairly, in all material respects, the consolidated financial position of Taiwan Semiconductor Manufacturing Company Limited and subsidiaries as of December 31, 2009 and 2008, and the results of their consolidated operations and their consolidated cash flows for the years then ended in conformity with the Guidelines Governing the Preparation of Financial Reports by Securities Issuers and accounting principles generally accepted in the Republic of China.
As discussed in Note 3 to the consolidated financial statements, effective January 1, 2009, Taiwan Semiconductor Manufacturing Company Limited and subsidiaries adopted the newly revised Statements of Financial Accounting Standards No. 10, “Accounting for Inventories”. In addition, effective January 1, 2008, Taiwan Semiconductor Manufacturing Company Limited and subsidiaries adopted Interpretation 2007-052, “Accounting for Bonuses to Employees, Directors and Supervisors”, issued by the Accounting Research and Development Foundation of the Republic of China and relevant requirements promulgated by the Financial Supervisory Commission of the Executive Yuan.
January 22, 2010
Notice to Readers
The accompanying consolidated financial statements are intended only to present the consolidated financial position, results of operations and cash flows in accordance with accounting principles and practices generally accepted in the Republic of China and not those of any other jurisdiction. The standards, procedures and practices to audit such consolidated financial statements are those generally accepted and applied in the Republic of China.
For the convenience of readers, the auditors’ report and the accompanying consolidated financial statements have been translated into English from the original Chinese version prepared and used in the Republic of China. If there is any conflict between the English version and the original Chinese version or any difference in the interpretation of the two versions, the Chinese-language auditors’ report and consolidated financial statements shall prevail.

44
ASSETS2009 2008
LIABILITIES AND SHAREHOLDERS’ EQUITY2009 2008
Amount % Amount % Amount % Amount %
CURRENT ASSETS CURRENT LIABILITIESCash and cash equivalents (Notes 2 and 4) $ 171,276,341 29 $ 194,613,752 35 Financial liabilities at fair value through profit or loss (Notes 2, 5 and 24) $ 25 - $ 85,187 -Financial assets at fair value through profit or loss (Notes 2, 5 and 24) 186,081 - 55,730 - Accounts payable 10,905,884 2 5,553,151 1Available-for-sale financial assets (Notes 2, 6 and 24) 14,389,946 2 10,898,715 2 Payables to related parties (Note 25) 783,007 - 489,857 -Held-to-maturity financial assets (Notes 2, 7 and 24) 9,944,843 2 5,881,999 1 Income tax payable (Notes 2 and 18) 8,800,249 1 9,331,825 2Receivables from related parties 12,524 - 407 - Salary and bonus payable 9,317,035 2 2,215,780 -Notes and accounts receivable 44,637,642 7 25,023,321 4 Accrued profit sharing to employees and bonus to directors and supervisors Allowance for doubtful receivables (Notes 2 and 8) (543,325) - (455,751) - (Notes 2, 3 and 20) 6,818,343 1 15,369,730 3Allowance for sales returns and others (Notes 2 and 8) (8,724,481) (1) (6,071,026) (1) Payables to contractors and equipment suppliers 28,924,265 5 7,998,773 1Other receivables from related parties 121,292 - 99,918 - Accrued expenses and other current liabilities (Notes 16, 24 and 28) 12,635,182 2 7,540,055 1Other financial assets (Note 26) 1,849,987 - 1,911,699 - Current portion of bonds payable and bank loans (Notes 14, 15, 24 and 26) 949,298 - 8,222,398 2Inventories (Notes 2, 3 and 9) 20,913,751 4 14,876,645 3Deferred income tax assets (Notes 2 and 18) 4,370,309 1 3,969,330 1 Total current liabilities 79,133,288 13 56,806,756 10Prepaid expenses and other current assets 1,368,838 - 1,813,692 -
LONG-TERM LIABILITIESTotal current assets 259,803,748 44 252,618,431 45 Bonds payable (Notes 14 and 24) 4,500,000 1 4,500,000 1
Long-term bank loans (Notes 15, 24 and 26) 578,560 - 1,420,476 -LONG-TERM INVESTMENTS (Notes 2, 6, 7, 10, 11 and 24) Other long-term payables (Notes 16, 24 and 28) 5,602,420 1 9,548,226 2
Investments accounted for using equity method 17,871,208 3 18,907,158 3 Obligations under capital leases (Notes 2 and 24) 707,499 - 722,339 -Available-for-sale financial assets 1,358,049 - 2,032,658 -Held-to-maturity financial assets 15,553,242 3 15,426,252 3 Total long-term liabilities 11,388,479 2 16,191,041 3Financial assets carried at cost 3,063,004 1 3,615,447 1
OTHER LIABILITIESTotal long-term investments 37,845,503 7 39,981,515 7 Accrued pension cost (Notes 2 and 17) 3,797,032 1 3,701,584 1
Guarantee deposits (Note 28) 1,006,023 - 1,484,495 -PROPERTY, PLANT AND EQUIPMENT (Notes 2, 12 and 26) Deferred credits (Note 2) 185,689 - 316,537 -
Cost Others 137,161 - 43,709 -Land and land improvements 934,090 - 953,857 -Buildings 142,294,558 24 132,249,996 24 Total other liabilities 5,125,905 1 5,546,325 1Machinery and equipment 775,653,489 130 697,498,743 125Office equipment 13,667,747 2 12,430,800 2 Total liabilities 95,647,672 16 78,544,122 14Leased assets 714,424 - 722,339 -
933,264,308 156 843,855,735 151 EQUITY ATTRIBUTABLE TO SHAREHOLDERS OF THE PARENT Accumulated depreciation (693,743,886) (117) (618,816,267) (110) Capital stock - NT$10 par value (Notes 20 and 22)Advance payments and construction in progress 34,154,365 6 18,605,882 3 Authorized: 28,050,000 thousand shares
Issued: 25,902,706 thousand shares in 2009 Net property, plant and equipment 273,674,787 45 243,645,350 44 25,625,437 thousand shares in 2008 259,027,066 43 256,254,373 46
Capital surplus (Notes 2 and 20) 55,486,010 9 49,875,255 9INTANGIBLE ASSETS Retained earnings (Note 20)
Goodwill (Note 2) 5,931,318 1 6,044,392 1 Appropriated as legal capital reserve 77,317,710 13 67,324,393 12Deferred charges, net (Notes 2 and 13) 6,458,554 1 7,125,828 1 Appropriated as special capital reserve - - 391,857 -
Unappropriated earnings 104,564,972 18 102,337,417 18Total intangible assets 12,389,872 2 13,170,220 2 181,882,682 31 170,053,667 30
Others (Notes 2, 22 and 24)OTHER ASSETS Cumulative translation adjustments (1,766,667) - 481,158 -
Deferred income tax assets (Notes 2 and 18) 7,988,303 1 6,636,873 1 Unrealized gain/loss on financial instruments 453,621 - (287,342) -Refundable deposits 2,733,143 1 2,767,199 1 (1,313,046) - 193,816 -Others (Notes 2 and 26) 260,864 - 97,001 -
Equity attributable to shareholders of the parent 495,082,712 83 476,377,111 85Total other assets 10,982,310 2 9,501,073 2
MINORITY INTERESTS (Note 2) 3,965,836 1 3,995,356 1
Total shareholders’ equity 499,048,548 84 480,372,467 86
TOTAL $ 594,696,220 100 $ 558,916,589 100 TOTAL $ 594,696,220 100 $ 558,916,589 100
Taiwan Semiconductor Manufacturing Company Limited and Subsidiaries
CONSOLIDATED BALANCE SHEETSDECEMBER 31, 2009 AND 2008(In Thousands of New Taiwan Dollars, Except Par Value)
The accompanying notes are an integral part of the consolidated financial statements.(With Deloitte & Touche audit report dated January 22, 2010)

45
Taiwan Semiconductor Manufacturing Company Limited and Subsidiaries
CONSOLIDATED STATEMENTS OF INCOMEFOR THE YEARS ENDED DECEMBER 31, 2009 AND 2008 (In Thousands of New Taiwan Dollars, Except Earnings Per Share)
2009 2008
Amount % Amount %
GROSS SALES (Notes 2 and 25) $ 309,655,614 $ 341,983,355
SALES RETURNS AND ALLOWANCES (Notes 2 and 8) 13,913,375 8,825,695
NET SALES 295,742,239 100 333,157,660 100
COST OF SALES (Notes 3, 9, 19 and 25) 166,413,628 56 191,408,099 58
GROSS PROFIT 129,328,611 44 141,749,561 42
OPERATING EXPENSES (Note 19)Research and development 21,593,398 7 21,480,937 7General and administrative 11,285,478 4 11,096,599 3Marketing 4,487,849 2 4,736,657 1
Total operating expenses 37,366,725 13 37,314,193 11
INCOME FROM OPERATIONS 91,961,886 31 104,435,368 31
NON-OPERATING INCOME AND GAINSInterest income (Note 2) 2,600,925 1 5,373,823 2Settlement income (Note 28) 1,464,915 1 951,180 -Valuation gain on financial instruments, net (Notes 2, 5 and 24) 594,660 - - -Technical service income (Notes 25 and 28) 367,013 - 1,181,966 -Equity in earnings of equity method investees, net (Notes 2 and 10) 45,994 - 701,533 -Ga in on settlement and disposal of financial assets, net (Notes 2 and
24) 15,999 - 721,050 -Foreign exchange gain, net (Note 2) - - 1,227,653 1Others (Note 2) 564,042 - 664,244 -
Total non-operating income and gains 5,653,548 2 10,821,449 3
2009 2008
Amount % Amount %
NON-OPERATING EXPENSES AND LOSSESImpairment of financial assets (Notes 2, 6, 11 and 24) $ 913,230 1 $ 1,560,055 1Foreign exchange loss, net (Note 2) 626,971 - - -Interest expense 391,479 - 614,988 -Valuation loss on financial instruments, net (Notes 2, 5 and 24) - - 1,081,019 -Loss on idle assets (Note 2) - - 210,477 -Others (Note 2) 221,107 - 318,032 -
Total non-operating expenses and losses 2,152,787 1 3,784,571 1
INCOME BEFORE INCOME TAX 95,462,647 32 111,472,246 33
INCOME TAX EXPENSE (Notes 2 and 18) 5,996,424 2 10,949,009 3
NET INCOME $ 89,466,223 30 $ 100,523,237 30
ATTRIBUTABLE TO:Shareholders of the parent $ 89,217,836 30 $ 99,933,168 30Minority interests 248,387 - 590,069 -
$ 89,466,223 30 $ 100,523,237 30
2009 2008
Income Attributable to Shareholders of the Parent
Income Attributable to Shareholders of the Parent
BeforeIncome Tax
AfterIncome Tax
BeforeIncome Tax
AfterIncome Tax
EARNINGS PER SHARE (NT$, Note 23)Basic earnings per share $ 3.68 $ 3.45 $ 4.26 $ 3.84Diluted earnings per share $ 3.67 $ 3.44 $ 4.23 $ 3.81
The accompanying notes are an integral part of the consolidated financial statements. (Concluded)(With Deloitte & Touche audit report dated January 22, 2010)
(Continued)

46
Equity Attributable to Shareholders of the Parent
MinorityInterests
TotalShareholders’
Equity
Capital Stock - Common Stock
Capital Surplus
Retained Earnings Others
CumulativeTranslation
Adjustments
UnrealizedGain (Loss)
on FinancialInstruments
TreasuryStock Others Total TotalLegal Capital
Reserve
Special Capital Reserve
UnappropriatedEarnings TotalShares
(In Thousands) Amount
BALANCE, JANUARY 1, 2008 26,427,104 $ 264,271,037 $ 53,732,682 $ 56,406,684 $ 629,550 $ 161,828,337 $ 218,864,571 $ (1,072,853) $ 680,997 $ (49,385,032) $ (49,776,888) $ 487,091,402 $ 3,594,169 $ 490,685,571
Appropriations of prior year’s earnings Legal capital reserve - - - 10,917,709 - (10,917,709) - - - - - - - -Reversal of special capital reserve - - - - (237,693) 237,693 - - - - - - - -Profit sharing to employees - in cash - - - - - (3,939,883) (3,939,883) - - - - (3,939,883) - (3,939,883)Profit sharing to employees - in stock 393,988 3,939,883 - - - (3,939,883) (3,939,883) - - - - - - -Cash dividends to shareholders - NT$3.00 per share - - - - - (76,881,311) (76,881,311) - - - - (76,881,311) - (76,881,311)Stock dividends to shareholders - NT$0.02 per share 51,254 512,542 - - - (512,542) (512,542) - - - - - - -Bonus to directors - - - - - (176,890) (176,890) - - - - (176,890) - (176,890)
Capital surplus transferred to capital stock 76,881 768,813 (768,813) - - - - - - - - - - -Net income in 2008 - - - - - 99,933,168 99,933,168 - - - - 99,933,168 590,069 100,523,237Ad justment arising from changes in percentage of
ownership in equity method investees - - (137,063) - - - - - - - - (137,063) 11,700 (125,363)Translation adjustments - - - - - - - 1,554,011 - - 1,554,011 1,554,011 (68,792) 1,485,219Issuance of stock from exercising employee stock
options 6,027 60,266 166,884 - - - - - - - - 227,150 - 227,150Cash dividends received by subsidiaries from parent
company - - 102,279 - - - - - - - - 102,279 - 102,279Valuation loss on available-for-sale financial assets - - - - - - - - (826,251) - (826,251) (826,251) (17,048) (843,299)Net change in unrealized gain (loss) on financial
instruments from equity method investees - - - - - - - - (142,088) - (142,088) (142,088) - (142,088)Treasury stock repurchased - - - - - - - - - (30,427,413) (30,427,413) (30,427,413) - (30,427,413)Treasury stock retired (1,329,817) (13,298,168) (3,220,714) - - (63,293,563) (63,293,563) - - 79,812,445 79,812,445 - - -Decrease in minority interests - - - - - - - - - - - - (114,742) (114,742)
BALANCE, DECEMBER 31, 2008 25,625,437 256,254,373 49,875,255 67,324,393 391,857 102,337,417 170,053,667 481,158 (287,342) - 193,816 476,377,111 3,995,356 480,372,467
Appropriations of prior year’s earningsLegal capital reserve - - - 9,993,317 - (9,993,317) - - - - - - - -Reversal of special capital reserve - - - - (391,857) 391,857 - - - - - - - -Cash dividends to shareholders - NT$3.00per share - - - - - (76,876,312) (76,876,312) - - - - (76,876,312) - (76,876,312)Stock dividends to shareholders - NT$0.02per share 51,251 512,509 - - - (512,509) (512,509) - - - - - - -
Profit sharing to employees - in stock 141,870 1,418,699 6,076,289 - - - - - - - - 7,494,988 - 7,494,988Capital surplus transferred to capital stock 76,876 768,763 (768,763) - - - - - - - - - - -Net income in 2009 - - - - - 89,217,836 89,217,836 - - - - 89,217,836 248,387 89,466,223Adjustment arising from changes in percentage of
ownership in equity method investees - - 115,418 - - - - - - - - 115,418 (38,966) 76,452Translation adjustments - - - - - - - (2,247,825) - - (2,247,825) (2,247,825) 39,786 (2,208,039)Issuance of stock from exercising employee stock
options 7,272 72,722 187,811 - - - - - - - - 260,533 - 260,533Valuation gain on available-for-sale financial assets - - - - - - - - 622,541 - 622,541 622,541 6,047 628,588Net change in unrealized gain (loss) on financial
instruments from equity method investees - - - - - - - - 118,422 - 118,422 118,422 - 118,422Decrease in minority interests - - - - - - - - - - - - (284,774) (284,774)
BALANCE, DECEMBER 31, 2009 25,902,706 $ 259,027,066 $ 55,486,010 $ 77,317,710 $ - $ 104,564,972 $ 181,882,682 $ (1,766,667) $ 453,621 $ - $ (1,313,046) $ 495,082,712 $ 3,965,836 $ 499,048,548
Taiwan Semiconductor Manufacturing Company Limited and Subsidiaries
CONSOLIDATED STATEMENTS OF CHANGES IN SHAREHOLDERS’ EQUITY FOR THE YEARS ENDED DECEMBER 31, 2009 AND 2008(In Thousands of New Taiwan Dollars, Except Dividends Per Share)
Note: TSMC’s profit sharing to employees and bonus to directors in the amount of NT$6,771,338 thousand and NT$15,148,057 thousand, respectively, had been charged against earnings of 2009 and 2008.The accompanying notes are an integral part of the consolidated financial statements.(With Deloitte & Touche audit report dated January 22, 2010)

47
Taiwan Semiconductor Manufacturing Company Limited and Subsidiaries
CONSOLIDATED STATEMENTS OF CASH FLOWSFOR THE YEARS ENDED DECEMBER 31, 2009 AND 2008 (In Thousands of New Taiwan Dollars)
2009 2008
CASH FLOWS FROM OPERATING ACTIVITIESNet income attributable to shareholders of the parent $ 89,217,836 $ 99,933,168Net income attributable to minority interests 248,387 590,069Ad justments to reconcile net income to net cash provided by operating
activities:Depreciation and amortization 80,814,748 81,512,191Amortization of premium/discount of financial assets 21,483 (93,393)Impairment of financial assets 913,230 1,560,055Loss (gain) on disposal of available-for-sale financial assets, net 20,337 (637,219)Gain on held-to-maturity financial assets redeemed by the issuer (16,091) -Gain on disposal of financial assets carried at cost, net (20,245) (83,831)Equity in earnings of equity method investees, net (45,994) (701,533)Dividends received from equity method investees 1,239,490 1,661,134Gain on disposal of property, plant and equipment and other assets,
net (45,475) (100,285)Loss on idle assets - 210,477Deferred income tax (1,752,409) 2,279,414Changes in operating assets and liabilities:
Decrease (increase) in:Financial assets and liabilities at fair value through profit or loss (215,513) 1,412,531Receivables from related parties (12,117) 10,478Notes and accounts receivable (19,614,321) 22,180,805Allowance for doubtful receivables 87,574 (246,056)Allowance for sales returns and others 2,653,455 1,981,991Other receivables from related parties (21,374) 143,702Other financial assets 7,834 (425,937)Inventories (6,037,106) 8,985,615Prepaid expenses and other current assets 585,430 (443,462)
Increase (decrease) in:Accounts payable 4,916,885 (6,021,731)Payables to related parties 293,150 (1,013,519)Income tax payable (531,576) (1,794,303)Salary and bonus payable 7,101,255 (17,670)Accrued profit sharing to employees and bonus to directors and supervisors (1,056,399) 15,369,730Accrued expenses and other current liabilities 1,356,269 (3,936,757)Accrued pension cost 95,448 36,062Deferred credits (237,726) (858,161)
Net cash provided by operating activities 159,966,465 221,493,565
CASH FLOWS FROM INVESTING ACTIVITIESAcquisitions of:
Property, plant and equipment (87,784,906) (59,222,654)Available-for-sale financial assets (38,800,577) (85,273,867)Held-to-maturity financial assets (12,224,353) (16,523,275)Investments accounted for using equity method (42,947) (55,871)Financial assets carried at cost (321,195) (463,211)
Proceeds from disposal or redemption of: Available-for-sale financial assets 36,039,978 138,515,023Held-to-maturity financial assets 7,944,800 15,634,620Financial assets carried at cost 131,075 199,424Property, plant and equipment and other assets 24,241 194,940
Proceeds from return of capital by investees - 2,345,867Increase in deferred charges (1,469,831) (3,395,287)
2009 2008
Decrease in refundable deposits $ 34,056 $ 10,570Decrease (increase) in other assets 1,176 (8,163)
Net cash used in investing activities (96,468,483) (8,041,884)
CASH FLOWS FROM FINANCING ACTIVITIESProceeds from long-term bank loans 286,574 98,400Repayments of:
Long-term bank loans (378,673) (468,313)Bonds payable (8,000,000) -
Decrease in guarantee deposits (478,472) (758,514)Proceeds from exercise of employee stock options 260,533 227,150Cash dividends (76,876,312) (76,779,032)Profit sharing to employees in cash - (3,939,883)Bonus to directors - (176,890)Repurchase of treasury stock - (33,480,997)Decrease in minority interests (284,774) (114,742)
Net cash used in financing activities (85,471,124) (115,392,821)
NET INCREASE (DECREASE) IN CASH AND CASH EQUIVALENTS (21,973,142) 98,058,860
EFFECT OF EXCHANGE RATE CHANGES ON CASH AND CASH EQUIVALENTS (1,364,269) 1,568,404
CASH AND CASH EQUIVALENTS, BEGINNING OF YEAR 194,613,752 94,986,488
CASH AND CASH EQUIVALENTS, END OF YEAR $ 171,276,341 $ 194,613,752
SUPPLEMENTAL INFORMATIONInterest paid $ 580,376 $ 676,318Income tax paid $ 8,088,124 $ 10,477,018
INVESTING AND FINANCING ACTIVITIES AFFECTING BOTH CASH AND NON-CASH ITEMSAcquisition of property, plant and equipment $ 109,151,226 $ 60,978,527Increase in payables to contractors and equipment suppliers (21,361,340) (1,742,041)Nonmonetary exchange trade-out price (809) -Increase in obligations under capital leases (4,171) (13,832)Cash paid $ 87,784,906 $ 59,222,654
Disposal of property, plant and equipment and other assets $ 25,050 $ 194,940Nonmonetary exchange trade-out price (809) -Cash received $ 24,241 $ 194,940
Repurchase of treasury stock $ - $ 30,427,413Decrease in accrued expenses and other current liabilities - 3,053,584Cash paid $ - $ 33,480,997
NONCASH FINANCING ACTIVITIESCurrent portion of bonds payable $ - $ 8,000,000Current portion of long-term bank loans $ 949,298 $ 222,398Cu rrent portion of other long-term payables (under accrued expenses
and other current liabilities) $ 4,005,307 $ 1,126,546
(Continued)
(Concluded)The accompanying notes are an integral part of the consolidated financial statements.(With Deloitte & Touche audit report dated January 22, 2010)

48
Taiwan Semiconductor Manufacturing Company Limited and Subsidiaries
NOTES TO CONSOLIDATED FINANCIAL STATEMENTSFOR THE YEARS ENDED DECEMBER 31, 2009 AND 2008(Amounts in Thousands of New Taiwan Dollars, Unless Specified Otherwise)
1. GENERAL
Taiwan Semiconductor Manufacturing Company, Limited (TSMC), a Republic of China (R.O.C.) corporation, was incorporated on February 21, 1987. TSMC is a dedicated foundry in the semiconductor industry which engages mainly in the manufacturing, selling, packaging, testing and computer-aided designing of integrated circuits and other semiconductor devices and the manufacturing of masks. On September 5, 1994, its shares were listed on the Taiwan Stock Exchange (TSE). On October 8, 1997, TSMC listed some of its shares of stock on the New York Stock Exchange (NYSE) in the form of American Depositary Shares (ADSs).
As of December 31, 2009 and 2008, TSMC and its subsidiaries had 26,390 and 24,834 employees, respectively.
2. SUMMARY OF SIGNIFICANT ACCOUNTING POLICIES
The consolidated financial statements are presented in conformity with the Guidelines Governing the Preparation of Financial Reports by Securities Issuers and accounting principles generally accepted in the R.O.C.
For the convenience of readers, the accompanying consolidated financial statements have been translated into English from the original Chinese version prepared and used in the R.O.C. If there is any conflict between the English version and the original Chinese version or any difference in the interpretation of the two versions, the Chinese-language consolidated financial statements shall prevail.
Significant accounting policies are summarized as follows:
Principles of ConsolidationThe accompanying consolidated financial statements include the accounts of all directly and indirectly majority owned subsidiaries of TSMC, and the accounts of investees in which TSMC’s ownership percentage is less than 50% but over which TSMC has a controlling interest. All significant intercompany balances and transactions are eliminated upon consolidation.
The consolidated entities were as follows:
Name of Investor Name of Investee
Percentage of Ownership December 31 Remark
2009 2008
TSMC TSMC North America 100% 100% -TSMC Japan Limited (TSMC Japan) 100% 100% -TSMC Partners, Ltd. (TSMC Partners) 100% 100% -TSMC Korea Limited (TSMC Korea) 100% 100% -Taiwan Semiconductor Manufacturing
Company Europe B.V. (TSMC Europe)100% 100% -
TSMC International Investment Ltd. (TSMC International)
- 100% In June 2009, TSMC International was merged into TSMC Partners.
TSMC Global Ltd. (TSMC Global) 100% 100% -TSMC China Company Limited (TSMC
China)100% 100% -
VentureTech Alliance Fund III, L.P. (VTAF III)
98% 98% -
VentureTech Alliance Fund II, L.P. (VTAF II)
98% 98% -
Emerging Alliance Fund, L.P. (Emerging Alliance)
99.5% 99.5% -
Global Unichip Corporation (GUC) 35% 36% TS MC has a controlling interest over the financial, operating and personnel hiring decisions of GUC.
Xintec Inc. (Xintec) 41% 42% TS MC obtained three out of five director positions and has a controlling interest in Xintec.
TSMC Partners TSMC Design Technology Canada Inc. (TSMC Canada)
100% 100% -
TSMC Technology, Inc. (TSMC Technology)
100% - Its previous shareholder, TSMC International, was merged into TSMC Partners in June 2009.
TSMC Development, Inc. (TSMC Development)
100% - Its previous shareholder, TSMC International, was merged into TSMC Partners in June 2009.
InveStar Semiconductor Development Fund, Inc. (ISDF)
97% - Its previous shareholder, TSMC International, was merged into TSMC Partners in June 2009.
InveStar Semiconductor Development Fund, Inc. (II) LDC. (ISDF II)
97% - Its previous shareholder, TSMC International, was merged into TSMC Partners in June 2009.
TSMC Development
WaferTech, LLC (WaferTech) 99.9% 99.9% -
VTAF III Mutual-Pak Technology Co., Ltd. (Mutual-Pak)
59% 51% -
Growth Fund Limited (Growth Fund) 100% 100% -
VTAF III, VTAF II and Emerging Alliance
VentureTech Alliance Holdings, LLC (VTA Holdings)
100% 100% -
GUC Global Unichip Corporation-NA (GUC-NA)
100% 100% -
Global Unichip Japan Co., Ltd. (GUC-Japan)
100% 100% -
Global Unichip Europe B.V. (GUC-Europe)
100% 100% -
Global Unichip (BVI) Corp. (GUC- BVI) 100% - Newly established in February 2009.

49
The following diagram presents information regarding the relationship and ownership percentages between TSMC and its consolidated investees as of December 31, 2009:
TSMC North America
100%
TSMC Japan
100%
TSMC Partners
100%
TSMC Korea
100%
TSMC Europe
100%
TSMC Global
100%
TSMC China
TSMC
100% 98%
VTAF II
98% 99.5%
GUC
35%
Xintec
41%
TSMC Technology
100%
TSMC Canada
100%
TSMC Development
100%
ISDF
97%
ISDF II
97%
WaferTech
99.9%
Mutual-PakGrowth
FundGUC-Japan GUC-Europe GUC-BVI
100% 100% 100%
GUC-NA
100%59% 100%
VTA Holdings
62% 31% 7%
VTAF IIIEmerging Alliance
TSMC North America is engaged in selling and marketing of integrated circuits and semiconductor devices. TSMC Japan, TSMC Korea and TSMC Europe are engaged mainly in marketing or customer service, engineering and technical supporting activities. TSMC Partners is engaged in investment in companies involved in the design, manufacture, and other related business in the semiconductor industry. TSMC Global and TSMC Development are engaged in investing activities. TSMC China is engaged in the manufacturing and selling of integrated circuits pursuant to the orders from and product design specifications provided by customers. Emerging Alliance, VTAF II, VTAF III, VTA Holdings, ISDF, ISDF II, and Growth Fund are engaged in investing in new start-up technology companies. TSMC Canada and TSMC Technology are engaged mainly in engineering support activities. WaferTech is engaged in the manufacturing, selling, testing and computer-aided designing of integrated circuits and other semiconductor devices. GUC is engaged in researching, developing, manufacturing, testing and marketing of integrated circuits. GUC-NA, GUC-Japan, and GUC-Europe are engaged in providing products consulting in North America, Japan, and Europe, respectively. GUC-BVI is engaged in investing activities. Xintec is engaged in the provision of wafer packaging service. Mutual-Pak is engaged in the manufacturing and selling of electronic parts, and researching, developing and testing of RFID.
TSMC Partners and TSMC International were both 100% owned subsidiaries of TSMC. To simplify the organization structure of investment, TSMC Partners merged TSMC International in June 2009.
Chi Cherng and Hsin Ruey, both 100% owned subsidiaries of TSMC, were engaged in investing activities. To simplify the organization structure of investment, TSMC merged Chi Cherng and Hsin Ruey in the third quarter of 2008.
TSMC together with its subsidiaries are hereinafter referred to collectively as the “Company”.
Minority interests in the aforementioned subsidiaries are presented as a separate component of shareholders’ equity.
Use of EstimatesThe preparation of consolidated financial statements in conformity with the aforementioned guidelines and principles requires management to make reasonable assumptions and estimates of matters that are inherently uncertain. The actual results may differ from management’s estimates.
Classification of Current and Noncurrent Assets and LiabilitiesCurrent assets are assets held for trading purposes and assets expected to be converted to cash, sold or consumed within one year from the balance sheet date. Current liabilities are obligations incurred for trading purposes and obligations expected to be settled within one year from the balance sheet date. Assets and liabilities that are not classified as current are noncurrent assets and liabilities, respectively.
Cash EquivalentsRepurchase agreements collateralized by government bonds, agency bonds, corporate issued notes and corporate bonds acquired with maturities of less than three months from the date of purchase are classified as cash equivalents. The carrying amount approximates fair value.
Financial Assets/Liabilities at Fair Value Through Profit or LossDerivatives that do not meet the criteria for hedge accounting and financial assets acquired principally for the purpose of selling them in the near term are initially recognized at fair value, with transaction costs expensed as incurred. The derivatives and financial assets are remeasured at fair value subsequently with
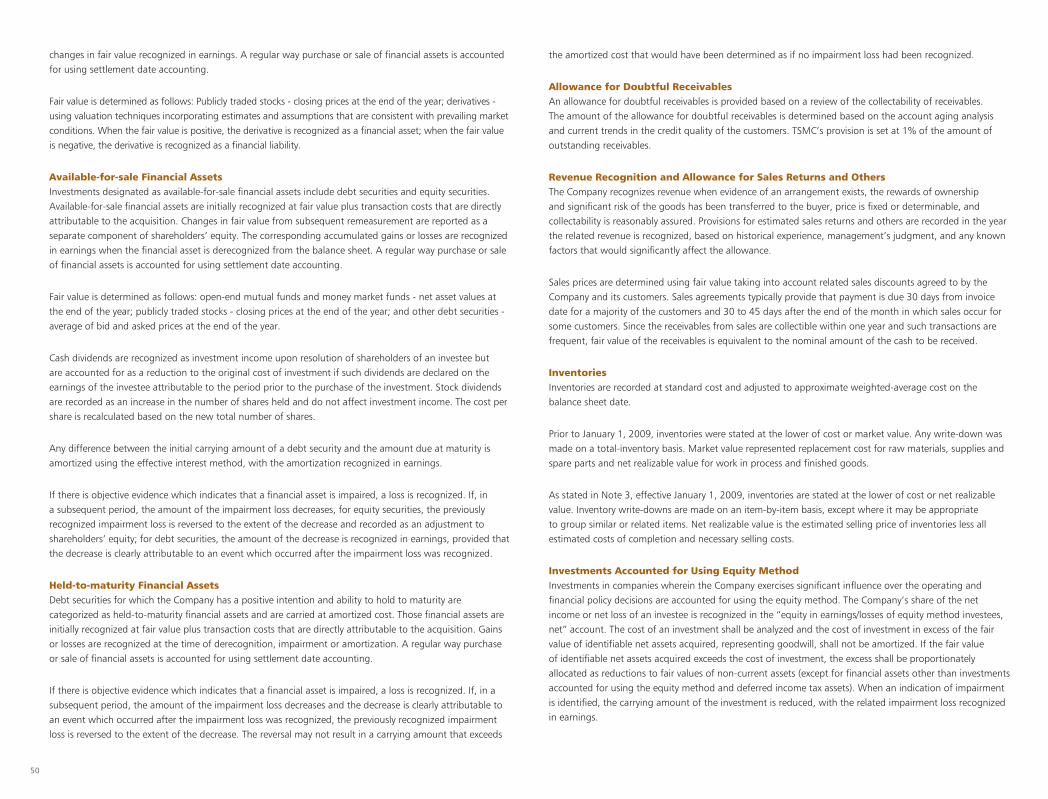
50
changes in fair value recognized in earnings. A regular way purchase or sale of financial assets is accounted for using settlement date accounting.
Fair value is determined as follows: Publicly traded stocks - closing prices at the end of the year; derivatives - using valuation techniques incorporating estimates and assumptions that are consistent with prevailing market conditions. When the fair value is positive, the derivative is recognized as a financial asset; when the fair value is negative, the derivative is recognized as a financial liability.
Available-for-sale Financial AssetsInvestments designated as available-for-sale financial assets include debt securities and equity securities. Available-for-sale financial assets are initially recognized at fair value plus transaction costs that are directly attributable to the acquisition. Changes in fair value from subsequent remeasurement are reported as a separate component of shareholders’ equity. The corresponding accumulated gains or losses are recognized in earnings when the financial asset is derecognized from the balance sheet. A regular way purchase or sale of financial assets is accounted for using settlement date accounting.
Fair value is determined as follows: open-end mutual funds and money market funds - net asset values at the end of the year; publicly traded stocks - closing prices at the end of the year; and other debt securities - average of bid and asked prices at the end of the year.
Cash dividends are recognized as investment income upon resolution of shareholders of an investee but are accounted for as a reduction to the original cost of investment if such dividends are declared on the earnings of the investee attributable to the period prior to the purchase of the investment. Stock dividends are recorded as an increase in the number of shares held and do not affect investment income. The cost per share is recalculated based on the new total number of shares.
Any difference between the initial carrying amount of a debt security and the amount due at maturity is amortized using the effective interest method, with the amortization recognized in earnings.
If there is objective evidence which indicates that a financial asset is impaired, a loss is recognized. If, in a subsequent period, the amount of the impairment loss decreases, for equity securities, the previously recognized impairment loss is reversed to the extent of the decrease and recorded as an adjustment to shareholders’ equity; for debt securities, the amount of the decrease is recognized in earnings, provided that the decrease is clearly attributable to an event which occurred after the impairment loss was recognized.
Held-to-maturity Financial AssetsDebt securities for which the Company has a positive intention and ability to hold to maturity are categorized as held-to-maturity financial assets and are carried at amortized cost. Those financial assets are initially recognized at fair value plus transaction costs that are directly attributable to the acquisition. Gains or losses are recognized at the time of derecognition, impairment or amortization. A regular way purchase or sale of financial assets is accounted for using settlement date accounting.
If there is objective evidence which indicates that a financial asset is impaired, a loss is recognized. If, in a subsequent period, the amount of the impairment loss decreases and the decrease is clearly attributable to an event which occurred after the impairment loss was recognized, the previously recognized impairment loss is reversed to the extent of the decrease. The reversal may not result in a carrying amount that exceeds
the amortized cost that would have been determined as if no impairment loss had been recognized.
Allowance for Doubtful ReceivablesAn allowance for doubtful receivables is provided based on a review of the collectability of receivables. The amount of the allowance for doubtful receivables is determined based on the account aging analysis and current trends in the credit quality of the customers. TSMC’s provision is set at 1% of the amount of outstanding receivables.
Revenue Recognition and Allowance for Sales Returns and OthersThe Company recognizes revenue when evidence of an arrangement exists, the rewards of ownership and significant risk of the goods has been transferred to the buyer, price is fixed or determinable, and collectability is reasonably assured. Provisions for estimated sales returns and others are recorded in the year the related revenue is recognized, based on historical experience, management’s judgment, and any known factors that would significantly affect the allowance.
Sales prices are determined using fair value taking into account related sales discounts agreed to by the Company and its customers. Sales agreements typically provide that payment is due 30 days from invoice date for a majority of the customers and 30 to 45 days after the end of the month in which sales occur for some customers. Since the receivables from sales are collectible within one year and such transactions are frequent, fair value of the receivables is equivalent to the nominal amount of the cash to be received.
InventoriesInventories are recorded at standard cost and adjusted to approximate weighted-average cost on the balance sheet date.
Prior to January 1, 2009, inventories were stated at the lower of cost or market value. Any write-down was made on a total-inventory basis. Market value represented replacement cost for raw materials, supplies and spare parts and net realizable value for work in process and finished goods.
As stated in Note 3, effective January 1, 2009, inventories are stated at the lower of cost or net realizable value. Inventory write-downs are made on an item-by-item basis, except where it may be appropriate to group similar or related items. Net realizable value is the estimated selling price of inventories less all estimated costs of completion and necessary selling costs.
Investments Accounted for Using Equity MethodInvestments in companies wherein the Company exercises significant influence over the operating and financial policy decisions are accounted for using the equity method. The Company’s share of the net income or net loss of an investee is recognized in the “equity in earnings/losses of equity method investees, net” account. The cost of an investment shall be analyzed and the cost of investment in excess of the fair value of identifiable net assets acquired, representing goodwill, shall not be amortized. If the fair value of identifiable net assets acquired exceeds the cost of investment, the excess shall be proportionately allocated as reductions to fair values of non-current assets (except for financial assets other than investments accounted for using the equity method and deferred income tax assets). When an indication of impairment is identified, the carrying amount of the investment is reduced, with the related impairment loss recognized in earnings.
51
When the Company subscribes for additional investee’s shares at a percentage different from its existing ownership percentage, the resulting carrying amount of the investment in the investee differs from the amount of the Company’s share of the investee’s equity. The Company records such a difference as an adjustment to long-term investments with the corresponding amount charged or credited to capital surplus.
Gains or losses on sales from the Company to equity method investees or from equity method investees to the Company are deferred in proportion to the Company’s ownership percentages in the investees until such gains or losses are realized through transactions with third parties.
If an investee’s functional currency is a foreign currency, differences will result from the translation of the investee’s financial statements into the reporting currency of the Company. Such differences are charged or credited to cumulative translation adjustments, a separate component of shareholders’ equity.
Financial Assets Carried at CostInvestments for which the Company does not exercise significant influence and that do not have a quoted market price in an active market and whose fair value cannot be reliably measured, such as non-publicly traded stocks and mutual funds, are carried at their original cost. The costs of non-publicly traded stocks and mutual funds are determined using the weighted-average method. If there is objective evidence which indicates that a financial asset is impaired, a loss is recognized. A subsequent reversal of such impairment loss is not allowed.
The accounting treatment for cash dividends and stock dividends arising from financial assets carried at cost is the same as that for cash and stock dividends arising from available-for-sale financial assets.
Property, Plant and Equipment, Assets Leased to Others and Idle AssetsProperty, plant and equipment and assets leased to others are stated at cost less accumulated depreciation. Properties covered by agreements qualifying as capital leases are carried at the lower of the leased equipment’s market value or the present value of the minimum lease payments at the inception date of the lease, with the corresponding amount recorded as obligations under capital leases. When an indication of impairment is identified, any excess of the carrying amount of an asset over its recoverable amount is recognized as a loss. If the recoverable amount increases in a subsequent period, the amount previously recognized as impairment would be reversed and recognized as a gain. However, the adjusted amount may not exceed the carrying amount that would have been determined, net of depreciation, as if no impairment loss had been recognized. Significant additions, renewals and betterments incurred during the construction period are capitalized. Maintenance and repairs are expensed as incurred.
Depreciation is computed using the straight-line method over the following estimated service lives: land improvements - 20 years; buildings - 10 to 20 years; machinery and equipment - 3 to 5 years; office equipment - 3 to 15 years; and leased assets - 20 years.
Upon sale or disposal of property, plant and equipment and assets leased to others, the related cost and accumulated depreciation are deducted from the corresponding accounts, with any gain or loss recorded as non-operating gains or losses in the year of sale or disposal.
When property, plant and equipment are determined to be idle or useless, they are transferred to idle assets at the lower of the net realizable value or carrying amount. Depreciation on the idle assets is provided
continuously, and the idle assets are tested for impairment on a periodical basis.
Intangible AssetsGoodwill represents the excess of the consideration paid for acquisition over the fair value of identifiable net assets acquired. Goodwill is no longer amortized and instead is tested for impairment annually. If an event occurs or circumstances change which indicate that the fair value of goodwill is more likely than not below its carrying amount, an impairment loss is recognized. A subsequent reversal of such impairment loss is not allowed.
Deferred charges consist of technology license fees, software and system design costs and other charges. The amounts are amortized over the following periods: Technology license fees - the shorter of the estimated life of the technology or the term of the technology transfer contract; software and system design costs and other charges - 2 to 5 years. When an indication of impairment is identified, any excess of the carrying amount of an asset over its recoverable amount is recognized as a loss. If the recoverable amount increases in a subsequent period, the previously recognized impairment loss would be reversed and recognized as a gain. However, the adjusted amount may not exceed the carrying amount that would have been determined, net of amortization, as if no impairment loss had been recognized.
Expenditures related to research activities and those related to development activities that do not meet the criteria for capitalization are charged to expenses when incurred.
Pension CostsFor employees who participate in defined contribution pension plans, pension costs are recorded based on the actual contributions made to employees’ individual pension accounts during their service periods. For employees who participate in defined benefit pension plans, pension costs are recorded based on actuarial calculations.
Income TaxThe Company applies an inter-period allocation for its income tax whereby deferred income tax assets and liabilities are recognized for the tax effects of temporary differences, net operating loss carryforwards and unused tax credits. Valuation allowances are provided to the extent, if any, that it is more likely than not that deferred income tax assets will not be realized. A deferred tax asset or liability is classified as current or noncurrent in accordance with the classification of its related asset or liability. However, if a deferred tax asset or liability does not relate to an asset or liability in the financial statements, then it is classified as either current or noncurrent based on the expected length of time before it is realized or settled.
Any tax credits arising from purchases of machinery, equipment and technology, research and development expenditures, personnel training expenditures, and investments in important technology-based enterprises are recognized using the flow-through method.
Adjustments of prior years’ tax liabilities are added to or deducted from the current year’s tax provision.
Income tax on unappropriated earnings (excluding earnings from foreign consolidated subsidiaries) at a rate of 10% is expensed in the year of shareholder approval which is the year subsequent to the year the earnings are generated.

52
Stock-based CompensationEmployee stock options that were granted or modified in the period from January 1, 2004 to December 31, 2007 are accounted for by the interpretations issued by the Accounting Research and Development Foundation of the Republic of China. The Company adopted the intrinsic value method and any compensation cost determined using this method is recognized in earnings over the employee vesting period. Employee stock option plans that were granted or modified after December 31, 2007 are accounted for using fair value method in accordance with Statement of Financial Accounting Standards No. 39, “Accounting for Share-based Payment”. The Company did not grant or modify any employee stock options since January 1, 2008.
Profit Sharing to Employees and Bonus to Directors and SupervisorsEffective January 1, 2008, the Company adopted Interpretation 2007-052, “Accounting for Bonuses to Employees, Directors and Supervisors”, which requires companies to record profit sharing to employees and bonus to directors and supervisors as an expense rather than as an appropriation of earnings.
Treasury StockTreasury stock is stated at cost and shown as a deduction in shareholders’ equity. When TSMC retires treasury stock, the treasury stock account is reduced and the common stock as well as the capital surplus - additional paid-in capital are reversed on a pro rata basis. When the book value of the treasury stock exceeds the sum of the par value and additional paid-in capital, the difference is charged to capital surplus - treasury stock transactions and to retained earnings for any remaining amount.
TSMC’s stock held by its subsidiaries is treated as treasury stock and reclassified from investments accounted for using equity method to treasury stock. The gains resulted from disposal of the treasury stock held by subsidiaries and cash dividends received by subsidiaries from TSMC are recorded under capital surplus - treasury stock transactions.
Foreign-currency TransactionsForeign-currency transactions other than derivative contracts are recorded in New Taiwan dollars at the rates of exchange in effect when the transactions occur. Exchange gains or losses derived from foreign-currency transactions or monetary assets and liabilities denominated in foreign currencies are recognized in earnings.
At the balance sheet date, monetary assets and liabilities denominated in foreign currencies are revalued at prevailing exchange rates with the resulting gains or losses recognized in earnings.
Translation of Foreign-currency Financial StatementsThe financial statements of foreign subsidiaries are translated into New Taiwan dollars at the following exchange rates: Assets and liabilities - spot rates at year-end; shareholders’ equity - historical rates; income and expenses - average rates during the year. The resulting translation adjustments are recorded as a separate component of shareholders’ equity.
3. ACCOUNTING CHANGES
Effective January 1, 2009, the Company adopted the newly revised Statement of Financial Accounting Standards (SFAS) No. 10, “Accounting for Inventories”. The main revisions are (1) inventories are stated at the lower of cost or net realizable value, and inventories are written down to net realizable value on an item-by-item basis except when the grouping of similar or related items is appropriate; (2) unallocated
overheads are recognized as expenses in the year in which they are incurred; and (3) abnormal cost, write-downs of inventories and any reversal of write-downs are recorded as cost of sales for the year. Such a change in accounting principle did not have significant effect on the Company’s consolidated financial statements as of and for the year ended December 31, 2009.
Effective January 1, 2008, the Company adopted Interpretation 2007-052, “Accounting for Bonuses to Employees, Directors and Supervisors”, issued in March 2007 by the ARDF, which requires companies to record profit sharing to employees and bonus to directors and supervisors as an expense rather than as an appropriation of earnings. The adoption of this interpretation resulted in a decrease in net income and earnings per share (after income tax and retroactively adjusted for the issuance of stock dividend) of NT$12,827,595 thousand and NT$0.49, respectively, for the year ended December 31, 2008.
Effective January 1, 2008, the Company adopted SFAS No. 39, “Accounting for Share-based Payment”, which requires companies to record share-based payment transactions in the financial statements at fair value. Such a change in accounting principle did not have any effect on the Company’s consolidated financial statements as of and for the year ended December 31, 2008.
4. CASH AND CASH EQUIVALENTS
December 31
2009 2008
Cash and deposits in banks $ 167,448,973 $ 185,943,439Repurchase agreements collateralized by government bonds 3,359,754 8,670,313Agency bonds 253,013 -Corporate issued notes 160,150 -Corporate bonds 54,451 -
$ 171,276,341 $ 194,613,752
5. FINANCIAL ASSETS/LIABILITIES AT FAIR VALUE THROUGH PROFIT OR LOSS
December 31
2009 2008
Trading financial assets
Forward exchange contracts $ 4,338 $ 28,423Cross currency swap contracts 181,743 14,049Publicly traded stocks - 13,258
$ 186,081 $ 55,730
Trading financial liabilities
Forward exchange contracts $ 25 $ 35,812Cross currency swap contracts - 49,375
$ 25 $ 85,187

53
The Company entered into derivative contracts during the years ended December 31, 2009 and 2008 to manage exposures due to the fluctuations of foreign exchange rates. The derivative contracts entered into by the Company did not meet the criteria for hedge accounting. Therefore, the Company did not apply hedge accounting treatment for its derivative contracts.
Outstanding forward exchange contracts consisted of the following:
Maturity DateContract Amount
(In Thousands)
December 31, 2009
Sell US$/buy NT$ February 2010 US$21,300/NT$686,788
December 31, 2008
Sell US$/buy NT$ January 2009 to February 2009 US$138,900/NT$4,558,672Sell EUR/buy NT$ January 2009 EUR1,500/NT$63,150Sell RMB/buy US$ January 2009 to April 2009 RMB55,010/US$8,000Sell US$/buy JPY January 2009 to February 2009 US$131/JPY11,800
Outstanding cross currency swap contracts consisted of the following:
Maturity DateContract Amount
(In Thousands)Range of
Interest Rates PaidRange of
Interest Rates Received
December 31, 2009
January 2010 to February 2010 US$750,000/NT$24,201,706 0.24% - 0.70% 0.00% - 0.38%
December 31, 2008
January 2009 US$307,000/NT$10,061,232 0.54% - 5.00% 0.00% - 3.83%
For the years ended December 31, 2009 and 2008, changes in fair value related to derivative financial instruments recognized in earnings was a net gain of NT$594,660 thousand and a net loss of NT$1,081,019 thousand, respectively.
6. AVAILABLE-FOR-SALE FINANCIAL ASSETS
December 31
2009 2008
Corporate bonds $ 7,042,219 $ 3,279,073Agency bonds 5,032,037 5,696,511Government bonds 2,341,780 340,893Publicly traded stocks 574,865 279,937Corporate issued notes 303,367 -Money market funds 283,713 1,000,086Open-end mutual funds 170,014 -Corporate issued asset-backed securities - 2,334,873
15,747,995 12,931,373Current portion (14,389,946) (10,898,715)
$ 1,358,049 $ 2,032,658
For the years ended December 31, 2009 and 2008, the Company recognized impairment on available-for-sale financial assets of NT$201,346 thousand and NT$934,584 thousand, respectively.
7. HELD-TO-MATURITY FINANCIAL ASSETS
December 31
2009 2008
Corporate bonds $ 15,120,048 $ 18,158,679Structured time deposits 7,000,000 1,643,000Government bonds 3,378,037 1,506,572
25,498,085 21,308,251Current portion (9,944,843) (5,881,999)
$ 15,553,242 $ 15,426,252
Structured time deposits categorized as held-to-maturity financial assets consisted of the following:
Principal Amount Interest ReceivableRange of Interest
RatesMaturity Date
December 31, 2009
Callable domestic deposits $ 7,000,000 $ 4,308 0.36% - 0.95% July 2010 to August 2011
December 31, 2008
Callable foreign deposits $ 1,643,000 $ 660 4.82% December 2011
As of December 31, 2008, the principal of the structured time deposits that resided in banks located in Hong Kong amounted to US$50,000 thousand, which was called back in March 2009.
8. ALLOWANCES FOR DOUBTFUL RECEIVABLES, SALES RETURNS AND OTHERS
Movements of the allowance for doubtful receivables were as follows:
Years Ended December 31
2009 2008
Balance, beginning of year $ 455,751 $ 701,807Provision 331,485 14,880Write-off (243,911) (260,936)
Balance, end of year $ 543,325 $ 455,751
Movements of the allowance for sales returns and others were as follows:
Years Ended December 31
2009 2008
Balance, beginning of year $ 6,071,026 $ 4,089,035Provision 13,913,375 8,825,695Write-off (11,259,920) (6,843,704)
Balance, end of year $ 8,724,481 $ 6,071,026

54
9. INVENTORIES
December 31
2009 2008
Finished goods $ 2,743,450 $ 5,782,704Work in process 15,302,010 7,606,608Raw materials 1,541,599 334,363Supplies and spare parts 1,326,692 1,152,970
$ 20,913,751 $ 14,876,645
Reversal of inventories within the original write-down amount to net realizable value in the amount of NT$428,162 thousand, and write-down of inventories to net realizable value in the amount of NT$1,660,854 thousand were included in the cost of sales for the years ended December 31, 2009 and 2008, respectively.
10. INVESTMENTS ACCOUNTED FOR USING EQUITY METHOD
December 31
2009 2008
Carrying Amount
% ofOwnership
Carrying Amount
% ofOwnership
Common stockVanguard International Semiconductor Corporation (VIS) $ 9,365,232 37 $ 9,787,275 37Systems on Silicon Manufacturing Company Pte Ltd. (SSMC) 6,157,141 39 6,808,192 39VisEra Holding Company (VisEra Holding) 2,273,065 49 2,277,126 49Mcube Inc. (Mcube) 25,624 70 - -Aiconn Technology Corporation (Aiconn) 18,116 42 34,565 44
Preferred stockMcube 32,030 10 - -
$ 17,871,208 $ 18,907,158
The Company will subscribe through a private placement for new shares of Motech Industries Inc. (“Motech”) under a Share Subscription Agreement entered into on December 9, 2009. The total consideration is approximately NT$6.2 billion (US$193 million). After the subscription of shares, the Company will own 20% of the Motech shares. The transaction is still subject to Motech’s shareholders’ approval and regulatory approval.
In September 2009, the Company acquired common stock and preferred stock of Mcube for NT$57,960 thousand. The Company took both ownership of stock and controlling power into consideration and concluded that the Company did not have controlling interest over Mcube. Accordingly, the Company applied equity method to account for this investment and the related equity in earnings/losses.
Years Ended December 31
2009 2008
Balance, beginning of year $ 1,990,621 $ 2,589,742Amortization (599,121) (599,121)
Balance, end of year $ 1,391,500 $ 1,990,621
As of December 31, 2009 and 2008, the ending balances of the aforementioned difference allocated to goodwill were both NT$1,061,885 thousand.
11. FINANCIAL ASSETS CARRIED AT COST
December 31
2009 2008
Non-publicly traded stocks $ 2,899,600 $ 3,453,454Mutual funds 163,404 161,993
$ 3,063,004 $ 3,615,447
In August 2009, the common stock of Leadtrend Technology Corporation (“Leadtrend”) was listed on the Taiwan Stock Exchange. Thus, the Company reclassified its investment in Leadtrend from financial assets carried at cost to available-for-sale financial assets-noncurrent.
For the years ended December 31, 2009 and 2008, the Company recognized impairment on financial assets carried at cost of NT$711,884 thousand and NT$625,471 thousand, respectively.
For the years ended December 31, 2009 and 2008, equity in earnings/losses of equity method investees was net gain of NT$45,994 thousand and NT$701,533 thousand, respectively. Related equity in earnings/losses of equity method investees were determined based on the audited financial statements, except for Mcube for the year ended December 31, 2009. The Company believes that, had Mcube’s financial statements been audited, any adjustments arising would have had no material effect on the Company’s consolidated financial statements.
As of December 31, 2009 and 2008, fair values of publicly traded stocks in investments accounted for using equity method (VIS) were NT$10,114,398 thousand and NT$4,680,264 thousand, respectively.
Movements of the difference between the cost of investments and the Company’s share in investees’ net assets allocated to depreciable assets were as follows:
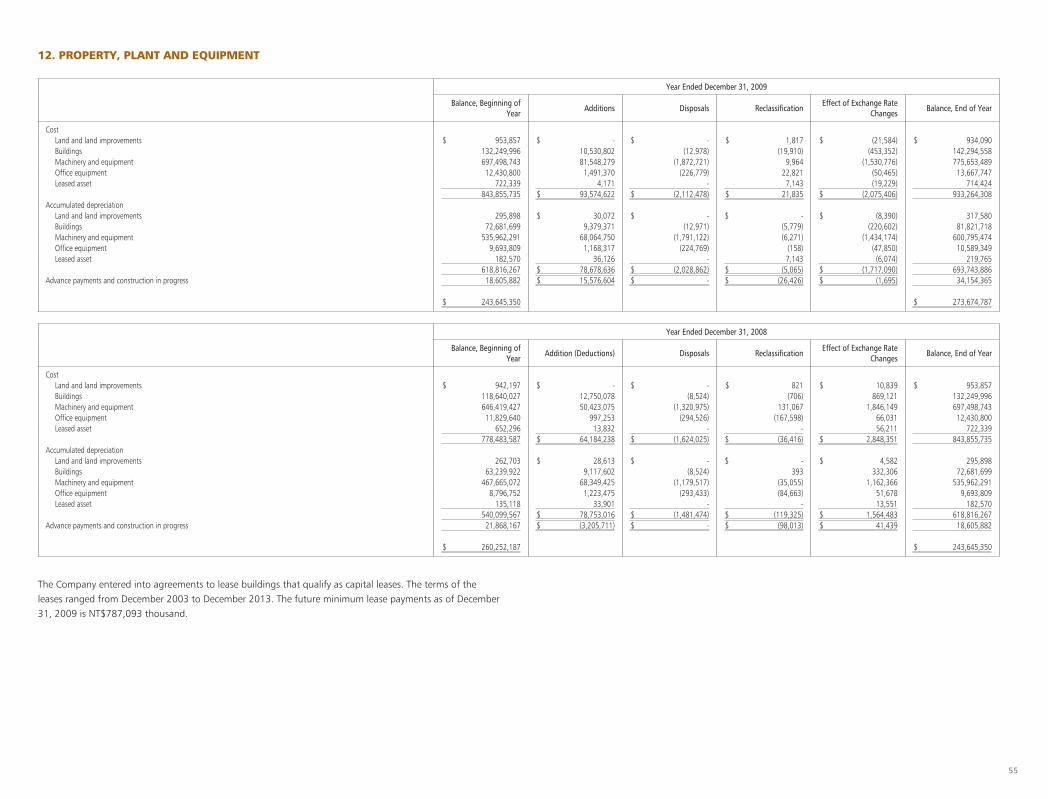
55
12. PROPERTY, PLANT AND EQUIPMENT
Year Ended December 31, 2009
Balance, Beginning of Year
Additions Disposals ReclassificationEffect of Exchange Rate
ChangesBalance, End of Year
CostLand and land improvements $ 953,857 $ - $ - $ 1,817 $ (21,584) $ 934,090Buildings 132,249,996 10,530,802 (12,978) (19,910) (453,352) 142,294,558Machinery and equipment 697,498,743 81,548,279 (1,872,721) 9,964 (1,530,776) 775,653,489Office equipment 12,430,800 1,491,370 (226,779) 22,821 (50,465) 13,667,747Leased asset 722,339 4,171 - 7,143 (19,229) 714,424
843,855,735 $ 93,574,622 $ (2,112,478) $ 21,835 $ (2,075,406) 933,264,308Accumulated depreciation
Land and land improvements 295,898 $ 30,072 $ - $ - $ (8,390) 317,580Buildings 72,681,699 9,379,371 (12,971) (5,779) (220,602) 81,821,718Machinery and equipment 535,962,291 68,064,750 (1,791,122) (6,271) (1,434,174) 600,795,474Office equipment 9,693,809 1,168,317 (224,769) (158) (47,850) 10,589,349Leased asset 182,570 36,126 - 7,143 (6,074) 219,765
618,816,267 $ 78,678,636 $ (2,028,862) $ (5,065) $ (1,717,090) 693,743,886Advance payments and construction in progress 18,605,882 $ 15,576,604 $ - $ (26,426) $ (1,695) 34,154,365
$ 243,645,350 $ 273,674,787
Year Ended December 31, 2008
Balance, Beginning of Year
Addition (Deductions) Disposals ReclassificationEffect of Exchange Rate
ChangesBalance, End of Year
CostLand and land improvements $ 942,197 $ - $ - $ 821 $ 10,839 $ 953,857Buildings 118,640,027 12,750,078 (8,524) (706) 869,121 132,249,996Machinery and equipment 646,419,427 50,423,075 (1,320,975) 131,067 1,846,149 697,498,743Office equipment 11,829,640 997,253 (294,526) (167,598) 66,031 12,430,800Leased asset 652,296 13,832 - - 56,211 722,339
778,483,587 $ 64,184,238 $ (1,624,025) $ (36,416) $ 2,848,351 843,855,735Accumulated depreciation
Land and land improvements 262,703 $ 28,613 $ - $ - $ 4,582 295,898Buildings 63,239,922 9,117,602 (8,524) 393 332,306 72,681,699Machinery and equipment 467,665,072 68,349,425 (1,179,517) (35,055) 1,162,366 535,962,291Office equipment 8,796,752 1,223,475 (293,433) (84,663) 51,678 9,693,809Leased asset 135,118 33,901 - - 13,551 182,570
540,099,567 $ 78,753,016 $ (1,481,474) $ (119,325) $ 1,564,483 618,816,267Advance payments and construction in progress 21,868,167 $ (3,205,711) $ - $ (98,013) $ 41,439 18,605,882
$ 260,252,187 $ 243,645,350
The Company entered into agreements to lease buildings that qualify as capital leases. The terms of the leases ranged from December 2003 to December 2013. The future minimum lease payments as of December 31, 2009 is NT$787,093 thousand.

56
13. DEFERRED CHARGES, NET
Year Ended December 31, 2009
Balance, Beginning of Year
Additions Amortization Disposals ReclassificationEffect of Exchange Rate
ChangesBalance, Ending of Year
Technology license fee $ 4,125,212 $ 2,000 $ (902,061) $ - $ 378 $ 5,095 $ 3,230,624Software and system design costs 1,801,831 965,676 (928,583) - (4,310) (86) 1,834,528Patent and others 1,198,785 502,601 (299,731) - (5,502) (2,751) 1,393,402
$ 7,125,828 $ 1,470,277 $ (2,130,375) $ - $ (9,434) $ 2,258 $ 6,458,554
Year Ended December 31, 2008
Balance, Beginning of Year
Additions Amortization Disposals ReclassificationEffect of Exchange Rate
ChangesBalance, Ending of Year
Technology license fee $ 5,819,148 $ 9,256 $ (1,691,242) $ - $ - $ (11,950) $ 4,125,212Software and system design costs 1,449,603 1,171,163 (806,096) (14,279) 59 1,381 1,801,831Patent and others 654,850 754,402 (218,957) - - 8,490 1,198,785
$ 7,923,601 $ 1,934,821 $ (2,716,295) $ (14,279) $ 59 $ (2,079) $ 7,125,828
14. BONDS PAYABLE
December 31
2009 2008
Domestic unsecured bonds:Iss ued in January 2002 and repayable in 2009 and 2012 in two
installments, 2.75% and 3.00% interest payable annually, respectively $ 4,500,000 $ 12,500,000
Current portion - (8,000,000)
$ 4,500,000 $ 4,500,000
15. LONG-TERM BANK LOANS
December 31
2009 2008
Secured loans:Re payable from August 2009 in 17 quarterly installments, annual
interest at 0.67% - 2.70% in 2009 and 2.56% - 3.67% in 2008 $ 788,263 $ 728,400US $20,000 thousand, repayable in full in one lump sum payment in
November 2010, annual interest at 0.68% - 0.97% in 2009 and 3.62% in 2008 640,895 658,719
Re payable from December 2007 in 8 semi-annual installments, annual interest at 1.10% - 2.42% in 2009 and 2.42% - 3.23% in 2008 98,700 168,750
Re payable from May 2007 in 16 quarterly installments, fully repaid in June 2009, annual interest at 2.42% - 3.00% - 37,828
Re payable from March 2007 in 12 quarterly installments, fully repaid in June 2009, annual interest at 2.53% - 3.21% - 32,472
Re payable from April 2005 in 16 quarterly installments, annual interest at 2.42% - 3.00% - 8,995
Re payable from February 2005 in 17 quarterly installments, annual interest at 2.56% - 3.15% - 7,710
1,527,858 1,642,874Current portion (949,298) (222,398)
$ 578,560 $ 1,420,476
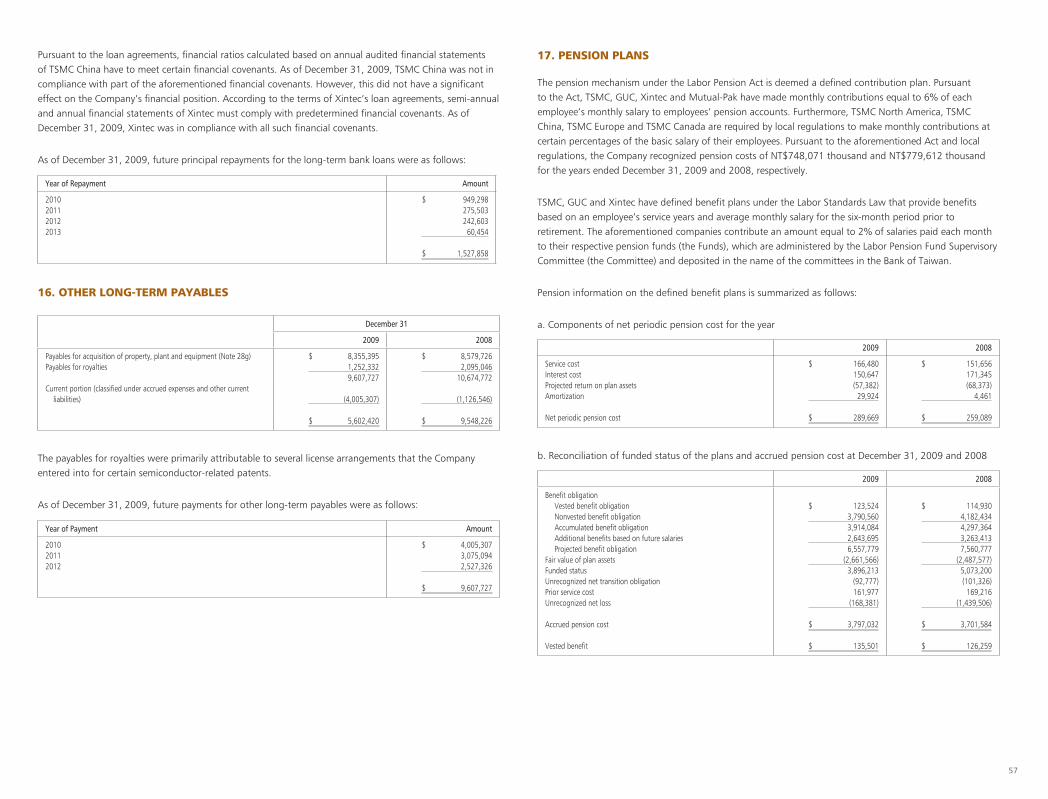
57
Pursuant to the loan agreements, financial ratios calculated based on annual audited financial statements of TSMC China have to meet certain financial covenants. As of December 31, 2009, TSMC China was not in compliance with part of the aforementioned financial covenants. However, this did not have a significant effect on the Company’s financial position. According to the terms of Xintec’s loan agreements, semi-annual and annual financial statements of Xintec must comply with predetermined financial covenants. As of December 31, 2009, Xintec was in compliance with all such financial covenants.
As of December 31, 2009, future principal repayments for the long-term bank loans were as follows:
Year of Repayment Amount
2010 $ 949,2982011 275,5032012 242,6032013 60,454
$ 1,527,858
16. OTHER LONG-TERM PAYABLES
December 31
2009 2008
Payables for acquisition of property, plant and equipment (Note 28g) $ 8,355,395 $ 8,579,726Payables for royalties 1,252,332 2,095,046
9,607,727 10,674,772Cu rrent portion (classified under accrued expenses and other current
liabilities) (4,005,307) (1,126,546)
$ 5,602,420 $ 9,548,226
The payables for royalties were primarily attributable to several license arrangements that the Company entered into for certain semiconductor-related patents.
As of December 31, 2009, future payments for other long-term payables were as follows:
Year of Payment Amount
2010 $ 4,005,3072011 3,075,0942012 2,527,326
$ 9,607,727
2009 2008
Service cost $ 166,480 $ 151,656Interest cost 150,647 171,345Projected return on plan assets (57,382) (68,373)Amortization 29,924 4,461
Net periodic pension cost $ 289,669 $ 259,089
b. Reconciliation of funded status of the plans and accrued pension cost at December 31, 2009 and 2008
2009 2008
Benefit obligationVested benefit obligation $ 123,524 $ 114,930Nonvested benefit obligation 3,790,560 4,182,434Accumulated benefit obligation 3,914,084 4,297,364Additional benefits based on future salaries 2,643,695 3,263,413Projected benefit obligation 6,557,779 7,560,777
Fair value of plan assets (2,661,566) (2,487,577)Funded status 3,896,213 5,073,200Unrecognized net transition obligation (92,777) (101,326)Prior service cost 161,977 169,216Unrecognized net loss (168,381) (1,439,506)
Accrued pension cost $ 3,797,032 $ 3,701,584
Vested benefit $ 135,501 $ 126,259
17. PENSION PLANS
The pension mechanism under the Labor Pension Act is deemed a defined contribution plan. Pursuant to the Act, TSMC, GUC, Xintec and Mutual-Pak have made monthly contributions equal to 6% of each employee’s monthly salary to employees’ pension accounts. Furthermore, TSMC North America, TSMC China, TSMC Europe and TSMC Canada are required by local regulations to make monthly contributions at certain percentages of the basic salary of their employees. Pursuant to the aforementioned Act and local regulations, the Company recognized pension costs of NT$748,071 thousand and NT$779,612 thousand for the years ended December 31, 2009 and 2008, respectively.
TSMC, GUC and Xintec have defined benefit plans under the Labor Standards Law that provide benefits based on an employee’s service years and average monthly salary for the six-month period prior to retirement. The aforementioned companies contribute an amount equal to 2% of salaries paid each month to their respective pension funds (the Funds), which are administered by the Labor Pension Fund Supervisory Committee (the Committee) and deposited in the name of the committees in the Bank of Taiwan.
Pension information on the defined benefit plans is summarized as follows:
a. Components of net periodic pension cost for the year

58
2009 2008
Discount rate used in determining present values 2.25% 2.00% - 2.50%Future salary increase rate 3.00% 2.00% - 3.00%Expected rate of return on plan assets 1.50% - 2.00% 2.25% - 2.50%
c. Actuarial assumptions at December 31, 2009 and 2008
2009 2008
$ 194,221 $ 206,873
d. Contributions to the Funds for the year
2009 2008
$ 37,801 $ 28,990
e. Payments from the Funds for the year
18. INCOME TAX
a. A reconciliation of income tax expense based on “income before income tax” at statutory rates and income tax currently payable was as follows:
Years Ended December 31
2009 2008
Inc ome tax expense based on “income before income tax” at statutory rates $ 24,182,953 $ 27,970,388
The effect of the following:Tax-exempt income (8,652,030) (9,670,500)Temporary and permanent differences 3,136,013 2,122,899Others 247,050 44,073
Additional tax at 10% on unappropriated earnings 30,707 13,926Net operating loss carryforwards used (66,135) (205,234)Income tax credits used (9,984,616) (11,109,313)
Income tax currently payable $ 8,893,942 $ 9,166,239
Years Ended December 31
2009 2008
Income tax currently payable $ 8,893,942 $ 9,166,239Income tax adjustments on prior years (1,159,353) (707,255)Other income tax adjustments 23,023 204,587Net change in deferred income tax assets
Investment tax credits (1,291,102) 1,060,599Net operating loss carryforwards 59,940 411,368Temporary differences (1,042,295) (2,129,121)Valuation allowance 512,269 2,942,592
Income tax expense $ 5,996,424 $ 10,949,009
b. Income tax expense consisted of the following:
c. Net deferred income tax assets consisted of the following:
December 31
2009 2008
Current deferred income tax assetsInvestment tax credits $ 3,304,092 $ 2,885,762Temporary differences
Allowance for sales returns and others 814,557 710,098Others 665,586 846,376
Valuation allowance (413,926) (472,906)
$ 4,370,309 $ 3,969,330
Noncurrent deferred income tax assetsInvestment tax credits $ 12,184,624 $ 11,311,852Net operating loss carryforwards 3,440,825 3,588,968Temporary differences
Depreciation (1,573,025) (2,134,460)Others 1,106,746 506,181
Valuation allowance (7,170,867) (6,635,668)
$ 7,988,303 $ 6,636,873
In May 2009, the amendment of Article 5 of the Income Tax Law of the Republic of China announced that the income tax rate of profit-seeking enterprises will be reduced from 25% to 20%, and will be effective starting in 2010. TSMC and its domestic subsidiaries which are subject to the Income Tax Law of the Republic of China had recalculated their deferred tax assets in accordance with the amended Article and adjusted the resulting difference as an income tax expense.
As of December 31, 2009, the net operating loss carryforwards generated by WaferTech, TSMC Development, Xintec and Mutual-Pak would expire on various dates through 2026.
d. Integrated income tax information:
The balance of the imputation credit account (ICA) of TSMC as of December 31, 2009 and 2008 was NT$369,265 thousand and NT$521,634 thousand, respectively.
The estimated and actual creditable ratios for distribution of TSMC’s earnings of 2009 and 2008 were 0.35% and 9.10%, respectively.
The imputation credit allocated to the shareholders is based on its balance as of the date of dividend distribution. The estimated creditable ratio may change when the actual distribution of imputation credit is made.
e. All of TSMC’s earnings generated prior to December 31, 1997 have been appropriated.

59
f. As of December 31, 2009, investment tax credits of TSMC, GUC, Xintec and Mutual-Pak consisted of the following:
h. The tax authorities have examined income tax returns of TSMC through 2007. All investment tax credit adjustments assessed by the tax authorities have been recognized accordingly.
Law/Statute ItemTotal
Creditable Amount
Remaining Creditable
AmountExpiry Year
Statute for Upgrading Purchase of machinery and $ 587,048 $ - 2009 Industries equipment 1,331,228 110,488 2010
4,711,020 66,368 20113,464,868 3,464,868 20123,315,509 3,315,509 2013
$ 13,409,673 $ 6,957,233
Statute for Upgrading Research and development $ 2,711,736 $ 9,353 2010 Industries expenditures 2,809,829 2,090,320 2011
2,968,208 2,968,208 20123,409,744 3,409,744 2013
$ 11,899,517 $ 8,477,625
Statute for Upgrading Personnel training expenditures $ 37 $ - 2009 Industries 23,905 759 2010
20,081 20,081 201132,534 32,534 2012
484 484 2013
$ 77,041 $ 53,858
Statute for Upgrading Investments in important $ 7,297 $ - 2009 Industries technology-based enterprises 79,804 - 2010
$ 87,101 $ -
g. The profits generated from the following projects of TSMC, GUC and Xintec are exempt from income tax for a five-year period:
Tax-Exemption Period
Construction of Fab 14 - Module A 2006 to 2010Construction of Fab 12 - Module B and expansion of Fab 14 - Module A 2007 to 2011Construction of Fab 14 - Module B and expansion of Fab 12 and others 2008 to 20122003 plant expansion of GUC 2007 to 20112005 and 2006 plant expansion of GUC To be determined2003 plant expansion of Xintec 2007 to 2011
19. LABOR COST, DEPRECIATION AND AMORTIZATION
Year Ended December 31, 2009
Classified as Cost of Sales
Classified as Operating Expenses
Total
Labor costSalary and bonus $ 18,122,593 $ 15,798,756 $ 33,921,349Labor and health insurance 698,566 579,231 1,277,797Pension 603,765 433,910 1,037,675Meal 442,328 195,758 638,086Welfare 527,662 201,487 729,149Others 134,334 233,258 367,592
$ 20,529,248 $ 17,442,400 $ 37,971,648
Depreciation $ 74,482,133 $ 4,180,237 $ 78,662,370Amortization $ 1,259,949 $ 870,426 $ 2,130,375
Year Ended December 31, 2008
Classified as Cost of Sales
Classified asOperating Expenses
Total
Labor costSalary and bonus $ 19,574,249 $ 15,654,567 $ 35,228,816Labor and health insurance 766,952 489,601 1,256,553Pension 634,730 403,962 1,038,692Meal 474,048 188,407 662,455Welfare 640,817 273,055 913,872Others 262,144 171,631 433,775
$ 22,352,940 $ 17,181,223 $ 39,534,163
Depreciation $ 74,703,223 $ 4,033,588 $ 78,736,811Amortization $ 1,837,540 $ 878,755 $ 2,716,295
20. SHAREHOLDERS’ EQUITY
As of December 31, 2009, 1,097,513 thousand ADSs of TSMC were traded on the NYSE. The number of common shares represented by the ADSs was 5,487,565 thousand (one ADS represents five common shares).
Capital surplus can only be used to offset a deficit under the Company Law. However, the capital surplus generated from donations and the excess of the issuance price over the par value of capital stock (including the stock issued for new capital, mergers, convertible bonds and the surplus from treasury stock transactions) may be appropriated as stock dividends, which are limited to a certain percentage of TSMC’s paid-in capital. Also, the capital surplus from long-term investment may not be used for any purpose.

60
Capital surplus consisted of the following:
December 31
2009 2008
Additional paid-in capital $ 23,457,805 $ 17,962,468From merger 22,805,390 22,805,390From convertible bonds 8,893,190 8,893,190From long-term investments 329,570 214,152Donations 55 55
$ 55,486,010 $ 49,875,255
TSMC’s Articles of Incorporation provide that, when allocating the net profits for each fiscal year, TSMC shall first offset its losses in previous years and then set aside the following items accordingly:
a. Legal capital reserve at 10% of the profits left over, until the accumulated legal capital reserve equals TSMC’s paid-in capital;
b. Special capital reserve in accordance with relevant laws or regulations or as requested by the authorities in charge;
c. Bonus to directors and profit sharing to employees of TSMC of not more than 0.3% and not less than 1% of the remainder, respectively. Directors who also serve as executive officers of TSMC are not entitled to receive the bonus to directors. TSMC may issue profit sharing to employees in stock of an affiliated company meeting the conditions set by the Board of Directors or, by the person duly authorized by the Board of Directors;
d. Any balance left over shall be allocated according to the resolution of the shareholders’ meeting.
TSMC’s Articles of Incorporation also provide that profits of TSMC may be distributed by way of cash dividend and/or stock dividend. However, distribution of profits shall be made preferably by way of cash dividend. Distribution of profits may also be made by way of stock dividend; provided that the ratio for stock dividend shall not exceed 50% of the total distribution.
Any appropriations of the profits are subject to shareholders’ approval in the following year.
TSMC has recorded profit sharing to employees as a charge to earnings of approximately 7.5% and 15% of net income for the years ended December 2009 and 2008, respectively; bonuses to directors were accrued with an estimate based on historical experience. If the actual amounts subsequently resolved by the shareholders differ from the estimated amounts, the differences are recorded in the year of shareholders’ resolution as a change in accounting estimate. If profit sharing is resolved to be distributed to employees in stock, the number of shares is determined by dividing the amount of profit sharing by the closing price (after considering the effect of dividends) of the shares on the day preceding the shareholders’ meeting.
TSMC no longer has supervisors since January 1, 2007. The required duties of supervisors are being fulfilled by the Audit Committee.
The appropriation for legal capital reserve shall be made until the reserve equals TSMC’s paid-in capital. The reserve may be used to offset a deficit, or be distributed as dividends and bonuses for the portion in excess of 50% of the paid-in capital if TSMC has no unappropriated earnings and the reserve balance has exceeded 50% of TSMC’s paid-in capital. The Company Law also prescribes that, when the reserve has reached 50% of TSMC’s paid-in capital, up to 50% of the reserve may be transferred to capital.
A special capital reserve equivalent to the net debit balance of the other components of shareholders’ equity (for example, cumulative translation adjustments and unrealized loss on financial instruments, but excluding treasury stock) shall be made from unappropriated earnings pursuant to existing regulations promulgated by the Securities and Futures Bureau (SFB). Any special reserve appropriated may be reversed to the extent that the net debit balance reverses.
The appropriations of earnings for 2008 and 2007 had been approved in the TSMC’s shareholders meetings held on June 10, 2009 and June 13, 2008, respectively. The appropriations and dividends per share were as follows:
Appropriation of Earnings Dividends Per Share (NT$)
For FiscalYear 2008
For FiscalYear 2007
For FiscalYear 2008
For FiscalYear 2007
Legal capital reserve $ 9,993,317 $ 10,917,709Special capital reserve (391,857) (237,693)Profit sharing to employees - in cash - 3,939,883Profit sharing to employees - in stock - 3,939,883Cash dividends to shareholders 76,876,312 76,881,311 $ 3.00 $ 3.00Stock dividends to shareholders 512,509 512,542 0.02 0.02Bonus to directors - 176,890
$ 86,990,281 $ 96,130,525
TSMC’s profit sharing to employees that have been paid in cash and in stock as well as bonus to directors in the amounts of NT$7,494,988 thousand, NT$7,494,988 thousand and NT$158,080 thousand for 2008, respectively, had been approved in the shareholders’ meeting held on June 10, 2009. The profit sharing to employee in stock of 141,870 thousand shares was determined by the closing price of TSMC’s common shares (after considering the effect of dividends) of the day immediately preceding the shareholders’ meeting, which was NT$52.83. The resolved amounts of the profit sharing to employees and bonus to directors were consistent with the resolutions of meeting of the Board of Directors held on February 10, 2009 and same amount had been charged against earnings of 2008.
TSMC’s shareholders meeting held on June 10, 2009 also resolved to distribute stock dividends out of capital surplus, and stock dividends to shareholders as well as profit sharing to employees to be paid in stock in the amount of NT$768,763 thousand, NT$512,509 thousand and NT$7,494,988 thousand, respectively. The aforementioned capital increase had taken effect on July 21, 2009.
As of January 22, 2010, the Board of Directors of TSMC has not resolved the appropriation for earnings of 2009.
The information about the appropriations of profit sharing to employees and bonus to directors is available at the Market Observation Post System website.

61
Under the Integrated Income Tax System that became effective on January 1, 1998, R.O.C. resident shareholders are allowed a tax credit for their proportionate share of the income tax paid by TSMC on earnings generated since January 1, 1998.
21. STOCK-BASED COMPENSATION PLANS
TSMC’s Employee Stock Option Plans, consisting of the TSMC 2004 Plan, TSMC 2003 Plan, and TSMC 2002 Plan, were approved by the SFB on January 6, 2005, October 29, 2003 and June 25, 2002, respectively. The maximum number of options authorized to be granted under the TSMC 2004 Plan, TSMC 2003 Plan and TSMC 2002 Plan was 11,000 thousand, 120,000 thousand and 100,000 thousand, respectively, with each option eligible to subscribe for one common share of TSMC when exercisable. The options may be granted to qualified employees of TSMC or any of its domestic or foreign subsidiaries, in which TSMC’s shareholding with voting rights, directly or indirectly, is more than fifty percent (50%). The options of all the plans are valid for ten years and exercisable at certain percentages subsequent to the second anniversary of the grant date. Under the terms of the plans, the options are granted at an exercise price equal to the closing price of TSMC’s common shares listed on the TSE on the grant date.
Options of the plans that had never been granted or had been granted but subsequently canceled had expired as of December 31, 2009.
Information about TSMC’s outstanding options for the years ended December 31, 2009 and 2008 was as follows:
Number of Options (In Thousands)
Weighted-averageExercise Price (NT$)
Year ended December 31, 2009
Balance, beginning of year 36,234 $ 34.0Options granted 175 34.0Options exercised (7,272) 35.8Options canceled (327) 46.5
Balance, end of year 28,810 33.5
Year ended December 31, 2008
Balance, beginning of year 41,875 35.6Options granted 767 35.2Options exercised (6,027) 37.7Options canceled (381) 46.5
Balance, end of year 36,234 35.3
The numbers of outstanding options and exercise prices have been adjusted to reflect the distribution of earnings by TSMC in accordance with the plans. The options granted were the result of the aforementioned adjustment.
As of December 31, 2009, information about TSMC’s outstanding options was as follows:
Range of Exercise Price (NT$)
Options Outstanding
Number of Options (In Thousands)
Weighted-averageRemaining Contractual Life
(Years)
Weighted-average Exercise Price
(NT$)
$22.8 - $32.0 21,179 3.18 $ 29.138.0 - 50.1 7,631 4.88 45.5
28,810 3.63 33.5
As of December 31, 2009, all of the above outstanding options were exercisable.
GUC’s Employee Stock Option Plans, consisting of the GUC 2003 Plan and GUC 2002 Plan, were approved by its Board of Directors on January 23, 2003 and July 1, 2002, respectively. The maximum number of options authorized to be granted under the GUC 2003 Plan and GUC 2002 Plan was 7,535 and 5,000, respectively, with each option eligible to subscribe for one thousand common shares of GUC when exercisable. The options may be granted to qualified employees of GUC. The options of all the plans are valid for six years and exercisable at certain percentages subsequent to the second anniversary of the grant date.
Moreover, the GUC 2007 Plan, GUC 2006 Plan, and GUC 2004 Plan were approved by the SFB on November 28, 2007, July 3, 2006, and August 16, 2004 to grant a maximum of 1,999 options, 3,665 options and 2,500 options, respectively, with each option eligible to subscribe for one thousand common shares of GUC when exercisable. The options may be granted to qualified employees of GUC or any of its subsidiaries. Except for the options of the GUC 2006 Plan which are valid until August 15, 2011, the options of the other two GUC option Plans are valid for six years. Options of all three Plans are exercisable at certain percentages subsequent to the second anniversary of the grant date.
Information about GUC’s outstanding options for the years ended December 31, 2009 and 2008 was as follows:
Number of OptionsWeighted-average
Exercise Prices (NT$)
Year ended December 31, 2009
Balance, beginning of year 5,557 $ 63.9Options granted 87 13.8Options exercised (1,475) 11.0Options canceled (359) 63.4
Balance, end of year 3,810 83.5
Year ended December 31, 2008
Balance, beginning of year 7,598 60.3Options granted 284 14.8Options exercised (2,115) 14.0Options canceled (210) 168.4
Balance, end of year 5,557 66.6
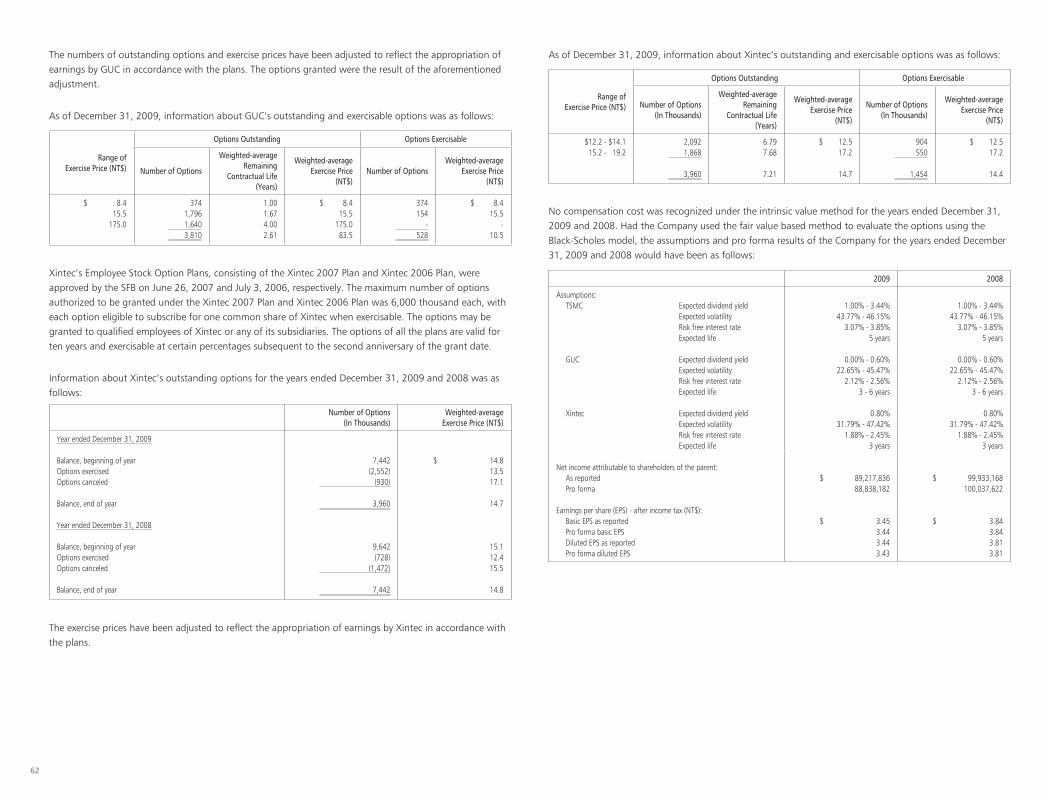
62
The numbers of outstanding options and exercise prices have been adjusted to reflect the appropriation of earnings by GUC in accordance with the plans. The options granted were the result of the aforementioned adjustment.
As of December 31, 2009, information about GUC’s outstanding and exercisable options was as follows:
Range ofExercise Price (NT$)
Options Outstanding Options Exercisable
Number of Options
Weighted-averageRemaining
Contractual Life (Years)
Weighted-average Exercise Price
(NT$)Number of Options
Weighted-average Exercise Price
(NT$)
$ 8.4 374 1.00 $ 8.4 374 $ 8.415.5 1,796 1.67 15.5 154 15.5
175.0 1,640 4.00 175.0 - -3,810 2.61 83.5 528 10.5
Xintec’s Employee Stock Option Plans, consisting of the Xintec 2007 Plan and Xintec 2006 Plan, were approved by the SFB on June 26, 2007 and July 3, 2006, respectively. The maximum number of options authorized to be granted under the Xintec 2007 Plan and Xintec 2006 Plan was 6,000 thousand each, with each option eligible to subscribe for one common share of Xintec when exercisable. The options may be granted to qualified employees of Xintec or any of its subsidiaries. The options of all the plans are valid for ten years and exercisable at certain percentages subsequent to the second anniversary of the grant date.
Information about Xintec’s outstanding options for the years ended December 31, 2009 and 2008 was as follows:
Number of Options(In Thousands)
Weighted-averageExercise Price (NT$)
Year ended December 31, 2009
Balance, beginning of year 7,442 $ 14.8Options exercised (2,552) 13.5Options canceled (930) 17.1
Balance, end of year 3,960 14.7
Year ended December 31, 2008
Balance, beginning of year 9,642 15.1Options exercised (728) 12.4Options canceled (1,472) 15.5
Balance, end of year 7,442 14.8
The exercise prices have been adjusted to reflect the appropriation of earnings by Xintec in accordance with the plans.
As of December 31, 2009, information about Xintec’s outstanding and exercisable options was as follows:
Range ofExercise Price (NT$)
Options Outstanding Options Exercisable
Number of Options (In Thousands)
Weighted-averageRemaining
Contractual Life (Years)
Weighted-average Exercise Price
(NT$)
Number of Options (In Thousands)
Weighted-average Exercise Price
(NT$)
$12.2 - $14.1 2,092 6.79 $ 12.5 904 $ 12.515.2 - 19.2 1,868 7.68 17.2 550 17.2
3,960 7.21 14.7 1,454 14.4
No compensation cost was recognized under the intrinsic value method for the years ended December 31, 2009 and 2008. Had the Company used the fair value based method to evaluate the options using the Black-Scholes model, the assumptions and pro forma results of the Company for the years ended December 31, 2009 and 2008 would have been as follows:
2009 2008
Assumptions:TSMC Expected dividend yield 1.00% - 3.44% 1.00% - 3.44%
Expected volatility 43.77% - 46.15% 43.77% - 46.15%Risk free interest rate 3.07% - 3.85% 3.07% - 3.85%Expected life 5 years 5 years
GUC Expected dividend yield 0.00% - 0.60% 0.00% - 0.60%Expected volatility 22.65% - 45.47% 22.65% - 45.47%Risk free interest rate 2.12% - 2.56% 2.12% - 2.56%Expected life 3 - 6 years 3 - 6 years
Xintec Expected dividend yield 0.80% 0.80%Expected volatility 31.79% - 47.42% 31.79% - 47.42%Risk free interest rate 1.88% - 2.45% 1.88% - 2.45%Expected life 3 years 3 years
Net income attributable to shareholders of the parent:As reported $ 89,217,836 $ 99,933,168Pro forma 88,838,182 100,037,622
Earnings per share (EPS) - after income tax (NT$):Basic EPS as reported $ 3.45 $ 3.84Pro forma basic EPS 3.44 3.84Diluted EPS as reported 3.44 3.81Pro forma diluted EPS 3.43 3.81

63
22. TREASURY STOCK
BeginningShares
AdditionStock
DividendsRetirement
EndingShares
Year ended December 31, 2008
Parent company stock held by subsidiaries 34,096 - 171 34,267 -Repurchase under share buyback plan 800,000 495,549 - 1,295,549 -
834,096 495,549 171 1,329,816 -
(Shares in Thousands)
TSMC held a meeting of the Board of Directors on November 13, 2007 and approved a share buyback plan to repurchase the TSMC’s common shares up to 800,000 thousand shares listed on the TSE during the period from November 14, 2007 to January 13, 2008 for the buyback price in the range from NT$43.2 to NT$94.2. TSMC had repurchased 800,000 thousand common shares. All the treasury stock repurchased under this share buyback plan was retired in February 2008.
TSMC held a meeting of the Board of Directors on May 13, 2008 and approved a share buyback plan to repurchase the TSMC’s common shares up to 500,000 thousand shares listed on the TSE during the period from May 14, 2008 to July 13, 2008 for the buyback price in the range from NT$48.25 to NT$100.50. TSMC had repurchased 216,674 thousand common shares. All the treasury stock repurchased under this share buyback plan was retired in August 2008.
TSMC held a meeting of the Board of Directors on August 12, 2008 and approved a share buyback plan to repurchase the TSMC’s common shares up to 283,000 thousand shares listed on the TSE during the period from August 13, 2008 to October 12, 2008 for the buyback price in the range from NT$42.85 to NT$86.20. TSMC had repurchased 278,875 thousand common shares. All the treasury stock repurchased under this share buyback plan was retired in November 2008.
TSMC merged Chi Cherng and Hsin Ruey in the third quarter of 2008. TSMC’s common shares held by Chi Cherng and Hsin Ruey in the number of 34,267 thousand shares were retired on August 2008.
Amounts (Numerator) Number of Shares
(Denominator)(In Thousands)
EPS (NT$)
BeforeIncome Tax
AfterIncome Tax
BeforeIncome Tax
AfterIncome Tax
Year ended December 31, 2009
Basic EPSEar nings available to common shareholders of the
parent $ 95,189,766 $ 89,217,836 25,835,802 $ 3.68 $ 3.45Effect of dilutive potential common shares - - 77,801
Diluted EPSEa rnings available to common shareholders of
the parent (including effect of dilutive potential common shares) $ 95,189,766 $ 89,217,836 25,913,603 $ 3.67 $ 3.44
Year ended December 31, 2008
Basic EPSEa rnings available to common shareholders of the
parent $110,847,835 $ 99,933,168 26,039,186 $ 4.26 $ 3.84Effect of dilutive potential common shares - - 196,493
Diluted EPSEa rnings available to common shareholders of
the parent (including effect of dilutive potential common shares) $110,847,835 $ 99,933,168 26,235,679 $ 4.23 $ 3.81
As discussed in Note 3, effective January 1, 2008, the Company adopted Interpretation 2007-052 that requires companies to record profit sharing to employees as an expense rather than as an appropriation of earnings. If the Company may settle the obligation by cash, by issuing shares, or in combination of both cash and shares, profit sharing to employees which will be settled in shares should be included in the weighted average number of shares outstanding in calculation of diluted EPS, if the shares have a dilutive effect. The number of shares is estimated by dividing the amount of profit sharing to employees in stock by the closing price (after considering the dilutive effect of dividends) of the common shares on the balance sheet date. Such dilutive effect of the potential shares needs to be included in the calculation of diluted EPS until the shares of profit sharing to employees are resolved in the shareholders’ meeting in the following year.
The average number of shares outstanding for EPS calculation has been retroactively adjusted for the issuance of stock dividends. This adjustment caused each the basic and diluted after income tax EPS for the year ended December 31, 2008 to decrease from NT$3.86 to NT$3.84 and NT$3.83 to NT$3.81, respectively.
23. EARNINGS PER SHARE
EPS is computed as follows:

64
e. Movements of the unrealized gains or losses on financial instruments for the years ended December 31, 2009 and 2008 were as follows:
Year Ended December 31, 2009
From Available-for-sale Financial
Assets
From Available-for-sale Financial
Assets Held by Investees
Total
Balance, beginning of year $ (198,413) $ (88,929) $ (287,342)Recognized directly in shareholders’ equity 391,801 118,422 510,223Removed from shareholders’ equity and recognized in earnings 230,740 - 230,740
Balance, end of year $ 424,128 $ 29,493 $ 453,621
Year Ended December 31, 2008
From Available-for-sale Financial
Assets
From Available-for-sale Financial
Assets Held by Investees
Total
Balance, beginning of year $ 627,838 $ 53,159 $ 680,997Recognized directly in shareholders’ equity (1,130,599) (142,088) (1,272,687)Removed from shareholders’ equity and recognized in earnings 304,348 - 304,348
Balance, end of year $ (198,413) $ (88,929) $ (287,342)
f. Information about financial risk
1) Market risk. The publicly traded stocks categorized as financial assets at fair value through profit or loss are exposed to market price fluctuations. The derivative financial instruments categorized as financial assets/liabilities at fair value through profit or loss are mainly used to hedge the exchange rate fluctuations of foreign-currency assets and liabilities; therefore, the market risk of derivatives will be offset by the foreign exchange risk of these hedged items. Available-for-sale financial assets and held-to-maturity financial assets held by the Company are mainly fixed-interest-rate debt securities; therefore, the fluctuations in market interest rates would result in changes in fair value of these debt securities. Subject to turmoil in the global financial market, the Company evaluated its financial assets and determined that certain impairment for its asset-backed securities is other-than-temporary. The Company had appropriately recognized related impairment losses.
2) Credit risk. Credit risk represents the potential loss that would be incurred by the Company if the counter-parties or third-parties breached contracts. Financial instruments with positive fair values at the balance sheet date are evaluated for credit risk. Subject to turmoil in the global financial market, the Company evaluated the financial instruments for any possible counter-party or third-party default. As a result of the evaluation, the Company determined that certain financial instruments are exposed to credit risk and had appropriately recognized related impairment losses.
3) Liquidity risk. The Company has sufficient operating capital to meet cash needs upon settlement of derivative financial instruments, bonds payable and bank loans. Therefore, the liquidity risk is low.
24. DISCLOSURES FOR FINANCIAL INSTRUMENTS
a. Fair values of financial instruments were as follows:
December 31
2009 2008
CarryingAmount
Fair ValueCarryingAmount
Fair Value
Assets
Financial assets at fair value through profit or loss $ 186,081 $ 186,081 $ 55,730 $ 55,730Available-for-sale financial assets 15,747,995 15,747,995 12,931,373 12,931,373Held-to-maturity financial assets 25,498,085 25,671,664 21,308,251 21,457,008
Liabilities
Financial liabilities at fair value through profit or loss 25 25 85,187 85,187Bonds payable (including current portion) 4,500,000 4,574,979 12,500,000 12,612,423Long-term bank loans (including current portion) 1,527,858 1,527,858 1,642,874 1,642,874Other long-term payables (including current portion) 9,607,727 9,607,727 10,674,772 10,674,772Obligations under capital leases 707,499 707,499 722,339 722,339
b. Methods and assumptions used in estimating fair values of financial instruments
1) The aforementioned financial instruments do not include cash and cash equivalents, receivables, other financial assets, refundable deposits, payables and guarantee deposits. The carrying amounts of these financial instruments approximate their fair values due to their short maturities.
2) Except for derivatives and structured time deposits, fair values of financial assets at fair value through profit or loss, available-for-sale and held-to-maturity financial assets were based on their quoted market prices.
3) The fair values of those derivatives and structured time deposits are determined using valuation techniques incorporating estimates and assumptions that were consistent with prevailing market conditions.
4) Fair value of the bonds payable was based on their quoted market price.
5) Fair values of long-term bank loans, other long-term payables and obligations under capital leases were based on the present value of expected cash flows, which approximate their carrying amounts.
c. The changes in fair value of derivatives contracts which were outstanding as of December 31, 2009 and 2008 estimated using valuation techniques were recognized as net gains of NT$186,056 thousand and net losses of NT$42,715 thousand, respectively.
d. As of December 31, 2009 and 2008, financial assets exposed to fair value interest rate risk were NT$40,857,296 thousand and NT$34,002,159 thousand, respectively; financial liabilities exposed to fair value interest rate risk were NT$4,500,025 thousand and NT$12,585,187 thousand, respectively, and financial liabilities exposed to cash flow interest rate risk were NT$1,527,858 thousand and NT$1,642,874 thousand, respectively.
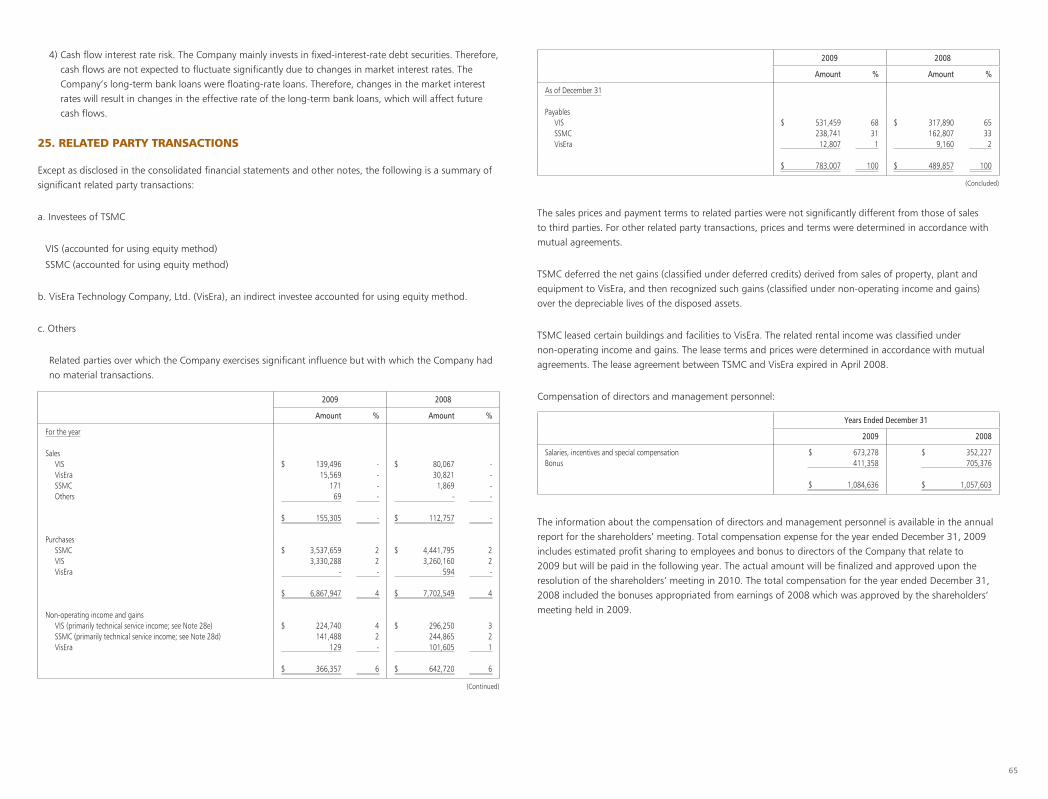
65
2009 2008
Amount % Amount %
For the year
SalesVIS $ 139,496 - $ 80,067 -VisEra 15,569 - 30,821 -SSMC 171 - 1,869 -Others 69 - - -
$ 155,305 - $ 112,757 -
PurchasesSSMC $ 3,537,659 2 $ 4,441,795 2VIS 3,330,288 2 3,260,160 2VisEra - - 594 -
$ 6,867,947 4 $ 7,702,549 4
Non-operating income and gainsVIS (primarily technical service income; see Note 28e) $ 224,740 4 $ 296,250 3SSMC (primarily technical service income; see Note 28d) 141,488 2 244,865 2VisEra 129 - 101,605 1
$ 366,357 6 $ 642,720 6
(Continued)
2009 2008
Amount % Amount %
As of December 31
PayablesVIS $ 531,459 68 $ 317,890 65SSMC 238,741 31 162,807 33VisEra 12,807 1 9,160 2
$ 783,007 100 $ 489,857 100
(Concluded)
The sales prices and payment terms to related parties were not significantly different from those of sales to third parties. For other related party transactions, prices and terms were determined in accordance with mutual agreements.
TSMC deferred the net gains (classified under deferred credits) derived from sales of property, plant and equipment to VisEra, and then recognized such gains (classified under non-operating income and gains) over the depreciable lives of the disposed assets.
TSMC leased certain buildings and facilities to VisEra. The related rental income was classified under non-operating income and gains. The lease terms and prices were determined in accordance with mutual agreements. The lease agreement between TSMC and VisEra expired in April 2008.
Compensation of directors and management personnel:
Years Ended December 31
2009 2008
Salaries, incentives and special compensation $ 673,278 $ 352,227Bonus 411,358 705,376
$ 1,084,636 $ 1,057,603
The information about the compensation of directors and management personnel is available in the annual report for the shareholders’ meeting. Total compensation expense for the year ended December 31, 2009 includes estimated profit sharing to employees and bonus to directors of the Company that relate to 2009 but will be paid in the following year. The actual amount will be finalized and approved upon the resolution of the shareholders’ meeting in 2010. The total compensation for the year ended December 31, 2008 included the bonuses appropriated from earnings of 2008 which was approved by the shareholders’ meeting held in 2009.
4) Cash flow interest rate risk. The Company mainly invests in fixed-interest-rate debt securities. Therefore, cash flows are not expected to fluctuate significantly due to changes in market interest rates. The Company’s long-term bank loans were floating-rate loans. Therefore, changes in the market interest rates will result in changes in the effective rate of the long-term bank loans, which will affect future cash flows.
25. RELATED PARTY TRANSACTIONS
Except as disclosed in the consolidated financial statements and other notes, the following is a summary of significant related party transactions:
a. Investees of TSMC
VIS (accounted for using equity method)
SSMC (accounted for using equity method)
b. VisEra Technology Company, Ltd. (VisEra), an indirect investee accounted for using equity method.
c. Others
Related parties over which the Company exercises significant influence but with which the Company had no material transactions.

66
28. SIGNIFICANT COMMITMENTS AND CONTINGENCIES
Significant commitments and contingencies of the Company as of December 31, 2009, excluding those disclosed in other notes, were as follows:
a. Under a technical cooperation agreement with ITRI, the R.O.C. Government or its designee approved by TSMC can use up to 35% of TSMC’s capacity if TSMC’s outstanding commitments to its customers are not prejudiced. The term of this agreement is for five years beginning from January 1, 1987 and is automatically renewed for successive periods of five years unless otherwise terminated by either party with one year prior notice.
b. Under several foundry agreements, TSMC shall reserve a portion of its production capacity for certain major customers that have guarantee deposits with TSMC. As of December 31, 2009 TSMC had a total of US$29,582 thousand of guarantee deposits.
c. Under a Shareholders Agreement entered into with Philips and EDB Investments Pte Ltd. on March 30, 1999, the parties formed a joint venture company, SSMC, which is an integrated circuit foundry in Singapore. TSMC’s equity interest in SSMC was 32%. Nevertheless, Philips parted with its semiconductor company which was renamed as NXP B.V. in September 2006. TSMC and NXP B.V. purchased all the SSMC shares owned by EDB Investments Pte Ltd. pro rata according to the Shareholders Agreement on November 15, 2006. After the purchase, TSMC and NXP B.V. currently own approximately 39% and 61% of the SSMC shares respectively. TSMC and Philips (now NXP B.V.) are required, in the aggregate, to purchase at least 70% of SSMC’s capacity, but TSMC alone is not required to purchase more than 28% of the capacity. If any party defaults on the commitment and the capacity utilization of SSMC fall below a specific percentage of its capacity, the defaulting party is required to compensate SSMC for all related unavoidable costs.
d. TSMC provides technical services to SSMC under a Technical Cooperation Agreement (the Agreement) effective March 30, 1999. TSMC receives compensation for such services computed at a specific percentage of net selling price of all products sold by SSMC. The Agreement shall remain in force for ten years and will be automatically renewed for successive periods of five years each unless pre-terminated by either party under certain conditions.
e. TSMC provides a technology transfer to VIS under a Manufacturing License and Technology Transfer Agreement entered into on April 1, 2004. TSMC receives compensation for such technology transfer in the form of royalty payments from VIS computed at specific percentages of net selling price of certain products sold by VIS. VIS agreed to reserve its certain capacity to manufacture for TSMC certain products at prices as agreed by the parties.
f. TSMC, TSMC North America and WaferTech filed a series of lawsuits in late 2003 and 2004 against Semiconductor Manufacturing International Corporation, SMIC (Shanghai) and SMIC Americas (aggregately referring to as “SMIC”). The lawsuits alleged that SMIC infringed multiple TSMC, TSMC North America and WaferTech patents and misappropriated TSMC, TSMC North America and WaferTech’s trade secrets. These suits were settled out of court on January 30, 2005. As part of the settlement, Semiconductor Manufacturing International Corporation shall pay US$175 million over six years to resolve TSMC, TSMC North America and WaferTech’s claims. As of December 31, 2009, SMIC had paid US$135 million in accordance with the terms of this settlement agreement. In August 2006, TSMC, TSMC North America
26. PLEDGED OR MORTGAGED ASSETS
The Company provided certain assets as collateral mainly for long-term bank loans, land lease agreements and customs duty guarantee, which were as follows:
December 31
2009 2008
Other financial assets $ 949,368 $ 33,377Property, plant and equipment, net 2,808,057 4,032,571Others assets 20,000 -
$ 3,777,425 $ 4,065,948
27. SIGNIFICANT LONG-TERM LEASES
The Company leases several parcels of land and office premises from the SPA and Jhongli Industrial Park Service Center. These operating leases expire on various dates from March 2010 to December 2029 and can be renewed upon expiration.
The Company entered into lease agreements for its office premises and certain equipment located in the United States, Europe, Japan, Shanghai and Taiwan. These operating leases expire between 2010 and 2018 and can be renewed upon expiration.
As of December 31, 2009, future lease payments were as follows:
Year Amount
2010 $ 557,5882011 504,2632012 487,1312013 462,4392014 444,2012015 and thereafter 3,293,532
$ 5,749,154

67
and WaferTech filed a lawsuit against SMIC in Alameda County Superior Court in California for breach of aforementioned settlement agreement, breach of promissory notes and trade secret misappropriation, seeking injunctive relief and monetary damages. In September 2006, SMIC filed a cross-complaint against TSMC, TSMC North America and WaferTech in the same court, alleging TSMC, TSMC North America and WaferTech of breach of the settlement agreement and implied covenant of good faith and fair dealing, in response to TSMC, TSMC North America and WaferTech’s August complaint. In November 2006, SMIC filed a complaint with Beijing People’s High Court against TSMC, TSMC North America and WaferTech alleging defamation and breach of good faith. The California State Superior Court of Alameda County issued an Order on TSMC, TSMC North America and WaferTech’s pre-trial motion for a preliminary injunction against SMIC on September 7, 2007. In the Order, the Court found “TSMC has demonstrated a significant likelihood that it will ultimately prevail on the merits of its claim for breach of certain paragraphs of the (2005) Settlement Agreement” with SMIC. The Court also found “TSMC has demonstrated a significant probability of establishing that SMIC retains and is using TSMC Information in SMIC’s 0.13um and smaller technologies, and there is significant threat of serious irreparable harm to TSMC if SMIC were to disclose or transfer that information before final resolution of the case”. Therefore, the Court ordered that, effective immediately, SMIC must provide advance notice and an opportunity for TSMC, TSMC North America and WaferTech to object before disclosing items enumerated in the Court Order to SMIC’s third party partners. The Court, however, did not grant a preliminary injunction as requested by TSMC, TSMC North America and WaferTech. In January 2009, the court in the California action held a four-day bench trial to determine whether a Settlement Agreement existed between the parties, and if there were an agreement, the interpretation of certain terms. SMIC contended that there was no binding Settlement Agreement, and TSMC, TSMC North America and WaferTech contended that the Settlement Agreement signed on January 30, 2005 and finalized shortly thereafter and repeatedly ratified bound the parties. On March 10, 2009, the Court issued its Statement of Decision. The Court rejected SMIC’s contention, and found that the parties were bound by the Settlement Agreement identified by TSMC, TSMC North America and WaferTech. The Court also interpreted the meaning of certain provisions within the Settlement Agreement. Regarding the claims raised by SMIC in the Beijing lawsuit, the Beijing People’s High Court has on June 10, 2009 rejected those claims and dismissed the lawsuit. On November 4, 2009, after a two-month trial, a jury in the California action found SMIC to have both breached the 2005 settlement agreement and misappropriated TSMC, TSMC North America and WaferTech’s trade secrets. TSMC, TSMC North America and WaferTech have subsequently settled both lawsuits with SMIC. Pursuant to the new settlement agreement, the parties have agreed to the entry of a stipulated judgment in favor of TSMC, TSMC North America and WaferTech in the California action, and to the dismissal of SMIC’s appeal against the Beijing High Court’s finding in favor of TSMC, TSMC North America and WaferTech. Under the new settlement agreement and the related stipulated judgment, SMIC has agreed to make cash payments by installments to TSMC totaling US$200 million, which are in addition to the US$135 million previously paid to TSMC under the 2005 settlement agreement, and to provide TSMC with other valuable consideration.
g. The Company entered into an agreement with a counterparty in 2003 whereby TSMC China is obligated to purchase certain property, plant and equipment at the agreed-upon price within the contract period. If the purchase is not completed, TSMC China is obligated to compensate the counterparty for the loss incurred. The property, plant and equipment have been in use by TSMC China since 2004 and are being depreciated over their estimated service lives. The related obligation totaled NT$8,355,395 thousand and NT$8,579,726 thousand as of December 31, 2009 and 2008, respectively, which is included in other long-term payables.
h. Amounts available under unused letters of credit as of December 31, 2009 were NT$16,155 thousand.
29. ADDITIONAL DISCLOSURES
Following are the additional disclosures required by the SFB for TSMC and its investees in which all significant intercompany balances and transactions are eliminated upon consolidation:
a. Financing provided: None;
b. Endorsement/guarantee provided: None;
c. Marketable securities held: Please see Table 1 attached;
d. Marketable securities acquired and disposed of at costs or prices of at least NT$100 million or 20% of the paid-in capital: Please see Table 2 attached;
e. Acquisition of individual real estate properties at costs of at least NT$100 million or 20% of the paid-in capital: Please see Table 3 attached;
f. Disposal of individual real estate properties at prices of at least NT$100 million or 20% of the paid-in capital: None;
g. Total purchases from or sales to related parties amounting to at least NT$100 million or 20% of the paid-in capital: Please see Table 4 attached;
h. Receivable from related parties amounting to at least NT$100 million or 20% of the paid-in capital: Please see Table 5 attached;
i. Names, locations, and related information of investees over which TSMC exercises significant influence: Please see Table 6 attached;
j. Information on investment in Mainland China
1) The name of the investee in mainland China, the main businesses and products, its issued capital, method of investment, information on inflow or outflow of capital, percentage of ownership, equity in the net gain or net loss, ending balance, amount received as dividends from the investee, and the limitation on investee: Please see Table 7 attached.
2) Significant direct or indirect transactions with the investee, its prices and terms of payment, unrealized gain or loss, and other related information which is helpful to understand the impact of investment in mainland China on financial reports: Please see Table 8 attached.
k. Intercompany relationships and significant intercompany transactions: Please see Table 8 attached.

68
c. Export sales
AreaYears Ended December 31
2009 2008
Asia $ 65,491,264 $ 55,383,901Europe and others 44,602,706 41,890,123
$ 110,093,970 $ 97,274,024
The export sales information is based on the amounts billed to customers within the areas.
d. Major customers representing at least 10% of gross sales
Years Ended December 31
2009 2008
Amount % Amount %
Customer A $ 33,025,488 11 $ 46,523,059 14Customer B 31,994,983 10 30,271,064 9
30. SEGMENT FINANCIAL INFORMATION
a. Industry financial information
The Company operates in one industry. Therefore, the disclosure of industry financial information is not applicable to the Company.
b. Geographic information:
North America and Others
TaiwanAdjustments and
EliminationConsolidated
2009
Sales to other than consolidated entities $ 162,783,488 $ 132,958,751 $ - $ 295,742,239Sales among consolidated entities 11,891,274 163,407,355 (175,298,629) -
Total sales $ 174,674,762 $ 296,366,106 $ (175,298,629) $ 295,742,239
Gross profit $ 2,004,734 $ 128,456,453 $ (1,132,576) $ 129,328,611Operating expenses (37,366,725)Non-operating income and gains 5,653,548Non-operating expenses and losses (2,152,787)
Income before income tax $ 95,462,647
Identifiable assets $ 113,023,501 $ 468,112,330 $ (24,285,114) $ 556,850,717Long-term investments 37,845,503
Total assets $ 594,696,220
2008
Sales to other than consolidated entities $ 193,727,539 $ 139,430,121 $ - $ 333,157,660Sales among consolidated entities 16,280,818 194,731,514 (211,012,332) -
Total sales $ 210,008,357 $ 334,161,635 $ (211,012,332) $ 333,157,660
Gross profit $ 2,114,127 $ 140,540,236 $ (904,802) $ 141,749,561Operating expenses (37,314,193)Non-operating income and gains 10,821,449Non-operating expenses and losses (3,784,571)
Income before income tax $ 111,472,246
Identifiable assets $ 122,781,555 $ 425,545,212 $ (29,391,693) $ 518,935,074Long-term investments 39,981,515
Total assets $ 558,916,589

69
Held Company Name Marketable Securities Type and Name Relationship with TSMC Financial Statement Account
December 31, 2009
NoteShares/Units(In Thousands)
Carrying Value(US$ in Thousands)
Percentage of Ownership (%)
Market Value or Net Asset Value
(US$ in Thousands)
TSMC Corporate bondTaiwan Mobile Co., Ltd. - Available-for-sale financial assets - $ 1,046,672 N/A $ 1,046,672Formosa Petrochemical Corporation - Held-to-maturity financial assets - 3,178,551 N/A 3,200,302Taiwan Power Company - 〃 - 3,004,941 N/A 3,011,743Nan Ya Plastics Corporation - 〃 - 2,000,145 N/A 2,029,935Formosa Plastics Corporation - 〃 - 1,671,815 N/A 1,685,345China Steel Corporation - 〃 - 1,512,130 N/A 1,528,117CPC Corporation, Taiwan - 〃 - 500,031 N/A 499,913Taipei Fubon Commercial Bank Co., Ltd. - 〃 - 298,884 N/A 298,751First Commercial Bank Co., Ltd. - 〃 - 99,814 N/A 99,815
Government bondEuropean Investment Bank Bonds - Held-to-maturity financial assets - 2,003,877 N/A 2,025,5002003 Asian Development Bank Govt. Bond - 〃 - 893,710 N/A 875,103
StockTSMC Global Subsidiary Investments accounted for using
equity method1 45,397,256 100 45,397,256
TSMC Partners Subsidiary 〃 988,268 32,545,619 100 32,545,619VIS Investee accounted for using
equity method〃 628,223 9,365,232 37 10,114,398
SSMC Investee accounted for using equity method
〃 314 6,157,141 39 5,581,994
TSMC North America Subsidiary 〃 11,000 2,723,727 100 2,723,727Xintec Investee with a controlling
financial interest〃 93,081 1,475,014 41 1,437,395
GUC Investee with a controlling financial interest
〃 46,688 983,126 35 7,913,592
TSMC Europe Subsidiary 〃 - 159,467 100 159,467TSMC Japan Subsidiary 〃 6 135,663 100 135,663TSMC Korea Subsidiary 〃 80 18,519 100 18,519United Industrial Gases Co., Ltd. - Financial assets carried at cost 16,783 193,584 10 297,655Shin-Etsu Handotai Taiwan Co., Ltd. - 〃 10,500 105,000 7 332,943W.K. Technology Fund IV - 〃 4,000 40,000 2 43,975
FundHorizon Ventures Fund - Financial assets carried at cost - 103,992 12 103,992Crimson Asia Capital - 〃 - 59,412 1 59,412
CapitalTSMC China Subsidiary Investments accounted for using
equity method- 2,961,043 100 2,958,707
VTAF III Subsidiary 〃 - 1,309,615 98 1,292,412VTAF II Subsidiary 〃 - 1,122,810 98 1,117,773Emerging Alliance Subsidiary 〃 - 305,866 99 305,866
TSMC Partners Corporate bondGeneral Elec Cap Corp. Mtn - Held-to-maturity financial assets - US$ 20,543 N/A US$ 21,312General Elec Cap Corp. Mtn - 〃 - US$ 20,219 N/A US$ 21,182
TABLE 1
Taiwan Semiconductor Manufacturing Company Limited and Subsidiaries
MARKETABLE SECURITIES HELD DECEMBER 31, 2009(Amounts in Thousands of New Taiwan Dollars, Unless Specified Otherwise)
(Continued)
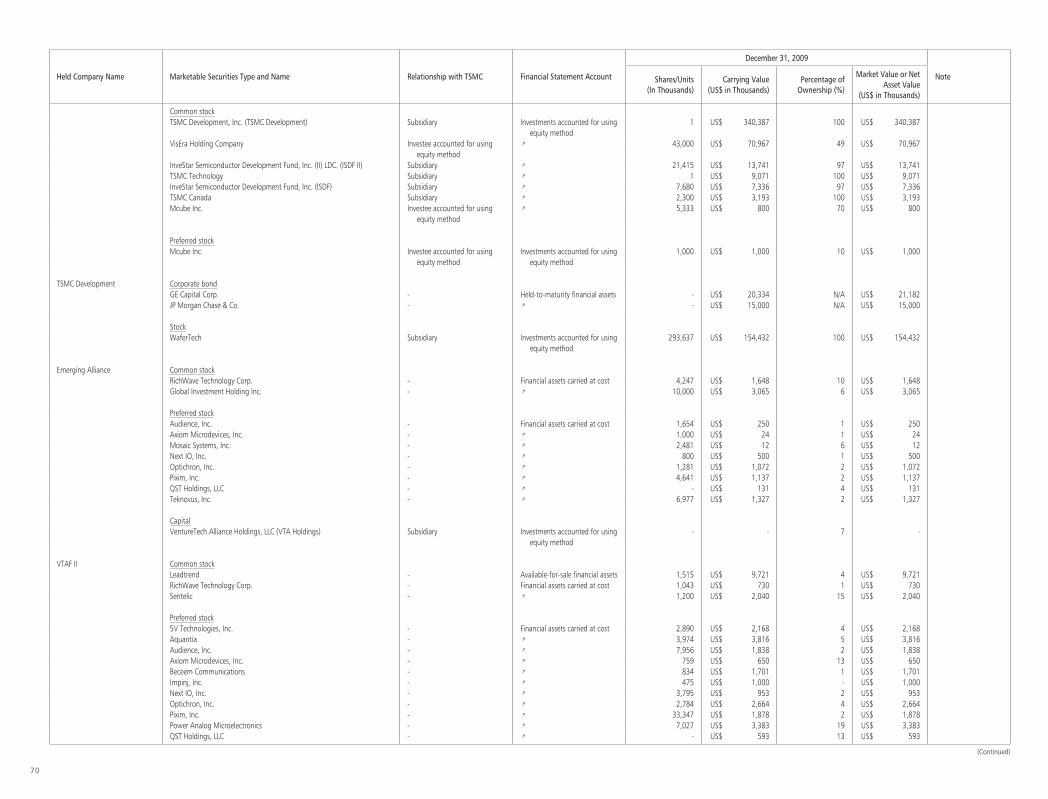
70
Held Company Name Marketable Securities Type and Name Relationship with TSMC Financial Statement Account
December 31, 2009
NoteShares/Units(In Thousands)
Carrying Value(US$ in Thousands)
Percentage of Ownership (%)
Market Value or Net Asset Value
(US$ in Thousands)
Common stockTSMC Development, Inc. (TSMC Development) Subsidiary Investments accounted for using
equity method 1 US$ 340,387 100 US$ 340,387
VisEra Holding Company Investee accounted for using equity method
〃 43,000 US$ 70,967 49 US$ 70,967
InveStar Semiconductor Development Fund, Inc. (II) LDC. (ISDF II) Subsidiary 〃 21,415 US$ 13,741 97 US$ 13,741TSMC Technology Subsidiary 〃 1 US$ 9,071 100 US$ 9,071InveStar Semiconductor Development Fund, Inc. (ISDF) Subsidiary 〃 7,680 US$ 7,336 97 US$ 7,336TSMC Canada Subsidiary 〃 2,300 US$ 3,193 100 US$ 3,193Mcube Inc. Investee accounted for using
equity method〃 5,333 US$ 800 70 US$ 800
Preferred stockMcube Inc. Investee accounted for using
equity methodInvestments accounted for using
equity method1,000 US$ 1,000 10 US$ 1,000
TSMC Development Corporate bondGE Capital Corp. - Held-to-maturity financial assets - US$ 20,334 N/A US$ 21,182JP Morgan Chase & Co. - 〃 - US$ 15,000 N/A US$ 15,000
StockWaferTech Subsidiary Investments accounted for using
equity method293,637 US$ 154,432 100 US$ 154,432
Emerging Alliance Common stockRichWave Technology Corp. - Financial assets carried at cost 4,247 US$ 1,648 10 US$ 1,648Global Investment Holding Inc. - 〃 10,000 US$ 3,065 6 US$ 3,065
Preferred stockAudience, Inc. - Financial assets carried at cost 1,654 US$ 250 1 US$ 250Axiom Microdevices, Inc. - 〃 1,000 US$ 24 1 US$ 24Mosaic Systems, Inc. - 〃 2,481 US$ 12 6 US$ 12Next IO, Inc. - 〃 800 US$ 500 1 US$ 500Optichron, Inc. - 〃 1,281 US$ 1,072 2 US$ 1,072Pixim, Inc. - 〃 4,641 US$ 1,137 2 US$ 1,137QST Holdings, LLC - 〃 - US$ 131 4 US$ 131Teknovus, Inc. - 〃 6,977 US$ 1,327 2 US$ 1,327
CapitalVentureTech Alliance Holdings, LLC (VTA Holdings) Subsidiary Investments accounted for using
equity method- - 7 -
VTAF II Common stockLeadtrend - Available-for-sale financial assets 1,515 US$ 9,721 4 US$ 9,721RichWave Technology Corp. - Financial assets carried at cost 1,043 US$ 730 1 US$ 730Sentelic - 〃 1,200 US$ 2,040 15 US$ 2,040
Preferred stock5V Technologies, Inc. - Financial assets carried at cost 2,890 US$ 2,168 4 US$ 2,168Aquantia - 〃 3,974 US$ 3,816 5 US$ 3,816Audience, Inc. - 〃 7,956 US$ 1,838 2 US$ 1,838Axiom Microdevices, Inc. - 〃 759 US$ 650 13 US$ 650Beceem Communications - 〃 834 US$ 1,701 1 US$ 1,701Impinj, Inc. - 〃 475 US$ 1,000 - US$ 1,000Next IO, Inc. - 〃 3,795 US$ 953 2 US$ 953Optichron, Inc. - 〃 2,784 US$ 2,664 4 US$ 2,664Pixim, Inc. - 〃 33,347 US$ 1,878 2 US$ 1,878Power Analog Microelectronics - 〃 7,027 US$ 3,383 19 US$ 3,383QST Holdings, LLC - 〃 - US$ 593 13 US$ 593
(Continued)

71
Held Company Name Marketable Securities Type and Name Relationship with TSMC Financial Statement Account
December 31, 2009
NoteShares/Units(In Thousands)
Carrying Value(US$ in Thousands)
Percentage of Ownership (%)
Market Value or Net Asset Value
(US$ in Thousands)
Teknovus, Inc. - Financial assets carried at cost 1,599 US$ 454 - US$ 454Xceive - 〃 3,936 US$ 1,516 2 US$ 1,516
CapitalVTA Holdings Subsidiary Investments accounted for using
equity method- - 31 -
VTAF III Common stockMutual-Pak Technology Co., Ltd. Subsidiary Investments accounted for using
equity method9,180 US$ 2,112 59 US$ 2,112
Acionn Technology Corporation Investee accounted for using equity method
〃 4,500 US$ 566 42 US$ 566
Preferred stockAuramicro, Inc. - Financial assets carried at cost 4,694 US$ 1,408 20 US$ 1,408BridgeLux, Inc. - 〃 4,955 US$ 6,391 4 US$ 6,391Exclara, Inc. - 〃 21,708 US$ 4,568 18 US$ 4,568GTBF, Inc. - 〃 1,154 US$ 1,500 N/A US$ 1,500InvenSense, Inc. - 〃 816 US$ 1,000 1 US$ 1,000LiquidLeds Lighting Corp. - 〃 1,600 US$ 800 11 US$ 800M2000, Inc. - 〃 3,000 US$ 3,000 5 US$ 3,000Neoconix, Inc. - 〃 3,283 US$ 4,608 6 US$ 4,608Powervation, Ltd. - 〃 310 US$ 4,678 16 US$ 4,678Quellan, Inc. - 〃 3,106 US$ 457 6 US$ 457Silicon Technical Services, LLC - 〃 1,055 US$ 1,208 1 US$ 1,208Tilera, Inc. - 〃 3,222 US$ 2,781 3 US$ 2,781Validity Sensors, Inc. - 〃 8,070 US$ 3,089 3 US$ 3,089
CapitalGrowth Fund Limited (Growth Fund) Subsidiary Investments accounted for using
equity method- US$ 823 100 US$ 823
VTA Holdings Subsidiary 〃 - - 62 -
Growth Fund Common stockStaccato - Financial assets carried at cost 10 US$ 25 - US$ 25SiliconBlue Technologies, Inc. - 〃 5,107 US$ 762 2 US$ 762
ISDF Common stockMemsic, Inc. - Available-for-sale financial assets 1,364 US$ 4,472 6 US$ 4,472Capella Microsystems (Taiwan), Inc. - Financial assets carried at cost 557 US$ 154 2 US$ 154
Preferred stockIntegrated Memory Logic, Inc. - Financial assets carried at cost 2,872 US$ 1,221 9 US$ 1,221IP Unity, Inc. - 〃 1,008 US$ 290 1 US$ 290Sonics, Inc. - 〃 230 US$ 497 2 US$ 497
ISDF II Common stockMemsic, Inc. - Available-for-sale financial assets 1,145 US$ 3,754 5 US$ 3,754Sonics, Inc. - Financial assets carried at cost 278 US$ 10 3 US$ 10Epic Communication, Inc. - 〃 50 US$ 23 - US$ 23EON Technology, Corp. - 〃 2,368 US$ 656 3 US$ 656Goyatek Technology, Corp. - 〃 932 US$ 545 6 US$ 545Capella Microsystems (Taiwan), Inc. - 〃 561 US$ 210 2 US$ 210Auden Technology MFG. Co., Ltd. - 〃 1,049 US$ 223 3 US$ 223
Preferred stockAlchip Technologies Limited - Financial assets carried at cost 6,979 US$ 3,664 18 US$ 3,664FangTek, Inc. - 〃 1,032 US$ 686 6 US$ 686Kilopass Technology, Inc. - 〃 3,887 US$ 500 5 US$ 500
(Continued)

72
Held Company Name Marketable Securities Type and Name Relationship with TSMC Financial Statement Account
December 31, 2009
NoteShares/Units(In Thousands)
Carrying Value(US$ in Thousands)
Percentage of Ownership (%)
Market Value or Net Asset Value
(US$ in Thousands)
Sonics, Inc. - Financial assets carried at cost 264 US$ 456 3 US$ 456
GUC Open-end mutual fundJih Sun Bond Fund - Available-for-sale financial assets 5,668 $ 80,008 - $ 80,008FSITC Taiwan Bond Fund - 〃 352 60,005 - 60,005Cathay Bond Fund - 〃 2,509 30,001 - 30,001
Common stockGUC-NA Subsidiary Investments accounted for using
equity method800 38,617 100 38,617
GUC-Japan Subsidiary 〃 1 12,899 100 12,899GUC-Europe Subsidiary 〃 - 5,213 100 5,213GUC-BVI Subsidiary 〃 550 17,466 100 17,466
Xintec CapitalCompositech Ltd. - Financial assets carried at cost 587 - 3 -
TSMC Global Corporate bondAb Svensk Exportkredit Swedish - Available-for-sale financial assets 5,000 US$ 5,144 N/A US$ 5,144African Development Bank - 〃 2,600 US$ 2,622 N/A US$ 2,622Allstate Life Global Fdg - 〃 220 US$ 221 N/A US$ 221Asian Development Bank - 〃 2,500 US$ 2,497 N/A US$ 2,497Astrazeneca Plc - 〃 2,150 US$ 2,349 N/A US$ 2,349Australia + New Zealand Bkg - 〃 2,000 US$ 2,054 N/A US$ 2,054Banco Bilbao Vizcaya P R - 〃 3,250 US$ 3,248 N/A US$ 3,248Bank New York Inc. Medium - 〃 2,100 US$ 2,262 N/A US$ 2,262Bank of New York Mellon - 〃 2,200 US$ 2,208 N/A US$ 2,208Bear Stearns Cos Inc. - 〃 5,000 US$ 4,974 N/A US$ 4,974Bear Stearns Cos Inc. - 〃 3,500 US$ 3,391 N/A US$ 3,391Bhp Billiton Fin USA Ltd. - 〃 2,000 US$ 2,129 N/A US$ 2,129Bnp Paribas SA - 〃 2,310 US$ 2,339 N/A US$ 2,339Boeing Co. - 〃 450 US$ 445 N/A US$ 445Bsch Issuances Ltd. - 〃 2,250 US$ 2,359 N/A US$ 2,359Cello Part/Veri Wirelss - 〃 2,000 US$ 2,068 N/A US$ 2,068Citibank NA - 〃 5,000 US$ 4,996 N/A US$ 4,996Citigroup funding Inc. - 〃 2,000 US$ 2,016 N/A US$ 2,016Credit Suisse New York - 〃 2,000 US$ 2,057 N/A US$ 2,057European Investment Bank - 〃 2,250 US$ 2,243 N/A US$ 2,243Federal Farm Cr Bks - 〃 2,250 US$ 2,254 N/A US$ 2,254Finance for Danish Ind - 〃 1,900 US$ 1,900 N/A US$ 1,900General Elec Cap Corp. - 〃 1,000 US$ 978 N/A US$ 978General Elec Cap Corp. - 〃 7,000 US$ 7,001 N/A US$ 7,001General Elec Cap Corp. Fdic Gtd - 〃 2,500 US$ 2,547 N/A US$ 2,547Goldman Sachs Group Inc. - 〃 2,000 US$ 1,939 N/A US$ 1,939Goldman Sachs Group Incser 2 - 〃 3,000 US$ 3,012 N/A US$ 3,012Hewlett Packard Co. - 〃 3,000 US$ 3,000 N/A US$ 3,000HSBC Fin Corp. - 〃 2,315 US$ 2,233 N/A US$ 2,233HSBC USA Inc. Fdic Gtd Tlgp - 〃 2,200 US$ 2,277 N/A US$ 2,277IBM Corp. - 〃 1,800 US$ 1,796 N/A US$ 1,796International Business Machs - 〃 3,000 US$ 3,027 N/A US$ 3,027Intl Bk Recon + Develop - 〃 2,000 US$ 2,069 N/A US$ 2,069JP Morgan Chase + Co. - 〃 2,500 US$ 2,523 N/A US$ 2,523JP Morgan Chase + Co. Fdic Gtd Tlg - 〃 3,000 US$ 3,030 N/A US$ 3,030Kfw - 〃 2,230 US$ 2,236 N/A US$ 2,236Kfw Medium Term Nts Book Entry - 〃 1,950 US$ 1,953 N/A US$ 1,953Kreditanstalt Fur Wiederaufbau - 〃 650 US$ 673 N/A US$ 673Lloyds Tsb Bank Plc Ser 144A - 〃 5,950 US$ 6,049 N/A US$ 6,049Mellon Fdg Corp. - 〃 3,500 US$ 3,419 N/A US$ 3,419Met Life Glob Funding I - 〃 2,100 US$ 2,142 N/A US$ 2,142
(Continued)
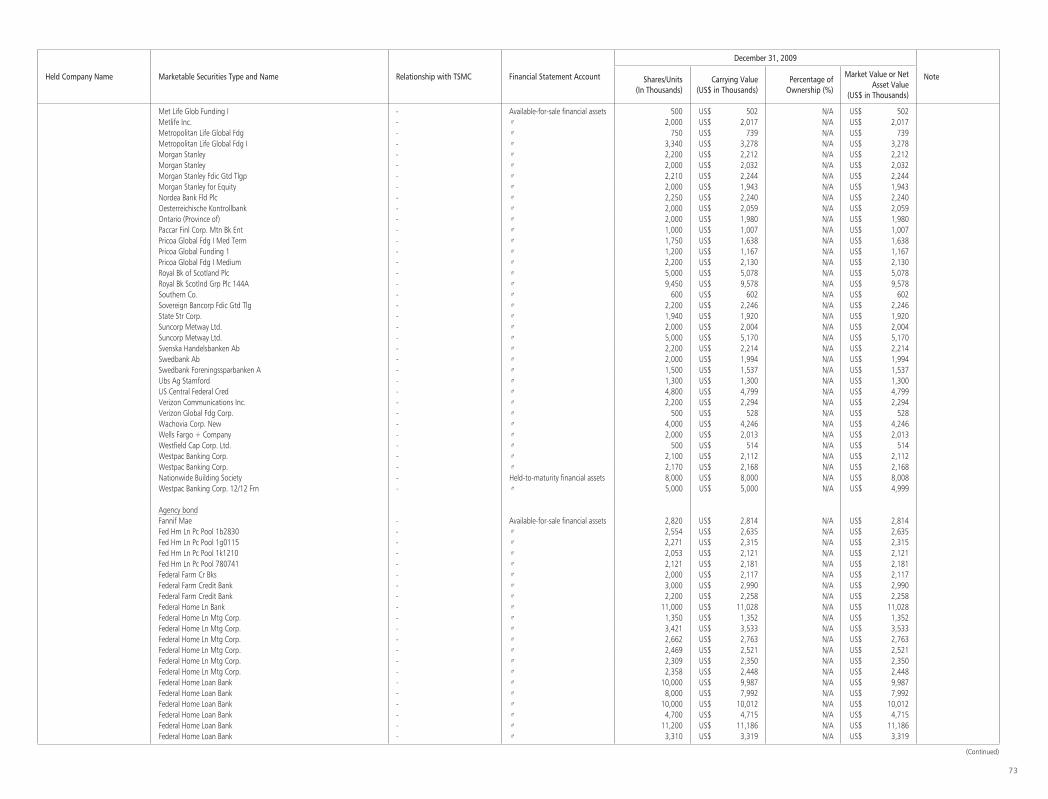
73
Held Company Name Marketable Securities Type and Name Relationship with TSMC Financial Statement Account
December 31, 2009
NoteShares/Units(In Thousands)
Carrying Value(US$ in Thousands)
Percentage of Ownership (%)
Market Value or Net Asset Value
(US$ in Thousands)
Met Life Glob Funding I - Available-for-sale financial assets 500 US$ 502 N/A US$ 502Metlife Inc. - 〃 2,000 US$ 2,017 N/A US$ 2,017Metropolitan Life Global Fdg - 〃 750 US$ 739 N/A US$ 739Metropolitan Life Global Fdg I - 〃 3,340 US$ 3,278 N/A US$ 3,278Morgan Stanley - 〃 2,200 US$ 2,212 N/A US$ 2,212Morgan Stanley - 〃 2,000 US$ 2,032 N/A US$ 2,032Morgan Stanley Fdic Gtd Tlgp - 〃 2,210 US$ 2,244 N/A US$ 2,244Morgan Stanley for Equity - 〃 2,000 US$ 1,943 N/A US$ 1,943Nordea Bank Fld Plc - 〃 2,250 US$ 2,240 N/A US$ 2,240Oesterreichische Kontrollbank - 〃 2,000 US$ 2,059 N/A US$ 2,059Ontario (Province of) - 〃 2,000 US$ 1,980 N/A US$ 1,980Paccar Finl Corp. Mtn Bk Ent - 〃 1,000 US$ 1,007 N/A US$ 1,007Pricoa Global Fdg I Med Term - 〃 1,750 US$ 1,638 N/A US$ 1,638Pricoa Global Funding 1 - 〃 1,200 US$ 1,167 N/A US$ 1,167Pricoa Global Fdg I Medium - 〃 2,200 US$ 2,130 N/A US$ 2,130Royal Bk of Scotland Plc - 〃 5,000 US$ 5,078 N/A US$ 5,078Royal Bk Scotlnd Grp Plc 144A - 〃 9,450 US$ 9,578 N/A US$ 9,578Southern Co. - 〃 600 US$ 602 N/A US$ 602Sovereign Bancorp Fdic Gtd Tlg - 〃 2,200 US$ 2,246 N/A US$ 2,246State Str Corp. - 〃 1,940 US$ 1,920 N/A US$ 1,920Suncorp Metway Ltd. - 〃 2,000 US$ 2,004 N/A US$ 2,004Suncorp Metway Ltd. - 〃 5,000 US$ 5,170 N/A US$ 5,170Svenska Handelsbanken Ab - 〃 2,200 US$ 2,214 N/A US$ 2,214Swedbank Ab - 〃 2,000 US$ 1,994 N/A US$ 1,994Swedbank Foreningssparbanken A - 〃 1,500 US$ 1,537 N/A US$ 1,537Ubs Ag Stamford - 〃 1,300 US$ 1,300 N/A US$ 1,300US Central Federal Cred - 〃 4,800 US$ 4,799 N/A US$ 4,799Verizon Communications Inc. - 〃 2,200 US$ 2,294 N/A US$ 2,294Verizon Global Fdg Corp. - 〃 500 US$ 528 N/A US$ 528Wachovia Corp. New - 〃 4,000 US$ 4,246 N/A US$ 4,246Wells Fargo + Company - 〃 2,000 US$ 2,013 N/A US$ 2,013Westfield Cap Corp. Ltd. - 〃 500 US$ 514 N/A US$ 514Westpac Banking Corp. - 〃 2,100 US$ 2,112 N/A US$ 2,112Westpac Banking Corp. - 〃 2,170 US$ 2,168 N/A US$ 2,168Nationwide Building Society - Held-to-maturity financial assets 8,000 US$ 8,000 N/A US$ 8,008Westpac Banking Corp. 12/12 Frn - 〃 5,000 US$ 5,000 N/A US$ 4,999
Agency bondFannif Mae - Available-for-sale financial assets 2,820 US$ 2,814 N/A US$ 2,814Fed Hm Ln Pc Pool 1b2830 - 〃 2,554 US$ 2,635 N/A US$ 2,635Fed Hm Ln Pc Pool 1g0115 - 〃 2,271 US$ 2,315 N/A US$ 2,315Fed Hm Ln Pc Pool 1k1210 - 〃 2,053 US$ 2,121 N/A US$ 2,121Fed Hm Ln Pc Pool 780741 - 〃 2,121 US$ 2,181 N/A US$ 2,181Federal Farm Cr Bks - 〃 2,000 US$ 2,117 N/A US$ 2,117Federal Farm Credit Bank - 〃 3,000 US$ 2,990 N/A US$ 2,990Federal Farm Credit Bank - 〃 2,200 US$ 2,258 N/A US$ 2,258Federal Home Ln Bank - 〃 11,000 US$ 11,028 N/A US$ 11,028Federal Home Ln Mtg Corp. - 〃 1,350 US$ 1,352 N/A US$ 1,352Federal Home Ln Mtg Corp. - 〃 3,421 US$ 3,533 N/A US$ 3,533Federal Home Ln Mtg Corp. - 〃 2,662 US$ 2,763 N/A US$ 2,763Federal Home Ln Mtg Corp. - 〃 2,469 US$ 2,521 N/A US$ 2,521Federal Home Ln Mtg Corp. - 〃 2,309 US$ 2,350 N/A US$ 2,350Federal Home Ln Mtg Corp. - 〃 2,358 US$ 2,448 N/A US$ 2,448Federal Home Loan Bank - 〃 10,000 US$ 9,987 N/A US$ 9,987Federal Home Loan Bank - 〃 8,000 US$ 7,992 N/A US$ 7,992Federal Home Loan Bank - 〃 10,000 US$ 10,012 N/A US$ 10,012Federal Home Loan Bank - 〃 4,700 US$ 4,715 N/A US$ 4,715Federal Home Loan Bank - 〃 11,200 US$ 11,186 N/A US$ 11,186Federal Home Loan Bank - 〃 3,310 US$ 3,319 N/A US$ 3,319
(Continued)

74
Held Company Name Marketable Securities Type and Name Relationship with TSMC Financial Statement Account
December 31, 2009
NoteShares/Units(In Thousands)
Carrying Value(US$ in Thousands)
Percentage of Ownership (%)
Market Value or Net Asset Value
(US$ in Thousands)
Federal Home Loan Bank - Available-for-sale financial assets 3,000 US$ 2,989 N/A US$ 2,989Federal Home Loan Bank - 〃 3,000 US$ 2,983 N/A US$ 2,983Federal Home Loan Bank - 〃 3,000 US$ 2,984 N/A US$ 2,984Federal Home Loan Mtg Corp. - 〃 1,411 US$ 1,441 N/A US$ 1,441Federal Home Loan Mtg Corp. - 〃 1,940 US$ 2,012 N/A US$ 2,012Federal National Mort Assoc - 〃 2,117 US$ 2,176 N/A US$ 2,176Federal National Mort Assoc - 〃 1,752 US$ 1,782 N/A US$ 1,782Federal Natl Mtg Assn Gtd Remi - 〃 2,854 US$ 2,926 N/A US$ 2,926Federal Natl Mtg Assn Mtn - 〃 2,669 US$ 2,765 N/A US$ 2,765Federal Natl Mtg Assn Remic - 〃 2,871 US$ 2,953 N/A US$ 2,953Federal Natl Mtg Assn - 〃 4,000 US$ 4,228 N/A US$ 4,228Federal Natl Mtge Assn - 〃 2,039 US$ 2,126 N/A US$ 2,126Fhr 3087 Jb - 〃 2,540 US$ 2,656 N/A US$ 2,656Fnma Pool 745688 - 〃 2,272 US$ 2,336 N/A US$ 2,336Fnma Pool 790772 - 〃 1,527 US$ 1,568 N/A US$ 1,568Fnma Pool 819649 - 〃 2,318 US$ 2,383 N/A US$ 2,383Fnma Pool 829989 - 〃 2,146 US$ 2,221 N/A US$ 2,221Fnma Pool 846233 - 〃 2,288 US$ 2,332 N/A US$ 2,332Fnma Pool 870884 - 〃 2,357 US$ 2,442 N/A US$ 2,442Fnma Pool 879908 - 〃 2,056 US$ 2,128 N/A US$ 2,128Fnr 2005 47 Ha - 〃 2,652 US$ 2,753 N/A US$ 2,753Fnr 2006 60 Co - 〃 3,062 US$ 3,153 N/A US$ 3,153Fnr 2009 70 Nt - 〃 2,537 US$ 2,609 N/A US$ 2,609Freddie Mac - 〃 4,500 US$ 4,491 N/A US$ 4,491Gnma II Pool 082431 - 〃 2,000 US$ 2,030 N/A US$ 2,030
Government bondUS Treasury N/B - Available-for-sale financial assets 21,400 US$ 21,394 N/A US$ 21,394US Treasury N/B - 〃 2,170 US$ 2,158 N/A US$ 2,158US Treasury Nts - 〃 37,700 US$ 39,012 N/A US$ 39,012United States Treas Nts - 〃 10,536 US$ 10,548 N/A US$ 10,548Societe De Financement De Lec - Held-to-maturity financial assets 15,000 US$ 15,000 N/A US$ 15,091
Corporate issued noteBarclays U.S. Fdg LLC - Available-for-sale financial assets 4,500 US$ 4,489 N/A US$ 4,489Royal Bk of Scotland - 〃 5,000 US$ 4,982 N/A US$ 4,982
Money market fundSsga Cash Mgmt Global Offshore - Available-for-sale financial assets 8,858 US$ 8,858 N/A US$ 8,858
(Concluded)

75
Company Name
Marketable Securities Type and Name
Financial Statement Account
Counter-partyNature of Relationship
Beginning Balance Acquisition Disposal (Note 2) Ending Balance (Note 3)
Shares/Units(In Thousands)
Amount(US$ in
Thousands)
Shares/Units(In Thousands)
(Note 1)
Amount(US$ in
Thousands)
Shares/Units(In Thousands)
Amount(US$ in
Thousands)
Carrying Value (US$ in
Thousands)
Gain (Loss) or Disposal (US$ in Thousands)
Shares/Units(In Thousands)
Amount (US$ in
Thousands)
TSMC Corporate bondTaiwan Mobile Co., Ltd. Available-for-sale
financial assetsGrand Cathay Securities Corp. and several financial institutions
- - $ 2,032,658 - $ - - $ 1,037,370 $ 1,000,000 $ 37,370 - $ 1,046,672
Formosa Petrochemical Corporation Held-to-maturity financial assets
〃 - - 3,554,908 - 457,351 - - - - - 3,178,551
Taiwan Power Company 〃 〃 - - 4,209,629 - 203,892 - - - - - 3,004,941Formosa Plastic Corporation 〃 〃 - - 2,385,285 - 203,994 - - - - - 1,671,815China Steel Corporation 〃 〃 - - 1,000,000 - 514,672 - - - - - 1,512,130Taipei Fubon Commercial Bank Co., Ltd.
〃 〃 - - - - 298,677 - - - - - 298,884
Government bondEuropean Investment Bank Bonds Held-to-maturity
financial assetsGrand Cathay Securities Corp. and several financial institutions
- - 383,387 - 2,025,500 - 400,000 383,909 16,091 - 2,003,876
CapitalVTAF III Investments
accounted for using equity method
- Subsidiary - 1,305,605 - 262,922 - - - - - 1,309,615
TSMC Corporate bond Development JP Morgan Chase & Co. Held-to-maturity
financial assetsJP Morgan Securitied Inc. - - - - US$ 15,000 - - - - - US$ 15,000
GUC Open-end mutual fundJih Sun Bond Fund Available-for-sale
financial assetsJih Sun Investment Trust Co., Ltd. - - - 19,143 270,000 13,475 190,120 190,000 120 5,668 80,008
FSITC Taiwan Bond Fund 〃 First Securities Investment Trust Co., Ltd.
- - - 1,146 195,000 794 135,206 135,000 206 352 60,005
Prudential Financial Bond Fund 〃 Prudential Financial Securities Investment Trust Enterprise
- - - 11,261 170,000 11,261 170,319 170,000 319 - -
PCA Well Pool Fund 〃 PCA Securities Investment Trust Co., Ltd.
- - - 13,121 170,000 13,121 170,241 170,000 241 - -
Hua Nan Phoenix Bond Fund 〃 Hua Nan Investment Trust Co., Ltd. - - - 10,287 160,000 10,287 160,143 160,000 143 - -
TSMC Global Corporate bondAb Svensk Exportkredit Swedish Available-for-sale
financial assets- - - - 5,000 US$ 5,185 - - - - 5,000 US$ 5,144
Banco Bilbao Vizcaya P R 〃 - - - - 3,250 US$ 3,250 - - - - 3,250 US$ 3,248Bear Stearns Cos Inc. 〃 - - - - 5,000 US$ 4,965 - - - - 5,000 US$ 4,974Bear Stearns Cos Inc. 〃 - - - - 3,500 US$ 3,360 - - - - 3,500 US$ 3,391Chase Manhattan Corp. New 〃 - - 3,250 US$ 3,353 - - 3,250 US$ 3,380 US$ 3,480 US$ (100) - -Citibank NA 〃 - - - - 3,000 US$ 3,002 3,000 US$ 3,002 US$ 3,002 - - -Citibank NA 〃 - - - - 5,000 US$ 4,995 - - - - 5,000 US$ 4,996Deutsche Bank Ag London 〃 - - 2,995 US$ 3,013 - - 2,995 US$ 3,021 US$ 3,041 US$ (20) - -General Elec Cap Corp. 〃 - - - - 5,000 US$ 4,834 4,000 US$ 3,880 US$ 3,868 US$ 12 1,000 US$ 978General Elec Cap Corp. 〃 - - - - 7,000 US$ 7,002 - - - - 7,000 US$ 7,001
TABLE 2
Taiwan Semiconductor Manufacturing Company Limited and Subsidiaries
MARKETABLE SECURITIES ACQUIRED AND DISPOSED OF AT COSTS OR PRICES OF AT LEAST NT$100 MILLION OR 20% OF THE PAID-IN CAPITALFOR THE YEAR ENDED DECEMBER 31, 2009(Amounts in Thousands of New Taiwan Dollars, Unless Specified Otherwise)
(Continued)
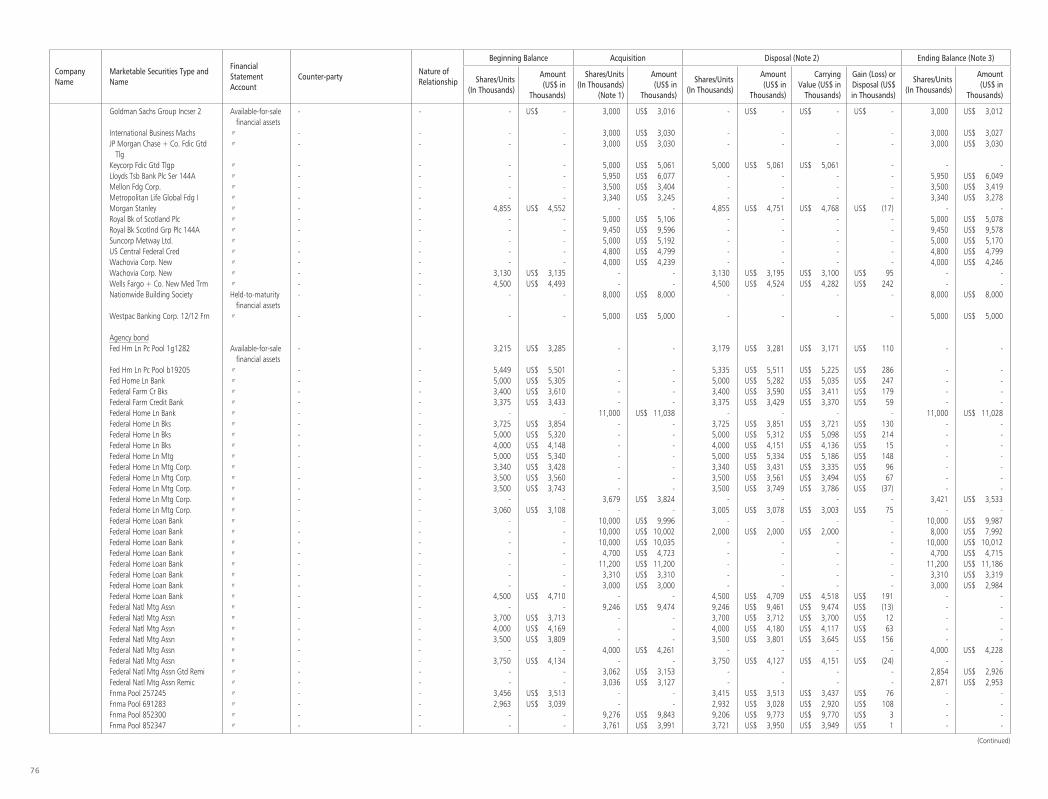
76
Company Name
Marketable Securities Type and Name
Financial Statement Account
Counter-partyNature of Relationship
Beginning Balance Acquisition Disposal (Note 2) Ending Balance (Note 3)
Shares/Units(In Thousands)
Amount(US$ in
Thousands)
Shares/Units(In Thousands)
(Note 1)
Amount(US$ in
Thousands)
Shares/Units(In Thousands)
Amount(US$ in
Thousands)
Carrying Value (US$ in
Thousands)
Gain (Loss) or Disposal (US$ in Thousands)
Shares/Units(In Thousands)
Amount (US$ in
Thousands)
Goldman Sachs Group Incser 2 Available-for-sale financial assets
- - - US$ - 3,000 US$ 3,016 - US$ - US$ - US$ - 3,000 US$ 3,012
International Business Machs 〃 - - - - 3,000 US$ 3,030 - - - - 3,000 US$ 3,027JP Morgan Chase + Co. Fdic Gtd Tlg
〃 - - - - 3,000 US$ 3,030 - - - - 3,000 US$ 3,030
Keycorp Fdic Gtd Tlgp 〃 - - - - 5,000 US$ 5,061 5,000 US$ 5,061 US$ 5,061 - - -Lloyds Tsb Bank Plc Ser 144A 〃 - - - - 5,950 US$ 6,077 - - - - 5,950 US$ 6,049Mellon Fdg Corp. 〃 - - - - 3,500 US$ 3,404 - - - - 3,500 US$ 3,419Metropolitan Life Global Fdg I 〃 - - - - 3,340 US$ 3,245 - - - - 3,340 US$ 3,278Morgan Stanley 〃 - - 4,855 US$ 4,552 - - 4,855 US$ 4,751 US$ 4,768 US$ (17) - -Royal Bk of Scotland Plc 〃 - - - - 5,000 US$ 5,106 - - - - 5,000 US$ 5,078Royal Bk Scotlnd Grp Plc 144A 〃 - - - - 9,450 US$ 9,596 - - - - 9,450 US$ 9,578Suncorp Metway Ltd. 〃 - - - - 5,000 US$ 5,192 - - - - 5,000 US$ 5,170US Central Federal Cred 〃 - - - - 4,800 US$ 4,799 - - - - 4,800 US$ 4,799Wachovia Corp. New 〃 - - - - 4,000 US$ 4,239 - - - - 4,000 US$ 4,246Wachovia Corp. New 〃 - - 3,130 US$ 3,135 - - 3,130 US$ 3,195 US$ 3,100 US$ 95 - -Wells Fargo + Co. New Med Trm 〃 - - 4,500 US$ 4,493 - - 4,500 US$ 4,524 US$ 4,282 US$ 242 - -Nationwide Building Society Held-to-maturity
financial assets- - - - 8,000 US$ 8,000 - - - - 8,000 US$ 8,000
Westpac Banking Corp. 12/12 Frn 〃 - - - - 5,000 US$ 5,000 - - - - 5,000 US$ 5,000
Agency bondFed Hm Ln Pc Pool 1g1282 Available-for-sale
financial assets- - 3,215 US$ 3,285 - - 3,179 US$ 3,281 US$ 3,171 US$ 110 - -
Fed Hm Ln Pc Pool b19205 〃 - - 5,449 US$ 5,501 - - 5,335 US$ 5,511 US$ 5,225 US$ 286 - -Fed Home Ln Bank 〃 - - 5,000 US$ 5,305 - - 5,000 US$ 5,282 US$ 5,035 US$ 247 - -Federal Farm Cr Bks 〃 - - 3,400 US$ 3,610 - - 3,400 US$ 3,590 US$ 3,411 US$ 179 - -Federal Farm Credit Bank 〃 - - 3,375 US$ 3,433 - - 3,375 US$ 3,429 US$ 3,370 US$ 59 - -Federal Home Ln Bank 〃 - - - - 11,000 US$ 11,038 - - - - 11,000 US$ 11,028Federal Home Ln Bks 〃 - - 3,725 US$ 3,854 - - 3,725 US$ 3,851 US$ 3,721 US$ 130 - -Federal Home Ln Bks 〃 - - 5,000 US$ 5,320 - - 5,000 US$ 5,312 US$ 5,098 US$ 214 - -Federal Home Ln Bks 〃 - - 4,000 US$ 4,148 - - 4,000 US$ 4,151 US$ 4,136 US$ 15 - -Federal Home Ln Mtg 〃 - - 5,000 US$ 5,340 - - 5,000 US$ 5,334 US$ 5,186 US$ 148 - -Federal Home Ln Mtg Corp. 〃 - - 3,340 US$ 3,428 - - 3,340 US$ 3,431 US$ 3,335 US$ 96 - -Federal Home Ln Mtg Corp. 〃 - - 3,500 US$ 3,560 - - 3,500 US$ 3,561 US$ 3,494 US$ 67 - -Federal Home Ln Mtg Corp. 〃 - - 3,500 US$ 3,743 - - 3,500 US$ 3,749 US$ 3,786 US$ (37) - -Federal Home Ln Mtg Corp. 〃 - - - - 3,679 US$ 3,824 - - - - 3,421 US$ 3,533Federal Home Ln Mtg Corp. 〃 - - 3,060 US$ 3,108 - - 3,005 US$ 3,078 US$ 3,003 US$ 75 - -Federal Home Loan Bank 〃 - - - - 10,000 US$ 9,996 - - - - 10,000 US$ 9,987Federal Home Loan Bank 〃 - - - - 10,000 US$ 10,002 2,000 US$ 2,000 US$ 2,000 - 8,000 US$ 7,992Federal Home Loan Bank 〃 - - - - 10,000 US$ 10,035 - - - - 10,000 US$ 10,012Federal Home Loan Bank 〃 - - - - 4,700 US$ 4,723 - - - - 4,700 US$ 4,715Federal Home Loan Bank 〃 - - - - 11,200 US$ 11,200 - - - - 11,200 US$ 11,186Federal Home Loan Bank 〃 - - - - 3,310 US$ 3,310 - - - - 3,310 US$ 3,319Federal Home Loan Bank 〃 - - - - 3,000 US$ 3,000 - - - - 3,000 US$ 2,984Federal Home Loan Bank 〃 - - 4,500 US$ 4,710 - - 4,500 US$ 4,709 US$ 4,518 US$ 191 - -Federal Natl Mtg Assn 〃 - - - - 9,246 US$ 9,474 9,246 US$ 9,461 US$ 9,474 US$ (13) - -Federal Natl Mtg Assn 〃 - - 3,700 US$ 3,713 - - 3,700 US$ 3,712 US$ 3,700 US$ 12 - -Federal Natl Mtg Assn 〃 - - 4,000 US$ 4,169 - - 4,000 US$ 4,180 US$ 4,117 US$ 63 - -Federal Natl Mtg Assn 〃 - - 3,500 US$ 3,809 - - 3,500 US$ 3,801 US$ 3,645 US$ 156 - -Federal Natl Mtg Assn 〃 - - - - 4,000 US$ 4,261 - - - - 4,000 US$ 4,228Federal Natl Mtg Assn 〃 - - 3,750 US$ 4,134 - - 3,750 US$ 4,127 US$ 4,151 US$ (24) - -Federal Natl Mtg Assn Gtd Remi 〃 - - - - 3,062 US$ 3,153 - - - - 2,854 US$ 2,926Federal Natl Mtg Assn Remic 〃 - - - - 3,036 US$ 3,127 - - - - 2,871 US$ 2,953Fnma Pool 257245 〃 - - 3,456 US$ 3,513 - - 3,415 US$ 3,513 US$ 3,437 US$ 76 - -Fnma Pool 691283 〃 - - 2,963 US$ 3,039 - - 2,932 US$ 3,028 US$ 2,920 US$ 108 - -Fnma Pool 852300 〃 - - - - 9,276 US$ 9,843 9,206 US$ 9,773 US$ 9,770 US$ 3 - -Fnma Pool 852347 〃 - - - - 3,761 US$ 3,991 3,721 US$ 3,950 US$ 3,949 US$ 1 - -
(Continued)
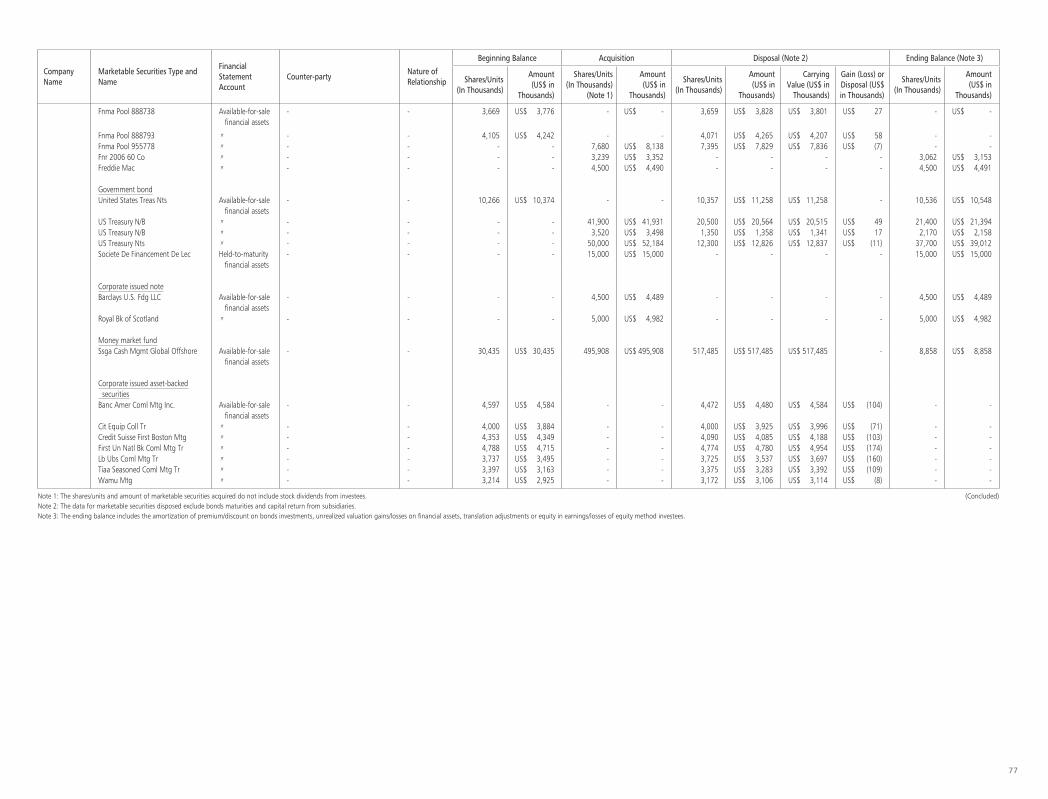
77
Company Name
Marketable Securities Type and Name
Financial Statement Account
Counter-partyNature of Relationship
Beginning Balance Acquisition Disposal (Note 2) Ending Balance (Note 3)
Shares/Units(In Thousands)
Amount(US$ in
Thousands)
Shares/Units(In Thousands)
(Note 1)
Amount(US$ in
Thousands)
Shares/Units(In Thousands)
Amount(US$ in
Thousands)
Carrying Value (US$ in
Thousands)
Gain (Loss) or Disposal (US$ in Thousands)
Shares/Units(In Thousands)
Amount (US$ in
Thousands)
Fnma Pool 888738 Available-for-sale financial assets
- - 3,669 US$ 3,776 - US$ - 3,659 US$ 3,828 US$ 3,801 US$ 27 - US$ -
Fnma Pool 888793 〃 - - 4,105 US$ 4,242 - - 4,071 US$ 4,265 US$ 4,207 US$ 58 - -Fnma Pool 955778 〃 - - - - 7,680 US$ 8,138 7,395 US$ 7,829 US$ 7,836 US$ (7) - -Fnr 2006 60 Co 〃 - - - - 3,239 US$ 3,352 - - - - 3,062 US$ 3,153Freddie Mac 〃 - - - - 4,500 US$ 4,490 - - - - 4,500 US$ 4,491
Government bondUnited States Treas Nts Available-for-sale
financial assets- - 10,266 US$ 10,374 - - 10,357 US$ 11,258 US$ 11,258 - 10,536 US$ 10,548
US Treasury N/B 〃 - - - - 41,900 US$ 41,931 20,500 US$ 20,564 US$ 20,515 US$ 49 21,400 US$ 21,394US Treasury N/B 〃 - - - - 3,520 US$ 3,498 1,350 US$ 1,358 US$ 1,341 US$ 17 2,170 US$ 2,158US Treasury Nts 〃 - - - - 50,000 US$ 52,184 12,300 US$ 12,826 US$ 12,837 US$ (11) 37,700 US$ 39,012Societe De Financement De Lec Held-to-maturity
financial assets- - - - 15,000 US$ 15,000 - - - - 15,000 US$ 15,000
Corporate issued noteBarclays U.S. Fdg LLC Available-for-sale
financial assets- - - - 4,500 US$ 4,489 - - - - 4,500 US$ 4,489
Royal Bk of Scotland 〃 - - - - 5,000 US$ 4,982 - - - - 5,000 US$ 4,982
Money market fundSsga Cash Mgmt Global Offshore Available-for-sale
financial assets- - 30,435 US$ 30,435 495,908 US$ 495,908 517,485 US$ 517,485 US$ 517,485 - 8,858 US$ 8,858
Corporate issued asset-backed securitiesBanc Amer Coml Mtg Inc. Available-for-sale
financial assets- - 4,597 US$ 4,584 - - 4,472 US$ 4,480 US$ 4,584 US$ (104) - -
Cit Equip Coll Tr 〃 - - 4,000 US$ 3,884 - - 4,000 US$ 3,925 US$ 3,996 US$ (71) - -Credit Suisse First Boston Mtg 〃 - - 4,353 US$ 4,349 - - 4,090 US$ 4,085 US$ 4,188 US$ (103) - -First Un Natl Bk Coml Mtg Tr 〃 - - 4,788 US$ 4,715 - - 4,774 US$ 4,780 US$ 4,954 US$ (174) - -Lb Ubs Coml Mtg Tr 〃 - - 3,737 US$ 3,495 - - 3,725 US$ 3,537 US$ 3,697 US$ (160) - -Tiaa Seasoned Coml Mtg Tr 〃 - - 3,397 US$ 3,163 - - 3,375 US$ 3,283 US$ 3,392 US$ (109) - -Wamu Mtg 〃 - - 3,214 US$ 2,925 - - 3,172 US$ 3,106 US$ 3,114 US$ (8) - -
(Concluded)Note 1: The shares/units and amount of marketable securities acquired do not include stock dividends from investees.Note 2: The data for marketable securities disposed exclude bonds maturities and capital return from subsidiaries.Note 3: The ending balance includes the amortization of premium/discount on bonds investments, unrealized valuation gains/losses on financial assets, translation adjustments or equity in earnings/losses of equity method investees.
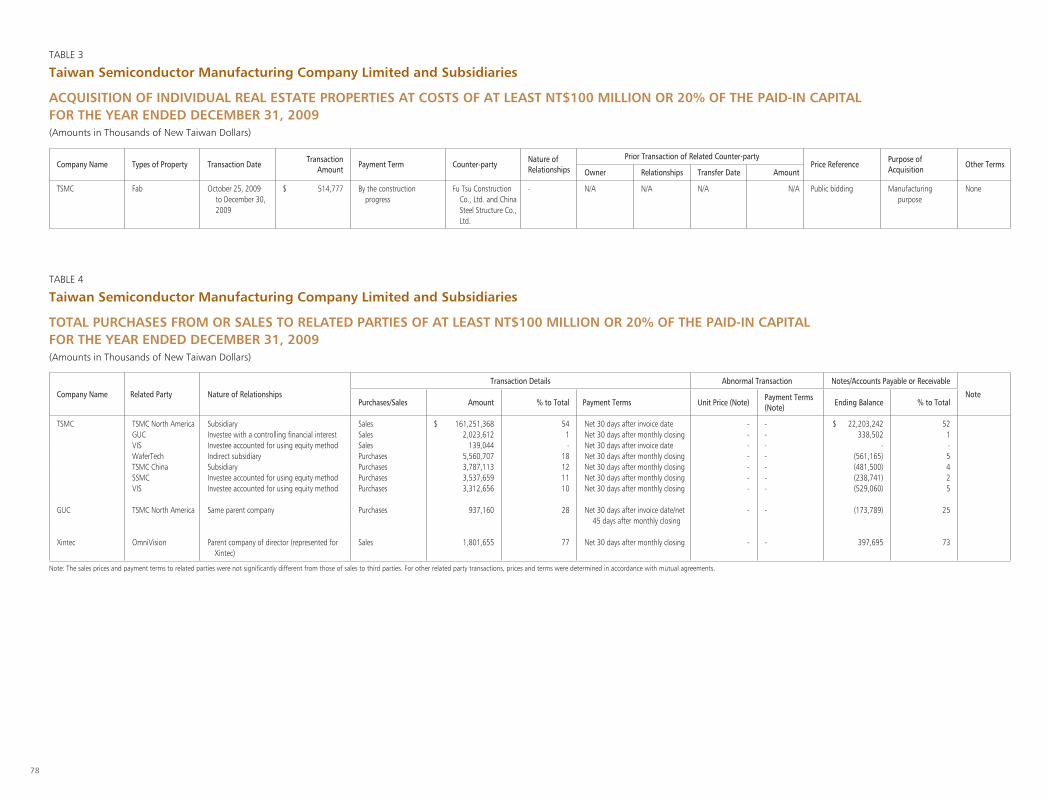
78
TABLE 3
Taiwan Semiconductor Manufacturing Company Limited and Subsidiaries
ACQUISITION OF INDIVIDUAL REAL ESTATE PROPERTIES AT COSTS OF AT LEAST NT$100 MILLION OR 20% OF THE PAID-IN CAPITALFOR THE YEAR ENDED DECEMBER 31, 2009(Amounts in Thousands of New Taiwan Dollars)
Company Name Types of Property Transaction DateTransaction
AmountPayment Term Counter-party
Nature of Relationships
Prior Transaction of Related Counter-partyPrice Reference
Purpose of Acquisition
Other TermsOwner Relationships Transfer Date Amount
TSMC Fab Oc tober 25, 2009 to December 30, 2009
$ 514,777 By the construction progress
Fu Tsu Construction Co., Ltd. and China Steel Structure Co., Ltd.
- N/A N/A N/A N/A Public bidding Ma nufacturing purpose
None
TABLE 4
Taiwan Semiconductor Manufacturing Company Limited and Subsidiaries
TOTAL PURCHASES FROM OR SALES TO RELATED PARTIES OF AT LEAST NT$100 MILLION OR 20% OF THE PAID-IN CAPITALFOR THE YEAR ENDED DECEMBER 31, 2009(Amounts in Thousands of New Taiwan Dollars)
Company Name Related Party Nature of Relationships
Transaction Details Abnormal Transaction Notes/Accounts Payable or Receivable
NotePurchases/Sales Amount % to Total Payment Terms Unit Price (Note)
Payment Terms(Note)
Ending Balance % to Total
TSMC TSMC North America Subsidiary Sales $ 161,251,368 54 Net 30 days after invoice date - - $ 22,203,242 52GUC Investee with a controlling financial interest Sales 2,023,612 1 Net 30 days after monthly closing - - 338,502 1VIS Investee accounted for using equity method Sales 139,044 - Net 30 days after invoice date - - - -WaferTech Indirect subsidiary Purchases 5,560,707 18 Net 30 days after monthly closing - - (561,165) 5TSMC China Subsidiary Purchases 3,787,113 12 Net 30 days after monthly closing - - (481,500) 4SSMC Investee accounted for using equity method Purchases 3,537,659 11 Net 30 days after monthly closing - - (238,741) 2VIS Investee accounted for using equity method Purchases 3,312,656 10 Net 30 days after monthly closing - - (529,060) 5
GUC TSMC North America Same parent company Purchases 937,160 28 Ne t 30 days after invoice date/net 45 days after monthly closing
- - (173,789) 25
Xintec OmniVision Pa rent company of director (represented for Xintec)
Sales 1,801,655 77 Net 30 days after monthly closing - - 397,695 73
Note: The sales prices and payment terms to related parties were not significantly different from those of sales to third parties. For other related party transactions, prices and terms were determined in accordance with mutual agreements.

79
TABLE 5
Taiwan Semiconductor Manufacturing Company Limited and Subsidiaries
RECEIVABLES FROM RELATED PARTIES AMOUNTING TO AT LEAST NT$100 MILLION OR 20% OF THE PAID-IN CAPITAL DECEMBER 31, 2009(Amounts in Thousands of New Taiwan Dollars)
Company Name Related Party Nature of Relationships Ending BalanceTurnover Days
(Note 1)
Overdue Amounts Received in Subsequent Period
Allowance for Bad DebtsAmounts Action Taken
TSMC TSMC North America Subsidiary $ 22,211,918 38 $ 6,438,761 - $ 8,899,170 $ -GUC Investee with a controlling financial interest 338,502 50 - - - -TSMC China Subsidiary 111,103 (Note 2) - - - -
Xintec OmniVision Parent company of director (represented for Xintec) 397,695 81 160 - 127,130 -
Note 1: The calculation of turnover days excludes other receivables from related parties.Note 2: The ending balance primarily consisted of other receivables, which is not applicable for the calculation of turnover days.
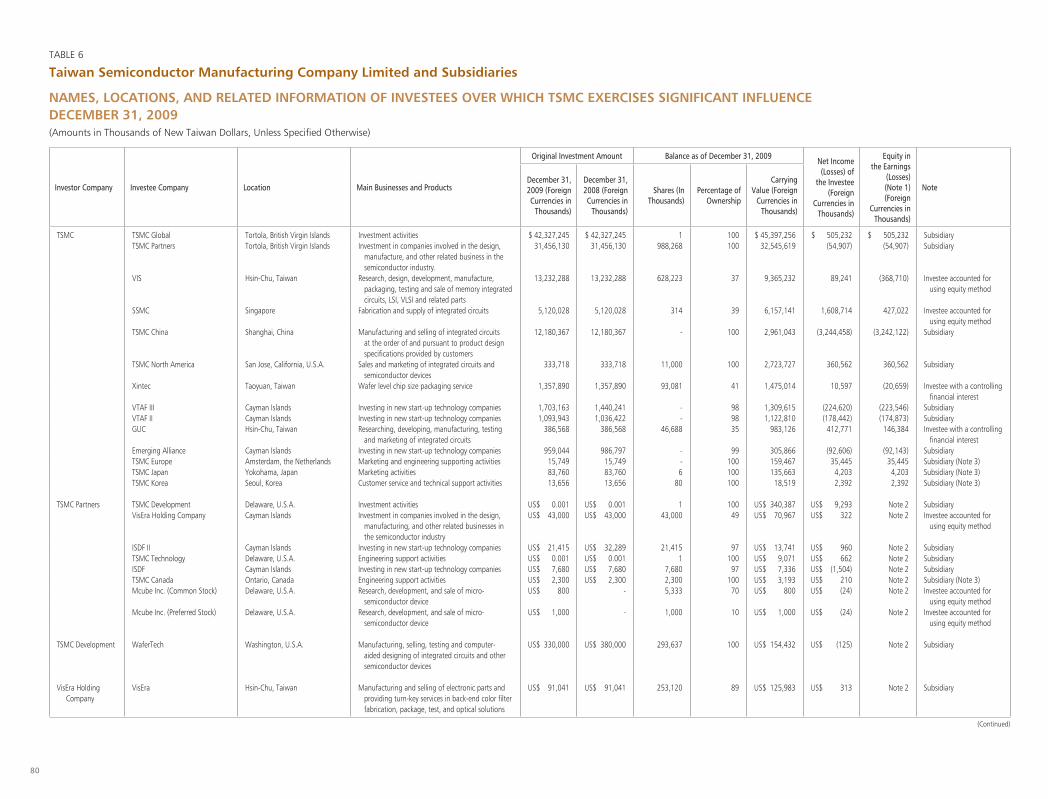
80
TABLE 6
Taiwan Semiconductor Manufacturing Company Limited and Subsidiaries
NAMES, LOCATIONS, AND RELATED INFORMATION OF INVESTEES OVER WHICH TSMC EXERCISES SIGNIFICANT INFLUENCEDECEMBER 31, 2009(Amounts in Thousands of New Taiwan Dollars, Unless Specified Otherwise)
Investor Company Investee Company Location Main Businesses and Products
Original Investment Amount Balance as of December 31, 2009Net Income (Losses) of
the Investee (Foreign
Currencies in Thousands)
Equity in the Earnings
(Losses) (Note 1) (Foreign
Currencies in Thousands)
NoteDecember 31, 2009 (Foreign Currencies in
Thousands)
December 31, 2008 (Foreign Currencies in
Thousands)
Shares (In Thousands)
Percentage of Ownership
Carrying Value (Foreign
Currencies in Thousands)
TSMC TSMC Global Tortola, British Virgin Islands Investment activities $ 42,327,245 $ 42,327,245 1 100 $ 45,397,256 $ 505,232 $ 505,232 SubsidiaryTSMC Partners Tortola, British Virgin Islands Investment in companies involved in the design,
manufacture, and other related business in the semiconductor industry.
31,456,130 31,456,130 988,268 100 32,545,619 (54,907) (54,907) Subsidiary
VIS Hsin-Chu, Taiwan Research, design, development, manufacture, packaging, testing and sale of memory integrated
circuits, LSI, VLSI and related parts
13,232,288 13,232,288 628,223 37 9,365,232 89,241 (368,710) Investee accounted for using equity method
SSMC Singapore Fabrication and supply of integrated circuits 5,120,028 5,120,028 314 39 6,157,141 1,608,714 427,022 Investee accounted for using equity method
TSMC China Shanghai, China Manufacturing and selling of integrated circuits at the order of and pursuant to product design
specifications provided by customers
12,180,367 12,180,367 - 100 2,961,043 (3,244,458) (3,242,122) Subsidiary
TSMC North America San Jose, California, U.S.A. Sales and marketing of integrated circuits and semiconductor devices
333,718 333,718 11,000 100 2,723,727 360,562 360,562 Subsidiary
Xintec Taoyuan, Taiwan Wafer level chip size packaging service 1,357,890 1,357,890 93,081 41 1,475,014 10,597 (20,659) Investee with a controlling financial interest
VTAF III Cayman Islands Investing in new start-up technology companies 1,703,163 1,440,241 - 98 1,309,615 (224,620) (223,546) SubsidiaryVTAF II Cayman Islands Investing in new start-up technology companies 1,093,943 1,036,422 - 98 1,122,810 (178,442) (174,873) SubsidiaryGUC Hsin-Chu, Taiwan Researching, developing, manufacturing, testing
and marketing of integrated circuits386,568 386,568 46,688 35 983,126 412,771 146,384 Investee with a controlling
financial interestEmerging Alliance Cayman Islands Investing in new start-up technology companies 959,044 986,797 - 99 305,866 (92,606) (92,143) SubsidiaryTSMC Europe Amsterdam, the Netherlands Marketing and engineering supporting activities 15,749 15,749 - 100 159,467 35,445 35,445 Subsidiary (Note 3)TSMC Japan Yokohama, Japan Marketing activities 83,760 83,760 6 100 135,663 4,203 4,203 Subsidiary (Note 3)TSMC Korea Seoul, Korea Customer service and technical support activities 13,656 13,656 80 100 18,519 2,392 2,392 Subsidiary (Note 3)
TSMC Partners TSMC Development Delaware, U.S.A. Investment activities US$ 0.001 US$ 0.001 1 100 US$ 340,387 US$ 9,293 Note 2 SubsidiaryVisEra Holding Company Cayman Islands Investment in companies involved in the design,
manufacturing, and other related businesses in the semiconductor industry
US$ 43,000 US$ 43,000 43,000 49 US$ 70,967 US$ 322 Note 2 Investee accounted for using equity method
ISDF II Cayman Islands Investing in new start-up technology companies US$ 21,415 US$ 32,289 21,415 97 US$ 13,741 US$ 960 Note 2 SubsidiaryTSMC Technology Delaware, U.S.A. Engineering support activities US$ 0.001 US$ 0.001 1 100 US$ 9,071 US$ 662 Note 2 SubsidiaryISDF Cayman Islands Investing in new start-up technology companies US$ 7,680 US$ 7,680 7,680 97 US$ 7,336 US$ (1,504) Note 2 SubsidiaryTSMC Canada Ontario, Canada Engineering support activities US$ 2,300 US$ 2,300 2,300 100 US$ 3,193 US$ 210 Note 2 Subsidiary (Note 3)Mcube Inc. (Common Stock) Delaware, U.S.A. Research, development, and sale of micro-
semiconductor deviceUS$ 800 - 5,333 70 US$ 800 US$ (24) Note 2 Investee accounted for
using equity methodMcube Inc. (Preferred Stock) Delaware, U.S.A. Research, development, and sale of micro-
semiconductor deviceUS$ 1,000 - 1,000 10 US$ 1,000 US$ (24) Note 2 Investee accounted for
using equity method
TSMC Development WaferTech Washington, U.S.A. Manufacturing, selling, testing and computer- aided designing of integrated circuits and other
semiconductor devices
US$ 330,000 US$ 380,000 293,637 100 US$ 154,432 US$ (125) Note 2 Subsidiary
VisEra Holding Company
VisEra Hsin-Chu, Taiwan Manufacturing and selling of electronic parts and providing turn-key services in back-end color filter
fabrication, package, test, and optical solutions
US$ 91,041 US$ 91,041 253,120 89 US$ 125,983 US$ 313 Note 2 Subsidiary
(Continued)

81
Investor Company Investee Company Location Main Businesses and Products
Original Investment Amount Balance as of December 31, 2009Net Income (Losses) of
the Investee (Foreign
Currencies in Thousands)
Equity in the Earnings
(Losses) (Note 1) (Foreign
Currencies in Thousands)
NoteDecember 31, 2009 (Foreign Currencies in
Thousands)
December 31, 2008 (Foreign Currencies in
Thousands)
Shares (In Thousands)
Percentage of Ownership
Carrying Value (Foreign
Currencies in Thousands)
VTAF III Mutual-Pak Technology Co., Ltd. Taipei, Taiwan Manufacturing and selling of electronic parts and researching, developing, and testing of RFID
US$ 3,088 US$ 1,705 9,180 59 US$ 2,112 US$ (1,105) Note 2 Subsidiary
Aiconn Technology Corp. Taipei, Taiwan Wholesaling telecommunication equipments, and manufacturing wired and wireless communication
equipments
US$ 1,777 US$ 1,777 4,500 42 US$ 566 US$ (1,239) Note 2 Investee accounted for using equity method
Growth Fund Cayman Islands Investing in new start-up technology companies US$ 1,550 US$ 700 - 100 US$ 823 US$ (127) Note 2 Subsidiary (Note 3)VTA Holdings Delaware, U.S.A. Investing in new start-up technology companies - - - 62 - - Note 2 Subsidiary (Note 3)
VTAF II VTA Holdings Delaware, U.S.A. Investing in new start-up technology companies - - - 31 - - Note 2 Subsidiary (Note 3)
GUC GUC-NA U.S.A. Consulting services in main products US$ 800 US$ 800 800 100 $ 38,617 $ 5,617 Note 2 Subsidiary GUC-Japan Japan Consulting services in main products JPY 30,000 JPY 30,000 1 100 12,899 1,608 Note 2 Subsidiary (Note 3)GUC-Europe The Netherlands Consulting services in main products EUR 100 EUR 50 - 100 5,213 353 Note 2 Subsidiary (Note 3)GUC-BVI British Virgin Islands Investment activities US$ 550 - 550 100 17,466 (133) Note 2 Subsidiary (Note 3)
Emerging Alliance VTA Holdings Delaware, U.S.A. Investing in new start-up technology companies - - - 7 - - Note 2 Subsidiary (Note 3)
Note 1: Equity in earnings/losses of investees include the effect of unrealized gross profit from affiliates.Note 2: The equity in the earnings/losses of the investee company is not reflected herein as such amount is already included in the equity in the earnings/losses of the investor company.Note 3: Equity in earnings/losses was determined based on the unaudited financial statements.
(Concluded)

82
TABLE 7
Taiwan Semiconductor Manufacturing Company Limited and Subsidiaries
INFORMATION OF INVESTMENT IN MAINLAND CHINAFOR THE YEAR ENDED DECEMBER 31, 2009(Amounts in Thousands of New Taiwan Dollars, Unless Specified Otherwise)
Equity in the Earnings (Losses)(Note 2)
Carrying Value as of December 31, 2009
Accumulated Inward Remittance of Earnings as of
December 31, 2009
Accumulated Investment in Mainland China as of December 31, 2009 (US$ in Thousand)
Investment Amounts Authorized byInvestment Commission, MOEA (US$ in Thousand)
Upper Limit on Investment (US$ in Thousand)
$ (3,242,122) $ 2,961,043 $ - $ 12,180,367(US$ 371,000)
$ 12,180,367(US$ 371,000)
$ 12,180,367(US$ 371,000)
Investee Company Main Businesses and ProductsTotal Amount of Paid-in Capital
(RMB in Thousand)Method of Investment
Accumulated Outflow of Investment from Taiwan
as of January 1, 2009(US$ in Thousand)
Investment Flows Accumulated Outflow of Investment from Taiwan
as of December 31, 2009 (US$ in Thousand)
Percentage of OwnershipOutflow Inflow
TSMC China Ma nufacturing and selling of integrated circuits at the order of and pursuant to product design specifications provided by customers
$ 12,180,367(RMB 3,070,623)
(Note 1) $ 12,180,367(US$ 371,000)
$ - $ - $ 12,180,367(US$ 371,000)
100%
Note 1: Direct investments US$371,000 thousand in TSMC China.Note 2: Amount was recognized based on the audited financial statements.
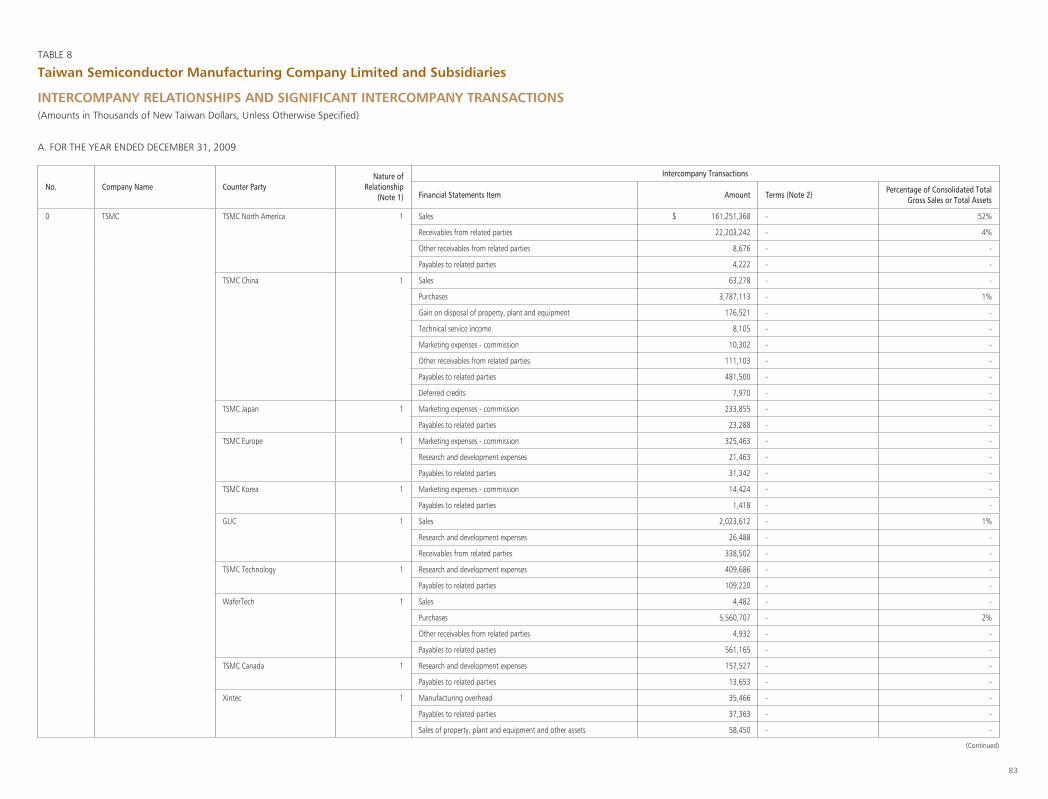
83
No. Company Name Counter PartyNature of
Relationship(Note 1)
Intercompany Transactions
Financial Statements Item Amount Terms (Note 2)Percentage of Consolidated Total
Gross Sales or Total Assets
0 TSMC TSMC North America 1 Sales $ 161,251,368 - 52%
Receivables from related parties 22,203,242 - 4%
Other receivables from related parties 8,676 - -
Payables to related parties 4,222 - -
TSMC China 1 Sales 63,278 - -
Purchases 3,787,113 - 1%
Gain on disposal of property, plant and equipment 176,521 - -
Technical service income 8,105 - -
Marketing expenses - commission 10,302 - -
Other receivables from related parties 111,103 - -
Payables to related parties 481,500 - -
Deferred credits 7,970 - -
TSMC Japan 1 Marketing expenses - commission 233,855 - -
Payables to related parties 23,288 - -
TSMC Europe 1 Marketing expenses - commission 325,463 - -
Research and development expenses 21,463 - -
Payables to related parties 31,342 - -
TSMC Korea 1 Marketing expenses - commission 14,424 - -
Payables to related parties 1,418 - -
GUC 1 Sales 2,023,612 - 1%
Research and development expenses 26,488 - -
Receivables from related parties 338,502 - -
TSMC Technology 1 Research and development expenses 409,686 - -
Payables to related parties 109,220 - -
WaferTech 1 Sales 4,482 - -
Purchases 5,560,707 - 2%
Other receivables from related parties 4,932 - -
Payables to related parties 561,165 - -
TSMC Canada 1 Research and development expenses 157,527 - -
Payables to related parties 13,653 - -
Xintec 1 Manufacturing overhead 35,466 - -
Payables to related parties 37,363 - -
Sales of property, plant and equipment and other assets 58,450 - -
TABLE 8
Taiwan Semiconductor Manufacturing Company Limited and Subsidiaries
INTERCOMPANY RELATIONSHIPS AND SIGNIFICANT INTERCOMPANY TRANSACTIONS(Amounts in Thousands of New Taiwan Dollars, Unless Otherwise Specified)
A. FOR THE YEAR ENDED DECEMBER 31, 2009
(Continued)
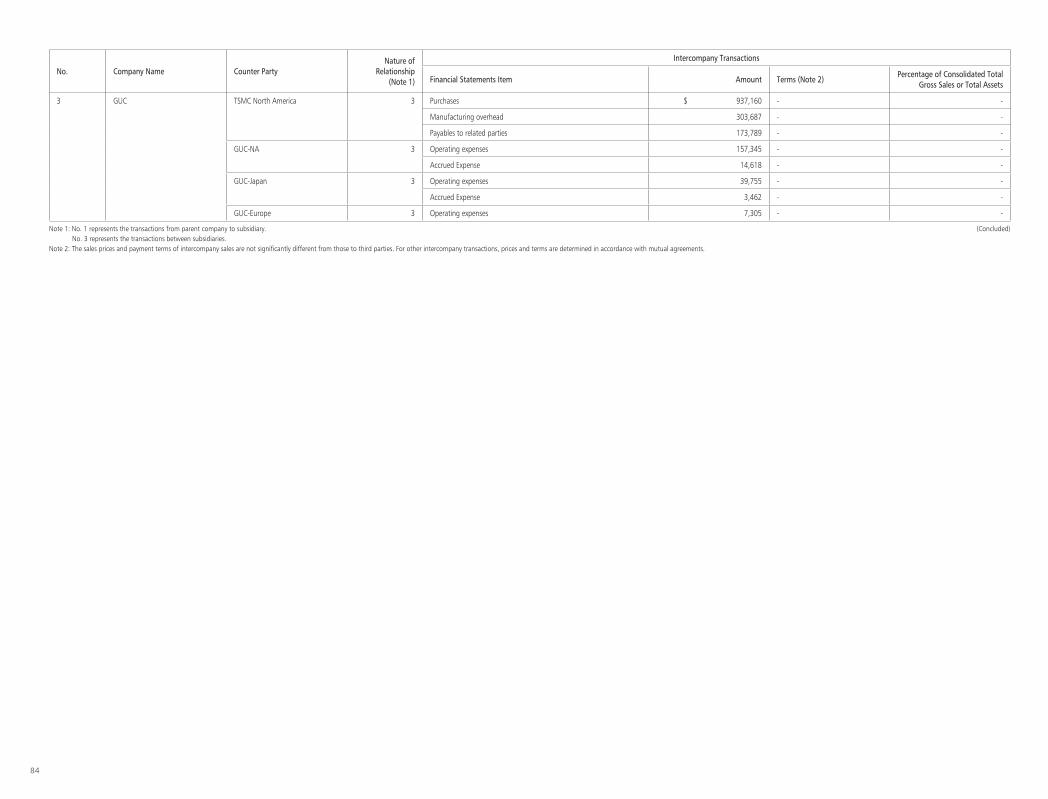
84
No. Company Name Counter PartyNature of
Relationship(Note 1)
Intercompany Transactions
Financial Statements Item Amount Terms (Note 2)Percentage of Consolidated Total
Gross Sales or Total Assets
3 GUC TSMC North America 3 Purchases $ 937,160 - -
Manufacturing overhead 303,687 - -
Payables to related parties 173,789 - -
GUC-NA 3 Operating expenses 157,345 - -
Accrued Expense 14,618 - -
GUC-Japan 3 Operating expenses 39,755 - -
Accrued Expense 3,462 - -
GUC-Europe 3 Operating expenses 7,305 - -
Note 1: No. 1 represents the transactions from parent company to subsidiary. No. 3 represents the transactions between subsidiaries.Note 2: The sales prices and payment terms of intercompany sales are not significantly different from those to third parties. For other intercompany transactions, prices and terms are determined in accordance with mutual agreements.
(Concluded)
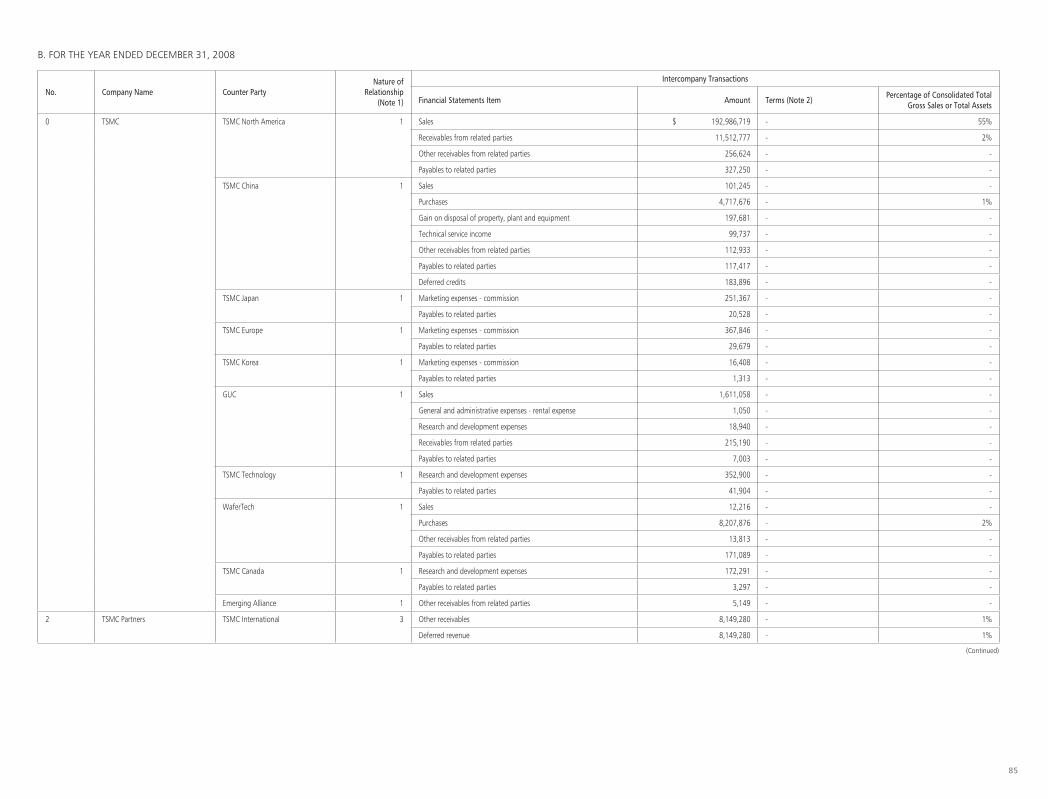
85
No. Company Name Counter PartyNature of
Relationship(Note 1)
Intercompany Transactions
Financial Statements Item Amount Terms (Note 2)Percentage of Consolidated Total
Gross Sales or Total Assets
0 TSMC TSMC North America 1 Sales $ 192,986,719 - 55%
Receivables from related parties 11,512,777 - 2%
Other receivables from related parties 256,624 - -
Payables to related parties 327,250 - -
TSMC China 1 Sales 101,245 - -
Purchases 4,717,676 - 1%
Gain on disposal of property, plant and equipment 197,681 - -
Technical service income 99,737 - -
Other receivables from related parties 112,933 - -
Payables to related parties 117,417 - -
Deferred credits 183,896 - -
TSMC Japan 1 Marketing expenses - commission 251,367 - -
Payables to related parties 20,528 - -
TSMC Europe 1 Marketing expenses - commission 367,846 - -
Payables to related parties 29,679 - -
TSMC Korea 1 Marketing expenses - commission 16,408 - -
Payables to related parties 1,313 - -
GUC 1 Sales 1,611,058 - -
General and administrative expenses - rental expense 1,050 - -
Research and development expenses 18,940 - -
Receivables from related parties 215,190 - -
Payables to related parties 7,003 - -
TSMC Technology 1 Research and development expenses 352,900 - -
Payables to related parties 41,904 - -
WaferTech 1 Sales 12,216 - -
Purchases 8,207,876 - 2%
Other receivables from related parties 13,813 - -
Payables to related parties 171,089 - -
TSMC Canada 1 Research and development expenses 172,291 - -
Payables to related parties 3,297 - -
Emerging Alliance 1 Other receivables from related parties 5,149 - -
2 TSMC Partners TSMC International 3 Other receivables 8,149,280 - 1%
Deferred revenue 8,149,280 - 1%
B. FOR THE YEAR ENDED DECEMBER 31, 2008
(Continued)

86
No. Company Name Counter PartyNature of
Relationship(Note 1)
Intercompany Transactions
Financial Statements Item Amount Terms (Note 2)Percentage of Consolidated Total
Gross Sales or Total Assets
3 GUC TSMC North America 3 Purchases $ 1,747,488 - 1%
Manufacturing overhead 298,926 - -
Operating Expense 1,458 - -
Payables to related parties 148,680 - -
GUC-NA 3 Operating expenses 105,044 - -
Payables to related parties 11,074 - -
GUC-Japan 3 Operating expenses 28,480 - -
Payables to related parties 2,260 - -
GUC-Europe 3 Operating expenses 5,140 - -
Note 1: No. 1 represents the transactions from parent company to subsidiary. No. 3 represents the transactions between subsidiaries.Note 2: The sales prices and payment terms of intercompany sales are not significantly different from those to third parties. For other intercompany transactions, prices and terms are determined in accordance with mutual agreements.
(Concluded)
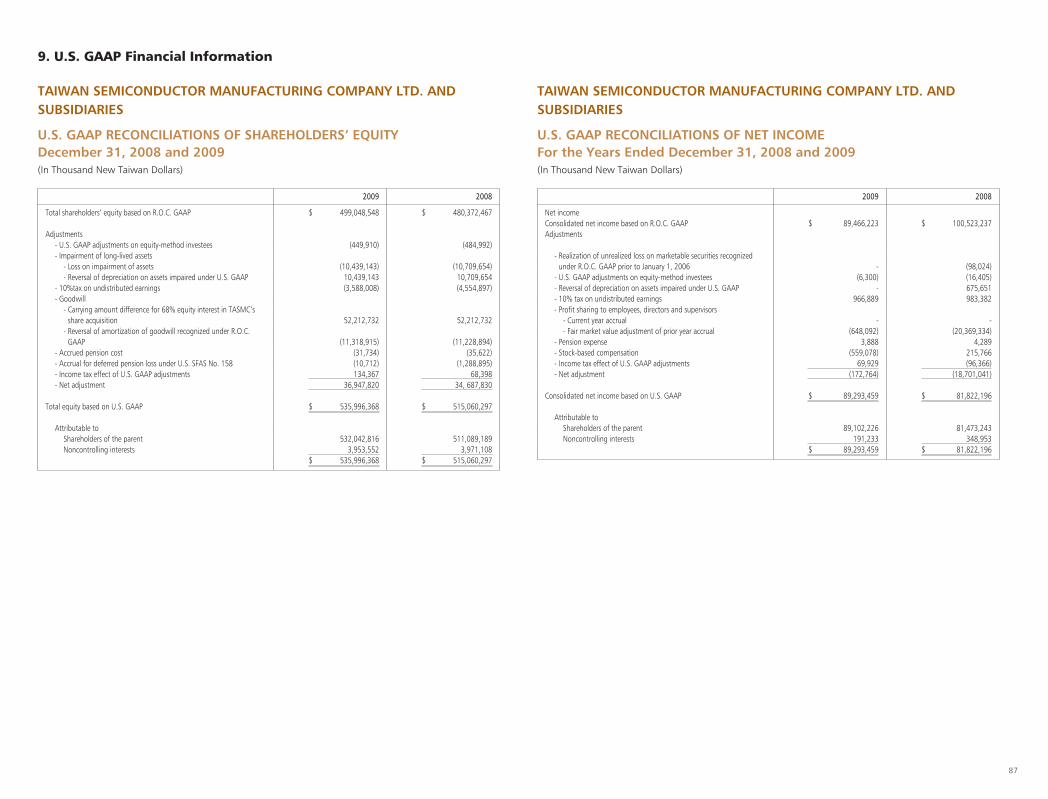
87
2009 2008
Net incomeConsolidated net income based on R.O.C. GAAP $ 89,466,223 $ 100,523,237Adjustments
- Realization of unrealized loss on marketable securities recognized under R.O.C. GAAP prior to January 1, 2006 - (98,024)
- U.S. GAAP adjustments on equity-method investees (6,300) (16,405)- Reversal of depreciation on assets impaired under U.S. GAAP - 675,651- 10% tax on undistributed earnings 966,889 983,382- Profit sharing to employees, directors and supervisors
- Current year accrual - -- Fair market value adjustment of prior year accrual (648,092) (20,369,334)
- Pension expense 3,888 4,289- Stock-based compensation (559,078) 215,766- Income tax effect of U.S. GAAP adjustments 69,929 (96,366)- Net adjustment (172,764) (18,701,041)
Consolidated net income based on U.S. GAAP $ 89,293,459 $ 81,822,196
Attributable toShareholders of the parent 89,102,226 81,473,243Noncontrolling interests 191,233 348,953
$ 89,293,459 $ 81,822,196
9. U.S. GAAP Financial Information
TAIWAN SEMICONDUCTOR MANUFACTURING COMPANY LTD. AND SUBSIDIARIES
U.S. GAAP RECONCILIATIONS OF SHAREHOLDERS’ EQUITYDecember 31, 2008 and 2009(In Thousand New Taiwan Dollars)
2009 2008
Total shareholders’ equity based on R.O.C. GAAP $ 499,048,548 $ 480,372,467
Adjustments- U.S. GAAP adjustments on equity-method investees (449,910) (484,992)- Impairment of long-lived assets
- Loss on impairment of assets (10,439,143) (10,709,654)- Reversal of depreciation on assets impaired under U.S. GAAP 10,439,143 10,709,654
- 10%tax on undistributed earnings (3,588,008) (4,554,897)- Goodwill
- Carrying amount difference for 68% equity interest in TASMC’s share acquisition 52,212,732 52,212,732
- Reversal of amortization of goodwill recognized under R.O.C. GAAP (11,318,915) (11,228,894)
- Accrued pension cost (31,734) (35,622)- Accrual for deferred pension loss under U.S. SFAS No. 158 (10,712) (1,288,895)- Income tax effect of U.S. GAAP adjustments 134,367 68,398- Net adjustment 36,947,820 34, 687,830
Total equity based on U.S. GAAP $ 535,996,368 $ 515,060,297
Attributable toShareholders of the parent 532,042,816 511,089,189Noncontrolling interests 3,953,552 3,971,108
$ 535,996,368 $ 515,060,297
TAIWAN SEMICONDUCTOR MANUFACTURING COMPANY LTD. AND SUBSIDIARIES
U.S. GAAP RECONCILIATIONS OF NET INCOMEFor the Years Ended December 31, 2008 and 2009(In Thousand New Taiwan Dollars)

Corporate Headquarters & Fab 128, Li-Hsin Rd. 6, Hsinchu Science Park, Hsinchu, Taiwan 300-78, R.O.C.Tel: 886-3-5636688 Fax: 886-3-5637000
Fab 2, Fab 5121, Park Ave. 3, Hsinchu Science Park, Hsinchu, Taiwan 300-77, R.O.C.Tel: 886-3-5636688 Fax: 886-3-5781546
Fab 39, Creation Rd. 1, Hsinchu Science Park, Hsinchu, Taiwan 300-77, R.O.C.Tel: 886-3-5636688 Fax: 886-3-5781548
Fab 61, Nan-Ke North Rd., Tainan Science Park, Tainan, Taiwan 741-44, R.O.C.Tel: 886-6-5056688 Fax: 886-6-5052057
Fab 825, Li-Hsin Rd., Hsinchu Science Park, Hsinchu, Taiwan 300-78, R.O.C.Tel: 886-3-5636688 Fax: 886-3-5662051
Fab 141-1, Nan-Ke North Rd., Tainan Science Park, Tainan, Taiwan 741-44, R.O.C.Tel: 886-6-5056688 Fax: 886-6-5051262
TSMC North America2585 Junction Avenue, San Jose, CA 95134, U.S.A.Tel: 408-3828000 Fax: 408-3828008
TSMC Europe B.V.World Trade Center, Zuidplein 60, 1077 XV Amsterdam, The NetherlandsTel: 31-20-3059900 Fax: 31-20-3059911
TSMC Japan Limited21F, Queen’s Tower C, 2-3-5, Minatomirai, Nishi-ku, Yokohama Kanagawa, 220-6221, JapanTel: 81-45-6820670 Fax: 81-45-6820673
TSMC China Company Limited4000, Wen Xiang Road, Songjiang, Shanghai, ChinaPostcode: 201616Tel: 86-21-57768000 Fax: 86-21-57762525
TSMC Korea Limited15F, AnnJay Tower, 718-2, Yeoksam-dong, Gangnam-gu Seoul 135-080, KoreaTel: 82-2-20511688 Fax: 82-2-20511669
TSMC Liaison Office in India1st Floor, Pine Valley, Embassy Golf-Links Business Park Bangalore-560071, IndiaTel: 91-80-41768615 Fax: 91-80-41764568
TSMC Design Technology Canada Inc.349 Terry Fox Drive, Kanata, ON K2K 2V6, CanadaTel: 1-613-5667067 Fax: 1-613-2713643
TSMC SpokespersonName: Lora HoTitle: Vice President & CFOTel: 886-3-5664602 Fax: 886-3-5670121Email: [email protected]
Deputy SpokespersonName: J.H. TzengTitle: Deputy Director, Public RelationsTel: 886-3-5055028 Fax: 886-3-5670121Email: [email protected]
TSMC Investor RelationsName: Elizabeth SunTitle: Director, Investor RelationsTel: 886-3-5682085 Fax: 886-3-5797337Email: [email protected]
AuditorsCompany: Deloitte & ToucheAuditors: Hung-Peng Lin, Shu-Chieh HuangAddress: 12F, 156, Sec. 3, Min-Sheng E. Rd., Taipei, Taiwan 105-96, R.O.C.Tel: 886-2-25459988 Fax: 886-2-25459966Website: http://www.deloitte.com.tw
Common Share Transfer Agent and RegistrarCompany: The Transfer Agency Department of Chinatrust Commercial BankAddress: 5F, 83, Sec. 1, Chung-Ching S. Rd., Taipei, Taiwan 100-08, R.O.C.Tel: 886-2-21811911 Fax: 886-2-23116723Website: http://www.chinatrust.com.tw
ADR Depositary BankCompany: Citibank, N.A.Depositary Receipts ServicesAddress: 388 Greenwich Street, New York, NY 10013, U.S.A.Website: http://www.citigroup.com/adrTel: 1-877-2484237 (toll free)Tel: 1-781-5754555 (out of US)Fax: 1-201-3243284E-mail: [email protected]’s depositary receipts of the common shares are listed on New York Stock Exchange (NYSE) under the symbol TSM. The information relating to TSM is available at http://www.nyse.com and http://newmops.tse.com.tw
C O N T A C T I N F O R M A T I O N
Copyright © 2010 by Taiwan Semiconductor Manufacturing Company, Ltd. All rights reserved.