The Economics of Quality: The Implementation and …/media/Files/Reports/... · The goal of this...
36
Prepared for Midwest Research Institute, National Renewable Energy Laboratory 1617 Cole Boulevard Golden, CO 80401-3393 Prepared by Home Innovation Research Labs formerly the NAHB Research Center 400 Prince George’s Blvd. Upper Marlboro, MD 20774 The Economics of Quality: The Implementation and Economic Impact of Quality Management in the Homebuilding Industry JUNE 2010 Updated July 2013
Transcript of The Economics of Quality: The Implementation and …/media/Files/Reports/... · The goal of this...

Prepared for
Midwest Research Institute, National Renewable Energy Laboratory 1617 Cole Boulevard Golden, CO 80401-3393
Prepared by
Home Innovation Research Labs
formerly the NAHB Research Center
400 Prince George’s Blvd.
Upper Marlboro, MD 20774
The Economics of Quality: The Implementation and Economic Impact
of Quality Management in the Homebuilding Industry
JUNE 2010
Updated July 2013

Disclaimer
Neither Home Innovation Research Labs, Inc. (formerly the NAHB
Research Center, Inc.), nor any person acting on its behalf, makes any
warranty, express or implied, with respect to the use of any
information, apparatus, method, or process disclosed in this publication
or that such use may not infringe privately owned rights, or assumes
any liabilities with respect to the use of, or for damages resulting from
the use of, any information, apparatus, method or process disclosed in
this publication, or is responsible for statements made or opinions
expressed by individual authors.

Home Innovation Research Labs July 2013 The Economics of Quality Page i
Contents Introduction – What is the Cost of Quality? ................................................................................................. 1
The Economics & Value Impact of Quality .................................................................................................... 1
The Impact of Quality................................................................................................................................ 4
Customer Satisfaction Starts from Within ................................................................................................ 5
The Impact of the Malcolm Baldrige National Quality Award Criteria ..................................................... 6
Quality in the Construction Industry ............................................................................................................. 9
The Impact of Quality for Home Building Companies ................................................................................ 10
Business Results of Implementing Quality Management ................................................................... 13
The Impact of High Performing Homes....................................................................................................... 15
Suggested Quality Management Tools and Techniques for Home Builders .............................................. 16
Strategic Models ..................................................................................................................................... 17
Tactical Standards ................................................................................................................................... 19
Operational ............................................................................................................................................. 20
Suggested Cost of Quality Metrics for Home Builders................................................................................ 20
Quality performance metrics .................................................................................................................. 20
Schedule .............................................................................................................................................. 20
Energy Performance ........................................................................................................................... 21
Costs .................................................................................................................................................... 21
Training ............................................................................................................................................... 22
Satisfaction – Customer, Employee, Trade, Etc. ................................................................................. 22
Referral................................................................................................................................................ 23
Productivity ......................................................................................................................................... 23
Warranty/Defects ............................................................................................................................... 23
Challenges: Cost .................................................................................................................................. 24
Challenges: Customer Satisfaction ...................................................................................................... 24
Challenges: Defects ............................................................................................................................. 24
Challenges: Other issues ..................................................................................................................... 24
Conclusion ................................................................................................................................................... 25
References .................................................................................................................................................. 26


Home Innovation Research Labs July 2013 The Economics of Quality Page 1
Introduction – What is the Cost of Quality? With high-performance homes, energy performance and cost
savings are quantifiable. Energy performance in the Building America
program is estimated in the design phase using energy simulations
and verified through testing and monitoring. In addition the
economic cost benefits of energy efficiency for both the builder and
ultimately the homeowner are also quantifiable. One Building
America goal is that for each high performance home the amortized
costs of energy efficiency upgrades is less than that of the monthly
utility bill savings. The result is a home that is more energy efficient
and is cost effective for a homeowner to buy and operate.
To ensure that the homes are built as designed to achieve optimal
energy savings, a builder’s quality control and assurance processes
are necessary. There are economic costs to a builder for quality
management including the costs for prevention, appraisal, and the
cost of failure that can directly affect the economics of energy
efficiency upgrades in a high performance home. An effective quality
management system should create efficiencies and related savings
that are greater than the investments in the quality activities
required to achieve the savings. However, the costs of quality are
difficult to measure due to the fact that the performance metrics
have not been fully defined and are often not effectively utilized by
builders.
The goal of this paper is to detail the value of quality management in
general as well as specifically to new home construction and high-
performance homes. Therefore, the paper outlines the economics of quality including the cost of quality
which breaks down the impact of quality into its component parts, its value, its impact in the
construction industry, and its value for high performance homebuilders. In addition, it lays out
recommended tools and techniques for the introduction of quality management and the monitoring of
its impact based on metrics. Those builders using these tools and techniques have seen dramatic
improvements in energy and quality performance, profitability, and customer satisfaction.
The Economics & Value Impact of Quality The economics of quality include the fact that there are costs to prevention, appraisal, as well as costs of
failure. Ultimately the goal is to be able to track the costs and benefits of each to determine the most
cost effective solution. The cost of quality (COQ) relates to the costs of Prevention, Appraisal, and
Failure (PAF). The COQ can be further broken down into the cost of good quality (conformance) and
poor quality (non-conformance) as shown below (Cokins, 2006).
COST OF QUALITY
DEFINITIONS
Prevention: Cost of all
activities specifically designed
to prevent poor quality in
products and services.
Appraisal: Costs associated
with measuring evaluating or
auditing products or services
to assure conformance.
Internal Failure: Costs
resulting from products or
services not conforming to
requirements or customer
user needs, which occur prior
to delivery or shipment to the
customer.
External Failure: Costs
resulting from products or
services not conforming to
requirements or customer /
user needs which occur.

July 2013 Home Innovation Research Labs Page 2 The Economics of Quality
Cost of Conformance (good quality) = Prevention Costs + Appraisal Costs Cost of Non-Conformance (poor quality) = Internal Failure Costs + External Failure Costs
In other words, the cost to achieve high quality consists of the cost to prevent errors plus the cost to
monitor or appraise performance to detect errors. The cost of poor quality (non-conformance), on the
other hand, is equal to the cost of correcting failures before delivery to the customer (Internal Failure)
and the cost of failures after delivery to the customer (External Failures).
Figure 1 shows how the cost of poor quality or chronic waste can be reduced by focusing on the three
fundamentals of quality, planning, control and improvement.
Figure 1. The Juran Trilogy
Examining the PAF (Prevention, Appraisal and Failure) model graphically, (Figure 2) total quality costs
are the sum of prevention, appraisal, and failure costs. The cost of failure decreases as the cost of
prevention and appraisal rises with increasing quality, there is typically a minimum point along the total
cost curve. This point represents the ideal investment in prevention and appraisal that will present the
least total quality cost. Below that investment in prevention and appraisal, failure costs—and, hence the
total cost of quality—will be high. By contrast, investing too many resources in prevention and appraisal
will reduce failure rates, but at an excessive cost. When embarking on a quality management program,
companies which wish to minimize the total COQ invest the optimal amount in prevention and appraisal
that provides the maximum return on investment with respect to failure costs.
The goals of a quality program include reducing the overall COQ and to invert its components such that
the majority of costs are spent on preventing and catching defects rather than correcting failures. But
obviously the aim is to then also reduce the cost of prevention and appraisal also. Figure 3 depicts the

Home Innovation Research Labs July 2013 The Economics of Quality Page 3
hypothetical COQ, including its component costs, for a corporation before and after quality program
implementation.
Understanding the cost of quality and its potential impact are two of the most fundamental aspects of
quality management.
Figure 2. The classical COQ model
Figure 3. Hypothetical cost of quality (Cokins, 2006)
PC=prevention cost; AC=appraisal cost; IFC=internal failure cost; EFC=external failure cost

July 2013 Home Innovation Research Labs Page 4 The Economics of Quality
The Impact of Quality Beyond the costs of quality, there it the impact of quality on revenue and reducing the total cost of
quality (TCOQ) by increasing preventative costs and decreasing failure costs. There is ample evidence of
the strategic importance of quality management and the positive impact it has on businesses due to its
systems approach, focus on the customer and links to strategic planning and competitive advantage
(e.g., Cokins, 2006, Harrington, et al, 1999, Easton and Jarrell, 1998, Cable and Healy, 1996).
One study (Samson and Terziovski, 1999) examined quality management practices and operational
performance at 1,200 Australian and New Zealand manufacturing companies. Researchers identified a
statistically significant relationship between quality management practices and operational performance
with the strongest predictors of performance being leadership, personnel management, and customer
focus. These factors and their correlation to rates of return are supported in numerous other studies.
For example, Evans and Jack (2003) found that improving quality management practices had a positive
correlation with financial performance. A 1998 study of 307 companies in U.S. also found that quality
driven strategies improved financial performance. In other words, investing in quality management
techniques leads to increased profitability (Handfield, Ghosh and Fawcett, 1998). A study of Swedish
national quality award recipients found a significantly higher return on assets than their competitors and
a comparable group (Eriksson and Hansson, 2003).
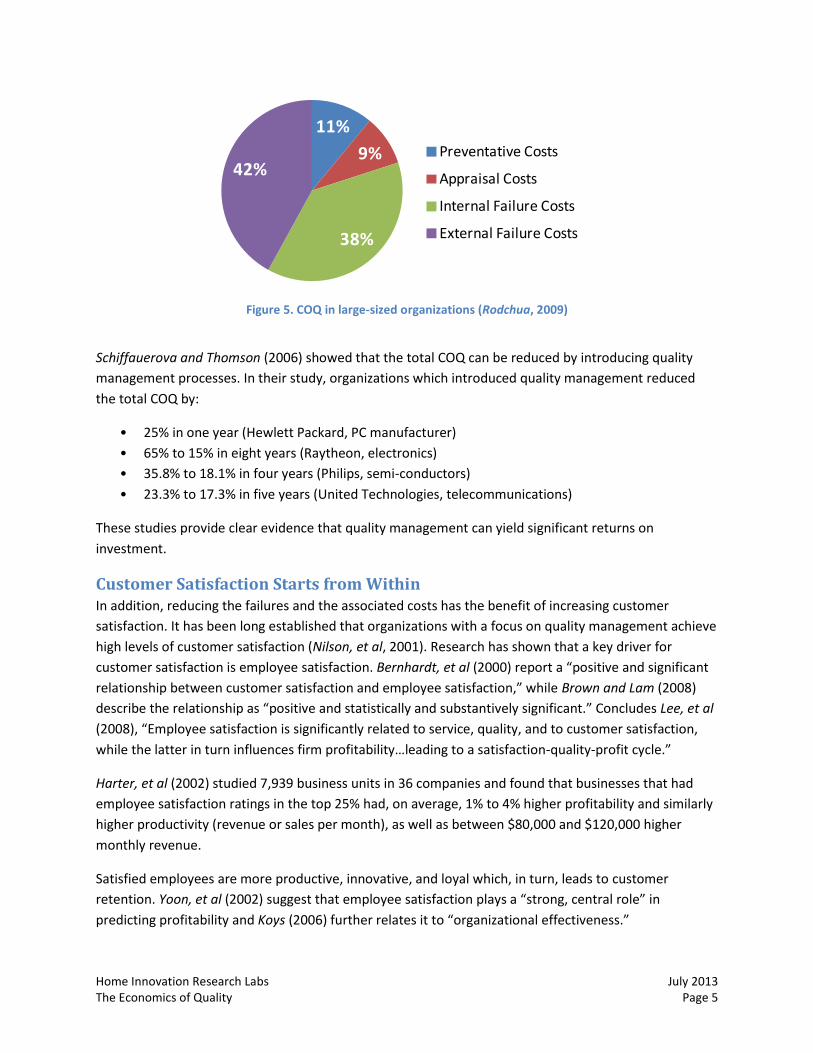
In a study of 63 manufacturing organizations (Rodchua, 2009), the total cost of quality was shown by to
be between 8% and 10% of expenses or between 2.6% and 4% of sales revenue. Failure costs among the
organizations studied represented between 70% and 80% of the total cost of quality (Figures 4 and 5).
Figure 4. COQ in small to medium-sized organizations (Rodchua, 2009)
10%
17%
47%
26% Preventative Costs
Appraisal Costs
Internal Failure Costs
External Failure Costs
Home Innovation Research Labs July 2013 The Economics of Quality Page 5
Figure 5. COQ in large-sized organizations (Rodchua, 2009)
Schiffauerova and Thomson (2006) showed that the total COQ can be reduced by introducing quality
management processes. In their study, organizations which introduced quality management reduced
the total COQ by:
• 25% in one year (Hewlett Packard, PC manufacturer)
• 65% to 15% in eight years (Raytheon, electronics)
• 35.8% to 18.1% in four years (Philips, semi-conductors)
• 23.3% to 17.3% in five years (United Technologies, telecommunications)
These studies provide clear evidence that quality management can yield significant returns on
investment.
Customer Satisfaction Starts from Within In addition, reducing the failures and the associated costs has the benefit of increasing customer
satisfaction. It has been long established that organizations with a focus on quality management achieve
high levels of customer satisfaction (Nilson, et al, 2001). Research has shown that a key driver for
customer satisfaction is employee satisfaction. Bernhardt, et al (2000) report a “positive and significant
relationship between customer satisfaction and employee satisfaction,” while Brown and Lam (2008)
describe the relationship as “positive and statistically and substantively significant.” Concludes Lee, et al
(2008), “Employee satisfaction is significantly related to service, quality, and to customer satisfaction,
while the latter in turn influences firm profitability…leading to a satisfaction-quality-profit cycle.”
Harter, et al (2002) studied 7,939 business units in 36 companies and found that businesses that had
employee satisfaction ratings in the top 25% had, on average, 1% to 4% higher profitability and similarly
higher productivity (revenue or sales per month), as well as between $80,000 and $120,000 higher
monthly revenue.
Satisfied employees are more productive, innovative, and loyal which, in turn, leads to customer
retention. Yoon, et al (2002) suggest that employee satisfaction plays a “strong, central role” in
predicting profitability and Koys (2006) further relates it to “organizational effectiveness.”
11%
9%
38%
42%Preventative Costs
Appraisal Costs
Internal Failure Costs
External Failure Costs

July 2013 Home Innovation Research Labs Page 6 The Economics of Quality
So what are the elements that drive employee satisfaction? In a study of over 5,000 employees across
90 companies, Cozzani and Oakley (2005) are the three key elements leading to employee satisfaction.
1. organizational communication;
2. employee engagement, and
3. organizational culture.
To effectively connect employee and customer satisfaction, the Corporate Leadership Council advises
that “companies must build their own models because customer satisfaction is only one variable in
understanding the relationship between employee satisfaction, customer satisfaction and financial
performance. Moreover, each company must determine how it defines employee satisfaction and
customer satisfaction, which can even differ between departments and business units within one
company,” (Corporate Leadership Council, 2003).
The Impact of the Malcolm Baldrige National Quality Award Criteria Companies successfully implementing quality management are typically businesses that are recognized
for their successes. Since its inception in 1987, the Malcolm Baldrige National Quality Award (MBNQA)
has generated substantial interest in the benefits of quality management and has served as a motivator
for implementing quality management systems. The program, created to stimulate quality improvement
by U.S. manufacturers, recognizes achievement, establishes criteria for evaluating improvement, and
publicizes the practices of award-winning companies in order to educate others. In its 23 years, there
have been more than 1,300 applicants, 72 award recipients, 2,800 quality examiners trained, and
750,000 copies of its Performance Criteria for Excellence distributed. It has inspired the creation of 43
state awards and nearly 45 international quality award programs. This reflects the international success,
rate of adoption and impact of the MBNQA. Many of the research studies cited here, as well as many
others, have been carried out using MBNQA winners, applicants, and companies which use its Criteria
for Excellence to drive improvement.
MBNQA applicants and winners consistently outperform other companies in key metrics. For example,
the U.S. Commerce Department compared return on investment for MBNQA winners to S&P 500 index
companies. Between the years 1988 and 1994, MBNQA winners had 188% ROI compared to 28% for the
S&P 500 companies (Jacob et al, 2004; Ramasesh, 1998).
These exceptional returns are from MBNQA winners, however, are not realized for all companies
involved in the MBNQA program, and it is important to set reasonable expectations especially with
timelines for implementation and results to follow. In many cases, expectations of financial returns from
administering quality programs and following MBNQA criteria are unreasonably high. In fact, Davis
(2005) found that managers expected impractically low implementation cost and lofty returns—
reporting expected improvements of 12% return on investment, 6.5% return on assets, 14% profits, and
15% customer satisfaction. When unrealistic expectations are set, the programs often cannot deliver
and are deemed unsuccessful (Hendricks and Singhal, 1999).
Home Innovation Research Labs July 2013 The Economics of Quality Page 7
Therefore, quality programs and MBNQA should not be seen as a “panacea for business, but rather a
means with which to build and maintain a strong competitive foundation” and should not be expected
to provide instant results (Hendricks and Singhal, 1999; Zari, et al, 1994). At the same time, many
companies have demonstrated dramatically improved financial returns while pursuing the MBNQA and,
hence, improving profit remains a top justification for involvement with MBNQA (Davis, 2005).
Perhaps the best-known study on the financial results of the MBNQA is the ‘Baldrige Index.’ In this
annual study, $1,000 is placed in a fictitious stock fund of publicly traded MBNQA winners and
compared to $1,000 hypothetically invested in the S&P 500 index. Between 1992 and 2002, the Baldrige
Index outperformed the S&P 500 by 6.5 to 1 (NIST, 2003).
Another study compared 17 MBNQA winners between 1988 and 1996 to the S&P 500 index while
adjusting for risk, market conditions such as inflation and interest rates, and variability unique to
individual stocks such as labor strikes and lawsuits. In this study, MBNQA winners consistently
outperformed the S&P 500 stocks having similar risk (Tai and Przasnyski, 1999).
Another fictitious stock index, the Q100, was created to track the quality leaders of the S&P 500.
Between September 1998 and December 2001, the Q100, which was weighted and diversified to align
with the S&P 500, experienced a return of 27% while the S&P 500 return was 17.6% during the same
time period. It was concluded that “in both bull and bear markets, quality improvement efforts have a
direct and measurable impact on performance” (George, 2002).
Wisner and Eakins (1994) studied 17 MBNQA winners between 1988 and 1992 and found impressive
achievements in customer service cost, production costs, product reliability, defect rate and cycle time
reduction. During this time, companies increased sales by 75%, employee job satisfaction by 57%, and
return on assets by 50%. Detailed analysis of financial performance (including annual sales, 5-year
growth, return on sales, return on assets, return on net worth, P/E ratio, earnings per share, and 5-year
average growth in earnings per share) on four of the companies calculated an increase of 58% in overall
financial performance during the four-year study period.
Ramasesh (1998) examined 13 publicly traded MBNQA winners between 1988 and 1996 and used S&P
500 index and the Wall Street Journal Index to track key performance metrics. Compared with the two
indices, this study found significantly higher returns for the MBNQA winners, especially in regard to net
sales per employee and reduction in inventories.
Jacob, et al (2004) compared 18, publicly-traded MBNQA winners between 1988 and 2002 to a
benchmark group of 18 comparable (by SIC code and sales revenue) companies. Researchers compared
several accounting metrics including a market-to-book ratio (market value of assets to the book value of
assets), P/E ratio, and excess value ratio. Under uni-variate and multivariate tests, MBNQA winners
performed significantly better than the industry medians in terms of profitability and asset utilization
while having more leveraged debt and spending more on capital, R&D, and advertising. In short, winners
were more valuable than the benchmark group and valued more highly by investors.
July 2013 Home Innovation Research Labs Page 8 The Economics of Quality
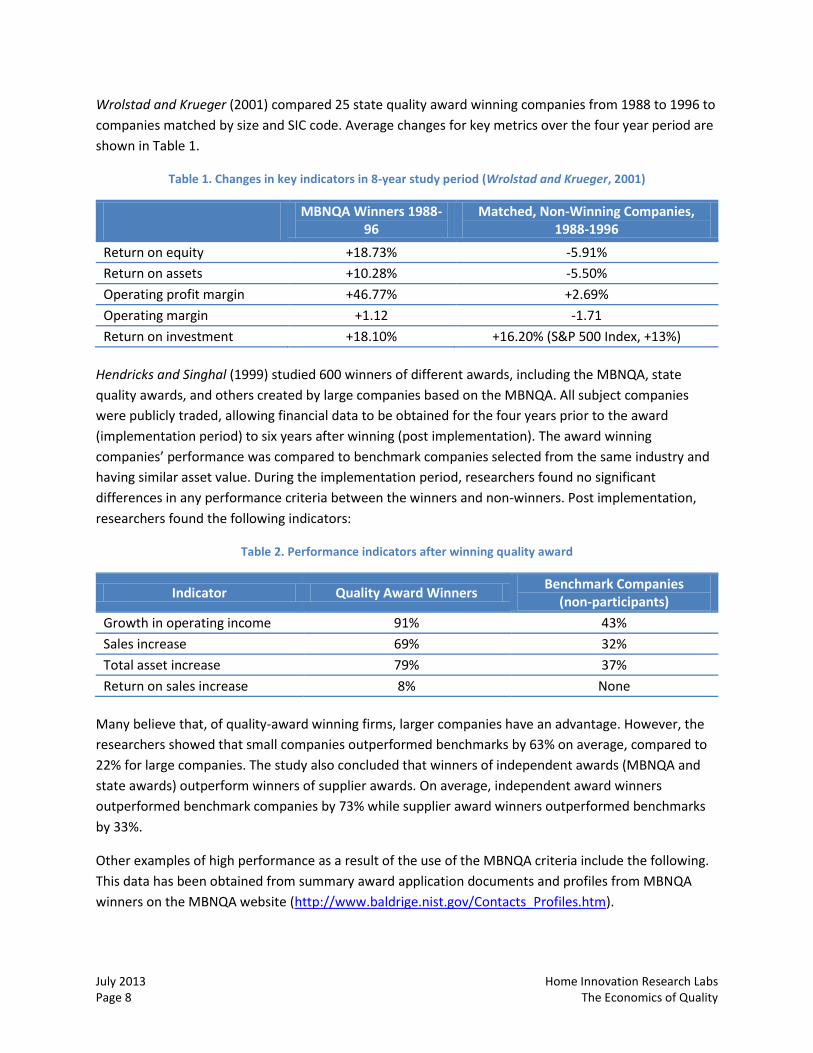
Wrolstad and Krueger (2001) compared 25 state quality award winning companies from 1988 to 1996 to
companies matched by size and SIC code. Average changes for key metrics over the four year period are
shown in Table 1.
Table 1. Changes in key indicators in 8-year study period (Wrolstad and Krueger, 2001)
MBNQA Winners 1988-
96 Matched, Non-Winning Companies,
1988-1996
Return on equity +18.73% -5.91%
Return on assets +10.28% -5.50%
Operating profit margin +46.77% +2.69%
Operating margin +1.12 -1.71
Return on investment +18.10% +16.20% (S&P 500 Index, +13%)
Hendricks and Singhal (1999) studied 600 winners of different awards, including the MBNQA, state
quality awards, and others created by large companies based on the MBNQA. All subject companies
were publicly traded, allowing financial data to be obtained for the four years prior to the award
(implementation period) to six years after winning (post implementation). The award winning
companies’ performance was compared to benchmark companies selected from the same industry and
having similar asset value. During the implementation period, researchers found no significant
differences in any performance criteria between the winners and non-winners. Post implementation,
researchers found the following indicators:
Table 2. Performance indicators after winning quality award
Indicator Quality Award Winners Benchmark Companies
(non-participants)
Growth in operating income 91% 43%
Sales increase 69% 32%
Total asset increase 79% 37%
Return on sales increase 8% None
Many believe that, of quality-award winning firms, larger companies have an advantage. However, the
researchers showed that small companies outperformed benchmarks by 63% on average, compared to
22% for large companies. The study also concluded that winners of independent awards (MBNQA and
state awards) outperform winners of supplier awards. On average, independent award winners
outperformed benchmark companies by 73% while supplier award winners outperformed benchmarks
by 33%.
Other examples of high performance as a result of the use of the MBNQA criteria include the following.
This data has been obtained from summary award application documents and profiles from MBNQA
winners on the MBNQA website (http://www.baldrige.nist.gov/Contacts_Profiles.htm).

Home Innovation Research Labs July 2013 The Economics of Quality Page 9
Small Businesses Service Businesses Manufacturing
MESA Products Inc
93% increase in sales
20% increase return on equity
Premier Inc
90% Customer satisfaction
15% increase in operating margin
Motorola Inc
32% increase employee productivity
99% customer satisfaction
PRO TEC
2% employee turnover
0.12% defect rate
Ritz Carlton
99% guest satisfaction, 80% extremely satisfied
Pre tax return on investment and earnings doubled
Sunny Fresh Foods
93% revenue increase
Market share increased while competition decreased by 10%
Texas Name Plate Co
Profit increase from 36% in 1998 to 40% in 2004
DynMcDermott Petroleum Operations
Customer satisfaction increased from 67% in 1999 to 74% in 2004
Boeing’s Airlift and Tanker Program
Avoided loss of 10,000 jobs
60% productivity increase
When used effectively, the MBNQA and other quality programs improve financial and non-financial
performance. But, like any other aspect of business, there is no silver bullet. Instead, a company must
apply knowledge, use judgment, clarify appropriate expectations, evaluate consequences, and monitor
processes continuously. This is the case whether an organization plans to apply for the MBNQA or simply
to use its self-assessment process (Hardie, 1998, Hendricks and Singhal, 1999, Davis, 2005). However,
Garvin (1991) may have stated it best, “While MBNQA winners are as vulnerable to economic downturns,
shifts in fashion and technology, and other environmental impacts, they are better positioned than others
to recover gracefully because they have superior management processes in place.”
Quality in the Construction Industry The next step is looking and quality management specifically in the construction industry. As quality
management processes including Total Quality Management, Quality Assurance, ISO 9001, Six Sigma,
and Lean continue to expand globally in manufacturing and other industries, these techniques have
seeped into the construction industry (Dahlgaard and Dahlgaard-Park, 2006; Aberdeen Group, 2005;
Salem et al, 2005; Abdul-Rashid & Abdul-Aziz, 2002; Mathews, et al, 2000). Quality has been adopted in
the construction industry mainly because, as in any other industry, “it is critical that client satisfaction is
achieved if an organization is to succeed, or indeed survive,” (Barratt, 2000).
Due to the construction industry’s uniquely complex and personal nature, understanding and meeting
client requirements is key to success. Quality management processes in the construction industry have
improved product quality and customer satisfaction, and reduced costs and employee injuries
(Hoonakker, 2006). While many in the industry are attempting to improve quality, progress has been
slow and fragmented (Low and Hong, 2005, Haupt and Whiteman, 2003). Further complicating the
integration of quality processes is the unique aspects of the industry as Low and Tan (1996) point out,
“the construction industry is characterized by activities which are discontinuous, dispersed, diverse and
distinct in nature.” Yet, the successful application of quality management in the industry is proven
(Bayfield and Roberts, 2005).

July 2013 Home Innovation Research Labs Page 10 The Economics of Quality
Another unique aspect to new home construction is the use of trade contractors. Where quality
methods are employed in the industry, the principles are often applied only at the management level
and not successfully transferred into field operations (Haupt and Whiteman, 2003). The issue is
complicated by the industry’s use of trade contractors, which undertake 90% to 100% of job site
construction (Abdul-Rashid and Abdul-Aziz, 2002). No doubt, client satisfaction and contractor
performance are “positively and strongly associated with their relationships with sub-contractors,” (Xiao
and Proverbs, 2003). Therefore, the best way to improve relationships and quality with trade
contractors is to focus on building partnerships (Mathews, et al, 2000) which involves collaborating on
resource efficiency, financial issues, and combined goals (Bayfield and Roberts, 2005). Barratt (2000)
concludes that a combination of “sound formal systems and strong relationships is essential to achieve
high quality in the project environment of construction.”
According to Xiao and Proverbs (2002), “quality tends to suffer from attitudinal rather than
technological problems; there is a need to create a culture of quality.” Creating this culture requires
behavioral changes and, therefore, commitment from company leaders may be the primary factor for
successful implementation, (Salem, et al, 2005). It is only a mind shift by senior management that will
lead to the industry fully embracing quality management (Low and Hong, 2005; Haupt and Whiteman,
2003). Yet, to be successful, the programs must be pervasive not just among managers, but also
throughout the company and in the field.
The Impact of Quality for Home Building Companies So what impacts are possible if quality management is applied to homebuilding? A 2008 study by
Professional Builder magazine ranked the issues that its “Giants” of homebuilding report as the greatest
opportunities for home building companies. At the top of this list was operational efficiency and third
ranked was better product and services. Both of these top-ranked improvement opportunities can be
addressed using quality tools and techniques (see Figure 6).
Figure 6. Opportunities for builders (Professional Builder, May 2009)

Home Innovation Research Labs July 2013 The Economics of Quality Page 11
Considering the potential for operational efficiencies outlined in the economics of quality section, and
profits from Figure 7, it becomes apparent that substantial financial impacts can be made by
implementing a quality program. Using 2008 data from Figure 7 with Rodchua’s (2002) average numbers
for the cost of quality, 3.5% of revenue is cost of quality and of that 75% of cost of quality is failure
costs. Therefore 2.62% of revenue is failure cost.
Figure 7. Component costs of the average home sales price (Professional Builder, May 2009)
For example, if a builder constructs 50 homes per year which sell for $150,000 each:
At 2.62% of revenue being failure cost:
2.62% x $150,000 = $3,930 failure cost/house
At 1.22% profit per house:
1.22% x $150,000 = $1,830 profit/house
Therefore for 50 homes per year, failure cost per year:
50 x $3,930 = $196,500 failure cost/yr
The equivalent of 1 home per year is the failure cost/yr
A 2006 study of nearly 32,000 homes by Quality Built supports these levels of failure costs. The study
revealed the average cost to correct defects in new single-family homes was $5,400 and more than
$4,500 for multifamily and light commercial construction (Quality Built, 2006).
The potential positive impact of quality improvement was illustrated by JD Power study (JD Power,
2006). An average JD Power builder with a JD Power index score of 112 receives 3.96 positive
recommendations per homebuyer. At an index score of 122, the same builder would receive 4.62

July 2013 Home Innovation Research Labs Page 12 The Economics of Quality
positive recommendations per homebuyer. This increase in recommendations, using JD Power’s
customer-based data for return rates, average sales price, and other indicators, would ultimately
translate to $175,000 increased profit.
0.66 Additional Recommendation
per Buyer X
128 Average Number
of Returned Questionnaires
per Builder
= 84
Potential Customers
X 15%
Convert to Sales
= 12
Additional Home Sales
X $292,000 Average Sale Price
= $3,504,000 Revenue
X 5% Average Profit Margin
=
$175,000 Additional Profit from additional recommendations
Figure 8. JD Power example of increased profits due to increased customer satisfaction
In another study by the Department of Energy on a modular home building company showed a 59% gain
in labor productivity and a simultaneous 22% cycle time reduction due to the implementation of a
quality management program (U.S. DOE, 2005).
Home Innovation Research Labs’ (formerly the NAHB Research Center) National Housing Quality (NHQ)
program has also shown the impact of quality implementation with traditional residential home
builders. A 2007 survey by Home Innovation’s National Housing Quality (NHQ) program builders
revealed that, after achieving NHQ certification:
• 80% of NHQ certified trade contractors reported a reduction in callbacks
• 88% achieved an increase in employee accountability
• 79% improved relationships with builders
• 65% overall improved their bottom line
• 70% of NHQ certified builders improved their bottom line
• 75 % reported a reduction in callbacks and improved relationships with trades
• Up to 25% reduction in cycle time for certified trade contractors (NAHBRC, 2007)
National Housing Quality Award (NHQA) winning builders have noted tremendous impacts from
implementing quality management systems. A sampling of results includes:
• 98% homes zero defects at closing, net profit increased 9% (Grayson Homes, MD)
• Reduced cycle time by 15% (Pringle Homes, FL)
• 95% of trades list builder as the best to work for (Estes Homes, WA)
• 33% of homeowner recommendations resulting in sale (TS Lewis, AZ)
• (Professional Builder Magazine, 2009)

Home Innovation Research Labs July 2013 The Economics of Quality Page 13
Finally, and perhaps most compellingly, a 1997 NAHB study reported the average builder net income
before taxes of 5.1% and gross margin of 18.5%; NHQA builders, on the other hand, achieved an average
net income of 11.2% and gross margin of 25.5%. (NAHB, 1997)
Business Results of Implementing Quality Management
Builders that have successfully implemented quality management reap excellent rewards in profitability,
product quality, customer satisfaction, and employee satisfaction. Between 1993 and 2009, National
Housing Quality Award-winning builders report the following impacts and performance indicators, many
of which are a direct result of implementing effective quality management:
Category NHQA Winning Builder
Benefit from Quality
Profits (Gross Margins) 12-20%
Revenue 15-100% increase/yr
Construction Costs vs. Budget +/- 1%
Customer Satisfaction 93-97%
Referral Rates (Sales made through referral) 29%
Cycle Time Reductions 15-50%
Zero Defects at Closing 98%
Defect Reductions 11-75%
Employee Satisfaction 94%
Trade Satisfaction 95%
Customer Endorsements/ Thank You Letters 73%
Warranty Requests 1 per every 15.5 homes
Winners of the National Housing Quality Award do not adhere to quality management to win awards.
Instead, they cite cost savings, reduced defects, job satisfaction, customer satisfaction, and profitability
as the motivation for quality management. As an example, the following are quotes from NHQ award-
winning builders and Professional Builder magazine regarding the value of quality.
“Quality and satisfaction save money. You save a lot of money getting it right the first time.
Make one trip [to the site], and you don't have to go back.” –K. Hovnanian Virginia, 2009 NHQ
silver award winner
“About 400 to 500 Opportunities for Improvement are suggested a year and about 80 percent of
them are implemented, saving thousands of dollars and improving the customer experience.”
–Wayne Homes, 2010 NHQ silver award winner
“Our most recent ‘Cost Walk’ generated over 500 ideas for improvement. Many of them were
implemented, and we documented savings of over $150,000 a year." –Pringle Development,
2008 NHQ silver award winner
July 2013 Home Innovation Research Labs Page 14 The Economics of Quality
“It's also about getting the performance that you measure. We started posting the trade
contractors’ relative performance and letting them all see where they stood. It seemed to really
spur them on to greater things.” –Pringle Development, 2008 NHQ silver award winner
Kevin Egan, president and COO, “The reason we've been successful is it starts with our mission
and our vision, We’re disciplined in our processes and operations, setting goals and objectives
and tracking key performance indicators and communicating that information.” –TW Lewis,
2009 NHQ gold award winner
“We decided that we wanted to start having fun. We wanted to make money. And we wanted
a good name. That is when we started to turn things around.” –Don Simon Homes, 2002 NHQ
gold award winner
From “maximizing customer satisfaction with final product and overall building experience” to
“designing, integrating and aligning all business functions to maximize efficiency and profits
throughout the organization,” these success drivers are the genesis of the company’s strategic
plan. –Don Simon Homes, 2001 NHQ silver award winner
“We don't build a single home. We are managers. We create schedules. We obtain the
materials, locations, plans, et cetera, but we don’t build a thing. We deal with contractors, many
of whom have been in business a long time. They have experience that we don’t.” –Pulte Homes
Minnesota, 2003 NHQ silver award winner
“Quality leadership is like that. It’s not passed down, layer by layer, until the folks that do the
work understand. Quality leadership rises to the top. Common values become company
values, and company values become a culture that nurtures success.” –Winans Construction,
2001 NHQ gold award winner
“Any company that embarks upon the NHQ process constantly seeks improvement. For us, that
meant growing not necessarily in volume but in ways that would actually accomplish something
for us, make us more efficient and create more opportunities for my employees.” –Boardwalk
Builders, 2004 NHQ silver award winner
“We felt that we really needed to have good communication with our customer, which mostly
means no surprises. We have checklists and systems in place [to ensure] this happens with every
single customer in every single home. I see a lot of companies winging everything, including
the repetitive-type tasks, and I see that as a huge waste of time and resources.” –Estes
Builders, 2005 NHQ silver award winner
“We have certain success drivers: business profitability, customer loyalty, operating efficiency
and employee department loyalty. Every other week, everyone in the organization comes
together – all 140 of us. We start every meeting with our vision or mission. It’s how you
communicate effectively with your team about what's important. You need to be part of that
process.” Veridian Homes, 2005 NHQ silver award winner

Home Innovation Research Labs July 2013 The Economics of Quality Page 15
“Efficiency and profitability drive decisions. A mindset to constantly improve processes and
procedures helps the company overcome any obstacles. The company strives to clearly
communicate its goals and objectives to employees to make sure they're aware of changes to
the company's strategic plan.” As one of the first contractors in the nation to achieve NHQ
Certified Framing Trade Contractor status, the company recognizes the need to minimize risk
associated with construction defect litigation and rising insurance premiums.” – Schuck &
Sons, 2007 NHQ silver award winner
“Partnerships with trade contractors and suppliers are an industry best practice with
systematic integration addressing the goals and objectives of the organization.” Shea Homes,
2006 NHQ gold award winner
“When times are tough—and no one is immune to our economy's downfall—it's easy to forgo
routines and strategy critical to business success. But Siminoni Builders maintained its business
rhythm and devotion to employees as the challenges mounted.” – Simonini Builders, 2010
NHQ gold award winner
“Performance and progress are closely monitored with daily "dashboard" reports and monthly
"scorecards." Color coded scorecards allow managers to be quickly alerted to problem spots so
changes can be made to address any deficiencies or variances from the established business
plans.” –Fireside Hearth & Home, 2008 NHQ Silver Award winner
These references show the dramatic positive impacts that quality management can provide on a wide
range of performance indicators including ultimately, profitability.
The Impact of High Performing Homes Beyond implementing quality management in general, as well as specifically in homes, adding the goal
of high-performance homes can also lead to improved customer satisfaction. A 2007 NAHB survey
revealed that home buyers want energy efficient, low-maintenance, well-insulated and well-sealed
homes and they are willing to pay a premium for them (Figures 9 & 10). Indeed, homeowners are not
simply attracted to high performing homes; they are more satisfied with these homes. According to
McGraw-Hill (2007), 63% of green home buyers are attracted to high performing homes due to lower
operating and maintenance costs. Yet, 85% reported being more satisfied with their new green homes
than with their previous, traditionally-built homes. By coupling quality management systems with high
performance home building techniques, builders are likely to create satisfied customers and, hence,
increased profit.

July 2013 Home Innovation Research Labs Page 16 The Economics of Quality
Figure 9. What homeowners want (NAHB, 2007)
Figure 10. What homeowners are willing to pay for the energy efficient features they want in homes (NAHB, 2007)
Suggested Quality Management Tools and Techniques for Home Builders The motivation for quality management for high-performance homes makes sense based on value,
costs, revenue, and customer service. In addition, quality management has the most impact when
strategically coordinated, driven and aligned throughout the organization. From the strategic level,
coordination flows through a tactical and then operational level. (Figure 11)
4%
30%
35%
35%
35%
39%
53%
53%
54%
60%
66%
72%
79%
0% 50% 100%
Other
Wide Range Of Options
Distinctive Design
Community Ammenities
Noise Reduction
Environmentally Friendly Features
High Quality Carpentry
Proximity To Community Locations
High Quality Appliances/Fixtures
Ease Of Maintenance
Better Insulated/Sealed Home
Energy Efficient Features
Living Spaces
Buyers
16%
51%
83%
0% 50% 100%
More Than $11,000
Up to $10,999 More
Up to $5,000 More
New Home Buyers

Home Innovation Research Labs July 2013 The Economics of Quality Page 17
Figure 11. Strategic, tactical and operational layering of quality management
Strategic Models As the strategic level, the NHQA application process helps builders self-assess their quality management
program, identify gaps, and coordinate improvement of factors critical to business success. The NHQA
Criteria for Performance Excellence has served as an important tool for hundreds of home builders and
trade contractors. The criteria help to:
• Align resources
• Improve communication
• Increase productivity
• Boost effectiveness
• Achieve strategic goals
The NHQA Criteria for Performance Excellence includes the following categories:
1. Leadership
How do your company’s senior leaders guide the organization toward a common purpose based
on shared values and priorities?

July 2013 Home Innovation Research Labs Page 18 The Economics of Quality
2. Strategic Planning
How do you create and implement a strategic plan to achieve a vision for the future, enhance
your competitive position, and improve overall performance?
3. Performance Management
How are your company’s business processes developed, managed, measured, and improved to
achieve performance excellence?
4. Customer Satisfaction
How does your company manage the design and delivery of products and services that promise
a high level of customer satisfaction?
5. Human Resources
How do your employee selection and development practices, as well as staff performance
management, well-being, motivation, satisfaction, and compensation contribute to the growth
of your organization?
6. Construction Quality
What methods does your company use to drive quality in the home construction process and
ensure high performing, trouble free products and services?
7. Trade Partnerships
How do you create high performance relationship with your independent trade partners?
8. Business Results
What are the tangible measurements of the business benefits resulting from your high
performance practices in the financial, operational, customer satisfaction, and product and
service quality areas?
Using the criteria, self-assessment can identify strengths and target opportunities for improvement that
impact customers, employees, owners, suppliers, and the public. The NHQ self-assessment process is
not only a first step toward driving improvement throughout an organization, but also toward
submitting an application for the NHQA award process annually. Writing an application, in fact, is in
itself a method of self-assessment.
When an award application is submitted, it undergoes review by a team of expert judges. Finalists
further receive a site visit by a judging team that may last several days. In either case, applicants receive
detailed, actionable feedback reports to support continued improvement.
The NHQA process is an ideal strategic tool for organizations. It helps companies learn quality concepts,
begin self-assessment, implement improvement, submit an application, and gain valuable independent
feedback for improvement.

Home Innovation Research Labs July 2013 The Economics of Quality Page 19
Tactical Standards Home Innovation’s NHQ Certified Builder and NHQ Certified Trade Contractor programs can represent
tactical quality management systems (QMS) for the construction industry. These programs based on ISO
9000, ISO 14000, and OSHA 18000 focus on driving quality assurance through a QMS. These programs
set criteria for quality, safety, and environmental management in the homebuilding industry.
Both certification programs, which involve annual third-party audits, incorporate the critical issues of
continual improvement and corrective and preventive with a unique focus on homebuilding industry
issues. Companies that go through the process of certification must demonstrate quality management
systems throughout the company—from scheduling work and creating jobsite inspection lists to
ensuring job ready conditions and partnering with trades on quality initiatives.
In fact, NHQ certified builders are strongly encouraging trade partners to seek NHQ certification, since
contractors provide nearly all of the skilled labor used to construct homes. Some NHQ certified builders
pay for over 12 hours of training and support the development of quality manuals required for
certification. The emphasis has been to ensure that a complete chain of quality processes is achieved
with all partners.
During the NHQ certification process, builders and trade contractors must develop a quality manual and
set of procedures that cover the following encompassing areas:
General
- Scope
- Leadership
- Quality statements
- Quality manual
- Responsibilities
- Organizational chart
- Training
- Performance management
- Process flow
Management System
- Committee
- Audits
- Annual reviews
- Changes
- Document control
- Records
- Reference documents
Procedures
- Scopes
- Procedures
- Codes
- Standards
- Manufacturers’ instructions
- Contracts
- Schedules
- Approval of trades
- Control of specifications and plans
- Job ready, in process and complete
inspection
- Corrective and preventive action
- Training

July 2013 Home Innovation Research Labs Page 20 The Economics of Quality
Operational Operational tools are those that make improvements happen. Home Innovation has developed many
tools, specific to the home building industry, to support quality improvement. These and other quality
specific tools include:
• Scopes of Work
• Procedure Documents
• Checklists
• Six Sigma DMAIC process
• Process Mapping
• Value stream mapping
• Failure mode effects analysis (FMEA)
• 5S
• 8D
• Fishbone Charts
• 80/20 rule
• Brainstorming
One additional measure that Home Innoation plans to address in future quality management work
includes the design of high-performance homes. To date, existing quality management programs have
not addressed the need to design the house as a system which is vital in high-performance homes.
Suggested Cost of Quality Metrics for Home Builders Although the value for quality management was detailed above, in order for a builder to be able to
quantify quality, it is necessary to have standard metrics and methodologies for measuring quality
management. For the home building industry, cost of quality metrics for high-performance homes
should ideally follow the Prevention, Appraisal and Failure model. By measuring these metrics a
homebuilder can establish their current levels of performance and then monitor year on year their
performance, measure improvement and benchmark themselves against the best in the industry.
Quality performance metrics There are many performance metrics to measure the success of a quality management system including
scheduling, costs, etc. These are detailed further below.
Schedule
• Construction Schedules – (ideally this is in working days) This metric allows a builder to ensure
‘on time’ construction by milestone as well as firm timelines to focus on for improvement i.e.,
reducing cycle times. Some of the suggested categories are included below. However, the intent
is that these are customized and each builder uses them to provide as much detail as possible to
determine if the schedules are met or not.
o Design

Home Innovation Research Labs July 2013 The Economics of Quality Page 21
o Contract signing to closing
o Contract signing to excavation
o Excavation foundation
o Excavation back fill
o Weather days
o Framing
o Frame start to certificate of occupancy
o Rough mechanical
o Drywall
o Trim
o Pre-punch to closing
o Testing
o Inspections
• Milestones – This metric includes the date of the milestones to further detail the construction
schedule above.
• On Time Delivery – To track this metric, a builder has to first determine when the when the
builder considers the delivery to the customer (such as closing). Once this is defined, and based
on the construction schedule, the on time delivery can be reported as a simple yes or no.
Beyond this, a builder can then relate the on time delivery as a percentage of projects
completed.
Energy Performance
• Air Infiltration Testing – This metric is the result of the blower door test to measure the air
infiltration (leakage) of the home to the exterior.
• Duct Leakage Testing – This metric is the result of the duct blaster test to measure the leakage
of the duct system to the exterior and the interior to determine heat loss and delivery efficiency
of the duct system.
• BA Benchmark/HERS Index –This metric uses energy simulations, the air infiltration, and duct
leakage measurements to estimate the energy use and costs of the home.
Costs
• Profits – This metric details the profits for the project including:
o Gross Profit= net sales – cost of goods sold
o Net Profit= gross profit – Total operating expenses
• Inspection Costs – This metric details all costs involved in checking and rechecking someone
else’s work (that they should have checked and done right the first time) this will include, labor,
truck, fuel costs etc.
July 2013 Home Innovation Research Labs Page 22 The Economics of Quality
• Verification Costs – This metric details the costs to verify the performance of the home including
the air infiltration testing, duct leakage testing, and any program verifications such as Builders
Challenge, ENERGY STAR, green programs, etc.
• Warranty Costs – This metric can cover all costs including labor, fuel, trucks, material and time
for rework and repair for customer call backs. In addition, it can also include litigation and
insurance costs.
Training
• Training Costs – this would include all training courses, books and other materials and may
include overhead for internal management time for training and even time taken from work to
attend certain all company meetings.
Satisfaction – Customer, Employee, Trade, Etc.
• Customer Satisfaction – (challenges discussed following) This metric is a score reflecting for
detailed aspects of the construction process and/or for the overall satisfaction of the client with
the process and finished product. The higher the score the better the chance of referrals and
return work in the future.
• Warranty Customer Satisfaction Rating – This metric can be a detailed customer satisfaction
score or sub-score (from other questions) that allows a builder to focus on sub sections of their
after construction/warranty process and key individuals in that process. This helps focus on
specific areas of improvement.
• Construction Manager Customer Satisfaction Rating – This metric can be a detailed customer
satisfaction score or sub-score (from other questions) that allows a builder to focus on sub
sections of their construction process and key individuals in that process. This helps focus on
specific areas of improvement.
• Trade/Supplier Satisfaction – This metric provides insights into the satisfaction of a builder’s
trades and/or suppliers. Finding potential new trade partners, evaluating them, training them to
meet the builder’s schedules, scopes of work, etc is time consuming and expensive. A builder
wants to keep their well trained, experienced trade partners. A trade/supplier satisfaction
survey allows a builder to uncover dissatisfaction they may have which they can address while
also allowing them to suggested areas to improve that may save time or money on the job.
Again there are various rating systems, survey approaches, and time periods for conducting
trade/supplier satisfaction surveys and so its challenges are also very similar to that of customer
satisfaction discussed earlier.
• Employee Satisfaction – This metric provides insights to the morale and culture of an
organization and is focused on reducing the rate of employee turnover by gaining feedback on
how the builder can make the work-life of their employees better. Hiring and training new
employees is very expensive, ensuring a builder keeps their trained, experienced existing
employees is a good investment. There are various rating systems, survey approaches and time

Home Innovation Research Labs July 2013 The Economics of Quality Page 23
periods for conducting employee satisfaction surveys and so its challenges are very similar to
that of customer satisfaction discussed earlier.
Referral
• Referral Rates – This metric details the percentage of customers that actually did refer someone
to a builder’s business.
Productivity
• Sales per Employee – This metric is gross sales/revenue divided by the number of employees
and provides an insight to how productive a builder is as an organization.
• Units /projects per Employee/Trade – This metric is another measure of how productivity.
Warranty/Defects
• Number of Warranty Calls – This metric can be measured as call backs per customer/home sold.
Obviously the less of these the better. The fewer the higher the customer satisfaction and the
higher the referral rates and of course the lower the unnecessary costs incurred by a builder
which reduce their profit margins. This will reduce their customer satisfaction scores, chances
for referrals and potentially result in the customer unfortunately promoting how bad their
business is to other potential customers.
• Time to Complete Warranty Calls – This metric is measured in days from the day the customer
called until the work is completed. If the customer calls back later on this same issue i.e., the
issue was not adequately resolved then it gets added on to the original issue length in days. This
reflects how well they respond and correct issues first time. The longer it takes to complete
warranty issues will result in reduced customer satisfaction scores, chances for referrals and
potentially result in the customer unfortunately promoting how bad business is to other
potential customers.
• Walk Through Pre Punch Defects – This metric is the number of defects found by the inspector
or superintendent on a final walk through of their home. This would be defects per square foot
of home. The more defects found, the more rework needs to be done. This is unnecessary (it
was not done correctly first time even though you paid for it) and further reduces your profit
margin.
• Customer Walk Through Defects – This metric is the number of defects found by the customer
on a final walk through of their home. This would be defects per square foot of home. This will
reduce your customer satisfaction score and also the possibility of referrals.
One issue with the metrics is that looking at metrics across multiple builders can be difficult. A key
challenge that needs to be recognized and addressed is that every builder uses different metrics to
monitor its operations. To look at multiple builders, the metrics need to be standardized so that there is
an agreed set of ‘master metrics’ which builders would ideally use or which would be used to ‘convert’
various builder metric formats. This would ensure that all data would be presented in one consistent
and coherent manner to compare ‘apples to apples.’

July 2013 Home Innovation Research Labs Page 24 The Economics of Quality
Examples of challenges due to the range of ways in which different organizations collect their data
include:
Challenges: Cost
• Warranty costs as a % of gross sales/revenue
• Warranty costs $ per home
• Warranty costs $ per year per home sold
In addition, some include staff costs and some do not.
Challenges: Customer Satisfaction
• 3rd party customer satisfaction survey companies
• Their own internal surveys
• Customers surveyed after move in / completion of project after
o 30 days,
o 45 days,
o 11 months,
o 12 months, and/or
o 18 months
• Rating scales for surveys
o Range 1-6,
o Range 1-5, or
o Range 1-10
• Satisfaction
o Recommendations to a friend or family member
o Direct question about satisfaction
o Sub survey answers to create a combined satisfaction score
Customer satisfaction can also be survey and measured for key steps and by department i.e.,
construction manager/supervisor or warranty for example.
Challenges: Defects
• Square foot per defect
• Defect per square foot
• Defect per room
• Defect count per home (regardless of square footage per home)
In addition, some count every paint scratch others paint defects on a per room basis
Challenges: Other issues
Similar problems relate to employee satisfaction and supplier/partner/sub-contractor surveys. Problems
also arise with production or even cycle time measures for example some use working days others use
days (that include weekends).

Home Innovation Research Labs July 2013 The Economics of Quality Page 25
Start and finish of project also creates problems for example some start the project cycle times based on
contract signing, arrival on site, work starting and finishing times as work completed by contractor or
sign off by home owner or certificate of occupancy.
Conclusion The value of quality management can have an impact on the economics of quality management.
Determining the costs of quality allow a high performance home builder to optimize their costs through
optimizing the prevention of defects through appraisals and the number of failures. In addition, there is
a direct connection between quality management and increased customer satisfaction. Numerous
manufacturers, builders, high performance home builders, Malcolm Baldrige National Quality Award
winners, National Housing Quality Award (NHQA) winners have documented value of quality
management, cost savings, increased customer satisfaction, and other benefits of implementing quality
management systems. To help builders implement quality management, there are many tools available
including the NHQA application process.
One necessary step to quantifying quality is measuring the success of quality management. It is
important to document schedules, energy performance, costs, training, satisfaction, referrals,
productivity, and warranty/defects. Consistently measuring these metrics will allow a builder to
determine where they are at and places for improvements. In addition, this will allow a larger study of
the impact of quality including value, costs, energy and quality performance, customer satisfaction, and
the impact in the construction industry. Those builders that have already adopted these practices have
seen significant improvements in the performance of their businesses.
July 2013 Home Innovation Research Labs Page 26 The Economics of Quality
References
Abdul-Rashid and Abdul-Aziz. (2002), “The realities of applying Total Quality Management in the
construction industry”, Structural Survey, 20(2), 88-96.
Abdul-Rahman, H., C.L. Kwan, and P.C. Woods, 1999, “Quality function deployment in construction
design: application in low cost housing design,” International Journal for Quality and Reliability
Management, 16(6), 591-605.
Adbul-Rahman, H., P.A. Thompson, and I.L. Whyte, 1996, “Capturing the cost of non-conformance on
construction sites” an application of the quality cost matrix, International Journal of Quality and
Reliability Management, 13(1), 48-60.
Aberdeen Group (2005), “The role of quality in global manufacturing,” The Product Quality Benchmark
Report.
Adsit, D.J., M. London, S. Crom, and D. Jones, 1996, “Relationships between employee attitudes,
customer satisfaction and departmental performance,” Journal of Management Development,
15(1), 62-75.
Barratt, P., 2000, “Systems and relationships for construction quality,” International Journal of Quality
and Reliability Management, 17(4/5), 377-392.
Bayfield, R. and P. Roberts, 2005 “Contract or cooperation? Insights from beyond construction:
collaboration the Honda Experience,” Lean Construction Journal, 2(2), 22-50.
Bernhardt, K.L, N. Donthub, and P.A. Kennett, 2000, “A longitudinal analysis of satisfaction and
profitability,” Journal of Business Research, 47(2), 161-171.
Brown, S.P., and S.K. Lam (2008) “A meta-analysis of relationships linking employee satisfaction to
customer responses,” Journal of Retailing, In Press, Available Online, 17 July 2008.
Cable, R.J and P. Healy, 1996, “In pursuit of quality: perceptions from corporate controllers,” The
Mid-Atlantic Journal of Business, 32(2), 135-144.
Calingo, L.M, 1996, “The evolution of strategic quality management,” International Journal of Quality &
Reliability Management, 32(39), 19-37.
Cokins, G., 2006, “Measuring the cost of quality,” Quality Progress, September, pp. 45-51.
Corporate Leadership Council, 2003, “Linking employee satisfaction with productivity, performance and
customer satisfaction,” July 2003, pp. 1-6.
Home Innovation Research Labs July 2013 The Economics of Quality Page 27
Cozzani, C.A and J.L. Oakley, 2005, “Linking organizational characteristics to employee attitudes and
behavior: a look at the downstream effects on market response and financial performance,”
Forum for People Performance Management & Measurement, pp. 1-15.
Dahlgaard, J.J. and S.M. Dahlgaard-Park, 2006, “Lean production, six sigma quality, TQM and company
culture,” The TQM Magazine, 18(3), 263-281.
Daniels, S., 2002, “Baldrige study says quality more that pays for itself,” Quality Progress, April, p. 36.
Davis, R.A., 2005, “Linking firm performance to the Malcolm Baldrige National Quality Award implementation
effort using multi-attribute utility theory,” Managerial Finance, 2005, 31(3), 19-34.
Easton, G.S. and S.L. Jarrell, 1998, “The effects of total quality management on corporate performance:
an empirical investigation,” The Journal of Business, 17(2), 253-255.
Eriksson, H. and J. Hansson, 2003, “The impact of TQM on financial performance,” Measuring Business
Excellence, 7(1), 36-50.
Evans, J. R and E.P. Jack, 2003, “Validating key results linkages in the baldrige performance model,”
Quality Management Journal, 10(2), 7-24.
Faulkner, A.J., J. Hudson, and P.S. Barrett, 2000, “Achieving exemplary quality in the construction
professions,” Structural Survey, 18(4), 155-162.
Feigenbaum, A.V., 1956, “Total Quality Control,” Harvard Business Review, 34(6).
Garvin, D., 1988, Managing Quality, The Strategic and Competitive Edge, The Free Press.
Garvin, D.A., 1991, “How the Baldrige award really works,” Harvard Business Review, Nov-December, pp
80-93.
George, S., 2002, “Bull or Bear?: The Q100 index proves that if you have quality you’ll beat the market,”
Quality Progress, April, pp 32-37.
Handfield, R., S. Ghosh, and S. Fawcett, 1998, “Quality driven change and its effects on financial
performance,” Quality Management Journal, 5(3), 13-30.
Hardie, N. (1998) “The effects of quality on business performance,” Quality Management Journal, 5(3),
65-83.
Harrington, H.J., J.J. Carr, and R. P. Reid, 1999, “What’s this systems stuff anyhow?” The TQM Magazine,
11(1), 54-57.
Harter, J.K, F.L. Schmidt, and T.L. Hayes, 2002, “Business unit level relationship Between employee
satisfaction, employee engagement and business outcomes: a meta analysis,” Journal of Applied
Psychology, 87(2), 268-279.

July 2013 Home Innovation Research Labs Page 28 The Economics of Quality
Haupt, T.C. and D.E. Whiteman, 2003, “Inhibiting factors of implementing Total Quality Management on
construction sites”, The TQM Magazine, 16(3), 166-173.
Hendricks, K.B. and V.R. Singhal, 1999, “Don’t count TQM out: evidence shows implementation pays off
in a big way,” Quality Progress, April, pp. 35-42.
Hiroshi, O., 1998, “Strategic management by policy in total quality management,” Strategic Change,
7(5), 277-288.
Hoonakker, P., 2006, “Quality in the construction industry,” ASQ World Conference on Quality and
Improvement, Proceedings, May, Vol. 60, pp. 1-9.
Hong Xiao and D. Proverbs, 2002, “The performance of contractors in Japan, the UK and the USA,”
International Journal of Quality and Reliability Management, 19(6), 672-687.
Hong Xiao and D. Proverbs, 2003, “Factors influencing Contractor Performance, Engineering,”
Construction and Architectural Management, 10(5), 322-332.
Jacob, R., C.N. Madu, and C. Tang, 2004, “An empirical assessment of the financial performance of
malcolm baldrige award winners,” International Journal of Quality & Reliability Management,
21(8), 897-914.
Juran, J. M., (1988), “Juran on Planning for Quality,” Free Press.
JD Power, (2006), “The impact of quality on customer satisfaction,” Maryland National Capital Building
Industry Association Meeting, 21 June 2006.
Kanji, G.K, K.K. Kristensen, and J.J. Dahlgaard, 1992, “Total quality management as a strategic variable,”
Total Quality Management, 3(1), 3-8.
Koys, D. J., (2006) “The effects of employee satisfaction, organizational citizenship behavior and
turnover on organizational effectiveness: a unit level longitudinal study,” Personal Psychology,
54(1), 101-114.
Low, S.P. (2001) “Quantifying the relationship between buildability, structural quality and productivity in
construction,” Structural Survey, 19(2), pp 106-112.
Low, S. P. and Hong, S.H. (2005) “Strategic Quality Management for the construction industry,” The TQM
Magazine, 17(1), 35-53.
Low, S. P. and W.C.K. Tan, 1996, “The influence of workload instability on quality in the construction
industry,” International Journal for Quality and Reliability Management, 13(3), 42-56.
Mathews, J., L. Pellew, F. Phua, and S. Rowlinson, 2000, “Quality relationships: partnering in the
construction supply chain,” International Journal of Quality and Reliability Management,
17(4/5), 493-510.

Home Innovation Research Labs July 2013 The Economics of Quality Page 29
McDonald, I., M. Zairi, M and M.A. Idris, 2002, “Sustaining and transferring excellence: a framework of
best practice of TQM transformation based on winners of baldrige and european quality
awards,” Measuring Business Excellence, 7(3), 20-30.
McGraw-Hill (2007) “Survey examines green home buyer sentiment,” HousingZone, 10 April 2007,
Research by NAHB and McGraw-Hill Construction
NAHB (1997) “The bottom-line on quality,” NAHB Business Management Committee’s Cost of Doing
Business Study, NAHB Research Center ToolBase.
NAHB (2007) “What do homeowners want?,” Consumer Preference Survey
NAHB Research Center (2007) “NHQ program achieving positive results for certified builders and
trades,” 2007 Media Releases and Alert.
Nilson, L., M. Johnson, and A. Gustafsson, 2001, “The impact of quality practices on customer
satisfaction and business results: product versus service organizations,” Journal of Quality
Management, 6(1), 5027.
NIST (2003) website, Baldrige Stock Studies, Tenth NIST Stock Investment Study, April 2004 & Ninth NIST
Stock Investment Study, May.
NIST (2008), “Baldrige National Quality Program 2008: Criteria for Performance Excellence”
Professional Builder Magazine (2009) NHQA Website, Builder Profiles
Quality Built (2006) “Nation’s leading risk management company releases top builder defect data for
construction industry: Quality Built Data shows builder top risk issues are preventable,” Media
Kit, International Builders’ Show, Orlando, Fla., 11 January 2006.
U.S. DOE (2005) “Building America industrialized housing partnership manufacturing/construction
productivity”
Ramasesh, R.V., 1998, “Baldrige award announcement and shareholder wealth,” International Journal of
Quality & Reliability Management, 3(2), 114-125.
Rodchua, S., 2009, “Comparative analysis of quality costs and organization size in the manufacturing
environment,” Quality Management Journal, 16(2), 34-43.
Salem, O., J. Solomon, A. Genaidy, and M. Luegring, 2005, “Site implementation and assessment of lean
construction techniques,” Lean Construction Journal, 2(2), 1-21.
Samson, D. & M. Terziovski, 1999, “The relationship between total quality Management practices and
operational performance,” Journal of Operations Management, 17(4), 393-409.
Schiffauerova, A. and V. Thomson, 2006, “A review of research on cost of quality models and best
practices,” International Journal of Quality & Reliability Management, 23(4).

July 2013 Home Innovation Research Labs Page 30 The Economics of Quality
Tai, L.S. and Z.H. Przasnyski, 1999, “Baldrige award winners beat the S&P 500: study shows quality
results in increased shareholder value,” Quality Progress, April, pp 45-51.
Taylor, C., 1997, “Baldrige winners learn that quality really does pay,” Managing Service Quality, 7(2),
65-68.
The Malcolm Baldrige National Quality Improvement Act of 1987 – Public Law 100-107, HR 812,
Section 2, Findings and Purpose.
Wisner, J.D. and S.G. Eakins, 1994, “A performance assessment of the US baldrige quality award
winners,” International Journal of Quality and Reliability Management, 11(2), 8-25.
Wrolstad, M., and T. Krueger, 2001, “Study shows that quality pays winners,” The Quality Management
Forum, Summer, 27(3), 11&14.
Yee, R.W.Y., A.C.L. Yeung, and T.C.E. Cheng, 2008, “The Impact of Employee Satisfaction on Quality and
Profitability in High Contact Service Industries,” Journal of Operations Management, 26(5), 651-668
Yoon, H.Y., J.H. Seo, and T.S. Yoon, 2004, “Effects of contact employee supports on critical employee
responses and customer service evaluation,” Journal of Services Marketing, 18(5), 395-412
Zari, M., S.R. Letza, and J.S. Oakland, 1994, “Does TQM impact on bottom-line results?,” The TQM
Magazine, 6(1), 38-43.


July 2013