
Joseph M. Juran Center for Research in Supply Chain, Operations, and Quality · 2014-03-07 ·...
48
Juran Center for Leadership in Quality Professor Kevin Linderman Academic Co-Director of Joseph M. Juran Center for Research in Supply Chain, Operations, and Quality Carlson School of Management University of Minnesota Joseph M. Juran Center for Research in Supply Chain, Operations, and Quality
Transcript of Joseph M. Juran Center for Research in Supply Chain, Operations, and Quality · 2014-03-07 ·...

Juran Center for Leadership in Quality
Professor Kevin LindermanAcademic Co-Director of Joseph M. Juran Center for Research in Supply
Chain, Operations, and Quality Carlson School of Management
University of Minnesota
Joseph M. Juran Center for Research in Supply Chain, Operations, and Quality

Juran Center for Leadership in Quality
Origins of the Juran Fellows Program

Juran Center for Leadership in Quality
“This will be a place where leaders engage with scholars to shape critical
questions, where new knowledge is developed, translated, and
disseminated, and, above all, where Quality scholars are trained. It is my
hope that, generations from now, historians will note that we helped
create the ‘Century of Quality.’”J.M. Juran
Quote from Dr. Juran

Juran Center for Leadership in Quality
Juran Fellowship AwardApplicationContent1. Career information 2. Executive summary3. Project description (up to 15 pages)
4. Short curriculum vitae (1-2 pages)
5. Letter of recommendation from a faculty advisor
Juran Center for Leadership in Quality
Evaluation Criteria 1. Importance of the Problem
(20% of score)2. Connection to Existing Quality Research
(20% of score)3. Appropriate Methodology
(20% of score)4. Relevance to Scholarship and Practice
(20% of score)5. Timeline and Probability of completion
(10% of score)

Juran Center for Leadership in Quality
Community of Juran Fellows
6

Juran Center for Leadership in Quality
Community of Juran Fellows

Juran Center for Leadership in Quality
The Future…
From seedlings to orchards

Juran Center for Leadership in Quality
Recent Juran Fellow Winners
Anna ErroreUniversity of Palermo (Italy)
Ujjal Kumar MukherjeeCarlson School of Management

Juran Center for Leadership in Quality
Anna ErroreUniversity of Palermo (Italy)Visiting PhD student at the Carlson School of Management
Definitive Screening Designs for Quality Improvement

Juran Center for Leadership in Quality
Anna ErroreUniversity of Palermo, Italy
(visiting PhD student at Carlson School of Management, University of Minnesota)
William LiChristopher J. Nachtsheim
Carlson School of Management, University of Minnesota
Definitive Screening Designs and Discrete Choice Experiments for Quality Improvement
Juran Center for Leadership in Quality
DOE in Business and Industry
All models are wrong; some models are useful.
Experiments, statistically designed or not, are a component of the learning process. How well one succeeds will be a function of adherence to the scientific method, the most rapid means for speeding the learning process.
George Box, 1978
Juran, J. M., and Godfrey, A. B. (1999). “Juran’s quality handbook (Vol. 2)”. New York, McGraw Hill.
Juran Center for Leadership in Quality
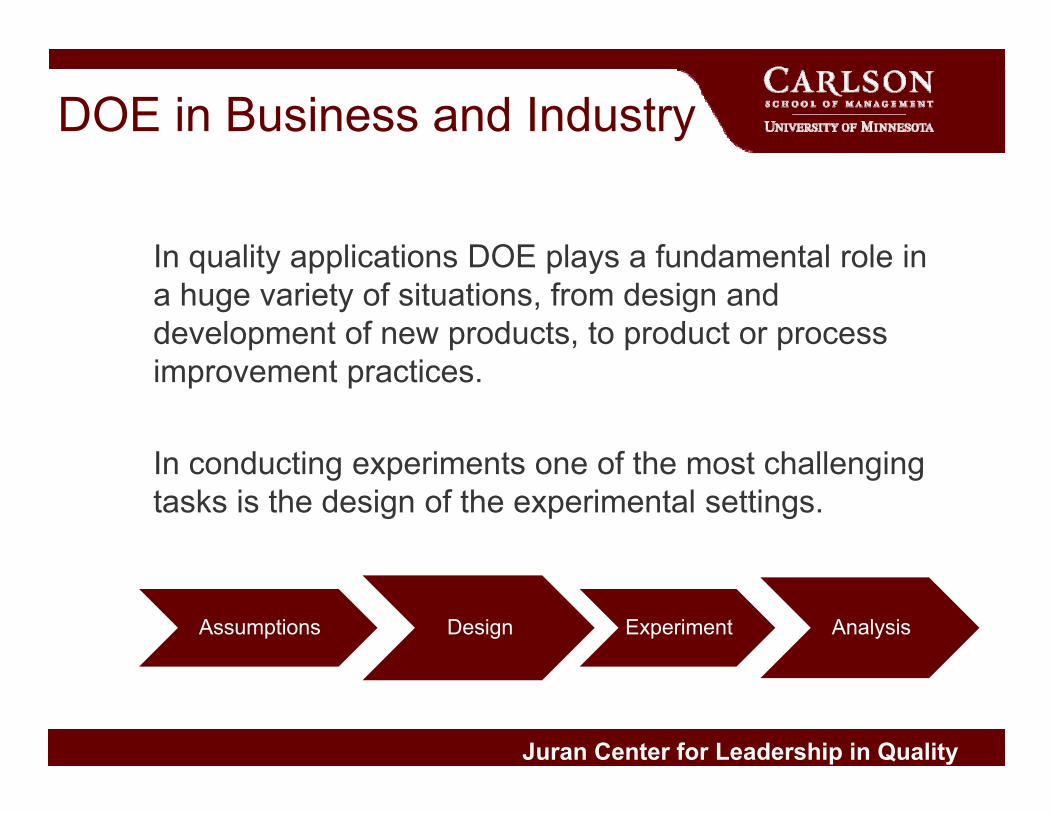
In quality applications DOE plays a fundamental role in a huge variety of situations, from design and development of new products, to product or process improvement practices.
In conducting experiments one of the most challenging tasks is the design of the experimental settings.
Assumptions Design Experiment Analysis
DOE in Business and Industry
Juran Center for Leadership in Quality
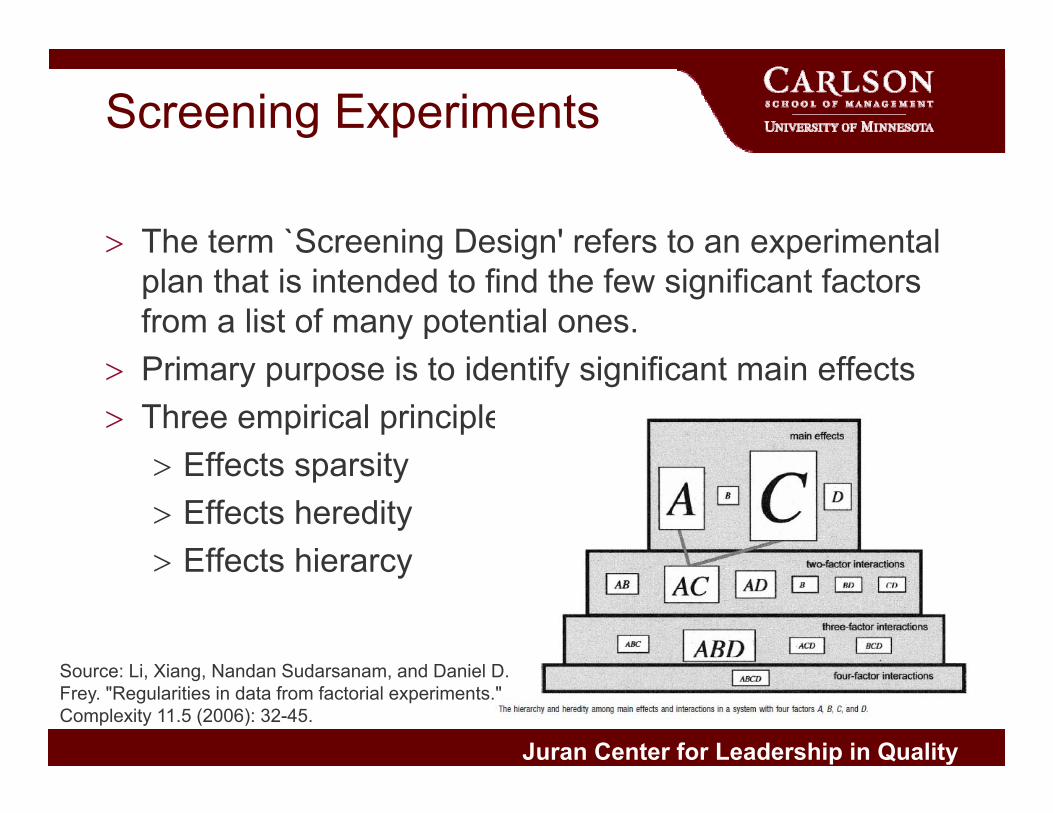
The term `Screening Design' refers to an experimental plan that is intended to find the few significant factors from a list of many potential ones.
Primary purpose is to identify significant main effects Three empirical principles
Effects sparsity Effects heredity Effects hierarcy
Screening Experiments
Source: Li, Xiang, Nandan Sudarsanam, and Daniel D. Frey. "Regularities in data from factorial experiments." Complexity 11.5 (2006): 32-45.
Juran Center for Leadership in Quality
Example
The reactor experiment of Box, Hunter, and Hunter (2005)
5 factors: Feed Rate (A), Catalyst (B), Stir Rate (C), Temperature (D), Concentration (E).
The response is the percent reacted (y).
Example of a Screening Experiment
Juran Center for Leadership in Quality
The fitted equation is:y = 65.5+9.75B+ 5.375D−3.125E +6.625BD−5.5DE
Obtained with a full factorial experimental design: 25 = 32 runs
In practice full factorial designs are very rare, especially for screening, because the run size increases exponentially with the number of factors.
Example of a Screening Experiment
Juran Center for Leadership in Quality
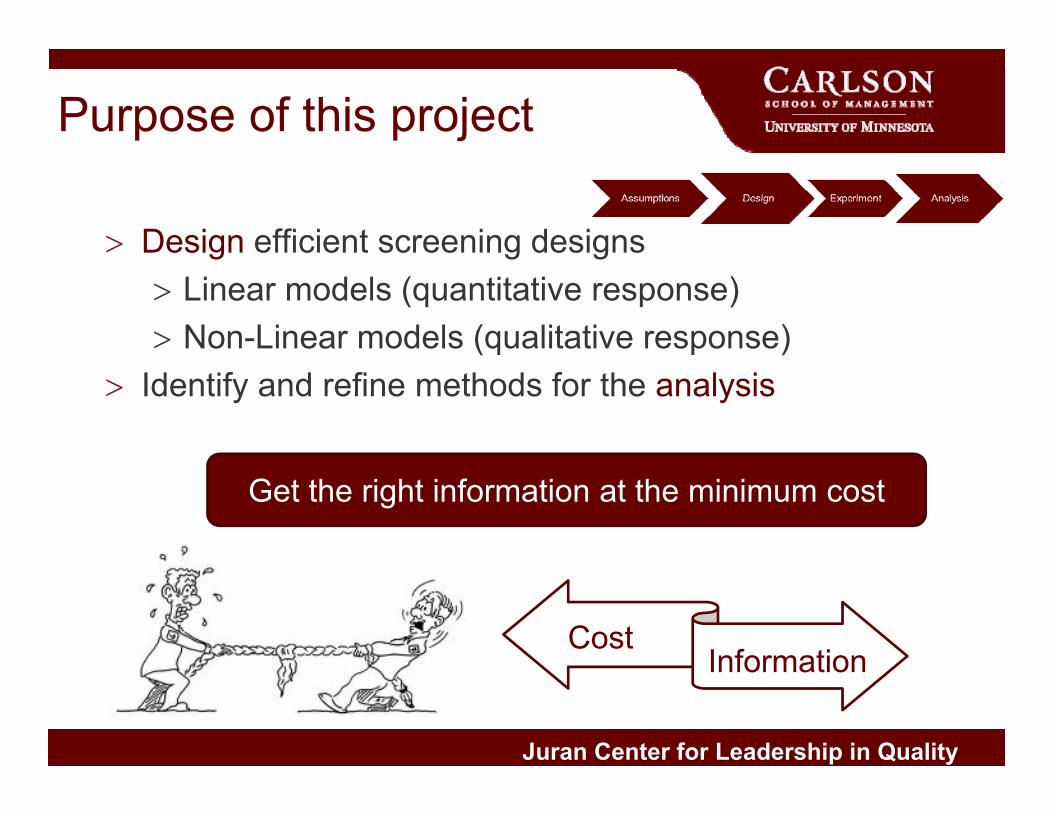
Design efficient screening designs Linear models (quantitative response) Non-Linear models (qualitative response)
Identify and refine methods for the analysis
Purpose of this project
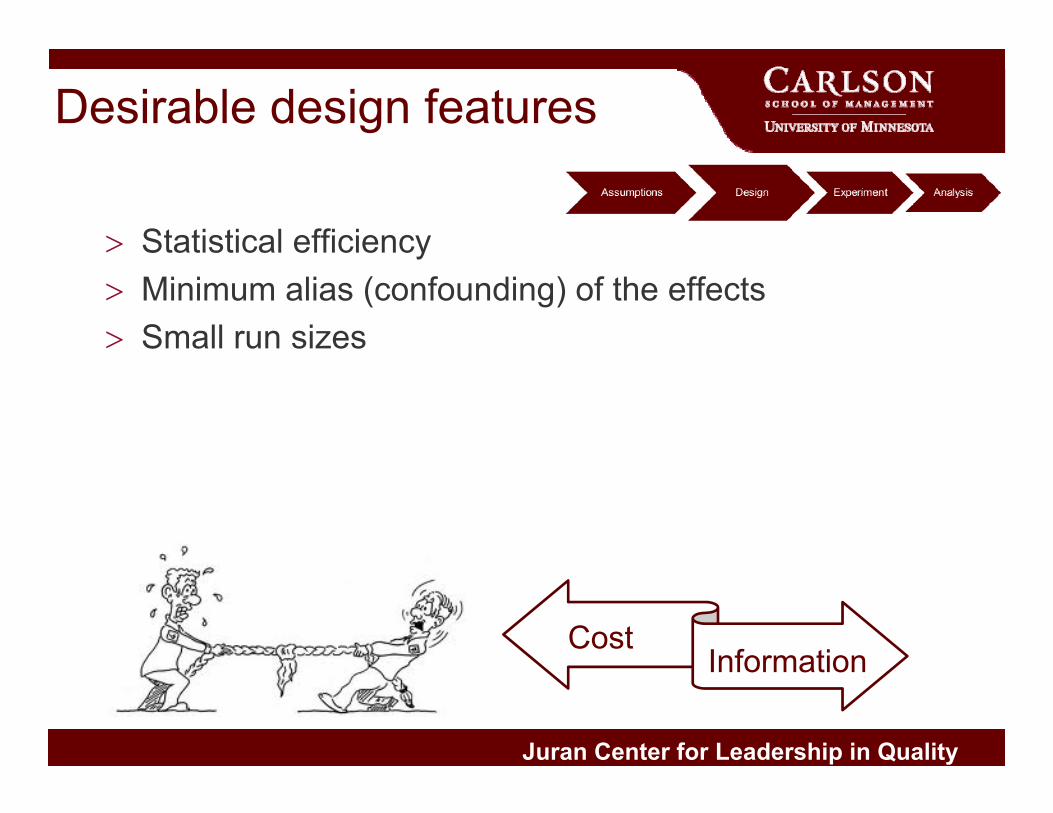
CostInformation
Get the right information at the minimum cost
Juran Center for Leadership in Quality
Over reliance on a single model
Optimal design depends on a pre-stated model
Full Factorial designs optimal for full-factorial model
Screening designs assume only first-order effects active(resolution III fractional factorial, Plackett Burman designs)
If higher order effects are active results may be misleading
Juran Center for Leadership in Quality
Statistical efficiency Minimum alias (confounding) of the effects Small run sizes
Desirable design features
CostInformation

Juran Center for Leadership in Quality
Definitive screening designs
Jones, B., & Nachtsheim, C. J. (2011) A Class of Three-Level Designs for Definitive Screening in the Presence of Second-Order Effects, Journal of Quality Technology 43(1), 1-15.
2012 ASQ Brumbaugh Award
2012 Lloyd S. Nelson
Juran Center for Leadership in Quality
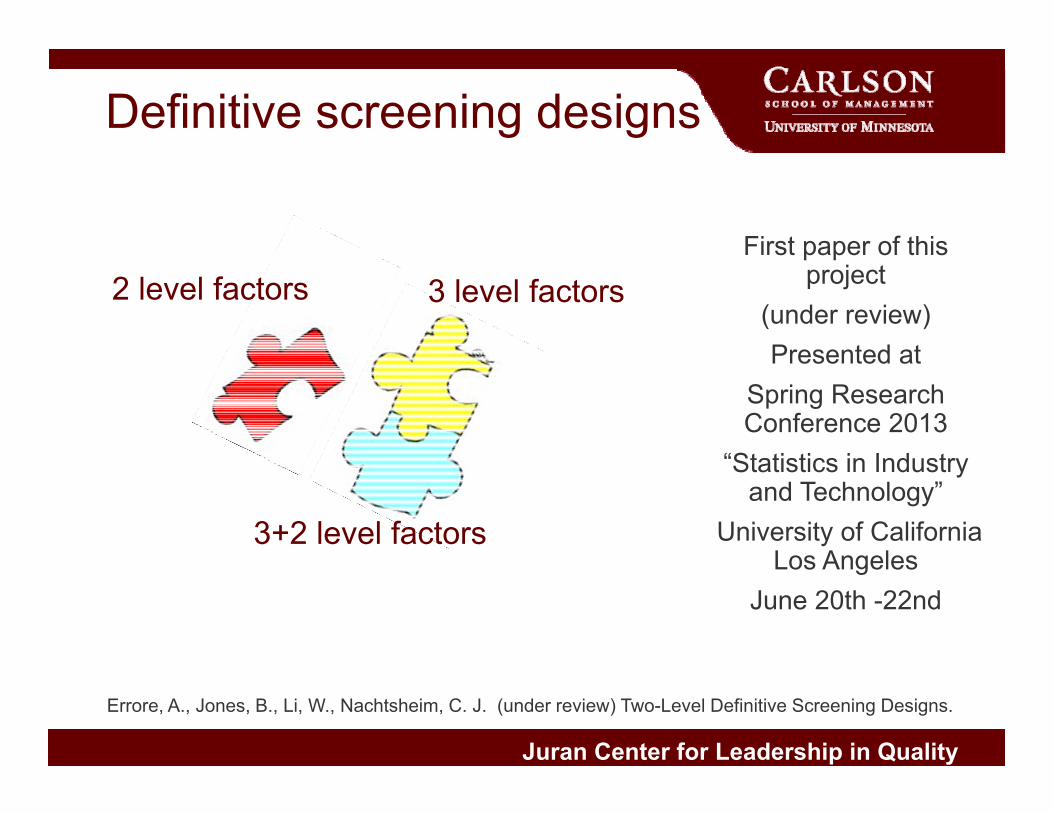
Definitive screening designs
Errore, A., Jones, B., Li, W., Nachtsheim, C. J. (under review) Two-Level Definitive Screening Designs.
2 level factors
3+2 level factors
3 level factorsFirst paper of this
project(under review)Presented at
Spring Research Conference 2013
“Statistics in Industry and Technology”
University of California Los Angeles
June 20th -22nd
Juran Center for Leadership in Quality
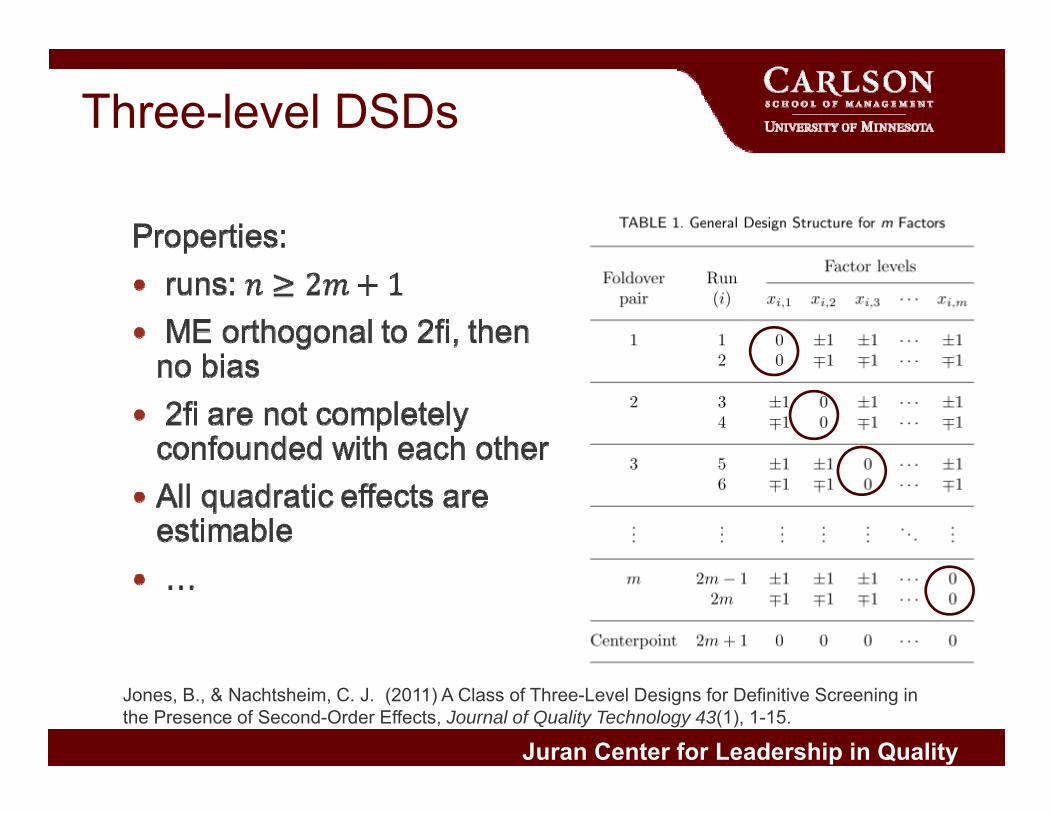
Three-level DSDs
Jones, B., & Nachtsheim, C. J. (2011) A Class of Three-Level Designs for Definitive Screening in the Presence of Second-Order Effects, Journal of Quality Technology 43(1), 1-15.
Juran Center for Leadership in Quality
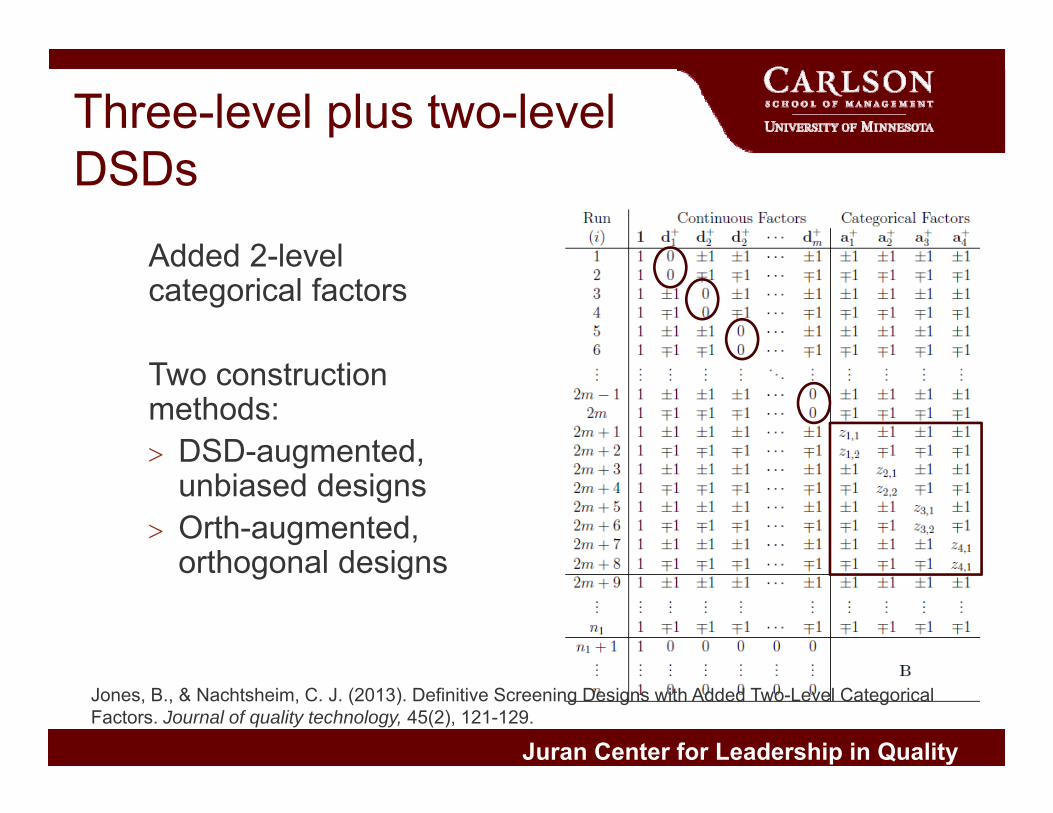
Jones, B., & Nachtsheim, C. J. (2013). Definitive Screening Designs with Added Two-Level Categorical Factors. Journal of quality technology, 45(2), 121-129.
Three-level plus two-level DSDs
Added 2-level categorical factors
Two construction methods: DSD-augmented,
unbiased designs Orth-augmented,
orthogonal designs
Juran Center for Leadership in Quality
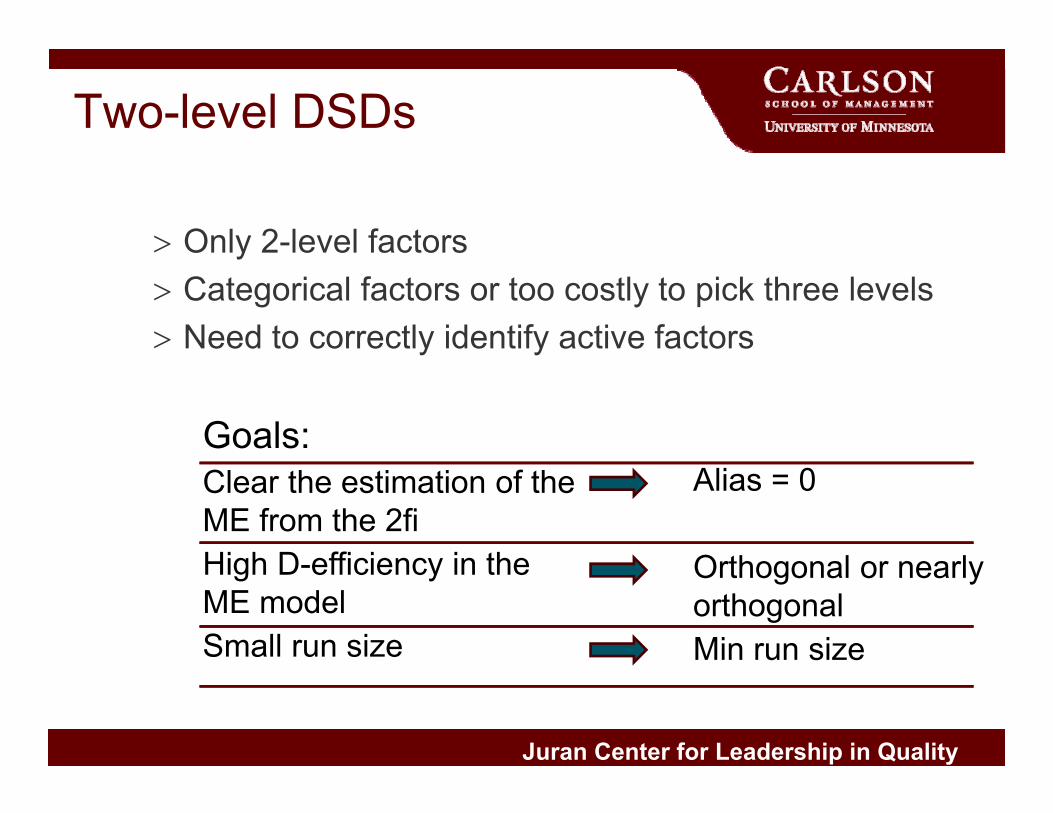
Goals:Clear the estimation of the ME from the 2fiHigh D-efficiency in the ME modelSmall run size
Alias = 0
Orthogonal or nearly orthogonalMin run size
Only 2-level factors Categorical factors or too costly to pick three levels Need to correctly identify active factors
Two-level DSDs
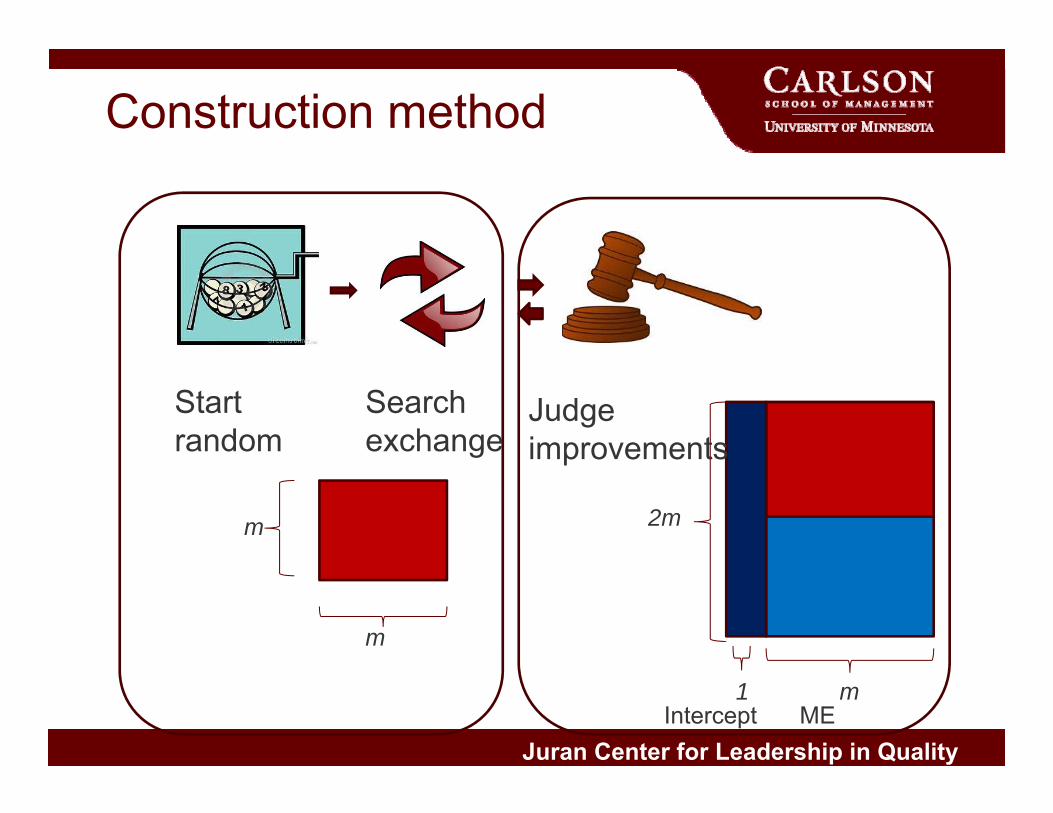
Juran Center for Leadership in QualityIntercept ME
2m
1 m
Construction method
m
m
Start random
Search exchange
Judge improvements
Juran Center for Leadership in Quality
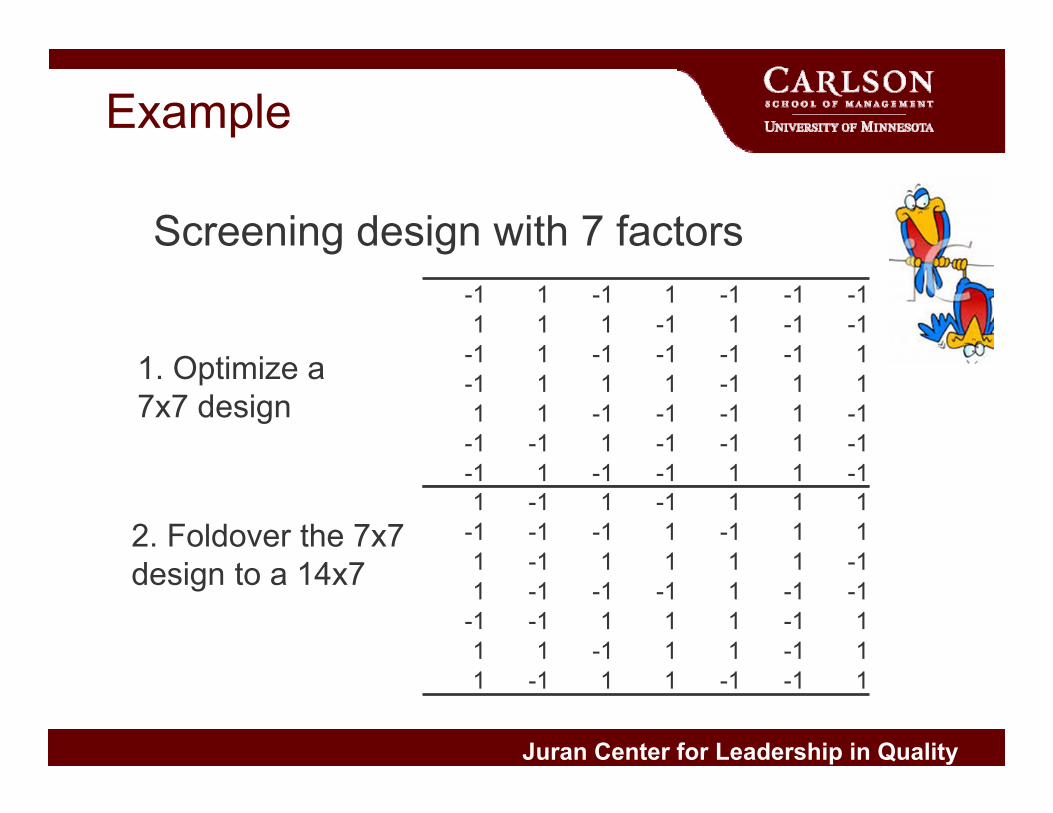
Example
-1 1 -1 1 -1 -1 -11 1 1 -1 1 -1 -1
-1 1 -1 -1 -1 -1 1-1 1 1 1 -1 1 11 1 -1 -1 -1 1 -1
-1 -1 1 -1 -1 1 -1-1 1 -1 -1 1 1 -11 -1 1 -1 1 1 1
-1 -1 -1 1 -1 1 11 -1 1 1 1 1 -11 -1 -1 -1 1 -1 -1
-1 -1 1 1 1 -1 11 1 -1 1 1 -1 11 -1 1 1 -1 -1 1
1. Optimize a 7x7 design
2. Foldover the 7x7 design to a 14x7
Screening design with 7 factors
Juran Center for Leadership in Quality
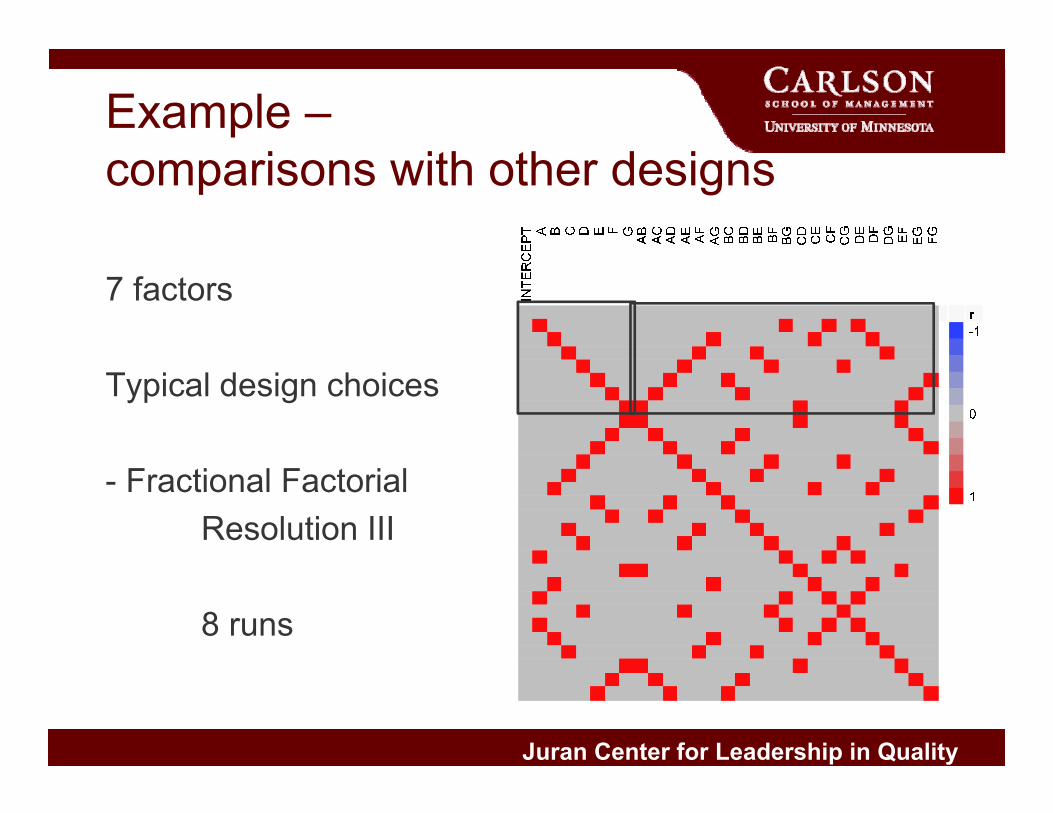
Example –comparisons with other designs
7 factors
Typical design choices
- Fractional FactorialResolution III
8 runs
Juran Center for Leadership in Quality
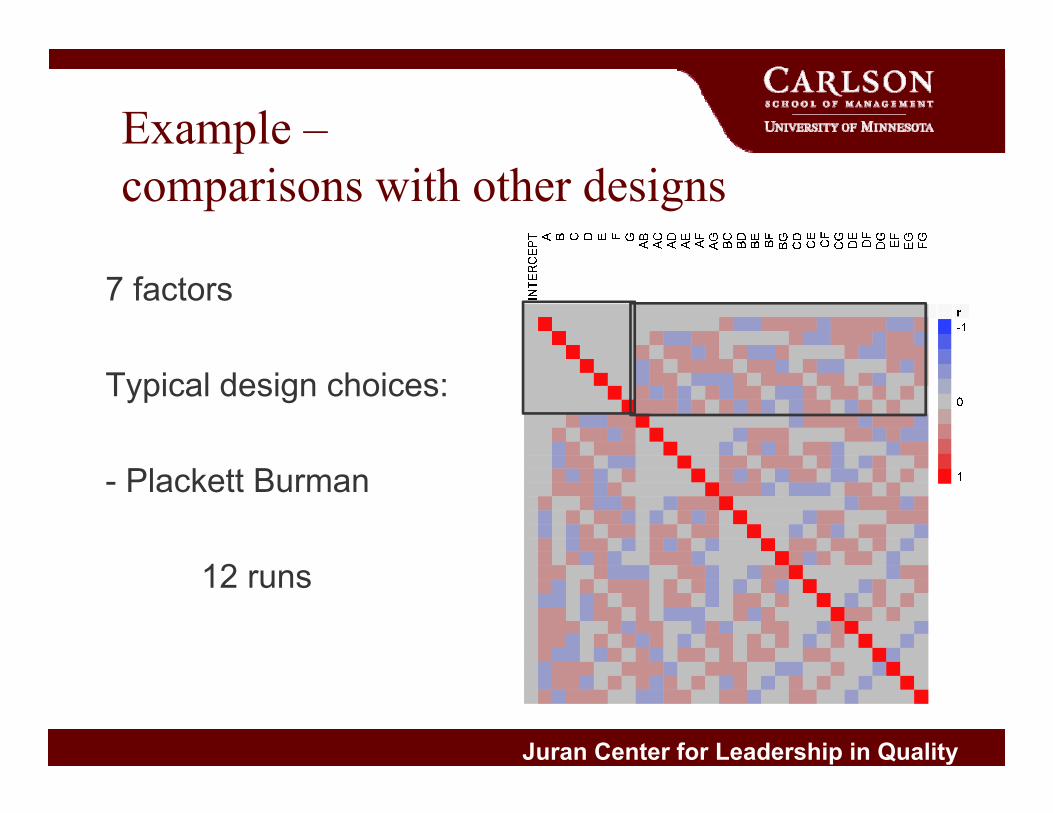
7 factors
Typical design choices:
- Plackett Burman
12 runs
Example –comparisons with other designs
Juran Center for Leadership in Quality
Example
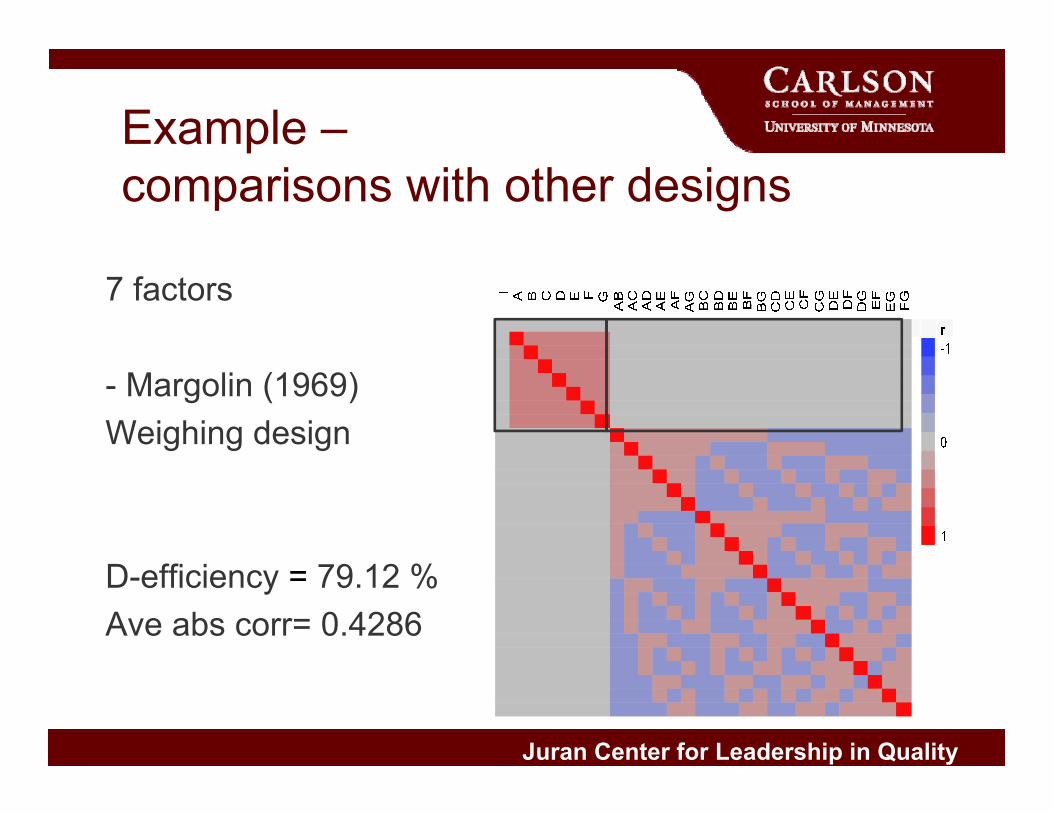
7 factors
- Margolin (1969)Weighing design
D-efficiency = 79.12 % Ave abs corr= 0.4286
Example –comparisons with other designs
Juran Center for Leadership in Quality
Example
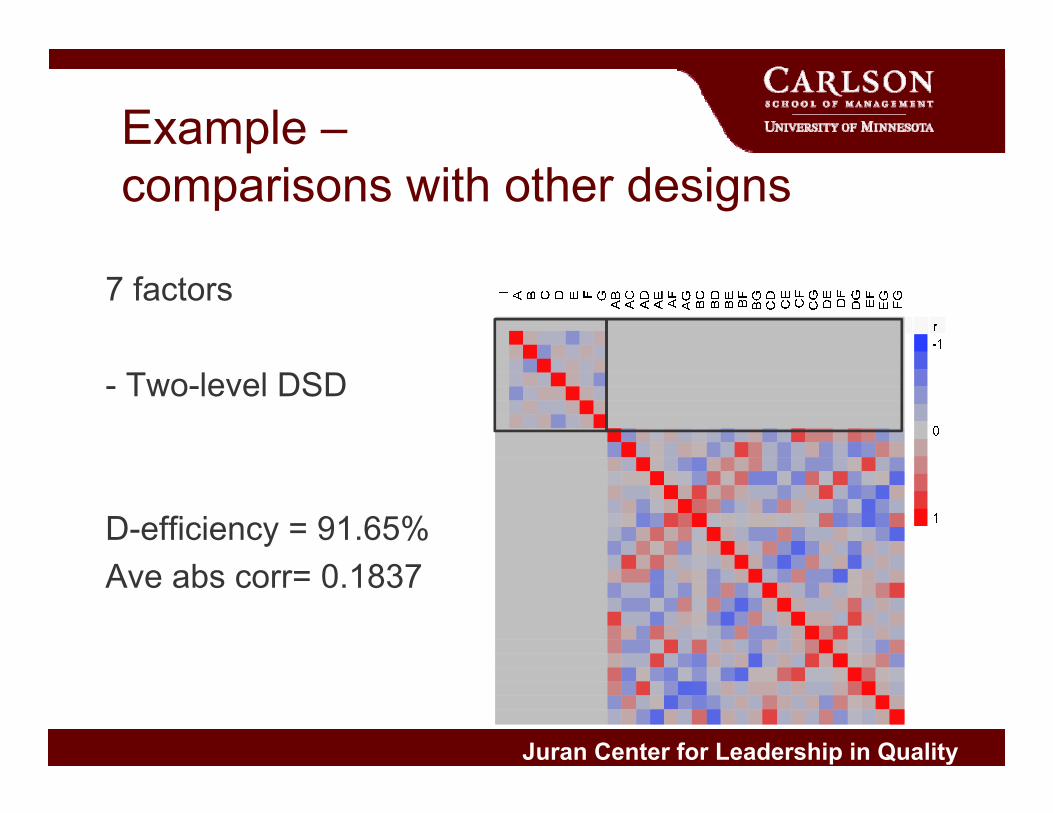
7 factors
- Two-level DSD
D-efficiency = 91.65% Ave abs corr= 0.1837
Example –comparisons with other designs
Juran Center for Leadership in Quality
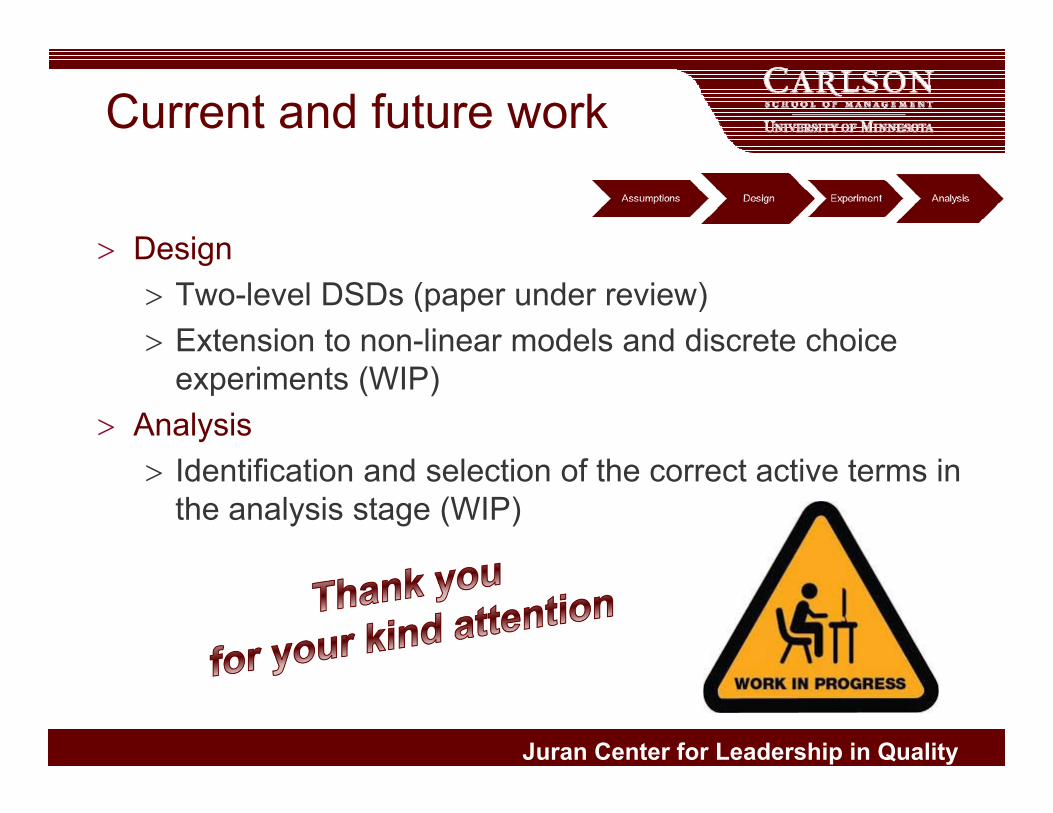
Current and future work
Design Two-level DSDs (paper under review) Extension to non-linear models and discrete choice
experiments (WIP) Analysis
Identification and selection of the correct active terms in the analysis stage (WIP)

Juran Center for Leadership in Quality
LEARNING FROM HIGH TECH INNOVATION FAILURES:APPLICATION OF ‘BIG DATA’ PREDICTIVE ANALYTICS ON MEDICAL DEVICE FAILURES
Ujjal Kumar MukherjeePhD Student, Carlson School of Management, UMN
Kingshuk K. SinhaProfessor, Mosaic Company Professor of Corporate Responsibility
Supply Chain & Operations, Carlson School of Management, UMN
March 11th, 2014
Juran Center for Leadership in QualityJuran Center for Leadership in Quality
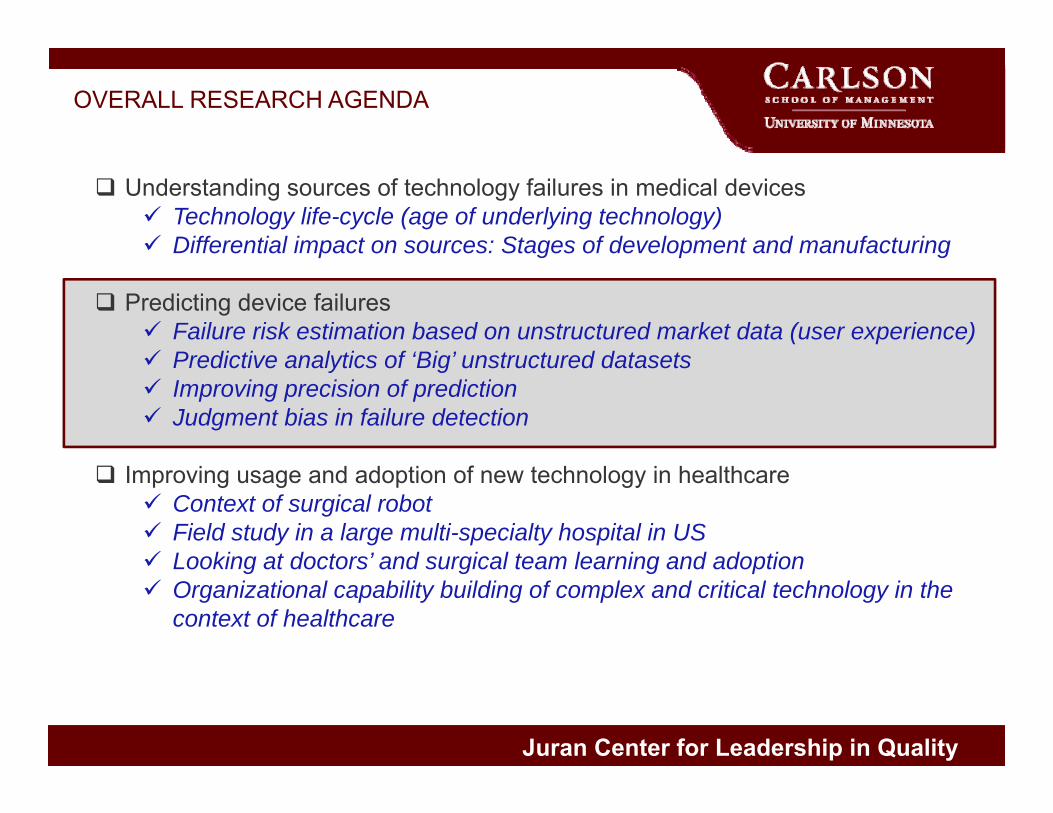
OVERALL RESEARCH AGENDA
Understanding sources of technology failures in medical devices Technology life-cycle (age of underlying technology) Differential impact on sources: Stages of development and manufacturing
Predicting device failures Failure risk estimation based on unstructured market data (user experience) Predictive analytics of ‘Big’ unstructured datasets Improving precision of prediction Judgment bias in failure detection
Improving usage and adoption of new technology in healthcare Context of surgical robot Field study in a large multi-specialty hospital in US Looking at doctors’ and surgical team learning and adoption Organizational capability building of complex and critical technology in the
context of healthcare
Juran Center for Leadership in QualityJuran Center for Leadership in Quality
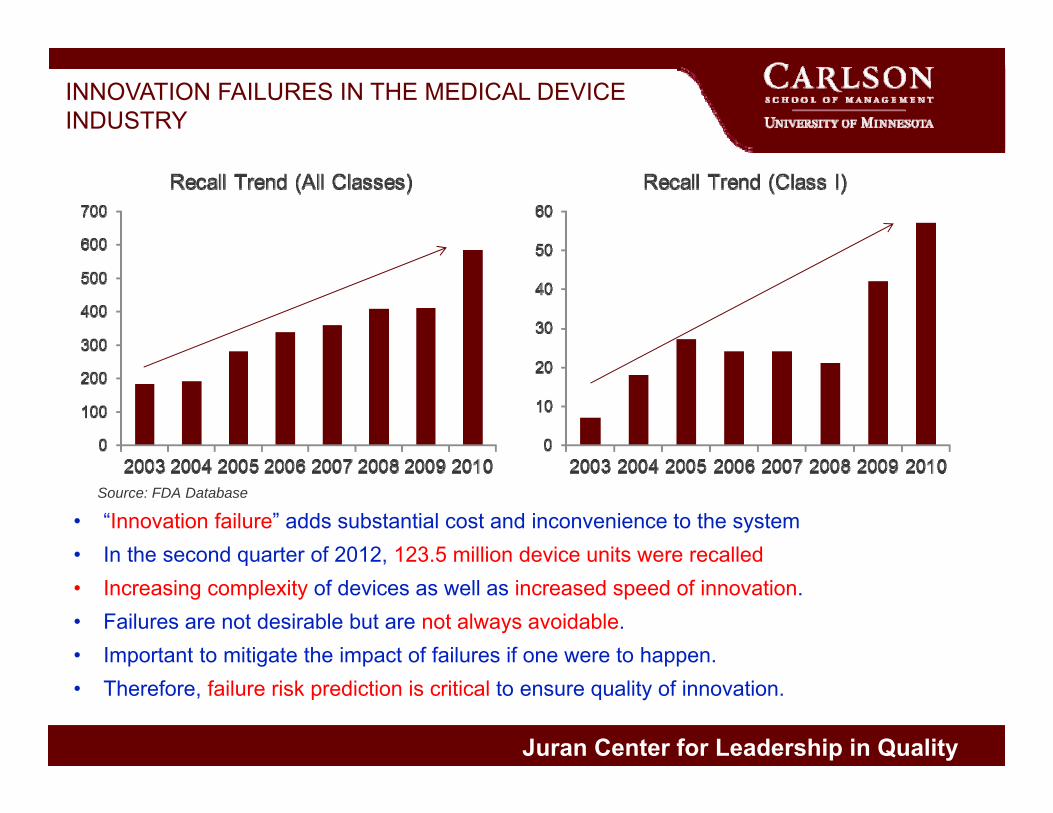
INNOVATION FAILURES IN THE MEDICAL DEVICE INDUSTRY
Source: FDA Database
• “Innovation failure” adds substantial cost and inconvenience to the system• In the second quarter of 2012, 123.5 million device units were recalled • Increasing complexity of devices as well as increased speed of innovation. • Failures are not desirable but are not always avoidable. • Important to mitigate the impact of failures if one were to happen. • Therefore, failure risk prediction is critical to ensure quality of innovation.
Juran Center for Leadership in QualityJuran Center for Leadership in Quality
OBJECTIVES OF THE RESEARCH
In this study we are using a large unstructured dataset and BIG DATA analytics to build a PREDICTIVE MODEL of failure risk of high tech innovations.
Research Questions:
Do field failure data provide a credible signal for early detection and prediction of innovation failure risk? (Prediction)
What technology, firm or industry factors individually and in combination can improve the precision of prediction of innovation failure risk? (Precision)
Do firms systematically exhibit a judgment bias in interpreting signals related to innovation failures? What factors influence the judgment bias, if present? (Consistency)
Juran Center for Leadership in QualityJuran Center for Leadership in Quality
FAILURE PREDICTION: USING SIGNAL DETECTION THEORY
Rate of adverse effects reported by users as signal of failure
Under normal working conditions some adverse effect reports are likely - Noise
However, systematic failures lead to abnormal adverse effect rate - Signal
The idea is to monitor market reports on an ongoing basis
Build predictive risk models for device failures
Classify user reports into likelihood of device failures
Statistically, separating the Signal from Noise is important.
Juran Center for Leadership in QualityJuran Center for Leadership in Quality
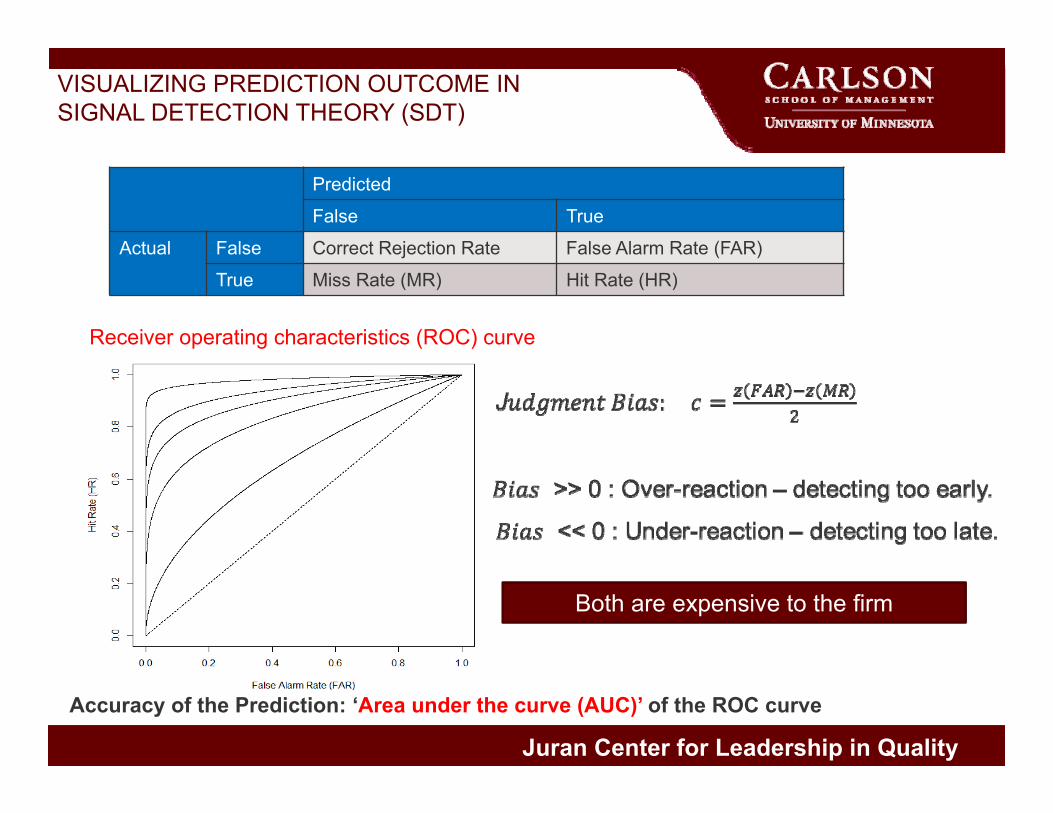
VISUALIZING PREDICTION OUTCOME IN SIGNAL DETECTION THEORY (SDT)
Predicted
False True
Actual False Correct Rejection Rate False Alarm Rate (FAR)
True Miss Rate (MR) Hit Rate (HR)
Accuracy of the Prediction: ‘Area under the curve (AUC)’ of the ROC curve
Receiver operating characteristics (ROC) curve
Both are expensive to the firm
Juran Center for Leadership in QualityJuran Center for Leadership in Quality
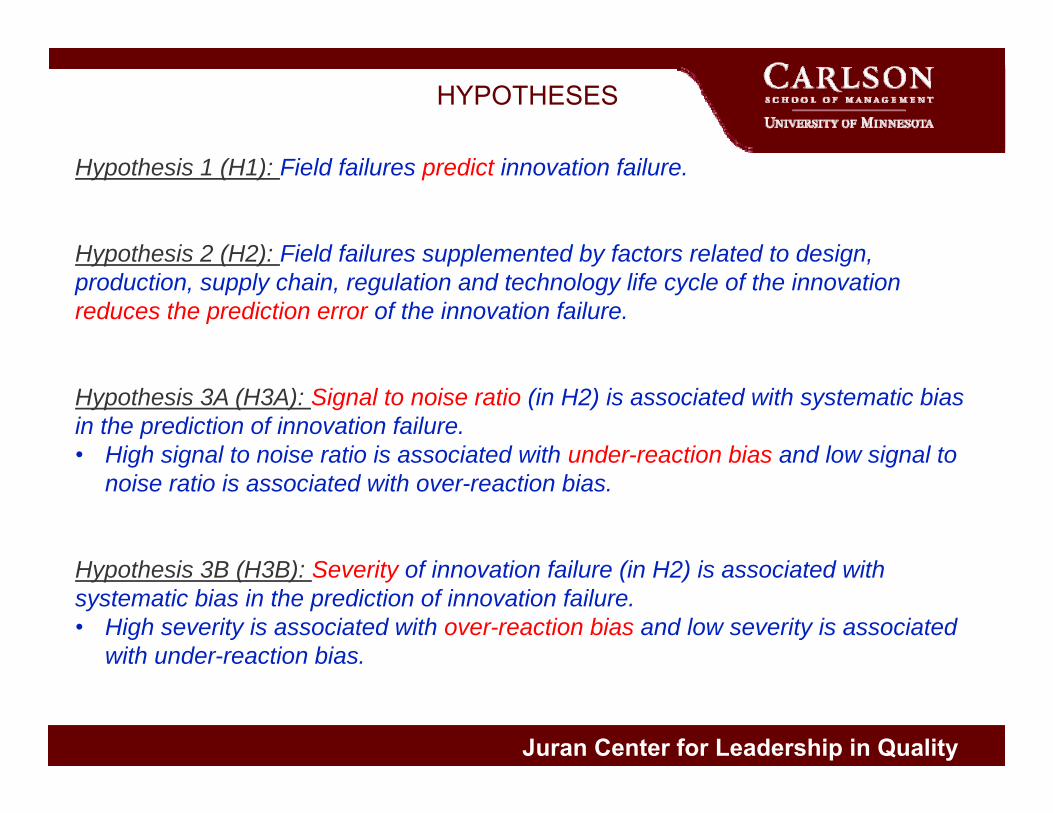
HYPOTHESES
Hypothesis 1 (H1): Field failures predict innovation failure.
Hypothesis 2 (H2): Field failures supplemented by factors related to design, production, supply chain, regulation and technology life cycle of the innovation reduces the prediction error of the innovation failure.
Hypothesis 3A (H3A): Signal to noise ratio (in H2) is associated with systematic bias in the prediction of innovation failure. • High signal to noise ratio is associated with under-reaction bias and low signal to
noise ratio is associated with over-reaction bias.
Hypothesis 3B (H3B): Severity of innovation failure (in H2) is associated with systematic bias in the prediction of innovation failure. • High severity is associated with over-reaction bias and low severity is associated
with under-reaction bias.
Juran Center for Leadership in QualityJuran Center for Leadership in Quality
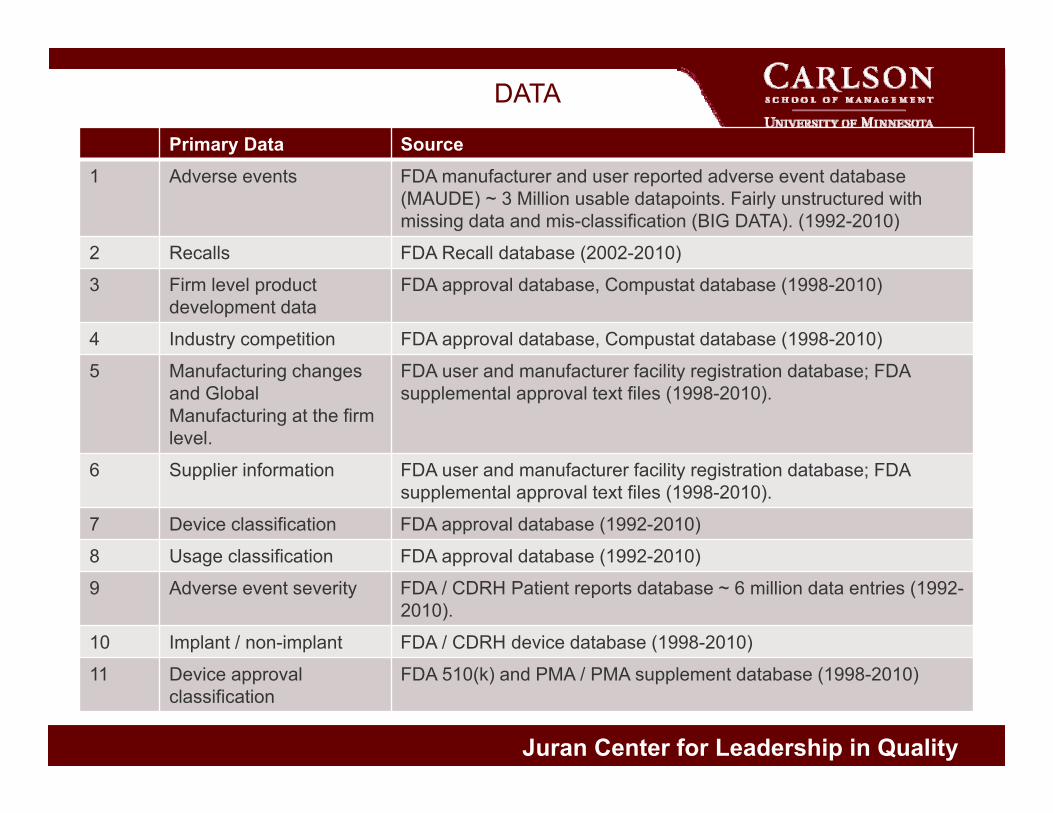
DATA
Primary Data Source1 Adverse events FDA manufacturer and user reported adverse event database
(MAUDE) ~ 3 Million usable datapoints. Fairly unstructured with missing data and mis-classification (BIG DATA). (1992-2010)
2 Recalls FDA Recall database (2002-2010)
3 Firm level product development data
FDA approval database, Compustat database (1998-2010)
4 Industry competition FDA approval database, Compustat database (1998-2010)
5 Manufacturing changes and Global Manufacturing at the firm level.
FDA user and manufacturer facility registration database; FDA supplemental approval text files (1998-2010).
6 Supplier information FDA user and manufacturer facility registration database; FDA supplemental approval text files (1998-2010).
7 Device classification FDA approval database (1992-2010)
8 Usage classification FDA approval database (1992-2010)
9 Adverse event severity FDA / CDRH Patient reports database ~ 6 million data entries (1992-2010).
10 Implant / non-implant FDA / CDRH device database (1998-2010)
11 Device approval classification
FDA 510(k) and PMA / PMA supplement database (1998-2010)
Juran Center for Leadership in QualityJuran Center for Leadership in Quality
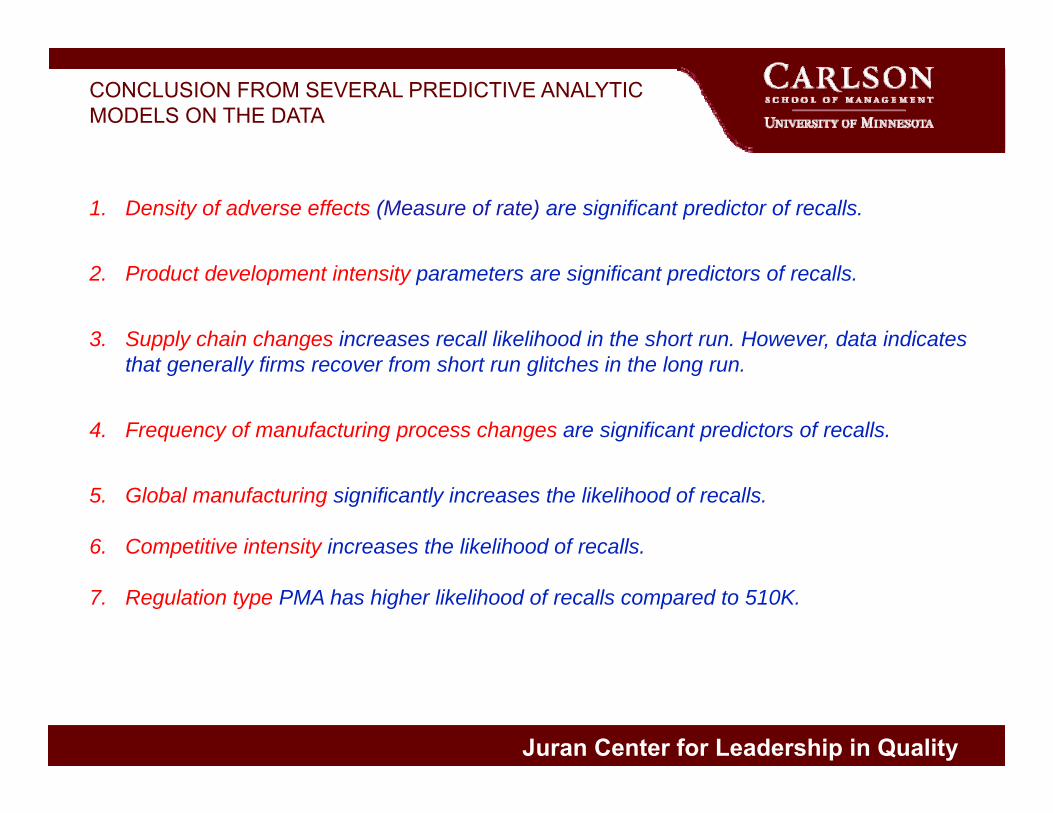
CONCLUSION FROM SEVERAL PREDICTIVE ANALYTIC MODELS ON THE DATA
1. Density of adverse effects (Measure of rate) are significant predictor of recalls.
2. Product development intensity parameters are significant predictors of recalls.
3. Supply chain changes increases recall likelihood in the short run. However, data indicates that generally firms recover from short run glitches in the long run.
4. Frequency of manufacturing process changes are significant predictors of recalls.
5. Global manufacturing significantly increases the likelihood of recalls.
6. Competitive intensity increases the likelihood of recalls.
7. Regulation type PMA has higher likelihood of recalls compared to 510K.
Juran Center for Leadership in Quality
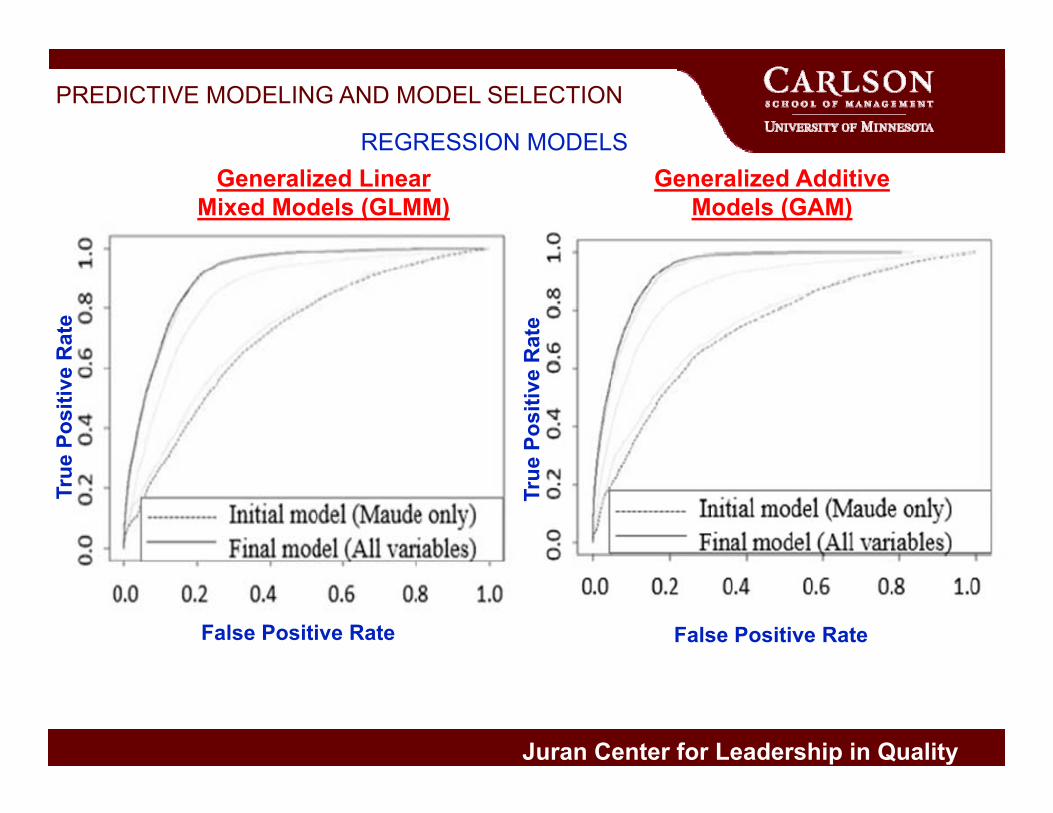
PREDICTIVE MODELING AND MODEL SELECTION
Generalized Linear Mixed Models (GLMM)
Generalized Additive Models (GAM)
False Positive Rate
True
Pos
itive
Rat
e
True
Pos
itive
Rat
e
False Positive Rate
REGRESSION MODELS
Juran Center for Leadership in Quality
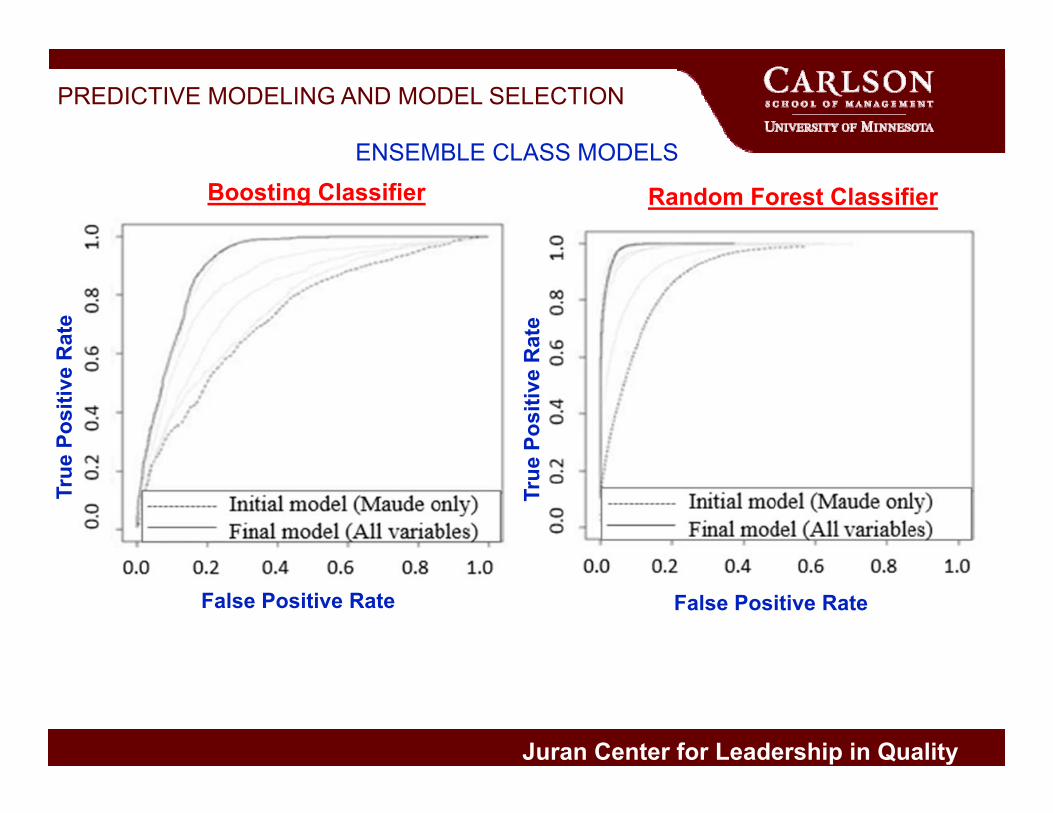
PREDICTIVE MODELING AND MODEL SELECTION
ENSEMBLE CLASS MODELS
False Positive Rate
True
Pos
itive
Rat
e
True
Pos
itive
Rat
e
False Positive Rate
Boosting Classifier Random Forest Classifier
Juran Center for Leadership in Quality
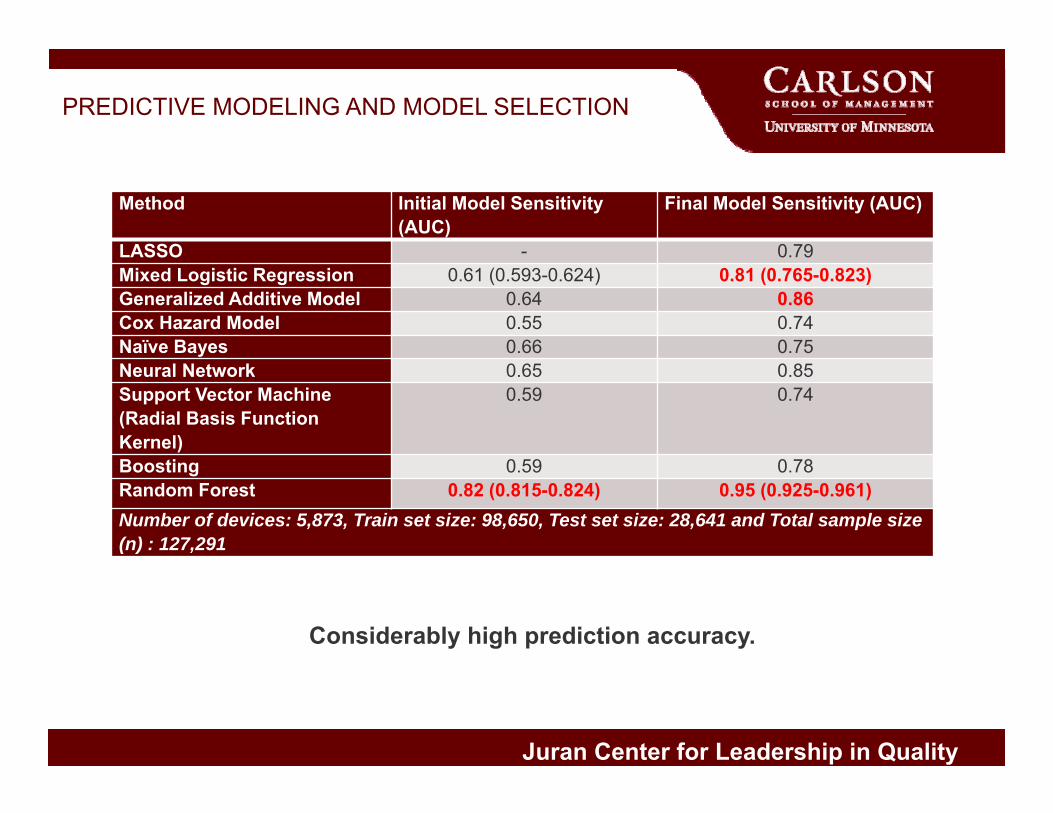
PREDICTIVE MODELING AND MODEL SELECTION
Method Initial Model Sensitivity (AUC)
Final Model Sensitivity (AUC)
LASSO - 0.79Mixed Logistic Regression 0.61 (0.593-0.624) 0.81 (0.765-0.823)Generalized Additive Model 0.64 0.86Cox Hazard Model 0.55 0.74Naïve Bayes 0.66 0.75Neural Network 0.65 0.85Support Vector Machine (Radial Basis Function Kernel)
0.59 0.74
Boosting 0.59 0.78Random Forest 0.82 (0.815-0.824) 0.95 (0.925-0.961)Number of devices: 5,873, Train set size: 98,650, Test set size: 28,641 and Total sample size (n) : 127,291
Considerably high prediction accuracy.
Juran Center for Leadership in QualityJuran Center for Leadership in Quality
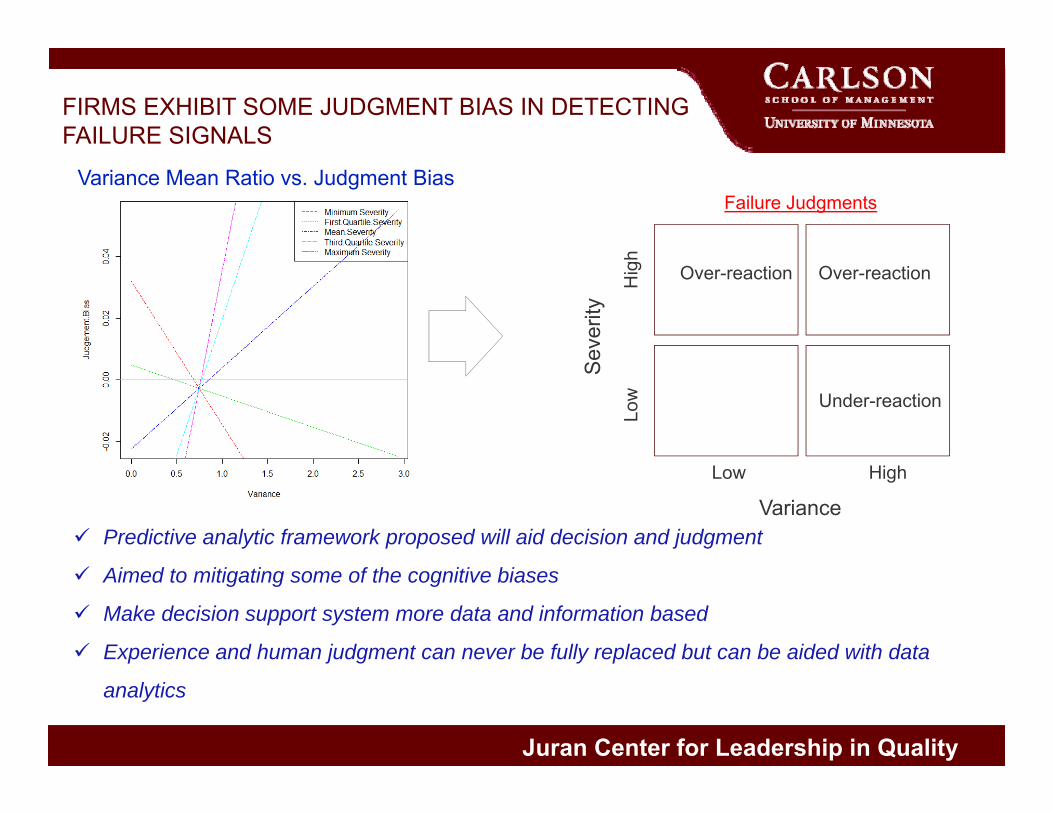
Variance
Seve
rity
Low High
Low
Hig
h
Under-reaction
Over-reactionOver-reaction
Failure JudgmentsVariance Mean Ratio vs. Judgment Bias
FIRMS EXHIBIT SOME JUDGMENT BIAS IN DETECTING FAILURE SIGNALS
Predictive analytic framework proposed will aid decision and judgment
Aimed to mitigating some of the cognitive biases
Make decision support system more data and information based
Experience and human judgment can never be fully replaced but can be aided with data
analytics
Juran Center for Leadership in Quality
CONCLUSIONS
1. We have shown that it is possible to predict innovation failures with fairly high degree of accuracy.
2. We have also been able to analyze the influence of some critical covariates in improving the accuracy of predicting innovation failure.
3. We have shown that judgment bias exists in managing innovation failure.
4. Use of data analytic decision support can help improve precision of failure detection and mitigate judgment bias to a considerable extent.

Juran Center for Leadership in QualityJuran Center for Leadership in Quality
ACKNOWLEDGEMENTS
Juran Center Dissertation Grant, 2013
Social and Business Analytic Collaboration (SOBACO), UMN Grant, 2013
American Hospital Association Grant, 2012
Dissertation Fellowship, Carlson School, UMN, 2014

Juran Center for Leadership in QualityJuran Center for Leadership in Quality
THANK YOU

Juran Center for Leadership in Quality
Juran Fellowship Award
WewelcomeyourParticipation!
Kevin [email protected]