TALLINNA KAUBAMAJA GRUPP AS - GlobeNewswire
36
TALLINNA KAUBAMAJA GRUPP AS Consolidated Interim Report for the Fourth quarter and 12 months of 2018 (unaudited)
Transcript of TALLINNA KAUBAMAJA GRUPP AS - GlobeNewswire

TALLINNA KAUBAMAJA GRUPP AS
Consolidated Interim Report for
the Fourth quarter and 12 months of 2018 (unaudited)

Tallinna Kaubamaja Grupp AS
Consolidated Interim Report for the Fourth quarter and 12 months of 2018 (unaudited)
2
Table of contents
MANAGEMENT REPORT ............................................................................................................................................. 4 CONDENSED CONSOLIDATED FINANCIAL STATEMENTS.................................................................................... 12
MANAGEMENT BOARD’S CONFIRMATION TO THE CONDENSED CONSOLIDATED FINANCIAL
STATEMENTS .............................................................................................................................................. 12 CONDENSED CONSOLIDATED STATEMENT OF FINANCIAL POSITION ................................................ 13 CONDENSED CONSOLIDATED STATEMENT OF PROFIT OR LOSS AND OTHER COMPREHENSIVE
INCOME 14 CONDENSED CONSOLIDATED CASH FLOW STATEMENT ...................................................................... 15 CONDENSED CONSOLIDATED STATEMENT OF CHANGES IN OWNERS’ EQUITY ............................... 16 NOTES TO THE CONDENSED CONSOLIDATED INTERIM ACCOUNTS .................................................. 17
Note 1. Accounting Principles Followed upon Preparation of the Condensed Consolidated Interim
Accounts ........................................................................................................................................................... 17
Note 2. Cash and cash equivalents ............................................................................................................... 20
Note 3. Trade and other receivables ............................................................................................................. 20
Note 4. Trade receivables ............................................................................................................................... 20
Note 5. Inventories .......................................................................................................................................... 20
Note 6. Subsidiaries ........................................................................................................................................ 21
Note 7. Investments in associates ................................................................................................................. 22
Note 8. Long-term trade and other receivables ............................................................................................ 22
Note 9. Investment property .......................................................................................................................... 22
Note 10. Property, plant and equipment ...................................................................................................... 24
Note 11. Intangible assets .............................................................................................................................. 26
Note 12. Borrowings ....................................................................................................................................... 27
Note 13. Trade and other payables ............................................................................................................... 28
Note 14. Taxes................................................................................................................................................. 29
Note 15. Share capital .................................................................................................................................... 29
Note 16. Segment reporting ........................................................................................................................... 29
Note 17. Other operating expenses ............................................................................................................... 34
Note 18. Staff costs ........................................................................................................................................ 34
Note 19. Earnings per share .......................................................................................................................... 35
Note 20. Related party transactions .............................................................................................................. 35
Tallinna Kaubamaja Grupp AS
Consolidated Interim Report for the Fourth quarter and 12 months of 2018 (unaudited)
3
COMPANY PROFILE AND CONTACT DETAILS
The primary areas of activity of the companies of the Tallinna Kaubamaja Grupp AS (hereinafter referred to
as the ‘Tallinna Kaubamaja Group’ or ‘the Group’) include retail and wholesale trade and rental activities.
The Tallinna Kaubamaja Group employs more than 4,200 employees.
The Company is listed on the Tallinn Stock Exchange.
Registered office: Kaubamaja 1
10143 Tallinn
Republic of Estonia
Registry code: 10223439
Beginning of financial year: 1 January 2018
End of financial year: 31 December 2018
Beginning of interim report period: 1 January 2018
End of interim report period: 31 December 2018
Auditor: PricewaterhouseCoopers AS
Telephone: 372 667 3200
Fax: 372 667 3205
E-mail: [email protected]

Tallinna Kaubamaja Grupp AS
Consolidated Interim Report for the Fourth quarter and 12 months of 2018 (unaudited)
4
MANAGEMENT REPORT
The primary areas of activity of the companies of the Tallinna Kaubamaja Group include retail and wholesale
trade and rental activities.
Management
In order to manage the Tallinna Kaubamaja Group the general meeting of the shareholders, held at least
once in a year, elects supervisory board, which according to the articles of association may have 3 to 6
members. Members of the Tallinna Kaubamaja Group supervisory board are Jüri Käo (chairman of the
supervisory board), Andres Järving, Enn Kunila, Gunnar Kraft and Meelis Milder. Members of Tallinna
Kaubamaja Group supervisory board are elected for three years. The mandates of current supervisory board
members Andres Järving, Jüri Käo, Enn Kunila, Meelis Milder and Gunnar Kraft will expire on 19 May 2021.
During the period between the general meetings the supervisory board plans actions of the company,
organises management and accomplishes supervision over management actions. Regular supervisory board
meetings are held at least 10 times in a year. In order to manage daily activities the supervisory board
appoints member(s) of the management board of the Tallinna Kaubamaja Group in accordance with the
Commercial Code. In order to elect a member of the management board, his or her consent is required. By
the articles of association a member of the management board shall be elected for a specified term of three
years. Extension of the term of office of a member of the management board shall not be decided earlier
than one year before the planned date of expiry of the term of office, and not for a period longer than the
maximum term of office prescribed by the articles of association. Currently the management board of
Tallinna Kaubamaja Group has one member. The term of office of the management board member Raul
Puusepp was extended on 17 February 2017 and his term of office expires on 6 March 2020.
The law, the articles of association, decisions and goals stated by the shareholders and supervisory board
are followed for managing the company. By Commercial Code a resolution on amendment of the articles of
association shall be adopted, if at least two-third of the votes represented at a general meeting is in favour.
A resolution on amendment of the articles of association shall enter into force as of making of a corresponding
entry in the commercial register. The articles of association of the Tallinna Kaubamaja Group prescribe no
greater majority requirement and the public limited company does not possess several classes of shares.
Share market
Since 19 August 1997, the shares of Tallinna Kaubamaja Group have been listed in the main list of securities
of the Tallinn Stock Exchange. Tallinna Kaubamaja Group has issued 40,729.2 thousand registered shares,
each with the nominal value of 0.40 euros. The shares are freely transferable, no statutory restrictions apply.
There are no restrictions on transfer of securities to the company as provided by contracts between the
company and its shareholders. We do not have information about contracts between the shareholders
restricting the transfer of securities. NG Investeeringud OÜ has direct significant participation. Shares
granting special rights to their owners have not been issued.
The members of the management board of Tallinna Kaubamaja Group have no right to issue or buy back
shares. In addition, there are no commitments between the company and its employees providing for
compensation in mergers and acquisitions under article 19’ of Stock Market Trade Act.
The share with a price of 9.20 euros at the end of 2017 was closed in the end of December 2018 at the level
of 8.42 euros, fell by 8.48% a year-end following the pace of global stock markets.
According to the notice of regular annual general meeting of the shareholders published on 26 February
2018, the management board proposed to pay dividends 0.69 euros per share. The general meeting of
shareholders approved it.

Tallinna Kaubamaja Grupp AS
Consolidated Interim Report for the Fourth quarter and 12 months of 2018 (unaudited)
5
Share price and trading statistics on the Tallinn Stock Exchange from 01.01.2018 to 31.12.2018.
In euros
Company’s structure
The following companies belong to the group as of December 31, 2018:
Location Shareholding as of
31.12.2018
Shareholding as of
31.12.2017
Selver AS Estonia 100% 100%
Kulinaaria OÜ Estonia 100% 100%
Kaubamaja AS Estonia 100% 100%
Viking Security AS Estonia 100% 100%
Tartu Kaubamaja Kinnisvara OÜ Estonia 100% 100%
Tallinna Kaubamaja Kinnisvara AS Estonia 100% 100%
TKM Lietuva UAB Lithuania 100% 100%
SIA TKM Latvija Latvia 100% 100%
Selver Latvia SIA Latvia 0% 100%
TKM Auto OÜ Estonia 100% 100%
KIA Auto AS Estonia 100% 100%
KIA Auto UAB Lithuania 100% 100%
Forum Auto SIA Latvia 100% 100%
Verte Auto SIA Latvia 100% 100%
Viking Motors AS Estonia 100% 100%
OÜ TKM Beauty Estonia 100% 100%
OÜ TKM Beauty Eesti Estonia 100% 100%
AS TKM King Estonia 100% 100%
Rävala Parkla AS Estonia 50% 50%

Tallinna Kaubamaja Grupp AS
Consolidated Interim Report for the Fourth quarter and 12 months of 2018 (unaudited)
6
Economic development
In the third quarter of 2018, the gross domestic product grew by 4.2% in Estonia compared to the same
quarter of the previous year. As in previous quarters, the main contributor to the growth of the GDP was the
construction sector. The economic growth was primarily decelerated due to the decrease of added value in
agriculture, forest management, and fisheries. The growth in consumption attributed to the growth of wages
and changes in the income tax regulation was lower than expected in 2018. Savings of private persons,
however, grew by around 10%. Macroeconomic analysts have forecast economic growth to be 3.5% in 2018.
For 2019, analysts forecast the deceleration of economic growth down to 2.0% because of a labour deficit
and growing wages that will result in the loss of competitive edge of companies, especially in export. The
consumer price index grew 3.7% in the fourth quarter of 2018 and 3.4% annually. The price growth of food
and non-alcoholic beverages decelerated down to 2.1% in the fourth quarter; however, the annual result was
3.1%. The price growth of clothes and footwear accelerated at the end of the year, showing 1.8% in the fourth
quarter, and the prices of this group of goods increased by 0.8% in a year. The prices of alcoholic beverages
and tobacco increased the fastest (8.6%) in 2018. It is expected that the growth of prices will stop at 2.6%
as a result of stabilisation of energy prices in 2019. According to the data of Statistics Estonia, average gross
wages grew by 7.5% in the third quarter of the 2018 compared to the previous year. Macroeconomic analysts
forecast a wage increase of 7.1% for the reporting year. In 2019, the expected growth of wages, according
to the Bank of Estonia, is 6.2%.
According to Statistics Estonia, the total sales revenue generated by the retail sector in current prices in
Estonia grew by 7.1% in the first eleven months of 2018. The car sales that have shown great growth for a
long time have accelerated the activity of the motor vehicle maintenance and repair segment, which grew by
20.3% (over one fifth) in eleven months compared to the previous year. The sales revenue of commercial
companies grew by 631 million euros in current prices during the first eleven months of 2018, where the
largest share, 261 million euros, was attributed to the sales of motor vehicles as well as their parts and
accessories, although the sales of new cars grew only by 3.6% in the first eleven months of 2018. Retail sales
in non-specialised stores (predominantly grocery) grew altogether by 3.6% during the first eleven months of
2018. Retail sales in other specialised stores grew by 6.4%. According to the Estonian Institute of Economic
Research, consumer confidence has weakened in the fourth quarter of 2018. According to analysts, the sales
growth in car sales and real estate is decelerating; however, the growth of domestic consumption will continue
on account of growing wages and tax returns resulting from the income tax reform.
Economic results
FINANCIAL RATIOS 2017–2018
EUR
4th quarter 2018 4th quarter 2017 Change
Sales revenue (in millions) 182.4 175.0 4.2%
Operating profit/loss (in millions) 11.8 12.4 -4.7%
Net profit/loss (in millions) 11.5 11.9 -3.3%
Return on equity (ROE) 5.4% 5.9%
Return on assets (ROA) 2.9% 3.1%
Net profit margin 6.32% 6.81%
Gross profit margin 27.16% 26.79%
Quick ratio 1.13 0.89
Debt ratio 0.45 0.48
Sales revenue per employee (in millions) 0.043 0.042
Inventory turnover 1.70 1.69
SHARE
Average number of shares (1000 pcs) 40,729 40,729
Equity capital per share (EUR/share) 5.54 5.11
Share’s closing price (EUR/share) 8.420 9.200
Earnings per share (EUR/share) 0.28 0.29
Average number of employees 4,270 4,193

Tallinna Kaubamaja Grupp AS
Consolidated Interim Report for the Fourth quarter and 12 months of 2018 (unaudited)
7
In the fourth quarter of 2018, the unaudited consolidated sales revenue of Tallinna Kaubamaja Group was
182.4 million euros, exceeding the year-on-year result by 4.2%. The sales revenue generated in 12 months
was 681.2 million euros, showing an increase of 4.6% compared to the result of 2017, when the sales revenue
was 651.3 million euros. In the fourth quarter of 2018, the unaudited consolidated net profit of the Group
was 11.5 million euros, which is 3.3% lower than the profit of the same period of the previous year. The net
profit of the group was 30.4 million euros in 2018, which is 2.0% better compared to the previous year. The
pre-tax profit of twelve months was 36.7 million euros, showing a growth of 0.7% compared to the previous
year. The size of the net profit was influenced by the dividend payment, on which income tax of 6.3 million
euros was accrued in the first quarter of 2018, whereas a year earlier, income tax was accrued in the amount
of 6.7 million euros.
In the fourth quarter of 2018, the Group continued to produce strong sales results. The supermarkets
segment showed the largest growth in sales, supported by two new Selver stores opened in Tallinn in
November. The successful sales campaigns of Kaubamaja and the launch of the new I.L.U. e-store increased
the sales revenue and profit of the department stores segment compared to the last quarter of 2017. The
car trade and supermarket segments had a very good year and were able to increase the sales and improve
the profit numbers. The sales results of the Group’s e-stores grew strongly in 2018, showing a growth in
numbers that still exceed the sales statistics of Estonian e-commerce sector. The labour costs of the Group
increased by 8.7% in a year and the average salary of the Group’s employees grew by 6.1%. The profit earned
in the fourth quarter was influenced by the re-evaluation of investment property. The value of investment
property grew in 2018; however, the growth was smaller compared to the growth in 2017, as a result of
which positive impact on earnings before interest, taxes, depreciation, and amortisation (EBITDA) was 1.0
million euros lower in 2018.
During 2018, SelveEkspress areas were extended in Selver stores and the service was available already in 48
Selver stores by the end of the reporting year. In September, a thoroughly renewed I.L.U. web store was
EUR
12 month 2018 12 month 2017 Change
Sales revenue (in millions) 681.2 651.3 4.6%
Operating profit/loss (in millions) 37.3 37.1 0.6%
Net profit/loss (in millions) 30.4 29.8 2.0%
Return on equity (ROE) 14.0% 14.5%
Return on assets (ROA) 7.5% 7.6%
Net profit margin 4.47% 4.58%
Gross profit margin 25.54% 25.57%
Quick ratio 1.13 0.89
Debt ratio 0.45 0.48
Sales revenue per employee (in millions) 0.159 0.156
Inventory turnover 6.48 6.39
SHARE
Average number of shares (1000 pcs) 40,729 40,729
Equity capital per share (EUR/share) 5.54 5.11
Share’s closing price (EUR/share) 8.420 9.200
Earnings per share (EUR/share) 0.75 0.73
Average number of employees 4,283 4,182
Return on equity (ROE) = Net profit / Average owners’ equity * 100%
Return on assets (ROA) = Net profit / Average total assets * 100%
Sales revenue per employee = Sales revenue / Average number of employees
Inventory turnover (multiplier) = Cost of goods sold / inventories
Net profit margin = Net profit / Sales revenue * 100%
Gross profit margin = (Sales revenue - Cost of goods sold) / Sales revenue
Quick ratio = Current assets / Current liabilities
Debt ratio = Total liabilities / Balance sheet total

Tallinna Kaubamaja Grupp AS
Consolidated Interim Report for the Fourth quarter and 12 months of 2018 (unaudited)
8
launched successfully. An ABC King store set up in accordance with the new concept was opened at Kristiine
Centre in the third quarter. The designing of the extension of the Kulinaaria plant, which is becoming too
small to meet the current customer needs, was initiated. The new plant is planned to be built on the plot
adjacent to the current plant. At the beginning of November, Selver opened its eight hypermarket in the T1
shopping centre and Kolde Selver was opened in the Põhja-Tallinn city district. The development work of
Estonian, Latvian, and Lithuanian car centres and the Kaubamaja Tallinn department store is ongoing.
The volume of assets of Tallinna Kaubamaja Group as at 31 December 2018 was 411.1 million euros, which
is 3.4% more than the respective number at the end of 2017. The balance sheet of the Group was influenced
by the re-evaluation of land and buildings in 2018, which resulted in a growth of the value of land and
buildings by 15.3 million euros. The same amount was added to the revaluation reserve of equity.
There were more than 674 thousand loyal customers at the end of the reporting period; the number of loyal
customers increased by 3.0% in a year. The relative importance of regular customers in the turnover of the
Group was 84.6% (the percentage was 83.0% in the 2017). Over 30,000 Partner Bank and Credit Cards had
been issued by the end of December.
Selver supermarkets
The annual consolidated sales revenue of the supermarkets business segment was 450.1 million euros in
2018, showing a growth of 3.9% in the year-on-year comparison. The consolidated sales revenue in the fourth
quarter was 122.5 million euros, increasing by 5.6% in comparison with the same period last year. In 2018,
the monthly average sales revenue of goods per square metre of selling space was 0.38 thousand euros and
0.40 thousand euros in the fourth quarter, growing by 0.8% and 2.1%, respectively, in the year-on-year
comparison. In terms of comparable stores, the average sales revenue of goods per square metre of selling
space was 0.37 thousand euros in 2018 and 0.40 thousand euros in the fourth quarter, showing a growth of
0.2% and 2.1%, respectively. In 2018, 38.8 million purchases were made in Selver supermarkets, which
exceeded the result of last year by 3.1%.
In 2018, the consolidated pre-tax profit of the supermarkets segment was 18.6 million euros, increasing by
1.8 million euros compared to the previous year. The net profit earned in 2018 was 14.6 million euros,
increasing by 1.4 million euros compared to the previous year. The difference between the net profit and
profit before income tax is due to income tax paid on dividends – the income tax paid on dividends was by
0.4 million euros higher in 2018 compared to the year earlier. The pre-tax profit and net profit was 5.8 million
euros in the fourth quarter, exceeding the result of the previous year of the comparable period by 0.1 million
euros. In the second half-year of 2018, SIA Selver Latvia was liquidated and as at the end of the year, the
company has been deleted from the commercial register.
The growth of the sales revenue in Selver supermarkets continued in the fourth quarter at a higher pace than
in the non-specialised stores market segment. The growth trend was visible in the number of purchases as
well as the amount of an average purchase. The growth of sales revenue of comparable stores was more
rapid in the last quarter of the year. In the fourth quarter, the growth of sales revenue in e-commerce was
28.0%.
The profit earned in the supermarkets segment was primarily influenced by the growth of the sales revenue.
In terms of operating costs, the cost efficiency level was improved compared to the previous year. The main
reason behind the growth of labour costs in the second half of the year is a strong pressure on wages and
recruitment new employees to new opening stores.
The comparison basis of 2018 does not include five new supermarkets opened in Tallinn last year and a
mobile store in Hiiumaa; however, the comparison basis is larger on account of a supermarket closed in
Tallinn.
As at the end of December, the supermarket segment includes the Selver chain with 53 Selver stores, e-
Selver, a mobile store, and a café with a total selling space of 99,900 m², as well as Kulinaaria OÜ, the largest
central kitchen in the Baltic States.
Department stores
In 2018, the department stores business segment earned a sales revenue of 100.9 million euros, which is
1.5% less than last year in the same period. Of this, the sales revenue generated in the fourth quarter was
31.6 million euros, which was 1.8% better than the revenue earned in the fourth quarter of 2017. The sales
revenue of the department stores segment per square metre of selling space was 0.31 thousand euros in 12
months, which was 1.2% less than in the same period last year. In 2018, the pre-tax profit of the department
stores segment was 3.8 million euros, which is 12.2% lower on the year-on-year basis. The pre-tax profit was
2.8 million euros in the fourth quarter, which was better by 24.0% compared to the result a year earlier. The
sales revenue of 12 months of the Kaubamaja department stores segment was influenced by a longer and

Tallinna Kaubamaja Grupp AS
Consolidated Interim Report for the Fourth quarter and 12 months of 2018 (unaudited)
9
stronger summer discount campaign, because the long winter and early summer did not help with the sale
of spring goods. The repair works on Gonsiori Street and the renovation of Tammsaare Park, which disturbed
the traffic and movement of pedestrians in downtown Tallinn, influenced the summer sales, restricted access
to and reduced the number of customers that visited the store in Tallinn. In addition, renovation works were
undertaken on the first floor of the Tartu department store in July and August and the completely renewed
women’s shoe department and men’s department were opened at the beginning of September. The sales
revenue of the fourth quarter was greatly influenced by the best Osturalli campaign throughout the years and
a strong Christmas campaign. Taking into account the location of the department store in downtown Tallinn,
the structural changes in the number of tourists in 2018, showing a lower number of Finnish tourists, had a
significant impact on the result of 2018. The changes in the excise policy have influenced the purchase
behaviour of Finnish tourists, resulting in not only in the decrease of sales of alcoholic beverages, but also
decreased sales in other groups of goods, such as perfumery products, clothes, footwear, and children's
goods.
In the fourth quarter of 2018, the sales revenue of OÜ TKM Beauty Eesti, which operates the I.L.U. cosmetics
stores, was 1.6 million euros, showing a growth of 3.8% compared to the same period in 2017. The profit
earned in the fourth quarter was 0.1 million euros, which was 0.1 million euros better compared to the same
period in 2017. The sales revenue was 4.6 million euros in 2018, decreasing by 0.7% compared to the sales
revenue earned in 2017. The loss was 0.2 million euros in 2018, which was 0.1 million euros less than the
loss earned in the comparable period in 2017. In February of the reporting year, the store in Kvartal shopping
centre in Tartu was closed because of unsatisfactory business results. During the year, attention was paid to
the assortment analyses by stores for the purpose of offering customers new attractive goods as well as
ensuring an optimal balance of inventories. In September, completely renewed I.L.U. e-store was opened,
which was well accepted by the customers.
Car Trade
In 2018, the sales revenue of the car trade segment was 114.9 million euros. The sales revenue exceeded
the year-on-year revenue by 15.3%, whereas the annual increase in the sales revenue of KIAs was 1.7%. The
sales revenue earned in the fourth quarter, 24.2 million euros, exceeded the year-on-year result by 2.8%.
The sales revenue of KIAs decreased by 11.1% compared to the same time of the previous year. Peugeots
made a strong sales result. In the Group’s car trade segment, a total of 5,050 new vehicles were sold in
2018, of which 949 vehicles were sold in the fourth quarter. In 2018, the net profit of the car trade segment
was 3.7 million euros, which is 11.9% higher than the profit earned in the previous year. The pre-tax profit
of the segment was 4.4 million euros in 2018, exceeding the profit of 2017 by 13.4%. The pre-tax profit of
the fourth quarter of 2018 was 0.6 million euros, which exceeded the year-on-year pre-tax profit by 16.5%.
The success of the car trade segment in 2018 is primarily due to a very successful year of subsidiaries that
operate as resellers. All three retail sellers – Viking Motors AS in Tallinn, Forum Auto SIA in Riga, and KIA
Auto UAB in Vilnius – fulfilled the profit expectations. The economic results of KIA Auto AS, the company that
imports KIAs, were as expected, although the very high results of the previous year were not exceeded. In
summary, it can be said that 2018 was a year of records for the car trade segment in terms of turnover,
profit, and the number of new cars sold.
A significant driver of the sales growth of new cars is the general growth of the car trade market in the Baltics,
especially in Latvia and Lithuania. In Latvia, several large procurements where KIAs were offered were won,
which significantly increased the market share of KIAs in Latvia. Active marketing and effectively directed
media campaigns by the importer of KIAs supported the growth of sales of KIAs. Still, the best-selling KIA
models are crossover SUV Sportage and the family hatchback Ceed. In addition, the sale of new Opel cars
has been successful. The bestselling OPEL models that customers have well accepted are the completely
new mid-size passenger car OPEL Insignia, the crossover SUV Mokka X, and the small compact car Astra.
Turnover was significantly influenced by achieving the status of a Peugeot reseller at the end of 2017 and
the resulting added business to the car trade segment. It can be said that the launch of the Peugeot business
exceeded expectations in both the visits to the service and turnover generated by the sale of new cars. The
bestselling models of Peugeot are crossover SUVs 2008, 3008, and 5008 as well as commercial vans Peugeot
Traveller/Expert and Partner.
Footwear trade
The sales revenue of the footwear trade segment was 9.8 million euros in 2018, decreasing by 11.2% on the
year-on-year basis. The pre-tax loss was significantly lower in 2018 compared to 2017. Altogether, the result
improved by 2.7 million euros, of which 2.2 million euros accounted for the decrease in goodwill in 2017.
The sales revenue was 2.6 million euros in the fourth quarter, which is 14.7% less than the year-on-year sales
revenue. The profit earned in the fourth quarter was 0.04 million euros. In 2018, the footwear trade segment
launched a new visual concept in ABC King stores. Two new ABC King stores with the renewed concept, which

Tallinna Kaubamaja Grupp AS
Consolidated Interim Report for the Fourth quarter and 12 months of 2018 (unaudited)
10
has been well accepted by customers, were opened in Ülemiste and Kristiine Shopping Centres in the second
half of the reporting year. Along with the changed concept, more attention was paid to the training of
personnel, which resulted in a lower turnover of employees and improved service. New supply channels
supported the improvement of the margin compared to 2017.
Real estate
The sales revenue earned in the real estate segment outside the Group was 5.4 million euros in 2018. The
sales revenue grew by 8.1% compared to 2017. The sales revenue of the segment earned outside the Group
was 1.4 million euros in the fourth quarter, growing by 7.3% compared to the same period in 2017. The pre-
tax profit of the real estate segment was 10.2 million euros in 2018, which is 29.4% lower than the result
earned in the same period last year. The pre-tax profit of the segment earned in the fourth quarter of 2018
was 2.3 million euros, which was 60% less than the year-on-year result. Tartu Kaubamaja Centre, which is
showing good results despite strong competition, was the primary driver of the growth of the segment’s sales
revenue. During the year, the gas station and store that opened in close proximity to Peetri Selver has
supported the growth of sales. At the end of the year, Ogre building in Latvia was partially rented to parties
outside of the Group. The decrease in profit of the real estate segment was affected by previous contracts
concluded inside the Group, related to Latvian real estate, which have ended by now. The revaluation of
investment property played a role in the decrease of the profit earned in the fourth quarter, which remained
below extent the revaluations in 2017.
In the last months of the reporting year, the construction works of Kolde Selver in the Põhja-Tallinn city
district were completed. In 2019, the development works of Estonian, Latvian and Lithuanian car centres
and the department store of Kaubamaja in Tallinn will be continued.
Personnel
The average number of employees in the Tallinna Kaubamaja Group in 2018 was 4,283, having grown by
2.4% compared to the same period in 2017. Total labour costs (cost of wages and social tax) amounted to
67.7 million euros in 2018, having grown by 8.7% compared to the same period in 2017. In the fourth
quarter, the labour costs increased by 7.9% compared to the year before, while the average number of
employees increased by 1.8%. The average monthly wage costs per employee increased by 6.0% in the
fourth quarter; the overall annual increase was 6.1%.

Tallinna Kaubamaja Grupp AS
Consolidated Interim Report for the Fourth quarter and 12 months of 2018 (unaudited)
11
Approval of the chairman of the management board and signature to the report
The chairman of the management board confirms that the management report gives a true and fair overview
of the most important events during the reporting period and their effects on the accounting report; it
includes a description of the main risks and uncertainties during the remaining financial year and reflects
transactions with related parties.
_________________________
Raul Puusepp
Chairman of the Management Board
Tallinn, 24 January 2019

Tallinna Kaubamaja Grupp AS
Consolidated Interim Report for the Fourth quarter and 12 months of 2018 (unaudited)
12
CONDENSED CONSOLIDATED FINANCIAL STATEMENTS
MANAGEMENT BOARD’S CONFIRMATION TO THE CONDENSED CONSOLIDATED FINANCIAL STATEMENTS
The Chairman of the Management Board confirms the correctness and completeness of Tallinna Kaubamaja
Grupp AS condensed consolidated interim financial statements (unaudited) for the period of the Fourth quarter
and 12 months of 2018 as set out on pages 12 - 36.
The Chairman of the Management Board confirms that:
1. the accounting policies used in preparing the interim financial statements are in compliance with
International Financial Reporting Standard as adopted in the European Union;
2. the interim financial statements give a true and fair view of the financial position. the results of the
operations and the cash flows of the Parent and the Group;
3. Tallinna Kaubamaja Grupp AS and its subsidiaries are going concerns.
__________________________
Raul Puusepp
Chairman of the Management Board
Tallinn, 24 January 2019
Tallinna Kaubamaja Grupp AS
Consolidated Interim Report for the Fourth quarter and 12 months of 2018 (unaudited)
13
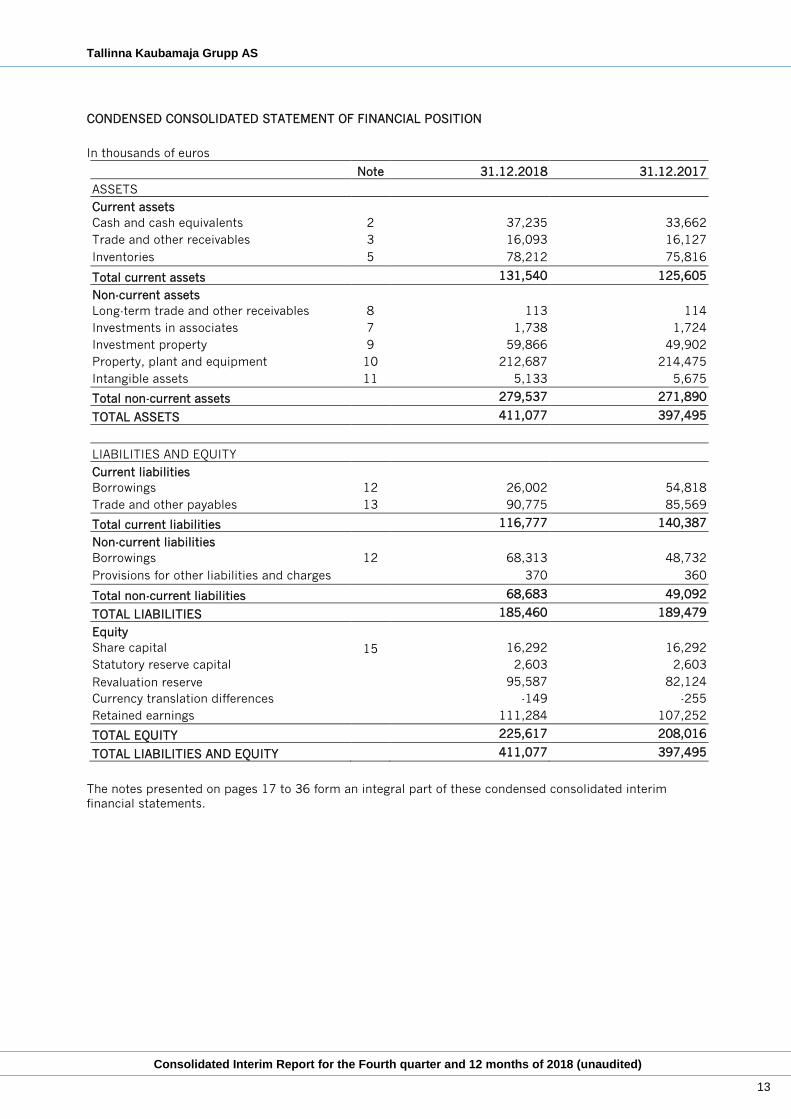
CONDENSED CONSOLIDATED STATEMENT OF FINANCIAL POSITION
In thousands of euros
Note 31.12.2018 31.12.2017
ASSETS
Current assets
Cash and cash equivalents 2 37,235 33,662
Trade and other receivables 3 16,093 16,127
Inventories 5 78,212 75,816
Total current assets 131,540 125,605
Non-current assets
Long-term trade and other receivables 8 113 114
Investments in associates 7 1,738 1,724
Investment property 9 59,866 49,902
Property, plant and equipment 10 212,687 214,475
Intangible assets 11 5,133 5,675
Total non-current assets 279,537 271,890
TOTAL ASSETS 411,077 397,495
LIABILITIES AND EQUITY
Current liabilities
Borrowings 12 26,002 54,818
Trade and other payables 13 90,775 85,569
Total current liabilities 116,777 140,387
Non-current liabilities
Borrowings 12 68,313 48,732
Provisions for other liabilities and charges 370 360
Total non-current liabilities 68,683 49,092
TOTAL LIABILITIES 185,460 189,479
Equity
Share capital 15 16,292 16,292
Statutory reserve capital 2,603 2,603
Revaluation reserve 95,587 82,124
Currency translation differences -149 -255
Retained earnings 111,284 107,252
TOTAL EQUITY 225,617 208,016
TOTAL LIABILITIES AND EQUITY 411,077 397,495
The notes presented on pages 17 to 36 form an integral part of these condensed consolidated interim
financial statements.

Tallinna Kaubamaja Grupp AS
Consolidated Interim Report for the Fourth quarter and 12 months of 2018 (unaudited)
14
CONDENSED CONSOLIDATED STATEMENT OF PROFIT OR LOSS AND OTHER COMPREHENSIVE INCOME
In thousands of euros
Note
IV quarter
2018
IV quarter
2017
12 months
2018
12 months
2017
Revenue 16 182,352 175,031 681,181 651,257
Other operating income 982 1,339 2,175 2,239
Cost of sales 5 -132,830 -128,147 -507,182 -484,760
Other operating expenses 17 -15,189 -14,161 -56,033 -54,611
Staff costs 18 -19,461 -18,035 -67,710 -62,289
Depreciation, amortisation and impairment
losses 10, 11 -3,227 -3,409 -13,426 -13,356
Other expenses -844 -248 -1,673 -1,373
Operating profit 11,783 12,370 37,332 37,107
Finance income 0 0 1 1
Finance costs -237 -202 -810 -773
Finance income on shares of associates 7 27 27 214 162
Profit before tax 11,573 12,195 36,737 36,497
Income tax expense 15 -49 -275 -6,299 -6,666
NET PROFIT FOR THE FINANCIAL YEAR 11,524 11,920 30,438 29,831
Other comprehensive income:
Items that will not be subsequently reclassified to profit or loss
Revaluation of land and buildings 15,266 0 15,266 0
Other comprehensive income for the financial
year 15,266 0 15,266 0
TOTAL COMPREHENSIVE INCOME FOR THE
FINANCIAL YEAR 26,790 11,920 45,704 29,831
Basic and diluted earnings per share (euros) 19 0.28 0.29 0.75 0.73
Net profit and total comprehensive income are attributable to the owners of the parent.
The notes presented on pages 17 to 36 form an integral part of these condensed consolidated interim
financial statements.

Tallinna Kaubamaja Grupp AS
Consolidated Interim Report for the Fourth quarter and 12 months of 2018 (unaudited)
15
CONDENSED CONSOLIDATED CASH FLOW STATEMENT
In thousands of euros
Note 12 months 2018 12 months 2017
CASH FLOWS FROM OPERATING ACTIVITIES
Net profit 30,438 29,831
Adjustments:
Income tax on dividends 15 6,249 6,372
Interest expense 810 773
Interest income -1 -1
Depreciation, amortisation 10, 11 13,329 13,317
Gain from fair value adjustment of investment property 9 -42 -1,081
Loss on sale and write-off of non-current assets 10 97 39
Profit on sale of non-current assets 10 -398 -203
Profit on sale of investment property 9 -39 0
Effect of equity method 7 -214 -162
Change in inventories -2,026 -5,630
Change in receivables and prepayments related to
operating activities 36 -582
Change in liabilities and prepayments related to operating
activities 5,216 1,718
TOTAL CASH FLOWS FROM OPERATING ACTIVITIES 53,455 44,390
CASH FLOWS FROM INVESTING ACTIVITIES
Purchase of property, plant and equipment (excl.
finance lease) 10 -15,991
-14,778
Proceeds from sale of property, plant and equipment 10 9,723 1,403
Proceeds from sale of investment property 9 676 20
Purchase of intangible assets 11 -95 -69
Dividends received 7 200 200
Interest received 1 1
TOTAL CASH FLOWS USED IN INVESTING ACTIVITIES -5,486 -13,223
CASH FLOWS FROM FINANCING ACTIVITIES
Proceeds from borrowings 12 84,060 63,719
Repayments of borrowings 12 -92,838 -65,587
Change in overdraft balance 12 -457 4,794
Dividends paid 15 -28,102 -25,659
Income tax on dividends 15 -6,249 -6,371
Interest paid -810 -776
TOTAL CASH FLOWS USED IN FINANCING ACTIVITIES -44,396 -29,880
TOTAL CASH FLOWS 3,573 1,287
Effect of exchange rate changes 0 0
Cash and cash equivalents at the beginning of the period 2 33,662 32,375
Cash and cash equivalents at the end of the period 2 37,235 33,662
Net change in cash and cash equivalents 3,573 1,287
The notes presented on pages 17 to 36 form an integral part of these condensed consolidated interim
financial statements.

Tallinna Kaubamaja Grupp AS
Consolidated Interim Report for the Fourth quarter and 12 months of 2018 (unaudited)
16
CONDENSED CONSOLIDATED STATEMENT OF CHANGES IN OWNERS’ EQUITY
In thousands of euros
Share
capital
Statutory
reserve
capital
Revaluation
reserve
Currency
translation
differences
Retained
earnings Total
Balance as of 31.12.2016 16,292 2,603 83,932 -255 101,272 203,844
Net profit for the reporting period 0 0 0 0 29,831 29,831
Total comprehensive income
for the reporting period 0 0 0 0 29,831 29,831
Reclassification of depreciation of
revalued land and buildings 0 0 -1,808 0 1,808 0
Dividends paid 0 0 0 0 -25,659 -25,659
Balance as of 31.12.2017 16,292 2,603 82,124 -255 107,252 208,016
Net profit for the reporting period 0 0 0 0 30,438 30,438
Revaluation of land and buildings 0 0 15,266 0 0 15,266
Currency translation differences 0 0 0 106 -106 0
Total comprehensive income
for the reporting period 0 0 15,266 106 30,332 45,704
Reclassification of depreciation of
revalued land and buildings 0 0 -1,803 0 1,803 0
Dividends paid 0 0 0 0 -28,103 -28,103
Balance as of 31.12.2018 16,292 2,603 95,587 -149 111,284 225,617
Additional information on share capital and changes in equity is provided in Note 15.
The notes presented on pages 17 to 36 form an integral part of these condensed consolidated interim
financial statements.

Tallinna Kaubamaja Grupp AS
Consolidated Interim Report for the Fourth quarter and 12 months of 2018 (unaudited)
17
NOTES TO THE CONDENSED CONSOLIDATED INTERIM ACCOUNTS
Note 1. Accounting Principles Followed upon Preparation of the Condensed Consolidated Interim Accounts
General Information
Tallinna Kaubamaja Grupp AS (‘the Company’) and its subsidiaries (jointly ‘Tallinna Kaubamaja Group’ or
‘the Group’) are companies engaged in rendering services related to retail sale and rental activities in Estonia,
Latvia and Lithuania. Tallinna Kaubamaja Grupp AS is a company registered on 18 October 1994 in the
Republic of Estonia with the legal address of Gonsiori 2, Tallinn. The shares of Tallinna Kaubamaja Grupp AS
are listed on the NASDAQ OMX Tallinn Stock Exchange. The majority shareholder of Tallinna Kaubamaja
Grupp AS is OÜ NG Investeeringud, the majority owner of which is NG Kapital OÜ. NG Kapital OÜ is an entity
with ultimate control over Tallinna Kaubamaja Grupp AS.
Basis for Preparation
The Condensed Consolidated Interim Accounts of Tallinna Kaubamaja Group has been prepared in accordance
with the International Financial Reporting Standard IAS 34 Interim Financial Reporting as adopted by the
European Union. The condensed consolidated interim financial statements do not contain all the information
that has to be presented in the annual financial statements and they should be read in conjunction with the
Group’s consolidated financial statements as at and for the year ended 31 December 2017. However, selected
explanatory notes are included to explain events and transactions that are significant to an understanding of
the changes in the Group’s financial position and performance since the last annual financial statements. This
is the first set of the Group’s financial statements where IFRS 15 and IFRS 9 have been applied. Changes to
significant accounting policies are described below.
The functional and presentation currency of Tallinna Kaubamaja Group is euro. All amounts disclosed in the
financial statements have been rounded to the nearest thousand unless referred to otherwise.
The Manager is of the opinion that the Condensed Consolidated Interim Report of Tallinna Kaubamaja Group
for the Fourth quarter and 12 months of 2018 gives a true and fair view of the Company’s performance in
accordance with the going-concern concept.
This Condensed Consolidated Interim Report has not been audited or otherwise reviewed by auditors.
Changes in significant accounting policies
Except as described below, the accounting policies applied in these interim financial statements are the same
as those applied in the Group’s consolidated financial statements as at and for the year ended 31 December
2017.
The changes in accounting policies are also expected to be reflected in the Group’s consolidated financial
statements as at and for the year ending 31 December 2018. The Group has initially adopted IFRS 15 Revenue
from Contracts with Customers and IFRS 9 Financial Instruments from 1 January 2018. A number of other
new standards are effective from 1 January 2018 but they do not have a material effect on the Group’s financial
statements. The application of IFRS 15 and IFRS 9 did not have any material effect on the Group’s financial
statements as at 01.01.2018 and no adjustments to the equity have been made as of that date.
IFRS 15, Revenue from Contracts with Customers IFRS 15 establishes a comprehensive framework for determining whether, how much and when revenue is
recognised. It replaced IAS 18 Revenue, IAS 11 Construction Contracts and related interpretations. The Group
has adopted IFRS 15 using modified retrospective approach which requires that the cumulative effect of
initially applying this standard is recognised in retained earnings at the date of initial application (i.e. 1
January 2018) and the information presented for 2017 is restated – i.e. it is presented, as previously reported,
under IAS 18, IAS 11 and related interpretations. As disclosed above, there were no adjustments as the impact
of IFRS 15 to the retained earnings as at 1 January 2018 was not material, therefore no adjustments to the
equity have been made.
The details of the new significant accounting policies and the nature of the changes to previous accounting
policies in relation to the Group’s various goods and services are set out below. Under IFRS 15, revenue is
recognised when a customer obtains control of the goods or services.

Tallinna Kaubamaja Grupp AS
Consolidated Interim Report for the Fourth quarter and 12 months of 2018 (unaudited)
18
Sale of goods – retail
Revenue from the sale of goods is recognised at the time when a sales transaction is completed for the client
in a retail store. The client generally pays in cash or by credit card. The probability of returning goods is
estimated at a portfolio level (expected value method), based on prior experience, and returns are recognised
in the period of the sales transaction as a reduction of revenue, by recognising a contract liability (refund
liability) and a right to the returned goods. The validity of this assumption and the estimated amount of
returns are reassessed at each reporting date. Because the number of products returned has been steady
for years, it is highly probable that a significant reversal in the cumulative revenue recognised will not occur.
Accounting for customer loyalty programme
In previous reporting periods, the consideration received from the sale of goods was allocated to the points
and the goods sold using the residual method. Under this method, a part of the consideration equalling the
fair value of the points was allocated to the points. The residual part of the consideration was allocated to
the goods sold.
Under IFRS 15, the total consideration must be allocated to the points and goods based on the relative stand-
alone selling prices. Using this new method, the amounts allocated to the goods sold are, on average, higher
than the amounts allocated under the residual value method, although the impact as of 1 January 2018 was
not material.
IFRS 9, Financial Instruments
IFRS 9 sets out requirements for recognising and measuring financial assets, financial liabilities and some
contracts to buy or sell non-financial items. This standard replaces IAS 39 Financial Instruments: Recognition
and Measurement.
IFRS 9 largely retains the existing requirements in IAS 39 for the classification and measurement of financial
liabilities. However, it eliminates the previous IAS 39 categories for financial assets of held to maturity, loans
and receivables and available for sale. Under IFRS 9, on initial recognition, a financial asset is classified as
measured at: amortised cost; fair value with changes recognised in other comprehensive income (FVOCI) –
debt investment; FVOCI – equity investment; or fair value with changes recognised in profit or loss (FVTPL).
The classification of financial assets under IFRS 9 is generally based on the business model in which a
financial asset is managed and its contractual cash flow characteristics.
A financial asset is measured at amortised cost if it meets both of the following conditions and is not
designated as at FVTPL:
- it is held within a business model whose objective is to hold assets to collect contractual cash flows;
and
- its contractual terms give rise on specified dates to cash flows that are solely payments of principal
and interest on the principal amount outstanding.
A financial asset (unless it is a trade receivable without a significant financing component that is initially
measured at the transaction price) is initially measured at fair value plus, for an item not at FVTPL,
transaction costs that are directly attributable to its acquisition.
These assets are subsequently measured at amortised cost using the effective interest method. The
amortised cost is reduced by impairment losses. Interest income, foreign exchange gains and losses and
impairment are recognised in profit or loss. Any gain or loss on derecognition is recognised in profit or loss.
The following table explains the original measurement categories under IAS 39 and the new measurement
categories under IFRS 9 for each class of the Group’s financial assets as at 1 January 2018.
in thousands of euro Original
classification
under IAS 39
New
classification
under IFRS 9
Carrying amount
under IAS 39
Carrying amount
under IFRS 9
Trade and other
receivables
Loans and
receivables
Amortised cost 12,363 12,363
Cash and cash equivalents Loans and
receivables
Amortised cost 33,662 33,662
Total financial assets 46,025 46,025

Tallinna Kaubamaja Grupp AS
Consolidated Interim Report for the Fourth quarter and 12 months of 2018 (unaudited)
19
Impairment of financial assets
IFRS 9 replaces the ‘incurred loss’ model in IAS 39 with an ‘expected credit loss’ (ECL) model. The new
impairment model applies to financial assets measured at amortised cost, contract assets and debt
investments at FVOCI, but not to investments in equity instruments. Under IFRS 9, credit losses are
recognised earlier than under IAS 39. The financial assets at amortised cost consist of trade receivables,
cash, and cash equivalents.
Under IFRS 9, loss allowances are measured from initial recognition of the financial assets, on either of the
following bases:
- 12-month ECLs: these are ECLs that result from possible default events within the 12 months after
the reporting date; and
- lifetime ECLs: these are ECLs that result from all possible default events over the expected life of a
financial instrument.
ECLs are a probability-weighted estimate of credit losses. A credit loss is the difference between the cash
flows that are due to the Group in accordance with the contract and the cash flows that the Group expects to
receive discounted at the original effective interest rate. .
The Group measures loss allowances as follows:
- for trade receivables at an amount equal to lifetime ECLs;
- for cash and cash equivalents that are determined to have low credit risk at the reporting date (the
management considers ‘low credit risk’ to be an investment grade credit rating with at least one major
rating agency) at an amount equal to 12-month ECLs
- for all other financial assets at an amount of 12-month ECLs, if the credit risk (i.e. the risk of default
occurring over the expected life of the financial asset) has not increased significantly since initial
recognition; if the risk has increased significantly, the loss allowance is measured at an amount equal
to lifetime ECLs.
When determining whether the credit risk of a financial asset has increased significantly since initial
recognition and when estimating ECLs, the Group considers reasonable and supportable information that is
relevant and available without undue cost or effort. This includes both quantitative and qualitative information
and analysis, based on the Group’s historical experience and informed credit assessment and including
forward-looking (including macroeconomic) information. The Group assumes that the credit risk on a financial
asset has increased significantly if it is more than 30 days past due.
The Group considers a financial asset to be in default when:
- the debtor is unlikely to pay its credit obligations to the Group in full, without recourse by the group
to actions such as realising security (if any is held); or
- the financial asset is more than 90 days past due.
Loss allowances for financial assets measured at amortised cost are deducted from the gross carrying amount
of the assets.
For assets in the scope of the IFRS 9 impairment model, impairment losses are generally expected to increase
and become more volatile. However, the Group has determined that the application of IFRS 9’s impairment
requirements at 01.01.2018 results in no material impact on Group’s financial statements.
Changes in accounting policies resulting from the adoption of IFRS 9 have been applied retrospectively, except
as described below. Changes in accounting policies did not have a material impact on the Group’s financial
statements on the adoption at 1 January 2018. In accordance with the transitional provisions in IFRS 9,
comparative figures have not been restated, but continue to be accounted for in accordance with IAS 39.
The following assessments have been made on the basis of the facts and circumstances that existed at the
date of initial application.
- The determination of the business model within which a financial asset is held.
- If an investment in a debt security had low credit risk at the date of initial application of IFRS 9, then
the Group has assumed that the credit risk on the asset had not increased significantly since its initial
recognition.

Tallinna Kaubamaja Grupp AS
Consolidated Interim Report for the Fourth quarter and 12 months of 2018 (unaudited)
20
Note 2. Cash and cash equivalents
in thousands of euros
31.12.2018 31.12.2017
Cash on hand 1,216 643
Bank accounts 35,006 29,866
Cash in transit 1,013 3,153
Total cash and cash equivalents 37,235 33,662
Note 3. Trade and other receivables
in thousands of euros
31.12.2018 31.12.2017
Trade receivables (Note 4) 12,782 11,761
Other receivables form related parties (Note
20) 1 0
Other short-term receivables 614 602
Total financial assets from balance sheet line
“Trade and other receivables” 13,397 12,363
Prepayment for goods 2,008 2,993
Other prepaid expenses 633 701
Prepaid rental expenses 39 34
Prepaid taxes (Note 14) 16 36
Total trade and other receivables 16,093 16,127
Note 4. Trade receivables
in thousands of euros
31.12.2018 31.12.2017
Trade receivables 10,157 9,450
Allowance for doubtful receivables -7 -4
Receivables from related parties (Note 20) 290 392
Credit card payments 2,342 1,923
Total trade receivables 12,782 11,761
Note 5. Inventories
in thousands of euros
31.12.2018 31.12.2017
Goods purchased for resale 77,418 75,068
Raw materials and materials 794 748
Total inventories 78,212 75,816
Tallinna Kaubamaja Grupp AS
Consolidated Interim Report for the Fourth quarter and 12 months of 2018 (unaudited)
21
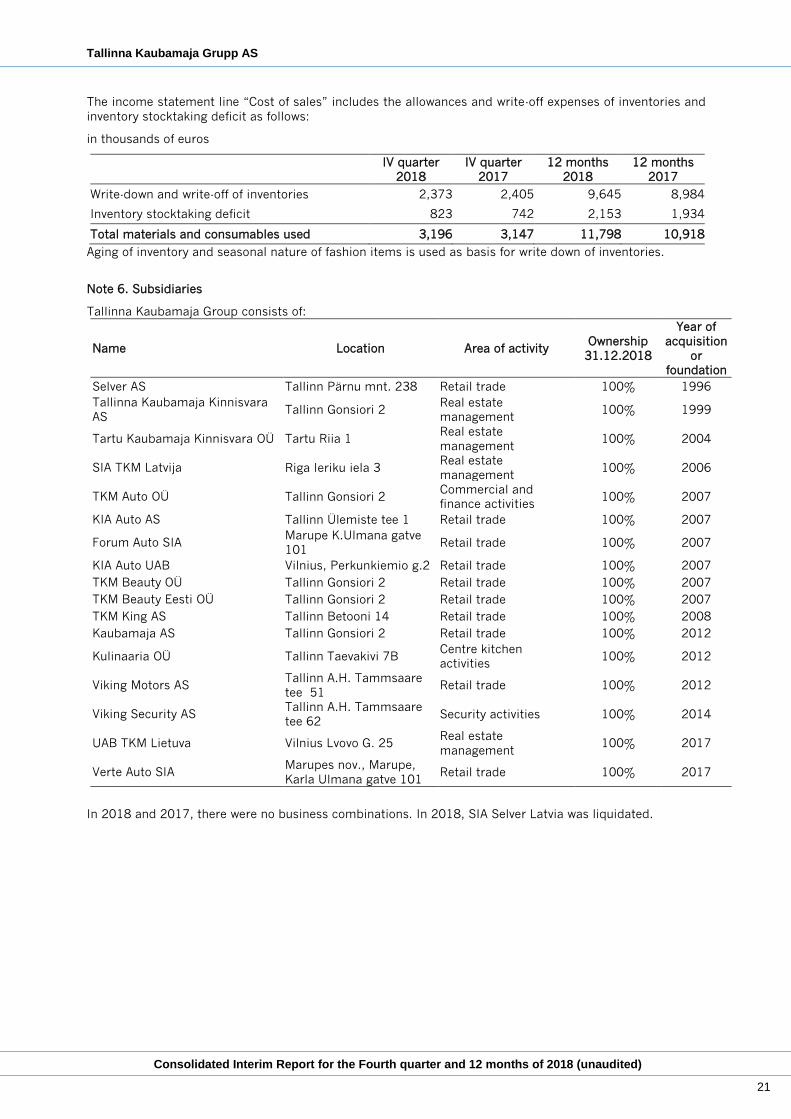
The income statement line “Cost of sales” includes the allowances and write-off expenses of inventories and
inventory stocktaking deficit as follows:
in thousands of euros
IV quarter
2018
IV quarter
2017
12 months
2018
12 months
2017
Write-down and write-off of inventories 2,373 2,405 9,645 8,984
Inventory stocktaking deficit 823 742 2,153 1,934
Total materials and consumables used 3,196 3,147 11,798 10,918
Aging of inventory and seasonal nature of fashion items is used as basis for write down of inventories.
Note 6. Subsidiaries
Tallinna Kaubamaja Group consists of:
Name Location Area of activity Ownership
31.12.2018
Year of
acquisition
or
foundation
Selver AS Tallinn Pärnu mnt. 238 Retail trade 100% 1996
Tallinna Kaubamaja Kinnisvara
AS Tallinn Gonsiori 2
Real estate
management 100% 1999
Tartu Kaubamaja Kinnisvara OÜ Tartu Riia 1 Real estate
management 100% 2004
SIA TKM Latvija Riga Ieriku iela 3 Real estate
management 100% 2006
TKM Auto OÜ Tallinn Gonsiori 2 Commercial and
finance activities 100% 2007
KIA Auto AS Tallinn Ülemiste tee 1 Retail trade 100% 2007
Forum Auto SIA Marupe K.Ulmana gatve
101 Retail trade 100% 2007
KIA Auto UAB Vilnius, Perkunkiemio g.2 Retail trade 100% 2007
TKM Beauty OÜ Tallinn Gonsiori 2 Retail trade 100% 2007
TKM Beauty Eesti OÜ Tallinn Gonsiori 2 Retail trade 100% 2007
TKM King AS Tallinn Betooni 14 Retail trade 100% 2008
Kaubamaja AS Tallinn Gonsiori 2 Retail trade 100% 2012
Kulinaaria OÜ Tallinn Taevakivi 7B Centre kitchen
activities 100% 2012
Viking Motors AS Tallinn A.H. Tammsaare
tee 51 Retail trade 100% 2012
Viking Security AS Tallinn A.H. Tammsaare
tee 62 Security activities 100% 2014
UAB TKM Lietuva Vilnius Lvovo G. 25 Real estate
management 100% 2017
Verte Auto SIA Marupes nov., Marupe,
Karla Ulmana gatve 101 Retail trade 100% 2017
In 2018 and 2017, there were no business combinations. In 2018, SIA Selver Latvia was liquidated.
Tallinna Kaubamaja Grupp AS
Consolidated Interim Report for the Fourth quarter and 12 months of 2018 (unaudited)
22
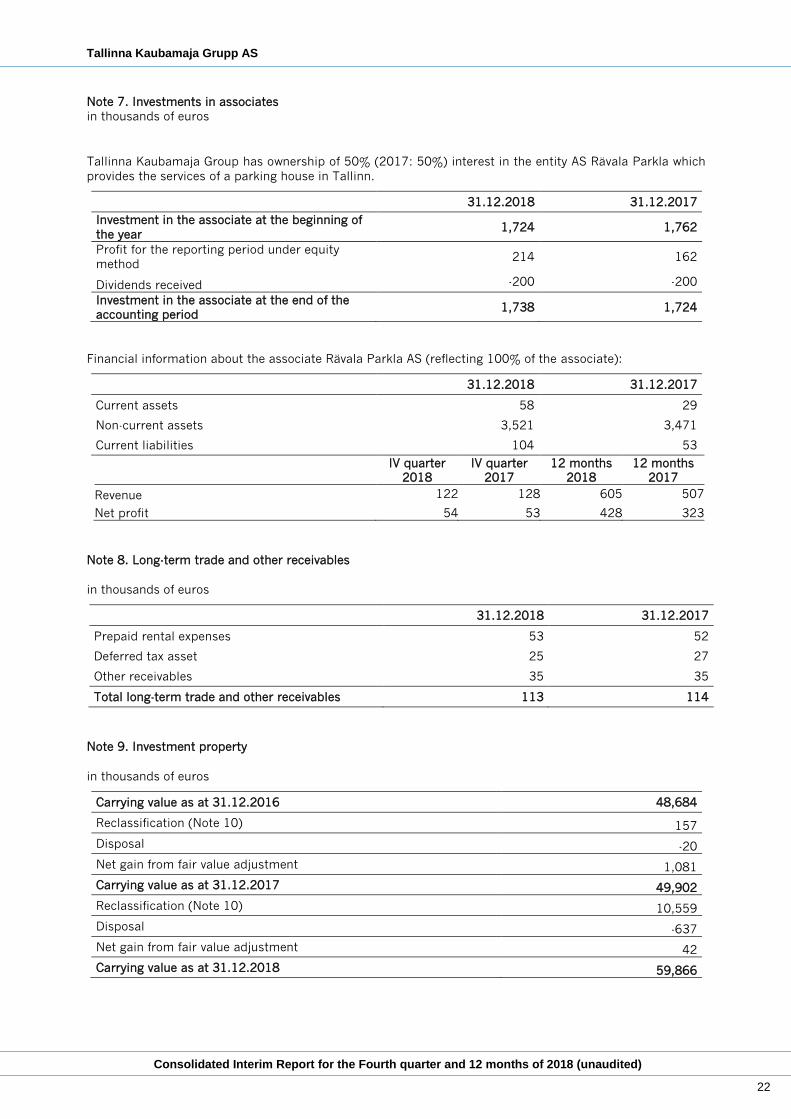
Note 7. Investments in associates
in thousands of euros
Tallinna Kaubamaja Group has ownership of 50% (2017: 50%) interest in the entity AS Rävala Parkla which
provides the services of a parking house in Tallinn.
31.12.2018 31.12.2017
Investment in the associate at the beginning of
the year 1,724 1,762
Profit for the reporting period under equity
method 214 162
Dividends received -200 -200
Investment in the associate at the end of the
accounting period 1,738 1,724
Financial information about the associate Rävala Parkla AS (reflecting 100% of the associate):
31.12.2018 31.12.2017
Current assets 58 29
Non-current assets 3,521 3,471
Current liabilities 104 53
IV quarter
2018
IV quarter
2017
12 months
2018
12 months
2017
Revenue 122 128 605 507
Net profit 54 53 428 323
Note 8. Long-term trade and other receivables
in thousands of euros
31.12.2018 31.12.2017
Prepaid rental expenses 53 52
Deferred tax asset 25 27
Other receivables 35 35
Total long-term trade and other receivables 113 114
Note 9. Investment property
in thousands of euros
Carrying value as at 31.12.2016 48,684
Reclassification (Note 10) 157
Disposal -20
Net gain from fair value adjustment 1,081
Carrying value as at 31.12.2017 49,902
Reclassification (Note 10) 10,559
Disposal -637
Net gain from fair value adjustment 42
Carrying value as at 31.12.2018 59,866

Tallinna Kaubamaja Grupp AS
Consolidated Interim Report for the Fourth quarter and 12 months of 2018 (unaudited)
23
Investment properties comprise immovables improved with commercial buildings and constructions in
progress. Property with commercial buildings (Viimsi shopping centre and Tartu Kaubamaja Shopping
Centre), which the Group maintains predominantly for earning rental income in Estonia, are partially classified
as investment properties and partially as property, plant and equipment as at 31.12.2018 and 31.12.2017.
Property in Rae municipal Peetri was reclassified as investment property from property, plant and equipment
in 2017. In Latvia, Rezekne commercial building and property is classified as investment property which the
Group maintains for earning rental income.
In current year, three objects in Latvia were reclassified as investment property in the amount of 9,388
thousand euros. Properties with commercial buildings, which the Group maintains predominantly for earning
rental income.
In 2018, Tartu Kaubamaja Shopping Centre renovation amounted to 201 thousand euros (2017: 157
thousand euros). Gas station at Peetri Selver was completed at value of 970 thousand euros (Note 10). In
the reporting period in Harju county, in Peetri, Veesaare road 5 a property was sold.
As a result, the valuation in 2018, the net fair value adjustment of investment property in Estonia in the
amount of 85 thousand euros recorded in the income statement line “Other operating income” (2017: 1,081
thousand euros). As a result, the valuation in 2018, the net fair value adjustment of investment property in
Latvia in the amount of 43 thousand euros recorded in the income statement line “Other operating expenses”.
No fair value change of investment property in Latvia was identified in 2017.

Tallinna Kaubamaja Grupp AS
Consolidated Interim Report for the Fourth quarter and 12 months of 2018 (unaudited)
24
Note 10. Property, plant and equipment
in thousands of euros
Land and
buildings
Machinery
and
equipment
Other
fixtures and
fittings
Construction
in progress
and
prepayments
Total
31.12.2016
Cost or revalued amount 164,456 33,797 34,978 44,315 277,546
Accumulated depreciation and impairment 0 -22,746 -22,320 -20,969 -66,035
Carrying value 164,456 11,051 12,658 23,346 211,511
Changes occurred in 2017
Purchases and improvements 1,893 356 134 12,395 14,778
Reclassification 2,173 4,500 3,838 -10,511 0
Reclassification to investment property
(Note 9) -157 0 0 0 -157
Disposals -8 -379 -18 -795 -1,200
Write-offs 0 -1 -38 0 -39
Decrease/increase in value through profit
or loss 0 0 0 2,144 2,144
Depreciation -5,049 -3,243 -4,270 0 -12,562
31.12.2017
Cost or revalued amount 167,890 37,114 37,634 44,584 287,222
Accumulated depreciation and impairment -4,582 -24,830 -25,330 -18,005 -72,747
Carrying value 163,308 12,284 12,304 26,579 214,475
Changes occurred in 2018
Purchases and improvements 700 1,277 1,459 12,555 15,991
Reclassification 5,379 3,146 3,638 -12,163 0
Reclassification (Note 11) 0 0 0 -140 -140
Reclassification to investment property
(Note 9) -9,388 0 0 -1,171 -10,559
Reclassification to inventory 0 -372 0 0 -372
Disposals -10 -25 -5 -9,285 -9,325
Write-offs -40 -22 -34 -1 -97
Decrease/increase in value through profit
or loss 171 0 0 -23 148
Increase in value through revaluation
reserve 15,266 0 0 0 15,266
Depreciation -4,810 -3,529 -4,361 0 -12,700
31.12.2018
Cost or revalued amount 170,576 40,456 41,235 27,579 279,846
Accumulated depreciation and impairment 0 -27,697 -28,234 -11,228 -67,159
Carrying value 170,576 12,759 13,001 16,351 212,687
The cost of investments for the 2018 amounted to 16,086 thousand euros (including purchases of property,
plant and equipment in the amount of 15,991 thousand euros and purchases of intangible assets amounted
to 95 thousand euros).
The cost of purchases of property, plant and equipment made in 2018 in the supermarket business segment was 8,842 thousand euros. In the reporting period, in Tallinn T1 shopping centre T1 Selver and in Põhja-Tallinn Kolde Selver opened. As well construction of e-shop storage begin. Additionally, construction of e- shop storage continued, computing technology for SelveEkspress self-service cashers and renewed store fittings were purchased.

Tallinna Kaubamaja Grupp AS
Consolidated Interim Report for the Fourth quarter and 12 months of 2018 (unaudited)
25
The cost of purchases of property, plant and equipment in the business segment of department store amounted to 2,415 thousand euros. In the reporting period, renovation of department store in Tartu took place and store fittings and computing technology was purchased.
The cost of purchases of property, plant and equipment in the reporting period was 659 thousand euros in the car trade business segment.
The cost of purchases of property, plant and equipment in the reporting period in the footwear segment was 242 thousand euros.
The cost of purchases of property, plant and equipment in the real estate business segment amounted to 3,833 thousand euros. In the reporting period the construction work of the gas station in Rae municipality, Raudkivi road and at the intersection of the Tartu road, next to Selver store in Peetri municipality were finished. According to the lease contract, part of the cost of the gas station was sold to the lessee. Gas station is a part of developments of Peetri Selver and was leased out to Circle K for a long term. Gas station is accordingly reclassified as investment property (Note 9). In the reporting period in Tallinn, Sõle 31, Kolde Selver construction work were carried out. Additionally renovation of Tartu Kaubamaja centre took place.
In the reporting period, seven items of the buildings under construction located in Latvia were sold at selling price of 9,000 thousand euros, profit on sale amounted to 395 thousand euros.
In the end of 2018 and 2017, Tallinna Kaubamaja Grupp AS companies had no commitments to purchase fixed assets.
At the year-end 2018, the fair value of “Land and buildings” and recoverable amount of “Construction in
progress” was assessed. The fair values of “Land and buildings” and the recoverable amounts of buildings
under construction (based on the value in use) were determined based on management’s judgment, using
the estimates of certified independent real estate experts for determining the inputs to be used or the fair
value of the items. The discounted cash flow model and market data (comparable transactions, rental
income, etc.) were both used for determining fair values as well as recoverable amounts.
The discount rates used for estimation were 8.0% -11.5% (2017: 8.5% - 11.5%) depending on the location
of the property and the rental growth rates were 1% - 2.5% (2017: 1% - 2.5%). For the purpose of estimating
the value of “Land and buildings”, the rental agreements in force have been used for determining the input
of the rental price, which management believes correspond to the market conditions. As a result of the
revaluation in 2018 the value of “Land and buildings” located in Estonia increased by 14,280 thousand euros
which was recognized through revaluation reserve and increase in value was recognized through profit and
loss in the amount of 171 thousand euros. As a result of the revaluation in 2017 the value of “Land and
buildings” located in Estonia was adjusted neither upwards nor downwards.
The discount rates used for estimation of “Land and Buildings” located in Latvia were 9.5% (2017: 10.0% -
13.0%) and the rental growth rates were 2.5% (2017: 1.1% -2.5%). As a result of the revaluation in 2018
the value of “Land and buildings” located in Latvia increased by 986 thousand euros which was recognized
through revaluation reserve. As a result of the revaluation in 2017 the value of “Land and buildings” located
in Latvia was adjusted neither upwards nor downwards.
As a result of the revaluation in 2018 and 2017 the value of “Land and buildings” located in Lithuania was
adjusted neither upwards nor downwards.
The value of “Construction in progress” located in Estonia was adjusted neither upwards nor downwards in
2018 and 2017.
The value of “Construction in progress” located in Latvia decreased by 23 thousand euros and was recognized
through profit and loss. In 2017 the value of “Construction in progress” located in Latvia increased by 2,144
thousand euros which was recognized through profit and loss. The value of “Construction in progress” located
in Lithuania was adjusted neither upwards nor downwards in 2018 and 2017.

Tallinna Kaubamaja Grupp AS
Consolidated Interim Report for the Fourth quarter and 12 months of 2018 (unaudited)
26
Note 11. Intangible assets
in thousands of euros
Goodwill Trademark Beneficial
contracts
Develop-
ment
expendi-
ture
Total
31.12.2016
Cost or revalued amount 6,814 5,277 1,080 1,317 14,488
Accumulated amortisation and impairment -1,441 -3,030 -1,080 -432 -5,983
Carrying value 5,373 2,247 0 885 8,505
Changes occurred in 2017
Purchases and improvements 0 0 0 69 69
Amortisation 0 -487 0 -233 -720
Impairment -2,113 -66 0 0 -2,179
31.12.2017
Cost or revalued amount 3,260 5,277 1,080 1,386 11,003
Accumulated amortisation and impairment 0 -3,583 -1,080 -665 -5,328
Carrying value 3,260 1,694 0 721 5,675
Changes occurred in 2018
Purchases and improvements 0 0 0 95 95
Reclassification (Note 10) 0 0 0 140 140
Amortisation 0 -497 0 -280 -777
31.12.2018
Cost or revalued amount 3,260 5,277 0 1,602 10,139
Accumulated amortisation and impairment 0 -4,080 0 -926 -5,006
Carrying value 3,260 1,197 0 676 5,133
In the reporting period, the Group capitalised costs of a web page update and e-shop as development
expenditure in the amount of 95 thousand euros (2017: 69 thousand euros).
As a trademark, the Group has recognised the image of ABC King at cost value of 3,509 thousand euros; the
image contains a combination of the name, symbol and design together with recognition and preference by
consumers. Trademark will be amortised during 15 years. In 2017, a trademark of ABC King as adjusted
downwards in the amount of 66 thousand euros.
Trademark at value of 1,588 thousand euros was acquired in 2012 through purchase of AS Viking Motors
shares. Trademark will be amortised during 7 years.
Trademark at value of 180 thousand euros was acquired in 2014 through purchase of Viking Security AS
shares. Trademark will be amortised during 7 years.
Goodwill is allocated to cash generating units of the Group by the following segments:
in thousands of euros 31.12.2018 31.12.2017
Car trade 3,156 3,156
Department store 104 104
Total 3,260 3,260
The recoverable amount (based on value in use) was determined on the basis of future cash flows for the
next five years. In all units, except in footwear trade, it was evident that the present value of cash flows covers
the value of goodwill and trademark as well as beneficial lease agreements and other assets related to the
unit. In 2017 in footwear trade, it was evident that the present value of cash flows does not cover the value
of goodwill. Accordingly goodwill in footwear trade was adjusted downwards in the amount of 2,113 thousand
euros.

Tallinna Kaubamaja Grupp AS
Consolidated Interim Report for the Fourth quarter and 12 months of 2018 (unaudited)
27
Note 12. Borrowings
in thousands of euros
31.12.2018 31.12.2017
Short-term borrowings
Overdraft 7,354 7,811
Bank loans 16,424 45,002
Other borrowings 2,224 2,005
Total short-term borrowings 26,002 54,818
in thousands of euros
31.12.2018 31.12.2017
Long-term borrowings
Bank loans 68,202 48,570
Other borrowings 111 162
Total long-term borrowings 68,313 48,732
Total borrowings 94,315 103,550
Borrowings received
in thousands of euros
IV quarter
2018
IV quarter
2017
12 months
2018
12 months
2017
Overdraft 0 4,264 0 4,794
Bank loans 2,393 17,543 79,020 60,392
Other borrowings 882 759 5,040 3,327
Total borrowings received 3 275 22,566 84,060 68,513
Borrowings paid
in thousands of euros
IV quarter
2018
IV quarter
2017
12 months
2018
12 months
2017
Overdraft 141 0 457 0
Bank loans 6,054 13,088 87,965 62,132
Other borrowings 1,238 708 4,873 3,455
Total borrowings paid 7,433 13,796 93,295 65,587
Bank loans and other borrowings are denominated in euros.
As of 31.12.2018, the repayment dates of bank loans are between 28.01.2019 and 12.12.2023 (31.12.2017:
between 30.04.2018 and 15.11.2022), interest is tied both to 3-month and 6-month EURIBOR as well as
EONIA. Weighted average interest rate was 1.06% (2017: 0.93%).

Tallinna Kaubamaja Grupp AS
Consolidated Interim Report for the Fourth quarter and 12 months of 2018 (unaudited)
28
Net debt reconciliation
in thousands of euros
31.12.2018 31.12.2017
Cash and cash equivalents (Note 2) 37,235 33,662
Short-term borrowings -26,002 -54,818
Long-term borrowings -68,313 -48,732
Net debt -57,080 -69,888
Cash and cash equivalents (Note 2) 37,235 33,662
Gross debt – fixed interest rates -11,537 -25,493
Gross debt – variable interest rates -82,778 -78,057
Net debt -57,080 -69,888
Cash and cash
equivalents Overdraft
Borrowings
due within 1
year
Borrowings due
after 1 year Total
Net debt 31.12.2016 32,375 -3,017 -23,835 -73,772 -68,249
Cash flows 1,287 -4,794 -23,172 25,040 -1,639
Net debt 31.12.2017 33,662 -7,811 -47,007 -48,732 -69,888
Cash flows 3,573 457 28,359 -19,581 12,808
Net debt 31.12.2018 37,235 -7,354 -18,648 -68,313 -57,080
Note 13. Trade and other payables
in thousands of euros
31.12.2018 31.12.2017
Trade payables 67,266 61,919
Payables to related parties (Note 20) 3,965 3,750
Other accrued expenses 145 116
Prepayments by tenants 2,682 3,666
Total financial liabilities from balance sheet line
“Trade and other payables” 74,058 69,451
Taxes payable (Note 14) 8,089 7,896
Employee payables 6,916 6,461
Prepayments 1,630 1,671
Short-term provisions* 82 90
Total trade and other payables 90,775 85,569
*Short-term provisions represent warranty provisions related to footwear trade.

Tallinna Kaubamaja Grupp AS
Consolidated Interim Report for the Fourth quarter and 12 months of 2018 (unaudited)
29
Note 14. Taxes
in thousands of euros
31.12.2018 31.12.2017
Prepaid
taxes
Taxes
payable
Prepaid
taxes
Taxes
payable
Prepaid taxes 16 0 36 0
Value added tax 0 4,022 0 3,949
Personal income tax 0 948 0 970
Social security taxes 0 2,737 0 2,498
Corporate income tax 0 74 0 192
Unemployment insurance 0 180 0 164
Mandatory funded pension 0 128 0 123
Total taxes 16 8,089 36 7,896
Note 15. Share capital
As of 31.12.2018 and 31.12.2017, the share capital in the amount of 16,292 thousand euros consisted of
40,729,200 ordinary shares with the nominal value of 0.40 euros per share. All shares issued have been paid
for. According to the articles of association, the maximum allowed number of shares is 162,916,800 shares.
In 2018, dividends were declared and paid to the shareholders in the amount of 28,102 thousand euros, or
0.69 euros per share. Related income tax on dividends amounted to 6,249 thousand euros. In 2017,
dividends were paid to the shareholders in the amount of 25,659 thousand euros, or 0.63 euros per share.
Related income tax on dividends amounted to 6,371 thousand euros.
Note 16. Segment reporting
The Group has defined the business segments based on the reports used regularly by the supervisory board
to make strategic decisions.
The chief operating decision maker monitors the Group’s operations by activities. With regard to areas of
activity, the operating activities are monitored in the department store, supermarket, real estate, car trade,
footwear trade, beauty products (I.L.U.) and security segments. The measures of I.L.U. and security segment
are below the quantitative criteria of the reporting segment specified in IFRS 8; these segments have been
aggregated with the department store segment because they have similar economic characteristics and are
similar in other respects specified in IFRS 8.
The main area of activity of department stores, supermarkets, footwear trade and car trade is retail trade.
Supermarkets focus on the sale of food products and convenience goods, the department stores on the sale
of beauty and fashion products, the car trade on the sale of cars and spare parts. Among others, in the car
trade segment cars are sold at wholesale prices to authorised car dealers. The share of wholesale trade in
other segments is insignificant. The real estate segment deals with the management and maintenance of real
estate owned by the Group, and with the rental of commercial premises.
The activities of the Group are carried out in Estonia, Latvia and Lithuania. The Group operates in all the five
operating segments in Estonia. The Company is engaged in car trade and real estate development in Latvia
and in Lithuania.
The disclosures of financial information correspond to the information that is periodically reported to the
Supervisory Board. Measures of income statement, segment assets and liabilities have been measured in
accordance with accounting policies used in the preparation of the financial statements. Main measures that
Supervisory Board monitors are segment revenue (external segment and inter-segment revenue), EBITDA
(earnings before interest, taxes, depreciation and amortisation) and net profit or loss.

Tallinna Kaubamaja Grupp AS
Consolidated Interim Report for the Fourth quarter and 12 months of 2018 (unaudited)
30
in thousands of euros
IV quarter 2018
Super
markets
Depart-
ment
store
Car
trade
Footwear
trade
Real
estate
Inter-
segment
transact-
ions
Total
seg-
ments
External revenue 122,519 31,557 24,249 2,619 1,408 0 182,352
Inter-segment revenue 229 1,772 13 53 3,167 -5,234 0
Total revenue 122,748 33,329 24,262 2,672 4,575 -5,234 182,352
EBITDA 7,283 3,307 780 218 3,422 0 15,010
Segment depreciation and
impairment losses -1,557 -647 42 -111 -954 0 -3,227
Operating profit 5,726 2,660 822 107 2,468 0 11,783
Finance income 77 237 0 0 3 -317 0
Finance income on shares
of associates 0 27 0 0 0 0 27
Finance costs -39 -82 -180 -71 -182 317 -237
Income tax -1 0 -48 0 0 0 -49
Net profit 5,763 2,842 594 36 2,289 0 11,524
incl. in Estonia 5,568 2,842 633 36 3,559 0 12,638
incl. in Latvia 195 0 14 0 -1,259 0 -1,050
incl. in Lithuania 0 0 -53 0 -11 0 -64
Segment assets 99,816 72,081 33,432 5,069 263,158 -62,479 411,077
Segment liabilities 74,434 38,914 22,758 8,218 83,575 -42,439 185,460
Segment investments in
property, plant and
equipment
3,999 459 225 183 702 0 5,568
Segment investments in
intangible assets 93 -56 2 0 -2 0 37
Increase in value of
property, plant and
equipment through profit
or loss (Note 10)
0 0 171 0 0 0 171
Impairment of property, plant
and equipment through profit or
loss (Note 10)
0 0 0 0 -23 0 -23
Increase in value through
revaluation reserve (Note 10) 81 0 0 0 15,185 0 15,266
Fair value adjustment of
investment property (Note 9) 0 0 0 0 42 0 42

Tallinna Kaubamaja Grupp AS
Consolidated Interim Report for the Fourth quarter and 12 months of 2018 (unaudited)
31
in thousands of euros
IV quarter 2017
Super
markets
Depart-
ment store
Car
trade
Footwear
trade
Real
estate
Inter-
segment
transact-
ions
Total
seg-
ments
External revenue 116,055 31,014 23,580 3,070 1,312 0 175,031
Inter-segment revenue 279 1,706 22 29 3,223 -5,259 0
Total revenue 116,334 32,720 23,602 3,099 4,535 -5,259 175,031
EBITDA 7,074 2,663 877 360 4,805 0 15,779
Segment depreciation and
impairment losses -1,479 -617 -129 -2,287 1,103 0 -3,409
Operating profit/loss 5,595 2,046 748 -1,927 5,908 0 12,370
Finance income 76 306 0 0 8 -390 0
Finance income on shares
of associates 0 27 0 0 0 0 27
Finance costs -52 -87 -197 -106 -150 390 -202
Income tax 0 0 -162 0 -113 0 -275
Net profit/loss 5,619 2,292 389 -2,033 5,653 0 11,920
incl. in Estonia 6,150 2,292 570 -2,033 3,437 0 10,416
incl. in Latvia -531 0 -163 0 2,227 0 1,533
incl. in Lithuania 0 0 -18 0 -11 0 -29
Segment assets 94,473 74,658 38,682 6,275 242,700 -59,293 397,495
Segment liabilities 67,476 40,413 28,687 10,184 83,114 -40,395 189,479
Segment investments in
property, plant and
equipment
2,295 605 203 1 1,526 0 4,630
Segment investments in
intangible assets 0 19 0 0 15 0 34
Increase in value of
property, plant and
equipment through profit
or loss (Note 10)
0 0 0 0 2,388 0 2,388
Impairment of property, plant
and equipment through profit or
loss (Note 10)
0 0 0 0 -244 0 -244
Impairment of intangible assets
(Note 11) 0 0 0 -2,179 0 0 -2,179
Fair value adjustment of
investment property (Note 9) 0 0 0 0 1,081 0 1,081

Tallinna Kaubamaja Grupp AS
Consolidated Interim Report for the Fourth quarter and 12 months of 2018 (unaudited)
32
in thousands of euros
12 months 2018
Super
markets
Depart-
ment
store Car trade
Footwear
trade
Real
estate
Inter-
segment
transact-
ions
Total
seg-
ments
External revenue 450,098 100,883 114,934 9,828 5,438 0 681,181
Inter-segment revenue 1,127 6,305 73 147 12,798 -20,450 0
Total revenue 451,225 107,188 115,007 9,975 18,236 -20,450 681,181
EBITDA 24,562 6,095 5,125 159 14,817 0 50,758
Segment depreciation and
impairment losses -6,089 -2,566 -336 -415 -4,020 0 -13,426
Operating profit/loss 18,473 3,529 4,789 -256 10,797 0 37,332
Finance income 302 396 0 1 28 -726 1
Finance income on shares
of associates 0 214 0 0 0 0 214
Finance costs -140 -341 -347 -128 -580 726 -810
Income tax -4,050 -939 -792 0 -518 0 -6,299
Net profit/loss 14,585 2,859 3,650 -383 9,727 0 30,438
incl. in Estonia 14,603 2,859 3,009 -383 11,303 0 31,391
incl. in Latvia -18 0 377 0 -1,532 0 -1,173
incl. in Lithuania 0 0 264 0 -44 0 220
Segment assets 99,816 72,081 33,432 5,069 263,158 -62,479 411,077
Segment liabilities 74,434 38,914 22,758 8,218 83,575 -42,439 185,460
Segment investments in
property, plant and
equipment (Note 10)
8,842 2,415 659 242 3,833 0 15,991
Segment investments in
intangible assets (Note 11) 93 0 2 0 0 0 95
Increase in value of
property, plant and
equipment through profit
or loss (Note 10)
0 0 171 0 0 0 171
Impairment of property, plant
and equipment through profit or
loss (Note 10)
0 0 0 0 -23 0 -23
Increase in value through
revaluation reserve (Note 10) 81 0 0 0 15,185 0 15,266
Fair value adjustment of
investment property (Note 9) 0 0 0 0 42 0 42

Tallinna Kaubamaja Grupp AS
Consolidated Interim Report for the Fourth quarter and 12 months of 2018 (unaudited)
33
in thousands of euros
12 months 2017
Super
markets
Depart-
ment
store
Car
trade
Footwear
trade
Real
estate
Inter-
segment
transact-
ions
Total
seg-
ments
External revenue 433,111 102,375 99,673 11,068 5,030 0 651,257
Inter-segment revenue 1,127 6,305 73 147 12,798 -20,450 0
Total revenue 434,238 108,680 99,746 11,215 17,828 -20,450 651,257
EBITDA 22,226 6,566 4,815 -266 17,122 0 50,463
Segment depreciation and
impairment losses -5,534 -2,612 -525 -2,639 -2,046 0 -13,356
Operating profit/loss 16,692 3,954 4,290 -2,905 15,076 0 37,107
Finance income 262 652 12 1 134 -1,060 1
Finance income on shares
of associates 0 162 0 0 0 0 162
Finance costs -113 -440 -386 -189 -705 1,060 -773
Income tax -3,607 -888 -654 0 -1,517 0 -6,666
Net profit/loss 13,234 3,440 3,262 -3,093 12,988 0 29,831
incl. in Estonia 15,348 3,440 2,868 -3,093 10,100 0 28,663
incl. in Latvia -2,114 0 204 0 2,925 0 1,015
incl. in Lithuania 0 0 190 0 -37 0 153
Segment assets 94,473 74,658 38,682 6,275 242,700 -59,293 397,495
Segment liabilities 67,476 40,413 28,687 10,184 83,114 -40,395 189,479
Segment investments in
property, plant and
equipment (Note 10)
8,662 1,257 728 94 4,037 0 14,778
Segment investments in
intangible assets (Note 11) 1 52 0 0 16 0 69
Increase in value of
property, plant and
equipment through profit
or loss (Note 10)
0 0 0 0 2,388 0 2,388
Impairment of property, plant
and equipment through profit or
loss (Note 10)
0 0 0 0 -244 0 -244
Impairment of intangible assets
(Note 11) 0 0 0 -2,179 0 0 -2,179
Fair value adjustment of
investment property (Note 9) 0 0 0 0 1,081 0 1,081
External revenue according to types of goods and services sold
in thousands of euros
IV quarter
2018
IV quarter
2017
12 months
2018
12 months
2017
Retail revenue 166,970 159,613 620,048 592,768
Wholesale revenue 6,725 7,024 32,736 28,731
Rental income 2,544 2,312 9,737 9,317
Revenue for rendering services 6,113 6,082 18,660 20,441
Total revenue 182,352 175,031 681,181 651,257
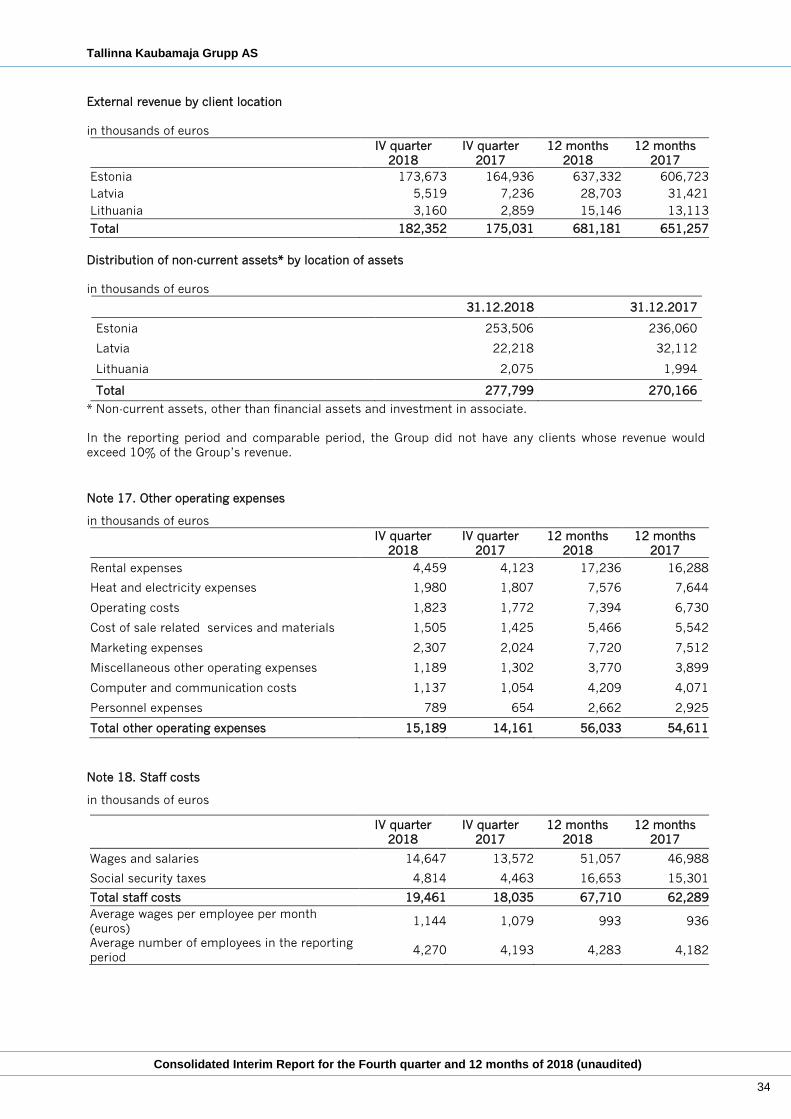
Tallinna Kaubamaja Grupp AS
Consolidated Interim Report for the Fourth quarter and 12 months of 2018 (unaudited)
34
External revenue by client location
in thousands of euros
IV quarter
2018
IV quarter
2017
12 months
2018
12 months
2017
Estonia 173,673 164,936 637,332 606,723
Latvia 5,519 7,236 28,703 31,421
Lithuania 3,160 2,859 15,146 13,113
Total 182,352 175,031 681,181 651,257
Distribution of non-current assets* by location of assets
in thousands of euros
31.12.2018 31.12.2017
Estonia 253,506 236,060
Latvia 22,218 32,112
Lithuania 2,075 1,994
Total 277,799 270,166
* Non-current assets, other than financial assets and investment in associate.
In the reporting period and comparable period, the Group did not have any clients whose revenue would
exceed 10% of the Group’s revenue.
Note 17. Other operating expenses
in thousands of euros
IV quarter
2018
IV quarter
2017
12 months
2018
12 months
2017
Rental expenses 4,459 4,123 17,236 16,288
Heat and electricity expenses 1,980 1,807 7,576 7,644
Operating costs 1,823 1,772 7,394 6,730
Cost of sale related services and materials 1,505 1,425 5,466 5,542
Marketing expenses 2,307 2,024 7,720 7,512
Miscellaneous other operating expenses 1,189 1,302 3,770 3,899
Computer and communication costs 1,137 1,054 4,209 4,071
Personnel expenses 789 654 2,662 2,925
Total other operating expenses 15,189 14,161 56,033 54,611
Note 18. Staff costs
in thousands of euros
IV quarter
2018
IV quarter
2017
12 months
2018
12 months
2017
Wages and salaries 14,647 13,572 51,057 46,988
Social security taxes 4,814 4,463 16,653 15,301
Total staff costs 19,461 18,035 67,710 62,289
Average wages per employee per month
(euros) 1,144 1,079 993 936
Average number of employees in the reporting
period 4,270 4,193 4,283 4,182

Tallinna Kaubamaja Grupp AS
Consolidated Interim Report for the Fourth quarter and 12 months of 2018 (unaudited)
35
Note 19. Earnings per share
For calculating the basic earnings per share, the net profit to be distributed to the Parent’s shareholders is
divided by the weighted average number of ordinary shares in circulation. As the Company does not have
potential ordinary shares, the diluted earnings per share equal basic earnings per share.
IV quarter
2018
IV quarter
2017
12 months
2018
12 months
2017
Net profit (in thousands of euros) 11,524 11,920 30,438 29,831
Weighted average number of shares 40,729,200 40,729,200 40,729,200 40,729,200
Basic and diluted earnings per share (euros) 0.28 0.29 0.75 0.73
Note 20. Related party transactions
in thousands of euros
In preparing the consolidated interim report of Tallinna Kaubamaja Grupp AS, the following parties have been
considered as related parties:
a. owners (Parent and the persons controlling or having significant influence over the Parent);
b. associates;
c. other entities in the Parent’s consolidation group.
d. management and supervisory boards of the Group companies;
e. close relatives of the persons described above and the entities under their control or significant influence.
Majority shareholder of Tallinna Kaubamaja Grupp AS is OÜ NG Investeeringud. Majority shareholder of OÜ
NG Investeeringud is NG Kapital OÜ. NG Kapital OÜ is the ultimate controlling party of Tallinna Kaubamaja
Grupp AS.
The Tallinna Kaubamaja Group has purchased and sold goods, services and non-current assets as follows:
Purchases
12 months
2018
Sales 12
months
2018
Purchases
12 months
2017
Sales 12
months 2017
Parent 325 16 501 38
Entities in the Parent’s consolidation group 26,135 3,298 25,918 4,214
Members of management and supervisory
boards 10 40 0 87
Other related parties 498 16 811 133
Total 26,968 3,370 27,230 4,472
A major part of the purchases from the entities in the Parent’s consolidation group is made up of goods
purchased for sale. Purchases from the Parent are mostly made up of management fees. Sales to related
parties are mostly made up of services provided.
Balances with related parties:
31.12.2018 31.12.2017
Receivable from Parent (Note 4) 290 392
Members of management and supervisory
boards (Note 3) 1 0
Total receivables from related parties 291 392

Tallinna Kaubamaja Grupp AS
Consolidated Interim Report for the Fourth quarter and 12 months of 2018 (unaudited)
36
31.12.2018 31.12.2017
Parent 19 19
Entities in the Parent’s consolidation group 3,934 3,696
Other related parties 12 35
Total liabilities to related parties (Note 13) 3,965 3,750
Receivables from and liabilities to related parties are unsecured and carry no interest because they have
regular payment terms.
For arranging funding for its subsidiaries, the Group uses the group account, the members of which are most
of the Group’s entities. In its turn, this group as a subgroup is a member of the group account of NG
Investeeringud OÜ (hereinafter head group). From autumn 2001, Tallinna Kaubamaja Grupp AS has been
keeping its available funds at the head group account, earning interest income on its deposits. During 12
months of 2018 and 12 months of 2017, the Group has not earned interest income on its deposits of available
funds.
As at 31 December 2018 and 31 December 2017, Tallinna Kaubamaja Grupp AS had not deposited any funds
through parent company NG Investeeringud OÜ and had not used available funds of parent. According to the
group account contract, the Group’s members are jointly responsible for the unpaid amount to the bank.
Remuneration paid to the members of the Management and Supervisory Board
Short term benefits to the management boards’ members of the Tallinna Kaubamaja Group for the reporting
period including wages, social security taxes, bonuses and car expenses, amounted to 1,990 thousand euros
(2017: 1,815 thousand euros). Short-term benefits to supervisory boards’ members of the Group in reporting
period including social taxes amounted to 628 thousand euros (2017: 565 thousand euros).
The termination benefits for the members of the Management Board are limited to 3- month’s salary expense.