AS TALLINNA VESI - Nasdaq
32
AS TALLINNA VESI Consolidated Interim Report for the 4 th quarter of 2020 29 January 2021
Transcript of AS TALLINNA VESI - Nasdaq

AS TALLINNA VESI
Consolidated Interim Report for the 4th quarter of 2020
29 January 2021

Currency
Start of reporting period
End of reporting period
Address
Chairman of the Management Board
Commercial register number
Telephone
Telefax
Website
Field of activity
Thousand euros
1 January 2020
31 December 2020
Ädala St. 10, Tallinn, Estonia
Karl Heino Brookes
10 257 326
+372 62 62 200
+372 62 62 300
www.tallinnavesi.ee
Production, treatment and distribution of water;
storm and wastewater disposal and treatment
Contents Page
MANAGEMENT REPORT 3
MANAGEMENT CONFIRMATION 18
CONSOLIDATED STATEMENT OF FINANCIAL POSITION 19 CONSOLIDATED STATEMENT OF COMPREHENSIVE INCOME 20 CONSOLIDATED CASH FLOW STATEMENT 21 CONSOLIDATED STATEMENT OF CHANGES IN EQUITY 22
NOTES TO THE ACCOUNTS
22 23 24 24 25 26 27 28 29 29 3030 30 31
NOTE 1. ACCOUNTING PRINCIPLES NOTE 2. CRITICAL ACCOUNTING ESTIMATESNOTE 3. CASH AND CASH EQUIVALENTSNOTE 4. PROPERTY, PLANT AND EQUIPMENTNOTE 5. INTANGIBLE ASSETSNOTE 6. PROVISION FOR POSSIBLE THIRD-PARTY CLAIMSNOTE 7. SEGMENT REPORTINGNOTE 8. STAFF COSTSNOTE 9. COST OF GOODS/SERVICES SOLD, MARKETING AND ADMINISTRATIVE EXPENSES NOTE 10. OTHER INCOME / EXPENSESNOTE 11. FINANCIAL INCOME AND EXPENSESNOTE 12. DIVIDENDS NOTE 13. EARNINGS PER SHARE NOTE 14. RELATED PARTIESNOTE 15. LIST OF SUPERVISORY BOARD MEMBERS 32
2

MANAGEMENT REPORT
Chairman´s summary
2020 was an extraordinary year due to the COVID-19 pandemic and caused Tallinna Vesi to make changes
in its working arrangements, to ensure the continued safety of staff and uninterrupted services to our
customers. This ensured we maintained high standards in the quality of both drinking water and final
treated effluent, as well as improved network reliability. A number of quality parameters showed a record
performance in 2020.
Due to the reduced tariffs applicable since the end of last year, and decreased commercial consumption
driven by the virus restrictions, the Company's revenues and profits for the fourth quarter and 12 months
of 2020 were lower in comparison with the same period last year. According to external forecasts, the
impact of the pandemic will gradually start to reverse as the vaccine is implemented. We are therefore
optimistic that consumption will also revert back to pre-pandemic volumes in the longer term.
Financial performance reflects the impacts of Coronavirus
The Company’s sales revenue for the 4th quarter of 2020 decreased compared to the same period in 2019, resulting mainly from the reductions in tariffs effective from 1 December 2019 and lower consumption of commercial customers, due to the COVID-19 pandemic. Sales revenue for the 4th quarter of 2020 was €13.17 million, reduced by 18.3%, or €2.95 million compared to the same period in 2019.
Sales to private customers were €5.13, showing a decrease by 15.2%, due to the reduced tariffs mentioned previously. Sales to commercial customers reduced by 25.7% to €3.81 million, which is a consequence of lower tariffs, as well as 16% lower consumption by businesses. The hospitality sector has seen the greatest impact from the pandemic.
The gross profit for the 4th quarter of 2020 was €5.64 million, showing a reduction of 29.4%, which is attributable to the lower sales revenue. The operating profit was €5.76 million, which is a reduction of €5.31 million or 48.0% compared to the previous year. Besides the negative changes in tariffs and consumption, the operating profit was positively impacted by the €1.2 million reduction in the provision associated with third-party claims as was also done in the previous quarters.
The net profit for the 4th quarter of 2020 was €5.39 million, showing a decrease of 50,8% compared to the same period last year. In terms of the full year of 2020, the Company’s total sales revenue was €51.72 million, which represents an 18.5% decrease year-on-year. Considering the imminent roll out of the coronavirus vaccinations, we remain optimistic that consumption will revert back to pre-pandemic volumes, as the hospitality sector starts to recover in Tallinn.
Reliable water and wastewater service
In 2019, the water samples taken from customer’s taps were 99.0% compliant with all quality requirements,
in 2020 this same parameter reached 99.7%. This is a result of further investments into the network and
enhanced maintenance regimes, which were introduced following the introduction of a more sensitive water
quality test into Estonia
The Company has made great efforts to reduce leakages in the water network, and the all-time low record of
12.42% in leakage rate that the Company achieved in 2020, is a testament to that work. The leakage rate for
2019 was 12.97%.
Similar to previous years, the final treated effluent at Paljassaare Wastewater Treatment Plant was 100%
compliant with all quality requirements in 2020.
We work hard to limit interruptions in the water network and minimise their duration when they occur. During
2020, the average water disruption time remained stable at 2 hours and 56 minutes per property compared
to 2 hours and 59 minutes in 2019.
The number of sewer blockages and sewer collapses showed a significant improvement in comparison with
2019, reducing by 13% and 22% respectively.
3

In terms of enhancing the reliability of water supply service to customers, the largest project delivered was
on Punane Street, where the water main supplying 100,000 residents in Lasnamäe and Maardu, was
reconstructed. Another key project related to a section of the water pipe on Järvevana Rd, improving the
security of water supply for residents and companies in the Mustamäe and Õismäe districts of Tallinn. Also,
the pumping stations on Jääraku Str in Pirita-Kose and on Kolde Blvd in Northern Tallinn received investments
related to new technology and telemetry.
Tallinna Vesi commenced the reconstruction of the mechanical treatment stage at Paljassaare wastewater
treatment plant – one of largest projects of the past decade for the company. This major project will continue
throughout 2021. During 2020, we reconstructed a large collector at Kadaka Blvd, which directs wastewater
from Saku, Saue, Laagri and approximately half of the properties in Nõmme District, to the Company’s
wastewater treatment plant at Paljassaare.
Our aim is to provide a high-quality and uninterrupted service to our customers. To ensure that, we
consistently monitor our performance in terms of keeping our promises made to customers, giving swift
responses and reducing the likelihood of complaints. We managed to maintain high standards in keeping our
promises, and only had one failure in 2020. In 2020, we had approximately 24% less inquiries from our
customers in connection with the most frequent subjects, such as water quality, pressure and sewer
blockages, which is a positive trend.
In 2020, we carried on supporting the initiatives that help to resolve some of the issues in the community We
continued to provide free drinking water to community events. Due to the spread of coronavirus, we had to
postpone the open-door days at our treatment plants, but we will continue with these at the first opportunity.
We will also be developing digital educational videos aimed at promoting environmental awareness among
children and young people.
OPERATIONAL INDICATORS FOR TWELVE MONTHS OF 2020
*Since 2020, only the cases in the water company’s control are classified as complaints.
**In 2019 and before, all critical inquiries were classified as complaints.
Karl Heino Brookes
Chairman of the Management Board
Indicator Unit 2020 2019 2018
Compliance of water quality at the customers’ tap % 99.7 99.0 99.9
Water loss in the water distribution network % 12.4 13.0 13.7
Average duration of water interruptions per property in hours h 2.93 2.99 3.27
Number of sewer blockages No 463 532 603
Number of sewer collapses No 80 103 88
Wastewater treatment compliance with environmental standards % 100.0 100.0 100.0
Number of customer complaints (*/**) No 40*/
181** 41/ 167
44/ 158
Number of customer contacts regarding water quality No 323 508 258
Number of customer contacts regarding water pressure No 359 478 439
Number of customer contacts regarding blockages and discharge of storm water
No 864 1,047 1,043
Responding written customer contacts within at least 2 workdays % 100.0 100.0 100.0
Number of failed promises cases No 1 7 4
Notification of unplanned water interruptions at least 1 h before % 98.9 96.2 95.2
4

FINANCIAL HIGHLIGHTS OF THE 4th QUARTER OF 2020
Economic environment has significantly changed in the world and in Estonia resulting from ongoing
coronavirus pandemic. The virus started to spread again more actively at the end of 3rd quarter, which made
it necessary to control it with additional restrictions. The extent of the new outbreak of the virus and the
associated economic impact are difficult to predict, the latest economic forecast from the Bank of Estonia
published in December indicates that in 2020 the economy contracted by 2.5%. This is a much softer decline
than was predicted when the coronavirus crisis broke out and is also one of the smallest in Europe. The
relatively gentle setback could mean that exiting the crisis will be easier. If vaccination will be successful and
the spread of the virus will be brought under the control in the first half of 2021, the economy is expected to
start growing again in the second quarter of 2021 and GDP is expected to grow by 2.9% compared to 2020.
Pandemic has among other factors impacted the Company´s financial results, due to which the Company's
revenues and profit are lower compared to the same period in 2019.
The Group’s sales revenues during the 4th quarter of 2020 were €13.17 million, being down by 18.3% or €2.95
million compared to the same period in 2019.
The gross profit in the 4th quarter of 2020 was €5.64 million, showing a decrease of 29.4% or €2.35 million.
The decrease in gross profit was fully related to lower revenues as the total cost of goods and services sold
was lower than in comparative period. The revenues were mainly impacted by decrease in water and
wastewater revenues from private and commercial customers within the service area, which were mostly
affected by new lower tariffs from 1/12/2019, accompanied by decrease in consumption of commercial
customers, which was related to pandemic.
The operating profit was €5.76 million, showing a decrease of 48.0% or €5.31 million. In addition to above-
mentioned changes in gross profit, the operating profit in the 4th quarter of 2020 was impacted by €1.20
million positive change in the provision formed for the possible third-party claims. The operating profit for the
4th quarter of 2020 before the impact resulted from the change of provision formed for the possible third-
party claims was €4.55 million, compared to €6.44 million operating profit in the 4th quarter of 2019, being
lower by 29.3% or €1.88 million year-on-year.
The net profit for the 4th quarter of 2020 was €5.39 million, showing a decrease of 50.8% or €5.56 million. The
net profit was mainly impacted by above-mentioned changes in the operating profit, accompanied deferred
tax expense of €0.25 million and by lower net financial expenses. The changes in the financial expenses were
influenced by lower interest expense and expiring of swap contracts in the middle of 4th quarter. The net profit
for the 4th quarter of 2020 without the impact resulted from the change of the fair value of swap contracts
and the change of provision for the possible third-party claims was €4.16 million compared to €6.23 million
net profit in 2019, being lower by 33.2% or €2.07 million year-on-year.
5

MAIN FINANCIAL INDICATORS
€ million, except key ratios
4th quarter Change
2020/ 2019
12 months Change
2020/ 2019 2020 2019 2018 2020 2019 2018
Sales 13.17 16.12 16.23 -18.3% 51.72 63.42 62.78 -18.5%
Gross profit 5.64 7.98 8.38 -29.4% 22.23 33.95 34.19 -34.5%
Gross profit margin % 42.78 49.49 51.61 -13.6% 42.97 53.53 54.45 -19.7%
Operating profit before depreciation and amortisation 7.41 12.72 6.82 -41.7% 28.07 38.18 32.73 -26.5%
Operating profit before depreciation and amortisation margin % 56.23 78.86 42.01 -28.7% 54.27 60.21 52.13 -9.9%
Operating profit 5.76 11.06 5.29 -48.0% 21.78 32.08 26.94 -32.1%
Operating profit - main business 5.51 10.82 5.07 -49.1% 20.88 31.19 26.22 -33.0%
Operating profit margin % 43.71 68.61 32.61 -36.3% 42.12 50.57 42.91 -16.7%
Profit before taxes 5.64 10.95 5.01 -48.5% 21.34 31.30 25.95 -31.8%
Profit before taxes margin % 42.85 67.93 30.88 -36.9% 41.27 49.36 41.33 -16.4%
Net profit 5.39 10.95 5.01 -50.8% 16.73 27.76 24.15 -39.7%
Net profit margin % 40.91 67.93 30.88 -39.8% 32.35 43.77 38.47 -26.1%
ROA % 2.12 4.21 2.03 -49.7% 6.45 10.83 10.10 -40.4%
Debt to total capital employed % 56.09 56.05 58.85 0.1% 56.09 56.05 58.85 0.1%
ROE % 4.92 9.95 5.00 -50.6% 14.69 25.43 25.61 -42.2%
Current ratio 3.85 5.48 5.36 -2.2% 3.85 5.48 5.36 -29.7%
Quick ratio 3.80 5.44 5.33 -2.0% 3.80 5.44 5.33 -30.1%
Investments into fixed assets 5.65 5.33 3.04 6.0% 19.42 16.09 10.40 20.7%
Payout ratio % na 72.05 62.11 na 72.05 62.11
Gross profit margin – Gross profit / Net sales
Operating profit before depreciation and amortisation – Operating profit + depreciation and amortisation
Operating profit before depreciation and amortisation margin – Operating profit before depreciation and amortisation /
Net sales
Operating profit margin – Operating profit / Net sales
Net profit margin – Net profit / Net sales
ROA – Net profit / Average Total assets for the period
Debt to Total capital employed – Total liabilities / Total capital employed
ROE – Net profit / Average Total equity for the period
Current ratio – Current assets / Current liabilities
Quick ratio – (Current assets – Stocks) / Current liabilities
Payout ratio - Total Dividends per annum/ Total Net Income per annum
Main business – water services related activities, excl. connections profit and government grants, construction services,
doubtful debt
6

FINANCIAL RESULTS FOR THE 4th QUARTER OF 2020
Statement of comprehensive income
SALES
On 18/10/2019 the Competition Authority approved the tariffs of the AS Tallinna Vesi and new tariffs were
applicable starting from 1/12/2019, the changes in the 4th quarter of 2020 from main activities revenues, i.e.
from sales of water and wastewater services, were driven by lower tariffs from main service area,
accompanied by changes in water services consumption related to coronavirus outbreak. According to
Estonia’s macroeconomic forecast, we expect a short-term a decrease in our water services consumption also
in first half of the next year. In the long-term future, the Company does not expect significant changes in the
water services consumption.
In the 4th quarter of 2020, the Group’s total sales were €13.17 million, showing a decrease by 18.3% or €2.95
million year-on-year. 88.5% of sales comprise of water services within and outside of the service area, 9.9%
from construction services and 1.6% from other services. The construction services sales are more seasonal,
and the Company continues to seek possibilities to grow these services revenues.
7

4th quarter Variance
2020/2019
€ thousand 2020 2019 2018 € %
Water supply service 2,061 3,083 3,600 -1,022 -33.1%
Wastewater disposal service 3,066 2,966 2,987 100 3.4%
Total from private customers 5,127 6,049 6,587 -922 -15.2%
Water supply service 1,882 2,728 2,898 -846 -31.0%
Wastewater disposal service 1,932 2,403 2,401 -471 -19.6%
Total from commercial customers 3,814 5,131 5,299 -1,317 -25.7%
Water supply service 414 392 380 22 5.6%
Wastewater disposal service 840 841 749 -1 -0.1%
Storm water disposal service 74 148 111 -74 -50.0%
Total from outside service area customers 1,328 1,381 1,240 -53 -3.8%
Storm water treatment and disposal and fire hydrants service
1,016 1,153 1,078 -137 -11.9%
Overpollution charges and discharging 367 318 227 49 15.4%
Total from water services 11,652 14,032 14,431 -2,380 -17.0%
Construction services 1,309 1,899 1,615 -590 -31.1%
Other services 211 191 183 20 10.5%
TOTAL REVENUE 13,172 16,122 16,229 -2,950 -18.3%
Sales from water services were €11.65 million, showing a 17.0% or €2.38 million decrease compared to the 4th quarter of 2019, resulting from the changes in the tariff and sales volumes as described below:
• There has been a decrease in private customers’ sales of 15.2% to €5.13 million, driven mainly by on average 27% lower tariffs from 1/12/2019. The decrease from tariff was partly balanced by higher customer consumption volumes from apartment blocks, which is our biggest private customer group, and private houses segment. The total impact from change of tariffs was -€1.22 million and from consumption +€0.32 million. Higher consumption from private customers was mainly related to coronavirus outbreak as substantial part of population is working from home.
• Sales to commercial customers within the service area decreased by 25.7% to €3.81 million driven by on average 15% lower tariffs from 1/12/2019 and on average 16.9% lower consumption of water services. The commercial customer sales were impacted by pandemic as hotels and spas and entertainment facilities were operating with lower number of visitors and less people were working in offices. The impact on commercial customers revenues from change of tariffs was -€0.45 million and from consumption -€0.84 million.
• Sales to customers outside the main service area decreased by 3.8% to €1.33 million, which was also impacted by change of tariffs from 1/12/2019, balanced partly by an increase in water and stormwater services consumption. The total impact from change of tariffs was -€0.07 million and from consumption +€0.01 million.
• Sales from the operation and maintenance of the main service area storm water and fire hydrant system amounted to €1.02 million, showing a decrease of 11.9% or €0.14 million compared to the same period in 2019, driven mainly by 32.2% lower storm water volumes.
• Overpollution charges and discharging revenues received have increased by 15.4% to €0.37 million.
8

Sales of construction services were €1.31 million, decreasing by 31.1% or €0.59 million year-on-year. The decrease was mainly related to lower pipe construction services revenues, balanced slightly by higher road construction revenues. The change is partly impacted by coronavirus pandemic caused delays in new developments in Tallinn.
COST OF GOODS AND SERVICES SOLD AND GROSS PROFIT
The cost of goods and services sold amounted to €7.54 million in the 4th quarter of 2020, being lower by €0.61 million compared to the equivalent period in 2019. The changes were influenced by higher staff and other purchase costs for goods and services, whilst construction services related costs and electricity and pollution tax costs were lower.
4th quarter Variance 2020/2019
€ thousand 2020 2019 2018 € %
Water abstraction charges -318 -314 -294 -4 -1.3%
Chemicals -414 -408 -495 -6 -1.5%
Electricity -754 -972 -767 218 22.4%
Pollution tax -198 -302 -248 104 34.4%
Total direct production costs -1,684 -1,996 -1,804 312 15.6%
Staff costs -1,933 -1,707 -1,606 -226 -13.2%
Depreciation and amortisation -1,457 -1,470 -1,366 13 0.9%
Construction services -1,068 -1,655 -1,370 587 35.5%
Other costs of goods/services sold -1,395 -1,315 -1,708 -80 -6.1%
Other costs of goods/services sold total -5,853 -6,147 -6,050 294 4.8%
Total cost of goods/services sold -7,537 -8,143 -7,854 606 7.4%
Total direct production costs (water abstraction charges, chemicals, electricity and pollution tax expenses) amounted to €1.68 million, showing a 15.6% or €0.31 million decrease compared to the equivalent period in 2019. Changes in direct production costs came from a combination of changes in prices and in treated volumes, that affected the cost of goods sold together with the following additional factors:
• Chemicals costs decreased by 1.5% to €0.41 million, driven mainly by on average 2% lower price and 49% lower usage of coagulant worth €0.02 million, accompanied by 29% lower usage of methanol in wastewater treatment. Lower costs from wastewater treatment were partly balanced by 2.5% higher usage of chlorine and coagulant in water treatment process.
• Electricity costs decreased by 22.4% to €0.75 million, driven mainly by 17.8% lower price and 23.8% lower usage of electricity in wastewater treatment process and 16.5% lower usage in water treatment area, worth €0.08 million, €0.04 million respectively.
• Pollution Tax cost has decreased by 34.4% to €0.20 million, due to new Water permit from 2019 Q4, that has changed the calculation method for pollution tax to be calculated quarterly instead of annually.
Other costs of goods sold (staff costs, depreciation, construction services related costs and other costs of goods sold) amounted to €5.85 million, having decreased by 4.8% or €0.29 million. The decrease was influenced by lower construction services related costs and balanced by higher staff expense due following reasons:
• Staff costs increased by 13.2% to €1.93 million. It was driven by higher number of staff (8 employees more than in the 4th quarter of 2019) and change of salaries from the beginning of the year for all employees by CPI.
9

• Construction services costs decreased by 35.5% to €1.07 million, mainly due to lower construction services revenues mentioned earlier.
• Other costs of goods/services sold increased by 6.1% to €1.39 million, mainly because of higher asset maintenance costs.
As a result of all above the Group’s gross profit for the 4th quarter of 2020 was €5.64 million, showing a decrease of 29.4% or €2.35 million, compared to the gross profit of €7.98 million for the comparative period of 2019.
ADMINISTRATIVE AND MARKETING EXPENSES, OTHER INCOME AND EXPENSES
Administrative and marketing expenses decreased by 23.0% or €0.31 million amounting to €1.06 million, compared to 4th quarter of 2019.
Other income and expenses amounted to net income of €1.18 million, compared to net income of €4.46 million in comparative period. The change was mostly impacted by positive change in provision formed for potential third party claims in 2019 in amount of €4.63 million compared to €1.20 million in 2020. The provision takes into account 24 months (in 2019 yearend 3 years or 36 months) of possible difference in the prices between the tariffs approved by the City of Tallinn in 2010 and the best understanding of CA methodology. Still, the Company does not consider itself liable to customers for any claims related to the tariffs applied until the new tariffs were approved by the CA. See additional information in Note 6 to the abbreviated accounts.
OPERATING PROFIT
As a result of the factors listed above the Group’s operating profit for the 4th quarter of 2020 amounted to
€5.76 million, being 48.0% or €5.31 million lower than in the corresponding period of 2019. Eliminating the
effect of the change of provision for the possible third-party claims the operating profit for the 4th quarter of
2020 and 2019 would have been €4.55 million and €6.44 million, being lower by 29.3% or €1.88 million year-
on-year.
FINANCIAL EXPENSES
The Group’s net financial income and expenses have resulted a net expense of €0.11 million, compared to the same level of net expense in the 4th quarter of 2019. The numbers were derived from lower interest costs that were related to lower interest margin of 2019 NIB loan agreement at the same time SWAP agreements providing positive fair value.
The standalone swap agreements were signed to mitigate the long-term floating interest risk. The interest swap agreements were signed for €37.5 million and ended in November 2020, €50.22 million are with floating interest rate. By the end of 4th quarter 2020, the whole loan amount of €87.72 million is bearing a floating interest rate. Effective interest rate of loans (incl. swap interests) in the 4th quarter of 2020 was 0.65%, amounting to interest costs of €0.14 million, compared to the effective interest rate of 0.90% and the interest costs of €0.15 million in the 4th quarter of 2019.
PROFIT BEFORE TAXES AND NET PROFIT
The Group’s net profit for the 4th quarter of 2020 was €5.39 million, being 50.8% or €5.56 million lower than for the comparative period of 2019. The decrease in net profit was mainly impacted by changes in operating profit and net financial expenses. Eliminating the effects of the change of the fair value of swap contracts and the change of provision for the possible third-party claims, the Group’s net profit for the 4th quarter of 2020 would have been €4.16 million compared to net profit of €6.23 million in 2019, showing a decrease of 33.2% or €2.07 million year-on-year.
10

FINANCIAL RESULTS FOR THE TWELVE MONTHS OF 2020
Statement of comprehensive income
SALES During the twelve months of 2020 the Group’s total sales were €51.72 million, showing a decrease by 18.5% or €11.71 million year-on-year. Sales from water services for twelve months of 2020 were 45.80 million, decreasing by 19.5% or €11.07 million year-on-year. 88.6% of sales comprise of sales of water services within and outside of the service area, 10.1% from construction services and 1.3% from other services.
12 months Variance
2020/2019
€ thousand 2020 2019 2018 € %
Water supply service 8,106 13,781 14,179 -5,675 -41.2%
Wastewater disposal service 12,048 11,719 11,586 329 2.8%
Total from private customers 20,154 25,500 25,765 -5,346 -21.0%
Water supply service 7,209 11,482 11,733 -4,273 -37.2%
Wastewater disposal service 7,417 9,317 9,513 -1,900 -20.4%
Total from commercial customers 14,626 20,799 21,246 -6,173 -29.7%
Water supply service 1,593 1,622 1,465 -29 -1.8%
Wastewater disposal service 3,298 3,193 2,893 105 3.3%
Storm water disposal service 291 426 322 -135 -31.7%
Total from outside service area customers 5,182 5,241 4,680 -60 -1.1%
Storm water treatment and disposal and fire hydrants service
4,588 4,002 3,562 586 14.6%
Overpollution charges and discharging 1,250 1,324 960 -74 -5.6%
Total from water services 45,800 56,866 56,213 -11,066 -19.5%
Construction services 5,222 5,960 5,950 -738 -12.4%
Other services 695 597 617 98 16.4%
TOTAL REVENUE 51,717 63,423 62,780 -11,706 -18.5%
During the twelve months of 2020 there has been a decrease in sales to private customers by 21.0% to €20.15 million that is mainly related to the 27% lower water services tariffs from 1/12/2019, accompanied by 5.2% increase in consumption, worth -€6.67 million and +€1.33 million respectively. Higher sales in domestic customer consumption volumes came mainly from apartment blocks, which is also our biggest private customer group, and were accompanied by individual houses. Also the sales to commercial customers within the service area has decreased by 29.7% to €14.63 million. The decrease is related to the 15% lower water services tariffs from 1/12/2019, accompanied by 18.5% decrease in consumption, worth -€2.31 million and -€3.86 million respectively. Lower sales in commercial customers is related to decrease in the sales of all commercial customer segments by reasons mentioned the in the 4th quarter results.
11

Sales to customers outside the main service area decreased by 1.1% to €5.18 million, being impacted by a decrease in the sales of water and storm water services and water supply services and were partly balanced by higher wastewater service revenues, being also mainly impacted by changes of tariffs, balanced by higher water and stormwater volumes. Sales from the operation and maintenance of the main service area storm water and fire hydrants system in the twelve months of 2020 amounted to €4.58 million, showing an increase of 14.6% or €0.58 million year-on-year, driven mainly by averagely 10% higher storm water volumes, balanced by lower cost per m3. Overpollution charges and discharging revenues received have decreased by 5.6% to €1.25 million.
Sales of construction services were €5.22 million, decreasing by 12.4% or €0.74 million year-on-year. The decrease was mainly related to lower pipe construction service as the Company continued some major projects in Tallinn and other parts of Estonia, won in 2019, and had a setback in revenues in the 4th quarter of 2020 because of reasons mentioned in the 4th quarter results.
COST OF GOODS AND SERVICES SOLD AND GROSS AND OPERATING PROFITS 12 months Variance 2020/2019
€ thousand 2020 2019 2018 € %
Water abstraction charges -1,237 -1,219 -1,187 -18 -1.5%
Chemicals -1,567 -1,664 -1,744 97 5.8%
Electricity -3,256 -3,566 -2,849 310 8.7%
Pollution tax -989 -1,089 -963 100 9.2%
Total direct production costs -7,049 -7,538 -6,743 489 6.5%
Staff costs -7,247 -6,602 -6,283 -645 -9.8%
Depreciation and amortisation -5,521 -5,420 -5,177 -101 -1.9%
Construction services -4,256 -5,096 -5,204 840 16.5%
Other costs of goods/services sold -5,418 -4,814 -5,187 -604 -12.5%
Other costs of goods/services sold total -22,442 -21,932 -21,851 -510 -2.3%
Total cost of goods/services sold -29,491 -29,470 -28,594 -21 -0.1%
During the twelve months of 2020 the cost of goods and services sold amounted to €29.49 million, decreasing by 0.1% or €0.02 million compared to the equivalent period in 2019. Total direct production costs (water abstraction charges, chemicals, electricity and pollution tax expenses) amounted to €7.05 million, showing a 6.5% or €0.49 million decrease compared to the equivalent period in 2019. Changes in direct production costs came from a combination of changes in prices and in treated volumes that affected the cost of goods sold together with the following additional factors:
• Water abstraction charges increased by 1.5% to €1.24 million, driven mainly by higher abstracted water volumes to water treatment process.
• Chemicals costs decreased by 5.8% to €1.57 million, driven mainly by on average 28% lower price of methanol, accompanied by lower usage of methanol and polymer in wastewater treatment to remove Nitrogen and Phosphorus, worth €0.13 million and €0.03 million respectively. Lower costs from wastewater treatment were partly balanced by higher usage of coagulant in water treatment process, worth -€0.07 million.
• Expenses for Electricity dropped by 8.7% or €0.31 million resulting in costs worth of €3.25 million mainly due to 9.2% lower price and lower usage of electricity in wastewater treatment plant.
Other costs of goods sold (staff costs, depreciation, construction and asphalting services costs and other costs of goods sold) amounted to €22.44 million, having increased by 2.3% or €0.51 million. The increase in other costs of goods sold were mainly driven by 12.5% higher other costs of goods and services sold which amounted to €5.42 million and 9.8% higher staff costs amounting to €7.25 million by the same reasons mentioned in the
12

4th quarter results. In addition, it was accompanied by 16.5% lower construction services related costs amounting to €4.25 million.
The Group’s gross profit for the twelve months of 2020 was €22.23 million, showing a decrease of 34.5% or €11.73 million compared to the comparative period of 2019. The Group’s operating profit for the twelve months of 2020 amounted to €21.78 million, being 32.1% or €10.29 million lower than in the corresponding period of 2019, being mainly impacted by lower water services revenues from main service area because of new tariff valid from 1/12/2019 and lower commercial customer consumption, change of provision for the possible third-party claims mentioned in the 4th quarter results and lower tariff dispute related legal costs resulting from the ICSID award in June 2019 according to which the Company was liable to pay for 25% of Estonian legal costs related to this matter. Eliminating the effect of the change of provision for the possible third-party claims the operating profit for 2020 and 2019 would have been €16.97 million and €27.45 million, being lower by 38.2% or €10.48 million year-on-year.
FINANCIAL EXPENSES
The Group’s net financial income and expenses have resulted a net expense of €0.44 million, compared to net expense of €0.77 million in the twelve months of 2019. The decrease was impacted by lower interest costs and higher positive change in the fair value of the swap contracts year-on-year, worth €0.48 million and €0.18 million respectively.
PROFIT BEFORE TAXES AND NET PROFIT
The Group’s profit before taxes for the twelve months of 2020 were €21.34 million, being 31.8% or €9.96 million lower than for the relevant period of 2019. The Group’s net profit for the twelve months of 2020 were €16.73 million, being 39.7% or €11.03 million lower than for the equivalent period of 2019. Eliminating the effects of the change of the derivatives fair value and the change of provision for the possible third-party claims the Group’s net profit for the twelve months of 2020 would have been €11.70 million, showing a decrease by 49.1% or €11.28 million year-on-year.
Statement of financial position
In the twelve months of 2020 the Group invested into fixed assets €19.42 million. As of 31/12/2020, non-current tangible assets amounted to €201.07 million and total non-current assets amounted to €203.43 million (31/12/2019: €189.63 million and €190.34 million respectively).
Compared to the year end of 2019 the trade receivables, accrued income and prepaid expenses have shown a decrease in the amount of €0.22 million to €7.02 million. Decrease mainly derives from lower water and construction services related trade receivables and lower accrued income, by €0.44 million and €0.06 million respectively. The collectability rate continues to be high at 99.55% level, as of December 2019 the collectability rate was 99.73%.
Current liabilities have increased by €0.31million to €13.55 million compared to the year end of 2019, mainly deriving from investments related trade payables.
Deferred income from connection fees has grown compared to the end of 2019 by €3.49 million to €34.56 million.
Provision for possible third-party claims has decreased compared to the end of 2019 by €4.81 million to €9.63 million by changes mentioned in the section of 4th quarter Other income and expenses results. More detailed information about the provision is presented in Note 6 to the financial statements.
The Group’s loan balance has decreased, being €87.72 million. In May 2019 the Company started to return the old NIB loan with 11 equal semi-annual payments. The weighted average loan interest risk margin is 0.66%.
The Group has a Total debt to assets level of 56.09%, in range of 55%-65%, reflecting the Group’s equity profile. In comparative period of 2019, the total debt to assets ratio was 56.05%.
Deferred Tax Liability is recorded according to International Financial Reporting Standards (IFRS) Interpretation Committee agenda decision in June 2020, according to which deferred tax shall be recognized for all taxable differences associated with investments in subsidiaries unless it is probable that the profits will not be distributed in the foreseeable future (IAS 12.39-40). AS Tallinna Vesi has assessed the impact of the IFRS Interpretation Committee agenda decision and has reached a conclusion of the amount not being
13

material, therefore no correction into previous reporting periods is made and the total impact of deferred tax amount is recognized in financial statements for the year 2020.
Cash flow
As of 31/12/2020, the cash position of the Group is strong. At the end of December 2020, the cash balance of the Group stood at €44.51 million, which is 17.4% of the total assets (31/12/2019: €64.78 million, forming 24.6% of the total assets).
The biggest contribution to the cash flows comes from main operations. During the twelve months of 2020, the Group generated €22.62 million of cash flows from operating activities, a decrease of €11.40 million compared to the corresponding period in 2019. Underlying operating profit continues to be the main contributor to operating cash flows.
In the twelve months of 2020 the result of net cash flows from investing activities was a cash outflow of €13.62 million, an increase of €6.25 million compared to the cash outflow of €7.37 million in the twelve months of 2019. This is made up as follows:
• The cash outflows from investments in fixed assets have increased by €5.24 million compared to 2019 amounting to €15.68 million.
• The compensations received for pipe construction were €1.99 million, showing a decrease of €1.01 million compared to the same period of 2019.
In the twelve months of 2020 cash outflow from financing activities amounted to €29.26 million, increasing by €5.62 million compared to the same period in 2019. The change was mainly related to higher dividend payment, balanced partly by lower interest payments, by +€4.92 million and -€0.34 million respectively.
EMPLOYEES
We believe it is important to treat our employees equally, involve them in the decision-making process and to inform them regularly. We consider the involvement of our staff in the decision-making process instrumental for them to understand and be able to support the Company in its pursuits. Our staff can vary to a large degree in age, nationality, nature of work and in many other aspects. This requires us to be resourceful and flexible in our communication with the staff in order to involve, engage and listen to them. This is done using several means and channels of communication, such as regular staff meetings with the management, bulletin boards, intranet, informative letters, team events and a quarterly internal newsletter. Estonian is not
14

the communication language for quite a number of our staff. Therefore, we have organized Estonian language classes at the Company’s expense to make the staff, whose mother tongue is not Estonian, also feel as part of our unified team. At the same time, we provide the majority of important information also in Russian.
We have described our human resource policies. We follow equality principles in selecting and managing people, which translates into providing, when feasible, equal opportunities to everyone. Understanding and appreciating the diversity of our staff, we ensure, that everyone is treated fairly and equally and they have access to the same opportunities as is reasonable and practicable. We aim to ensure, that no employees are discriminated against due to, but not exclusive to age, gender, religion, cultural or ethnic origin, disability, sexual orientation or marital status.
Considering the spread of coronavirus, it is even more important than usual for us to keep our employees informed about developments in the company. We use various channels for doing that (listed above). In addition to the traditional channels of information, we also prepared a video in both Estonian and Russian about the related rearrangements in the company and distributed it among the staff. Also, a virtual appreciation gala was organised to appraise our best employees of the 2020 at Tallinna Vesi and Watercom.
The corona crisis has significantly changed the daily working arrangements in our company, and many employees began to perform their tasks remotely. Currently, working remotely has become a part of our daily lives. To support our employees, we have put in place the “Remote Working Rules” summarising the key topics. Another document “Risk Assessment for Remote Working” has been prepared as a tool used in assessing the risks at the place where remote work is performed. Both documents are reviewed and discussed with managers as well as signed by each employee working remotely. Furthermore, various useful documents of supporting information are available in the company’s Intranet under the section “Remote Work”. The implementation of remote working in the company was also one of the key subjects raised in the 2020 Employee Satisfaction Survey. Corona crisis has also changed skills workers ways of working, many of them work now temporally in shifts until to end of corona crisis to ensure the safety of people and an uninterrupted work process.
At the end of the 4th quarter of 2020, the total number of employees was 333 compared to 325 at the end of the same period in 2019. The full time equivalent (FTE) was 318 and 314 respectively. Average number of employees during the twelve months was 332 in 2020 and 321 in 2019 respectively.
By gender, employee allocation was as follows:
As of 31/12/2020 As of 31/12/2019
Women Men Total Women Men Total
Group 92 241 333 89 236 325
Management Team 14 18 32 13 16 29
Executive Team 4 5 9 5 4 9
Management Board 1 2 3 1 2 3
Supervisory Board 1 8 9 1 8 9
The total salary costs were €2.66 million for the 4th quarter of 2020, including €0.05 million paid to Management and Supervisory Council members (excluding social taxes). The contingent liability in case the Council should want to replace the current Management Board members is €0.09 million.
DIVIDENDS
Dividend allocation to the shareholders is recorded as a liability in the financial statement of the Company at the time when the profit allocation and dividend payment is confirmed by the annual general meeting of shareholders.
Every year the Supervisory Council evaluates the proposal of the dividends to be paid out to the shareholders and approves it to be presented to the voting to the Annual General Meeting of shareholders, considering all circumstances. In the Annual General Meeting held on 28/05/2020, the Supervisory Board proposed to pay out €1.00 per A-share and €600 per B-share, which is equal to 72.0% of earnings per share in 2019. The proposal was approved by Annual General Meeting and the dividend payout was made on 26/06/2020.
15

Dividend payouts in last five years have been as follows:
Dividend policy
ASTV aims to distribute 50%-80% of the annual profit as dividends. Dividend payments shall be assessed annually considering ASTV’s earnings, investment needs, liquidity position and long-term financial objectives.
SHARE PERFORMANCE
AS Tallinna Vesi is listed on Nasdaq Baltic Main List with trading code TVEAT and ISIN EE3100026436.
As of 31/12/2020, AS Tallinna Vesi shareholders, with a direct holding over 5%, were:
• United Utilities (Tallinn) BV (35.3%)
• City of Tallinn (34.7%)
During the twelve months of 2020 the shareholder structure has been relatively stable compared to the end of 2019. At the end of the 4th quarter of 2020, the pension funds shareholding has slightly decreased, being 0.69% of the total shares compared to 0.97% at the end of 2019.
At 31/12/2020, the closing price of AS Tallinna Vesi share was €13.25, which is 4.33% (2019: +7.83%) higher compared to the closing price of €12.70 at the end of the previous quarter. During the 4th quarter the OMX Tallinn index increased by 16.15% (2019: +3.60%).
In twelve months of 2020, 22,812 deals with the Company’s shares were concluded (2019: 3,996 deals) during which 1.403 million shares or 7.0% of total shares exchanged their owners (2019: 595 thousand shares or 3.0%).
The turnover of the transactions was €11.01 million higher than in 2019 comparative period, amounting to €17.49 million.
16

CORPORATE STRUCTURE
As of 31/12/2020, the Group consisted of 2 companies. The subsidiary Watercom OÜ is wholly owned by AS Tallinna Vesi and consolidated into the results of the Company.
CORPORATE GOVERNANCE
SUPERVISORY COUNCIL
Supervisory Council organises and arranges the management of the Company and supervises the activities of the Management Board. According to AS Tallinna Vesi’s articles of association Supervisory Council consists of 9 members, who are elected or appointed for two years. The following change took place in the Supervisory Council members in 2020: On 1/09/20, Mr Thomas Wright Lissett was appointed as a member of Supervisory Council with the term until 1/09/22 due to ended term of Supervisory Council member Mr Keith Haslett.
Supervisory Council has established three committees to advise Supervisory Council on audit, remuneration and corporate governance matters.
Further information about the Supervisory Council and committees can be found in the note 15 to the financial statements as well as on the Company’s webpage:
About us > Management board > Supervisory council
About us > Audit committee
About us > Principles of governance > Corporate governance report
MANAGEMENT BOARD
Management Board is a governing body, which represents and manages AS Tallinna Vesi in its daily operations in accordance with the legal requirements as well as the Articles of Association. The Management Board is required to act economically in the most efficient way taking into consideration the interest of the Company and its shareholders and to ensure the sustainable development of the Company in accordance with the set objectives and strategy.
To ensure that the Company’s interests are met in the best way possible, the Management and Supervisory Boards are collaborating extensively. Meetings of Management Board and Supervisory Council members are held at least once a quarter. In those meetings the Management Board informs the Supervisory Council about all significant issues in Company’s business operations, the fulfilment of the Company’s short and long-term goals is discussed and the risks impacting them. Management Board prepares a management report for every Supervisory Council meeting and submits it in advance with sufficient time for the Supervisory Council to study it.
According to the Articles of Association the Management Board consists of 2-5 members, who are elected for 3 years.
Starting from 1/01/2020, there are 3 members in the Management Board of AS Tallinna Vesi: Karl Heino Brookes (Chairman of the Board, with the powers of the Management Board Member until 21/03/2023), Aleksandr Timofejev (with the powers of the Management Board Member until 29/10/2021) and Kristi Ojakäär (with the powers of the Management Board Member until 1/01/2023).
Further information on the members of the Management Board can be found on the Company’s website:
About us > Management board
Additional information:
Karl Heino Brookes
Chairman of the Management Board
+372 62 62 200
17
AS TALLINNA VESICONSOLIDATED UNAUDITED INTERIM CONDENSED FINANCIAL STATEMENTS
FOR THE 12 MONTHS PERIOD OF FINANCIAL YEAR 2020 ENDED 31 DECEMBER 2020
MANAGEMENT CONFIRMATIONMANAGEMENT CONFIRMATIONMANAGEMENT CONFIRMATIONMANAGEMENT CONFIRMATION
Karl Heino BrookesKarl Heino BrookesKarl Heino BrookesKarl Heino BrookesChairman of the Management BoardChief Executive Officer
Aleksandr TimofejevAleksandr TimofejevAleksandr TimofejevAleksandr TimofejevMember of the Management BoardChief Operating Officer
Kristi OjakäärKristi OjakäärKristi OjakäärKristi OjakäärMember of the Management BoardChief Financial Officer
29 January 2021
https://tallinnavesi.ee/en/ettevote/management-board/
The significant transactions with related parties are disclosed in the interim accounts.
Any subsequent events that materially affect the valuation of assets and liabilities and have occurreduntil the completion of the consolidated financial statements on 29 January 2021 have been consideredin preparing the financial statements.
The Management Board considers AS Tallinna Vesi and its subsidiary to be going concern entities.
Introduction and photos of the Management Board members are published at company’s web page.
The Management Board has prepared the consolidated interim accounts of AS Tallinna Vesi (theCompany) and its subsidiary OÜ Watercom (together the Group) in the form of consolidated condensedfinancial statements for the 12 months period of financial year 2020 ended 31 December 2020. Theinterim accounts have not been reviewed by the auditors.
The condensed financial statements for the period ended 31 December 2020 have been preparedfollowing the accounting policies and the manner of presenting the information in line with theInternational Financial Reporting Standards as adopted by the EU. The condensed financial statementsprovide a fair presentation of the assets, liabilities, financial position and result of the operations andthe cash flows of the Group.
The interim report gives a fair presentation of the main events that occurred during the 9 months ofthe financial year and of their effect on the condensed financial statements. It includes the descriptionof the main risks and unclear aspects that can, based on the sensible judgement of the ManagementBoard, have an impact on the Company.
18

AS TALLINNA VESICONSOLIDATED UNAUDITED INTERIM CONDENSED FINANCIAL STATEMENTS
FOR THE 12 MONTHS PERIOD OF FINANCIAL YEAR 2020 ENDED 31 DECEMBER 2020
CONSOLIDATED STATEMENT OF FINANCIAL POSITIONCONSOLIDATED STATEMENT OF FINANCIAL POSITIONCONSOLIDATED STATEMENT OF FINANCIAL POSITIONCONSOLIDATED STATEMENT OF FINANCIAL POSITION
€ thousand
ASSETSASSETSASSETSASSETS NoteNoteNoteNote 2020202020202020 2019201920192019
CURRENT ASSETSCURRENT ASSETSCURRENT ASSETSCURRENT ASSETSCash and cash equivalents 3 44 514 64 775
7 019 7 239Inventories 701 504
TOTAL CURRENT ASSETSTOTAL CURRENT ASSETSTOTAL CURRENT ASSETSTOTAL CURRENT ASSETS 52 23452 23452 23452 234 72 51872 51872 51872 518
NON-CURRENT ASSETSNON-CURRENT ASSETSNON-CURRENT ASSETSNON-CURRENT ASSETSProperty, plant and equipment 4 202 802 189 627Intangible assets 5 629 710
TOTAL NON-CURRENT ASSETSTOTAL NON-CURRENT ASSETSTOTAL NON-CURRENT ASSETSTOTAL NON-CURRENT ASSETS 203 431203 431203 431203 431 190 337190 337190 337190 337
TOTAL ASSETSTOTAL ASSETSTOTAL ASSETSTOTAL ASSETS 255 665255 665255 665255 665 262 855262 855262 855262 855
LIABILITIES AND EQUITY LIABILITIES AND EQUITY LIABILITIES AND EQUITY LIABILITIES AND EQUITY
CURRENT LIABILITIESCURRENT LIABILITIESCURRENT LIABILITIESCURRENT LIABILITIESCurrent portion of long-term lease liabilities 393 352Current portion of long-term loans 3 630 3 631Trade and other payables 7 084 6 717Derivatives 0 221Prepayments 2 445 2 323
TOTAL CURRENT LIABILITIESTOTAL CURRENT LIABILITIESTOTAL CURRENT LIABILITIESTOTAL CURRENT LIABILITIES 13 55213 55213 55213 552 13 24413 24413 24413 244
NON-CURRENT LIABILITIESNON-CURRENT LIABILITIESNON-CURRENT LIABILITIESNON-CURRENT LIABILITIESDeferred income from connection fees 34 564 31 070Leases 1 400 964Loans 83 978 87 592Provision for possible third party claims 6 9 628 14 442Deferred tax liability 255 0Other payables 32 18
TOTAL NON-CURRENT LIABILITIESTOTAL NON-CURRENT LIABILITIESTOTAL NON-CURRENT LIABILITIESTOTAL NON-CURRENT LIABILITIES 129 857129 857129 857129 857 134 086134 086134 086134 086
TOTAL LIABILITIESTOTAL LIABILITIESTOTAL LIABILITIESTOTAL LIABILITIES 143 409143 409143 409143 409 147 330147 330147 330147 330
EQUITY EQUITY EQUITY EQUITY Share capital 12 000 12 000Share premium 24 734 24 734Statutory legal reserve 1 279 1 279Retained earnings 74 243 77 512
TOTAL EQUITY TOTAL EQUITY TOTAL EQUITY TOTAL EQUITY 112 256112 256112 256112 256 115 525115 525115 525115 525
TOTAL LIABILITIES AND EQUITY TOTAL LIABILITIES AND EQUITY TOTAL LIABILITIES AND EQUITY TOTAL LIABILITIES AND EQUITY 255 665255 665255 665255 665 262 855262 855262 855262 855
Notes to the consolidated financial statements on pages 5 to 15 form an integral part of the condensed financial statements.
Trade receivables, accrued income and prepaid expenses
as of 31 December as of 31 December as of 31 December as of 31 December
19
AS TALLINNA VESICONSOLIDATED UNAUDITED INTERIM CONDENSED FINANCIAL STATEMENTS
FOR THE 12 MONTHS PERIOD OF FINANCIAL YEAR 2020 ENDED 31 DECEMBER 2020
CONSOLIDATED STATEMENT OF COMPREHENSIVE INCOMECONSOLIDATED STATEMENT OF COMPREHENSIVE INCOMECONSOLIDATED STATEMENT OF COMPREHENSIVE INCOMECONSOLIDATED STATEMENT OF COMPREHENSIVE INCOME
€ thousand
NoteNoteNoteNote 2020202020202020 2019201920192019 2020202020202020 2019201920192019
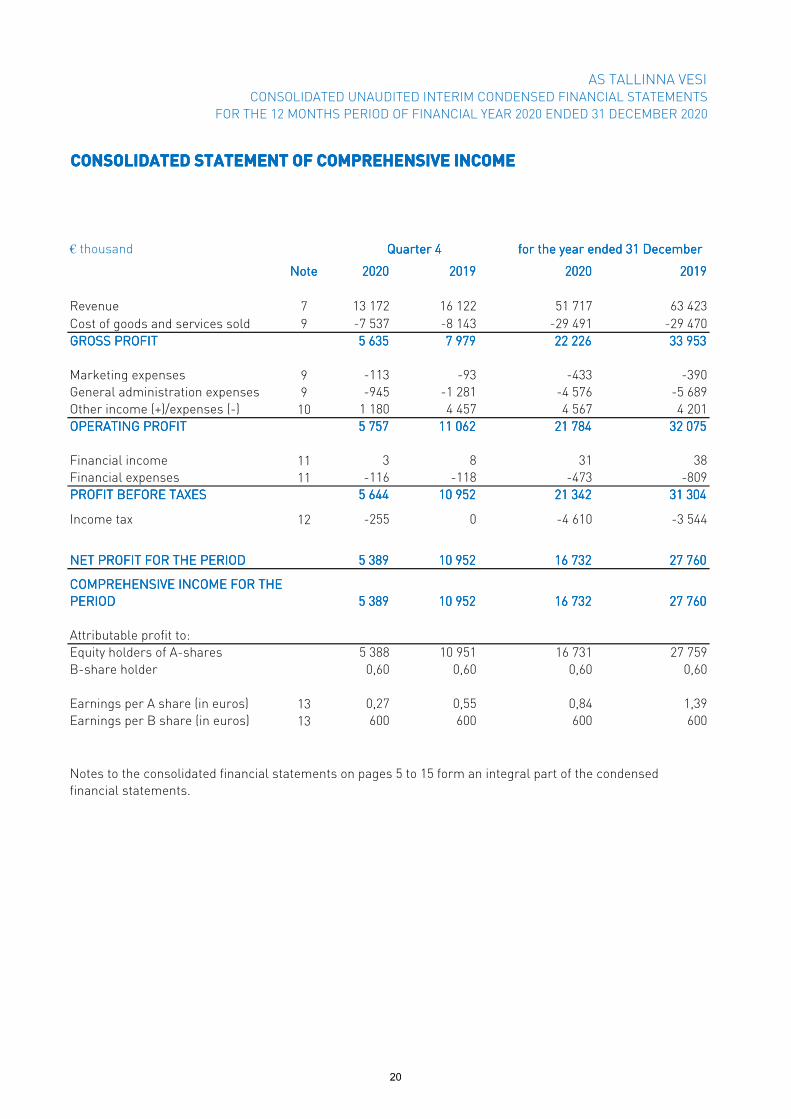
Revenue 7 13 172 16 122 51 717 63 423Cost of goods and services sold 9 -7 537 -8 143 -29 491 -29 470GROSS PROFITGROSS PROFITGROSS PROFITGROSS PROFIT 5 6355 6355 6355 635 7 9797 9797 9797 979 22 22622 22622 22622 226 33 95333 95333 95333 953
Marketing expenses 9 -113 -93 -433 -390General administration expenses 9 -945 -1 281 -4 576 -5 689Other income (+)/expenses (-) 10 1 180 4 457 4 567 4 201OPERATING PROFITOPERATING PROFITOPERATING PROFITOPERATING PROFIT 5 7575 7575 7575 757 11 06211 06211 06211 062 21 78421 78421 78421 784 32 07532 07532 07532 075
Financial income 11 3 8 31 38Financial expenses 11 -116 -118 -473 -809PROFIT BEFORE TAXESPROFIT BEFORE TAXESPROFIT BEFORE TAXESPROFIT BEFORE TAXES 5 6445 6445 6445 644 10 95210 95210 95210 952 21 34221 34221 34221 342 31 30431 30431 30431 304
Income tax 12 -255 0 -4 610 -3 544
5 3895 3895 3895 389 10 95210 95210 95210 952 16 73216 73216 73216 732 27 76027 76027 76027 760
5 3895 3895 3895 389 10 95210 95210 95210 952 16 73216 73216 73216 732 27 76027 76027 76027 760
Attributable profit to:Equity holders of A-shares 5 388 10 951 16 731 27 759B-share holder 0,60 0,60 0,60 0,60
Earnings per A share (in euros) 13 0,27 0,55 0,84 1,39Earnings per B share (in euros) 13 600 600 600 600
Notes to the consolidated financial statements on pages 5 to 15 form an integral part of the condensed financial statements.
COMPREHENSIVE INCOME FOR THE COMPREHENSIVE INCOME FOR THE COMPREHENSIVE INCOME FOR THE COMPREHENSIVE INCOME FOR THE PERIODPERIODPERIODPERIOD
Quarter 4 Quarter 4 Quarter 4 Quarter 4
NET PROFIT FOR THE PERIODNET PROFIT FOR THE PERIODNET PROFIT FOR THE PERIODNET PROFIT FOR THE PERIOD
for the year ended 31 Decemberfor the year ended 31 Decemberfor the year ended 31 Decemberfor the year ended 31 December
20

AS TALLINNA VESICONSOLIDATED UNAUDITED INTERIM CONDENSED FINANCIAL STATEMENTS
FOR THE 12 MONTHS PERIOD OF FINANCIAL YEAR 2020 ENDED 31 DECEMBER 2020
CONSOLIDATED STATEMENT OF CASH FLOWS CONSOLIDATED STATEMENT OF CASH FLOWS CONSOLIDATED STATEMENT OF CASH FLOWS CONSOLIDATED STATEMENT OF CASH FLOWS
€ thousandNoteNoteNoteNote 2020202020202020 2019201920192019
CASH FLOWS FROM OPERATING ACTIVITIESCASH FLOWS FROM OPERATING ACTIVITIESCASH FLOWS FROM OPERATING ACTIVITIESCASH FLOWS FROM OPERATING ACTIVITIES
Operating profit 21 784 32 075Adjustment for depreciation/amortisation 4,5,9,10 6 283 6 109Adjustment for revenues from connection fees 10 -542 -389Other non-cash adjustments 6 -4 814 -4 624
Profit (-)/loss (+) from sale of property, plant and equipment, and intangible assets -14 138
Change in current assets involved in operating activities 140 391Change in liabilities involved in operating activities -215 318
TOTAL CASH FLOWS FROM OPERATING ACTIVITIESTOTAL CASH FLOWS FROM OPERATING ACTIVITIESTOTAL CASH FLOWS FROM OPERATING ACTIVITIESTOTAL CASH FLOWS FROM OPERATING ACTIVITIES 22 62222 62222 62222 622 34 01834 01834 01834 018
CASH FLOWS USED IN INVESTING ACTIVITIESCASH FLOWS USED IN INVESTING ACTIVITIESCASH FLOWS USED IN INVESTING ACTIVITIESCASH FLOWS USED IN INVESTING ACTIVITIES
-15 682 -10 441
1 998 3 010
32 24Interest received 35 36
TOTAL CASH FLOWS USED IN INVESTING ACTIVITIESTOTAL CASH FLOWS USED IN INVESTING ACTIVITIESTOTAL CASH FLOWS USED IN INVESTING ACTIVITIESTOTAL CASH FLOWS USED IN INVESTING ACTIVITIES -13 617-13 617-13 617-13 617 -7 371-7 371-7 371-7 371
CASH FLOWS USED IN FINANCING ACTIVITIESCASH FLOWS USED IN FINANCING ACTIVITIESCASH FLOWS USED IN FINANCING ACTIVITIESCASH FLOWS USED IN FINANCING ACTIVITIESInterest paid and loan financing costs, incl swap interests -719 -1 056Lease payments -555 -404Received loans 0 37 500Repayment of loans -3 636 -41 136Dividends paid 12 -19 888 -14 965Withheld income tax paid on dividends 12 -113 -36Income tax paid on dividends -4 355 -3 544
TOTAL CASH FLOWS USED IN FINANCING ACTIVITIESTOTAL CASH FLOWS USED IN FINANCING ACTIVITIESTOTAL CASH FLOWS USED IN FINANCING ACTIVITIESTOTAL CASH FLOWS USED IN FINANCING ACTIVITIES -29 266-29 266-29 266-29 266 -23 641-23 641-23 641-23 641
CHANGE IN CASH AND CASH EQUIVALENTSCHANGE IN CASH AND CASH EQUIVALENTSCHANGE IN CASH AND CASH EQUIVALENTSCHANGE IN CASH AND CASH EQUIVALENTS -20 261-20 261-20 261-20 261 3 0063 0063 0063 006
3333 64 77564 77564 77564 775 61 76961 76961 76961 769
3333 44 51444 51444 51444 514 64 77564 77564 77564 775
for the year ended 31 for the year ended 31 for the year ended 31 for the year ended 31 DecemberDecemberDecemberDecember
Notes to the consolidated financial statements on pages 5 to 15 form an integral part of the condensed financial statements.
CASH AND CASH EQUIVALENTS AT THE END CASH AND CASH EQUIVALENTS AT THE END CASH AND CASH EQUIVALENTS AT THE END CASH AND CASH EQUIVALENTS AT THE END OF THE PERIOD OF THE PERIOD OF THE PERIOD OF THE PERIOD
Compensations received for construction of pipelines, incl connection fees
Acquisition of property, plant and equipment, and intangible assets
Proceeds from sale of property, plant and equipment, and intangible assets
CASH AND CASH EQUIVALENTS AT THE CASH AND CASH EQUIVALENTS AT THE CASH AND CASH EQUIVALENTS AT THE CASH AND CASH EQUIVALENTS AT THE BEGINNING OF THE PERIOD BEGINNING OF THE PERIOD BEGINNING OF THE PERIOD BEGINNING OF THE PERIOD
21

AS TALLINNA VESICONSOLIDATED UNAUDITED INTERIM CONDENSED FINANCIAL STATEMENTS
FOR THE 12 MONTHS PERIOD OF FINANCIAL YEAR 2020 ENDED 31 DECEMBER 2020
CONSOLIDATED STATEMENT OF CHANGES IN EQUITYCONSOLIDATED STATEMENT OF CHANGES IN EQUITYCONSOLIDATED STATEMENT OF CHANGES IN EQUITYCONSOLIDATED STATEMENT OF CHANGES IN EQUITY
€ thousand
Share Share Share Share capitalcapitalcapitalcapital
Share Share Share Share premiumpremiumpremiumpremium
Statutory Statutory Statutory Statutory legal reservelegal reservelegal reservelegal reserve
Retained Retained Retained Retained earningsearningsearningsearnings
Total equityTotal equityTotal equityTotal equity
as of 31 December 2018as of 31 December 2018as of 31 December 2018as of 31 December 2018 12 00012 00012 00012 000 24 73424 73424 73424 734 1 2791 2791 2791 279 64 75364 75364 75364 753 102 766102 766102 766102 766
Dividends 0 0 0 -15 001 -15 001-15 001-15 001-15 001Comprehensive income for theperiod 0 0 0 27 760 27 76027 76027 76027 760
as of 31 December 2019as of 31 December 2019as of 31 December 2019as of 31 December 2019 12 00012 00012 00012 000 24 73424 73424 73424 734 1 2791 2791 2791 279 77 51277 51277 51277 512 115 525115 525115 525115 525
Dividends 0 0 0 -20 001 -20 001-20 001-20 001-20 001Comprehensive income for theperiod 0 0 0 16 732 16 73216 73216 73216 732
as of 31 December 2020as of 31 December 2020as of 31 December 2020as of 31 December 2020 12 00012 00012 00012 000 24 73424 73424 73424 734 1 2791 2791 2791 279 74 24374 24374 24374 243 112 256112 256112 256112 256
NOTES TO THE CONSOLIDATED UNAUDITED INTERIM FINANCIAL STATEMENTSNOTES TO THE CONSOLIDATED UNAUDITED INTERIM FINANCIAL STATEMENTSNOTES TO THE CONSOLIDATED UNAUDITED INTERIM FINANCIAL STATEMENTSNOTES TO THE CONSOLIDATED UNAUDITED INTERIM FINANCIAL STATEMENTS
NOTE 1. ACCOUNTING PRINCIPLESNOTE 1. ACCOUNTING PRINCIPLESNOTE 1. ACCOUNTING PRINCIPLESNOTE 1. ACCOUNTING PRINCIPLES
Notes to the consolidated financial statements on pages 5 to 15 form an integral part of the condensedfinancial statements.
The condensed consolidated interim financial statements of the Group have been prepared in accordance withInternational Financial Reporting Standard IAS 34 Interim Financial Reporting as adopted by the EuropeanUnion. The condensed interim financial statements do not contain all the information presented in the annualfinancial statements and should be read in conjunction with the Group’s latest published annual financialstatements as at and for the year ended 31 December 2019. Selected notes are included in interim financialstatements to explain events and transactions that are significant to an understanding of the changes in theGroup’s financial position and performance since the last annual financial statements.
International Financial Reporting Standards (IFRS) Interpretation Committee agenda decision regarding International Financial Reporting Standards (IFRS) Interpretation Committee agenda decision regarding International Financial Reporting Standards (IFRS) Interpretation Committee agenda decision regarding International Financial Reporting Standards (IFRS) Interpretation Committee agenda decision regarding deferred tax related to investments in subsidiaries deferred tax related to investments in subsidiaries deferred tax related to investments in subsidiaries deferred tax related to investments in subsidiaries
According to the paragraphs 52A and 57A of IAS 12 (International Accounting Standard 12), no current ordeferred tax liability shall be recognised until a liability to pay dividends is recognised. In Estonia, suchaccounting principle has been applied consistently to all undistributed profits regardless of whether suchprofits arose in the parent or in a subsidiary. In June 2020, IFRS Interpretation Committee made an agendadecision where it concluded that the principle set out in the paragraphs 52A and 57A of the Standard IAS 12only applies to undistributed profits accumulated in a parent company and does not apply to undistributedprofits accumulated in the subsidiaries. Instead, the principles described in the paragraphs 39-40 of theStandard IAS 12 should be followed in respect of undistributed profits in subsidiaries, explaining that thedeferred tax shall be recognized for all taxable differences associated with investments in subsidiaries unlessit is probable that the profits will not be distributed in the foreseeable future.
AS Tallinna Vesi has assessed the impact of the IFRS Interpretation Committee agenda decision and hasreached a conclusion of the amount not being material, therefore no correction into previous reporting periodsis made and the total impact of deferred tax amount is recognized in financial statements for the year 2020.The Group presents the financial information in an interim report as described below.
22

AS TALLINNA VESICONSOLIDATED UNAUDITED INTERIM CONDENSED FINANCIAL STATEMENTS
FOR THE 12 MONTHS PERIOD OF FINANCIAL YEAR 2020 ENDED 31 DECEMBER 2020
NOTE 2. CRITICAL ACCOUNTING ESTIMATES NOTE 2. CRITICAL ACCOUNTING ESTIMATES NOTE 2. CRITICAL ACCOUNTING ESTIMATES NOTE 2. CRITICAL ACCOUNTING ESTIMATES
•
•
The Group makes estimates and assumptions concerning the future. The resulting accounting estimates will,by definition, seldom equal the related actual results. The estimates and assumptions that have a significantrisk of material misstatements to the carrying amounts of assets and liabilities were the same as described inthe last annual financial statements as at and for the year ended 31 December 2019, except for estimatesaddressed below:
Management has developed estimates on the expected credit losses of trade receivables based on the bestavailable information about past events, current conditions and forecasts of macroeconomic conditionsrelated to Covid-19 outbreak. Trade receivables have been grouped based on shared credit riskcharacteristics and the days past due. The expected loss rates are based on the payment profiles of salesover a period of 24 months before 31 December 2020, respectively, and the corresponding historical creditlosses experienced within this period. The historical loss rates are adjusted to reflect current and forward-looking information on macroeconomic factors affecting the ability of the customers to settle thereceivables. The Group has identified the GDP and the unemployment rate of Estonia in which it sells itsgoods and services to be the most relevant factors, and has accordingly adjusted the historical loss ratesbased on expected changes in these factors. As at 31 December 2020, Management of the Group hasassessed the expected credit loss related to Covid-19 outbreak to be €60 thousand. Estimated credit loss isbeing revised according to further developments.
The potential undiscounted payments by the Company in the future, if potential claims from customerswere recognised by the courts, would amount to €24.1 million (as of 31 December 2019: €36.1 million). Thisestimate marks the maximum difference in between the tariffs approved based on the Services Agreementand the tariffs based on the Company's estimation, with the reservation to the possible fluctuation,regarding past 24 months (as of 31 December 2019: 36 months), being the approximate remainingunexpired term of potential claims. The Management Board of the Company has assessed the potentialliability resulting from such claims, if successful, to be €9.6 million (as of 31 December 2019: €14.4 million).As of 31 December 2020, claims totalling €1.1 million have been filed within one application. The Companydoes not admit any liability and fully rejects it.
Management has made an estimate with regards to possible third-party claims based on the maximumdifference between revenues calculated with tariffs established based on the Services Agreement and thetariffs based on the Company's estimation, with the reservation to the possible fluctuation. According to thelaw, the tariffs established based on the Services Agreement were in force until the Competition Authorityapproved the new tariffs and the Company implemented these tariffs in line with the law. The Company hasacted in good faith and in reliance to the applicable legal acts . Thus the Company does not consider itselfliable to the customers for any claims related to the tariffs applied until the new tariffs approved by theCompetition Authority were duly implemented.
23

AS TALLINNA VESICONSOLIDATED UNAUDITED INTERIM CONDENSED FINANCIAL STATEMENTS
FOR THE 12 MONTHS PERIOD OF FINANCIAL YEAR 2020 ENDED 31 DECEMBER 2020
NOTE 3. CASH AND CASH EQUIVALENTSNOTE 3. CASH AND CASH EQUIVALENTSNOTE 3. CASH AND CASH EQUIVALENTSNOTE 3. CASH AND CASH EQUIVALENTS
€ thousand 2020202020202020 2019201920192019
Cash in hand and in bank 20 514 43 175
Short-term deposits 24 000 21 600Total cash and cash equivalentsTotal cash and cash equivalentsTotal cash and cash equivalentsTotal cash and cash equivalents 44 51444 51444 51444 514 64 77564 77564 77564 775
NOTE 4. PROPERTY, PLANT AND EQUIPMENTNOTE 4. PROPERTY, PLANT AND EQUIPMENTNOTE 4. PROPERTY, PLANT AND EQUIPMENTNOTE 4. PROPERTY, PLANT AND EQUIPMENT
€ thousand
Land and Land and Land and Land and buildingsbuildingsbuildingsbuildings
FacilitiesFacilitiesFacilitiesFacilitiesMachinery Machinery Machinery Machinery
and and and and equipmentequipmentequipmentequipment
Construction Construction Construction Construction in progressin progressin progressin progress
Right-of-Right-of-Right-of-Right-of-use use use use
assetsassetsassetsassets
Right-of-Right-of-Right-of-Right-of-use assets use assets use assets use assets
in progressin progressin progressin progress
Total Total Total Total property, property, property, property, plant and plant and plant and plant and
equipmentequipmentequipmentequipmentas of 31 December 2018as of 31 December 2018as of 31 December 2018as of 31 December 2018
Acquisition cost 26 500 215 059 49 933 3 199 0 0 294 691
Accumulated depreciation -7 114 -70 993 -37 399 0 0 0 -115 506Net book valueNet book valueNet book valueNet book value 19 38619 38619 38619 386 144 066144 066144 066144 066 12 53412 53412 53412 534 3 1993 1993 1993 199 0000 0000 179 185179 185179 185179 185Transactions in the period 1 January 2019 - 31 December 2019Transactions in the period 1 January 2019 - 31 December 2019Transactions in the period 1 January 2019 - 31 December 2019Transactions in the period 1 January 2019 - 31 December 2019
Reclassification on 1 January 2019 (IFRS 16) 0 0 -823 -26 1 525 26 702
Acquisition in book value 0 0 0 15 606 0 237 15 843
Write off and sale of property, plant and equipment in residual value -7 -130 -20 0 -37 0 -194Reclassification 245 14 829 1 245 -16 323 262 -262 -4Depreciation -321 -3 342 -1 870 0 -372 0 -5 905as of 31 December 2019as of 31 December 2019as of 31 December 2019as of 31 December 2019
Acquisition cost 26 688 229 228 48 552 2 456 2 493 1 309 418Accumulated depreciation -7 385 -73 805 -37 486 0 -1 115 0 -119 791Net book valueNet book valueNet book valueNet book value 19 30319 30319 30319 303 155 423155 423155 423155 423 11 06611 06611 06611 066 2 4562 4562 4562 456 1 3781 3781 3781 378 1111 189 627189 627189 627189 627
Transactions in the period 1 January 2020 - 31 December 2020Transactions in the period 1 January 2020 - 31 December 2020Transactions in the period 1 January 2020 - 31 December 2020Transactions in the period 1 January 2020 - 31 December 2020Acquisition in book value 0 0 0 18 336 0 951 19 287
Write off and sale of property, plant and equipment in residual value 0 0 0 0 -23 0 -23Reclassification 191 10 682 1 418 -11 993 629 -952 -25Depreciation -296 -3 536 -2 013 0 -219 0 -6 064as of 31 December 2020as of 31 December 2020as of 31 December 2020as of 31 December 2020
Acquisition cost 26 875 239 412 49 029 8 799 2 793 0 326 908Accumulated depreciation -7 677 -76 843 -38 558 0 -1 028 0 -124 106Net book valueNet book valueNet book valueNet book value 19 19819 19819 19819 198 162 569162 569162 569162 569 10 47110 47110 47110 471 8 7998 7998 7998 799 1 7651 7651 7651 765 0000 202 802202 802202 802202 802
as of 31 Decemberas of 31 Decemberas of 31 Decemberas of 31 December
Property, plant and equipment and intangible assets are written off, if the conditions of the asset do not enable its furtherusage for production purposes.
By nature the right-of-use assets comply with the asset class of machinery and equipment.
24

AS TALLINNA VESICONSOLIDATED UNAUDITED INTERIM CONDENSED FINANCIAL STATEMENTS
FOR THE 12 MONTHS PERIOD OF FINANCIAL YEAR 2020 ENDED 31 DECEMBER 2020
NOTE 5. INTANGIBLE ASSETSNOTE 5. INTANGIBLE ASSETSNOTE 5. INTANGIBLE ASSETSNOTE 5. INTANGIBLE ASSETS
€ thousand
Acquired licenses Acquired licenses Acquired licenses Acquired licenses and other intangible and other intangible and other intangible and other intangible
assetsassetsassetsassets
Unfinished Unfinished Unfinished Unfinished intangible intangible intangible intangible
assets assets assets assets
Total intangible Total intangible Total intangible Total intangible assetsassetsassetsassets
as of 31 December 2018as of 31 December 2018as of 31 December 2018as of 31 December 2018Acquisition cost 4 206 50 4 256Accumulated depreciation -3 591 0 -3 591Net book valueNet book valueNet book valueNet book value 615615615615 50505050 665665665665
Transactions in the period 1 January 2019 - 31 December 2019Transactions in the period 1 January 2019 - 31 December 2019Transactions in the period 1 January 2019 - 31 December 2019Transactions in the period 1 January 2019 - 31 December 2019Acquisition in book value 0 249 249Reclassification 288 -288 0Depreciation -204 0 -204as of 31 December 2019as of 31 December 2019as of 31 December 2019as of 31 December 2019Acquisition cost 4 463 11 4 474Accumulated depreciation -3 764 0 -3 764Net book valueNet book valueNet book valueNet book value 699699699699 11111111 710710710710
Transactions in the period 1 January 2020 - 31 December 2020Transactions in the period 1 January 2020 - 31 December 2020Transactions in the period 1 January 2020 - 31 December 2020Transactions in the period 1 January 2020 - 31 December 2020Acquisition in book value 0 138 138Reclassification 119 -119 0Depreciation -219 0 -219as of 31 December 2020as of 31 December 2020as of 31 December 2020as of 31 December 2020Acquisition cost 4 582 30 4 612Accumulated depreciation -3 983 0 -3 983Net book valueNet book valueNet book valueNet book value 599599599599 30303030 629629629629
25

AS TALLINNA VESICONSOLIDATED UNAUDITED INTERIM CONDENSED FINANCIAL STATEMENTS
FOR THE 12 MONTHS PERIOD OF FINANCIAL YEAR 2020 ENDED 31 DECEMBER 2020
NOTE 6. PROVISION FOR POSSIBLE THIRD PARTY CLAIMSNOTE 6. PROVISION FOR POSSIBLE THIRD PARTY CLAIMSNOTE 6. PROVISION FOR POSSIBLE THIRD PARTY CLAIMSNOTE 6. PROVISION FOR POSSIBLE THIRD PARTY CLAIMS
On 12 December 2017, the Supreme Court made a decision on AS Tallinna Vesi’s cassation in thetariff dispute with the Estonian Competition Authority. The court stated that the Competition Authorityis not bound by the agreement on the water tariffs contained in the Services Agreement, which wasexecuted upon privatisation of the company. From now on, the tariffs will be regulated by theCompetition Authority in line with the methodology.
According to the law the tariffs established based on the Services Agreement were in force until theCompetition Authority approved the new tariffs and the Company implemented these tariffs in linewith the law. The Company has acted in good faith and in reliance to the applicable legal acts . Thusthe Company does not consider itself liable to the customers for any claims related to the tariffsapplied until the new tariffs approved by the Competition Authority were duly implemented.
On 18 October 2019 the Competition Authority approved the tariffs that the Company had applied forin September of that year. The new tariffs for water services came into force on 1 December 2019. Inthe Company’s main service area the private customer tariffs reduced by 27% and commercialcustomer tariffs dropped by 15%, on average.
The potential undiscounted payments by the Company in the future, if potential claims fromcustomers were recognised by the courts, would amount to €24.1 million (as of 31 December 2019:€36.1 million). This estimate marks the maximum difference in between the tariffs approved based onthe Services Agreement and the tariffs based on the Company's estimation, with the reservation tothe possible fluctuation, regarding past 24 months (as of 31 December 2019: 36 months), being theapproximate remaining unexpired term of potential claims.
The Management Board of the Company has assessed the potential liability resulting from suchclaims, if successful, to be €9.6 million (as of 31 December 2019: €14.4 million). As of 31 December2020, claims totalling €1.1 million have been filed within one application. The Company does notadmit any liability and fully rejects it.
26

AS TALLINNA VESICONSOLIDATED UNAUDITED INTERIM CONDENSED FINANCIAL STATEMENTS
FOR THE 12 MONTHS PERIOD OF FINANCIAL YEAR 2020 ENDED 31 DECEMBER 2020
NOTE 7. SEGMENT REPORTINGNOTE 7. SEGMENT REPORTINGNOTE 7. SEGMENT REPORTINGNOTE 7. SEGMENT REPORTING
€ thousand
Water Water Water Water servicesservicesservicesservices
Const- Const- Const- Const- ruction ruction ruction ruction
servicesservicesservicesservices
Other Other Other Other servicesservicesservicesservices
Inter- Inter- Inter- Inter- segment segment segment segment
transactionstransactionstransactionstransactions
Total Total Total Total segmentssegmentssegmentssegments
1 January 2020 - 31 December 20201 January 2020 - 31 December 20201 January 2020 - 31 December 20201 January 2020 - 31 December 2020External revenue 45 800 5 222 695 0 51 717Inter-segment revenue 1 3 481 3 421 -6 903 0
Total segment revenueTotal segment revenueTotal segment revenueTotal segment revenue 45 80145 80145 80145 801 8 7038 7038 7038 703 4 1164 1164 1164 116 -6 903-6 903-6 903-6 903 51 71751 71751 71751 717
Segment's gross profitSegment's gross profitSegment's gross profitSegment's gross profit 19 61419 61419 61419 614 409409409409 2 7682 7682 7682 768 -565-565-565-565 22 22622 22622 22622 226
Unallocated expenses:Unallocated expenses:Unallocated expenses:Unallocated expenses:Marketing and Administrative expenses -5 325Other income/expenses 4 567
Operating profitOperating profitOperating profitOperating profit 21 46821 46821 46821 468
1 January 2019 - 31 December 20191 January 2019 - 31 December 20191 January 2019 - 31 December 20191 January 2019 - 31 December 2019External revenue 56 866 5 960 597 0 63 423Inter-segment revenue 1 2 740 3 399 -6 140 0
Total segment revenueTotal segment revenueTotal segment revenueTotal segment revenue 56 86756 86756 86756 867 8 7008 7008 7008 700 3 9963 9963 9963 996 -6 140-6 140-6 140-6 140 63 42363 42363 42363 423
Segment's gross profitSegment's gross profitSegment's gross profitSegment's gross profit 32 98232 98232 98232 982 329329329329 1 2531 2531 2531 253 -611-611-611-611 33 95333 95333 95333 953
Unallocated expenses:Unallocated expenses:Unallocated expenses:Unallocated expenses:Marketing and Administrative expenses -6 079Other income/expenses 4 201
Operating profitOperating profitOperating profitOperating profit 32 07532 07532 07532 075
The Group's chief operating decision maker assesses the performance of each operating segment on the basis of itsrevenue (external and inter-segment revenue) and gross profit. The inter-segment transactions are carried out onmarket terms.
The Group has defined the business segments based on the reports used regularly by the chief operating decision makerfor the purposes of making strategic decisions. The chief operating decision maker monitors the Group’s operations byactivities. Three segments are distinguished: water services, construction and other services.
Water services:Water services:Water services:Water services: water supply, storm and wastewater disposal and treatment, fire hydrants service, overpollution charges and discharging.
ConstructionConstructionConstructionConstruction services:services:services:services: construction services provided by Watercom OÜ. Construction services have been identified as areportable segment because its revenues are more than 10% of the combined revenues of all segments.
OtherOtherOtherOther services:services:services:services: road maintenance, jet wash and transportation services, project management and owner's supervisionand other activities. Other activities are of less importance to the Group's financial results and none of them constitutes aseparate segment for reporting purposes.
27

AS TALLINNA VESICONSOLIDATED UNAUDITED INTERIM CONDENSED FINANCIAL STATEMENTS
FOR THE 12 MONTHS PERIOD OF FINANCIAL YEAR 2020 ENDED 31 DECEMBER 2020
Revenue by activitiesRevenue by activitiesRevenue by activitiesRevenue by activities
€ thousand 2020202020202020 2019201920192019 2020202020202020 2019201920192019
Water servicesWater servicesWater servicesWater services
Water supply service 2 061 3 083 8 106 13 781
Wastewater disposal service 3 066 2 966 12 048 11 719Total from private customers 5 127 6 049 20 154 25 500
Water supply service 1 882 2 728 7 209 11 482Wastewater disposal service 1 932 2 403 7 417 9 317Total from corporate customers 3 814 5 131 14 626 20 799
Water supply service 414 392 1 593 1 622Wastewater disposal service 840 841 3 298 3 193Storm water disposal service 74 148 291 426Total from outside service area customers 1 328 1 381 5 182 5 241
Storm water treatment and disposal service and fire hydrants service 1 016 1 153 4 588 4 002
Overpollution charges and discharging 367 318 1 250 1 324
Total from water servicesTotal from water servicesTotal from water servicesTotal from water services 11 652 14 032 45 800 56 866Construction servicesConstruction servicesConstruction servicesConstruction services 1 309 1 899 5 222 5 960Other servicesOther servicesOther servicesOther services 211 191 695 597Total revenueTotal revenueTotal revenueTotal revenue 13 17213 17213 17213 172 16 12216 12216 12216 122 51 71751 71751 71751 717 63 42363 42363 42363 423
100% of the Group´s revenue was generated within the Republic of Estonia.
NOTE 8. STAFF COSTSNOTE 8. STAFF COSTSNOTE 8. STAFF COSTSNOTE 8. STAFF COSTS
€ thousand 2020202020202020 2019201920192019 2020202020202020 2019201920192019
Salaries and wages -1 986 -1 735 -7 417 -6 762
Social security and unemployment insurance tax -672 -587 -2 509 -2 286Staff costs total Staff costs total Staff costs total Staff costs total -2 658-2 658-2 658-2 658 -2 322-2 322-2 322-2 322 -9 926-9 926-9 926-9 926 -9 048-9 048-9 048-9 048
335335335335 325325325325 332332332332 321321321321Average number of employees during the Average number of employees during the Average number of employees during the Average number of employees during the reporting periodreporting periodreporting periodreporting period
Quarter 4 Quarter 4 Quarter 4 Quarter 4
Quarter 4 Quarter 4 Quarter 4 Quarter 4
for the year ended 31 Decemberfor the year ended 31 Decemberfor the year ended 31 Decemberfor the year ended 31 December
for the year ended 31 Decemberfor the year ended 31 Decemberfor the year ended 31 Decemberfor the year ended 31 December
28

AS TALLINNA VESICONSOLIDATED UNAUDITED INTERIM CONDENSED FINANCIAL STATEMENTS
FOR THE 12 MONTHS PERIOD OF FINANCIAL YEAR 2020 ENDED 31 DECEMBER 2020
€ thousand 2020202020202020 2019201920192019 2020202020202020 2019201920192019Cost of goods and services sold Cost of goods and services sold Cost of goods and services sold Cost of goods and services sold Water abstraction charges -318 -314 -1 237 -1 219Chemicals -414 -408 -1 567 -1 664Electricity -754 -972 -3 256 -3 566Pollution tax -198 -302 -989 -1 089Staff costs -1 933 -1 707 -7 247 -6 602Depreciation and amortization -1 457 -1 470 -5 521 -5 420Construction services -1 068 -1 655 -4 256 -5 096Other costs -1 395 -1 315 -5 418 -4 814Total cost of goods and services sold Total cost of goods and services sold Total cost of goods and services sold Total cost of goods and services sold -7 537-7 537-7 537-7 537 -8 143-8 143-8 143-8 143 -29 491-29 491-29 491-29 491 -29 470-29 470-29 470-29 470
Marketing expensesMarketing expensesMarketing expensesMarketing expensesStaff costs -100 -78 -370 -318Other marketing expenses -13 -15 -63 -72Total marketing expensesTotal marketing expensesTotal marketing expensesTotal marketing expenses -113-113-113-113 -93-93-93-93 -433-433-433-433 -390-390-390-390
Administrative expensesAdministrative expensesAdministrative expensesAdministrative expensesStaff costs -625 -537 -2 309 -2 128Depreciation and amortization -82 -86 -333 -335Other general administration expenses -238 -658 -1 934 -3 226Total administrative expensesTotal administrative expensesTotal administrative expensesTotal administrative expenses -945-945-945-945 -1 281-1 281-1 281-1 281 -4 576-4 576-4 576-4 576 -5 689-5 689-5 689-5 689
NOTE 10. OTHER INCOME/EXPENSESNOTE 10. OTHER INCOME/EXPENSESNOTE 10. OTHER INCOME/EXPENSESNOTE 10. OTHER INCOME/EXPENSES
€ thousand 2020202020202020 2019201920192019 2020202020202020 2019201920192019
Connection fees 201 112 542 389Depreciation of single connections -112 -97 -429 -354
Doubtful receivables expenses (-)/ expense reduction (+) 7 -2 -64 20Provision for possible third party claims (Note 6) 1 204 4 626 4 814 4 626Other income (+)/expenses (-) -120 -182 -296 -480Total other income / expensesTotal other income / expensesTotal other income / expensesTotal other income / expenses 1 1801 1801 1801 180 4 4574 4574 4574 457 4 5674 5674 5674 567 4 2014 2014 2014 201
NOTE 9. COST OF GOODS AND SERVICES SOLD, MARKETING AND ADMINISTRATIVE NOTE 9. COST OF GOODS AND SERVICES SOLD, MARKETING AND ADMINISTRATIVE NOTE 9. COST OF GOODS AND SERVICES SOLD, MARKETING AND ADMINISTRATIVE NOTE 9. COST OF GOODS AND SERVICES SOLD, MARKETING AND ADMINISTRATIVE EXPENSESEXPENSESEXPENSESEXPENSES
Quarter 4 Quarter 4 Quarter 4 Quarter 4
Quarter 4 Quarter 4 Quarter 4 Quarter 4
for the year ended 31 Decemberfor the year ended 31 Decemberfor the year ended 31 Decemberfor the year ended 31 December
for the year ended 31 Decemberfor the year ended 31 Decemberfor the year ended 31 Decemberfor the year ended 31 December
29

AS TALLINNA VESICONSOLIDATED UNAUDITED INTERIM CONDENSED FINANCIAL STATEMENTS
FOR THE 12 MONTHS PERIOD OF FINANCIAL YEAR 2020 ENDED 31 DECEMBER 2020
€ thousand 2020202020202020 2019201920192019 2020202020202020 2019201920192019
Interest income 3 8 31 38Interest expense, loan -112 -153 -487 -714Interest expense, swap -27 -56 -185 -230
Increase (+)/decrease (-) of fair value of swap 28 99 221 159Other financial income (+)/expenses (-) -5 -8 -22 -24Total financial income / expensesTotal financial income / expensesTotal financial income / expensesTotal financial income / expenses -113-113-113-113 -110-110-110-110 -442-442-442-442 -771-771-771-771
NOTE 12. DIVIDENDSNOTE 12. DIVIDENDSNOTE 12. DIVIDENDSNOTE 12. DIVIDENDS
€ thousand 2020202020202020 2019201920192019
Dividends declared during the period 20 001 15 001Dividends paid during the period 19 888 14 965Withheld income tax on dividends 113 36Income tax on dividends paid 4 355 3 544
Dividends declared per shares:Dividends per A-share (in euros) 1,00 0,75Dividends per B-share (in euros) 600 600
NOTE 13. EARNINGS PER SHARENOTE 13. EARNINGS PER SHARENOTE 13. EARNINGS PER SHARENOTE 13. EARNINGS PER SHARE
€ thousand 2020202020202020 2019201920192019 2020202020202020 2019201920192019
Net profit minus B-share preferred dividend rights 5 388 10 951 16 731 27 759
Weighted average number of ordinary shares for the purposes of basic earnings per share (in pieces) 20 000 000 20 000 000 20 000 000 20 000 000
Earnings per A share (in euros) 0,27 0,55 0,84 1,39Earnings per B share (in euros) 600 600 600 600
NOTE 11. FINANCIAL INCOME AND EXPENSESNOTE 11. FINANCIAL INCOME AND EXPENSESNOTE 11. FINANCIAL INCOME AND EXPENSESNOTE 11. FINANCIAL INCOME AND EXPENSES
Diluted earnings per share for the periods ended 31 December 2020 and 2019 was equal to earnings per sharefigures stated above.
Quarter 4 Quarter 4 Quarter 4 Quarter 4
Quarter 4 Quarter 4 Quarter 4 Quarter 4
Dividend income tax rate in 2020 is 20/80 (in 2019: 20/80), but for dividend payments in the amount of up to theaverage taxed dividend payment during the three preceding years, the income tax rate 14/86 is applied. Whencalculating the average dividend payment of the three preceding years, 2018 is the first year to be taken intoaccount. In addition, for dividends payable to natural persons, income tax at a rate of 7% is withheld on dividendstaxed with a lower income tax rate.
for the year ended 31 Decemberfor the year ended 31 Decemberfor the year ended 31 Decemberfor the year ended 31 December
for the year ended 31 Decemberfor the year ended 31 Decemberfor the year ended 31 Decemberfor the year ended 31 December
for the year ended 31 Decemberfor the year ended 31 Decemberfor the year ended 31 Decemberfor the year ended 31 December
30

AS TALLINNA VESICONSOLIDATED UNAUDITED INTERIM CONDENSED FINANCIAL STATEMENTS
FOR THE 12 MONTHS PERIOD OF FINANCIAL YEAR 2020 ENDED 31 DECEMBER 2020
NOTE 14. RELATED PARTIESNOTE 14. RELATED PARTIESNOTE 14. RELATED PARTIESNOTE 14. RELATED PARTIES
Balances recorded on the statement of Balances recorded on the statement of Balances recorded on the statement of Balances recorded on the statement of financial position of the Groupfinancial position of the Groupfinancial position of the Groupfinancial position of the Group€ thousand 2020202020202020 2019201920192019Accounts receivable 1 390 531Trade and other payables 185 184
Transactions Transactions Transactions Transactions
€ thousand 2020202020202020 2019201920192019 2020202020202020 2019201920192019Revenue 1 016 1 153 4 588 4 002services -56 249 736 991Fees to the Group’s Management and Fees to the Group’s Management and Fees to the Group’s Management and Fees to the Group’s Management and Supervisory Board membersSupervisory Board membersSupervisory Board membersSupervisory Board members€ thousand (excluding social tax) 2020202020202020 2019201920192019 2020202020202020 2019201920192019Fees for Management Board 43 57 213 213Supervisory Board fees 8 8 32 32
Company shares belonging to the Management Board and Supervisory Board membersCompany shares belonging to the Management Board and Supervisory Board membersCompany shares belonging to the Management Board and Supervisory Board membersCompany shares belonging to the Management Board and Supervisory Board members
As of 31 December 2020, the members of the Supervisory Council and the Management Board did not own anyshares in the company (as of 31 December 2019: Riina Käi owned 100 shares).
The potential salary liability would be up to €90 thousand (excluding social tax) if the Supervisory Board wouldreplace all Management Board members.
Transactions with related parties are considered to be transactions with members of the Supervisory Boardand Management Board, their relatives and the companies in which they have control or significant influenceand transactions with shareholder having the significant influence. Dividend payments are indicated in theStatement of Changes in Equity.
Quarter 4 Quarter 4 Quarter 4 Quarter 4
The Group´s Management Board and Supervisory Board members are considered as key managementpersonnel for whom the contractual salary payments have been accounted for as disclosed above. In additionto this one Board Member has also received direct compensations from the companies belonging to the groupof United Utilities (Tallinn) B.V. as overseas secondees. Such compensations are recorded on line 'Purchase ofadministrative and consulting services'.
The Group’s Management Board members are elected for 3 (three) years and Supervisory Board members for2 (two) years. Stock exchange announcement is published about the change in Management and SupervisoryBoard.
Shareholders having the significant influenceShareholders having the significant influenceShareholders having the significant influenceShareholders having the significant influence
Quarter 4 Quarter 4 Quarter 4 Quarter 4
as of 31 December as of 31 December as of 31 December as of 31 December
for the year ended 31 Decemberfor the year ended 31 Decemberfor the year ended 31 Decemberfor the year ended 31 December
for the year ended 31 Decemberfor the year ended 31 Decemberfor the year ended 31 Decemberfor the year ended 31 December
31
AS TALLINNA VESICONSOLIDATED UNAUDITED INTERIM CONDENSED FINANCIAL STATEMENTS
FOR THE 12 MONTHS PERIOD OF FINANCIAL YEAR 2020 ENDED 31 DECEMBER 2020
NOTE 15. LIST OF SUPERVISORY BOARD MEMBERSNOTE 15. LIST OF SUPERVISORY BOARD MEMBERSNOTE 15. LIST OF SUPERVISORY BOARD MEMBERSNOTE 15. LIST OF SUPERVISORY BOARD MEMBERS
Simon Roger Gardiner Chairman of the Supervisory BoardThomas Wright Lissett Member of the Supervisory BoardMartin Benjamin Padley Member of the Supervisory BoardBrendan Francis Murphy Member of the Supervisory BoardPriit Rohumaa Member of the Supervisory BoardKatrin Kendra Member of the Supervisory BoardToivo Tootsen Member of the Supervisory BoardAllar Jõks Member of the Supervisory BoardPriit Lello Member of the Supervisory Board
https://tallinnavesi.ee/en/ettevote/management-board/supervisory-council/Introduction of Supervisory Board members is published at company’s web page.
32