TALLINNA KAUBAMAJA GRUPP AS
37
TALLINNA KAUBAMAJA GRUPP AS Consolidated Interim Report for the Third quarter and first 9 months of 2021 (unaudited)
Transcript of TALLINNA KAUBAMAJA GRUPP AS
TALLINNA KAUBAMAJA GRUPP AS
Consolidated Interim Report for
the Third quarter and first 9 months of 2021 (unaudited)
Tallinna Kaubamaja Grupp AS
Consolidated Interim Report for the third quarter and first 9 months of 2021 (unaudited)
2
Table of contents
MANAGEMENT REPORT .............................................................................................................................................. 4 CONDENSED CONSOLIDATED FINANCIAL STATEMENTS..................................................................................... 14
MANAGEMENT BOARD’S CONFIRMATION TO THE CONDENSED CONSOLIDATED FINANCIAL STATE-
MENTS 14 CONDENSED CONSOLIDATED STATEMENT OF FINANCIAL POSITION ................................................ 15 CONDENSED CONSOLIDATED STATEMENT OF PROFIT OR LOSS AND OTHER COMPREHENSIVE
INCOME 16 CONDENSED CONSOLIDATED CASH FLOW STATEMENT ...................................................................... 17 CONDENSED CONSOLIDATED STATEMENT OF CHANGES IN OWNERS’ EQUITY ............................... 18 NOTES TO THE CONDENSED CONSOLIDATED INTERIM ACCOUNTS .................................................. 19
Note 1. Accounting Principles Followed upon Preparation of the Condensed Consolidated Interim Ac-
counts ............................................................................................................................................................... 19
Note 2. Cash and cash equivalents ............................................................................................................... 20
Note 3. Trade and other receivables ............................................................................................................. 20
Note 4. Trade receivables ............................................................................................................................... 20
Note 5. Inventories .......................................................................................................................................... 20
Note 6. Subsidiaries ........................................................................................................................................ 21
Note 7. Investments in associates ................................................................................................................. 23
Note 8. Long-term trade and other receivables ............................................................................................ 23
Note 9. Investment property .......................................................................................................................... 24
Note 10. Property, plant and equipment ...................................................................................................... 25
Note 11. Intangible assets .............................................................................................................................. 26
Note 12. Borrowings ....................................................................................................................................... 27
Note 13. Trade and other payables ............................................................................................................... 29
Note 14. Taxes................................................................................................................................................. 29
Note 15. Share capital .................................................................................................................................... 30
Note 16. Segment reporting ........................................................................................................................... 30
Note 17. Services expenses ............................................................................................................................ 35
Note 18. Staff costs ........................................................................................................................................ 36
Note 19. Earnings per share .......................................................................................................................... 36
Note 20. Related party transactions .............................................................................................................. 36
Tallinna Kaubamaja Grupp AS
Consolidated Interim Report for the third quarter and first 9 months of 2021 (unaudited)
3
COMPANY PROFILE AND CONTACT DETAILS
The primary areas of activity of the companies of the Tallinna Kaubamaja Grupp AS (hereinafter referred to
as the ‘Tallinna Kaubamaja Group’ or ‘the Group’) include retail and wholesale trade and rental activities. The
Tallinna Kaubamaja Group employs more than 4,900 employees.
The Company is listed on the Tallinn Stock Exchange.
Registered office: Kaubamaja 1
10143 Tallinn
Republic of Estonia
Registry code: 10223439
Beginning of financial year: 1 January 2021
End of financial year: 31 December 2021
Beginning of interim report period: 1 January 2021
End of interim report period: 30 September 2021
Auditor: PricewaterhouseCoopers AS
Telephone: 372 667 3300
E-mail: [email protected]

Tallinna Kaubamaja Grupp AS
Consolidated Interim Report for the third quarter and first 9 months of 2021 (unaudited)
4
MANAGEMENT REPORT
Management
In order to manage the Group the general meeting of the shareholders, held at least once in a year, elects
supervisory board, which according to the articles of association may have 3 to 6 members. Members of the
Group supervisory board are Jüri Käo (chairman of the supervisory board), Andres Järving, Enn Kunila, Gunnar
Kraft and Meelis Milder. Members of Group supervisory board are elected for three years. The mandates of
current supervisory board members Andres Järving, Jüri Käo, Enn Kunila, Meelis Milder and Gunnar Kraft will
expire on 20 May 2024. During the period between the general meetings the supervisory board plans actions
of the company, organises management and accomplishes supervision over management actions. Regular
supervisory board meetings are held at least 10 times in a year. In order to manage daily activities the
supervisory board appoints member(s) of the management board of the Tallinna Kaubamaja Group in
accordance with the Commercial Code. In order to elect a member of the management board, his or her
consent is required. By the articles of association a member of the management board shall be elected for a
specified term of three years. Extension of the term of office of a member of the management board shall not
be decided earlier than one year before the planned date of expiry of the term of office, and not for a period
longer than the maximum term of office prescribed by the articles of association. Currently the management
board of Group has one member. The term of office of the management board member Raul Puusepp was
extended on 2020 and his term of office expires on 6 March 2023.
The law, the articles of association, decisions and goals stated by the shareholders and supervisory board are
followed for managing the company. By Commercial Code a resolution on amendment of the articles of
association shall be adopted, if at least two-third of the votes represented at a general meeting is in favour. A
resolution on amendment of the articles of association shall enter into force as of making of a corresponding
entry in the commercial register. The Group does not possess several classes of shares.
Structure of the company
The Group is reporting its economic activities under five operating segments as follows.
1. The operating segment of supermarkets is focused on the retail sales of food products and
convenience goods.
2. The main area of activity of the department store segment is the retail sales of beauty and fashion
products. The segment includes the retail sales of the department stores, as well as the beauty and
footwear store chains.
3. The car trade segment is focused on the import and sale of cars and spare parts for cars.
4. The real estate segment is involved with the development, management and maintenance of the real
estate owned by the Group and with renting commercial premises.
5. The principal activity of the security segment is the provision of security solutions.
The following companies belong to the Group as of September 30, 2021:
Shareholding
as of
Shareholding
as of
Selver supermarkets Location 30.09.2021 31.12.2020
Selver AS Estonia 100% 100%
Kulinaaria OÜ Estonia 100% 100%
Department stores
Kaubamaja AS Estonia 100% 100%
TKM Finants AS Estonia 100% 100%
OÜ TKM Beauty Estonia 100% 100%
OÜ TKM Beauty Eesti Estonia 100% 100%
AS TKM King Estonia 100% 100%
Rävala Parkla AS Estonia 50% 50%
Tallinna Kaubamaja Grupp AS
Consolidated Interim Report for the third quarter and first 9 months of 2021 (unaudited)
5
Shareholding
as of
Shareholding
as of
Car trade Location 30.09.2021 31.12.2020
TKM Auto OÜ Estonia 100% 100%
KIA Auto AS Estonia 100% 100%
AS Viking Motors Estonia 100% 100%
SIA Forum Auto Latvia 100% 100%
Verte Auto SIA Latvia 100% 100%
KIA Auto UAB Lithuania 100% 100%
Security segment
Viking Security AS Estonia 100% 100%
Real estate
Tallinna Kaubamaja Kinnisvara AS Estonia 100% 100%
OÜ Tartu Kaubamaja Kinnisvara Estonia 100% 100%
SIA TKM Latvija Latvia 100% 100%
TKM Lietuva UAB Lithuania 100% 100%
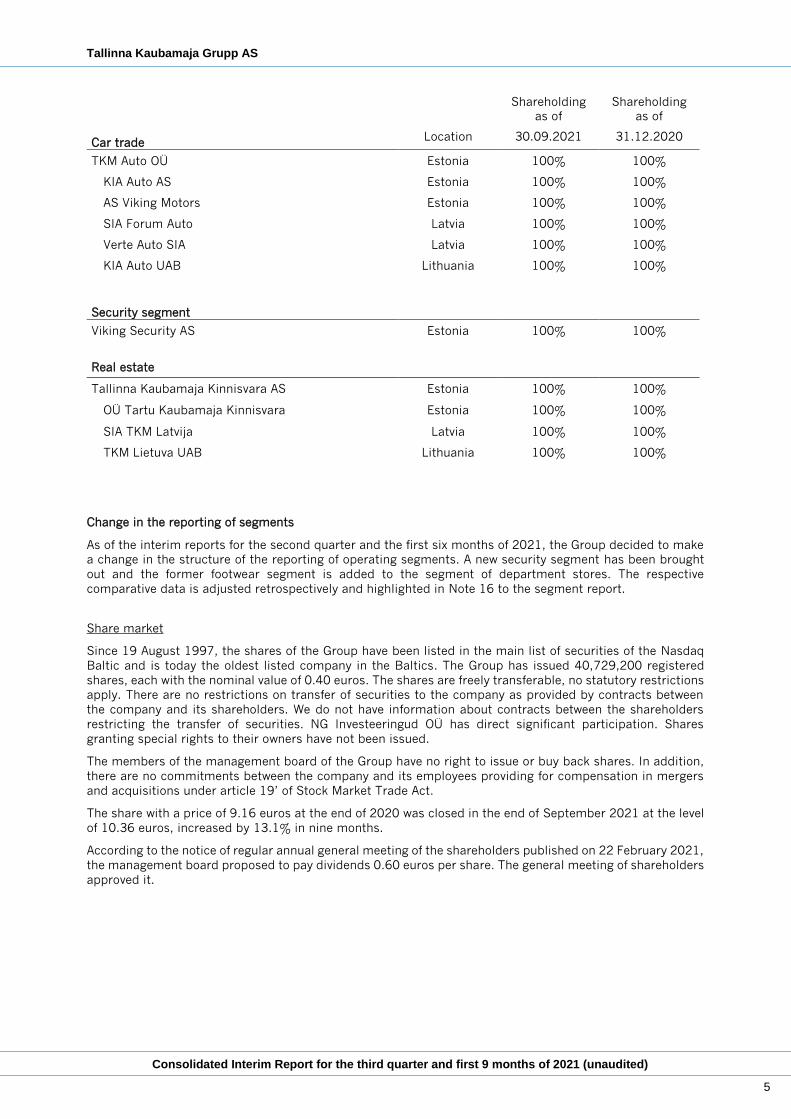
Change in the reporting of segments
As of the interim reports for the second quarter and the first six months of 2021, the Group decided to make
a change in the structure of the reporting of operating segments. A new security segment has been brought
out and the former footwear segment is added to the segment of department stores. The respective
comparative data is adjusted retrospectively and highlighted in Note 16 to the segment report.
Share market
Since 19 August 1997, the shares of the Group have been listed in the main list of securities of the Nasdaq
Baltic and is today the oldest listed company in the Baltics. The Group has issued 40,729,200 registered
shares, each with the nominal value of 0.40 euros. The shares are freely transferable, no statutory restrictions
apply. There are no restrictions on transfer of securities to the company as provided by contracts between
the company and its shareholders. We do not have information about contracts between the shareholders
restricting the transfer of securities. NG Investeeringud OÜ has direct significant participation. Shares
granting special rights to their owners have not been issued.
The members of the management board of the Group have no right to issue or buy back shares. In addition,
there are no commitments between the company and its employees providing for compensation in mergers
and acquisitions under article 19’ of Stock Market Trade Act.
The share with a price of 9.16 euros at the end of 2020 was closed in the end of September 2021 at the level
of 10.36 euros, increased by 13.1% in nine months.
According to the notice of regular annual general meeting of the shareholders published on 22 February 2021,
the management board proposed to pay dividends 0.60 euros per share. The general meeting of shareholders
approved it.
Tallinna Kaubamaja Grupp AS
Consolidated Interim Report for the third quarter and first 9 months of 2021 (unaudited)
6
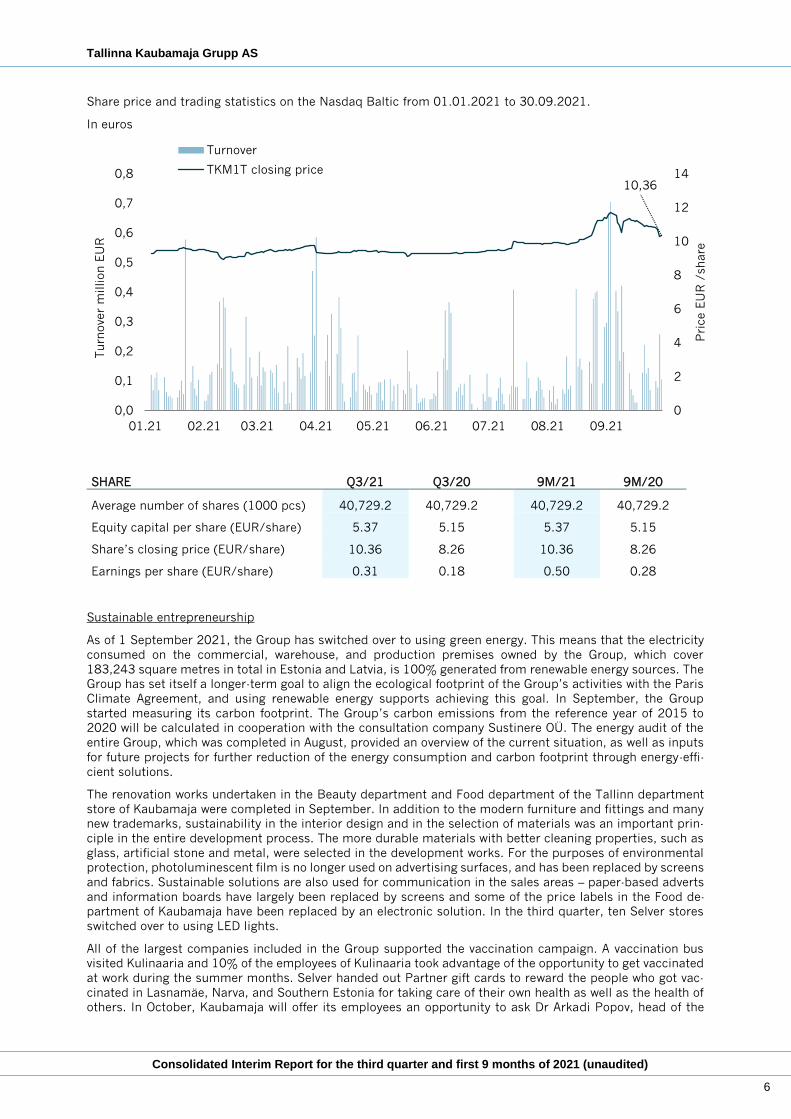
Share price and trading statistics on the Nasdaq Baltic from 01.01.2021 to 30.09.2021.
In euros
SHARE Q3/21 Q3/20 9M/21 9M/20
Average number of shares (1000 pcs) 40,729.2 40,729.2 40,729.2 40,729.2
Equity capital per share (EUR/share) 5.37 5.15 5.37 5.15
Share’s closing price (EUR/share) 10.36 8.26 10.36 8.26
Earnings per share (EUR/share) 0.31 0.18 0.50 0.28
Sustainable entrepreneurship
As of 1 September 2021, the Group has switched over to using green energy. This means that the electricity
consumed on the commercial, warehouse, and production premises owned by the Group, which cover
183,243 square metres in total in Estonia and Latvia, is 100% generated from renewable energy sources. The
Group has set itself a longer-term goal to align the ecological footprint of the Group’s activities with the Paris
Climate Agreement, and using renewable energy supports achieving this goal. In September, the Group
started measuring its carbon footprint. The Group’s carbon emissions from the reference year of 2015 to
2020 will be calculated in cooperation with the consultation company Sustinere OÜ. The energy audit of the
entire Group, which was completed in August, provided an overview of the current situation, as well as inputs
for future projects for further reduction of the energy consumption and carbon footprint through energy-effi-
cient solutions.
The renovation works undertaken in the Beauty department and Food department of the Tallinn department
store of Kaubamaja were completed in September. In addition to the modern furniture and fittings and many
new trademarks, sustainability in the interior design and in the selection of materials was an important prin-
ciple in the entire development process. The more durable materials with better cleaning properties, such as
glass, artificial stone and metal, were selected in the development works. For the purposes of environmental
protection, photoluminescent film is no longer used on advertising surfaces, and has been replaced by screens
and fabrics. Sustainable solutions are also used for communication in the sales areas – paper-based adverts
and information boards have largely been replaced by screens and some of the price labels in the Food de-
partment of Kaubamaja have been replaced by an electronic solution. In the third quarter, ten Selver stores
switched over to using LED lights.
All of the largest companies included in the Group supported the vaccination campaign. A vaccination bus
visited Kulinaaria and 10% of the employees of Kulinaaria took advantage of the opportunity to get vaccinated
at work during the summer months. Selver handed out Partner gift cards to reward the people who got vac-
cinated in Lasnamäe, Narva, and Southern Estonia for taking care of their own health as well as the health of
others. In October, Kaubamaja will offer its employees an opportunity to ask Dr Arkadi Popov, head of the
10,36
0
2
4
6
8
10
12
14
0,0
0,1
0,2
0,3
0,4
0,5
0,6
0,7
0,8
01.21 02.21 03.21 04.21 05.21 06.21 07.21 08.21 09.21
Pri
ce E
UR
/share
Turn
ove
r m
illion E
UR
Turnover
TKM1T closing price
Tallinna Kaubamaja Grupp AS
Consolidated Interim Report for the third quarter and first 9 months of 2021 (unaudited)
7
West Tallinn Central Hospital, about the health risks arising from getting vaccinated or foregoing the vaccina-
tion.
Summer is the time for events, and the events supported by the companies of the Group financially or in the
form of advertising or handing out products included several large-scale events, such as the Saaremaa Opera
Days, Sõru Jazz, Tuletorni Kontsert, Grillfest, Kapa Rock, Augustiunetus, Augustibluus, the ALTernative street
festival, and the Ülemiste Volleyball Festival.
Schoolchildren were also not left without attention. Selver handed out 1 litre of Selver ice cream to all children
who started the first grade. In August, Kaubamaja helped to collect school supplies for the children of large
Estonian families within the framework of the ‘Kooli Aeg’ campaign. The project in question, which has been
received very well by the customers and has become a tradition, involves giving the customers an opportunity
to purchase school supplies for the children of large families from the Kaubamaja department stores in Tallinn
and Tartu and from the online store of Kaubamaja.
In terms of social projects, Selver also supported a camp for the victims of sexual violence. Kulinaaria contin-
ued its tight cooperation with the Astangu Vocational Rehabilitation Centre with an aim to increase the em-
ployment rate among the individuals with special needs and nine people from Astangu, in total, completed
their internships at Kulinaaria in the summer period. Kulinaaria also commenced cooperation with the Food
Bank in August and 485 kg of food has already been saved within the short period of time. Kia Auto helped
the young Estonian rower Liisa-Marie Läänet to buy her own boat for training and for qualifying for the 2024
Summer Olympics.
Economic environment
The Estonian economy is rapidly recovering from the crisis. In the second quarter of 2021, the Estonian gross
domestic product increased steeply by 12.9% compared to the second quarter in the previous year. According
to Statistics Estonia, the primary reason for the fast economic growth is the very low reference base of last
year, when Estonia was suffering from the emergency situation declared due to the coronavirus crisis.
However, the economy has also grown compared to the pre-crisis second quarter of 2019. The processing
industry and the transport and warehousing sectors recovered quickly in the second quarter of 2021, with the
information and communications sector also growing rapidly. Trade also contributed to the economic growth.
The accommodation and catering sectors, which were severely affected by the coronavirus-related
restrictions, exhibited a fast growth, but still remained below the pre-crisis level. In the third quarter, the
impact of the almost 1.3 billion euros from the pension savings which was injected into the consumption by
the pension reform was clearly visible in the Estonian economy, supporting the growth in demand and
especially the consumption of durable goods, but the entire impact of the reform remains unclear for now.
According to the Bank of Estonia, the annual economic growth may reach 9.5%, in total. The consumer price
index in Estonia grew by 3.1% in the first nine months, whereas the prices of food and non-alcoholic beverages
rose by 0.9%, while the prices of clothing and footwear decreased by 0.4%. The increase in prices was led by
the higher accommodation and transport expenses due to an increase in the prices of engine fuel and the
electricity supplied to homes. According to the estimations of the Bank of Estonia, the average inflation in
2021 will be 3.6%, mainly due to the increase in energy prices. In comparison with the second quarter of the
previous year, the average monthly gross wages increased by 7.3%, reaching 1,538 euros in the second
quarter. The pace of recruitment of those employees who were released in the sectors which suffered due to
the waves of the pandemic in other fields of activity has been slower than expected. Analysts predict a total
increase in the average wage of at least 6.0–7.0% in 2021 in connection which the steep increase in labour
deficiency which has accompanied the enlivening of the economy.
According to Statistics Estonia, the sales revenue generated by commercial establishments in current prices
increased by 17.0% in the first eight months of 2021. After the spring movement restrictions caused by the
virus, consumption boldly recovered in September, gaining further momentum from the pension savings paid
out by the pension reform, which is not yet reflected in Statistics Estonia's eight-month statistics. In the first
eight months of 2020, sales revenue decreased by 6.6%. The largest growth in sales revenue was
unsurprisingly shown by retail sales via mail or the Internet (40.0%). Sales revenue in non-specialised stores
(primarily foodstuffs) grew by 4.8% in total in the first eight months of the year. The retail, wholesale, and
repairs segment of motor vehicles and motorbikes, which had suffered the greatest decline in the year before,
increased by 27.8% in the first eight months of 2021. According to AMTEL, the registration of new vehicles
in the first nine months of 2021 increased by 30.1% in Estonia. A year earlier, the Estonian car market had
fallen by 34.4%. Thus, the market for new passenger cars in Estonia has now recovered close to the pre-crisis
level.
Tallinna Kaubamaja Grupp AS
Consolidated Interim Report for the third quarter and first 9 months of 2021 (unaudited)
8
Economic results
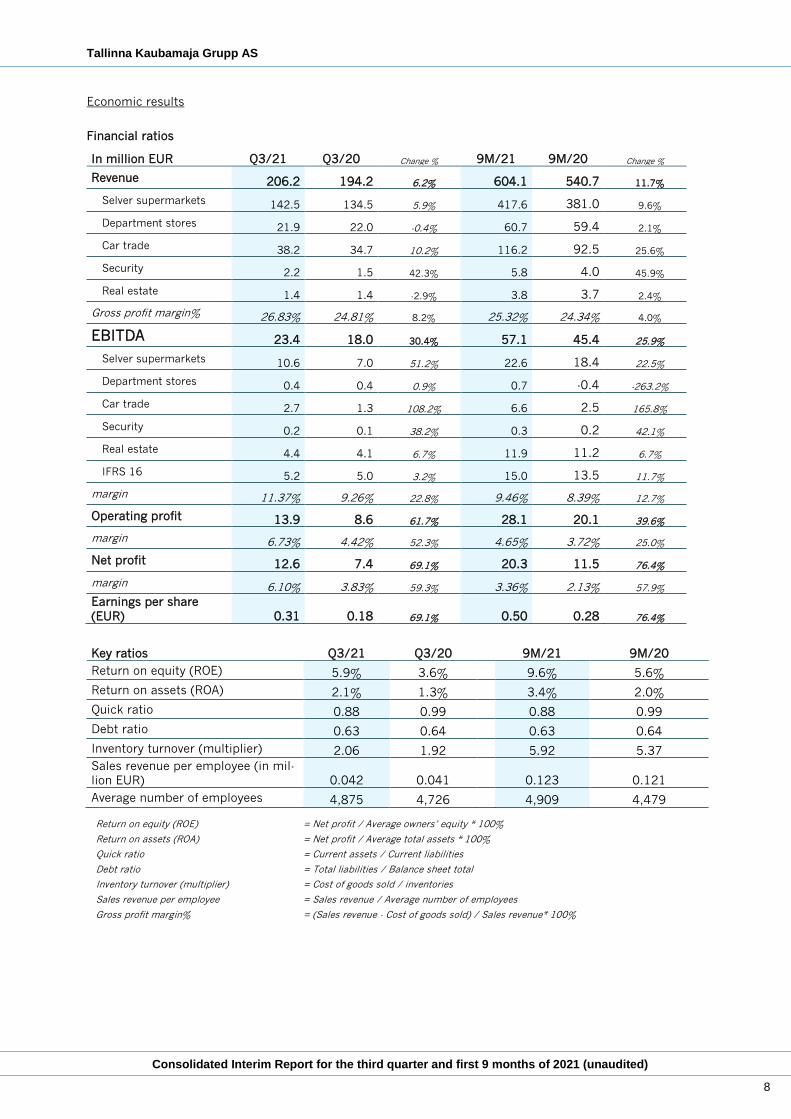
Financial ratios
In million EUR Q3/21 Q3/20 Change % 9M/21 9M/20 Change %
Revenue 206.2 194.2 6.2% 604.1 540.7 11.7%
Selver supermarkets 142.5 134.5 5.9% 417.6 381.0 9.6%
Department stores 21.9 22.0 -0.4% 60.7 59.4 2.1%
Car trade 38.2 34.7 10.2% 116.2 92.5 25.6%
Security 2.2 1.5 42.3% 5.8 4.0 45.9%
Real estate 1.4 1.4 -2.9% 3.8 3.7 2.4%
Gross profit margin% 26.83% 24.81% 8.2% 25.32% 24.34% 4.0%
EBITDA 23.4 18.0 30.4% 57.1 45.4 25.9%
Selver supermarkets 10.6 7.0 51.2% 22.6 18.4 22.5%
Department stores 0.4 0.4 0.9% 0.7 -0.4 -263.2%
Car trade 2.7 1.3 108.2% 6.6 2.5 165.8%
Security 0.2 0.1 38.2% 0.3 0.2 42.1%
Real estate 4.4 4.1 6.7% 11.9 11.2 6.7%
IFRS 16 5.2 5.0 3.2% 15.0 13.5 11.7%
margin 11.37% 9.26% 22.8% 9.46% 8.39% 12.7%
Operating profit 13.9 8.6 61.7% 28.1 20.1 39.6%
margin 6.73% 4.42% 52.3% 4.65% 3.72% 25.0%
Net profit 12.6 7.4 69.1% 20.3 11.5 76.4%
margin 6.10% 3.83% 59.3% 3.36% 2.13% 57.9%
Earnings per share
(EUR) 0.31 0.18 69.1% 0.50 0.28 76.4%
Key ratios Q3/21 Q3/20 9M/21 9M/20
Return on equity (ROE) 5.9% 3.6% 9.6% 5.6%
Return on assets (ROA) 2.1% 1.3% 3.4% 2.0%
Quick ratio 0.88 0.99 0.88 0.99
Debt ratio 0.63 0.64 0.63 0.64
Inventory turnover (multiplier) 2.06 1.92 5.92 5.37
Sales revenue per employee (in mil-
lion EUR) 0.042 0.041 0.123 0.121
Average number of employees 4,875 4,726 4,909 4,479
Return on equity (ROE) = Net profit / Average owners’ equity * 100%
Return on assets (ROA) = Net profit / Average total assets * 100%
Quick ratio = Current assets / Current liabilities
Debt ratio = Total liabilities / Balance sheet total
Inventory turnover (multiplier) = Cost of goods sold / inventories
Sales revenue per employee = Sales revenue / Average number of employees
Gross profit margin% = (Sales revenue - Cost of goods sold) / Sales revenue* 100%
Tallinna Kaubamaja Grupp AS
Consolidated Interim Report for the third quarter and first 9 months of 2021 (unaudited)
9
In the third quarter of 2021, the consolidated unaudited sales revenue of the Group was 206.2 million euros,
which was 6.2% more than the sales revenue of the same period in 2020. The sales revenue in the nine
months was 604.1 million euros, which was an 11.7% increase in comparison with the result of the first nine
months of 2020, when the sales revenue was 540.7 million euros. In the third quarter of 2021, the Group’s
unaudited consolidated net profit was 12.6 million euros, which was 69.1% higher than the profit of the
comparable period in the previous year. The Group’s net profit of the first nine months of 2021 was 20.3
million euros, which was 76.4% higher than the result of the comparable period in the previous year. In the
first nine months, the pre-tax profit was 24.6 million euros, increasing by 42.2% compared to the year before.
Net profit was affected by the dividend payment, from which 4.3 million euros of income tax was calculated
in the first quarter of 2021; 5.8 million euros of income tax was calculated a year before.
The sales result of the third quarter of 2021 was probably affected most by the favourable situation in the
Estonian retail market. Those consumers, who had stayed away from stores during the coronavirus restrictions
in spring, returned, and active use of the funds from the second pension pillar, which became available due
to the pension reform in Estonia, increased the sales of durable goods explosively. The strong sales results of
the Selver segment and the car segment in the third quarter also accelerated the growth of the Group’s sales
revenue. Fast-paced growth of the sales via online channels continued in the Selver and Kaubamaja depart-
ment store segments even after the restrictions on movement were lifted. The major strategic investments
made by the Group a year earlier in the growth of the supermarket segment's store network and the expansion
of the central kitchen have paid off and enabled the successful growth of supermarket segment sales and
gross revenue and increased margins. In the situation of a car deficit, the Group's car segment also managed
to improve its sales margin. Along with the growth of the store network, maintenance and data communication
costs increased at a comparable pace. Labour costs increased by 8.0% in the third quarter, while the number
of employees increased by 3.1%.
The economic result of the first nine months of 2021 was affected by the restrictions established to prevent
the spread of the coronavirus in the second quarter. Those mainly affected the stores of the Kaubamaja
department store segment, with most of those stores closed for seven weeks. The fashion and industrial goods
departments of the Kaubamaja department store segment, all I.L.U. stores, as well as the ABC King and SHU
shoe stores were closed for visitors. Even though, based on an application submitted by the Group, the state
covered the employees’ remuneration and, within the framework of the entrepreneurship support package,
the Group’s operating expenditure in the extent of 1.6 million euros in total (in the year before, the amount
of national aid for the operations reached 1.3 million euros), the Kaubamaja department store segment is still
earning a loss over the nine months in total.
In the third quarter of this year, Selver renovated the Jaamamõisa store. In the Kaubamaja department store
segment, the Beauty department and Food department of the Tallinn department store were renovated, with
the Food department in Tallinn closed fully for the renovation works on 25 June and reopened in renovated
form on 26 August. Both of the renovated sections have been accepted well by the customers. In September,
the Group notified the stock exchange of the strategic decision to close the footwear business and to gradually
close all ABC KING and SHU stores over the following year.
One of the most significant large-scale developments of the Group was finished in the first nine months of
2021 – the completion of the new production building of the central kitchen of Kulinaaria OÜ with the renova-
tion of the previous factory and the connection of the two production buildings. The most extensive innovation
in the first quarter was the transfer of stores operating under the Comarket brand to the Selver ABC brand
and the integration of Comarket, Delice stores, and the Solaris Food Store with the Selver supply chain and
IT systems. Updating the software platform of the Selver online stores also commenced in the first quarter
and was fully completed by the end of the third quarter. As of 1 June 2021, the service area of the e-Selver
online store service covers all of Estonia. With this expansion, Selver became the only online grocery store in
Estonia which delivers goods to all counties of mainland Estonia in the entire extent. Selver has been very
actively contributing to the development of e-commerce in the past six years to be a pioneer in online shop-
ping. One update allows the customers of e-Selver to track the journeys of their orders on the map, which is
updated at an interval of twenty seconds.
As at 30 September 2021, the volume of assets of Tallinna Kaubamaja Group was 598.2 million euros – a
decrease of 4.6% compared to the results at the end of 2020 without the impact of IFRS 16.
At the end of the reporting period, the number of loyal customers was more than 701 thousand, which is 2.1%
more than the year before. The proportion of loyal customers in the Group’s turnover was 85.5% (in the first
half of 2020, it was 86.5%).
Selver supermarkets
The consolidated sales revenue of the supermarket business segment in the nine months of 2021 was 417.6
million euros, increasing by 9.6% compared to the previous year. The consolidated sales revenue was 142.5
Tallinna Kaubamaja Grupp AS
Consolidated Interim Report for the third quarter and first 9 months of 2021 (unaudited)
10
million euros in the third quarter of 2020, increasing by 5.9% in comparison with the same period of last
year. The average monthly sales revenue per square metre of sales area in the nine months of 2021 was 0.39
thousand euros, exceeding the respective indicator in the year before by 1.8%. In the third quarter, the re-
spective indicator was 0.41 thousand euros, which is 6.2% more than in the same period last year. The
average sales revenue per square metre of selling space of comparable stores was 0.40 thousand euros in
the first nine months and 0.41 thousand euros, on average, in the third quarter, growing by 2.1% and 4.6%,
respectively, compared to the year before. In the nine months of 2021, 31.7 million purchases were made
from the stores, which was 13.0% more than in the reference year.
In the third quarter of 2021, both the pre-tax profit and the net profit were 7.8 million euros, increasing by
3.4 million euros in comparison with the same period the year before. The consolidated pre-tax profit of the
supermarkets segment in the nine months of 2021 was 14.2 million euros, increasing by 2.1 million euros in
comparison with the previous year. The net profit of the nine months was 12.6 million euros, which is an
increase of 2.7 million euros in comparison with the previous year. As of 1 June 2020, the results of the
supermarket segment include the results of ABC Supermarkets.
As Estonian economy as a whole, the supermarket segment was also impacted by the changes in the purchase
behaviour and consumption habits of the customers in connection with the coronavirus broke out in March
2020, which has resulted in challenges in operating with the goods and continuously increased the expenses
on the personal protective equipment for the customers and the employees.
Selver’s result is affected by the acquisition of ABC Supermarkets in the second quarter of last year, which
increased the number of Selver stores by nineteen new stores. In February 2021, the sales activities of one of
the stores were terminated and at the end of the half-year, the sales activities will continue in the eighteen
added stores. The comparability of the results is also affected by the new Selver store opened in July 2020
and by the renovation of one of the Selver stores in the reference period, the expansion of the sales area of
two stores, and the impact of the leap year. Selver has renovated one store in the third quarter this year. The
store was closed for customers for six weeks due to the renovation works.
Compared to the same period the year before, which included the significant increase in e-commerce, the
number of orders received by e-Selver has almost doubled in the nine months. The service area of e-Selver
has been expanded in several stages since the beginning of the year and since June, it covers the entire
mainland Estonia, as well as the largest islands. The service area of e-Selver is the largest in Estonia and it
was declared the most user-friendly online store in the category of groceries in 2021.
This year, the transfer of the stores operating under the Comarket brand to the Selver ABC brand was com-
pleted and IT software upgrades were made in the Delice store and Solaris Food Store. In the Delice and
Solaris stores, the Delice Express service is now offered to customers – previously, these stores had self-
service checkouts, but now, customers can make their purchases conveniently by using barcode scanners.
The process bringing the stores together under one brand and the process of updating the IT software were
accompanied by closing the stores for a few days for replacing the equipment, as well as by one-time expenses
and investments. The work with the assortment of the stores operating under the Selver ABC trademark, as
well as increasing the efficiency of the work processes including the entire Selver chain, has continued. In the
third quarter, four smaller Selver stores were rebranded under the Selver ABC trademark. Investments have
been made in the popular SelveEkspress service this year. Additional self-checkout tills have been added to
the stores where the customers’ interest in the service has significantly increased, and opening of the SelveEk-
spress service in the Selver ABC stores has begun. Expansion of the SelveEkspress service to the Selver ABC
stores will also continue in the last quarter of the year.
The profit has been significantly affected by the good revenue, especially in the summer period, when the
weather was warm, as well as the faster increase in labour costs, and the costs of the acquisition of ABC
Supermarkets and bringing the stores under the Selver trademark. The lack of manpower in the labour market
has resulted in wage pressure. A temporary increase in the labour costs was also caused by the integration
of the processes of ABC Supermarket stores into the Selver solution, higher labour needs in the e-commerce
segment, where the provision of the service is more resource-intensive compared to the physical store, and
higher expenses to cover the increased sick days of employees. The profit has also been affected by the energy
prices, which have occasionally risen several times above the normal levels.
Selver also plans to renovate another Selver store this year and to further develop the online store service to
meet the persistently high demand. Active preparations continue in connection with the new Selver stores to
be opened in 2022.
As at the end of September, the supermarket segment includes sixty-nine Selver stores, one Delice store, one
Solaris Food Store, the e-Selver online store, the mobile store and café, with a total sales area of 114.6
thousand m2, and the central kitchen Kulinaaria OÜ.
Tallinna Kaubamaja Grupp AS
Consolidated Interim Report for the third quarter and first 9 months of 2021 (unaudited)
11
Department stores
The sales revenue of the Kaubamaja department stores segment in the nine months of 2021 was 60.7 million
euros, which was 2.1% better than in the comparable period of the previous year. The sales revenue of the
third quarter was 21.9 million euros, which remained 0.4% below the level of the previous year. The pre-tax
loss of the Kaubamaja department store segment in the first nine months of 2021 was 1.0 million euros,
which was 1.3 million euros better than the result of the previous year, when the loss amounted to 2.3 million
euros. The pre-tax loss of for the third quarter was 0.1 million euros, which is 0.1 million euros better than in
the same period last year.
The average sales revenue of the Kaubamaja department stores per square metre of selling space was 0.24
thousand euros per month in the nine months, which is 0.7% higher than in the same period last year. The
sales result of the Kaubamaja department stores for the nine months was affected by the strict restrictions in
spring, which resulted in the closure of all stores selling industrial goods. As in the previous year, the Kau-
bamaja department stores closed all departments of industrial goods in Tallinn and Tartu for seven weeks (in
2020, they were closed for six weeks). Only the grocery stores remained open. The fact, that the customers’
demand for summer goods was, compared to the previous year, much higher after the reopening of the stores,
was evident from the discount campaign in the summer, which proved very successful. The renovation of the
Beauty department and Food department of the Tallinn department store had a negative impact on the oper-
ating profit of the Kaubamaja department store segment, with the Food department in Tallinn closed fully for
the renovation works on 25 June and reopened in renovated form on 26 August. The opening campaign of the
autumn season and ‘Ilu Aeg’ (the Time of Beauty campaign) in early September were most successful for a
number of years, which shows, that the customers have accepted the renovated sections well.
In the third quarter of 2021, the sales revenue of OÜ TKM Beauty Eesti, which operates I.L.U. cosmetics
stores, was 1.5 million euros, which is 17.4% more than in the same period of 2020. In the third quarter of
2021, profit was 0.1 million euros, which was 0.05 million euros more than during the comparable period in
2020. The sales revenue in the first nine months of 2021 was 3.5 million euros, which is 7.4% more than in
the same period of 2020. In the first nine months of 2021, profit was 0.1 million euros, which was 0.04 million
euros more than in the comparable period in 2020. The sales revenue in the third quarter was increased by
successful marketing campaigns, the expansion of the sales areas of several stores at the expense of former
hair studios, and the consumers’ preparedness to visit physical stores in the light of the significantly improved
pandemic situation. In the last month of the quarter, thanks to the funds released from the second pension
pillar, there was an increase in more expensive impulse purchases.
The sales revenue of the shoe stores of TKM King AS, which is being reported under the Kaubamaja depart-
ment store segment as of 1 April 2021, was 3.5 million euros in the nine months of 2021. In comparison with
the previous year, the sales revenue decreased by 28.0% in the same period. In the third quarter, the sales
revenue of the segment was 1.8 million euros, which is 7.3% less than during the same period in the year
before. The loss of the nine months of 2021 was 0.8 million euros, which is an improvement of 0.6 million
euros compared to the loss of the same period in 2020. The loss of the third quarter was 0.3 million euros,
which is 0.1 million euros better than loss of the same period of 2020. In September, the Group notified the
stock exchange of the strategic decision to close its footwear business. The Group intends to gradually close
all ABC KING and SHU stores within the next year. Two ABC KING stores (Kristiine Centre, Port Artur 2), two
SHU stores (Ülemiste Centre, Port Artur 2), and the outlet store in the Magistrali Centre were closed in the
second quarter, which also had an impact on the sales revenue for the reporting period.
Car trade
The sales revenue of the car trade segment was 116.2 million euros in the first nine months of 2021. The
sales revenue was 25.6% higher than the sales revenue in the same period the year before. The 38.2-million-
euro sales revenue of the third quarter was 10.2% higher than the sales revenue in the third quarter of 2020.
In the first nine months, a total of 4,887 new vehicles were sold, of which 1,581 were sold in the third quarter.
The net profit of the segment in the first nine months of 2021 was 5.5 million euros, exceeding the profit for
the same period of the year before by 4.4 million euros. The pre-tax profit of the segment for the first nine
months of 2021 was 5.8 million euros, exceeding the profit for the same period in 2020 by 4.0 million euros.
The pre-tax profit of the third quarter of 2021 was 2.4 million euros, which is 1.4 million euros more than the
profit of the same period of the year before.
The improved market environment in the third quarter supported the customers’ increasing interest in pur-
chasing vehicles. The availability of the cars has turned out to be the key component of the sales success, as
the deficiency of chips and other car components has been causing more or less severe delivery difficulties
for car manufacturers for quite a while. The competent planning of the stocks in the car segment of the Group
has enabled to continue to increase the sales figures. The volumes of the car maintenance services have been
growing increasingly thanks to the increase in the number of car brands represented by the Group’s car
Tallinna Kaubamaja Grupp AS
Consolidated Interim Report for the third quarter and first 9 months of 2021 (unaudited)
12
segment. The increased demand has allowed to improve the sales margin and thereby also the profitability of
the segment.
The Group is expecting to add several new important models to the selection in the near future, such as the
new Kia Sportage, an update of the Kia Ceed model, an updated Škoda Kodiaq, the brand new Škoda Fabia,
and Peugeot 308. Unfortunately, due to delivery issues, longer delivery times and longer waiting times in
fulfilling orders can be predicted.
Security segment
The sales revenue earned in the security segment outside the Group was 5.8 million euros in the first nine
months of 2021. The sales revenue of the nine months increased by 45.9% compared to the year before. The
sales revenue in the third quarter was 2.2 million euros, which is 42.3% more than in the same period last
year. The pre-tax profit of the security segment in the first nine months of 2021 was 0.1 million euros, re-
maining approximately at the same level compared to the previous year. The pre-tax profit of the segment in
the third quarter was 0.1 million euros, which is 140.6% higher than in the same period in 2020.
All business areas showed good growth numbers. Profitability has also improved as a result of the investments
and extensions in several areas of activity. The area of cash transport and fire safety services grew the fastest.
Important emphasis will be placed on technological solutions and digitalisation in the following quarters. The
labour market situation, which has a negative impact on both growth and margins, remains a major concern.
Real estate
The sales revenue earned in the real estate segment outside the Group was 3.8 million euros in the first nine
months of 2021. The sales revenue increased by 2.4% compared to the same period last year. The sales
revenue earned in the segment outside the Group was 1.4 million euros in the third quarter. During the refer-
ence period, sales revenue decreased by 2.9%. The pre-tax profit in the real estate segment outside the Group
was 8.0 million euros in the first nine months of 2021. Compared to the reference period, the profit increased
by 7.1%. The pre-tax profit earned in the segment was 3.1 million euros in the third quarter. The pre-tax profit
increased by 7.2% in the reference period.
The drop in the sales revenue of the segment in the third quarter reflects with a delay the impact of the one-
time lowering of the rent, which was granted to the tenants during the period of the restriction on visiting
shopping centres in spring. The restrictions have had a more significant impact on the rental premises in
central Tallinn. The Tartu Kaubamaja centre has recovered quickly from the restrictions, which were imple-
mented to prevent the spread of the virus. The same applies to the Viimsi Centre, which was affected most
by the restrictions imposed on leisure centres in the beginning of the year. The increase in the sales revenue
and profit of the segment in the nine months were supported by renting commercial premises to an external
party by the Latvian real estate company and by the sale of a registered immovable in Saare County.
Personnel
During the first nine months of 2021, the average number of employees at the Grupp was 4,909, growing by
9.6% in comparison with the same period in 2020, mainly due to the acquisition of the subsidiary ABC
Supermarkets AS in May 2020. Total labour force expenses (salary expenses and social tax expenses) in the
first nine months of 2021 were 62.8 million euros, which is 13.6% more than during the same period of 2020.
In the third quarter, labour force costs increased by 8.0% in comparison with the year before, while the
average number of employees increased by 3.1%. The average monthly salary costs per employee increased
by 3.7% in the first nine month of the year compared to the average salary of the first nine months of 2020;
in the third quarter, the increase was 4.7%.
Tallinna Kaubamaja Grupp AS
Consolidated Interim Report for the third quarter and first 9 months of 2021 (unaudited)
13
Approval of the chairman of the management board and signature to the report
The chairman of the management board confirms that the management report gives a true and fair overview
of the most important events during the reporting period and their effects on the accounting report; it includes
a description of the main risks and uncertainties during the remaining financial year and reflects transactions
with related parties.
_________________________
Raul Puusepp
Chairman of the Management Board
Tallinn, 12 October 2021
Tallinna Kaubamaja Grupp AS
Consolidated Interim Report for the third quarter and first 9 months of 2021 (unaudited)
14
CONDENSED CONSOLIDATED FINANCIAL STATEMENTS
MANAGEMENT BOARD’S CONFIRMATION TO THE CONDENSED CONSOLIDATED FINANCIAL STATEMENTS
The Chairman of the Management Board confirms the correctness and completeness of Tallinna Kaubamaja
Grupp AS condensed consolidated interim financial statements (unaudited) for the period of the third quarter
and first 9 months of 2021 as set out on pages 14 - 37.
The Chairman of the Management Board confirms that:
1. the accounting policies used in preparing the interim financial statements are in compliance with
International Financial Reporting Standard as adopted in the European Union;
2. the interim financial statements give a true and fair view of the financial position. the results of the
operations and the cash flows of the Parent and the Group;
3. Tallinna Kaubamaja Grupp AS and its subsidiaries are going concerns.
__________________________
Raul Puusepp
Chairman of the Management Board
Tallinn, 12 October 2021
Tallinna Kaubamaja Grupp AS
Consolidated Interim Report for the third quarter and first 9 months of 2021 (unaudited)
15
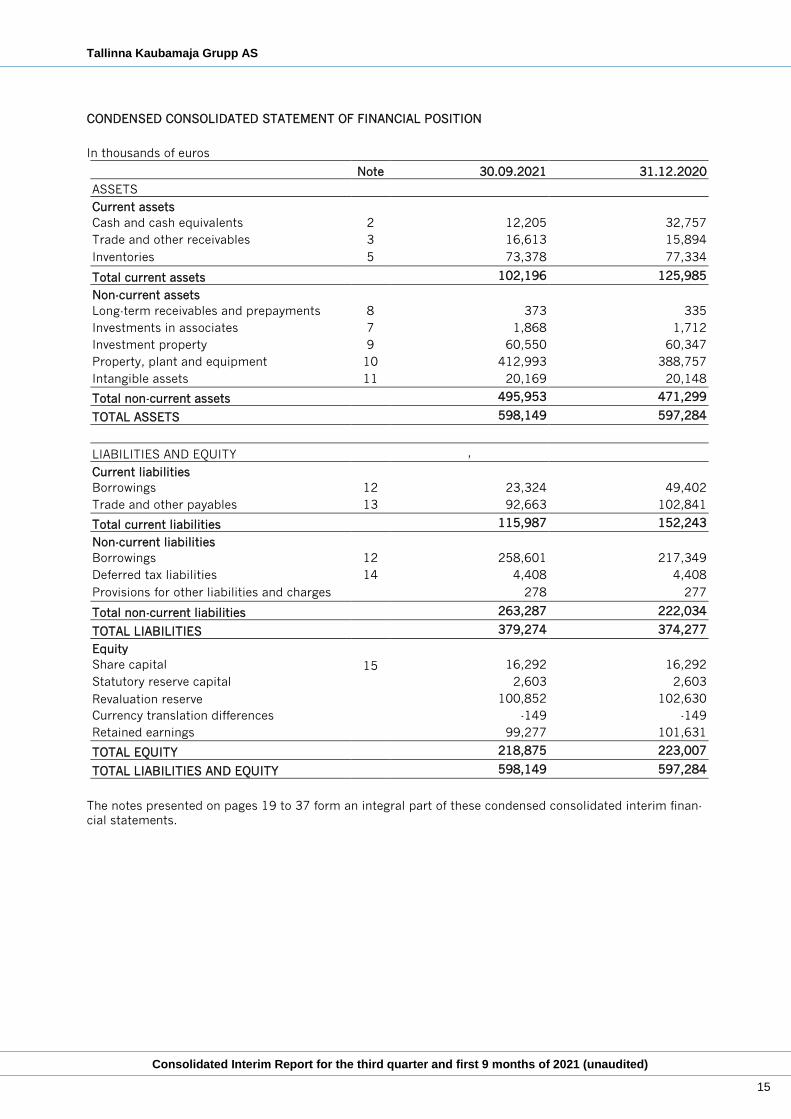
CONDENSED CONSOLIDATED STATEMENT OF FINANCIAL POSITION
In thousands of euros
Note 30.09.2021 31.12.2020
ASSETS
Current assets
Cash and cash equivalents 2 12,205 32,757
Trade and other receivables 3 16,613 15,894
Inventories 5 73,378 77,334
Total current assets 102,196 125,985
Non-current assets
Long-term receivables and prepayments 8 373 335
Investments in associates 7 1,868 1,712
Investment property 9 60,550 60,347
Property, plant and equipment 10 412,993 388,757
Intangible assets 11 20,169 20,148
Total non-current assets 495,953 471,299
TOTAL ASSETS 598,149 597,284
LIABILITIES AND EQUITY ,
Current liabilities
Borrowings 12 23,324 49,402
Trade and other payables 13 92,663 102,841
Total current liabilities 115,987 152,243
Non-current liabilities
Borrowings 12 258,601 217,349
Deferred tax liabilities 14 4,408 4,408
Provisions for other liabilities and charges 278 277
Total non-current liabilities 263,287 222,034
TOTAL LIABILITIES 379,274 374,277
Equity
Share capital 15 16,292 16,292
Statutory reserve capital 2,603 2,603
Revaluation reserve 100,852 102,630
Currency translation differences -149 -149
Retained earnings 99,277 101,631
TOTAL EQUITY 218,875 223,007
TOTAL LIABILITIES AND EQUITY 598,149 597,284
The notes presented on pages 19 to 37 form an integral part of these condensed consolidated interim finan-
cial statements.
Tallinna Kaubamaja Grupp AS
Consolidated Interim Report for the third quarter and first 9 months of 2021 (unaudited)
16
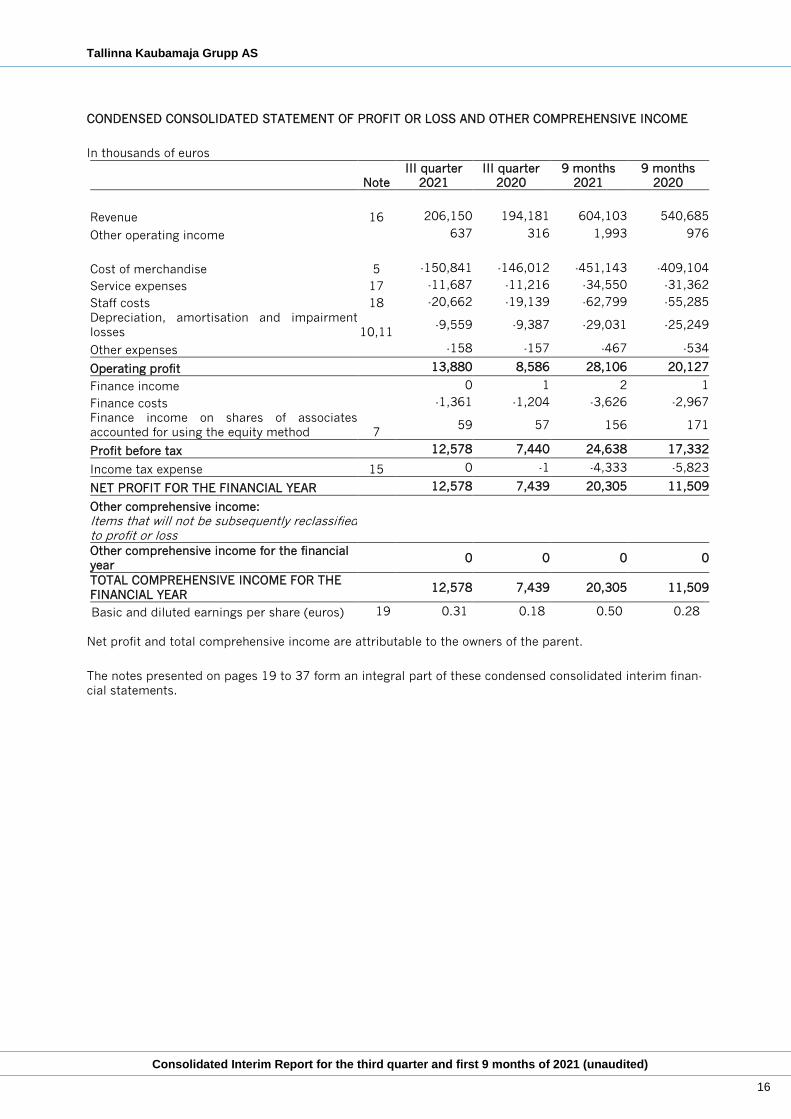
CONDENSED CONSOLIDATED STATEMENT OF PROFIT OR LOSS AND OTHER COMPREHENSIVE INCOME
In thousands of euros
Note
III quarter
2021
III quarter
2020
9 months
2021
9 months
2020
Revenue 16 206,150 194,181 604,103 540,685
Other operating income 637 316 1,993 976
Cost of merchandise 5 -150,841 -146,012 -451,143 -409,104
Service expenses 17 -11,687 -11,216 -34,550 -31,362
Staff costs 18 -20,662 -19,139 -62,799 -55,285
Depreciation, amortisation and impairment
losses 10,11 -9,559 -9,387 -29,031 -25,249
Other expenses -158 -157 -467 -534
Operating profit 13,880 8,586 28,106 20,127
Finance income 0 1 2 1
Finance costs -1,361 -1,204 -3,626 -2,967
Finance income on shares of associates
accounted for using the equity method 7 59 57 156 171
Profit before tax 12,578 7,440 24,638 17,332
Income tax expense 15 0 -1 -4,333 -5,823
NET PROFIT FOR THE FINANCIAL YEAR 12,578 7,439 20,305 11,509
Other comprehensive income:
Items that will not be subsequently reclassified to profit or loss
Other comprehensive income for the financial
year 0 0 0 0
TOTAL COMPREHENSIVE INCOME FOR THE
FINANCIAL YEAR 12,578 7,439 20,305 11,509
Basic and diluted earnings per share (euros) 19 0.31 0.18 0.50 0.28
Net profit and total comprehensive income are attributable to the owners of the parent.
The notes presented on pages 19 to 37 form an integral part of these condensed consolidated interim finan-
cial statements.
Tallinna Kaubamaja Grupp AS
Consolidated Interim Report for the third quarter and first 9 months of 2021 (unaudited)
17
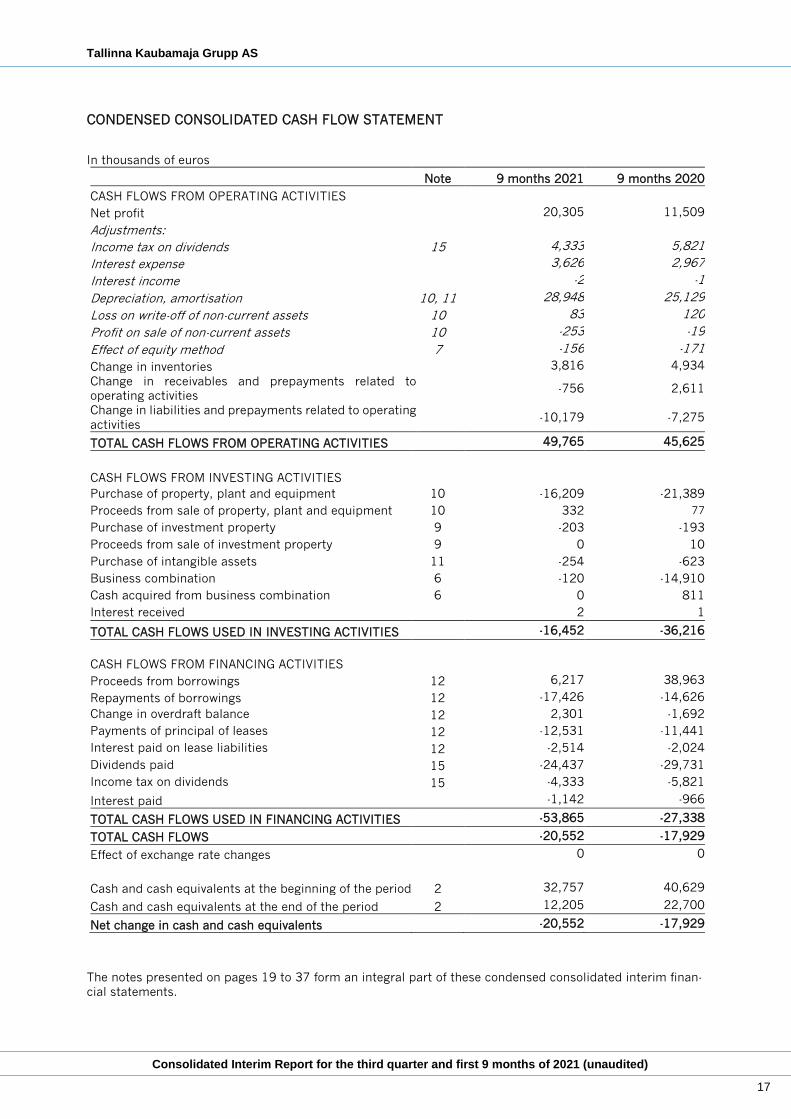
CONDENSED CONSOLIDATED CASH FLOW STATEMENT
In thousands of euros
Note 9 months 2021 9 months 2020
CASH FLOWS FROM OPERATING ACTIVITIES
Net profit 20,305 11,509
Adjustments:
Income tax on dividends 15 4,333 5,821
Interest expense 3,626 2,967
Interest income -2 -1
Depreciation, amortisation 10, 11 28,948 25,129
Loss on write-off of non-current assets 10 83 120
Profit on sale of non-current assets 10 -253 -19
Effect of equity method 7 -156 -171
Change in inventories 3,816 4,934
Change in receivables and prepayments related to
operating activities -756 2,611
Change in liabilities and prepayments related to operating
activities -10,179 -7,275
TOTAL CASH FLOWS FROM OPERATING ACTIVITIES 49,765 45,625
CASH FLOWS FROM INVESTING ACTIVITIES
Purchase of property, plant and equipment 10 -16,209 -21,389
Proceeds from sale of property, plant and equipment 10 332 77
Purchase of investment property 9 -203 -193
Proceeds from sale of investment property 9 0 10
Purchase of intangible assets 11 -254 -623
Business combination 6 -120 -14,910
Cash acquired from business combination 6 0 811
Interest received 2 1
TOTAL CASH FLOWS USED IN INVESTING ACTIVITIES -16,452 -36,216
CASH FLOWS FROM FINANCING ACTIVITIES
Proceeds from borrowings 12 6,217 38,963
Repayments of borrowings 12 -17,426 -14,626
Change in overdraft balance 12 2,301 -1,692
Payments of principal of leases 12 -12,531 -11,441
Interest paid on lease liabilities 12 -2,514 -2,024
Dividends paid 15 -24,437 -29,731
Income tax on dividends 15 -4,333 -5,821
Interest paid -1,142 -966
TOTAL CASH FLOWS USED IN FINANCING ACTIVITIES -53,865 -27,338
TOTAL CASH FLOWS -20,552 -17,929
Effect of exchange rate changes 0 0
Cash and cash equivalents at the beginning of the period 2 32,757 40,629
Cash and cash equivalents at the end of the period 2 12,205 22,700
Net change in cash and cash equivalents -20,552 -17,929
The notes presented on pages 19 to 37 form an integral part of these condensed consolidated interim finan-
cial statements.
Tallinna Kaubamaja Grupp AS
Consolidated Interim Report for the third quarter and first 9 months of 2021 (unaudited)
18
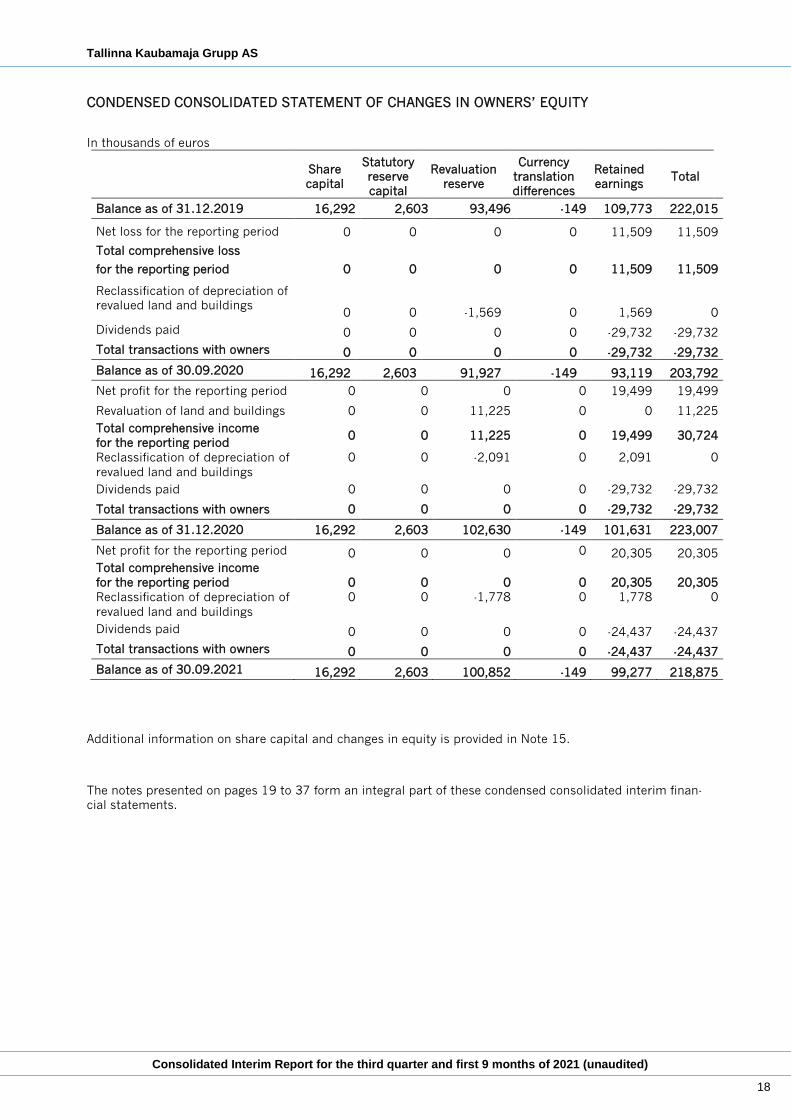
CONDENSED CONSOLIDATED STATEMENT OF CHANGES IN OWNERS’ EQUITY
In thousands of euros
Share
capital
Statutory
reserve
capital
Revaluation
reserve
Currency
translation
differences
Retained
earnings Total
Balance as of 31.12.2019 16,292 2,603 93,496 -149 109,773 222,015
Net loss for the reporting period 0 0 0 0 11,509 11,509
Total comprehensive loss
for the reporting period 0 0 0 0 11,509 11,509
Reclassification of depreciation of
revalued land and buildings 0 0
-1,569 0
1,569 0
Dividends paid 0 0 0 0 -29,732 -29,732
Total transactions with owners 0 0 0 0 -29,732 -29,732
Balance as of 30.09.2020 16,292 2,603 91,927 -149 93,119 203,792
Net profit for the reporting period 0 0 0 0 19,499 19,499
Revaluation of land and buildings 0 0 11,225 0 0 11,225
Total comprehensive income
for the reporting period 0 0 11,225 0 19,499 30,724
Reclassification of depreciation of
revalued land and buildings
0 0 -2,091 0 2,091 0
Dividends paid 0 0 0 0 -29,732 -29,732
Total transactions with owners 0 0 0 0 -29,732 -29,732
Balance as of 31.12.2020 16,292 2,603 102,630 -149 101,631 223,007
Net profit for the reporting period 0 0 0 0 20,305 20,305
Total comprehensive income
for the reporting period 0 0 0 0 20,305 20,305
Reclassification of depreciation of
revalued land and buildings
0 0 -1,778 0 1,778 0
Dividends paid 0 0 0 0 -24,437 -24,437
Total transactions with owners 0 0 0 0 -24,437 -24,437
Balance as of 30.09.2021 16,292 2,603 100,852 -149 99,277 218,875
Additional information on share capital and changes in equity is provided in Note 15.
The notes presented on pages 19 to 37 form an integral part of these condensed consolidated interim finan-
cial statements.
Tallinna Kaubamaja Grupp AS
Consolidated Interim Report for the third quarter and first 9 months of 2021 (unaudited)
19
NOTES TO THE CONDENSED CONSOLIDATED INTERIM ACCOUNTS
Note 1. Accounting Principles Followed upon Preparation of the Condensed Consolidated Interim Accounts
General Information
Tallinna Kaubamaja Grupp AS (‘the Company’) and its subsidiaries (jointly ‘Tallinna Kaubamaja Group’ or
‘the Group’) are companies engaged in rendering services related to retail sale and rental activities in Esto-
nia, Latvia and Lithuania. Tallinna Kaubamaja Grupp AS is a company registered on 18 October 1994 in the
Republic of Estonia with the legal address of Kaubamaja 1, Tallinn. The shares of Tallinna Kaubamaja Grupp
AS are listed on the NASDAQ Tallinn Stock Exchange. The majority shareholder of Tallinna Kaubamaja Grupp
AS is OÜ NG Investeeringud (Note 28), the majority owner of which is NG Kapital OÜ. NG Kapital OÜ is an
entity with ultimate control over Tallinna Kaubamaja Grupp AS.
Basis for Preparation
The Condensed Consolidated Interim Accounts of Tallinna Kaubamaja Group has been prepared in accordance
with the International Financial Reporting Standard IAS 34 Interim Financial Reporting as adopted by the Eu-
ropean Union. The condensed consolidated interim financial statements do not contain all the information that
has to be presented in the annual financial statements and they should be read in conjunction with the Group’s
consolidated financial statements as at and for the year ended 31 December 2020. However, selected explan-
atory notes are included to explain events and transactions that are significant to an understanding of the
changes in the Group’s financial position and performance since the last annual financial statements.
The presentation currency of Tallinna Kaubamaja Group is euro. Items included in the financial statements of
each of the Group’s entities are measured using the currency of the primary economic environment in which
the entity operates (‘the functional currency’). The functional currency of each of the Group’s entities is euro.
All amounts disclosed in the financial statements have been rounded to the nearest thousand unless referred
to otherwise.
The Manager is of the opinion that the Condensed Consolidated Interim Report of Tallinna Kaubamaja Group
for the third quarter and first 9 months of 2021 gives a true and fair view of the Company’s performance in
accordance with the going-concern concept.
This Condensed Consolidated Interim Report has not been audited or otherwise reviewed by auditors.
Changes in presentation
The Group has defined in segment reporting the business segments based on the reports used regularly by the
supervisory board to make strategic decisions. In 2021, the supervisory board started to monitor, as separate
segment, security segment. Footwear segment is included in department store segment where previously was
presented also security services. Previous periods comparatives have been restated accordingly.
Tallinna Kaubamaja Grupp AS
Consolidated Interim Report for the third quarter and first 9 months of 2021 (unaudited)
20
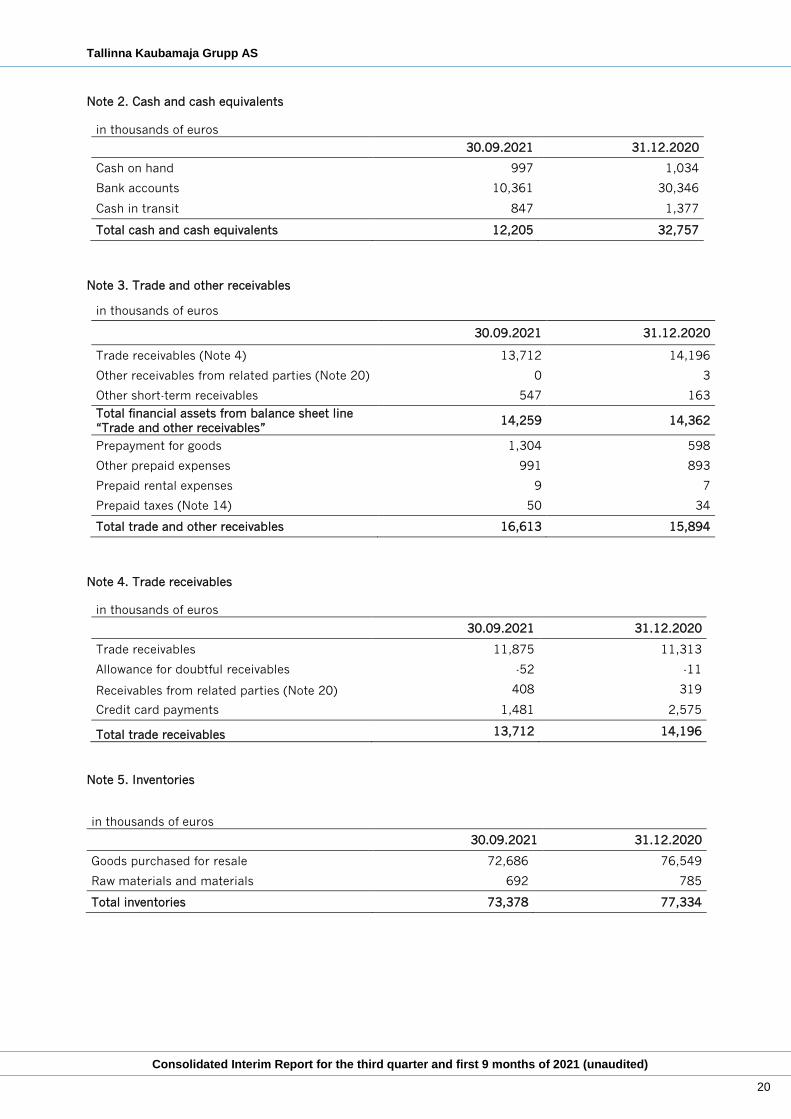
Note 2. Cash and cash equivalents
in thousands of euros
30.09.2021 31.12.2020
Cash on hand 997 1,034
Bank accounts 10,361 30,346
Cash in transit 847 1,377
Total cash and cash equivalents 12,205 32,757
Note 3. Trade and other receivables
in thousands of euros
30.09.2021 31.12.2020
Trade receivables (Note 4) 13,712 14,196
Other receivables from related parties (Note 20) 0 3
Other short-term receivables 547 163
Total financial assets from balance sheet line
“Trade and other receivables” 14,259 14,362
Prepayment for goods 1,304 598
Other prepaid expenses 991 893
Prepaid rental expenses 9 7
Prepaid taxes (Note 14) 50 34
Total trade and other receivables 16,613 15,894
Note 4. Trade receivables
in thousands of euros
30.09.2021 31.12.2020
Trade receivables 11,875 11,313
Allowance for doubtful receivables -52 -11
Receivables from related parties (Note 20) 408 319
Credit card payments 1,481 2,575
Total trade receivables 13,712 14,196
Note 5. Inventories
in thousands of euros
30.09.2021 31.12.2020
Goods purchased for resale 72,686 76,549
Raw materials and materials 692 785
Total inventories 73,378 77,334
Tallinna Kaubamaja Grupp AS
Consolidated Interim Report for the third quarter and first 9 months of 2021 (unaudited)
21
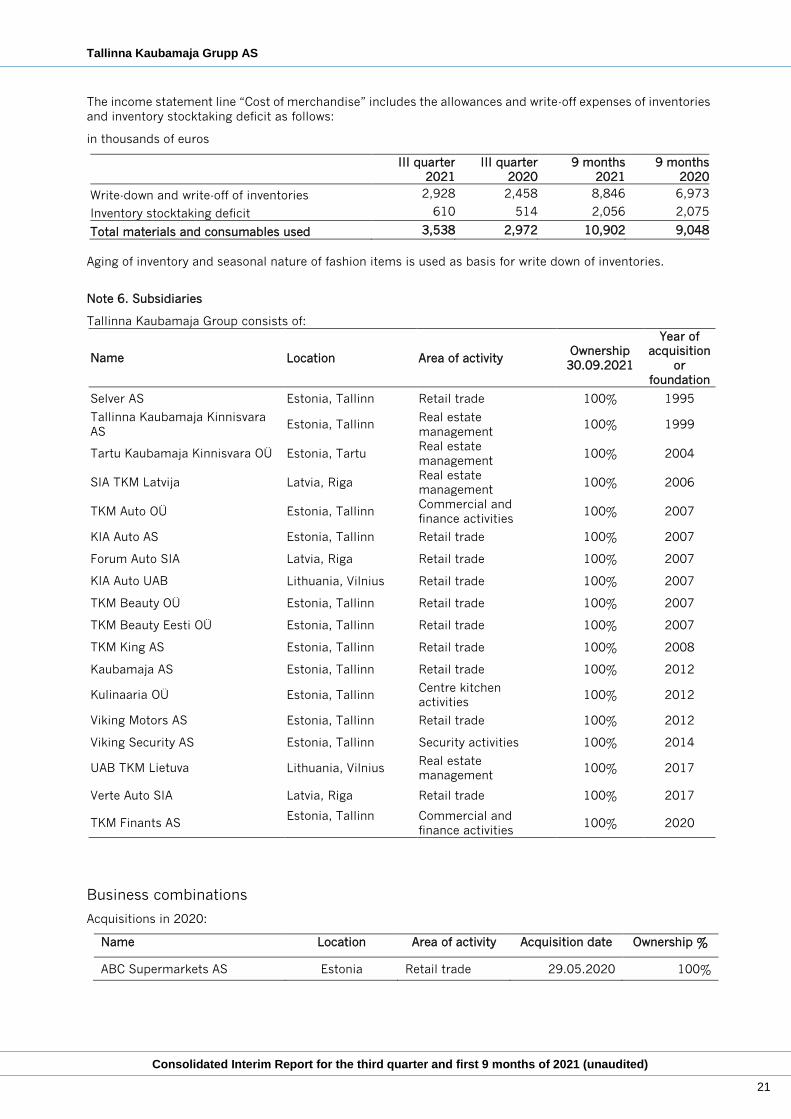
The income statement line “Cost of merchandise” includes the allowances and write-off expenses of inventories
and inventory stocktaking deficit as follows:
in thousands of euros
III quarter
2021
III quarter
2020
9 months
2021
9 months
2020
Write-down and write-off of inventories 2,928 2,458 8,846 6,973
Inventory stocktaking deficit 610 514 2,056 2,075
Total materials and consumables used 3,538 2,972 10,902 9,048
Aging of inventory and seasonal nature of fashion items is used as basis for write down of inventories.
Note 6. Subsidiaries
Tallinna Kaubamaja Group consists of:
Name Location Area of activity Ownership
30.09.2021
Year of
acquisition
or
foundation
Selver AS Estonia, Tallinn Retail trade 100% 1995
Tallinna Kaubamaja Kinnisvara
AS Estonia, Tallinn
Real estate
management 100% 1999
Tartu Kaubamaja Kinnisvara OÜ Estonia, Tartu Real estate
management 100% 2004
SIA TKM Latvija Latvia, Riga Real estate
management 100% 2006
TKM Auto OÜ Estonia, Tallinn Commercial and
finance activities 100% 2007
KIA Auto AS Estonia, Tallinn Retail trade 100% 2007
Forum Auto SIA Latvia, Riga Retail trade 100% 2007
KIA Auto UAB Lithuania, Vilnius Retail trade 100% 2007
TKM Beauty OÜ Estonia, Tallinn Retail trade 100% 2007
TKM Beauty Eesti OÜ Estonia, Tallinn Retail trade 100% 2007
TKM King AS Estonia, Tallinn Retail trade 100% 2008
Kaubamaja AS Estonia, Tallinn Retail trade 100% 2012
Kulinaaria OÜ Estonia, Tallinn Centre kitchen
activities 100% 2012
Viking Motors AS Estonia, Tallinn Retail trade 100% 2012
Viking Security AS Estonia, Tallinn Security activities 100% 2014
UAB TKM Lietuva Lithuania, Vilnius Real estate
management 100% 2017
Verte Auto SIA Latvia, Riga Retail trade 100% 2017
TKM Finants AS Estonia, Tallinn Commercial and
finance activities 100% 2020
Business combinations
Acquisitions in 2020:
Name Location Area of activity Acquisition date Ownership %
ABC Supermarkets AS Estonia Retail trade 29.05.2020 100%
Tallinna Kaubamaja Grupp AS
Consolidated Interim Report for the third quarter and first 9 months of 2021 (unaudited)
22
On May 29, 2020, Selver AS, a subsidiary of Tallinna Kaubamaja Grupp AS, acquired a 100% stake in ABC
Supermarkets AS. AS Selver is a supermarket and hypermarket chain operating in Estonia, which trades mainly
in food and basic consumer goods. The chain of Selver supermarkets was established in 1995. The transaction
added 16 Comarket shops in Harju, Pärnu and Tartu County, 2 Delice shops in Viimsi and the city of Pärnu
and a Solaris shop in Tallinn to the Selver chain. Acquiring the shares of ABC Supermarkets AS give us unique
opportunity to meet our clients´ expectations by offering more convenient and quicker purchases in new
locations where we are not yet present.
The merger decisions of Selver AS (the acquiring company) and ABC Supermarkets AS (the company being
acquired) were adopted on 21 August 2020 and an entry of the merger in the commercial register was made
on 1 October 2020. Selver AS and ABC Supermarkets AS balance sheet merger was on 01.07.2020.
The table below provides an overview of acquired identifiable assets and liabilities of ABC Supermarkets AS
at the time of acquisition.
in thousands of euros Fair value
Cash and cash equivalents 811
Trade receivables 6,962
Inventories 2,839
Property, plant and equipment 3,697
Goodwill (Note 11) 13,609
Trademark (Note 11) 1,911
Liabilities -6,978
Total identifiable net assets 22,851
Consideration of ownership interest 22,851
Paid for ownership interest in cash 14,910
Cash and cash equivalents in the acquired entity -811
Net outflow of cash – investing activities -14,099
Payable in future for the ownership interest in
cash 1,641
Goodwill at value of 13,609 thousand euros and trademark 1,911 thousand euros was acquired (Note 11).
The goodwill is attributable to the reduction of costs through the centralized purchasing function and the
introduction of a unified customer base.
Acquisition-related costs are included in other operating expenses in the statement of profit or loss and other
comprehensive income and in operating cash flows in the statement of cash flows.
With aim to provide our customers more convenient shopping experience, in 2020, it was decided to develop
financial services that support retail business. In 2020, Tallinna Kaubamaja Grupp AS established TKM
Finants AS, a subsidiary with a share capital of 50,000 euros belonging completely to the Group. According
to the developed plan, after the Financial Supervision Authority has issued the relevant authorisation, TKM
Finants AS will commence with granting credit to private persons, the postponement of a due date for a
charge, including the entry into credit agreements and performance of acts needed for this purpose in its own
name and account.
In order to separate the operations of OÜ TKM Beauty Eesti, which is involved in the retail trade of cosmetics,
from the cosmetics wholesale function, a division was undertaken. In the course of the division of OÜ TKM
Beauty (company being divided), OÜ TKM Beauty Holding, a company with a share capital of 2,500 euros and
100% ownership by Tallinna Kaubamaja Grupp AS, was established. OÜ TKM Beauty transferred the share of
OÜ TKM Beauty Eesti to OÜ TKM Beauty Holding (recipient company). In November 2020 merge of OÜ TKM
Beauty Holding and OÜ TKM Beauty Eesti took place, so that OÜ TKM Beauty Eesti directly become a 100%
subsidiary of Tallinna Kaubamaja Grupp AS.
On 30 December 2020, Viking Security AS, a subsidiary of Tallinna Kaubamaja Grupp AS, entered into an
agreement to acquire from P. DUSSMANN EESTI OÜ its security services business in Estonia together with
the assets and agreements belonging to it. As of 1 March 2021, as a result of the acquisition of the business,
the assets and agreements related to the provision of security services belonging to P.DUSSMANN EESTI OÜ
we transferred to Viking Security AS in their entirety and unchanged.
Tallinna Kaubamaja Grupp AS
Consolidated Interim Report for the third quarter and first 9 months of 2021 (unaudited)
23
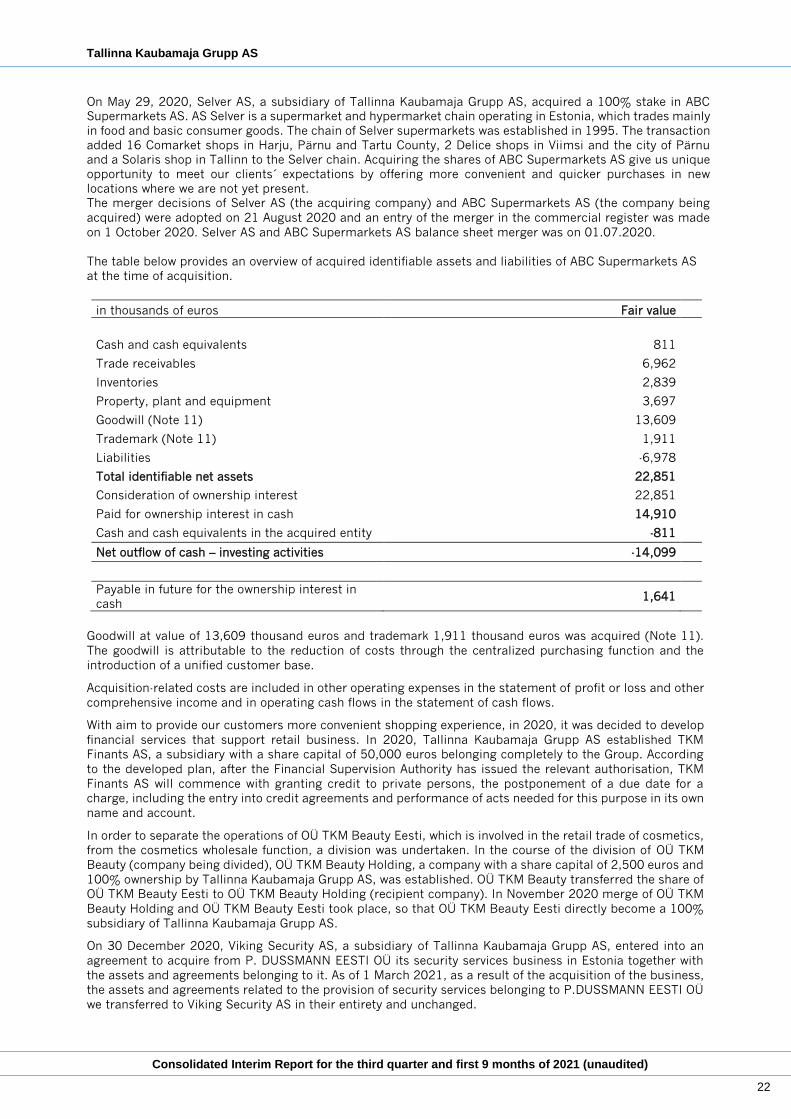
The table below provides an overview of acquired identifiable assets and liabilities of P. Dussmann Eesti OÜ
security services business at the time of acquisition.
in thousands of euros Fair value
Fixed assets 0
Beneficial agreements (Note 11) 120
Liabilities 0
Total identifiable net assets 120
Consideration of ownership of assets 120
Cash and cash equivalents in the acquired
business 120
Net outflow of cash – investing activities -120
Beneficial agreements at value of 120 thousand euros was acquired (Note 11).
Note 7. Investments in associates
Tallinna Kaubamaja Grupp AS has ownership of 50% (2020: 50%) interest in the entity AS Rävala Parkla which
provides the services of a parking house in Tallinn. The investment has been classified as associated company
because the other owner has the power to appoint the members of supervisory board.
in thousands of euros
30.09.2021 31.12.2020
Investment in the associate at the beginning of
the year 1,712 1,721
Profit for the reporting period under equity
method 156 191
Dividends received 0 -200
Investment in the associate at the end of the
accounting period 1,868 1,712
Financial information about the associate Rävala Parkla AS (reflecting 100% of the associate):
30.09.2021 31.12.2020
Current assets 329 111
Non-current assets 3,418 3,446
Current liabilities 10 133
Owner’s equity 3,737 3,424
III quarter
2021
III quarter
2020
9 months
2021
9 months
2020
Revenue 180 135 428 399
Net profit 118 119 313 347
Note 8. Long-term trade and other receivables
in thousands of euros
30.09.2021 31.12.2020
Prepaid rental expenses 233 269
Deferred tax asset 31 31
Other receivables 109 35
Total long-term trade and other receivables 373 335
Tallinna Kaubamaja Grupp AS
Consolidated Interim Report for the third quarter and first 9 months of 2021 (unaudited)
24
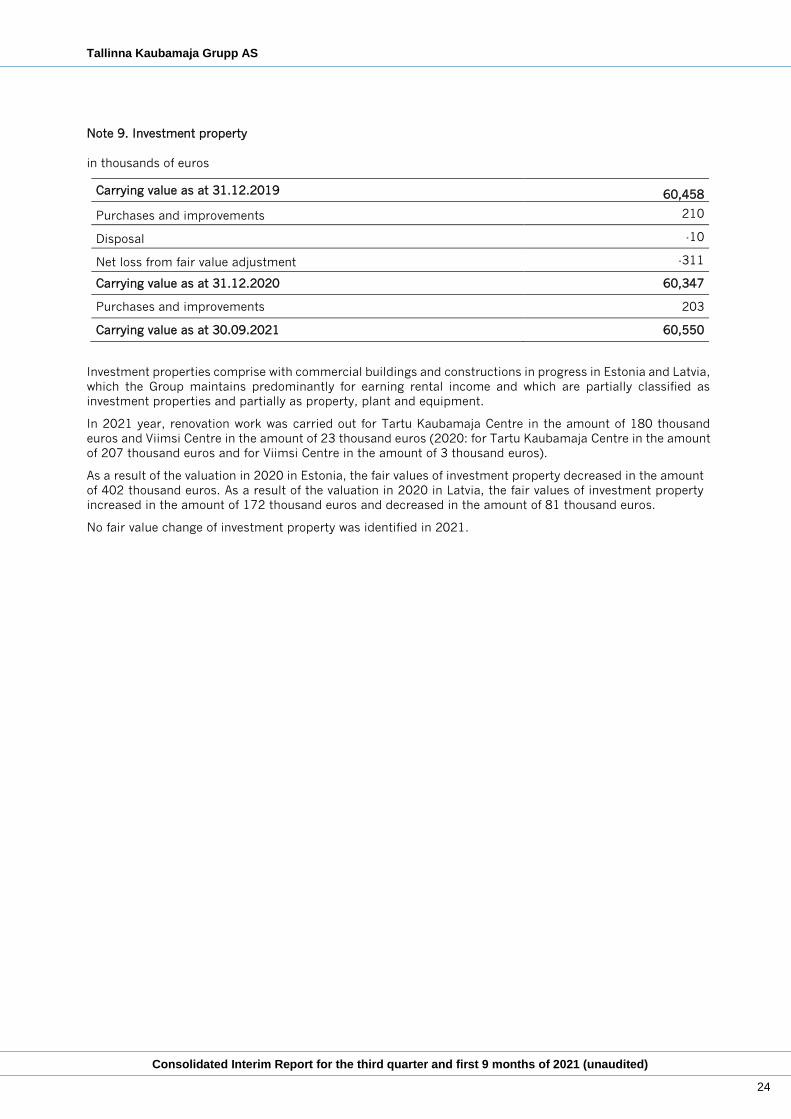
Note 9. Investment property
in thousands of euros
Carrying value as at 31.12.2019 60,458
Purchases and improvements 210
Disposal -10
Net loss from fair value adjustment -311
Carrying value as at 31.12.2020 60,347
Purchases and improvements 203
Carrying value as at 30.09.2021 60,550
Investment properties comprise with commercial buildings and constructions in progress in Estonia and Latvia,
which the Group maintains predominantly for earning rental income and which are partially classified as
investment properties and partially as property, plant and equipment.
In 2021 year, renovation work was carried out for Tartu Kaubamaja Centre in the amount of 180 thousand
euros and Viimsi Centre in the amount of 23 thousand euros (2020: for Tartu Kaubamaja Centre in the amount
of 207 thousand euros and for Viimsi Centre in the amount of 3 thousand euros).
As a result of the valuation in 2020 in Estonia, the fair values of investment property decreased in the amount
of 402 thousand euros. As a result of the valuation in 2020 in Latvia, the fair values of investment property
increased in the amount of 172 thousand euros and decreased in the amount of 81 thousand euros.
No fair value change of investment property was identified in 2021.
Tallinna Kaubamaja Grupp AS
Consolidated Interim Report for the third quarter and first 9 months of 2021 (unaudited)
25
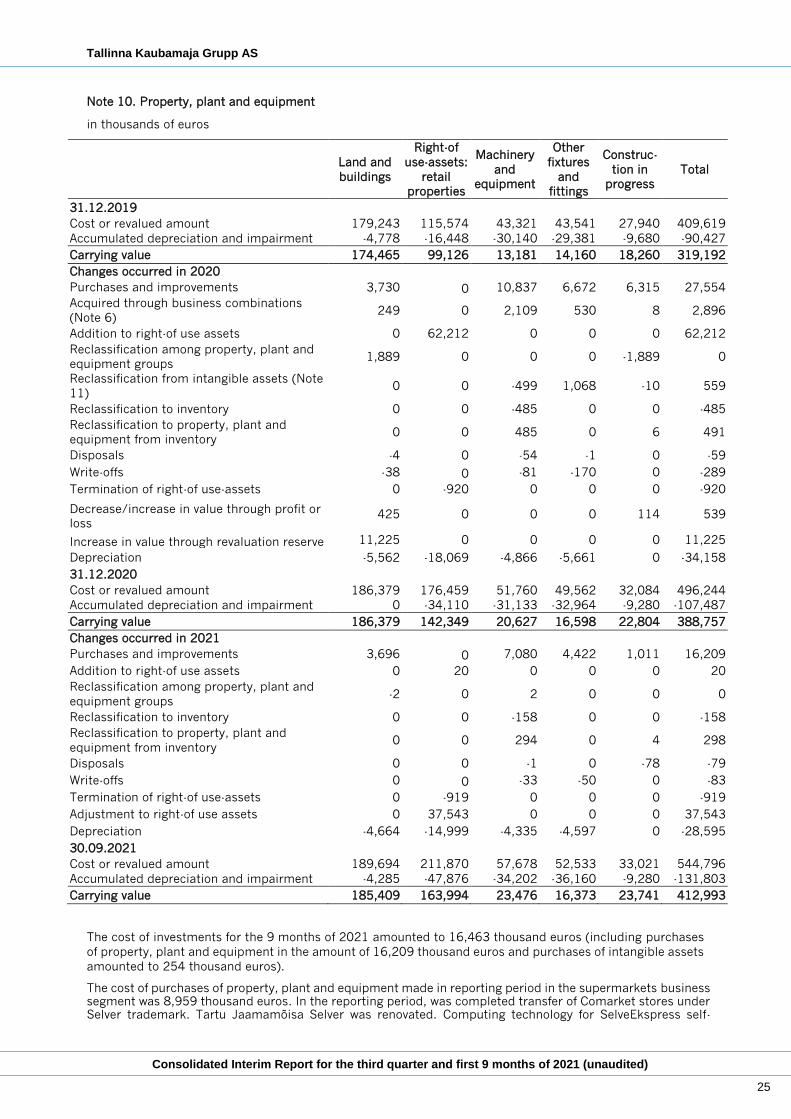
Note 10. Property, plant and equipment
in thousands of euros
Land and
buildings
Right-of
use-assets:
retail
properties
Machinery
and
equipment
Other
fixtures
and
fittings
Construc-
tion in
progress
Total
31.12.2019
Cost or revalued amount 179,243 115,574 43,321 43,541 27,940 409,619
Accumulated depreciation and impairment -4,778 -16,448 -30,140 -29,381 -9,680 -90,427
Carrying value 174,465 99,126 13,181 14,160 18,260 319,192
Changes occurred in 2020
Purchases and improvements 3,730 0 10,837 6,672 6,315 27,554
Acquired through business combinations
(Note 6) 249 0 2,109 530 8 2,896
Addition to right-of use assets 0 62,212 0 0 0 62,212
Reclassification among property, plant and
equipment groups 1,889 0 0 0 -1,889 0
Reclassification from intangible assets (Note
11) 0 0 -499 1,068 -10 559
Reclassification to inventory 0 0 -485 0 0 -485
Reclassification to property, plant and
equipment from inventory 0 0 485 0 6 491
Disposals -4 0 -54 -1 0 -59
Write-offs -38 0 -81 -170 0 -289
Termination of right-of use-assets 0 -920 0 0 0 -920
Decrease/increase in value through profit or
loss 425 0 0 0 114 539
Increase in value through revaluation reserve 11,225 0 0 0 0 11,225
Depreciation -5,562 -18,069 -4,866 -5,661 0 -34,158
31.12.2020
Cost or revalued amount 186,379 176,459 51,760 49,562 32,084 496,244
Accumulated depreciation and impairment 0 -34,110 -31,133 -32,964 -9,280 -107,487
Carrying value 186,379 142,349 20,627 16,598 22,804 388,757
Changes occurred in 2021
Purchases and improvements 3,696 0 7,080 4,422 1,011 16,209
Addition to right-of use assets 0 20 0 0 0 20
Reclassification among property, plant and
equipment groups -2 0 2 0 0 0
Reclassification to inventory 0 0 -158 0 0 -158
Reclassification to property, plant and
equipment from inventory 0 0 294 0 4 298
Disposals 0 0 -1 0 -78 -79
Write-offs 0 0 -33 -50 0 -83
Termination of right-of use-assets 0 -919 0 0 0 -919
Adjustment to right-of use assets 0 37,543 0 0 0 37,543
Depreciation -4,664 -14,999 -4,335 -4,597 0 -28,595
30.09.2021
Cost or revalued amount 189,694 211,870 57,678 52,533 33,021 544,796
Accumulated depreciation and impairment -4,285 -47,876 -34,202 -36,160 -9,280 -131,803
Carrying value 185,409 163,994 23,476 16,373 23,741 412,993
The cost of investments for the 9 months of 2021 amounted to 16,463 thousand euros (including purchases
of property, plant and equipment in the amount of 16,209 thousand euros and purchases of intangible assets
amounted to 254 thousand euros).
The cost of purchases of property, plant and equipment made in reporting period in the supermarkets business segment was 8,959 thousand euros. In the reporting period, was completed transfer of Comarket stores under Selver trademark. Tartu Jaamamõisa Selver was renovated. Computing technology for SelveEkspress self-
Tallinna Kaubamaja Grupp AS
Consolidated Interim Report for the third quarter and first 9 months of 2021 (unaudited)
26
service cashers were purchased. New project of transition to digital price tags in Selver stores continued, also were renewed store fittings. New investments for Selver e-store were made in order to expand service availability in home delivery. Selver AS subsidiary’s Kulinaaria OÜ opened new production building.
The cost of purchases of property, plant and equipment in the business segment of department stores amounted to 5,285 thousand euros. In the reporting period, Kaubamaja opened renewed Tallinna Kaubamaja Beauty Department and Food Department.
The cost of purchases of property, plant and equipment in the reporting period was 176 thousand euros in
the car trade business segment.
The cost of purchases of property, plant and equipment in the reporting period was 93 thousand euros in the
security business segment.
The cost of purchases of property, plant and equipment in the real estate business segment amounted to
1,696 thousand euros.
The companies in the consolidated Tallinna Kaubamaja Group did not have any binding obligations for the purchase of tangible assets.
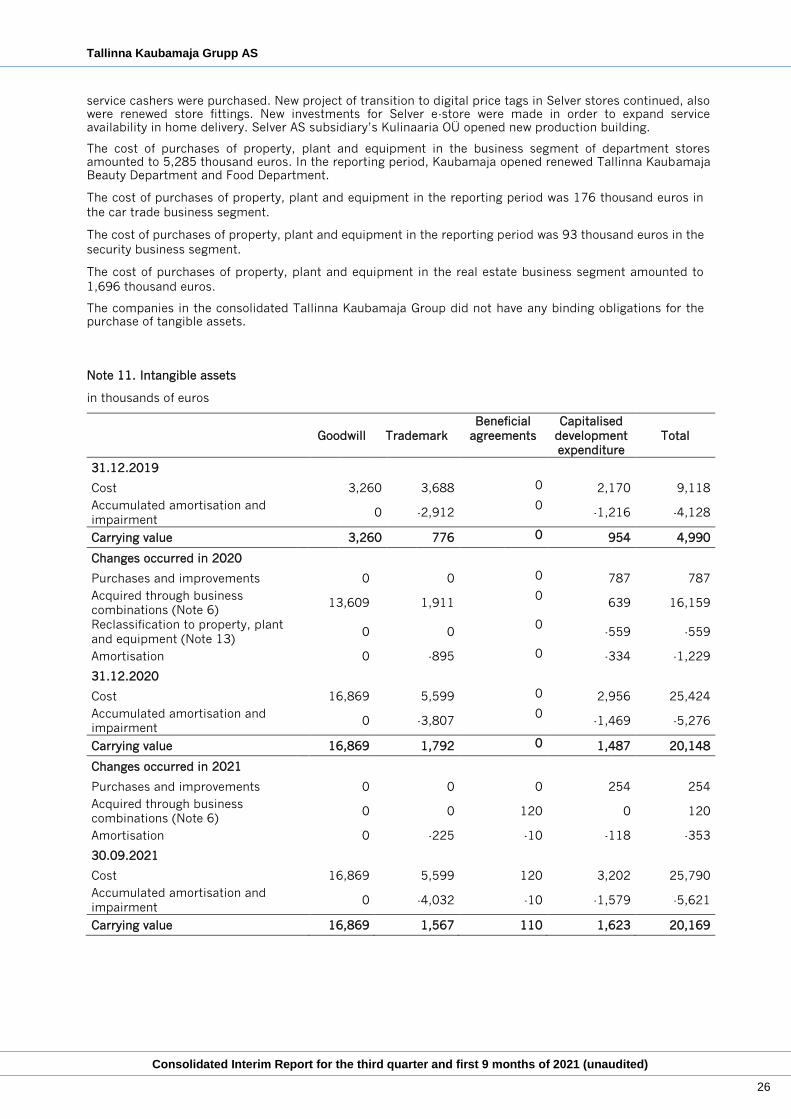
Note 11. Intangible assets
in thousands of euros
Goodwill Trademark
Beneficial
agreements
Capitalised
development
expenditure
Total
31.12.2019
Cost 3,260 3,688 0 2,170 9,118
Accumulated amortisation and
impairment 0 -2,912
0 -1,216 -4,128
Carrying value 3,260 776 0 954 4,990
Changes occurred in 2020
Purchases and improvements 0 0 0 787 787
Acquired through business
combinations (Note 6) 13,609 1,911
0 639 16,159
Reclassification to property, plant
and equipment (Note 13) 0 0
0 -559 -559
Amortisation 0 -895 0 -334 -1,229
31.12.2020
Cost 16,869 5,599 0 2,956 25,424
Accumulated amortisation and
impairment 0 -3,807
0 -1,469 -5,276
Carrying value 16,869 1,792 0 1,487 20,148
Changes occurred in 2021
Purchases and improvements 0 0 0 254 254
Acquired through business
combinations (Note 6) 0 0 120 0 120
Amortisation 0 -225 -10 -118 -353
30.09.2021
Cost 16,869 5,599 120 3,202 25,790
Accumulated amortisation and
impairment 0 -4,032 -10 -1,579 -5,621
Carrying value 16,869 1,567 110 1,623 20,169
Tallinna Kaubamaja Grupp AS
Consolidated Interim Report for the third quarter and first 9 months of 2021 (unaudited)
27
In the reporting period, the Group capitalised costs of a web page update, loyalty card web page update, loyalty
card - Monthly Card and e-shop as development expenditure in the amount of 254 thousand euros (2020: 787
thousand euros).
As a trademark, the Group has recognised the image of ABC King at a cost value of 3,508 thousand euros; the
image contains a combination of the name, symbol and design together with recognition and preference by
consumers. Trademark has been fully amortised in 2020, but its use will continue.
Trademark at value of 180 thousand euros was acquired in 2014 through purchase of Viking Security AS
shares. Trademark will be amortised during 7 years.
Trademark at value of 1,911 thousand euros was acquired in 2020 through purchase of ABC Supermarkets AS
shares. Trademark will be amortised during 7 years.
In 2021, Viking Security AS acquired from P. Dussmann Eesti OÜ its security services business in Estonia
together with the assets and agreements belonging to it. Beneficial agreements at value of 120 thousand euros
was acquired together with security services business. Beneficial agreements will be amortised during 7 years.
Goodwill is allocated to cash generating units of the Group by the following segments:
in thousands of euros 30.09.2021 31.12.2020
Supermarkets 13,609 13,609
Car trade 3,156 3,156
Department store 104 104
Total 16,869 16,869
The recoverable amount (based on value in use) was determined on the basis of future cash flows for the next
five years. In all units, it was evident that the present value of cash flows covers the value of goodwill and
trademark as well as beneficial lease agreements and other assets related to the unit.
Note 12. Borrowings
in thousands of euros
30.09.2021 31.12.2020
Short-term borrowings
Overdraft 14,950 12,650
Bank loans 2,350 17,101
Lease liabilities 4,263 17,892
Other borrowings 1,761 1,759
Total short-term borrowings 23,324 49,402
in thousands of euros
30.09.2021 31.12.2020
Long-term borrowings
Bank loans 86,150 86,150
Lease liabilities 166,097 128,386
Other borrowings 6,354 2,813
Total long-term borrowings 258,601 217,349
Total borrowings 281,925 266,751
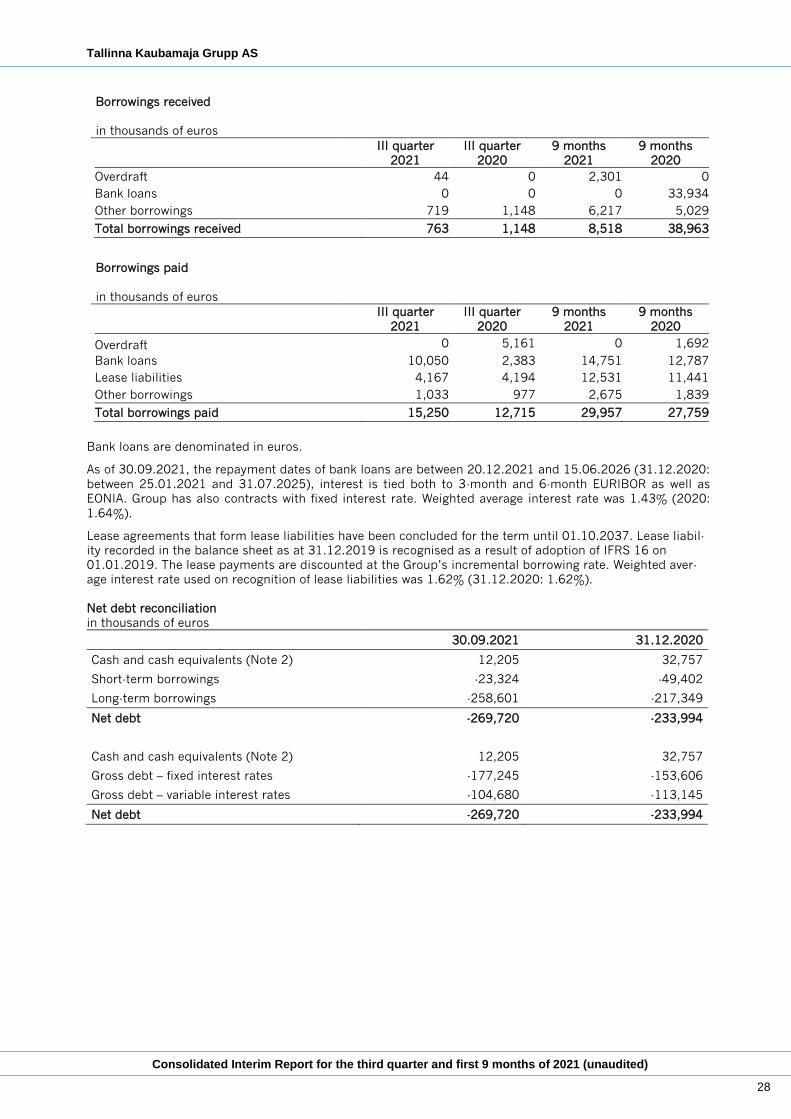
Tallinna Kaubamaja Grupp AS
Consolidated Interim Report for the third quarter and first 9 months of 2021 (unaudited)
28
Borrowings received
in thousands of euros
III quarter
2021
III quarter
2020
9 months
2021
9 months
2020
Overdraft 44 0 2,301 0
Bank loans 0 0 0 33,934
Other borrowings 719 1,148 6,217 5,029
Total borrowings received 763 1,148 8,518 38,963
Borrowings paid
in thousands of euros
III quarter
2021
III quarter
2020
9 months
2021
9 months
2020
Overdraft 0 5,161 0 1,692
Bank loans 10,050 2,383 14,751 12,787
Lease liabilities 4,167 4,194 12,531 11,441
Other borrowings 1,033 977 2,675 1,839
Total borrowings paid 15,250 12,715 29,957 27,759
Bank loans are denominated in euros.
As of 30.09.2021, the repayment dates of bank loans are between 20.12.2021 and 15.06.2026 (31.12.2020:
between 25.01.2021 and 31.07.2025), interest is tied both to 3-month and 6-month EURIBOR as well as
EONIA. Group has also contracts with fixed interest rate. Weighted average interest rate was 1.43% (2020:
1.64%).
Lease agreements that form lease liabilities have been concluded for the term until 01.10.2037. Lease liabil-
ity recorded in the balance sheet as at 31.12.2019 is recognised as a result of adoption of IFRS 16 on
01.01.2019. The lease payments are discounted at the Group’s incremental borrowing rate. Weighted aver-
age interest rate used on recognition of lease liabilities was 1.62% (31.12.2020: 1.62%).
Net debt reconciliation
in thousands of euros
30.09.2021 31.12.2020
Cash and cash equivalents (Note 2) 12,205 32,757
Short-term borrowings -23,324 -49,402
Long-term borrowings -258,601 -217,349
Net debt -269,720 -233,994
Cash and cash equivalents (Note 2) 12,205 32,757
Gross debt – fixed interest rates -177,245 -153,606
Gross debt – variable interest rates -104,680 -113,145
Net debt -269,720 -233,994
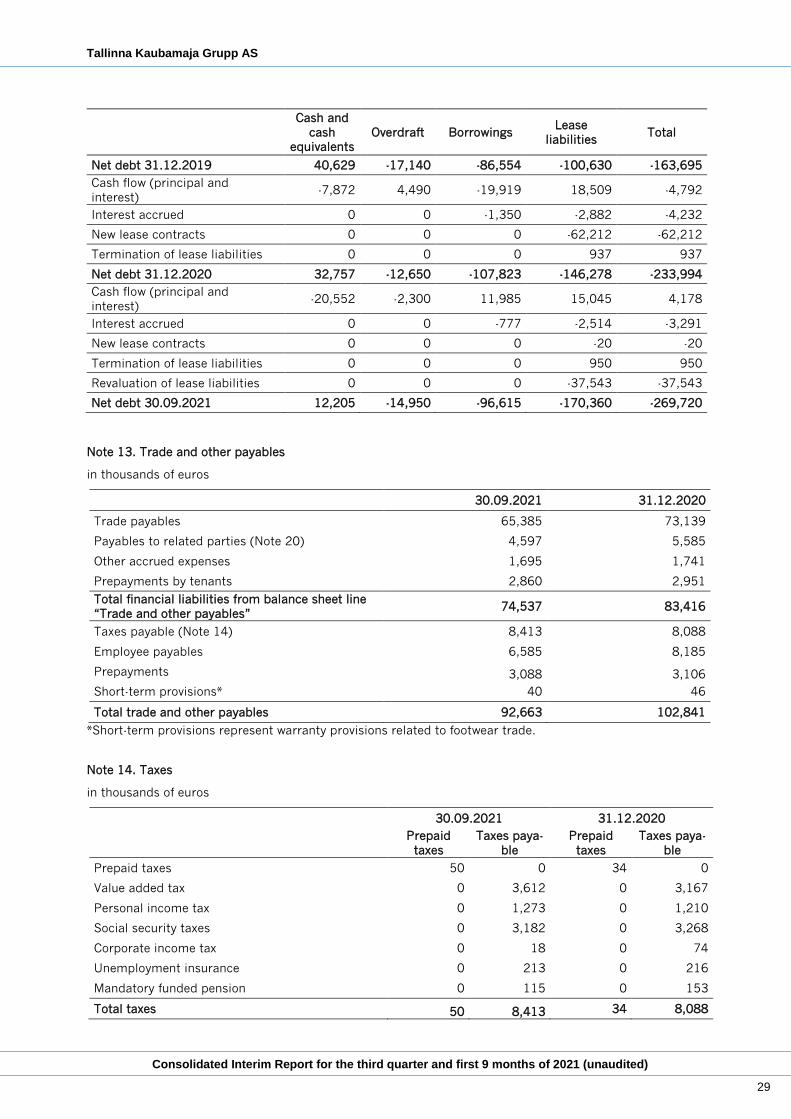
Tallinna Kaubamaja Grupp AS
Consolidated Interim Report for the third quarter and first 9 months of 2021 (unaudited)
29
Cash and
cash
equivalents
Overdraft Borrowings Lease
liabilities Total
Net debt 31.12.2019 40,629 -17,140 -86,554 -100,630 -163,695
Cash flow (principal and
interest) -7,872 4,490 -19,919 18,509 -4,792
Interest accrued 0 0 -1,350 -2,882 -4,232
New lease contracts 0 0 0 -62,212 -62,212
Termination of lease liabilities 0 0 0 937 937
Net debt 31.12.2020 32,757 -12,650 -107,823 -146,278 -233,994
Cash flow (principal and
interest) -20,552 -2,300 11,985 15,045 4,178
Interest accrued 0 0 -777 -2,514 -3,291
New lease contracts 0 0 0 -20 -20
Termination of lease liabilities 0 0 0 950 950
Revaluation of lease liabilities 0 0 0 -37,543 -37,543
Net debt 30.09.2021 12,205 -14,950 -96,615 -170,360 -269,720
Note 13. Trade and other payables
in thousands of euros
30.09.2021 31.12.2020
Trade payables 65,385 73,139
Payables to related parties (Note 20) 4,597 5,585
Other accrued expenses 1,695 1,741
Prepayments by tenants 2,860 2,951
Total financial liabilities from balance sheet line
“Trade and other payables” 74,537 83,416
Taxes payable (Note 14) 8,413 8,088
Employee payables 6,585 8,185
Prepayments 3,088 3,106
Short-term provisions* 40 46
Total trade and other payables 92,663 102,841
*Short-term provisions represent warranty provisions related to footwear trade.
Note 14. Taxes
in thousands of euros
30.09.2021 31.12.2020
Prepaid
taxes
Taxes paya-
ble
Prepaid
taxes
Taxes paya-
ble
Prepaid taxes 50 0 34 0
Value added tax 0 3,612 0 3,167
Personal income tax 0 1,273 0 1,210
Social security taxes 0 3,182 0 3,268
Corporate income tax 0 18 0 74
Unemployment insurance 0 213 0 216
Mandatory funded pension 0 115 0 153
Total taxes 50 8,413 34 8,088
Tallinna Kaubamaja Grupp AS
Consolidated Interim Report for the third quarter and first 9 months of 2021 (unaudited)
30
As of 30.09.2021 deferred tax liability on dividends in the amount of 4,408 thousand euros (31.12.2020: 4,408
thousand euros) is recorded in the balance sheet.
Note 15. Share capital
As of 30.09.2021 and 31.12.2020, the share capital in the amount of 16,292 thousand euros consisted of
40,729,200 ordinary shares with the nominal value of 0.40 euros per share. All shares issued have been paid
for. According to the articles of association, the maximum allowed number of shares is 162,916,800 shares.
In 2021, dividends were paid to the shareholders in the amount of 24,437 thousand euros, or 0.60 euros per
share. Related income tax expense on dividends amounted to 4,333 thousand euros.
In 2020, dividends were paid to the shareholders in the amount of 29,731 thousand euros, or 0.73 euros per
share. Related income tax expense on dividends amounted to 5,821 thousand euros.
Note 16. Segment reporting
The Group has defined the business segments based on the reports used regularly by the supervisory board to
make strategic decisions.
The chief operating decision maker monitors the Group’s operations by activities. With regard to areas of
activity, the operating activities are monitored in the department stores, supermarkets, real estate, car trade,
footwear trade, beauty products (I.L.U.) and security segments. The measures of I.L.U. and footwear segment
are below the quantitative criteria of the reporting segment specified in IFRS 8; these segments have been
aggregated with the department stores segment because they have similar economic characteristics and are
similar in other respects specified in IFRS 8.
The main area of activity of department stores, supermarkets, footwear trade and car trade is retail trade.
Supermarkets focus on the sale of food products and convenience goods, the department stores on the sale of
beauty and fashion products, the car trade on the sale of cars and spare parts. Among the others, in the car
trade segment, cars are sold at wholesale prices to authorised car dealers. The share of wholesale trade in
other segments is insignificant. The real estate segment deals with the development, management and
maintenance of real estate owned by the Group, and with the rental of commercial premises.
The activities of the Group are carried out in Estonia, Latvia and Lithuania. The Group operates in all the five
operating segments in Estonia. The Group is engaged in car trade and real estate development in Latvia and
in Lithuania.
The disclosures of financial information correspond to the information that is periodically reported to the
Supervisory Board. Measures of profit or loss, segment assets and liabilities have been measured in accordance
with accounting policies used in the preparation of the financial statements, except for IFRS 16 measurement
and recognition of right of use assets and lease liabilities. The effect of IFRS 16 measurement and recognition
of right of use assets and lease liabilities are shown in a separate sector. Main measures that Supervisory
Board monitors are segment revenue (external segment and inter-segment revenue), EBITDA (earnings before
interest, taxes, depreciation and amortisation) and net profit or loss.
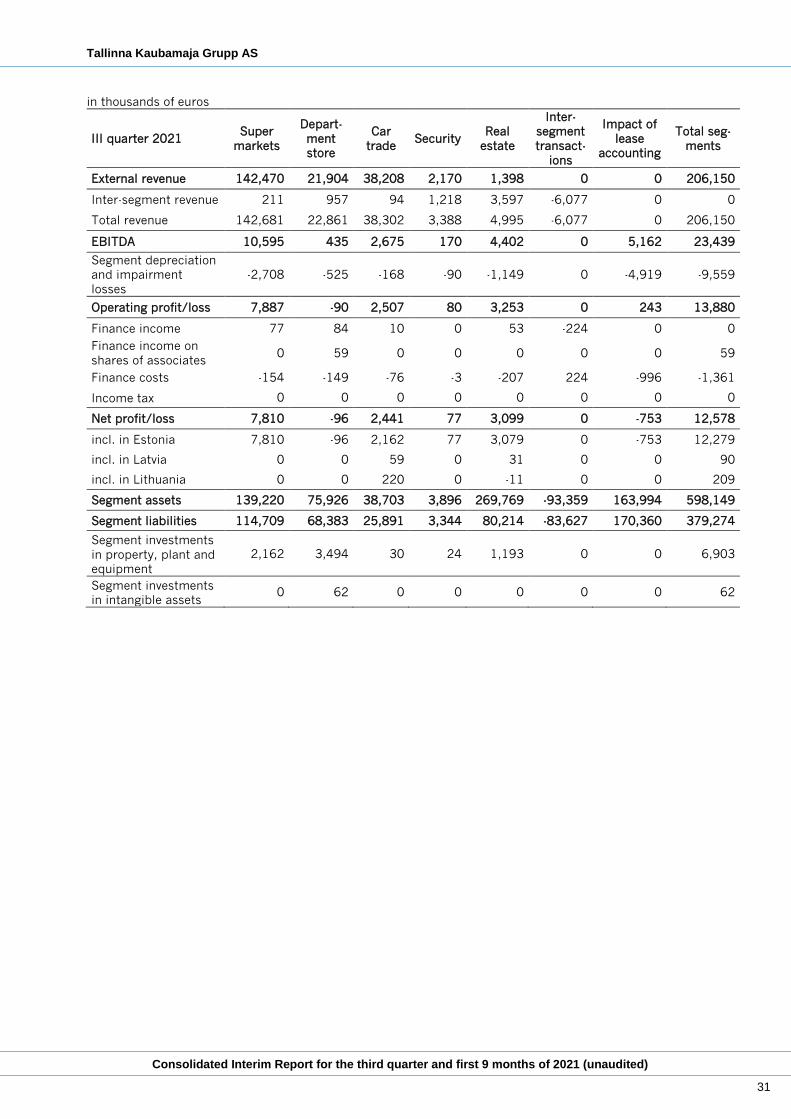
Tallinna Kaubamaja Grupp AS
Consolidated Interim Report for the third quarter and first 9 months of 2021 (unaudited)
31
in thousands of euros
III quarter 2021 Super
markets
Depart-
ment
store
Car
trade Security
Real
estate
Inter-
segment
transact-
ions
Impact of
lease
accounting
Total seg-
ments
External revenue 142,470 21,904 38,208 2,170 1,398 0 0 206,150
Inter-segment revenue 211 957 94 1,218 3,597 -6,077 0 0
Total revenue 142,681 22,861 38,302 3,388 4,995 -6,077 0 206,150
EBITDA 10,595 435 2,675 170 4,402 0 5,162 23,439
Segment depreciation
and impairment
losses
-2,708 -525 -168 -90 -1,149 0 -4,919 -9,559
Operating profit/loss 7,887 -90 2,507 80 3,253 0 243 13,880
Finance income 77 84 10 0 53 -224 0 0
Finance income on
shares of associates 0 59 0 0 0 0 0 59
Finance costs -154 -149 -76 -3 -207 224 -996 -1,361
Income tax 0 0 0 0 0 0 0 0
Net profit/loss 7,810 -96 2,441 77 3,099 0 -753 12,578
incl. in Estonia 7,810 -96 2,162 77 3,079 0 -753 12,279
incl. in Latvia 0 0 59 0 31 0 0 90
incl. in Lithuania 0 0 220 0 -11 0 0 209
Segment assets 139,220 75,926 38,703 3,896 269,769 -93,359 163,994 598,149
Segment liabilities 114,709 68,383 25,891 3,344 80,214 -83,627 170,360 379,274
Segment investments
in property, plant and
equipment
2,162 3,494 30 24 1,193 0 0 6,903
Segment investments
in intangible assets 0 62 0 0 0 0 0 62
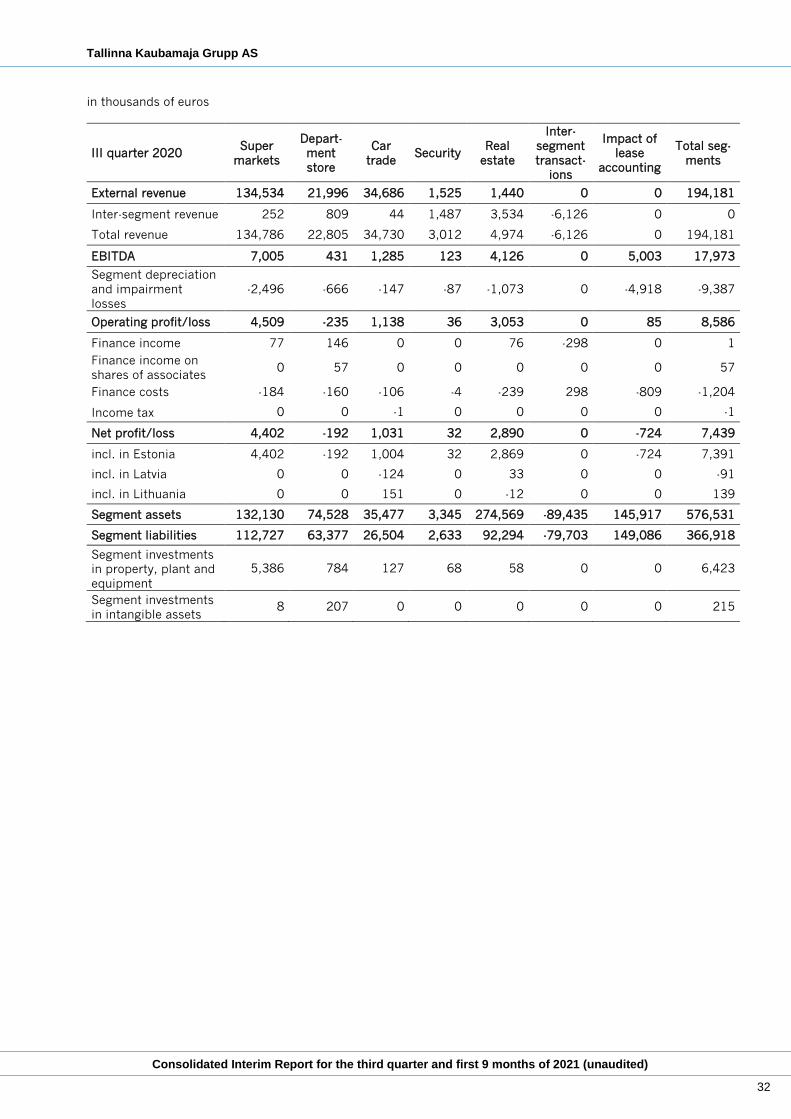
Tallinna Kaubamaja Grupp AS
Consolidated Interim Report for the third quarter and first 9 months of 2021 (unaudited)
32
in thousands of euros
III quarter 2020 Super
markets
Depart-
ment
store
Car
trade Security
Real
estate
Inter-
segment
transact-
ions
Impact of
lease
accounting
Total seg-
ments
External revenue 134,534 21,996 34,686 1,525 1,440 0 0 194,181
Inter-segment revenue 252 809 44 1,487 3,534 -6,126 0 0
Total revenue 134,786 22,805 34,730 3,012 4,974 -6,126 0 194,181
EBITDA 7,005 431 1,285 123 4,126 0 5,003 17,973
Segment depreciation
and impairment
losses
-2,496 -666 -147 -87 -1,073 0 -4,918 -9,387
Operating profit/loss 4,509 -235 1,138 36 3,053 0 85 8,586
Finance income 77 146 0 0 76 -298 0 1
Finance income on
shares of associates 0 57 0 0 0 0 0 57
Finance costs -184 -160 -106 -4 -239 298 -809 -1,204
Income tax 0 0 -1 0 0 0 0 -1
Net profit/loss 4,402 -192 1,031 32 2,890 0 -724 7,439
incl. in Estonia 4,402 -192 1,004 32 2,869 0 -724 7,391
incl. in Latvia 0 0 -124 0 33 0 0 -91
incl. in Lithuania 0 0 151 0 -12 0 0 139
Segment assets 132,130 74,528 35,477 3,345 274,569 -89,435 145,917 576,531
Segment liabilities 112,727 63,377 26,504 2,633 92,294 -79,703 149,086 366,918
Segment investments
in property, plant and
equipment
5,386 784 127 68 58 0 0 6,423
Segment investments
in intangible assets 8 207 0 0 0 0 0 215
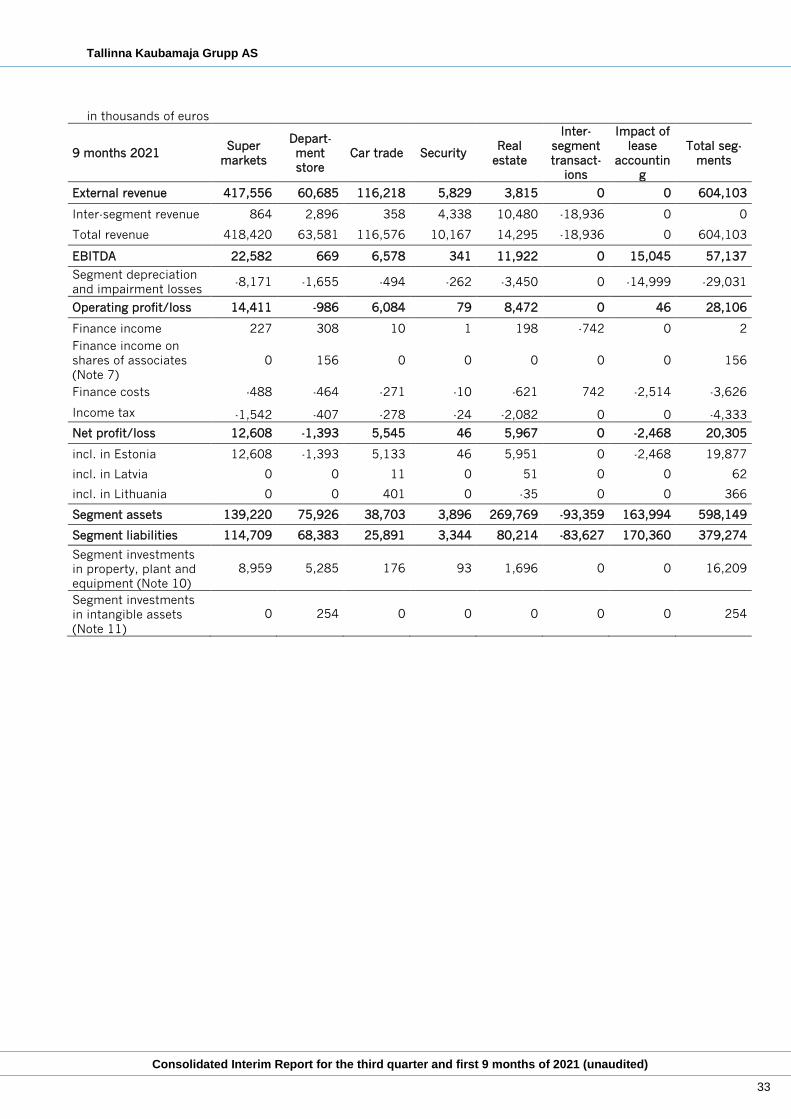
Tallinna Kaubamaja Grupp AS
Consolidated Interim Report for the third quarter and first 9 months of 2021 (unaudited)
33
in thousands of euros
9 months 2021 Super
markets
Depart-
ment
store
Car trade Security Real
estate
Inter-
segment
transact-
ions
Impact of
lease
accountin
g
Total seg-
ments
External revenue 417,556 60,685 116,218 5,829 3,815 0 0 604,103
Inter-segment revenue 864 2,896 358 4,338 10,480 -18,936 0 0
Total revenue 418,420 63,581 116,576 10,167 14,295 -18,936 0 604,103
EBITDA 22,582 669 6,578 341 11,922 0 15,045 57,137
Segment depreciation
and impairment losses -8,171 -1,655 -494 -262 -3,450 0 -14,999 -29,031
Operating profit/loss 14,411 -986 6,084 79 8,472 0 46 28,106
Finance income 227 308 10 1 198 -742 0 2
Finance income on
shares of associates
(Note 7)
0 156 0 0 0 0 0 156
Finance costs -488 -464 -271 -10 -621 742 -2,514 -3,626
Income tax -1,542 -407 -278 -24 -2,082 0 0 -4,333
Net profit/loss 12,608 -1,393 5,545 46 5,967 0 -2,468 20,305
incl. in Estonia 12,608 -1,393 5,133 46 5,951 0 -2,468 19,877
incl. in Latvia 0 0 11 0 51 0 0 62
incl. in Lithuania 0 0 401 0 -35 0 0 366
Segment assets 139,220 75,926 38,703 3,896 269,769 -93,359 163,994 598,149
Segment liabilities 114,709 68,383 25,891 3,344 80,214 -83,627 170,360 379,274
Segment investments
in property, plant and
equipment (Note 10)
8,959 5,285 176 93 1,696 0 0 16,209
Segment investments
in intangible assets
(Note 11)
0 254 0 0 0 0 0 254
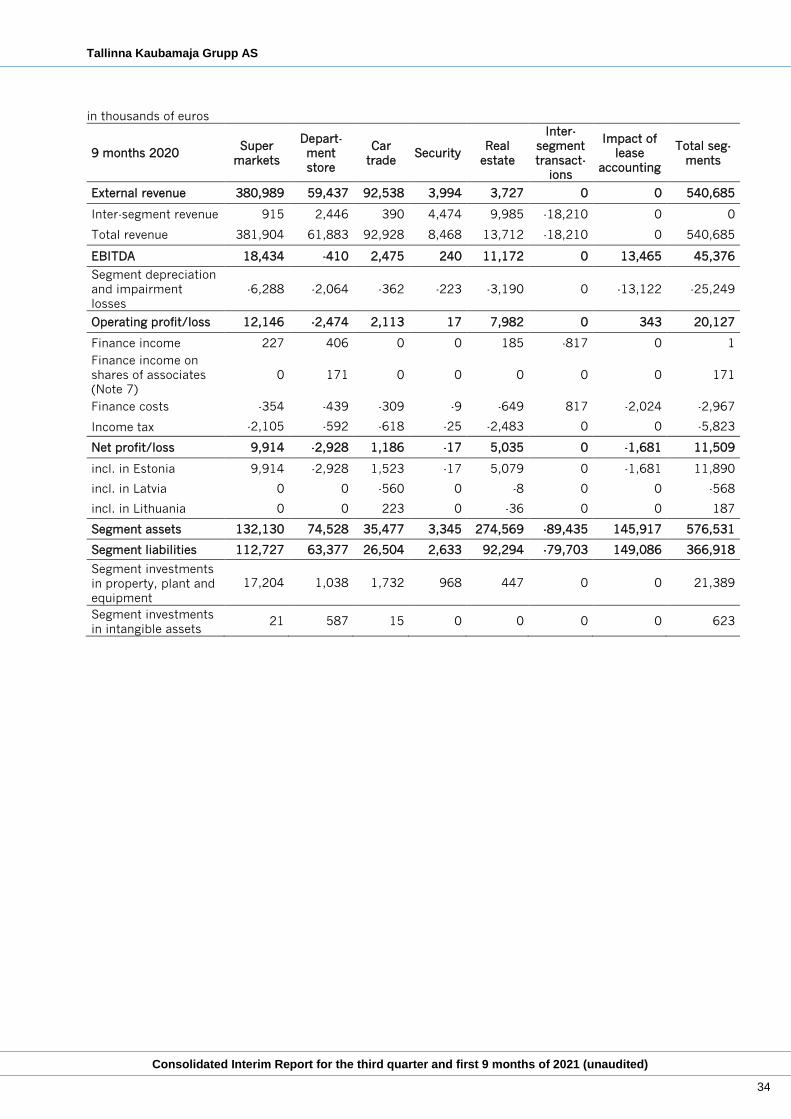
Tallinna Kaubamaja Grupp AS
Consolidated Interim Report for the third quarter and first 9 months of 2021 (unaudited)
34
in thousands of euros
9 months 2020 Super
markets
Depart-
ment
store
Car
trade Security
Real
estate
Inter-
segment
transact-
ions
Impact of
lease
accounting
Total seg-
ments
External revenue 380,989 59,437 92,538 3,994 3,727 0 0 540,685
Inter-segment revenue 915 2,446 390 4,474 9,985 -18,210 0 0
Total revenue 381,904 61,883 92,928 8,468 13,712 -18,210 0 540,685
EBITDA 18,434 -410 2,475 240 11,172 0 13,465 45,376
Segment depreciation
and impairment
losses
-6,288 -2,064 -362 -223 -3,190 0 -13,122 -25,249
Operating profit/loss 12,146 -2,474 2,113 17 7,982 0 343 20,127
Finance income 227 406 0 0 185 -817 0 1
Finance income on
shares of associates
(Note 7)
0 171 0 0 0 0 0 171
Finance costs -354 -439 -309 -9 -649 817 -2,024 -2,967
Income tax -2,105 -592 -618 -25 -2,483 0 0 -5,823
Net profit/loss 9,914 -2,928 1,186 -17 5,035 0 -1,681 11,509
incl. in Estonia 9,914 -2,928 1,523 -17 5,079 0 -1,681 11,890
incl. in Latvia 0 0 -560 0 -8 0 0 -568
incl. in Lithuania 0 0 223 0 -36 0 0 187
Segment assets 132,130 74,528 35,477 3,345 274,569 -89,435 145,917 576,531
Segment liabilities 112,727 63,377 26,504 2,633 92,294 -79,703 149,086 366,918
Segment investments
in property, plant and
equipment
17,204 1,038 1,732 968 447 0 0 21,389
Segment investments
in intangible assets 21 587 15 0 0 0 0 623
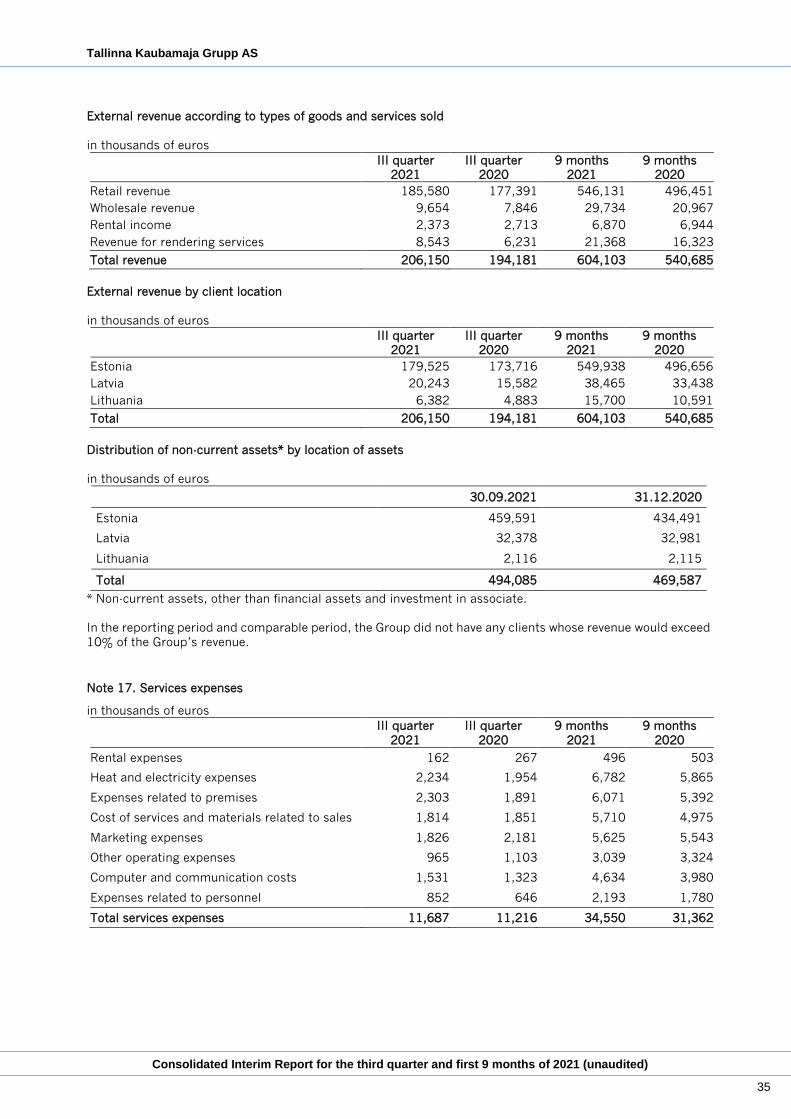
Tallinna Kaubamaja Grupp AS
Consolidated Interim Report for the third quarter and first 9 months of 2021 (unaudited)
35
External revenue according to types of goods and services sold
in thousands of euros
III quarter
2021
III quarter
2020
9 months
2021
9 months
2020
Retail revenue 185,580 177,391 546,131 496,451
Wholesale revenue 9,654 7,846 29,734 20,967
Rental income 2,373 2,713 6,870 6,944
Revenue for rendering services 8,543 6,231 21,368 16,323
Total revenue 206,150 194,181 604,103 540,685
External revenue by client location
in thousands of euros
III quarter
2021
III quarter
2020
9 months
2021
9 months
2020
Estonia 179,525 173,716 549,938 496,656
Latvia 20,243 15,582 38,465 33,438
Lithuania 6,382 4,883 15,700 10,591
Total 206,150 194,181 604,103 540,685
Distribution of non-current assets* by location of assets
in thousands of euros
30.09.2021 31.12.2020
Estonia 459,591 434,491
Latvia 32,378 32,981
Lithuania 2,116 2,115
Total 494,085 469,587
* Non-current assets, other than financial assets and investment in associate.
In the reporting period and comparable period, the Group did not have any clients whose revenue would exceed
10% of the Group’s revenue.
Note 17. Services expenses
in thousands of euros
III quarter
2021
III quarter
2020
9 months
2021
9 months
2020
Rental expenses 162 267 496 503
Heat and electricity expenses 2,234 1,954 6,782 5,865
Expenses related to premises 2,303 1,891 6,071 5,392
Cost of services and materials related to sales 1,814 1,851 5,710 4,975
Marketing expenses 1,826 2,181 5,625 5,543
Other operating expenses 965 1,103 3,039 3,324
Computer and communication costs 1,531 1,323 4,634 3,980
Expenses related to personnel 852 646 2,193 1,780
Total services expenses 11,687 11,216 34,550 31,362
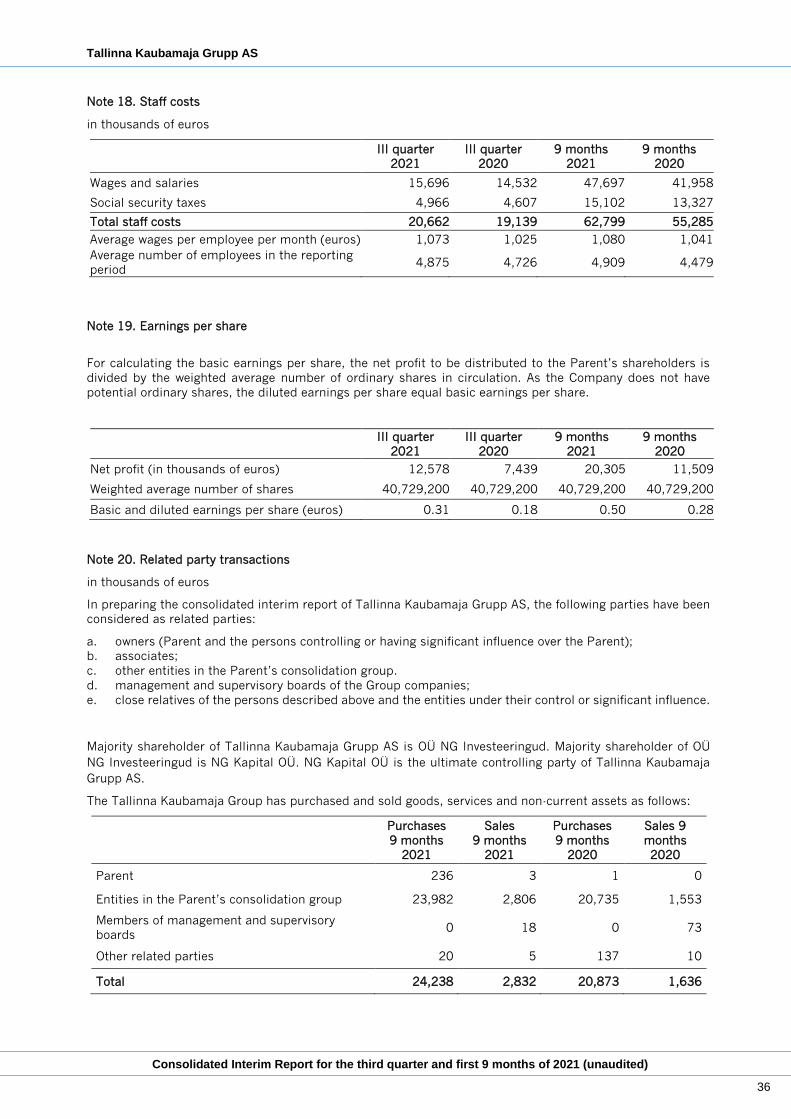
Tallinna Kaubamaja Grupp AS
Consolidated Interim Report for the third quarter and first 9 months of 2021 (unaudited)
36
Note 18. Staff costs
in thousands of euros
III quarter
2021
III quarter
2020
9 months
2021
9 months
2020
Wages and salaries 15,696 14,532 47,697 41,958
Social security taxes 4,966 4,607 15,102 13,327
Total staff costs 20,662 19,139 62,799 55,285
Average wages per employee per month (euros) 1,073 1,025 1,080 1,041
Average number of employees in the reporting
period 4,875 4,726 4,909 4,479
Note 19. Earnings per share
For calculating the basic earnings per share, the net profit to be distributed to the Parent’s shareholders is
divided by the weighted average number of ordinary shares in circulation. As the Company does not have
potential ordinary shares, the diluted earnings per share equal basic earnings per share.
III quarter
2021
III quarter
2020
9 months
2021
9 months
2020
Net profit (in thousands of euros) 12,578 7,439 20,305 11,509
Weighted average number of shares 40,729,200 40,729,200 40,729,200 40,729,200
Basic and diluted earnings per share (euros) 0.31 0.18 0.50 0.28
Note 20. Related party transactions
in thousands of euros
In preparing the consolidated interim report of Tallinna Kaubamaja Grupp AS, the following parties have been
considered as related parties:
a. owners (Parent and the persons controlling or having significant influence over the Parent);
b. associates;
c. other entities in the Parent’s consolidation group.
d. management and supervisory boards of the Group companies;
e. close relatives of the persons described above and the entities under their control or significant influence.
Majority shareholder of Tallinna Kaubamaja Grupp AS is OÜ NG Investeeringud. Majority shareholder of OÜ
NG Investeeringud is NG Kapital OÜ. NG Kapital OÜ is the ultimate controlling party of Tallinna Kaubamaja
Grupp AS.
The Tallinna Kaubamaja Group has purchased and sold goods, services and non-current assets as follows:
Purchases
9 months
2021
Sales
9 months
2021
Purchases
9 months
2020
Sales 9
months
2020
Parent 236 3 1 0
Entities in the Parent’s consolidation group 23,982 2,806 20,735 1,553
Members of management and supervisory
boards 0 18 0 73
Other related parties 20 5 137 10
Total 24,238 2,832 20,873 1,636
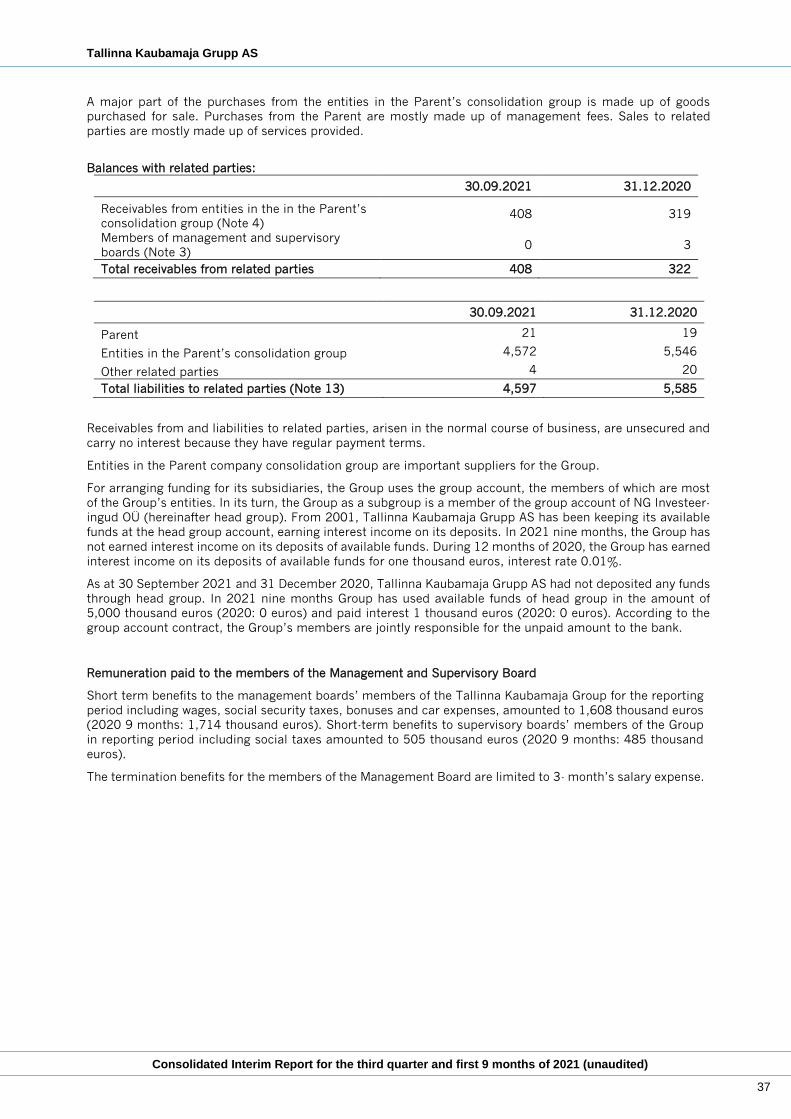
Tallinna Kaubamaja Grupp AS
Consolidated Interim Report for the third quarter and first 9 months of 2021 (unaudited)
37
A major part of the purchases from the entities in the Parent’s consolidation group is made up of goods
purchased for sale. Purchases from the Parent are mostly made up of management fees. Sales to related
parties are mostly made up of services provided.
Balances with related parties:
30.09.2021 31.12.2020
Receivables from entities in the in the Parent’s
consolidation group (Note 4) 408 319
Members of management and supervisory
boards (Note 3) 0 3
Total receivables from related parties 408 322
30.09.2021 31.12.2020
Parent 21 19
Entities in the Parent’s consolidation group 4,572 5,546
Other related parties 4 20
Total liabilities to related parties (Note 13) 4,597 5,585
Receivables from and liabilities to related parties, arisen in the normal course of business, are unsecured and
carry no interest because they have regular payment terms.
Entities in the Parent company consolidation group are important suppliers for the Group.
For arranging funding for its subsidiaries, the Group uses the group account, the members of which are most
of the Group’s entities. In its turn, the Group as a subgroup is a member of the group account of NG Investeer-
ingud OÜ (hereinafter head group). From 2001, Tallinna Kaubamaja Grupp AS has been keeping its available
funds at the head group account, earning interest income on its deposits. In 2021 nine months, the Group has
not earned interest income on its deposits of available funds. During 12 months of 2020, the Group has earned
interest income on its deposits of available funds for one thousand euros, interest rate 0.01%.
As at 30 September 2021 and 31 December 2020, Tallinna Kaubamaja Grupp AS had not deposited any funds
through head group. In 2021 nine months Group has used available funds of head group in the amount of
5,000 thousand euros (2020: 0 euros) and paid interest 1 thousand euros (2020: 0 euros). According to the
group account contract, the Group’s members are jointly responsible for the unpaid amount to the bank.
Remuneration paid to the members of the Management and Supervisory Board
Short term benefits to the management boards’ members of the Tallinna Kaubamaja Group for the reporting
period including wages, social security taxes, bonuses and car expenses, amounted to 1,608 thousand euros
(2020 9 months: 1,714 thousand euros). Short-term benefits to supervisory boards’ members of the Group
in reporting period including social taxes amounted to 505 thousand euros (2020 9 months: 485 thousand
euros).
The termination benefits for the members of the Management Board are limited to 3- month’s salary expense.