
Stationary Fuel Cells: Overview of Hydrogen and … and Fuel Cell Activities ... 1500kW Carbonate FC...
25
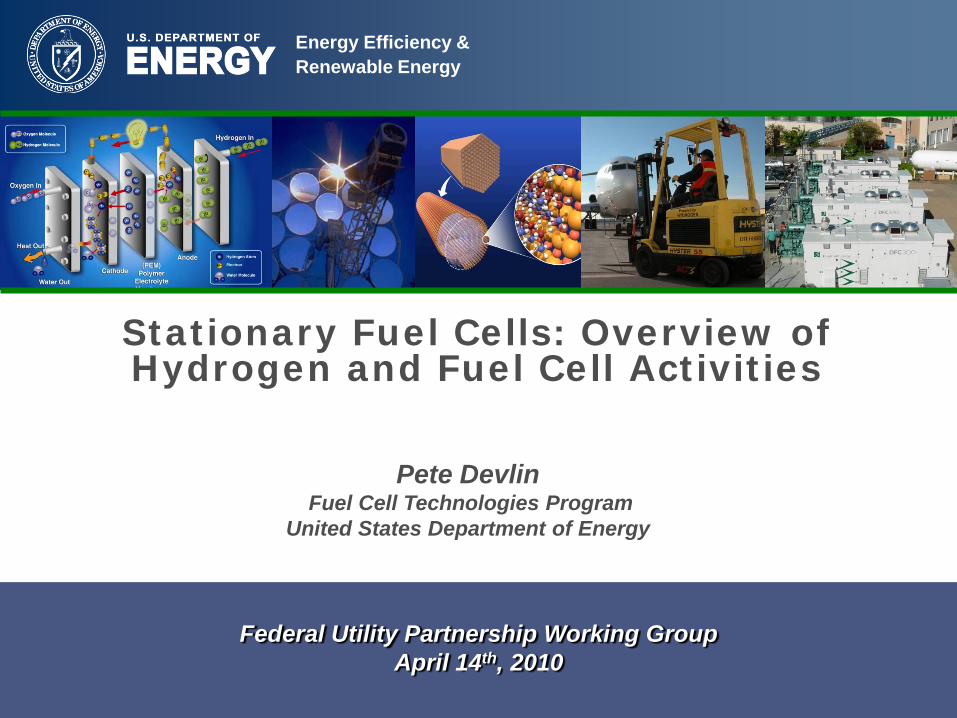
Energy Efficiency & Renewable Energy Stationary Fuel Cells: Overview of Hydrogen and Fuel Cell Activities Pete Devlin Fuel Cell Technologies Program United States Department of Energy Federal Utility Partnership Working Group April 14 th , 2010
Transcript of Stationary Fuel Cells: Overview of Hydrogen and … and Fuel Cell Activities ... 1500kW Carbonate FC...
Energy Efficiency & Renewable Energy
Stationary Fuel Cells: Overview of Hydrogen and Fuel Cell Activities
Pete DevlinFuel Cell Technologies Program
United States Department of Energy
Federal Utility Partnership Working GroupApril 14th, 2010
2
• DOE Fuel Cell Market Transformation Overview
• Overview of CHP Concept
• Stationary Fuel Cells for CHP Applications
• Partnering and Financing (Sam Logan)
• Example Project
Outline
3
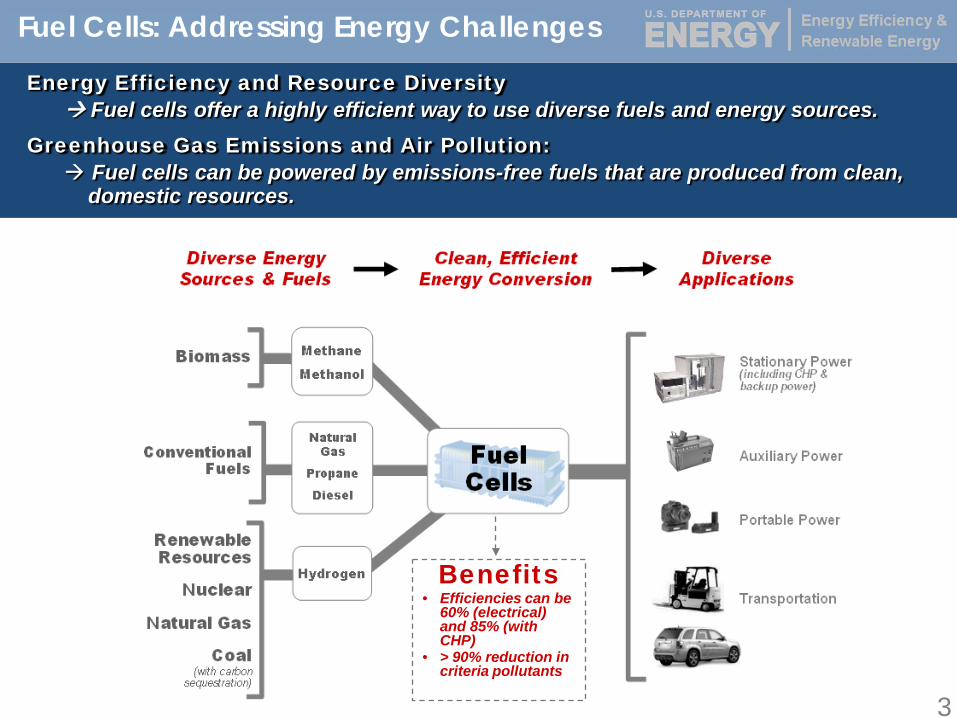
Fuel Cells: Addressing Energy Challenges
Energy Efficiency and Resource Diversity Fuel cells offer a highly efficient way to use diverse fuels and energy sources.
Greenhouse Gas Emissions and Air Pollution: Fuel cells can be powered by emissions-free fuels that are produced from clean,
domestic resources.
Stationary Power(including CHP & backup power)
Auxiliary & Portable Power
TransportationBenefits
• Efficiencies can be 60% (electrical) and 85% (with CHP)
• > 90% reduction in criteria pollutants
National Renewable Energy Laboratory Innovation for Our Energy Future4
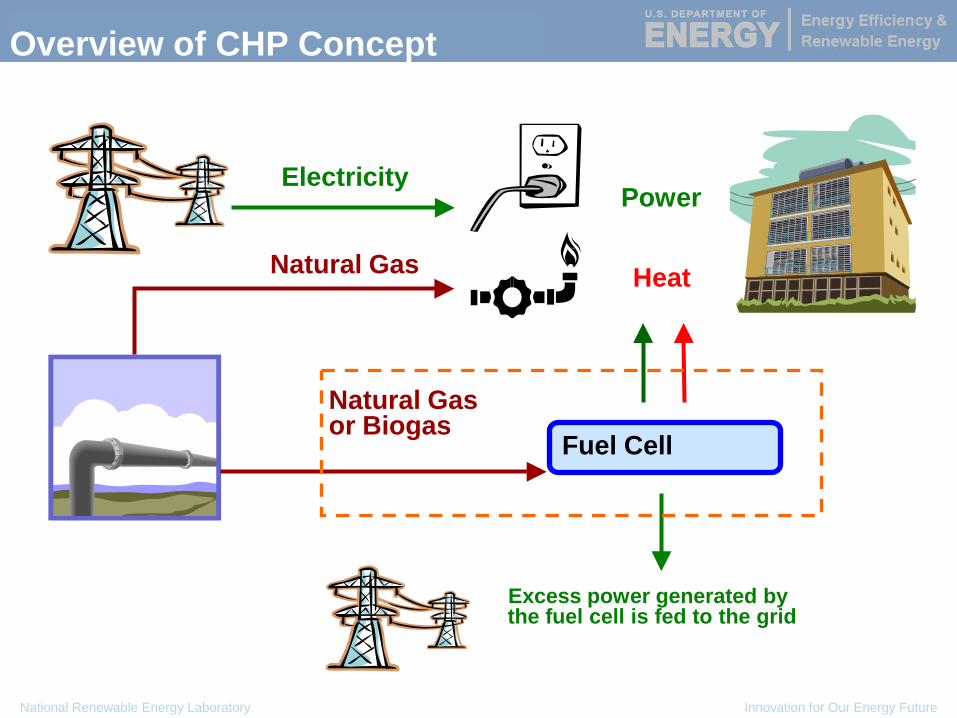
Overview of CHP Concept
Electricity
Natural Gas
Power
Heat
Natural Gasor Biogas
Fuel Cell
Excess power generated by the fuel cell is fed to the grid
5
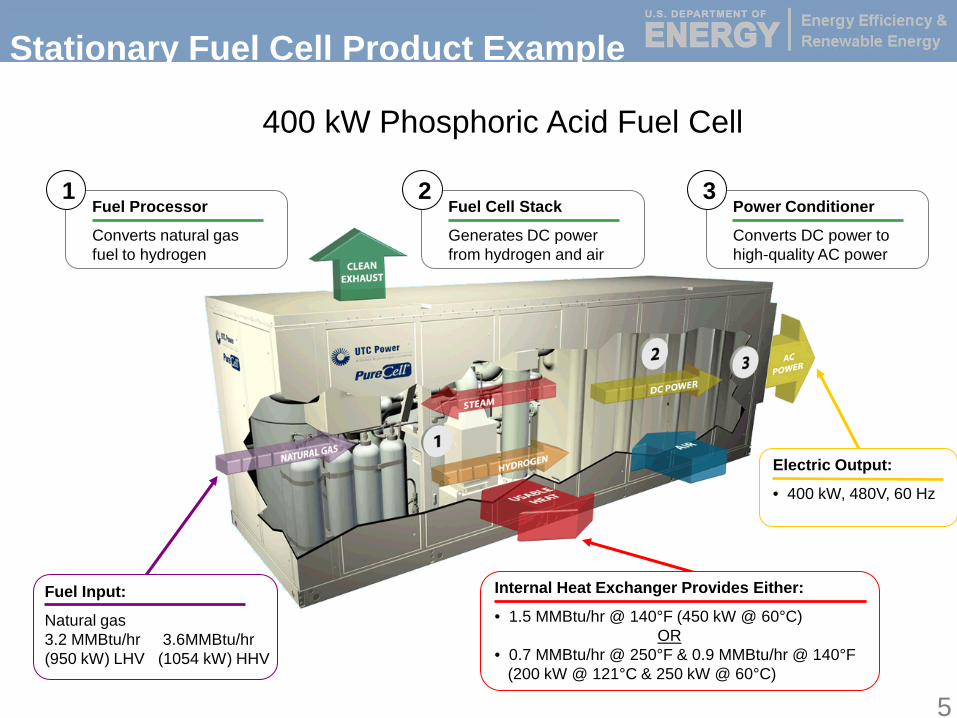
400 kW Phosphoric Acid Fuel Cell
Power Conditioner
Converts DC power tohigh-quality AC power
3Fuel Cell Stack
Generates DC powerfrom hydrogen and air
2Fuel Processor
Converts natural gasfuel to hydrogen
1
Electric Output:
• 400 kW, 480V, 60 Hz
Internal Heat Exchanger Provides Either:
• 1.5 MMBtu/hr @ 140°F (450 kW @ 60°C)OR
• 0.7 MMBtu/hr @ 250°F & 0.9 MMBtu/hr @ 140°F(200 kW @ 121°C & 250 kW @ 60°C)
Fuel Input:
Natural gas3.2 MMBtu/hr 3.6MMBtu/hr(950 kW) LHV (1054 kW) HHV
Stationary Fuel Cell Product Example
6
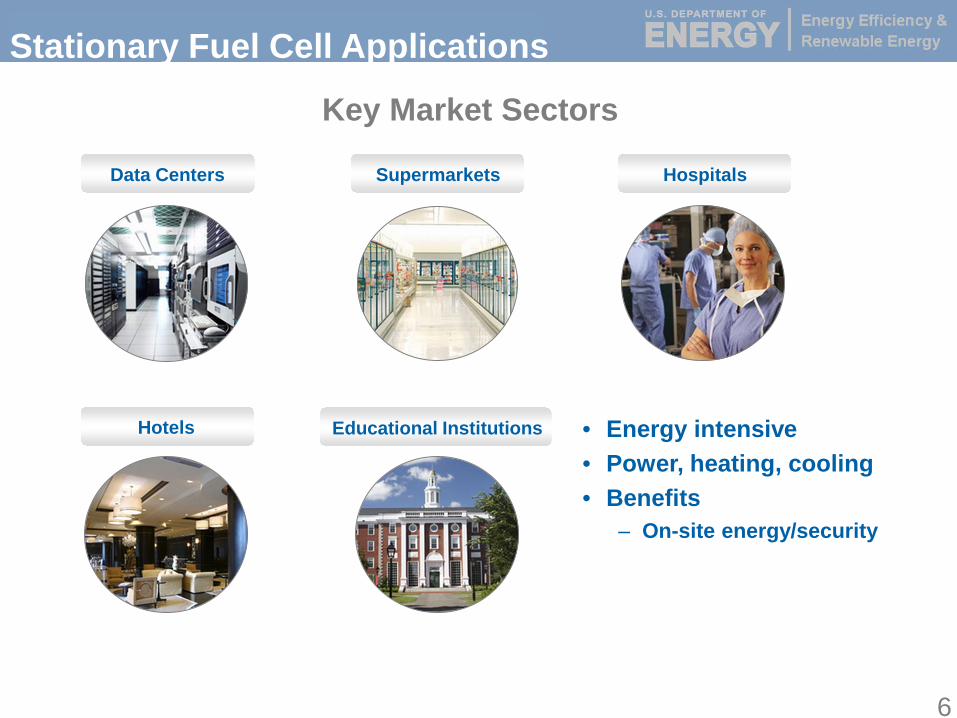
Key Market Sectors
Data Centers Supermarkets Hospitals
Hotels Educational Institutions • Energy intensive• Power, heating, cooling• Benefits
– On-site energy/security
Stationary Fuel Cell Applications
7
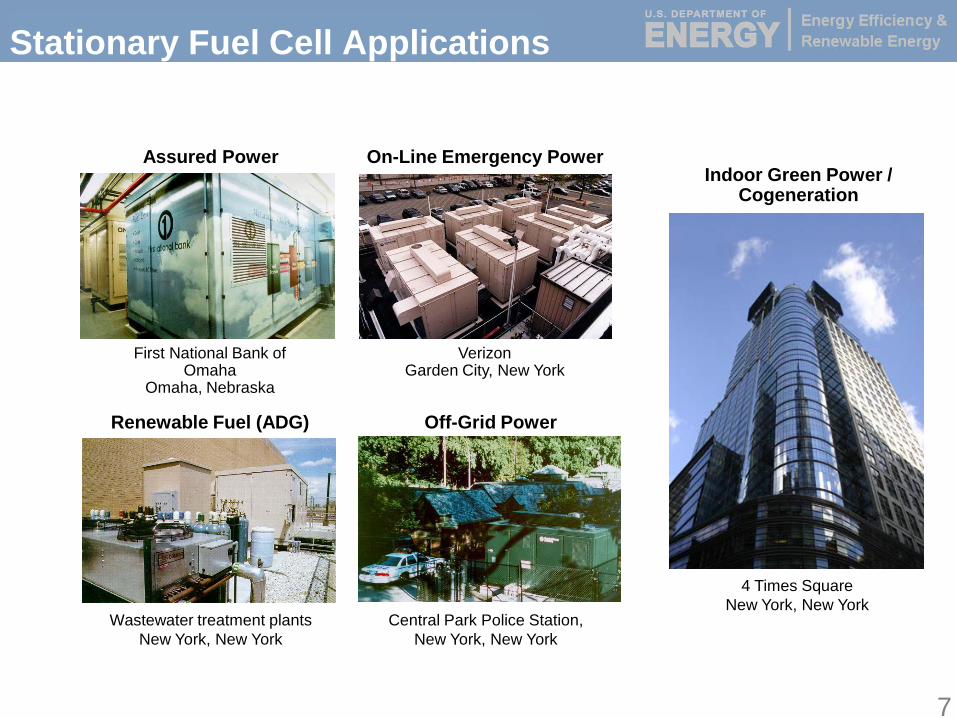
Stationary Fuel Cell Applications
First National Bank of Omaha
Omaha, Nebraska
Assured Power
Off-Grid Power
4 Times SquareNew York, New York
Indoor Green Power / Cogeneration
Wastewater treatment plantsNew York, New York
Renewable Fuel (ADG)
On-Line Emergency Power
VerizonGarden City, New York
Central Park Police Station,New York, New York
8
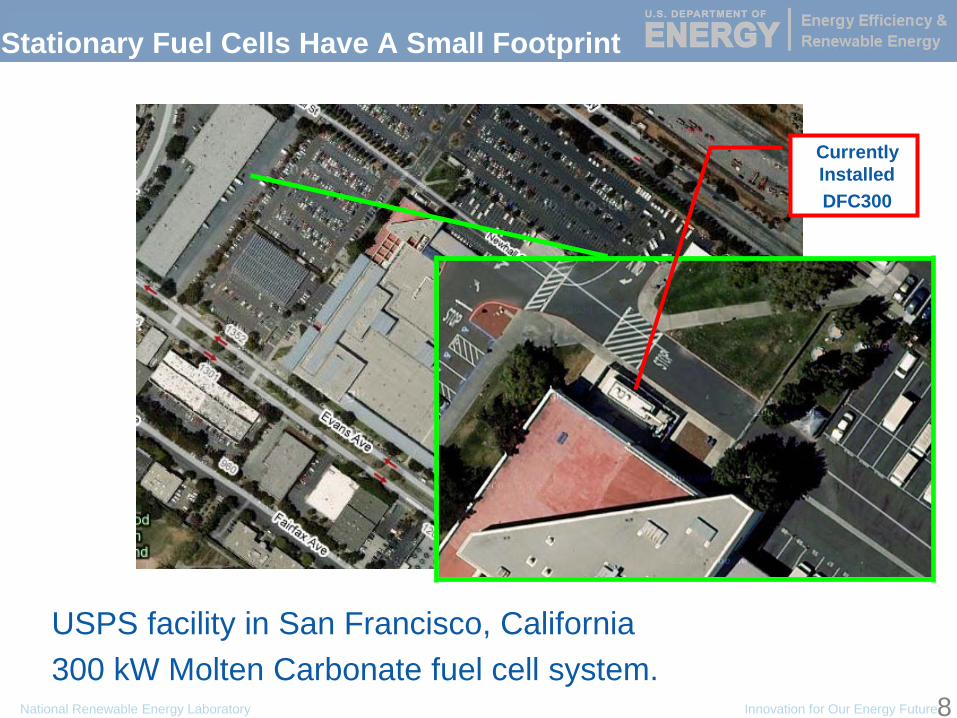
Stationary Fuel Cells Have A Small Footprint
National Renewable Energy Laboratory Innovation for Our Energy Future8
USPS facility in San Francisco, California300 kW Molten Carbonate fuel cell system.
Currently InstalledDFC300
National Renewable Energy Laboratory Innovation for Our Energy Future9
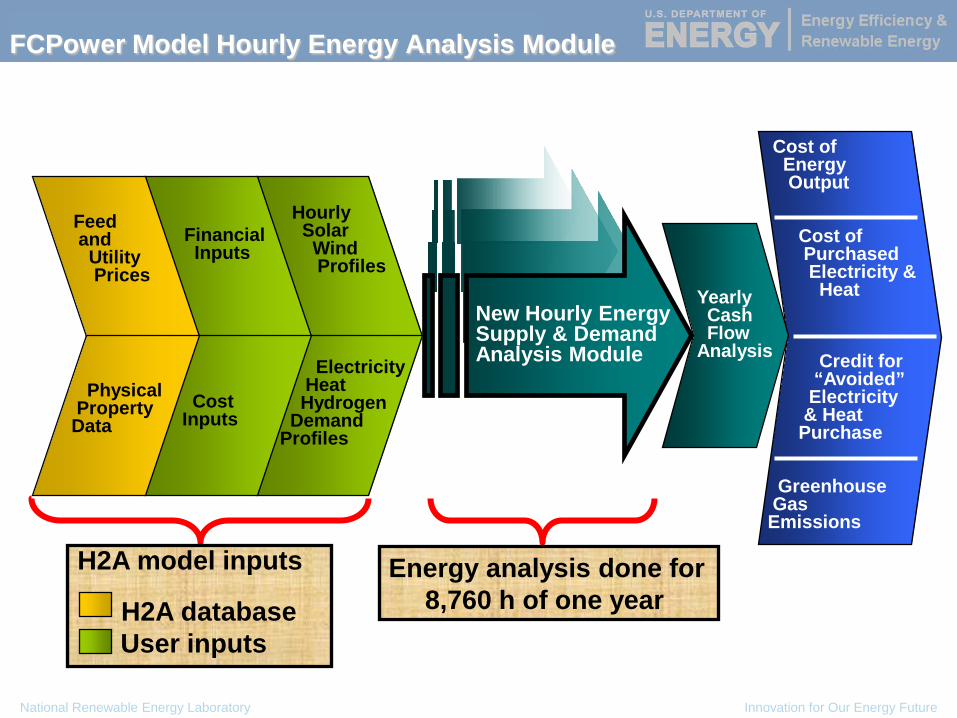
New Hourly EnergySupply & DemandAnalysis Module
FCPower Model Hourly Energy Analysis Module
Feedand
Utility Prices
PhysicalProperty
DataCost
Inputs
ElectricityHeatHydrogen
DemandProfiles
Hourly Solar
WindProfiles
Yearly Cash Flow
Analysis
Cost ofEnergyOutput
Cost of PurchasedElectricity &
Heat
Credit for“Avoided”Electricity
& Heat Purchase
GreenhouseGasEmissions
FinancialInputs
Energy analysis done for8,760 h of one year
H2A model inputs
H2A databaseUser inputs
10
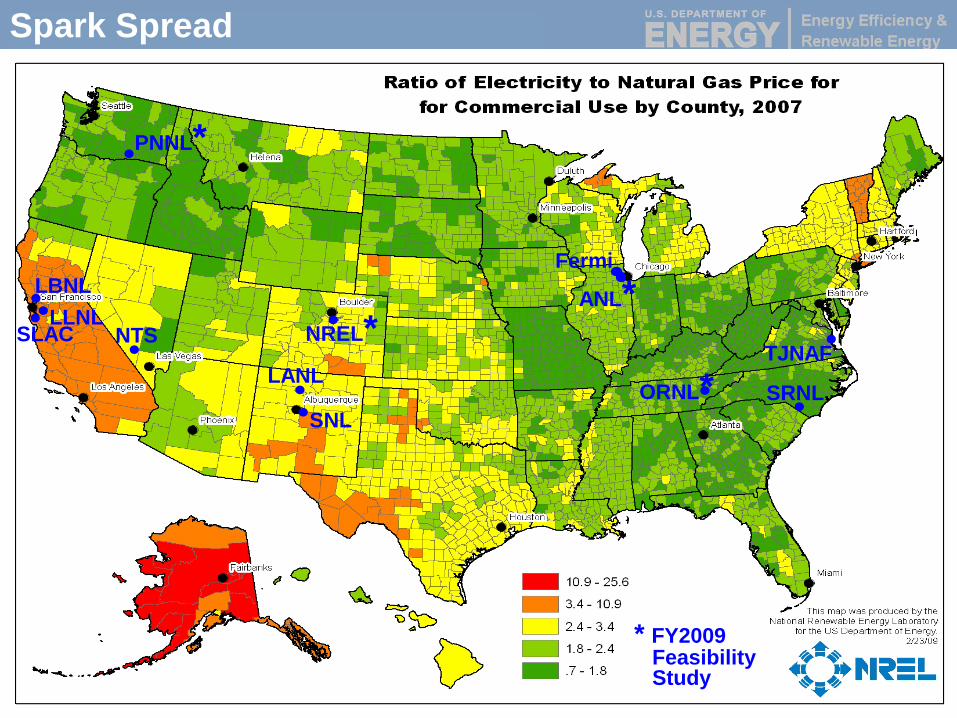
LBNL
PNNL*
LLNLNTS NREL*
LANL
ANL*
ORNL* SRNL
TJNAF
Fermi
SLAC
* FY2009 Feasibility Study
SNL
Spark Spread
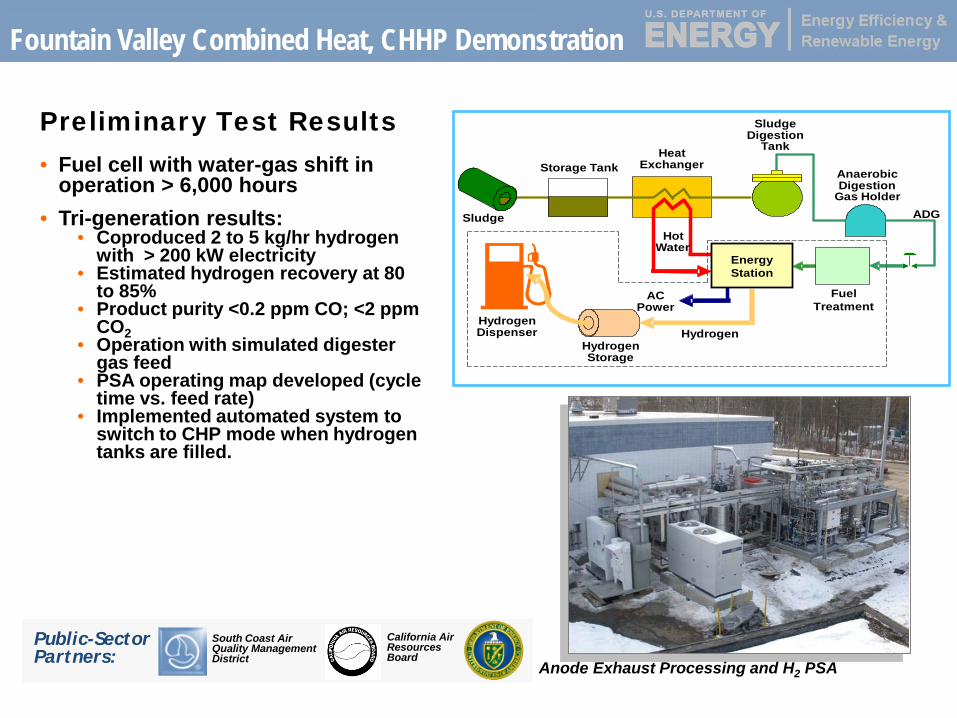
Sludge
Storage Tank
Sludge Digestion
Tank
ADG
Hydrogen
Hot Water
Energy Station
Fuel Treatment
Anaerobic Digestion
Gas Holder
Heat Exchanger
AC Power
Hydrogen Storage
Hydrogen Dispenser
Anode Exhaust Processing and H2 PSA
Preliminary Test Results• Fuel cell with water-gas shift in
operation > 6,000 hours• Tri-generation results:
• Coproduced 2 to 5 kg/hr hydrogen with > 200 kW electricity
• Estimated hydrogen recovery at 80 to 85%
• Product purity <0.2 ppm CO; <2 ppm CO2
• Operation with simulated digester gas feed
• PSA operating map developed (cycle time vs. feed rate)
• Implemented automated system to switch to CHP mode when hydrogen tanks are filled.
Public-Sector Partners:
California Air Resources Board
South Coast Air Quality Management District
Fountain Valley Combined Heat, CHHP Demonstration
12
Partners in Market Transformation
Market Transformation
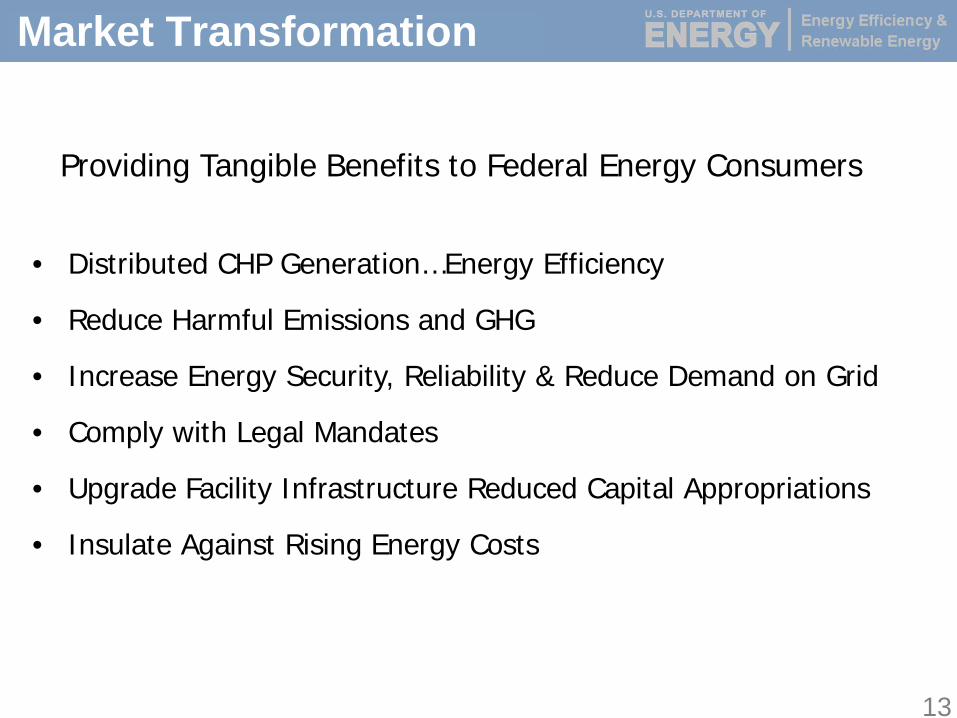
Market Transformation
• Distributed CHP Generation…Energy Efficiency
• Reduce Harmful Emissions and GHG
• Increase Energy Security, Reliability & Reduce Demand on Grid
• Comply with Legal Mandates
• Upgrade Facility Infrastructure Reduced Capital Appropriations
• Insulate Against Rising Energy Costs
Providing Tangible Benefits to Federal Energy Consumers
13
Market Transformation
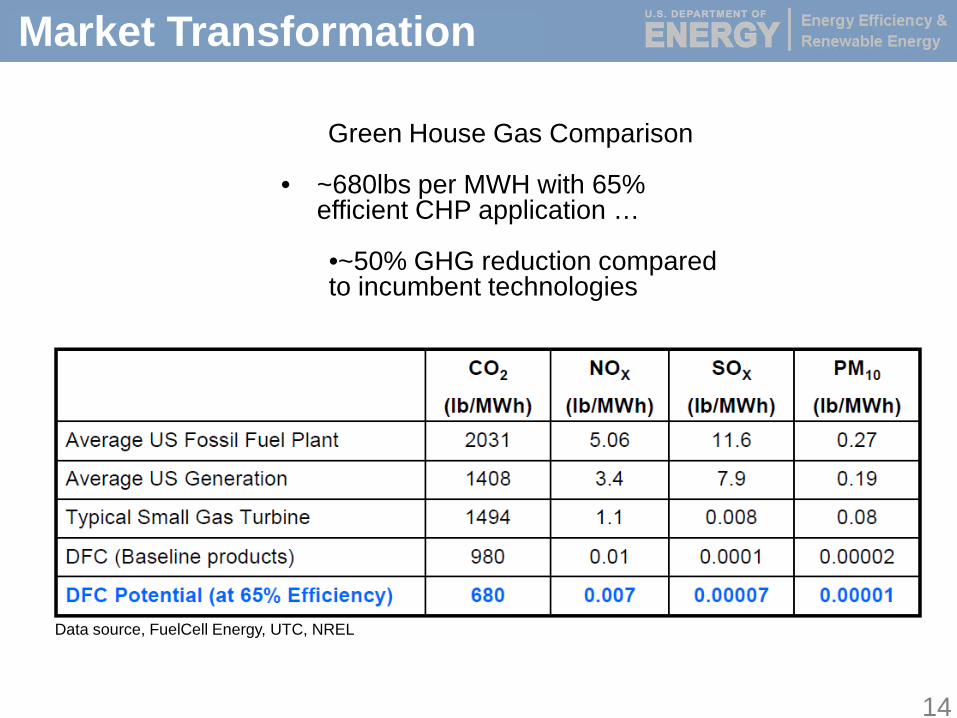
Green House Gas Comparison
• ~680lbs per MWH with 65% efficient CHP application …
•~50% GHG reduction compared to incumbent technologies
Data source, FuelCell Energy, UTC, NREL
14
15
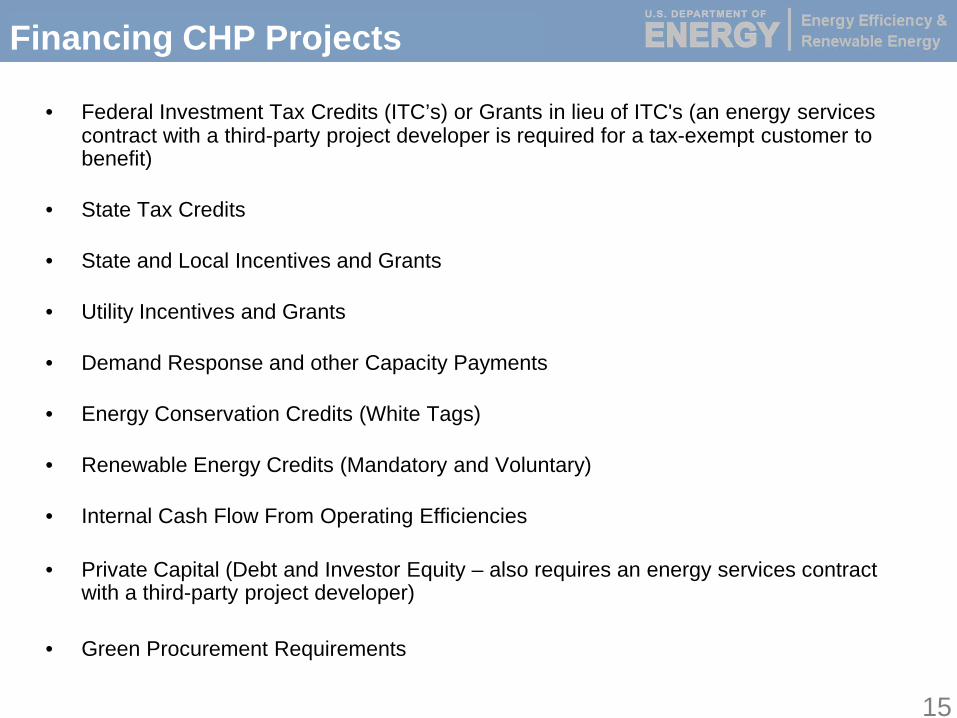
• Federal Investment Tax Credits (ITC’s) or Grants in lieu of ITC's (an energy services contract with a third-party project developer is required for a tax-exempt customer to benefit)
• State Tax Credits
• State and Local Incentives and Grants
• Utility Incentives and Grants
• Demand Response and other Capacity Payments
• Energy Conservation Credits (White Tags)
• Renewable Energy Credits (Mandatory and Voluntary)
• Internal Cash Flow From Operating Efficiencies
• Private Capital (Debt and Investor Equity – also requires an energy services contract with a third-party project developer)
• Green Procurement Requirements
Financing CHP Projects
16
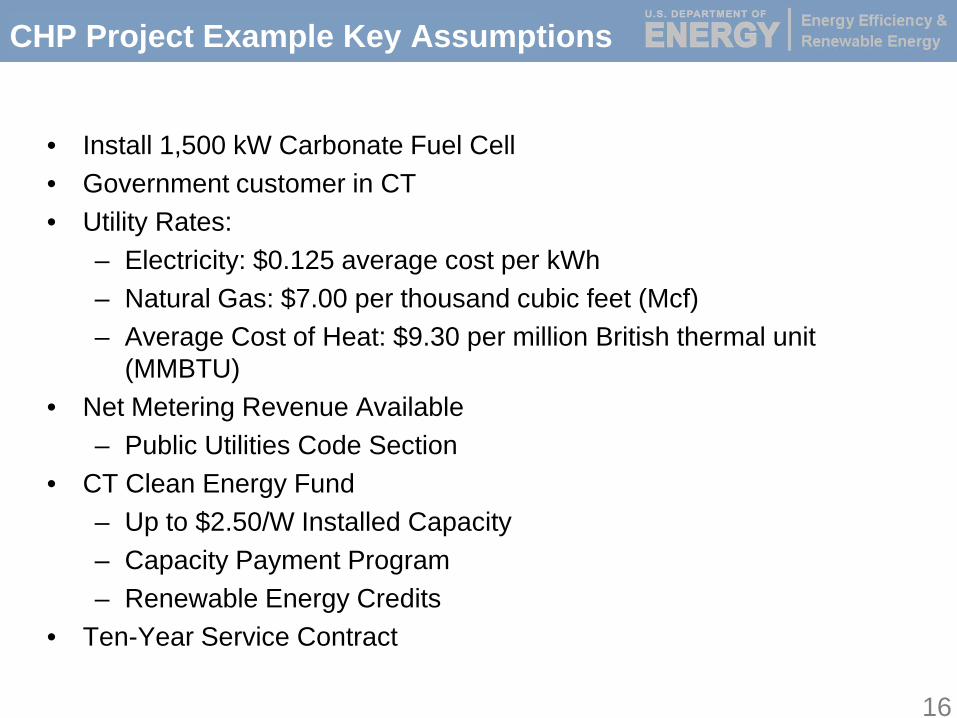
• Install 1,500 kW Carbonate Fuel Cell • Government customer in CT• Utility Rates:
– Electricity: $0.125 average cost per kWh– Natural Gas: $7.00 per thousand cubic feet (Mcf)– Average Cost of Heat: $9.30 per million British thermal unit
(MMBTU)• Net Metering Revenue Available
– Public Utilities Code Section• CT Clean Energy Fund
– Up to $2.50/W Installed Capacity– Capacity Payment Program– Renewable Energy Credits
• Ten-Year Service Contract
CHP Project Example Key Assumptions
17
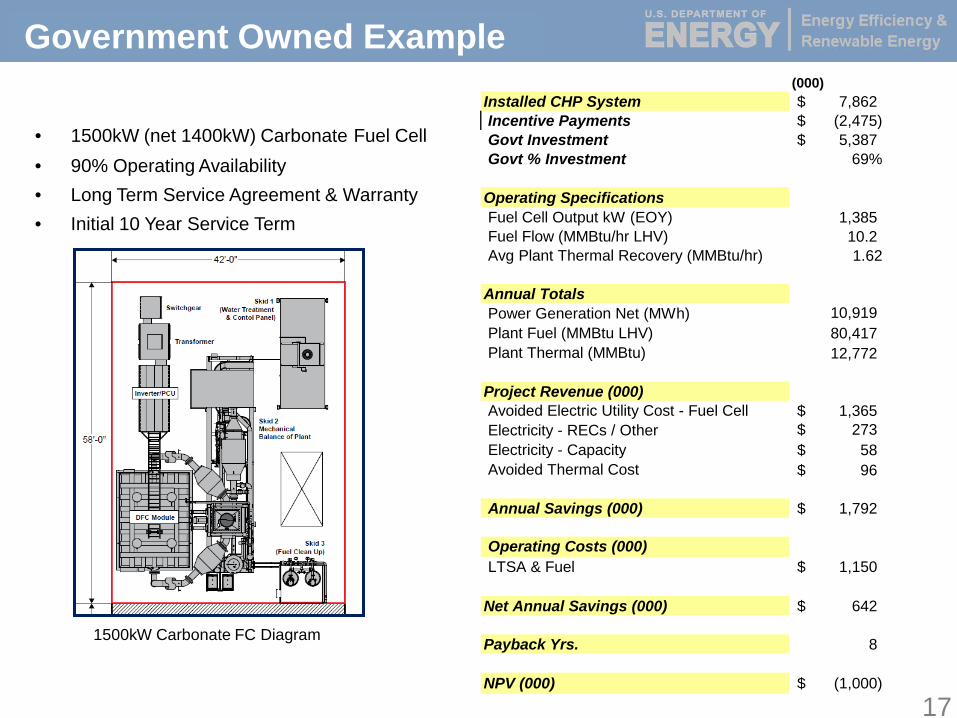
Government Owned Example
• 1500kW (net 1400kW) Carbonate Fuel Cell• 90% Operating Availability• Long Term Service Agreement & Warranty• Initial 10 Year Service Term
1500kW Carbonate FC Diagram
(000)Installed CHP System 7,862$ Incentive Payments (2,475)$ Govt Investment 5,387$ Govt % Investment 69%
Operating Specifications Fuel Cell Output kW (EOY) 1,385 Fuel Flow (MMBtu/hr LHV) 10.2 Avg Plant Thermal Recovery (MMBtu/hr) 1.62
Annual Totals Power Generation Net (MWh) 10,919 Plant Fuel (MMBtu LHV) 80,417 Plant Thermal (MMBtu) 12,772
Project Revenue (000) Avoided Electric Utility Cost - Fuel Cell 1,365$ Electricity - RECs / Other 273$ Electricity - Capacity 58$ Avoided Thermal Cost 96$
Annual Savings (000) 1,792$
Operating Costs (000) LTSA & Fuel 1,150$
Net Annual Savings (000) 642$
Payback Yrs. 8
NPV (000) (1,000)$
18
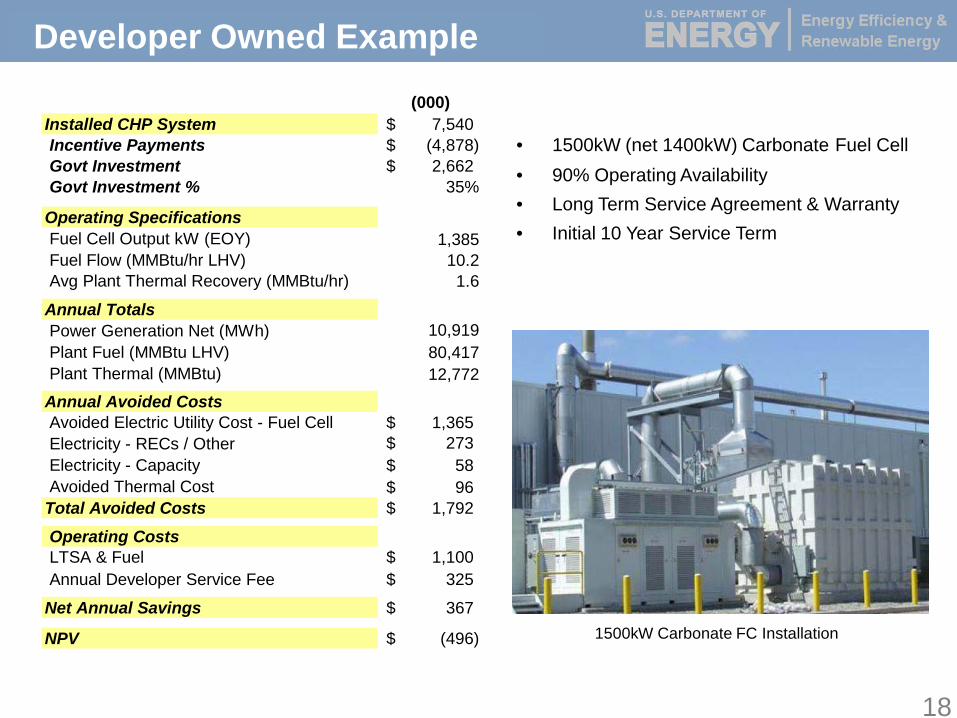
Developer Owned Example
• 1500kW (net 1400kW) Carbonate Fuel Cell• 90% Operating Availability• Long Term Service Agreement & Warranty• Initial 10 Year Service Term
1500kW Carbonate FC Installation
(000)Installed CHP System 7,540$ Incentive Payments (4,878)$ Govt Investment 2,662$ Govt Investment % 35%
Operating Specifications Fuel Cell Output kW (EOY) 1,385 Fuel Flow (MMBtu/hr LHV) 10.2 Avg Plant Thermal Recovery (MMBtu/hr) 1.6
Annual Totals Power Generation Net (MWh) 10,919 Plant Fuel (MMBtu LHV) 80,417 Plant Thermal (MMBtu) 12,772Annual Avoided Costs Avoided Electric Utility Cost - Fuel Cell 1,365$ Electricity - RECs / Other 273$ Electricity - Capacity 58$ Avoided Thermal Cost 96$ Total Avoided Costs 1,792$
Operating Costs LTSA & Fuel 1,100$ Annual Developer Service Fee 325$
Net Annual Savings 367$
NPV (496)$
19
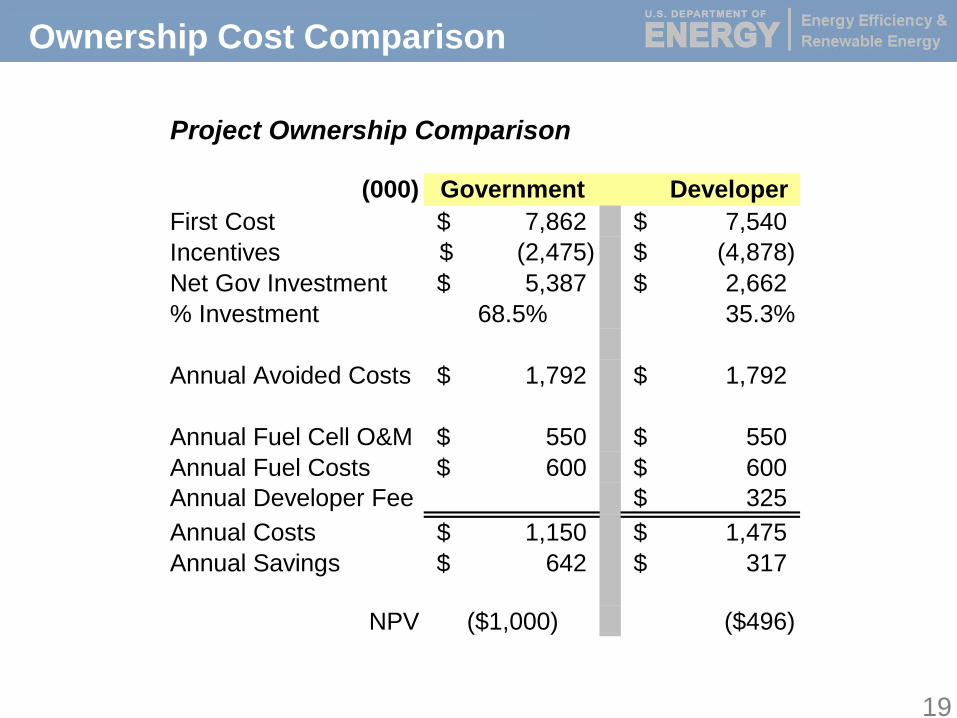
Ownership Cost Comparison
Project Ownership Comparison
(000) Government Developer First Cost 7,862$ 7,540$ Incentives (2,475)$ (4,878)$ Net Gov Investment 5,387$ 2,662$ % Investment 68.5% 35.3%
Annual Avoided Costs 1,792$ 1,792$
Annual Fuel Cell O&M 550$ 550$ Annual Fuel Costs 600$ 600$ Annual Developer Fee 325$ Annual Costs 1,150$ 1,475$ Annual Savings 642$ 317$
NPV ($1,000) ($496)
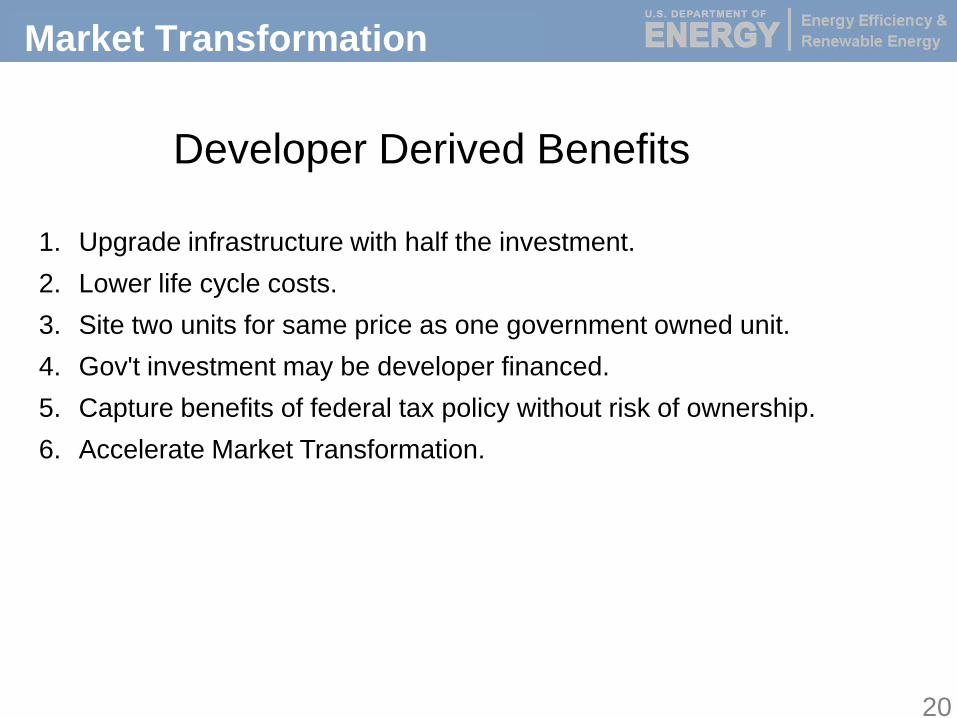
Market Transformation
Developer Derived Benefits
1. Upgrade infrastructure with half the investment.2. Lower life cycle costs. 3. Site two units for same price as one government owned unit.4. Gov't investment may be developer financed.5. Capture benefits of federal tax policy without risk of ownership.6. Accelerate Market Transformation.
20
21
3
2
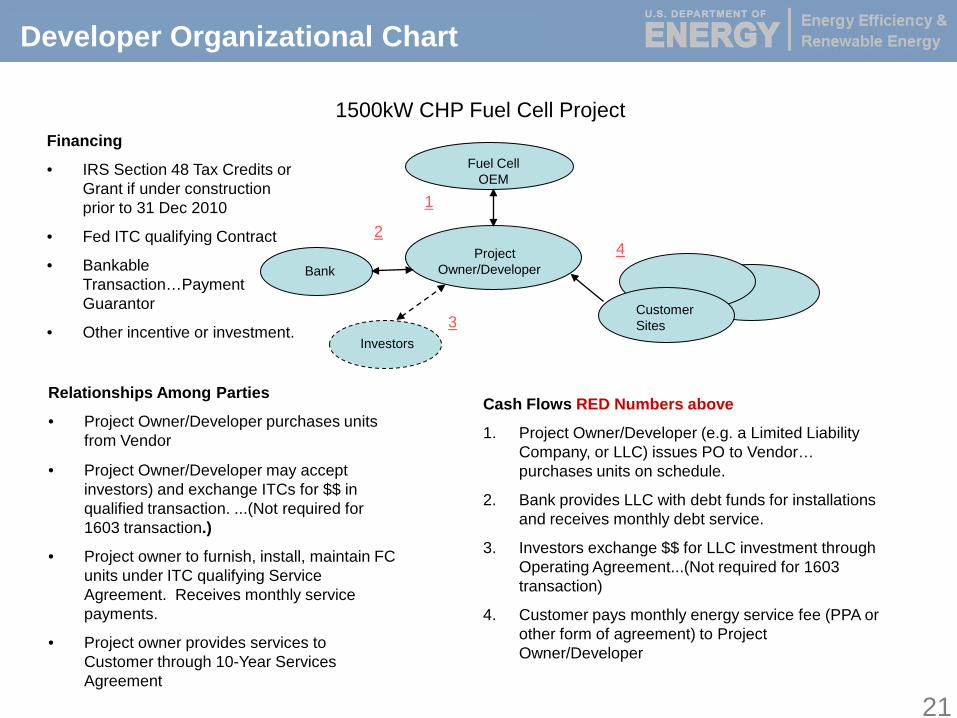
Relationships Among Parties
• Project Owner/Developer purchases units from Vendor
• Project Owner/Developer may accept investors) and exchange ITCs for $$ in qualified transaction. ...(Not required for 1603 transaction.)
• Project owner to furnish, install, maintain FC units under ITC qualifying Service Agreement. Receives monthly service payments.
• Project owner provides services to Customer through 10-Year Services Agreement
Cash Flows RED Numbers above
1. Project Owner/Developer (e.g. a Limited Liability Company, or LLC) issues PO to Vendor… purchases units on schedule.
2. Bank provides LLC with debt funds for installations and receives monthly debt service.
3. Investors exchange $$ for LLC investment through Operating Agreement...(Not required for 1603 transaction)
4. Customer pays monthly energy service fee (PPA or other form of agreement) to Project Owner/Developer
4
Financing
• IRS Section 48 Tax Credits or Grant if under construction prior to 31 Dec 2010
• Fed ITC qualifying Contract
• Bankable Transaction…Payment Guarantor
• Other incentive or investment.
1
Project Owner/Developer
Customer Sites
Fuel Cell OEM
Bank
Investors
1500kW CHP Fuel Cell Project
Developer Organizational Chart
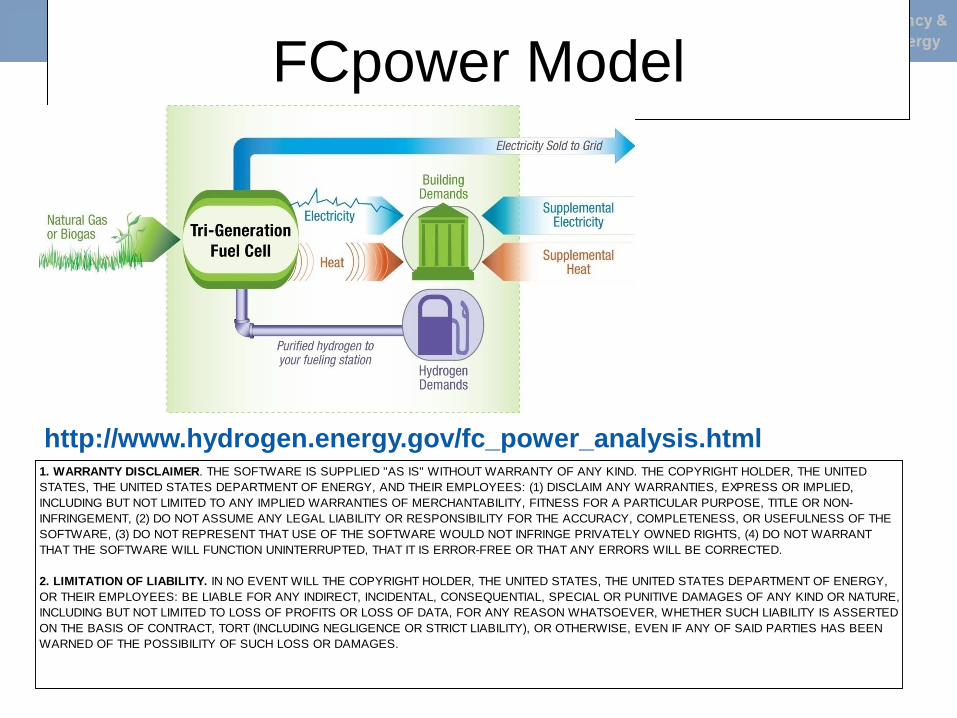
FCpower Model
1. WARRANTY DISCLAIMER. THE SOFTWARE IS SUPPLIED "AS IS" WITHOUT WARRANTY OF ANY KIND. THE COPYRIGHT HOLDER, THE UNITED STATES, THE UNITED STATES DEPARTMENT OF ENERGY, AND THEIR EMPLOYEES: (1) DISCLAIM ANY WARRANTIES, EXPRESS OR IMPLIED, INCLUDING BUT NOT LIMITED TO ANY IMPLIED WARRANTIES OF MERCHANTABILITY, FITNESS FOR A PARTICULAR PURPOSE, TITLE OR NON-INFRINGEMENT, (2) DO NOT ASSUME ANY LEGAL LIABILITY OR RESPONSIBILITY FOR THE ACCURACY, COMPLETENESS, OR USEFULNESS OF THE SOFTWARE, (3) DO NOT REPRESENT THAT USE OF THE SOFTWARE WOULD NOT INFRINGE PRIVATELY OWNED RIGHTS, (4) DO NOT WARRANT THAT THE SOFTWARE WILL FUNCTION UNINTERRUPTED, THAT IT IS ERROR-FREE OR THAT ANY ERRORS WILL BE CORRECTED.
2. LIMITATION OF LIABILITY. IN NO EVENT WILL THE COPYRIGHT HOLDER, THE UNITED STATES, THE UNITED STATES DEPARTMENT OF ENERGY, OR THEIR EMPLOYEES: BE LIABLE FOR ANY INDIRECT, INCIDENTAL, CONSEQUENTIAL, SPECIAL OR PUNITIVE DAMAGES OF ANY KIND OR NATURE, INCLUDING BUT NOT LIMITED TO LOSS OF PROFITS OR LOSS OF DATA, FOR ANY REASON WHATSOEVER, WHETHER SUCH LIABILITY IS ASSERTED ON THE BASIS OF CONTRACT, TORT (INCLUDING NEGLIGENCE OR STRICT LIABILITY), OR OTHERWISE, EVEN IF ANY OF SAID PARTIES HAS BEEN WARNED OF THE POSSIBILITY OF SUCH LOSS OR DAMAGES.
http://www.hydrogen.energy.gov/fc_power_analysis.html
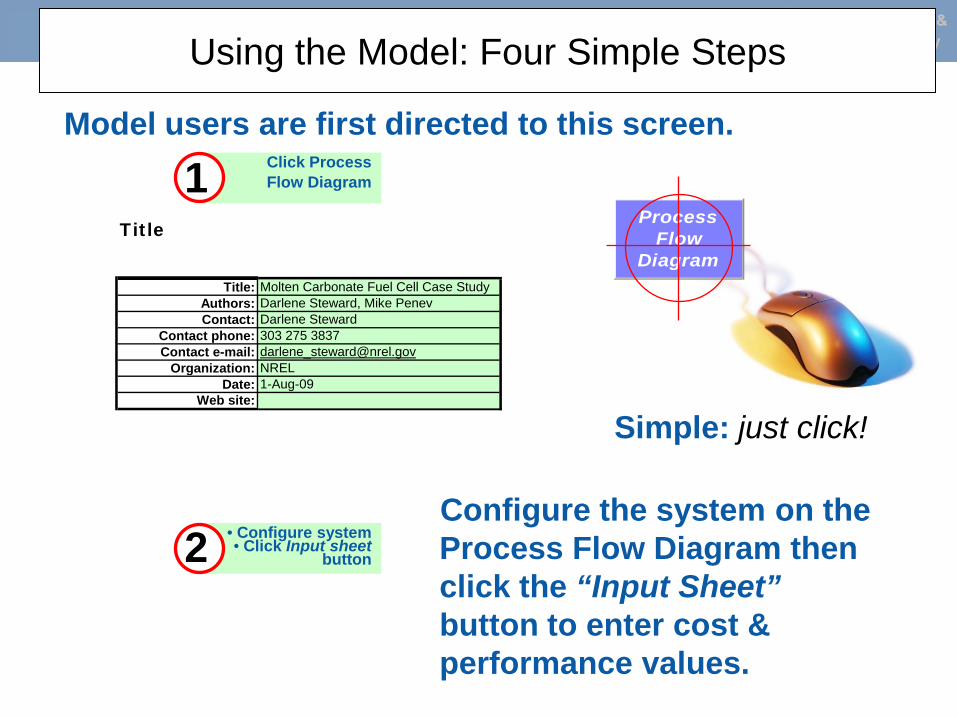
Using the Model: Four Simple Steps
Simple: just click!
Title
Title: Molten Carbonate Fuel Cell Case StudyAuthors: Darlene Steward, Mike PenevContact: Darlene Steward
Contact phone: 303 275 3837Contact e-mail: [email protected]
Organization: NRELDate: 1-Aug-09
Web site:
Process Flow
Diagram
Click Process Flow Diagram1
Model users are first directed to this screen.
• Configure system • Click Input sheet
button2Configure the system on the Process Flow Diagram then click the “Input Sheet” button to enter cost & performance values.
Using the Model: Four Simple Stepstle
Table of Contents
View and edit project information
Cell color coding key
Technical Operating Parameters and Specifications
Financial Input Values
Capital Costs
Fixed Operating Costs
Technical Operating Parameters and Specifications
Building typelarge_hotel_ca_los_angeles
Building locationLOS_ANGELES,CATotal yearly electricity load (kWh/year)367,920Total yearly heat load (kWh/year)367,920Total yearly hydrogen demand (kg/year)0
Financial Input Valuesef_Reference year2005tartAssumed startup year2010ons
tLength of construction period (years)1
erct
% of capital spent in 1st year of construction100%erc
t% of capital spent in 2nd year of construction% of capital spent in 3rd year of construction0%% of capital spent in 4th year of construction0%
tartti
Startup time (years)0.038lantlif
Plant life (years)20nalAnalysis period (years)20quit% equity financing (%)100%ebtit
Interest rate on debt, if applicable (%)ebtDebt period (years)erct_fied
% of fixed operating costs during startup (%)100%
erct
% of revenues during startup (%)40%erct
% of variable operating costs during startup (%)50%ecDecommissioning costs (% of initial capital investment)10%alvSalvage value (% of initial capital investment)10%nflatInflation rate (%)1.9%eali
After-tax real IRR (%)10.0%tat
tState taxes (%)6.0%
ed_Federal taxes (%)35.0%Stot
ltTotal tax rate (%)38.90%
Wori
Working capital (% of yearly change in operating costs)15%
Capital Costs
Direct capital costs (enter costs on equipment sheet)
High-temperature fuel cell and/or reformer process direct capital cost ($)$2,339,362
Electrolyzer direct capital cost ($)
Hydrogen fuel cell direct capital cost ($)
Molten Carbonate Fuel Cell Power Model v1.0
Calculate energy cost with existing hourly energy profile
You must specify equipment size, operating parameters, and system costs for each new piece of equipment. Click the button labeled "Enter Values."
Molten carbonate fuel cell combined heat, hydrogen, and power installation for a large hotel in Los Angeles
Variable Operating Costs - Energy Feedstocks, Utilities, and Byproducts
Notes
It is assumed that some product is lost during startup operations.
Assume full labor, permitting, and fees as well as costs for equipment startup equivalent to assumed plant yearly maintenance.
Notes
Variable Operating Costs - Other Materials and Byproducts
Variable Operating Costs - Other Variable Operating Costs
Notes
System life would range from 20 to 30 years. Default value is derived from the H2A Production Model forecourt cases.
Use default values
Import and export data and perform analyses
Run hourly energy calculations and calculate cost
To import load profiles for a new location, click the "Toolkit" button and follow the directions for importing new load profiles
Toolkit
Default
Default
Default
Default
Default
Default
Default
Default
Default
Calculate Cost
Go to Detail Sheet
View Description
Default
Default
Key
Project InfoUse Default
Values
Not Selected Not Selected
Not Selected Not Selected
Run Hourly Energy Profile
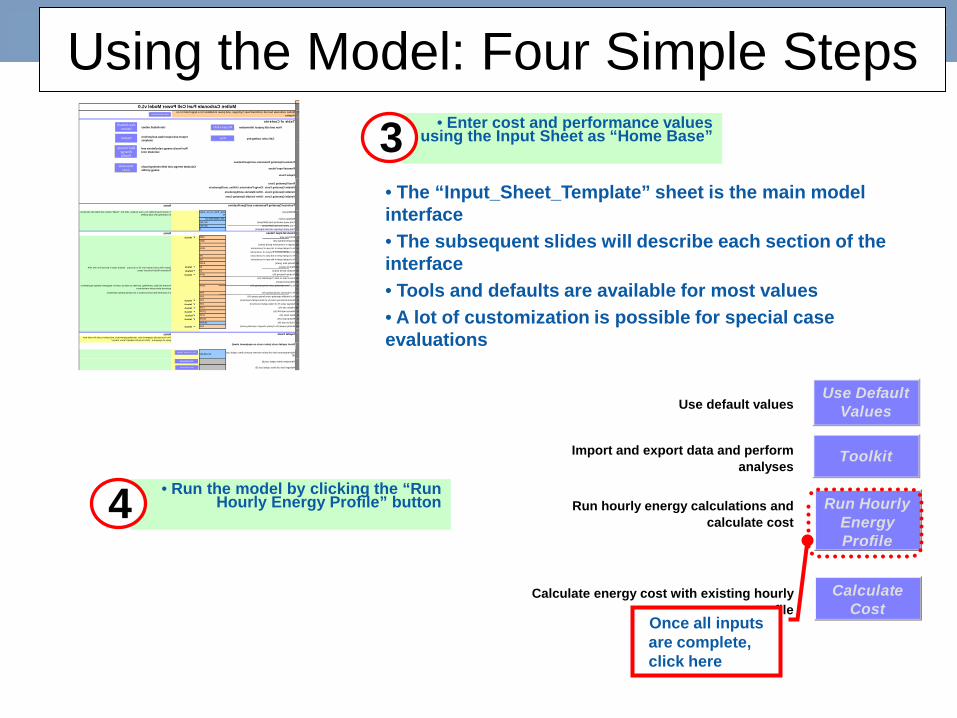
• The “Input_Sheet_Template” sheet is the main model interface• The subsequent slides will describe each section of the interface• Tools and defaults are available for most values• A lot of customization is possible for special case evaluations
• Enter cost and performance values using the Input Sheet as “Home Base”3
• Run the model by clicking the “Run Hourly Energy Profile” button4
Calculate energy cost with existing hourly energy profile
Use default values
Import and export data and perform analyses
Run hourly energy calculations and calculate cost
Toolkit
Calculate Cost
Use Default
Values
Run Hourly Energy Profile
Once all inputs are complete, click here