Comparison Between Fuel Cell and Hydrogen Engine Fuel ... - Presentations/hydrogen... · Comparison...
15
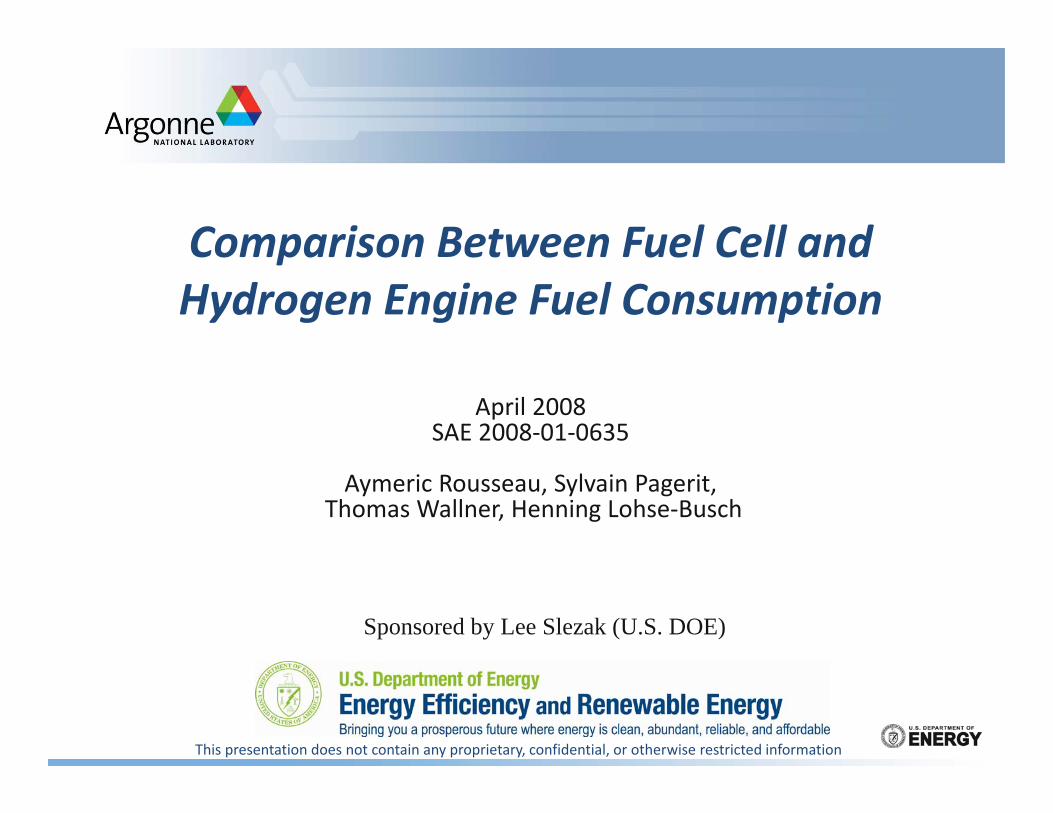
Comparison Between Fuel Cell and Comparison Between Fuel Cell and Hydrogen Engine Fuel Consumption April 2008 SAE 2008‐01‐0635 Aymeric Rousseau, Sylvain Pagerit, Thomas Wallner, Henning Lohse‐Busch Sponsored by Lee Slezak (U.S. DOE) This presentation does not contain any proprietary, confidential, or otherwise restricted information
Transcript of Comparison Between Fuel Cell and Hydrogen Engine Fuel ... - Presentations/hydrogen... · Comparison...
Comparison Between Fuel Cell andComparison Between Fuel Cell and Hydrogen Engine Fuel Consumption
April 2008SAE 2008‐01‐0635
Aymeric Rousseau, Sylvain Pagerit,Thomas Wallner, Henning Lohse‐Busch
Sponsored by Lee Slezak (U.S. DOE)
This presentation does not contain any proprietary, confidential, or otherwise restricted information
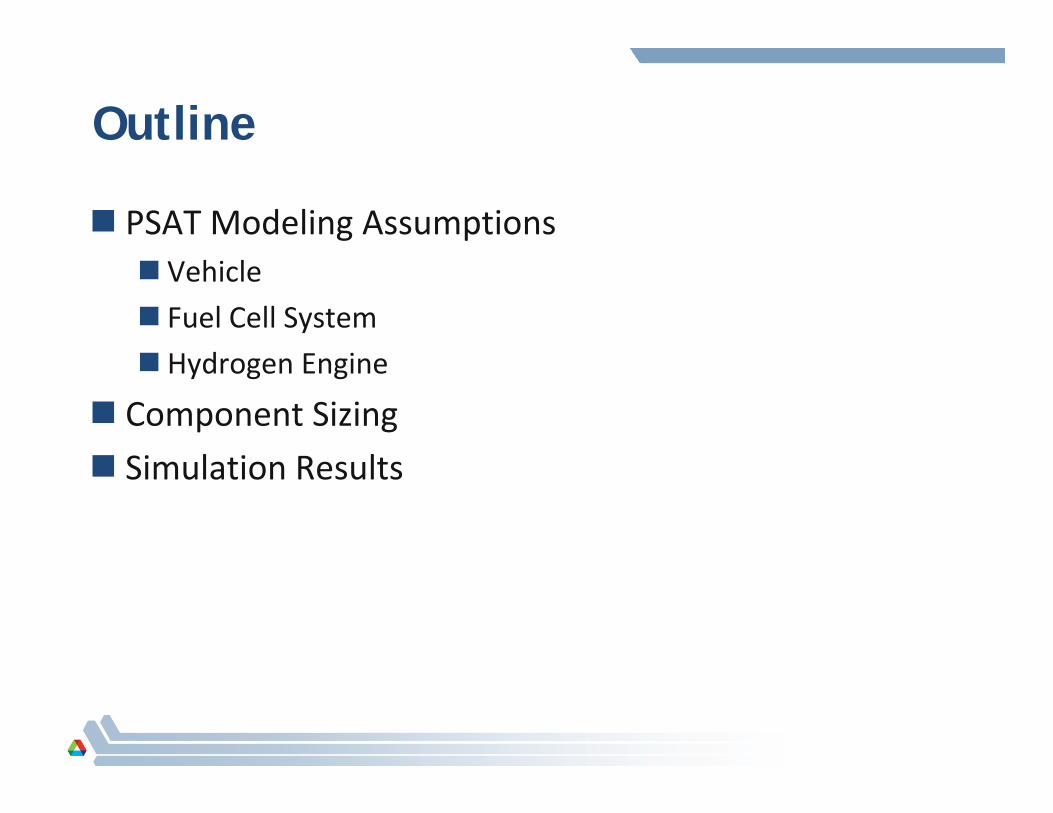
Outline
PSAT Modeling Assumptions Vehicle
Fuel Cell System
H d E i Hydrogen Engine
Component Sizing
Si l ti R lt Simulation Results
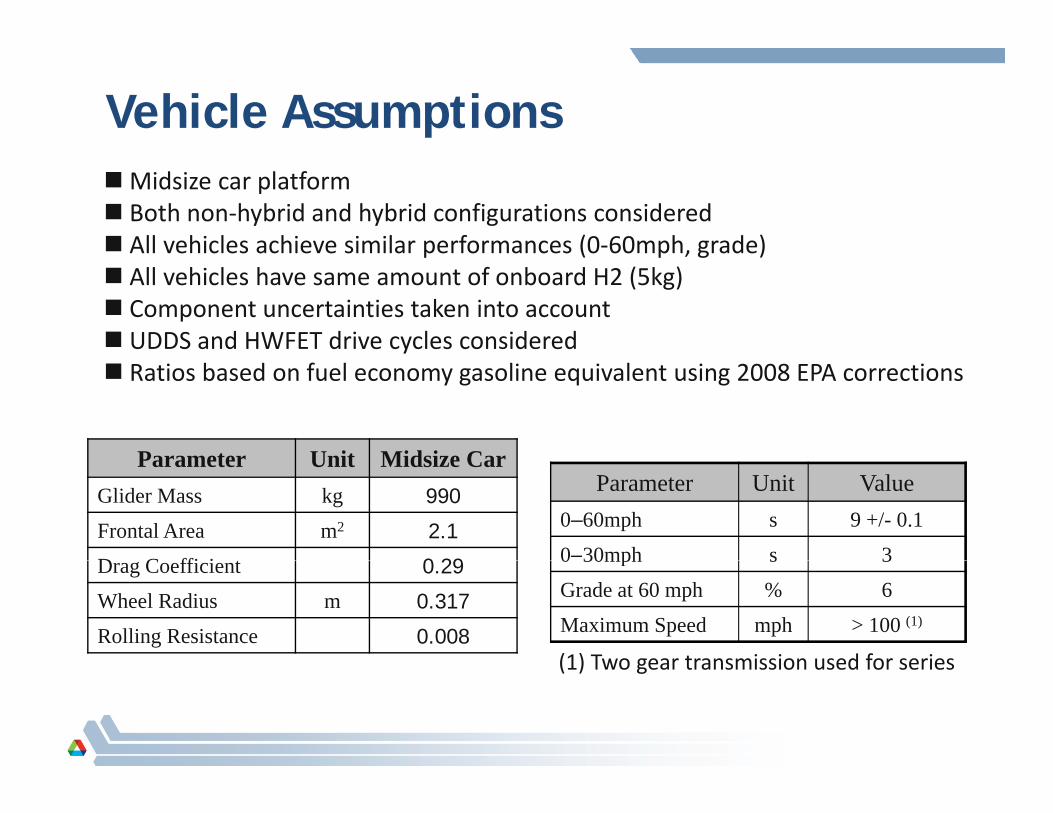
Vehicle AssumptionsMidsize car platform Both non‐hybrid and hybrid configurations considered All vehicles achieve similar performances (0‐60mph, grade)All vehicles achieve similar performances (0 60mph, grade) All vehicles have same amount of onboard H2 (5kg) Component uncertainties taken into account UDDS and HWFET drive cycles considered
Parameter Unit Midsize Car
Ratios based on fuel economy gasoline equivalent using 2008 EPA corrections
Parameter Unit Midsize CarGlider Mass kg 990
Frontal Area m2 2.1
D C ffi i t 0 29
Parameter Unit Value0–60mph s 9 +/- 0.1
0–30mph s 3Drag Coefficient 0.29
Wheel Radius m 0.317
Rolling Resistance 0.008
0 30mph s 3
Grade at 60 mph % 6
Maximum Speed mph > 100 (1)
(1) Two gear transmission used for series(1) Two gear transmission used for series
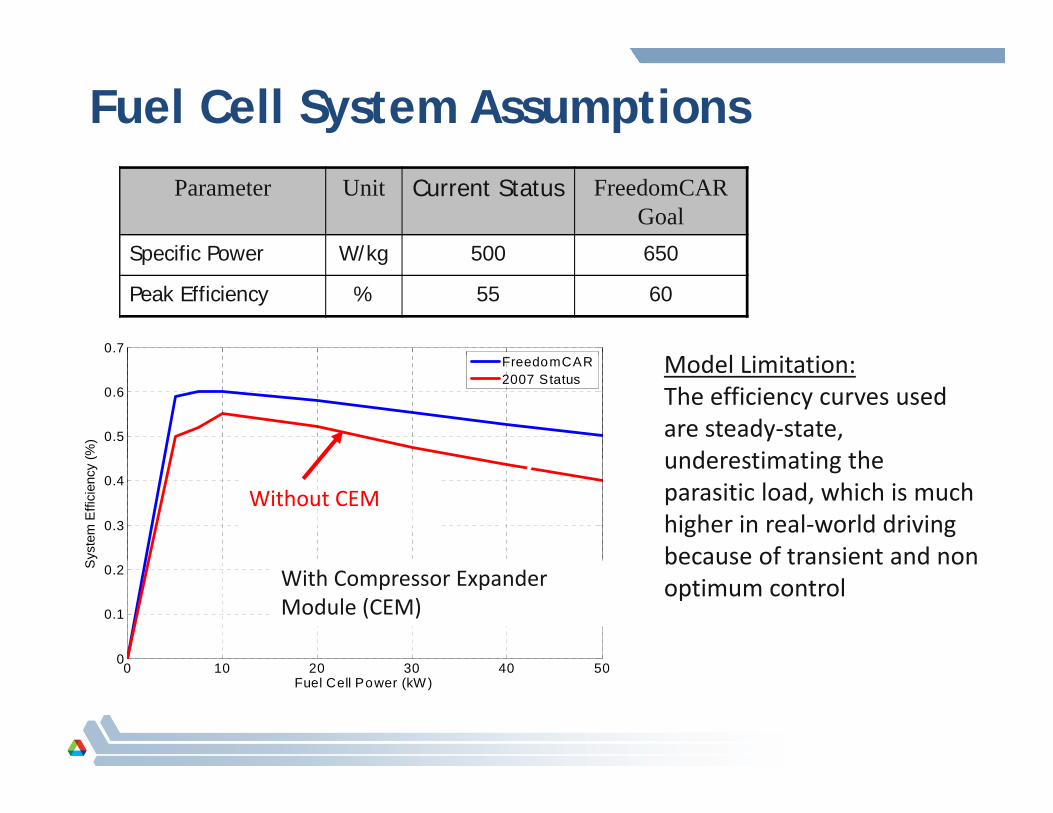
Fuel Cell System AssumptionsParameter Unit Current Status FreedomCAR
GoalSpecific Power W/kg 500 650
0.7
Specific Power W/kg 500 650
Peak Efficiency % 55 60
d l
0.5
0.6
(%)
FreedomCAR2007 Status
Model Limitation:The efficiency curves used are steady‐state, underestimating the
0.3
0.4
Sys
tem
Effi
cien
cy ( underestimating the
parasitic load, which is much higher in real‐world driving because of transient and non
Without CEM
0 10 20 30 0 00
0.1
0.2S
because of transient and non optimum controlWith Compressor Expander
Module (CEM)
0 10 20 30 40 500
Fuel Cell Power (kW)
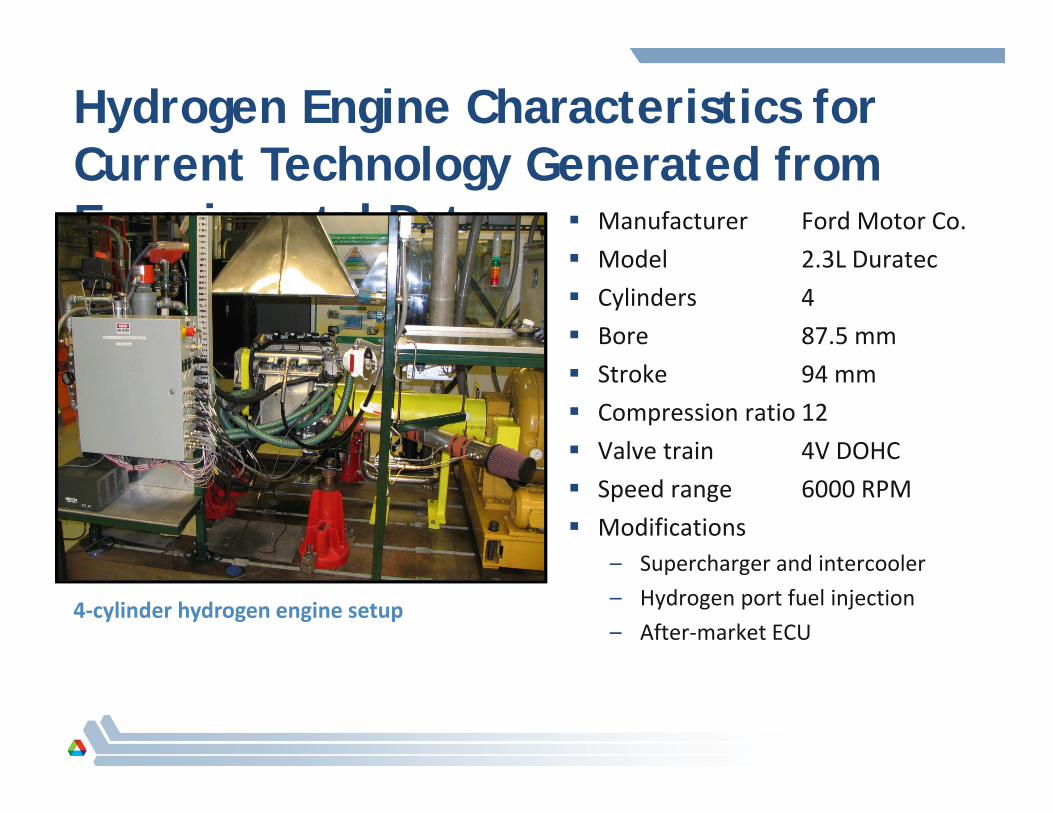
Hydrogen Engine Characteristics for C t T h l G t d f Current Technology Generated from Experimental Data Manufacturer Ford Motor Co.
M d l 2 3L D t Model 2.3L Duratec
Cylinders 4
Bore 87.5 mm
Stroke 94 mm
Compression ratio 12
Valve train 4V DOHCValve train 4V DOHC
Speed range 6000 RPM
ModificationsSupercharger and intercooler– Supercharger and intercooler
– Hydrogen port fuel injection
– After‐market ECU4‐cylinder hydrogen engine setup
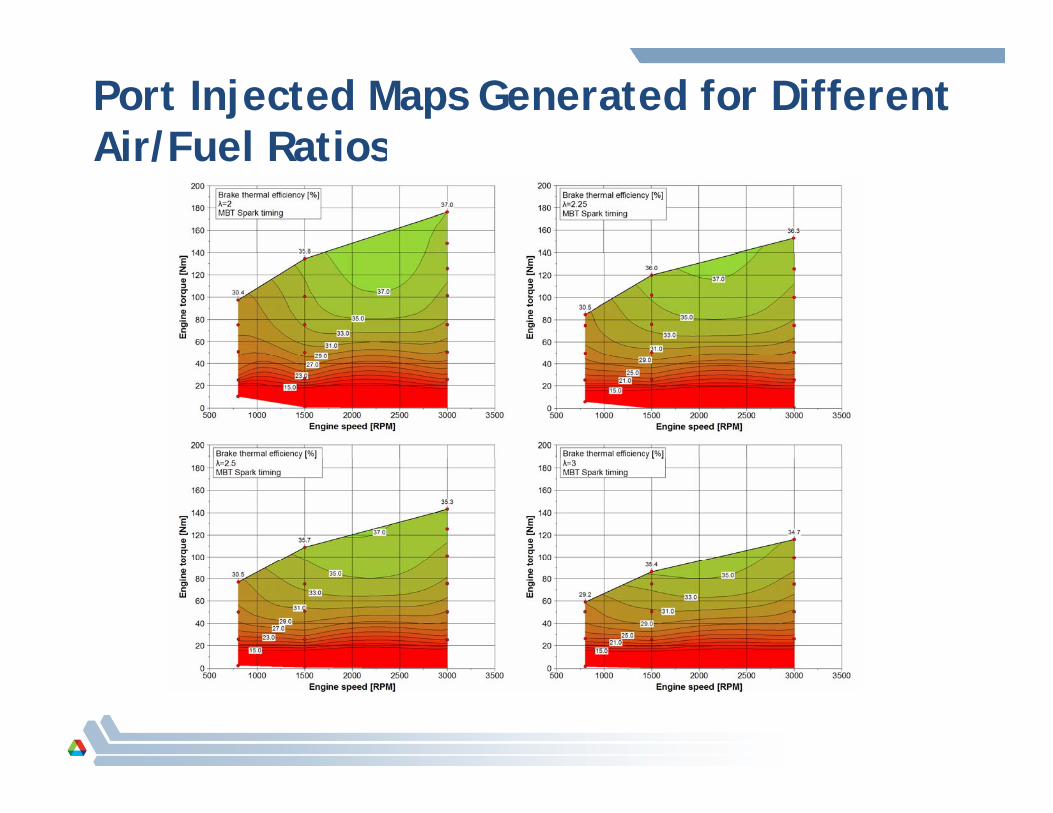
Port Injected Maps Generated for Different Air/Fuel RatiosAir/Fuel Ratios
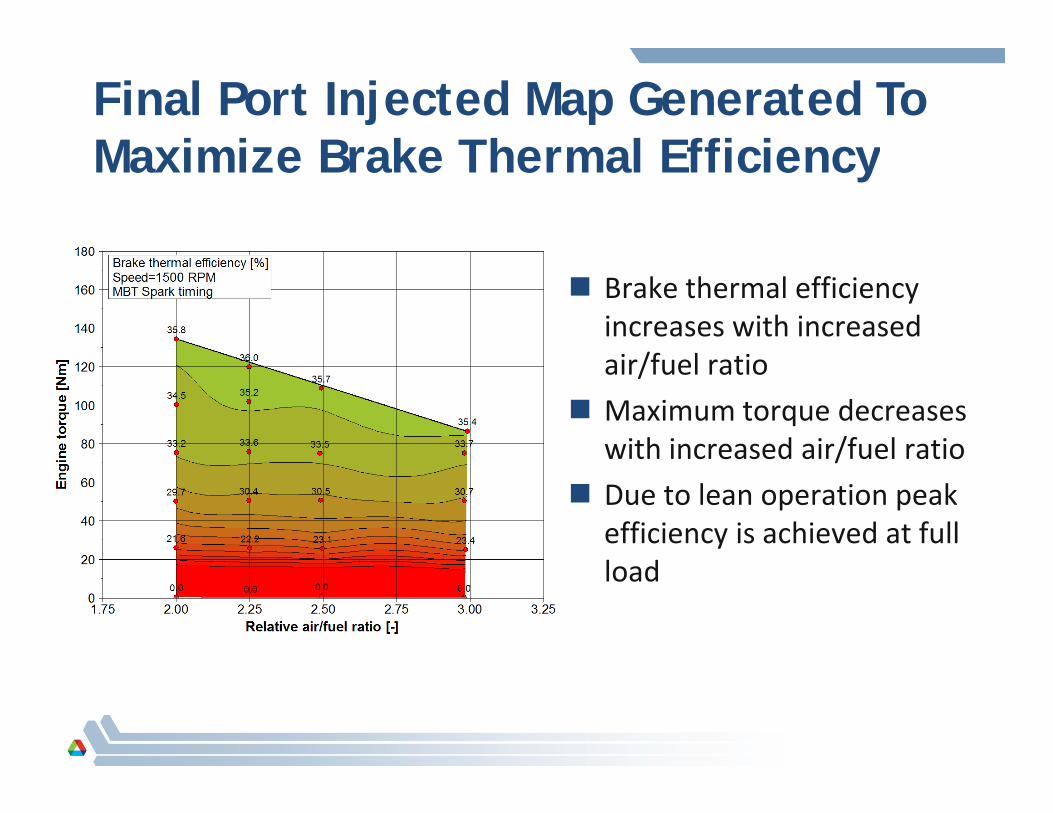
Final Port Injected Map Generated To Maximize Brake Thermal EfficiencyMaximize Brake Thermal Efficiency
Brake thermal efficiency increases with increased i /f l iair/fuel ratio
Maximum torque decreases with increased air/fuel ratiowith increased air/fuel ratio
Due to lean operation peak efficiency is achieved at full l dload
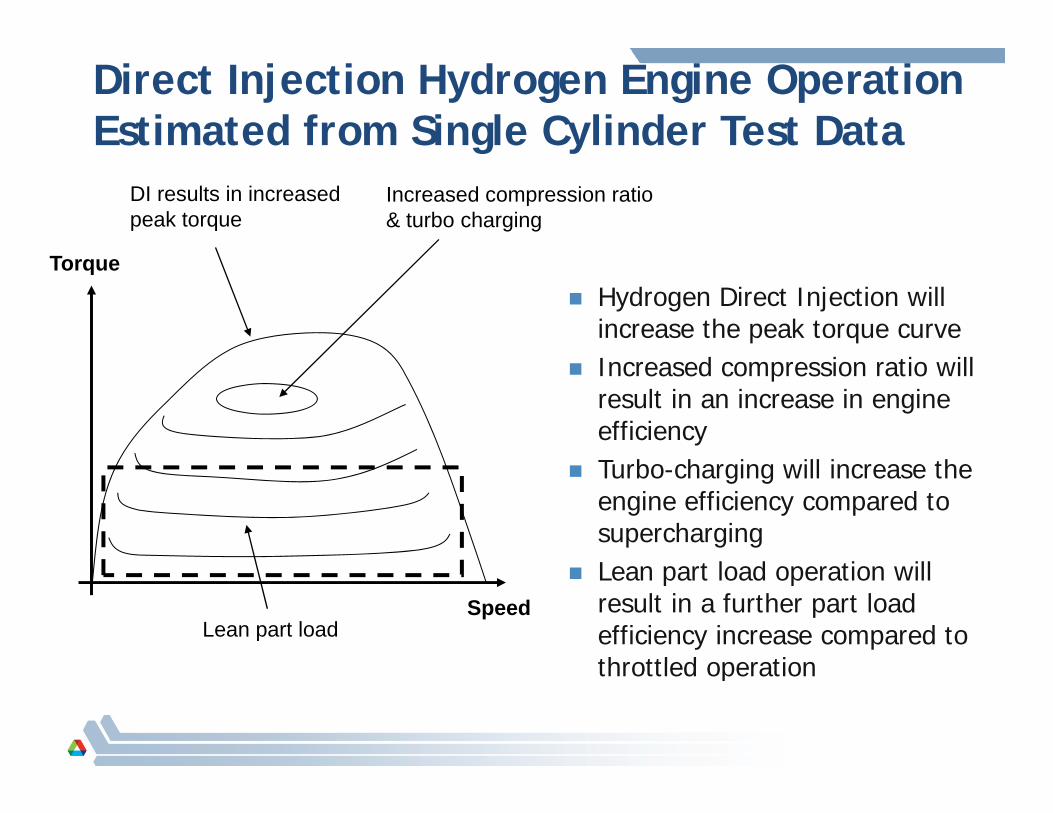
Direct Injection Hydrogen Engine OperationEstimated from Single Cylinder Test Datag y
DI results in increased peak torque
Increased compression ratio & turbo charging
Hydrogen Direct Injection will increase the peak torque curve
Torque
Increased compression ratio will result in an increase in engine efficiency
Turbo-charging will increase the engine efficiency compared to supercharging
l d ll Lean part load operation will result in a further part load efficiency increase compared to throttled operation
SpeedLean part load
throttled operation
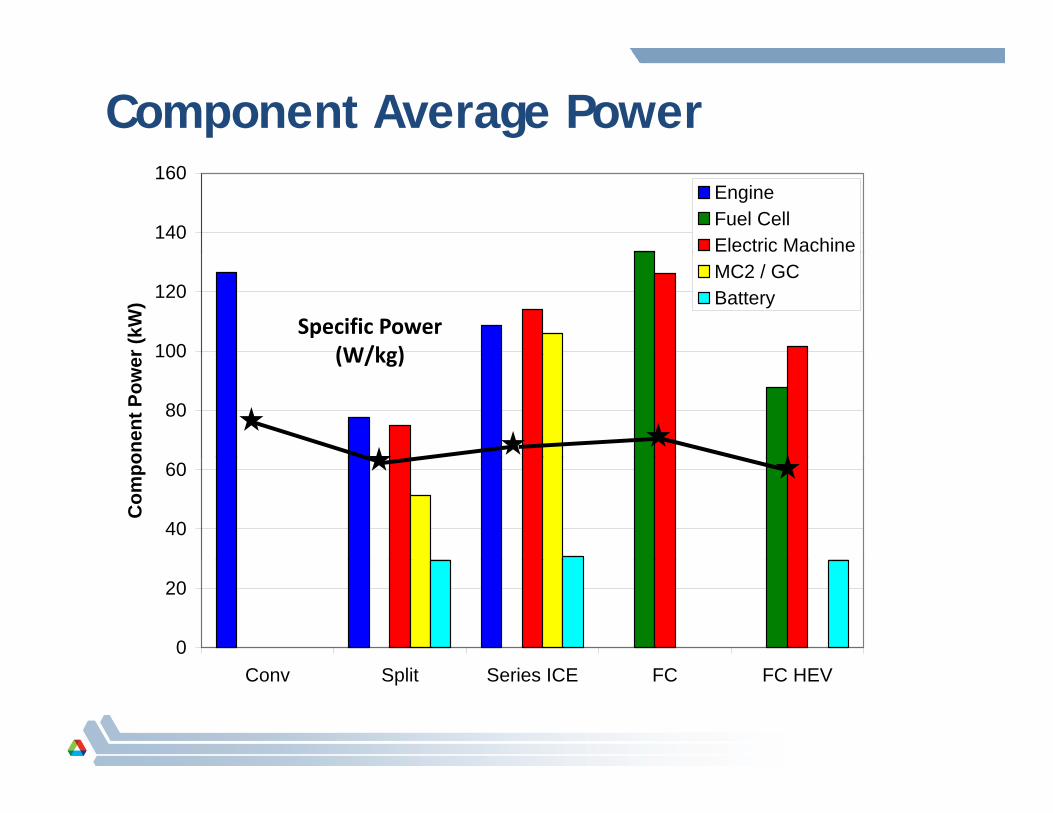
Component Average Power
140
160EngineFuel CellElectric Machine
100
120
r (kW
)
MC2 / GCBattery
Specific Power(W/kg)
80
100
onen
t Pow
er (W/kg)
40
60
Com
po
0
20
Conv Split Series ICE FC FC HEV
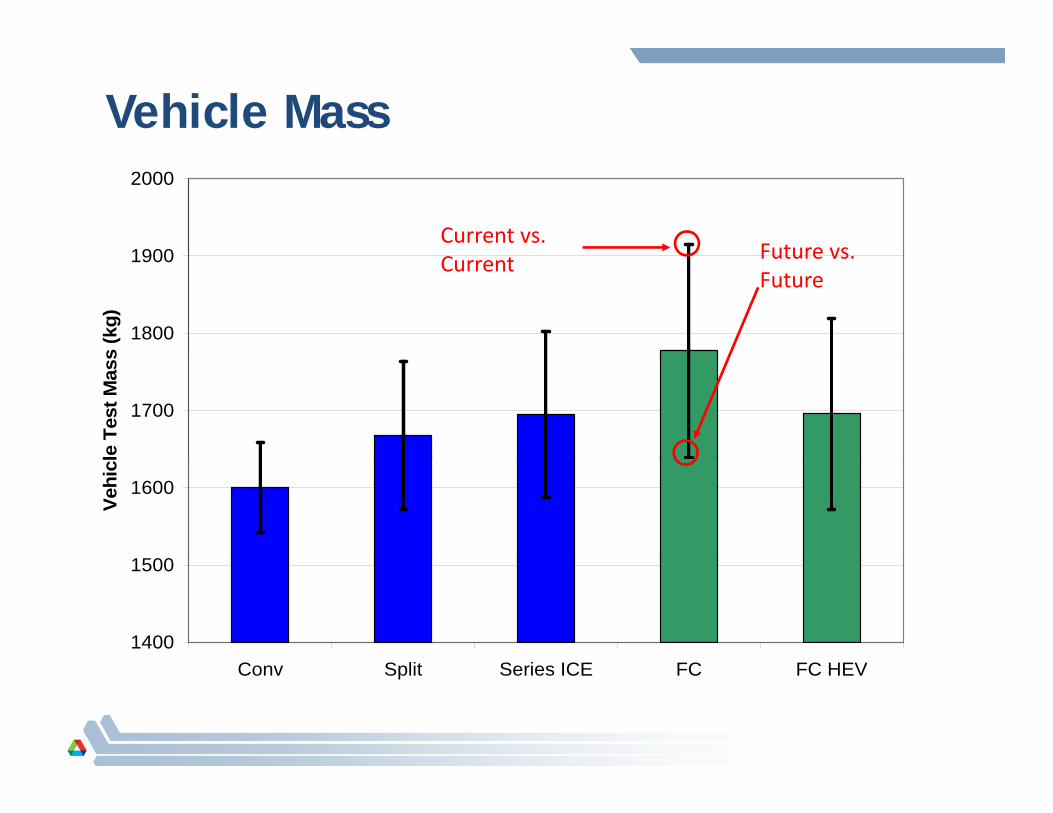
Vehicle Mass
1900
2000
Future vsCurrent vs.
1800
1900
s (k
g)
Future vs. Future
Current
1700
le T
est M
ass
1500
1600
Vehi
cl
1400
1500
C S lit S i ICE FC FC HEVConv Split Series ICE FC FC HEV
2 5
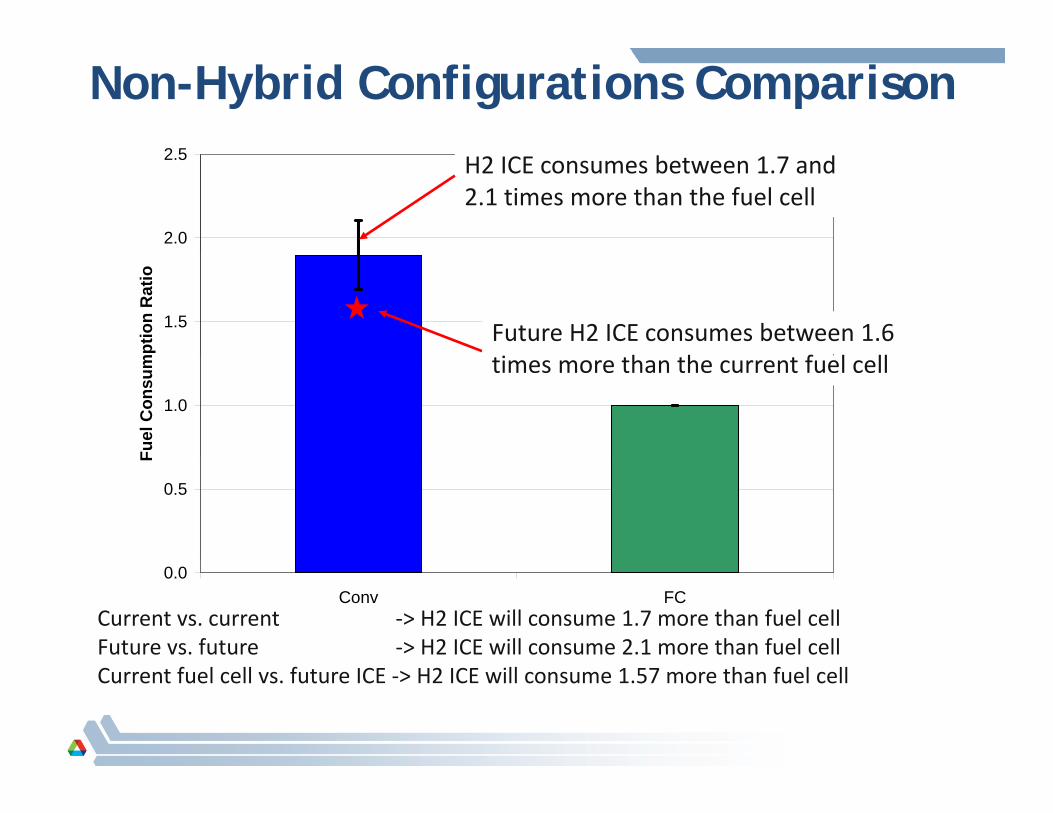
Non-Hybrid Configurations Comparison
2.0
2.5 H2 ICE consumes between 1.7 and 2.1 times more than the fuel cell
1.5
mpt
ion
Rat
io
Future H2 ICE consumes between 1.6 h h f l ll
1.0
Fuel
Con
sum times more than the current fuel cell
0.5
F
0.0Conv FC
Current vs. current ‐> H2 ICE will consume 1.7 more than fuel cellFuture vs. future ‐> H2 ICE will consume 2.1 more than fuel cellCurrent fuel cell vs. future ICE ‐> H2 ICE will consume 1.57 more than fuel cell
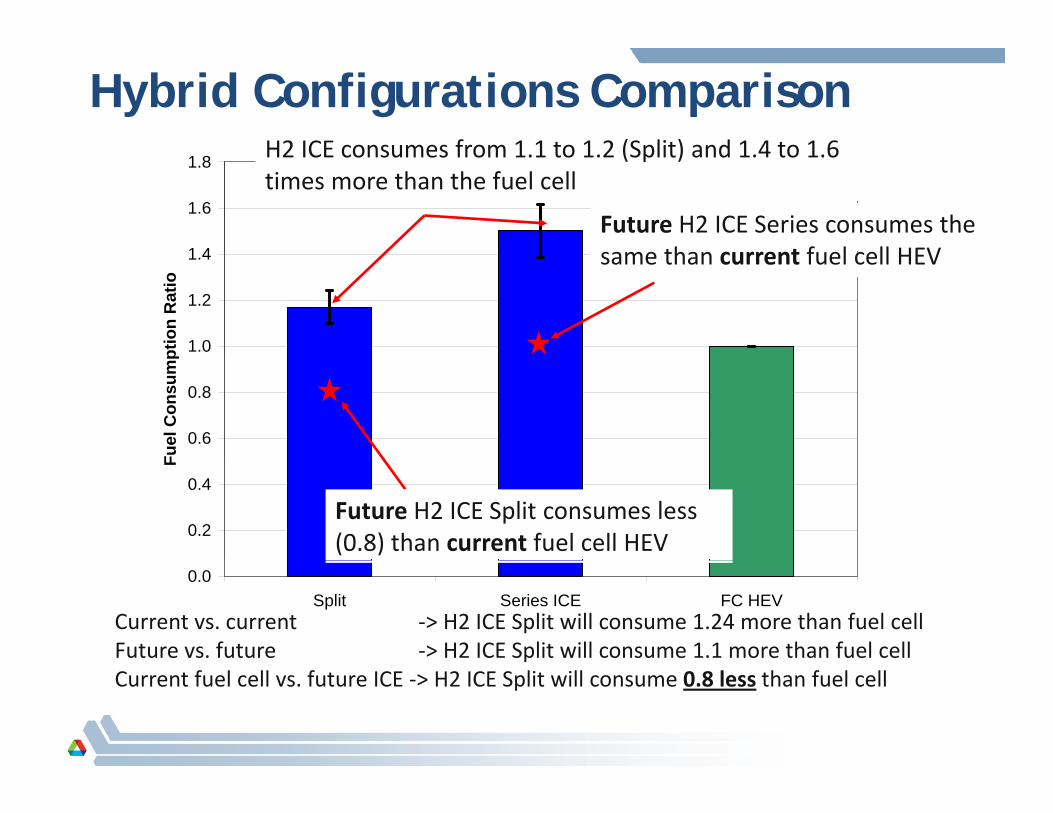
Hybrid Configurations ComparisonH2 ICE consumes from 1 1 to 1 2 (Split) and 1 4 to 1 6
1 4
1.6
1.8 H2 ICE consumes from 1.1 to 1.2 (Split) and 1.4 to 1.6 times more than the fuel cell
Future H2 ICE Series consumes the same than current fuel cell HEV
1.0
1.2
1.4
ptio
n R
atio
same than current fuel cell HEV
0.6
0.8
Fuel
Con
sum
p
0.2
0.4
F
Future H2 ICE Split consumes less (0.8) than current fuel cell HEV
0.0Split Series ICE FC HEV
Current vs. current ‐> H2 ICE Split will consume 1.24 more than fuel cellFuture vs. future ‐> H2 ICE Split will consume 1.1 more than fuel cellCurrent fuel cell vs. future ICE ‐> H2 ICE Split will consume 0.8 less than fuel cell
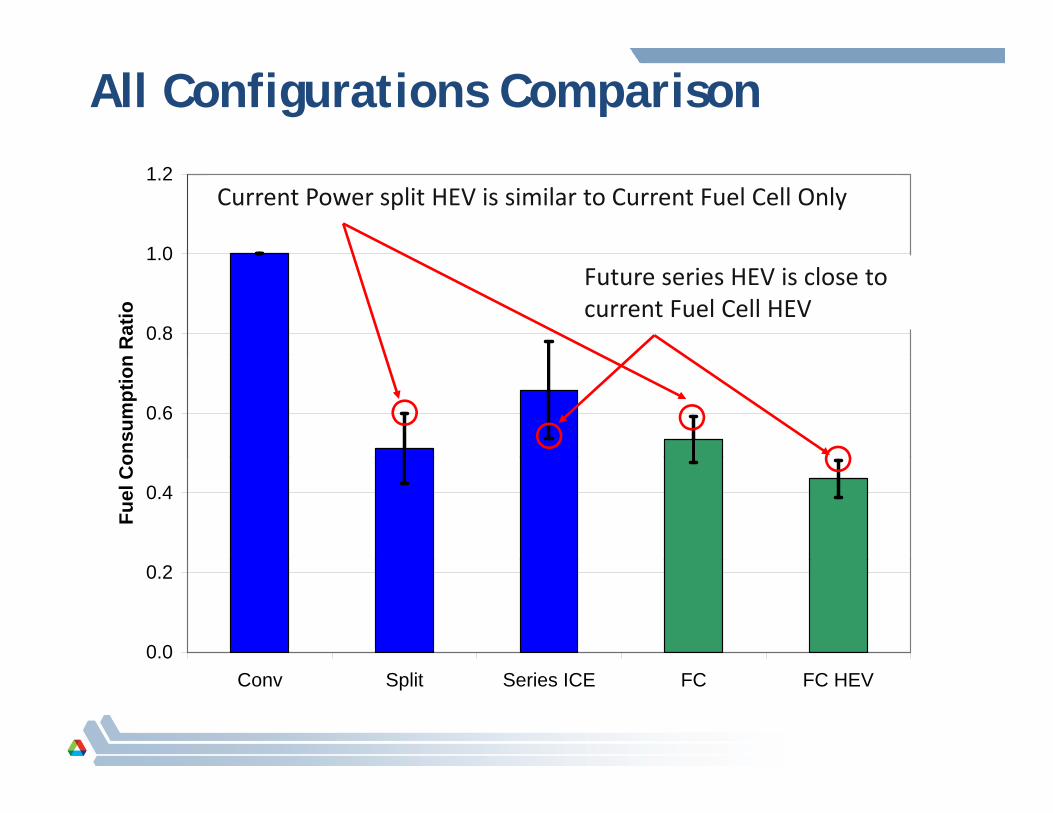
All Configurations Comparison
1 0
1.2Current Power split HEV is similar to Current Fuel Cell Only
0.8
1.0
Rat
io
Future series HEV is close to current Fuel Cell HEV
0.6
onsu
mpt
ion
0.4
Fuel
Co
0.0
0.2
Conv Split Series ICE FC FC HEV
Fuel Economy Results Analysis All HEVs configuration capture similar amount of energy at the
wheel during deceleration (~98% on UDDS). However, the series fi ti h l d t l l t i hiconfigurations have more losses due to lower electric machine
efficiencies than the power split.
Both HEV configurations using ICE have similar average efficiencies g g g(~31% for port injected and ~41.5% for direct injection on UDDS).
The fuel cell system average efficiency remains higher (~47% for d 51% f f UDDS)current case and ~51% for future case on UDDS).
In addition, the series configuration with H2‐ICE is penalized by the driveline inefficiencies (both generator ~90% and electric machinedriveline inefficiencies (both generator 90% and electric machine ~81%)
Conclusion
The DI H2‐ICE has been defined based on a combination of four‐cylinder and single cylinder data generated for different A/F ratios.
H2 ICE t i h ld b h b idi d t b titi ith f l ll H2‐ICE powertrain should be hybridized to be competitive with fuel cell systems vehicle fuel consumption.
Power split configuration offers the best fuel consumption when using H2‐ICE due to added inefficiencies in the series configuration.
If one considers that the current fuel cell system efficiencies will remain constant in the future (most research is focused on cost and durability),constant in the future (most research is focused on cost and durability), DI H2‐ICE could provide an interesting option (up to 20% reduction in fuel consumption).
If one considers both future technologies within an HEV a 10 to 40% If one considers both future technologies within an HEV, a 10 to 40% increase in fuel consumption is noticed when using H2‐ICE.