
SHELL HYDROGEN STUDY ENERGY OF THE FUTURE? · and fuel cell technology, Uwe Schabla, regarding...
37
SHELL HYDROGEN STUDY ENERGY OF THE FUTURE? Sustainable Mobility through Fuel Cells and H 2
Transcript of SHELL HYDROGEN STUDY ENERGY OF THE FUTURE? · and fuel cell technology, Uwe Schabla, regarding...

SHELL HYDROGEN STUDY
ENERGY OF THE FUTURE?Sustainable Mobility through Fuel Cells and H2

1
THE ELEMENT HYDROGEN
2
SUPPLY PATHWAYS
6
11
3STORAGE & TRANSPORTATION20
4
APPLICATIONS 28
INTRODUCTION 4
5
STATIONARY ENERGY APPLICATIONS 356
MOBILITY APPLICATIONS 38
7
VEHICLE OWNERSHIP COSTS 47
8
REFUELLING STATION INFRASTRUCTURE 51
9
ENERGY & ENVIRONMENTAL BALANCES SCENARIOS FOR FUEL CELL VEHICLES 57
SUMMARY 62
+ –
SHELL HYDROGEN STUDY
ENERGY OF THE FUTURE?Sustainable Mobility through Fuel Cells and H2
SHELL
Dr. Jörg Adolf (Project Lead)
Dr. Christoph H. Balzer
Dr. Jurgen Louis
Dipl.-Ing. Uwe Schabla
www.shell.de
WUPPERTAL INSTITUT
Prof. Dr. Manfred Fischedick (Supervision)
Dr. Karin Arnold (Project Coordination)
Dipl.-Soz.Wiss. Andreas Pastowski
Dipl.-Ing. Dietmar Schüwer
www.wupperinst.org
PUBLISHED BY
Shell Deutschland Oil GmbH22284 Hamburg
Design & Production: Mänz Kommunikation

develops models, strategies and instruments for transitions to sustainable development. Its work centres on the way in which challenges in terms of resources, climate and energy influence and are influenced by the economy and society. The “Future Energy and Mobility Structures” research group, which was involved in the study, is concerned in particular with the transition to sustainable structures from a technical /structural and systems analytical point of view.
The project leader and coordinator of the Shell Hydrogen Study on behalf of Shell was Dr. Jörg Adolf. The scientific coordina-tor on behalf of the Wuppertal Institute was Dr. Karin Arnold. She was supported by Andreas Pastowski and Dietmar Schüwer. The work was carried out under the scientific supervision of Professor Manfred Fischedick.
The following authors at Shell also con-tributed to the scientific preparation of the study: Dr. Jurgen Louis, regarding technical and scientific questions about hydrogen and fuel cell technology, Uwe Schabla, regarding stationary fuel cell applications, and Dr. Christoph H. Balzer, regarding the preparation of energy and greenhouse gas balances and scenario techniques.
In addition, many other experts, decision makers and stakeholders from science, busi-ness and politics were consulted during the preparation of the Shell Hydrogen Study. Shell would like to take this opportunity to thank all concerned for their contribution and cooperation. A selection of relevant data and sources can be found at the end of the study.
What are the main conversion methods involved in using hydrogen for energy purposes? Alongside the mobility applica-tions for hydrogen technology, are there any stationary applications for hydrogen as a source of energy?
The focus of this study is the issue of sustainable mobility through fuel cells and hydrogen (H2). When we think of hydrogen and mobility, fuel cell electric vehicles, in particular passenger cars, are what come to mind. But hydrogen and fuel cells can be used by other means of transport too. Therefore, the aim of this study is to give an overview of the technical state of and prospects for hydrogen and fuel cell technology in all transport sectors, including non-road means of transport.
After assessing the technological maturity of motor vehicles and passenger cars in particular, we look at the costs and cost- effectiveness of hydrogen mobility as an important decision-making criterion, as well as the development of a hydrogen supply infrastructure. Finally, since hydrogen- powered vehicles are only viable if they can be operated more sustainably than today’s vehicles, we use scenario techniques to estimate and assess possible energy and environmental balances for future fuel cell passenger car fleets.
AUTHORS AND SOURCESShell worked closely with the German research institute and think-tank Wuppertal Institute to produce the Shell Hydrogen Study. Back in 2007 the Wuppertal Insti-tute examined and evaluated the concept of “geological CO2 storage” as a possible climate policy action for Shell (WI 2007). The Wuppertal Institute researches and
as part of a compound. If hydrogen is to be used as an energy source in a future hydrogen energy economy, then first of all its origin needs to be clarified: Where does hydrogen occur? From which materials and how can it be produced, and using what technical processes? If a future energy economy is to be sustainable, the way in which it is generated is key. So what are the advantages and disadvantages of the various hydrogen supply pathways?
Highly developed energy systems rely increasingly on electricity as a secondary energy source. Electricity has many advantages as an energy source, but some disadvantages too: it can generally only be directly stored in small amounts and for short periods of time, and its transportation is mostly grid-based. Chemical energy storage via hydrogen could represent an alternative or an important supplement to existing energy stores. If hydrogen is to play a part in the energy system of the future, the possibilities for storing and trans-porting hydrogen need to be analysed.
In the past, debate about the use of hydro-gen has centred above all on automobility. But hydrogen usage cannot be and is not limited to transport applications. In new technologies there are often synergies between different applications, and these need to be taken into account when looking at learning curves and economies of scale of (new) technologies. And when it comes to the use of scarce resources (like energy and fuels), competing uses need to be considered. This raises the following question: What (other) fundamental application areas – as a material and an energy source – are there for hydrogen? And, with regard to energy applications:
Over the years Shell has produced a number of scenario studies on key energy issues. These have included studies on important energy consumption sectors such as passenger cars and commercial vehicles (lorries and buses) and the supply of energy and heat to private households, as well as studies on the state of and prospects for individual energy sources and fuels, including biofuels, natural gas and liquefied petroleum gas.
Shell has been involved in hydrogen production as well as in research, development and application for decades, with a
dedicated business unit, Shell Hydrogen. Now, in cooperation with the Wuppertal Institute in Germany, Shell has conducted a study on hydrogen as a future energy source.
The study looks at the current state of hydrogen supply path-ways and hydrogen application technologies and explores the potential and prospects for hydrogen as an energy source in the global energy system of tomorrow. The study focuses on the use of hydrogen in road transport and specifically in fuel cell electric vehicles (FCEVs), but it also examines non-automo-tive resp. stationary applications.
HYDROGEN – A PROMISING ELEMENT
More than 100 elements are known in chemistry, over 90 of which occur naturally. Elements are substances which cannot be broken down into simpler substances and from which all other substances are formed. Hydrogen is an element – but not just any element. Hydrogen is the smallest and lightest of all elements. Hydrogen was the first element created in space after the Big Bang. And it is the first element in the periodic table in modern chemistry.
Hydrogen was discovered in the 18th century as a flammable gas. Important technologies for producing and using hydrogen were developed in the 19th and early 20th century. Even then, its potential for the energy industry was recognised. We now know that hydrogen has a very high specific energy content (calorific or heating value). In some contemporary visions of the future, hydrogen played a prominent role as an energy source.
Hydrogen was given new impetus in the 1960s by space travel, which relied heavily on hydrogen as an energy store, and in the 1970s as a consequence of the energy and oil price crises, when the search began for alternative energy concepts. During the 1990s energy prices were low
ENERGY OF THE FUTURE?
– as was interest in novel energy forms.
Nevertheless, issues around sustainability,
climate protection and environmental
protection began to have a growing influ-
ence on energy supply policy. This sparked
a new interest in hydrogen as a clean and
sustainable energy option.
Over the past two decades, the energy
debate has been and is still dominated by
other energy sources – such as natural gas,
biofuels/biomass and electricity. Throughout
this period, however, intensive research and
development in hydrogen-related technolo-
gies has continued. Nonetheless, hydrogen
has so far failed to gain commercial
acceptance either generally or in individual
application areas as a new energy source.
Owing to high capital investment costs and
a long useful life of energy infrastructure,
it takes considerable time for new energy
sources to capture a significant share of the
energy market.
After decades of R&D as well as testing, it is
legitimate to ask: Is hydrogen the energy or
at least an important energy of the future?
And, if so, when and how could hydrogen
develop into a leading energy source in
the global energy system? The intent of
the Shell Hydrogen Study is to provide
qualified assessments and answers to these
questions.
RESEARCH OBJECTIVES AND KEY QUESTIONS
Shell scenario studies present facts, trends and prospects on specific key energy issues in a compact form. As in the previous Shell studies on passenger cars, commercial vehicles, domestic heating and individual energy sources and fuels, the initial focus is on providing an expert analysis and assessment of a subject.
There has certainly been plenty of discussion and reporting on hydrogen, and it is an exceptionally simple element. At the same time, however, hydrogen is not a familiar product, especially among end users who are accustomed to petrol and electricity. So far, any experience of hydrogen is limited largely to its use as a feed material in chemical production and as a technical gas in industry.
For that reason one of the most important aims of the Shell Hydrogen Study is to provide basic information about the element and about the use of hydrogen as an energy source. The first purpose of the study is to give an overview of the special properties and advantages of hydrogen.
Hydrogen is one of the ten most common elements on the surface of the Earth that is accessible to man. In nature, however, it does not exist in pure form, but rather only
Hard copies of the Shell Commercial Vehicle Study, the Shell Passenger Car Scenarios (both also as an English summary) and the Shell/BDH Domestic Heating Study (only in German) can be ordered via [email protected].
54
INTRODUCTION Shell Hydrogen Study

p p pn nn
H31
TRITIUMH2
1
DEUTERIUMH1
1
PROTIUM
p p pn nn
H31
Tritium
H21
Deuterium
H11
Protium
e e ee e e
H2O Water
CH4 Methane
H2 Hydrogen
H2O WaterH2 Hydrogen
CH4 Methane
The higher the hydrogen content of a hydrocarbon, the lower the carbon dioxide content and hence the lower the greenhouse gas emissions on combustion (oxidation).
gas, is made up of one carbon atom and four hydrogen atoms (CH4). By contrast, in higher alkanes such as petrol and diesel fuel the carbon-hydrogen ratio is around 1:2, and in coal it is only around 1:1.
Space is filled with highly diluted hydro-gen and also contains gigantic gas clouds consisting of hydrogen. The sun, which is around 4.6 billion years old, is a so-called main sequence star, which releases its radiant energy from hydrogen burning. Hydrogen is also the most frequently occurring chemical element on the giant gas planets (Jupiter, Saturn) of our solar system.
Unlike in outer space, the proportion of hydrogen in the elements on Earth is much smaller. The part of the Earth that is acces-sible to humans makes up less than 1% of the Earth’s mass. In the region of the Earth’s crust, oceans and atmosphere, the mass fraction of hydrogen is just 0.9 % (Mor-timer/Müller 2010). The proportion of hydrogen in the Earth’s atmosphere is only 0.5 parts per million (ppm).
Furthermore, hydrogen on Earth exists only rarely in its pure form; in most cases it is found in chemically bonded form. The larg-est proportion of hydrogen on Earth occurs as a compound with oxygen, in the form of water or water vapour. Corresponding to the relative atomic masses of hydrogen and oxygen, water (H2O) consists of approxi-mately 11.2 percent by weight hydrogen; in other words, the mass ratio of hydrogen to oxygen is around 1:8.
Moreover, hydrogen occurs in almost all organic compounds. It is not only living creatures that are composed of organic compounds. Fossil energy sources also consist primarily of carbon-hydrogen com-pounds. For example, the hydrocarbon methane, the main constituent of natural
The H-H molecule has a relatively high bond energy of 436 kJ/mol, which means that the H2 molecule is stable and chemically inert at room temperature. Only above temperatures of around 6000 degrees Celsius do hydrogen molecules break down almost completely into hydrogen atoms.
Depending on whether the protons of an H-H compound rotate in parallel or in opposite directions about their own axis (nuclear spin), the two modifications are known respectively as ortho- hydrogen and para-hydrogen. Ortho-hydrogen (o-H2) has a higher energy content than para-hydrogen (p-H2). In addition, their technical and physical properties differ slightly. Under prevailing thermodynamic conditions ortho- and para-hydrogen form an equilibrium mixture. Under standard conditions hydrogen exists as a 75:25 mixture of o- and p-hydrogen, while cryogenic hydrogen consists almost entirely of p-H2. The conversion of o- to p-hydrogen is an exothermic chemical reaction in which energy is released. Therefore, even if cryogenic liquid hydrogen is completely isolated, evaporation occurs unless all o-H2 is converted into p-H2 (Holle-mann/Wiberg 2007). In the rest of this study the term “hydrogen” will mostly be used as a synonym for the H2 molecule.
1.2 WHERE DOES HYDROGEN OCCUR?Hydrogen is the first and most important element in the universe. Its estimated mass fraction is in the order of 75 %. In the early uni-verse, some 13.8 billion years ago, hydrogen nuclei were formed by fusion at extremely high temperatures (nucleosynthesis). In the hot interior of stars, the subsequent stellar fusion of hydrogen to helium, also known as “hydrogen burning”, is the most important and richest source of energy in their life cycle. The age of a star can be determined from the distribution of the elements and the stellar mass.
1.1 WHAT IS HYDROGEN?
The name “hydro-gène” (“water producer”) was first coined in 1787 by the French chemist Antoine Laurent de Lavoisier, from the Greek words “hydor” (water) and “genes” (producing). It had earlier been called “inflammable air” by the English chemist and physicist Henry Cavendish because of its high flammability. The German name “Wasserstoff” (“water substance”) likewise refers to its water producing properties.
Hydrogen (chemical symbol H for the Latin name hydrogenium) is the first element in the periodic table and also the simplest. Ordinary hydrogen consists of a positively charged nucleus (pro-ton) and a negatively charged electron. Hydrogen has the lowest atomic weight of any element, at 1.008 grams per mol (g/mol); atomic hydrogen is 12 times lighter than carbon (C), 14 times lighter than nitrogen (N) and 16 times lighter than oxygen (O).
In addition to ordinary or light hydrogen 1H (protium), there are also two other hydrogen atoms (isotopes): heavy hydrogen (2H) or deuterium (D) and super-heavy hydrogen (3H) or tritium (T), with additional neutrons. As the neutron in the hydrogen nucleus is roughly the same weight as the proton, deuterium is approximately twice as heavy and tritium approximately three times as heavy as protium. Almost all hydrogen (99.985 %) is ordinary hydrogen, only 0.015 % occurs as heavy hydrogen. The proportion of super-heavy hydrogen is vanishingly small (Hollemann/Wiberg 2007).
Under standard conditions, i.e. ambient temperature and atmospheric pressure of 1.013 bar, atomic hydrogen (H) does not occur. Instead, hydrogen exists in dimerised form, where two hydrogen atoms firmly combine to form a hydrogen molecule (H2). The molecular weight of a hydrogen molecule is then 2.016 g/mol.
1 THE ELEMENT HYDROGEN
1 HYDROGEN ISOTOPES 2 HYDROGEN MOLECULES
>> In the beginning, there was hydrogen.<< Hoimar von Ditfurt 1972
76

‒250°
‒240°
‒230°
‒220°
‒210°
‒200°
‒190°
‒180°
‒170°
‒160°
‒150°
‒140°
‒130°
-120°
‒110°
-100°
‒90°
‒80°
‒70°
‒60°
‒50°
‒40°
‒30°
‒20°
‒10°
0
+10°
+20°
Gaseous @ atmospheric pressure, can be liquefied under pressure
Liquid @ atmospheric pressure
Solid @ atmospheric pressure
‒253°Boiling point
‒259° Melting point
‒240°
Triple point
Critical pointGaseous, cannot be liquefied
Absolute zero temperature: ‒273.15° = 0 K
‒260°
Jules Verne “The Mysterious Island“
1874
Water will be the coal of the future.
VISIONS OF A HYDROGEN ECONOMY
−260˚ −220˚
10
1
Pressure (bar)
Temperature (°C)
Supercritical fluid
−230˚−240˚−250˚
Critical point 13 bar, ‒240˚
Gaseous
100
350
700
+20˚
GH2
Liquid
Solid
GH2
SH2
LH2
CcH2
NIS
T 20
17; o
wn
diag
ram
3 PHASE DIAGRAM HYDROGEN
The critical temperature and critical pressure characterise the critical point of a substance. For hydrogen the critical point is approximately –240°C or 33.15 K and 13 bar. At the critical point of a substance the liquid and gas phase merge. At the same time, the critical point marks the upper end of the vapour-pressure curve in the pressure-temperature phase diagram. The critical density at the critical point is 31 grams per litre (g/l).
The melting point, at which H2 changes from the liquid to the solid state of aggregation, is –259.19°C or 13.9 K under normal pressure and is thus slightly lower again than the boiling point. This means that only the noble gas helium has lower boiling and melting points than hydrogen.
The triple or three phase point of a substance is the point in the phase diagram at which all three states of aggregation are in thermodynamic equilibrium; for hydrogen this point is at –259.19°C and 0.077 bar. The triple point is also the lowest point of the vapour-pressure curve. The vapour-pres-sure curve indicates pressure-temperature combinations at which the gas and liquid phases of hydrogen are in equi-librium. To the left of the vapour-pressure curve hydrogen is liquid, to the right it is gaseous. To the right of and above
During the 1970s, under the impression of dwindling and ever more expensive fossil fuels, the concept of a (solar) hydrogen economy was developed, with H2 as the central energy carrier. Since the 1990s, hydrogen and fuel cells have made huge technical progress in the mobility sector. After the turn of the century, not least against the background of renewed global raw material shortages and increasingly urgent questions of sustainability, the prospects for a hydro-gen economy were considered once again (Rifkin 2002).
More recently, the focus has increasingly been on hydrogen’s role in a national and global energy transition. Within this context, the value added of hydrogen (from renewable ener-gies via electrolysis) in an increasingly electrified energy world has also been subject to discussion. Nevertheless, an important role is envisaged for hydrogen – especially as a clean, storable and transportable energy store – in an electricity-based energy future (Nitsch 2003; Ball/Wietschel 2009).
Almost since its discovery, hydrogen has played an important part in contemporary visions of the future, especially in relation to the energy industry and locomotion.
As early as 1874, the French science fiction writer Jules Verne (1828 – 1905) in his novel “L’Île mystérieuse” (The Mysteri-ous Island) saw hydrogen and oxygen as the energy sources of the future. In his vision, hydrogen would be obtained by the breaking down of water (via electrolysis). Water, resp. hydro-gen, would replace coal, which at the time was the dominant energy source in the energy supply industry.
In the 1960s, the successful use of hydrogen as a rocket propellant and of fuel cells to operate auxiliary power units in space – especially in the context of the US Saturn/Apollo space travel programme – provided further impetus to the fantasies surrounding hydrogen. Also in the 1960s, first passenger cars were fitted with fuel cells as basic prototypes resp. technology demonstrators.
1.3 PROPERTIES OF HYDROGENUnder normal or standard conditions, hydrogen is a colourless and odourless gas. Hydrogen is non-toxic and is not causing environmental damage – in that respect it is environmentally neutral.
In terms of the properties of substances, a distinction is made between physical and chemical properties. Physical properties are determined by measurement and experi-mentation, while chemical properties are observed by means of chemical reactions. One of the most important chemical prop-erties of energy sources is the behaviour of the substance when it is burned (redox behaviour), either in a hot conversion process or by cold electrochemical com-bustion. Physical and chemical properties of substances influence both the use and
usefulness of a substance and the way in which it is handled; that applies in particu-lar also to the safe handling and storage of energy sources such as hydrogen.
PHYSICAL PROPERTIES
Hydrogen – by which both here and below we mean dihydrogen or equilibrium hydrogen mixtures (H2) – exists in gaseous form under normal conditions. For a long time hydrogen was believed to be a permanent gas, which cannot be converted into either of the other two states of aggre-gation, i.e. liquid or solid (Hollemann/Wiberg 2007).
In fact its boiling point is very low, at –252.76°C; this is close to the absolute zero temperature of –273.15°C and cor-responds to 20.3 Kelvin (K) on the absolute
temperature scale. Below this temperature hydrogen is liquid under normal pressure of 1.013 bar, above this point it is gaseous.
The state of aggregation is dependent not only on temperature, however, but also on pressure. Gases can thus also be liquefied by raising the pressure. However, there is a critical temperature above which a gas can no longer be liquefied, no matter how high the pressure. In the case of hydrogen the critical temperature is –239.96°C (33.19 K). If hydrogen is to be liquefied, its temperature must be below this point.
Similarly, once it reaches a sufficiently high pressure, a gas can no longer be liquefied, even by lowering the temperature further. This pressure is known as the critical pressure, and for hydrogen it is 13.1 bar.
the critical point, hydrogen becomes a supercritical fluid, which is neither gaseous nor liquid. Compared with that of methane, the vapour-pressure curve of hydrogen is very steep and short – over a small temperature and pressure range. As a consequence, liquefaction takes place primarily by cooling and less so by compression. By contrast, the compressed storage of hydrogen (at 350 or 700 bar) always takes place as a supercritical fluid.
In connection with temperature and pressure changes, a special feature of hydrogen that has to be taken into consideration is its negative Joule-Thomson coefficient: when air expands under normal conditions, it cools down – an effect which is used in the liquefaction of gases, specifically in the Hampson-Linde cycle for the cryocooling of gases. Hydrogen behaves quite differently: it heats up when its flow is throttled. Only below its inversion temperature of 202 K (approx. –71°C) does hydrogen demonstrate a “normal” Joule-Thomson effect. By contrast, for the main constituents of air, nitrogen and oxygen, the inversion temperature is 621 K and 764 K respectively.
Density is a physical quantity that is defined by the ratio of mass per volume. Gases have a very low density in
9
Shell Hydrogen Study
8
1 THE ELEMENT HYDROGEN

20% 40% 60% 80% 100%
Hydrogen Mixture too lean
Ignition range
Mixture too rich Methane
Propane
Ethanol
Petrol
Biodiesel
Diesel Ges
tis 2
017;
ow
n di
agra
m
4 IGNITION RANGE OF FUELS
68%Gas
16%Oil
11%Coal
5%Electricity
11%
Kohle
5%
Strom
16%
Öl
Erdgas
68%
11%
Kohle 5%
Strom
16%Öl Erdgas68%
E4tech 2014; own diagram
E4tech 2014; eigene Darstellung
5 SHARE OF PRIMARY ENERGY CARRIERS IN GLOBAL HYDROGEN PRODUCTION
amounts of energy – in other words high temperatures – are needed to form new molecular bonds. Hydrogen exists almost entirely in atomic form only above a tem-perature of 6,000 K. In addition to high temperatures, catalysts are also often used for chemical reactions involving hydrogen.
Molecular hydrogen (H2) is relatively inert. Nevertheless, by punctual heating of a 2:1 hydrogen/oxygen mixture (oxyhydrogen gas) to approximately 600°C, a chain reaction can be started which leads to an explosive propagation of the temperature rise throughout the entire gas mixture. The water vapour formed by the high heat of reaction then achieves a much greater volume than the original hydrogen/oxygen mixture. The sudden propagation of the water vapour leads to a so-called oxyhydrogen or Knallgas reaction.
For that reason, to avoid an oxyhydrogen/Knallgas reaction when working with hydrogen, an oxyhydrogen gas sample should always be taken or oxygen should only be added to the hydrogen at the moment of ignition (Hollemann/Wiberg 2007). Likewise, in gas mixtures containing hydrogen and chlorine gas or fluorine, the reaction to hydrogen chloride or hydrogen fluoride can result in explosive exothermic reactions.
Its chemical properties make hydrogen an excellent combustion and automotive fuel. Nevertheless, handling hydrogen requires care, and in particular compliance with safety regulations.
concentration of 4 vol%, the upper limit at 77 vol%. The liquid and gaseous fuels that are currently in use have much lower ignition ranges. Only ethanol, which is contained in petrol for example, has a higher upper explosive limit, at 27 vol.%.
Its combustion properties make hydrogen an interesting combustion fuel: If hydrogen were to be used in internal combustion engines, the broad ignition limits would allow for extremely lean air/hydrogen gas mixtures. While petrol engines run at a stoichiometric combustion air ratio (λ = 1) and modern diesel engines typically oper-ate at λ = 2, lambda values of up to 10 would be possible with hydrogen-operated combustion engines (Eichlseder/Klell 2012). Lean combustion is more efficient than stoichiometric combustion and thus minimises fuel consumption.
The autoignition temperature of pure hydro-gen is 585°C, which is higher than that of conventional fuels. However, the minimum ignition energy of 0.02 MJ is much lower than that of other fuels. Hydrogen is there-fore classified as an extremely flammable gas. However, a simple electrostatic dis-charge (with an energy of around 10 MJ) would also be sufficient to ignite almost any other fuel. The maximum flame velocity of hydrogen is 346 cm/s, which is around eight times higher than that of methane (43 cm/s).
Regarding the thermal behaviour of hydro-gen, it has been found that because of the strong bond between the hydrogen atoms of the hydrogen molecule, considerable
comparison to liquid and solid substances. At a temperature of 0°C or 273.15 K, the density of hydrogen in its gaseous state is 0.089 grams per litre (g/l). Since air is around 14 times heavier than gaseous hydrogen, with a density of 1.29 g/l, hydrogen has a high buoyancy in the atmosphere. Hydrogen volatilises quickly in the open air.
Liquefaction plays an important part in the storage and transport of hydrogen as an energy source. In the liquid state at the boil-ing point, at –253°C (20.3 K) and 1.013 bar, hydrogen has a density of 70.79 g/l. At the melting point, at –259.2°C (13.9 K) and 1.013 bar, its density is 76.3 g/l (Hollemann/Wiberg 2007).
Liquefaction increases the density of hydrogen by a factor of around 800, and the storage volume falls correspondingly. For the purposes of comparison, when Liquefied Petroleum Gas (LPG) is liquefied, the density or volume factor, depending on the proportion of butane/propane, is around 250; when methane is liquefied to form Liquefied Natural Gas (LNG), the factor is around 600 (Shell 2013, 2015).
Another relevant feature of hydrogen is its extremely high diffusibility. As the lightest gas, hydrogen can diffuse into another medium, passing through porous material or even metals (Hollemann/Wiberg 2007). This can also cause materials to become brittle. In storage, the high diffu-sivity requires the use of special materials for the storage containers – for example austenitic steels or coatings with diffusion barrier layers. Otherwise, diffusion losses of the stored hydrogen can occur.
CHEMICAL PROPERTIES
The most characteristic chemical property of hydrogen is its flammability (Hollemann/Wiberg 2007). When hydrogen is burned in ambient air, the flame is scarcely visible in daylight, since the flame is characterised by low heat radiation and a high ultraviolet component. In comparison with other fuels, it is striking that hydrogen is combustible in a very broad concentration spectrum. The ignition range of hydrogen, marked by its lower and upper explosive limit, is corre-spondingly large: the lower limit is at a
Owing to its physical properties, hydrogen is an almost permanent gas. Hydrogen gas only liquefies at very low temperatures (below –253°C).
As hydrogen has a very low density, it is usually stored under pressure. Liquefaction increases its density by a factor of 800.
The characteristic property of hydrogen is its excellent flammability. Due to its chemical properties, hydrogen has to be handled with care.
Hydrogen is the most common substance in the universe and the richest energy source for stars.
Hydrogen (H) is the first element in the periodic table of modern chemistry and is also the smallest, lightest atom.
Pure hydrogen occurs on Earth only in molecular form (H2). Hydrogen on Earth is usually found in compounds, most notably as water molecules (H2O).
Hydrogen has long been regarded as an energy carrier of the future. It is also discussed as the foundation of a sustainable hydrogen economy.
2 SUPPLY PATHWAYS
Hydrogen naturally only exists in (chemi-cally) bound form, so it has to be produced by means of specific processes in order to be used for chemical or energy purposes. A number of suitable processes are availa-ble and are in use today. Most of today’s global hydrogen production is based on fossil energy sources (see figure 5).
Only a small proportion of hydrogen is produced by electrolysis, the electricity for which currently stems from a variety of sources. For the future it can be assumed that hydrogen production from electrolysis will rise significantly if (surplus) electricity
from renewable energies becomes increasingly available.
Figure 6 shows the basic process stages for industrial hydrogen production. For the most important processes various raw materials can be used without fundamental changes to the process. Hydrogen production pro-cesses include steam reforming, currently the most important production process, as well as partial oxidation, autothermal reforming and gasification of solid fuels. In addition, the electrolysis of water with electricity from various sources and the use of industrial “residual hydrogen” is considered.
Depending on the production method, the hydrogen product gas that is obtained includes undesired substances (such as carbon monoxide, CO) and impurities; this applies especially to the thermochemical and biochemical methods. Depending on the intended use the product gas has to undergo a subsequent purification; in some cases the raw materials for the hydrogen production also have to be prepared.
The processes for producing hydrogen are described in more detail below, followed by an analysis of the energy and greenhouse gas emissions balances for the
IN SUMMARY
11
Shell Hydrogen Study
10
1 THE ELEMENT HYDROGEN

Natural Gas
Oil
Coal
Electricity
Biomass
SMRSteam methane reforming
POXPartial oxidation
ATRAutothermal reforming
Syngas
ELECTROLYSIS
BIOCHEMICALCONVERSION
HYDROGEN
THERMOCHEMICALCONVERSION
Solar, Wind
Algea from sunlight
BiomethaneBiogasEthanolVegetable Oils
PRIMARY ENERGY SECONDARY ENERGY CONVERSION INTERMEDIARY PRODUCT FINAL ENERGY CARRIER
6 PROCESSES FOR PRODUCING HYDROGENthe preceding partial oxidation of the fuel. As the feedstock is not fully converted, but used for heat supply, this has a detrimental impact on the efficiency.
Air or a mixture of oxygen and water vapour or carbon dioxide is used as the oxidant or gasifying agent. As in partial oxidation, the product gas that is formed is at its purest when oxygen is used, since the use of air introduces quite a high proportion of nitrogen into the process. The composition of the resulting synthesis gas, in other words the proportion or purity of hydrogen, is also influenced by the gasification temperature and pressure, by the cooling capacity of the reactor, and by the residence time of the product gas in the reactor (Görner et al. 2015).
materials, rather than relying on light hydrocarbons (Zakkour/Cook 2010).
Autothermal reforming (ATR)
Autothermal reforming is a combination of steam reforming and partial oxidation. The reforming of methane takes place in accordance with the following reaction equation:
4 CH4 + O2 + 2 H2O → 4 CO + 10 H2
In the ATR process combining steam reforming and partial oxidation, the high hydrogen yield is determined by the steam reforming step. The necessary process heat is supplied internally by the partial oxidation step.
The advantage of the autothermal reaction, which is not dependent on an external heat supply, is more or less offset by increased investment and operating costs for the air separation unit and a more complicated flue gas purification process.
GASIFICATION
Gasification is a traditional method for producing fuel gases. It denotes the reaction of a carbon carrier (such as coal) with oxygen or an oxygen-containing gasifying agent to form a synthesis gas. In this process, the raw material that is used is first dried and broken down thermally in the absence of air to form carbon and hydro-gen compounds, which are then partially combusted by oxidation (Eichlseder/Klell 2012). In accordance with the following reaction equation, the heated carbon and water vapour produce a synthesis gas consisting of CO and H2.
C + H2O → CO + H2
By the subsequent water gas shift reaction CO again is converted to form CO2 and further water vapour to H2. The various reactor types are distinguished by the design of the gasifier. The gasification process itself can be performed under excess pressure or at atmospheric pressure. The higher the operating pressure, the better the performance of the gasifier. Gasification generally involves the input of heat (endothermic reaction = allothermal gasification). An autothermal process management, however, uses the heat from
The carbon monoxide content is further reduced through further chemical conver-sion processes such as CO methanation and selective CO oxidation. The purity of the product gas is further increased by subsequent CO2 washing and other physical purification steps (DWV 2015).
If other starting materials such as heavy fuel oil are used, the steam reforming process in principle proceeds in the same way. However, the production of the synthesis gas in the first step differs.
Partial oxidation (POX)
Partial oxidation is understood to be the exothermic conversion of mainly heavy hydrocarbons (such as heavy fuel oil or coal) with the aid of oxygen (O2). Thermal partial oxidation takes place under high pressure and at high temperatures from around 1,250°C to around 1,400°C. As heat is released, no external heat source is needed other than the partial combustion of the raw material. The POX reaction equation for hexadecane, a long-chain alkane found in gas oil, looks like this:
C16H34 + 8 O2 → 16 CO + 17 H2
As in steam reforming, a synthesis gas is produced that is converted to hydrogen by means of the water gas shift reaction and gas treatment (Zakkour/Cook 2010). In this process, the longer the chain length of the hydrocarbon used, the lower the hydrogen yield.
A substantial difference from steam reforming is that O2 is used instead of water vapour as the oxidant. This O2 is usually produced in an air separation unit, which considerably increases the energy consumption of partial oxidation. However, this is offset to some extent by the extraction of heat from the reaction. In addition, the use of O2 rather than air more or less eliminates the occurrence of nitrogen in the water gas shift reaction, resulting in a lower energy consumption (for separation and purification).
All in all, partial oxidation is less efficient than steam reforming; at the same time, however, it offers the advantage of being able to convert a wider range of raw
is used as an oxidant, the product gas also contains nitrogen. The reaction takes place at high temperatures (between approx. 700°C and 900°C) and the conversion is assisted by a catalyst. In addition to the raw material, reforming requires an oxidant, which supplies the necessary oxygen. Based on the oxidant, three basic methods can be identified (Aicher et al. 2004):
■ Steam reforming: Pure water vapour is used as the oxidant. The reaction requires the introduction of heat (“endothermic”).
■ Partial oxidation: Oxygen or air is used in this method. The process releases heat (“exothermic”).
■ Autothermal reforming: This process is a combination of steam reforming and par-tial oxidation and operates with a mixture of air and water vapour. The ratio of the two oxidants is adjusted so that no heat needs to be introduced or discharged (“isothermal”).
Steam reforming Steam methane reforming (SMR)
The raw materials for steam reforming are mostly natural gas and water; in principle,
REFORMING
Reforming of fossil hydrocarbons is by far the most widespread method of hydrogen production. Reforming is the conversion of hydrocarbons and alcohols by chemical processes into hydrogen, giving rise to the by-products water (vapour), carbon mon-oxide and carbon dioxide. If (ambient) air
different hydrogen supply pathways, based on the Well-to-Tank approach which con-siders the production of the primary energy source through to provision of the hydrogen in a storage system or (vehicle) tank.
The summary of the energy and green-house gas balances is based on the Well-to-Wheel balances of the Joint Research Center of the European Commission, Eucar and Concawe (JEC 2014); therefore the processes behind (JEC 2014) are briefly outlined. In addition, an overview of the hydrogen manufacturing costs for the various processes is provided.
however, other light hydrocarbons such as liquefied petroleum gas or naphtha can also be used (Zakkour/Cook 2010). The starting material has to be prepared first; this usually involves removing sulphur, which attacks the catalyst. In the next step, methane and water are converted into hydrogen by the following reactions:
CH4 + H2O → CO + 3 H2
CH4 + 2 H2O → CO2 + 4 H2
A synthesis gas is formed, consisting predominantly of hydrogen and carbon monoxide, with small amounts of carbon dioxide, water vapour and residual hydrocarbons. Both the carbon and the H2 molecules can form a compound with oxygen. In this process as little hydrogen as possible should oxidise to form water, so that a high yield of H2 can be achieved. Suitable catalysts can help with this (Aicher et al. 2004).
In the next step, CO and remaining water are converted further to H2 and CO2 in the so-called water gas shift reaction (DWV 2015).
CO + H2O → CO2 + H2
On a global scale, the production of hydrogen from biomass has so far been negligible. In the long term, however, from the perspective of low-CO2 hydrogen production, it is conceivable that this manufacturing option could play a part – provided that sustainability requirements for the biomass that is used can be reliably met and that sufficient quantities are available.
In principle there are two methods for producing hydrogen from biomass: thermochemical or biochemical methods. The possibility of generating electricity from biomass and converting it into hydrogen by electrolysis is covered under electrolysis.
THERMOCHEMICAL METHODS
Thermochemical methods are in most cases based on the gasification or pyrolysis of solid or liquid biomass to form a synthesis gas, followed by a further treatment to produce H2 (as with fossil fuels). The “solid biomass” category includes primarily woody and stalky biomass, i.e. forest wood or waste wood and straw, but also stalky energy crops such as miscanthus. Timber is most suitable for gasification, since stalky materials like straw contain too many impu-rities and, given the tendency to form ash, are not an ideal feedstock for gasification
2.1 PRODUCTION FROM FOSSIL ENERGY SOURCES
2.2 BIOGENIC PRODUCTION
13
Shell Hydrogen Study
12
2 SUPPLY PATHWAYS

CATH
OD
E
AN
OD
E
H2O
H2O2
2e–
2e–
2 OH–½ O2 H2
2 OH– → H2O + ½O2 + 2e–
2 H2O +2e– → H2 + 2 OH–
7 THE PRINCIPLE OF ELECTROLYSIS 8 ELECTROLYSER KEY FEATURES
The high level of interest in hydrogen as a by-product of industry production processes (“industrial residual hydrogen”), especially for use in FCEVs, can be traced back to the time when, in and around the 1980s, work on fuel cell drive-trains for vehicles increased and there was intense discussion surrounding “hydrogen as transportation fuel”. The potential of industrial hydrogen
The economic attractiveness of hydrogen production by electrolysis is very much dependent on electricity prices. At today’s energy prices, electrolysis is more expensive than steam reforming (Schiller 2012). Ultimately, producing hydrogen by electro- lysis requires an inexpensive electricity supply, and in particular surplus renewable electricity. By contrast, if electricity generated by a natural gas power station is used for electrolysis, the reduced efficiency of the overall process chain has to be taken into account: converting natural gas to electric-ity to hydrogen is associated with greater losses than the direct conversion of natural gas to hydrogen.
The charge carriers move in the electrolyte towards the anode. At the anode (positive pole) the electrons are absorbed by the negative OH– anions. The OH– anions are oxidised to form water and oxygen. Oxygen rises at the anode. A membrane prevents the product gases H2 and O2 from mixing but allows the passage of OH– ions.
2 H2O + 2 e– → H2 + 2 OH–
2 OH– → H2O + ½ O2 + 2e--
The efficiency of electrolysis is determined by the amount of electricity used to pro-duce an amount of hydrogen. Depending on the method used, the efficiency of water electrolysers is currently in the region of 60 to 80 % (based on the calorific value).
Electrolysers consist of individual cells and central system units (balance of plant). By combining electrolytic cells and stacks, hydrogen production can be adapted to individual needs.
Electrolysers are differentiated by the electrolyte materials and the temperature at which they are operated: low-temperature electrolysis (LTE), including alkaline elec-trolysis (AE), proton exchange membrane (PEM) electrolysis and anion exchange membrane (AEM) electrolysis (also known as alkaline PEM), and high-temperature electrolysis (HTE). The latter group most
The electrolysis breaks down a feedstock, in this case water, into hydrogen and oxygen by electricity. The electrolyser consists of a DC source and two noble-metal-coated electrodes, which are separated by an electrolyte. The electrolyte or ionic conductor can be a liquid, for example conductive caustic potash solution (potassium hydroxide, KOH) for alkaline electrolysis (Eichlseder/Klell 2012).
In an alkaline electrolyser (cf. figure 7) the cathode (negative pole) loses electrons to the aqueous solution. The water is dissoci-ated, leading to the formation of hydrogen (H2) and hydroxide ions (OH–).
into oxygen and hydrogen by biophotolysis (Hy-NOW 2012). There are a number of methods available for converting sugar and starch and lignocellulose from biomass into hydrogen. They are based on the use of various microorganisms and (with the exception of one process) draw at least some of the energy they need from sunlight. The most relevant methods are dark fermen-tation using heterotrophic bacteria, photo-fermentation using photosynthetic bacteria, and biophotolytic splitting of water using green algae or cyanobacteria.
Common to all biochemical methods is the fact that at present they exist only on a laboratory scale and are performed in very small amounts. Market maturity is not yet in sight, since conversion rates and hydrogen yields are still well below a marketable threshold and therefore still need to be increased considerably.
With the exception of the biophotolytic process, all biogenic hydrogen production methods require significant volumes of biomass. This could lead to restrictions for large-scale production, since biomass is a renewable raw material whose potential and availability are limited by various requirements, regarding sustainability for example, but also by competing uses (Fritsche et al. 2012; Kaltschmitt et al. 2016).
processes. Of the various timbers that can be used, untreated wood is most suitable, i.e. forest wood or coppiced wood from short-rotation coppices (SRCs).
High-pressure gasification of biomass is complicated by the fact that waste wood tends to be contaminated with stones or nails, which can damage the pressure vessel. For that reason, wood gasification according to (JEC 2014) is usually carried out at normal pressure, which has a detrimental impact on the efficiency. The alternative is to use only pure forest wood, which reduces the potential for hydrogen production.
Alongside the gasification of solid biomass, however, it is also possible to reform biogenic secondary energy sources or to convert them to hydrogen by partial oxida-tion. Suitable secondary energy sources include biogas or biomethane (produced by anaerobic fermentation) or bioethanol (produced by alcoholic fermentation).
All types of moist, green biomass are suitable in principle for producing biogas by fermentation (Kaltschmitt et al. 2016). Biogas and biomethane processed to natural gas quality can be used directly in the reformer and converted to hydrogen in the same way as natural gas. In the case of biogas, if need be, a preliminary desulphurisation stage is performed.
The use of vegetable oils, biodiesel or bioglycerol (produced by physiochemical methods) is also possible. Liquid secondary energy sources such as bioethanol, bio-diesel, vegetable oils or glycerol sometimes require adjustments to the reformer feed (Hy-NOW 2012).
In particular with respect to the use of secondary energies it should be noted that each additional conversion stage is asso-ciated with losses, which adversely affects the overall balance of the product.
BIOCHEMICAL PRODUCTION
The biochemical production of hydrogen from biomass using microorganisms is also possible. In this case the biomass can likewise be fermented and processed further, or alternatively water can be split
Temperature°C Electrolyte Plant size Efficiency Purity H2 System costs Lifespan Maturity level
Alkaline Electrolysis (AE)
60 – 80Potassium- hydroxid
0.25 – 760Nm3 H2/h
1.8 – 5,300 kW 65 – 82 %99.5 %
– 99.9998 %1,000 –
1,200 €/kW60,000 – 90,000 h
Commercially used in industry for the last 100
years
Proton Exchange Membrane Electrolysis (PEM)
60 – 80Solid state membrane
0.01 – 240 Nm3 H2/h
0.2 – 1,150 kW 65 – 78 %99.9 %
- 99.9999 %1,900 –
2,300 €/kW20,000 –60,000 h
Commercially used for medium and small
applications (<300 kW)
Anion Exchange Membrane Electrolysis (AEM)
60 – 80Polymer
membrane0.1 – 1
Nm3 H2/h0.7 – 4.5 kW N/A 99.4 % N/A N/A
Commercially available for limited
applications
Solid Oxide Electrolysis (SOE)
700 – 900Oxide
ceramicUntil now at experimental
stage in laboratories85 % (lab)
N/A N/Aapprox 1,000 h
Experimental stage
notably includes solid oxide electrolysis (SOE), but this is still at an advanced R&D stage and products are not yet commer-cially available. Once it reaches market maturity, its advantages are expected to include increased conversion efficiency and the possibility of producing a synthesis gas directly from steam and CO2, for use in various applications such as synthetic liquid fuels (E4tech 2014, IEA 2015b).
Low-temperature electrolysers are currently available on the market, and AE is the clear market leader here, accounting for most of the installed capacity worldwide. PEM electrolysis has been commercially available since the beginning of the 21st
century, whereas AEM has only just appeared on the market. Table 8 shows some characteristic features of the various electrolysis methods.
Research priorities with regard to electro- lysers currently include increasing the efficiency of the electrolyser system as a whole, along with its operating life, power density and stack size, reducing costs (especially material costs), introducing pressurised systems to avoid the need for subsequent compression of the H2 produced, and not least developing flexible systems adapted to intermittent and fluctuating power supply.
for the use of early demonstration fleets of fuel cell vehicles was assessed in a number of studies. Residual hydrogen from industry was intended to serve as an entry point until renewably generated hydrogen was widely available. Furthermore, the industrial distribution infrastructure was regarded as a basis or stepping stone for a universal hydrogen supply system.
At the time, quite significant amounts of hydrogen as a by-product of various industrial operations were being released into the atmosphere rather than being integrated into other production processes (WI/Covestro 2015). Since then, however, energy prices in Germany and Europe have risen, and the industries concerned are now keen either to integrate the accru-ing hydrogen into their processes or, if that is not possible, to find customers willing to pay a good price for it.
A number of studies have sought to quantify the amount of industrial residual hydrogen available. The EU project “Roads 2 HyCom” (Maisonnier et al. 2007) pro-duced among other results a map showing hydrogen production sites in Europe. In this map the hydrogen sources were broken down into three categories: the “merchant” category supplies hydrogen to other industrial customers, while the “captive”
2.4 HYDROGEN AS A BY-PRODUCT
2.3 ELECTROLYSIS
E4tech 2014; IEA 2015b; own diagram
15
Shell Hydrogen Study
14
2 SUPPLY PATHWAYS
H2O2
H2O Gas grid
H2
POWER-TO-GAS
POWER-TO-LIQUIDS
Power generation Power Electrolysis
Methanation
Synthesis
PtH2
MethanePtCH4CO2
CO2
Petrol, Diesel,Jet fuel
PtH2 PtH2
Storage caverns
efficiency (in MJ primary energy / MJ hydrogen produced) and the associated specific greenhouse gas intensity (g CO2 equivalent / MJ hydrogen produced), where CO2 equivalent is referred to below as CO2.
The results are shown in figures 10 and 11. All pathways are shown as being “central-ised” in large production units, where “cen-tralised” still means domestic production. The possibility of producing hydrogen on a large scale using solar power in North Africa or offshore wind power in Northern Europe, for example, and shipping it to Germany has been excluded from this analysis. For various reasons, not only technical but also geopolitical, the impact of implementing this option, which is more of a long-term objective, cannot yet be assessed. The sensitivity analysis illustrates the effects of decentralised production, characterised firstly by the less efficient production and secondly by the elimination or at least the considerable shortening of the transport route.
In considering the energy efficiency of the different hydrogen production and supply pathways, differences between the primary energy sources are evident (figure 10). The EU electricity mix/electrolysis pathway stands out because the cumulated energy input is 4.6 to 5 times higher than that of the other pathways. By contrast, the differences between natural gas reforming and electrolysis from variable renewable energies (in this case wind) in terms of the height of the bars are slight.
Nevertheless, the type of energy source used must be taken into account: electro- lysis from renewable energies uses more than 70 % renewable energies and consumes only small amounts of fossil and nuclear resources (for transport and for production and dismantling of the wind energy converters used). By contrast, the proportion of renewable resources in the gas reforming pathways is less than 5 %. One exception to this rule is the “biogas mix” pathway, half of which is supplied by waste-based biogas and which thus contains a higher proportion of renewable energy.
for example) but also in terms of the size and location of the production unit: depending on demand and on the supply strategy, hydrogen is generated decen-tralised in small plants directly at the point of use or in large centralised plants and subsequently transported by pipeline or lorry to the dispensing stations.
In practice there will also be combinations of centralised and decentralised pro-duction, in regional supply for example, but for simplification reasons they are not described here. Thermal conversion from the fossil fuels coal, oil and above all natural gas still dominates. As part of the process of decarbonising energy production and energy consumption, the role of fossil fuels, especially coal, is being reduced. In fact, the specific greenhouse gas emissions from hydrogen generated by coal gasification are more than twice the ones from hydrogen produced by natural gas reforming (JEC 2014). In the long term, thermal conversion will increasingly be superseded by electrolysis (using electricity from renewable energies).
For that reason, this section examines only two main hydrogen production pathways: steam reforming from natural gas and electrolysis. No further consideration is given to supply pathways based on coal and (heavy fuel) oil. Energy and green-house gas balances are considered for the selected pathways and their variants and production costs are estimated.
The energy and greenhouse gas balances for the above-mentioned hydrogen pro- duction pathways are presented and analysed with reference to (JEC 2014). (JEC 2014) contains energy and greenhouse gas balances for a large number of energy and fuels pathways. The data is updated regularly and forms an acknowledged basis for analysing energy sources and fuels in the European context. According to (JEC 2014) the primary energy share (subdivided into fossil, nuclear and renewable energy sources) and the resulting greenhouse gas emissions for each conversion stage and transport mode are calculated and mapped. The results show for each pathway the specific energy
The previous sections of this chapter introduced various hydrogen production technologies. These technologies can be differentiated not only in terms of the energy sources used (fossil or renewable,
category retains hydrogen on site for its own use. Only “by-product” hydrogen has no further use within the process or on site; only this category can be made available for other applications, such as fuel cell electric vehicles.
However, by-product hydrogen is also widely used today. In the chemical industry it is used for additional processes such as hydrogenation. It is at least used to produce electricity and heat, as in the steel industry for example. However, this by-product hydrogen could be replaced by natural gas as an energy source, and thus be made available. Moreover, the layout of new or retrofitted plant sites is such that all input and product streams are used, as a result of which the availability of individ-ual “by-products” is falling sharply overall.
The project “CO2 ReUse NRW” (WI/Covestro 2015) provided a detailed insight into the production, distribution and use of industrial hydrogen. The bulk of industrial hydrogen is produced specifically for its intended purpose (mostly chemical industry). Within this context, refineries too have become net consumers of hydrogen. Only a relatively small proportion of 9 % of the total amount of hydrogen produced can be considered to be available for external applications. Therefore, little or no industrial hydrogen is available for other applications, such as transportation fuel.
By contrast, according to a survey by (Cox 2011), in the USA there is still potential in residual hydrogen. The most important source for this is the chlor-alkali electrolysis; however, landfill gas and biogenic gases are also regarded as a potential source of by-product hydrogen. In this context considerable importance is attached to the availability of gas processing plants.
In the course of the energy transition, the proportion of renewable energies in electricity generation has risen markedly. Wind power and photovoltaics have seen the greatest expansion. However, the availability of these intermittent and non-dispatchable renewable energies (variable renewable energies, VREs) fluctuates over time. At the same time, because of its physical properties, supplying electricity requires a constant balancing of supply and demand.
If the proportion of renewable energies exceeds roughly one- quarter of electricity generation, special/additional measures are necessary in order to integrate fluctuating renewable energy supplies. Otherwise it may be necessary to limit the production or use of renewable energies.
Alongside other demand and supply measures, energy storage can play an important part in improved system integration. Until now, pumped-storage hydro power plants have dominated electricity stor-age capacity – although they account for less than 3 % of global electricity generation. Short-term electricity storage in batteries for small plants is developing dynamically. However, longer-term stor-age of larger surplus amounts of electricity requires new types of storage, such as chemical storage in the form of hydrogen (IEA 2016b).
Hydrogen can be obtained by electrolysis from electricity produced with surplus renewables. If there is a corresponding energy demand, the hydrogen can fulfil it directly. However, it can also be stored in bulk tanks as pressurised gas and retrieved when supplies are low.
Finally, the hydrogen can be converted into other energy carriers. Converting renewable electricity via hydrogen into other energy
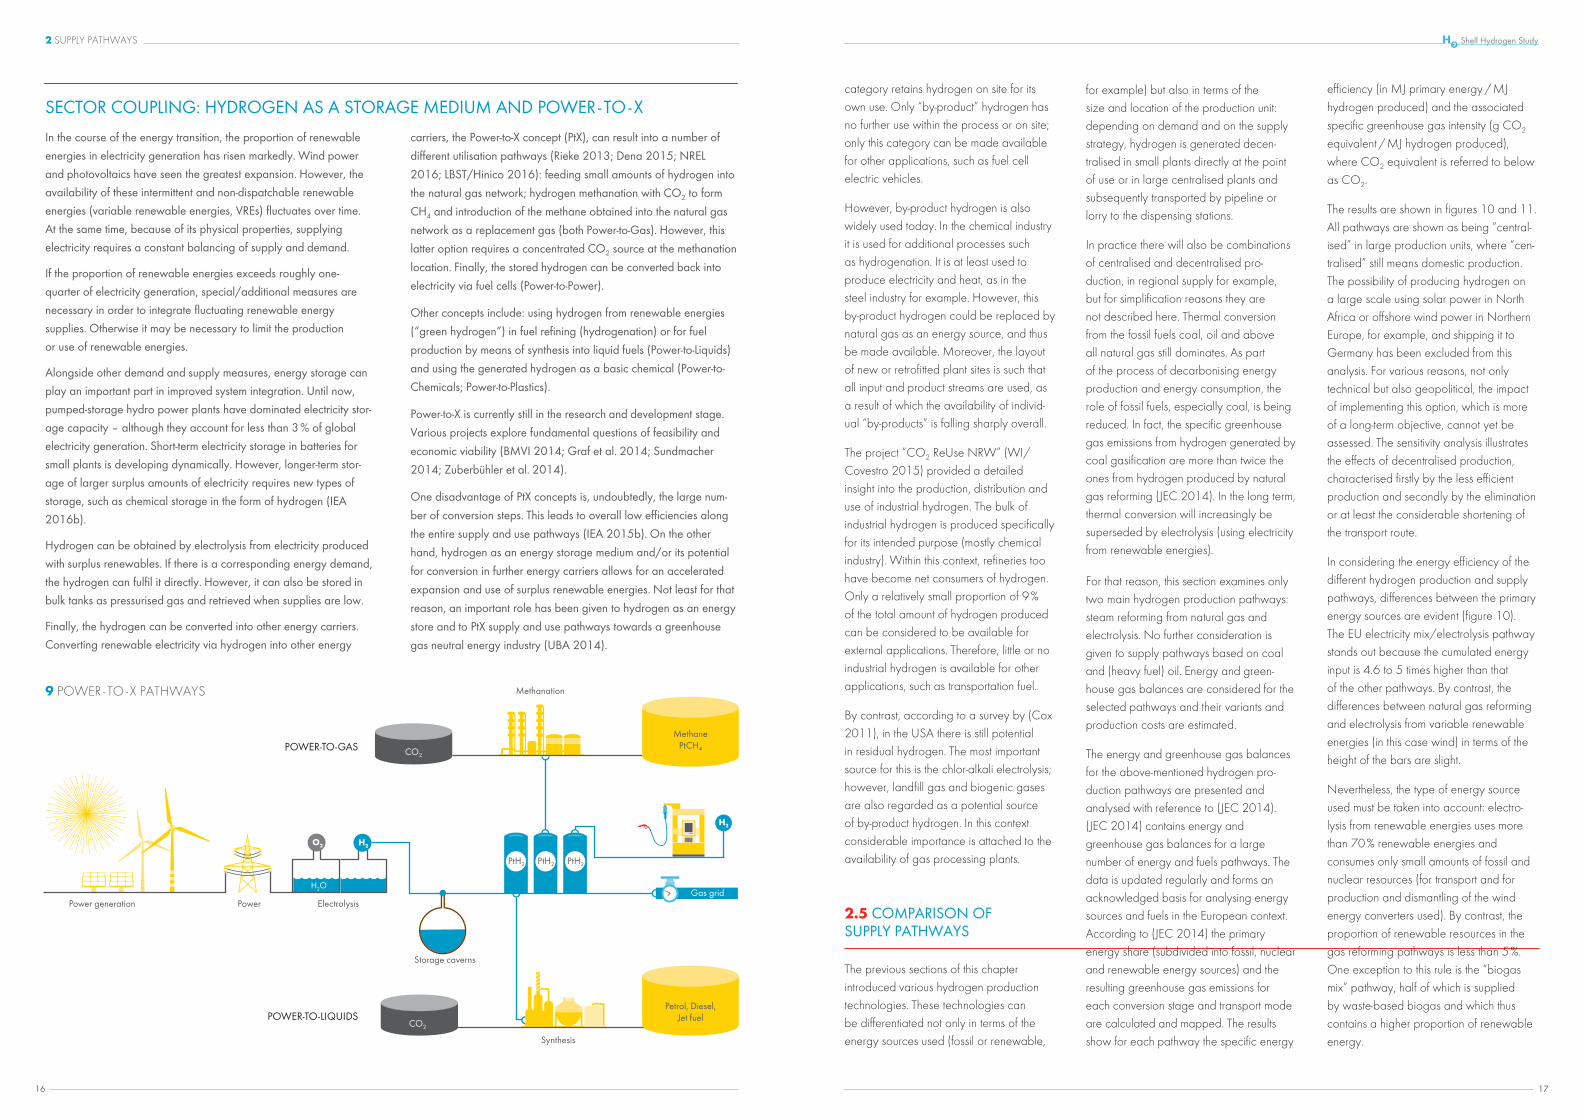
carriers, the Power-to-X concept (PtX), can result into a number of different utilisation pathways (Rieke 2013; Dena 2015; NREL 2016; LBST/Hinico 2016): feeding small amounts of hydrogen into the natural gas network; hydrogen methanation with CO2 to form CH4 and introduction of the methane obtained into the natural gas network as a replacement gas (both Power-to-Gas). However, this latter option requires a concentrated CO2 source at the methanation location. Finally, the stored hydrogen can be converted back into electricity via fuel cells (Power-to-Power).
Other concepts include: using hydrogen from renewable energies (“green hydrogen”) in fuel refining (hydrogenation) or for fuel production by means of synthesis into liquid fuels (Power-to-Liquids) and using the generated hydrogen as a basic chemical (Power-to- Chemicals; Power-to-Plastics).
Power-to-X is currently still in the research and development stage. Various projects explore fundamental questions of feasibility and economic viability (BMVI 2014; Graf et al. 2014; Sundmacher 2014; Zuberbühler et al. 2014).
One disadvantage of PtX concepts is, undoubtedly, the large num-ber of conversion steps. This leads to overall low efficiencies along the entire supply and use pathways (IEA 2015b). On the other hand, hydrogen as an energy storage medium and/or its potential for conversion in further energy carriers allows for an accelerated expansion and use of surplus renewable energies. Not least for that reason, an important role has been given to hydrogen as an energy store and to PtX supply and use pathways towards a greenhouse gas neutral energy industry (UBA 2014).
SECTOR COUPLING: HYDROGEN AS A STORAGE MEDIUM AND POWER - TO - X
2.5 COMPARISON OF SUPPLY PATHWAYS
9 POWER - TO - X PATHWAYS
17
Shell Hydrogen Study
16
2 SUPPLY PATHWAYS

2
4
6
8
10
12
Centralised Gas Reforming Decentralised Gas Reforming Centralised Electrolysis Decentralised Electrolysis Centralised Biomass Decentralised Biomass
€/kg H2
CurrentProjected
Min. - Max.
LBST/Hinico 2015; Grube/Höhlein 2013, own diagram
50
100
150
200
250 g CO2/MJ H2
EU Gas-Mix Reforming
Biogas-Mix Reforming
LNG Reforming
EU Electricity-Mix Electrolysis
Renewable Electricity Electrolysis
Decentralised PathsCentralised Paths
JEC
201
4; o
wn
diag
ram
11 GREENHOUSE GAS EMISSIONS OF HYDROGEN SUPPLY
12 HYDROGEN PRODUCTION COSTS
0.5
1.5
2.5
3.5
4.5
EU Gas-Mix Reforming
Biogas-Mix Reforming
LNG Reforming
EU Electricity-Mix Electrolysis
Renewable Electricity Electrolysis
RenewablesNuclearFossil
MJ/MJ H2
JEC
201
4; o
wn
diag
ram
10 ENERGY INPUT FOR HYDROGEN SUPPLY
et al. 2013; DBFZ 2007; Sattler 2010;
Smolenaars 2010; Tillmetz/Bünger 2010;
Trudewind/Wagner 2007). The pathways in question are centralised and decentral-ised natural gas reforming, centralised and decentralised electrolysis of (wind) elec-tricity, and centralised and decentralised biomass gasification and reforming. The analysis has been supplemented with the data from (LBST/Hinico 2015).
Finally, the timeliness of the data should be taken into consideration: most of the studies that were analysed quote data from methods that had been implemented at the time of publication. Based on personal information from the authors, these values are still up-to-date. Therefore they are reproduced in figure 12 as the current status. The cost data from the cited studies are summarised in this figure. This has been done by calculating a weighted average, while the deviation from the minimum or maximum value is shown in the shaded bars. In addition, three of the studies indi-cate costs for the years 2020 (or 2019) and 2030 in two different scenarios; where available these are shown in yellow in the figure.
It is obvious that the range of production costs from centralised natural gas reforming is narrow. Production costs of between 1 and 2 EUR per kilogram of hydrogen (average 1.4 €/kg) can therefore be regarded as very probable. The variations in decentralised reforming are much higher.
As a consequence of the high proportion of coal used in its production, the German electricity mix has a higher CO2 intensity. However, the conclusions that can be drawn are not fundamentally different.
There are also similar programmes and resulting studies in other regions of the world, for example in California and other states of the USA. The Well-to-Wheel emissions for typical hydrogen production pathways were analysed by the Argonne National Laboratory in the “Greenhouse gases, Regulated Emissions, and Energy use in Transportation” model (GREET 2015). The values are in the same order of magnitude as those from the JEC study and therefore support the conclusions set out here.
parison: if hydrogen is to be produced by electrolysis from a partially decarbonised electricity grid with the same greenhouse gas intensity as for the natural gas reform-ing pathway, specific greenhouse gas emissions from the electricity that is used must be about 56 g CO2/MJ electricity. Compared with the current levels of approximately 150 g CO2/MJ electricity, the grid greenhouse gas intensity would therefore have to be reduced by approxi-mately two-thirds.
The values for the selected hydrogen pro-duction pathways are taken from the JEC study (JEC 2014) and reflect the situation across Europe. It is assumed that these values also apply to Germany. There are differences between the EU and Germany, especially in regard to the electricity mix.
In terms of greenhouse gas emissions the reforming pathways represent an average value which does not vary substantially according to the origin of the natural gas or the type of import (as Compressed Natu-ral Gas, CNG, by pipeline or in liquefied form as LNG, Liquefied Natural Gas). The greenhouse gas intensity can be reduced significantly by adding processed biogas, so-called biomethane, which has similar properties to natural gas. However, this is very much dependent on the origin and the type of the raw materials from which it is produced: The use of biomethane derived from municipal waste results in significantly lower greenhouse gas emissions than biomethane based on energy crops or slurry (DBFZ 2014). The addition of biomethane to natural gas and its use in hydrogen production generally occurs as a balance sheet calculation rather than by physically transporting the biomethane to the reforming plant.
Even more relevant than the type of gas used for reforming is the greenhouse gas intensity of the electricity used for electro- lysis. In terms of the carbon footprint, the EU electricity mix pathway and the electrolysis from renewable energies pathway differ by a factor of 17.
If solely renewable electricity is used, the hydrogen that is produced is almost emis-sion-free, with around 13 g CO2/MJ H2. On the other hand, if the average Euro-pean electricity mix is used for electrolysis, the greenhouse gas emissions produced are some 2.2 times higher than in natural gas reforming.
Therefore, if hydrogen is to be made available sustainably and on a large scale, only electrolysis using electricity generated from renewable energy sources offers the possibility of providing a low-CO2 fuel. However, if a reliable supply of larger amounts of electricity is needed for the transport sector, surplus renewable elec-tricity is no longer sufficient for hydrogen production. Rather, the required electricity must be produced specifically for that purpose.
The scale of the transition of electricity generation that is needed shows a com-
2.6 PRODUCTION COSTS – CURRENT AND PROJECTED
The same is true for electrolysis: the spread of costs for centralised plants is smaller than that for decentralised plants. One reason for this may be that decentralised plants are frequently not used at optimum capacity, and the variations in utilisation have an even greater impact on production costs than they do in a centralised plant.
According to these figures, hydrogen from centralised and decentralised electrolysis plants can be produced with production costs ranging from almost 6 €/kg H2 (for the centralised plant) to nearly 8 €/kg H2 (for decentralised electrolysis). Another key input variable, along with capacity utilisation and full load hours achieved, is the electricity price, which in the considered references varies between 6.5 and 10 EUR cents/kWh.
The production costs for the centralised biomass-based pathways, at an average of around 3.3 €/kg H2 up to a maximum of 7.4 €/kg H2, lie somewhere between those for natural gas reforming and electrolysis. Here too the dependency on biomass production costs should be noted; depending on what sustainability require-ments are implemented, these costs could rise sharply in future if sustainable biomass as a resource becomes scarce. In the short-
to medium-term outlook (2020 and 2030),
the data situation becomes much sparser.
For decentralised natural gas reforming
only one set of cost data is available, with
no spread. For the biomass pathways the
Essential parameters of the various pro-
duction pathways also include, in addition
to the energy uses and greenhouse gas
emissions described above, the production
costs. These are not included in (JEC 2014)
but have been added from other literature
references. The structure and components
of the pathways in the literature differ in
some details, such as plant size and
capacity utilisation, raw material costs, etc.,
from the pathways considered above.
Here only the pure production costs are
considered; infrastructure and distribution
costs (for road transport) are covered
elsewhere. Key controlled variables for
the analysis and compilation of production
costs are the costs or prices of the primary
energy sources (natural gas, biomass, elec-
tricity, etc.) and energy costs for conversion;
the type, size, capacity and utilisation of
the conversion plant and the conversion
efficiency or yield of hydrogen.
(Grube/Höhlein 2013) compiled the
production costs for hydrogen generated
by various pathways. For their cost compi-
lation they drew on a number of studies,
mostly from 2010 to 2013 but including
two older studies from 2007: (Gökçek
2010; Kwapis/Klug 2010; Lemus/Duart
2010; Liberatore et al. 2012; Michaelis
19
Shell Hydrogen Study
18
2 SUPPLY PATHWAYS

0
10
20
30
40
50
0 20 40 60 80 100 120 140Gravimetric energy density in MJ/kg
Volumetric energy density MJ/l
Natural Gas EU-Mix
CNG 200 bar
LNG Bioethanol
Biodiesel PetrolSyn-Diesel
Diesel
Hydrogen
CGH2 350 barCGH2 700 bar
LH2 20.3ºK
LIQUID
NATURAL GASHYDROGEN
LPG LIQUEFIED GASES
13 ENERGY DENSITY OF FUELS
14 STORAGE METHODS
Cryo-compressed Hydrogen
CcH2
storage and cooled hydrogen storage. As hydrogen has to be cooled down to very low temperatures in order to liquefy, the term cryogenic hydrogen storage is also used. Finally, if compression and cooling are combined, this is also referred to as hybrid storage.
High-pressure storage Compressed Gaseous Hydrogen, CGH2
From production through intermediate storage and on to distribution to the end user, hydrogen is handled at different gas pressures. A low-pressure storage tank operates at just 50 bar. For intermediate storage in high-pressure tanks or gas cylinders, pressures of up to 1,000 bar are technically possible. Only special solid steel or steel composite pressure vessels
tested over lengthy periods of time, include physical storage methods based on either compression or cooling or a combination of the two (hybrid storage). In addition, a large number of other new hydrogen storage technologies are being pursued or investigated. These technologies can be grouped together under the name materials- based storage technologies. These can include solids, liquids or surfaces. Figure 14 shows an overview of the available hydro-gen storage methods. As yet only physical storage by compression and liquefaction have any commercial relevance.
PHYSICAL HYDROGEN STORAGE
Physical storage methods are the most mature and the most frequently used. A distinction is made between high-pressure
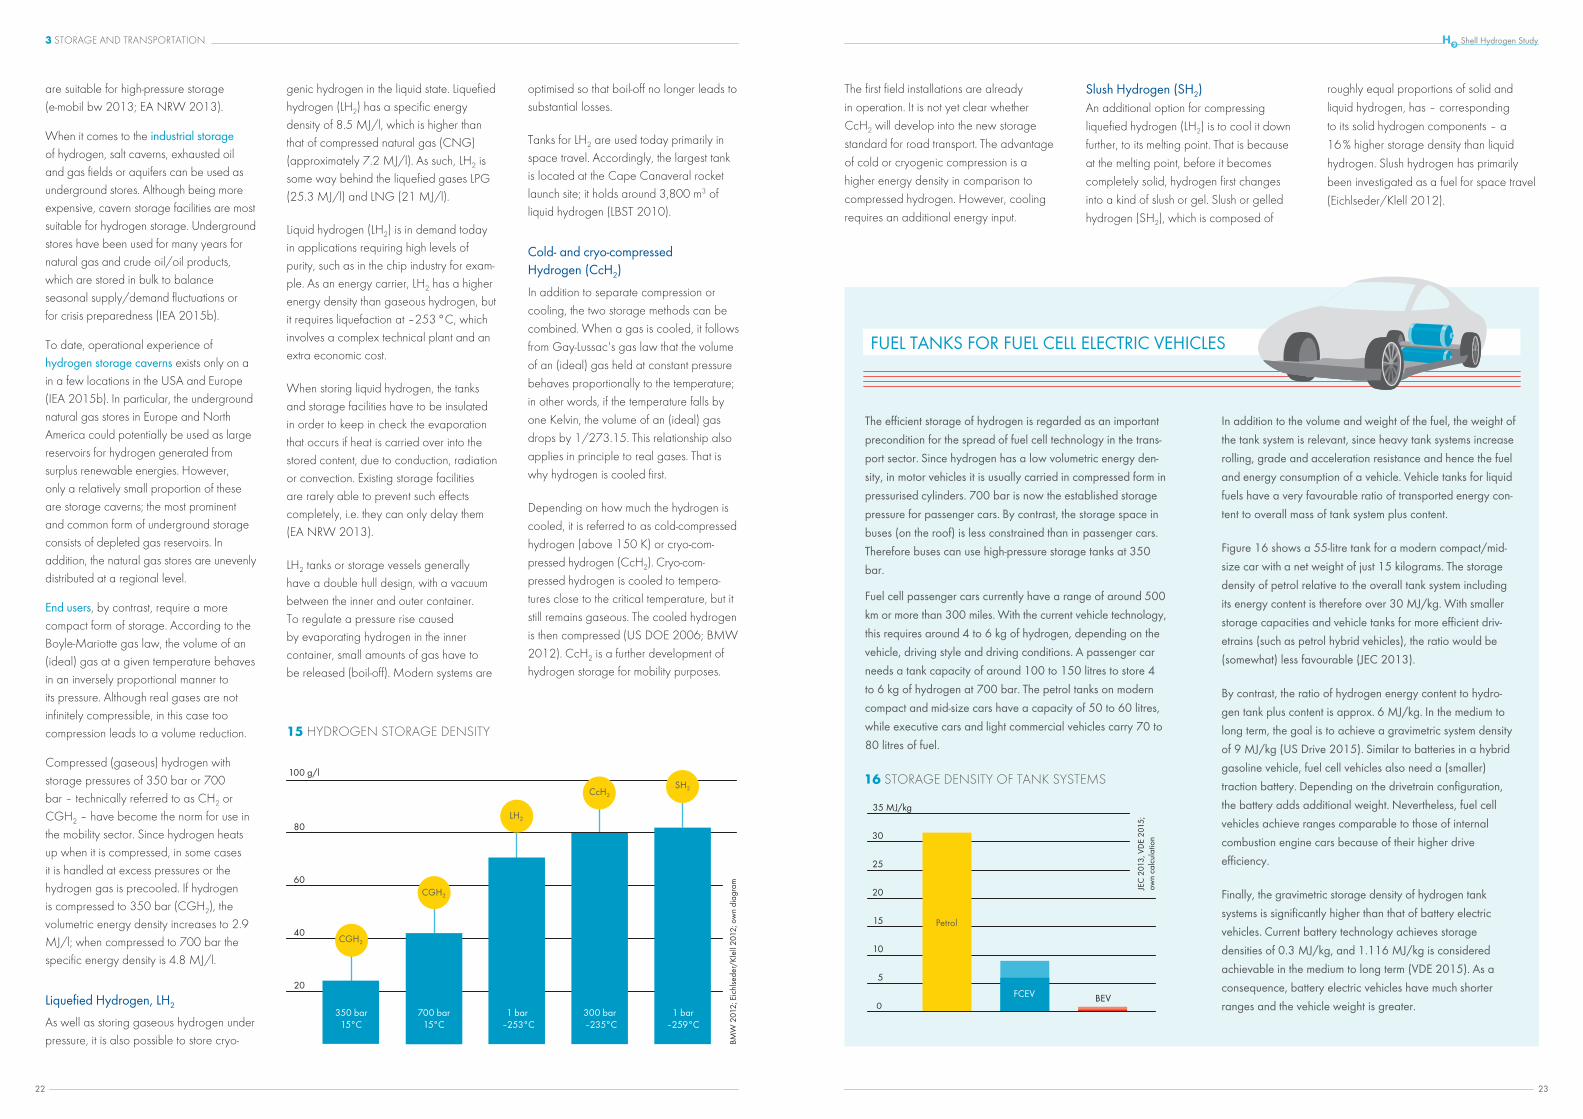
It can be seen that hydrogen as an energy carrier has by far the highest gravimetric energy density (lower heating value), at 120.1 MJ/kg. The higher heating value (not shown in figure 13) is even as high as 141.88 MJ/kg. The mass-based energy density (LHV) of hydrogen is thus almost three times higher than that of liquid hydrocarbons.
However, the volumetric energy density of hydrogen is comparatively low. Under ambient conditions the y-section is almost on the zero-line, at just 0.01 MJ/l. There-fore, for practical handling purposes, the density of hydrogen must be increased significantly for storage purposes.
The most important hydrogen storage methods, which have been tried and
Owing to its physical and chemical properties, the logistics costs (i.e. storage and transportation) for hydrogen are higher than those for other energy sources (such as liquid fuels). This chapter provides an overview of storage technologies for hydrogen as an energy carrier. It then looks at transport options in connection with the corresponding storage methods.
A major advantage of hydrogen is that it can be produced from (surplus) renewable energies, and unlike electricity it can also be stored in large amounts for extended periods of time. For that reason, hydrogen produced on an industrial scale could play an important part in the energy transition. As a chemical energy store, hydrogen could act as means of sector coupling in integrated energy schemes.
fully exploited by 2030, however. Photo-
biological hydrogen production and the
solar thermal cycle are innovative pro-
cesses but have not yet reached maturity.
gas reforming, centralised electrolysis and
centralised biomass pathways in particular
are expected to offer significant cost-saving
potential, which may not yet have been
reference period, i.e. whether the figures
are a projection of the anticipated costs
or the current situation, is not always
transparent. The decentralised natural
Hydrogen can be produced from a large number of primary energy sources and by various technical processes. The most important primary energy source for hydrogen production today is natural gas, with a share of 70 %, followed by oil, coal and electricity (as a secondary energy). Steam reforming (from natural gas) is the most important method of hydrogen production. Electrolysis from electricity currently accounts for around 5 % of global hydrogen production. In addition, only a small amount of unused residual hydrogen, generated as a by-product of industrial production processes, is (still) available.
The importance of renewable energies in hydrogen production is still low, although it will increase in future. Electrolysis from renewable electricity is seen as offering huge potential for the future. Hydrogen can also be produced from biomass, pro-vided that there is sufficient sustainable biomass potential.
IN SUMMARY
Hydrogen generated by electrolysis from renewable energies produces the lowest greenhouse gas emissions. The primary energy input for electrolysis based on conventional electricity is high, whereas that for natural gas and biogas reforming and for renewable electrolysis is low. However, electrolysis from renewable electricity uses a high proportion of renewable primary energy and only small amounts of fossil primary energy.
Of all the production methods and supply pathways considered, centralised hydrogen production is more cost-effective than decentralised production. Centralised natural gas reforming is the most cost-effective method. For newer production pathways, in particular electrolysis from renewables, substantial cost reductions still need to be achieved.
3 STORAGE & TRANSPORTATION
PHYSICAL
Compressed Gaseous Hydrogen
CGH2
(350, 700 bar)
Liquefied Hydrogen
LH2
Slush Hydrogen
SH2
MATERIALS-BASED
Metal Hydrides
Liquid Organic
Hydrogen Carriers
LOHCs
Sorbents
(MOFs, Zeolites,
Nanotubes)
3.1 STORAGE
The way in which an energy carrier is stored is greatly influenced by its energy content. The energy content of an energy source is determined by its calorific value or more precisely by its lower and higher heating value. The lower heating value (LHV) is defined as the amount of usable
heat that is released in a (theoretically) complete combustion. The higher heating value (HHV) additionally takes into account the heat of condensation contained in the water vapour, although this cannot be used by motor vehicles.
The calorific or heating value is a specific quantity and is usually based on the mass
of the energy source, so it is stated in MJ/kg or kWh/kg, for example. Using the density (kg/l), the mass-based calorific value can also be converted into a volu-metric energy density, which is then stated in MJ/l or kWh/l. Figure 13 shows the gravimetric and volumetric energy densities of hydrogen and other gaseous and liquid energy carriers and fuels.
21
Shell Hydrogen Study
20
2 SUPPLY PATHWAYS
20
40
60
80
100 g/l
350 bar15°C
700 bar15°C
1 bar –253°C
300 bar –235°C
1 bar–259°C
BMW
201
2; E
ichl
sede
r/Kl
ell 2
012;
ow
n di
agra
m
CGH2
CGH2
LH2
CcH2
SH2
15 HYDROGEN STORAGE DENSITY
0
5
10
15
20
25
30 MJ/kg
0
5
10
15
20
25
30
35 MJ/kg
Otto FCEV BEV
JEC
201
3, V
DE
2015
;ow
n ca
lcul
atio
n
Petrol
FCEV BEV
roughly equal proportions of solid and
liquid hydrogen, has – corresponding
to its solid hydrogen components – a
16 % higher storage density than liquid
hydrogen. Slush hydrogen has primarily
been investigated as a fuel for space travel
(Eichlseder/Klell 2012).
Slush Hydrogen (SH2)An additional option for compressing liquefied hydrogen (LH2) is to cool it down further, to its melting point. That is because at the melting point, before it becomes completely solid, hydrogen first changes into a kind of slush or gel. Slush or gelled hydrogen (SH2), which is composed of
The first field installations are already in operation. It is not yet clear whether CcH2 will develop into the new storage standard for road transport. The advantage of cold or cryogenic compression is a higher energy density in comparison to compressed hydrogen. However, cooling requires an additional energy input.
optimised so that boil-off no longer leads to substantial losses.
Tanks for LH2 are used today primarily in space travel. Accordingly, the largest tank is located at the Cape Canaveral rocket launch site; it holds around 3,800 m3 of liquid hydrogen (LBST 2010).
Cold- and cryo-compressed Hydrogen (CcH2)
In addition to separate compression or cooling, the two storage methods can be combined. When a gas is cooled, it follows from Gay-Lussac's gas law that the volume of an (ideal) gas held at constant pressure behaves proportionally to the temperature; in other words, if the temperature falls by one Kelvin, the volume of an (ideal) gas drops by 1/273.15. This relationship also applies in principle to real gases. That is why hydrogen is cooled first.
Depending on how much the hydrogen is cooled, it is referred to as cold-compressed hydrogen (above 150 K) or cryo-com-pressed hydrogen (CcH2). Cryo-com-pressed hydrogen is cooled to tempera-tures close to the critical temperature, but it still remains gaseous. The cooled hydrogen is then compressed (US DOE 2006; BMW 2012). CcH2 is a further development of hydrogen storage for mobility purposes.
genic hydrogen in the liquid state. Liquefied hydrogen (LH2) has a specific energy density of 8.5 MJ/l, which is higher than that of compressed natural gas (CNG) (approximately 7.2 MJ/l). As such, LH2 is some way behind the liquefied gases LPG (25.3 MJ/l) and LNG (21 MJ/l).
Liquid hydrogen (LH2) is in demand today in applications requiring high levels of purity, such as in the chip industry for exam-ple. As an energy carrier, LH2 has a higher energy density than gaseous hydrogen, but it requires liquefaction at –253 °C, which involves a complex technical plant and an extra economic cost.
When storing liquid hydrogen, the tanks and storage facilities have to be insulated in order to keep in check the evaporation that occurs if heat is carried over into the stored content, due to conduction, radiation or convection. Existing storage facilities are rarely able to prevent such effects completely, i.e. they can only delay them (EA NRW 2013).
LH2 tanks or storage vessels generally have a double hull design, with a vacuum between the inner and outer container. To regulate a pressure rise caused by evaporating hydrogen in the inner container, small amounts of gas have to be released (boil-off). Modern systems are
are suitable for high-pressure storage (e-mobil bw 2013; EA NRW 2013).
When it comes to the industrial storage of hydrogen, salt caverns, exhausted oil and gas fields or aquifers can be used as underground stores. Although being more expensive, cavern storage facilities are most suitable for hydrogen storage. Underground stores have been used for many years for natural gas and crude oil/oil products, which are stored in bulk to balance seasonal supply/demand fluctuations or for crisis preparedness (IEA 2015b).
To date, operational experience of hydrogen storage caverns exists only on a in a few locations in the USA and Europe (IEA 2015b). In particular, the underground natural gas stores in Europe and North America could potentially be used as large reservoirs for hydrogen generated from surplus renewable energies. However, only a relatively small proportion of these are storage caverns; the most prominent and common form of underground storage consists of depleted gas reservoirs. In addition, the natural gas stores are unevenly distributed at a regional level.
End users, by contrast, require a more compact form of storage. According to the Boyle-Mariotte gas law, the volume of an (ideal) gas at a given temperature behaves in an inversely proportional manner to its pressure. Although real gases are not infinitely compressible, in this case too compression leads to a volume reduction.
Compressed (gaseous) hydrogen with storage pressures of 350 bar or 700 bar – technically referred to as CH2 or CGH2 – have become the norm for use in the mobility sector. Since hydrogen heats up when it is compressed, in some cases it is handled at excess pressures or the hydrogen gas is precooled. If hydrogen is compressed to 350 bar (CGH2), the volumetric energy density increases to 2.9 MJ/l; when compressed to 700 bar the specific energy density is 4.8 MJ/l.
Liquefied Hydrogen, LH2
As well as storing gaseous hydrogen under pressure, it is also possible to store cryo-
The efficient storage of hydrogen is regarded as an important precondition for the spread of fuel cell technology in the trans-port sector. Since hydrogen has a low volumetric energy den-sity, in motor vehicles it is usually carried in compressed form in pressurised cylinders. 700 bar is now the established storage pressure for passenger cars. By contrast, the storage space in buses (on the roof) is less constrained than in passenger cars. Therefore buses can use high-pressure storage tanks at 350 bar.
Fuel cell passenger cars currently have a range of around 500 km or more than 300 miles. With the current vehicle technology, this requires around 4 to 6 kg of hydrogen, depending on the vehicle, driving style and driving conditions. A passenger car needs a tank capacity of around 100 to 150 litres to store 4 to 6 kg of hydrogen at 700 bar. The petrol tanks on modern compact and mid-size cars have a capacity of 50 to 60 litres, while executive cars and light commercial vehicles carry 70 to 80 litres of fuel.
In addition to the volume and weight of the fuel, the weight of the tank system is relevant, since heavy tank systems increase rolling, grade and acceleration resistance and hence the fuel and energy consumption of a vehicle. Vehicle tanks for liquid fuels have a very favourable ratio of transported energy con-tent to overall mass of tank system plus content.
Figure 16 shows a 55-litre tank for a modern compact/mid-size car with a net weight of just 15 kilograms. The storage density of petrol relative to the overall tank system including its energy content is therefore over 30 MJ/kg. With smaller storage capacities and vehicle tanks for more efficient driv-etrains (such as petrol hybrid vehicles), the ratio would be (somewhat) less favourable (JEC 2013).
By contrast, the ratio of hydrogen energy content to hydro-gen tank plus content is approx. 6 MJ/kg. In the medium to long term, the goal is to achieve a gravimetric system density of 9 MJ/kg (US Drive 2015). Similar to batteries in a hybrid gasoline vehicle, fuel cell vehicles also need a (smaller) traction battery. Depending on the drivetrain configuration, the battery adds additional weight. Nevertheless, fuel cell vehicles achieve ranges comparable to those of internal combustion engine cars because of their higher drive efficiency.
Finally, the gravimetric storage density of hydrogen tank systems is significantly higher than that of battery electric vehicles. Current battery technology achieves storage densities of 0.3 MJ/kg, and 1.116 MJ/kg is considered achievable in the medium to long term (VDE 2015). As a consequence, battery electric vehicles have much shorter ranges and the vehicle weight is greater.
FUEL TANKS FOR FUEL CELL ELECTRIC VEHICLES
16 STORAGE DENSITY OF TANK SYSTEMS
23
Shell Hydrogen Study
22
3 STORAGE AND TRANSPORTATION

17 HYDROGEN ROAD TRANSPORT
evaporated hydrogen is extracted from the container, normally at the filling station, and supplied for another use or re-liquefied.
Similarly to lorry transport, LH2 can also be transported by ship or by rail, provided that suitable waterways, railway lines and loading terminals are available.
PIPELINE
A pipeline network would be the best option for the comprehensive and large-scale use of hydrogen as an energy source. However, pipelines require high levels of initial investment, which may pay off, but only with correspondingly large volumes of hydrogen. Nevertheless, one possibility for developing pipeline networks for hydrogen distribution is local or regional networks, known as micro-networks. These could subsequently be combined into transregional networks.
Worldwide there are already (2016) more than 4,500 km of hydrogen pipelines in total, the vast majority of which are operated by hydrogen producers (HyARC 2017). The longest pipelines are operated in the USA, in the states of Louisiana and Texas, followed by Belgium and Germany (see figure 18).
Another possibility for transporting and storing surplus renewable energy in the form of hydrogen is to feed it into the public natural gas network (Hydrogen Enriched Natural Gas or HENG). Until well into the 20th century, hydrogen-rich town gas or coke-oven gas with a hydrogen content above 50 vol% was distributed to house-holds in Germany, the USA and England, for example, via gas pipelines – although not over long distances, for which as yet no experience is available.
per tanker is lower. Single tube trailers carry approximately 500 kg of hydrogen, depending on the pressure and container material.
The largest tank volumes for gaseous hydrogen transport are currently 26 cubic metres. Taking account of the low hydro-gen density factor at 500 bar, this results in a load of around 1,100 kg hydrogen per lorry. This figure extrapolates to approximately 12,000 normal cubic metres of hydrogen. At 250 bar both the weight of hydrogen and its transport volume in Nm3 would be roughly halved.
LIQUID TRANSPORT
As an alternative, hydrogen can be transported in liquid form in lorries or other means of transport. In comparison to pressure gas vessels, more hydrogen can be carried with an LH2 trailer, as the density of liquid hydrogen is higher than that of gaseous hydrogen. Since the density even of liquid hydrogen is well below that of liquid fuels, at approx. 800 kg/m3, in this case too only relatively moderate masses of hydrogen are transported. At a density of 70.8 kg/m3, around 3,500 kg of liquid hydrogen or almost 40,000 Nm3 can be carried at a loading volume of 50 m3.
Over longer distances it is usually more cost-effective to transport hydrogen in liquid form, since a liquid hydrogen tank can hold substantially more hydrogen than a pressurised gas tank. For the purposes of liquid transport the hydrogen is loaded into insulated cryogenic tanks.
LH2 trailers have a range of approximately 4,000 km. Over the journey time the cryogenic hydrogen heats up, causing the pressure in the container to rise. The
3.2 TRANSPORTATION
Today, the transport of compressed gaseous or liquid hydrogen by lorry and of compressed gaseous hydrogen by pipeline to selected locations are the main transport options used commercially – and they are likely to remain so in the medium term. This section discusses the three transport options CGH2 and LH2 by lorry and CGH2 by pipeline and compares their economic advantages.
COMPRESSED GAS CONTAINERS
Gaseous hydrogen can be transported in small to medium quantities in compressed gas containers by lorry. For transporting larger volumes, several pressurised gas cylinders or tubes are bundled together on so-called CGH2 tube trailers. The large tubes are bundled together inside a protective frame.
The tubes are usually made of steel and have a high net weight. This can lead to mass-related transport restrictions. The newest pressurised storage systems use lighter composite storage containers for lorry transport.
The low density of hydrogen also has an impact on its transport: under standard conditions (1.013 bar and 0°C), hydrogen has a density of 0.0899 kg per cubic metre (m3), also called normal cubic metre (Nm3). If hydrogen is compressed to 200 bar, the density under standard conditions increases to 15.6 kg hydrogen per cubic meter, and at 500 bar it would reach 33 kg H2/m3.
A tube trailer cannot store compressed gas as compactly as a tanker for liquid fuels (petrol or diesel fuel). This means that the available tank volume for hydrogen
Liquid organic hydrogen carriers (LOHC)
Liquid organic hydrogen carriers (LOHCs)
represent another option for binding
hydrogen chemically. LOHCs are chemical
compounds with high hydrogen absorption
capacities. They currently include, in
particular, the carbazole derivative
N-ethylcarbazole, but also toluene, which
is converted to methylcyclohexane by
hydrogenation, dibenzyltoluene, ammonia
boranes and formic acid (Von Wild et al.
2010).
Dehydrogenated LOHCs (unsaturated
hydrocarbons) absorb hydrogen in the
presence of a catalyst and at pressures of
30 to 50 bar and temperatures of approx.
150 to 200°C. The heat released by
this process (exothermic) can be used
elsewhere – for heating purposes or for
preheating ahead of dehydrogenation, for
example. The hydrogenated carbazole
derivative has comparable physicochem-
ical properties to diesel fuel and can
be stored and transported accordingly
(Teichmann et al. 2011). Discharge
takes place by dehydrogenation, which
requires a heat input of approximately
250 to 300°C (endothermic reaction).
The released hydrogen may in some cases
also need to be freed from LOHC vapour.
Surface storage systems (sorbents)
Finally, hydrogen can be stored as a
sorbate by attachment (adsorption) on
materials with high specific surface areas.
Such sorption materials include, among
others, microporous organometallic
framework compounds (metal-organic
frameworks (MOFs)), microporous
crystalline aluminosilicates (zeolites) or
microscopically small carbon nanotubes.
Adsorption materials in powder form can
achieve high volumetric storage densities.
The sorption temperatures are generally
well below the discharge temperatures for
liquid and solid storage materials. Adsorp-
tion storage materials as hydrogen stores
are still the furthest removed from practical
implementation in the field.
Materials-based hydrogen storage media
can be divided into three classes (FCTO
2017): first, hydride storage systems;
second, liquid hydrogen carriers; and third,
surface storage systems, which take up
hydrogen by adsorption, i.e. attachment to
the surface.
The intermediate storage of hydrogen in
the form of hydrocarbons (natural gas,
liquefied petroleum gas) or alcohols
(methanol), which can then be used
directly or with the aid of a reformer in
fuel cells, is not considered in any further
detail here.
Hydride storage systems
In metal hydride storage systems the hydrogen forms interstitial compounds with metals. Here molecular hydrogen is first adsorbed on the metal surface and then incorporated in elemental form (H) into the metallic lattice with heat output and released again with heat input. Metal hydrides are based on elemental metals such as palladium, magnesium and lantha-num, intermetallic compounds, light metals such as aluminium, or certain alloys. Palla-dium, for example, can absorb a hydrogen gas volume up to 900 times its own volume (Mortimer/Müller 2010).
The storage density of metal hydride storage systems so far was in the region of 1.5 wt% at room temperature, which means that 1.5 kg of hydrogen could be stored in a storage mass of 100 kg. In recent years, complex hydrides have enabled the storage capacity to be increased to up to 5.5 wt% (i.e. 5.5 kg H2 in a 100 kg storage mass) (EA NRW 2013).
Substantial drawbacks to hydride storage are firstly the large amount of heat energy used for discharging, and secondly – especially for applications in transport – the high mass and the slow absorption and release of hydrogen. Advantages include the filter effect of metallic storage, allowing high-purity hydrogen to be discharged, and the low potential of accidental release.
There are thus clear differences between
the physical storage methods in terms of
the storage density achieved (figure 15).
The highest densities, at 80 and 82 g H2/l
respectively, are achieved by supercritical
cryo-compressed hydrogen (CcH2) and a
50:50 liquid/solid mix of slush hydrogen
(SH2) – albeit at cryogenic temperatures in
each case. Nevertheless liquid hydrogen
(LH2) has a density of over 70 g/l at 1 bar.
By contrast, hydrogen compressed to 700
bar (CGH2) has a density of approx. 40
g/l at 15°C.
Higher storage densities come at a price,
however. The higher the storage density,
the greater the amount of energy needed
for cooling and/or compression, and the
more complex the design of tank systems
and infrastructure.
Currently it takes in the region of 9 to 12 %
of the final energy made available in the
form of H2 to compress hydrogen from 1
to 350 or 700 bar. Supplying hydrogen at
30 bar – from steam reforming for example
– takes approximately 4 to 5 % compres-
sion energy. By contrast, the energy input
for liquefaction (cooling) is much higher,
currently around 30 %. The energy input is
subject to large spreads, depending on the
method, quantity and external conditions.
Work is currently in progress to find more
economic methods with a significantly
lower energy input. In the meantime, the
latest methods for hydrogen liquefaction
involve an energy consumption of less than
20 %. The theoretical energy demand for
compression of hydrogen to 700 bar or its
liquefaction is in the region of 4 to 10 % of
the energy content (US DOE 2009).
MATERIALS-BASED H2 STORAGE
An alternative to physical storage methods
is provided by hydrogen storage in solids
and liquids and on surfaces. Most of these
storage methods are still in development,
however. Moreover, the storage densities
that have been achieved are still not
adequate, the cost and time involved in
charging and discharging hydrogen are
too high, and/or the process costs are too
expensive.
TUBE TRAILER200 – 250 bar, ≈ 500 kg, ambient temperature
CONTAINER TRAILER500 bar, ≈ 1,000 kg, ambient temperature
LIQUID TRAILER1 – 4 bar, ≈ 4,000 kg, cryogenic temperature
25
Shell Hydrogen Study
24
3 STORAGE AND TRANSPORTATION

USA 2,608 km
Belgium 613 km
Germany 376 km
France 303 km
Others 258 km
Canada 147 km
Netherlands 237 km
HyARC 2017; own diagram
18 HYROGEN PIPELINES PER COUNTRY
cylinders. This option is relatively expensive for larger amounts, since the greater the volume of hydrogen to be transported, the larger the number of pressure cylinders required. However, in comparison to liquefaction or to a pipeline network, there are virtually no fixed costs, so this is the best option for small amounts and short distances (Yang/Ogden 2007). It is also a flexible option, since it is available for any route and at any time and the necessary amounts can also be increased (albeit with additional operating costs) and reduced.
If it is available, liquid hydrogen trucking is the preferred option for larger volumes over larger distances. The additional cost for hydrogen liquefaction is then offset by the lower trucking cost.
For the transport of very large hydrogen volumes a comprehensive pipeline network is ideal. This option is dominated by the costs of building the pipeline infrastructure. Once it has been built, the increase in specific transport costs for larger volumes is negligible. A pipeline is thus the most cost-effective choice for large transport vol-umes, whereas for small amounts the fixed costs are very difficult to recover (Yang/Ogden 2007). This conclusion applies to all gaseous and liquid substances to be transported, irrespective of the specific properties of hydrogen.
that are still considered to be critical and to be generally unsuitable for operation with these hydrogen concentrations. For CNG vehicles, the currently authorised limit value for the proportion of hydrogen used is only 2 vol%, depending on the materials built in (UNECE 2013).
Given their length, the large gas networks in many industrial countries could store considerable amounts of hydrogen. A number of different technical methods are available for recovering hydrogen transported by natural gas pipeline from a natural gas/hydrogen mixed gas (NREL 2013b): pressure swing adsorption (PSA), the membrane process, or electrochemical gas separation. However, all separation processes require additional technical effort and energy input.
TRANSPORT ECONOMY
The various transport possibilities each require specific infrastructure and also involve different fixed and operating costs as well as varying levels of energy input and transport capacity. Depending on the transport task (i.e. the amount of hydrogen to be transported, the distance, the priority of low costs, etc.), the most suitable option must therefore be chosen in each case.
If hydrogen is required in small amounts on a laboratory scale, it is typically transported by lorry in gaseous form in pressure
Infrastructure elements that were installed at the time, such as pipelines, gas installations, seals, gas appliances etc., were designed for the hydrogen-rich gas and were later modified with the switch to natural gas. It can be assumed that many of the gas transport networks, distribution lines and storage facilities that were operated in the past are still in use today (Müller-Syring et al. 2013). In Leeds (UK), for instance, the possibility has been explored of converting the existing natural gas network in the region (used primarily for municipal heating supply) entirely to hydrogen (Sadler et al. 2016).
Many countries have looked at adding hydrogen into the existing natural gas networks. For the USA, according to (NREL 2013b), it would be possible to introduce amounts from 5 vol% to 15 vol% hydrogen without substantial negative impact on end users or the pipeline infrastructure. At the same time, the larger additions of hydrogen would in some cases require expensive conversions of appliances.
In Germany this limit has been set some-what lower, at up to 10 vol% (Müller-Syring et al. 2013; Müller-Syring/Henel 2014). In principle, gas at concentrations of up to 10 vol% hydrogen can be transported in the existing natural gas network without the risk of damage to gas installations, distribution infrastructure, etc. However, a number of components have been listed
Hydrogen is used in both gaseous and liquid form. Liquid hydrogen is purer than gaseous hydrogen, since the cryogenic temperatures cause a number of accompanying substances to freeze and drop out. The hydrogen quality is differentiated by degree of purity. Hydrogen is available up to a purity grade of 7.0; this corresponds to a purity of 99.99999 %. What should be the quality requirements for hydrogen as an energy carrier?
Impurities and accompanying substances in hydrogen are dependent on the manufacturing process. Thermochemical production methods may give rise to more accompanying substances which, depending on the subsequent application, require the hydrogen to undergo a multistage post-production purification treatment. Hydrogen from electrolysis contains exceptionally few undesired accompanying substances – principally water vapour (H2O).
Hydrogen as a feedstock has long been used for industrial processes, either as a feed material for chemical production through to semiconductor production, or for energy purposes as a supplementary energy source in thermal processes. Its use in fuel cells is relatively new.
While thermal processes are relatively robust in the face of (minor) fluctuations in fuel quality, fuel cells – depending on type – may react very sensitively to impurities and accompanying substances in the hydrogen. This is especially true of fuel cells with noble metal catalysts. In this case impurities and accompa-nying substances can lead to irreversible loss of performance in the fuel cells.
High-temperature fuel cells (MOFC, SOFC) are less sensitive. The hydrogen used in low-temperature fuel cells with noble metal catalysts must have a high purity. For that reason, ISO standard 14687 (published in 1999) established quality requirements for hydrogen for use in PEM fuel cells. ISO standard 14687 was last revised in 2012.
For use in PEM fuel cells in motor vehicles, ISO 14687 Part 2 requires a hydrogen purity degree of 3.7 or a hydrogen content of at least 99.97 %. Furthermore, specific concentration values for a number of undesired substances must not be exceeded. These substances include in particular sulphur compounds, carbon monoxide (CO), carbon dioxide (CO2), ammonia (NH3), formaldehyde (CH2O) and hydrocarbons.
SAFETY
Hydrogen is a combustible gas. And if combustible gases are
released, they can form explosive mixtures with air. Hydrogen
is known from chemistry lessons in particular for the so-called
oxyhydrogen or Knallgas explosion. It is therefore legitimate to
ask (DWV 2011): How safe is hydrogen? What factors have
to be taken into account to ensure hydrogen is handled safely?
Safety-related information about substances and mixtures is
summarised in safety data sheets. ISO Technical Report 15916 (2015) contains international guidelines for the safe handling
and storage of gaseous and liquid hydrogen. Safety require-
ments for specific applications are laid down in other ISO
standards referenced in that report; they include, for example,
ISO 19880 (2016), which describes safety and performance
requirements for compressed hydrogen refuelling stations for
passenger cars and other motor vehicles.
First of all, hydrogen by itself is not explosive; it is not self-igniting, decayable or oxidising. Moreover, hydrogen is not toxic, corrosive, radioactive, foul-smelling, water-polluting or even carcinogenic. Hydrogen can however displace atmospheric oxygen and as such have an asphyxiating effect. Its most obvious safety-related feature is its high flammability and the broad ignition limits in hydrogen-air mixtures from 4 to 77 %.
Yet hydrogen cannot burn on its own. It requires an oxidant (air/oxygen) to do so, along with an ignition source, such as an electric spark. If hydrogen in pure form is brought together with air/oxygen and an ignition source, it burns almost invisibly. For the safe handling of hydrogen, it follows that:
Unlike liquid fuels hydrogen is stored and transported in pure form and in closed resp. completely sealed systems/tanks. Hydrogen pressure tanks, which are most commonly used,
PRODUCT QUALITY
27
Shell Hydrogen Study
26
3 STORAGE AND TRANSPORTATION

+ –
AmmoniaRefining
Methanol
Other
55%
25%
10%
10%
Zakkour/Cook 2010; own diagram
Firstly, hydrogen occurs as a by-product in the catalytic reforming of naphtha. With the hydrogen obtained from reforming, the oil products, which still have a high sulphur content after distillation, are desulphurised by hydrotreating in the presence of a catalyst. Here the oil products are heated together with hydrogen, and the hydrogen sulphide that forms from sulphur and hydro-gen is drawn off.
In hydrocracking, by contrast, the aim is to increase the product yield. To this end, long-chain hydrocarbons are heated and converted into shorter-chain hydrocarbons with the aid of hydrogen and in the presence of catalysts. Furthermore, hydro- cracking makes it easier to remove product impurities. Since the amount of hydrogen obtained from naphtha reforming is no longer sufficient for hydrotreatment and hydrocracking in refineries, the necessary hydrogen must be specifically produced – by natural gas steam reforming or partial oxidation of (heavy) fuel oil. In the future, the hydrogen needed for fuel production could also be produced by electrolysis from renewable energies (“green hydrogen”).
It is expected that there will be a further rise in hydrogen demand in refineries worldwide. One reason for this trend is the endeavour to achieve greater processing depths for each barrel of crude oil. Another are the worldwide increasing quality requirements for fuels (e.g. freedom from sulphur and metals), especially in the emerging markets (IEA 2016b); better fuels are needed to comply with more stringent engine standards and stricter exhaust gas regulations.
Finally, not only mineral oils, but also vegetable oils can be hydrogenated. The latter can either be hydrogenated in refineries together with fossil intermediates (co-hydrogenation) or in separate biofuel plants. Hydrogenated Vegetable Oil (HVO) is a fungible paraffinic fuel com-parable to Diesel fuel. The hydrogenation process is also used in food chemistry to harden oils and fats and in the plastics industry for polymer production.
AMMONIA (FERTILISERS)
The most important hydrogen-nitrogen com-pound is ammonia (NH3), also known as azane. Technically, ammonia is obtained on a large scale by the Haber-Bosch process. This process combines hydrogen and nitrogen together directly by synthesis. To this end, the starting materials nitrogen and hydrogen must first be obtained. In the case of nitrogen this is achieved by low-temperature separation of air, while hydrogen originates today from natural gas steam reforming.
Ammonia is synthesised at temperatures of 500°C and pressures of 200 bar. As triple-bonded atmospheric nitrogen (N2) is very unreactive, the presence of an iron-based catalyst is required. The elements hydrogen and nitrogen react together in the proportion 3:1 in accordance with the following reaction equation:
3 H2 + N2 → 2 NH3
The yield of the Haber process, i.e. the conversion rate of nitrogen (N2) to ammonia (NH3) is modest, at below 20 %; so substantial recycling of unreacted gases occurs.
Ammonia itself is a colourless gas with a pungent odour. It is readily water-soluble. Almost 90 % of ammonia goes into fertiliser production. For this purpose, a large part of the ammonia is converted into solid fertiliser salts or, after catalytic oxidation, into nitric acid (HNO3) and its salts (nitrates) (Holle- mann/Wiberg 2007; Mortimer/Müller 2010).
Owing to its high energy of evaporation, ammonia is also used in refrigeration plants as an environmentally friendly and inexpen-sively produced refrigerant; its technical name is R-717.
REFINERIES
In refineries, crude oil is processed by various methods into oil products such as naphtha, petrol and diesel fuels, heating oil and aviation fuels. Following distillation (heating), other refining processes are used in order to obtain the desired products and product qualities. Hydrogen plays an important part in some refinery processes.
Hydrogen is a highly versatile basic chem-ical, which is used in chemical production and industry to produce, process or refine intermediates and/or end products. It is estimated by (Zakkour/Cook 2010) that between 45 Mt/a and 50 Mt/a of hydro-gen are produced worldwide, and around 7.8 Mt/a are used in Europe (Le Duigou et al. 2011).
19 GLOBAL USAGE OF HYDROGEN
4.1 MATERIAL AND INDUSTRIAL APPLICATIONSshould have high safety margins and be fitted with relief valves.
Ignition sources must be avoided.
Since hydrogen is lighter than air, it escapes upwards. Therefore hydrogen should either be stored in the open air or, if in enclosed spaces, with good aeration and ventilation. Hydrogen sensors also increase safety.
Since hydrogen molecules are very small, they can diffuse through many materials. For steel tanks this is less of a problem. Modern composite materials can be protected against hydrogen diffusion and material embrittlement by means of appropriate coatings, materials and suitable operating conditions.
Hydrogen has only a very low volumetric energy density, which means that it has to be compressed for storage and transporta-tion purposes.
The most important commercial storage method – especially for end users – is the storage of hydrogen as a compressed gas. A higher storage density can be achieved by hydrogen liquefaction. Novel materials-based storage media (metal hydrides, liquids or sorbents) are still at the R&D stage.
The storage of hydrogen (e.g. for compression or liquefaction) requires energy; work is in progress on more efficient storage methods.
Unlike electricity, hydrogen can be successfully stored in large amounts for extended periods of time. In long-term underground
storage facilities hydrogen can take on an important role as a buffer store for electricity from surplus renewable energies.
At present, hydrogen is generally transported by lorry in pressurised gas containers, and in some cases also in cryogenic liquid tanks. Moreover, local/regional hydrogen pipeline networks are available in some locations.
In the long-term, the natural gas supply infrastructure (pipelines and underground storage facilities) could also be used for the storage and transportation of hydrogen.
Liquid hydrogen is suitable for long-distance transport, com-pressed gaseous hydrogen is suitable for shorter distances in smaller amounts, while pipelines are advantageous for large volumes.
4 APPLICATIONS
Since hydrogen practically only exists on Earth in a combined form, in order to be used it must first be produced by means of an elaborate process. But what exactly is hydrogen produced for? What are its most important areas of application?
In fact there are many possible applications for the element hydrogen. It has two main areas of use: material applications and energy applications. Material applications of hydrogen involve the further processing or refining of other substances or intermediates with the aid of or by adding hydrogen. In most cases special processes are required, which bring about the desired results through pressure, temperature and
reaction-promoting catalysts. Its use as an energy source involves using the energy contained in hydrogen to produce higher-value energy (electricity), heat and (finally) also mechanical energy. Here too there are a number of different usage pathways, which are in turn dependent on the energy conversion technology used.
This chapter begins by describing the most important material hydrogen applications in industry. It then looks at the options for energy usage and analyses the most important conversion technology – namely the fuel cell and its various design types – in more detail.
Hydrogen is used in large quantities for chemical product synthesis, especially to form ammonia and methanol. Refineries, where hydrogen is used for the processing of intermediate oil products, are another area of use. Thus, about 55 % of the hydro-gen produced around the world is used for ammonia synthesis, 25 % in refineries and about 10 % for methanol production. The other applications worldwide account for only about 10 % of global hydrogen production.
It is not always possible to draw final conclusions from the amount of hydrogen used about its relevance in specific pro-duction processes and/or its commercial importance in a given application area. Only a small part of global hydrogen production (approx. 4 %) is traded freely (Yergin et al. 2009).
This section briefly describes the most important industrial processes and areas of material use of hydrogen.
IN SUMMARY
29
Shell Hydrogen Study
28
3 STORAGE AND TRANSPORTATION

ANODEELECTROLYTE
CATHODE
+ –
eigene Darstellung
H2 ½ O2
2e– 2e–
H2 + ½ O2 = H2O HEAT
+
4 H+ + 2 O2– → 2 H2O
The side on which the reaction gases accumulate and the type of ion transport through the electrolyte that is needed to close the circuit are dependent on the cell type (see figure 22).
Finally, the gas diffusion layer ensures a uniform distribution of the inflowing gases and reaction products along with the removal of electrons and process heat.
FUEL CELL TYPES
Fuel cells are categorised primarily by the type of electrolyte and the temperature at which the cell is operated. Five groups of fuel cells are differentiated by electrolyte type, and three ranges by temperature: low-temperature at less than approximately 100°C, medium-temperature above 100°C, and high-temperature above 500°C. The following section briefly presents the most important fuel cell types by electrolyte, along with their main areas of application, advantages and disadvan-tages, and the market development status. Table 21 contains a summary of important performance parameters of fuel cells.
In general, the necessary purity of the hydrogen used decreases as the tempera-ture rises – the lowest temperatures require the purest hydrogen. The efficiencies that can be achieved by the fuel cells are dependent among other things on the operation with air or pure oxygen.
In addition to the schematic representation shown here, the following elements are also needed to operate a fuel cell: conditioning of fuel, air and waste gas, cooling circuit, power circuit, humidifier line, measurement and control technology, safety equipment and additional equipment for start-up.
A fuel cell system consists of individual fuel cells connected in series – also known as stacks. The core component of the fuel cell is the membrane electrode assembly (MEA), which determines the performance of the fuel cell. It consists of two porous, catalyst-doped electrodes (cathode and anode), an electrolyte (ionic conductor) arranged between them, and the gas diffusion layers.
The electrolyte separates the gases from each other, but is permeable for certain ions (electrically charged particles). The hydrogen gas supplied to the anode side is split into ions due to the catalyst action and gives off electrons:
2 H2 → 4 H+ + 4e–
These electrons are directed to the cathode via an external circuit, in which they per-form electrical work. There they cause the oxygen to ionise in accordance with the following reaction equation:
O2 + 4 e– → 2 O2–
Lastly, the free oxygen and hydrogen radicals combine with heat output to form electrically neutral water:
waste heat is at a sufficiently high temper-ature level, a combined heat and power power process can be added downstream. That is the case with the high-temperature fuel cells (SOFC and MCFC); this gives rise to much higher overall efficiencies than in pure thermal engines.
The direct conversion of chemical energy is already known from batteries. These have a finite internal store of energy. A fuel cell can provide a continuous supply of elec-tricity for as long as the cell is fed with fuel. In the simplest case the fuel is hydrogen, which combines with oxygen in a reaction to form water. By spatial separation into two half-cells – by means of an electrolyte, membrane and/or diaphragm – the two substances are unable to react directly with each other, so a controlled reaction can occur.
Depending on the fuel cell type, the temperatures reached during catalytic combustion are well below the hydrogen combustion temperatures, at approx. 60°C to 1,000°C. The process is also referred to as cold combustion. The formation of nitrogen oxides (NOx) in the presence of air only begins at temperatures above 1,500°C, so this pollutant issue is avoided in catalytic combustion (Weber 1988).
STRUCTURE & FUNCTIONING
While electrolysis breaks down water into its constituents oxygen and hydrogen using direct current, the reverse process of electrolysis, i.e. the recombination of oxygen and hydrogen to form water with production of direct current takes place in a fuel cell. The basic structure and operation of a fuel cell are illustrated in figure 20.
than that, only hydrogen accruing as a by-product in industry is still occasionally co-combusted, if no economic use can be found for it.
Given the technical progress made in fuel cell technology in recent years, but also because of the technical requirements applying to hydrogen-powered heat engines, the use of hydrogen as a fuel is now focused almost entirely on the fuel cell.
FUEL CELL
The fuel cell principle was discovered as early as 1838/39. At the time, however, the fuel cell was unable to make any inroads against the steam engine/genera-tor combination. Unlike heat engines, a fuel cell can convert chemically bound energy into electrical energy directly, i.e. without detouring via a thermal power process.
The optimum efficiency of heat engines is denoted by the Carnot efficiency (Bosch 2014). This is dependent on the ratio of the (upper) combustion temperature to the (lower) incoming air temperature. In fact, heat engines cannot convert the entire heat of the combustion process into mechanical energy, only a part of it.
The generation of electricity via heat engines also requires the use of a genera-tor. Moreover, real heat engines operated by petrol or diesel processes remain well below theoretical Carnot efficiencies. And when operated with fossil fuels they emit both air pollutants and greenhouse gases.
In fuel cells, the energy contained in hydro-gen is converted into electrical and heat energy. In this process, 286 kilojoules of energy are released per mol of hydrogen. The conversion of this released energy (reaction enthalpy) into electrical energy determines the maximum efficiency of a fuel cell. In theory, fuel cells can reach cell efficiencies of over 80 %. However, owing to voltage losses the efficiencies that are actually achievable are lower (Eichlseder/Klell 2012).
Since a fuel cell produces waste heat as well as electricity, it can also be used in combined heat and power processes. If the
flat glass production (hydrogen used as an inerting or protective gas), the electronics industry (used as a protective and carrier gas, in deposition processes, for cleaning, in etching, in reduction processes, etc.), and applications in electricity generation, for example for generator cooling or for corrosion prevention in power plant pipelines (LBST 2010).
The direct reduction of iron ore – i.e. the separation of oxygen from the iron ore using hydrogen and synthesis gas – could develop into an important industrial process in steel manufacturing, because in the tradi-tional blast furnace method large amounts of carbon are released (LBST 2010). While direct reduction with natural gas is now well-established in steel production (World Steel Association 2015), corresponding production methods based on hydrogen so far exist only on a pilot scale.
4.2 ENERGY APPLICATIONSIn terms of energy applications, hydrogen is above all a secondary energy source and chemical energy store. The energy it contains can be used either in thermally operating heat engines or in galvanic (fuel) cells.
When hydrogen (H2) is burned with pure oxygen (O2), water is formed in accord-ance with the following reaction equation:
2 H2 + O2 → 2 H2O
In contrast to the combustion of hydro-carbons, no carbon dioxide is formed in this process. If hydrogen is burned with air, nitrogen oxides are also produced. Very high temperatures are reached in hydrogen combustion – above 2,000°C to 3,000°C, depending on the ratio and oxygen content of combustion air.
Although hydrogen is generally a clean and potent fuel with high energy content and attractive combustion properties, hydrogen's use for energy purposes now rarely lies in (hot) combustion. There has been little further research and development in hydrogen-fuelled internal combustion engines in the recent past.
Only in space travel hydrogen is still used as a propellant for rocket engines. Other
METHANOL
Hydrogen is also an important basic substance for producing methanol (CH3OH). The production of methanol (methanol synthesis) takes place by means of the catalytic hydrogenation of carbon monoxide (Hollemann/Wiberg 2007). Here a mixture of carbon monoxide and hydrogen – also known as water gas or synthesis gas – is passed over suitable catalysts. Under pressure and at elevated temperature, methanol is formed almost exclusively, in accordance with the follow-ing reaction equation:
CO + 2 H2 → CH3OH
Methanol or methyl alcohol is a simple alcohol and highly toxic. Structurally its composition is similar to that of methane (CH4), but one hydrogen atom is substituted by a hydroxyl group (OH).
Methanol can be used directly as a fuel in internal combustion engines. It is also used in direct methanol fuel cells or, after reforming, in PEM fuel cells. Fuel additives are produced from methanol, and it is used to transesterify vegetable oils to form methyl esters (biodiesel). Methanol is also a central chemical raw material, from which important chemical intermediates like formaldehyde (CH2O), acetic acid (C2H4O2) and others are synthesised. The demand for methanol has been rising steadily since 2009. A further growth in methanol demand is expected (Johnson 2012).
OTHER APPLICATIONS
The other applications, which in total make up around 10 % of hydrogen usage, consist of two groups:
Firstly, hydrogen is used to produce a large number of other important chemical compounds. These include (according to LBST 2010) base materials for paints and synthetic fibres, various raw materials and precursors for nylon production and polyure-thane elastomer production, and use for the plasticisation and elasticisation of plastics.
Secondly, hydrogen is needed in other industrial applications; these include metalworking (primarily in metal alloying),
20 PRINCIPLE OF THE FUEL CELL
>> The fuel cell is a greater achievement of civilisation than the steam engine and will soon banish the Siemens generator
into the museum. <<
Wilhelm Ostwald (Nobel prize winner) at the 2nd annual meeting of the Association of
German Electrical Engineers in 1884 (Verband Deutscher Elektrotechniker)
31
Shell Hydrogen Study
30
4 APPLICATIONS

PAFCs are low. Their electrical efficiency is relatively low (40 %), although by using waste heat higher overall efficiencies (80 %) can be achieved than with AFCs and PEMFCs. PAFCs are less sensitive to carbon monoxide, but they require a higher noble metal loading.
PAFCs also require a complex water management process and have high material requirements. Because of their aggressive electrolyte, this cell type is less suitable for the small output range (in the building sector) and mobility applications; in the stationary sector, however, they have had a high degree of technological matu-rity for some time now. Further potential for cost reduction is considered to be low, however. They are used mostly in large stationary fuel cells (such as small power plants), but in low numbers.
Molten carbonate fuel cell (MCFC)
The molten carbonate fuel cell (MCFC) is categorised as a high-temperature cell. A carbonate melt is used as the electrolyte. The operating temperature for MCFCs is 600 to 700°C. Like PAFCs, MCFCs cover a broad output spectrum up to the MW range, and require a lot of space.
approximately 200°C), while at the same time eliminating the complex water management process.
Furthermore, the carbon monoxide and carbon dioxide tolerance and the overall efficiency are higher – especially when it comes to waste heat utilisation. The use of heat- and acid-resistant materials gives rise to higher production costs, however. In addition, the HT-PEMFC is technologically less mature than the LT-PEMFC.
A special application of the PEMFC is the direct methanol fuel cell (DMFC). The DMFC operates in a similar temperature range (50 to 120°C) to the LT-PEMFC. It can use the hydrogen contained in methanol (CH3OH) directly, and then benefits from the high storage density of methanol. However, the efficiency of the DMFC is relatively low (20 %). It is mostly used in small devices. Overall, it plays only a minor role in the fuel cell market.
Phosphoric acid fuel cell (PAFC)
The phosphoric acid fuel cell (PAFC) is cat-egorised in the medium temperature range (approx. 160–220°C). PAFCs cover a broad output spectrum up into the MW range. The power density and flexibility of
Of all the fuel cell types, PEMFC systems have the highest potential for cost reduction with regard to production volume. In the long-term, production costs of 30 $/kWel are considered to be achievable, com-parable to those for internal combustion engine drive-trains. Today, the service life of PEMFCs is approximately 5,000 operating hours which is sufficient for a travel distance of around 100,000 miles or 150,000 to 200,000 km (IEA 2015b).
The LT-PEMFC currently dominates the world market for fuel cells, in terms of both the number of installed systems and the output of the fuel cells (E4tech 2016).
A further development of the low-tempera-ture PEMFC is the high-temperature PEMFC. The HT-PEMFC uses a novel, acid-doped membrane and therefore does not need water for its conduction mechanism. This enables higher operating temperatures to be achieved (up to
In addition, the overall efficiency increases if the fuel cell is used not only for electricity generation but rather in combined heat and power (CHP) systems, i.e. which utilise the electricity as well as the heat produced.
Alkaline fuel cell (AFC)
The alkaline fuel cell is the pioneer among fuel cells. It was first used at an early stage of space travel – for example for the on-board power supply for the Apollo mission in the 1960s. In its initial phase, the AFC was used almost exclusively for mobility applications, but it is also being tested in stationary applications.
The AFC is a low-temperature fuel cell. Key advantages include the rapid attainment of the low operating temperature and the compact design. The use of a simple electrolyte (potassium hydroxide solution) and low-cost catalysts (base metals) leads to low investment costs.
The main problem with the AFC is that it has a very low carbon dioxide tolerance and is therefore dependent on a supply of very pure gases, especially pure oxygen. Despite further developments such as the alkaline membrane fuel cell (AMFC), the AFC is inferior to the PEMFC in terms of output and durability.
Polymer electrolyte fuel cell / Proton exchange membrane fuel cell (PEMFC)
The polymer electrolyte membrane is also a low-temperature (LT) fuel cell, which operates at temperatures of around 80°C. Unlike the AFC, the PEMFC has a solid polymer membrane as the electrolyte. In contrast to the AFC, this avoids an elab-orate preparation of the electrolyte. The PEMFC has a high power density and a small volume, making it especially suitable for mobility applications.
The noble metal catalyst (platinum) leads to high construction costs. Since the catalyst is also poisoned by sulphur and carbon monoxide, the PEMFC requires pure hydrogen. Unlike the AFC, however, it can operate with air rather than with pure oxygen. The LT-PEMFC additionally requires a complex water management process.
>> PEM is likely to be the leading technology way into the future. <<
E4tech 2016
Unlike PAFCs, MCFCs have high electrical efficiencies of over 60 % (stack) or around 55 % (system). Electrical efficiencies of approximately 65 % and overall efficien-cies of 85 % can be achieved by using the waste heat by means of a downstream thermal power process for additional electricity generation.
The high operating temperature allows the use not only of hydrogen but also of hydrogen-containing gases (such as natural gas or biogas) or methanol in conjunction with an internal reforming process. If hydrocarbons are used, how-ever, carbon dioxide emissions are also produced. Expensive noble metal catalysts are not necessary for MCFCs, but they do require high-temperature-resistant and corrosion-resistant materials. MCFCs are used primarily in the power plant sector – in low numbers.
Oxide ceramic fuel cell / Solid oxide fuel cell (SOFC)
The solid oxide fuel cell (SOFC) is a high- temperature cell (approx. 500 –1,000°C), the electrolyte for which consists of a solid porous ceramic material. SOFCs cover a broad range of applications,
from decentralised power supply (a few kilowatts) up to the power plant sector (several megawatts). Owing to their high operating temperature, SOFCs require relatively long start-up times. Like MCFCs, SOFCs have high electrical efficiencies (around 60 %, or up to 70 % with a downstream thermal power process) and high overall efficiencies (up to 85 %). The high operating temperature allows for the internal reforming of hydrogen-rich gases or liquid fuels. Once again, however, if hydrocarbons are used, carbon dioxide emissions are also produced. Expensive noble metal catalysts are not necessary for SOFCs, but they do require high-tem-perature-resistant materials. SOFCs are not only tolerant of carbon monoxide but they are also sulphur-tolerant. Compared with MCFCs, SOFCs are characterised by lower investment costs and a much longer service life.
In recent years SOFCs have developed into the second most important fuel cell type after the PEMFC, in terms of both numbers and installed capacity. Incentive schemes for stationary fuel cells for domestic energy supply have contributed to this success (E4tech 2016).
Fuel cell typeTemperature
range °CElectrolyte Electrical performance Fuel Oxidant Efficiency el
(HS)Investment costs
USD/kWel
Life expectancy (h)
Market development Application
AFC 60 – 90 Potassium hydroxide Up to 250 kW H2
O2 (pure) 50 – 60 % 200 to 700 5,000 to 8,000 Established for decades, but
limited to specialised applications Space travel, submarines
PEMFC50 – 90 (LT)
up to 180 (HT)Polymer
membraneFrom 500 W to
400 kW
H2, gas, syngas, biogas, methanol
(external reforming)O2
30 – 60 %(depending on size and
application)
3,000 to 4,000(stationary)
~500 (mobile)
60,000 (stationary)
5,000 (mobile)
Early market / matureleading fuel cell type
Vehicle drivetrains, space travel, micro + block-type CHP,
backup power
PAFC 160 – 220 Phosphoric acid Up to several 10 MW
H2, gas, syngas, biogas, methanol
(external reforming)O2 30 – 40 % 4,000 to 5,000 30,000 to
60,000Mature
(low volume)Decentralised power generation,
block-type CHP
MCFC 600 – 700 Carbonate meltFrom a couple of
100 kW to several MW
H2, gas, syngas, biogas, methanol
(internal reforming)O2 55 – 60 % 4,000 to 6,000 20,000 to
40,000Early market / market introduction
(especially for bigger plants)Power plants (base load), CHP
(process heat/steam)
SOFC 700 –1,000 Solid ceramic oxide
From a couple of kW to several MW
H2, gas, syngas, biogas, methanol
(internal reforming)O2 50 – 70 % 3,000 to 4,000 up to 90,000 Mature
(volumes rising)Power plants, CHP (process heat/steam), micro + block-type CHP
Wagner 1996; Drenckhahn/Hassmann 1993, updated with IEA 2015b, EA NRW 2017 (www.brennstoffzelle-nrw.de) and own additions
21 FIVE TYPES OF FUEL CELL EXPLAINED
33
Shell Hydrogen Study
32
4 APPLICATIONS

ANODE ELECTROLYTE CATHODE+ –
WBZU 2008; own diagram
SOFC1000˚C
MCFC650˚C
PAFC200˚C
AFC80˚C
PEM80˚C
HEAT
2e– 2e–
O2-
CO2-
H+
OH-
O2
O2
CO2
H2O
O2
O2
H2
H2
H+ H2O
O2
H2
H2
CO
H2
CO
CO2
H2O
CO2
H2O
3
Oxygen O2 Fuel gas
Residual gas H2/CO
Reaction gas H2O/CO2
Residual gas O2/N2
Reaction gas H2O
H2O
Residual gas O2/N2
gas H2O
Backup power
Figure 22 shows the most important fuel cell types by points of origin of the reaction products on the anode or cathode side and the direction and type of ion transport through the electrolyte. Between them, the various fuel cell types cover a wide temperature range. Low operating temperatures allow for a dynamic load response, while high temperatures favour continuous loads. In addition, the electrolytes of the HT fuel cells are more resistant to impurities and to variations in fuel quality.
As combustion gases, either hydrogen is oxidised to water or carbon monoxide to carbon dioxide. In the PEMFC and PAFC the occurring water is drawn off at the cathode. In the case of the AFC and the high-temperature SOFC and MCFC cells, by contrast, the reaction products of the fuels supplied on the anode side leave the cell again on the same side. A special feature of the AFC is that it gives off product water via the electro-lyte, causing the electrolyte to be diluted (Wendt/Plzak 1990).
Air or pure oxygen is supplied at the cathode as oxidant. Correspondingly, nitrogen and oxygen occur as residual gases at the cathode outlet. The fuel for the fuel cell can either be used directly in the fuel cell or prepared from various hydrogen-rich intermediates such as natural gas, methanol or synthesis gas via reforming. Depending on the operat-ing temperature, reforming takes place internally or externally.
22 WORKING PRINCIPLE OF SELECTED FUEL CELLS
Hydrogen is a highly versatile basic chemical. The most impor-tant material applications in industry are ammonia synthesis (fertilisers) and methanol synthesis. Another important use is the refining of oil and intermediates in refineries – called hydro- treating and hydrocracking – as well as the hydrogenation of vegetable oils in (bio-) refineries.
Although it is possible to use hydrogen as an energy source in heat engines (such as the internal combustion engine), that rarely occurs now.
The fuel cell is now the leading conversion technology of hydrogen usage for energy purposes. Fuel cells have made
huge technical progress in recent years and offer much higher electrical and overall efficiencies than thermal engines.
The world market for fuel cells is currently dominated by the low-temperature polymer electrolyte membrane fuel cell (PEMFC), which because of its power density, flexibility and cost reduction potential is most suitable for mobility purposes.
The solid oxide fuel cell (SOFC) has developed into the second most important fuel cell type. This high-temperature fuel cell is used for continuous domestic energy or electricity supply and in the power plant sector.
In comparison to conventional thermal power plants, fuel cells have much higher electrical efficiencies of up to 60 %, even for small plants. This is advantageous from an exergetic perspective, since a lot of high-value electricity and little heat are produced.
In ongoing operation, fuel cell backups are characterised by the following advantages: long autonomous operation and service life, low maintenance costs due to the lack of moving parts, and quiet, (locally) emission-free electricity generation (FCTO 2014a, HMWEVL 2016).
The backup capacity of stationary fuel cells varies from a few kW to over 1 GWe. Fuel cells with low-wattage electrical outputs are often portable fuel cells, which offer weight advantages over recharge-able batteries and generators. A variety of different fuel cell types are used in the
5.1 ELECTRICITY GENERATIONStationary fuel cells can be used for decen-tralised power supply in off-grid areas. The market for backup power applications (BUP) is becoming increasingly important. Backup applications include firstly emergency power supply and secondly uninterruptible power supply (UPS).
Emergency generator sets are used for maintaining operation in the event of lengthy power outages. In such cases the switchover from the mains power supply is usually (briefly) interrupted.
Uninterruptible power supplies, on the other hand, are used to protect highly sensitive technical systems against mains supply fluctuations and short-term outages, so as to ensure continuous operation. Areas of use include in particular telecommunications and IT systems, such as radio towers or data processing centres.
the most important drivers of global market development for fuel cell technology (US DOE 2016).
Fuel cells generate both electricity and (by-product) heat. The com-mon production and use of electricity and heat is also known as cogeneration or combined heat and power (CHP). In some cases only electricity generation is of interest, especially in the case of backup power units. Sometimes a relevant additional value is also seen in use of the by-product heat e.g. in the residential sector.
The use of hydrogen for energy purposes occurs mainly in fuel cells. In 2015 and 2016 some 50,000 fuel cell systems were delivered worldwide, with a total generating capacity of approximately 200 MW (nominal electric output).
Around 80 % of the fuel cell systems supplied and 60 % of the fuel cell capacities shipped were stationary applications (E4tech 2016). Although transport applications are surpassing the stationary sector now, stationary fuel cells are still among
5 STATIONARY ENERGY APPLICATIONS
stationary sector, in some cases also for cooling. In addition to hydrogen, methanol, natural gas and liquefied petroleum gas are used as fuels (HMWEVL 2016).
5.2 DOMESTIC ENERGYIf, in addition to the generated electricity, the heat that is produced is also used, the process is referred to as combined heat and power (CHP). If such plants are used in the domestic heating sector, they are also described as micro-CHP or mini-CHP plants (Shell/BDH 2013) because of their smaller outputs.
CHP plants can be operated with two strategies: The plant covers either most of the electricity or of the heat demand. If electricity prices are high, an electricity-led mode of operation is appropriate. In this way the purchase of electricity from the grid can be minimised, or the generated IN SUMMARY
35
Shell Hydrogen Study
34
4 APPLICATIONS

10,000
30,000
50,000
70,000 €
Air sourced heat pump today
Air sourced heat pump future
Micro-CHP fuel cell today
Gas condensing boiler
Micro-CHP fuel cell future
Years of serviceToday 5 10 15 20
Stationary fuel cells are an important driver of global market development for fuel cells.
Fuel cells are increasingly being used as an alternative to generators and rechargeable batteries as a backup power supply.
Fuel cells generate both power and heat. Major demonstration projects for fuel cell heating systems have already been introduced in Germany, Europe and Japan, under the names “Callux”, “ene.field” and “Ene-Farm”. The first commercial micro-CHP plants based on PEMFC and SOFC fuel cells are now available.
Owing to their high overall efficiency, micro-CHP fuel cell systems are a promising new option for a sustainable residential energy supply.
Depending on the market development, the use of fuel cell-based micro-CHP or mini-CHP units in the building/residential sector will require further funding.
associated higher electrical efficiency. In combined mode, i.e. electrical and thermal, fuel cells can achieve efficiencies of up to 95 %. The electrical efficiency is up to 45 %. Furthermore, fuel cell systems are characterised by high efficiencies over all load points, they are quiet, have low maintenance costs and operate (locally) emission-free (ASUE 2016).
One disadvantage is that, because of higher purchase costs, fuel cell heating systems – without incentive schemes – are currently not yet economically viable as compared with condensing boilers. It can be assumed, however, that as numbers increase and as synergy effects with PEM fuel cells from automotive applications take hold, the purchase costs of fuel cell systems for domestic energy supply will continue to fall.
Specifically for domestic energy supply, there are large demonstration projects running in Germany (“Callux”) and in 12 EU member states (“ene.field”), in which more than 1,500 PEM and SO fuel cell systems are operating in houses and apart-ment buildings. In the meantime, the first fuel cell systems for domestic energy supply are commercially available in Europe. Meanwhile, almost 200,000 gas-fuelled PEM and SO fuel cell systems for domestic energy supply have been installed and funded in Japan through the state “Ene-Farm” project; the Japanese government wants to have installed 1.4 million systems by 2020 and 5.3 million by 2030 (HMW-EVL 2016, E4tech 2016).
Probably the biggest advantage of fuel cells over thermal power processes is the direct electrochemical conversion during electricity and heat generation and the
CHP electricity can be fed into the electricity grid and reimbursed.
The heat produced as a by-product of com-bined heat and power is used to cover part of the buildings heat demand. The mostly electricity-led mode of operation results in a low thermal output from fuel cell heating systems. The remaining heat requirement of the building is covered by an additional heating system, e.g. a condensing boiler. For that reason, fuel cells are particularly suitable for buildings with a low space heating requirement, such as low-energy or nearly zero-energy buildings. In buildings with a higher space heating requirement, hybrid fuel cell heating systems, comprising a fuel cell and a condensing boiler to cover peak heating requirements, are used.
Stationary fuel cells in the output range up to 10 kWe are usually PEM or SO fuel cells. The typical CHP output range for houses and apartment buildings is 0.7 to 5 kWe. If fuel cell systems are operated with natural gas as the fuel, an existing natural gas infrastructure can be used. However, the fuel must be reformed first. In the case of PEM fuel cells, reforming takes place externally. Owing to the higher temperatures, internal reforming is possible in SO fuel cells.
In the USA and in Europe, a number of funded projects are running, in which pure hydrogen – from surplus renewable energies or as an industrial by-product – is being trialled or used in stationary fuel cells (HMWEVL 2016).
IN SUMMARY
in the building; here 70 % of the electricity generated by the fuel cell is consumed in the house. As such, less electricity has to be drawn from the grid. The electricity that is generated by the fuel cell and not consumed internally is fed into the grid.
In all three cases, the cost of ownership for energy are made up of the acquisition and installation costs for the heating system, the natural gas purchase costs, and the costs for domestic elec-tricity supply via grid connection. For the fuel cell heating system this means that the costs for domestic electricity fall because of the consumption of the self-generated electricity. This reduction is (partially) offset by a higher natural gas consumption, however.
Figure 24 shows the heating and electricity costs in EUR over time, i.e. the costs for acquiring each heating system (on the Y-axis intersection), and for the total operating costs (including acquisition cost) for three system options over 20 years of service (X-axis). The calculation does not take account of any grants for heating appliances or any tax exemptions or feed-in remunerations for the electricity.
Owing to the low acquisition costs, the ownership costs for the gas condensing boiler are the lowest today. The acquisition costs for the fuel cell heating system are the highest. However, given the high proportion of self-generated electricity that is con-sumed, it has the lowest operating fuel and electricity costs. As such, the fuel cell heating system would be more cost-effective than an electric heat pump after just under 10 years of service.
If the purchase costs of a fuel cell heating system were to fall, due to falling production costs or to direct subsidies as in Japan, for example, the fuel cell heating system would even be more cost-effective than the gas condensing boiler heating system after just a few years.
In principle, the greater the spread between the electricity and gas price and the higher the proportion of self-generated elec- tricity that is used, the faster a fuel cell heating system pays off.
Using key data and own assumptions from the Shell BDH domestic heating study (2013), this section analyses the eco-nomics of an investment in a micro-CHP fuel cell heating system for residential heating in comparison with a gas condensing boiler and an electric heat pump. For this purpose a simplified (total) cost of ownership (TCO) approach is applied. The cost of ownership analysis focuses on the investment cost for the heat-ing equipment (including installation) and the costs of purchas-ing energy (for heat generation and electricity).
A reference building with a living area of approximately 150 m² is considered. In the reference building chosen, the heat required for domestic hot water and heating was previously generated by a low-temperature natural gas boiler. The specific energy consumption of 150 kWh per square metre for living space results in an annual natural gas consumption of 22,500 kWh. The annual domestic electricity consumption (4,000 kWh) is drawn from the general electricity grid. The assumed electricity price is 0.30 €/kWh, the natural gas price 0.065 €/kWh.
The low-temperature boiler which has been used for central heating so far is outdated by now. The owner needs to modernise the heating system and considers three options: a micro-CHP fuel cell heating system, a gas condensing boiler heating system and an electric heat pump. The life time of all three heating types is assumed to be 20 years.
Gas condensing boiler: The low-temperature gas boiler is replaced by a gas condensing boiler. The costs for this system and its installation amount to 7,000 €. The boiler runs on natural gas. The replacement reduces the natural gas consump-tion to 20,100 kWh. As previously, all the domestic electricity consumed is drawn from the grid.
Heat pump: The low-temperature gas boiler is replaced by an electric air sourced heat pump (ASHP). The costs for the heat pump and its installation amount to 12,000 €. Operating the heat pump requires 7,200 kWh of heat pump electricity per year. The heat pump electricity tariff is 0.21 €/kWh. Again, all the domestic electricity consumed is drawn from the grid via the existing house connection.
Fuel cell heating system: The low-temperature gas boiler is replaced by a new micro-CHP fuel cell heating system. The costs for this system amount to 20,000 €. The fuel cell heating system consists of a fuel cell for simultaneous electricity and heat generation (electricity output 0.75 kW, heat output 1 kW). A natural gas condensing boiler that is additionally integrated into the heating system supplies the extra heat required to heat the building and for domestic hot water generation. The fuel cell heating system runs on natural gas. As electricity prices are high compared to the natural gas price, the most economic operating strategy of the fuel cell is to cover most of the electricity needed
THE ECONOMICS OF A FUEL CELL HEATING SYSTEM
24 DOMESTIC ENERGY COSTS COMPARED
23 FUEL CELL SYSTEM AS A PART OF DOMESTIC ENERGY SUPPLY
37
Shell Hydrogen Study
36
5 STATIONARY ENERGY APPLICATIONS
Natural Gas
Heat
Power
System efficiencyup to
95%
Electricalefficiency up to
45%
Fuel Cell
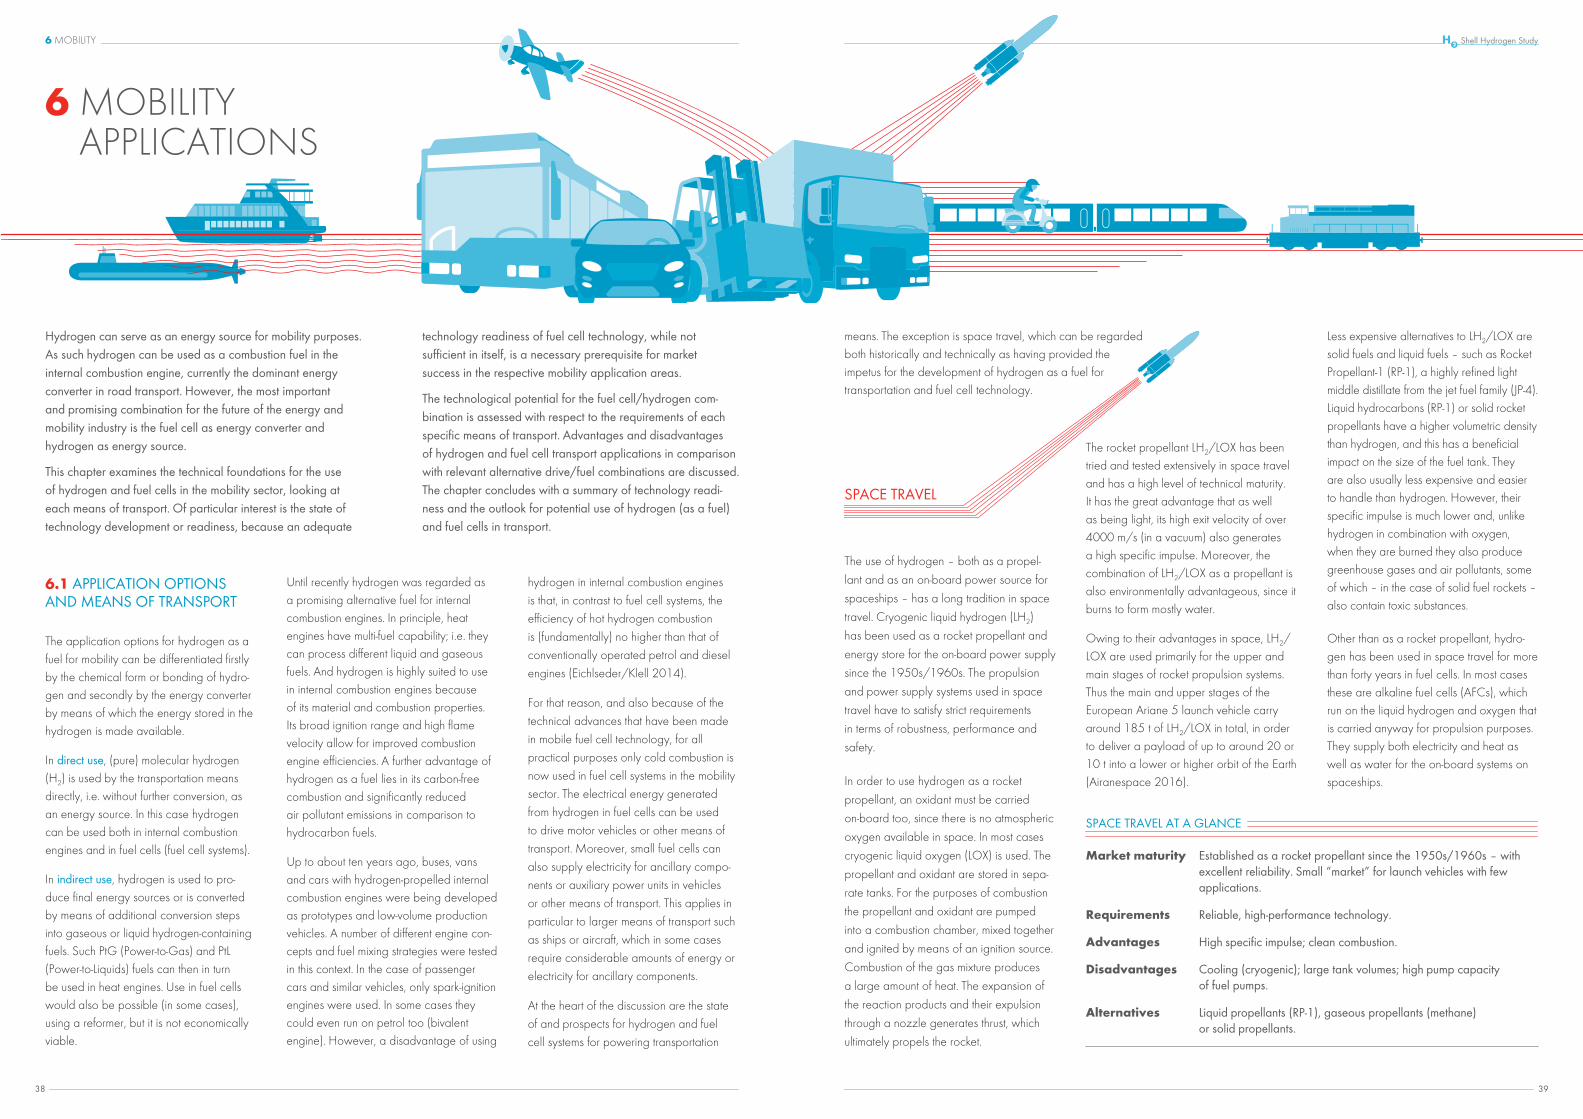
Less expensive alternatives to LH2/LOX are solid fuels and liquid fuels – such as Rocket Propellant-1 (RP-1), a highly refined light middle distillate from the jet fuel family (JP-4). Liquid hydrocarbons (RP-1) or solid rocket propellants have a higher volumetric density than hydrogen, and this has a beneficial impact on the size of the fuel tank. They are also usually less expensive and easier to handle than hydrogen. However, their specific impulse is much lower and, unlike hydrogen in combination with oxygen, when they are burned they also produce greenhouse gases and air pollutants, some of which – in the case of solid fuel rockets – also contain toxic substances.
Other than as a rocket propellant, hydro-gen has been used in space travel for more than forty years in fuel cells. In most cases these are alkaline fuel cells (AFCs), which run on the liquid hydrogen and oxygen that is carried anyway for propulsion purposes. They supply both electricity and heat as well as water for the on-board systems on spaceships.
The rocket propellant LH2/LOX has been tried and tested extensively in space travel and has a high level of technical maturity. It has the great advantage that as well as being light, its high exit velocity of over 4000 m/s (in a vacuum) also generates a high specific impulse. Moreover, the combination of LH2/LOX as a propellant is also environmentally advantageous, since it burns to form mostly water.
Owing to their advantages in space, LH2/LOX are used primarily for the upper and main stages of rocket propulsion systems. Thus the main and upper stages of the European Ariane 5 launch vehicle carry around 185 t of LH2/LOX in total, in order to deliver a payload of up to around 20 or 10 t into a lower or higher orbit of the Earth (Airanespace 2016).
The use of hydrogen – both as a propel-
lant and as an on-board power source for
spaceships – has a long tradition in space
travel. Cryogenic liquid hydrogen (LH2)
has been used as a rocket propellant and
energy store for the on-board power supply
since the 1950s/1960s. The propulsion
and power supply systems used in space
travel have to satisfy strict requirements
in terms of robustness, performance and
safety.
In order to use hydrogen as a rocket
propellant, an oxidant must be carried
on-board too, since there is no atmospheric
oxygen available in space. In most cases
cryogenic liquid oxygen (LOX) is used. The
propellant and oxidant are stored in sepa-
rate tanks. For the purposes of combustion
the propellant and oxidant are pumped
into a combustion chamber, mixed together
and ignited by means of an ignition source.
Combustion of the gas mixture produces
a large amount of heat. The expansion of
the reaction products and their expulsion
through a nozzle generates thrust, which
ultimately propels the rocket.
means. The exception is space travel, which can be regarded both historically and technically as having provided the impetus for the development of hydrogen as a fuel for transportation and fuel cell technology.
hydrogen in internal combustion engines is that, in contrast to fuel cell systems, the efficiency of hot hydrogen combustion is (fundamentally) no higher than that of conventionally operated petrol and diesel engines (Eichlseder/Klell 2014).
For that reason, and also because of the technical advances that have been made in mobile fuel cell technology, for all practical purposes only cold combustion is now used in fuel cell systems in the mobility sector. The electrical energy generated from hydrogen in fuel cells can be used to drive motor vehicles or other means of transport. Moreover, small fuel cells can also supply electricity for ancillary compo-nents or auxiliary power units in vehicles or other means of transport. This applies in particular to larger means of transport such as ships or aircraft, which in some cases require considerable amounts of energy or electricity for ancillary components.
At the heart of the discussion are the state of and prospects for hydrogen and fuel cell systems for powering transportation
Until recently hydrogen was regarded as a promising alternative fuel for internal combustion engines. In principle, heat engines have multi-fuel capability; i.e. they can process different liquid and gaseous fuels. And hydrogen is highly suited to use in internal combustion engines because of its material and combustion properties. Its broad ignition range and high flame velocity allow for improved combustion engine efficiencies. A further advantage of hydrogen as a fuel lies in its carbon-free combustion and significantly reduced air pollutant emissions in comparison to hydrocarbon fuels.
Up to about ten years ago, buses, vans and cars with hydrogen-propelled internal combustion engines were being developed as prototypes and low-volume production vehicles. A number of different engine con-cepts and fuel mixing strategies were tested in this context. In the case of passenger cars and similar vehicles, only spark-ignition engines were used. In some cases they could even run on petrol too (bivalent engine). However, a disadvantage of using
technology readiness of fuel cell technology, while not sufficient in itself, is a necessary prerequisite for market success in the respective mobility application areas.
The technological potential for the fuel cell/hydrogen com-bination is assessed with respect to the requirements of each specific means of transport. Advantages and disadvantages of hydrogen and fuel cell transport applications in comparison with relevant alternative drive/fuel combinations are discussed. The chapter concludes with a summary of technology readi-ness and the outlook for potential use of hydrogen (as a fuel) and fuel cells in transport.
Hydrogen can serve as an energy source for mobility purposes. As such hydrogen can be used as a combustion fuel in the internal combustion engine, currently the dominant energy converter in road transport. However, the most important and promising combination for the future of the energy and mobility industry is the fuel cell as energy converter and hydrogen as energy source.
This chapter examines the technical foundations for the use of hydrogen and fuel cells in the mobility sector, looking at each means of transport. Of particular interest is the state of technology development or readiness, because an adequate
6 MOBILITY APPLICATIONS
The application options for hydrogen as a fuel for mobility can be differentiated firstly by the chemical form or bonding of hydro-gen and secondly by the energy converter by means of which the energy stored in the hydrogen is made available.
In direct use, (pure) molecular hydrogen (H2) is used by the transportation means directly, i.e. without further conversion, as an energy source. In this case hydrogen can be used both in internal combustion engines and in fuel cells (fuel cell systems).
In indirect use, hydrogen is used to pro-duce final energy sources or is converted by means of additional conversion steps into gaseous or liquid hydrogen-containing fuels. Such PtG (Power-to-Gas) and PtL (Power-to-Liquids) fuels can then in turn be used in heat engines. Use in fuel cells would also be possible (in some cases), using a reformer, but it is not economically viable.
SPACE TRAVEL
Market maturity Established as a rocket propellant since the 1950s/1960s – with excellent reliability. Small “market” for launch vehicles with few applications.
Requirements Reliable, high-performance technology.
Advantages High specific impulse; clean combustion.
Disadvantages Cooling (cryogenic); large tank volumes; high pump capacity of fuel pumps.
Alternatives Liquid propellants (RP-1), gaseous propellants (methane) or solid propellants.
SPACE TRAVEL AT A GLANCE
6.1 APPLICATION OPTIONS AND MEANS OF TRANSPORT
39
Shell Hydrogen Study
38
6 MOBILITY

The main drive sources for rail vehicles
are either diesel drives (diesel-electric,
diesel-hydraulic) or all-electric. The energy
intensity of electric rail vehicles is around
half that of diesel rail vehicles (IEA/UIC
2015). An increase in line electrification
in conjunction with a decarbonisation of
railway electricity production would there-
fore be a possible energy and climate
strategy for rail.
The proportion of electric traction is
already high in some regions of the world.
Electrification levels have reached 60 to
80 % in Europe and Asia, and the average
for EU member states is around 60 %.
Worldwide, however, the proportion of
electrified railways is only around one-third.
Over 50 % of the railways in India are
electrified, around 40 % in China, a good
20 % in Africa, but only a few percent in
North America (IEA/UIC 2015).
In electric locomotives, motive power is
supplied via stationary current conductors
(overhead lines, conductor rails) and cur-
rent collectors on the vehicles. However,
for technical, economic or other reasons,
not every railway line can be electrified.
Especially on lines with a low transport
volume, the high up-front investment that
Market maturity Use of fuel cells for on-board power generation being trialled. Concepts for small ship/boat propulsion systems; propulsion systems for commercial maritime shipping unlikely.
Requirements Low emissions combined with low prices for drive-trains and fuels.
Advantages Higher efficiency, lower emissions.
Disadvantages Expensive propulsion technology and fuel.
Alternatives Diesel engine with heavy fuel oil, marine diesel, (commercial) diesel fuel; gas turbine with LNG/CNG.
emissions, low operating temperatures and air-independent operation. However, the “market” for submarines is very small, and even in the future it will not grow beyond a niche size.
been developed in the USA and Germany. The submarines developed in Germany use PEM fuel cells and metal hydride hydrogen stores. In terms of submarine applications, fuel cells are characterised by low noise
Submarines are a niche application of fuel cells. For instance, electrolysers have been used in submarines for some time now to produce oxygen for breathing air. Submarines operated with fuel cells have
In the shipping industry diesel engines are used almost exclusively today. Ocean- going vessels use either heavy fuel oil or marine diesel as fuel, while inland water-way vessels – within the EU for example – use commercial diesel fuel. To date the only relevant alternative drive option for the shipping industry is the use of liquefied natural gas (LNG) or compressed natural gas (CNG) to fuel ships.
As in aviation, fuel cells are currently being tested as energy providers for the on-board power supply. The functional capability of fuel cell modules has been tested success-fully under maritime conditions (e4ships 2016). Fuel cells work more efficiently than
Market maturity Demonstration projects for on-board power supply. The first miniature/small aircraft have demonstrated the feasibility of electric aviation. Use in larger commercial aircraft not yet in sight.
Requirements High reliability in flight operations; compact, weight-saving storage.
Advantages Efficient energy converter and clean fuel; multifunctional.
Disadvantages Large storage volume, significantly more expensive than fossil fuels.
Alternatives Jet engines with kerosene type aviation fuel (Jet A1) or paraffinic fuels (such as GTL); piston engines with gasoline type aviation fuel (Avgas).
operations aviation fuel can be saved and
emissions reduced. Furthermore, multifunc-
tional fuel cells can contribute to the supply
of water, air humidification and the inerting
of fuels (Renouard-Valleta et al. 2012).
The ideas and concepts for hydrogen in
aviation extend to the support and/or com-
plete drive of the flight operation. Individual
jet engines have occasionally been tested
with hydrogen in the past. More recently,
electric aviation has been boosted by a
number of small demonstration aircraft –
the size of unmanned drones, motor gliders
In civil aviation, hydrogen-powered fuel
cells are regarded as potential energy
providers for aircraft as they have been
in space travel for some time now. Thus,
fuel cell modules can supply electricity to
the aircraft electrical system as emergency
generator sets or as an auxiliary power unit. More advanced concepts include
starting of the main engine and the nose
wheel drive for airfield movements by
commercial aircraft.
Since fuel cells produce electricity more
efficiently than aircraft engines, in ground
AVIATION
NAUTICAL APPLICATIONS
AVIATION AT A GLANCE RAIL / HYDRAIL
or small sports aircraft with a mass of up
to 1.5 t (DLR 2015). These miniature and
small propeller aircraft were fitted with
PEM fuel cells and lithium batteries for the
drive. The custom-built electric planes were
able to demonstrate the basic feasibility
of hydrogen-powered fuel cells in flight
operations over short distances.
The use of fuel cell technology as the sole
or main drive and fuel for full-sized commer-
cial aircraft in national and international air
services is not yet in sight, however.
comparable diesel-generator sets, in the partial load range in particular and through the possibility of combined heat and power generation. Air pollutant and noise emissions in ports can be reduced. In many cases the fuel cells are operated not with hydrogen but with other fuels, including methanol, natural gas or diesel fuel. These offer the advantages of greater availability, lower price and easier storage. They are converted into hydrogen with the aid of internal or external reformers.
The use of hydrogen-powered fuel cells for ship propulsion, by contrast, is still at an early design or trial phase – with applications in smaller passenger ships,
ferries or recreational craft. The low- and high-temperature fuel cell (PEMFC) and the solid oxide fuel cell (SOFC) are seen as the most promising fuel cell types for nautical applications (EMSA 2017). As yet, however, no fuel cells have been scaled for and used on large merchant vessels.
Moreover, in comparison to the efficient, slow-running diesel engine, which runs on heavy fuel oil, the power train and fuel are still far too expensive. In addition, interna-tional technical standards still need to be developed in order to use gaseous fuels (such as hydrogen) (Würsig/Marquardt 2016).
is needed for electrification of the lines
cannot always be justified. Moreover,
overhead lines cannot be used for shunting
if cranes are also in use for moving
transport goods. In subsurface mining, by
contrast, traction vehicles have to operate
without air pollutants.
Rail vehicles that use hydrogen as an
energy store and energy source can
offer an additional alternative. Fuel
cell-powered rail vehicles combine the
advantage of pollutant-free operation
with the advantage of low infrastructure
costs, comparable with those for diesel
operation.
The term hydrail as a short form of
hydrogen rail has been coined to describe
hydrogen-based rail vehicles. Hydrail
applications can be reasonable in loca-
tions where an electric rail infrastructure
cannot be built or where pollutant-free
operation is required.
To date, two types of fuel cell-powered
rail vehicles have been developed and
tested: shunting locomotives and railcars
for public (local) rail passenger transport.
Heavy locomotives for (long-distance)
rail freight transport are either all-electric,
diesel-electric or diesel-hydraulic. The
shunting locomotives are mostly either
one-off vehicles or conversions of diesel
locomotives. Moreover, individual shunting
locomotives have been fitted out and used
for transport purposes below ground in the
mining industry.
For light rail vehicles there is a funded
test track for regional fuel cell trains in
Northern Germany; 50 local trains are
scheduled to be brought into service in
various regions of Germany by 2021
(Ernst & Young et al. 2016). In addition,
a fuel cell-powered tram – also known as
a hydrogen trolley or hydrolley – which
has been developed in China operates
on a tram line in the Chinese coastal city
of Quingdao. Other tram lines are at the
planning stage.
Light passenger rail vehicles frequently
cover only short distances each day, for
which large energy stores are not required.
The expensive combination of fuel cell
and on-board hydrogen tank can pay off,
if the costs of setting up and maintaining
overhead lines are avoided. In the long-
term, it might also be possible for parts of
the infrastructure to be shared with fuel cell
buses.
NAUTICAL APPLICATIONS AT A GLANCE
41
Shell Hydrogen Study
40
6 MOBILITY

Market maturity Technology tried and tested in numerous small fleets worldwide (Europe, North America, Asia), larger projects with several hundred buses at the planning stage; currently only in publicly funded transport projects, studies on commercial use (CFCP 2013; RB 2015).
Requirements Flexible, reliable use in scheduled services with short downtimes (for refuelling/charging); ideally no space and weight restrictions for passenger transport.
Advantages Range 300 to 450 km, no public infrastructure needed for municipal buses, range still too short for coaches; no air pollutants, low noise emissions, little additional weight from hydrogen tanks.
Disadvantages Vehicles still more expensive than the reference technology of diesel buses.
Alternatives Gas buses, diesel hybrid buses, electric buses.
flexibility as diesel buses in day-to-day operation. While some older municipal buses still consume well over 20 kg of hydrogen (rather than 40 litres of diesel) per 100 km, newer fuel cell buses now use only 8 to 9 kg per 100 km, giving FCEBs an energy efficiency advantage of around 40 % as compared with diesel buses.
In order to develop the market, demonstra-tion projects with large fleets in long-term use are planned. The FCEB fleet in Europe is expected to expand from 90 to between 300 and 400 vehicles by 2020. The first large fleets have also been announced in China (RB 2015).
The use of fuel cells and hydrogen in municipal buses has made a substantial contribution to the technical and economic development of this drive technology in road transport. For that reason, the use of fuel cell technology and hydrogen in buses is also regarded as a model which can be transferred to other commercial vehicles (ARB 2015).
On the way towards commercialisation,
industrial trucks for material handling rep-
resent an early market application of fuel
cell technology. The USA has the largest
hydrogen-powered industrial truck fleet at
present. With various incentive schemes in
place, there are currently some 11,000
fuel cell vehicles in use in the USA, with an
average fleet size of over 100 units.
In Europe there are around 140 fuel cell
industrial trucks in operation at present. In
order to drive commercialisation forward,
a further 200 fuel cell-operated material
handling vehicles are set to be brought
into circulation in small fleets at 10 to 20
selected locations as part of the HyLIFT
Europe project. In Asia there are as yet
only prototypes in Japan (FCTO 2016;
Landinger 2016).
Market maturity Over 11,000 fuel cell material handling vehicles in North America; demonstration fleets in Europe; prototypes in Japan.
Requirements Hydrogen supply (in some cases outdoors) for larger vehicle fleets, multi-shift use.
Advantages Continuous operation, high material handling productivity, (locally) emission-free operation.
Disadvantages Lightweight drive, requires extra weights.
Alternatives Battery electric vehicles (indoors); gas, petrol, diesel (outdoors).
Industrial trucks are another area of use
for fuel cell technology. Industrial trucks
can run on the ground or on a rail system.
The most common types are forklifts and
tow trucks, which are used in intralogistics,
i.e. for handling flows of materials within
a company. In many cases industrial
trucks operate in enclosed areas, but they
are also used outdoors – at airports for
example. Worldwide more than 10 million
industrial trucks are used every day, and the
fleet is growing (Günthner/Micheli 2015).
Industrial trucks are available with both
electric drives and internal combustion
engines. In the case of electric drives for
indoor use, lead-acid batteries are still
widely used. Internal combustion engine
industrial trucks are often low-emission gas
vehicles (liquefied petroleum gas) or petrol
or diesel vehicles.
Market maturity To date, demonstration projects for light rail vehicles (based on bus technology). Various shunting locomotives as pilot projects/one-off vehicles.
Requirements Sufficient and reliable hydrogen supply.
Advantages Lower infrastructure costs (no overhead lines/conductor rails); (locally) emission-free operation, dependent on hydrogen production.
Disadvantages Expensive drive system; additional tank space.
Alternatives Diesel (-electric/-hydraulic) with diesel or PtX fuels; electric traction.
INDUSTRIAL TRUCKS (FORKLIFTS/TOW TRUCKS)
RAIL / HYDRAIL AT A GLANCE
Fuel cell industrial trucks are especially
suitable for indoor operation, because they
produce no local pollutant emissions and
only low noise emissions. Fuel cell vehicles
have advantages over battery-operated
industrial trucks in terms of refuelling.
Instead of having to replace the battery, the
trucks can be refuelled within two to three
minutes.
They take up less space and are cheaper
to maintain and repair. Fuel cell industrial
trucks allow for uninterrupted use and are
therefore particularly suitable for multi-shift
fleet operation in material handling (FCTO
2014b). In the case of larger industrial
truck fleets in multi-shift operation, (mod-
erate) cost reductions can be achieved
in comparison to battery technology, and
productivity in material handling can also
be increased (NREL 2013a).
INDUSTRIAL TRUCKS AT A GLANCE
In terms of road transport, buses in the public transport network are the most thoroughly tested area of application for hydrogen and fuel cells. Since the early 1990s, several hundred buses have been and are being operated with hydrogen worldwide – predominantly in North America, Europe and increasingly also in Asia.
Although hydrogen was initially still used in buses with internal combustion engines, bus developers are now concentrating almost entirely on fuel cell electric buses (FCEB). The use of small FCEB fleets is being promoted in urban areas as a way of contributing to technological development and to clean air policy.
Fuel cell buses have now reached a high level of technical maturity, although they are not yet in series production. Owing to the small numbers, until now they have still been much more expensive, at around 1 million EUR, than standard diesel buses, which cost in the region of 250,000 EUR. The main-tenance costs have also been significantly
reduced and the reliable operating times increased (Hua et al. 2013).
Depending on annual production numbers, production costs for FCEBs should continue to fall, however, in future projects. The production costs for 12-metre buses are projected to fall to around 650,000 EUR by 2020 and to approx. 350,000 EUR by 2030, bringing them within reach of diesel hybrid buses (RB 2015; Klingenberg 2016).
Modern fuel cell buses draw their energy from two fuel cell stacks, each with an output of approx. 100 kW. They also have a relatively small traction battery and are able to recover brake energy. In addition, they carry approximately 30 to 50 kg of compressed hydrogen on board, stored in pressure tanks at 350 bar. On the other hand, some battery electric bus models have large traction batteries and only small fuel cell stacks, which are used as range extenders.
Fuel cell buses now have a range of 300 to 450 km and so offer almost the same
BUSES
BUSES AT A GLANCE
LORRIES AND LIGHT COMMERCIAL VEHICLES
Almost all lorries are fitted with diesel engines; this is especially true of the heavy goods vehicles used for long-distance road haulage. Alternative drives and fuels – mostly gas vehicles (CNG and LPG) – are only used for light commercial vehicles,
and even then only in small numbers as yet. Electric drives have so far been unable to achieve significant numbers in lorries because of the weight and volume of the batteries needed to provide the necessary range reduces the payload to an
unacceptable level. However, a gradual increase in hybridisation/electrification is anticipated in the future for light commercial vehicles and small lorries (Shell 2016). In terms of lorries, in California and Germany there are as yet just a few publicly funded
43
Shell Hydrogen Study
42
6 MOBILITY

Although hydrogen is a clean fuel with
excellent physicochemical properties, it has
been unable to gain acceptance as a fuel
for motorised road transport. For passenger
cars the focus is now almost entirely on
hydrogen-powered fuel cells as a source of
drive energy.
Virtually all fuel cell passenger cars today
are equipped with PEM fuel cells, in both
series and parallel configurations (cf. the
box on fuel cells in passenger cars, p. 48).
The prices for medium-sized vehicles fitted
with fuel cells are still well above those for
passenger cars with internal combustion
engines – at around 60,000 EUR/USD
(IEA 2015b). In some cases, fuel cell
passenger cars can be leased (with
leasing rates similar to combustion-engined
vehicles). With the launch of FCEV series
production, vehicle cost and prices are
expected to fall substantially.
The fuel cell stacks in the latest fuel cell
models have an output of 100 kW or more.
As compared with battery electric cars they
have a greater range – of around 400 to
500 kilometres today – with a lower vehicle
weight and much shorter refuelling times of
three to five minutes (US DOE 2016). They
usually carry 4 to 7 kg of hydrogen on
board, stored in pressure tanks at 700 bar.
Along with battery electric vehicles,
hydrogen-powered fuel cell passenger cars
are the only zero-emission alternative drive
option for motorised private transport. The
first fuel cell passenger cars were tested
back in the 1960s as demonstration pro-
jects. A new boost to fuel cell development
came in the 1990s. In most cases the fuel
cell test vehicles were converted cars that
had originally been fitted with an internal
combustion engine. At the time, however,
the early test models were still not competi-
tive, either technically or economically.
In addition, up until about 10 years ago
petrol engine prototypes were still being
tested with hydrogen as an alternative
energy and low-emission fuel. These were
vehicles with modified bivalent engines,
which could run on both petrol and hydro-
gen (Eichlseder/Klell 2012). Owing to the
fuel, hydrogen-powered internal combustion
engines not only achieve somewhat higher
efficiencies than in petrol operation, they
also emit much lower levels of pollutants.
Market maturity Only prototypes so far; were regarded as an early commercial application, but e-bikes advanced faster. Hydrogen to extend the range of heavy motorcycles in future.
Requirements Low purchase/running costs; adequate range; simple storage.
Advantages Fuel cell motorcycles are zero-pollutant and low-noise. Longer range in comparison to all-electric motorcycles.
Disadvantages Expensive, especially in comparison to cheap internal combustion engines; inadequate hydrogen supply infrastructure.
Alternatives Motorcycles with internal combustion engine; e-bikes and e-scooters.
Light motorcycles were an early commer-cial application of fuel cell technology in motorised private transport. In emerging and developing economies, motor scooters and small motorcycles are an indicator of an increase in motorisation. However, two-stroke or four-stroke motorcycle engines running on fossil fuels lead to increased air pollutant and noise emissions in conurbations.
Electric scooters and motorcycles, by contrast, offer the advantage of zero-
Market maturity Vehicles mostly in the USA (around 50), with individual examples in Germany/EU. Concepts and prototypes primarily for smaller lorries in urban areas with air quality issues, but also first concepts/prototypes for heavy goods vehicles.
Requirements Space-saving hydrogen storage; reliable supply; reduction in total cost of ownership.
Advantages Higher efficiency, no air pollutants, low noise emissions.
Disadvantages Expensive drive technology/fuel; still shorter range than diesel; low density of refuelling stations.
Alternatives Diesel vehicles; LNG/CNG and battery-electric commercial vehicles (BEVs).
possible range and an adequate refuelling station infrastructure (ARB 2015; Wietschel et. al 2016).
Finally, the use of fuel cells to supply auxiliary equipment with electricity is also discussed. Here reformers convert diesel fuel into hydrogen, which is used efficiently and with few or no air pollutants by appro-priately dimensioned fuel cells to operate refrigeration systems and the like.
The use of fuel cells in long-distance road haulage, i.e. for 40-ton trucks in the EU or class 7/8 trucks in the USA, is farther behind. Meanwhile, concepts or prototypes for heavier lorries are available. However, vehicles of the 300 to 350 kW output class would still need to be tested in long-term use over long distances.
Prerequisites for use in long-distance road haulage are considered to be the mini-mising of losses in payload (and volume), competitive fuel prices, the maximum
vehicles which draw their drive energy from hydrogen-powered fuel cells.
In principle, the wealth of experience and concepts in bus applications can be drawn on regarding the use of fuel cells goods vehicles. The prototypes are mostly light to medium lorries, which because of their low noise emissions and absence of pollutants are intended for use in urban delivery services. As a rule they are generally battery electric vehicles, which have been fitted with a fuel cell as a range extender.
LORRIES AND LIGHT COMMERCIAL VEHICLES AT A GLANCE
pollutant and low noise emission travel. In the past, however, they suffered from the low storage density and hence range of batteries. Due to technical advances in battery technology, however, the typical daily distances travelled in cities can now often be covered.
The last two decades saw a succession of two-wheel prototypes equipped with a variety of fuel cell types and storage systems. The commercial implementation of fuel cell motorcycles foundered, however,
partly because of the higher purchase/running costs for the fuel cell technology and the inadequate hydrogen supply infrastructure (Wing 2012). In addition, battery technology can cover the moderate performance requirements for electric motor- cycles and mopeds in urban commuter traffic. As a result there are now only a few current prototypes, including a motor scooter with pan-European approval as a production vehicle (Suzuki 2011).
MOTORCYCLES
MOTORCYCLES AT A GLANCE
PASSENGER CARS
>> FCEVs are ready for production. <<
IEA HIA 2016
There is now a wealth of practical expe-
rience available with fuel cell prototype
passenger cars. A number of major car
manufacturers are starting to offer early
series-production vehicles which are now
just as good as conventional internal com-
bustion engine cars in terms of functionality.
The number of fuel cell cars manufactured
over the coming years is projected to range
from several hundred up to thousands of
units (US DOE 2016).
Market maturity Technology proven worldwide (Europe, North America, Asia) through prototypes/small fleets, first production vehicles in moderate numbers. Incentive schemes for passenger car purchase still necessary.
Requirements Comparable to internal combustion engine vehicles in terms of equipment, performance, range; sufficiently dense hydrogen refuelling infrastructure.
Advantages Pollutant-free driving; range and performance close to petrol cars.
Disadvantages Still much more expensive than internal combustion engine cars; poor refuelling station infrastructure.
Alternatives Internal combustion engine cars; battery electric cars.
PASSENGER CARS AT A GLANCE
6.2 TECHNOLOGY READINESS
Finally, the degree of technical readiness or the state of development of hydrogen- powered drives – mostly fuel cell vehicles – is assessed. Hydrogen-powered vehicles are categorised by reference to the Technology Readiness Levels (TRL) devised by NASA (NASA 1995; DOD 2011; ISO 2013). The Technology Readiness Levels range from the basic description of the
operating principle (TRL 1) through a proof of concept (TRL 3) up to TRL 9 (technology established in the market). In almost all the vehicle categories considered, there are at least experimental setups or (small) prototypes which have been tested – if not necessarily to scale – in their operational environment with hydrogen and/or fuel cell technology. For that reason, the rest of
this section concentrates only on TR levels 5/6 (experimental setup in operational environment/prototype) upwards. The ultimate objective of technological devel-opment is TRL 9, a technology established in the market – like internal combustion engine drives in road transport. The prereq-uisite for this is an approved, functioning technology (TRL 8).
45
Shell Hydrogen Study
44
6 MOBILITY

4
1
5
6
7
8
9
Motorcycle
Aviation5-6
6-7Lorries6-7
Buses7-8
Passenger Cars8
Material Handling8-9
Light Rail7
Space Travel9
Shipping5-6
TRL
Shunting Locos6-7
Buses have undergone more intensive testing with hydrogen and fuel cells than any other form of transport. Light rail and road vehi-cles for the transport of goods may benefit from bus technology.
Of all modes of transport, industrial trucks have the largest numbers of fuel cell electric vehicles.
Commercial aircraft and merchant ships can use fuel cells as an efficient and clean energy provider for auxiliary power units.
The most important advantages of hydrogen and fuel cells in road transport are the higher efficiency of the energy converter, zero-pollutant operation (in fuel cells) and functionality comparable to established IC engined vehicles.
Space travel provided the impetus for the development of hydrogen as a transport fuel and of fuel cell technology.
In the transport sector hydrogen is now used almost exclusively in fuel cells.
Hydrogen fuel cell systems are suitable for virtually all means of transport.
Passenger cars, buses and material handling vehicles have tech-nically reached series-production readiness, are not far off that point, or are already in the early stages of commercialisation.
Fuel cell passenger cars now offer the same features as those powered by internal combustion engines.
IN SUMMARY
TRL Definition of Technology Readiness Levels
5 Experimental setup in operational environment – key technology elements tested in a relevant environment
6 Prototype in operational environment – technical feasibility demonstrated in the area of application
7 Prototype in use – demonstration almost to scale in the operational environment
8 Qualified system with proof of functional capability in area of use – product
9 Qualified system with proof of successful use – product
What is the technological maturity of the individual means of transport in terms of hydrogen and fuel cells today?
The highest Technological Readiness Levels, TRL 8 or 9, are achieved by fuel cell industrial trucks, for which extensive experience in the field is already available in large numbers, especially in North America. Cars are at TRL 8 and buses at TRL 7 to 8. The longest and most extensive operational experience that is available relates to hydrogen and fuel cell buses. Moreover, the first passenger cars with a fuel cell drive are now available as series-production vehicles.
The technology components and opera-tional experience relating to fuel cell buses can in principle be transferred to lorries and light rail vehicles. While local trains have already reached a relatively high technol-ogy readiness (TRL 7), the technology for shunting locomotives is still lagging behind somewhat (TRL 6 to 7). In terms of lorries, the lighter vehicle classes are also at the early prototype stage (TRL 6 to 7), whereas
for heavy goods vehicles first concepts are available.
The use of fuel cell technology for ship and aircraft propulsion systems is currently at TRL 5 to TRL 6, with only small prototypes to date. There are no equivalent concepts as yet for merchant ships and commercial aircraft. Fuel cells are successfully used as auxiliary power units (APUs), however, these are still one-off products for experi-mental purposes (TRL 6).
Lastly, rocket propulsion systems are difficult to categorise. Hydrogen-fuelled rockets have been used in space travel for
decades, but it is a small niche market with few applications over time. Nonetheless, the technology itself should be categorised at TRL 9.
Technology readiness is an important prerequisite for the commercial success of new technologies. However, a high level of technology readiness, while a necessary condition, is not sufficient in itself for market success. Depending on the technology user, there are other important factors affecting the purchase, maintenance or use of a means of transport with a specific drive/fuel combination.
Private users want transportation means to provide a (passenger) transport service, and generally one that is as cost-effective as possible. For that reason, purchase and maintenance costs and energy consump-tion play a part. Therefore, the resources and time involved in using the transportation means should not be too high. However, other selection criteria might be as important as economics. Non-economic
criteria include comfort, safety, prestige and environmental characteristics such as specific emissions; in some cases people are prepared to pay a high premium for such criteria, especially pioneer users.
In commercial transport the most important factors, in addition to technology readiness, are economic criteria arising from the acquisition and operating costs for a
vehicle. In addition, usage restrictions and availabilities of drive/fuel combinations are taken into account in regard to vehicle acquisition and maintenance.
Since economic efficiency and energy and environmental balances are relevant for both private and commercial users, these are assessed in more detail below in respect of passenger cars.
7 CAR OWNERSHIP COSTS
There are many factors determining the choice and operation of a vehicle. They include technical parameters (such as range or engine power), ecological parameters (such as emissions), regulatory parameters (such as usage restrictions/driving bans) or qualitative parameters (such as comfort or prestige). An important factor in deciding whether to buy or keep a car is economic in nature, i.e. the costs involved. These can include
the (substantial) purchase costs of the vehicle, running costs, or costs relating to a specific mileage or transport capacity. This chapter looks at the economics of hydrogen-powered fuel cell passenger cars and compares fuel cell electric vehicles (FCEV) with competing drive/fuel combinations – namely petrol cars, petrol hybrids and battery electric passenger cars.
An analysis tool to assess the economic viability of different fuel-drive-train combina-tions is the total cost of ownership (TCO) approach as established in commercial road transport. TCO analysis takes account of all the direct and indirect costs of vehicle ownership for the purposes of providing a desired passenger or goods transport service.
The fixed TCO costs include the acquisition costs for a car, i.e. the purchase price (usually for the basic version of a vehicle) or, if financing is used, the instalment pay-
ments plus interest. If the car is to be sold again, the depreciation over the desired ownership period or the trade-in value must also be estimated. Vehicle tax and car insurance are included in the fixed costs.
In addition, workshop costs (for mainte-nance and wear-and-tear repairs) must be taken into account (ADAC 2016). Furthermore, assumptions have to be made about key cost items – regarding insurance tariff or depreciation for example. Finally, the running TCO costs include spending on fuel or energy and consumables.
The TCO estimate is complex and it is
appropriate primarily for rational economic
operators. For the analysis of financial
decisions of private households, however,
a simple comparison of the most important
differentiating cost items is usually sufficient.
The key cost differentiators are the purchase price of the vehicle and the fuel costs for
its operation. If the ownership costs for
different drive types are similar, they are
assumed to have little influence on
purchase and operation decisions; if they
differ significantly, the ownership costs can
25 TECHNOLOGY READINESS LEVELS OF MOBILITY APPLICATIONS FOR HYDROGEN/FUEL CELLS
47
Shell Hydrogen Study
46
6 MOBILITY

Converter
Fuel cell Hydrogen tank
Battery Converter
Electric motor
Fuel cellHydrogen tank
Battery
Electric motor
Converter
0.02
0.04
0.06
0.08
0.1 € /MJ
3
6
9
12
15 € /100 km
9.5 €/kg
7 €/kg
2.5 €/l
1.5 €/l
35 ct/kWh
20 ct/kWh
* European fuel prices Passenger cars 2020+
Hydrogen Petrol Electricity FCEV Petrol BEVPetrol Hybrid
26 FUEL COSTS AT EUROPEAN FUEL PRICES, PASSENGER CARS 2020+
10.000
20.000
30.000
40.000
50.000
60.000
70.000
80.000 €
10,000
20,000
30,000
40,000
50,000
60,000
70,000
80,000 €
FCEV 2010+
BEV 2020+
FCEV 2020+
BEV 2020+
20,000 50,000 100,000 150,000 200,000Total mileage in km
0 50,000 100,000 150,000 200,000
0
20,000Total mileage in km
9.50 €/kg H2
35 ct/kWh
20 ct/kWh
7 €/kg H2
9.50 €/kg H2
1.50 €/l
7 €/kg H2
FCEV 2010+
Petrol Hybrid 2020+2.50 €/l
Petrol 2020+
FCEV 2020+
10,000
20,000
30,000
40,000
50,000
60,000
70,000
80,000 €
28 OWNERSHIP COSTS COMPARED: FCEV AND BEV
27 OWNERSHIP COSTS COMPARED: FCEV AND PETROL POWERED
10.000
20.000
30.000
40.000
50.000
60.000
70.000
80.000 €
10,000
20,000
30,000
40,000
50,000
60,000
70,000
80,000 €
FCEV 2010+
BEV 2020+
FCEV 2020+
BEV 2020+
20,000 50,000 100,000 150,000 200,000Total mileage in km
0 50,000 100,000 150,000 200,000
0
20,000Total mileage in km
9.50 €/kg H2
35 ct/kWh
20 ct/kWh
7 €/kg H2
9.50 €/kg H2
1.50 €/l
7 €/kg H2
FCEV 2010+
Petrol Hybrid 2020+2.50 €/l
Petrol 2020+
FCEV 2020+
10,000
20,000
30,000
40,000
50,000
60,000
70,000
80,000 €
should be noted that under the EU directive
to reduce CO2 emissions from new pas-
senger cars (333/2014/EU), (European)
vehicle manufacturers are required to
reduce the specific CO2 emissions from their
newly registered vehicles to an average
of just 95 g CO2/km (based on the New
European Driving Cycle). Similar CO2 limits
apply in Korea and the USA with maximum
permissible values of 97 and 88 g CO2/km
with effect from 2020 and 2025 (ICCT
2014a), while the regulations in Japan and China are somewhat less strict. In order for a petrol car to emit only 95 g CO2, it must have a fuel consumption amounting to around 4 l/100 km. That would be a challenge for a simple petrol C-segment car, but not for a hybrid petrol car.
The assumptions regarding vehicle equip-ment and (standard) fuel consumption are based on (JEC 2013) for “2020 plus” category vehicles; these passenger cars are already characterised by high efficiency and low fuel consumption figures. The standard fuel consumption figures were converted into real fuel consumption figures mainly by reference to (ICCT 2016) and sources cited therein. Passenger car pur-chase costs by drive type up to 2030 were taken from an ambitious climate protection scenario (2DS) in (IEA 2015b). The fuel prices for the alternative drive systems were varied in order to estimate sensitivities. The assumed values are not future projections but only assumptions for the purposes of the ownership cost analysis.
The ownership costs for each drive/fuel cost combination are compared with one another in an XY chart (figures 27 and 28). The X-axis shows the total mileage over the lifetime of the passenger car, while the Y-axis shows the ownership costs (purchase and fuel/energy costs) accrued in total over a given mileage. The point where an ownership cost curve intersects with the Y-axis indicates the purchase costs for a given passenger car drive/fuel configura-tion. The gradient of the ownership cost curve reflects the fuel or energy costs for a car drive type as a function of mileage, based on European energy and fuel prices.
It should be noted that the fuel or energy costs for operating the vehicle are deter-mined not only by the fuel prices (in €/litre or MJ) but also by the efficiency of the car drive in question. Concerning the cost per unit of energy in €/MJ, hydrogen – like electricity – is more expensive than fossil fuels today (petrol at 1.5 €/l, figure 26). However, since both fuel cell electric vehicles and battery electric vehicles are more efficient than petrol vehicles, their MJ/km consump tion is lower. At European fuel
technology for zero-emission vehicles in the medium term. Therefore, the fuel cell passenger car is compared with an internal combustion engine C-segment car – both a petrol-only and a hybrid petrol vehicle. In addition, fuel cell passenger cars are compared with battery electric vehicles, since they are the only relevant alternative in the zero-emission drives sector.
The ownership cost analysis considers passenger car models of the 2020s. It
tip the balance for or against a drive/fuel combination. A simplified ownership cost comparison for a fuel cell passenger car is set out below. The vehicle in question is a C segment (compact class/lower medium) passenger car, Europe’s best-selling car class. The fuel cell electric vehicle should be a fuel cell-dominant system, rather than having a fuel cell range extender fitted.
It is assumed that low-pollutant, hybrid petrol car concepts will be the competing
For automotive applications, low-temperature polymer electrolyte membrane fuel cells are now used almost exclusively. In the PEM fuel cell, hydrogen is converted with oxygen to water. The tech-nology has a high degree of maturity and is characterised by a simple setup, fast response to load changes, good cold start properties and a high power density (Günthner/Micheli 2015).
Fuel cell stacks are formed from several hundred cells in order to build a vehicle powertrain. Power outputs of 100 kW or more can be achieved in this way. The catalytic coating of the electrodes with platinum materials is a costly feature of PEM fuel cells. In order to lower costs, the aim of fuel cell production is to reduce the platinum content without adversely affecting the function of the fuel cell.
A range of control systems are also needed to operate the fuel cell system. These include a hydrogen air management system to supply the fuel cell stack, a thermal management system, particu-larly for cooling the stack, and a system to manage the electric drive and vehicle electrical system. All of these auxiliary consum-ers require several kilowatts of parasitic power and thus have a detrimental effect on the system efficiency (Reif 2010).
Fuel cells achieve their highest efficiency under low loads. At part load they can achieve efficiencies roughly twice those of heat engines. In addition, if the passenger compartment needs
to be heated, vehicles with fuel cells can draw heat from the fuel cell stack’s coolant circuit, thereby avoiding power losses for auxiliary air heaters of up to around 5 kW as compared with battery electric vehicles (Tschöke 2010). However, as the PEM fuel cell operating temperature of 80 to 85°C cannot be exceeded significantly, additional electrical power for cooling the stack is needed. Moreover, operation in extremely hot regions represents a technical challenge (Reif 2010).
In addition to the fuel cell stack, a fuel cell vehicle also has a traction battery (usually lithium-ion or nickel-metal hydride rechargeable batteries). Electrical energy from the fuel cell or from regenerative operation of the powertrain (recuperation) can be temporarily stored in this battery. The traction battery also serves to cover short-term power peaks. The traction battery is operated at a much higher voltage than the current vehicle electrical system (12 V).
The electric powertrain of fuel cell electric vehicles, i.e. electric motors and power electronics, is no different from the drive for battery electric vehicles. If the fuel cell stacks feed electrical energy directly into the electric motor as and when required, this is described as a fuel cell-dominant system. If the fuel cell stack only supplies the traction battery, which in turn is the sole energy supply for the electric motor, this type of vehicle is referred to as a battery electric vehicle with range extender.
FUEL CELL-DOMINANT SYSTEMBEV WITH RANGE-EXTENDER
49
Shell Hydrogen Study
48
7 CAR OWNERSHIP COSTS
FUEL CELL CONCEPTS FOR PASSENGER CARS

ning of 2017 are located either in Japan or in the USA – with over 90 % of the vehicles in the USA being concentrated in California. Also more than 90 % of the fuel cell vehicles are passenger cars, the second biggest vehicle class being fuel cell electric buses (HyARC 2017).
While only a moderate number of new hydrogen refuelling stations were built over the last decade, the number of new stations opening each year has risen markedly in recent years. As of the beginning of 2017, a further 140 refuelling stations worldwide were in planning, under construction or in commissioning. At the same time, the start of commercialisation is leading to a growth in the fuel cell electric vehicle fleet. As a consequence, significant variations
8.1 STATIONS AND VEHICLESAccording to a recent survey (HyARC 2017), at the beginning of 2017 there are around 280 active hydrogen refuelling stations worldwide. According to this survey, Japan has the largest number of refuelling stations, with 91, followed by the US with 61 stations the majority of which (30) are in California (CaFCP 2017). In Europe, Western Europe and in particular Germany is leading with 37 stations. One fourth of the hydrogen refuelling stations are non-public (HyARC 2017).
The geographical distribution of hydrogen stations largely corresponds to the number of hydrogen-fuelled motor vehicles. Most of the approximately 4,200 fuel cell electric vehicles that were registered at the begin-
of the (public) hydrogen infrastructure for road transport. It then assesses the building blocks for a future hydrogen infrastructure, including hydrogen refuelling station concepts and refuelling station technology, possible supply and distribution pathways. Finally, the economics of a future hydrogen infrastructure for road transport are discussed.
The development of a hydrogen economy for the automotive industry will require a new infrastructure. This infrastructure will consist of fuel production, storage and distribution facilities. In the transport sector, the new hydrogen infrastructure will also have to provide a hydrogen supply network for fuel electric cell vehicles. This chapter looks at the current state and expansion
result of stricter air quality regulations. As a consequence, (locally) emission-free fuel cell electric vehicles powered by hydrogen are becoming increasingly attractive in comparison to cars with an internal combustion engine, and not on cost grounds alone.
If the gap between the purchase costs of fuel cell cars and battery electric cars can be closed as production numbers increase, fuel cell cars can also offer an alternative to (locally) emission-free battery electric vehicles. That is because, with comparable ownership costs, fuel cell electric vehicles offer further advantages over battery electric vehicles, such as greater comfort, longer range and shorter charging times. By contrast, if battery electric vehicles are improved in terms of comfort, range or charging time, they will become more expensive and will lose any economic advantages they may have over fuel cell electric vehicles.
An important factor in deciding whether to buy or keep a passenger car is the ownership costs involved. These include the car purchase costs, running costs, or ownership costs relating to a mileage or transport capacity.
At today’s cost structures fuel cell passenger cars are not yet competitive. But in an ambitious climate scenario involving rapid technological advances and market development, automotive fuel cell technology would quickly become much more cost-effective. In addition, production costs for hydrogen (from renewables) could fall in the medium to long-term, and – with lower hydrogen infrastructure costs – it could be distributed more cheaply as a fuel.
At the same time, internal combustion drive systems are becoming more expensive, and in urban and metropolitan areas they are often subject to local usage restrictions as a
vehicles and in more established and also lower purchase prices. Furthermore, all- electric drives are even more efficient than fuel cell electric vehicles.
The extent to which BEV energy costs per kilometre are higher or lower than those for FCEVs depends on the electricity prices. Depending on the purchase category – domestic electricity versus off-peak or preferential electricity tariff – the retail prices for electricity can fluctuate. High domestic electricity prices make running battery electric cars more expensive, while low electricity tariffs make it cheaper. Overall, however, the distance-based energy costs of both electric variants are still similar, and this is reflected in similar gradients of the ownership cost curves.
If the gap in purchase costs between FCEVs and BEVs could be more or less closed, the costs for fuel cell electric vehicles and battery vehicles (per vehicle kilometre) would be very similar. Under these circum-stances, because of advantages in terms of comfort, range and charging time, some potential buyers would probably be inclined to opt for fuel cell electric vehicles. Conversely, improving the range and charging time performance of BEVs would increase their purchase costs, thereby reducing their economic advantage.
lower than those for a petrol car after just 50,000 to 60,000 km. With virtual cost parity, non-economic advantages – such as the possibility of (locally) emission-free driving in cities – could tip the balance in favour of purchasing an FCEV.
In addition, fossil fuels could also become (relatively) more expensive, and this would likewise increase the economic attractive-ness of an FCEV as compared with a petrol car. However, a more efficient hybrid petrol car could (partially) compensate for the higher fuel prices. By contrast, lower fossil fuel prices – which prevail for example in the USA or which could be induced by lower crude oil prices in a 2°C climate action scenario (IEA 2016b) – may diminish the economic advantage of an FCEV in terms of mileage-dependent fuel costs. Because of the lower specific hydro-gen consumption (in MJ/km), variations in the hydrogen retail price have less of an impact in the ownership cost comparison with internal combustion drives than changes in fossil fuel prices.
FCEVs VERSUS BEVs
Battery electric vehicles currently have a head start of several years over fuel cell electric vehicles in terms of technology and market development. This lead is expressed in a greater variety of battery electric
prices, and for passenger cars of 2020 and beyond, the energy costs based on mileage (in €/km) for electric drives are lower than those for petrol vehicles. Only petrol-hydrids would be able to compete with FCEVs and BEVs at today’s fuel prices; petrol-only vehicles always display substantially higher running fuel cost than EV drives.
FCEVs VERSUS PETROL CARSUntil now, FCEVs have still not been suffi-ciently attractive to many consumers in cost terms because of their high purchase price in comparison to petrol and diesel cars. In the future, cars driven by an internal com-bustion engine will be more expensive – in part because of higher costs for drivetrain technology (such as direct injection, hybrid systems) and because of more complex exhaust emission control systems.
On the other hand, fuel cell electric vehicles will become less expensive because of technological development, learning curve effects and effects of scale in production (IEA 2015b). The hydrogen consumer prices could also fall as a result of a more cost-efficient hydrogen supply and retail infrastructure. If the purchase price for a fuel cell electric vehicle were to fall by half, combined with a moderate reduction in hydrogen refuelling station prices, the ownership costs for an FCEV would be
8 REFUELLING INFRASTRUCTURE
or differences in the statistics for hydrogen refuelling stations and for fuel cell electric vehicles may occur.
8.2 LOCATION SOLUTIONSA hydrogen refuelling station comprises facilities for the delivery, storage and refuel-ling of hydrogen. All other components of a typical refuelling station, such as refuelling points for other fuels, parking areas, sales areas, car washes, etc., have been excluded from the following consideration because they are similar to those of a conventional refuelling station. Generally, there are three different location solutions for hydrogen refuelling stations:
A hydrogen facility can be integrated into an existing refuelling station as an additional
AFDC 2017, CaFCP 2017, HyARC 2017; Status Q1 2017
29 HYDROGEN INFRASTRUCTURE ACTIVITIES
IN SUMMARY
5150
7 CAR OWNERSHIP COSTS
91
37
61
18
DE
UK
USAtotal
JP
4
9
CAN23
Rest of Europe 26
Global281
Stations
3
5KORCHI
IND
Scandinavia
Global4138 FCEV
40% USA / 40% JP
CEP/H2 Mobility
HySUTCaFCP30

REFUELLING STATIONUPSTREAM
8.5 REFUELLING STATION SIZES
Regardless of the way in which hydrogen is supplied and delivered, refuelling stations can be differentiated by size. H2 Mobility (H²M 2010) classifies four sizes of refuel-ling stations, “very small (XS)”, “small (S)”, “medium (M)” and “large (L)”, depending on the number of refuelling operations or the volume of hydrogen sold (table 31). In principle, XL stations with even higher output data are also conceivable; no stations of this size are expected for the moment, however. The XS refuelling stations are usually research stations, in which economic optimisation is not a priority. The commer-cialisation of hydrogen refuelling stations only starts with size S or M.
The hydrogen station equipment has to be sized accurately for the station. A modular design enables smaller hydrogen refuelling stations gradually to be expanded into larger ones if the hydrogen demand also increases in line with rising vehicle numbers. Nonetheless, over the course of the development of hydrogen refuelling stations, structural changes may occur that require a shift to a different refuelling station concept.
To ensure a high capacity utilisation of the refuelling station and hence to achieve as steady a throughput as possible, hydrogen should be delivered in accordance with need. If an hydrogen refuelling station is serving bus fleets used in local public transport, its throughput rises significantly. As delivery volumes rise, the supply of liquid hydrogen (station size L or XL) will become economically viable.
connection devices) and the hydrogen fuel quality standard ISO 14687-2 for PEM fuel cell electric vehicles (EP/Council 2014a).
Hydrogen fuelling must take place within hydrogen storage system limits. The Worldwide Hydrogen Fueling Protocol SAE J2601 fuels all hydrogen storage systems quickly to a high state of charge (SOC) without violating the storage system operating limits of internal tank temperature or pressure. SAE J2601 was adopted as a standard in 2014. SAE J2601 (in combi-nation with SAE J2799) is being used as a basis for fuelling light duty fuel cell electric vehicles with 350 or 700 bar worldwide. SAE J2601 defines pressure tolerances and temperature windows for safe and conven-ient hydrogen refuelling. Apart from light duty vehicles part 2 and 3 of SAE J2601 also cover heavy duty vehicles and forklifts.
Finally, SAE J2600 (Compressed Hydrogen Surface Vehicle Fueling Connection Devices) and SAE J2799 (Hydrogen Surface Vehicle to Station Communications Hardware and Software) must be complied with in regard to dispenser design. While the fuelling nozzle is standardised, the design of the user interface is left to the refuelling station operator. Depending on specific site-related or technological issues, other national or local standards may also apply.
An overview of technical standards for the automotive hydrogen infrastructure can be found online, for example at www.hyapproval.org, www.hyweb.de or www.fuelcellstandards.com.
To ensure safe operation, a large number of technical standards must be adhered to when building and operating hydrogen refuelling stations. Work is still ongoing on hydrogen-specific codes and standards for the automotive hydrogen economy, since in some cases regulations not designed for hydrogen make building and operating refuelling stations more difficult and more expensive (HMUELV 2013). Technical standards published by the International Organization for Standardization (ISO) or the Society of Automotive Engineers (SAE) specify concrete requirements for the hydrogen refuelling station infrastructure.
The most important technical standard is ISO 19880 (Gaseous Hydrogen Fuelling Stations). Other ISO standards are relevant for construction and also operation. For instance, the EU alternative fuels infrastruc-ture directive (AFID) requires compliance not only with ISO 19880 (formerly ISO 20100) but also with ISO 17268 (Gaseous hydrogen land vehicle refuelling
gaseous hydrogen, liquid hydrogen is trans-ferred via a liquid pump to an evaporator, from where it can be introduced directly into the vehicle without being cooled.
Dispenser: Refuelling itself is carried out using the dispenser, a device or machine to pump liquid or gaseous fuels into the vehicle. The dispenser includes the fuelling nozzle, which delivers the compressed hydrogen into the vehicle’s pressure tank. It is designed for the pressure of the hydro-gen tank, i.e. 350 or 700 bar. Another important element is the user interface, which contains various displays showing pressure, fill level or measured quantity.
Finally, the hydrogen can be produced either locally at the refuelling station or centrally in another location and then delivered. In the case of decentralised hydrogen production at the refuelling station, the production concept has to be decided. The options are a reformer for producing hydrogen from natural gas (or biomethane) or an electrolyser for produc-ing hydrogen from (renewable) electricity.
Mobile refuelling stations are used in places where (as yet) there is no perma-nent hydrogen refuelling station and only relatively small amounts of hydrogen are dispensed locally. In this case, transportable containers or truck trailers are used as liquid or compressed gas storage tanks. Mobile hydrogen refuelling stations are thus primarily an instrument for a market launch or for demonstration projects.
new, standalone facility. In this case a previously unused site has to be developed. There is no need to work within the con-straints of existing site infrastructure.
For public hydrogen refuelling stations, however, the typical refuelling station components expected by customers, such as sales areas and other services, also need to be taken into consideration.
fuel offering. The main precondition for this is that there is sufficient space on the exist-ing site for the required hydrogen facilities and that the delivery, storage and dispens-ing of hydrogen alongside other liquid or gaseous fuels is possible from both a technical and a regulatory perspective.
A hydrogen refuelling station can also be established like a greenfield project as a
Low-Pressure Storage Compressor Precooling DispenserHigh-Pressure Storage
1 2 3 4 5
Electrolyser
8.3 REFUELLING STATION MODULES
Certain technical components are neces- sary for the construction of a hydrogen refuelling station. For all refuelling stations these include adequately sized storage facilities for hydrogen, compressors which bring the hydrogen to the desired gas pressure level, a precooling system, and dispensers for delivering the fuel. Refuelling stations can be set up more quickly and less expensively by standardising or modu-larising these components – which are also known as functional modules (H2M 2010).
Hydrogen storage tanks: The storage tanks must hold enough hydrogen to meet customer demand. To this end hydrogen is stored in low-pressure tanks, currently at between 20 and 200 bar (in future up to 500 bar), for several days. If the hydrogen is delivered by compressed hydrogen gas trailer, this can be used on site as a low-pressure storage tank. The quantities to be stored are calculated on the basis of the number of anticipated refuelling operations per day and can be adapted with a modu-lar expansion of the refuelling station.
Medium- and high-pressure storage tanks, with pressure stages of 200 to 450 bar and 800 to 1,000 bar respectively, are
used to refuel the customer vehicle. The hydrogen from the low-pressure storage tank can be transferred via a high-pressure compressor to the high-pressure storage tank. The pressure there is high enough to refuel the vehicle. Another possibility is to use a medium-pressure storage tank. From there the customer’s vehicle tank can be filled until pressure balance is reached. To fill up the tank completely, refuelling can then either be continued from the high-pres-sure storage tank (cascade refuelling) or hydrogen from the medium-pressure storage tank can be compressed to the necessary pressure using a booster compressor.
Compressors: A number of different compressors can be used to achieve the necessary compression. Customary types are piston, compressed air, diaphragm or ionic compressors, which are selected according to the design of the refuelling station (capacity utilisation, energy con-sumption, cost-effectiveness, etc.). Hydro-gen compression is a way of overcoming the pressure difference between storage (from 50 to 200 bar) and refuelling (up to 1,000 bar). The refuelling process should not exceed the target time of three to five minutes. Since the fuel cell in the vehicle is operated with pure hydrogen, it is important
that no contamination with lubricants occurs during compression.
Precooling system: The SAE J2601 fuelling protocol, which covers hydrogen vehicle refuelling, aims to ensure that a vehicle’s hydrogen tank does not heat up above 85°C even during fast refuelling. Since hydrogen is compressed during refuelling, it heats up. Depending on ambient temper-ature, fuel delivery temperature and target pressure in the vehicle tank, precooling (normally) is necessary to stay in within the limits (overpressure/overheat) of the vehicle’s fuel storage system. For 700 bar refuelling hydrogen is generally precooled to -40°C (according to SAE J2601). Higher precooling temperatures are possible, but may lead to longer refuelling times.
The low temperature required is usually generated by means of a compression refrigerating machine and a suitable heat exchanger. Precooling adds complexity to the station and increases its energy con-sumption. Further optimisation of the pro-cess is currently an area of development.
In the case of a liquid hydrogen refuelling station, cryogenic hydrogen (LH2) is deliv-ered and stored in a liquid tank. If the fuel cell electric vehicle is to be refuelled with
8.4 STANDARDS
Very small
XS
Small
S
Medium
M
Large
L
Dispenser 1 1 2 4
Max throughput per day 80 kg 212 kg 420 kg 1,000 kg
Max no. of refuellings per day
20 38 75 180
Max no. of FCEVs supplied per station
100 400 800 1,600
31 CLASSES OF HYDROGEN REFUELLING STATIONS BY SIZE H2M 2010
H2
KA
THO
DE
AN
OD
E
H2O
H2 O2
30 COMPONENTS OF A HYDROGEN REFUELLING STATION
53
Shell Hydrogen Study
52
8 REFUELLING INFRASTRUCTURE

PATH 1 PATH 2 PATH 3 PATH 4 – OUTLOOK
Dispenser 1 1 4 8
Capacity 80 kg/day 80 kg/day 320 kg/day 700 kg/day
Production Central reforming On-site electrolysis Central reforming or electrolysis
Central electrolysis
Supply Gaseous Gaseous Liquid Gaseous
Transport CGH2 – tube trailer (lorry) N/A LH2-trailer (lorry) Pipeline
Transport capacity 500 kg per delivery N/A 3.5 t per delivery Unlimited
Low-presure storage Approx. 200 - 300 % of daily fuel volumes
Approx. 50 - 70 % of daily fuel volumes
Approx. 200 - 700 % of daily fuel volumes
N/A
High-presure storage 30 - 50 kg/dispenser 30 - 50 kg/dispenser N/A 30 - 50 kg/dispenser
Refuelling Dispenser 80 kg/day 20 refuellings
Dispenser 80 kg/day 20 refuellings
Dispenser 80 kg/day 20 refuellings
Dispenser 80 kg/day 20 refuellings
Refuelling gas pressure 700 bar 700 bar 700 bar 700 bar
Space requirements Medium High Low Very low
Capitical costs per site(specific per kg H2)
High High (including electrolyser)
Medium Low(high including pipeline infrastructure)
Hydrogen cost Low High Medium Low
1,500 kg LH2/day
180 kg CGH2/day
130 kg CGH2/day
Electrolysis
3,400
13,400
22,500
NRE
L 201
3c; E
VTC
201
4
33 HYDROGEN SITE CAPITAL COSTS in $/kg H2 + day
As of the beginning of 2017, there are 281 hydrogen refuelling stations and more than 4,000 hydrogen-powered vehicles world-wide. Hydrogen refuelling stations and fuel cell vehicle fleets are concentrated in the USA, Western Europe and Asia/Japan.
Hydrogen refuelling stations comprise the following technical components: storage tanks, compressor, precooler/evaporator and dispenser. A modular structure and internationally agreed, hydrogen-specific standards contribute significantly to a safe and efficient expansion of the refuelling station network.
Substantial potential for cost reduction amounting to around 50 % is anticipated between 2017 and 2025, thanks to regulatory and technical standardisation and effects of scale (CEC/CARB 2017). Nevertheless, financing a new hydrogen refuelling station infrastructure remains an economic challenge, because in the early market development stage hydrogen dis-pensers have only a few vehicles to serve, and low throughput can lead to under-utili-sation. If the full cost were to be passed on, hydrogen retail prices would have to be very high. This conflicts with the fact, that the product offered to the consumer must be economically attractive too.
To keep capital requirement and investment risks as low as possible, an optimum roll-out strategy for a future hydrogen refuelling station infrastructure is needed. Key elements of such an infrastructure strategy are spatial network planning, the choice of optimum refuelling station concepts and sizes, the coordination of infrastructure and vehicle fleet, and the standardisation of technical and regulatory solutions.
To overcome the technical and economic market barriers of a hydrogen-based infra-structure, hydrogen initiatives have been established in leading automotive regions (see box on global hydrogen mobility initiatives). In addition, state funding to promote market development is available in Europe, North America and Asia for the purchase of fuel cell electric vehicles and for building hydrogen refuelling stations (IEA 2015b).
hydrogen refuelling stations, ranging from 1 million to 10 million USD. The costs for the most important refuelling station concepts with daily capacities of around 200 to 300 kg hydrogen are between 2 and around 3 million USD, with expenditure on fixed assets amounting to 1.5 to 2 million USD. For Germany, lower costs of around 1 million EUR per refuelling station are cited (Bonhoff 2016).
As a metric, capital costs based on daily dispensing capacity have emerged. In absolute terms, investment costs for smaller hydrogen refuelling stations are lower than for large ones. However, the capacity- specific capital costs range from almost 15,000 USD per kg and per day for small stations to approximately 3,000 USD per kg and day for large stations supplied with liquid hydrogen. These low capital costs are only achievable with high capacity utilisation, however. Refuelling stations with on-site hydrogen electrolysis are much more expensive than centrally supplied stations – specifically, over 20,000 USD per kg and day, which is attributable to the high investment costs for the electrolyser.
centrally by electrolysis and transported to the refuelling station via pipelines. The space requirement can then be neglected; virtually any number of vehicles can be served. As in the previous case, the size and number of dispensers need to be adapted accordingly.
8.7 COSTS & FINANCINGAs comprehensive an infrastructure as possible is an important factor for the acceptance and market success of a new technology – and that is also true of hydrogen and fuel cell vehicles. However, building that infrastructure requires high initial capital investment. The question is how high these investment costs will be and how a hydrogen refuelling station infrastructure can be built as efficiently as possible.
There are a number of information problems associated with estimating refuelling station costs: firstly, the costs of setting up a hydrogen refuelling station depend on the location solution, the size of the refuelling station and local conditions. For competition reasons, cost data is often confidential and is not published. Furthermore, the hydrogen stations that have been built to date have mostly been designed as one-off projects. Past building outlay therefore is not a relia-ble indicator for future construction costs in a more developed market. And lastly, there are currently only a few publications on hydrogen refuelling station costs.
In-depth studies on hydrogen refuelling sta-tion costs are only available from California so far (NREL 2013c; EVTC 2014; CEC/CARB 2017). According to these studies, there is a big spread in investment costs for
Table 32 shows four typical hydrogen sup-ply and distribution pathways. All pathways assume the purchase of compressed hydro-gen at 700 bar; the dispenser is the same in all cases. Refuelling should take between three and five minutes for a full tank. The four supply pathways map a time line: the first two pathways are already relevant in the short- and medium-term and differ in terms of the type of hydrogen supply: in the first case hydrogen is delivered in gaseous form, in the second pathway it is produced on site. The first refuelling station would currently be limited to a trailer delivery and hence to approximately 500 kg hydrogen per day. With on-site production there would be no delivery restrictions, although the electrolyser must reliably produce the required amounts of hydrogen. The investment costs are also higher. On-site production can be scaled up if necessary. However, functional modules such as the storage tanks, compressor or dispenser need to be resized in some circumstances.
Hydrogen pathways 3 and 4 are only relevant in the mid- to long-term or for a larger hydrogen requirement. Pathway 3 is based on a liquid delivery, which can bring larger amounts to the refuelling station and can manage with less space. Only in the longer term will hydrogen be produced
(natural gas, biogas, naphtha). Normally, hydrogen produced on site is in gaseous form at a pressure of less than 50 bar, so it has to be compressed further for refuelling. Centrally produced hydrogen can be delivered in gaseous form as CGH2 or in liquid form as LH2, with CGH2 dominating.
In the case of gaseous hydrogen, the pressure stage at which the vehicles are served is important. At present, refuelling stations operate at the two pressure stages of 350 bar and 700 bar, and at the current stage of development the split is roughly equal (HyARC 2017). Around 20 % of all refuelling stations currently offer both pressure stages, but the trend is towards the higher pressure stage, with the advantages of a larger volume of hydrogen stored and hence an improved vehicle range. Over 90 % of refuelling operations for fuel cell electric vehicles are with gaseous hydro-gen. Currently only a few refuelling stations offer both possibilities or concentrate on liquid refuelling (HyARC 2017).
The supply options for hydrogen (delivery as CGH2 or LH2, in trailers or by pipeline; on-site production) can be combined with the dispensing options (gaseous at 350 or 700 bar; liquid) and the size and design of the refuelling station (storage concepts, etc.).
The space required for delivering, storing and dispensing hydrogen at the refuelling station is a factor that must be considered, especially in inner city areas. Of the various supply concepts, on-site production requires the most space, since the electrolyser or reformer is located on the refuelling station premises. At the same time, the storage requirement is lower, since hydrogen can be produced to a greater extent on demand. On the other hand, optimisation work has already reduced the space needed for the hydrogen handling equip-ment. Whereas a few years ago hydrogen facilities were still housed in 40-foot containers (corresponding to 12 m), smaller containers measuring 11 feet (3.3 m) are today sufficient.
8.6 DISTRIBUTIONIn terms of hydrogen supply, there are two different options available for retail sites: the delivery of externally produced hydrogen to the stations, or decentralised production on site. Currently, most refuelling stations are supplied with centrally pro-duced hydrogen (HyARC 2017). When it comes to on-site hydrogen production, at the refuelling stations that are operating around the world electrolysis ranks ahead of the reforming of gases and other fuels
IN SUMMARY
By choosing appropriate refuelling station sizes and refuelling station supply concepts, the hydrogen refuelling station network can be adapted to the given demand.
Building a refuelling station infrastructure requires high capital investment. In the early stages of market growth, there will be a need for synchronisation with the development of the fuel cell electric vehicle fleet and further (short-term) financial support for infrastructure expansion
32 SELECTED HYDROGEN SUPPLY AND DISTRIBUTION PATHWAYS
55
Shell Hydrogen Study
54
8 REFUELLING INFRASTRUCTURE

The transport sector currently (2014) consumes around 28 % of the global final energy consumption and causes 23 % of the energy-related greenhouse gas emissions (IEA 2016a). Around three-quarters of global transport emissions come from road transport. Road transport worldwide was responsible for around 5.7 gigatonnes of carbon dioxide emissions (CO2) in 2014. This corresponds to a share of 17.5 % of the energy-related CO2 emissions worldwide.
Between 1990 and 2014, road traffic-related CO2 emissions grew by 71 % worldwide; emissions from road traffic in the industrial nations (OECD) also increased over this period by 30 % (IEA 2016a). Despite measures to avoid traffic or to shift it to public transport or more environmentally sustainable modes of transport, road traffic worldwide is still increasing. Therefore, reducing the energy, especially the fuel consumption, and the environmental impact of motor vehicles is all the more important.
Overall the energy consumption and the environmental impact of motor vehicles are determined by, along with the vehicle mileage, their specific energy consumption. Fuel consumption is substantially predetermined by the choice of drive type. The drive also influences the greenhouse gas emissions and, together with the energy conversion process, the resulting air pollutant emissions.
The specific energy consumption per km of a motor vehicle is determined by its weight and form, by environmental and driving conditions and by the efficiency of the drive type. The passenger car considered is an average passenger car in the respective region, i.e. is a C segment passenger car for Europa and Japan and a mid-sized light duty vehicle (LDV) for the US. The efficiencies of different drive types vary significantly. In particular, electric drive types, both battery electric and fuel cell electric vehicles, have much higher efficien-cies than internal combustion engines.
Thus, the Tank-to-Wheel (TtW) efficiencies of conventional petrol passenger cars are only about 20 %, and 30 % for hybrid petrol
Moreover, in 2014 the EU established minimum requirements for the infrastructure for alternative fuels, including hydrogen, through the AFID directive (2014/94/EU). This directive requires the EU member states to provide a reasonable number of hydrogen refuelling stations by 2025 in order to secure the movement of hydrogen-powered fuel cell electric vehicles (EP/Council 2014a).
USA/California (H2USA; CaFCP)There are a number of hydrogen initiatives in the USA, including the nationwide public-private initiative H2USA (www.h2usa.org). The state of California is leading the way in terms of the hydro-gen refuelling station infrastructure and fuel cell electric vehicle development. California is accelerating the phasing-in of so-called zero-emission vehicles within the vehicle fleet; just as battery electric vehicles fuel cell electric vehicles are regarded as ZEVs.
The California Fuel Cell Partnership CaFCP (www.cafcp.com) was established in 1999 under the leadership of the California Air Resources Board and the California Energy Commission. The CaFCP has already set up a number of multi-annual pro-grammes, most recently (2012) a roadmap for the five-year period to 2017. Accordingly, over 84 refuelling stations should be available by then, corresponding to a demand of around 53,000 vehicles (CaFCP 2012). More than 30 hydrogen stations were set up in 2016, and another 20 are under construction or going through approval procedures (CaFCP 2016).
Japan (HySUT)The governmental organisation New Energy and Industrial Technology Development Organisation (NEDO) is also driving forward the development and commercialisation of hydrogen technology in Japan. The relevant hydrogen technologies include domestic use (Ene-Farm) and use in power plants and transport. The Association of Hydrogen Supply and Utilisation Technology HySUT (www.hysut.or.jp/en/) was founded in 2009 under the umbrella of the NEDO. Its original aim was to promote the technical preconditions for a future hydrogen infrastructure.
Following a reorganisation in 2016, HySUT is now engaged in the commercialisation of the hydrogen supply system and of hydrogen-powered fuel cell electric vehicles. Areas of interest also include issues surrounding technology/consumer acceptance and demonstration projects. The technology and market demonstration phase was followed in 2016 by early commercialisation. This is due to be completed in 2025, with a move to full commercialisa-tion from 2026. The number of hydrogen-powered vehicles has increased steadily. As of the beginning of 2017 there are already around 90 refuelling stations operating in Japan, and this number is scheduled to rise to 160 by 2020.
Germany (H2 Mobility / CEP)The Clean Energy Partnership (CEP) industry consortium (www.cleanenergypartnership.de) for the development of an automotive hydrogen economy in Germany was established as early as 2002. Between 2012 and 2016 the CEP undertook the task of creating a basic hydrogen supply network, with 50 refuelling stations in Germany (CEP 2016).
The operating company H2 Mobility (www.h2-mobility.de) was established in 2014. H2 Mobility is a joint venture which is engaged in building and operating a network of hydrogen refuel-ling stations in Germany. H2 Mobility is also sourcing the hydrogen for its entire network, where possible from renewable energies.
H2 Mobility’s plan is to set up the first 100 hydrogen stations by 2018/2019, unconditionally and irrespective of fuel cell electric vehicle numbers; preferred locations are the metropolitan areas and hydrogen corridors along the motorways. Depending on the registration figures for fuel cell vehicles, a comprehensive hydro-gen infrastructure with 400 hydrogen refuelling stations in Germany should then be established by 2023.
As of the beginning of 2017 there were 35 to 40 CEP hydrogen refuelling stations operating in Germany. The CEP refuelling stations are being transferred to H2 Mobility. As a national hydrogen lighthouse project, the CEP will pursue tasks involved in developing hydrogen technology and standards.
EU/Europe (FCH JU, H2ME, EU AFID directive)In Europe there are a whole host of project-based, cross-border hydrogen/fuel cell initiatives – for example between European cities or for bus fleets. An important initiative is the Fuel Cells and Hydrogen Joint Undertaking (FCH JU), a partnership between the EU Commission, industry and research institutes. Its aim is to make the fuel cell and hydrogen pillars of the future European energy and transport system (www.fch.europa.eu). The second phase of the initiative (FCH JU 2) is scheduled to run until 2020, with pro-jects running until 2024.
Furthermore, the national hydrogen initiatives from Germany, Great Britain, Scandinavia and France have established a Euro-pean hydrogen platform called Hydrogen Mobility Europe (www.h2me.eu). Hydrogen Mobility Europe consists of two project parts: H2M1 and H2M2. The goal is to develop a pan- European infrastructure of hydrogen refuelling stations and fuel cell electric vehicle fleets in a coordinated manner. Today, H2M involves more than 40 Partners from 9 countries, drawing together their expertise from across the transport, hydrogen and energy industries. In addition, Denmark, Norway and Sweden are represented in the Scandinavian Hydrogen High way Partner-ship SHHP (www.scandinavianhydrogen.org).
GLOBAL HYDROGEN MOBILITY INITIATIVES 9 ENERGY & ENVIRONMENTAL BALANCES, SCENARIOS FOR FCEVs
This chapter examines the energy and greenhouse gas balances for hydrogen-powered fuel cell electric vehicles (FCEV) and discusses their potential contribution to more environmentally friendly mobility. The other air pollutant and noise emissions as well as other external effects of motorised private transport are not assessed.
Firstly, the analysis considers the drive efficiencies of passenger cars of different drive types in various regions of the world (EU and USA) and resulting specific fuel consumption figures, on the basis of (JEC 2013) and (GREET 2015). By reference to (JEC 2014) and again to (GREET 2015), specific greenhouse gas factors for fuels are derived and used to determine the specific greenhouse gas emissions of drive types.
Simple scenario assumptions for possible FCEV fleet growth figures in the leading hydrogen regions (USA, Western Europe, Japan) are outlined, on the basis of an ambitious automotive hydrogen scenario in (IEA 2015b).
Finally, extrapolated consumption, emission and fleet data along with other assumptions are used to estimate automotive hydrogen fuel consumption and potential savings of fossil fuels and greenhouse gas emissions to 2050.
passenger cars. Fuel cell electric vehicles at least achieve TtW efficiencies of up to 50 %, while battery electric vehicles can reach around 70 % (Kücücay 2014).
Like the vehicle ownership cost calculation, the scenario assumptions regarding the European vehicle fleet development are based on the specific fuel consumption fig-ures from (JEC 2013). These are recorded in the New European Driving Cycle NEDC. It is assumed that consumption figures of newly registered vehicles will disseminate into the passenger car fleets in the long term. It should be noted that JEC standard consumption figures for the 2020s and beyond assume significant improvements in efficiency. The standard specific fuel con-
sumption figures were converted into real specific fuel consumption by using real-world fuel consumption factors (ICCT 2016).
An estimate of technological progress and associated specific efficiency improvements and greenhouse gas emission reductions for passenger cars extending beyond the 2020s up to 2050 was provided in (AEA 2012). ICE passenger cars may achieve specific fuel savings of up to 50 % by 2050, as compared with the reference technology in 2010. These specific efficiency improve- ments were applied to the JEC fuel con- sumption figures up to 2050. However, the efficiency improvements for the petrol drives from 2040 onwards is limited due to technological restrictions.
9.1 EFFICIENCY AND FUEL CONSUMPTION
57
Shell Hydrogen Study
56
8 REFUELLING INFRASTRUCTURE

40
80
120
160
200 g CO2 / km
2020 2030 2040 20502020 2030 2040 2050 2020 2030 2040 2050 2020 2030 2040 2050
PETROL E10
PETROL HYBRIDE10
BATTERY ELECTRIC VEHICLEElectricity Mix 450
FUEL CELL ELECTRIC VEHICLEHydrogen Mix
Well-to-Tank
Tank-to-Wheel
34 SPECIFIC WELL-TO-WHEEL PASSENGER CAR GREENHOUSE GAS EMISSIONS “REAL WORLD” DRIVING CONDITIONS, EUROPE
for the growing FCEV fleet is generated entirely from renewable sources (e.g. wind power) and only the electrical energy needed at the refuelling station to compress the hydrogen is taken from the electricity mix according to the IEA 450 scenario. As a consequence, the WtW greenhouse gas emissions of the FCEV are slightly lower than those of the BEV.
The introduction of electric drives, particu-larly with a fuel cell, into the vehicle fleet provides an important lever for reducing the greenhouse gas emissions of motorised private transport if vehicle electricity and hydrogen are also produced with a low greenhouse gas output.
9.3 SCENARIOS FOR FCEVsIn addition to the 450 scenario in its World Energy Outlook, the International Energy Agency in its Energy Technology Perspectives (ETP) has developed a second technology-oriented 2DS scenario, which likewise describes how the 2°C goal can be met (IEA 2015a). While “450” denotes 450 parts per million CO2 (the maximum atmospheric CO2 concentration for the 2°C scenario) and considers a projection to 2040, 2DS stands for 2 Degree Scenario and extends as far as 2050. Both scenarios assume a rapidly accelerating technological improvement and set high requirements for reducing emissions in the conversion and consumption sectors of the energy system, and thus also in transport, by 2050.
gas reductions are achieved primarily due to improvements in the powertrain technology, since the assumed fuel mix is virtually unchanged over the considered time horizon. For the electric drives the emission reductions are achieved through a combination of technological improvements and the switch to renewable sources for electricity and hydrogen production.
Generally, electric drives generate much lower WtW greenhouse gas emissions than internal combustion engines. This advantage will be even more pronounced by 2050, since the efficiency potential of internal combustion engine drivetrains is technically limited.
For the electric drives it can be seen that up to 2030, the greenhouse gas emissions of FCEVs are still somewhat higher as compared with BEVs because a significant proportion of hydrogen is still reformed from natural gas; in 2050 this pattern is reversed. For BEVs the greenhouse gas emission factor for the electricity is based on the then low greenhouse gas electricity mix according to the IEA 450 scenario (IEA 2016b). However, in the 450 scenario electricity is still assumed to contain a small proportion of fossil electricity generation, leading to greenhouse gas emissions.
On the other hand, hydrogen can be spe-cifically produced from surplus renewable electricity where this accrues and can be stored for further use. Therefore, hydrogen
the basis of surplus renewable electricity is gaining ground, reaching 100 % by 2050, to enable greenhouse gas emissions to fall by 80 % as compared with 1990. The calculation of the greenhouse gas emission factors of the hydrogen mix over time is based on the emission factors from (JEC 2014) for the individual supply pathways. For the USA the corresponding supply pathways from (GREET 2015) are used.
GREENHOUSE GAS FACTORS FOR VEHICLES
If the varying drive efficiencies are also taken into consideration, the distance- related CO2 emissions in g CO2/km can be estimated for the different drive types. Figure 34 compares the WtW emissions for fuel cell electric vehicles with the WtW emis-sions for vehicles with an internal combustion engine (petrol) and battery electric drives.
For the internal combustion engine vehicles (petrol and petrol hybrid) it can be seen that over 80 % of the WtW greenhouse gas emissions arise during combustion in the engine (TtW) and only up to 20 % during production of the fuels (WtT). In the case of the electric drives (BEVs and FCEVs) only the WtT greenhouse gas emissions are relevant, since no emissions occur while the vehicle is running.
For all the drive types under consideration, the mileage-related WtW greenhouse gas emissions decrease over time: in the case of the petrol cars the greenhouse
assumed to be constant over the period up to 2050. Since the specifications for petrol are standardised, unchanged CO2 emission factors for its combustion (g CO2/MJ) are assumed.
For all regions under consideration, petrol containing 10 % bioethanol is assumed for the medium to long term. For the EU (and Japan), the bioethanol blends meet the sustainability requirements of the EU Renewable Energy Directive 28/2009/EC (EP/Council 2009a) and of the EU Fuel Quality directive 30/2009/EC (EP/Council 2009b). For petrol in the USA the WtT emission factors for E10 from the GREET model (GREET 2015) apply.
Electricity
Depending on the type of primary energy source used and the conversion technolo-gies for generating electricity, the carbon dioxide emissions in electricity generation vary widely. For electricity a clear change in the generation structure and hence also in its specific emission factor is anticipated because of a growing proportion of renew-able electricity generation in the electricity generation mix by 2050.
The 450 scenario developed by the International Energy Agency (IEA 2016b) describes the preconditions that must be met by the energy sector overall and by the electricity sector in particular in order to achieve the 2°C climate action goal. The greenhouse gas emission factors for the European, Japanese and US American electricity mix are derived from the ambitious 450 scenario and are extrapolated to 2050. In particular, the IEA 450 scenario requires a major decarbonisation of the electricity sector through a strong expan-sion of renewable energies.
Hydrogen
There are also different supply pathways for hydrogen: Today, hydrogen is primarily obtained by steam reforming of natural gas. In the mid-term, a growing proportion of biogas from municipal waste is assumed, up to 10 % by 2030 and dropping down again to 0 % in 2050. In the longer term, hydrogen generation by electrolysis on
fuel production pathways and fuel-specific combustion factors from the last edition of the Well-to-Wheels study by the European research platform of Joint Research Centre of the European Commission, Eucar and Concawe (JEC 2014) for Europe. The basic data from the JEC study was also taken into consideration by the European Commission in establishing typical and standard values for reducing greenhouse gas emissions for biofuels in the EU Renew-able Energy Directive 28/2009/EC (EP/Council 2009a) and the EU Fuel Quality Directive 30/2009/EC (EP/Council 2009b) as well as the associated directive 2015/652/EU (Council 2015) which lays down methods for calculating the green-house gas intensity of fuels and energy supplied other than biofuels and reporting by suppliers. The same greenhouse gas factors have been assumed to be valid for Japan.
For the USA the greenhouse gas factors are taken from “Greenhouse gases, Regulated Emissions, and Energy use in Transportation Model”, “GREET model” for short, published by the Argonne National Laboratory of the Department of Energy (DOE) of the US federal government (GREET 2015). The GREET model is used in modified form to establish the fuel path-ways of the Low Carbon Fuel Standard (LCFS) in California (CCR 2017).
For the scenario calculations CO2 emission factors were determined for three fuel types: petrol, as only petrol cars are con-sidered as the internal combustion engine reference, electricity for battery electric vehicles (BEVs), and hydrogen for fuel cell electric vehicles (FCEVs).
Petrol
The WtT emission factors from the JEC study (JEC 2014) for petrol were modified in accordance with a recalculation of the greenhouse gas intensity of crude oil imports into the EU (ICCT 2014b) and thus correspond to the values in the above mentioned EU directive laying down calculation methods for the EU Fuel Quality Directive (Council 2015). Moreover, the WtT emission factors for petrol are
The fuel consumption figures for Japan were assumed to be the same as for Europe. The specific energy consumption of US passenger cars was based on the values from (GREET 2015), which are somewhat higher than European consump-tion figures.
9.2 GREENHOUSE GAS EMISSIONSIn order to compare the carbon dioxide emissions of passenger cars, relevant energy-related greenhouse gas factors (in g CO2/MJ) are in a first step compiled for hydrogen, petrol and electricity. For this purpose, the greenhouse gas emissions for the entire fuel and energy supply chains are taken into account. In a second step distance-related greenhouse gas emissions (in g CO2/100 km) for the vehicles are calculated and discussed.
GREENHOUSE GAS FACTORS FOR TRANSPORT FUELS
Regarding greenhouse gas emissions, a distinction must be drawn between Tank-to-Wheel emissions (TtW), which arise from burning a fuel in the engine, and Well-to-Tank emissions (WtT), which are caused upstream by the production and supply of the fuel. Well-to-Wheel emissions (WtW) are used to assess the entire supply chain for the fuel including its use, i.e. from the source of primary energy to conversion into kinetic energy for propulsion.
Burning fossil energy sources produces car-bon dioxide, which largely determines the greenhouse gas balance of motor vehicles with an internal combustion engine. Other greenhouse gases can also arise upstream in the supply chains of all fuel types or energy sources. The most important of these other greenhouse gases (methane, CH4 and nitrous oxide, N2O) are also taken into consideration in the overall greenhouse gas balances. Where reference is made to CO2, the other greenhouse gases are also included in CO2 equivalents. The terms “greenhouse gas (GHG) emissions” and “carbon dioxide (CO2) emissions” are used synonymously below.
The specific greenhouse gas emission factors were compiled on the basis of the
59
Shell Hydrogen Study
58
9 BALANCES AND SCENARIOS

20
40
60
80
100
120 mln vehicles
2030 2035 2040 2045 2050
Japan
EU 4
USA
Dat
a: IE
A 2
015b
35 NUMBER OF FCEVs IN SELECTED MARKETS
2
4
6
8
10 mln vehicles
2030 2035 2040 2045 20502025
Japan
EU 4
USA
Dat
a: IE
A 2
015b
36 NEW REGISTRATIONS OF FCEVs IN SELECTED MARKETS
1
2
3
4
5
6
7 mln t H2 p.a.
2030 2035 2040 2045 2050
Japan EU 4 USA
37 ANNUAL H2 DEMAND OF FCEVs ACCORDING TO 2DS HIGH H2 SCENARIO
–200
–150
–100
–50 mln t CO2
2030 2035 2040 2045 2050
Japan
EU 4
USA
38 WELL-TO-WHEEL GHG SAVINGS OF FCEVs COMPARED TO PETROL VEHICLES
International Energy Agency (IEA 2016b) for 2014. This scenario is the “baseline scenario” in (IEA 2016b) and describes the development of the energy sector based on the confirmed climate action commitments by governments with regard to energy and greenhouse gas savings, and thus reflects the current situation. The NPS shows annual traffic-related emissions of approx. 1,700 mln t CO2 for the USA, around 860 mln t CO2 for the EU and around 210 mln t CO2 for Japan. Only TtW emissions are considered in this scenario.
FCEVs save 100 % of TtW emissions. For that reason in the cumulative consideration up to 2050 this proportion is larger than the WtW savings, in which, taken as a whole, higher WtT emissions from FCEVs compare with lower WtT emissions from petrol drives.
The emission reductions achieved in the 2DS high H2 scenario can be ranked by reference to the total traffic-related greenhouse gas emissions of the New Policies Scenario (NPS) developed by the
Hydrogen-powered fuel cell electric vehicles (FCEVs) are much more efficient than passenger cars driven by an internal combustion engine. Hence, FCEVs can make an important contribution to the diversification of the energy supply and to energy savings in motorised road transport.
Hydrogen generated from renewable energy sources (like wind or biogas) produces very low specific greenhouse gas emissions. Coupled with the more efficient drive of FCEVs, this results in up to 90 % lower distance-related greenhouse gas emissions as compared to internal combustion engine vehicles running on fossil fuels. Depending on the supply chain, FCEVs produce (slightly) higher/lower specific greenhouse gas emissions than battery electric vehicles (BEVs).
An ambitious 2DS high H2 scenario developed by the International Energy Agency, in line with the climate action goal of limiting the global temperature rise to 2°C, projects that the number of fuel cell vehicles in three key markets (USA, selected European passenger car markets and Japan) will increase to some 113 mln units by 2050. This is based on new FCEV registrations rising to 1 mln each in the EU and USA in 2030 and to around 10 mln in all the regions in question in 2050.
Based on these FCEV fleet scenarios, a hydrogen consumption of around 10 mln t of hydrogen (per year) has been estimated for the 113 mln FCEVs in 2050. If efficient petrol cars are superseded by FCEVs, this will lead to savings – depending on the petrol vehicle type (hybrid or petrol only) – of 38 to 68 mln t of petrol and over 190 mln t of traffic- related CO2 emissions in 2050.
it rises to 1 mln t in 2030, to a little over 5 mln t in 2040 and to 10 mln t in 2050. This corresponds to an energy equivalent of around 1,200 petajoules or to the energy content of 27 mln t of petrol. If in addition the much higher efficiency of fuel cell vehicles in comparison to petrol drives is also taken into account, the use of fuel cell electric vehicles can lead to savings of up to 38 mln t of petrol compared to hybridised petrol vehicles and up to 68 mln t compared to a pure petrol drive.
If this hydrogen is to be obtained by electrolysis from renewable electricity, the requirements for hydrogen production are as follows: for the USA this would mean a wind and solar electricity requirement of over 330 TWh. For EU4 the figure would still be more than 100 TWh and for Japan more than 40 TWh. For the purposes of comparison, (IEA 2016b) anticipates in the 450 scenario a reduced electricity pro-duction in 2040, compared with today's figures, of 4,752 TWh for the USA, 3,314 TWh for the EU and 864 TWh for Japan.
With a growing proportion of hydrogen from renewable sources by 2050, the rise in fuel cell electric vehicles offers a signif-icant greenhouse gas savings potential in the vehicle fleet. Assuming that the FCEVs will primarily replace cars with a petrol drive, this suggests a WtW greenhouse gas savings potential of over 190 mln t per year and a TtW greenhouse gas savings potential of over 180 mln t per year in the three regions of interest in 2050 (figure 38).
This savings potential is broken down across the three regions as follows: in the USA WtW savings of up to 125 mln t CO2 per year and TtW savings of up to 120 mln t CO2 are possible. In EU 4 WtW savings of up to 49 mln t CO2 and TtW savings of up to 45 mln t CO2 are possible, and finally in Japan WtW savings of 18 mln t CO2 and TtW savings of 14 mln t of CO2 are achievable. Taken over the entire period up to 2050, savings of over 1.5 gigatonnes WtW and around 1.6 gigatonnes TtW are possible in the three regions, as compared with petrol alternatives.
populated Japan 9,000 km/year. These average annual mileages are assumed for all vehicles considered, independent of their drive type. Moreover, annual mileages are assumed to remain constant until 2050. The calculated annual hydro-gen demand for the number of vehicles according to the 2DS high H2 scenario is shown in figure 37.
While the hydrogen demand in Japan develops moderately, it rises significantly for EU4 and especially for the USA. In total
As a comparison, there are currently over 1 billion passenger cars worldwide (VDA 2016), and the number is expected to reach around 2 billion vehicles by 2050.
The energy demand of FCEVs can be calculated by multiplying annual mileage with specific energy consumption figures. The typical annual mileages differ substan-tially in the markets in question. For the USA a mileage of approximately 18,000 km/year is assumed, for Europe approximately 13,000 km/year and for the densly
In the 2DS scenario, the IEA expects hydrogen and fuel cell technology to contribute substantially to the energy and climate goals. In the transport sector, the fuel cell drive can contribute significantly to reducing the greenhouse gas emissions of motorised private transport. Depending on the way in which the hydrogen is produced, and especially if it is produced from renewable energy sources, in a WtW consideration the greenhouse gas emissions of a fuel cell electric passenger car can be reduced by more than 90 % as compared with a petrol engine vehicle.
The IEA has published a “technology roadmap” for hydrogen and fuel cell electric vehicles (IEA 2015b), which is based on the 2DS scenario and, in a variant of that scenario, examines how an accelerated introduction of hydrogen technologies can contribute to achieving the 2°C goal (2DS high H2).
For the transport sector in the USA, Japan and the four major Western European markets of Germany, France, Great Britain and Italy (EU4), the 2DS high H2 scenario describes an increase in the number of FCEVs to well over 100 million vehicles by 2050. This assumes a rapid market expansion for fuel cell electric vehicles in the three automotive regions. According to this scenario, 1 million new FCEVs will have to be registered in both the USA and EU4 by 2030 in order to achieve the 2DS goals. In total, there would then be almost 10 million new FCEVs in the three market regions in 2050. As a comparison, approx. 74 million new passenger cars are registered each year worldwide at present (VDA 2016); in 2050 the annual number of newly registered passenger cars would be expected to be over 100 million cars.
Figures 35 and 36 show the development of the FCEV fleets in the three regions in question. The biggest absolute rise, to almost 60 million FCEVs in 2050, takes place in the USA. Around 35 million fuel cell vehicles are anticipated in the four Euro-pean countries (EU4) and some 20 million in Japan in 2050. In total, around 11 million fuel cell passenger cars will be registered in 2030 and around 113 million in 2050.
IN SUMMARY
61
Shell Hydrogen Study
60
9 BALANCES AND SCENARIOS

HYDROGEN – ENERGY OF THE FUTURE from surplus renewable power is seen as offering huge potential for the future.
Alkaline electrolysis has been used in the industry for more than a century. Alternative electrolysis methods offering improved performance parameters (regarding conver-sion efficiency, flexibility and cost) are currently in development.
Hydrogen production from biomass, while technically feasible, is still insignificant on a global scale, and while thermochemical methods such as biomass gasification and biogas reforming are already in use, bio-chemical processes are still in their infancy. The availability of biomass has to be checked against sustainability requirements, since it is a limited resource.
mal reforming and gasification, which generally use fossil primary energy sources. Some unused residual hydrogen is availa-ble for energy use as a by-product of industrial production processes.
To date, only small amounts of hydrogen have been generated from renewable energies, although that amount is set to increase in future. Electrolysis currently accounts for around 5 % of global hydrogen production, but most of this is still based on conventional electricity sources. Electrolysis
Since hydrogen usually exists on Earth as part of a compound, it has to be synthesised in specific processes in order to be used as a material or energy source. This can be achieved by different technical methods,
Hydrogen was the first element created after the Big Bang. It is the most common substance in the universe and the richest energy source for stars like the sun.
Hydrogen (H) is the first element in the periodic table of chemistry and is also the
Shell has been involved in hydrogen production as well as in hydrogen research, development and application for decades, with a dedicated business unit, Shell Hydrogen. Now, in cooperation with the German research institute and think-tank Wuppertal Institute, Shell has conducted a study on hydrogen as a future energy carrier.
The Shell Hydrogen Study looks at the current state of hydrogen supply pathways and application technologies and explores the potential and prospects for hydrogen as an energy source. The study also examines non-energy uses and non-automotive applications, but its focus is, as indicated by its subtitle Sustainable Mobility Through Fuel Cells and H2, on the use of hydrogen in road transport and specifically in fuel cell electric vehicles.
smallest, lightest atom. Pure hydrogen occurs on Earth only in molecular form (H2). Hydrogen on Earth is usually found in compounds, most notably as water mole-cules (H2O).
First discovered in the 18th century, hydro-gen was originally known as “inflammable air”. By the 19th century hydrogen was featuring in contemporary visions of the future, especially in relation to the energy industry and locomotion. In the 1960s and 1970s space travel and the increasing scarcity of resources further intensified the aura of excitement surrounding hydrogen. Since the 1990s the interest in hydrogen has been boosted by the growing urgency
Over the years Shell has published a number of scenario studies on key energy issues. These have included studies on important energy consumption sectors such as passenger cars and com-mercial vehicles (lorries and buses), and the supply of energy and heat to private households, as well as studies on the state of and prospects for individual energy sources and fuels, including biofuels, natural gas and liquefied petroleum gas.
Hydrogen is an element that receives significant attention. As an energy source, hydrogen has long been considered a possible basis for a sustainable energy future. But it cannot be viewed in isolation, since it is both in competition with and interdependent on other energies and the technologies that use them. The question is whether hydrogen can be an important energy carrier of the future.
to find sustainable energy sources. More recently, the focus has been on hydrogen’s role in an increasingly electricity-based energy economy.
Owing to its special physical properties, hydrogen is an almost permanent gas, since it only liquefies at very low temperatures (below –253°C). It has a low density, so it is usually stored under pressure. Liquefaction increases its density by a factor of 800. The most characteristic property of hydrogen is its flammability. It also has by far the highest gravimetric energy density of all energy sources in use today. Due to its chemical properties, hydrogen has to be handled with care.
STORAGE & TRANSPORTATION
APPLICATIONS
As the main hydrogen supply pathways, steam reforming of natural gas and biogas and electrolysis have been analysed and compared in terms of energy input, green-house gas emissions and production costs: Electrolysis based on conventional electricity (grid mix) requires high primary energy input. By contrast, natural gas and biogas reforming and electrolysis based on renew-able electricity require little primary energy. Moreover, electrolysis of renewable elec-tricity uses only minimal amounts of fossil resources. H2 originating from electrolysis with electricity from renewables produces the lowest greenhouse gas emissions, whereas H2 obtained from gas reforming – natural gas or biogas – is better than hydrogen from grid-based electrolysis.
and various primary energy sources – both fossil and renewable fuels, in solid, liquid or gaseous form – can be used in these techni-cal production processes.
The most important primary energy source for hydrogen production currently is natural gas, at 70 %, followed by oil, coal and electricity (as a secondary energy resource). Steam reforming (from natural gas) is the most commonly used method for hydrogen production. Other production methods include partial oxidation, autother-
Of all the production methods considered, centralised hydrogen production is more cost-effective than production in smaller, decentralised plants. Centralised natural gas reforming is most cost-effective of all, with production costs of 1 to 2 EUR per kilogram of hydrogen.
Electrolysis is significantly more expensive, and its commercial viability largely depends on electricity prices. The costs of biomass- based hydrogen production are between natural gas reforming and electrolysis.
In the future, decentralised natural gas reforming, centralised electrolysis and centralised biomass routes are expected to offer the greatest cost-saving potential.
The specific physical and chemical proper-ties of hydrogen lead to higher logistics costs (storage and transportation) than for other energy carriers. Hydrogen has a very low volumetric energy density, which means that it has to be compressed for storage and transportation purposes.
Commercially most important is the hydro-gen storage as compressed gas. For end users, high-pressure storage tanks of varying design (350, 700 bar) are available. A higher density for storage can be achieved by liquefaction, although this involves cooling the hydrogen to –253°C.
The higher the storage density, the greater the amount of energy needed for cooling and compression, which is why more effi-cient storage methods are being explored.
Unlike electricity, hydrogen can be success-fully stored in large amounts for extended periods. Low-pressure underground storage facilities such as caverns can be filled with hydrogen from surplus renewable electricity and used as buffer stores for the electricity sector. As yet, however, there are very few underground hydrogen storage facilities in use.
Novel storage media are materials-based hydrogen storage technologies. These include metal hydrides, chemical hydrogen storage materials (such as liquid organic hydrogen carriers) or sorbents (such as metallic organic frameworks, zeolites and carbon nanotubes). Most of these technolo-
gies are still at the research and develop-ment stage.
At present, hydrogen is generally trans-ported by lorry in pressurised gas tanks, and in some cases also in cryogenic liquid tanks. However, each lorry trailer can only carry around 0.5 to 1 t of gaseous hydro-gen or up to 4 t of liquid hydrogen.
Regional hydrogen pipelines are available in some locations, the longest being in the USA and Western Europe. In the long-term, the natural gas supply infrastructure (pipe-lines and underground storage facilities) could also be used for the storage and transportation of hydrogen. In terms of transport costs, liquid hydrogen is suitable for long-distance transport, compressed gaseous hydrogen is suitable for shorter distances in smaller amounts, while pipelines are advantageous for large volumes.
industry are ammonia synthesis, primarily used for the production of nitrogenous fertilisers, and methanol synthesis. Also, hydrogen is a by-product of crude oil refining in refineries, in particular catalytic reforming of naphthas, on the other hand it is used for the processing and refining of oil products in refineries – in processes such as hydrotreating and hydrocracking, for example. Energy applications involve converting the energy contained in hydro-
gen into heat, power or electricity. However, hydrogen is now rarely used as an energy source in heat engines.
For energy applications, fuel cells have become the main focus of hydrogen usage. Fuel cells offer much higher electrical efficiency and overall efficiency than heat engines. The fuel cell principle was discovered back in the 19th century: with a continuous supply of fuel, chemical energy
Hydrogen is a highly versatile basic chemi-cal with two main areas of use: material applications and energy applications. The most important material applications in
2
3
4 + –
H2O Water
CH4 Methane
H2 Hydrogen
H2O WaterH2 Hydrogen
CH4 Methane
1
THE ELEMENT HYDROGEN
SUPPLY PATHWAYS
63
Shell Hydrogen Study
62
SUMMARY

reduction potential are most suitable for mobility applications. A parallel develop-ment is the solid oxide fuel cell (SOFC), which is used for continuous domestic energy supply and in power plants.
The catalysts used on the electrodes of the fuel cells have a huge influence on system costs and performance. Work on cost savings and more affordable catalyst materials is ongoing.
while high temperature cells favour continuous loads and are more resilient to fluctuations in fuel quality. In addition, after external or internal reforming, some fuel cell types can also use other fuels containing hydrogen (such as natural gas or methanol).
The world market is currently dominated by low-temperature polymer electrolyte mem-brane fuel cells (PEMFCs), which because of their power density, flexibility and cost
is converted directly into electrical energy. As the reverse process of electrolysis, H2 and oxygen are recombined into H2O – producing DC electricity at the same time.
Fuel cells have seen some major technical advances, especially in recent years. The many different cell types now available are distinguished in terms of the electrolytes (ionic conductors) they use and their operating temperature. Low temperature cells allow for a dynamic load response,
MOBILITY APPLICATIONS
VEHICLE OWNERSHIP COSTS
REFUELLING STATION INFRASTRUCTURE
ENERGY AND ENVIRONMENT: SCENARIOS FOR FUEL CELL ELECTRIC VEHCLES
One of the most important considerations when it comes to buying or keeping a vehicle is economic in nature: the ownership costs involved. These include the purchase cost, ongoing costs for fuel, or costs relating to mileage or transport performance. Once the costs for vehicles with different drive-trains are sufficiently similar, other, non-eco-nomic decision factors come into play.
Under existing purchase and fuel cost structures, fuel cell passenger cars are not yet competitive. But in an ambitious climate action scenario involving rapid technological
STATIONARY ENERGY APPLICATIONS
Stationary fuel cells are an important driver of global market development for fuel cell systems, in terms of both numbers and installed capacity.
Fuel cells are increasingly being used as an alternative to generators and rechargeable batteries as a backup power supply, in the form of either emergency generator sets or
uninterruptible power supplies (UPS). Since fuel cells generate electricity and heat, their use in combined heat and power (CHP) units for electricity and heating supply in the power plant sector and the building sector is increasing.
Micro-CHP fuel cell systems, due to their high overall efficiency, are a promising new option for energy-efficient domestic energy supply. Fuel cells for domestic energy supply generally run on natural gas (with additional external or internal reforming). The first commercial micro-CHP units based on PEMFC and SOFC fuel cells are now available for the construction resp. building sector. Major demonstration projects and market launch programmes for domestic
fuel cell systems have already been intro-duced in Germany, Europe and Japan, under the names “Callux”, “ene.field” and “Ene-Farm”. By the end of 2016, almost 200,000 micro-CHP units had been installed in Japan under the Ene-Farm programme; by 2030 the Japanese government wants to have installed 5.3 million CHP units.
The economic efficiency of fuel cell micro-CHP or mini-CHP units in the building sector is dependent on the respective electricity and natural gas retail prices. The wider take-up of CHP technology in buildings will require (in the short term) further temporary funding to develop the market.
Hydrogen can be used as an energy source for mobility applications. Initially, it was also tested in internal combustion engines, but in the transport sector hydro-gen is now used almost exclusively in fuel cells. Space travel provided the historical and technical impetus for the development of hydrogen and fuel cell technology.
In principle, hydrogen fuel cell systems are suitable for virtually all means of transport, but their technological maturity varies
according to the means of transport and the way in which it is used. The technological maturity of a product can be determined in terms of Technology Readiness Levels (TRL), a system developed by the US space authority NASA. The TRL scale goes from levels 1 to 9. Sufficient technological maturity, which means at least proven functionality in the field of use (= TRL 8), is a crucial prerequisite for a market launch in the respective mobility application areas.
Industrial trucks such as forklifts or tractor units for material handling are technically almost fully mature and are already at the early stages of commercialisation. Passen-ger cars have reached series production, while buses are close behind. Material handling equipment has been manufactured in the highest numbers. Today, in North
America a fleet of over 11,000 fork lifts and tow trucks is in operation. Fuel cell passen-ger cars now offer the same features (such as performance, refuelling time, effective range or comfort) as those driven by internal combustion engines. Buses have undergone more intensive fleet testing than any other means of transport, thanks to public funding projects.
There is still a lot of development work to be done with regard to trains, ships and aircraft: light rail vehicles and commercial vehicles (including lorries) may benefit from proven bus or passenger car technology. There are no plans as yet for commercial aircraft or merchant ships, but they can use fuel cells as an efficient energy source for auxiliary power units (APUs).
advances and effects of scale in production and market development, automotive fuel cell technology would quickly become much more cost-effective. In addition, pro-duction costs for H2 could fall in the medium- to long-term, and this combined with lower technology and infrastructure costs would allow hydrogen to be distributed and marketed more cheaply as a fuel.
At the same time, vehicles with internal combustion drive-trains are becoming more expensive, mainly due to more complex exhaust gas treatment. In urban and metropolitan areas in particular IC engine vehicles are increasingly subject to local usage restrictions as a result of stricter rules on air quality and tailpipe emissions. As a consequence, (locally) emission-free fuel cell passenger cars powered by hydrogen are becoming increasingly attractive in
comparison to passenger cars with internal combustion engines, and not on cost grounds alone.
Once the gap between the purchase cost of fuel cell passenger cars and battery electric vehicles closes with increasing production numbers, fuel cell passenger cars offer a real alternative to (locally) emission-free battery electric vehicles. That is because, with comparable ownership costs, fuel cell electric vehicles also offer additional advantages over battery electric vehicles, such as greater comfort, longer range and shorter charging times. By contrast, if battery electric vehicles were to be improved in terms of comfort, i.e. range or charging time, they would become more expensive and would lose their economic advantage over fuel cell electric vehicles.
The development and spread of hydrogen mobility will require a new infrastructure to provide a comprehensive supply network for fuel cell electric vehicles (FCEV). As of the beginning of 2017, there are around 280 hydrogen refuelling stations and some 4,000 FCEVs worldwide. Hydrogen refuelling stations and fuel cell vehicle fleets have so far been concentrated in the USA, Western Europe and Asia / Japan. Infrastructure and fleet development has accelerated considerably in recent years.
Hydrogen refuelling stations comprise the following technical components: Hydrogen storage tank, compressor, precooler/evaporator and dispenser. Until now, hydrogen refuelling stations have mostly been custom-made. Manufacturing costs can be reduced by the modularisation of technical components and by series production. Furthermore, internationally agreed, hydrogen-specific standards will contribute significantly to a safe and efficient expansion of the refuelling station network. Substantial potential for cost reduction in the order of 50 % over the coming years is anticipated, thanks to regulatory and techni-cal standardisation and effects of scale.
Absolute and specific refuelling station infrastructure costs differ, depending on
capacity, design and utilisation. By choosing appropriate sizes and supply concepts, the hydrogen refuelling station network can be adjusted to meet demand, and infrastructure costs can be reduced by means of a gradual expansion. Nevertheless, there is a risk of significant under-utilisation at the start of the market growth phase, so in the early stages there will be a need for financial support for infrastructure expansion.
Network development will also have to be synchronised with the expansion of hydrogen resp. FCEV fleets. A number of hydrogen initiatives have been set up to this end in the lead regions (North America, Western Europe and Japan/Asia).
Transport is an important energy consumption and emission sector. Worldwide, road traffic was responsible for around 5.7 gigatonnes of CO2 emissions in 2014, and CO2
emissions from road vehicles rose by 71 % between 1990 and 2014. Given that road traffic worldwide is still increasing, despite measures to avoid traffic or to shift it to public transport or more environmentally sustainable modes of transport, reducing the energy consumption and negative environ-mental impacts of motorised vehicles is all the more important.
Hydrogen-powered fuel cell electric vehicles (FCEVs) are much more efficient than
passenger cars propelled by an internal combustion engine. So FCEVs can make an important contribution to the diversification of energy supply and to energy savings in motorised road transport.
If hydrogen is generated from renewable energy sources, its specific greenhouse gas emissions over the entire supply chain are very low. Coupled with the more efficient drive-train, this results in significantly lower distance-related greenhouse gas emissions
6
7
8
9
5
65
Shell Hydrogen Study
64
SUMMARY

9 TECHNOLOGY ACCEPTANCEHydrogen is not (yet) a familiar product among end users. Rather, for the vast majority of consumers, hydrogen and the technologies that use it are still new. Novel energy technologies require openness, a willingness to learn and familiarisation on the part of future users. Therefore, education and the dissemination of relevant technological information are vital if such technologies are to gain acceptance among users and in society as a whole. This requires appropriate communication strategies and formats for building experience and commitment.
10 SYNERGYTo speed up the establishment of a global hydrogen economy, synergies need to be created – through cooperation between cities, regions and states and with relevant economic operators. Linking up the production and consumption sectors is also important, as is a comprehensive coordination of innovative technologies like battery systems and fuel cells.
exemptions from bans on entering certain urban areas). The development of alternative technologies in areas with a very limited portfolio of mature, sustainable technologies (e.g. lorries, rail, ships, aircraft) requires further R&D funding.
6 INFRASTRUCTURE / REFUELLING STATIONS
The expansion of hydrogen refuelling stations, in particular in the introductory phase when utilisation is low, requires the financial burden and risk to be shared. State funding for infrastructure should play a part in this. The hydrogen infra-structure should be expanded in a coordinated manner as appropriate, with the long-term goal of nation-wide coverage.
7 STANDARDSHydrogen must be safe, easy and efficient to handle. Therefore there is a need for uniform, international, hydrogen-specific technical standards for plants and equipment and for hydrogen as a product.
8 ENERGY SOURCES AND FUELThe use of green hydrogen requires the creation of appropri-ate incentive systems – for example by offsetting it against the EU greenhouse gas reduction target for fuels or by expanding capacity markets for storage and demand-side management measures. Regarding hydrogen production from electricity, a level playing field needs to be established with other options such as power storage or Power-to-X schemes. Electrolysis should not be additionally burdened with duties, since electrolysers are not end consumers of (renewable) electricity. Existing differences in treatment at a product level must be eliminated.
3 FUEL CELLS The further development of mobile and stationary fuel cells as the most important energy technologies for hydrogen use must be supported, in terms of manufacturing costs and efficiency as well as long-term stability, through technologi-cally diverse R&D funding.
4 STATIONARY APPLICATIONSBackup systems for emergency and uninterruptible power supplies, micro-CHP fuel cell systems for domestic energy supply and cogeneration power plants still need further technology funding, despite significant advances in recent years. At least short-term financial and/or regulatory support is needed as they are brought onto the market.
5 MOBILITY APPLICATIONSFuel cell electric vehicles are electric vehicles. The purchase of fuel cell passenger cars and buses should be temporarily supported through public procurement programmes, direct financial incentives or a privileged status for vehicles (e.g.
Hydrogen as an energy source and fuel cells as energy converters have an important part to play in the energy transition and in achieving the climate policy goal of limiting the global temperature rise to 2°C. Hydrogen production and application tech-nologies have made significant progress in recent years. Nevertheless, hydrogen and fuel cells are both still in their infancy in terms of achieving broad commercial use in the global energy system. As such, they require further support and funding from the government and from society as a whole.
What actions and measures are needed to enable hydrogen and fuel cells to finally become one of the pillars of a sustainable energy system in the future? Below we set out ten key requirements across the entire hydrogen supply and use chain that may help to improve the overall conditions for a future hydrogen economy. Each of these measures is important in its own right, but ideally they should be regarded as a coherent bundle of measures, in which the individual steps build on each other – or, even better, are coordinated with measures for other sectors.
as compared with internal combustion engine vehicles running on fossil fuels. Depending on the hydrogen supply path-way, FCEVs produce (slightly) higher/lower, but essentially similar, specific green-house gas emissions as compared with battery electric vehicles.
An ambitious “2DS high H2” scenario developed by the International Energy Agency in line with the climate action goal of limiting the global temperature rise to 2°C, assumes that the number of fuel cell electric vehicles in three key markets (USA, selected European markets and Japan) will
increase to some 113 million units by 2050. This is based on a projected increase in annual FCEV registrations in the EU and USA to 1 million by 2030, rising to a total of 10 million new registrations per year in the three regions in question by 2050.
Based on assumed average annual vehicle mileages, specific (distance-related) vehicle energy consumption and greenhouse gas factors for the fuels used, the hydrogen consumption for a fleet of 113 million fuel cell electric vehicles in 2050 is estimated at approximately 10 mln t of hydrogen (per
POLICY ASKS FOR THE HYDROGEN ECONOMY
1 MANUFACTURINGThe continued development of hydrogen production methods based on electrolysis and low-emission reforming must be supported by, among other things, a tailor-made R&D policy focusing on manufacturing costs, efficiency, and flexibility of use. Financial incentives will be necessary, especially for the market entry phase, to boost the production of green hydrogen, either by electrolysis based on electricity from renewable energies or by biogas reforming.
2 STORAGE AND TRANSPORTATIONIn the long term, large-scale storage and transportation options for hydrogen must be (further) improved. One aspect of this is the storage of hydrogen produced from surplus renewable electricity in bulk storage tanks (caverns). In addition, more pre-commercial basic research is needed in the area of storage media (hydrides, liquid and sorbent storage systems). Finally, the hydrogen transport infra- structure (such as liquid hydrogen transport as well as hydrogen pipelines) must be developed as appropriate.
year). If efficient petrol passenger cars were to be replaced by fuel cell electric vehicles, this would lead to savings – depending on the design of the vehicle replaced (hybrid or petrol only) – of 38 to 68 mln t of petrol and over 190 mln t of transport-related CO2 emissions in 2050.
Considering the entire period between now and 2050, over 1.5 gigatonnes of green-house gas emissions could be saved, Well-to-Wheel, as compared to the replaced petrol vehicles.
67
Shell Hydrogen Study
66
SUMMARY

ADAC 2016: ADAC, Autokosten 2016. Berechnungsgrundlagen für die standardisierte Kostenberechnung, München 2016.
AEA 2012: AEA Technology plc (AEA), A review of the efficiency and cost assumptions for road transport vehicles to 2050, Didcot/UK 2012.
AFDC 2017: Alternative Fuels Data Center (AFDC), The Information Source for Alternative Fuels and Advanced Vehicles, Hydrogen, Washington 2017, http://www.afdc.energy.gov.
Aicher et al. 2004: Thomas Aicher, Ludger Blum, Michael Specht, Was-serstoffgewinnung aus Erdgas- Anlagenentwicklung und Systemtechnik. Fraunhofer ISE, FZ Jülich, Zentrum für Sonnenenergie- und Wasser-stoff-Forschung, Baden-Württemberg 2004.
Albat et al. 2008: Dirk Rüdeger Albat, Oskar Josef Haidn, Günter Lan-gel, Kap. 3.3 Raumfahrttechnik, in: Wilfried Ley, Klaus Wittmann, Willi Hallmann (Eds.), Handbuch der Antriebssysteme, 3rd edition, München 2008, pp. 179-203.
ARB 2015: Air Resources Board (ARB), Medium- and Heavy-Duty Fuel Cell Electric Vehicles. Technology Assessment, Sacramento/USA 2015.
Arianespace 2016: Arianespace, Ariane 5. User’s Manual. Issue 5 Revision 2, Evry-Courcouronnes 2016.
ASUE 2016: Arbeitsgemeinschaft für sparsamen und umweltfreundlichen Energieverbrauch e.V. (ASUE), Brennstoffzellen für die Hausenergiever-sorgung, Berlin 2016.
Ball/Wietschel, 2009: Michael Ball, Martin Wietschel (Eds.), The Hydrogen Economy: Opportunities and Challenges. Den Haag, Karlsruhe 2009.
BMVI 2014: Bundesministerium für Verkehr und digitale Infrastruktur (BMVI), Wissenschaftliche Studien-Kurzstudie: „Power-to-Gas (PtG) im Verkehr. Aktueller Stand und Entwicklungsperspektiven“, Berlin 2014.
BMW 2012: BMW, Cryo-compressed Hydrogen Storage, Presentation, Cryogenic Cluster Day, Oxford, September 28th, 2012.
Bonhoff 2016: Klaus Bonhoff, Supporting Market Ramp-up of Hydrogen and Fuel Cell Technologies, Presentation, WHEC 2016, Zaragoza/Spain, June 14th, 2016.
Bosch 2014: Robert Bosch GmbH (Eds.), Kraftfahrttechnisches Taschen-buch, 28th edition, Wiesbaden 2014.
CaFCP 2012: California Fuel Cell Partnership (CaFCP), A California Road Map: The Commercialization of Hydrogen Fuel Cell Vehicles, Sacramento/USA 2012.
CaFCP 2013: California Fuel Cell Partnership (CaFCP), A Road Map for Fuel Cell Electric Buses in California, Sacramento/USA 2013.
CaFCP 2016: California Fuel Cell Partnership (CaFCP), Annual Evalua-tion of Hydrogen Fuel Cell Electric Vehicle Deployment and Hydrogen Fuel Station Network Development, Sacramento/USA 2016.
CaFCP 2017: California Fuel Cell Partnership (CaFCP), Stations, Sacramento/USA 2017, http://cafcp.org/stationmap.
CCR 2017: California Code of Regulations (CCR), Title 17, Division 3, Chapter 1, Subchapter 10, Article 4, Subarticle 7, (ccr.oal.ca.gov), Thomson Reuters 2017.
CEC/CARB 2017: California Energy Commission (CEC)/California Air Resource Board (CARB), Joint Agency Staff Report on Assembly Bill 8: 2016 Assessment of Time and Cost Needed to Attain 100 Hydrogen Refueling Stations in California, Sacramento/USA 2017.
CEP 2016: Clean Energy Partnership (CEP), Wasserstoff – Was uns bewegt hat. 2002–2016, Berlin 2016.
Council 2015: Council of the European Union (Council), Directive 2015/652/EU laying down calculation methods and reporting requirements pursuant to Directive 98/70/EC relating to the quality of petrol and diesel fuels, in: Official Journal of the European Union, Brussels, April 25th 2015, L 107/26-67.
Cox 2011: Ruth Cox, Waste and By-product hydrogen; Presentation, DOE / DOD Workshop, Fuel Cell and Hydrogen Energy Association, USA 2011.
DBFZ 2007: Deutsches BiomasseForschungsZentrum (DBFZ), Techno- economic assessment of hydrogen production processes for the hydro-gen economy for the short and medium term, in: International Journal of Hydrogen Energy, Vol. 32, Issue 16, pp. 3797–3810.
DBFZ 2014: Deutsches Biomasse-ForschungsZentrum (DBFZ), Aufbereitung von Biogas zu Biomethan und dessen Nutzung - Status quo und Perspek-tiven, in: Karl J. Thomé-Kozmiensky, Michael Beckmann (Eds.), Dezen-trale Energieversorung, Nietwerder-Neuruppin 2014, pp. 133–149.
Dena 2015: Deutsche EnergieAgentur (Dena), Energiesystem der Zukunft - Power to Gas - Strategieplattform Power to Gas, Berlin 2015.
DLR 2015: Deutsches Zentrum für Luft- und Raumfahrt (DLR). Pressemit-teilung: Emissionsfreie Passagierflüge: DLR stellt Projekt für viersitziges Brennstoffzellenflugzeug HY4 vor, Stuttgart, October 12th 2015.
DOD 2011: Department of Defence, United States of America (DOD), Technology Readiness Assessment (TRA). Guidance, Washington 2011.
Drenckhahn/Hassmann 1993: W. Drenckhahn, K. Hassmann, Brennstoff-zellen als Energiewandler. Energiewirtschaftliche Tagesfragen, Jg. 43 (1993), Heft 6, pp. 382–389.
DWV 2015: Deutscher Wasserstoff- und Brennstoffzellenverband (DWV), Wasserstoff – der neue Energieträger, 5th edition, Berlin 2015.
e4ships 2016: e4ships, Brennstoffzellen im maritimen Einsatz 2009-2016, Hamburg 2016.
E4tech 2014: E4 Tech, Study on development of water electrolysis in the EU, Lausanne/London 2014.
E4tech 2016: E4tech, The Fuel Cell Industry Review 2016, Lausanne/London.
EA NRW 2013 : EnergieAgentur NRW (EA NRW), Wasserstoff – Schlüssel zur Energiewende Beispiele aus Nordrhein-Westfalen von der Herstellung bis zur Nutzung, Düsseldorf 2013.
EA NRW 2017: EnergieAgentur NRW (EA NRW), Brennstoffzellen- Grundlagen und Typen, www.brennstoffzelle-nrw.de, Düsseldorf 2017.
Eichlseder/Klell 2012: Helmut Eichlseder, Manfred Klell, Wasserstoff in der Fahrzeugtechnik. Erzeugung, Speicherung, Anwendung, 3rd edition, Wiesbaden 2012.
e-mobil BW 2013: Landesagentur für Elektromobilität und Brennstoff- zellentechnologie (e-mobil BW), Wasserstoff-Infrastruktur für eine nachhaltige Mobilität, Stuttgart 2013.
EMSA 2017: European Maritime Safety Agency (EMSA), Study on the Use of Fuel Cells in Shipping, Lisbon 2017.
EP/Council 2009a: European Parliament/Council (EP/Council), Directive 2009/28/EC on the promotion of the use of energy from renewable sources and amending and subsequently repealing Directives 2001/77/EC and 2003/30/EC, in: Official Journal of the European Union, L 140/16-62, Brussels, June 5th 2009.
EP/Council 2009b: European Parliament/Council (EP/Council), Directive 2009/30/EC amending Directive 98/70/EC as regards the specification of petrol, diesel and gas-oil and introducing a
mechanism to monitor and reduce greenhouse gas emissions, in: Official Journal of the European Union, L 140/88-113, Brussels, June 5th 2009.
EP/Council 2014a: European Parliament/Council (EP/Council), Directive 2014/94/EU on the deployment of alternative fuels infrastructure, in: Official Journal of the European Union, L 307/1-20, Brussels, Oct. 28th 2014.
EP/Council 2014b: European Parliament/Council (EP/Council), Regula-tion 333/2014/-EU amending Regulation 443/2009/EC to define the modalities for reaching the 2020 target to reduce CO2 emissions from new passenger cars, in: Official Journal of the European Union, L 103/115-121, Brussels, April 5th 2014.
Ernst & Young et al. 2016: Ernst & Young, Ludwig-Bölkow-Systemtechnik, Signon Deutschland, TÜV SÜD Rail, Becker Büttner Held, IFOK, Wasser-stoff-Infrastruktur für die Schiene, Ergebnisbericht, Berlin/Hamburg 2016.
EVTC 2014: Electric Vehicle Transportation Center (EVTC), Hydrogen Fueling Stations Infrastructure, Cocoa, FL/USA.
FCTO 2014a: Fuel Cell Technologies Office (FCTO), Early Markets: Fuel Cells for Backup Power, Washington 2014.
FCTO 2014b: Fuel Cell Technology Office (FCTO), Early Markets: Fuel Cells for Material Handling Equipment, Washington 2014.
FCTO 2016: Fuel Cell Technology Office (FCTO), State of the States: Fuel Cells in America 2016, 7th edition, Washington 2016.
FCTO 2017: Fuel Cell Technologies Office (FCTO), Hydrogen Storage, Washington 2017, https://energy.gov/eere/fuelcells/fuel-cell-technologies-office.
Fritsche et al. 2012: Uwe Fritsche, Horst Fehrenbach, Susanne Köppen, Dorothea Liebig, Jörg Adolf, Nach Super E10: Welche Rolle für Biokraftstoffe? Fakten, Trends und Perspektiven. IINAS Internationales Institut für Nachhaltigkeitsanalysen und -strategien; ifeu Institut für Ener-gie- und Umweltforschung, Darmstadt, Heidelberg, Hamburg 2012.
Gestis 2017: Gefahrstoffinformationssystem (Gestis), Stoffdatenbank, Sankt Augustin 2017, www.dguv.de/ifa/gestis.
Gökçek 2010: Murat Gökçek, Hydrogen generation from small-scale wind-powered electrolysis system in different power matching modes, in: International Journal of Hydrogen Energy, Vol. 35, Issue 19, pp. 10050-10059.
Görner 2015: Klaus Görner, Kapitel 7: Umwandlungsprozesse bei fossilen Energieträgern, in: Manfred Fischedick, Klaus Görner, Margit Thomeczek (Eds.), CO2: Abtrennung, Speicherung, Nutzung. Ganz-heitliche Bewertung im Bereich von Energiewirtschaft und Industrie, Berlin 2015, pp. 153-254.
Graf et al. 2014: Frank Graf, Manuel Götz, Marco Henel, Tanja Schaaf, Robert Tichler, Techno-ökonomische Studie von Power-to-Gas Konzepten, DVGW Forschungsstelle am KIT; DBI Gas- und Umwelt-technik; Outotec GmbH; Energieinstitut an der Johannes Kepler Univer-sität, Karlsruhe, Leipzig, Oberursel, Linz 2014.
GREET 2015: Argonne National Laboratory, The Greenhouse gases, Regulated Emissions, and Energy use in Transportation Model (GREET), Argonne/USA 2015.
Grube/Höhlein 2013: Thomas Grube, Bernd Höhlein, Kosten der Was-serstoffbereitstellung in Versorgungssystemen auf Basis erneuerbarer Energien, Wasserstoff und Brennstoffzelle, Berlin, Heidelberg 2013, pp. 225 – 239.
Günthner/Micheli 2015: Willibald A. Günthner, Robert Micheli, H2 IntraDrive – Einsatz einer wasserstoffbetriebenen Flurförderfahr-zeugflotte unter Produktionsbedingungen, München 2015.
H2M 2010: H2 Mobility (H2M), 70MPa Hydrogen Refuelling Station Standardization. Functional Description of Station Modules, Berlin 2010.
HMWEVL 2013: Hessisches Ministerium für Umwelt, Energie, Landwirt-schaft und Verbraucherschutz (HMUELV), Wasserstoff-Tankstellen, Wiesbaden 2013.
HMWEVL 2016: Hessisches Ministerium für Wirtschaft, Energie, Verkehr und Landesentwicklung (HMWEVL), Stationäre Brennstoffzellen- Anwendungen, Wiesbaden 2016.
Hollemann/Wiberg 2007: Arnold Hollemann, Egon Wiberg, Lehrbuch der Anorganischen Chemie, 102nd edition, München 2007.
Hua et al. 2013: Thanh Hua, Rajesh Ahluwalia, Leslie Eudy, Gregg Sin-ger, Boris Jermer, Nick Asselin-Miller, Silvia Wessel, Timothy Patterson, Jason Marcinkoski, Status of Hydrogen Fuel Cell Electric Buses World-wide, in: Journal of Power Sources, 269 (2014), pp. 975-993.
HyARC 2017: Hydrogen Analysis Research Center (HyARC), Hydrogen Data Book, Washington 2017, http://hydrogen.pnl.gov.
Hy-NOW 2012: DBFZ, LBST, Fraunhofer ISI, Evaluierung der Verfahren und Technologien für die Bereitstellung von Wasserstoff auf Basis von Biomasse, Leipzig, Ottobrunn, Karlsruhe 2010.
ICCT 2014a: International Council on Clean Transportation (ICCT), Factsheet United States Light-Duty Vehicle Efficiency Standards, Berlin u.a.O. 2014.
ICCT 2014b: International Council on Clean Transportation (ICCT), Upstream Emissions of Fossil Fuel Feedstocks for Transport Fuels Consumed in the European Union, Washington D.C. 2014.
ICCT 2016: International Council on Clean Transportation (ICCT), A 2016 Update of Official and ‘Real-world’ Fuel Consumption and CO2 Values for Passenger Cars in Europe, Berlin u.a.O. 2016.
IEA 2015a: International Energy Agency (IEA), Energy Technology Perspectives, Paris 2015.
IEA 2015b: International Energy Agency (IEA), Technology Roadmap Hydrogen and Fuel Cells, Paris 2015.
IEA 2016a: International Energy Agency (IEA), CO2 Emissions from Fuel Combustion. Highlights, Paris 2016.
IEA 2016b: International Energy Agency (IEA), World Energy Outlook, Paris 2016.
IEA HIA 2016: International Energy Agency/Hydrogen Implementing Agreement (IEA HIA), 2015 Annual Report, Bethesda/USA 2016.
IEA/UIC 2015: International Energy Agency (IEA)/International Union of Railways (IUC), Railway Handbook 2015. Energy Consumption and CO2 Emissions, Paris 2015.
ISO 2013: International Standardisation Organisation (ISO): ISO 16290:2013(en). Space systems — Definition of the Technology Readiness Levels (TRLs) and their criteria of assessment, Geneva 2013.
JEC 2013: Joint Research Center of the European Commission, Eucar and Concawe (JEC), Well-to-Wheels Analysis of Future Automotive Fuels and Powertrains in the European Context. Tank-to-Wheels-Report Version 4, Luxemburg 2013.
JEC 2014: Joint Research Center of the European Commission, Eucar and Concawe (JEC), Well-to-Wheels Analysis of Future Automotive Fuels and Powertrains in the European Context, Version 4.a, Luxemburg 2014.
Johnson 2012: Dewey Johnson, Global Methanol Market Review, Chemical Market Research IHS, London 2012.
Kaltschmitt et al. 2016: Martin Kaltschmitt, Hans Hartmann und Herrmann Hofbauer, Energie aus Biomasse: Grundlagen, Techniken und Verfah-ren, 3rd edition, Leipzig 2016.
Klingenberg 2016: Heinrich Klingenberg, Brennstoffzellenbusse im ÖPNV: Erfahrungsbericht und gemeinsame Busbeschaffung, Vortrag, 7. Deutscher Wasserstoff-Congress, Berlin, July 6th 2016.
BIBLIOGRAPHY
68
Shell Hydrogen Study
69
BIBLIOGRAPHY

Kücücay 2014: Ferit Kücücay, Verbrauchs- und emissionsarmes Fahrzeug, Vortrag, 11. Symposium: Hybrid- und Elektrofahrzeuge, Braunschweig, February 18th 2014.
Kwapis/Klug 2010: Dieter Kwapis, Karl Klug, Wasserstoffbasiertes Energiekomplementärsystem für die regenerative Vollversorgung eines H2-Technologiezentrums. Proceedings, Netzwerk Brennstoffzelle und Wasserstoff, Recklinghausen 2010, pp. 10050–10059.
Landinger 2016, Hubert Landinger, Internationale Perspektiven für brenn-stoffzellenbetriebene Fahrzeuge in der Logistik, Vortrag, 15. Brennstoff-zellenforum, Frankfurt, September 13th 2016.
LBST 2010: Ludwig-Bölkow-Systemtechnik (LBST), Potenziale der Wind-Wasserstoff-Technologie in der Freien und Hansestadt Hamburg und in Schleswig-Holstein, Ottobrunn 2010.
LBST 2016: Ludwig Bölkow Systemtechnik (LBST), Renewables in Trans-port 2050. Empowering a Sustainable Mobility Future with Zero Emis-sion Fuels from Renewable Electricity. Europe and Germany, Munich 2016.
LBST/Hinico 2015: Ludwig-Bölkow Systemtechnik (LBST), Hinico S.A., Study on hydrogen from renewable ressources in the EU (GHyP), München, Brüssel 2015.
LBST/Hinico 2016: Ludwig-Bölkow Systemtechnik (LBST), Hinico S.A., Power-to-gas. Short-term and long-term Opportunities to leverage Synergies between the Electricity and Transport Sectors through Pow-er-to-Hydrogen, München, Brüssel 2016.
Le Duigou et al. 2011: Alain Le Duigou, Marianne Miguet, Yves Amalric, French hydrogen markets in 2008 – Overview and future prospects, in: International Journal of Hydrogen Energy, Vol. 36, Issue 15, 2011, pp. 8822–8830.
Lemus/Duart 2010: Ricardo Guerrero Lemus, Jose Manuel Martinez Duart, Updated hydrogen production costs and parities for conventio-nal and renewable technologies, in: International Journal of Hydrogen Energy, Vol. 35, Issue 9, 2010, pp. 3929–3936.
Liberatore et al. 2012: Raffaele Liberatore, Michela Lanchi, Alberto Giaconia, Pietro Tarquini, Energy and economic assessment of an industrial plant for the hydrogen production by water-splitting through the sulfur-iodine thermochemical cycle powered by concentrated solar energy, in: International Journal of Hydrogen Energy, Vol. 37, Issue 12, 2012, pp. 9550–9565.
Maisonnier et al. 2007: G. Maisonnier, J. Perrin, R. Steinberger-Wilckens, S.C. Trümper, European Hydrogen Infrastructure Atlas and Industrial Excess Hydrogen, Oldenburg 2007.
Michaelis et al. 2013: Julia Michaelis, Fabio Genoese, Martin Wiet-schel, Systemanalyse zur Verwendung von Überschussstrom. Ergebnis-vorstellung der Studie „Integration von Windwasserstoff-Systemen in das Energiesystem“, Berlin 2013.
Mortimer/Müller 2010: Charles Mortimer, Ulrich Müller, Chemie. Das Basiswissen der Chemie, 10th edition, Stuttgart, New York 2010.
Müller-Syring et al. 2013: Gert Müller-Syring, Marco Henel, Wolfgang Köppel, Herwig Mlaker, Michael Sterner, Thomas Höcher, Entwick-lung von modularen Konzepten zur Erzeugung, Speicherung und Einspeisung von Wasserstoff und Methan ins Erdgasnetz. Deutscher Verein des Gas- und Wasserfaches e.V., Bonn 2013.
Müller-Syring/Henel 2014: Gert Müller-Syring, Marco Henel, Wasser-stofftoleranz der Erdgasinfrastruktur inklusive aller assoziierten Anlagen, Deutscher Verein des Gas- und Wasserfaches e.V., Bonn 2014.
NASA 1995: National Aeronautics and Space Administration (NASA), Technology Readiness Levels. A White Paper, Washington 1995.
NIST 2017: National Institute of Standards and Technology (NIST), NIST Chemistry WebBook. NIST Standard Reference Database Number 69, Gaithersburg, MD 2017, http://webbook.nist.gov/chemistry/.
Nitsch 2003: Joachim Nitsch, Potenziale der Wasserstoffwirtschaft, Berlin, Heidelberg 2003.
NREL 2013a: National Renewable Energy Laboratory (NREL), An Evaluation of the Total Cost of Ownership of Fuel Cell-Powered Material Handling Equipment, Golden/Colorado/USA 2013.
NREL 2013b: National Renewable Energy Laboratory (NREL), Blending Hydrogen into Natural Gas Pipeline Networks: A Review of Key Issues, Golden/Colorado/USA 2013.
NREL 2013c: National Renewable Energy Laboratory (NREL), Hydrogen Station Cost Estimates. Comparing Hydrogen Station Cost Calculator Results with other Recent Estimates, Golden/Colorado/USA 2013.
NREL 2016: National Renewable Energy Laboratory (NREL), Economic Assessment of Hydrogen Technologies Participating in California Elec-tricity Markets. Golden/Colorado/USA 2016.
RB 2015: Roland Berger (RB), Fuel Cell Electric Buses – Potential for Sustainable Public Transport in Europe, Munich 2015.
Reif 2010: Konrad Reif (Ed.), Konventioneller Antriebsstrang und Hybridantriebe, Wiesbaden 2010.
Renouard-Valleta et al. 2012: Gwénaëlle Renouard-Valleta, Martin Saballusa, Peter Schumann, Josef Kallo, K. Andreas Friedrich, Hans Müller-Steinhagen, Fuel cells for civil aircraft application: On-board production of power, water and inert gas, in: Chemical Engineering Research and Design, Vol. 90, Issue 1, 2012, pp. 3–10.
Rieke 2013: S. Rieke, Power-to-Gas: aktueller Stand, Vortrag, Fördervereinssitzung ReBio e.V., Brakel 2013.
Rifkin 2002: Jeremy Rifkin, Die H2-Revolution. Frankfurt, New York 2002
Sadler et al. 2016: Dan Sadler, Al Cargill, Mark Crowther, Alastair Rennie, James Watt, Steve Burton, Mike Haines, H 21 Leeds City Gate. Northern Gas Networks; Wales & West Utilities; kiwa Partner for progress; amec forster wheeler, Leeds/UK 2016.
Sattler 2010: Christian Sattler, Wasserstoff-Produktionskosten via solarer Reformierung von Erdgas. Proceedings Netzwerk Brennstoffzelle und Wasserstoff, Recklinghausen 2010.
Schiller 2012: Günther Schiller, Überblick über die Verfahren der Was-serelektrolyse und Forschungsergebnisse sowie Forschungsbedarf bei der alkalischen Elektrolyse, Vortrag, Ulmer Gespräch Energiesysteme der Zukunft, Ulm 2012.
Shell 2013: Shell, Natural Gas – a bridging technology for the future?, Hamburg 2013.
Shell 2014: Shell Pkw-Szenarien bis 2040. Fakten, Trends und Perspektiven für Automobilität, Hamburg 2014.
Shell 2015: Shell, LPG als Energieträger und Kraftstoff. Fakten, Trends und Perspektiven, Hamburg 2015.
Shell 2016: Shell Nutzfahrzeug-Studie. Diesel oder alternative Antriebe – womit fahren Lkw und Bus morgen? Fakten, Trends und Perspektiven bis 2040, Hamburg 2016.
Shell/BDH 2013: Shell/Bundesindustrieverband Haus-, Energie- und Umwelttechnik e.V. (Shell/ BDH), Klimaschutz im Wohnungssektor – Wie heizen wir morgen? Fakten, Trends und Perspektiven für Heiztechnik bis 2030, Hamburg 2013.
Smolenaars 2010: Jacques Smolenaars, Wasserstoff-Produktionskosten via Onsite-Reformer an der Tankstelle. Proceedings Netzwerk Brenn-stoffzelle und Wasserstoff, Recklinghausen 2010.
Sundmacher 2014: Kai Sundmacher, Power-to-Gas Energetik, Dynamik, Systemdesign, Akzeptanz, Vortrag, Leopoldina Symposium Energie-speicher, Halle 2014.
Suzuki 2011: Suzuki, Suzuki’s Burgman Fuel-Cell Scooter becomes world’s first fuel-cell vehicle to earn European Whole Vehicle Type Approval, Press Release, Hamamatsu, March 9th 2011.
Teichmann et al. 2011: Daniel Teichmann, Wolfgang Arlt, Peter Wasser-scheid, Raymond Freymann, A future energy supply based on Liquid Organic Hydrogen Carriers (LOHC), in: Energy & Environmental Science, Vol. 4, Issue 8, 2011, pp. 2767–2773.
Tillmetz/Bünger 2010: Werner Tillmetz, Ulrich Bünger, Development sta-tus of hydrogen and fuel cells–Europe, Vortrag, 18th World Hydrogen Conference, Essen 2010.
Trudewind/Wagner 2007: Clemens Trudewind, Hermann-Josef Wagner, Vergleich von H2-Erzeugungsverfahren. Proceedings, Tagungsband der 5. Internationalen Energiewirtschaftstagung IEWT an der TU Wien, Wien, February 14th - 16th 2007.
Tschöke 2014: Helmut Tschöke (Ed.), Die Elektrifizierung des Antriebs-strangs, Wiesbaden 2014.
UBA 2014: Umweltbundesamt (UBA), Treibhausgasneutrales Deutsch-land im Jahr 2050, Dessau 2014.
UNECE 2013: United Nations Economic Commission for Europe (UNECE), Agreement Concerning the Adoption of Uniform Technical Prescriptions for Wheeled Vehicles, Equipment and Parts. Regulation Nr. 110, Addendum 109, Geneva 2013.
US DOE 2006: US Department of Energy (US DOE), Technical Assess-ment of Cryo-Compressed Hydrogen Storage Tank Systems for Automotive Applications, Washington 2006.
US DOE 2009: US Department of Energy (US DOE), Energy require-ments for hydrogen gas compression and liquefaction as related to vehicle storage needs, Washington 2009.
US DOE 2016: US Department of Energy (US DOE), Fuel Cell Technologies. Market Report 2015, Washington 2016.
US Drive 2015: US Drive, Target Explanation Document: Onboard Hydrogen Storage for Light-Duty Fuel Cell Vehicles, Washington 2015.
VDA 2016: Verband der Automobilindustrie (VDA), Tatsachen und Zahlen, 80th edition, Berlin 2016.
VDE 2015: Verband der Elektrotechnik (VDE), Kompendium: Li-Ionen- Batterien.Grundlagen, Bewertungskriterien, Gesetze und Normen, Frankfurt/Main 2015.
von Wild et al. 2010: J. von Wild, T. Friedrich, A. Cooper, B. Toseland, G. Muraro, W. Te Grotenhuis, Y. Wang, P. Humble, A. Karim, Liquid Organic Hydrogen Carriers (LOHC): An auspicious alternative to conventional hydrogen storage technologies, in: Detlef Stolten, Thomas Grube (Eds.): 18th World Hydrogen Energy Conference 2010, Proceedings of the WHEC, Essen 2010.
Wagner 1996: Herrmann Josef Wagner, Brennstoffzellen – Funktion, Entwicklungsstand, zukünftige Einsatzgebiete, Frankfurt/Main 1996.
WBZU 2008: Weiterbildungszentrum Brennstoffzelle Ulm e.V. (WBZU), Brennstoffzellen-Grundlagen, Aufbau und Funktion. Vortrag beim Basis-seminar Brennstoffzellen- und Wasserstofftechnologie, Ulm 2008.
Weber 1988: Rudolf Weber, Der sauberste Brennstoff. Der Weg zur Wasserstoff-Wirtschaft, FL-Vaduz 1998.
Wendt/Plzak 1990: Hartmut Wendt, Vojtech Plzak (Eds.), Brennstoffzellen – Stand der Technik, Entwicklungen, Marktchancen, Düsseldorf 1990.
WI 2007: Wuppertal Institut (WI), CO2-capture and geological storage as a climate policy option: Technologies, concepts, perspectives, Wuppertal Spezial Nr. 35e, Wuppertal 2007.
WI/Covestro 2015: Wuppertal Institut für Klima, Umwelt, Energie gGmbH (WI); Covestro Deutschland AG, CO2 reuse NRW: evaluating gas sources, demand and utilization for CO2 and H2 within the North Rhine-Westphalia area with respect to gas qualities. Wuppertal, Leverkusen 2015.
Wietschel et al. 2016: Martin Wietschel, Till Gnann, Axel Thielmann, André Kühn, Stand der Forschung, Marktpotenziale und Forschungsbe-darf für Brennstoffzellen-Lkw, Präsentation, MKS-Fachworkshop, Berlin May 30th 2016.
Wing 2012: Jonathan Wing, Two-Wheelers and the Demand for Fuel Cells, FuelCellToday, August 1st 2012, http://www.fuelcelltoday.com/analysis/analyst-views/2012/12-08-01-two-wheelers-and-the-demand-for-fuel-cells.
Wing 2013: Jonathan Wing, Fuel Cells and Submarines, FuelCellToday, July 13th 2013; http://www.fuelcelltoday.com/news-archive/2013/may/u36-another-fuel-cell-submarine-for-the-german-navy.
World Steel Association 2015: World Steel Association, World Steel in Figures 2014, Brüssel 2015.
Würsig/Marquardt 2016: Gerd Würsig, Sören Marquardt, Strategic impact of efficient supply systems and alternative fuels. Safety, stan-dards and guidelines, Presentation at the Final e4ships Conference, Hamburg, September 7th 2016.
Yang/Ogden 2007: Christopher Yang, Joan Ogden, Determining the lowest-cost hydrogen delivery mode. International Journal of Hydrogen Energy, Vo. 32, Issue 2, pp. 268–286.
Yergin et al. 2009: Daniel Yergin, David Hobbs, Lawrence Makovitch, Mary Lashley Barcella, Fueling North America’s Energy Future: The Unconventional Natural Gas Revolution and the Carbon Agenda. IHS CERA Special Report. Cambridge, UK 2009.
Zakkour/Cook 2010: Paul Zakkour, Greg Cook, CCS Roadmap for industry: high-purity CO2 sources - Sectoral assessment. Industrial hydrogen and synfuel production and use. Global CCS Institute; Carbon Counts Company, UK 2010.
Zuberbühler et al. 2014: Ulrich Zuberbühler, Mareike Jentsch, Stephan Rieke, Errichtung und Betrieb einer Forschungsanlage zur Speicherung von erneuerbarem Strom als erneuerbares Methan im 250 kWel-Maß-stab. ZSW; Fraunhofer IWES. Stuttgart; Kassel 2014.
7170
BIBLIOGRAPHY Shell Hydrogen Study

Hydrogen is an element that receives significant attention: As an energy carrier, hydrogen is considered to be the basis for a sustainable energy future. But hydrogen is not alone, since it competes with other energies and their application technologies. The question arises as to what extent hydrogen can or will play a leading role in the global energy system of the future. Shell has already been active for decades in hydrogen research and development. In cooperation with the Wuppertal Institute, Shell has now conducted an energy carrier study, which addresses the current status as well as the long-term prospects of the use of hydrogen, in particular for energy and transport purposes.
The Shell Hydrogen Study discusses firstly the (natural) occurrence, properties, and historical perspectives of the element hydrogen. It then examines current as well as future technologies/processes and source materials for the production of hydrogen, and it compares the energy requirements, greenhouse gas emissions and supply costs of the different production pathways. Furthermore, hydrogen logistics is investigated. That includes, on the one hand, current and future storage methods, and on the other, the various transport options and their respective benefits, including questions of transport economy.
This is followed by a description of the different potential options for the use of hydrogen. A distinction is made between the use in materials or for energy purposes/as an energy carrier. The analysis of hydrogen use for energy purposes focuses on the fuel cell – and not on the use in heat engines resp. combustion engines. On the user side, stationary energy applications for back-up electricity production as well as domestic energy supply – including their economics – are looked into.
The main focus of the study is on mobile hydrogen applications. For this purpose, the technological status and prospects of mobile applications – from aerospace, via material handling, through to the passenger car – are discussed. This is followed by an analysis of the economics of hydrogen-powered fuel-cell cars based on a simplified car cost comparison. Subsequently, the construction of a hydrogen retail station infrastructure for road transport is discussed.
Finally, the possible effects of fuel-cell cars on fuel consumption and greenhouse gas emissions in selected regions up to 2050 are discussed. This analysis is based on the ambitious 2DS hydrogen scenario from the International Energy Agency.
ABSTRACT
Shell Deutschland Oil GmbH22284 Hamburg
www.shell.de/h2studywww.shell.com/hydrogen
Hamburg 2017