Santa Barbara County 2010 Children’s...
40
Santa Barbara County 2010 Santa Barbara County 2010 Santa Barbara County 2010 Childre Childre Children’ s Scorecard s Scorecard s Scorecard Data on our children’s physical, emotional, educational and social well-being over time. Presented by the Santa Barbara County KIDS Network, UCSB Gevirtz Graduate School of Education, public agencies and community-based organizations.
Transcript of Santa Barbara County 2010 Children’s...

Santa Barbara County 2010Santa Barbara County 2010Santa Barbara County 2010
ChildreChildreChildrennn’’’s Scorecards Scorecards Scorecard Data on our children’s physical, emotional, educational and social well-being over time.
Presented by the Santa Barbara County KIDS Network, UCSB Gevirtz Graduate School of Education, public agencies and community-based organizations.

Credits & Participants
Santa Barbara County 2010 Children’s Scorecard
Data and background information in this report was provided by analysts from the Santa Barbara County Departments of Social Services, Probation, Public Health and Alcohol, Drug and Mental Health Services.
We also thank the Child Care Planning Council, the Children’s Health Initiative, and the University of California at Santa Barbara for their contributions.
The KIDS Network membership reviewed data and trends and as-sisted with compiling information on community-wide initiatives.
The original concept of this report was guided by the KIDS Network Scorecard Committee, made up of members of the general and executive membership. The graphic design and layout was created by Dennis Tivey, Department of Social Services.
Desktop publishing, data updates and related text by Joy Thomas. Edited by Katharina Zulliger. Photography by Leesa Munger.
Please refer to www.countyofsb.org/kidsnet for more information on the KIDS Network.
Credits & Participants

IntroductionIntroductionIntroduction The KIDS Network is proud to present its second edition of the revised Children’s Scorecard, a comprehensive summary of trends related to children’s well-being. Or-ganized around three “domains,” or sets of goals desired for our community’s chil-dren, the report is intended to paint an objective picture of how children are faring in the areas of safety, health and education.
The desired outcomes for all children in Santa Barbara County in each of these areas are:
1. Children and youth are safe and supported by families and communities.
2. Children and youth are healthy and thrive.
3. Children and youth are “ready to learn” and will succeed in school.
Each of these domains encompasses a number of goals that are measured by various in-dicators selected by the Scorecard committee based on data availability and relevance.
The listing of current initiatives included with each goal can help concerned individuals and agencies make informed decisions about how and where to engage on behalf of chil-dren.
Originally conceived and designed by Dr. Michael Furlong at the Gevirtz Graduate School of Education at the University of California at Santa Barbara, the Santa Barbara County Children’s Scorecard was issued for the first time in 1994.
Additional statistics and data about Santa Barbara County’s children are available to the public at www.kidsdata.org, an online resource that provides access to regularly updated indicators, community resources and research.
Santa Barbara County 2010 Children’s Scorecard
Introduction

2010 Children’s Scorecard Introduction
Kathy Gallagher
True commitment to the well-being of the children in our community must begin with an honest
assessment of the status quo. We cannot improve what we don’t fully understand. Documents
like the Children’s Scorecard are invaluable in helping us paint an unbiased picture of the
strengths and challenges in our community. Once we have this information, we can agree to
effectively work together and improve those outcomes that we consider a priority for our chil-
dren. The Scorecard also helps us understand how outcomes for children are interrelated
across domains and therefore how important targeted collaboration across disciplines and sec-
tors remains in developing strategies that will help us achieve our goal of ensuring all children’s
mental, physical and emotional well-being. Thank you for all that you do to support children in
Santa Barbara County.
Janet Wolf
For the Department of Social Services, accountability is a core principle of our operations. Sup-
porting the production of documents like the Scorecard is one of the many ways we track how
effective we are in creating lasting change for our young clients. We share the responsibility for
the well-being of children in our community with our colleagues from other County Departments,
such as Public Health, Probation, and Alcohol, Drug and Mental Health Services, and with our
partners from education and community-based organizations providing health and human ser-
vices. Shared responsibility implies shared accountability, and through the Scorecard we have
agreed to track common measures that we believe reflect the well-being of the children in our
community. On behalf of the KIDS Network, I thank you for your interest in this document and
look forward to your comments and recommendations.
Message from Social Services
Message from the Chair
Santa Barbara County 2010 Children’s Scorecard
Janet Wolf, 2nd District Supervisor Santa Barbara County Board of Supervisors KIDS Network Chair
Kathy Gallagher, Director Santa Barbara County Department of Social Services

Page 1 2010 Children’s Scorecard
Children and youth are safe and supported by families and communities ................2
Children are free from abuse and neglect ................................................................................................ 4
Children and youth are socially responsible ............................................................................................ 6
Children live in families that are able to provide for them financially.................................................... 8
Children are safe and learning while their parents are at work ............................................................ 10
Children feel valued, cared for, and supported.......................................................................................12
Children and youth are healthy and thrive.............................................................. 14
Children are born at normal birth weight ...............................................................................................16
Children are physically fit ........................................................................................................................18
Children are mentally and emotionally healthy..................................................................................... 20
Children have access to health insurance coverage, and families know how to use it ................................ 22
Children and youth are “ready to learn” and will succeed in school........................24
All children and youth are proficient in reading, math, and language ................................................. 26
All youth enrolled in public school successfully complete high school................................................. 28
Appendices ............................................................................................................. 30
Appendix 1: County demographics. .........................................................................................................31
Appendix 2: Student demographics ....................................................................................................... 32
Appendix 3: Related data and resources ................................................................................................ 33
ContentsContentsContents
Santa Barbara County 2010 Children’s Scorecard

Page 2
Our goals for Santa Barbara County’s children and youth:Our goals for Santa Barbara County’s children and youth:Our goals for Santa Barbara County’s children and youth:
Domain 1 of 3:
Children and youth are Children and youth are Children and youth are safe and supported by safe and supported by safe and supported by families and communities.families and communities.families and communities.
• Children are free from abuse and neglect.
• Children and youth are socially responsible.
• Children live in families that are able to provide for them financially.
• Children are safe and learning while their parents are at work.
• Children feel valued, cared for, and supported.
Santa Barbara County

Page 3
• Child abuse: The overall rate of substantiated child abuse and neglect declined in Santa Barbara County from peaks in 2006-2007, and was below the state-wide rate (per 1,000 children) in 2010. Children under age 1 were consistently most at risk, while neglect remained the most frequent type of abuse for all ages.
• Juvenile crime: The rates for juvenile felony and violent offenses increased over-all since 2000, but dropped in 2010. Most offenses did not involve weapons, and were committed by youth 14 and older.
• Child poverty: Both the statewide and county poverty rates for children under 18 were at their highest of the decade in 2009 (most recent available data). The percentages of county and statewide public school students enrolled in the Free and Reduced-Price Meal Program increased overall, and were at their highest of the decade in 2010.
• Child care: According to estimated licensed child care availability for children ages 0-12, there were two children in need of care for every space available in the county in 2009. There was a critical shortage of infant-toddler care. Cost can be burdensome for families, not all of whom are eligible for subsidized programs.
• School connectedness: Countywide, more students than in the past reported feel-ing connected to school. Additionally, over half reported having an adult outside of home and school with whom they have a caring relationship and who has high expectations for them.
Executive Summary
2010 Children’s Scorecard
Domain: Children and youth are safe and supported by families and communities.
Domain: Children and youth are supported by families and communities.

Santa Barbara County Page 4
Goal: Goal: Goal:
Children are free from abuse and neglect.Children are free from abuse and neglect.Children are free from abuse and neglect.
Indicator: Substantiated cases of child abuse and neglect.Indicator: Substantiated cases of child abuse and neglect.Indicator: Substantiated cases of child abuse and neglect.
Children who grow up in safe, stable and emotionally supportive families and commu-nities show higher levels of resilience and well-being as adults. Children who are ex-posed to physical or emotional violence and neglect may experience lifelong challenges in physical and mental health, as well as in their social and emotional development.
Terminology & Explanations 1. Substantiated means that Child Welfare
Services (CWS) has investigated the referral and determined that the parent’s (or caretaker’s) actions (or failures to act) meet the legal definition of child abuse and neglect, and require CWS interven-tion to ensure the safety of the child. In Santa Barbara County, substantiated cases represent approximately one quarter of all referrals to CWS. The absence of a substantiated child abuse case does not necessarily mean that a family’s children are doing well, but declining rates of such cases are desir-able.
2. General neglect is defined as “the negli-gent failure of a person having the care or custody of a child to provide ade-quate food, clothing, shelter, medical care, or supervision where no physical injury to the child has occurred.” General neglect in a family is often caused by stress or substance abuse, and is best addressed through prevention or sup-portive services for the caretakers. For definitions of the categories of child abuse and neglect in California, visit http://www.childwelfare.gov/systemwide/laws_policies/state.
3. Referrals indicate the number of fami-lies referred, not the number of children. Generally, families in the Santa Maria region have more children per family referred for service than other regions.
What the data show from 2000 to 2010:
• The overall rate of substantiated1 child abuse and neglect decreased for all ages from 2006 and 2007 high points. The 2010 overall rate (7.6 per 1,000 children) was lower than the overall rate in the year 2000 (9 per 1,000 children). In real numbers, 797 out of an estimated 105,206 children were found to have suffered ne-glect or abuse in 2010, vs. 901 out of an estimated 99,859 in 2000.
• In 2010, the Santa Barbara County rate of 7.6 abused or neglected chil-dren (0-17 years) per 1,000 was below the statewide rate, which was 8.7 children per 1,000 for that year.
• In 2010, Child Welfare Services investigated referrals for 3,189 fami-lies. Families with referrals that did not meet the legal definition for abuse and neglect were often referred to community organizations that provide support to families.
Substantiated Child Abuse by Age—Incidents per 1,000 Children Source: Needell, B., et al. CWS Reports for CA
UC Berkeley Center for Social Services Research http://cssr.berkeley.edu/CWSCMSreports
Key Years of age:
Under 1 1-10 11-17
30
25
20
15
10
5
0 2000 2001 2002 2003 2004 2005 2006 2007
12.2
10.2 11.4
15.6
19.0 19.2
23.3 25.2
6.9 7.3 6.6
5.4
7.4 7.0 8.4 8.6
10.2 8.8
7.4 7.0 8.3 8.1
11.7 11.2
2008
19.3
8.8 7.7
2009
18.7
9.0
6.4
2010
15.9
8.2
5.6

2010 Children’s Scorecard
What we know:
• General neglect2 was consistently the num-ber one cause of substantiated cases—in all age groups, for all years from 2000 to 2010.
• Younger children, particularly infants less than one year old, were more vulnerable to abuse and neglect. In 2010, under-one-year-olds represented 5% of all children in Santa Barbara County, but 11% of all sub-stantiated cases.
• When considering the number of families per region, the rate of investigated refer-rals was similar in all regions of the county.
• The three most frequently cited family needs in Santa Barbara County are support with parenting skills, mental health/coping skills, and access to substance abuse treat-ment. These priority needs have remained consistent over time.
Prevention and the Role of the Community Protecting children from abuse and neglect is a shared responsi-bility. Child Welfare Services’ primary responsibility is to ensure the safety of children once a family is in severe crisis. The com-munity at-large can ensure that families are connected to re-sources and supports in time to prevent any child abuse or ne-glect. The role of the Santa Barbara County Child Abuse Preven-tion Council in the community is to help coordinate these efforts around effective strategies in partnership with community-based organizations, parents, and all types of professionals who work with children and families.
The council raises funds, educates partners about their role in child abuse and neglect prevention, and promotes awareness for the prevention of child abuse and neglect. The council meets monthly. For more information, please contact Katharina Zulliger at (805) 346-8222 or visit http://www.PreventChildAbuseSB.org.
Community-Wide Initiatives & Innovations • Structured Decision Making (SDM). A process applied by
CWS workers when answering Child Abuse Reporting Hotline calls. SDM provides defined, consistent decision-making crite-ria for assessing the risk of future abuse and the need for a response.
• Safe-from-the-Start. Local experts in each county have been trained by the Safe-from-the-Start Initiative to provide commu-nity groups with no-cost trainings and presentations on the dangers of early exposure to violence. Contact: Deborah Holmes, CALM, (805) 965-2376.
• Front Porch. Santa Barbara County’s Differential Response Program, through which families can receive community-based support services after a referral to the hotline has been made and before formally entering the child welfare system. Contact: Devin Drake, [email protected].
• SafeCare® Project. An in-home, evidence-based parent train-ing program found to be effective in response to child neglect. Trained home-visitors teach skill-building through modeling and practice, focusing on health, safety and parent-child inter-actions. Child Welfare Services has implemented the training model locally in collaboration with community-based partners who are also able to work with families preventatively. Contact: Melissa Hoesterey, (805) 346-7248.
• SB163 Wraparound Program. A family-centered, community-oriented, culturally sensitive, strength-based, individualized alternative to sending foster children to or maintaining them in high level group home placements by providing intensive ser-vices to them and their families or a suitable substitute care provider. The program is grounded in a philosophy of uncondi-tional commitment to support families to safely and compe-tently care for their high needs children in our community.
Page 5 Domain: Children and youth are supported by families and communities.
Domain: Children and youth are safe and supported by families and communities. Goal: Children are free from abuse and neglect.
2007 2008 2009 2010
Investigated Referrals3 of Child Abuse in Santa Barbara County, by Region
Source: Santa Barbara County Department of Social Services
750
0
1448
81
5 10
99
1154
1469
79
8
1097
1448
80
5
900
150
300
450
600
1050
1071
1345
77
3
Key Santa Maria Region Lompoc Region Santa Barbara Region
1500
1350
1200

Santa Barbara County Page 6
Terminology & Explanations 1. Sustained petition means the youth’s case has
been adjudicated in a court of law and the peti-tion has been found true. Adjudicated is a legal term meaning the case has been heard and settled. (The term “found guilty” is not used with youthful offenders, as the focus of the juvenile system is rehabilitation, not punishment.)
2. The rate per 1,000 youth is a more accurate measure of changes over time than the number of crimes committed, because the size of the youth population changes over time. Note: if the total number of 10-to-17-year-olds is low, as is the case in Santa Barbara County, then small increases may appear more dramatic.
3. Felonies are serious crimes, punishable by over a year in detention, including grand theft, bur-glary or aggravated assault.
4. Violent crimes include both misdemeanors (less serious) and felony (serious) crimes. Assault, battery, robbery, rape and homicide, for exam-ple, are considered violent crimes.
What we know:
• The highest percentage of violent offenses were “misdemeanor assaults” such as school fights, domestic violence, and other violent acts without weapons.
• The majority of these sustained petitions were incurred by youth ages 14 and older. The number of minors incurring sustained petitions for violent crimes at a younger age was very low.
Goal: Goal: Goal:
Children and youth are socially responsible.Children and youth are socially responsible.Children and youth are socially responsible.
Indicator: Serious or violent crimes committed by youth.Indicator: Serious or violent crimes committed by youth.Indicator: Serious or violent crimes committed by youth.
Crimes committed by a youth negatively impact the community, the family, and the youth’s own future.
What the data show from 2000 to 2010:
• The rates for felony and violent offenses dropped in 2010, but increased overall since 2000. The data show a slight decline from the peaks of 2006-2009.
• Nearly 7 youth per 1,000 incurred a sustained petition1 for a violent crime in 2010, compared to almost 4 youth per 1,000 in the year 2000. In real numbers, 316 out of an estimated 46,597 youth ages 10 to 17 incurred a sustained petition for a violent crime in 2010, vs. 173 out of an esti-mated 44,435 in 2000.
Juvenile Sustained Petitions1 for Felony & Violent Offenses—Rate per 1,000 Youth2 Source: Santa Barbara County Probation Department
2000
9
8
7
6
5
4
3
2
1
0
Sustained felonies3
Sustained violent crimes4
Key
4.3 4.7
5.3
3.9 3.7
5.0
2001 2002 2003 2004 2005 2006 2007 2008
Top Sustained Felony Petitions: Assault: 60 Burglary: 50 Theft: 37 Gang-related: 35
Weapons: 19 Auto theft: 14 Robbery: 7
(Year 2010)
4.9
2009
4.8 5.1
2010
4.8
5.8
6.9
6.0
6.8
5.0
5.8
7.1 7.2 7.3
6.8 7.0

2010 Children’s Scorecard
Related Data & Resources
Juvenile Gang Data:
There is presently no central data collection point for compre-hensive, comparative gang vio-lence data on juveniles in Santa Barbara County. Probation data are limited to youth on proba-tion with gang terms and condi-tions.
Law enforcement agencies in the county are using CAL-GANGS, a relatively new but promising statewide data collec-tion system for intelligence pur-poses, but data reports are not available to the public.
Page 7
Community-Wide Initiatives & Innovations
• Alternative Detention Program. Youth committing technical probation violations or non-violent offenses (such as absen-teeism, or using drugs or alcohol) can be enrolled in a supervision program providing tutoring and homework help, guest speakers /programs, and community service. Contact: Wendy Stanley, County Probation Department, (805) 934-6273.
• Restorative Justice Taskforce. In Santa Maria and Lompoc, first- and second-time non-violent offenders are referred to a local Restorative Justice Team Conference with the victim, to develop a plan for paying for or correcting damage or harm. In Santa Barbara, a pilot Restorative Justice Program intervenes with selected youth on probation. Contact: Rob Burrs, Conflict Solutions Center, Santa Maria: (805) 349-8943, Santa Barbara: (805) 963-8165.
• Teen Court. First-time offenders are tried by a group of peers, who determine a legally binding disposition or “sentence” by jury. Offered countywide. Contact: Eduardo Cué, Council on Alcoholism and Drug Abuse, (805) 730-7575 x121.
• SB163 Wraparound Program. A collaborative project between the Departments of Social Services and Probation to sup-port families and reduce group home placements (refer to page 5).
• Youthful Offender Block Grant Program. State funds that target youth not eligible for commitment to the State Division of Juvenile Justice. Funds support assessment of risks and needs, intensive probation supervision, long-term local com-mitment program, mental health and substance abuse counseling, and mentoring. Contact: Brian Swanson, County Pro-bation Department, (805) 739-8606.
• Lompoc & Santa Maria Valley Gang Forums. Designed to educate the community about gang violence, and respond to it through community-wide planning. Contacts: Joyce Howerton, Fund for Santa Barbara, (805) 717-2012 and Mike Cordero, Santa Maria City Council.
• South Coast Gang Taskforce. A collaborative of government agencies and community-based organizations from the South Coast region, with a goal of engaging the community in the development of short- and long-term strategies to end youth gangs and violence. Contact: Dr. Gus Frias, Community Action Commission, (805) 964-8857 x152.
Domain: Children and youth are supported by families and communities.
Domain: Children and youth are safe and supported by families and communities. Goal: Children and youth are socially responsible.
Youth Violence
The prevention of youth violence is most successful when interventions are developmentally targeted and age-specific, engage the community, and start early before any violent behavior has been witnessed or en-gaged in by the youth.
Peer/social risk factors include association with delinquent peers, poor grades in school, and poverty in the community.
Peer/social protective factors include commitment to school and involve-ment in social activities.
The most promising prevention strategies to-date focus on the following: • improving parental interactions with each other and their children, • home-visiting to increase the effectiveness of parenting and access
to community resources, • developing social problem-solving skills for children and youth, and • mentoring by adults that serve as supportive role models.
Source: http://www.cdc.gov/ViolencePrevention/youthviolence

Santa Barbara County
Terminology & Explanations 1. Poverty thresholds are dollar amounts
issued by the US Census Bureau for statistical purposes. Poverty guidelines are used to determine financial eligibility for certain programs, including Head Start, WIC and Medi-Cal (but not Cal-WORKs or low-income housing). The Federal Poverty Guideline for 2010 for a 4-person household for all states (except Hawaii and Alaska) is $22,050. Poverty experts agree that the method-ology for determining poverty measures is outdated and should be revised. For more information on poverty guidelines and thresholds, please refer to http://aspe.hhs.gov/poverty/faq.shtml.
2. The Free and Reduced-Price Meal Program (FRL) is a federal initiative for children whose parents or guardians have low incomes (130% of the poverty level for free meals, or under 185% for reduced-price meals). While there are limitations to its accuracy (e.g., limited income verification requirements), it is widely used as a poverty measure due to its regular availability.
3. Non-Assistance CalFresh (NACF) is a program providing food benefits to individuals and families who do not receive cash assistance from Cal-WORKs or SSI/SSP.
4. Years presented are the final year of a school year; e.g., 2009-2010 is shown as 2010.
5. The family economic self-sufficiency standard measures the income neces-sary for a family to meet their basic needs adjusted by county. For more information, see “Making Ends Meet: How Much Does It Cost to Raise a Family in California?” developed by the California Budget Project.
Goal: Goal: Goal:
ChildrenChildrenChildren’’’s families can provide for them.s families can provide for them.s families can provide for them.
Child poverty is associated with negative outcomes later in life, including reduced educational attainment, low earnings, teenage childbearing, and physical and mental health problems. Children in poverty are more likely to live in stressful environments, sometimes without adequate nutrition for physical and cognitive development, and are less likely to have access to health care, child care, and extracurricular opportunities.
What the data show from 2000 to 2011:
• The percentage of children in Santa Barbara County living in families with incomes below the federal poverty threshold1 was over time similar to the percentage of such children statewide.
• The percentage of public school students qualifying for the Free and Reduced-Price Meal Program (FRL)2 in Santa Barbara County increased 14% between 2000 and 2010.
• Countywide Non-Assistance CalFresh3 (food stamps) caseloads in-creased 82% between 2006/2007 and 2011; in 2011, 59% of recipi-ents were children.
Page 8
Key Indicators, State vs. County Rounded to nearest percent. Sources: http://www.cde.ca.gov/ds/sh/cw/filesafdc.asp and
http://factfinder.census.gov/home/saff/main.html?_lang=en
Percentage of children qualifying for FRL4
Children below Federal Poverty Line
2004 2005 2006 2000 2001 2002 2003 2007
40%
30%
20%
10%
60%
50%
Key
Santa Barbara County California overall
2008 2009 2010
20 21
16 19 17
19 18 17 17
19 18 18 20
14
19 17
14
19
47 47 49 49 50 51 51
40 40
44 45 47
49
54 51 53
48
56 54
47
40
Indicators:Indicators:Indicators: 1. Families with children in poverty. 1. Families with children in poverty. 1. Families with children in poverty. 2. Students enrolled in free and reduced2. Students enrolled in free and reduced2. Students enrolled in free and reduced---price lunch.price lunch.price lunch.

2010 Children’s Scorecard
Community-Wide Initiatives & Innovations
• EITC & Tax Assistance Campaign Finan-cial Stability Services Partnership. A partnership dedicated to increasing aware-ness and claiming of the Earned Income Tax Credit (EITC). Contact: Northern Santa Barbara County United Way, Sandy Soria Sosa, (805) 922-0329.
• Network of Family Resource Centers. Family Resource Centers in Santa Maria, Guadalupe, Carpinteria, Cuyama, Santa Barbara, Isla Vista, Solvang, Buellton, Santa Ynez, Los Alamos, and Lompoc pro-vide assistance with basic needs and help families access services and supports. Contact: Teressa Rodriguez-Johnes, (805) 739-8741.
• Workforce Investment Board Youth Coun-cil. Countywide collaboration for support-ing youth employment for in- and out-of-school youth. Contact: Ray McDonald, (805) 681-4446.
Page 9 Domain: Children and youth are supported by families and communities.
Domain: Children and youth are safe and supported by families and communities. Goal: Children’s families can provide for them.
Aid to Children Source: Santa Barbara County Department of Social Services and Legislative Analyst’s Office Report, http://lao.ca.gov/laoapp/PubDetails.aspx?id=2264
CalWORKs Source: CalWIN MRM182R and MRD012R for 3/11, CalFresh Source: DFA 296 Worksheet/CalWIN MRD012R for 3/11, Medi-Cal Source: CalWIN MRH0009R for 3/11, Caseload Growth Source: EDR for 3/11
Description Eligibility for Children
Income Restrictions (The 2010 FPL for a
family of 4 is $22,050.)
Max. Aid Payment (Family of 4)
Other Restrictions
Recipients Under Age 18
Provides cash grants and welfare-to-work services to low-income families
79% of the county’s CalWORKs recipients are children, of which 47% are under age 5. Children can be eligible for cash grants regardless of par-ent eligibility for welfare-to-work services.
A family’s net income cannot exceed the maximum aid payment, which is less than half the Federal Poverty Level (FPL).
$762
Asset limits, permanent residency or citizenship required
10,184
19% increase in caseloads
since 2006/07
Provides food benefits via the Electronic Benefit Transfer (EBT) card to low-income households for food pur-chases
59% of the county’s CalFresh recipients are children. Chil-dren can be eligible for Cal-Fresh regardless of parent eligibility.
A family’s net income cannot exceed the FPL.
$668
(w/zero income)
Permanent residency or citizenship required
13,433 (NACF3)
82% increase in caseloads
since 2006/07
Medical and dental insurance for low-income individuals including families with chil-dren, seniors, persons with disabilities, children in foster care, pregnant women, and people w/specific diseases
61% of the county’s Medi-Cal recipients are children. All low-income children under age 1 are eligible for Medi-Cal ser-vices if born to a mother eligi-ble for and receiving Medi-Cal on the date of the child’s birth.
For “Zero Share of Cost,” depending on the age of the child, a family’s net income cannot exceed between 100-200% of the FPL.
N/A
Asset limits for most programs and satisfactory immigration status or citizenship for non-emergency services
40,281
20% increase in caseloads
since 2006/07
Cal
WO
RK
s C
alFr
esh
Med
i-Cal
P
rogr
am
What we know:
• Official poverty rates do not measure economic hardship. Only children from families with very low incomes are included in this measure, which indicates that approximately one out of every five children was living in poverty in 2009. In compari-son, the percentage of families with children living below the family economic self-sufficiency standard5 for Santa Barbara County was closer to 50%, indicating that many families strug-gle to meet a basic standard of living, which includes adequate housing, child care, transportation, food, and health care costs.
• Children and households with children headed by a female single parent consistently have higher poverty rates than any other demographic group. According to the American Com-munity Survey, almost 30% of all single women with children were living in poverty in 2009, compared to 13% of all fami-lies.
• Regions with the highest percentages of families in poverty include Guadalupe, Lompoc, and Santa Maria (Source: UCSB Economic Forecast).
• The majority of government support through CalWORKs, CalFresh, and Medi-Cal is provided to children (see chart below).

Santa Barbara County
Goal: Goal: Goal:
Children have appropriate child care.Children have appropriate child care.Children have appropriate child care.
Indicator: Early care & education (child care) availability. Indicator: Early care & education (child care) availability. Indicator: Early care & education (child care) availability.
It is important that children are safe and learning while their parents are at work. Children’s participation in high quality child care and after-school pro-grams is directly related to improved educational and social outcomes. This is especially true for children exposed to family or environmental risk factors.
Research has shown that the first three years of life are critical for brain de-velopment. Children who participate in high quality early care and education programs while their parents are working enter kindergarten with im-proved social and cognitive skills and prospects for a brighter future.
What we know:
• High quality early care and educa-tion programs play an important role in school readiness and affect school success through graduation and beyond.
• Subsidized child care slots are a critical need in the early care and education system. Their availability depends heavily on public funding, and increased demand typically oc-curs in times of economic down-turn, when less funding is available.
• There is a particular need for slots for infants and children with diag-nosed disabilities.
• Parents rely on consistent quality care to be able to work. Child care availability directly impacts the eco-nomic self-sufficiency of families.3
Page 10
What the data show from 2000 to 2011:
• Only 55% of the more than 35,000 children ages 0-12 estimated to need care had a space available to them in 2009.1 The availability of child care spaces increased as a result of local efforts, but there were still two children needing care for every space available. The greatest deficit was for infants and toddlers; there were five babies for every space available in 2009.
• A family in Santa Barbara County with an income of $50,000 would have spent between 33% and 50% of their income for licensed child care for an infant and a preschooler in 2011.2 At this income level, the family would not have been eligible for a state or federally funded child care space.
Overall Need and Capacity for Early Care and Education Source: Santa Barbara County Child Care Planning Council
Infant-Toddler
30,000
6,854
1,424
12,881 9,686
15,448
8,065
35,000
10,000
15,000
20,000
25,000
35,182
19,175
Preschool School-Age Total Ages 0-12
Key Need Capacity
40,000
5,000
0
45%
unmet need
48%
unmet need
25% unmet need
79%
unmet need
2010 Children’s Scorecard
Community Focus: CAC Head Start
Operated by the Community Action Commission (CAC) of Santa Barbara County, a local nonprofit organization, Head Start provides early care and education services to over 1,100 children through its preschool program, and serves approximately 100 infants and toddlers in center-based or contracted family child care. Approximately 60% of these children are enrolled in North County programs, 20% in Mid-County and 20% in South County. A smaller Migrant Head Start/Early Head Start program is operated by the Community Action Partnership of San Luis Obispo County (CAPSLO) in North County.
Head Start provides comprehensive services to the entire family and screens children for health and other needs upon entry to the program. The goals of Head Start are to ensure that all children enrolled in the program are ready for school when entering kindergarten and that parents know how to support their children’s school-readiness.
For local Head Start information and data, visit http://www.cacsb.com/pdf/PIR101028s.pdf. For more on Head Start outcomes, see http://eclkc.ohs.acf.hhs.gov.
Terminology & Explanations 1. Source: Early Care and Education Needs Assessment,
compiled by the Santa Barbara County Child Care Planning Council based on 2009 data, http://www.sbceo.org/~ccpc/needs.html. Child care avail-ability is calculated by comparing the estimated number of children by age, using the CA Dept. of Public Health Birth Records, with the percentage of children esti-mated to need care, based on recommendations from Review of Literature and Studies of Child Care Demand (Michelle Nillson and Joanne Brion, Brion and Associ-ates, 2005). Reported spaces available include only licensed spaces for children 0-5 years, but also include school-based license-exempt spaces for children 6-12 years of age. No numbers are available for private license-exempt care provided by relatives, friends or neighbors.
2. Child care cost is collected from licensed programs by Children’s Resource & Referral of Santa Barbara County.
3. Source: “The Costs of Disinvestment: Why States Can’t Afford to Cut Smart Early Childhood Pro-grams,” Pew Center on the States, http://www.pewcenteronthestates.org/uploadedFiles/Cost_of_Disinvestment_brief_ final.pdf?n=1020
Page 11
Community-Wide Initiatives & Innovations
• Child Care Planning Council. A state-mandated council funded by the California Department of Education to provide planning and coordination for early care and education in the county. Contact: (805) 964-4710, x4473, http://www.sbceo.org/~ccpc.
• First 5 Early Care and Education Division. This program provides resources and technical assis-tance for the early childhood education community to support program improvement, workforce devel-opment and capacity building. Contact: (805) 884-8085, http://www.first5santabarbaracounty.org.
• Children’s Resource and Referral of Santa Bar-bara County. A child care referral hotline which links parents with a comprehensive, continuously updated database of licensed providers. Contact: Santa Barbara (805) 963-6631, Santa Maria (805) 925-7071, Administration (805) 925-6701, http://sbfcc.org.
Domain: Children and youth are supported by families and communities.
Domain: Children and youth are safe and supported by families and communities. Goal: Children have appropriate child care.
Monthly Cost of Child Care (30+ hours/week) Source: Santa Barbara Family Care Center, Children’s Resource & Referral, 5/11
$0 $200 $400 $600 $800 $1000 $1200
$699 $608
$665 $439
$794 $655
$905 $753
$858 $710
$1167 $881
Key
South County North County
Infant: 0-23 mos. Preschool: 2-5 yrs. School-Age: 6-13 yrs.
School-Age Licensed Family Child Care Homes
School-Age Centers
Preschool Licensed Family Child Care Homes
Preschool Centers
Infant Licensed Family Child Care Homes
Infant Centers
46% increase since 10/09
22% increase since 10/09
24% increase since 10/09

Santa Barbara County
What we know:
• Research has shown that when adolescents feel cared for and connected to people at their school, they are less likely to use alcohol, engage in violence, or initiate early sexual activity.
• Students who are connected to school are more likely to be academically engaged. In addition, having a good connection early on in a student’s secondary school life has been linked with later academic success, and an in-creased chance of graduating from high school.
• Positive classroom management climates, par-ticipation in extracurricular activities, educa-tive disciplinary policies, and smaller school size are all positively associated with higher school connectedness.
• External assets3 in the community encompass social support, boundaries and expectations, constructive use of time, and opportunities for empowerment. Communities that promote resources that increase external assets help youth build resilience.
Terminology & Explanations 1. Source: McNeely, C.A.; Nonnemaker, J.M.; & Blum, R.W. (2002). Promoting School Connectedness: Evidence from the National Longitudinal Study of
Adolescent Health. Journal of School Health, 72, 138-146.
2. Connectedness: per student responses to 5 items derived from National Longitudinal Study of Adolescent Health. Students with “high” levels of con-nectedness agree or strongly agree with each of these statements: 1) I feel close to people at this school, 2) I am happy to be at this school, 3) I feel like a part of this school, 4) The teachers at this school treat students fairly, 5) I feel safe in my school.
3. External assets: defined per California Healthy Kids Survey (CHKS) measures. Caring Relationships: “I have an adult outside of home/school who really cares about me, tells me when I do a good job, notices when I am upset about something.” High Expectations: “I have an adult outside of home/school who believes I will be a success, always wants me to do my best, who I trust.” Meaningful Participation: “outside of home/school, I am part of clubs, sports teams, church/temple, or other group activities; I am involved in music, art, literature, sports, or a hobby; I help other people.”
4. Years presented are the final year of a school year; e.g., 2010-2011 is shown as 2011.
Goal: Goal: Goal:
ChildrenChildrenChildren feelfeelfeel valuedvaluedvalued andandand supported.supported.supported.
Page 12
Indicator: School Connectedness.Indicator: School Connectedness.Indicator: School Connectedness.
“School connectedness” refers to the belief by students that adults in the school care about their learning, and care about them as individuals. Students who feel con-nected to school are more likely to achieve academically, and less likely to become involved in high-risk behavior.1
What the data show from 2005 to 2011:
• Across Santa Barbara County, students in all grades had higher levels of school connectedness2 in 2011 than in 2005. Students in all reporting grades were more likely in 2011 than in 2005 to say that they feel safe, are a part of their school, and feel close with people at their school.
• Overall, 7th graders reported the highest level of connectedness, with more than half of students feel-ing a high level of connection to their schools in 2011. Ninth and 11th graders were more likely to re-port having a moderate level of school connected-ness, which increased 12% and 18%, respectively, between 2005 and 2011.
• Over half of students reported having an adult out-side of home and school with whom they have a car-ing relationship and who has high expectations for them.
• Less than half of students reported participating in ac-tivities in their community. This may be due to lack of awareness of community resources, and/or a lack of community-based programs available to youth of all ages.

2010 Children’s Scorecard
Community-Wide Initiatives & Innovations
Safe Schools/Healthy Students Initiative (SS/HS) is a unique Federal grant-making program designed to prevent violence and substance abuse. It helps schools and communities promote safe and healthy environments in which students can learn and develop. With funding from this project, both Carpinteria and Santa Maria school districts have had the opportunity to implement the following school- and community-based programs for students across grade levels:
• Check, Connect & Respect (CC&R) is a dropout prevention program that uses school-based coaches to help at-risk students feel more connected to the school and learning. The coaches work in collaboration with the student, teachers, and parents to help the student develop habits of healthy school behavior.
• Resolving Conflict Creatively Program is a program characterized by a comprehensive, multi-year strategy to prevent violence and create caring, peaceable communities of learning that improve school success for all children. The program includes the recruitment, training, and supervision of children to act as peer mediators and teachers.
• Too Good for Drugs & Violence (TGDV) is a classroom curriculum that promotes students’ prosocial skills, positive character traits, and violence-free and drug-free norms. Through the program, students participate in role-plays and co-operative learning activities that aim to encourage them to apply their skills in a variety of school and community settings.
Page 13 Domain: Children and youth are supported by families and communities.
Domain: Children and youth are safe and supported by families and communities. Goal: Children feel valued and supported.
School Connectedness2 Source: CHKS Santa Barbara County 2005-2011 data4
10%
30%
50%
70%
90%
20%
0%
Key
7th Grade 9th Grade 11th Grade Non-Traditional
Students reporting high levels of school connectedness in:
40%
60%
80%
100%
49%
49
%
38%
35
% 39
%
32%
35%
29
%
2005 2007 2009 2011 Statewide 2007-2009
53%
44%
43%
46%
48%
42%
42%
34%
58%
47%
50%
41%
External Assets in the Community3 Source: CHKS Santa Barbara County 2010 data
10%
30%
50%
70%
90%
Non-Traditional
20%
0%
48%
71%
68%
41%
63%
66%
47%
64%
66%
19%
51%
52%
Key
7th Grade 9th Grade 11th Grade
Meaningful Participation (in the community) High Expectations (from an adult not in home/school ) Caring Relationships (with an adult not in home/school)
Percentage of students reporting that they have:
40%
60%
80%
100%
Page 14 Santa Barbara County
Domain 2 of 3:
Children and youthChildren and youthChildren and youth are healthy and thrive.are healthy and thrive.are healthy and thrive. Our goals for Santa Barbara County’s children and youth:Our goals for Santa Barbara County’s children and youth:Our goals for Santa Barbara County’s children and youth:
• Children are born at normal birth weight.
• Children are physically fit.
• Children have access to health insurance coverage, and families know how to use it.
• Children are mentally and emotionally healthy.

2010 Children’s Scorecard Page 15
• Birth weight: Santa Barbara County has not yet met the Healthy People Goal for percentage of children born at low birth weight. There was no significant change in the data over time from 2000 to 2009 (most recent available data).
• Physical fitness: The percentage of Santa Barbara County youth considered “fit” increased slightly over time, but was still less than half of all children and youth in all grades tested. County rates generally remained better than the rates for Cali-fornia as a whole.
• Mental health: Adjustment Disorder and Child & Adolescent Disorder were the most common diagnosis categories among children and youth seen by Alcohol, Drug and Mental Health Services (ADMHS) in 2010. These categories primarily include Attention Deficit, Conduct and Attachment Disorders, and signs of de-pression or anxiety. For youth admitted to the ADMHS Alcohol and Drug Program, the reported age of first substance use was primarily between ages 11 to 15.
• Health insurance: The number and percentage of children insured by Medi-Cal
and Healthy Families greatly increased over time. The majority of individuals and children on public health insurance were in North County. The percentage of uninsured children appears to have decreased since 2001 (although the data are not considered statistically stable).
Executive Summary
Domain: Children and youth are healthy and thrive.

Santa Barbara County
1%
Page 16
What the data show from 2000 to 2009:
• Santa Barbara County has not yet met the Healthy People Goal for low birth weight children. There was no significant change in the data over time.
• The county met the goal for very low birth weight children in 2001, 2007, and 2008.
What we know:
• The Healthy People goals are ambitious, and are not being met by most California counties. Santa Barbara County’s rates for low birth weight compared favorably with the state’s, but still did not meet the goals.
• While the overall number of infants born at low birth weights is small (372 babies of the 6,039 total births in Santa Barbara County in 2009), these infants are much more likely than babies of normal weight to have health problems and require specialized care in a neonatal intensive care unit, accounting for a significant amount of all funds spent on infant health care. Very low birth weight children are at the highest risk for poor health outcomes, including learning disabilities later in life.
Goal: Goal: Goal:
Children are born at normal birth weight.Children are born at normal birth weight.Children are born at normal birth weight.
Indicator: Infants born at low and very low birth weight.Indicator: Infants born at low and very low birth weight.Indicator: Infants born at low and very low birth weight.
Low birth weight contributes substantially to infant mortality and childhood disabilities. The Healthy People1 goals aim for 5% or fewer of all children born at low birth weight, and 0.9% at very low birth weight.2 Prenatal care is a key factor in birth outcomes.
Percentage of Live Births at Low or Very Low Birth Weights Source: Santa Barbara County Public Health Department. Percentage of all births between 250g to 4,999g in accordance with FHOP data quality guidelines.
CA Source: State of California, Department of Public Health, Birth Records, http://www.cdph.ca.gov/data/statistics/Pages/default.aspx 8%
7%
6%
5%
4%
3%
2%
1%
0%
2001 2003 2005 2007
6.1%
6.9%
6.1%
6.
3%
0.9%
1.
1%
6.8%
6.
6%
1.2%
1.
1%
6.4%
6.9%
1.2%
0.9%
1.
2%
Key
Santa Barbara County California
Low birth weight:
Santa Barbara County California
Very low birth weight:
2009
Goal for very low birth weight (0.9%)
Goal for low birth weight (5%)
6.2%
6.7%
1.
0%
1.1%

2010 Children’s Scorecard
Terminology and Explanations 1. Healthy People 2010 is a comprehensive set of disease
prevention and health promotion objectives in different focus areas, including child and maternal health, set for the entire nation by Federal and State agencies and membership or-ganizations.
2. Low birth weight refers to children weighing less than 2,500 grams (5.5 pounds) at birth. Children weighing less than 1,500 grams (3.3 pounds) are considered very low birth weight. The two main reasons for low birth weight are pre-mature birth and “small-for-date” babies. In Santa Barbara County in 2009, 64% of low birth weight babies were born prematurely.
3. Maternal Child and Adolescent Health is part of the State Department of Public Health. The Santa Barbara County Public Health Department administers the local MCAH Pro-gram.
4. WIC data are self-reported upon completion of a birth certifi-cate. Data trends show higher participation among North County, Hispanic, and teen mothers.
Page 17
Domain: Children and youth are healthy and thrive.
Goal: Children are born at normal birth weight.
Community-Wide Initiatives & Innovations • Maternal Child and Adolescent Health3 Field Nursing
Program. Through this program, the Santa Barbara County Public Health Department provides in-home as-sessment, education, linkage/referral, and comprehen-sive case management for women at risk of adverse pre-natal outcomes. This program provides maternal-infant and family case management services. Contact: Sandra Copley, (805) 681-5476 or (800) 288-8145, http://www.sbcphd.org/MCAH.
• Comprehensive Perinatal Services Program (CPSP) provides free and enhanced prenatal and postpartum care to Medi-Cal eligible women with low-income. CPSP coordinates nutrition and health education with clinical obstetrical care. Contact: Louise Davis, (805) 681-5468, http://www.sbcphd.org/MCAH.
• Women, Infants, and Children (WIC) Program. A nutri-tion program administered by the Santa Barbara County Public Health Department (PHD) that provides checks to buy healthy foods, nutrition and health education, breast-feeding education and support, and referrals to health care and other community services. According to PHD, 56% of Santa Barbara County mothers who had a child in 2009 (3,407 of 6,039) reported utilizing the WIC pro-gram.4 Contact: (805) 681-5276.
• PAC/LAC is a non-profit maternal and child health or-ganization that strives to improve pregnancy and birth outcomes by working with the professionals and systems
that care for pregnant women and their families. Con-tact: http://www.paclac.org.
• Post-Partum Support Group works on developing re-sources to increase awareness and build a comprehen-sive network of community perinatal services and pro-viders to strengthen mental health in the pregnant and postpartum family. Contact: Sandy Fahey, (805) 737-6631.
• Great Beginnings Program is a home-visitation pro-gram initiated prenatally or at birth. Goals of the pro-gram are to promote positive parenting, facilitate opti-mal child health and development—including linkage to a medical provider, and prevent child abuse and ne-glect. Great Beginnings uses the Healthy Family Amer-ica model and is administered by Child Abuse Listening and Mediation (CALM). Contact Deborah Holmes, (805) 965-2376 x121.
• Welcome Every Baby (WEB) is a free resource for all babies and their families which includes a nurse home visit, a call-line to answer questions about caring for babies and early child development, and online re-sources. Funded by a grant from First 5 and adminis-tered countywide by the Santa Barbara County Educa-tion Office, the program offers maternal/newborn screenings, developmental evaluations, breastfeeding support and community referrals. Contact: Mary Bucher, (805) 280-2034, North County (805) 922-5459, South County (805) 898-2229, http://www.welcomeverybaby.org.
Percentage of Low Birth Weight Births by Region Source: Santa Barbara County Public Health Department
Percentage out of all births between 250g to 4,999g in accordance with FHOP data quality guidelines.
2003 2005 2007
5%
0%
6.1%
6.8%
7.4%
5.7%
6.8%
6.
7%
6.4%
5.8%
6.
0%
8%
6%
1%
2%
3%
4%
7%
2009
6.8%
5.9%
5.
8%
Key North County Mid-County South County

Santa Barbara County Page 18
What the data show from 2000 to 2010:
• The percentage of youth considered “fit” increased slightly overall since 2001, but held steady from 2006 to 2010. Less than half of all children and youth in all grades tested were able to meet the six fit-ness standards in the 2009-2010 school year.
• While overall fitness rates reported were low, countywide rates were generally slightly higher than those for California as a whole.
• WIC2 data for children considered to be obese or overweight (by BMI for age percentile3) show no significant changes in North or South County, and a 6% increase in Mid-County between 2006 and 2010.
What we know:
• Differences by gender were more significant than differences by grade. Seventh-grade females were consistently more fit than 7th-grade males.
• The California Physical Fitness Test includes a body composi-tion component. Body composi-tion is determined either by us-ing measuring devices to esti-mate a student’s level of body fat, or by using weight and height measurements to calcu-late a student’s body mass index. Based on these measurements, there was no noticeable change at any grade level of the percent-age of children whose body com-position is considered within a healthy zone.1
• Obesity and dental caries share contributing factors, which more often than not are related to en-vironmental factors where chil-dren live.4
Goal: Goal: Goal:
Children and youth are physically fit.Children and youth are physically fit.Children and youth are physically fit.
Indicators:Indicators:Indicators: 1. Public school children meeting all fitness standards.1. Public school children meeting all fitness standards.1. Public school children meeting all fitness standards.1 2. Overweight children and youth.2. Overweight children and youth.2. Overweight children and youth.
Childhood obesity and poor physical fitness increase the risk of type 2 diabetes, heart disease, asthma, sleep and orthopedic problems, and more. Associated social problems may lead to depression, low self-esteem, and missed school days.
Terminology and Explanations 1. For definitions and more information on the public school Physical Fitness Test, visit http://www.cde.ca.gov/ta/tg/pf. 2. Administered by the County Public Health Dept., the WIC (Women, Infants, and Children) program serves women who are pregnant, breastfeeding or
just had a baby, and infants and children under 5 years of age. WIC provides checks to buy healthy foods, nutrition and health education, breastfeed-ing education and support, and referrals to health care and other community services. To qualify, a family has to earn less than 185% of the Federal Poverty Level ($41,348 for a family of four in 2011).
3. The Body Mass Index for Age Percentile provides a comparison of one child’s BMI value to other children of the same age and sex. It is not the same as BMI value. WIC considers children whose BMI-for-Age is above 85% to be overweight, and children whose BMI-for-Age is above 95% to be obese. See more on BMI-for-Age at http://www.cdc.gov/nccdphp/dnpa/healthyweight/assessing/bmi/childrens_BMI/about_childrens_BMI.htm.
4. Source: http://www.childrennow.org/uploads/documents/oral_health_brief_022011.pdf
Preschool Children Overweight or Obese by BMI for Age Percentile Source: WIC. 7,058 children evaluated in 2006, 7,362 in 2008, 8,480 in 2010.
Percent:
Sept. 2006
Sept. 2008
34% 25%
27%
35% 25% 26%
10 20 30 40 50 60 70 80 90 100
Key North County Mid-County South County
Oct. 2010
36% 31%
25%

2010 Children’s Scorecard
Neighborhood Nutrition Indicators
Obesity and physical fitness rates are closely related to the commu-nity environment in which chil-dren live. The availability of healthy, nutritious food, farmer’s markets, safe playgrounds, parks, and other open space, as well as the ability to safely walk or bike to and from school all play an important role in a child’s fitness level.
The number of fast food outlets and convenience stores, along with the lack of safe outdoor space negatively affect a commu-nity’s health. Obesity prevention and physical fitness initiatives, therefore, need to target both individual changes toward a healthy lifestyle and changes in the environment.
Page 19
Domain: Children and youth are healthy and thrive.
Goal: Children and youth are physically fit.
Percentage of County Public School Students Meeting Health & Fitness Targets Source: California Department of Education DataQuest, http://data1.cde.ca.gov/dataquest
Key Grade: 5 7 9
18 22 20
28 31
28 29 32
26 30
35 33 27
38 39
24
41 34
Percentage of children meeting all six physical fitness standards:
33 39
46
27
37 38
Percentage of children with body composition in Healthy Fitness Zone:
2007 2001 2002 2003 2004 2005 2006 2008
42
2009
30
41 44
65 69 71 69 67 67
63
72 71 71 72 69 70 71 69 69 69
63 69
72 69 71 70 67
72 71 64
72 70 68
2010
31 39
Community-Wide Initiatives & Innovations • Childhood Obesity Prevention Initiatives. The Diabetes Resource Center
of Santa Barbara County provides school-based programs and instruction in food preparation, organic gardening, physical activities, healthy eating habits, and health and wellness for families in Carpinteria and Santa Bar-bara. They also train Promotores de Salud, local community members who teach and advocate for healthier options for families. Contact: Dr. Andria Ruth, [email protected].
• Gold Coast Collaborative. Regional effort to address childhood obesity. Contact: Alicia Villacana, (805) 677-5254.
• Lompoc Valley Community Health Care Organization leads a community coalition focused on obesity prevention and community health in Lompoc. Contact: Judy Taggart, (805) 737-5787.
• Partners for Fit Youth. Coalition of organizations with the goal of improv-ing the health of youth and their families to prevent chronic disease, and promote healthy weight. Contact: Susan Horne, (805) 681-4757.
• Santa Barbara County Promotores de Salud Network. A network of bilin-gual health promoters who work on improving the health literacy of socio-economically challenged communities, increasing access and utilization of health services and enhancing the community’s overall health and well-being. Contact: Josefa Rios, SBCEO Health Linkages, (805) 448-2578 or [email protected].
• S’Cool Food. Empowers school districts to implement and sustain nour-ishing “cook-from-scratch” food service operations through culinary train-ing for food service personnel and food literacy programs for students, including school gardens. Contact: [email protected].
100%
90%
80%
70%
60%
50%
40%
30%
20%
10%
School Year Ending:

Santa Barbara County Page 20
Serious emotional and behavioral disorders can affect one in 10 young people and can severely dis-rupt a young person’s daily functioning in the home, school or community. These disorders include depression, attention deficit/hyperactivity, anxiety disorders, conduct disorder, and eating disorders.
Youth substance use is associated with negative consequences including increased risk of serious drug use later in life, school failure, and poor judgment, which may put young people at risk for accidents, violence, unplanned and unsafe sex, and suicide.2
Goal: Goal: Goal:
Children and youth are mentally healthy.Children and youth are mentally healthy.Children and youth are mentally healthy.
Indicators:Indicators:Indicators: 1. Mental health diagnoses of children referred to ADMHS.1. Mental health diagnoses of children referred to ADMHS.1. Mental health diagnoses of children referred to ADMHS.1 2. Age of first substance use by county youth in ADMHS Alcohol & Drug Program.2. Age of first substance use by county youth in ADMHS Alcohol & Drug Program.2. Age of first substance use by county youth in ADMHS Alcohol & Drug Program.
What we know:
• Data are an insufficient representation of the mental and emotional health of children and youth.
What the data show from 2000 to 2010:
• Adjustment Disorder and Child and Adolescent Disorder were the most common diagnosis categories among children and youth seen by ADMHS in 2010. These groups primarily include Attention Deficit, Conduct and Attachment Disorders, and signs of depression or anxiety.3 There were no evident changes in the percent-ages of diagnosed conditions between 2009 and 2010.
• The number of children seen by ADMHS has increased by 56% overall in the past decade.
• Of county youth admitted to the ADMHS Alcohol and Drug Program, the overwhelming majority reported their first substance use was between the ages of 11 and 15. Twice as many youth reported using their first substance between the ages of 6 and 10 than those who reported first using after age 15.
Key
Mental Health Diagnoses4 of Children5 Served by ADMHS Source: Santa Barbara County Department of Alcohol, Drug & Mental Health Services
Fiscal Year Ending: Clients:
2001 2,052
2002 2,424
2003 2,389
2004 2,578
2005 2,779
2006 2,832
2007 3,007
2008 3,192
45%
40%
35%
30%
25%
20%
15%
10%
5%.
2009 3,206
2010 3,192
For definitions of the diagnoses used in the chart, please refer to the DSM-IV manual, available at http://www.psychiatryonline.com/DSMPDF/dsm-iv.pdf.
Mood Disorder Schizophrenia/Psychotic Disorders Anxiety Disorder Other
Adjustment Disorder Child & Adolescent Disorder

2010 Children’s Scorecard
Community-Wide Initiatives & Innovations
• Early Mental Health and Special Needs Collaborative. Led by ADMHS, this initiative aims to streamline mental health services for children 0-5 and their parents by coordinating assessments, screening and access to services. Contact: Sandy Fahey, (805) 737-6631.
• CATCH (Child Assistance Team Creating Hope). Through this program, adminis-tered by the Santa Barbara County Education Office, a team of school psycholo-gists, teachers trained in social skills curriculum and behavioral supports, and instructional assistants provide supports to children exhibiting behavioral chal-lenges in preschool settings. The program includes on-site or in-home consulta-tion with preschool staff and parents, Second Step (a mental health curriculum) training, and referrals to other services as appropriate. Contact: Erin Galbraith, (805) 966-1357.
• SAFTY (Safe Alternatives for Treating Youth). Operated by Casa Pacifica, SAFTY is a mobile crisis response service available 24 hours a day, 7 days a week, to all Santa Barbara County youth through age 21. The goal is to prevent psychiatric hospitalization and decrease the use of emergency rooms for mental health crisis. Contact: Amanda Pyper, (805) 570-9333.
• Spirit. Children, youth, and their families are provided whatever it takes to support resiliency and promote recovery from mental illness through wraparound teams. Located at clinic sites: Santa Barbara (805) 884-1600, Santa Maria (805) 934-6385, Lompoc (805) 737-6600.
• Post-Partum Support Group works on developing resources to increase aware-ness and build a comprehensive network of community perinatal services and providers to strengthen mental health in the pregnant and postpartum family. Contact: Sandy Fahey, (805) 737-6631.
Terminology and Explanations 1. ADMHS (the Santa Barbara County
Department of Alcohol, Drug and Men-tal Health Services) serves children and youth with “serious emotional dis-turbance” (a significant impairment in an important area of life functioning). Children receiving services funded by Medi-Cal must have a DSM-IV diagno-sis, with a treatment plan enabling the child to progress developmentally (as individually appropriate). Children with mental disorders can be served under “Early & Periodic Screening, Diagnosis & Treatment” (EPSDT), which includes services to help those under 21 main-tain their level of functioning, whether or not their condition is expected to improve.
2. Source: Facts for Families, American Academy of Child and Adolescent Psychiatry, http://aacap.org/cs/root/facts_for_families/teens_alcohol_and_other_drugs
3. The Child & Adolescent Disorder group primarily includes Attention Deficit, Con-duct, and Attachment Disorders. Very young children in this category often suffer from attachment disorders. In older children, Adjustment Disorder is used for a variety of behaviors, includ-ing signs of depression or anxiety.
4. While children are diagnosed carefully, categories of mental health diagnoses are also influenced and limited by medical billing and other internal proce-dures.
5. Experts and clinicians are less likely to diagnose a specific mental illness in early childhood, as it is an important developmental stage when much of the child’s personality and mind are still in formation. Also, with younger children, it is often difficult to distinguish be-tween social, emotional or physical issues that may be causing the con-cerning or disruptive behavior. Usually, behavioral issues are considered cause for intervention when they are so severe that they interfere with develop-ment and performance or strongly impact others.
Page 21
Domain: Children and youth are healthy and thrive.
Goal: Children and youth are mentally healthy.
0%
Age of First Substance Use by County Youth Admitted to ADMHS Alcohol & Drug Program
Source: Santa Barbara County Department of Alcohol, Drug & Mental Health Services
Key Year 2006-07 (738 Admissions*) Year 2007-08 (704 Admissions*) Year 2008-09 (609 Admissions*) Year 2009-10 (672 Admissions*)
100%
80%
60%
40%
20%
0% 0-5 Years 6-10 Years 11-15 Years 16-17 Years
<1%
1%
12%
14%
10%
84%
81%
84%
4%
5%
4%
1%
10%
83%
5%
*Numbers include duplicate client counts, as some clients have multiple admissions per year.
Santa Barbara County Page 22
Goal: Goal: Goal:
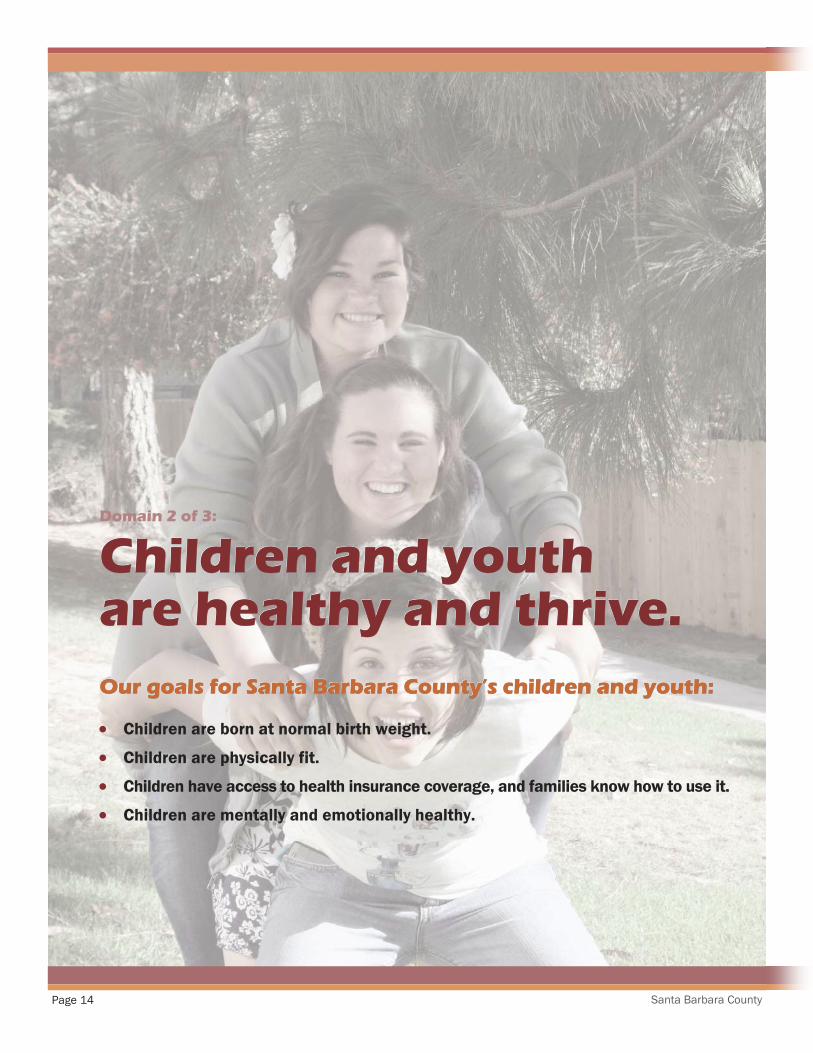
Children have health insurance.Children have health insurance.Children have health insurance.
Indicator: Children with health insurance coverage.Indicator: Children with health insurance coverage.Indicator: Children with health insurance coverage.
Children with health insurance generally have better health throughout childhood and into their teens. They are more likely to receive needed shots that prevent disease, get treatment for recurring illnesses such as ear infections and asthma, get preventative care to keep them well, and get the treatment they need when they are sick. Children with health insurance get sick less often, and are less likely to miss school due to illness.1
What the data show from 2000 to 2010:
• The number and percentage of children insured by Medi-Cal2 and Healthy Families3 increased from 2000 to 2010. In 2010, 41% of children and youth between the ages of 0 and 20 were receiving Medi-Cal services, compared to 20% in 20004.
• The percentage of uninsured children appears to have decreased overall between 2001 and 2009. How-ever, the data are not considered statistically stable.5
• While there is no specific information available on children-only enrollment, North County enrollees comprised 53% of the county’s Medi-Cal caseload in 2010, while South County and Mid-County enrol-lees comprised 29% and 18%, respectively.
Children on Public Insurance in Santa Barbara County Medi-Cal Sources: 2000-2008, California Department of Health Care Services; 2009-2010, Santa Barbara County Department of Social Services
Healthy Families Source: Managed Risk Medical Insurance Board, http://www.mrmib.ca.gov/MRMIB/HFPReports.shtml
Note Data for Medi-Cal and Healthy Families is point-in-time enrollment as of April of each year.
Key
Medi-Cal:
Healthy Families:
Ages11-15 Ages 6-10 Ages 0-5
Ages 16-20
Ages 0-18
2000 2001 2002 2003 2004
24,852
27,708 30,308
32,347
3,307
4,60
3
6,16
0
7,66
0
2005 2006 2007 2008
36,275 36,996 36,889 37,549 38,821
7,92
9
8,40
4
8,47
8
10,1
37
9,09
5
45,000
40,000
35,000
30,000
25,000
20,000
15,000
10,000
5,000
0 2009 2010
43,271 10
,681
40,504
10,8
00
What we know:
Children enrolled in health insurance supported by case management access health care correctly.6
• In 2009-2010, parents reported 23% fewer vis-its to the emergency department after one year of enrollment and case management.
• After 10 months of coverage, 90% of parents reported their children had seen a dentist in the last 6 months, compared to 32% prior to enroll-ment.
• After 10 months of coverage, 95% of parents reported their children received medical ser-vices, compared to 60% prior to enrollment.

2010 Children’s Scorecard
Terminology and Explanations 1. Source: United States Department of Health and Human
Services, http://www.insurekidsnow.gov/qa/index.html 2. Medi-Cal is state and federally funded health coverage. To
qualify for free Medi-Cal, children must live in households with incomes under 200% of Federal Poverty Level (FPL) for infants under age 1, 133% for children ages 1-5, and 100% for children ages 6-19. If eligible, those children living in households with incomes above these levels will have a share-of-cost.
3. Healthy Families is state funded public insurance for children whose parents earn less than 250% of FPL.
4. Source: Department of Finance 5. California Health Information Survey (CHIS) is a telephone
survey of adults, adolescents, and children, conducted every two years by the UCLA Center for Health Policy Research. Such statewide surveys may be subject to a higher margin of error in smaller counties such as Santa Barbara. CHIS care-fully selects respondents to create a sample that is represen-tative of the population surveyed. For more information, see http://www.chis.ucla.edu.
6. Source: Children’s Health Initiative of Santa Barbara County
Community-Wide Initiatives & Innovations
• Children’s Health Initiative of Santa Barbara County. Housed at the Health Linkages program run by the County Education Office, the Children’s Health Initiative works to promote coordinated outreach, widespread enrollment, cor-rect utilization, and high retention for all public health insur-ance products available to children. There are over 90 certi-fied application assistors countywide. Contact: Tara Dooley, (805) 964-4710, x4460.
• Community Health Centers of the Central Coast. A network of clinics facilitating health care access for low-income fami-lies. Contact: (805) 929-3211.
• Santa Barbara Neighborhood Clinics provide high-quality, affordable medical and dental care to all, especially the un-insured and underserved, regardless of their ability to pay. Contact: Jeremy Myer, (805) 963-8566, x226.
• Santa Barbara County Public Health Department Health Care Centers provide high quality medical and preventative services to the uninsured and underinsured. Contact: http://www.sbcphd.org/HCC.
Children’s Oral Health Santa Barbara County children of all ages continue to have higher rates of untreated dental decay than the state average. In 2010, dental disease affected nearly 40% of preschool children, and 8% of preschool and school age children had untreated emergency dental needs. In addition, the number of dentists available to chil-dren on public insurance is small; in some cases the ratio of den-tal homes available to children is lower than 1 dentist per 1,000 children.
The Children’s Oral Health Collaborative is addressing this issue with the following strategies: • Increase community awareness through parent education,
coordinated messaging and preschool/school-based out-reach.
• Provide oral health and nutrition education and tooth brushing support for pre- and elementary school programs.
• Provide training and support for medical providers to per-form oral health assessments, provide anticipatory guid-ance and apply fluoride varnish.
• Provide school and community-based fluoride varnish and sealant programs, and assist parents in accessing routine care per medical and dental guidelines.
Baseline information is being collected and will serve to meas-ure the effectiveness of these strategies over time. Contact: Georgene Lowe, (805) 964-4610 x4455.
Page 23
Domain: Children and youth are healthy and thrive.
Goal: Children have health insurance.
Type of Insurance (Children Ages 0-17) Source: California Health Information Survey2
2001 2003 2005
60%
50%
40%
30%
20%
10%
0%
52%
12%
Uninsured
Medi-Cal/ Healthy Families
Employer-based insurance 53%
48%
37% 34%
14%
6%
2007 2009
52%
6%
52%
28%
33%
27%
17%
Page 24 Santa Barbara County
Domain 3 of 3:
Children and youth Children and youth Children and youth are “ready to learn”are “ready to learn”are “ready to learn” and will succeed in school.and will succeed in school.and will succeed in school.
Our goals for Santa Barbara County’s children and youth:Our goals for Santa Barbara County’s children and youth:Our goals for Santa Barbara County’s children and youth:
• All children and youth are proficient in reading, math, and language.
• All youth enrolled in public school successfully complete high school.

2010 Children’s Scorecard Page 25
Domain: Children and youth are “ready to learn” and will succeed in school.
• Grade school STAR test scores: Although the scores for English-Language Arts and Math showed slight gains between third and seventh grade, there were significant achievement gaps based on parent education level, income, and ethnicity. Similar gaps occur nationwide. No significant progress has been made in closing these gaps for California students.
• High school Algebra 1 CST test scores: While there were sizable gains since 2003, the total number of students with proficient or advanced scores in Algebra remained low. Student scores for Algebra differed dramatically according to par-ent education level.
• High school exit exam test scores: There was no significant change over time in the percentage of students able to pass the Mathematics or English-Language Arts sections of the exam. The majority of students, particularly those who were not socioeconomically disadvantaged, were able to pass the exam in tenth grade.
Executive Summary

Santa Barbara County Page 26
Community-Wide Initiatives & Innovations
• Fun in the Sun. A summer program for at-risk and low-income youth, with a focus on literacy and reading proficiency. Contact: United Way of Santa Barbara County: North County (805) 922-0329, South County (805) 965-8591.
• The Carpinteria Children’s Project at Main is a joint venture of the school district, First 5, several community-based organizations, and a cadre of local foundations with the mission of ensuring that every in-coming student in kindergarten is “school ready.” The project follows the National Education Goal Panel’s recommendations for school readiness, which are that children are healthy and thriving, families are supported, schools are ready, and children are ready for the rigors of academic life. Contact (805) 566-1600 or [email protected].
• The First 5 School Readiness Initiative brings together local low-performing schools, family resource centers, and community-based organizations to offer programs that help prepare children to enter kindergarten as healthy, active learners. Contact: M. Carmen Lozano, Community Collaborative Specialist, First 5 Santa Barbara County, (805) 884-8056.
Did You Know?
The foundation for children's school suc-cess begins long before children enter kindergarten. To address the achieve-ment gap, resources have to be invested in the health and early development of children.
Research has shown that supporting parent literacy skills, teaching parents how to interact with infants in ways that develop their abilities to learn, offering perinatal support, enrolling children in quality early care and education pro-grams that support their social emotional development, and providing opportuni-ties for parents to become engaged in school-learning can significantly increase reading proficiency, which is directly re-lated to academic success.
Goal: Goal: Goal:
ChildrenChildrenChildren areareare proficientproficientproficient ininin keykeykey subjects.subjects.subjects.
Indicator:Indicator:Indicator: Public school 3rd and 7th graders testing proficient in Public school 3rd and 7th graders testing proficient in Public school 3rd and 7th graders testing proficient in reading, math, and language.reading, math, and language.reading, math, and language.1
A solid educational foundation greatly improves a child’s opportu-nity to live a meaningful and productive adult life. Third-grade test scores are considered strong indicators of future academic success.
What the data show from 2004 to 2010:
• Children’s 3rd-grade STAR test scores in English-Language Arts and Math showed significant dif-ferences based on their parents’ education levels. This was true for each set of 3rd graders tested since 2004.
• Between 3rd and 7th grade, there were slight gains for each student group, but the achievement gap based on parent education did not narrow.
• This achievement gap2 occurs statewide and na-tionwide. Causes and solutions are widely de-bated, but no significant progress has been made in closing this gap for California students.
What we know:
• Similar differences in children’s test results are apparent when scores are broken down by parent income, ethnicity, or disability status.
• The achievement gap begins with the transition from preschool to kindergarten, and continues as students progress through school. It is evident not only in test scores, but also in the rates of stu-dents passing the high school exit exam, complet-ing high school, and achieving college readiness.

2010 Children’s Scorecard
Terminology and Explanations 1. Per STAR (Standardized Testing And Reporting program) California Standards Test results for English-Language Arts and Mathematics. Tests are
administered only to students in CA public schools. These tests were developed specifically to assess students’ knowledge of the CA content stan-dards. For more information, please refer to http://star.cde.ca.gov.
2. The Department of Education is leading a statewide initiative to close the achievement gap, defined in California as the disparity between White stu-dents and other ethnic groups, English learners and native English speakers, socioeconomically disadvantaged students and non-disadvantaged students, and students with and without disabilities. For more information on this topic, please refer to http://www.closingtheachievementgap.org.
3. Years presented are the final year of a school year; e.g., 2009-2010 is shown as 2010.
Page 27
Goal: Children are proficient in key subjects.
Domain: Children and youth are “ready to learn” and will succeed in school.
Percentage of Children Scoring Proficient or Advanced, by Parent Education Level3 Source: http://star.cde.ca.gov
12% 71%
69%
11% 74%
10% 71%
12% 69%
32% 45% 87%
29% 83%
26% 81% 56%
23% 83% 51%
80%
15% 75%
Engl
ish-
Lang
uage
Art
s
Key
Some College
< High School High School
BA/BS Degree Graduate Degree
Level of parents’ education: 59%
15% 47% 75% 67%
38% 25%
56%
26%
38%
59% 43% 28%
57%
24% 12%
36% 23%
51% 35% 22%
75%
74%
74%
73%
70%
63%
64%
54%
46%
41%
44%
56% 44%
38% 27%
28%
74% 67%
85%
2008
2007
2006
2005
2004
3rd
Grad
e
2009
2008
2007
2006
2005
2004
7th G
rade
2009 2010
2010 79% 61%
80%
85%
81%
81%
84%
83%
69% 38%
72%
72%
70%
81% 48%
76%
Mat
h
75%
76%
76%
77%
67%
71%
68%
61%
64%
63%
61%
54%
64%
61%
61%
61%
59%
54%
50%
50%
49%
49%
49%
48%
47%
47%
46%
45%
32%
40%
41%
40%
39%
39%
36%
23% 19%
25%
32%
37%
35%
32%
31%
31%
29%
30%
2008
2007
2006
2005
2004
3rd
Grad
e
2009
2008
2007
2006
2005
2004
7th G
rade
2009 2010
2010 77% 67% 50% 37% 35%
87% 83% 62% 52% 46%
46% 35%
41% 27% 17%

Santa Barbara County
Terminology and Explanations 1. Algebra I testing is completed as part of the California Standardized Testing and Report-
ing (STAR) program. The results reported as part of the STAR testing include a combined score for students tested in any of the grades between 7-11 for specific content standards associated with having completed the Algebra I course. Advanced scores represent superior performance in which students demonstrate a comprehensive and complex understanding of the knowledge and skills assessed. Proficient scores represent solid performance in which students demonstrate a competent and adequate understanding of the knowledge and skills assessed. For more, see http://star.cde.ca.gov/star2010/help_scoreexplanations.asp.
2. The High School Exit Exam is a mandatory graduation requirement. Beginning in tenth grade, students have the opportunity to take the test multiple times each school year until they have passed it.
3. Adam Gamoran and Eileen C. Hannigan (2000). Algebra for Everyone? Benefits of College-Preparatory Mathematics for Students With Diverse Abilities in Early Secondary School. Educa-tional Evaluation and Policy Analysis, Vol. 22, No. 3, 241-254.
A Note on Dropout Data Beginning with the 2007/2008 school year, the Department of Education is tracking student dropout rates by assigning each student a unique 10-digit number (Statewide Student Identifier) to identify pupils as they move be-tween schools and districts. Historical data, which lacked this ability to account for individual students, is not considered to be reliable by education experts, and is thus not yet included in this Scorecard as a trend.
For the most recent dropout data by school district, see the Department of Education’s Dataquest website at http://dq.cde.ca.gov.
Goal: Goal: Goal:
All youth complete high school.All youth complete high school.All youth complete high school.
What the data show from 2003 to 2010:
• Student scores for Algebra differed significantly according to parent education level. While there were slight gains from 2003 to 2010 for all student populations, students whose parents had attended graduate school were still more than twice as likely as students whose parents had high school or less education to achieve proficient or advanced scores in Algebra I testing.
• While there were sizable gains from 2003 to 2010, the total number of students scoring proficient or advanced in Algebra re-mained low.
• There was no significant change over time in the percentage of students able to pass the Mathematics or English-Language Arts sections of the exit exam.
• A majority of students were able to pass the exit exam in 10th grade. This was particularly true for students whose families were not socioeconomically disadvantaged.
• Students who were unable to pass the exit exam in 10th grade were increasingly less likely to pass the test in a later grade. In 2009-10, the average passing rate for the Mathematics portion in grades 11 and 12 was 40%, vs. 82% in 10th grade.
What we know:
• Students who do not take Algebra I by eighth grade are more likely to drop out of school, and less likely to graduate from a four-year college or university.3
• There was a similarly persistent, though less pronounced, Algebra achievement gap between students from families with low-income and students whose families are not so-cioeconomically disadvantaged. This gap did not narrow from 2003 to 2010. However, slight gains were made for both groups, with the per-centage of students scoring profi-cient or advanced rising from 16% to 29% for students from families with low-income, and from 23% to 46% for students whose families are not socioeconomically disadvantaged.
Indicators:Indicators:Indicators: 1. Proficient or advanced score on Algebra I California Standards Test.1. Proficient or advanced score on Algebra I California Standards Test.1. Proficient or advanced score on Algebra I California Standards Test.1 2. Pass English & Math sections of High School Exit Exam in 10th grade.2. Pass English & Math sections of High School Exit Exam in 10th grade.2. Pass English & Math sections of High School Exit Exam in 10th grade.2
Page 28
Algebra I is considered a gateway course for access to the pre-college mathe-matics courses needed to be UC and CSU eligible by graduation from high school. The California High School Exit Exam is a mandatory graduation requirement.

2010 Children’s Scorecard Page 29
Domain: Children and youth are “ready to learn” and will succeed in school.
Goal: All youth complete high school.
Key Math (socioeconomically advantaged)
Math (socioeconomically disadvantaged) ELA (socioeconomically advantaged) ELA (socioeconomically disadvantaged)
Math (all students countywide) ELA (all students countywide) `
Percentage of 10th Graders Passing English-Language Arts (ELA) & Math Exit Exam, by Socioeconomic Circumstances
Source: California Department of Education Dataquest, http://dq.cde.ca.gov/dataquest
2004 2005 2006 2007 2008
89%
63
%
59%
90
%
90%
62
%
60%
66%
63%
88%
65
%
61%
90
%
90%
70
%
66%
92%
92%
100%
90%
80%
70%
60%
50%
40%
30%
20%
10%
0%
73%
68%
2009
75%
67%
92
%
2010
89%
90%
91%
92%
91%
Students in Grades 7-11 Scoring Proficient or Advanced in Algebra, by Parent Education Level Source: California Department of Education Dataquest, http://dq.cde.ca.gov/dataquest
Key Level of parents’ education:
< High School High School AA/AS Degree
BA/BS Degree Graduate Degree All students `
2004 2005 2006 2007 2008
1017
%
39%
10
%
11%
53%
11
%
14%
49%
19
%
18%
36%
49
%
17%
22%
39%
51
%
19%
21
%
24%
51%
2003
29%
29%
28%
22%
23%
25%
25%
21%
100%
90%
80%
70%
60%
50%
40%
30%
20%
10%
0% 2009
25%
24
% 32
%
43%
57
%
2010
28%
27
% 34
%
48%
67
%
36%

Santa Barbara County Page 30
About Santa Barbara County ChildrenAbout Santa Barbara County ChildrenAbout Santa Barbara County Children
• County demographics
• Student demographics
• Related data & resources
AppendicesAppendicesAppendices

2010 Children’s Scorecard Page 31
• In 2010, Santa Barbara County was home to an estimated 105,206 children. Of those children, 34,216 (33%) were under six years old.
• Of the 6,039 children born in 2009, 34% were born in South County, 18% in Mid-County, and 47% in North County.
• From 2000 to 2010, countywide population in-creased by 9%, with the most growth occurring in North County. Population in the Santa Maria region increased by 20%, with an estimated 15,802 more residents in 2010 than in 2000.
• In 2010, 57.2% of Santa Barbara County children identified Latino/Hispanic as their ethnic origin (vs. 49.6% statewide), and 33.9% as Caucasian/White (vs. 30.3% statewide). Other ethnicities in Santa Barbara County made up 8.8% of the total (Source: http://dof.ca.gov).
• Based on the American Community Survey five-year estimate (2005-2009), approximately 47% (42,413) of all family households had children under age 18 living with their parents. Of these, 27% were single parent households (Source: http://factfinder.census.gov).
Appendix 1:Appendix 1:Appendix 1:
County DemographicsCounty DemographicsCounty Demographics
Children as a Percentage of County Population Source: http://dof.ca.gov
2000 0%
2002 2004 2006 2008
20%
10%
30%
8%
17%
25%
8%
17% 17%
8% 8%
17% 16%
8%
Ages 6-17
Ages 0-5
Total
2010
24%
16%
8%
24% 25% 25% 25%
Santa Barbara County Population by Region Source: Population Estimates for Cities, Counties and the State, http://dof.ca.gov
2000
2002
2004
2006
2008
Key
Buellton
Guadalupe Santa Maria
Lompoc Solvang
Goleta
Santa Barbara Carpinteria
Unincorporated
50,000 100,000 150,000 200,000 250,000 300,000 350,000 400,000 450,000
2010
0

Santa Barbara County Page 32
• Of the 65,960 children enrolled in Santa Barbara County’s public schools in 2010, 43% were en-rolled in North County school districts, 37% in South County and 20% in Mid-County. School enrollment declined overall in South and Mid-County, while increasing in North County.
• The overall percentage of English Language Learners (ELL) in the county remained around 30% from 2000 to 2010, with rising rates in North and South County since 2006. The Santa Maria-Bonita and Santa Barbara Elementary School Districts showed an increasing percent-age of ELL student enrollment.
• About one in every 10 public school students was enrolled in special education in 2010. Among the county’s 7,314 special education students, learn-ing disabilities and speech or language impair-ments were the most common disabilities. Special education enrollment for autism grew at a par-ticularly fast rate, nearly tripling from 167 stu-dents countywide (2.6% of special education stu-dents) in 2002 to 485 (6.6%) in 2010.
Appendix 2:Appendix 2:Appendix 2:
Student DemographicsStudent DemographicsStudent Demographics
Public School Enrollment by Region Source: http://dq.cde.ca.gov/dataquest
30,000
25,000
0
10,000
2000 2005
Key
Mid-County
North County South County
20,000
15,000
5,000
23,657
26,770
15,002
2010
13,332
24,432
28,196
26,450 26,544
14,527
Public School Students Enrolled in Special Education
Source: Special Tabulation by CA Dept. of Education, Special Education Division Assessment, Evaluation and Support, http://www.kidsdata.org
15%
0% 2002 2006 2010
Key Santa Barbara County California
Autism* Countywide Autism* Statewide
2004 2008
2.6%
8.8%
6.6%
9.7%
11.1% 10.8% 11.0%
*Percentage of Special Education Students Enrolled for Autism
English Language Learners as % of Enrollment Rounded to nearest percent. Source: http://dq.cde.ca.gov/dataquest
40%
2000
30%
20%
5%
0%
10%
15%
25%
35%
2002 2004 2006 2008
29%
36%
17%
28%
37%
20%
27%
35%
18%
25%
32%
19%
36%
20%
Key
Mid-County
North County South County
2010
39%
20%
28%
31%
10%
5%
Appendix 3:Appendix 3:Appendix 3:
Related Data & ResourcesRelated Data & ResourcesRelated Data & Resources Groups intending to develop a community-wide or strategic partnership may wish to consult the following resources for an in-depth understanding of the issues.
Child Abuse & Neglect
American Humane Association works to end the abuse and neglect of children and animals through groundbreaking research, education, training and services. Online resources for child abuse prevention avail-able at http://www.americanhumane.org/children. CDSS Child Welfare Redesign. General information and history on the California Child Welfare Outcomes and Accountability Act (AB636, C-CFSR), at http://www.childsworld.ca.gov/PG1519.htm. Child Abuse Referral & Foster Care Data. Available at http://www.kidsdata.org, or directly from the UC Berkeley Center for Social Services Research website at http://cssr.berkeley.edu/CWSCMSreports. Child Welfare Information Gateway. A service of the Children's Bureau, providing access to print and electronic publications, websites, and online databases covering a wide range of related topics, at http://www.childwelfare.gov. Court Appointed Special Advocates (CASA) of Santa Barbara County work to assure safe, permanent, nurturing homes for abused and ne-glected children. Children are referred by the court to highly trained volunteers who advocate for them in the court system. At http://www.sbcasa.org. FRIENDS (Family Resource Information, Education and Network De-velopment Services), the National Resource Center for Community-Based Child Abuse Prevention (CBCAP), provides training and techni-cal assistance to federally funded CBCAP programs. The site serves as a resource to those programs and to the rest of the child abuse preven-tion community. At http://www.friendsnrc.org. Online Mandated Reporter Trainings. In English and Spanish, includ-ing professional modules targeted to particular sectors. Available online at http://mandatedreporterca.com. Pathway to the Prevention of Child Abuse & Neglect. A collection of findings from research, practice, theory and policy about child abuse prevention, organized by outcome goals for families, available online at http://www.cssp.org/publications/documents/pathways-to-outcomes. Santa Barbara County Child Abuse Prevention Council (CAPC) is a community council with the primary purpose of coordinating efforts to prevent and respond to child abuse and neglect. Online at http://www.PreventChildAbuseSB.org. Strengthening Families. An approach to preventing child abuse and neglect developed by the Center for the Study of Social Policy. The framework involves building evidence-based Protective Factors around young children and their families while enhancing policies and practices through collaboration among early childhood, child abuse prevention, and child protective services sectors. Information available at http://www.strengtheningfamilies.net.
Child Care & After-School Programs
California After-School Network. Statewide after-school coalition pro-viding policy information, resources, research, and technical assistance for California’s state-funded after-school programs. Home page at http://www.afterschoolnetwork.org.
California Child Care Resource & Referral Network. Information for child care providers and parents, as well as links to county-level data and information, at http://www.rrnetwork.org. The Costs of Disinvestment: Why States Can’t Afford to Cut Smart Early Childhood Programs. This brief from the Pew Center on the States demonstrates how investing in early childhood development acts as an economic stimulus and positions states to compete and thrive in a changing economic landscape. Available online at http://www.pewcenteronthestates.org/uploadedFiles/Cost_of_Disinvestment_brief_ final.pdf?n=1020. Early Care & Education Needs Assessment. Information from the Child Care Planning Council regarding the availability of services and the needs within the county, updated every five years. Available online at http://www.sbceo.org/~ccpc/needs.shtml. Effects of a Universal Preschool Program in California. According to RAND researchers, a high-quality, one-year, voluntary, universal pre-school program could generate $2.62 in benefits for California society per dollar of cost. Research brief available in PDF format for download at http://www.rand.org/pubs/research_briefs/RB9164.6. Guiding Principles for Quality After-School Programs Serving Pre-teens. A report from the Lucile Packard Foundation for Children’s Health, on after-school quality characteristics linked to positive out-comes for preteens, at http://www.lpfch.org/afterschool. Prepared to Learn. A RAND study exploring the nature and quality of early care and education for preschool-age children in California, at http://www.rand.org/pubs/technical_reports/TR539. Research Connections. Public access to child care and early education research data. Interactive tools allow users to search thousands of rele-vant resources, download documents, build customized tables on state policies, compare state demographics and analyze research data online at http://www.researchconnections.org.
Child & Family Poverty
Poverty is a widely studied and debated issue, and there is a wide array of information about poverty measures, child poverty, related outcomes and policy available to those interested. Only a limited selection directly related to child and family poverty is listed here. Center for the Study of Social Policy (CCSP). CCSP works with policy makers and communities to improve the lives of the most vulnerable children and families. At http://www.cssp.org. Child Poverty Persistence: Facts and Consequences. A policy brief from the Urban Institute, examining children’s poverty status over time and measuring the relationship between child poverty and adult out-comes. At http://www.urban.org/publications/412126.html. Children and Poverty—Vol. 7, Number 2—Summer/Fall 1997. Journal published by the Future of Children, providing research, policy and information, at http://www.futureofchildren.org. The Effects of Poverty and Economic Hardship Across Generations. Report on poverty’s effects on the social, physical, and developmental needs of children and families, using a “Family Stress—Family Invest-ment” model: http://cppr.ucdavis.edu/pdf/poverty_and_hardship.pdf.
2010 Children’s Scorecard Page 33

Page 34 Santa Barbara County
Family Economic Security Initiative. This statewide coalition, providing information on policies and programs promoting family economic self-sufficiency, annually publishes a self-sufficiency standard for each county. At http://www.insightcced.org. Family Strengthening and Economic Success. A policy brief from the California Family Resource Association, describing ways to increase a family’s assets, income and earning potential. Download at http://californiafamilyresource.org/assets/docs/fes_brief/CFRA_FES_BRIEF.pdf. Making Ends Meet: How Much Does It Cost to Raise a Family in Cali-fornia? This report, published by the California Budget Project in June 2010, provides a benchmark for assessing the adequacy of current employment opportunities and public policies that address the eco-nomic challenges facing many working families. Available online at http://www.cbp.org/pdfs/2010/100624_Making_Ends_Meet.pdf. National Center for Children in Poverty. Research, fact-sheets, poverty statistics and policy briefs at http://www.nccp.org. Small Area Income and Poverty Estimates (SAIPE). This program of the US Census Bureau produces model-based estimates annually of income and poverty for states, counties and school districts, based on a composite of data. At http://www.census.gov/hhes/www/saipe.
Education-Related Data & Research The California Department of Education maintains an extensive web-site of information and statistics for all types of education-related data at http://www.cde.ca.gov/ds. Data can also be found organized by school district at http://www.kidsdata.org. The California Dropout Research Project. Based at UC Santa Barbara, the project provides data and produces research and policy briefs on the California high school student drop-out issue. Visit online at http://www.lmri.ucsb.edu/dropouts. Closing the Achievement Gap. Operated jointly by the California Dept. of Education and West-Ed, a site dedicated to research, information and policy on narrowing the achievement gap among student sub-groups: http://www.closingtheachievementgap.org. Education Trust. Data, policy briefs and fact sheets on the achievement gap, access to higher education and other school-achievement related issues, at http://www.edtrust.org. Standardized Testing And Reporting (STAR). The California Dept. of Education’s STAR website annually publishes the most recent test results and provides information about test content and administration: http://star.cde.ca.gov. UCLA/IDEA: Institute for Democracy, Education, and Access, based at UCLA, produces research and reports in collaboration with the educa-tion and general community on issues of public education and higher education access. At http://idea.gseis.ucla.edu/publications. West-Ed’s California Healthy Kids Survey (CHKS). Biannual survey includes questions about study habits and feelings about school envi-ronment. At http://www.wested.org/cs/chks/print/docs/chks_home.html.
Health Insurance Children’s Health Insurance Data. Available at http://www.kidsdata.org or directly from the UCLA California Health Information Survey at http://www.chis.ucla.edu. Healthy Families Enrollment Data. Available online from the Dept. of Man-aged Risk Medical Insurance Board at http://www.mrmib.ca.gov/MRMIB/HFPReports.shtml.
Medi-Cal Enrollment Data. Available from the Dept. of Health Care Ser-vices at http://www.dhcs.ca.gov/dataandstats/statistics/Pages/RASS_Default.aspx.
Juvenile Crime Community Violence Prevention as a Family Strengthening Strategy—Policy Brief #5 from the Family Strengthening Policy Center includes a list of resources and references. Available for download in PDF format at http://www.nassembly.org/fspc/practice/documents/Brief5.pdf. Juvenile Arrest Data. Available at http://www.kidsdata.org or directly from the Criminal Justice Statistics Center at http://ag.ca.gov/crime.php. National Youth Violence Prevention Resource Center provides technical assistance resources for engaging local government and community leaders in implementing community-wide youth violence prevention strategies. Online at http://www.safeyouth.org. Research on Child Delinquency including child delinquency prevention, youth gangs, and causes and correlates of delinquency, is available from the Office of Juvenile Justice and Delinquency Prevention publications at http://ojjdp.gov. Survey of Prevention and Intervention Programs and Activities in Santa Barbara County Schools: Grades K-8. A publication from the Juvenile Justice Delinquency Prevention Commission (with UCSB), at http://www.jjdpc.org/pdf/2006survey.pdf. Youth Violence Prevention information from the Centers for Disease Con-trol and Prevention. Fact sheets, reports, data, resources, assessment tools and strategies for the prevention of youth violence online at http://www.cdc.gov/ViolencePrevention/youthviolence.
Mental Health
Facts for Families from the American Academy of Child and Adolescent Psychiatry. Developed to provide concise, current information on issues that affect children, teenagers and their families, including various men-tal health issues. Complete downloads available in English and Spanish at http://aacap.org/cs/root/facts_for_families/facts_for_families. National Mental Health Information Center. Information and research on youth and child mental health issues from the US Dept. of Health and Human Services Substance Abuse and Mental Health Administra-tion (SAHMSA), at http://mentalhealth.samhsa.gov/child/childhealth.asp. Suicide and Self-Inflicted Injury Data. Available at http://www.kidsdata.org or directly from the Injury Prevention Web at http://www.injuryprevention.org/info/data/ca.htm. West-Ed’s California Healthy Kids Survey (CHKS). Biannual survey includes self-reported data on emotional and mental health states of youth. At http://www.wested.org/cs/chks/print/docs/chks_home.html.
Normal Birth Weight Birth Weight, Prenatal Care Breastfeeding and Infant Mortality Data. Available directly from the California Dept. of Public Health at http://www.cdph.ca.gov/data/statistics/Pages/default.aspx, or at http://www.kidsdata.org. Healthy Women, Healthy Babies. Issue brief on infant mortality and low birth weight prevention from the Trust for America’s Health. Online at http://healthyamericans.org/report/44/healthy-women-healthy-babies. Maternal and Child Health Library. Extensive information on issues and research of interest to the maternal and child health professionals and those interested in knowing more about the topic, at http://www.mchlibrary.info.
Physical Fitness & Obesity
California Center for Public Health Advocacy. Data and information related to obesity and related outcomes, from the California Center for Public Health Advocacy, at http://www.publichealthadvocacy.org. Centers for Disease Control. Definitions and information about healthy weight and how to interpret, calculate, and use the body mass index for children and youth: http://www.cdc.gov/nccdphp/dnpa/healthyweight/assessing/bmi/childrens_BMI/about_childrens_BMI.htm. Children Now addresses the issues undermining children’s health and well-being, including health coverage, oral health, the obesity epidemic, and integrated services. Reports, research, data and policy priorities at http://www.childrennow.org/index.php/learn/health. Get Healthy California: California Obesity Prevention Plan. Strategic plan produced by the California Dept. of Health Services, listing goals and strategies to be implemented statewide. Available at http://www.dhs.ca.gov/CAObesityPrevention. “Designed for Disease.” Report finds that people living near numerous fast food restaurants and convenience stores have a higher prevalence of obesity and diabetes than people living near grocery stores and produce vendors — regardless of individual or community income. At http://www.publichealthadvocacy.org/designedfordisease.html.
We welcome your comments, ideas, questions and sugges-tions for future Scorecard publications. Please address them to Katharina Zulliger, Santa Barbara County KIDS Network Manager at [email protected].
2010 Children’s Scorecard
Oral Health and Obesity Policy Brief. “Childhood Obesity and Dental Disease: Common Causes, Common Solutions.” This brief covers the intersections of childhood obesity and dental disease, and proposes solutions that can promote the prevention of both. Available at http://www.childrennow.org/uploads/documents/oral_health_brief_022011.pdf. Physical Fitness and Obesity Data. Available at http://www.kidsdata.org or directly from the California Dept. of Education at http://dq.cde.ca.gov/dataquest. Robert Wood Johnson Foundation Publications and Research. Infor-mation on policy and environmental changes that lead to increased physical activity and better nutrition to address obesity: http://www.rwjf.org/pr/topic.jsp?topicid=1024. “Searching for Healthy Food: The Food Landscape in Santa Barbara County.” Fact sheet at http://www.publichealthadvocacy.org/searchingforhealthyfood.html. UCLA Center for Health Policy Research. Data, policy, and research on obesity and other health topics at http://www.healthpolicy.ucla.edu.