SAIPEM FIRST HALF 2020 RESULTS PRESENTATION
34
SAIPEM FIRST HALF 2020 RESULTS PRESENTATION 29 JULY 2020
Transcript of SAIPEM FIRST HALF 2020 RESULTS PRESENTATION

SAIPEMFIRST HALF 2020 RESULTSPRESENTATION
29 JULY 2020
|2
Forward-looking statements contained in this presentation regrading future events and future results are based on current expectations,estimates, forecasts and projections about the industries in which Saipem S.p.A. (the “Company”) operates, as well as the beliefs andassumptions of the Company’s management.These forward-looking statements are only predictions and are subject to known and unknown risks, uncertainties, assumptions and otherfactors beyond the Company’ control that are difficult to predict because they relate to events and depend on circumstances that will occurin the future. These include, but are not limited to: forex and interest rate fluctuations, commodity price volatility, credit and liquidity risks,HSE risks, the levels of capital expenditure in the oil and gas industry and other sectors, political instability in areas where the Groupoperates, actions by competitors, success of commercial transactions, risks associated with the execution of projects (including ongoinginvestment projects), the recent Coronavirus outbreak (including its impact across our business, worldwide operations and supply chain); inaddition to changes in stakeholders’ expectations and other changes affecting business conditions.
Therefore, the Company’s actual results may differ materially and adversely from those expressed or implied in any forward-lookingstatements. They are neither statements of historical fact nor guarantees of future performance. The Company therefore caution againstrelying on any of these forward-looking statements. Factors that might cause or contribute to such differences include, but are not limited to,economic conditions globally, the impact of competition, political and economic developments in the countries in which the Companyoperates, and regulatory developments in Italy and internationally. Any forward-looking statements made by or on behalf of the Companyspeak only as of the date they are made. The Company undertakes no obligation to update any forward-looking statements to reflect anychanges in the Company’s expectations with regard thereto or any changes in events, conditions or circumstances on which any suchstatement is based. Accordingly, readers should not place undue reliance on forward-looking statements due to the inherent uncertaintytherein.
The Financial Reports contain analyses of some of the aforementioned risks.
Forward-looking statements neither represent nor can be considered as estimates for legal, accounting, fiscal or investment purposes.Forward-looking statements are not intended to provide assurances and/or solicit investment.
FORWARD-LOOKING STATEMENTS
|3
TABLE OF CONTENT
▪ 01 OPENING REMARKS
▪ 02 1H 2020 RESULTS
▪ 03 BUSINESS UPDATE
▪ 04 BUSINESS OUTLOOK ANDCLOSING REMARKS
▪ 05 APPENDIX

OPENING REMARKS
|5
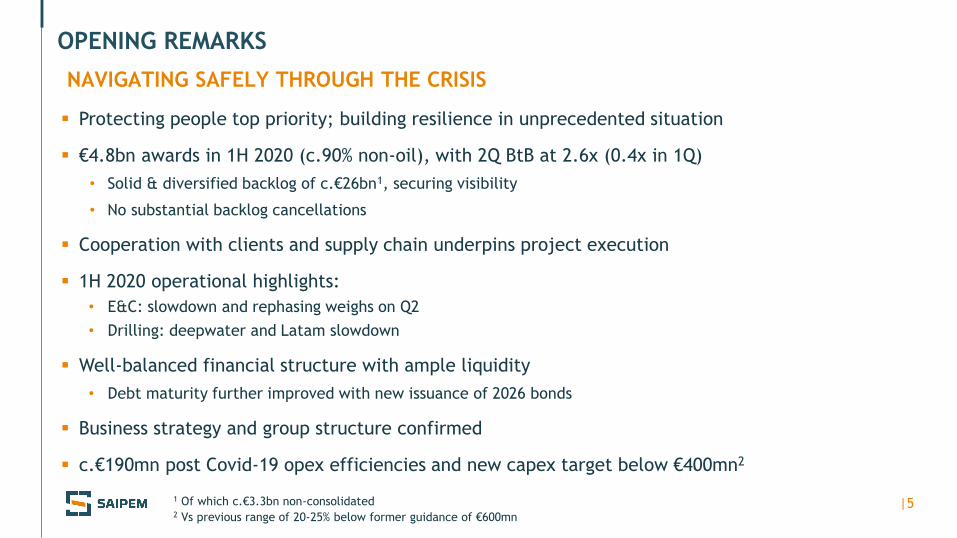
OPENING REMARKS
NAVIGATING SAFELY THROUGH THE CRISIS
1 Of which c.€3.3bn non-consolidated2 Vs previous range of 20-25% below former guidance of €600mn
▪ Protecting people top priority; building resilience in unprecedented situation
▪ €4.8bn awards in 1H 2020 (c.90% non-oil), with 2Q BtB at 2.6x (0.4x in 1Q)
• Solid & diversified backlog of c.€26bn1, securing visibility
• No substantial backlog cancellations
▪ Cooperation with clients and supply chain underpins project execution
▪ 1H 2020 operational highlights:
• E&C: slowdown and rephasing weighs on Q2
• Drilling: deepwater and Latam slowdown
▪ Well-balanced financial structure with ample liquidity
• Debt maturity further improved with new issuance of 2026 bonds
▪ Business strategy and group structure confirmed
▪ c.€190mn post Covid-19 opex efficiencies and new capex target below €400mn2

|6
COVID-19, MAINTAINING BUSINESS MOMENTUM
▪ Health and safety of personnel, partners and clients top priority
▪ Vessel operability unaffected by Covid-19, through strict protocols and procedures
▪ Key E&C onshore projects progressing at slower pace; some sizeable project rephased
▪ Effective collaboration with clients and supply chain
▪ Opex efficiencies and CAPEX rephasing in progress
▪ Business continuity across the organisation through remote working
HANDLING COMPLEXITY DELIVERS RESILIENCE

1H 2020 RESULTS
|8
0.8
1.81.0 0.5
500 500
0
500
48 106
92 100
89
62
72
244 69
76 51
13
6
151 500
442
175
667 651
101
568
2020 2021 2022 2023 2024 2025 2026+
Bonds ECA Facilities Bank Facilities Other Debt New bond
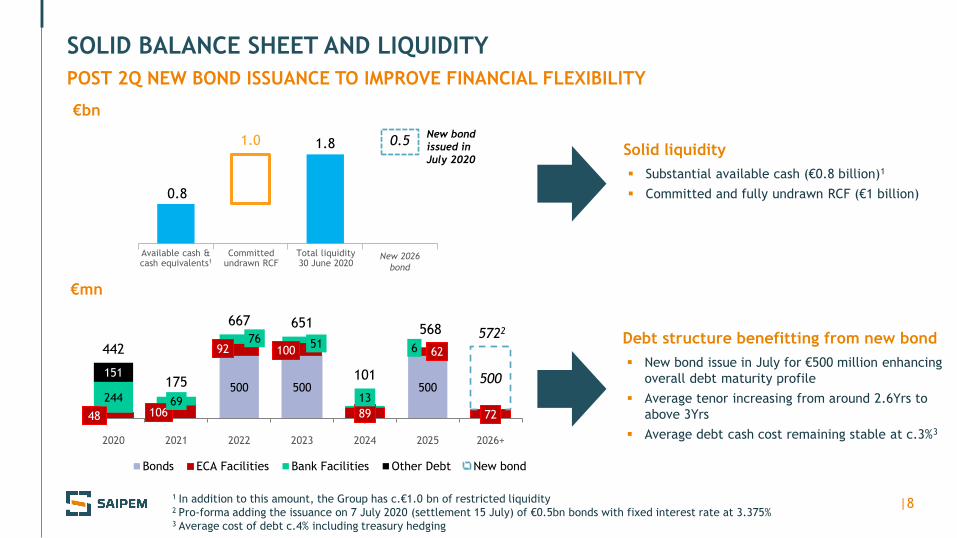
SOLID BALANCE SHEET AND LIQUIDITY
POST 2Q NEW BOND ISSUANCE TO IMPROVE FINANCIAL FLEXIBILITY
1 In addition to this amount, the Group has c.€1.0 bn of restricted liquidity2 Pro-forma adding the issuance on 7 July 2020 (settlement 15 July) of €0.5bn bonds with fixed interest rate at 3.375%3 Average cost of debt c.4% including treasury hedging
€bn
€mn
Available cash & cash equivalents1
Committed undrawn RCF
Total liquidity30 June 2020
Debt structure benefitting from new bond
▪ New bond issue in July for €500 million enhancing
overall debt maturity profile
▪ Average tenor increasing from around 2.6Yrs to
above 3Yrs
▪ Average debt cash cost remaining stable at c.3%3
Solid liquidity
▪ Substantial available cash (€0.8 billion)1
▪ Committed and fully undrawn RCF (€1 billion)
5722
New 2026
bond
New bond
issued in
July 2020

|9
1H 2020 RESULTS
YoY COMPARISON (€ mn – IFRS16)
Adjusted EBITDA1Revenues Adjusted Net Result1
1H201H191H201H19
1H201H19
3,675
606
355
4,519
1 Excluding special items, see slide 12
(132)
60
13.4% margin 9.7%
|10
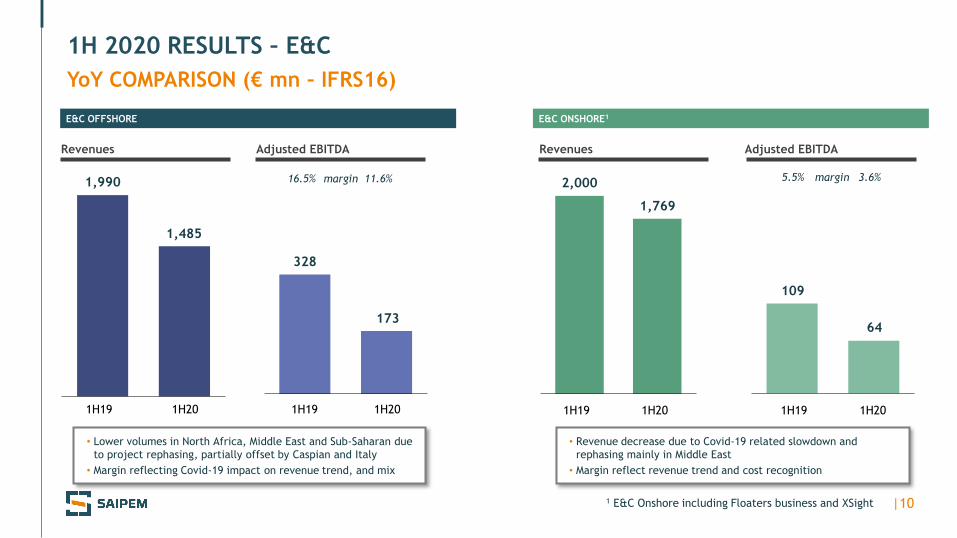
1H 2020 RESULTS – E&C
YoY COMPARISON (€ mn – IFRS16)
328
1 E&C Onshore including Floaters business and XSight
1H201H191H201H19
E&C OFFSHORE
1,990
Adjusted EBITDARevenues
• Lower volumes in North Africa, Middle East and Sub-Saharan due
to project rephasing, partially offset by Caspian and Italy
• Margin reflecting Covid-19 impact on revenue trend, and mix
16.5% 11.6%margin
• Revenue decrease due to Covid-19 related slowdown and
rephasing mainly in Middle East
• Margin reflect revenue trend and cost recognition
2,000
1H201H191H201H19
E&C ONSHORE1
109
Adjusted EBITDARevenues
5.5% 3.6%margin
1,485
173
1,769
64
|11
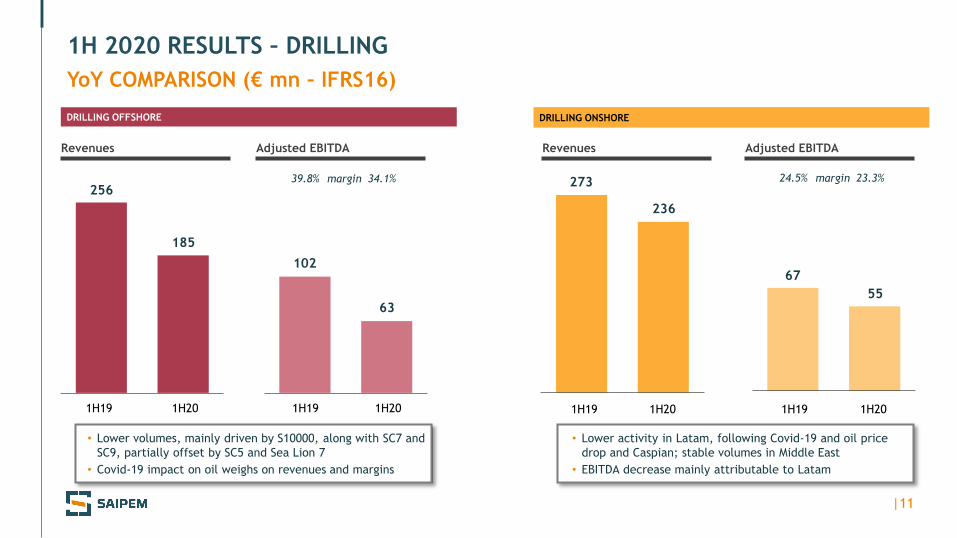
1H 2020 RESULTS – DRILLING
YoY COMPARISON (€ mn – IFRS16)
256
102
273
67
DRILLING ONSHORE
Adjusted EBITDARevenues Adjusted EBITDARevenues
DRILLING OFFSHORE
1H201H19
• Lower volumes, mainly driven by S10000, along with SC7 and
SC9, partially offset by SC5 and Sea Lion 7
• Covid-19 impact on oil weighs on revenues and margins
• Lower activity in Latam, following Covid-19 and oil price
drop and Caspian; stable volumes in Middle East
• EBITDA decrease mainly attributable to Latam
1H201H191H201H191H201H19
24.5% 23.3%margin39.8% 34.1%margin
185
63
236
55

|12
1H20
Adjusted
1H20
Reported
(132)
(885)
(257)
Impairment
(44)
(119)
Health & Safety
(Covid-19)1
Write-down
& other2
1H 2020 NET RESULT
RECONCILIATION ADJUSTED-REPORTED
Net Result (€ mn – IFRS 16)
Drivers of non-cash impairment
Market deterioration triggered a review of
assumptions for drilling offshore, such as:
▪ Shifting of some activity
▪ Renegotiation of rates
▪ Contract cancellation for 1 unit
▪ Delay in awards
▪ Revision of long-term rates
▪ Increased discount rate (WACC)
1 Expenses to support people’s health and safety during Covid-19 pandemic2 Write-down of assets and inventories for efficiency measures; other includes the outcome of a litigation
1Q ‘20
(333) 2Q ‘20

|13
1H 2020 NET DEBT EVOLUTION
(€ bn)
1H IN LINE WITH QUARTELY DISTRIBUTION COMMENTED WITH FY 2019 AND 1Q RESULTS
0.90
(0.06)
0.30
0.47
0.19
1.08 0.61
0.46 1.36
Cash flow
(N.P.+ D&A)
CapexNet debt
Dec. 31, 2019
Net debt
Jun. 30, 2020
Others includ.
Δ working
capital
FY19
IFRS 16
impact
Net debt 1H20
IFRS 16 impact
Net debt
Jun. 30, 2020
MANAGEMENT VIEW IFRS VIEWIFRS VIEW
Dec. 31, 2019

BUSINESS UPDATE
|15
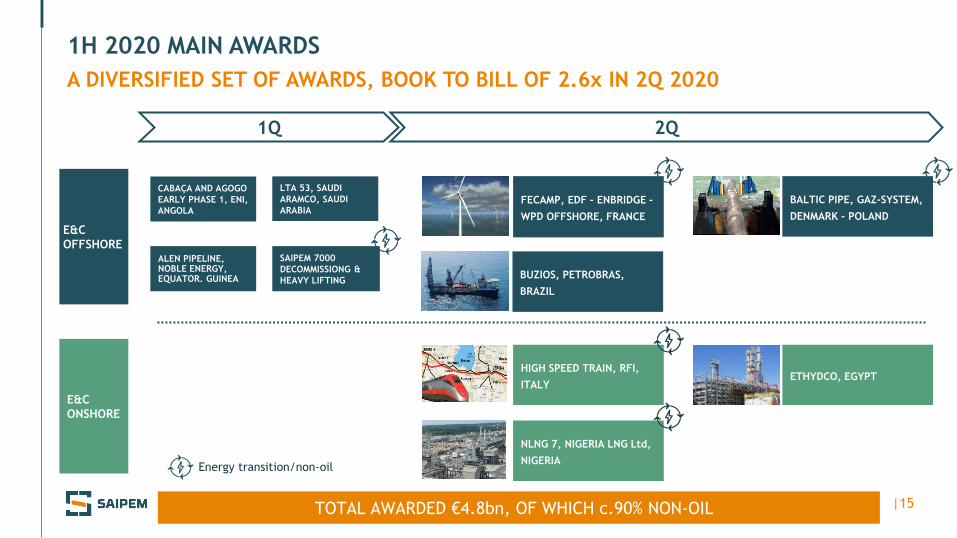
1H 2020 MAIN AWARDS
A DIVERSIFIED SET OF AWARDS, BOOK TO BILL OF 2.6x IN 2Q 2020
TOTAL AWARDED €4.8bn, OF WHICH c.90% NON-OIL
2Q
LTA 53, SAUDI
ARAMCO, SAUDI
ARABIA
ALEN PIPELINE, NOBLE ENERGY, EQUATOR. GUINEA
SAIPEM 7000
DECOMMISSIONG &
HEAVY LIFTING
CABAÇA AND AGOGO
EARLY PHASE 1, ENI,
ANGOLA
1Q
HIGH SPEED TRAIN, RFI,
ITALYETHYDCO, EGYPT
BALTIC PIPE, GAZ-SYSTEM,
DENMARK - POLAND
FECAMP, EDF - ENBRIDGE -
WPD OFFSHORE, FRANCE
NLNG 7, NIGERIA LNG Ltd,
NIGERIA
BUZIOS, PETROBRAS,
BRAZIL
E&C
OFFSHORE
E&C
ONSHORE
Energy transition/non-oil

|16
E&C OFFSHORE – 1H 2020 BUSINESS EVOLUTION
ALL CURRENT PROJECTS ARE PROGRESSING, NO BACKLOG CANCELLATIONS
STRATEGIC
PRIORITIES
ONGOING
OPERATIONS
▪ Prolonged crew shifts, strict protocols and health monitoring
▪ Main impacts on project schedules, triggered by:• Constraints in moving people and supplies
• Slower yard activity
• Some schedule postponement by clients
▪ Covid-19 direct impact on operations in 2Q, yet learned how to minimize effects
KEY
EFFICIENCY
ACTIONS
▪ Asset:• Costs optimization of vessels and yards (e.g. cold/warm stacking)
• Scrap of some old units
▪ Reduction of G&A and FTE
▪ Review of local footprint
▪ Cross-divisional synergy on engineering workforce
▪ Capex reduction
SOLUTIONSCORE “GREEN”
Energy transition/non-oil

|17
OCEANS AND SEAS ARE OUR HABITAT
OFFSHORE EXPERTISE KEY TO FUTURE ENERGY SOURCES
OFFSHORE WIND
TARGETING A BROADER SPECTRUM OF TECHNOLOGIES
TODAY TOMORROW
FLOATING WIND
FLOATING SOLAR MARINE WAVES
OFFSET INSTALLATION
EQUIPMENT
HIGH ALTITUDE WINDEXPLORING
NEW
SOLUTIONSSUBSEA RESCUE
HYDRONE

|18
E&C ONSHORE - 1H 2020 BUSINESS EVOLUTION
ALL CURRENT PROJECTS ARE PROGRESSING, NO BACKLOG CANCELLATION
STRATEGIC
PRIORITIES
ONGOING
OPERATIONS
▪ Significant awards in 1H
▪ Quick and effective response on working sites mitigated the impact on operations• Able to take additional actions
• Leveraging on pilot cases (e.g. Tangguh) to capitalize our learning curve
• Mozambique area 1 site now re-manned, back to pre-Covid-19 workforce level
• Arctic LNG2 quickly recovered full workforce level
• Further strengthening relationship with key clients and suppliers
▪ Main impacts:• 2Q directly affected by Covid-19 constraints at working sites
• Material shifting of some project schedule agreed with clients in Middle East, but no backlog cancellation
KEY
EFFICIENCY
ACTIONS
▪ Supply chain: revisiting commercial conditions (e.g. pricing)
▪ Reducing contingent expenses: travels, external services, consultancies and G&A
IGITALIZEECARBONIZEIVERSIFY
Energy transition/non-oil
|19
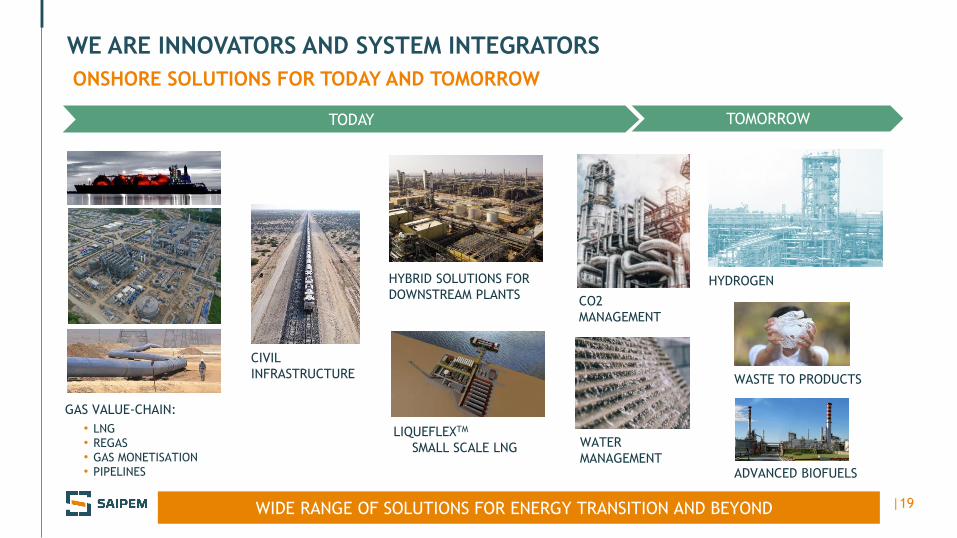
WE ARE INNOVATORS AND SYSTEM INTEGRATORS
ONSHORE SOLUTIONS FOR TODAY AND TOMORROW
WIDE RANGE OF SOLUTIONS FOR ENERGY TRANSITION AND BEYOND
TODAY TOMORROW
GAS VALUE-CHAIN:
• LNG
• REGAS
• GAS MONETISATION
• PIPELINES ADVANCED BIOFUELS
WASTE TO PRODUCTS
HYDROGEN
LIQUEFLEXTM
SMALL SCALE LNG
HYBRID SOLUTIONS FOR
DOWNSTREAM PLANTS
CIVIL
INFRASTRUCTURE
CO2
MANAGEMENT
WATER
MANAGEMENT

|20
Americas Onshore
Downstream
FloatersAfrica Onshore
Downstream
Floaters
Infrastructures
Renewables & green
€1.8 bn
Middle East Onshore
LNG
Upstream €3.4 bn
E&C OPPORTUNITIESSAME VISIBILITY, OVER A LONGER TIME SPAN
APPROXIMATELY €21bn E&C OPPORTUNITIES: €10bn OFFSHORE, €11bn ONSHORE
Asia Pacific Onshore
€1.0bn
Downstream
Upstream
LNG
€2.1 bn
Subsea
Fixed facilities &
conventional SW
Americas Offshore
Middle East OffshoreAfrica OffshoreAsia Pacific Offshore
Fixed facilities
Pipelines
Subsea
€2.0 bn
Fixed Facilities &
conventional SW
Pipelines
€4.3 bn
Subsea
Fixed Facilities€0.8 bn
€2.3bn
Europe/CIS & Central Asia Onshore
Europe/CIS & Central Asia Offshore
Renewables & green
Pipelines€0.8 bn
Downstream
Infrastructures€2.0 bn

|21
▪ Innovation to enhance energy
transition & decarbonization
▪ Focus on technological
disruptive solutions
▪ Design for sustainable
innovation
XSIGHT
OUR APPROACH TO EARLY ENGAGEMENT
CROSS-DIVISIONAL INNOVATION ENGINE, POINTING THE WAY
▪ Floating solar panel park agreement with Equinor
▪ Co-development agreement for offshore wind farm and floating solar farm
in Italy (Seagul, Quint’x, Politecnico di Torino)
▪ MoU with CDP for the energy transition
▪ Hydrogen: green hydrogen production, hydrogen storage and transportation
(e.g. injection into grids) and utilization (in-house research Moss Maritime)
▪ Cracks monitoring technology with coherent fiber optic. Various applications
(e.g. O&G, infrastructures) (Politecnico di Milano)
SOME EXAMPLES:
Energy transition

|22
DRILLING OFFSHORE - 1H 2020 BUSINESS EVOLUTION
THROUGH CYCLE FLEET MANAGEMENT
STRATEGIC
PRIORITIES▪ Opportunistic approach and flexibility to consider external growth (e.g. financially distressed assets)
ONGOING
OPERATIONS
▪ Prolonged crew shifts secured execution
▪ Strict protocols and health monitoring minimized risk of infection onboard the fleet
▪ Deepwater activity postponement with no disruption to backlog
▪ SC8 semisub engagement initially cancelled, now renegotiated
▪ Contract cancellation for PN8 jackup from 2021
▪ TAD fully devaluated
KEY
EFFICIENCY
ACTIONS
▪ Asset management:• Scrap (green recycle) of two jackups PN2, PN5 (to be replaced by leased-PN9) and of one semisub SC7
• Smart stacking for rigs with reduced operations
• Lease rate reduced for rented vessels
▪ Personnel on board (POB) rightsizing, maintenance plan and inventory optimisation
▪ Supply chain: revisiting commercial conditions
▪ Structural cost optimisation (e.g. local offices and logistic bases)

|23
OFFSHORE DRILLING FLEET
*ENGAGEMENT FOR
PRODUCTION SUPPORT
**LEASED VESSEL
***TO BE SCRAPPED
2020 2021 2022
Committed Optional periodStand-by rate New awards in 2Q
Eni Mozambique
Eni Egypt, Worldwide
GSP Romania
Wintershall,
Vår EnergiNorway
Eni Angola
ADNOC UAE
Saudi Aramco Saudi Arabia
Eni Mexico
Saudi Aramco Saudi Arabia
Saudi Aramco Saudi Arabia
Petrobel Egypt
ULTRA
DEEP-W
ATER a
nd
HARSH
EN
V.
HI
SPEC
DEEP-W.
SHALLO
W-W
ATER
STA
ND
AR
D
Saipem 12000
Saipem 10000
Scarabeo 9
Scarabeo 8
Scarabeo 5*
Perro Negro 8
Perro Negro 7
Pioneer**
Sea Lion 7**
PN 5*** \
Perro Negro 9**
Perro Negro 4
TO 2024>
TO 2023>
TO 2023>
PN9
TO 2023>
TO 2023>
PN5

|24
DRILLING ONSHORE - 1H 2020 BUSINESS EVOLUTION
THROUGH CYCLE FLEET MANAGEMENT
STRATEGIC
PRIORITIES▪ Continuing to pursue strategic options to ensure business continuity and long-term resilience
ONGOING
OPERATIONS
▪ Prolonged crew shifts secured execution
▪ Activity suspension for certain rigs with no impact to backlog
▪ Some contract renewed in Middle East
▪ Pricing pressure by some clients
▪ Delays in the start up of new rigs in Latin America
KEY
EFFICIENCY
ACTIONS
▪ Fleet rightsizing and inventory optimisation
▪ Revisiting partnership with clients and supply chain
▪ Optimisation of geographical footprint (e.g. logistic bases, offices and workforce)
▪ Agile organization through process redesign

|25
ONSHORE DRILLING FLEET
FLEET @ JUNE 30, 2020: 83 RIGS
UTILISATION RATE
1H 2020 AVERAGE1: 51%
1 Simple average: # days sold / # days available for sale; till Q4 2019 weighted average, defined as # days sold weighted by technical specifications
(e.g. higher HP = higher weight) / # days available for sale
AMERICAS47 RIGS
UTILISATION RATE
AVERAGE1: 22%
EMEA36 RIGS
UTILISATION RATE
AVERAGE1 : 90%
|26
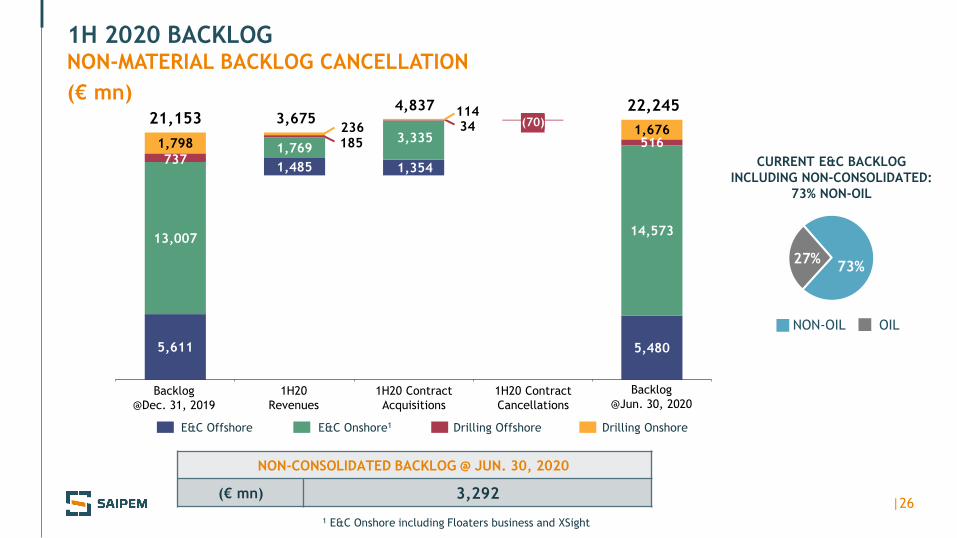
1H 2020 BACKLOG
(€ mn)
5,611
1,485 1,354
5,480
13,007
1,7693,335
14,573
737
185
34 70
5161,798
236
114
1,676(70)
Backlog
@Jun. 30, 2020Backlog
@Dec. 31, 2019
1H20
Revenues
1H20 Contract
Acquisitions
3,67521,1534,837 22,245
E&C Onshore1 Drilling OffshoreE&C Offshore Drilling Onshore
1 E&C Onshore including Floaters business and XSight
(€ mn) 3,292
NON-CONSOLIDATED BACKLOG @ JUN. 30, 2020
73%27%
CURRENT E&C BACKLOG
INCLUDING NON-CONSOLIDATED:
73% NON-OIL
NON-OIL OIL
NON-MATERIAL BACKLOG CANCELLATION
1H20 Contract
Cancellations
|27
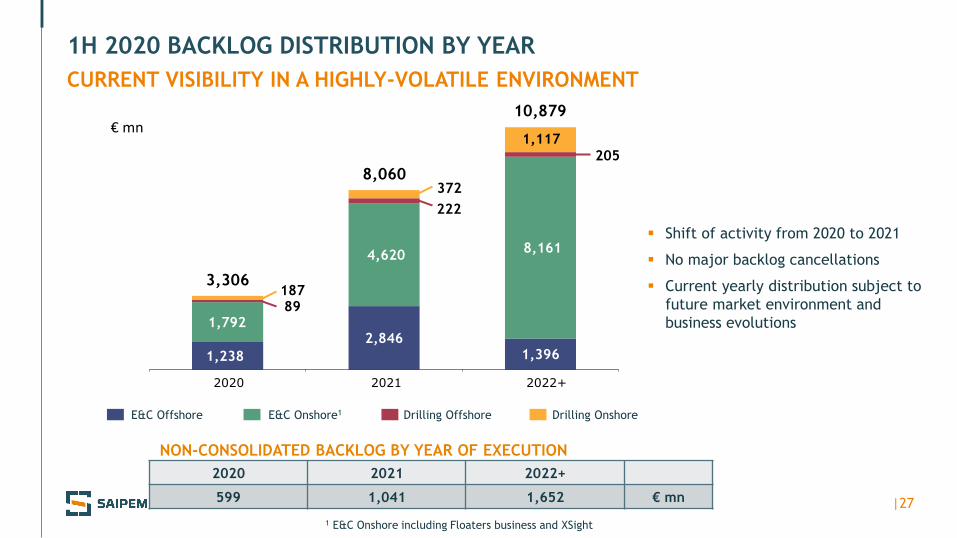
1H 2020 BACKLOG DISTRIBUTION BY YEAR
CURRENT VISIBILITY IN A HIGHLY-VOLATILE ENVIRONMENT
1 E&C Onshore including Floaters business and XSight
2020 2021 2022+
NON-CONSOLIDATED BACKLOG BY YEAR OF EXECUTION
2020 2021 2022+
599 1,041 1,652 € mn
1,238
2,8461,396
1,792
4,620 8,161
89
222
205
187
372
1,117
8,060
3,306
10,879
E&C Onshore1 Drilling OffshoreE&C Offshore Drilling Onshore
▪ Shift of activity from 2020 to 2021
▪ No major backlog cancellations
▪ Current yearly distribution subject to
future market environment and
business evolutions
€ mn

BUSINESS OUTLOOK AND
CLOSING REMARKS

|29
BUSINESS OUTLOOK1
1 Business outlook does not factor further and possible material business deterioration from Covid-19
▪ Business outlook remains impacted by the Covid-19, albeit backlog provides support
to 2H 2020 volumes, expected broadly in line with 1H
▪ In a still challenging environment, efficiency actions of c.€190mn in FY 2020 are
expected to support 2H group adj. EBITDA margin up to the level of 1H
▪ Immediate rephasing actions should result in capex below €400mn in FY 2020

|30
CLOSING REMARKS
OPEX EFFICIENCY AND CAPEX REPHASING TO SUPPORT 2020
NAVIGATING SAFELY THROUGH THE CRISIS
OPERATIONS PROGRESSING DESPITE COVID-19 CHALLENGES
HEALTH AND SAFETY TOP PRIORITY
SOLID BALANCE SHEET, LIQUIDITY AND BACKLOG
GOOD VISIBILITY ON OPPORTUNITIES OVER A LONGER TIME SPAN

APPENDIX

|32
53 61 36
148
298
50 6641
156
313
OffshoreDrilling
OnshoreDrilling
E&COnshore
E&COffshore
TotalD&A
1H 2020 RESULTS – D&A, FINANCE CHARGES AND TAXES
D&A
TAXES
FINANCIAL
CHARGES
1H 2020
1H 2019
▪ Taxes at € 74mn
▪ 2H 2020 expected in line with 1H 2020
1 Floaters business included in E&C Onshore 2 Including €14mn of IFRS16 impact3 Including exchange differences for € -12mn
(€ mn – IFRS16)
D&A€ mn
1
80 95 15
Financing costs Project hedgingcosts
Finance charges3
2
1H 2020
€ mn

|33
11.0% 7.7%
2Q 2020 RESULTS
QoQ TREND (€ mn – IFRS16)
Adjusted EBITDA1Revenues Adjusted Net Income1
1,503
2Q201Q202Q201Q20
2Q201Q20
240
115
margin2,172
(123)(9)
1 Not including special items
|34
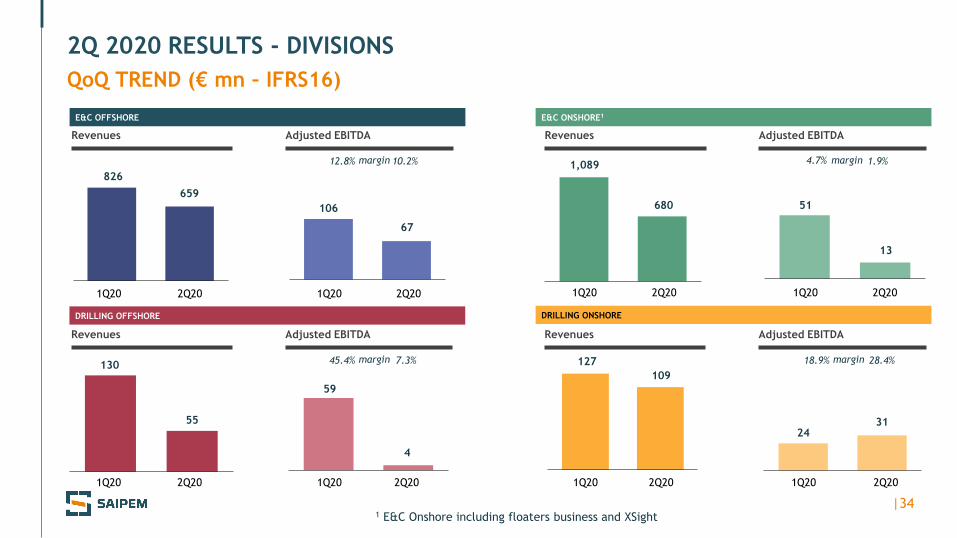
2Q 2020 RESULTS - DIVISIONS
QoQ TREND (€ mn – IFRS16)
1 E&C Onshore including floaters business and XSight
2Q201Q202Q201Q20
Adjusted EBITDARevenues
E&C OFFSHORE
2Q201Q202Q201Q20
E&C ONSHORE1
2Q201Q202Q201Q20
DRILLING OFFSHORE
2Q201Q202Q201Q20
DRILLING ONSHORE
1,089
680 51
13
55
130
4
59
127
109
2431
659
826
106
67
12.8% 10.2%margin 4.7% 1.9%margin
45.4% 7.3%margin 18.9% 28.4%margin
Adjusted EBITDARevenues
Adjusted EBITDARevenues Adjusted EBITDARevenues