2012 HALF YEAR RESULTS - RNS · PDF file2012 HALF YEAR RESULTS Incorporating the requirements...
165
2012 HALF YEAR RESULTS Incorporating the requirements of Appendix 4D This half year results announcement incorporates the half year report given to the Australian Securities Exchange (ASX) under Listing Rule 4.2A. This half year consolidated report is to be read in conjunction with the annual financial report 2011. National Australia Bank Limited ABN 12 004 044 937 (the ‘Company’) .
Transcript of 2012 HALF YEAR RESULTS - RNS · PDF file2012 HALF YEAR RESULTS Incorporating the requirements...

2012HALF YEAR
RESULTSIncorporating the requirements of Appendix 4D
This half year results announcement incorporates the half year report given to the Australian Securities Exchange (ASX) under Listing Rule 4.2A.
This half year consolidated report is to be read in conjunction with the annual financial report 2011.
National Australia Bank Limited ABN 12 004 044 937 (the ‘Company’)
.

Half Year Results
2012This page has been left blank intentionally.

Results for announcement to the marketReport for the half year ended 31 March 2012
page 82 up 8.1% * to 8,960
down 15.5% * to 2,052
down 15.5% * to 2,052
90 100
6 June 2012
Highlights (3)
Group cash earnings
Cash return on equity (ROE)
Diluted cash earnings per share (cents)
Banking cost to income ratio
Tier 1 capital ratio
Full time equivalent employees
Full time equivalent employees decreased to 43,399 driven by continued focus on efficiency programs partly offset by investment in key initiatives to support business growth.
1,894
15.0%
6.0%
210 bps
125.1
down
up 98 bps
down
Record date for determining entitlements to the final dividend
up Cash earnings of $2,828 million for the March 2012 half year increased by $160 million or 6.0% on the March 2011 half year. This was largely driven by stronger performances in Business Banking, Personal Banking, Wholesale Banking and NZ Banking, offset by weaker results in UK Banking and Specialised Group Assets (SGA) primarily due to higher bad and doubtful debt charges. The difference between cash earnings and statutory net profit attributable to the owners of the Company was primarily due to charges relating to the outcomes of the UK Banking strategic review referred to in the ASX announcement dated 30 April 2012, and accelerated hedging costs on SCDOs. Refer to note on cash earnings on page 13.
Interim dividend
Net profit attributable to owners of the Company (2)
page 82
page 82
Revenue from ordinary activities (1)
Profit after tax from ordinary activities attributable to owners of the Company
A reference in this Appendix 4D to the 'Group' is a reference to the Company and its controlled entities. All currency amounts are expressed in Australian dollars unless otherwise stated. References in this document to the March 2012 half year are references to the six months ended 31 March 2012. Other six month periods are referred to in a corresponding manner. National Australia Bank Limited's half year consolidated financial report and directors' report, prepared in accordance with the Corporations Act 2001 (Cth), is located in Section 5.
Cash ROE decreased by 10 basis points. down to
up to Diluted cash earnings per share increased by 2.5%.
The Tier 1 capital ratio has increased to 10.17%. It remains above the Group's target.
The Group’s banking cost to income ratio improved by 210 basis points to 41.8%.

Half Year Results
2012This page has been left blank intentionally.

i
Half Year Results
2012Table of ContentsSection 2
HighlightsGroup Performance 2
Net Profit Attributable to Owners of the Company 2Shareholder Returns 2Earnings per Share 2Strategic Highlights & Business Developments 2Key Performance Measures 5Group Performance Indicators 5Group Results 6
Divisional Performance 7Divisional Results 7Divisional Performance Indicators 7
Section 3
Review of Operating Environment, Group Operations and ResultsReview of Group Operating Environment 10Review of Group Operations and Results 12Full Time Equivalent Employees 20Investment Spend 21Taxation 21Non-cash Earnings Items 22Lending 23Goodwill and Other Intangible Assets 24Retail Deposits 25Asset Quality 26Capital Management and Funding 31Other Matters 35
Section 4
Review of Divisional Operations and ResultsDivisional Performance Summary 38Business Banking 42Personal Banking 46Wholesale Banking 50NAB Wealth 54NZ Banking 62UK Banking 66Great Western Bank 70Specialised Group Assets 74Corporate Functions and Other 78
Section 5
Financial ReportReport of the Directors 80Consolidated Financial Statements 82Notes to the Consolidated Financial Statements 88Directors’ Declaration 110Independent Review Report 111
Section 6
Supplementary Information 113
Section 7
Glossary of Terms 149

Half Year Results
2012
ii
This page has been left blank intentionally.
Wissi eum zzrilitHalf Year Results
2012
i
National Australia Bank Limited ABN 12 004 044 937 800 Bourke Street Docklands Victoria 3008 AUSTRALIA www.nabgroup.com
ASX ANNOUNCEMENT Thursday, 10 May 2012
NAB 2012 Half Year Results Solid result and progress against strategic agenda Key PointsThe 31 March 2012 half year results are compared with 31 March 2011 half year results unless otherwise stated.
• On a statutory basis, net profit attributable to owners of the Company1 was $2.052 billion, a decrease of $376 million or 15.5%. The difference between net profit attributable to the owners of the company and cash earnings was primarily due to the charges relating to the outcomes of the UK Banking strategic review referred to in the ASX Announcement dated 30 April 2012, and accelerated amortisation of hedging costs on exited SCDO assets.
• On a cash earnings2 basis:
• Cash earnings were $2.828 billion, an increase of $160 million or 6.0%, largely due to strong results in Wholesale Banking and NZ Banking, and higher earnings in Business Banking and Personal Banking. This was a solid result, particularly considering the increasingly difficult operating conditions for UK Banking during the period. Challenging economic conditions, subdued credit growth, and a full regulatory agenda presented challenges across the industry and the Group.
• Revenue grew by 3.5% to $9.108 billion, an outcome reflecting subdued credit demand and higher funding costs. The growth was primarily driven by Wholesale Banking. Business Banking, Personal Banking and NZ Banking also had higher revenue, having recorded volume growth ahead of system.
• Net interest margin decreased by 6 basis points, largely as a result of higher wholesale and deposit funding costs.
• The Group again delivered positive ‘jaws’ with revenue continuing to grow faster than expenses. Costs were lower than in both the previous half and the prior corresponding period.
• The charge to provide for bad and doubtful debts was $1.131 billion3, an increase of $143 million or 14.5%, primarily due to higher charges in UK Banking as a result of the further economic downturn, and increases in the specific provision for the SGA leveraged finance and commercial property portfolios. However, in aggregate, asset quality metrics were generally improved.
• Balance sheet strength remained a focus, with sound capital, funding and liquidity positions being maintained. During the half, the Group raised $14.455 billion of term wholesale funding (including secured funding).
• The Stable Funding Index was 85% compared with 84% at March 2011. The Group’s capital position also improved, with the Tier 1 ratio at 10.17% from 9.19% at March
1 Reviewed in accordance with Australian Auditing Standards2 Refer to note on cash earnings on page 6 of this document 3 On a statutory basis, bad and doubtful debts were $1.321 billion. The difference between the charge for bad and doubtful debts on a statutory basis and the charge for bad and doubtful debts on a cash earnings basis mainly relates to a charge arising from a default of two of the Group’s SCDO’s for which the Group has received off-setting compensation.

Wissi eum zzrilit Half Year Results
2012
ii
2
2011. Cash return on equity was 15.0%, a decrease of 10 basis points. The core tier 1 ratio was 8.03%.
• The interim dividend is 90 cents per share fully franked, an increase of 6 cents per share on the prior interim dividend.
• NAB continues to make progress on its corporate responsibility agenda and in March 2012, NAB was named as an Equal Opportunity for Women in the Workplace Agency(EOWA) Employer of Choice for Women for the sixth year in a row.
Executive Commentary
“The Group continues to make progress against its strategic agenda and transform the way it does business,” NAB Group Executive Officer, Cameron Clyne, said today.
“The Australian franchise continued to perform well and market share was further strengthened during the period, despite an increasingly competitive environment. Business Banking maintained its position as Australia’s leading business lender with a 70 basis point increase in market share reflecting its focus on supporting customers in all market conditions and strong relationship banking model. Personal Banking continued to benefit from its differentiated customer proposition, increasing its market share of home lending by 90 basis points. We have reiterated our commitment to maintain the lowest standard variable rate of the major Australian banks for 2012, and customer satisfaction is now at the highest level in 15 years4.
“Revenue momentum, sound cost management, and strong capital generation were key features of the Group’s half-year performance. This was despite a challenging operating environment characterised by higher funding costs and subdued credit growth across all markets, and particularly difficult economic conditions in the UK.
“Wholesale Banking performed strongly, as momentum from the franchise focused strategy produced higher sales of risk management products to Group customers and Specialised Finance also performed well.
“Despite sluggish investment markets and an increase in insurance lapses, NAB Wealth grew both funds under management and premiums inforce. The business continued to invest in the development of new products and services during the half, releasing a new insurance product, MLC Insurance, and a refresh of MasterKey fundamentals. Adviser numbers grew, with 84 net new advisers joining aligned networks. Costs were tightly managed.
“New Zealand Banking performed strongly, with improved market share across most categories.
“Great Western Bank moved to further strengthen its presence in Iowa, the second largest agricultural producing state in the US.
“SGA risk weighted assets were significantly reduced with the removal of the economic risk on the remaining two Synthetic Collateralised Debt Obligations.
“During the period the Group maintained its focus on balance sheet strength and further improved its capital and funding ratios. Cost growth was managed to below revenue growth in spite of subdued market conditions and the ongoing technology investment program, and the Group remains committed to pursuing sustainable productivity improvements.
“NAB is well positioned to continue to achieve its overall objective of delivering sustainable, satisfactory shareholder returns, despite an uncertain outlook,” he said.
4 Roy Morgan Research, Australians 14+
Wissi eum zzrilitHalf Year Results
2012
iii
3
Business Commentary
Business Banking Cash earnings increased by $83 million or 7.0%, despite higher funding costs and lower demand for credit. Income from sales of risk management products increased, reflecting improvements in cross-sell with Wholesale Banking.
Business Banking retained its position as Australia’s leading business lender with a 70 basis points increase in market share5, reflecting the strength of its relationship focused banking model. Average retail deposits also grew by $10.7 billion or 12.8%.
Net interest margin declined by 1 basis point due to higher funding and deposit costs, partly offset by repricing of the lending portfolio.
Operational efficiencies and effective expense management drove a reduction in expenses of $4 million or 0.5%.
The asset quality of the portfolio was broadly stable and the charge for bad and doubtful debts fell by $13 million or 3.4%.
Personal Banking Cash earnings increased by $32 million or 7.4% due to strong volume growth over the year and good cost management, despite continued pressure on the net interest margin. The net interest margin decreased by 20 basis points, reflecting increases in funding and deposit costs, and changes in mix, as momentum in home lending continued, although partially offset by repricing.
Over the period Personal Banking continued to increase market share in housing lending6
and household deposits7,despite a competitive market. Improving the customer experience remained a key focus and this was reflected in further improvements in customer satisfaction.
The increase in the charge to provide for bad and doubtful debts has been small, despite the growth in home lending volumes, as a result of continued improvements in loan origination quality.
Wholesale Banking Cash earnings increased strongly by $125 million or 31.8% due to an increase in revenue in both the customer and risk businesses.
All businesses contributed to an increase in revenue, which was up by $222 million or 22.3%, with costs up only 2.0% (costs fell excluding performance based remuneration), demonstrating strong cost management and operational efficiencies. There was improved performance in the customer businesses as the cross-sell agenda continued to gain traction, bringing higher sales of risk management products to Group customers. Specialised Finance performed well in infrastructure, energy and utilities, building on the positive momentum from the prior year. The Capital Markets business provided innovative funding solutions by taking clients direct to global capital markets and, with the Financial Institutions Group, developed a number of innovative deposit products for the Superannuation industry. Risk income also increased, following sluggish performance in the second half of 2011, with improved performances in both Treasury and trading.
The charge to provide for bad and doubtful debts was higher, mainly due to provisions raised against two customers.
5 APRA Banking System, as at March 2012 6 RBA Financial System / NAB including Wholesale Banking, as at March 2012 7 APRA Banking System / NAB including Wholesale Banking, as at March 2012

Wissi eum zzrilit Half Year Results
2012
iv
4
NAB Wealth Cash earnings before IoRE8 were down $10 million or 3.7% compared to March 2011, predominantly the result of an increase in insurance lapses. Compared to the September 2011 half, cash earnings before IoRE were 11.1% higher, despite subdued investment markets and a competitive operating environment. Expenses were tightly managed.
Funds under management (FUM) increased by $4.589 billion or 3.9% as a result of acquisitions in the direct funds management business. This was partially offset by lower discretionary flows from retail and wholesale sources, as investors remained cautious. Inforce premiums grew by 4.0% to $1,493 million. Investment margins were stable, with favourable earnings on the annuities portfolio offset by changes in the business mix.
Adviser interest in NAB Wealth’s progressive business model remains strong and led to an 8.7% increase in aligned advisors since March 2011. The business continued to develop new products and services over the half including the launch of a new insurance product, MLC Insurance, and the acquisition of the direct funds management business, Antares Capital Partners Limited (formerly known as Aviva Investors Australia Ltd).
New Zealand Banking Cash earnings increased by NZ$102 million or 36.0% driven by modest margin improvement, increased volumes and a lower charge to provide for bad and doubtful debts.
BNZ increased its market share in key segments including agribusiness9, while its market share of housing remained stable10. The average volumes of retail deposits also grew strongly, rising by NZ$3.1 billion or 10.2%, further strengthening the balance sheet and growing market share by 70 basis points to 18.7%.
Net interest margin improved by 17 basis points to 2.41% largely due to repricing for market conditions and a favourable product mix, reflecting strong growth in the demand for variable rate mortgages.
The charge to provide for bad and doubtful debts was down NZ$61 million or 64.2% to NZ$34 million due to lower specific provisions on business exposures, strong credit card collections, and an overall improvement in asset quality across the lending portfolio as the economic recovery continues.
United Kingdom Banking UK Banking cash earnings for the first half of the 2012 financial year were a £25 million loss compared to a £77 million profit in the prior corresponding period. UK Banking’s performance was adversely affected by a further deterioration in economic and operating conditions in the region and this has had an effect on asset quality. Results were also affected by an increase in the cost of retail and wholesale funding following Clydesdale Bank’s credit rating downgrades and reflecting higher retail deposit costs.
The Commercial Real Estate (CRE) portfolio was the main driver of the increased charge to provide for bad and doubtful debts in UK Banking, as a result of renewed weakness in the property market and the prolonged economic downturn.
National Australia Bank announced the outcome of its strategic review into UK Banking on 30 April 2012 in response to the downgrade in growth prospects for the UK economy over the last half year, as the commercial property market experiences a “double dip” and the economic recovery stalls. The restructure will simplify the business model of the UK franchise, bringing it back to its core geographies of Scotland and Northern England and improve its balance sheet structure through the transfer and subsequent run-off of commercial real estate assets. These changes are needed to adapt to the changed
8 Investment earnings on shareholders’ retained profits and capital in the life business 9 Reserve Bank of New Zealand data, as at March 201210 Reserve Bank of New Zealand data, as at March 2012

Wissi eum zzrilitHalf Year Results
2012
v
5
operating environment in the UK, and to reposition the UK Banking business to improve returns for the Group over the medium term11.
Great Western Bank Great Western Bank (GWB) cash earnings increased by US$3 million or 6.4% over the half as the business continued to generate growth in lending volumes and credit quality improved, lowering the charge for bad and doubtful debts.
Net interest margin declined by 60 basis points due to increased competition and lower yields on investment securities. GWB remains fully deposit funded.
In March 2012 GWB announced the proposed acquisition of First Federal Savings Bank of Iowa, consistent with GWB’s strategy to grow through strategically aligned, bolt-on acquisitions. The deal remains subject to the necessary approvals.
Specialised Group Assets Specialised Group Assets (SGA) cash earnings fell by $80 million, mainly due to lower mark-to-market gains and a higher charge for bad and doubtful debts as a result of rises in specific provisions. Due to the run-off of the business, expenses decreased by $6 million or 25.0%.
The ongoing performance of the portfolio remains closely linked to the state of the UK and US economies.
As announced on 22 March 2012, National Australia Bank removed the economic risk of the remaining two Synthetic Collateralised Debt Obligations, held as part of the portfolio. There has been a reduction in SGA risk weighted assets of $17.3 billion since September 2009, $7.0 billion of which was achieved during the last six months.
Balance Sheet Commentary
Capital The Group Tier 1 capital ratio of 10.17%, up 98 basis points from March 2011, was consistent with the Group’s objective of maintaining a strong balance sheet. The total capital ratio was 11.52%. Balance sheet strength remains a strategic priority for the Group.
Funding and Liquidity Global wholesale funding market conditions were fragile during the first quarter of the 2012 financial year as the European sovereign debt crisis worsened. While there has been an improvement in market conditions and greater access to funding since then, the market remains vulnerable to further disruptions.
Nevertheless, the Group raised $14.455 billion of term wholesale funding (including secured funding) in the first half of the 2012 financial year. The weighted average maturity of term wholesale funding raised by the Group over the half year to 31 March 2012 was approximately 4.2 years, slightly higher than that of the September 2011 half year of 4.1 years.
The Group maintains well diversified and high quality liquid asset portfolios that are continually reassessed to support regulatory and internal requirements. Total liquid assets held at 31 March 2012 were $90.061 billion.
Group Asset Quality Asset quality metrics have been slightly stronger than at March 2011. The ratio of 90+ days past due loans to gross loans and acceptances was 0.49% at 31 March 2012, compared to 0.55% at 31 March 2011. Excluding the UK, this ratio was 0.45%, 7 basis points lower than March 2011.
11 Details of the outcomes of the UK Banking strategic review are included in the ASX Announcement dated 30 April 2012

6
For further information:
Media Brian Walsh M: +61 (0) 411 227 585
Meaghan Telford M: +61 (0) 457 551 211
Investor Relations Ross Brown M: +61 (0) 477 302 010
Craig Horlin M: +61 (0) 417 372 474
Disclaimer
This announcement contains certain forward-looking statements. The words "anticipate", "believe", "expect", "project",
"estimate", "likely", "intend", "should", "could", "may", "target", "plan" and other similar expressions are intended to identify
forward-looking statements. Indications of, and guidance on, future earnings and financial position and performance are also
forward-looking statements. Such forward-looking statements are not guarantees of future performance and involve known
and unknown risks, uncertainties and other factors, many of which are beyond the control of the Group, which may cause
actual results to differ materially from those expressed or implied in such statements. There can be no assurance that actual
outcomes will not differ materially from these statements. Further information on important factors that could cause actual
results to differ materially from those projected in such statements is contained in the Group’s Annual Financial Report.
Note on Cash Earnings
The Group’s results and Review of Divisional Operations and Results are presented on a cash earnings basis unless otherwise
stated. Cash earnings is a key financial performance measure used by NAB, the investment community and NAB’s Australian
peers with a similar business portfolio. NAB also uses cash earnings for its internal management reporting as it better reflects
what NAB considers to be the underlying performance of the Group. It is not a statutory financial measure and is not presented
in accordance with Australian Accounting Standards nor audited or reviewed in accordance with Australian Auditing Standards.
“Cash earnings” is calculated by excluding some items which are included within the statutory net profit attributable to owners
of the Company. A definition of cash earnings is set out on page 150 of the 2012 Half Year Results Announcement. A
discussion of non-cash earnings items and a full reconciliation of the cash earnings to statutory net profit attributable to owners
of the Company for the March 2012 half year is included on pages 22 and 141 of the 2012 Half Year Results Announcement.
The Group's financial statements, prepared in accordance with the Corporations Act 2001 (Cth) and Australian Accounting
Standards, and reviewed by the auditors in accordance with Australian Auditing Standards, are included in section 5 of the
2012 Half Year Results Announcement.

1
Half Year Results
2012Section 2
Highlights
Group Performance 2
Net Profit Attributable to Owners of the Company 2
Shareholder Returns 2
Earnings per Share 2
Strategic Highlights & Business Developments 2
Key Performance Measures 5
Group Performance Indicators 5
Group Results 6
Divisional Performance 7
Divisional Results 7
Divisional Performance Indicators 7
Half Year Results
2012
2
Highlights
Net Profit Attributable to Owners of the CompanyNet Profit attributable to owners of the Company (statutory net profit) for the March 2012 half year decreased by $739 million or 26.5% against the September 2011 half year, and $376 million or 15.5% against the March 2011 half year. Net Profit attributable to owners of the company is prepared and reviewed in accordance with the Corporations Act 2001 (Cth), Australian Accounting Standards and Australian Auditing Standards.
Shareholder ReturnsThe Group’s cash return on equity has decreased by 10 basis points to 15.0% against the March 2011 half year, or 20 basis points against the September 2011 half year, primarily due to the higher level of capital more than offsetting the benefit from higher earnings.
The interim dividend for March 2012 is 90 cents per share, two cents higher than the September 2011 half year, and six cents higher than the March 2011 half year. This represents a dividend payout ratio of 71.3% for the March 2012 half year on a cash earnings basis. The dividend payment is 100% franked and will be paid on 16 July 2012. Shares will be quoted ex-dividend on 31 May 2012.
Earnings per ShareBasic statutory earnings per share decreased by 35.6 cents or 28.6% and diluted earnings per share decreased by 34.8 cents or 28.2% on the September 2011 half year. This reflects the Group’s decrease in statutory profit.
Basic statutory earnings per share decreased by 20 cents or 18.4% and diluted earnings per share decreased by 19.9 cents or 18.4% on the March 2011 half year. This reflects the Group’s decrease in statutory profit.
Basic cash earnings per share decreased by 0.7 cents or 0.6% and diluted cash earnings per share decreased by 0.6 cents or 0.5% on the September 2011 half year. This reflects the Group’s increase in cash earnings, more than offset by an increase in weighted average number of ordinary shares.
Basic cash earnings per share increased by 3.2 cents or 2.6% and diluted cash earnings per share increased by 3.0 cents or 2.5% on the March 2011 half year. This reflects the Group’s increase in cash earnings, partially offset by an increase in weighted average number of ordinary shares.
Strategic Highlights & Business DevelopmentsThe Group maintains its overall objective to deliver sustainable, satisfactory returns to shareholders. NAB continues to transform the way it does business through the strategic priorities it announced in 2009. These are: - Focusing on the strong Australian franchise and
managing international businesses for value. - Maintaining balance sheet strength. - Reducing cost and complexity. - Enhancing the Group’s reputation.
The Group continued to make good progress on its strategic agenda during the first half of the financial year. A sustained focus on its Australian franchise has resulted in market share gains in Personal Banking and Business Banking and improved the performance of Wholesale Banking and NAB Wealth (formerly known as MLC & NAB Wealth). Despite challenging conditions in global debt markets, balance sheet strength was maintained with sound capital, funding and liquidity positions. The Group continues to manage to positive ‘Jaws’ between revenue and expense growth and has maintained a disciplined approach to managing expenses. Good progress has been made in the Group’s technology transformation and its initiatives to enhance its reputation and further differentiate itself from industry peers.
Earnings growth, revenue momentum and sound cost management were key features of the Group’s half year performance, despite what continues to be a challenging operating environment. This has ensured that the Group remains well positioned despite an uncertain outlook in the foreseeable future.
Strategic highlights for the March 2012 half year include:
Focusing on the strong Australian franchise and managing international businesses for valueThe Australian franchise continued to perform well and was further strengthened during the period.
Business Banking maintained its position as Australia’s leading business lender by market share and delivered stable revenues, despite low credit growth and an increased cost of funds. Its focus on deepening customer relationships contributed to lending(1) and deposit(2) market share gains of 50 and 30 basis points respectively. Improving efficiency remained a priority with new measures put in place to allow bankers to spend more time with customers. Good progress was made on cross-sell initiatives, with sales of risk management products sold through Wholesale Banking growing during the half year.
Personal Banking continued to deliver strong results through its differentiated customer proposition and its commitment to being the bank that offers fair value to customers. Personal Banking’s home lending growth was 2.2 times system(3) over the half year increasing NAB’s market share by 17 basis points. Strong momentum in transaction accounts continued with net new account growth of 150,000 during the half year. There was also strong growth in retail deposits, up 7.2% from the September 2011 half year. Personal Banking’s differentiated customer proposition also resulted in a 7.4% growth in customer numbers over the half year and strong improvements in customer satisfaction with NAB widening its lead on the peer average customer satisfaction result from 0.3% to 0.8%(4), the highest increase amongst the majors, and achieving its highest ever Main Financial Institution (MFI) result during that period. NAB was awarded a series of Money Magazine’s Best of the Best(1) RBA Financial System - March 2012.(2) APRA Banking System.(3) RBA Financial System/ NAB including Wholesale Banking Data.(4) Roy Morgan Research, Australians 14+, 6 month moving average. NAB
compared to ANZ, Commonwealth and Westpac.
Group PerformanceCameron Clyne

Half Year Results
2012
3
Highlights
Awards. Homeside Lending won the ‘Cheapest Home Loan Packages’ award, and for the third year running, UBank won the award for ‘Best Term Deposits - Short Term’ and ‘Best Savings Accounts - Regular Deposit’.
NAB Wealth maintained its position in superannuation, insurance and private wealth, and continued to grow its presence in direct asset management. The level of claims improved over the half year following investments in technology and claims management resources. The Investment Platforms business was strengthened by the refresh of the core MasterKey Fundamentals offering and the migration of MasterKey Custom to the new discretionary investment platform, MLC Wrap. The asset management footprint expanded with the integration of Antares Capital Partners Limited (formerly known as Aviva Investors Australia Limited) and taking an equity stake in Redpoint Investment Management. Improving cross-sell with other parts of the Group remains a priority with a number of successful pilots now being rolled out more broadly across the bank. The businesses continued to grow adviser numbers as 32 new advisers joined aligned networks, reflecting both the strength of NAB’s licensee offering and its preparedness for the new Future of Financial Advice (FoFA) reforms.
The ongoing success of Wholesale Banking’s franchise focus strategy was demonstrated by revenue growth of 42% and strong sales of risk management products through Business Banking over the half year. Fixed Income, Currencies and Commodities (FICC) was also well positioned to take advantage of interest rate and foreign exchange market movements with increased customer flow. Wholesale Banking deepened penetration into the insurance, superannuation and fund sectors by leveraging its market position in Asset Servicing and its strong relationships held through the Financial Institutions franchise. Momentum in Debt Capital Markets continues to build with a number of key syndicated loan and securitisation transactions closed during the period, including a NAB covered bond issuance. Wholesale Banking strengthened its position in the infrastructure and natural resources sector, winning a series of pivotal deals by providing a broader commercial proposition to clients through its strong advisory capabilities and by widening cross-sell opportunities. The Group also maintained its position as a leading arranger to renewable power projects in Australia.
New Zealand Banking’s strong performance for the half year reflects ongoing commitment to improving the customer experience through innovation, with BNZ winning the CANSTAR Innovation award for the second consecutive year. BNZ’s continued focus on supporting local businesses saw the March opening of its Russley Partners Centre in Christchurch. The Centre reflects the Bank’s most significant investment in Christchurch to date and will provide an unparalleled offering for businesses in the area. BNZ’s customer-centred approach has contributed to growth in core lending volumes and improved market share in certain key segments. Balance sheet strength remains a priority which is reflected in 5.3% growth in customer deposits and the raising of $NZ2.8 billion wholesale term funding during the period.
Operating conditions remain challenging for United Kingdom Banking. Earnings were lower, largely reflecting increased funding costs and a deterioration in credit quality. The ongoing sovereign debt crisis in the Eurozone and the continuing austerity of the UK government suggests that the UK economy is likely to
experience a prolonged period of subdued growth. The Group announced the outcome of the strategic review of UK Banking on 30 April 2012. The main outcomes of the review are to: - Simplify the business model to focus on retail
operations and SME business lending in Scotland and Northern England.
- Improve the UK Banking balance sheet structure by transferring the vast majority of its commercial real estate assets to NAB in the first half of the 2013 financial year.
- Place the transferred portfolio into run-off, to be managed separately.
Great Western Bank (GWB) continues to explore financially attractive opportunities for inorganic growth in selected markets and announced its entry into a merger agreement to acquire First Federal Savings Bank of Iowa. Whilst not a material acquisition for the Group, this acquisition increases the presence of GWB in Iowa, the second largest agricultural producing state in the US and a key target market. In addition, GWB delivered positive organic loan growth over the period and remains fully deposit funded.
Maintaining Balance Sheet Strength The Group held its focus on balance sheet strength and further improved its capital ratios over the period. This was achieved through an ongoing focus on capital efficiency. The Group’s capital position improved with the Tier 1 ratio at 10.17% compared to 9.70% as at 30 September 2011. Despite difficult conditions in global debt markets, it successfully executed its funding program and accessed a diverse range of funding sources. During the March 2012 half year, NAB has raised approximately $14.5 billion of term wholesale funding (including approximately $3.6 billion of covered bonds) and the Stable Funding Index (SFI) at 31 March 2012 was unchanged from its 30 September 2011 level of 85%. Conservative liquidity settings were maintained. The balance sheet is moving towards Basel III compliance through a combination of growth, composition and maturity levers. Examples of the initiatives include aligning asset growth with deposit growth, reshaping the deposit book through product innovation, improving both the quality and quantity of the liquid asset portfolio, and extending the duration of short term wholesale funding.
Reducing Cost and ComplexityThe Group remains committed to carefully managing expenses and aggressively pursuing sustainable productivity improvements. Positive ‘Jaws’ of 4.4% were achieved in the sequential half as revenue continued to grow faster than expenses, in spite of subdued market conditions. The decrease in expenses for the sequential half year was 0.8%. The Group has made significant progress on its Kaizen@NAB agenda in order to reduce process complexity and improve its customer experience, while continuing to invest in core infrastructure projects.
Ongoing process simplification activities have underpinned significant increases in customer satisfaction. The transformation of the Group’s technology operations environment gathered momentum and is on track to deliver improvements in cost efficiency and a reduction in operational risk. Notably, the Group’s Next Generation Banking IT platform has successfully implemented a major foundational release of a broad set of underlying application components.
Half Year Results
2012
4
Highlights
Enhancing the Group’s ReputationThe Group is making significant progress in enhancing its reputation relative to peers. For the first time since the Sweeney Research Brand Tracker program began, NAB is ahead of the peer average on the reported brand perception metrics. Last years “Break Up” Campaign has received more accolades, most notably at the Australian Direct Marketing Association Awards. NAB took home the ‘best of the best’ ADMA Grand Prix award, as well as the Gold award for Creative Campaign and the Silver award for Effectiveness: Lending and Credit. NAB also won the Australian Human Resources Institute Wayne Cascio Award for Organisational Development and Leadership for its work in developing and executing the Personal Banking Capability Strategy.
NAB’s ongoing commitment to creating a diverse and inclusive Workplace was demonstrated by NAB being recognised for the sixth year in a row as an Equal Opportunity for Women in the Workplace Agency (EOWA) Employer of Choice for Women. Employee engagement initiatives continued over the March 2012 half year, reflecting an ongoing focus on developing employees to realise their full potential. NAB continued the opening of its five virtual learning studios to make learning more accessible to employees in rural and regional areas. These will also deliver cost and productivity efficiencies by reducing the travel time and expenses associated with face-to-face learning.
As part of the Group’s continuing commitment to addressing its broader responsibility to society, the Academy and the Group’s Corporate Responsibility function are leading NAB’s commitment to support projects that create both positive social impacts and deliver financial returns. Strengthening efforts to manage its environmental impact, NAB is now one of two launch signatories to the United Nations Environment Program Finance Initiative (UNEP FI) ‘National Capital Declaration’. The Declaration commits signatories to working towards integrating natural capital considerations into risk management, product and service development, and transactions with customers and suppliers. NAB is well positioned for these commitments as it has developed a preliminary understanding of environmental risks and opportunities and participated in UNEP FI projects related to understanding natural capital risk.
Half Year Results
2012
5
Highlights
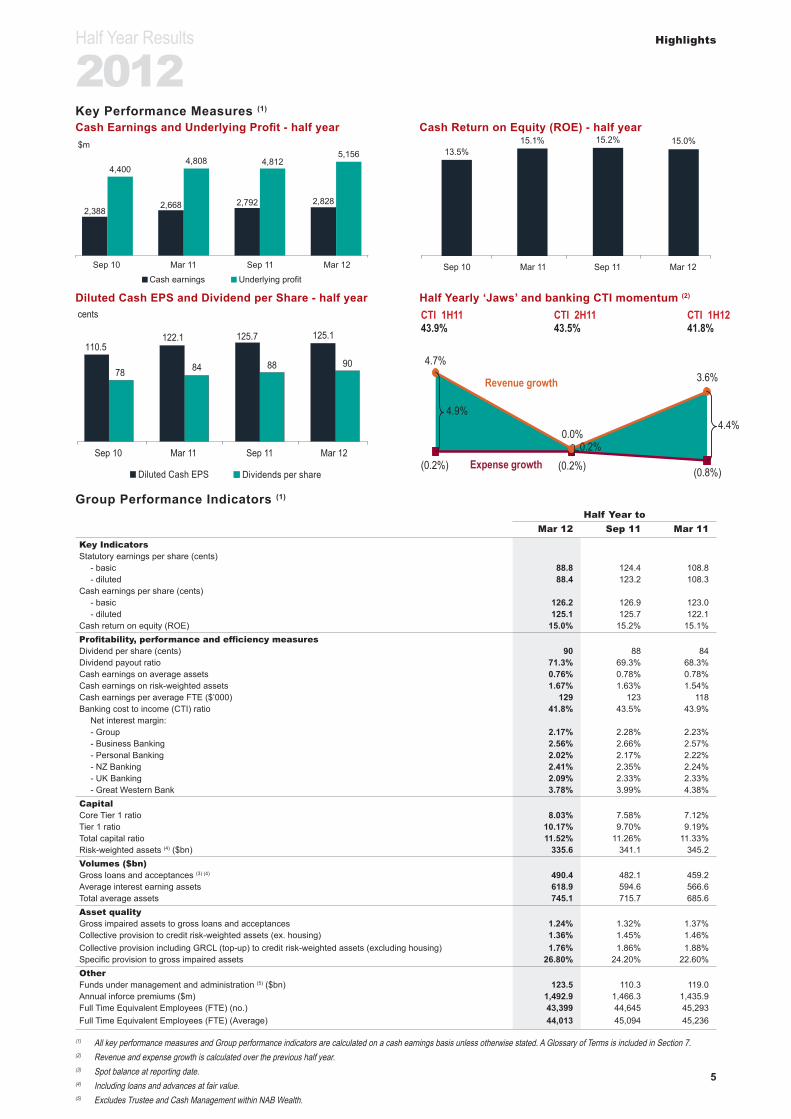
Key Performance Measures (1)
Cash Earnings and Underlying Profit - half year Cash Return on Equity (ROE) - half year
Cash earnings Underlying profit
$m
Sep 10 Mar 11 Sep 11 Mar 12
2,3882,668 2,792 2,828
4,4004,808 4,812
5,156
Sep 10 Mar 11 Sep 11 Mar 12
13.5%15.1% 15.2% 15.0%
Diluted Cash EPS and Dividend per Share - half year Half Yearly ‘Jaws’ and banking CTI momentum (2)
110.5122.1 125.7 125.1
78 84 88 90
Diluted Cash EPS Dividends per share
Sep 10 Mar 11 Sep 11 Mar 12
cents
(0.2%) (0.2%) (0.8%)
4.7%
0.0%
3.6%
4.4%4.9%
Expense growth
Revenue growth
0.2%
1H11 v 2H10 2H11 v 1H11 1H12 v2H11
CTI 2H1143.5%
CTI 1H1143.9%
CTI 1H1241.8%
Group Performance Indicators (1)
Half Year toMar 12 Sep 11 Mar 11
Key IndicatorsStatutory earnings per share (cents)
- basic 88.8 124.4 108.8 - diluted 88.4 123.2 108.3
Cash earnings per share (cents)- basic 126.2 126.9 123.0 - diluted 125.1 125.7 122.1
Cash return on equity (ROE) 15.0% 15.2% 15.1% Profitability, performance and efficiency measuresDividend per share (cents) 90 88 84 Dividend payout ratio 71.3% 69.3% 68.3% Cash earnings on average assets 0.76% 0.78% 0.78% Cash earnings on risk-weighted assets 1.67% 1.63% 1.54% Cash earnings per average FTE ($’000) 129 123 118 Banking cost to income (CTI) ratio 41.8% 43.5% 43.9%
Net interest margin:- Group 2.17% 2.28% 2.23% - Business Banking 2.56% 2.66% 2.57% - Personal Banking 2.02% 2.17% 2.22% - NZ Banking 2.41% 2.35% 2.24% - UK Banking 2.09% 2.33% 2.33% - Great Western Bank 3.78% 3.99% 4.38%
CapitalCore Tier 1 ratio 8.03% 7.58% 7.12% Tier 1 ratio 10.17% 9.70% 9.19% Total capital ratio 11.52% 11.26% 11.33% Risk-weighted assets (4) ($bn) 335.6 341.1 345.2 Volumes ($bn)Gross loans and acceptances (3) (4) 490.4 482.1 459.2 Average interest earning assets 618.9 594.6 566.6 Total average assets 745.1 715.7 685.6 Asset qualityGross impaired assets to gross loans and acceptances 1.24% 1.32% 1.37% Collective provision to credit risk-weighted assets (ex. housing) 1.36% 1.45% 1.46% Collective provision including GRCL (top-up) to credit risk-weighted assets (excluding housing) 1.76% 1.86% 1.88% Specific provision to gross impaired assets 26.80% 24.20% 22.60% OtherFunds under management and administration (5) ($bn) 123.5 110.3 119.0 Annual inforce premiums ($m) 1,492.9 1,466.3 1,435.9 Full Time Equivalent Employees (FTE) (no.) 43,399 44,645 45,293 Full Time Equivalent Employees (FTE) (Average) 44,013 45,094 45,236
(1) All key performance measures and Group performance indicators are calculated on a cash earnings basis unless otherwise stated. A Glossary of Terms is included in Section 7.(2) Revenue and expense growth is calculated over the previous half year. (3) Spot balance at reporting date.(4) Including loans and advances at fair value.(5) Excludes Trustee and Cash Management within NAB Wealth.
Half Year Results
2012
6
Highlights
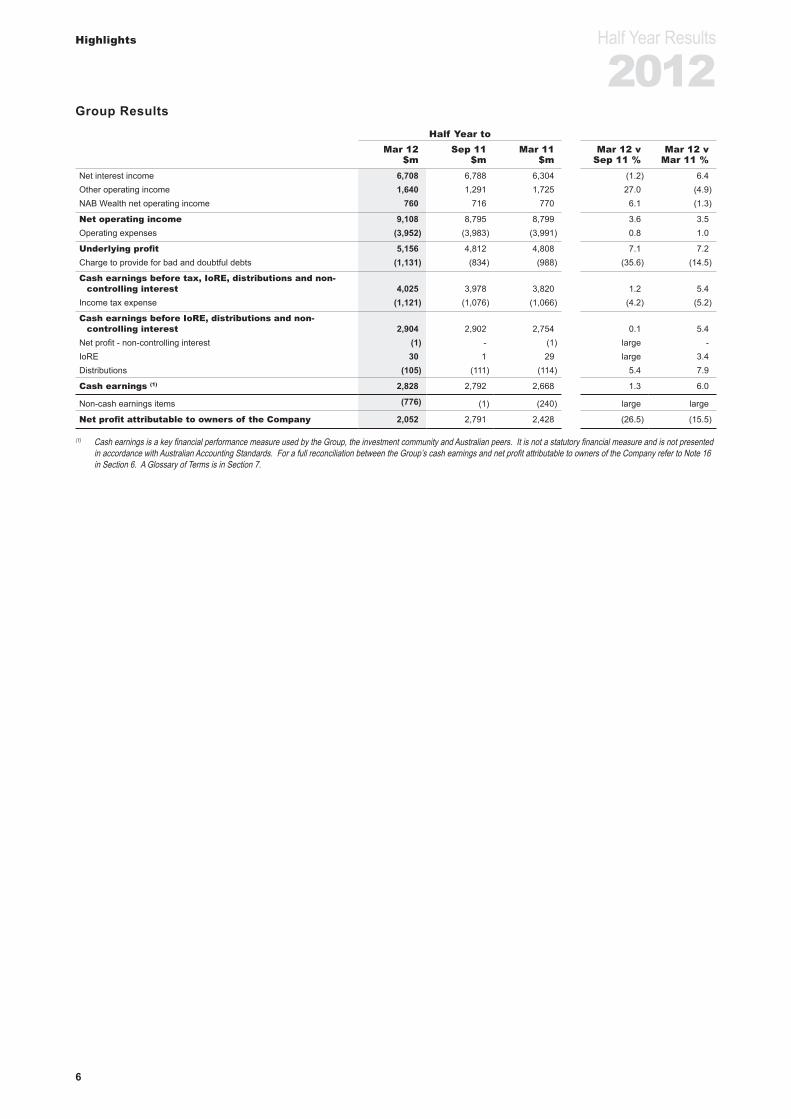
Group ResultsHalf Year to
Mar 12 Sep 11 Mar 11 Mar 12 v Mar 12 v$m $m $m Sep 11 % Mar 11 %
Net interest income 6,708 6,788 6,304 (1.2) 6.4 Other operating income 1,640 1,291 1,725 27.0 (4.9)NAB Wealth net operating income 760 716 770 6.1 (1.3)
Net operating income 9,108 8,795 8,799 3.6 3.5 Operating expenses (3,952) (3,983) (3,991) 0.8 1.0
Underlying profit 5,156 4,812 4,808 7.1 7.2 Charge to provide for bad and doubtful debts (1,131) (834) (988) (35.6) (14.5)
Cash earnings before tax, IoRE, distributions and non-controlling interest 4,025 3,978 3,820 1.2 5.4
Income tax expense (1,121) (1,076) (1,066) (4.2) (5.2)
Cash earnings before IoRE, distributions and non-controlling interest 2,904 2,902 2,754 0.1 5.4
Net profit - non-controlling interest (1) - (1) large - IoRE 30 1 29 large 3.4 Distributions (105) (111) (114) 5.4 7.9
Cash earnings (1) 2,828 2,792 2,668 1.3 6.0
Non-cash earnings items (776) (1) (240) large large
Net profit attributable to owners of the Company 2,052 2,791 2,428 (26.5) (15.5)
(1) Cash earnings is a key financial performance measure used by the Group, the investment community and Australian peers. It is not a statutory financial measure and is not presented in accordance with Australian Accounting Standards. For a full reconciliation between the Group’s cash earnings and net profit attributable to owners of the Company refer to Note 16 in Section 6. A Glossary of Terms is in Section 7.

Half Year Results
2012
7
Highlights
Divisional Performance
Divisional ResultsHalf Year to
Mar 12 Sep 11 Mar 11 Mar 12 v Mar 12 v$m $m $m Sep 11 % Mar 11 %
Business Banking 1,264 1,264 1,181 - 7.0 Personal Banking 464 500 432 (7.2) 7.4 Wholesale Banking 518 268 393 93.3 31.8 NAB Wealth (before loRE and after non-controlling interest) 259 234 269 10.7 (3.7)NZ Banking 297 254 215 16.9 38.1 UK Banking (36) 166 122 large largeGreat Western Bank 48 41 47 17.1 2.1 Specialised Group Assets (3) 33 77 large largeCorporate Functions and Other 92 142 17 (35.2) largeIoRE 30 1 29 large 3.4 Distributions (105) (111) (114) 5.4 7.9
Cash earnings 2,828 2,792 2,668 1.3 6.0
Non-cash earnings items (776) (1) (240) large large
Net profit attributable to owners of the Company 2,052 2,791 2,428 (26.5) (15.5)
Divisional Performance IndicatorsHalf Year to
Mar 12 v Mar 12 vMar 12 Sep 11 Mar 11 Sep 11 Mar 11
Business BankingCash earnings ($m) 1,264 1,264 1,181 - 7.0% Cash earnings on average assets 1.29% 1.31% 1.25% (2 bps) 4 bps Cash earnings on risk-weighted assets 1.78% 1.74% 1.61% 4 bps 17 bps Net interest margin 2.56% 2.66% 2.57% (10 bps) (1 bps)Net operating income ($m) 3,047 3,101 2,938 (1.7%) 3.7% Cost to income ratio 28.7% 28.5% 29.9% (20 bps) 120 bps
Personal BankingCash earnings ($m) 464 500 432 (7.2%) 7.4% Cash earnings on average assets 0.65% 0.74% 0.70% (9 bps) (5 bps)Cash earnings on risk-weighted assets 2.31% 2.43% 2.16% (12 bps) 15 bps Net interest margin 2.02% 2.17% 2.22% (15 bps) (20 bps)Net operating income ($m) 1,731 1,747 1,669 (0.9%) 3.7% Cost to income ratio 52.1% 51.5% 53.4% (60 bps) 130 bps
Wholesale BankingCash earnings ($m) 518 268 393 93.3% 31.8% Cash earnings on risk-weighted assets 2.60% 1.50% 2.30% 110 bps 30 bps Net operating income ($m) 1,219 859 997 41.9% 22.3% Cost to income ratio 38.1% 53.4% 45.7% 1,530 bps 760 bps
NAB WealthCash earnings before IoRE and non-controlling interest ($m) 260 234 270 11.1% (3.7%)Investment operating expenses to average FUM 62 bps 65 bps 64 bps 3 bps 2 bps Insurance cost to average inforce premium 16% 16% 17% - 100 bps
NZ Banking ($NZ)Cash earnings ($NZm) 385 329 283 17.0% 36.0% Cash earnings on average assets 1.30% 1.12% 0.98% 18 bps 32 bps Cash earnings on risk-weighted assets 1.93% 1.62% 1.44% 31 bps 49 bps Net interest margin 2.41% 2.35% 2.24% 6 bps 17 bps Net operating income ($NZm) 944 910 865 3.7% 9.1% Cost to income ratio 39.7% 41.5% 42.7% 180 bps 300 bps
UK Banking (£)Cash earnings/(deficit) (£m) (25) 106 77 large largeCash earnings on average assets (0.11%) 0.47% 0.34% (58 bps) (45 bps)Cash earnings on risk-weighted assets (0.16%) 0.64% 0.46% (80 bps) (62 bps)Net interest margin 2.09% 2.33% 2.33% (24 bps) (24 bps)Net operating income (£m) 592 644 615 (8.1%) (3.7%)Cost to income ratio 58.8% 56.4% 59.0% (240 bps) 20 bps
Great Western Bank ($US)Cash earnings ($USm) 50 43 47 16.3% 6.4% Cash earnings on average assets (1) 1.27% 1.13% 1.22% 14 bps 5 bps Cash earnings on risk-weighted assets 1.75% 1.40% 1.57% 35 bps 18 bps Net interest margin 3.78% 3.99% 4.38% (21 bps) (60 bps)Net operating income ($USm) 173 182 193 (4.9%) (10.4%)Cost to income ratio 49.7% 50.0% 46.6% 30 bps (310 bps)
Specialised Group AssetsCash earnings ($m) (3) 33 77 large largeNet operating income ($m) 87 28 139 large (37.4%)
(1) Average assets exclude goodwill.

Half Year Results
2012
8
Highlights
This page has been left blank intentionally.

9
Half Year Results
2012Section 3
Review of Operating Environment, Group Operations and Results
Review of Group Operating Environment 10
Review of Group Operations and Results 12
Full Time Equivalent Employees 20
Investment Spend 21
Taxation 21
Non-cash Earnings Items 22
Lending 23
Goodwill and Other Intangible Assets 24
Retail Deposits 25
Asset Quality 26
Capital Management and Funding 31
Other Matters 35

Half Year Results
2012
10
Review of Operating Environment, Group Operations and Results
Review of Group Operating Environment
Global Business EnvironmentThe business environment facing the Group through the first half of the financial year was dominated by a period of renewed volatility and stress in global financial markets. Concerns about Greek sovereign debt and financial stability in several other Eurozone economies lay at the heart of this volatility. While funding support for European banks and new agreements on Greek sovereign debt stabilised the situation, by the time these measures had been taken business confidence around the world had already been eroded and a new slowdown in the pace of global economic growth had commenced. This renewed stress in the middle of 2011 occurred when recoveries in many big economies were vulnerable.
During the global financial crisis many of the big advanced economies had been partially offsetting falls in private demand with higher budget deficits. However, by mid-2011 rising public debt was bringing austerity measures to many countries. Consequently, private demand had not yet recovered and fiscal policy was no longer available to offset renewed weakness. In the meantime, the big emerging economies were slowing in response to a tightening in their monetary policies.
In essence, the net effect of these factors - renewed financial stress, lower confidence, tighter monetary policy in the emerging economies, and the withdrawal of fiscal stimulus in the advanced economies - led to a fairly synchronised slowing in the pace of growth. Interestingly, demand trends in the US economy have not followed this pattern, with growth accelerating through 2011, but slowing in the initial months of 2012.
Global growth began slowing last year to 3.75%, at only slightly below trend, and is forecast to slip further to under 3.5% in 2012. The outlook of moderate world economic growth in 2012 masks big differences in economic performance between its constituent regions.
In the December quarter, growth in the advanced economies slipped to around 1.25% year-on-year. However, while the main emerging market economies slowed sharply through 2011, their growth rate was still over 6% by the end of the year, supported by still-solid growth in the Chinese economy. This disparity is expected to continue throughout 2012, with the advanced economies experiencing growth of about 1.5%, while the emerging economies are forecast to grow at 6.5%. The emerging economies, with their commodity intensive pattern of development, should continue to expand quite rapidly and account for a large part of total global economic expansion. This growth should support global commodity prices which, while they are expected to fall with the arrival of increased supply, should remain high by historical standards.
Australian EconomyAustralia has been one of the main beneficiaries of the commodity intensive growth in the emerging economies. Its commodity export prices in US dollars are twice their 2005-2007 average and the terms of trade are at levels seldom seen in the past century. These exceptionally high export prices have pumped income into the economy and helped it continue growing through the last four years of global recession and financial stress.
The commodity boom is also producing structural change across the economy. High prices for mineral exports have driven an appreciation of the Australian dollar, eroding the international competitiveness of sectors such as manufacturing, tourism and education services. By late 2011, their competitive position was the worst it has been since the early 1970s, with many indicators showing that Australia is a comparatively high cost location.
Despite favourable economic performance overall, there are material differences between sectors and regions. Fixed investment and corporate profits outside the mining sector have been fairly flat. Western Australia has grown rapidly, while Tasmania and South Australia have lagged. Many industries outside mining are still growing. The flow-on effects of higher mining output and incomes are boosting some services, while the health and education sectors have continued their growth in output and employment.
Australia is experiencing the same sort of de-leveraging pressures as other advanced economies, at the same time as it undergoes this process of structural change. Households have continued to record solid gains in income, but much higher savings rates and a slowdown in borrowing has flowed into weak retail spending. The housing market has been quite soft and housing construction and loan growth has slipped to quite low levels.
New Zealand EconomyNew Zealand’s economic position is quite similar to that of Australia. New Zealand’s commodity export prices are also well above their 2005-2007 average and the terms of trade are at their highest levels since the early 1970s. Higher commodity prices have boosted the NZ dollar and the outcome has been a sharp fall in the competitiveness of the non-commodity sectors. As in Australia, the result has been pressure for structural change, with manufacturing output slipping to well below its 2007 levels. Domestic spending in New Zealand has also been curbed by de-leveraging, as the household debt-to-income ratio was very high prior to the onset of the global financial crisis. Household incomes have continued to grow, but savings have turned positive for only the second time since the early 1990s and the growth of household credit has slowed to around 1% since mid-2010.
The long period of de-leveraging has created problems for parts of the economy. In late 2011 the volume of per capita retail sales had started to recover, but it was still lower than in 2007. Nominal house prices in early 2012 were around the levels they were in 2007 and the number of sales was quite low. However, housing affordability has improved, the household debt-to-income ratio is well below its peak level and the rapid growth in household deposits is strengthening balance sheets.
As a result of the high commodity prices, the improved household balance sheet and the reconstruction in Christchurch, economic growth is forecast to accelerate from around 1.4% in 2011 to 2.1% in 2012 and 2.9% in 2013. Domestic demand should pick up and there are signs that retail spending and the housing market are already improving.

Half Year Results
2012
11
Review of Operating Environment, Group Operations and Results
United Kingdom EconomyGrowth has been much weaker in the UK than in any other major Group market, with output falling in late 2011 and early 2012 and remaining at around 4% below its early 2008 level. By contrast, over the same period Australian real GDP rose by 7.5% and New Zealand output was back around its pre-crisis level.
The UK economy has experienced the same de-leveraging pressures as many other advanced economies, which has resulted in a 5% decline in the volume of household consumption spending. This fall in spending reflects a drop in real disposable income, an upturn in household savings and a marked slowdown in household borrowing. Property markets have weakened through this period of de-leveraging, with house prices down by almost a fifth from their 2007 average, while commercial property values are down by one-third. The drift downwards in property markets resumed in the latter part of the 2011 calendar year and has continued into early 2012.
Private sector de-leveraging and public sector austerity measures mean that the structure of the UK economy needs to change and a long and difficult process of re-balancing economic growth is under way. The next few years should see a much lower contribution to growth from government, consumer spending and property investment than prior to the global financial crisis. Instead, there is likely to be greater reliance on exports and business investment in sectors like manufacturing and traded services. The big depreciation in Sterling is helping this re-balancing, as it has significantly increased the international competitiveness of UK business relative to Eurozone suppliers.
United States of America Economy The US economy is continuing its drawn out recovery from the 2008/2009 recession, with indicators generally pointing to the economy expanding at a modest-to-moderate pace. Similar trends are also evident in the states that Great Western Bank operates in and leading indicators for the region are positive. The Great Western region has benefited from strong growth in farm incomes over the last two years. The Great Western region unemployment rate remains clearly below the national average and, like the rest of the country, has been improving since around mid-2011.
System Credit GrowthWith de-leveraging in progress across key Group markets and an absence of property price inflation, weak system credit growth is to be expected. Household debt-to- income ratios grew rapidly across Australia, New Zealand and the UK prior to the onset of the financial crisis. Once it became clear that income growth and asset value prospects would have to be revised downwards and the risk environment had deteriorated, the process of adjusting sectoral balance sheets began. At the same time, the prospect of slower than expected demand growth and much greater uncertainty eroded business confidence and credit demand.
Australian credit growth is running at around 3.5% year-on-year and only the early 1990s recession and the period of financial market stress of 2008/2009 recorded lower rates of growth. Housing credit growth is the lowest on record, reflecting weakening national house prices and sluggish sales. Business credit remains well below its late 2008 levels and the upturn through the last year has
been surprisingly modest. This reflects the concentration of investment spending in the mining sector, which is not very reliant on bank funding, as well as a general hesitation to commit to investment in other sectors of the economy.
New Zealand credit growth has been even weaker but the corollary has been that the process of balance sheet adjustment has progressed more quickly. System credit growth has been running at 1% year-on-year recently and by early 2012 the stock of business credit was still lower than it had been in 2009.
UK system credit growth has been minimal. Housing credit growth has been under 1% since mid-2010, reflecting the soft residential property market, more difficult loan financing conditions, rising unemployment and the pressure on household incomes. Business credit has been particularly weak, reflecting a lack of credit demand and the use of market funding.
System Asset qualityThe global economic downturn led to deterioration in system asset quality across all Group markets, but the increase in bad debts in most economies was generally on a much smaller scale than was seen in the recessions of the early 1990s.
The Australian system impaired loan ratio increased from around 20 basis points in 2007 to peak at around 1.25% in the first half of 2010 and has since fallen back to just over 1.07% in December 2011. Asset quality trends in New Zealand have been quite similar. The system impaired asset ratio increased from around 10 basis points in 2007 to 1.6% in the latter half of 2010 and improved slightly through 2011. The impaired loan ratio for registered banks fell from 1.65% in March 2011 to 1.41% in September 2011.
System asset quality has also worsened in the UK. Bank loan write-off ratios and the corporate insolvency rate have risen since 2007, but they remain below their early 1990s peaks.
OutlookThe Australian outlook is for growth to accelerate from 2% in calendar 2011 to 3.25% in 2012 and 3.75% in 2013. Mining investment will account for much of this growth, with growth in business fixed investment expected to continue through the forecast period. Moderate growth in employment is expected, after the loss of momentum evident in the last year, which is forecast to bring the unemployment rate down to 5% by 2013 – very low by international standards.
Employment growth is also expected to continue in New Zealand, taking the unemployment rate down from 6.25% to around 5% by 2013. The favourable outlook for economic activity alongside moderate inflation should allow the central bank to gradually move interest rates to more normal levels, with the cash rate expected to reach 4.25% by 2014.
The process of re-balancing the UK economy stalled in 2011 as the recovery trend in business investment stopped. The outlook for the UK is for modest growth, with output expected to grow by 0.4% in 2012, 1.5% in 2013 and 2.0% in 2014.

Half Year Results
2012
12
Review of Operating Environment, Group Operations and Results
Group ResultsHalf Year to
Mar 12 Sep 11 Mar 11 Mar 12 v Mar 12 v$m $m $m Sep 11 % Mar 11 %
Net interest income 6,708 6,788 6,304 (1.2) 6.4 Other operating income 1,640 1,291 1,725 27.0 (4.9)NAB Wealth net operating income 760 716 770 6.1 (1.3)
Net operating income 9,108 8,795 8,799 3.6 3.5 Operating expenses (3,952) (3,983) (3,991) 0.8 1.0
Underlying profit 5,156 4,812 4,808 7.1 7.2 Charge to provide for bad and doubtful debts (1,131) (834) (988) (35.6) (14.5)
Cash earnings before tax, IoRE, distributions and non-controlling interest 4,025 3,978 3,820 1.2 5.4
Income tax expense (1,121) (1,076) (1,066) (4.2) (5.2)
Cash earnings before IoRE, distributions and non-controlling interest 2,904 2,902 2,754 0.1 5.4
Net profit - non-controlling interest (1) - (1) large - IoRE 30 1 29 large 3.4 Distributions (105) (111) (114) 5.4 7.9
Cash earnings 2,828 2,792 2,668 1.3 6.0
Non-cash earnings items (after tax):Distributions 105 111 114 (5.4) (7.9)Treasury shares (92) 80 (41) large largeFair value and hedge ineffectiveness (40) 146 (327) large 87.8 IoRE discount rate variation (5) 48 (22) large 77.3 UK Payment Protection Insurance provision (182) (117) - (55.6) largeHedging costs on SCDO assets (99) (127) - 22.0 largeLitigation expense (24) (4) - large largeSoftware impairment (54) - - large largeGoodwill impairment (295) - - large largeRefund of tax on exchangeable capital units (ExCaps) settlement - - 142 - largeAmortisation of acquired intangible assets (51) (41) (41) (24.4) (24.4)Due diligence, acquisition and integration costs (39) (97) (65) 59.8 40.0
Net profit attributable to owners of the Company 2,052 2,791 2,428 (26.5) (15.5)
Cash Earnings (1)
2,668 2,828
83 32132 78 3 85 10
(162) (9) (92)
Mar 11 BusinessBanking
PersonalBanking
WholesaleBanking
UKBanking
NZBanking
NAB Wealth GreatWestern
Bank
SpecialisedGroupAssets
CorporateFunctions& Other *
FX Impact Mar 12
$m
(1) At constant exchange rates.* Corporate Functions and Other includes Group Funding, Group Business Services, other supporting units and Asia Banking.
Review of Group Operations and ResultsMark Joiner

Half Year Results
2012
13
Review of Operating Environment, Group Operations and Results
The Group’s results and Review of Divisional Operations and Results are presented on a cash earnings basis unless otherwise stated. Cash earnings is a key financial performance measure used by NAB, the investment community and NAB’s Australian peers with a similar business portfolio. NAB also uses cash earnings for its internal management reporting as it better reflects what NAB considers to be the underlying performance of the Group. It is not a statutory financial measure and is not presented in accordance with Australian Accounting Standards nor audited or reviewed in accordance with Australian Auditing Standards. “Cash earnings” is calculated by excluding some items which are included within the statutory net profit attributable to owners of the Company. A definition of cash earnings is set out on page 150. A discussion of non-cash earnings items and a full reconciliation of the cash earnings to statutory net profit attributable to owners of the Company for the March 2012 half year is included on pages 22 and 141. The Group’s financial statements, prepared in accordance with the Corporations Act 2001 (Cth) and Australian Accounting Standards, and reviewed by the auditors in accordance with Australian Auditing Standards, are included in section 5.
Financial Analysis
March 2012 v March 2011Net profit attributable to owners of the Company decreased by $376 million or 15.5%, reflecting higher charges for bad and doubtful debts, hedging costs on exited SCDO assets, impairment of goodwill and capitalised software and an additional provision for potential claims relating to payment protection insurance in UK Banking, offset by a strong performance in Wholesale Banking. Net profit attributable to owners of the Company (statutory net profit) is prepared and reviewed in accordance with the Corporations Act 2001 (Cth), Australian Accounting Standards and Australian Auditing Standards.
Cash earnings increased by $160 million or 6.0% against the March 2011 half year. Excluding foreign exchange rate movements, cash earnings increased by $150 million or 5.6%. This was largely driven by stronger performances in Business Banking, Personal Banking, Wholesale Banking and NZ Banking, offset by weaker results in UK Banking and Specialised Group Assets (SGA) primarily due to higher bad and doubtful debt charges.
Cash earnings on risk-weighted assets increased by 13 basis points reflecting higher earnings and lower RWAs as a result of optimisation activities.
Net interest income increased by $404 million or 6.4%. Excluding foreign exchange rate movements, net interest income increased by $452 million or 7.2%. This was driven by housing lending growth in Personal Banking and NZ Banking, together with above system growth in Business Banking. This was partially offset by higher deposit and wholesale funding costs. Wholesale Banking net interest income also increased by $262 million or 50.2% driven by higher interest earning assets to support Group funding and liquidity requirements, coupled with improved yields and gains on economically hedged
positions of the Group’s banking book interest rate risk largely offset in Other operating income.
Other operating income decreased by $85 million or 4.9%. Excluding foreign exchange rate movements, other operating income decreased by $80 million or 4.6%. This decrease was largely due to fair value movements on economic hedges relating to the Group’s banking book interest rate risk, offset by higher sales of risk management products to customers in Wholesale Banking.
NAB Wealth net operating income decreased by $10 million or 1.3% as a result of ongoing investment market uncertainty and an increase in lapses. This was offset by growth in average inforce premiums and favourable earnings on the annuities portfolio.
Operating expenses decreased by $39 million or 1.0%. Excluding foreign exchange rate movements, operating expenses decreased by $6.0 million or 0.2%. This reflects tight cost control, while continuing to invest in key strategic projects.
The charge to provide for bad and doubtful debts increased by $143 million or 14.5%. Excluding foreign exchange rate movements, the charge to provide for bad and doubtful debts increased by $173 million or 17.5%. This increase was primarily driven by UK Banking where asset quality in business lending has been adversely affected by economic and market uncertainty, combined with a deterioration in the commercial property market. SGA’s bad and doubtful debt charge increased by $50 million, primarily due to new impairments on a small number of UK related exposures.
March 2012 v September 2011Net profit attributable to owners of the Company decreased by $739 million or 26.5%, reflecting higher charges for bad and doubtful debts, impairment of goodwill and capitalised software and an additional provision for potential claims relating to payment protection insurance in UK Banking, offset by a strong performance in Wholesale Banking.
Cash earnings increased by $36 million or 1.3% against the September 2011 half year. Excluding foreign exchange rate movements, cash earnings increased by $39 million or 1.4%. This increase was largely attributable to improved performances in Wholesale Banking, NAB Wealth and NZ Banking, partially offset by a weaker performance in UK Banking and SGA. Wholesale Banking’s strong performance was mainly due to higher revenue in both the customer and risk businesses, whilst NAB Wealth benefited from lower claims and lapse experiences. The deterioration in profitability in UK Banking was largely the result of increasing bad and doubtful debt charges and higher deposit and funding costs.
Cash earnings on risk-weighted assets increased by 4 basis points reflecting continued RWA optimisation activities.
Net interest income decreased by $80 million or 1.2%. Excluding foreign exchange rate movements, net interest income decreased by $80 million or 1.2%.
Review of Group Operations and Results
Note on Cash earnings

Half Year Results
2012
14
Review of Operating Environment, Group Operations and Results
While Wholesale Banking’s net interest income benefited from higher interest earning assets, net interest income in Business Banking and Personal Banking was lower reflecting increases in term funding and deposit costs.
Other operating income increased by $349 million or 27.0%. Excluding foreign exchange rate movements, other operating income increased by $358 million or 27.7%. This was mainly driven by increases in Wholesale Banking risk income reflecting more favourable market conditions and positive positioning in both Fixed Income, Currencies and Commodities (FICC) and Treasury businesses. Other operating income was also higher in SGA as a result of favourable mark-to-market movements in the Synthetic Collateralised Debt Obligation (SCDO) risk mitigation trades.
NAB Wealth net operating income increased by $44 million or 6.1% due to favourable earnings on the annuities portfolio, lower insurance claims and a lower impact of unfavourable lapses and changes in the profile of the retail insurance book.
Operating expenses decreased by $31 million or 0.8%. Excluding foreign exchange rate movements, operating expenses increased $29 million or 0.7%. This reflects tight cost control, while continuing to invest in key strategic projects.
The charge to provide for bad and doubtful debts increased by $297 million or 35.6%. Excluding foreign exchange rate movements, the increase was $303 million or 36.3%. This increase reflects the significant deterioration in asset quality in UK Banking with its charge to provide for bad and doubtful debts increasing by $207 million. In addition, SGA’s charge to provide for bad and doubtful debts increased by $51 million primarily due to new impairments on a small number of UK related exposures. These increases have been partially offset by lower bad and doubtful debt charges in Business Banking and NZ Banking. The lower bad and doubtful debts charge in Business Banking is a result of lower provisioning for the Small and Medium Enterprises (SME) portfolio, partly offset by increased charges for large corporates. NZ Banking has benefited from lower specific provisions and improved credit card collections.
Impact of Foreign Exchange Rates MovementsExcluding foreign exchange rate movements, cash earnings increased by $150 million or 5.6% on the March 2011 half year and increased by $39 million or 1.4% against the September 2011 half year. Foreign exchange rate movements have had a favourable effect of $10 million on the March 2012 half year result when compared to the March 2011 half year, and an adverse effect of $3 million when compared to the September 2011 half year result.
See page 146 to 147 for the half year divisional performance summaries excluding foreign exchange rate movements for the March 2012 half year and September 2011 half year.

Half Year Results
2012
15
Review of Operating Environment, Group Operations and Results
Net Interest IncomeHalf Year to
Mar 12 Sep 11 Mar 11 Mar 12 v Mar 12 vSep 11 Mar 11
Net interest income ($m) 6,708 6,788 6,304 (1.2%) 6.4% Average interest earning assets ($bn) 618.9 594.6 566.6 4.1% 9.2% Net interest margin (%) 2.17 2.28 2.23 (11 bps) (6 bps)
Composition of Net Interest IncomeBanking ($m) 5,870 6,022 5,717 (2.5%) 2.7% Wholesale Banking ($m) 784 708 522 10.7% 50.2% Specialised Group Assets ($m) 54 58 65 (6.9%) (16.9%)
Net interest income ($m) 6,708 6,788 6,304 (1.2%) 6.4%
Net interest income and margin management are key areas of focus for the divisions. The Group net interest margin represents an amalgam of the individual business outcomes and the analysis below is based on divisional drivers.
Net Interest Income - Contribution to Net Increase (1)
Mar 11 BusinessBanking
PersonalBanking
WholesaleBanking
NZBanking
NAB Wealth GreatWestern
Bank
CorporateFunctions& Other *
Mar 12
$m
UKBanking
SpecialisedGroupAssets
FX Impact
6,304 6,708
84 77
276 53 3 36
(50) (18) (9) (48)
(1) At constant exchange rates.* Corporate Functions and Other includes Group Funding, Group Business Services, other supporting units and Asia Banking.
March 2012 v March 2011Net interest income increased by $404 million or 6.4% ($452 million or 7.2% excluding foreign exchange).
Banking net interest income increased by $153 million or 2.7% ($185 million or 3.2% excluding foreign exchange). The key contributing factors were: - Lending growth in Personal Banking and Business
Banking. - Repricing of the lending portfolio for current market
conditions. - Favourable mix impacts in New Zealand, as
customers moved from fixed rate mortgage products to higher margin variable products.
These increases were partially offset by the rising cost of deposits and wholesale funding.
Wholesale Banking’s net interest income increased by $262 million or 50.2% ($276 million or 52.9% excluding foreign exchange). Of the increase, $154 million was driven by gains on economically hedged positions relating to the Group’s banking book interest rate risk (offset in other operating income). The underlying increase of $108 million was driven by higher interest earning assets to support the Group’s funding and liquidity requirements, coupled with improved yields as part of optimising the Bank’s funding and liquidity profile.
Specialised Group Assets’ net interest income decreased by $11 million or 16.9% ($9 million or 13.8% excluding foreign exchange) as a result of the run-down of the lending portfolio.
March 2012 v September 2011Net interest income decreased by $80 million or 1.2% ($80 million or 1.2% excluding foreign exchange).
Banking net interest income decreased by $152 million or 2.5% ($152 million or 2.5% excluding foreign exchange). This decrease reflects increases in funding and deposit costs resulting in a higher average cost of funds, partially offset by repricing of the lending portfolio for current market conditions and volume growth.
Wholesale Banking’s net interest income increased by $76 million or 10.7% ($76 million or 10.7% excluding foreign exchange) mainly due to improved yields as part of optimising the Bank’s funding and liquidity profile.
Specialised Group Assets’ net interest income decreased by $4 million or 6.9% ($4 million or 6.9% excluding foreign exchange) due to the run-down of the lending portfolio.

Half Year Results
2012
16
Review of Operating Environment, Group Operations and Results
Net Interest MarginHalf Year to
Mar 12 Sep 11 Mar 11 Mar 12 v Mar 12 v% % % Sep 11 Mar 11
Business Banking 2.56 2.66 2.57 (10 bps) (1 bps)Personal Banking 2.02 2.17 2.22 (15 bps) (20 bps)NZ Banking 2.41 2.35 2.24 6 bps 17 bps UK Banking 2.09 2.33 2.33 (24 bps) (24 bps)Great Western Bank 3.78 3.99 4.38 (21 bps) (60 bps)
Group net interest margin 2.17 2.28 2.23 (11 bps) (6 bps)
Net interest margin
Mar 11 BusinessBanking
PersonalBanking
WholesaleBanking
UKBanking
NZBanking
GreatWestern
Bank
Other* Mar 12
%
SpecialisedGroupAssets
2.23 2.17
0.01 0.01 0.01
(0.01) (0.04) (0.03) (0.01)
–
* Includes NAB Wealth, Group Funding and other supporting units.
March 2012 v March 2011The Group’s net interest margin decreased by six basis points over the March 2011 half year. Key contributions to the Group net interest margin movements were: - A one basis point decrease attributable to Business
Banking due to changes in lending mix in the Group’s lending portfolio.
- A four basis point decrease attributable to Personal Banking primarily due to higher funding and deposit costs, together with the mix impact of growth in mortgages.
- A one basis point increase attributable to Wholesale Banking due to an improvement in yields, partially offset by an increase in liquid assets.
- A three basis point decrease attributable to UK Banking driven by higher liquidity and higher deposit and funding costs.
- A one basis point increase attributable to NZ Banking driven by volume growth in higher margin variable rate housing products and progressive repricing of the portfolio.
- A one basis point decrease attributable to Great Western Bank resulting from the tightening of lending margins due to highly competitive pricing.
- A one basis point increase attributable to SGA that has improved the Group’s mix, as this lower margin portfolio reduces in size.
March 2012 v September 2011The Group’s net interest margin decreased by 11 basis points over the September 2011 half year. Key movements in the Group net interest margin were: - A four basis point decrease attributable to Business
Banking due to higher funding and deposit costs. - A three basis point decrease attributable to Personal
Banking due to higher funding costs, together with the mix impact of growth in mortgages.
- A one basis point increase attributable to the Wholesale Banking margin driven by improved yields as part of optimising the Bank’s funding and liquidity profile.
- A three basis point decrease attributable to UK Banking driven by higher deposit and funding costs.
- A two basis point decrease attributable to Other driven by changes in portfolio mix.

Half Year Results
2012
17
Review of Operating Environment, Group Operations and Results
Other Operating IncomeHalf Year to
Mar 12 Sep 11 Mar 11 Mar 12 v Mar 12 v$m $m $m Sep 11 % Mar 11 %
Fees and commissions 1,234 1,222 1,285 1.0 (4.0)Trading income 295 (107) 341 large (13.5)Other 111 176 99 (36.9) 12.1
Other operating income 1,640 1,291 1,725 27.0 (4.9)
Composition of Trading Income (1)
Wholesale Banking 268 (24) 289 large (7.3)Specialised Group Assets 21 (73) 65 large (67.7)Group Treasury (64) (49) (51) (30.6) (25.5)
Other 70 39 38 79.5 84.2
Trading income 295 (107) 341 large (13.5)
(1) Excluding internal funding transactions.
Other Operating Income - Contribution to Net Decrease (1)
Mar 11 BusinessBanking
WholesaleBanking
UKBanking
NZBanking
NABWealth
GreatWestern
Bank
SpecialisedGroupAssets
CorporateFunctions& Other*
FX Impact Mar 12
$m
PersonalBanking
1,725 1,640
25 14 6(15) (37) (1) (1) (51) (20) (5)
(1) At constant exchange rates.* Corporate Functions and Other includes Group Funding, Group Business Services, other supporting units and Asia Banking.
March 2012 v March 2011Other operating income decreased by $85 million or 4.9% from March 2011 ($80 million or 4.6% excluding foreign exchange).
Fees and commissions decreased by $51 million or 4.0% ($39 million or 3.0% excluding foreign exchange). This decrease was mainly due to lower fees and commission income in UK Banking.
Trading income decreased by $46 million ($55 million excluding foreign exchange).
Wholesale Banking’s (1) contribution to trading income decreased by $21 million or 7.3% ($20 million or 6.9% excluding foreign exchange) as a result of mark-to-market losses of $154 million on economic hedges relating to the Group’s banking book interest rate risk (offset in net interest income). Excluding this, the increase of $133 million was mainly the result of higher sales of risk management products to the Group’s business customers.
Specialised Group Assets’ contribution decreased by $44 million or 67.7% ($55 million or 84.6% excluding foreign exchange) largely due to lower mark-to-market gains on the SCDO risk mitigation trades.
Other income increased by $12 million or 12.1% ($14 million excluding foreign exchange or 14.1%) mainly due to a charge of $21 million relating to payment protection insurance (PPI) in the prior period. This effect was partly offset by the sale of the Flybuys investment in the prior period.
March 2012 v September 2011Other operating income increased by $349 million or 27.0% ($358 million or 27.7% excluding foreign exchange) from September 2011.
Fees and commissions increased by $12 million or 1.0% ($14 million or 1.1% excluding foreign exchange). This increase was largely driven by Wholesale Banking through stronger capital market flows in both Australia and the United States.
Trading income increased by $402 million ($407 million excluding foreign exchange).
Wholesale Banking’s (1) contribution to trading income increased by $292 million ($295 million excluding foreign exchange). The increase was due to higher sales of risk management products to the Group’s business customers, combined with increased flow and improved trading conditions in the Fixed Income, Currencies and Commodities (FICC) business.
Specialised Group Assets’ contribution increased by $94 million ($99 million excluding foreign exchange). This increase was mainly due to unfavourable mark-to-market movements on the SCDO risk mitigation trades in the September 2011 half year.
Other income decreased by $65 million or 36.9% ($63 million or 35.8% excluding foreign exchange) mainly due to the gains on sale of an equity investment obtained through a restructure of debt in Specialised Group Assets in the September 2011 half year.
(1) Excluding internal funding transactions.

Half Year Results
2012
18
Review of Operating Environment, Group Operations and Results
NAB Wealth Net Operating IncomeHalf Year to
Mar 12 Sep 11 Mar 11 Mar 12 v Mar 12 v$m $m $m Sep 11 % Mar 11 %
Investments net operating income 510 498 501 2.4 1.8 Insurance net operating income 250 218 269 14.7 (7.1)
NAB Wealth net operating income 760 716 770 6.1 (1.3)
March 2012 v March 2011 Investments net operating income increased by $9 million or 1.8% compared to March 2011 as a result of growth in average funds under management (FUM) and favourable earnings on the annuities portfolio, partly offset by changes in business mix.
Insurance net operating income decreased by $19 million or 7.1% compared to the March 2011 half year. This result was largely driven by an increase in lapses, partially offset by growth in average inforce premiums.
March 2012 v September 2011Investments net operating income increased by $12 million or 2.4% against the September 2011 half year as a result of growth in average FUM and favourable earnings on the annuities portfolio, partly offset by changes in business mix.
Insurance net operating income increased by $32 million or 14.7% due to growth in average inforce premiums, lower claims and lower unfavourable lapses and changes in the profile of the retail insurance book.

Half Year Results
2012
19
Review of Operating Environment, Group Operations and Results
March 2012 v March 2011Operating expenses decreased by $39 million or 1.0% against March 2011 ($6 million or 0.2% excluding foreign exchange). The Group continues to tightly manage expenses while continuing to invest in key strategic projects.
Personnel expenses decreased by $18 million or 0.9% ($4 million or 0.2% excluding foreign exchange). This decrease was primarily driven by a reduction in FTEs, through the Group’s focus on productivity and process simplification, offset by the impact of higher redundancy costs and higher performance based compensation.
Occupancy related expenses decreased by $26 million or 7.1% ($22 million or 6.0% excluding foreign exchange) due to disciplined cost management during the period.
General expenses remained flat (increased $15 million or 1.4% excluding foreign exchange). Excluding foreign exchange, the movement was due to higher depreciation and amortisation charges associated with the continued investment in key strategic projects, partially offset by a reduction in discretionary spending (i.e. travel, professional fees, communication costs).
NAB Wealth operating expenses increased by $5 million or 1.0% mainly due to growth in advisers, the development of new products and services and the acquisition of the direct funds management business Antares Capital Partners Limited (Antares), formerly known as Aviva Investors Australia Limited, largely offset by a reduction of FTEs in the business.
March 2012 v September 2011Operating expenses decreased by $31 million or 0.8% against September 2011 ($29 million or 0.7% excluding foreign exchange). The Group continues to tightly manage expenses while continuing to invest in key strategic projects.
Personnel expenses increased by $62 million or 3.1% ($61 million or 3.1% excluding foreign exchange) largely due to higher performance-based compensation, partially offset by the Group’s focus on productivity and process simplifications driving a reduction in FTEs.
Occupancy related expenses decreased by $4 million or 1.2% ($3 million or 0.9% excluding foreign exchange) mainly due to disciplined cost management.
General expenses decreased by $89 million or 7.6% ($87 million or 7.5% excluding foreign exchange), due to a reduction in discretionary spending (i.e. travel, professional fees, marketing and communication costs), partially offset by higher depreciation and amortisation charges associated with the continued investment in key strategic projects.
NAB Wealth operating expenses remained flat due to disciplined cost management during the period. The impact of lower FTEs has been offset by the expense relating to the acquisition of Antares Capital Partners Limited.
Operating ExpensesHalf Year to
Mar 12 Sep 11 Mar 11 Mar 12 v Mar 12 v$m $m $m Sep 11 % Mar 11 %
Personnel expenses 2,040 1,978 2,058 (3.1) 0.9 Occupancy related expenses 341 345 367 1.2 7.1 General expenses 1,078 1,167 1,078 7.6 - NAB Wealth operating expenses (1) 493 493 488 - (1.0)
Total operating expenses 3,952 3,983 3,991 0.8 1.0
(1) Excludes banking related activities, which are included in the personnel, occupancy and general expenses categories.
Operating Expenses - Contribution to Net Increase (1)
Mar 11 BusinessBanking
PersonalBanking
WholesaleBanking
UKBanking
NZBanking
NAB Wealth GreatWestern
Bank
CorporateFunctions& Other*
FX Impact Mar 12
$m
SpecialisedGroupAssets
3,991 3,952
11 14 4 10
(4) (24) (3) (5) (9) (33)
(1) At constant exchange rates.* Corporate Functions and Other includes Group Funding, Group Business Services, other supporting units and Asia Banking.
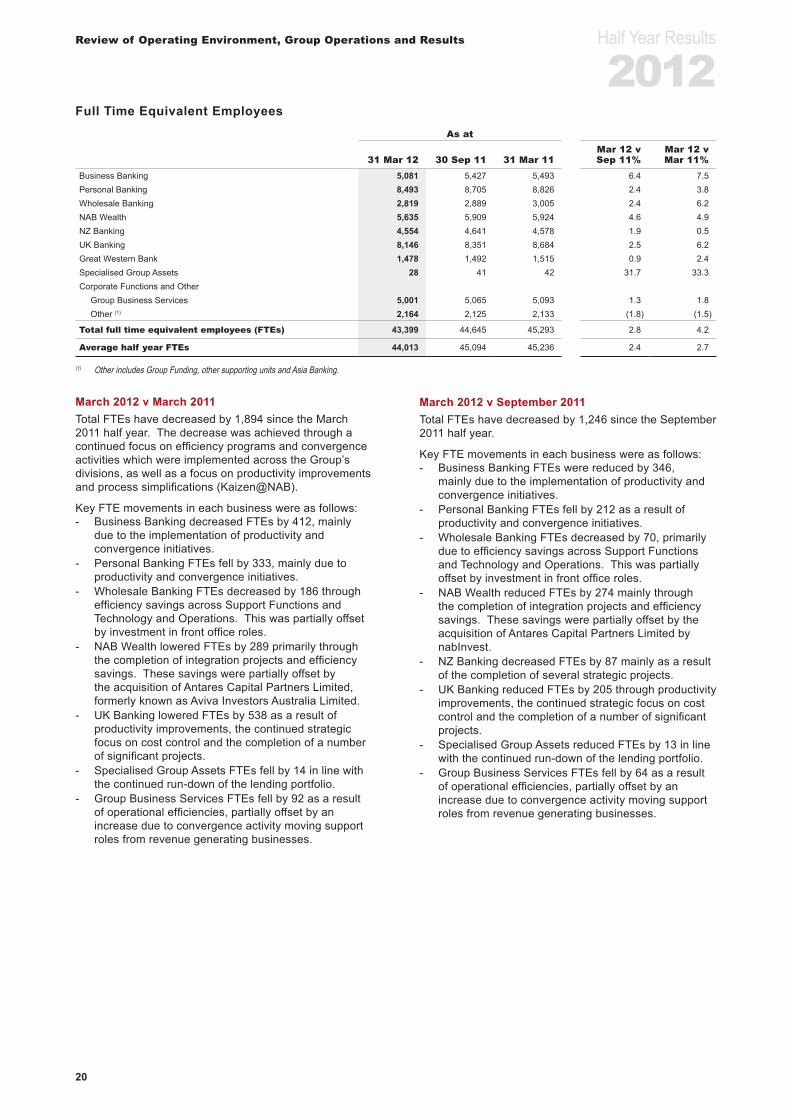
Half Year Results
2012
20
Review of Operating Environment, Group Operations and Results
Full Time Equivalent EmployeesAs at
Mar 12 v Mar 12 v31 Mar 12 30 Sep 11 31 Mar 11 Sep 11% Mar 11%
Business Banking 5,081 5,427 5,493 6.4 7.5 Personal Banking 8,493 8,705 8,826 2.4 3.8 Wholesale Banking 2,819 2,889 3,005 2.4 6.2 NAB Wealth 5,635 5,909 5,924 4.6 4.9 NZ Banking 4,554 4,641 4,578 1.9 0.5 UK Banking 8,146 8,351 8,684 2.5 6.2 Great Western Bank 1,478 1,492 1,515 0.9 2.4 Specialised Group Assets 28 41 42 31.7 33.3 Corporate Functions and Other
Group Business Services 5,001 5,065 5,093 1.3 1.8 Other (1) 2,164 2,125 2,133 (1.8) (1.5)
Total full time equivalent employees (FTEs) 43,399 44,645 45,293 2.8 4.2
Average half year FTEs 44,013 45,094 45,236 2.4 2.7
(1) Other includes Group Funding, other supporting units and Asia Banking.
March 2012 v March 2011Total FTEs have decreased by 1,894 since the March 2011 half year. The decrease was achieved through a continued focus on efficiency programs and convergence activities which were implemented across the Group’s divisions, as well as a focus on productivity improvements and process simplifications (Kaizen@NAB).
Key FTE movements in each business were as follows: - Business Banking decreased FTEs by 412, mainly
due to the implementation of productivity and convergence initiatives.
- Personal Banking FTEs fell by 333, mainly due to productivity and convergence initiatives.
- Wholesale Banking FTEs decreased by 186 through efficiency savings across Support Functions and Technology and Operations. This was partially offset by investment in front office roles.
- NAB Wealth lowered FTEs by 289 primarily through the completion of integration projects and efficiency savings. These savings were partially offset by the acquisition of Antares Capital Partners Limited, formerly known as Aviva Investors Australia Limited.
- UK Banking lowered FTEs by 538 as a result of productivity improvements, the continued strategic focus on cost control and the completion of a number of significant projects.
- Specialised Group Assets FTEs fell by 14 in line with the continued run-down of the lending portfolio.
- Group Business Services FTEs fell by 92 as a result of operational efficiencies, partially offset by an increase due to convergence activity moving support roles from revenue generating businesses.
March 2012 v September 2011Total FTEs have decreased by 1,246 since the September 2011 half year.
Key FTE movements in each business were as follows: - Business Banking FTEs were reduced by 346,
mainly due to the implementation of productivity and convergence initiatives.
- Personal Banking FTEs fell by 212 as a result of productivity and convergence initiatives.
- Wholesale Banking FTEs decreased by 70, primarily due to efficiency savings across Support Functions and Technology and Operations. This was partially offset by investment in front office roles.
- NAB Wealth reduced FTEs by 274 mainly through the completion of integration projects and efficiency savings. These savings were partially offset by the acquisition of Antares Capital Partners Limited by nabInvest.
- NZ Banking decreased FTEs by 87 mainly as a result of the completion of several strategic projects.
- UK Banking reduced FTEs by 205 through productivity improvements, the continued strategic focus on cost control and the completion of a number of significant projects.
- Specialised Group Assets reduced FTEs by 13 in line with the continued run-down of the lending portfolio.
- Group Business Services FTEs fell by 64 as a result of operational efficiencies, partially offset by an increase due to convergence activity moving support roles from revenue generating businesses.

Half Year Results
2012
21
Review of Operating Environment, Group Operations and Results
Investment SpendHalf Year to
Mar 12 Sep 11 Mar 11 Mar 12 v Mar 12 v$m $m $m Sep 11 % Mar 11 %
Infrastructure 309 414 305 (25.4) 1.3
Compliance / Operational Risk 57 53 66 7.5 (13.6)Efficiency and Sustainable Revenue 120 158 130 (24.1) (7.7)Other 30 13 21 large 42.9
Total Investment Spend 516 638 522 (19.1) (1.1)
Investment spend decreased by $6 million or 1.1% on the March 2011 half year and fell by $122 million or 19.1% on the September 2011 half year. The Group continues to invest in initiatives that support its strategic objectives.
Investment in infrastructure projects increased by $4 million or 1.3% compared to the March 2011 half year. The Group maintains a continued focus on improving the quality, consistency and capabilities of the organisation to significantly enhance the customer experience. Most of this investment was made in the Group’s Next Generation Banking IT Platform (NGP) and convergence of key technology and operational infrastructure. NGP is an enterprise-led, business enabled initiative that will support the transformation of the Australian businesses, replacing many of the Bank’s legacy applications and processes. Other key investment activities include large-scale upgrades to technology infrastructure and the ongoing refurbishment and relocation of stores and partner sites in Australia and New Zealand.
Spend on compliance and operational risk decreased by $9 million or 13.6% against the March 2011 half year. Initiatives include activities to support financial planning in NAB Wealth and to ensure compliance with the Personal Property Securities Act in Australia, the Foreign Account Tax Compliance Act in the US, the Financial Advisors Act and Anti-Money Laundering legislation in New Zealand and Basel III across the organisation.
Investment in efficiency and sustainable revenue decreased by $10 million or 7.7% compared to the March 2011 half year. The Group continues to identify opportunities to better service its customers. Business Banking activities include continued improvements in nabConnect to improve customer offerings in online channels. Personal Banking activities include improvements in fraud protection. NAB Wealth continue to enhance customer facing technology and back office infrastructure. Activities in Wholesale Banking include the continued development of software platforms to assist in achieving cross-sell. NZ Banking activities include the enhancement of banking services and improvements to NZ Partners’ products and services.
TaxationHalf Year to
Mar 12 Sep 11 Mar 11 Mar 12 v Mar 12 vSep 11 Mar 11
Income tax expense ($m) 1,121 1,076 1,066 (4.2%) (5.2%)Effective tax rate (%) 27.9 27.0 27.9 (90 bps) -
March 2012 v March 2011Income tax expense for the March 2012 half year was $55 million or 5.2% higher than the March 2011 half year, mainly due to an increase in cash earnings before tax. Excluding foreign exchange rate movements, the income tax expense for the half year was $53 million or 5.0% higher than the March 2011 half year.
The effective income tax rate for the March 2012 half year of 27.9% is the same as the effective income tax rate of the March 2011 half year.
March 2012 v September 2011Income tax expense for the March 2012 half year was $45 million or 4.2% higher than the September 2011 half year. Excluding foreign exchange rate movements, the income tax expense for the half year was $44 million or 4.1% higher than the September 2011 half year.
The effective income tax rate for the March 2012 half year of 27.9% is comparable to the effective income tax rate of the September 2011 half year of 27.0%.

Half Year Results
2012
22
Review of Operating Environment, Group Operations and Results
Non-cash Earnings Items
DistributionsDistributions relating to hybrid equity instruments are treated as an expense for cash earnings purposes and as a reduction in equity (dividend) for statutory purposes. The hybrid equity instruments are National Income Securities, Trust Preferred Securities, Trust Preferred Securities II and National Capital Instruments.
Treasury SharesFor statutory reporting purposes, the Group eliminates the effect on statutory net profit of the Group’s life insurance business investment in National Australia Bank Limited shares. The elimination includes unrealised mark-to-market movements arising from changes in National Australia Bank Limited’s share price, dividend income and realised profits and losses on the disposal of shares. Included in the Group’s life insurance business in the March 2012 half year was a net gain of $103 million ($92 million after tax) attributable to these adjustments.
Fair Value and Hedge IneffectivenessFair Value and hedge ineffectiveness cause volatility in statutory profit, which is excluded from cash earnings as it is income neutral over the full-term of transactions. This arises from: fair value movements relating to trading derivatives for risk management purposes; fair value movements relating to assets, liabilities and derivatives designated in hedge relationships; and fair value movements relating to assets and liabilities designated at fair value.
In the March 2012 half year there was a reduction in statutory profit of $39 million ($40 million after tax) from fair value and hedge ineffectiveness. This was largely due to changes in the fair value of assets and liabilities designated at fair value, partially offset by changes in the fair value of derivatives used to hedge long-term funding from movements in spreads between Australian and overseas interest rates.
IoRE Discount Rate VariationThe IoRE discount rate variation represents the impact on earnings of the change in value of deferred acquisition costs (net of reinsurance) included in insurance policy liabilities resulting from a movement in inflation and the risk free discount rate. In the March 2012 half year the discount rate was steady but the inflation rate increased. This resulted in a decrease in the present value of deferred acquisition costs, resulting in a pre-tax loss of $7 million ($5 million after tax).
UK Payment Protection Insurance ProvisionIn response to a substantial increase in the volume of payment protection insurance (PPI) claims since January 2012, an additional provision of $182 million (£120 million) for potential claims relating to PPI was announced on 30 April 2012. This additional provision reflects an updated assessment of future PPI claims based upon estimates, statistical analysis and assumptions in relation to a wide range of factors that remain uncertain, including how many PPI claims will be made against Clydesdale Bank PLC, for what value, and the prospects of mis-selling being established in relation to those claims.
Litigation Expense
The Group recognised $32 million ($24 million after tax) in non-recurring litigation expenses during the March 2012 half year.
Hedging Costs on SCDO AssetsAs announced on 22 March 2012, the Group entered into transactions to remove the economic risk on the Group’s two remaining Synthetic Collateralised Debt Obligation (SCDO) assets.
As previously disclosed, the recognition of remaining hedging costs related to the SCDO risk mitigation trades have been accelerated by expensing the carrying value of these hedge costs to non-cash earnings. During the March 2012 half year, $141 million ($99 million after tax), of such costs were expensed through non-cash earnings.
Goodwill and Software impairment On 30 April 2012 the Group announced the outcome of the UK Banking strategic review. The outcomes of this review include the write-off of $295 million of goodwill relating to UK Banking and the impairment of capitalised software of $54 million relating to assets that will be used in a substantially reduced form from what had been originally planned.
Amortisation of Acquired Intangible AssetsThe amortisation of acquired intangibles represents the amortisation of intangible assets acquired through business combinations such as core deposit intangibles, brand names and value of business and contracts in force.
Due Diligence, Acquisition and Integration CostsAcquisition and integration costs represent expenses associated with integrating acquisitions within the NAB operating model and reporting platforms, as well as costs associated with acquisitions.
The Aviva acquisition was completed on 1 October 2009. The integration of Aviva’s insurance operations, its discretionary investment platform, Navigator, and Business Super continues in line with expectations. The total integration costs recognised for the March 2012 half year amounted to $24 million.
The strategic alliance with Goldman Sachs JBWere (GSJBW) was completed on 1 November 2009 after NAB Wealth acquired 80.1% of GSJBW’s private wealth management business in Australia and New Zealand, which was branded JBWere. The total integration costs recognised for the March 2012 half year were $28 million.
The Challenger Mortgage Management acquisition, now branded Advantedge, was completed on 30 October 2009. This integration is now complete, with $4 million of expenditure recognised in the March 2012 half year. Due diligence costs of $3 million were incurred during the March 2012 half year.
Half year toMar 12 Sep 11 Mar 11
$m $m $mAviva 24 74 49 JBWere 28 43 16 Advantedge 4 6 23 Great Western Bank 1 - 3 Due diligence costs 3 10 5
Pre-tax total 60 133 96

Half Year Results
2012
23
Review of Operating Environment, Group Operations and Results
LendingAs at
31 Mar 12 30 Sep 11 31 Mar 11 Mar 12 v Mar 12 v$m $m $m Sep 11 % Mar 11 %
HousingBusiness Banking 60,346 60,215 58,908 0.2 2.4 Personal Banking 136,221 130,465 120,223 4.4 13.3 Wholesale Banking 421 487 578 (13.6) (27.2)NAB Wealth 16,087 16,104 15,610 (0.1) 3.1 NZ Banking 21,954 21,535 19,783 1.9 11.0 UK Banking 22,466 22,306 20,464 0.7 9.8 Great Western Bank 540 615 586 (12.2) (7.8)Corporate Functions and Other 1,399 1,337 1,160 4.6 20.6
Total housing 259,434 253,064 237,312 2.5 9.3
Non-housingBusiness Banking 138,309 135,856 133,847 1.8 3.3 Personal Banking 9,196 9,086 8,950 1.2 2.7 Wholesale Banking 17,144 15,464 13,226 10.9 29.6 NAB Wealth 2,690 2,757 2,817 (2.4) (4.5)UK Banking 29,030 31,481 30,611 (7.8) (5.2)NZ Banking 23,803 23,057 21,455 3.2 10.9 Great Western Bank 4,677 4,728 4,453 (1.1) 5.0 Specialised Group Assets 3,603 4,863 5,284 (25.9) (31.8)Corporate Functions and Other 2,521 1,769 1,291 42.5 95.3
Total non-housing 230,973 229,061 221,934 0.8 4.1
Gross loans and advances including acceptances 490,407 482,125 459,246 1.7 6.8
Represented by:Loans and advances at fair value 56,596 50,472 41,567 12.1 36.2 Loans at amortised cost 394,039 388,636 371,744 1.4 6.0 Acceptances 39,772 43,017 45,935 (7.5) (13.4)
Gross loans and advances including acceptances 490,407 482,125 459,246 1.7 6.8
March 2012 v March 2011Lending (gross loans and advances including acceptances) increased by $31.2 billion or 6.8% on March 2011. Excluding foreign exchange, lending increased by $29.2 billion or 6.1%. This increase was primarily due to continuing momentum in housing lending.
Housing lending increased by $22.1 billion or 9.3% during the half. Excluding foreign exchange, the increase was $21.0 billion or 8.3%. This growth was due to the Group’s strategy to remain competitive in this sector. Growth was achieved through continued momentum in Personal Banking, UK Banking and NZ Banking as a result of the effective execution of this strategy.
Non-housing lending increased by $9.1 billion or 4.1% over the period. Excluding foreign exchange, the increase was $8.1 billion or 3.6% this growth was mainly due to: - An increase of $4.5 billion or 3.3% in Business
Banking, with growth above credit system across most segments.
- An increase of $4.0 billion or 25.9% in Wholesale Banking, mainly reflecting growth in warehouse facilities in the Global Capital Markets business and lending in Specialised Finance.
- Growth of $0.8 billion or 3.6% in NZ Banking, despite weak demand for business credit. NZ Banking increased its market share in key segments, including agribusiness.
- An increase in Corporate Functions and Other of $1.2 billion or 74.4% due to growth in Asia Banking. This was mainly in the Corporate Loan Portfolio.
- A decline of $1.6 billion or 34.6% in Specialised Group Assets (SGA) due to the repayment of loans as the business is being managed down.
- A decline of $1.1 billion or 3.8% in UK Banking due to subdued demand for credit, together with a focus on managing down commercial property and unsecured personal lending exposures.
March 2012 v September 2011Lending increased by $8.3 billion or 1.7% on September 2011. Excluding foreign exchange, lending increased by $10.9 billion or 2.3% on September 2011. This growth was due to:
Housing lending increasing by $6.4 billion or 2.5%. Excluding foreign exchange, the increase was $7.2 billion or 2.9%. Growth was achieved in Personal Banking, UK Banking and NZ Banking. Modest growth was also achieved in Business Banking.
Non-housing lending increasing by $1.9 billion or 0.8%. Excluding foreign exchange, there was an increase of $3.7 billion or 1.6%, reflecting growth in Business Banking, Wholesale Banking, NZ Banking and Asia Banking, partially offset by declines in SGA and UK Banking. The increase in Business Banking reflected continued growth in the SME and most specialised business segments. The growth in Wholesale Banking was mainly in warehouse facilities in the Global Capital Markets business and in Specialised Finance. The growth in NZ Banking was largely due to increased agricultural lending. There was also growth in Asia Banking largely driven by growth in the Corporate Loan Portfolio. The decline in SGA was due to the continued efforts to manage down the business. The decline in UK Banking was due to subdued demand for credit and the focus on reshaping the loan portfolio by managing down commercial property and unsecured personal lending exposures.
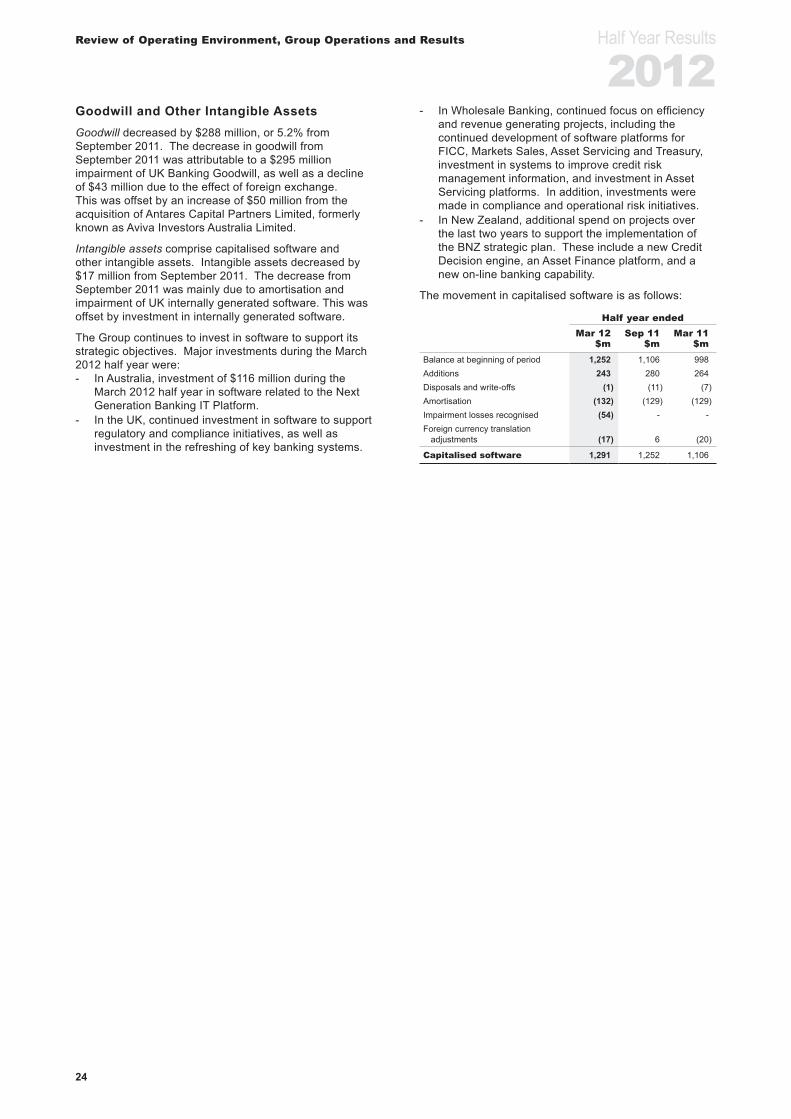
Half Year Results
2012
24
Review of Operating Environment, Group Operations and Results
Goodwill and Other Intangible AssetsGoodwill decreased by $288 million, or 5.2% from September 2011. The decrease in goodwill from September 2011 was attributable to a $295 million impairment of UK Banking Goodwill, as well as a decline of $43 million due to the effect of foreign exchange. This was offset by an increase of $50 million from the acquisition of Antares Capital Partners Limited, formerly known as Aviva Investors Australia Limited.
Intangible assets comprise capitalised software and other intangible assets. Intangible assets decreased by $17 million from September 2011. The decrease from September 2011 was mainly due to amortisation and impairment of UK internally generated software. This was offset by investment in internally generated software.
The Group continues to invest in software to support its strategic objectives. Major investments during the March 2012 half year were: - In Australia, investment of $116 million during the
March 2012 half year in software related to the Next Generation Banking IT Platform.
- In the UK, continued investment in software to support regulatory and compliance initiatives, as well as investment in the refreshing of key banking systems.
- In Wholesale Banking, continued focus on efficiency and revenue generating projects, including the continued development of software platforms for FICC, Markets Sales, Asset Servicing and Treasury, investment in systems to improve credit risk management information, and investment in Asset Servicing platforms. In addition, investments were made in compliance and operational risk initiatives.
- In New Zealand, additional spend on projects over the last two years to support the implementation of the BNZ strategic plan. These include a new Credit Decision engine, an Asset Finance platform, and a new on-line banking capability.
The movement in capitalised software is as follows:
Half year endedMar 12 Sep 11 Mar 11
$m $m $mBalance at beginning of period 1,252 1,106 998 Additions 243 280 264 Disposals and write-offs (1) (11) (7)Amortisation (132) (129) (129)Impairment losses recognised (54) - - Foreign currency translation
adjustments (17) 6 (20)
Capitalised software 1,291 1,252 1,106

Half Year Results
2012
25
Review of Operating Environment, Group Operations and Results
Retail DepositsAs at
31 Mar 12 30 Sep 11 31 Mar 11 Mar 12 v Mar 12 v$m $m $m Sep 11 % Mar 11 %
Retail depositsBusiness Banking 95,951 89,777 84,889 6.9 13.0 Personal Banking 80,779 75,408 70,375 7.1 14.8 NAB Wealth 11,730 10,238 10,119 14.6 15.9 NZ Banking 26,873 24,977 23,072 7.6 16.5 UK Banking 38,315 37,738 35,619 1.5 7.6 Great Western Bank 6,312 6,425 6,241 (1.8) 1.1 Corporate Functions and Other 3,605 4,420 5,126 (18.4) (29.7)
Total retail deposits 263,565 248,983 235,441 5.9 11.9
March 2012 v March 2011Retail deposits have increased by $28.1 billion or 11.9% since March 2011. Excluding foreign exchange, retail deposits have increased by $27.1 billion or 11.5%, driven by the Group’s strategy to focus on sustainable customer deposits as a source of funding to strengthen the balance sheet. This growth excluding foreign exchange was mainly due to: - An increase of $11.1 billion or 13.0% in Business
Banking, largely driven by growth in term deposits and transaction accounts.
- An increase of $10.4 billion or 14.8% in Personal Banking, due to growth in both UBank and in the proprietary network, as a result of growth in term deposits and online savings accounts.
- An increase of $1.6 billion or 15.9% in NAB Wealth, largely as a result of growth in term deposits.
- An increase of $2.2 billion or 8.8% in NZ Banking, mainly due to growth in term deposits and savings deposits.
- An increase of $3.2 billion or 9.1% in UK Banking, mainly driven by growth in term deposits which was partially offset by a decline in savings deposits.
- A decrease of $1.5 billion or 29.2% in Corporate Functions and Other from a decline in Asia Banking, largely driven by a decline in term deposits, mainly due to intense competition for and pricing of deposits across Asia.
March 2012 v September 2011Retail deposits have increased by $14.6 billion or 5.9% since September 2011. Excluding foreign exchange, retail deposits have increased by $16.5 billion or 6.7%. This growth excluding foreign exchange was mainly attributable to: - An increase of $6.2 billion or 6.9% in Business
Banking, reflecting the continued focus on increasing customer deposits.
- An increase of $5.4 billion or 7.1% in Personal Banking, through continued momentum in UBank and the proprietary network, driven by growth in term deposits.
- An increase of $1.5 billion or 14.6% in NAB Wealth, due to growth in term deposits.
- An increase of $1.8 billion or 7.0% in NZ Banking, due to growth in term deposits and savings deposits.
- An increase of $2.0 billion or 5.4% in UK Banking, largely as a result of growth in term deposits which was partially offset by a decline in savings deposits.
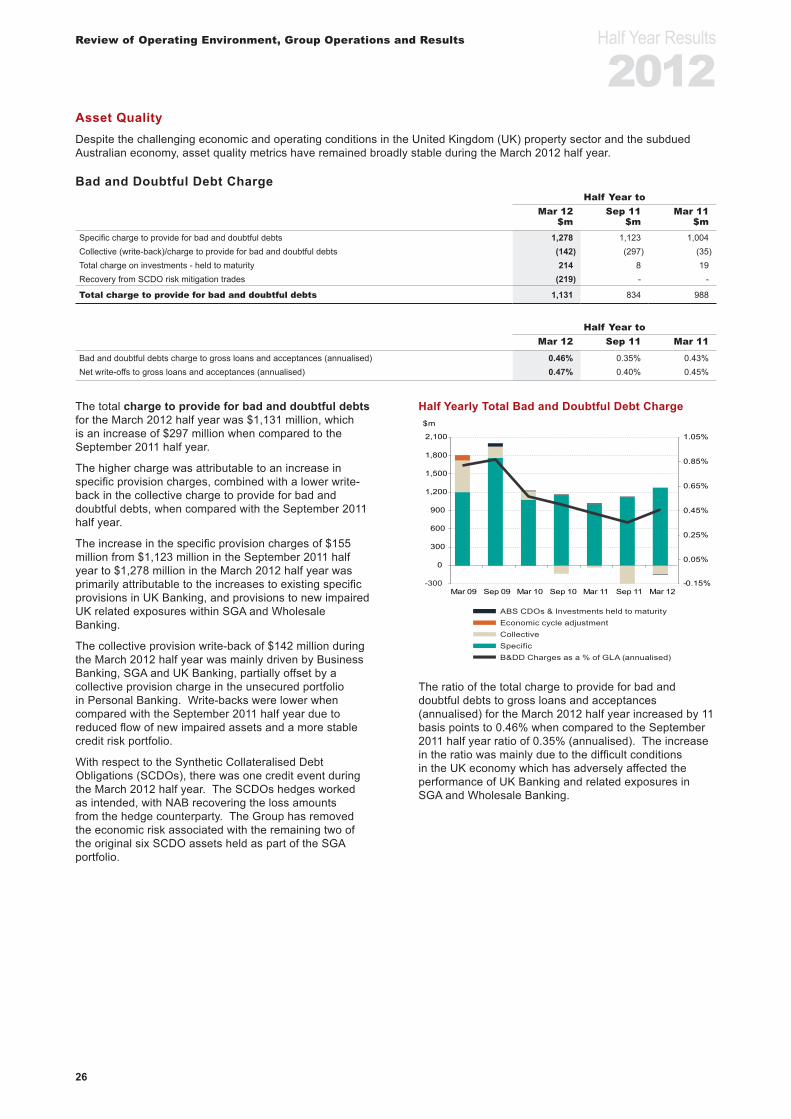
Half Year Results
2012
26
Review of Operating Environment, Group Operations and Results
Asset QualityDespite the challenging economic and operating conditions in the United Kingdom (UK) property sector and the subdued Australian economy, asset quality metrics have remained broadly stable during the March 2012 half year.
Bad and Doubtful Debt ChargeHalf Year to
Mar 12 Sep 11 Mar 11$m $m $m
Specific charge to provide for bad and doubtful debts 1,278 1,123 1,004 Collective (write-back)/charge to provide for bad and doubtful debts (142) (297) (35)Total charge on investments - held to maturity 214 8 19 Recovery from SCDO risk mitigation trades (219) - -
Total charge to provide for bad and doubtful debts 1,131 834 988
Half Year toMar 12 Sep 11 Mar 11
Bad and doubtful debts charge to gross loans and acceptances (annualised) 0.46% 0.35% 0.43% Net write-offs to gross loans and acceptances (annualised) 0.47% 0.40% 0.45%
The total charge to provide for bad and doubtful debts for the March 2012 half year was $1,131 million, which is an increase of $297 million when compared to the September 2011 half year.
The higher charge was attributable to an increase in specific provision charges, combined with a lower write-back in the collective charge to provide for bad and doubtful debts, when compared with the September 2011 half year.
The increase in the specific provision charges of $155 million from $1,123 million in the September 2011 half year to $1,278 million in the March 2012 half year was primarily attributable to the increases to existing specific provisions in UK Banking, and provisions to new impaired UK related exposures within SGA and Wholesale Banking.
The collective provision write-back of $142 million during the March 2012 half year was mainly driven by Business Banking, SGA and UK Banking, partially offset by a collective provision charge in the unsecured portfolio in Personal Banking. Write-backs were lower when compared with the September 2011 half year due to reduced flow of new impaired assets and a more stable credit risk portfolio.
With respect to the Synthetic Collateralised Debt Obligations (SCDOs), there was one credit event during the March 2012 half year. The SCDOs hedges worked as intended, with NAB recovering the loss amounts from the hedge counterparty. The Group has removed the economic risk associated with the remaining two of the original six SCDO assets held as part of the SGA portfolio.
Half Yearly Total Bad and Doubtful Debt Charge
-300
ABS CDOs & Investments held to maturityEconomic cycle adjustmentCollectiveSpecificB&DD Charges as a % of GLA (annualised)
-0.15%
0.05%
0.25%
0.45%
0.65%
0.85%
1.05%
0
300
600
900
1,200
1,500
1,800
2,100
Mar 09 Sep 09 Mar 10 Sep 10 Mar 11 Sep 11 Mar 12
$m
The ratio of the total charge to provide for bad and doubtful debts to gross loans and acceptances (annualised) for the March 2012 half year increased by 11 basis points to 0.46% when compared to the September 2011 half year ratio of 0.35% (annualised). The increase in the ratio was mainly due to the difficult conditions in the UK economy which has adversely affected the performance of UK Banking and related exposures in SGA and Wholesale Banking.

Half Year Results
2012
27
Review of Operating Environment, Group Operations and Results
Provisioning CoverageAs at
Mar 12 Sep 11 Mar 11Provisions for bad and doubtful debts $m $m $m
Collective provision on loans at amortised cost 2,333 2,505 2,781 Collective provision on loans and derivatives at fair value 725 893 707
Collective provision for bad and doubtful debts 3,058 3,398 3,488
Specific provision on loans at amortised cost 1,552 1,475 1,299 Specific provision on loans at fair value 82 71 120
Specific provision for bad and doubtful debts 1,634 1,546 1,419
Total provision for bad and doubtful debts (1) 4,692 4,944 4,907
(1) Not included in total provisions for doubtful debts are provisions on investments - held to maturity of $91 million (September 2011 $204 million, March 2011 $187 million).
As atMar 12 Sep 11 Mar 11
Total provision to gross loans and acceptances 0.96% 1.03% 1.07% Specific provision to gross impaired assets 26.8% 24.2% 22.6%
Collective provision to credit risk-weighted assets (excluding housing) 1.36% 1.45% 1.46%
Collective provision including GRCL on a pre-tax basis (top-up) to credit risk-weighted assets (excluding housing) 1.76% 1.86% 1.88%
Total provision for doubtful debts decreased by $252 million from $4,944 million at September 2011 to $4,692 million at March 2012. The decrease was largely due to lower collective provision balances, partially offset by higher specific provision balances as at March 2012.
The Group’s collective provision at March 2012 includes a NZ$50 million overlay for potential credit losses arising from the major New Zealand earthquakes.
The ratio of specific provisions to gross impaired assets increased from 24.2% at September 2011 to 26.8% at March 2012 largely due to the increase in existing specific provisions to longstanding exposures in Business Banking and UK Banking as conditions in the UK commercial property sector deteriorated further during the March 2012 half year.
The Group’s collective provision to credit risk-weighted assets (excluding housing) ratio decreased by nine basis points to 1.36% at March 2012, when compared to September 2011. The decrease reflects the reduction in the collective provision.
The general reserve for credit losses (“GRCL”) top-up decreased from $716 million at September 2011 to $710 million ($911 million on pre-tax basis) at March 2012.
When the GRCL is added to the Group’s ratio of collective provision to credit risk-weighted assets (excluding housing), the ratio increases from 1.36% to 1.76% as at March 2012, and is lower when compared to September 2011 (1.86%).
Provision and GRCL Coverage
0%
5%
10%
15%
20%
25%
30%
35%
40%
0.0%
0.4%
0.8%
1.2%
1.6%
2.0%
Mar 09 Sep 09 Mar 10 Sep 10 Mar 11 Sep 11 Mar 12
GRCL top up (pre-tax) as % of Credit Risk Weighted Assets (ex Housing) (LHS)Collective Provisions as % of Credit Risk Weighted Assets (ex Housing) (LHS)Specific Provisions as % of Impaired Assets (RHS)
Specific Provisions
The specific provision balance increased from $1,546 million at September 2011 to $1,634 million as at March 2012. The increase was driven by higher specific provision balances in UK Banking and Business Banking.
Collective ProvisionsThe collective provision balance has continued to trend down since September 2010. Collective provision was $3,058 million as at March 2012, compared to $3,398 million as at September 2011. The decrease of $340 million is attributable as follows:
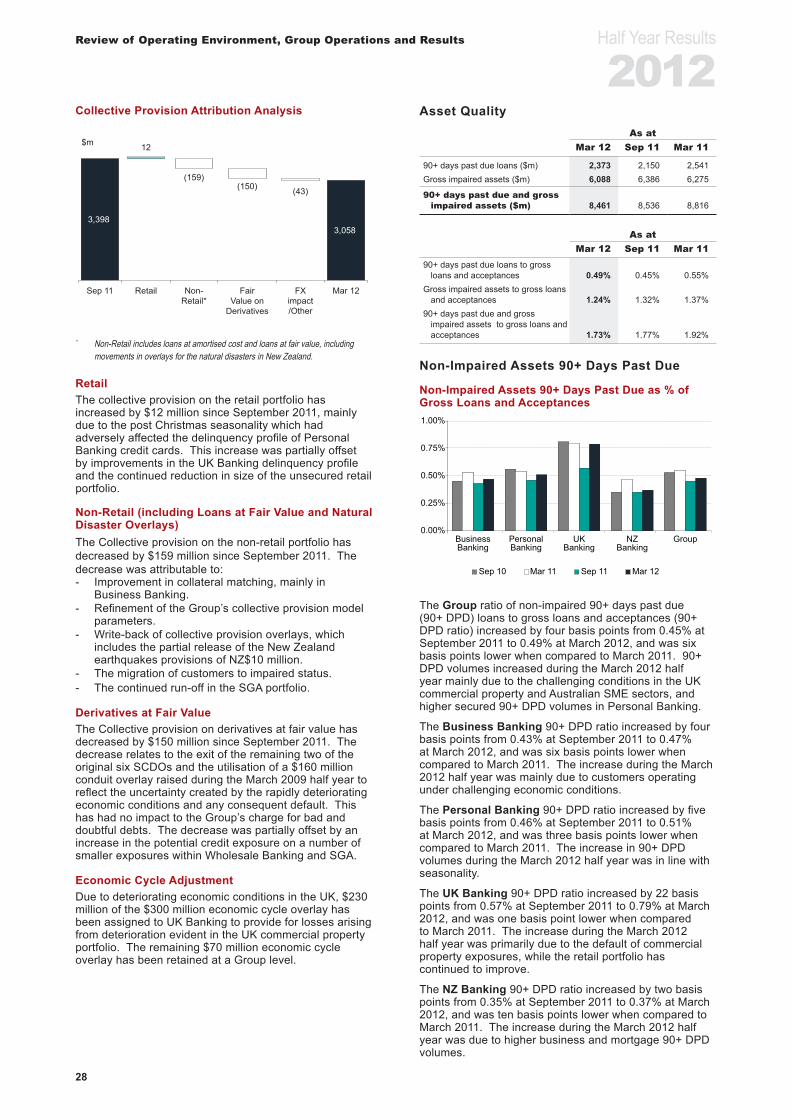
Half Year Results
2012
28
Review of Operating Environment, Group Operations and Results
Collective Provision Attribution Analysis
$m
Sep 11
3,398
Mar 12
3,058
Retail
12
Non-Retail*
(159)
FairValue on
Derivatives
(150)
FXimpact/Other
(43)
* Non-Retail includes loans at amortised cost and loans at fair value, including movements in overlays for the natural disasters in New Zealand.
RetailThe collective provision on the retail portfolio has increased by $12 million since September 2011, mainly due to the post Christmas seasonality which had adversely affected the delinquency profile of Personal Banking credit cards. This increase was partially offset by improvements in the UK Banking delinquency profile and the continued reduction in size of the unsecured retail portfolio.
Non-Retail (including Loans at Fair Value and Natural Disaster Overlays)The Collective provision on the non-retail portfolio has decreased by $159 million since September 2011. The decrease was attributable to: - Improvement in collateral matching, mainly in
Business Banking. - Refinement of the Group’s collective provision model
parameters. - Write-back of collective provision overlays, which
includes the partial release of the New Zealand earthquakes provisions of NZ$10 million.
- The migration of customers to impaired status. - The continued run-off in the SGA portfolio.
Derivatives at Fair ValueThe Collective provision on derivatives at fair value has decreased by $150 million since September 2011. The decrease relates to the exit of the remaining two of the original six SCDOs and the utilisation of a $160 million conduit overlay raised during the March 2009 half year to reflect the uncertainty created by the rapidly deteriorating economic conditions and any consequent default. This has had no impact to the Group’s charge for bad and doubtful debts. The decrease was partially offset by an increase in the potential credit exposure on a number of smaller exposures within Wholesale Banking and SGA.
Economic Cycle AdjustmentDue to deteriorating economic conditions in the UK, $230 million of the $300 million economic cycle overlay has been assigned to UK Banking to provide for losses arising from deterioration evident in the UK commercial property portfolio. The remaining $70 million economic cycle overlay has been retained at a Group level.
Asset QualityAs at
Mar 12 Sep 11 Mar 11
90+ days past due loans ($m) 2,373 2,150 2,541 Gross impaired assets ($m) 6,088 6,386 6,275
90+ days past due and gross impaired assets ($m) 8,461 8,536 8,816
As atMar 12 Sep 11 Mar 11
90+ days past due loans to gross loans and acceptances 0.49% 0.45% 0.55%
Gross impaired assets to gross loans and acceptances 1.24% 1.32% 1.37%
90+ days past due and gross impaired assets to gross loans and acceptances 1.73% 1.77% 1.92%
Non-Impaired Assets 90+ Days Past Due
Non-Impaired Assets 90+ Days Past Due as % of Gross Loans and Acceptances
0.00%
0.25%
0.50%
0.75%
1.00%
Sep 10 Mar 11 Sep 11 Mar 12
BusinessBanking
PersonalBanking
UKBanking
NZBanking
Group
The Group ratio of non-impaired 90+ days past due (90+ DPD) loans to gross loans and acceptances (90+ DPD ratio) increased by four basis points from 0.45% at September 2011 to 0.49% at March 2012, and was six basis points lower when compared to March 2011. 90+ DPD volumes increased during the March 2012 half year mainly due to the challenging conditions in the UK commercial property and Australian SME sectors, and higher secured 90+ DPD volumes in Personal Banking.
The Business Banking 90+ DPD ratio increased by four basis points from 0.43% at September 2011 to 0.47% at March 2012, and was six basis points lower when compared to March 2011. The increase during the March 2012 half year was mainly due to customers operating under challenging economic conditions.
The Personal Banking 90+ DPD ratio increased by five basis points from 0.46% at September 2011 to 0.51% at March 2012, and was three basis points lower when compared to March 2011. The increase in 90+ DPD volumes during the March 2012 half year was in line with seasonality.
The UK Banking 90+ DPD ratio increased by 22 basis points from 0.57% at September 2011 to 0.79% at March 2012, and was one basis point lower when compared to March 2011. The increase during the March 2012 half year was primarily due to the default of commercial property exposures, while the retail portfolio has continued to improve.
The NZ Banking 90+ DPD ratio increased by two basis points from 0.35% at September 2011 to 0.37% at March 2012, and was ten basis points lower when compared to March 2011. The increase during the March 2012 half year was due to higher business and mortgage 90+ DPD volumes.

Half Year Results
2012
29
Review of Operating Environment, Group Operations and Results
The Great Western Bank 90+ DPD ratio decreased by 125 basis points from 2.11% at September 2011 to 0.86% at March 2012, and was 291 basis points lower when compared to March 2011. The decrease in the 90+ DPD volumes was reflective of the continued work-out strategies in this portfolio and run-off of the TierOne portfolio. All of the 90+ DPD loans relate to the acquired TierOne assets and these are covered by the loss share agreement with the Federal Deposit Insurance Corporation (FDIC).
Impaired Assets
Gross Impaired Assets as % of Gross Loans and Acceptances - ex Investments Held to Maturity
0.00%
2.00%
4.00%
6.00%
8.00%
10.00%
Sep 10 Mar 11 Sep 11 Mar 12
BusinessBanking
PersonalBanking
UKBanking
NZBanking
WholesaleBanking
Specia-lised
GroupAssets
GreatWestern
Bank
Group
The Group ratio of gross impaired assets to gross loans and acceptances (impaired asset ratio) decreased by eight basis points from 1.32% at September 2011 to 1.24% at March 2012, and was 13 basis points lower when compared to March 2011. The decrease in the ratio was across all divisions, apart from Wholesale Banking, which remained stable, and UK Banking. During the March 2012 half year, the level of new impaired assets decreased by 19% when compared to the prior half year. However, impaired volumes remained at elevated levels at March 2012.
For Business Banking, the impaired asset ratio decreased by nine basis points from 1.85% at September 2011 to 1.76% at March 2012, and was two basis points lower than at March 2011. The key driver was lower levels of new impaired assets in the March 2012 half year, down by 30% when compared to the September 2011 half year, while the volume of gross write-offs and loans returning to performing or repaid status remained broadly stable.
Personal Banking’s impaired asset ratio continued to improve, down marginally by one basis point from 0.10% at September 2011 to 0.09% at March 2012, and was three basis points lower when compared to March 2011. The decrease was mainly due to lower impaired mortgage volumes.
The UK Banking impaired asset ratio increased by 34 basis points from 2.55% at September 2011 to 2.89% at March 2012, and was 24 basis points higher than March 2011. The increase reflected the deterioration in market conditions, which has adversely affected the commercial property portfolio. The flow of new impaired assets during the March 2012 half year was lower when compared to the September 2011 half year. Impaired asset volumes increased as market conditions made disposal of property assets increasingly difficult and affected collateral values.
The NZ Banking impaired asset ratio decreased by 25 basis points from 1.16% at September 2011 to 0.91% at March 2012, and was 58 basis points lower when compared to March 2011. The decrease was mainly driven by lower business impaired volumes as a
result of loans being repaid or returned to performing, combined with write-offs. This was partially offset by new impaired assets for the March 2012 half year, which have decreased by 39% when compared with the September 2011 half year.
The Wholesale Banking impaired asset ratio remained broadly stable during the March 2012 half year at 0.24% compared to the September half year, and was four basis points lower when compared to March 2011. During the March 2012 half year, there were two new impairments, offset by a number of write-offs and the repayment of a previously impaired facility.
The SGA impaired ratio decreased by 32 basis points from 10.03% at September 2011 to 9.71% at March 2012, and was steady when compared to March 2011. The decrease was mainly driven by the write-offs of large specific defaults, combined with loans returning to performing or repaid status.
The Great Western Bank impaired asset ratio decreased by 61 basis points from 2.70% at September 2011 to 2.09% at March 2012, and was 22 basis points higher when compared to March 2011. The decrease in the ratio was a result of new impaired assets being offset to a greater extent by loans returning to performing or repaid status and loans being written-off.
Net Write-OffsNet write-offs increased by 21% from $958 million for the September 2011 half year to $1,155 million for the March 2012 half year. The increase in volumes was mainly due to the write-off of large UK related exposures within SGA and Wholesale Banking, followed by higher write-offs in UK Banking.
The ratio of net write-offs as a proportion of gross loans and acceptances (annualised) has increased by seven basis points from 0.40% at September 2011 half year to 0.47% at the March 2012 half year.
The gross 12 month rolling write-off rate for the Group’s retail portfolio was steady at 0.21% at March 2012 when compared to September 2011, with the mortgage gross write-off rate steady at 0.06% during the March 2012 half year.
The ratio of total provisions to net write-offs (annualised) decreased from 249% at September 2011 to 203% as at March 2012.
Group Half Yearly Net Write-Offs as a % of Gross Loans and Acceptances
0.00%
0.15%
0.30%
0.45%
0.60%
0
500
1,000
1,500
2,000
Mar 09 Sep 09 Mar 10 Sep 10 Mar 11 Sep 11 Mar 12
Net Write-OffsNet Write-Offs as % of Gross Loans and Acceptances (annualised)
$m

Half Year Results
2012
30
Review of Operating Environment, Group Operations and Results
Commercial Property PortfolioThe Group’s commercial property portfolio decreased from $60.9 billion at September 2011 to $60.0 billion at March 2012 (1). The decrease of $0.9 billion includes $0.5 billion foreign currency translation effect across the UK and US, and reductions were observed across Residential – Other, Land Development and Subdivisions, and Tourism and Leisure. This portfolio represents 12.2% of the Group’s gross loans and acceptances at March 2012, a decline of forty basis points when compared to September 2011. All geographies apart from Asia observed a decrease in commercial property exposure to their respective gross loans and acceptances during the half year.
The Business Banking commercial property portfolio was broadly stable when compared to September 2011. At March 2012, the portfolio totalled $42.9 billion, representing 11.4% of gross loans and acceptances in the Australian geography. Asset quality within the commercial property portfolio remained stable during the half year.
The UK Banking commercial property portfolio decreased marginally when compared to September 2011. At March 2012, the portfolio totalled £6.0 billion, representing(1) Measured as balances outstanding at March 2012 per APRA Commercial Property Return ARF230.
17.8% of the division’s gross loans and acceptances. The asset quality of the commercial property portfolio was challenged by deteriorating economic market conditions in the UK, as levels of default and impairment rose during the March 2012 half year. Provisioning levels in commercial property have increased as a result of new impairments and the increase of provisions to existing impaired assets, as commercial property values have continued to decline.
The NZ Banking commercial property portfolio was NZ$6.9 billion at March 2012, marginally lower when compared to September 2011 as a result of one large repayment. This portfolio represents 11.9% of the division’s gross loans and acceptances at March 2012. The commercial property 90+ DPD and impaired ratio decreased during the March 2012 half year, mainly due to the write-off to one large exposure.
The SGA commercial property portfolio totals $0.4 billion at March 2012, a decrease of $0.4 billion when compared to September 2011.
Group Commercial Property by Type Group Commercial Property by GeographyResidential,
14%Industrial,
15%
Land,9%
Tourism &Leisure, 5%
Retail,24%
Other,6%
Office,27%
SGA,1%
USA,2%
Australia,72%
Asia,1%
NewZealand,
9%
UnitedKingdom,
15%

Half Year Results
2012
31
Review of Operating Environment, Group Operations and Results
Capital Management and Funding
Balance Sheet Management OverviewDuring the March 2012 half year, market conditions were characterised by heightened periods of instability, particularly in the first quarter as the European sovereign debt crisis worsened. Market conditions improved in the New Year and the Group was able to consistently access term wholesale funding markets, including senior debt markets.
The Group remains vigilant in its evaluation of economic and market conditions, and continues to ensure the balance sheet remains strong.
Regulatory Reform
Basel Regulatory ReformsThe Basel Committee has released its reform package for both capital and liquidity (“Basel III”).
Capital ReformsIn September 2011, the Australian Prudential Regulatory Authority (APRA) released a discussion paper outlining its proposed implementation of the Basel III capital reforms. This was followed by a Basel III response paper and updated draft capital standards in late March 2012. APRA’s broad approach to capital adequacy remains unchanged after the update. The proposals may be amended prior to final implementation.
As currently drafted, the reforms are estimated to have a net impact on the Group’s Core Tier 1 position of approximately 45 basis points. Further consultation is expected over 2012. APRA proposes to phase in changes to minimum capital levels from 1 January 2013.
APRA’s changes to market risk and securitisation (Basel 2.5) became effective on 1 January 2012.
Liquidity Reforms
APRA released its draft liquidity standard and discussion paper on the implementation of the Basel III liquidity reforms in Australia during November 2011. Consultation
between APRA, industry and market participants continues.
The Group will gradually transition to the proposed liquidity metrics, including the Liquidity Coverage Ratio (LCR) by January 2015 and the Net Stable Funding Ratio (NSFR) by January 2018. In order to transition to Basel III, the Group will increasingly focus on the quality of the liquidity and stability of the funding that underpins these measures.
In addition, the RBA announced details of its Committed Liquidity Facility (CLF), which is designed to address the shortfall of Level 1 liquid assets within Australia. The CLF will cost participants a fee of 15 basis points for both drawn and undrawn commitments.
Other Reform Proposals
In addition to the Basel Committee reforms, the Group remains focused on other areas of regulatory change. Key reform proposals that may affect the Group’s capital and funding include: - APRA’s Level 3 Conglomerate Supervision
proposals, which consider capital requirements for the consolidated Banking and Wealth Management Group.
- APRA’s proposed changes to capital adequacy for life and general insurance businesses.
- The potential impacts of the US Dodd-Frank Act on the Group’s operations.
- The UK Independent Commission on Banking which may affect the structure of banks and the amount of capital held in the UK business.
Capital ManagementThe Group’s capital management strategy is focused on adequacy, efficiency and flexibility. The capital adequacy objective focuses on holding capital in excess of the internal risk-based assessment of required capital, meeting regulatory requirements, maintaining capital consistent with the Group’s Balance Sheet risk appetite, and ensuring investors’ expectations are met. This approach is consistent across the Group’s subsidiaries.
Capital ratiosCapital ratios and risk-weighted assets (RWA) are set out below:
Basel II
Target Ratio
%
As at31 Mar 12 30 Sep 11 31 Mar 11 Mar 12 v Mar 12 v
% % % Sep 11 Mar 11Core Tier 1 ratio (1) 8.03 7.58 7.12 45 bps 91 bps
Tier 1 ratio above 8.00% 10.17 9.70 9.19 47 bps 98 bps
Total capital ratio 11.52 11.26 11.33 26 bps 19 bps
(1) Core Tier 1 ratio equals Total Tier 1 Capital less Tier 1 Hybrids.
As at31 Mar 12 30 Sep 11 31 Mar 11 Mar 12 v Mar 12 v
Basel II $m $m $m Sep 11% Mar 11%Risk-weighted assets - credit risk 300,185 308,648 311,625 (2.7) (3.7)Risk-weighted assets - market risk 5,277 2,968 3,159 77.8 67.0 Risk-weighted assets - operational risk 23,810 22,255 21,862 7.0 8.9 Risk-weighted assets - interest rate risk in the banking book 6,281 7,198 8,565 (12.7) (26.7)
Total risk-weighted assets 335,553 341,069 345,211 (1.6) (2.8)

Half Year Results
2012
32
Review of Operating Environment, Group Operations and Results
Movements in Basel II Tier 1 Ratio%
Sep 11$33,075m
CashEarnings$2,828m
Dividend(net of DRPparticipation)
($1,209m)
Net RWAReduction
excl. SCDO& Basel 2.5
$6.9bn
Foreign Currency
TranslationReserve($258m)
DeferredTax Assets
$196m
Basel 2.5 RWA
($2.9bn)
Non-CashEarnings*($159m)
DRPAdjustment
($100m)
Other ^ Mar 12$34,113m
UK PaymentProtectionInsurance($182m)
9.70 10.17
0.83 0.21
0.02 (0.35)
(0.08)
0.06
(0.05) (0.09) (0.05) (0.03)
* Non-cash earnings impact after adjusting for distributions, treasury shares, UK goodwill, software impairment, and separately disclosed items. ^ ‘Other’ includes non-cash earnings impact of SCDO hedging costs expense offset by the related RWA reduction, and other immaterial movements.
The Board approved Tier 1 target is above 8%. A target of above 8% reflects the Group’s desire to maintain strong balance sheet settings and is consistent with the risk appetite of investors and the global regulatory direction. The Group continues to operate above this target and is migrating capital ratios higher, in line with APRA’s proposed Basel III regulatory requirements and rating agency and investor expectations. Board approved targets will be recalibrated when the regulatory environment becomes clearer.
Capital Movements During the PeriodThe Group’s Tier 1 ratio of 10.17% at 31 March 2012 is consistent with the Group’s objective of maintaining a strong capital position.
The key movements in capital in the March 2012 half year were: - Earnings less dividend net of Dividend Reinvestment
Plan (DRP) participation (48 basis points). - Foreign Currency Translation Reserve (FCTR) (eight
basis points). - Net RWA reduction of $6.9 billion (excludes the
removal of economic risk relating to the remaining SCDO exposures and impacts of Basel 2.5) (21 basis points).
- Decrease in Deferred Tax Assets (DTA) deduction (six basis points).
- Basel 2.5 impacts (nine basis points). - Unfavourable non-cash earnings (five basis points). - Provision for potential claims relating to PPI in the UK
(five basis points).
The unfavourable eight basis points movement in the FCTR was offset by the foreign exchange (FX) impact on RWAs (+10 basis points).
Total RWAs fell by $5.5 billion over the March 2012 half year. This was largely the result of methodology changes, optimisation and the removal of economic risk relating to the remaining SCDO exposures ($1.5 billion). The effect was partially offset by asset volume growth.
Capital Impact of the UK Strategic ReviewThe proforma Tier 1 capital effects of the UK Banking strategic review (adjusted for restructuring and other costs that will be recorded following the March 2012 half year) is an estimated reduction of 7 basis points
(excluding the adjustment for PPI which was recognised in the March 2012 half year), resulting in a Tier 1 ratio on a proforma basis of 10.1%.
Dividend and Dividend Reinvestment PlanThe interim dividend has been increased to 90 cents per share and the DRP settings have been maintained to provide a 1.5% discount with no participation limit. For the purposes of calculating the Group’s capital ratios, the interim dividend has been reduced by an amount equal to 40% of the interim dividend to reflect assumed DRP participation.
UK Defined Benefit Pension SchemeThe Group’s UK operations manage a defined benefit pension scheme (“the Scheme”). During the March 2012 half year, the Scheme’s deficit decreased to £85 million from £180 million at 30 September 2011. Improvements in the funding position of the Scheme resulted from employer contributions (including the special contribution described below) and positive asset returns, offset by a decrease in the discount rate that increased the value of the pension liability.
As announced to the market in January 2012, National Australia Bank Ltd made a special contribution of £130 million to the Scheme, which was expensed in the income statement of National Australia Bank Limited. This contribution reduced the pension deficit liability of Clydesdale Bank PLC. There was only a minor impact on the Group consolidated financial statements as a result of this special contribution.
Pillar 3 DisclosuresFurther disclosures with respect to capital adequacy and risk management will be made in the Risk and Capital Report, as required by APS 330.

Half Year Results
2012
33
Review of Operating Environment, Group Operations and Results
FundingThe Group continues to explore opportunities to enhance and diversify its funding sources.
Funding IndicesThe Group employs a range of internal Board approved metrics to set its risk appetite and measure balance sheet strength. A key measure used is the Stable Funding Index (SFI), which is made up of the Customer Funding Index (CFI) and Term Funding Index (TFI). The CFI represents the proportion of the Group’s core assets that are funded by customer deposits. Similarly, the TFI represents the proportion of the Group’s core assets that are funded by term wholesale funding with a remaining maturity greater than one year.
The Group has maintained balance sheet strength, with the Group SFI remaining at 85% as at March 2012. The Group continues to focus on deposits as a key source of balance sheet strength, with the CFI at 65%.
Group Funding Indices (CFI, TFI and SFI)
CFI TFI SFI Benchmark
64% 65% 65% 65%
20% 19% 20% 20%
84% 84% 85% 85%
Sep 10 Mar 11 Sep 11 Mar 12
Customer FundingThe Group has continued to grow customer deposits, with an emphasis on the household and small business segments. This is consistent with the Group’s proactive approach to Basel III transition and the broader strategy to acquire more customers.
The Monthly Banking Statistics published by APRA show that in the six months ended March 2012, the Group has grown Australian domestic household deposits by 8.3% (versus 5.4% system growth) and business deposits excluding deposits from financial corporations by 1.0% (versus 0.7% system growth).
Term Wholesale Funding Global term funding market conditions were fragile during the first quarter of the 2012 financial year, with increased volatility offering limited opportunities for global banks to issue senior unsecured debt. Market conditions have since been improving and are broadly supportive of term issuance, although remain sensitive to ongoing Eurozone risks and the global macroeconomic outlook.
The Group raised $14.5 billion of term wholesale funding (including secured funding) in the first half of the 2012 financial year. National Australia Bank Limited raised $12.1 billion (including $2.8 billion of covered bonds). BNZ raised $1.5 billion (including $0.9 billion of covered bonds) and Clydesdale Bank PLC raised $0.9 billion of Residential Mortgage Backed Securities (RMBS).
The weighted average maturity of term wholesale funding raised by the Group over the half year to 31 March 2012 was approximately 4.2 years to first call, slightly higher than the September 2011 half year of 4.1 years. The weighted average remaining maturity of the Group’s senior and subordinated term wholesale portfolio funding is 2.8 years (3.2 years for TFI qualifying debt, which only includes debt with more than 12 months remaining term to maturity). The average cost of term wholesale funding issued by National Australia Bank Limited (including the cost of being swapped back to Australian dollars and fees) during the first half of the 2012 financial year was approximately 178 basis points over the Bank Bill Swap Rate (BBSW), compared to an average cost of 120 basis points over BBSW in the 2011 financial year. The average cost of the National Australia Bank Limited outstanding term funding portfolio for the first half of the 2012 financial year was 134 basis points over BBSW, compared to 124 basis points over BBSW for the 2011 financial year.
The Group has a total of $11 billion of Government guaranteed wholesale funding outstanding. Of this, 10% matures in financial year 2012 and the remainder by 2014.
Short-term Wholesale FundingDespite global volatility, the Group continued to access international and domestic short-term wholesale markets without difficulty over the half year. The focus has been on maintaining the longer average maturity of the short-term book to support the Group’s liquidity position.
Liquid Asset PortfolioThe Group maintains well diversified and high quality liquid asset portfolios to support regulatory and internal requirements in the various countries in which it operates. Total liquid assets held at 31 March 2012 were $90 billion, a $5 billion decrease from 30 September 2011 and an increase of $18 billion from 31 March 2011. Liquidity holdings will be continually reassessed in light of market conditions and as the effects of proposed regulatory changes become clearer.
In addition to these liquid assets, the Group holds internal securitisation pools of RMBS as a source of contingent liquidity to further support its liquid asset holdings.

Half Year Results
2012
34
Review of Operating Environment, Group Operations and Results
Half year 2012 Wholesale Funding by Deal Type ($14.5 billion)
Half year 2012 Wholesale Funding by Currency ($14.5 billion)
Secured FundingPublic and Private
31%Senior Private
Placements, 18%
Senior PublicOffshore, 27%
Senior PublicDomestic, 24%
JPY, 8%GBP, 5%
AUD, 25% EUR, 21%
USD, 32%Other, 9%
Credit RatingsRating agencies have continued to be active in adjusting the ratings of sovereigns and banks globally, including in the various banking sectors in which the Group operates. The Group monitors rating agency developments closely and regularly communicates with them. Entities in the Group are rated by Standard and Poor’s (S&P), Moody’s Investor Service (Moody’s) and Fitch Ratings (Fitch).
The Group’s current long-term debt ratings are: NAB Limited AA-/Aa2/AA- (S&P/Moody’s/Fitch); BNZ AA-/Aa3/AA-; Clydesdale Bank PLC BBB+/A2/A; and National Wealth Management Holdings Limited A+ (S&P).
In December 2011, S&P finalised its revised Bank Rating and Bank Hybrid Rating methodologies. This resulted in downgrades for a number of banks globally.
As a result of the methodology change, the long-term ratings of National Australia Bank Limited and BNZ were downgraded from AA to AA- with stable outlook, consistent with peers. Clydesdale Bank PLC was downgraded from A+ to BBB+, largely as a result of S&P’s perception of a reduction in parental support. National Australia Bank Limited confirmed that the nature of the Group’s support for Clydesdale Bank PLC has not changed. Following the outcome of the UK Banking strategic review, S&P revised the outlook from stable to positive. National Wealth Management Holdings Limited was also downgraded from AA- to A+ with stable outlook.
In February 2012, Fitch downgraded the long-term ratings of National Australia Bank Limited and BNZ from AA to AA-. These ratings have a stable outlook, and are consistent with peers. Fitch’s rationale for the ratings adjustment was that, in their view, the major Australian banks retain a relatively higher reliance on wholesale funding than similarly rated global peers.
As part of the Fitch review, Clydesdale Bank PLC’s long-term rating was also downgraded to A with Rating Watch Negative pending the outcome of the UK Banking strategic review. Following the outcome of the UK Banking strategic review, Fitch revised the outlook from Rating Watch Negative to stable.
In February 2012, following the announcement of the UK Banking strategic review Moody’s placed Clydesdale Bank PLC on Rating Under Review. Whilst the UK Banking strategic review has now been announced, Moody’s is yet to finalise its ratings review of Clydesdale Bank PLC.
Half Year Results
2012
35
Review of Operating Environment, Group Operations and Results
Other Matters
Corporate ResponsibilityCorporate Responsibility (CR) is about doing the right thing for our customers, our people and our communities. Our approach to CR is focused on creating economic value through our role as a financial institution whilst also creating value for society by understanding and addressing key social needs and challenges.
We articulate our CR approach across three core areas: getting the fundamentals right for our customers; being a good employer; and addressing our broader responsibility to society.
The highlights of NAB’s half year CR performance are set out below (the full CR reporting and disclosures are available on the NAB website).
External awards, recognition and reporting - NAB is one of the leading 2% of companies within the
banking sector in the 2011 Dow Jones Sustainability Index.
- Included in the Ethisphere Institute list of ‘2012 World’s Most Ethical Companies’.
- Continue to be listed as a constituent company on the FTSE4Good Index.
- In March 2012 we released our inaugural Communication of Progress on the anniversary of signing the United Nations Global Compact, a strategic policy initiative for businesses that are committed to aligning their operations and strategies with ten universally accepted principles in the areas of human rights, labour, environment and anti-corruption.
- Through our continued focus on customer satisfaction, in March 2012 NAB received Canstar Blue’s most satisfied customers award for the second year in a row. NAB achieved top scores in almost all criteria, and was the only bank to receive a five star rating for overall satisfaction.
- NAB, Homeside and UBank have taken out a series of awards in Money Magazine’s annual Best of the Best Awards for 2012, which recognise Australia’s best financial products, services and investments.
- Recognised for the sixth consecutive year as an Employer of Choice for Women by the Equal Opportunity for Women in the Workplace Agency.
- Awarded the Wayne Cascio Award for Organisational Development & Leadership in the 2011 Australian Human Resources Institute National Awards for excellence in talent management practices.
- Awarded the Environmental Tracking Scope 3 Disclosure Leader award and ranked second in the Environmental Tracking Asia-Pacific 300 according to greenhouse gas emissions and levels of transparency.
- We are one of 61 companies globally and one of only three in Australia participating in the International Integrated Reporting Council Integrated Reporting Program. The International Integrated Reporting Council is leading the development of a global framework for integrated reporting.
Initiatives to Support Customers - We maintain our longstanding commitment to
improving the financial inclusion and literacy of Australians. This year, NAB has written over 11,200 microfinance loans, with $130 million committed to helping Australians on low incomes or who have little access to affordable business credit.
- In March NAB, in conjunction with the Centre for Social Impact (CSI), we released a new research report, Small is the new big: Measuring the impact of NAB’s Microenterprise Loans. The report outlines the wide ranging social and economic benefits of providing funding to businesses that would otherwise have no avenues to credit.
- In February 2012 a new business payments card was launched, designed to make it easier for customers to manage their business purchases and expenses, particularly small to medium sized businesses. Similar to a Visa debit card, but with additional functionality giving businesses even more control using their own money to make purchases.
- On 14 March 2012 NAB launched the redesigned Credit Card statement. The new statement provides customers with clearer information on payment details, how to avoid interest on purchases and the late payment fee.
- ‘Customer centric’ training has now been delivered to 4,500 employees to continue to improve customer service levels across our network.
Initiatives to Support Employees - Established a People Council in 2012. It is comprised
of our Australian Executive members and aims to direct, review and approve NAB’s overall approach to people and culture.
- Gender diversity and inclusion continues to be a key priority for the Group. Various activities to improve gender diversity in the business include: - Setting measurable gender targets for the number
of women in senior executive positions, subsidiary boards and core talent development programs.
- Participating in the International Women’s Day celebrations in March 2012.
- BNZ signing the United Nations Principles for the Empowerment of Women and in the UK launching a new employee network group for women in November 2011.
- Undertaking Unconscious Bias training with 160 senior managers completing this training.
- Diversity and Inclusion Supplier Principles have now been rolled out to external recruitment providers.
Initiatives to Support Communities - The launch of NAB’s fourth Reconciliation Action
Plan took place on 1 March 2012. The key areas of focus continue to be financial inclusion, employment opportunities and cultural awareness.
- Staff participation in volunteering at NAB continues to grow - participation for the March 2012 half year is 20.7% compared to 15.7% in the March 2011 half year and the percentage of skilled volunteering is 7% in the March 2012 half year, compared to 5.7% in the March 2011 half year.
- CR and The Academy are partnering to encourage employees to link their development plans with skilled volunteering opportunities.
- NAB Schools First announced the 2011 National, State/Territory, Impact and Seed Funding Award winners. During the year, $5 million in award funding was shared among 110 award winning school-community partnerships. Over the past three years, NAB Schools First has awarded $15 million to 310 outstanding school-community partnerships in recognition of the positive contribution these partnerships are making to the lives of young Australians. More than 2,100 of our employees have volunteered their time to work with partnerships as part of the program.

Half Year Results
2012
36
Review of Operating Environment, Group Operations and Results
This page has been left blank intentionally.

37
Half Year Results
2012Section 4
Review of Divisional Operations and Results
Divisional Performance Summary 38
Business Banking 42
Personal Banking 46
Wholesale Banking 50
NAB Wealth 54
NZ Banking 62
UK Banking 66
Great Western Bank 70
Specialised Group Assets 74
Corporate Functions and Other 78

Half Y
ear R
esult
s
2012
38
Rev
iew
of
Div
isio
nal
Ope
rati
ons
and
Res
ults
Rev
iew
of
Div
isio
nal
Ope
rati
ons
and
Res
ults
Div
isio
nal P
erfo
rman
ce S
umm
ary
Hal
f ye
ar e
nded
Bus
ines
s B
anki
ngP
erso
nal
Ban
king
Who
lesa
le
Ban
king
NA
B
Wea
lth
NZ
B
anki
ngU
K
Ban
king
GW
B
Spe
cial
ised
G
roup
A
sset
s
Cor
pora
te
Func
tion
s &
Oth
er (1
)D
istr
ibut
ions
&
Elim
inat
ions
Gro
up
Cas
h E
arni
ngs
31 M
arch
201
2$m
$m$m
$m$m
$m$m
$m$m
$m$m
Net
inte
rest
inco
me
2,5
30
1,4
45
784
1
63
549
6
84
132
5
4 3
67
- 6
,708
Fe
es a
nd c
omm
issi
ons
422
2
69
127
1
3 1
51
212
3
0 6
4
-
1,2
34
Trad
ing
inco
me
54
7
268
1
-
2
- 2
1 (5
8) -
295
O
ther
41
10
40
3
28
3
5
6
22
(47)
111
Oth
er o
pera
ting
inco
me
517
2
86
435
1
7 1
79
217
3
5 3
3 (3
2) (4
7) 1
,640
N
AB
Wea
lth n
et o
pera
ting
inco
me
- -
- 7
60
- -
- -
- -
760
Net
ope
ratin
g in
com
e 3
,047
1
,731
1
,219
9
40
728
9
01
167
8
7 3
35
(47)
9,1
08
Ope
ratin
g ex
pens
es (8
75)
(902
) (4
65)
(571
) (2
89)
(529
) (8
3) (1
8) (2
67)
47
(3,9
52)
Und
erly
ing
profi
t 2
,172
8
29
754
3
69
439
3
72
84
69
68
- 5
,156
(C
harg
e to
pro
vide
for)
/ben
efit f
rom
bad
and
dou
btfu
l deb
ts (3
72)
(169
) (4
7) (5
) (2
6) (4
28)
(14)
(71)
1
- (1
,131
)
Cas
h ea
rnin
gs/(d
efici
t) b
efor
e ta
x, I
oRE
, dis
trib
utio
ns a
nd
non-
cont
rolli
ng in
tere
st 1
,800
6
60
707
3
64
413
(5
6) 7
0 (2
) 6
9 -
4,0
25
Inco
me
tax
(exp
ense
)/ben
efit
(536
) (1
96)
(189
) (1
04)
(116
) 2
0 (2
2) (1
) 2
3 -
(1,1
21)
Cas
h ea
rnin
gs/(d
efici
t) b
efor
e Io
RE
, dis
trib
utio
ns a
nd n
on-
cont
rolli
ng in
tere
st 1
,264
4
64
518
2
60
297
(3
6) 4
8 (3
) 9
2 -
2,9
04
Net
pro
fit -
non-
cont
rolli
ng in
tere
st -
- -
(1)
- -
- -
- -
(1)
IoR
E -
- -
30
- -
- -
- -
30
Dis
tribu
tions
- -
- -
- -
- -
- (1
05)
(105
)
Cas
h ea
rnin
gs/(d
efici
t) 1
,264
4
64
518
2
89
297
(3
6) 4
8 (3
) 9
2 (1
05)
2,8
28
Key
bal
ance
she
et it
ems
($bn
)To
tal
Gro
ss lo
ans
and
acce
ptan
ces
(ave
rage
) 1
97.2
1
42.3
1
7.5
18.
7 4
4.4
51.
2 5
.2
4.2
3
.4
- 4
84.1
R
etai
l dep
osits
(ave
rage
) 9
4.4
77.
8 -
11.
1 2
5.9
36.
7 6
.2
- 3
.0
- 2
55.1
To
tal r
isk-
wei
ghte
d as
sets
(spo
t) 1
40.6
4
0.4
42.
5 6
.9
31.
7 4
8.5
5.3
8
.0
11.
7 -
335
.6
(1)
Corp
orate
Fun
ction
s & O
ther in
clude
s Gro
up F
undin
g, Gr
oup B
usine
ss S
ervic
es, o
ther s
uppo
rting u
nits a
nd A
sia B
ankin
g.

38
Half Y
ear R
esult
s
2012
39
39
Rev
iew
of
Div
isio
nal
Ope
rati
ons
and
Res
ults
Div
isio
nal P
erfo
rman
ce S
umm
ary
Hal
f ye
ar e
nded
Bus
ines
s B
anki
ngP
erso
nal
Ban
king
Who
lesa
le
Ban
king
NA
B
Wea
lth
NZ
B
anki
ngU
K
Ban
king
GW
B
Spe
cial
ised
G
roup
A
sset
s
Cor
pora
te
Func
tion
s &
Oth
er (1
)D
istr
ibut
ions
&
Elim
inat
ions
Gro
up
Cas
h E
arni
ngs
30 S
epte
mbe
r 20
11$m
$m$m
$m$m
$m$m
$m$m
$m$m
Net
inte
rest
inco
me
2,5
87
1,4
58
708
1
68
528
7
54
130
5
8 3
97
- 6
,788
Fe
es a
nd c
omm
issi
ons
420
2
79
115
1
8 1
46
220
3
1 5
(1
2) -
1,2
22
Trad
ing
inco
me
49
3
(24)
1
- (4
) -
(73)
(59)
- (1
07)
Oth
er 4
5 7
6
0 (3
) 2
8 1
8 1
2 3
8 1
8 (4
7) 1
76
Oth
er o
pera
ting
inco
me
514
2
89
151
1
6 1
74
234
4
3 (3
0) (5
3) (4
7) 1
,291
N
AB
Wea
lth n
et o
pera
ting
inco
me
- -
- 7
16
- -
- -
- -
716
Net
ope
ratin
g in
com
e 3
,101
1
,747
8
59
900
7
02
988
1
73
28
344
(4
7) 8
,795
O
pera
ting
expe
nses
(885
) (9
00)
(459
) (5
67)
(291
) (5
56)
(87)
(25)
(260
) 4
7 (3
,983
)
Und
erly
ing
profi
t 2
,216
8
47
400
3
33
411
4
32
86
3
84
- 4
,812
(C
harg
e to
pro
vide
for)
/ben
efit f
rom
bad
and
dou
btfu
l deb
ts (4
17)
(138
) (3
3) (7
) (4
4) (2
21)
(25)
(20)
71
- (8
34)
Cas
h ea
rnin
gs/(d
efici
t) b
efor
e ta
x, I
oRE
, dis
trib
utio
ns a
nd
non-
cont
rolli
ng in
tere
st 1
,799
7
09
367
3
26
367
2
11
61
(17)
155
-
3,9
78
Inco
me
tax
(exp
ense
)/ben
efit
(535
) (2
09)
(99)
(92)
(113
) (4
5) (2
0) 5
0 (1
3) -
(1,0
76)
Cas
h ea
rnin
gs b
efor
e Io
RE
, dis
trib
utio
ns a
nd n
on-
cont
rolli
ng in
tere
st 1
,264
5
00
268
2
34
254
1
66
41
33
142
-
2,9
02
Net
pro
fit -
non-
cont
rolli
ng in
tere
st -
- -
- -
- -
- -
- -
IoR
E -
- -
1
- -
- -
- -
1
Dis
tribu
tions
- -
- -
- -
- -
- (1
11)
(111
)
Cas
h ea
rnin
gs/(d
efici
t) 1
,264
5
00
268
2
35
254
1
66
41
33
142
(1
11)
2,7
92
Key
bal
ance
she
et it
ems
($bn
)To
tal
Gro
ss lo
ans
and
acce
ptan
ces
(ave
rage
) 1
94.7
1
34.2
1
5.0
18.
6 4
3.5
50.
9 4
.9
5.2
2
.7
- 4
69.7
R
etai
l dep
osits
(ave
rage
) 8
5.8
72.
4 -
9.9
2
4.5
35.
7 6
.0
- 4
.8
- 2
39.1
To
tal r
isk-
wei
ghte
d as
sets
(spo
t) 1
41.4
4
0.5
38.
0 6
.9
31.
2 5
1.9
6.3
1
5.0
9.9
-
341
.0
(1)
Corp
orate
Fun
ction
s & O
ther in
clude
s Gro
up F
undin
g, Gr
oup B
usine
ss S
ervic
es, o
ther s
uppo
rting u
nits a
nd A
sia B
ankin
g.

Half Y
ear R
esult
s
2012
40
Rev
iew
of
Div
isio
nal
Ope
rati
ons
and
Res
ults
Half Year Results
2012
41
Review of Divisional Operations and Results
Div
isio
nal P
erfo
rman
ce S
umm
ary
Hal
f ye
ar e
nded
Bus
ines
s B
anki
ngP
erso
nal
Ban
king
Who
lesa
le
Ban
king
NA
B
Wea
lth
NZ
B
anki
ngU
K
Ban
king
GW
B
Spe
cial
ised
G
roup
A
sset
s
Cor
pora
te
Func
tion
s &
Oth
er (1
)D
istr
ibut
ions
&
Elim
inat
ions
Gro
up
Cas
h E
arni
ngs
31 M
arch
201
1$m
$m$m
$m$m
$m$m
$m$m
$m$m
Net
inte
rest
inco
me
2,4
46
1,3
68
522
1
60
487
7
68
155
6
5 3
33
- 6
,304
Fe
es a
nd c
omm
issi
ons
423
2
77
144
1
6 1
49
227
3
0 8
1
1 -
1,2
85
Trad
ing
inco
me
34
(1)
289
1
(2
) 2
-
65
(47)
- 3
41
Oth
er 3
5 2
5 4
2 2
2
4 (1
5) 8
1
1
1 (3
4) 9
9
Oth
er o
pera
ting
inco
me
492
3
01
475
1
9 1
71
214
3
8 7
4 (2
5) (3
4) 1
,725
N
AB
Wea
lth n
et o
pera
ting
inco
me
- -
- 7
70
- -
- -
- -
770
Net
ope
ratin
g in
com
e 2
,938
1
,669
9
97
949
6
58
982
1
93
139
3
08
(34)
8,7
99
Ope
ratin
g ex
pens
es (8
79)
(891
) (4
56)
(561
) (2
81)
(580
) (9
0) (2
4) (2
63)
34
(3,9
91)
Und
erly
ing
profi
t 2
,059
7
78
541
3
88
377
4
02
103
1
15
45
- 4
,808
(C
harg
e to
pro
vide
for)
/ben
efit f
rom
bad
and
dou
btfu
l deb
ts (3
85)
(163
) 1
2 (1
1) (7
2) (2
41)
(32)
(21)
(75)
- (9
88)
Cas
h ea
rnin
gs/(d
efici
t) b
efor
e ta
x, I
oRE
, dis
trib
utio
ns a
nd
non-
cont
rolli
ng in
tere
st 1
,674
6
15
553
3
77
305
1
61
71
94
(30)
- 3
,820
In
com
e ta
x (e
xpen
se)/b
enefi
t (4
93)
(183
) (1
60)
(107
) (9
0) (3
9) (2
4) (1
7) 4
7 -
(1,0
66)
Cas
h ea
rnin
gs b
efor
e Io
RE
, dis
trib
utio
ns a
nd n
on-
cont
rolli
ng in
tere
st 1
,181
4
32
393
2
70
215
1
22
47
77
17
- 2
,754
N
et p
rofit
- no
n-co
ntro
lling
inte
rest
- -
- (1
) -
- -
- -
- (1
)Io
RE
- -
- 2
9 -
- -
- -
- 2
9 D
istri
butio
ns -
- -
- -
- -
- -
(114
) (1
14)
Cas
h ea
rnin
gs/(d
efici
t) 1
,181
4
32
393
2
98
215
1
22
47
77
17
(114
) 2
,668
Key
bal
ance
she
et it
ems
($bn
)To
tal
Gro
ss lo
ans
and
acce
ptan
ces
191
.3
123
.5
13.
6 1
8.1
42.
1 5
2.2
5.3
5
.6
2.2
-
453
.9
Ret
ail d
epos
its 8
3.7
67.
6 -
9.9
2
3.1
37.
4 6
.6
- 5
.5
- 2
33.8
To
tal r
isk-
wei
ghte
d as
sets
(spo
t) 1
47.6
4
0.7
34.
6 6
.4
30.
1 5
1.9
5.7
1
8.0
10.
4 -
345
.2
(1)
Corp
orate
Fun
ction
s & O
ther in
clude
s Gro
up F
undin
g, Gr
oup B
usine
ss S
ervic
es, o
ther s
uppo
rting u
nits a
nd A
sia B
ankin
g.

40 Half Year Results
2012
41
Review of Divisional Operations and Results
This page has been left blank intentionally.

Half Year Results
2012
42
Review of Divisional Operations and Results – Business Banking
As Australia’s leading business bank based on market share, Business Banking provides a diverse range of commercial banking services to business customers, ranging from SMEs through to Australia’s largest institutions, including many of the ASX Top 200 listed companies. Business Banking also provides specialist industry expertise in the Agribusiness, Property, Healthcare, Natural Resources, Education and Government sectors.
Half Year toMar 12 Sep 11 Mar 11 Mar 12 v Mar 12 v
$m $m $m Sep 11 % Mar 11 %Net interest income 2,530 2,587 2,446 (2.2) 3.4 Other operating income 517 514 492 0.6 5.1
Net operating income 3,047 3,101 2,938 (1.7) 3.7 Operating expenses (875) (885) (879) 1.1 0.5
Underlying profit 2,172 2,216 2,059 (2.0) 5.5 Charge to provide for bad and doubtful debts (372) (417) (385) 10.8 3.4
Cash earnings before tax 1,800 1,799 1,674 0.1 7.5 Income tax expense (536) (535) (493) (0.2) (8.7)
Cash earnings 1,264 1,264 1,181 - 7.0
Average Volumes ($bn)Gross loans and acceptances 197.2 194.7 191.3 1.3 3.1 Interest earning assets 197.6 194.0 190.6 1.9 3.7 Total assets 195.9 192.3 188.8 1.9 3.8 Retail deposits 94.4 85.8 83.7 10.0 12.8
Capital ($bn)Risk-weighted assets - credit risk (spot) 137.3 138.4 144.9 (0.8) (5.2)Total risk-weighted assets (spot) 140.6 141.4 147.6 (0.6) (4.7)
Performance MeasuresCash earnings on average assets 1.29% 1.31% 1.25% (2 bps) 4 bps Cash earnings on risk-weighted assets 1.78% 1.74% 1.61% 4 bps 17 bps Net interest margin 2.56% 2.66% 2.57% (10 bps) (1 bps)Cost to income ratio 28.7% 28.5% 29.9% (20 bps) 120 bps ‘Jaws’ (0.6%) 4.8% 2.7% (540 bps) (330 bps)Cash earnings per average FTE ($’000s) 482 462 431 4.3 11.8 FTEs (spot) 5,081 5,427 5,493 6.4 7.5
As atMarket Share Mar 12 Sep 11 Mar 11Business lending APRA (1) 24.6% 24.1% 23.8% Business lending RBA (2) 22.9% 22.4% 22.2% Business deposits (1) 21.0% 20.7% 21.4%
(1) Source: APRA Banking System.(2) Source: RBA Financial System.
Business BankingJoseph Healy

Half Year Results
2012
43
Review of Divisional Operations and Results – Business Banking
March 2012 v March 2011Cash earnings increased by $83 million or 7.0% against the March 2011 half year, driven by underlying profit growth of 5.5%, and a reduction in the bad and doubtful debts charge.
Cash earnings on average assets improved by four basis points, reflecting the growth in cash earnings, through above business credit system lending growth, disciplined expense management and stable asset quality.
Cash earnings on risk-weighted assets has improved by 17 basis points, reflecting the growth in cash earnings, together with a reduction in risk-weighted assets through optimisation initiatives, including improved collateral matching.
Net interest income increased by $84 million or 3.4% compared to the March 2011 half year due to growth in both lending and deposit volumes. This was partially offset by higher funding and deposit costs, as the rising cost of term deposits and wholesale debt have increased the weighted average cost of funds.
Average interest earning assets grew by $7.0 billion or 3.7%. Business lending growth was above credit system, with growth observed across most segments.
Average retail deposits increased by $10.7 billion or 12.8% in line with the Group’s continued focus on growing customer deposits as an alternative source of funding. This growth was largely in term deposits and on-demand savings deposits.
Business Banking Average Volumes
Net interest margin declined by one basis point over the March 2011 half year due to higher funding costs, offset by repricing of the lending portfolio.
Other operating income was $25 million or 5.1% higher, largely driven by greater demand for risk management products sold to business customers, together with an increase in money transfer fees.
Operating expenses decreased by $4 million or 0.5%, due to tight expense management benefiting from a strong efficiency agenda, resulting in a cost to income ratio of 28.7%. This included a reduction in FTEs through improvements in operational efficiency while investment in key strategic priorities continued.
The charge to provide for bad and doubtful debts decreased by $13 million compared to the March 2011 half year. The credit quality of the portfolio remains broadly stable.
March 2012 v September 2011
Cash earnings were flat on the September 2011 half year, with lower revenue as a result of higher funding and deposit costs, offset by a reduction in the bad and doubtful debts charge.
Cash earnings on average assets decreased by two basis points, reflecting flat cash earnings growth.
Cash earnings on risk-weighted assets has improved by four basis points, due to risk-weighted asset optimisation activities.
Net interest income decreased by $57 million or 2.2% compared to the September 2011 half year, due to higher funding and deposit costs, partially offset by growth in volumes across the lending and deposit portfolios.
Average interest earning assets grew by $3.6 billion or 1.9%, due to growth across most segments.
Average retail deposits grew by $8.6 billion or 10.0%, reflecting the Group’s strategic priority to reduce its reliance on wholesale funding.
Net interest margin decreased by ten basis points on the September 2011 half year, due to higher funding and deposit costs.
Other operating income increased by $3 million or 0.6% due to greater demand for risk management products sold to business customers.
Operating expenses decreased by $10 million or 1.1%, reflecting the effective management of expenses.
The charge to provide for bad and doubtful debts decreased by $45 million largely due to the lower levels of provisioning required, particularly in the SME segment.
Business BankingFinancial Analysis

Half Year Results
2012
44
Review of Divisional Operations and Results – Business Banking
Other Items
Asset QualityAs at
Mar 12 Sep 11 Mar 11Specific provision for doubtful debts
($m) 937 872 788 Collective provision for doubtful debts
($m) 879 984 1,096 Collective provision on loans at fair
value 194 207 147 90+ DPD assets ($m) 935 852 1,017 Gross impaired assets ($m) 3,500 3,629 3,438 90+ DPD plus gross impaired assets
to gross loans and acceptances 2.23% 2.29% 2.31% Specific provision to gross impaired
assets 26.8% 24.0% 22.9% Net write-offs to gross loans and
acceptances (annualised) 0.42% 0.48% 0.52% Total provision as a percentage of net
write-offs 243% 219% 202% Total provision to gross loans and
acceptances 1.01% 1.05% 1.05% Bad and doubtful debt charge to
credit risk weighted assets 0.54% 0.58% 0.53%
The quality of the portfolio remained broadly stable during the March 2012 half year with a lower bad and doubtful debts charge compared to the September 2011 half year. The level of provisioning required for the SME portfolio fell over the half year. However, the charges for large corporates increased as a result of deteriorating market conditions. The ratio of bad and doubtful debt charge to credit risk weighted assets fell by four basis points to 0.54%.
The ratio of 90+ DPD plus gross impaired assets to gross loans and acceptances improved by six basis points to 2.23%, and was largely due to a reduction in impaired assets, predominantly in the larger corporate segment.
The ratio of net write-offs to gross loans and acceptances fell by six basis points to 0.42% during the March 2012 half year. The lower write-off activities were due to the business requiring a longer period of time to work with impaired customers in the current environment of global uncertainty and weak property markets.
Over the March 2012 half year, the loan loss provision coverage fell by four basis points to 1.01% due to the reduction in collective provisions, which was largely due to improvements in collateral matching. Specific provisions increased as further provisions were raised for longstanding impaired customers and the ratio to gross impaired assets rose by 280 basis points to 26.8%.

Half Year Results
2012
45
Review of Divisional Operations and Results – Business Banking
This page has been left blank intentionally.
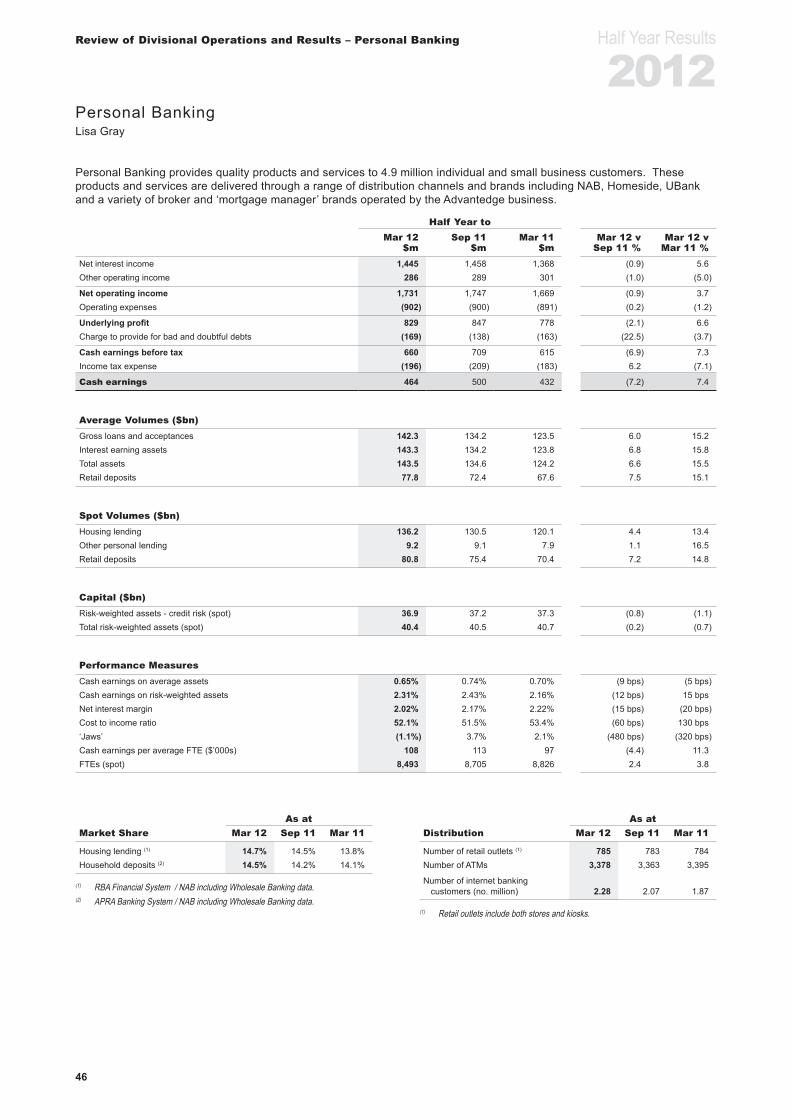
Half Year Results
2012
46
Review of Divisional Operations and Results – Personal Banking
Personal Banking provides quality products and services to 4.9 million individual and small business customers. These products and services are delivered through a range of distribution channels and brands including NAB, Homeside, UBank and a variety of broker and ‘mortgage manager’ brands operated by the Advantedge business.
Half Year toMar 12 Sep 11 Mar 11 Mar 12 v Mar 12 v
$m $m $m Sep 11 % Mar 11 %Net interest income 1,445 1,458 1,368 (0.9) 5.6 Other operating income 286 289 301 (1.0) (5.0)
Net operating income 1,731 1,747 1,669 (0.9) 3.7 Operating expenses (902) (900) (891) (0.2) (1.2)
Underlying profit 829 847 778 (2.1) 6.6 Charge to provide for bad and doubtful debts (169) (138) (163) (22.5) (3.7)
Cash earnings before tax 660 709 615 (6.9) 7.3 Income tax expense (196) (209) (183) 6.2 (7.1)
Cash earnings 464 500 432 (7.2) 7.4
Average Volumes ($bn)Gross loans and acceptances 142.3 134.2 123.5 6.0 15.2 Interest earning assets 143.3 134.2 123.8 6.8 15.8 Total assets 143.5 134.6 124.2 6.6 15.5 Retail deposits 77.8 72.4 67.6 7.5 15.1
Spot Volumes ($bn)Housing lending 136.2 130.5 120.1 4.4 13.4 Other personal lending 9.2 9.1 7.9 1.1 16.5 Retail deposits 80.8 75.4 70.4 7.2 14.8
Capital ($bn)Risk-weighted assets - credit risk (spot) 36.9 37.2 37.3 (0.8) (1.1)Total risk-weighted assets (spot) 40.4 40.5 40.7 (0.2) (0.7)
Performance MeasuresCash earnings on average assets 0.65% 0.74% 0.70% (9 bps) (5 bps)Cash earnings on risk-weighted assets 2.31% 2.43% 2.16% (12 bps) 15 bps Net interest margin 2.02% 2.17% 2.22% (15 bps) (20 bps)Cost to income ratio 52.1% 51.5% 53.4% (60 bps) 130 bps ‘Jaws’ (1.1%) 3.7% 2.1% (480 bps) (320 bps)Cash earnings per average FTE ($’000s) 108 113 97 (4.4) 11.3 FTEs (spot) 8,493 8,705 8,826 2.4 3.8
As atMarket Share Mar 12 Sep 11 Mar 11
Housing lending (1) 14.7% 14.5% 13.8% Household deposits (2) 14.5% 14.2% 14.1%
(1) RBA Financial System / NAB including Wholesale Banking data.(2) APRA Banking System / NAB including Wholesale Banking data.
As atDistribution Mar 12 Sep 11 Mar 11
Number of retail outlets (1) 785 783 784 Number of ATMs 3,378 3,363 3,395
Number of internet banking customers (no. million) 2.28 2.07 1.87
(1) Retail outlets include both stores and kiosks.
Personal BankingLisa Gray
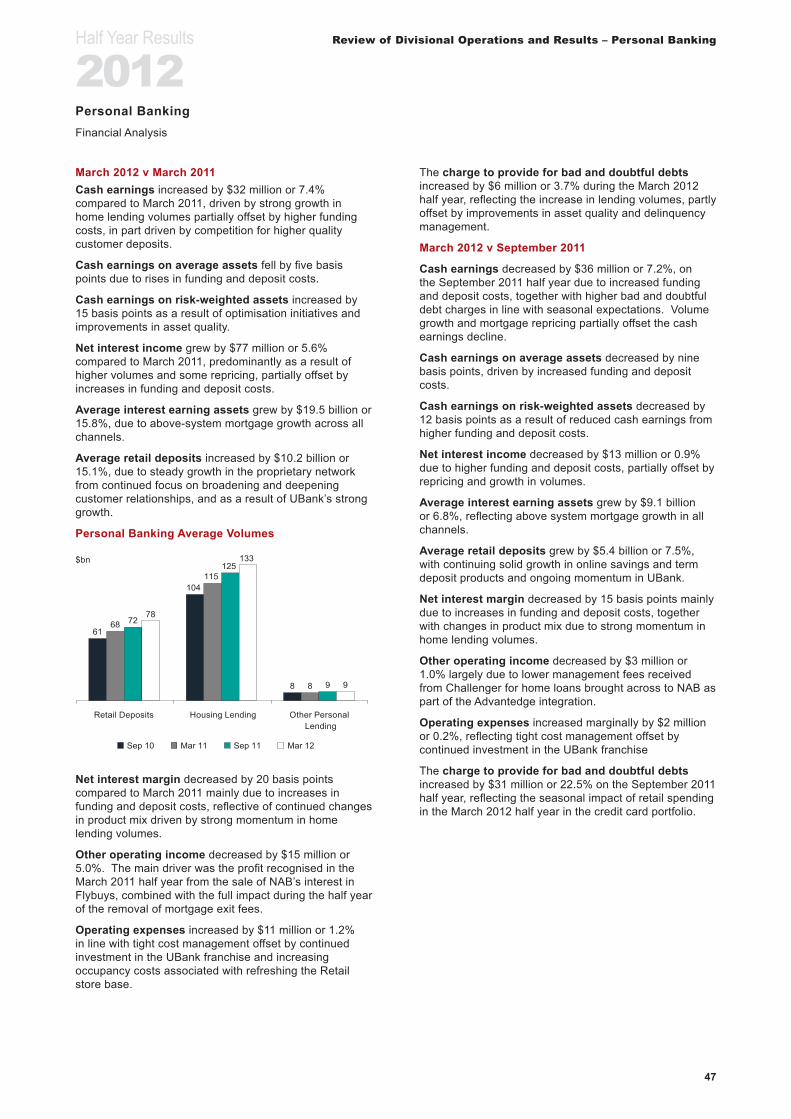
Half Year Results
2012
47
Review of Divisional Operations and Results – Personal Banking
March 2012 v March 2011Cash earnings increased by $32 million or 7.4% compared to March 2011, driven by strong growth in home lending volumes partially offset by higher funding costs, in part driven by competition for higher quality customer deposits.
Cash earnings on average assets fell by five basis points due to rises in funding and deposit costs.
Cash earnings on risk-weighted assets increased by 15 basis points as a result of optimisation initiatives and improvements in asset quality.
Net interest income grew by $77 million or 5.6% compared to March 2011, predominantly as a result of higher volumes and some repricing, partially offset by increases in funding and deposit costs.
Average interest earning assets grew by $19.5 billion or 15.8%, due to above-system mortgage growth across all channels.
Average retail deposits increased by $10.2 billion or 15.1%, due to steady growth in the proprietary network from continued focus on broadening and deepening customer relationships, and as a result of UBank’s strong growth.
Personal Banking Average Volumes
61
104
8
68
115
8
72
125
9
78
133
9
Retail Deposits Housing Lending Other PersonalLending
$bn
Sep 10 Mar 11 Sep 11 Mar 12
Net interest margin decreased by 20 basis points compared to March 2011 mainly due to increases in funding and deposit costs, reflective of continued changes in product mix driven by strong momentum in home lending volumes.
Other operating income decreased by $15 million or 5.0%. The main driver was the profit recognised in the March 2011 half year from the sale of NAB’s interest in Flybuys, combined with the full impact during the half year of the removal of mortgage exit fees.
Operating expenses increased by $11 million or 1.2% in line with tight cost management offset by continued investment in the UBank franchise and increasing occupancy costs associated with refreshing the Retail store base.
The charge to provide for bad and doubtful debts increased by $6 million or 3.7% during the March 2012 half year, reflecting the increase in lending volumes, partly offset by improvements in asset quality and delinquency management.
March 2012 v September 2011
Cash earnings decreased by $36 million or 7.2%, on the September 2011 half year due to increased funding and deposit costs, together with higher bad and doubtful debt charges in line with seasonal expectations. Volume growth and mortgage repricing partially offset the cash earnings decline.
Cash earnings on average assets decreased by nine basis points, driven by increased funding and deposit costs.
Cash earnings on risk-weighted assets decreased by 12 basis points as a result of reduced cash earnings from higher funding and deposit costs.
Net interest income decreased by $13 million or 0.9% due to higher funding and deposit costs, partially offset by repricing and growth in volumes.
Average interest earning assets grew by $9.1 billion or 6.8%, reflecting above system mortgage growth in all channels.
Average retail deposits grew by $5.4 billion or 7.5%, with continuing solid growth in online savings and term deposit products and ongoing momentum in UBank.
Net interest margin decreased by 15 basis points mainly due to increases in funding and deposit costs, together with changes in product mix due to strong momentum in home lending volumes.
Other operating income decreased by $3 million or 1.0% largely due to lower management fees received from Challenger for home loans brought across to NAB as part of the Advantedge integration.
Operating expenses increased marginally by $2 million or 0.2%, reflecting tight cost management offset by continued investment in the UBank franchise
The charge to provide for bad and doubtful debts increased by $31 million or 22.5% on the September 2011 half year, reflecting the seasonal impact of retail spending in the March 2012 half year in the credit card portfolio.
Personal BankingFinancial Analysis

Half Year Results
2012
48
Review of Divisional Operations and Results – Personal Banking
Other Items
Asset QualityAs at
Mar 12 Sep 11 Mar 11Specific provision for doubtful debts
($m) 37 45 41 Collective provision for doubtful debts
($m) 431 407 444
90+ DPD assets ($m) 744 646 698
Gross impaired assets ($m) 129 143 153
90+ DPD plus gross impaired assets to gross loans and acceptances 0.60% 0.57% 0.66%
Specific provision to gross impaired assets 28.7% 31.5% 26.8%
Net write-offs to gross loans and acceptances (annualised) 0.21% 0.22% 0.22%
Total provision as a percentage of net write-offs 153% 144% 173%
Total provision to gross loans and acceptances 0.32% 0.32% 0.38%
Bad and doubtful debt charge to credit risk weighted assets 0.92% 0.81% 0.88%
Current economic conditions continue to provide a challenging environment for asset quality, with consumer sentiment and house price indices softening and employment levels fluctuating across states. NAB customer repayment behaviour trends are consistent with the industry trend of consumer debt reduction.
Despite this background, loan origination quality continues to improve as evidenced by a reduction in specific provisions and a six basis point reduction of 90+ DPD plus gross impaired assets to gross loans and acceptances, as compared with the March 2011 half year.
As anticipated there was also a seasonal impact in the unsecured portfolio. Some residual impact from the natural disasters in late 2010 and early 2011, has been seen in the last quarter. These issues have been particularly prevalent in, although not isolated to, Queensland.

Half Year Results
2012
49
Review of Divisional Operations and Results – Personal Banking
This page has been left blank intentionally.
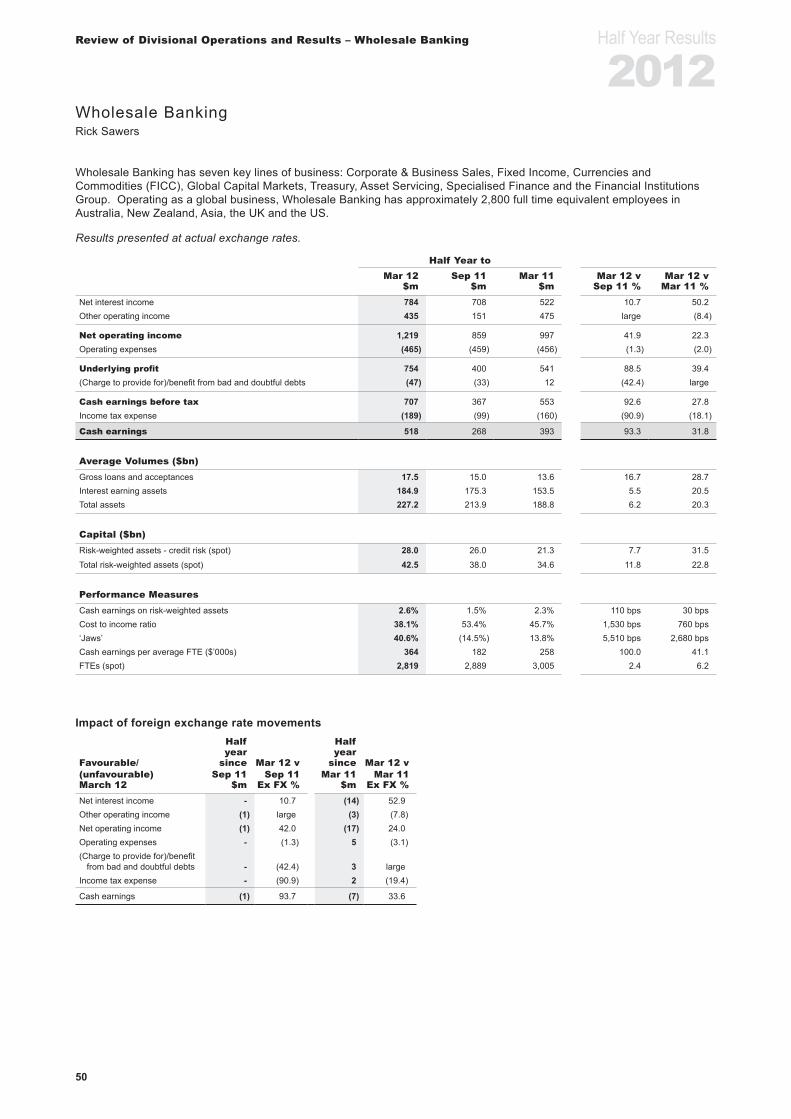
Half Year Results
2012
50
Review of Divisional Operations and Results – Wholesale Banking
Wholesale Banking has seven key lines of business: Corporate & Business Sales, Fixed Income, Currencies and Commodities (FICC), Global Capital Markets, Treasury, Asset Servicing, Specialised Finance and the Financial Institutions Group. Operating as a global business, Wholesale Banking has approximately 2,800 full time equivalent employees in Australia, New Zealand, Asia, the UK and the US.
Results presented at actual exchange rates.
Half Year toMar 12 Sep 11 Mar 11 Mar 12 v Mar 12 v
$m $m $m Sep 11 % Mar 11 %Net interest income 784 708 522 10.7 50.2 Other operating income 435 151 475 large (8.4)
Net operating income 1,219 859 997 41.9 22.3 Operating expenses (465) (459) (456) (1.3) (2.0)
Underlying profit 754 400 541 88.5 39.4 (Charge to provide for)/benefit from bad and doubtful debts (47) (33) 12 (42.4) large
Cash earnings before tax 707 367 553 92.6 27.8 Income tax expense (189) (99) (160) (90.9) (18.1)
Cash earnings 518 268 393 93.3 31.8
Average Volumes ($bn)Gross loans and acceptances 17.5 15.0 13.6 16.7 28.7 Interest earning assets 184.9 175.3 153.5 5.5 20.5 Total assets 227.2 213.9 188.8 6.2 20.3
Capital ($bn)Risk-weighted assets - credit risk (spot) 28.0 26.0 21.3 7.7 31.5
Total risk-weighted assets (spot) 42.5 38.0 34.6 11.8 22.8
Performance MeasuresCash earnings on risk-weighted assets 2.6% 1.5% 2.3% 110 bps 30 bps Cost to income ratio 38.1% 53.4% 45.7% 1,530 bps 760 bps ‘Jaws’ 40.6% (14.5%) 13.8% 5,510 bps 2,680 bps Cash earnings per average FTE ($’000s) 364 182 258 100.0 41.1 FTEs (spot) 2,819 2,889 3,005 2.4 6.2
Impact of foreign exchange rate movements
Favourable/
Half year
since Mar 12 v
Half year
since Mar 12 v(unfavourable) Sep 11 Sep 11 Mar 11 Mar 11March 12 $m Ex FX % $m Ex FX %Net interest income - 10.7 (14) 52.9 Other operating income (1) large (3) (7.8)Net operating income (1) 42.0 (17) 24.0 Operating expenses - (1.3) 5 (3.1)(Charge to provide for)/benefit
from bad and doubtful debts - (42.4) 3 largeIncome tax expense - (90.9) 2 (19.4)
Cash earnings (1) 93.7 (7) 33.6
Wholesale BankingRick Sawers

Half Year Results
2012
51
Review of Divisional Operations and Results – Wholesale Banking
March 2012 v March 2011Cash earnings have increased by $125 million or 31.8% to $518 million during the March 2012 half year. Excluding foreign exchange rate movements, cash earnings were up by 33.6%. The higher revenue generated primarily in the Customer businesses was partially offset by a higher bad and doubtful debt charge.
Net operating income increased by $222 million or 22.3% to $1,219 million. Excluding foreign exchange rate movements, income increased by $239 million.
Customer income increased by $153 million to $724 million, through higher sales of risk management products to the Group’s Business Banking customers and through connecting the Group’s borrowers with financial institution clients reflecting the impact of the Franchise Focus strategy.
Specialised Finance income also improved from increased deal flows in both Infrastructure and Energy & Utilities.
Within net operating income, net interest income increased by $262 million or 50.2%, partly offset by lower other operating income, which decreased by $40 million or 8.4%. Of the increase in net interest income, $154 million was driven by gains on economically hedged positions relating to the Group’s banking book interest rate risk (offset in other operating income). The underlying increase in net interest income of $108 million was driven by higher interest earning assets to support the Group’s funding and liquidity requirements, coupled with improved yields as part of optimising the Bank’s funding and liquidity profile.
The underlying increase in other operating income of $114 million was mainly due to higher sales of risk management products to the Group’s Business Banking customers partly offset by adverse credit valuation adjustments due to an increase in the mark-to-market value of the portfolio.
Operating expenses increased by $9 million or 2.0% to $465 million. Excluding foreign exchange rate movements, the increase was $14 million or 3.1%. This was largely due to higher performance based compensation, reflecting improved performance. Excluding performance based compensation, operating expenses decreased through operational efficiencies, particularly in support functions.
The charge to provide for bad and doubtful debts increased by $59 million. The increase was due to two specific impairments in the half year in comparison to a net recovery in the comparative period.
Average interest earning assets increased by $31.4 billion or 20.5%. Excluding the foreign exchange impact, the increase was $33.8 billion or 22.4%, through a combination of higher assets in the FICC business, lending growth in Specialised Finance, Financial Institutions and Capital Markets and also increases in liquid assets to support Group liquidity.
Cash earnings on risk-weighted assets increased by 30 basis points as a result of an improvement in cash earnings mainly due to higher revenue in the customer
businesses, partly offset by an increase in lower yielding liquid assets to support Group liquidity.
March 2012 v September 2011Cash earnings have increased by $250 million. Excluding foreign exchange rate movements, cash earnings increased by $251 million. The increase was mainly due to higher revenue in both Customer and Risk businesses.
Net operating income increased by $360 million or 41.9%. Excluding foreign exchange rate movements, the increase was $361 million or 42.0%.
Customer income increased by $39 million, primarily from increased sales of risk management products to the Group’s Business Banking customers. Income in the Financial Institution Group benefited from higher lending and term deposit volumes.
Risk income increased by $321 million to $495 million mainly due to increased flow from Customer businesses and improved trading conditions.
Within net operating income, net interest income increased by $76 million or 10.7% and other operating income was $284 million higher. The movement in net interest income was mainly due to improved yields as part of optimising the Bank’s funding and liquidity profile.
The increase in other operating income was due to higher sales of risk management products to the Group’s business customers, combined with increased flow and improved trading conditions in the Risk businesses.
Operating expenses increased by $6 million or 1.3%, as a result of higher performance based compensation reflecting higher FICC performance. This was partly offset by operational efficiencies leading to FTE reductions in support functions. Excluding foreign exchange rate movements, the increase was $6 million or 1.3%.
The charge to provide for bad and doubtful debts increased by $14 million, as a result of two specific impairments in the half year.
Average interest earning assets increased by $9.6 billion or 5.5%. Excluding foreign exchange movements, the increase was $9.7 billion or 5.5%, through a combination of higher assets in the FICC business, lending growth and also increases in liquid assets to support Group liquidity, although these have declined on a spot basis.
Cash earnings on risk-weighted assets increased by 110 basis points as a result of an improvement in cash earnings mainly due to higher revenue in both the Risk and Customer businesses, partly offset by an increase in lower yielding liquid assets to support Group liquidity.
Wholesale BankingFinancial Analysis

Half Year Results
2012
52
Review of Divisional Operations and Results – Wholesale Banking
Other Items
Asset QualityAs at
Mar 12 Sep 11 Mar 11Specific provision for doubtful debts
($m) 21 29 16 Collective provision for doubtful debts
($m) 61 72 60 Collective provision on loans at fair
value ($m) 1 1 1 Collective provision on derivatives at
fair value ($m) 150 149 98
Gross impaired assets ($m) 43 40 38 Gross impaired assets to gross loans
and acceptances 0.24% 0.25% 0.28% Specific provision to gross impaired
assets 48.8% 72.5% 42.1% Net write-offs to gross loans and
acceptances 0.74% 0.26% 0.48%
Asset quality remains sound. Charges for bad and doubtful debts included two specific impairments in the half year. Provisioning coverage ratios remains adequate and ratios were stable.
The ratio of gross impaired assets to gross loans and acceptances of 0.24% at March 2012 remains largely unchanged on September 2011. The credit portfolio is stable.
Investment grade equivalent exposures also remained stable and represent greater than 90% of the Wholesale Banking portfolio.

Half Year Results
2012
53
Review of Divisional Operations and Results – Wholesale Banking
This page has been left blank intentionally.

Half Year Results
2012
54
Review of Divisional Operations and Results – NAB Wealth
NAB Wealth provides superannuation, investments, insurance and private wealth solutions to retail, corporate and institutional clients. NAB Wealth operates one of the largest networks of retail financial advisers in Australia.
Half Year toMar 12 Sep 11 Mar 11 Mar 12 v Mar 12 v
$m $m $m Sep 11 % Mar 11 %Net interest income 163 168 160 (3.0) 1.9 Other operating income 17 16 19 6.3 (10.5)NAB Wealth net operating income 760 716 770 6.1 (1.3)
Net income 940 900 949 4.4 (0.9)Operating expenses (571) (567) (561) (0.7) (1.8)
Underlying profit 369 333 388 10.8 (4.9)Charge to provide for bad and doubtful debts (5) (7) (11) 28.6 54.5
Cash earnings before tax and IoRE 364 326 377 11.7 (3.4)Income tax expense (104) (92) (107) (13.0) 2.8
Cash earnings before IoRE and non-controlling interest 260 234 270 11.1 (3.7)
Net profit - non-controlling interest (1) - (1) large - IoRE (1) 30 1 29 large 3.4
Cash earnings 289 235 298 23.0 (3.0)
(1) The impact of changes in the IoRE discount rate variation has been excluded from cash earnings, as noted in Section 7 - Glossary of Terms.
Represented by:Investments & Private Bank 167 162 162 3.1 3.1 Insurance 93 72 108 29.2 (13.9)
Cash earnings before IoRE and non-controlling interest 260 234 270 11.1 (3.7)
Capital ($bn)Risk-weighted assets - credit risk (spot) 6.5 6.6 6.1 (1.5) 6.6 Total risk-weighted assets (spot) 6.9 6.9 6.4 - 7.8
Performance MeasuresCost to income ratio (%) 60.7% 63.0% 59.1% 230 bps (160 bps)‘Jaws’ 3.7% (6.3%) 3.8% large (10 bps)Cash earnings before IoRE and non-controlling interest per average
FTE ($’000s) 90 77 94 16.9 (4.3)BAU FTEs 4,510 4,695 4,632 3.9 2.6 Project FTEs 351 385 534 8.8 34.3 Salaried planners FTEs 774 829 758 6.6 (2.1)
FTEs (spot) 5,635 5,909 5,924 4.6 4.9 Financial advisers - salaried channels (1) 796 850 765 (6.4) 4.1 Financial advisers - aligned channels (1) 1,046 1,014 962 3.2 8.7
(1) Financial advisers - salaried and aligned channels are based on headcount.
Interest on Retained Earnings by Asset ClassHalf year to
Mar 12 Sep 11 Mar 11
Actual Earnings
Weighted Asset
BalanceEarnings
Rate (1)Actual
Earnings
Weighted Asset
BalanceEarnings
Rate (1)Actual
Earnings
Weighted Asset
BalanceEarnings
Rate (1)
IoRE by Asset Class $m $m % $m $m % $m $m %
Equity 22 195 22.6% (23) 195 (23.6%) 13 191 13.6% Fixed interest 5 185 5.4% 13 218 11.9% 4 218 3.7% Cash and others 47 2,090 4.5% 57 2,130 5.4% 53 2,048 5.2% Debt (37) 1,261 (5.9%) (35) 1,205 (5.8%) (32) 1,013 (6.3%)Income tax (7) (11) (9)
IoRE 30 1 29
(1) The earnings rate is an annualised rate allowing for simple interest.
NAB WealthSteve Tucker

Half Year Results
2012
55
Review of Divisional Operations and Results – NAB Wealth
March 2012 v March 2011
Cash earnings before IoRE and non-controlling interest of $260 million decreased by $10 million or 3.7% compared to March 2011. This result was due to ongoing investment market uncertainty and an increase in insurance lapses.
Net interest income grew by $3 million or 1.9% due to higher lending and deposit volumes, partially offset by an increase in funding costs.
NAB Wealth net operating income decreased by $10 million or 1.3% as a result of ongoing investment market uncertainty and an increase in lapses. This was offset by growth in average inforce premiums and favourable earnings on the annuities portfolio.
Funds under Management (FUM) as at 31 March 2012 of $123.5 billion increased by $4.6 billion, or 3.9% compared to March 2011, as a result of growth in the direct funds management business through acquisitions. This was partially offset by a deterioration in investment markets over the half year to September 2011.
Net funds flow declined by $0.9 billion compared to March 2011, influenced by ongoing investment market uncertainty.
Inforce premiums as at 31 March 2012 of $1.5 billion grew by $57 million or 4.0% compared to March 2011.
Operating Expenses increased by $10 million or 1.8% to support adviser growth, the acquisition of the direct funds management business, Antares Capital Partners Limited (formerly known as Aviva Investors Australia Limited), and the development of new products and services. Cost synergies from the integration of the Aviva business partially offset the increase in operating expenses.
Adviser numbers continued to grow as advisers were attracted to NAB Wealth’s progressive model. Salaried advisers grew from March 2011 as a result of continued investment in this channel but they have decreased in the current half year as advisers with lower productivity left the business.
Market share has declined slightly in Retail Investments and Insurance over the period, reflecting a competitive environment. NAB Wealth continues to manage the trade-off between volume growth and profitability and has recently refreshed its offering with repricing and the launch of new products to ensure it continues to attract advisers and customers.
March 2012 v September 2011
Cash earnings before IoRE and non-controlling interest of $260 million, increased by $26 million or 11.1% compared to the prior half year. This result was due to lower claims and a lower impact of unfavourable lapses and changes in the profile of the retail insurance book.
Net interest income fell by $5 million or 3.0%, mainly due to lower margins from higher funding costs and an increase in competition for deposits.
NAB Wealth net operating income increased by $44 million or 6.1% due to favourable earnings on the annuities portfolio, lower insurance claims and a lower impact of unfavourable lapses and changes in the profile of the retail insurance book.
Funds under Management (FUM) as at 31 March 2012 of $123.5 billion increased by $13.3 billion, or 12.0% compared to September 2011, as a result of growth in the direct funds management business through acquisitions and investment earnings over the half year to March 2012. This was partially offset by negative net flows due to ongoing investment market uncertainty.
Inforce premiums as at 31 March 2012 of $1.5 billion grew by $27 million or 1.8% compared to September 2011.
Operating expenses increased by $4 million or 0.7% to support the development of new products and services and the acquisition of the direct funds management business, Antares Capital Partners Limited. This was partially offset by efficiency initiatives which resulted in an improved cost to income ratio and positive ‘Jaws’.
NAB WealthFinancial Highlights

Half Year Results
2012
56
Review of Divisional Operations and Results – NAB Wealth
NAB Wealth - Investments inclusive of Private WealthHalf Year to
Mar 12 Sep 11 Mar 11 Mar 12 v Mar 12 v$m $m $m Sep 11 % Mar 11 %
Net interest income 163 168 160 (3.0) 1.9 Other operating income 17 16 19 6.3 (10.5)Gross income 784 771 772 1.7 1.6 Volume related expenses (274) (273) (271) (0.4) (1.1)
Net income 690 682 680 1.2 1.5
Operating expenses (453) (452) (443) (0.2) (2.3)
Underlying profit 237 230 237 3.0 - Charge to provide for bad and doubtful debts (5) (7) (11) 28.6 54.5
Cash earnings before tax 232 223 226 4.0 2.7 Income tax expense (65) (61) (64) (6.6) (1.6)
Cash earnings before IoRE 167 162 162 3.1 3.1
Average Volumes - Private Bank ($bn)Gross loans and acceptances 18.7 18.6 18.1 0.5 3.3 Interest earning assets 18.7 18.6 18.5 0.5 1.1
Performance Measures (1)
Funds under management (spot) ($m) (2) 123,547 110,289 118,958 12.0 3.9 Funds under management (average) ($m) (2) 119,629 116,375 116,810 2.8 2.4 Net funds flow ($m) (2) (1,480) 114 (605) large largeNet interest margin 1.74% 1.82% 1.73% (8 bps) 1 bps Cost to income ratio 65.7% 66.3% 65.1% 60 bps (60 bps)Investment operating expenses to average FUM (bps) (2) 62 65 64 3 bps 2 bps Investment income to average FUM (bps) (2) 85 85 86 - (1 bps)
(1) FUM excludes Trustee and Cash Management.(2) Spot and Average FUM for March 2011 and September 2011 have been re-stated. This is to reflect a change in the basis of reporting nabInvest FUM for non-wholly owned
businesses. FUM will be reported on the basis of nabInvest’s proportional ownership interest rather than total FUM for these businesses.
Funds Under ManagementDec 11 Jun 11 Dec 10
RankMarket
Share % RankMarket
Share % RankMarket
Share %Retail (excl. Cash) 2 15.7% 2 16.1% 2 16.1% Total Retail Superannuation 2 19.5% 2 20.1% 2 19.9% Total Wholesale 1 11.4% 1 10.8% 2 10.3%
Source: Plan for Life Australian Retail & Wholesale Investments Market share & Dynamics Report - December 2011. (Prior periods include re-statements of funds under management made by Plan for Life.)

Half Year Results
2012
57
Review of Divisional Operations and Results – NAB Wealth
Funds Under ManagementMovement in Funds under As at Investment As atManagement and Administration ($m) (1) Mar 11 Inflows Outflows earnings Other (2) Mar 12
Master Funds (Platforms) 81,473 11,198 (13,396) (76) (512) 78,687 Other Retail 4,758 54 (417) (87) (319) 3,989
Total Retail Funds (Excl. Cash) 86,231 11,252 (13,813) (163) (831) 82,676 Wholesale 32,727 4,718 (3,523) (588) 7,537 40,871
Total NAB Wealth ex Trustee and Cash Management 118,958 15,970 (17,336) (751) 6,706 123,547
Trustee 6,155 2,210 (1,643) - 2 6,724
Movement in Funds under As at Investment As atManagement and Administration ($m) (1) Sep 11 Inflows Outflows earnings Other (2) Mar 12
Master Funds (Platforms) 74,712 4,774 (6,327) 5,959 (431) 78,687 Other Retail 4,144 21 (195) 50 (31) 3,989
Total Retail Funds (Excl. Cash) 78,856 4,795 (6,522) 6,009 (462) 82,676 Wholesale 31,433 2,102 (1,855) 1,653 7,538 40,871
Total NAB Wealth ex Trustee and Cash Management 110,289 6,897 (8,377) 7,662 7,076 123,547
Trustee 6,439 522 (237) - - 6,724
(1) FUM for March 2011 and September 2011 has been re-stated. This is to reflect a change in the basis of reporting nabInvest FUM for non-wholly owned businesses. FUM will be reported on the basis of nabInvest’s proportional ownership interest rather than total FUM for these businesses.
(2) Other includes trust distributions and nabInvest acquisitions (including Antares Capital Partners Limited: $4.6 billion).
Funds Under Management
119.0 110.3
123.5
(1.5)
7.7
(8.4)
7.0 0.1
(0.4)
Mar 11 Sep 11 Mar 12
Funds Under Management Net Flows Investment Earnings Other
$bn
As atFUM by Asset Class Mar 12 Sep 11 Mar 11Australian equities 32% 31% 33% International equities 24% 25% 27% Australian fixed interest 20% 20% 18% International fixed interest 8% 8% 8% Australian cash 8% 8% 7% International direct property 4% 4% 3% International listed property 2% 2% 2% Australian listed property 2% 2% 2%

Half Year Results
2012
58
Review of Divisional Operations and Results – NAB Wealth
March 2012 v March 2011Cash earnings before IoRE grew by $5 million or 3.1% compared to March 2011 as a result of growth in average FUM and favourable earnings on the annuities portfolio. This was partially offset by changes in business mix.
Net interest income grew by $3 million or 1.9% due to higher lending and deposit volumes, partially offset by an increase in funding costs.
Gross income was up by 1.6% compared to March 2011, broadly in line with the increase in average FUM. Margins have remained flat, with favourable earnings on the annuities portfolio offset by changes in business mix.
FUM as at 31 March 2012 of $123.5 billion increased by $4.6 billion, or 3.9% compared to March 2011. This was due to growth in the direct funds management business through acquisitions, partially offset by a deterioration in investment markets over the half year to September 2011.
Net funds flow declined by $0.9 billion compared to March 2011, influenced by ongoing investment market uncertainty.
Volume related expenses which include commission payments and investment costs which were relatively flat compared to March 2011.
Operating expenses increased by $10 million, or 2.3% to support adviser growth, the development of new products and services and the acquisition of the direct funds management business, Antares Capital Partners Limited. Cost synergies from the integration of the Aviva business partially offset the increase in operating expenses.
The charge to provide for bad and doubtful debts decreased by $6 million predominantly as a result of a single specific provision in the March 2011 half year.
March 2012 v September 2011Cash earnings before IoRE grew by $5 million or 3.1% compared to September 2011 as a result of growth in average FUM and favourable earnings on the annuities portfolio, partially offset by changes in business mix.
Net interest income fell by $5 million or 3.0% mainly due to lower margins from higher funding costs and an increase in competition for deposits.
Gross income was up by 1.7% compared to September 2011, broadly in line with the increase in average FUM. Margins were relatively flat, with favourable earnings on the annuities portfolio offset by changes in business mix.
FUM as at 31 March 2012 of $123.5 billion increased by $13.3 billion, or 12.0% compared to September 2011, as a result of growth in the direct funds management business through acquisitions and investment earnings over the half year to March 2012. This was partially offset by negative net flows due to ongoing investment market uncertainty.
Net funds flow declined by $1.6 billion as a result of negative net flows from retail investments and small positive wholesale net flows, compared to large wholesale net flows experienced in the September 2011 half year.
Volume related expenses which include commission payments and investment costs have remained relatively flat.
Operating expenses of $453 million were in line with the prior half year.
NAB Wealth - Investments inclusive of Private WealthFinancial Analysis

Half Year Results
2012
59
Review of Divisional Operations and Results – NAB Wealth
Other Items
Asset QualityAs at
Mar 12 Sep 11 Mar 11Specific provision for doubtful debts
($m) 10 19 20 Collective provision for doubtful debts
($m) 19 17 15
90+ DPD assets ($m) 73 50 34
Gross impaired assets ($m) 48 54 70 90+ DPD plus gross impaired assets
to gross loans and acceptances 0.64% 0.55% 0.56% Specific provision to gross impaired
assets 20.8% 35.2% 28.6% Net write-offs to gross loans and
acceptances (annualised) 0.13% 0.03% (0.01%)Total provision as a percentage of net
write-offs 121% 720% (1,745%)Total provision to gross loans and
acceptances 0.15% 0.19% 0.19% Bad and doubtful debt charge to
credit risk weighted assets 0.15% 0.27% 0.35%
Asset quality measures across NAB Wealth for the six months to March 2012 have shown some deterioration in the 90+ DPD. This was attributable to the migration of a small number of larger exposures moving into the 90+ DPD category. Total provisions have decreased over the period and there has been a substantial improvement in the total gross impaired assets driven by asset sales or refinancing.
Total provisions to gross loans and acceptances of 0.15% has improved since September 2011.

Half Year Results
2012
60
Review of Divisional Operations and Results – NAB Wealth
NAB Wealth - InsuranceHalf Year to
Mar 12 Sep 11 Mar 11 Mar 12 v Mar 12 v$m $m $m Sep 11 % Mar 11 %
Gross income 801 784 780 2.2 2.7 Volume related expenses (551) (566) (511) 2.7 (7.8)
Net operating income 250 218 269 14.7 (7.1)Operating expenses (118) (115) (118) (2.6) -
Cash earnings before tax and IoRE 132 103 151 28.2 (12.6)Income tax expense (39) (31) (43) (25.8) 9.3
Cash earnings before loRE 93 72 108 29.2 (13.9)
Planned and Experience AnalysisPlanned margins 87 84 82 3.6 6.1 Experience profit/(loss) 6 (12) 26 large (76.9)
Cash earnings before IoRE 93 72 108 29.2 (13.9)
Performance MeasuresAnnual inforce premiums (spot) ($m) 1,492.9 1,466.3 1,435.9 1.8 4.0 Annual inforce premiums (average) ($m) 1,479.6 1,451.1 1,421.3 2.0 4.1 New business premiums ($m) 150.7 152.0 134.1 (0.9) 12.4 Insurance cost to average inforce premium (%) 16% 16% 17% - 100 bps
As at As at Mar 11 vAnnual Inforce Premiums ($m) Mar 11 Sales Lapses Mar 12 Mar 12 %Retail 1,146.5 238.5 (200.5) 1,184.5 3.3 Group Risk 289.4 64.2 (45.2) 308.4 6.6
Total 1,435.9 302.7 (245.7) 1,492.9 4.0
As at As at Sep 11 vAnnual Inforce Premiums ($m) Sep 11 Sales Lapses Mar 12 Mar 12 %Retail 1,165.2 117.1 (97.8) 1,184.5 1.7 Group Risk 301.1 33.6 (26.3) 308.4 2.4
Total 1,466.3 150.7 (124.1) 1,492.9 1.8
Premiums in ForceDec 11 Jun 11 Dec 10
RankMarket
Share % RankMarket
Share % RankMarket
Share %Retail risk premiums 2 17.8% 2 18.4% 1 18.9% Group Risk 6 9.5% 6 9.8% 5 10.0%
Share of New BusinessDec 11 Jun 11 Dec 10
RankMarket
Share % RankMarket
Share % RankMarket
Share %Retail risk premiums 2 15.4% 2 16.6% 1 18.0% Group Risk 6 6.0% 4 11.8% 4 11.7%
Source: DEXX&R Life Analysis - December 2011. (Prior periods include re-statements of premiums inforce made by DEXX&R.)
Half Year Results
2012
61
Review of Divisional Operations and Results – NAB Wealth
March 2012 v March 2011Cash earnings before IoRE of $93 million decreased by $15 million or 13.9% compared to the March 2011 half year. This result was largely driven by an increase in lapses, partially offset by growth in average inforce premiums.
Gross income increased by $21 million or 2.7% broadly in line with growth in average inforce premiums.
Volume related expenses include commission payments, claims and changes in insurance policy liabilities. These costs increased by $40 million or 7.8% as a result of the increase in average premiums inforce and an increase in lapses.
Operating expenses of $118 million were flat compared to the March 2011 half year.
Planned Margins and Experience Profit
Planned margins were $87 million, up by $5 million compared to the March 2011 half year, mainly due to volume growth.
Experience profits rose over the period as a result of favourable earnings on assets backing policy liabilities and favourable claims experience. These drivers were partially offset by unfavourable lapses.
March 2012 v September 2011Cash earnings before IoRE increased by $21 million or 29.2% compared to the September 2011 half year. This result was largely driven by growth in average inforce premiums, lower claims and a lower impact of unfavourable lapses and changes in the profile of the retail insurance book.
Gross income increased by $17 million or 2.2% to $801 million, broadly in line with growth in average inforce premiums.
Volume related expenses decreased by $15 million or 2.7% largely driven by lower claims and a lower impact of unfavourable lapses and changes in the profile of the retail insurance book.
Operating expenses of $118 million were up by $3 million compared to the September 2011 half year.
NAB Wealth - InsuranceFinancial Analysis

Half Year Results
2012
62
Review of Divisional Operations and Results – NZ Banking
NZ Banking comprises the Retail, Business, Agribusiness, Corporate and Insurance franchises in New Zealand, operating under the ‘BNZ’ brand. It excludes BNZ’s Wholesale Banking operations.
Results presented in local currency. See page 65 for results in $AUDm.
Half Year toMar 12 Sep 11 Mar 11 Mar 12 v Mar 12 vNZ$m NZ$m NZ$m Sep 11 % Mar 11 %
Net interest income 711 684 640 3.9 11.1 Other operating income 233 226 225 3.1 3.6
Net operating income 944 910 865 3.7 9.1 Operating expenses (375) (378) (369) 0.8 (1.6)
Underlying profit 569 532 496 7.0 14.7 Charge to provide for bad and doubtful debts (34) (56) (95) 39.3 64.2
Cash earnings before tax 535 476 401 12.4 33.4
Income tax expense (150) (147) (118) (2.0) (27.1)
Cash earnings 385 329 283 17.0 36.0
Average Volumes (NZ$bn)Gross loans and acceptances 57.5 56.4 55.4 2.0 3.8 Interest earning assets 59.1 58.0 57.2 1.9 3.3 Total assets 59.3 58.4 57.8 1.5 2.6 Retail deposits 33.5 31.8 30.4 5.3 10.2
Capital (NZ$bn)Risk-weighted assets - credit risk (spot) 36.3 35.3 36.1 2.8 0.6 Total risk-weighted assets (spot) 40.2 39.8 40.8 1.0 (1.5)
Performance MeasuresCash earnings on average assets 1.30% 1.12% 0.98% 18 bps 32 bps Cash earnings on risk-weighted assets 1.93% 1.62% 1.44% 31 bps 49 bps Net interest margin 2.41% 2.35% 2.24% 6 bps 17 bps Cost to income ratio 39.7% 41.5% 42.7% 180 bps 300 bps ‘Jaws’ 4.5% 2.8% - 170 bps 450 bps
Cash earnings per average FTE (NZ$’000s) 167 143 125 16.8 33.6
FTEs (spot) 4,554 4,641 4,578 1.9 0.5
As atMarket Share (1) Mar 12 Sep 11 Mar 11
Housing 16.2% 16.2% 16.0% Cards 27.4% 27.8% 28.0%
Agribusiness 21.1% 20.8% 19.7%
Retail deposits (2) 18.7% 18.0% 18.0%
(1) Source RBNZ (historical market share rebased with latest revised RBNZ published data).
(2) Retail deposits excludes some deposits by business banking customers captured in money market deposits in the BNZ Disclosure Statement.
As atDistribution Mar 12 Sep 11 Mar 11
Number of retail branches 179 179 178 Number of ATMs 449 445 444
Number of internet banking customers (no. ‘000s) 553 534 513
NZ BankingAndrew Thorburn

Half Year Results
2012
63
Review of Divisional Operations and Results – NZ Banking
March 2012 v March 2011Cash earnings for the half year increased by $102 million or 36.0% to $385 million when compared to the March 2011 half year. The current half year performance was characterised by improved net interest income and margins, higher fee income as well as lower bad and doubtful debt charges. Lending volume growth remained modest in light of the subdued demand for business and personal credit. The business continued to achieve positive ‘Jaws’ as revenue growth outweighed the slight increase in expenses over the March 2011 half year.
Net interest income increased by $71 million or 11.1% against the March 2011 half year primarily due to a combination of volume growth, margin improvement through growth in variable rate housing products, and progressive repricing of the asset portfolio. Strong deposit volume growth also contributed to the increase in net interest income during the period.
Average volumes of gross loans and acceptances increased by $2.1 billion or 3.8%. Demand for credit remained subdued over the past year. Nonetheless, BNZ increased its market share in key segments, including housing by 25 basis points to 16.2% and agribusiness by 141 basis points to 21.1%.
Average volumes of retail deposits grew strongly from the March 2011 half year, increasing by $3.1 billion or 10.2%. This was driven by a continuing focus on growing retail deposits to further strengthen the Bank’s balance sheet. This has helped improve BNZ’s market share by 66 basis points to 18.7%.
Net interest margin improved by 17 basis points to 2.41% from the March 2011 half year. The favourable portfolio mix from customers’ continued preference for variable rate products, as well as repricing of the asset portfolio helped support the net interest margin during the period. This was partially offset by funding cost pressure from growth in retail deposits in a competitive market, together with increases in the term profile of wholesale funding.
Other operating income increased by $8 million or 3.6% over the March 2011 half year. This was primarily driven by higher lending fees from Corporate and Institutional Banking customers, improved demand for risk management products, as well as increased premium revenue from insurance operations.
Operating expenses increased by $6 million or 1.6% from the March 2011 half year due largely to higher depreciation costs from completed investment projects, including the refresh of the Store and Partners network.
The charge to provide for bad and doubtful debts decreased by $61 million or 64.2%. The significant improvement was due to lower specific provisions on business exposures as the economy is showing signs of improvement, strong credit card collections and an overall improvement in asset quality across the lending portfolio.
Cash earnings on risk-weighted assets has improved by 49 basis points to 1.93% from the March 2011 half year. This is due to strong cash earnings growth as well as optimisation of assets which have resulted in lower risk-weighted assets.
March 2012 v September 2011Cash earnings increased by $56 million or 17.0% to $385 million when compared to the September 2011 half year, reflecting higher net interest income, increased fee income and continuing improvement in bad and doubtful debt charges.
Net interest income increased by $27 million or 3.9% from the September 2011 half year. This was the result of a combination of modest growth in volumes and overall margins. Margins continue to benefit from customers’ preference for variable rate housing products as interest rates remain low. This has, however been partially offset by increased wholesale funding costs due to the ongoing global uncertainty.
Average volumes of gross loans and acceptances grew slightly by $1.1 billion or 2.0%. This is in line with the overall system credit growth in New Zealand which remains subdued. BNZ increased its market share in key segments including agricultural lending by 34 basis points to 21.1% while housing market share remained steady at 16.2%.
Average volumes of retail deposits grew by $1.7 billion or 5.3% over the September 2011 half year, increasing BNZ’s market share by 66 basis points to 18.7% and further strengthening BNZ’s balance sheet.
Net interest margin improved by 6 basis points to 2.41% from the September 2011 half year. Margins continue to be supported by customers’ preference for variable rate products as well as repricing of the asset portfolio. This has been partially offset from higher funding costs associated with deposit growth and lengthening of term funding profile.
Other operating income increased by $7 million or 3.1% compared to the September 2011 half year. This was primarily driven by increased lending fees from Corporate and Institutional Banking customers, improved demand for risk management products and increased premium revenue from insurance operations.
Operating expenses decreased by $3 million or 0.8% compared to the September 2011 half year. NZ Banking remains focused on driving efficiencies and maintaining strong cost disciplines to enable business re-investment.
The charge to provide for bad and doubtful debts decreased by $22 million. The improvement was due to a combination of lower specific provisions on business exposures, strong credit card collections and an overall improvement in asset quality as the economic recovery continues.
Cash earnings on risk-weighted assets has improved by 31 basis points to 1.93% from the September 2011 half year. Cash earnings growth, offset by an increase in risk-weighted assets on the back of increased lending have driven the improvement.
NZ BankingFinancial Analysis (in local currency)

Half Year Results
2012
64
Review of Divisional Operations and Results – NZ Banking
Other Items
Asset QualityAs at
Mar 12 Sep 11 Mar 11Specific provision for doubtful debts
(NZ$m) 138 170 175 Collective provision for doubtful debts
(NZ$m) 198 207 219 Specific provision on loans at fair
value (NZ$m) 55 57 84 Collective provision on loans at fair
value (NZ$m) 97 72 74
90+ DPD assets (NZ$m) 214 202 263
Gross impaired assets (NZ$m) 530 658 836 90+ DPD plus gross impaired assets
to gross loans and acceptances 1.28% 1.51% 1.96% Specific provision to gross impaired
assets 36.4% 34.5% 31.0% Net write-offs to gross loans and
acceptances (annualised) 0.25% 0.22% 0.18% Total provision as a percentage of net
write-offs 334% 405% 540% Total provision to gross loans and
acceptances 0.84% 0.89% 0.99% Bad and doubtful debt charge to
credit risk weighted assets 0.19% 0.43% 0.53%
New Zealand’s economy has continued to grow at a slow pace through the first half of the financial year. Confidence and outlook has been dampened by emerging weaknesses in the global economy, which potentially includes slower than expected growth in China, the possibility of a prolonged downturn in Europe, high oil prices and the strong New Zealand dollar affecting local currency denominated export receipts.
In the broader business lending sector, the residual effects of the most recent economic downturn continue to affect sectors such as; commercial property (residential subdivision and development land), highly geared dairy farming operations and viticulture. The kiwifruit industry has been adversely affected by the Psa virus although the outlook for the industry has improved recently with careful disease management processes and continuing investigation of cost effective treatment options.
Agricultural commodity prices have remained elevated although they are trending down from recent highs. While the continued strength of the New Zealand dollar has dampened farm gate returns, confidence in the sector remains strong.
In spite of this challenging economic context the quality of BNZ’s lending portfolio has continued to improve. Compared with September 2011, the level of 90+ DPD and gross impaired assets to gross loans and acceptances has improved by 23 basis points from 1.51% to 1.28% with improvement across both business and retail exposures. Bad and doubtful debt charges are also 39.3% lower than the September half and 64.2% lower than the March 2011 half. Provision coverage has been reduced, reflecting the improvement in asset quality with lower specific provisions in particular.
Growth in the Housing portfolio has continued into this financial year, with asset quality remaining sound. The asset quality trend in unsecured consumer lending (credit card and personal loans) continues to improve, and as with Housing, is benefiting from a proactive approach in dealing with distressed customers.
BNZ has maintained a supportive approach to the business sector and continues to seek good quality lending opportunities. This includes growth in lending to the agricultural sector where asset quality continues to improve due to a well founded credit management approach, including the assessment of expected future returns from dairy and other commodities.
BNZ actively manages its lending portfolio and this includes a dynamic approach to adjustment of risk settings, a comprehensive program of oversight and early intervention activities for distressed credits.
Capital and Funding PositionDuring the half year, BNZ has continued to consolidate its balance sheet strength, supported by prudent liquidity management, maintaining access to wholesale funding markets and improving its capital base. A key focus for the bank has been the retail deposit strategy as an avenue for increasing the stable funding base.
This ongoing focus on customer deposits has seen BNZ increase its retail deposits by 5.3% compared to the September 2011 half year. Deposit funding remains a core component of balance sheet strength, with the ongoing rebalancing of our funding base towards customer deposits being a key factor supporting BNZ’s AA-/ Aa3 credit rating.
BNZ’s Core Funding Ratio (CFR), remains comfortably above the current Reserve Bank of New Zealand’s (RBNZ) minimum requirement of 70%.
Recently, offshore wholesale funding markets have been challenging, with the December quarter being particularly difficult due to the European sovereign debt crisis. In spite of the challenging environment in the March 2012 half year, BNZ was successful in accessing the domestic and offshore senior unsecured bond markets by placing bonds to both retail and institutional investors. This is an indication of the strong investor franchise BNZ has built over time.
During the March 2012 half year, BNZ completed its second successful European covered bond issue, raising EUR 500 million of 3.25 year funding. BNZ also completed two domestic covered bond issuances, raising NZ$350 million of 6 year funding. BNZ also issued NZ$465 million equivalent in term funding via medium term notes through USD, JPY, and CHF issuances.
As at 31 March 2012 BNZ Banking Group’s regulatory capital levels remain well above the RBNZ’s prescribed minimum levels. BNZ Banking Group’s Tier 1 capital ratio was 9.59% and its Total capital ratio was 12.39% (minimum 8%) on an RBNZ basis.
On 10 May 2012, BNZ announced an increase to its authorised capital of NZ$400 million from NAB Ltd. This further increases BNZ’s capital strength in advance of Basel III implementation. This transaction has an immaterial impact on the Group’s overall capital ratios and will be reflected in BNZ’s capital ratios in September 2012 half year.

Half Year Results
2012
65
Review of Divisional Operations and Results – NZ Banking
NZ BankingResults presented in Australian dollars. See page 62 for results in local currency.
Half Year toMar 12 Sep 11 Mar 11 Mar 12 v Mar 12 v
$m $m $m Sep 11 % Mar 11 %Net interest income 549 528 487 4.0 12.7 Other operating income 179 174 171 2.9 4.7
Net operating income 728 702 658 3.7 10.6 Operating expenses (289) (291) (281) 0.7 (2.8)
Underlying profit 439 411 377 6.8 16.4 Charge to provide for bad and doubtful debts (26) (44) (72) 40.9 63.9
Cash earnings before tax 413 367 305 12.5 35.4 Income tax expense (116) (113) (90) (2.7) (28.9)
Cash earnings 297 254 215 16.9 38.1
Impact of foreign exchange rate movements
Favourable/
Half year
since Mar 12 v
Half year
sinceMar 12 v
(unfavourable) Sep 11 Sep 11 Mar 11 Mar 11March 12 $m Ex FX % $m Ex FX %Net interest income - 3.9 9 11.1 Other operating income (1) 3.7 2 2.7 Operating expenses - 0.9 (4) (1.1)Charge to provide for
bad and doubtful debts - 41.1 (1) 64.4 Income tax expense - (2.4) (2) (26.1)
Cash earnings (1) 17.8 4 36.4

Half Year Results
2012
66
Review of Divisional Operations and Results – UK Banking
UK Banking operates under the Clydesdale Bank and Yorkshire Bank brands. It offers a range of banking services for both personal and business customers through retail branches, Financial Solutions Centres, direct banking and brokers. As announced on 30 April 2012, UK Banking was subject to a strategic review which was undertaken in response to more challenging economic and operating conditions in the region. The main outcomes of this, subject to final regulatory approvals, will be to simplify the business model to focus on retail operations and SME business lending in Scotland and Northern England, improve the balance sheet structure by transferring the vast majority of UK Banking’s commercial real estate assets to NAB in the first half of the 2013 financial year and place the transferred portfolio into run-off to be managed separately.
Results presented in local currency. See page 69 for results in $AUDm.
Half Year toMar 12 Sep 11 Mar 11 Mar 12 v Mar 12 v
£m £m £m Sep 11 % Mar 11 %Net interest income 450 491 481 (8.4) (6.4)Other operating income 142 153 134 (7.2) 6.0
Net operating income 592 644 615 (8.1) (3.7)Operating expenses (348) (363) (363) 4.1 4.1
Underlying profit 244 281 252 (13.2) (3.2)Charge to provide for bad and doubtful debts (282) (145) (151) (94.5) (86.8)
Cash earnings before tax (38) 136 101 large largeIncome tax benefit/(expense) 13 (30) (24) large large
Cash (deficit)/earnings (25) 106 77 large large
Average Volumes (£bn)Gross loans and acceptances 33.7 33.2 32.6 1.5 3.4 Interest earning assets 43.0 42.0 41.4 2.4 3.9 Total assets 46.4 45.1 44.8 2.9 3.6 Retail deposits 24.2 23.3 23.4 3.9 3.4
Capital (£bn)
Risk-weighted assets - credit risk (spot) 28.5 29.5 29.7 (3.4) (4.0)Total risk-weighted assets (spot) 31.4 32.5 33.3 (3.4) (5.7)
Performance MeasuresCash earnings on average assets (0.11%) 0.47% 0.34% (58 bps) (45 bps)Cash earnings on risk-weighted assets (0.16%) 0.64% 0.46% (80 bps) (62 bps)Net interest margin 2.09% 2.33% 2.33% (24 bps) (24 bps)Cost to income ratio 58.8% 56.4% 59.0% (240 bps) 20 bps ‘Jaws’ (4.0%) 4.7% 0.4% (870 bps) (440 bps)Cash earnings per average FTE (£’000s) (6) 25 18 large largeFTEs (spot) 8,146 8,351 8,684 2.5 6.2
As atDistribution Mar 12 Sep 11 Mar 11Number of retail branches 337 337 339 Number of ATMs 884 887 935 Number of internet banking
customers (no. ‘000s) 587 562 536
UK BankingDavid Thorburn

Half Year Results
2012
67
Review of Divisional Operations and Results – UK Banking
March 2012 v March 2011 Cash earnings decreased by £102 million when compared to March 2011. The cash earnings loss of £25 million reflects higher charges to provide for bad and doubtful debts, together with a reduction in net interest income due to higher funding costs.
Cash earnings on risk-weighted assets has decreasedby 62 basis points, largely reflecting the decline in cash earnings. Average risk-weighted assets remained relatively stable.
Net interest income decreased by £31 million or 6.4%. The credit rating downgrade that occurred during the period resulted in lower margin money market and retail deposits being replaced by more expensive longer term wholesale funding and retail term deposits. This resulted in higher wholesale and retail funding costs, coupled with higher liquidity costs. This was partially offset by higher lending income. The net interest margin declined by 24 basis points, driven by the higher funding costs and was diluted further by an increase in low yielding liquid assets.
Average gross loans and acceptances increased by £1.1 billion or 3.4%, primarily due to growth in mortgages. Mortgage growth of 10.9% was substantially higher than system growth of 0.3%(1). Business lending balances remained flat and the unsecured personal lending book declined by 16.7%.
Average retail deposits increased by £0.8 billion or 3.4%, which reflected the impact of a successful term deposit campaign.
Other operating income increased by £8 million or 6.0%, due to the depressive effect on other operating income in the March 2011 half year of the payments protection insurance (PPI) redress charged against this line item in that period. All claims are now charged against the PPI provision. This was partially offset by lower fees and commissions.
Operating expenses decreased by £15 million or 4.1% as the business demonstrated strong cost control. The reduction was driven by lower personnel costs as a result of the reduction in FTEs and lower performance related remuneration. This was partly offset by additional amortisation of investment spend from prior periods.
The charge to provide for bad and doubtful debts increased by £131 million over the March 2011 half year. The increase was predominantly from business lending losses as a result of the economic and market uncertainty and, in particular, further deterioration in the commercial property market. This was partly offset by continued improvement in unsecured retail portfolio delinquency, driving lower unsecured retail lending losses. (1) Source: Bank of England - February 2012.
March 2012 v September 2011
Cash earnings decreased by £131 million, reflecting higher charges to provide for bad and doubtful debts and a reduction in income.
Cash earnings on risk-weighted assets has decreasedby 80 basis points, largely reflecting the decline in cash earnings. Average risk-weighted assets remained relatively stable.
Net interest income decreased by £41 million or 8.4%, which was primarily due to higher wholesale and retail funding costs. This was partially offset by higher lending income. The net interest margin declined by 24 basis points driven by the reduction in net interest income and an increase in low yielding liquid assets.
Average gross loans and acceptances increased by £0.5 billion or 1.5%. This was driven by above system growth in mortgages. Unsecured personal lending decreased over the March 2012 half year and business lending balances remained flat, although the spot business lending balance declined in the March 2012 half year.
Average retail deposits increased by £0.9 billion or 3.9%. This reflected the impact of a successful term deposit campaign, and was above system growth of 1.0%(1).
Other operating income decreased by £11 million or 7.2%. This was mainly due to lower fees and commissions, reflecting economic conditions and the subdued demand for credit. This decrease was partially offset by insurance profit share which is received annually in the first half of each year.
Operating expenses decreased by £15 million or 4.1% as the business demonstrated strong cost control. The reduction was driven by lower personnel costs and was partly offset by additional amortisation costs.
The charge to provide for bad and doubtful debts increased by £137 million when compared to the September 2011 half year. The increase was predominantly from business lending losses as a result of the economic and market uncertainty and, in particular, further deterioration in the commercial property market.
UK BankingFinancial Analysis (in local currency)

Half Year Results
2012
68
Review of Divisional Operations and Results – UK Banking
Other Items
Asset QualityAs at
Mar 12 Sep 11 Mar 11Specific provision for doubtful debts
(£m) 206 120 89 Collective provision for doubtful debts
(£m) 383 243 275 Specific provision on loans at fair
value 25 16 37 Collective provision on loans at fair
value 133 141 97
90+ DPD assets (£m) 265 194 261
Gross impaired assets (£m) 968 858 867 90+ DPD plus gross impaired assets
to gross loans and acceptances 3.68% 3.12% 3.44% Specific provision to gross impaired
assets 23.9% 15.9% 14.5% Net write-offs to gross loans and
acceptances (annualised) 1.12% 0.84% 0.84% Total provision as a percentage of net
write-offs 200% 184% 181% Total provision to gross loans and
acceptances 2.23% 1.54% 1.52% Bad and doubtful debt charge to
credit risk-weighted assets 1.98% 1.00% 1.02%
Economic and market conditions resulted in deteriorating asset quality in our business lending portfolio over the March 2012 half year, predominantly within the commercial property sector which has experienced a ‘double dip’ reduction in property values.
Retail asset quality, mortgages and unsecured personal loans have improved and are showing a lower delinquency profile.
The total 90+ DPD balances have increased through the half year to March 2012 to £265 million, compared with £194 million at September 2011. This increase was in the business portfolio, with the commercial property book accounting for the majority of the increase, although there was also a material increase in the trading book 90+ DPD balance, reflecting the current stage of the economic cycle. There were continued reductions in the home loan and unsecured portfolios.
The level of impaired assets has increased to £968 million in the half year to March 2012, with the majority of the increase occurring in the second quarter. Commercial property business remains the largest component of the impaired asset portfolio which is as a result of the further deterioration of market conditions in this sector.
The overall collective provision for doubtful debts increased over the period reflecting the deterioration of the business lending portfolio and the transfer to the UK of £150 million of the existing economic overlay to the Group’s collective provision. However, there was a continued reduction in the personal lending collective provision, driven by improvements in the delinquency profile and a reduction in unsecured personal lending balances.
The ratio of total provisions to gross loans and acceptances increased to 2.23% in March 2012, as growth in balance sheet provisions was faster than growth in the portfolio. The majority of the provision growth was on commercial property related exposures.
Capital and Funding Position
Clydesdale Bank PLC (Clydesdale) issued £500 million of ordinary shares to the Group in January 2012. The Core Tier 1 ratio (FSA basis) increased to 9.2% from 8.9% in September 2011 and the Tier 1 ratio increased from 9.9% to 10.3%. This had an immaterial impact on the Group’s overall capital ratios.
Clydesdale continued to strengthen its ability to raise term funding. This included the re-structuring of the Covered Bond and Securitisation programs which enabled the programs to retain AAA ratings. This platform enabled Clydesdale to issue debt from the Lanark owner occupier mortgage securitisation program.
Clydesdale remains diversified in terms of the type of instrument and product, currency, counterparty, term structure and market.
Stable Funding and Customer Funding Indices
32.7 32.633.2 33.7
105.3%
93.8%96.7% 97.1%
85.2%81.9%
84.9%87.2%
£bn
Sep 10 Mar 11 Sep 11 Mar 12
Gross Loans & Acceptances (HY Average)Stable Funding IndexCustomer Funding Index
The successful growth of Clydesdale’s retail deposits has improved the Customer Funding Index to 87.2% as at March 2012 from 84.9% as at September 2011. The Stable Funding Index (customer funding plus term debt) remains robust.

Half Year Results
2012
69
Review of Divisional Operations and Results – UK Banking
UK BankingResults presented in Australian dollars. See page 66 for results in local currency.
Half Year toMar 12 Sep 11 Mar 11 Mar 12 v Mar 12 v
$m $m $m Sep 11 % Mar 11 %Net interest income 684 754 768 (9.3) (10.9)Other operating income 217 234 214 (7.3) 1.4
Net operating income 901 988 982 (8.8) (8.2)Operating expenses (529) (556) (580) 4.9 8.8
Underlying profit 372 432 402 (13.9) (7.5)Charge to provide for bad and doubtful debts (428) (221) (241) (93.7) (77.6)
Cash earnings before tax (56) 211 161 large largeIncome tax benefit/(expense) 20 (45) (39) large large
Cash (deficit)/earnings (36) 166 122 large large
Impact of foreign exchange rate movements
Favourable/
Half year
since Mar 12 v
Half year
since Mar 12 v(unfavourable) Sep 11 Sep 11 Mar 11 Mar 11March 12 $m Ex FX % $m Ex FX %Net interest income (6) (8.5) (34) (6.5)Other operating income (2) (6.4) (11) 6.5 Operating expenses 5 4.0 27 4.1 Charge to provide for
bad and doubtful debts 5 (95.9) 23 (87.1)Income tax expense - large (1) large
Cash earnings 2 large 4 large

Half Year Results
2012
70
Review of Divisional Operations and Results – Great Western Bank
GWB is fully deposit funded and offers a range of traditional banking and wealth management products delivered in a community banking model, and diversified lending in Agribusiness, small and medium sized businesses, and commercial property, together with a growing retail offering. Ranked as of 31 December 2011, GWB is the 7th largest bank provider of Agri loans in the US.
On the 13th of March 2012, GWB announced a proposed acquisition of First Federal Savings Bank of Iowa (First Federal). First Federal will contribute approximately US$433 million in deposit-funded assets and add 11 branches to GWB’s footprint in the state of Iowa. The merger is scheduled to close in the US summer, subject to regulatory and shareholder approval.
Results presented in local currency. See page 73 for results in $AUDm.
Half Year toMar 12 Sep 11 Mar 11 Mar 12 v Mar 12 vUS$m US$m US$m Sep 11 % Mar 11 %
Net interest income 136 138 155 (1.4) (12.3)Other operating income 37 44 38 (15.9) (2.6)
Net operating income 173 182 193 (4.9) (10.4)Operating expenses (86) (91) (90) 5.5 4.4
Underlying profit 87 91 103 (4.4) (15.5)Charge to provide for bad and doubtful debts (14) (27) (32) 48.1 56.3
Cash earnings before tax 73 64 71 14.1 2.8 Income tax expense (23) (21) (24) (9.5) 4.2
Cash earnings 50 43 47 16.3 6.4
Average Volumes (US$bn)Gross loans and acceptances 5.4 5.3 5.3 1.9 1.9 Interest earning assets 7.2 6.9 7.1 4.3 1.4 Total assets (1) 7.9 7.6 7.7 3.9 2.6 Retail deposits 6.5 6.3 6.6 3.2 (1.5)
Capital (US$bn)Risk-weighted assets - credit risk (spot) 5.0 4.9 5.7 2.0 (12.3)Total risk-weighted assets (spot) 5.5 6.1 5.9 (9.8) (6.8)
Performance MeasuresCash earnings on average assets 1.27% 1.13% 1.22% 14 bps 5 bps Cash earnings on risk-weighted assets 1.75% 1.40% 1.57% 35 bps 18 bps Net interest margin 3.78% 3.99% 4.38% (21 bps) (60 bps)Cost to income ratio 49.7% 50.0% 46.6% 30 bps (310 bps)‘Jaws’ 0.6% (6.8%) 6.5% 740 bps (590 bps)Cash earnings per average FTE (US$’000s) 67 57 62 17.5 8.1 FTEs (spot) 1,478 1,492 1,515 0.9 2.4
(1) Total assets exclude goodwill and other intangible assets.
Great Western BankAndrew Thorburn

Half Year Results
2012
71
Review of Divisional Operations and Results – Great Western Bank
March 2012 v March 2011Cash earnings increased by $3 million or 6.4% to $50 million when compared to the March 2011 half year. Revenue and bad and doubtful debt charges declined at similar rates, as margins tightened and asset quality improved.
Net interest income declined by $19 million or 12.3%, driven by renewed pressure on loan and investment yields, as competition intensified with the general economic recovery releasing capital for banks to return to core lending activity.
Net interest margin declined by 60 basis points compared to the March 2011 half year driven by depressed loan yields from competitive pressures in the market, coupled with erosion of yields on government backed securities. Simultaneously, average funding costs have continued to decline through reducing deposit rates and access to lower priced funding sources.
Other operating income declined by $1 million or 2.6%. Regulatory changes restricting debit card interchange income reduced this source of income by $2 million compared with the half year to March 2011. This loss of revenue was partially offset by strong income on home loan originations and fees from the secondary market as these loans are on sold.
Operating expenses declined by $4 million or 4.4% driven primarily by a reduction in costs relating to foreclosed property, reductions in FTE levels through attrition, and operational efficiencies.
The charge to provide for bad and doubtful debts decreased by $18 million or 56.3% for the half year, reflecting improvements in asset quality across the loan portfolio, with significantly lower write-offs and delinquencies in the March 2012 half year.
Cash earnings on risk weighted assets increased by 18 basis points compared to the March 2011 half year reflecting the increase in earnings and optimisation of risk weighted assets on the transition to Basel II capital framework during the March 2012 half year.
Average gross loans and acceptances grew by $0.1 billion with $0.4 billion of core loan growth, partially offset by the runoff and workout of $0.3 billion of non-core loans that were acquired as part of the TierOne asset acquisition.
Average retail deposits declined by $0.1 billion, driven by reductions in deposit pricing designed to reduce funding costs and more effectively utilise excess liquidity.
March 2012 v September 2011Cash earnings for the March 2012 half year increased by $7 million or 16.3% when compared to the September half year, reflecting the improved operating environment, with loan demand increasing, improved credit quality, and reductions in operating expenses. These effects were partially offset by continuing pressure on margins, particularly in the investment portfolio, which is largely comprised of government guaranteed mortgage backed securities that are currently trading at historically low yields.
Net interest income decreased by $2 million or 1.4% on a 21 basis points reduction in net interest margin. This was driven by intense competition for loan growth and a reduction in yields on excess liquidity invested in government backed securities. The effect was partially offset by a continued reduction in funding costs and strong loan growth for the half year.
Other operating income decreased by $7 million or 15.9%, driven by a reduction in fees charged on consumer debit card transactions as a result of regulatory changes, restricting debit card interchange income.
Operating expenses decreased $5 million or 5.5% compared to the September 2011 half year on a reduction in costs related to foreclosed property.
The charge to provide for bad and doubtful debts decreased by $13 million or 48.1% on stabilisation of asset quality across the portfolio.
Cash earnings on risk weighted assets increased 35 basis points compared to the September 2011 half year, driven by the 16.3% increase in cash earnings and a 9.8% decline in spot RWAs resulting from RWA optimisation projects.
Average gross loans and acceptances increased by $0.1 billion compared to the September 2011 half year, the net result of $0.3 billion of core lending growth, partially offset by $0.1 billion of run-off in the acquired non-core book.
Average retail deposits grew by $0.2 billion as customers have begun to return their funds to traditional bank deposit products given limited higher-yielding options in the marketplace.
Great Western BankFinancial Analysis (in local currency)

Half Year Results
2012
72
Review of Divisional Operations and Results – Great Western Bank
Other Items
Asset QualityAs at
Excluding covered loans (1) Mar 12 Sep 11 Mar 11
90+ DPD assets (US$m) - - - Specific provision for doubtful debts
(US$m) 12 17 20 Collective provision for doubtful debts
(US$m) 39 42 41
Gross impaired assets (US$m) 108 141 97
90+ DPD plus gross impaired assets to non-covered gross loans and acceptances 2.29% 3.25% 2.37%
Specific provision to gross impaired assets 11.1% 12.1% 20.6%
Total provision to non-covered gross loans and acceptances 1.08% 1.36% 1.49%
As atIncluding covered loans (1) Mar 12 Sep 11 Mar 11
90+ DPD assets (US$m) 46 110 197 Specific provision for doubtful debts
(US$m) 12 17 20 Collective provision for doubtful debts
(US$m) 39 42 41
Gross impaired assets (US$m) 114 141 97 90+ DPD plus gross impaired assets
to gross loans and acceptances 2.95% 4.81% 5.65% Specific provision to gross impaired
assets 10.5% 12.1% 20.6% Net write-offs to gross loans and
acceptances (annualised) 0.56% 0.79% 0.69% Total provision to gross loans and
acceptances 0.94% 1.13% 1.17%
(1) Refers to loans covered by the loss share agreement with the FDIC.
GWB’s total 90+ DPD have improved in the March 2012 half year as the acquired TierOne assets have been managed down.
As the signs of moderate economic growth have become evident and unemployment levels have slowly receded across the GWB footprint, asset quality has seen a significant improvement on the prior period. Annualised net write-offs to gross loans and acceptances have fallen by 23 basis points compared to the September 2011 half, reflecting both dedicated efforts to address problem credits in the September half year and the corresponding lack of further deterioration in the current half year.
The acquired TierOne portfolio, predominantly covered by the Federal Deposit Insurance Corporation (FDIC) loss share agreement, continues to perform in line with expectations as the arrangement with the FDIC continues to work effectively.
The asset quality challenges that remain in the portfolio are largely concentrated in commercial real estate and land development, which have been adversely affected by the current economic environment. GWB has significantly reduced its core exposure to commercial real estate since the acquisition by NAB. Other segments, particularly agribusiness, continue to perform well with solid harvests and commodity prices supporting land valuations.
Capital and Funding PositionGWB’s regulatory capital position remains strong and has consistently exceeded the requirements of a ‘well capitalised’ institution under the guidelines of the FDIC.
As of 31 March 2012, GWB’s US Tier 1 Capital ratio was 13.71% and the Total Capital ratio stood at 14.96%.
GWB continues to maintain a strong core funding base, with US$1.1 billion in deposits in excess of loans. Excess deposits are invested in a liquid portfolio of predominantly US government backed securities.
The successful growth of GWB’s retail deposits has improved the Customer Funding Index to 125% as at 31 March 2012 from 124% as at 30 September 2011.
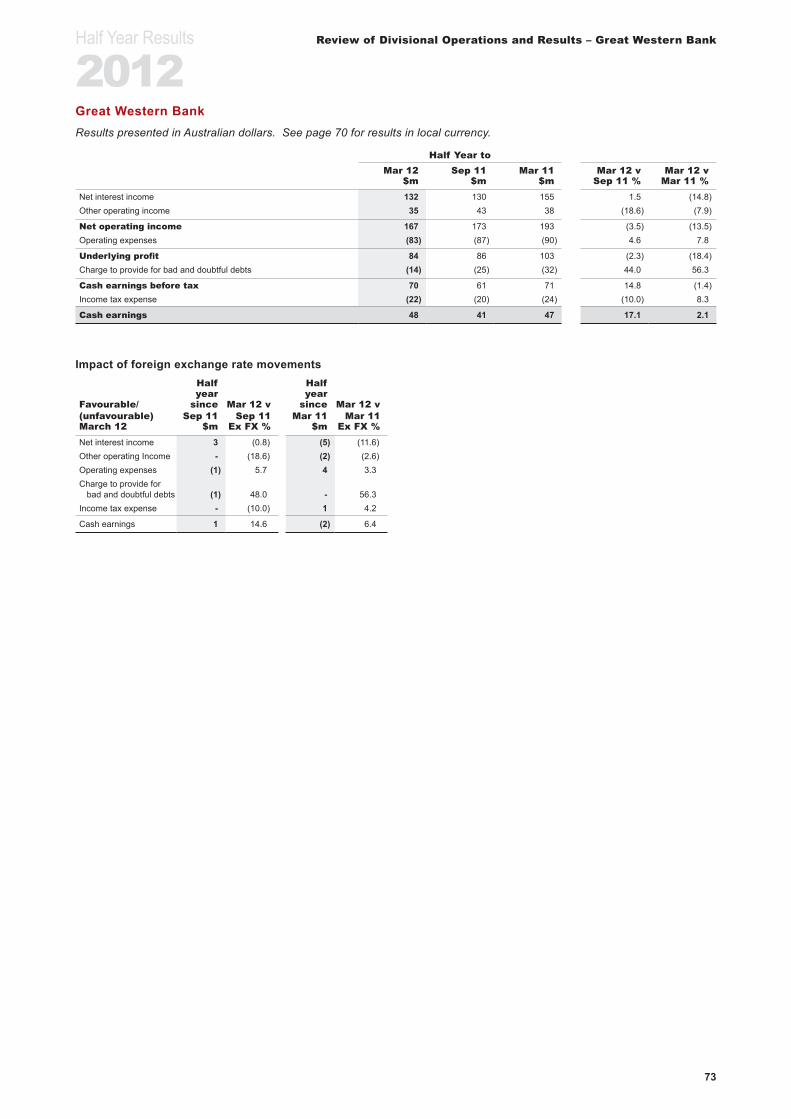
Half Year Results
2012
73
Review of Divisional Operations and Results – Great Western Bank
Great Western BankResults presented in Australian dollars. See page 70 for results in local currency.
Half Year toMar 12 Sep 11 Mar 11 Mar 12 v Mar 12 v
$m $m $m Sep 11 % Mar 11 %Net interest income 132 130 155 1.5 (14.8)Other operating income 35 43 38 (18.6) (7.9)
Net operating income 167 173 193 (3.5) (13.5)Operating expenses (83) (87) (90) 4.6 7.8
Underlying profit 84 86 103 (2.3) (18.4)Charge to provide for bad and doubtful debts (14) (25) (32) 44.0 56.3
Cash earnings before tax 70 61 71 14.8 (1.4)Income tax expense (22) (20) (24) (10.0) 8.3
Cash earnings 48 41 47 17.1 2.1
Impact of foreign exchange rate movements
Favourable/
Half year
since Mar 12 v
Half year
since Mar 12 v(unfavourable) Sep 11 Sep 11 Mar 11 Mar 11March 12 $m Ex FX % $m Ex FX %Net interest income 3 (0.8) (5) (11.6)Other operating Income - (18.6) (2) (2.6)Operating expenses (1) 5.7 4 3.3 Charge to provide for
bad and doubtful debts (1) 48.0 - 56.3 Income tax expense - (10.0) 1 4.2
Cash earnings 1 14.6 (2) 6.4
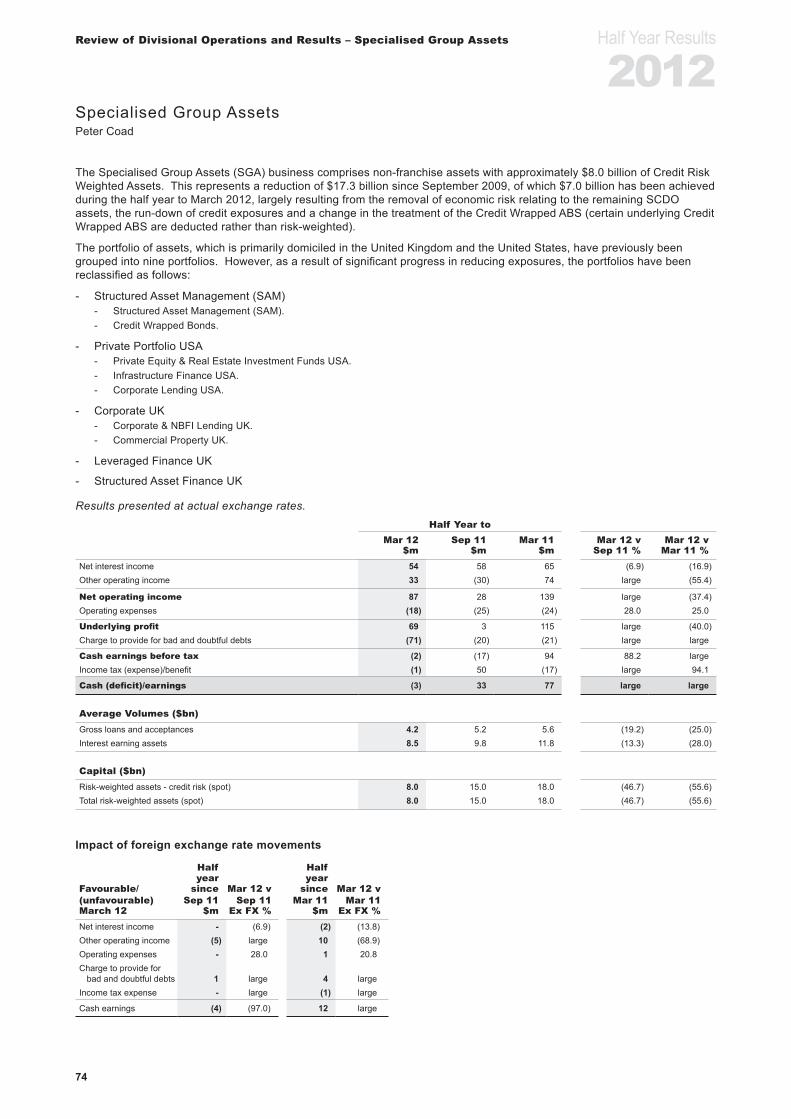
Half Year Results
2012
74
Review of Divisional Operations and Results – Specialised Group Assets
The Specialised Group Assets (SGA) business comprises non-franchise assets with approximately $8.0 billion of Credit Risk Weighted Assets. This represents a reduction of $17.3 billion since September 2009, of which $7.0 billion has been achieved during the half year to March 2012, largely resulting from the removal of economic risk relating to the remaining SCDO assets, the run-down of credit exposures and a change in the treatment of the Credit Wrapped ABS (certain underlying Credit Wrapped ABS are deducted rather than risk-weighted).
The portfolio of assets, which is primarily domiciled in the United Kingdom and the United States, have previously been grouped into nine portfolios. However, as a result of significant progress in reducing exposures, the portfolios have been reclassified as follows:
- Structured Asset Management (SAM) - Structured Asset Management (SAM). - Credit Wrapped Bonds.
- Private Portfolio USA - Private Equity & Real Estate Investment Funds USA. - Infrastructure Finance USA. - Corporate Lending USA.
- Corporate UK - Corporate & NBFI Lending UK. - Commercial Property UK.
- Leveraged Finance UK
- Structured Asset Finance UK
Results presented at actual exchange rates.Half Year to
Mar 12 Sep 11 Mar 11 Mar 12 v Mar 12 v$m $m $m Sep 11 % Mar 11 %
Net interest income 54 58 65 (6.9) (16.9)Other operating income 33 (30) 74 large (55.4)
Net operating income 87 28 139 large (37.4)Operating expenses (18) (25) (24) 28.0 25.0
Underlying profit 69 3 115 large (40.0)Charge to provide for bad and doubtful debts (71) (20) (21) large large
Cash earnings before tax (2) (17) 94 88.2 largeIncome tax (expense)/benefit (1) 50 (17) large 94.1
Cash (deficit)/earnings (3) 33 77 large large
Average Volumes ($bn)Gross loans and acceptances 4.2 5.2 5.6 (19.2) (25.0)Interest earning assets 8.5 9.8 11.8 (13.3) (28.0)
Capital ($bn)Risk-weighted assets - credit risk (spot) 8.0 15.0 18.0 (46.7) (55.6)Total risk-weighted assets (spot) 8.0 15.0 18.0 (46.7) (55.6)
Impact of foreign exchange rate movements
Favourable/
Half year
since Mar 12 v
Half year
since Mar 12 v(unfavourable) Sep 11 Sep 11 Mar 11 Mar 11March 12 $m Ex FX % $m Ex FX %Net interest income - (6.9) (2) (13.8)Other operating income (5) large 10 (68.9)Operating expenses - 28.0 1 20.8 Charge to provide for
bad and doubtful debts 1 large 4 largeIncome tax expense - large (1) large
Cash earnings (4) (97.0) 12 large
Specialised Group AssetsPeter Coad
Half Year Results
2012
75
Review of Divisional Operations and Results – Specialised Group Assets
March 2012 v March 2011Cash earnings decreased by $80 million compared to the March 2011 half year to $3 million loss. This was mainly due to lower mark-to-market gains on the SCDO risk mitigation trades and a higher bad and doubtful debts charge.
Net operating income decreased by $52 million compared to March 2011 half year to $87 million. This was mainly due to lower mark-to-market gains on the SCDO trades ($17 million at March 2012 versus $59 million at March 2011).
Non-franchise asset income decreased, consistent with the run-down of the lending portfolio.
Operating expenses decreased by $6 million or 25.0% on the March 2011 half year to $18 million. This was due to the run-off of the business, with FTE numbers contracting from 42 to 28.
The charge to provide for bad and doubtful debts increased by $50 million on the March 2011 half year to $71 million. This was as a result of increases in specific client provisions, largely driven by four UK exposures and reduced collective provision release.
Effective tax rates in SGA are heavily influenced by the mix of income and losses between the UK and US, with additional effects from the restatement of deferred tax balances due to the change in the UK corporate tax rate.
Average interest earning assets decreased by $3.3 billion (28.0%) to $8.5 billion. Excluding the foreign exchange impact of $0.4 billion, the asset decrease was $2.9 billion.
Risk Weighted Assets decreased by $10.0 billion (55.6%) to $8 billion. Excluding the foreign exchange impact of $0.1 billion, there was an underlying decrease of $9.9 billion. The underlying movement includes the impact of removing the economic risk related to the SCDO assets and a change in treatment of the credit wrapped ABS (certain underlying credit wrapped ABS are deducted rather than risk-weighted).
March 2012 v September 2011Cash earnings decreased by $36 million compared to the September 2011 half year, primarily due to a higher bad and doubtful debt charge and lower tax benefits, offset by mark-to-market gains on the SCDO risk mitigation trades compared with mark-to-market losses in the September 2011 half year.
Net operating income increased by $59 million largely due to mark-to-market losses on the SCDO risk mitigation trades during the September 2011 half year ($84 million loss), and a gain on the sale of an equity investment, which were not repeated in the March 2012 half year.
Operating expenses decreased by $7 million on the September 2011 half year. This was due to the run-off of the business.
The charge to provide for bad and doubtful debts increased by $51 million, due to increased specific provisions largely driven by four UK exposures.
Effective tax rates in SGA are heavily influenced by the mix of income and losses between the UK and US with additional effects from the restatement of deferred tax balances due to the change in the UK corporate tax rate.
Average interest earning assets decreased by $1.3 billion (13.3%). The foreign exchange impact was minimal.
Risk Weighted Assets decreased by $7.0 billion (46.7%). Excluding the foreign exchange impact of $0.4 billion, there was an underlying decrease of $6.6 billion. The underlying movement includes the impact of removing the economic risk related to the remaining SCDO assets and a change in treatment of the credit wrapped ABS (certain underlying Credit Wrapped ABS are deducted rather than risk-weighted).
Specialised Group AssetsFinancial Analysis

Half Year Results
2012
76
Review of Divisional Operations and Results – Specialised Group Assets
Other Items
Asset Quality As at
Mar 12 Sep 11 Mar 11Specific provision for doubtful debts
($m) 109 167 147 Collective provision for doubtful debts
($m) 143 180 210 Collective provision on derivatives at
fair value ($m) 29 185 189
Gross impaired assets ($m) 350 488 513 Gross impaired assets to gross loans
and acceptances 9.71% 10.49% 9.71% Specific provision to gross impaired
assets 31.1% 34.2% 28.7% Net write-offs to gross loans and
acceptances 8.66% 2.26% 3.07%
The internal credit ratings of SGA portfolio assets deteriorated slightly due to adverse economic conditions in the UK during the current half year. Stable conditions in the US and continued run-off of the portfolio have mitigated specific provisions with the release of collective provisions.
The bad and doubtful debts charge for the half year was $71 million, which is an increase of $50 million on the March 2011 half year. During the period, specific provisions across the portfolios stemmed principally from the UK Leveraged Finance and Commercial Property portfolios, which remain the portfolios that are most vulnerable to adverse economic conditions. A number of impaired assets have been written-off, reducing specific provisions and gross impaired assets.
Provisions for the non-SAM portfolio (totalling 100 clients) have been set according to each client’s individual circumstances, on the basis of ongoing reviews.
The exposures across the portfolios are predominantly in the UK, Europe, and North America.
A number of assets in these portfolios are under the close review and oversight of the separate Strategic Business Services team.
SGA continues to actively manage the SAM portfolio. As at 31 March 2012, the exposures in the SAM portfolio fell to $3.0 billion ($3.7 billion including assets previously reported separately as Credit Wrapped Bonds) from $4.3 billion at September 2011.
With respect to the SCDOs, two fully hedged positions remain on the balance sheet. As announced on 22 March 2012, the Group entered into transactions to remove the economic risk on the two remaining SCDO assets. As a result there was a reduction in risk weighted assets of $1.5 billion, and as at 31 March 2012, there is no longer any unhedged SCDO risk. During the March 2012 half year, the final SCDO mark-to-market was a gain of $17 million.
As previously disclosed, the recognition of remaining hedge costs related to the SCDO risk mitigation trades have been accelerated by expensing the carrying value of these hedge costs to non cash earnings. During the March 2012 half year, $141 million ($99 million after tax) of such costs were expensed through non-cash earnings. Residual costs associated with the exit of the economic risk on the remaining two SCDOs have been applied against the $160 million management overlay for conduits and derivatives. The $160 million overlay has now been fully utilised.
Impaired Assets – Loans and AdvancesThe level of gross impaired assets has decreased by $163 million from March 2011 to $350 million at March 2012. There is no change to the ratio of gross impaired assets to gross loans and acceptances from March 2011.

Half Year Results
2012
77
Review of Divisional Operations and Results – Specialised Group Assets
This page has been left blank intentionally.

Half Year Results
2012
78
Review of Divisional Operations and Results – Corporate Functions and Other
The Group’s ‘Corporate Functions’ business includes NAB’s operations in Asia and functions that support all businesses including Group Funding and Other Corporate Functions activities. Group Funding acts as the central vehicle for movements of capital and structural funding to support the Group’s operations, together with capital and balance sheet management. Other Corporate Functions activities include Group Business Services, Office of the CEO, Group Risk, Group Governance, Group Strategy and Finance, People, Marketing and Communications.
Half Year toMar 12 Sep 11 Mar 11 Mar 12 v Mar 12 v
$m $m $m Sep 11 % Mar 11 %Net operating income 335 344 308 (2.6) 8.8 Operating expenses (267) (260) (263) (2.7) (1.5)
Underlying profit 68 84 45 (19.0) 51.1 Benefit from /(charge to provide for) bad and doubtful debts 1 71 (75) 98.6 large
Cash earnings before tax and non-controlling interest 69 155 (30) (55.5) largeIncome tax benefit/(expense) 23 (13) 47 large (51.1)
Cash earnings 92 142 17 (35.2) large
March 2012 v March 2011Cash earnings increased by $75 million when compared with the March 2011 half year, mainly due to the bad and doubtful debt charge for the Queensland and Victorian floods being included in the March 2011 half year.
Net operating income increased by $27 million as a result of increased earnings on higher levels of capital, partly offset by the interest on the settlement of the ExCaps tax dispute that occurred during the March 2011 half year.
Operating expenses remained relatively flat, driven by disciplined cost management during the period.
The charge to provide for bad and doubtful debts decreased by $76 million as the March 2011 half year included the overlay raised for the Queensland and Victorian floods.
The income tax benefit decreased by $24 million, largely due to higher cash earnings before tax.
March 2012 v September 2011Cash earnings decreased by $50 million when compared with the September 2011 half year. This was due to the reversal in the September 2011 half year of the charge to provide for bad and doubtful debts for the Queensland and Victorian floods, partially offset by an increase in the income tax benefit in the current half year.
Net operating income decreased by $9 million, primarily due to decreased earnings from other fee income.
Operating expenses remained relatively flat, driven by disciplined cost management during the period.
The benefit from bad and doubtful debts decreased by $70 million as the September 2011 half year included the reversal of the overlay raised for Queensland and Victorian floods.
The income tax benefit increased by $36 million, mainly as a result of lower cash earnings before tax.
Corporate Functions and Other
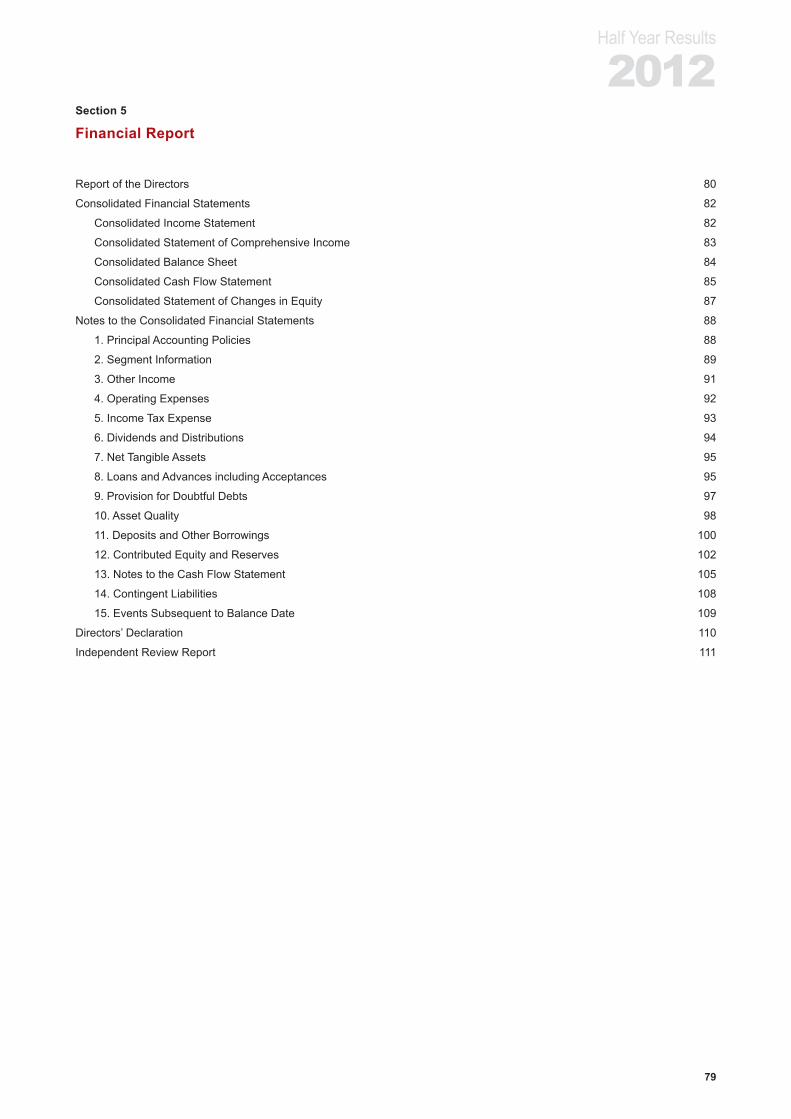
79
Half Year Results
2012Section 5
Financial Report
Report of the Directors 80
Consolidated Financial Statements 82
Consolidated Income Statement 82
Consolidated Statement of Comprehensive Income 83
Consolidated Balance Sheet 84
Consolidated Cash Flow Statement 85
Consolidated Statement of Changes in Equity 87
Notes to the Consolidated Financial Statements 88
1. Principal Accounting Policies 88
2. Segment Information 89
3. Other Income 91
4. Operating Expenses 92
5. Income Tax Expense 93
6. Dividends and Distributions 94
7. Net Tangible Assets 95
8. Loans and Advances including Acceptances 95
9. Provision for Doubtful Debts 97
10. Asset Quality 98
11. Deposits and Other Borrowings 100
12. Contributed Equity and Reserves 102
13. Notes to the Cash Flow Statement 105
14. Contingent Liabilities 108
15. Events Subsequent to Balance Date 109
Directors’ Declaration 110
Independent Review Report 111

Half Year Results
2012
80
Report of the Directors
Report of the Directors
The directors of National Australia Bank Limited (the‘Company’) present their report, together with the financial statements of the Group, being the Company and its controlled entities, for the half year ended 31 March 2012.
The directors of the Company have a significant responsibility with respect to the integrity of external reporting. This involves reviewing and monitoring, with the assistance of the Audit Committee and management, the processes, controls and procedures which are in place to maintain the integrity of the Group’s financial statements. Further details of the role of the Board of Directors and its Committees can be found in the Corporate Governance section of the Group’s 2011 Annual Financial Report or on the Group’s website www.nab.com.au.DirectorsDirectors who held office during or since the end of thehalf year are:
Michael A ChaneyChairman since September 2005 and Director sinceDecember 2004
Cameron A ClyneManaging Director and Group Chief Executive Officersince January 2009
Patricia A CrossDirector since December 2005
Daniel T GilbertDirector since September 2004
Dr Kenneth R HenryDirector since November 2011
Mark A JoinerDirector since March 2009
Paul J RizzoDirector since September 2004
Jillian S SegalDirector since September 2004
John G ThornDirector since October 2003
Geoffrey A TomlinsonDirector since March 2000
John A WallerDirector since February 2009
Sir Malcolm WilliamsonDirector since May 2004
Anthony KT YuenDirector since March 2010
Rounding of AmountsPursuant to Class Order 98/100 made by the AustralianSecurities and Investments Commission on 10 July 1998,the Company has rounded off amounts in this report andthe accompanying financial statements to the nearestmillion dollars, except where indicated.
Review of Operations and Group ResultsNet profit attributable to owners of the Company forthe half year ended 31 March 2012 of $2,052 milliondecreased $376 million or 15.5% compared to the priorcomparative period.
Net interest income increased $393 million or 6.3% driven by housing lending growth in Business Banking, Personal Banking and NZ Banking offset by higher funding costs. Net life insurance income increased $92 million or 31.1%as positive investment returns exceeded increases in policy liabilities and the external unit holders’ liability.Total other income increased $188 million or 11.0% due to mark-to-market gains on the SCDO risk mitigation trades and higher sales of risk management products to the Group’s customers.
Operating expenses increased by $285 million or 6.9%. The Group continues to tightly manage expenses while continuing to invest in key strategic projects.
The bad and doubtful debt charge increased $398 millionor 43.1% as the challenging operating and economic environment, particularly in the United Kingdom(UK) property sector has resulted in higher specific provision charges.
Total assets increased $67,380 million or 9.8%, mainlyfrom strong growth in liquid assets and lending, principally from continued momentum in housing and business lending in the Australian based business. Total liabilities increased $64,645 million or 10.0% mainly from the continued focus on growing deposits to support lending growth.
The Board has received assurance from the Group ChiefExecutive Officer and the Group Executive Director,Finance that the Company’s half year financial report forthe period ended 31 March 2012 is founded on soundsystems of risk management and internal control, andthat the systems are operating effectively in all materialrespects in relation to financial reporting risks.
Management has also reported that the Company’s riskmanagement and internal control systems have beendesigned and implemented to manage the Company’smaterial business risks, and those risks are beingmanaged effectively.
Auditor’s independence declarationA copy of the auditor’s independence declaration asrequired by section 307C of the Corporations Act 2001 (Cth) is set out on the following page and forms part of this report.Directors’ signatures
Signed in accordance with a resolution of the directors:
Michael A ChaneyChairman
Cameron ClyneGroup Chief Executive Officer
10 May 2012

Liability limited by a scheme approved under Professional Standards Legislation
Auditor’s Independence Declaration to the Directors of National Australia Bank Limited In relation to our review of the financial report of National Australia Bank Limited for the half year ended 31 March 2012, to the best of my knowledge and belief, there have been no contraventions of the auditor independence requirements of the Corporations Act 2001 or any applicable code of professional conduct.
Ernst & Young
AJ (Tony) Johnson Partner Melbourne 10 May 2012

Half Year Results
2012
82
Consolidated Financial Statements
Consolidated Income Statement
Half Year toMar 12 Sep 11 Mar 11
Note $m $m $mInterest income 17,646 17,570 16,700 Interest expense (10,974) (10,815) (10,421)
Net interest income 6,672 6,755 6,279
Premium and related revenue 691 693 666 Investment revenue 5,216 (3,975) 3,528 Fee income 266 276 277 Claims expense (388) (427) (367)Change in policy liabilities (4,057) 3,298 (2,823)Policy acquisition and maintenance expense (459) (459) (455)Investment management expense (3) 1 (6)
Movement in external unitholders’ liability (878) 657 (524)
Net life insurance income 388 64 296
Gains less losses on financial instruments at fair value 3 302 (129) (200)Other operating income 3 1,598 1,866 1,912
Total other income 1,900 1,737 1,712
Personnel expenses 4 (2,265) (2,240) (2,323)Occupancy-related expenses 4 (275) (289) (310)General expenses 4 (1,862) (1,719) (1,484)
Total operating expenses (4,402) (4,248) (4,117)
Charge to provide for doubtful debts 9 (1,321) (827) (923)
Profit before income tax expense 3,237 3,481 3,247 Income tax expense 5 (1,183) (690) (818)
Net profit for the period 2,054 2,791 2,429
Attributable to:Owners of the Company 2,052 2,791 2,428 Non-controlling interest in controlled entities 2 - 1
Net profit for the period 2,054 2,791 2,429
cents cents centsBasic earnings per share 88.8 124.4 108.8 Diluted earnings per share 88.4 123.2 108.3

Half Year Results
2012
83
Consolidated Financial Statements
Consolidated Statement of Comprehensive Income
Half Year toMar 12 Sep 11 Mar 11
Note $m $m $mNet profit for the period 2,054 2,791 2,429
Other comprehensive incomeActuarial (losses)/gains on defined benefit superannuation plans 12 (205) (145) 225 Cash flow hedges:
(Losses)/gains on cash flow hedging instruments 12 (78) 319 (98)Losses/(gains) transferred to the income statement 12 5 (4) 4
Exchange differences on translation of foreign operations 12 (258) 421 (592)Reclassification to the income statement on disposal of foreign operations 12 - - (2)Tax on items transferred directly from equity 41 (35) (35)Investments - available for sale:
Revaluation gains/(losses) 12 71 (10) (26)Gains from sale transferred to the income statement 12 (15) (11) (9)Impairment transferred to the income statement 12 - - 10
Revaluation of land and buildings 12 - 11 -
Other comprehensive income for the period, net of income tax (439) 546 (523)
Total comprehensive income for the period 1,615 3,337 1,906
Attributable to:Owners of the Company 1,613 3,337 1,905 Non-controlling interest in controlled entities 2 - 1
Total comprehensive income for the period 1,615 3,337 1,906

Half Year Results
2012
84
Consolidated Financial Statements
Consolidated Balance Sheet
As at31 Mar 12 30 Sep 11 31 Mar 11
Note $m $m $m
AssetsCash and liquid assets 23,376 27,093 22,534 Due from other banks 54,239 47,106 37,341 Trading derivatives 33,785 48,466 27,022 Trading securities 34,601 34,628 29,913 Investments - available for sale 24,090 18,045 14,693 Investments - held to maturity 10,979 12,787 13,393 Investments relating to life insurance business 67,426 63,920 67,155 Other financial assets at fair value 57,642 51,756 42,779 Hedging derivatives 3,267 4,108 2,645 Loans and advances 388,136 382,369 365,378 Due from customers on acceptances 39,772 43,017 45,935 Current tax assets 104 - 385 Property, plant and equipment 1,839 1,919 1,761 Goodwill and other intangible assets 6,957 7,262 7,113 Deferred tax assets 2,032 2,243 1,780 Other assets 8,598 9,038 9,636
Total assets 756,843 753,757 689,463
LiabilitiesDue to other banks 43,536 40,162 37,449 Trading derivatives 38,195 47,889 34,573 Other financial liabilities at fair value 21,356 23,726 19,557 Hedging derivatives 4,456 4,550 5,336 Deposits and other borrowings 11 418,266 402,964 364,311 Liability on acceptances 7,984 10,633 11,774 Life policy liabilities 56,402 53,608 56,810 Current tax liabilities 684 561 - Provisions 1,252 1,596 1,167 Bonds, notes and subordinated debt 96,849 99,768 91,449 Other debt issues 2,399 2,494 2,404 Defined benefit superannuation plan liabilities 148 295 182 External unitholders’ liability 11,034 9,959 10,229 Deferred tax liabilities - 28 95 Other liabilities 11,727 13,336 14,307
Total liabilities 714,288 711,569 649,643
Net assets 42,555 42,188 39,820
EquityContributed equity 12 26,090 25,274 24,365 Reserves 12 (1,438) (773) (1,491)Retained profits 12 17,865 17,667 16,931
Total equity (parent entity interest) 42,517 42,168 39,805 Non-controlling interest in controlled entities 38 20 15
Total equity 42,555 42,188 39,820

Half Year Results
2012
85
Consolidated Financial Statements
Consolidated Cash Flow Statement
Half Year toMar 12 Sep 11 Mar 11
Note $m $m $m
Cash flows from operating activitiesInterest received 17,546 17,764 16,077 Interest paid (11,304) (10,866) (10,079)Dividends received 8 7 11 Life insurance:
Premiums and other revenue received 3,208 5,598 4,030 Investment revenue received 937 2,302 938 Policy and other payments (3,780) (5,033) (3,832)Fees and commissions paid (253) (254) (244)
Net trading revenue (paid)/received (242) 140 1,249 Other operating income received 2,691 2,529 1,459 Payments to employees and suppliers:
Personnel expenses paid (2,441) (1,935) (2,454)Other operating expenses paid (1,454) (2,110) (1,786)
Net goods and services tax received 14 5 19 Payments for income taxes (943) (317) (854)
Cash flows from operating activities before changes in operating assets and liabilities 3,987 7,830 4,534
Changes in operating assets and liabilities arising from cash flow movements
Net placement of deposits with and withdrawal of deposits from supervisory central banks that are not part of cash equivalents (93) (49) (14)
Net funds advanced to and receipts from other banks with maturity greater than three months (1,312) (169) 2,653 Net receipts from and payments for acceptance transactions 632 1,792 2,967 Net funds advanced to and receipts from customers for loans and advances (9,003) (14,916) (15,361)Net acceptance from and repayment of deposits and other borrowings 20,877 34,434 17,662 Net movement in life insurance business investments (579) (93) 108 Net movement in other life insurance assets and liabilities (176) 204 (182)Net receipts from and payments for transactions in treasury bills and other eligible bills held for
trading and not part of cash equivalents 203 (506) 392
Net payments for and receipts from trading securities transactions (2,097) (6,831) (4,420)Net receipts from and payments for trading derivatives 3,152 (4,405) (705)Net funds advanced to and receipts from hedging derivative assets and other financial assets
at fair value (5,412) (8,437) (5,308)Net payments for and receipts from hedging derivative liabilities and other financial liabilities at
fair value (7,747) 2,449 (2,479)Net increase in other assets (754) (2,731) (282)Net (decrease)/increase in other liabilities (2,250) 3,416 (2,388)
Changes in operating assets and liabilities arising from cash flow movements (4,559) 4,158 (7,357)
Net cash (used in)/provided by operating activities 13(a) (572) 11,988 (2,823)

Half Year Results
2012
86
Consolidated Financial Statements
Half Year toMar 12 Sep 11 Mar 11
Note $m $m $m
Cash flows from investing activitiesMovement in investments - available for sale:
Purchases (17,532) (16,957) (13,974)Proceeds from disposal 680 1,964 1,108 Proceeds on maturity 12,708 10,232 13,252
Movement in investments - held to maturity:Purchases (6,396) (12,624) (11,664)Proceeds on maturity 7,312 12,304 11,815
Purchase of controlled entities and business combinations, net of cash acquired 13(d) (36) - (6)Proceeds from sale of controlled entities, net of cash disposed 13(e) - - 11 Purchase of property, plant, equipment and software (418) (586) (482)Proceeds from sale of property, plant, equipment and software, net of costs 68 48 69
Net cash (used in)/provided by investing activities (3,614) (5,619) 129
Cash flows from financing activitiesRepayments of bonds, notes and subordinated debt (9,248) (11,010) (10,895)Proceeds from issue of bonds, notes and subordinated debt, net of costs 14,455 15,816 15,766 On market purchase of shares for equity-based compensation - (33) - Dividends and distributions paid (excluding dividend reinvestment plan) (1,339) (1,199) (1,142)
Net cash provided by financing activities 3,868 3,574 3,729
Net (decrease)/increase in cash and cash equivalents (318) 9,943 1,035 Cash and cash equivalents at beginning of period 36,006 25,231 25,683 Effects of exchange rate changes on balance of cash held in foreign currencies (1,154) 832 (1,487)
Cash and cash equivalents at end of period 13(b) 34,534 36,006 25,231

Half Year Results
2012
87
Consolidated Financial Statements
Consolidated Statement of Changes in Equity
Contributed equity Reserves (1)
Retained profits (1) Total
Non-controlling interest in controlled
entitiesTotal
equityGroup $m $m $m $m $m $mBalance at 1 October 2010 23,551 (639) 16,028 38,940 14 38,954 Net profit for the period - - 2,428 2,428 1 2,429 Other comprehensive income for the period - (679) 156 (523) - (523)Transactions with owners, recorded directly in equity:
Contributions by and distributions to ownersIssue of ordinary shares 635 - - 635 - 635 On market purchase of shares for equity-based
compensation (33) - - (33) - (33)Transfer from equity-based compensation reserve -
issued shares 147 (147) - - - - Transfer from equity-based compensation reserve -
purchased shares 3 (3) - - - - Net loss realised on treasury shares (30) - - (30) - (30)Movement in treasury shares relating to life
insurance business 92 - - 92 - 92 Transfer (to)/from retained profits - (61) 61 - - - Equity-based compensation - 40 - 40 - 40 Tax on equity-based compensation - (2) - (2) - (2)Dividends paid - - (1,628) (1,628) - (1,628)Distributions on other equity instruments - - (114) (114) - (114)
Balance at 31 March 2011 24,365 (1,491) 16,931 39,805 15 39,820 Net profit for the period - - 2,791 2,791 - 2,791 Other comprehensive income for the period - 661 (115) 546 - 546 Transactions with owners, recorded directly in equity:
Contributions by and distributions to ownersIssue of ordinary shares 729 - - 729 - 729 Transfer from equity-based compensation reserve -
issued shares 33 (33) - - - - Transfer from equity-based compensation reserve -
purchased shares 2 (2) - - - - Net loss realised on treasury shares (27) - - (27) - (27)Movement in treasury shares relating to life
insurance business 172 - - 172 - 172 Transfer from/(to) retained profits - 44 (44) - - - Equity-based compensation - 49 - 49 - 49 Tax on equity-based compensation - (1) - (1) - (1)Dividends paid - - (1,785) (1,785) - (1,785)Distributions on other equity instruments - - (111) (111) - (111)
Changes in ownership interests (2)
Movement of non-controlling interest in controlled entities - - - - 5 5
Balance at 30 September 2011 25,274 (773) 17,667 42,168 20 42,188 Net profit for the period - - 2,052 2,052 2 2,054 Other comprehensive income for the period - (273) (166) (439) - (439)Transactions with owners, recorded directly in equity:
Contributions by and distributions to ownersIssue of ordinary shares 700 - - 700 - 700 Transfer from equity-based compensation reserve -
issued shares 190 (190) - - - - Net loss realised on treasury shares (2) - - (2) - (2)Movement in treasury shares relating to life
insurance business (72) - - (72) - (72)Transfer (to)/from retained profits - (320) 320 - - - Equity-based compensation - 116 - 116 - 116 Tax on equity-based compensation - 2 - 2 - 2 Dividends paid - - (1,903) (1,903) - (1,903)Distributions on other equity instruments - - (105) (105) - (105)
Changes in ownership interests (2)
Movement of non-controlling interest in controlled entities - - - - 16 16
Balance at 31 March 2012 26,090 (1,438) 17,865 42,517 38 42,555 (1) Refer to Note 12 Contributed Equity and Reserves for detail.(2) Change in ownership interests in controlled entities that does not result in a loss of control.
Half Year Results
2012
88
Notes to the Consolidated Financial Statements
1. Principal Accounting PoliciesThis report is a general purpose financial report for the half year reporting period ended 31 March 2012 which has been prepared in accordance with the Australian Securities Exchange (ASX) Listing Rules, the Corporations Act 2001 (Cth) and AASB 134 “Interim Financial Reporting”.
This interim financial report complies with Australian Accounting Standards issued by the Australian Accounting Standards Board as they relate to interim financial reports, which also ensures compliance with International Financial Reporting Standards issued by the International Accounting Standards Board.
This interim financial report does not contain all disclosures of the type normally found within an annual financial report and therefore cannot be expected to provide as full an understanding of the financial position and financial performance of the Group as that given by the annual financial report. This report should be read in conjunction with the annual financial report for the year ended 30 September 2011 and any public announcements made in the half year ended 31 March 2012 by the Group in accordance with continuous disclosure obligations under the Corporations Act 2001 (Cth) and the ASX Listing Rules.
This interim financial report has been prepared on the basis of accounting policies consistent with those applied in the 30 September 2011 annual financial report except as disclosed below.
Adoption of the following new and amended Accounting Standards and Interpretations, which were applicable from 1 October 2011, has not had a material impact on the Group: - Amended AASB 124 “Related Party Disclosures” and
AASB 2009-12 “Amendments to Australian Accounting Standards” which clarifies the definition of a related party.
- AASB 2009-14 “Amendments to Australian Interpretation – Prepayments of a Minimum Funding Requirement” which removes unintended consequences arising from the treatment of prepayments when there is a minimum funding requirement for an employee benefit plan.
- AASB 2010-4 “Further Amendments to Australian Accounting Standards arising from the Annual Improvements Project” which makes amendments to several Accounting Standards arising from the 2010 annual improvements project, including amendments to AASB 7 “Financial Instruments: Disclosures”.
- AASB 2011-1 “Amendments to Australian Accounting Standards arising from the Trans-Tasman Convergence Project” and AASB 1054 “Australian Additional Disclosures” which makes amendments to several Accounting Standards as part of the first phase of harmonisation of financial reporting requirements between Australia and New Zealand for entities that assert compliance with IFRS, and relocates Australian specific disclosure requirements and definitions to AASB 1054.
- AASB 2010-6 “Amendments to Australian Accounting Standards – Disclosures on Transfers of Financial Assets” which requires disclosures to be made of transfers of financial assets that are not derecognised in their entirety, and financial assets that are derecognised in their entirety but for which an entity retains continuing involvement.
The preparation of this report requires the use of critical accounting estimates and assumptions that affect the reported amounts of assets, liabilities, revenues and expenses and the disclosed amount of contingent liabilities. Assumptions made at each balance sheet date (such as the calculation of provisions for doubtful debts, defined benefit obligations and fair value adjustments), are based on best estimates at that date. Although the Group has internal control systems in place to ensure that estimates are reliably measured, actual amounts may differ from those estimates.
This report has been prepared under the historical cost convention, as modified by the application of fair value measurements required or allowed by relevant Accounting Standards.
Currency of presentationAll amounts are expressed in Australian dollars unless otherwise stated.

Half Year Results
2012
89
Notes to the Consolidated Financial Statements
2. Segment InformationThe Group evaluates reportable segments’ performance on the basis of cash earnings. Cash earnings represents the net profit attributable to owners of the Company, adjusted for certain items.
Major CustomersRevenues from no one single customer amount to greater than 10% of the Group’s revenues.
Half Year ended 31 March 2012
Cash earnings
Net interest income
Total other income and NAB Wealth
incomeTotal
assetsSegment Information by reportable segment $m $m $m $mBusiness Banking 1,264 2,530 517 197,245 Personal Banking 464 1,445 286 146,973 Wholesale Banking 518 784 435 235,882 NAB Wealth 289 163 777 96,329 NZ Banking 297 549 179 47,921 UK Banking (36) 684 217 67,562 Great Western Bank 48 132 35 8,337 Specialised Group Assets (3) 54 33 7,093 Corporate Functions & Other 92 367 (32) 30,754 Distributions/Eliminations (105) - (47) (81,253)
Total 2,828 6,708 2,400 756,843
Half Year ended 30 September 2011
Cash earnings
Net interest income
Total other income and NAB Wealth
incomeTotal
assetsSegment Information by reportable segment $m $m $m $mBusiness Banking 1,264 2,587 514 195,128 Personal Banking 500 1,458 289 140,706 Wholesale Banking 268 708 151 241,553 NAB Wealth 235 168 732 92,832 NZ Banking 254 528 174 46,650 UK Banking 166 754 234 76,512 Great Western Bank 41 130 43 8,399 Specialised Group Assets 33 58 (30) 9,240 Corporate Functions & Other 142 397 (53) 30,030 Distributions/Eliminations (111) - (47) (87,293)
Total 2,792 6,788 2,007 753,757
Half Year ended 31 March 2011
Cash earnings
Net interest income
Total other income and NAB Wealth
incomeTotal
assetsSegment Information by reportable segment $m $m $m $mBusiness Banking 1,181 2,446 492 191,574 Personal Banking 432 1,368 301 129,864 Wholesale Banking 393 522 475 189,051 NAB Wealth 298 160 789 95,140 NZ Banking 215 487 171 43,134 UK Banking 122 768 214 68,000 Great Western Bank 47 155 38 8,015 Specialised Group Assets 77 65 74 10,653 Corporate Functions & Other 17 333 (25) 16,480 Distributions/Eliminations (114) - (34) (62,448)
Total 2,668 6,304 2,495 689,463

Half Year Results
2012
90
Notes to the Consolidated Financial Statements
Reconciliation of cash earnings to net profit attributable to owners of the Company
Half Year toMar 12 Sep 11 Mar 11
$m $m $mGroup cash earnings (1) 2,828 2,792 2,668 Non-cash earnings items (after tax):
Distributions 105 111 114 Treasury shares (92) 80 (41)Fair value and hedge ineffectiveness (40) 146 (327)IoRE discount rate variation (5) 48 (22)UK Payment Protection Insurance provision (182) (117) - Hedging costs on SCDO assets (99) (127) - Litigation expense (24) (4) - Software impairment (54) - - Goodwill impairment (295) - - Refund of tax on exchangeable capital units settlement - - 142 Amortisation of acquired intangible assets (51) (41) (41)Due diligence, acquisition and integration costs (39) (97) (65)
Net profit attributable to owners of the Company 2,052 2,791 2,428
(1) Includes eliminations and distributions.
Half Year toMar 12 Sep 11 Mar 11
Reconciliation of net interest income $m $m $mNet interest income for reportable segments on a cash earnings basis 6,708 6,788 6,304 NAB Wealth net adjustment (2) (36) (33) (25)
Net interest income on a statutory basis 6,672 6,755 6,279
Half Year toMar 12 Sep 11 Mar 11
Reconciliation of other income and NAB Wealth income $m $m $mTotal other income and NAB Wealth income on a cash earnings basis (1) 2,400 2,007 2,495 NAB Wealth net adjustment (2) 170 (188) 123 Treasury shares (103) 95 (47)Fair value and hedge ineffectiveness 151 194 (532)UK Payment Protection Insurance provision (182) (156) - Hedging costs on SCDO assets (141) (219) - IoRE discount rate variation (7) 68 (31)
Total other income and NAB Wealth income on a statutory basis 2,288 1,801 2,008
(1) Includes eliminations and distributions.(2) The NAB Wealth net adjustment represents a reallocation of the income statement of the NAB Wealth business prepared on a cash earnings basis into the appropriate statutory
income lines.

Half Year Results
2012
91
Notes to the Consolidated Financial Statements
3. Other IncomeHalf Year to
Mar 12 Sep 11 Mar 11$m $m $m
Gains less losses on financial instruments at fair valueTrading securities 264 677 240 Trading derivatives:
Trading and risk management purposes (83) (1,399) 373 Recovery on SCDO risk mitigation trades 219 - -
Assets, liabilities and derivatives designated in hedge relationships (1) 200 235 (344)Assets and liabilities designated at fair value (280) 375 (475)Impairment of investments - available for sale - - (10)Other (18) (17) 16
Total gains less losses on financial instruments at fair value 302 (129) (200)
Other operating incomeDividend revenue 8 7 11 Gains from sale of investments - available for sale 15 11 9 Gains from sale of property, plant and equipment and other assets - 2 1 Banking fees 454 458 448 Money transfer fees 327 324 323 Fees and commissions 832 958 898 Investment management fees 88 124 139 Fleet management fees 13 13 10 Rentals received on leased vehicle assets 7 9 10 Revaluation (losses)/gains on investment properties (8) 1 3 Other income (138) (41) 60
Total other operating income 1,598 1,866 1,912
Total other income 1,900 1,737 1,712
(1) Represents hedge ineffectiveness of designated hedging relationships, plus economic hedges of long-term funding that do not meet the requirements for hedge accounting.
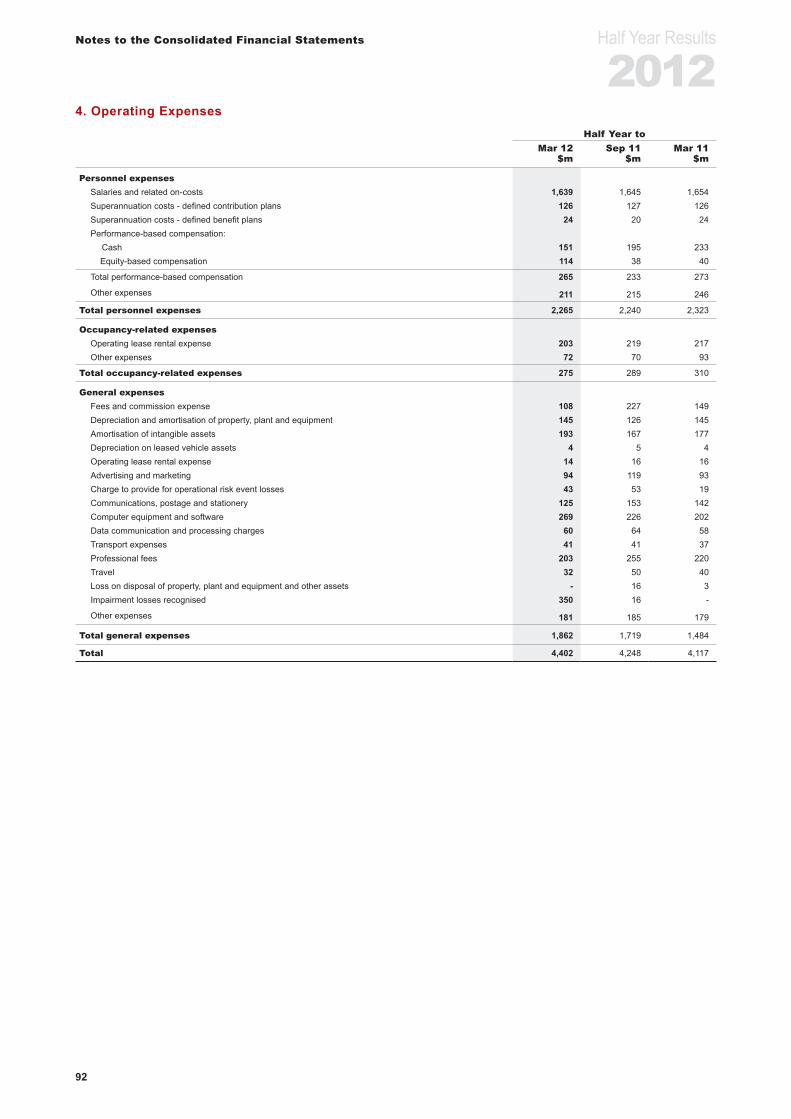
Half Year Results
2012
92
Notes to the Consolidated Financial Statements
4. Operating ExpensesHalf Year to
Mar 12 Sep 11 Mar 11$m $m $m
Personnel expensesSalaries and related on-costs 1,639 1,645 1,654 Superannuation costs - defined contribution plans 126 127 126 Superannuation costs - defined benefit plans 24 20 24 Performance-based compensation:
Cash 151 195 233 Equity-based compensation 114 38 40
Total performance-based compensation 265 233 273
Other expenses 211 215 246
Total personnel expenses 2,265 2,240 2,323
Occupancy-related expensesOperating lease rental expense 203 219 217 Other expenses 72 70 93
Total occupancy-related expenses 275 289 310
General expensesFees and commission expense 108 227 149 Depreciation and amortisation of property, plant and equipment 145 126 145 Amortisation of intangible assets 193 167 177 Depreciation on leased vehicle assets 4 5 4 Operating lease rental expense 14 16 16 Advertising and marketing 94 119 93 Charge to provide for operational risk event losses 43 53 19 Communications, postage and stationery 125 153 142 Computer equipment and software 269 226 202 Data communication and processing charges 60 64 58 Transport expenses 41 41 37 Professional fees 203 255 220 Travel 32 50 40 Loss on disposal of property, plant and equipment and other assets - 16 3 Impairment losses recognised 350 16 -
Other expenses 181 185 179
Total general expenses 1,862 1,719 1,484
Total 4,402 4,248 4,117

Half Year Results
2012
93
Notes to the Consolidated Financial Statements
5. Income Tax Expense
Reconciliation of income tax expense shown in the income statement with prima facie tax payable on the pre-tax accounting profit
Half Year toMar 12 Sep 11 Mar 11
$m $m $mProfit before income tax expense 3,237 3,481 3,247 Deduct profit before income tax expense attributable to the statutory funds of the life insurance business and
their controlled trusts (465) (17) (346)
Total profit excluding that attributable to the statutory funds of the life insurance business and their controlled trusts, before income tax expense 2,772 3,464 2,901
Prima facie income tax at 30% 832 1,040 870 Add/(deduct): Tax effect of amounts not deductible/(assessable):
Assessable foreign income 4 5 4 Foreign tax rate differences (3) 8 - Depreciation on buildings not deductible 1 1 2 Refund of tax on exchangeable capital units settlement - - (142)Foreign branch income not assessable (36) (26) (34)Under/(over) provision in prior years - (19) (5)Offshore banking unit income (14) (11) (12)Restatement of deferred tax balances for UK, US and NZ tax changes 4 (13) (7)Profit on sale of controlled entities - (9) - Treasury shares adjustment 20 (14) 8 Goodwill impairment 88 - - Other 61 (63) (15)
Total income tax expense on profit excluding that attributable to the statutory funds of the life insurance business and their controlled trusts 957 899 669
Income tax expense/(benefit) attributable to the statutory funds of the life insurance business and their controlled trusts 226 (209) 149
Total income tax expense 1,183 690 818
Effective tax rate, excluding statutory funds attributable to the life insurance business and their controlled trusts 34.5% 26.0% 23.1%

Half Year Results
2012
94
Notes to the Consolidated Financial Statements
6. Dividends and Distributions
Amount per share
Franked amount per
share
Foreign income per
shareTotal
amountDividends on ordinary shares cents % % $mInterim dividend declared in respect of the six months ended 31 March 2012 90 100 Nil 2,015
The record date for determining entitlements to the 2012 interim dividend is 6 June 2012. The interim dividend has been declared by the directors of the Company and is payable on 16 July 2012. The financial effect of this dividend has not been brought to account in the financial statements for the half year ended 31 March 2012 and will be recognised in subsequent financial reports.
Final dividend paid in respect of the year ended 30 September 2011 88 100 Nil 1,940 Interim dividend paid in respect of the six months ended 31 March 2011 84 100 Nil 1,823
Total dividends paid or payable in respect of the year ended 30 September 2011 172 3,763
Half Year to31 Mar 12 30 Sep 11 31 Mar 11
Amount per
securityTotal
amount
Amount per
securityTotal
amount
Amount per
securityTotal
amountDividends on preference shares cents (1) $m cents (1) $m cents (1) $mBNZ Income Securities 2.67 12 2.67 12 2.67 12 BNZ Income Securities 2 2.69 7 2.69 7 2.31 6
Total dividends on preference shares 19 19 18
(1) $A equivalent
Half Year to31 Mar 12 30 Sep 11 31 Mar 11
Amount per
securityTotal
amount
Amount per
securityTotal
amount
Amount per
securityTotal
amountDistributions on other equity instruments $ $m $ $m $ $mNational Income Securities 3.05 61 3.05 61 3.10 62 Trust Preferred Securities (1) 42.50 17 42.50 17 45.00 18 Trust Preferred Securities II (1) 26.25 21 26.25 21 27.50 22 National Capital Instruments 750.00 6 1,500.00 12 1,500.00 12
Total distributions on other equity instruments 105 111 114
(1) $A equivalent
Dividend and distribution plansThe dividend is paid in cash or as part of a dividend plan. Cash dividends are paid by way of cash or cash equivalents and direct credit. The dividend plans in operation are the Dividend Reinvestment Plan and the Bonus Share Plan (closed to new participants).
The last date for receipt of election notices for the Dividend Reinvestment Plan and the Bonus Share Plan is 5pm (Melbourne time) on 6 June 2012.

Half Year Results
2012
95
Notes to the Consolidated Financial Statements
7. Net Tangible AssetsAs at
31 Mar 12 30 Sep 11 31 Mar 11Net tangible assets per ordinary share ($) (1) 13.68 13.62 12.80
(1) Represents net assets excluding intangible assets, non-controlling interests, preference shares and other equity instruments divided by ordinary shares on issue at the end of the period.
8. Loans and Advances including AcceptancesAs at
31 Mar 12 30 Sep 11 31 Mar 11$m $m $m
Overdrafts 14,490 15,136 15,331 Credit card outstandings 7,960 7,903 7,679 Asset and lease financing 14,974 15,307 15,530 Housing loans 259,434 253,064 237,312 Other term lending 146,028 139,809 129,755 Other lending 6,596 6,479 6,758 Fair value adjustment 1,153 1,410 946
Gross loans and advances 450,635 439,108 413,311 Acceptances 39,772 43,017 45,935
Gross loans and advances including acceptances 490,407 482,125 459,246
Represented by:Loans and advances at fair value (1) 56,596 50,472 41,567 Loans and advances at amortised cost 394,039 388,636 371,744 Acceptances 39,772 43,017 45,935
Gross loans and advances including acceptances 490,407 482,125 459,246
Unearned income and deferred net fee income (2,018) (2,287) (2,286)Provision for doubtful debts (3,885) (3,980) (4,080)
Net loans and advances including acceptances 484,504 475,858 452,880
Securitised loans (2) 8,443 6,394 4,121
(1) On the balance sheet this amount is included within ‘Other financial assets at fair value’. This amount is included in the product and geographical analysis below.(2) Securitised loans are included within the balance of ‘Net loans and advances including acceptances’.
Australia EuropeNew
ZealandUnited States Asia
Total Group
By product and geographic location $m $m $m $m $m $m
As at 31 March 2012Overdrafts 7,569 5,266 1,617 5 33 14,490 Credit card outstandings 6,159 695 1,096 10 - 7,960 Asset and lease financing 12,783 2,168 15 - 8 14,974 Housing loans 213,075 22,466 21,954 540 1,399 259,434 Other term lending 91,467 25,923 20,901 5,396 2,341 146,028 Other lending 4,789 975 229 43 560 6,596 Fair value adjustment 428 657 48 20 - 1,153
Gross loans and advances 336,270 58,150 45,860 6,014 4,341 450,635 Acceptances 39,761 11 - - - 39,772
Gross loans and advances including acceptances 376,031 58,161 45,860 6,014 4,341 490,407
Represented by:Loans and advances at fair value 32,572 7,002 16,556 466 - 56,596 Loans and advances at amortised cost 303,698 51,148 29,304 5,548 4,341 394,039 Acceptances 39,761 11 - - - 39,772
Gross loans and advances including acceptances 376,031 58,161 45,860 6,014 4,341 490,407

Half Year Results
2012
96
Notes to the Consolidated Financial Statements
Australia EuropeNew
ZealandUnited States Asia
Total Group
By product and geographic location $m $m $m $m $m $m
As at 30 September 2011Overdrafts 7,892 5,708 1,503 7 26 15,136 Credit card outstandings 6,050 771 1,075 7 - 7,903 Asset and lease financing 12,877 2,407 16 - 7 15,307 Housing loans 207,272 22,306 21,535 615 1,336 253,064 Other term lending 83,942 28,225 20,265 5,561 1,816 139,809 Other lending 4,493 923 221 442 400 6,479 Fair value adjustment 462 816 110 22 - 1,410
Gross loans and advances 322,988 61,156 44,725 6,654 3,585 439,108 Acceptances 43,006 11 - - - 43,017
Gross loans and advances including acceptances 365,994 61,167 44,725 6,654 3,585 482,125
Represented by:Loans and advances at fair value 26,635 7,731 15,801 305 - 50,472 Loans and advances at amortised cost 296,353 53,425 28,924 6,349 3,585 388,636 Acceptances 43,006 11 - - - 43,017
Gross loans and advances including acceptances 365,994 61,167 44,725 6,654 3,585 482,125
Australia EuropeNew
ZealandUnited States Asia
Total Group
By product and geographic location $m $m $m $m $m $m
As at 31 March 2011Overdrafts 7,895 5,830 1,575 7 24 15,331 Credit card outstandings 5,874 782 1,018 5 - 7,679 Asset and lease financing 13,027 2,479 16 - 8 15,530 Housing loans 195,319 20,464 19,783 586 1,160 237,312 Other term lending 77,717 27,005 18,659 5,019 1,355 129,755 Other lending 4,410 1,380 169 410 389 6,758 Fair value adjustment 263 564 115 4 - 946
Gross loans and advances 304,505 58,504 41,335 6,031 2,936 413,311 Acceptances 45,924 11 - - - 45,935
Gross loans and advances including acceptances 350,429 58,515 41,335 6,031 2,936 459,246
Represented by:Loans and advances at fair value 19,700 7,348 14,311 208 - 41,567 Loans and advances at amortised cost 284,805 51,156 27,024 5,823 2,936 371,744 Acceptances 45,924 11 - - - 45,935
Gross loans and advances including acceptances 350,429 58,515 41,335 6,031 2,936 459,246
Increase/(Decrease) from 30 Sep 11
Movement from 30 September 2011 Australia EuropeNew
ZealandUnited States Asia
Total Group
excluding foreign exchange % % % % % %Overdrafts (4.1) (4.2) 7.0 (28.6) 37.5 (3.0)Credit card outstandings 1.8 (6.3) 1.4 42.9 - 1.0 Asset and lease financing (0.7) (6.5) (6.3) - 14.3 (1.6)Housing loans 2.8 4.6 1.4 (6.4) 11.6 2.9 Other term lending 9.0 (4.6) 2.6 3.4 37.4 5.5 Other 5.3 (2.6) (16.8) (85.6) 49.3 (0.3)
Total gross loans and advances 4.1 (1.3) 2.0 (3.7) 29.0 3.3
Increase/(Decrease) from 31 Mar 11
Movement from 31 March 2011 Australia EuropeNew
ZealandUnited States Asia
Total Group
excluding foreign exchange % % % % % %Overdrafts (4.1) (8.4) (4.0) (28.6) 37.5 (5.7)Credit card outstandings 4.9 (9.9) 0.6 large - 2.9 Asset and lease financing (1.9) (11.3) (11.8) - - (3.4)Housing loans 9.1 11.4 3.7 (7.2) 21.4 8.8 Other term lending 17.7 (2.6) 4.7 8.2 73.9 11.8 Other 11.6 (14.8) (8.9) (84.7) 45.1 0.8
Total gross loans and advances 10.4 0.8 3.7 0.4 48.9 8.5

Half Year Results
2012
97
Notes to the Consolidated Financial Statements
9. Provision for Doubtful DebtsAs at
31 Mar 12 30 Sep 11 31 Mar 11$m $m $m
Specific provision for doubtful debts 1,552 1,475 1,299 Collective provision for doubtful debts 2,333 2,505 2,781
Total provision for doubtful debts 3,885 3,980 4,080
Specific provision on loans at fair value (1) 82 71 120 Collective provision on loans and derivatives at fair value (1)(2) 725 893 707
Total provision for doubtful debts and provisions held on assets at fair value (3) 4,692 4,944 4,907
(1) Included within the carrying value of other financial assets at fair value.(2) Included within this balance for March 2012 is a management overlay in relation to conduit assets and derivatives of $nil (September 2011 $160 million, March 2011 $160 million). (3) Not included in total provisions for doubtful debts are provisions on investments - held to maturity of $91 million (September 2011 $204 million, March 2011 $187 million).
Movement in provisions for doubtful debtsHalf Year to Mar 12 Half Year to Sep 11
Specific Collective Total Specific Collective Total$m $m $m $m $m $m
Opening balance 1,475 2,505 3,980 1,299 2,781 4,080 Transfer to/(from) specific/collective provision 1,249 (1,249) - 1,116 (1,116) - Bad debts recovered 79 - 79 91 - 91 Bad debts written off (1,234) - (1,234) (1,049) - (1,049)Charge to income statement - 1,107 1,107 - 819 819 Foreign currency translation and other adjustments (17) (30) (47) 18 21 39
Total provision for doubtful debts 1,552 2,333 3,885 1,475 2,505 3,980
Half Year to Mar 11Specific Collective Total
$m $m $mOpening balance 1,409 2,865 4,274 Transfer to/(from) specific/collective provision 939 (939) - Bad debts recovered 93 - 93 Bad debts written off (1,123) - (1,123)Charge to income statement - 904 904 Foreign currency translation and other adjustments (19) (49) (68)
Total provision for doubtful debts 1,299 2,781 4,080
Half Year toMar 12 Sep 11 Mar 11
Total charge for doubtful debts by geographic location $m $m $mAustralia 523 459 543 Europe 536 284 278 New Zealand 23 44 72 United States 24 31 11 Asia 1 1 -
Total charge to provide for doubtful debts - recognised in provision 1,107 819 904
Total charge on investments - held to maturity (1) 214 8 19
Total charge to provide for doubtful debts - recognised in income statement 1,321 827 923
(1) Included in total charge on investments - held to maturity are amounts recovered through the realisation of the associated collateral on impaired assets. Also included are charges of $219 million in respect of defaulted SCDOs where the loss amounts have been fully recovered from the hedge counter party and recognised in other income.

Half Year Results
2012
98
Notes to the Consolidated Financial Statements
10. Asset QualityImpaired assets consist of retail loans (excluding credit card loans and portfolio managed facilities) which are contractually past due 90 days with security insufficient to cover principal and arrears of interest revenue; non retail loans which are contractually past due 90 days and there is sufficient doubt about the ultimate collectability of principal and interest; and impaired off-balance sheet credit exposures where current circumstances indicate that losses may be incurred. Unsecured portfolio managed facilities are classified as impaired when they become 180 days past due (if not written-off).
As at31 Mar 12 30 Sep 11 31 Mar 11
Summary of total impaired assets $m $m $mImpaired assets (1) (2) 5,853 6,151 6,063 Restructured loans (3) 235 235 212
Gross total impaired assets 6,088 6,386 6,275 Less: Specific provisions - total impaired assets (1,634) (1,546) (1,419)
Net total impaired assets 4,454 4,840 4,856
(1) Impaired assets do not include conduit assets classified as Investments - held to maturity in the balance sheet. There were $307 million of impaired conduit assets within this category at March 2012 (September 2011 $795 million, March 2011 $215 million).
(2) Impaired assets for March 2012 includes $174 million of impaired fair value assets (September 2011 $170 million, March 2011 $255 million).(3) These loans represent facilities which have been classified as restructured for reasons relating to the financial difficulty of the counterparty. The restructured loans include $nil million
of restructured fair value assets (September 2011 $16 million, March 2011 $24 million).
Australia EuropeNew
ZealandUnited States Asia
Total Group
Movement in gross impaired assets $m $m $m $m $m $mBalance at 30 September 2010 3,568 1,813 591 76 - 6,048 New 1,406 1,108 244 57 2 2,817 Written-off (599) (276) (64) (20) - (959)Returned to performing or repaid (685) (688) (136) (3) - (1,512)Foreign currency translation adjustments - (92) (21) (6) - (119)
Balance as at 31 March 2011 3,690 1,865 614 104 2 6,275 New 1,478 845 173 59 1 2,556 Written-off (508) (295) (72) (6) - (881)Returned to performing or repaid (815) (593) (235) (13) - (1,656)Foreign currency translation adjustments - 47 36 9 - 92
Balance as at 30 September 2011 3,845 1,869 516 153 3 6,386 New 1,053 857 104 63 - 2,077 Written-off (464) (478) (63) (36) - (1,041)Returned to performing or repaid (743) (352) (141) (19) (1) (1,256)Foreign currency translation adjustments - (69) 1 (10) - (78)
Gross impaired assets at 31 March 2012 3,691 1,827 417 151 2 6,088

Half Year Results
2012
99
Notes to the Consolidated Financial Statements
As at31 Mar 12 30 Sep 11 31 Mar 11
Gross impaired assets to gross loans & acceptances - by geographic location % % %Australia 0.98 1.05 1.05 Europe 3.14 3.06 3.19 New Zealand 0.91 1.15 1.49 United States 2.51 2.30 1.72 Asia 0.05 0.08 0.07
Total gross impaired assets to gross loans & acceptances 1.24 1.32 1.37
Group coverage ratiosNet impaired assets to total equity (1)(2) 10.5 11.5 12.2 Specific provision to gross impaired assets 26.8 24.2 22.6 Collective provision to credit risk-weighted assets (excluding housing) (3) 1.36 1.45 1.46 Collective provision including GRCL (top-up) to credit risk-weighted assets (excluding housing) 1.76 1.86 1.88 90+ days past due plus gross impaired assets to gross loans and acceptances 1.73 1.77 1.92 Net write-offs to gross loans and acceptances (annualised) 0.47 0.41 0.45 Total provision as a percentage of net write-offs (annualised) (4) 203 249 238 Total provision to gross loans and acceptances (4) 0.96 1.03 1.07
(1) Total equity of the parent.(2) Net impaired assets for March 2012 include $92 million of net impaired fair value assets (September 2011 $115 million, March 2011 $159 million). (3) Includes economic cycle adjustment, collective provision against loans at amortised cost and collective provisions held on assets at fair value.(4) Includes economic cycle adjustment, total provision against loans at amortised cost and total provisions held on assets at fair value.
The amounts below are not classified as impaired assets and therefore are not included in the summary on the previous page.
As at31 Mar 12 30 Sep 11 31 Mar 11
Summary of non-impaired loans 90+ days past due $m $m $mTotal non-impaired assets past due 90 days or more with adequate security 2,190 1,975 2,346 Total non-impaired portfolio managed facilities past due 90 to 180 days 183 175 195
Total 90+ days past due loans 2,373 2,150 2,541
Total 90 days past due loans to gross loans and acceptances (%) 0.49 0.45 0.55
As at31 Mar 12 30 Sep 11 31 Mar 11
Non-impaired loans 90+ days past due - by geographic location $m $m $mAustralia 1,751 1,547 1,749 Europe 408 318 407 New Zealand 169 158 194 United States 45 127 190 Asia - - 1
Total 90+ day past due loans 2,373 2,150 2,541

Half Year Results
2012
100
Notes to the Consolidated Financial Statements
11. Deposits and Other BorrowingsAs at
31 Mar 12 30 Sep 11 31 Mar 11$m $m $m
Deposits not bearing interest 22,685 21,324 18,415 On-demand and short-term deposits 143,098 145,947 138,455 Certificates of deposit 81,130 76,945 61,501 Term deposits 154,001 144,418 137,728
Total deposits 400,914 388,634 356,099 Securities sold under agreements to repurchase 10,574 6,379 3,220 Borrowings 14,262 18,159 13,409 Fair value adjustment 232 257 233
Total deposits and other borrowings 425,982 413,429 372,961
Represented by:Deposits and other borrowings at fair value (1) 7,716 10,465 8,650 Deposits and other borrowings at amortised cost 418,266 402,964 364,311
Total deposits and other borrowings 425,982 413,429 372,961
(1) On the balance sheet this amount is included within ‘Other financial liabilities at fair value’. These amounts are included in the product and geographical analysis below.
Australia EuropeNew
ZealandUnited States Asia
Total Group
By product and geographic location $m $m $m $m $m $m
As at 31 March 2012Deposits not bearing interest 17,516 2,367 1,544 1,255 3 22,685 On-demand and short-term deposits 102,791 24,647 9,605 5,800 255 143,098 Certificates of deposit 28,101 25,452 1,654 25,923 - 81,130 Term deposits 107,054 17,414 16,677 3,889 8,967 154,001
Total deposits 255,462 69,880 29,480 36,867 9,225 400,914 Securities sold under agreements to repurchase 2,889 1,921 - 5,764 - 10,574 Borrowings 1,242 - 3,766 9,254 - 14,262 Fair value adjustment - 225 6 1 - 232
Total deposits and other borrowings 259,593 72,026 33,252 51,886 9,225 425,982
Represented by:Deposits and other borrowings at fair value - 952 6,763 1 - 7,716 Deposits and other borrowings at amortised cost 259,593 71,074 26,489 51,885 9,225 418,266
Total deposits and other borrowings 259,593 72,026 33,252 51,886 9,225 425,982
Australia EuropeNew
ZealandUnited States Asia
Total Group
By product and geographic location $m $m $m $m $m $m
As at 30 September 2011Deposits not bearing interest 16,572 2,218 1,351 1,179 4 21,324 On-demand and short-term deposits 100,626 27,307 8,589 9,188 237 145,947 Certificates of deposit 22,751 33,718 1,440 19,036 - 76,945 Term deposits 98,515 15,758 15,881 6,012 8,252 144,418
Total deposits 238,464 79,001 27,261 35,415 8,493 388,634 Securities sold under agreements to repurchase 1,632 2,046 - 2,701 - 6,379 Borrowings 2,384 - 6,345 9,430 - 18,159 Fair value adjustment - 252 3 2 - 257
Total deposits and other borrowings 242,480 81,299 33,609 47,548 8,493 413,429
Represented by:Deposits and other borrowings at fair value - 1,179 9,284 2 - 10,465 Deposits and other borrowings at amortised cost 242,480 80,120 24,325 47,546 8,493 402,964
Total deposits and other borrowings 242,480 81,299 33,609 47,548 8,493 413,429

Half Year Results
2012
101
Notes to the Consolidated Financial Statements
Australia EuropeNew
ZealandUnited States Asia
Total Group
By product and geographic location $m $m $m $m $m $m
As at 31 March 2011Deposits not bearing interest 14,603 2,086 667 1,056 3 18,415 On-demand and short-term deposits 95,199 27,880 8,493 6,666 217 138,455 Certificates of deposit 19,688 28,668 1,678 11,467 - 61,501 Term deposits 94,073 14,641 14,931 5,151 8,932 137,728
Total deposits 223,563 73,275 25,769 24,340 9,152 356,099 Securities sold under agreements to repurchase 731 427 - 2,062 - 3,220 Borrowings 4,048 - 3,962 5,399 - 13,409 Fair value adjustment - 223 7 3 - 233
Total deposits and other borrowings 228,342 73,925 29,738 31,804 9,152 372,961
Represented by:Deposits and other borrowings at fair value - 1,169 7,478 3 - 8,650 Deposits and other borrowings at amortised cost 228,342 72,756 22,260 31,801 9,152 364,311
Total deposits and other borrowings 228,342 73,925 29,738 31,804 9,152 372,961
Increase/(Decrease) from 30 Sep 11
Movement from 30 September 2011 Australia EuropeNew
ZealandUnited States Asia
Total Group
excluding foreign exchange % % % % % %Deposits not bearing interest 5.7 10.8 13.7 13.5 (25.0) 7.1 On-demand and short-term deposits 2.2 (6.3) 11.2 (32.7) 14.9 (0.9)Certificates of deposit 23.5 (21.6) 14.2 45.1 - 8.9 Term deposits 8.7 14.4 4.5 (31.1) 15.8 7.6
Total deposits 7.1 (8.1) 7.6 10.9 15.8 4.6 Securities sold under agreements to repurchase 77.0 (2.5) - large - 72.3 Borrowings (47.9) - (41.0) 4.6 - (19.0)
Total deposits and other borrowings 7.1 (8.0) (1.6) 16.3 15.8 4.6
Increase/(Decrease) from 31 Mar 11
Movement from 31 March 2011 Australia EuropeNew
ZealandUnited States Asia
Total Group
excluding foreign exchange % % % % % %Deposits not bearing interest 19.9 15.1 large 19.6 - 23.1 On-demand and short-term deposits 8.0 (10.3) 5.7 (12.4) 18.1 3.2 Certificates of deposit 42.7 (9.9) (7.9) large - 32.7 Term deposits 13.8 20.4 4.4 (24.0) 1.1 11.2
Total deposits 14.3 (3.3) 6.9 52.5 1.5 12.4 Securities sold under agreements to repurchase large large - large - largeBorrowings (69.3) - (11.2) 72.6 - 4.5
Total deposits and other borrowings 13.7 (1.2) 4.5 64.3 1.5 14.0

Half Year Results
2012
102
Notes to the Consolidated Financial Statements
12. Contributed Equity and ReservesAs at
31 Mar 12 30 Sep 11 31 Mar 11Contributed equity $m $m $m
Issued and paid-up ordinary share capitalOrdinary shares, fully paid 21,176 20,360 19,451
Issued and paid-up preference share capitalBNZ Income Securities 380 380 380 BNZ Income Securities 2 203 203 203
Other contributed equityNational Income Securities 1,945 1,945 1,945 Trust Preferred Securities 975 975 975 Trust Preferred Securities II 1,014 1,014 1,014 National Capital Instruments 397 397 397
Total contributed equity 26,090 25,274 24,365
Half Year toMar 12 Sep 11 Mar 11
Movements in contributed equity $m $m $m
Ordinary share capitalBalance at beginning of period 20,360 19,451 18,637 Shares issued:
Dividend reinvestment plan 700 729 635 On market purchase of shares for equity-based compensation - - (33)Transfer from equity-based compensation reserve - issued shares 190 33 147 Transfer from equity-based compensation reserve - purchased shares - 2 3 Net loss realised on treasury shares (2) (27) (30)
Movement in treasury shares relating to life insurance business (72) 172 92
Balance at end of period 21,176 20,360 19,451
BNZ Income SecuritiesBalance at beginning of period 380 380 380
Movement during period - - -
Balance at end of period 380 380 380
BNZ Income Securities 2Balance at beginning of period 203 203 203 Movement during period - - -
Balance at end of period 203 203 203
National Income SecuritiesBalance at beginning of period 1,945 1,945 1,945 Movement during period - - -
Balance at end of period 1,945 1,945 1,945
Trust Preferred SecuritiesBalance at beginning of period 975 975 975 Movement during period - - -
Balance at end of period 975 975 975
Trust Preferred Securities IIBalance at beginning of period 1,014 1,014 1,014 Movement during period - - -
Balance at end of period 1,014 1,014 1,014
National Capital InstrumentsBalance at beginning of period 397 397 397 Movement during period - - -
Balance at end of period 397 397 397

Half Year Results
2012
103
Notes to the Consolidated Financial Statements
As at31 Mar 12 30 Sep 11 31 Mar 11
Reserves $m $m $mGeneral reserve 953 1,267 1,052 Asset revaluation reserve 76 76 68 Foreign currency translation reserve (3,925) (3,667) (4,088)Cash flow hedge reserve 301 355 114 Equity-based compensation reserve 361 433 556 General reserve for credit losses 710 716 751 Available for sale investments reserve 86 47 56
Total reserves (1,438) (773) (1,491)
Half Year toMar 12 Sep 11 Mar 11
Movements in reserves $m $m $m
General reserveBalance at beginning of period 1,267 1,052 1,166 Transfer (to)/from retained profits (314) 215 (114)
Balance at end of period 953 1,267 1,052
Asset revaluation reserveBalance at beginning of period 76 68 68 Revaluation of land and buildings - 11 - Tax on revaluation adjustments - (3) -
Balance at end of period 76 76 68
Foreign currency translation reserveBalance at beginning of period (3,667) (4,088) (3,494)Currency translation adjustments (258) 421 (592)Reclassification to the income statement on disposal of foreign operations - - (2)
Balance at end of period (3,925) (3,667) (4,088)
Cash flow hedge reserveBalance at beginning of period 355 114 182 (Losses)/gains on cash flow hedging instruments (78) 319 (98)Losses/(gains) transferred to the income statement 5 (4) 4 Tax on cash flow hedging instruments 19 (74) 26
Balance at end of period 301 355 114
Equity-based compensation reserveBalance at beginning of period 433 556 668 Equity-based compensation 116 49 40 Transfer to contributed equity - issued shares (190) (33) (147)Transfer to contributed equity - purchased shares - (2) (3)Transfer of shares, options and rights lapsed to retained profits - (136) - Tax on equity-based compensation 2 (1) (2)
Balance at end of period 361 433 556

Half Year Results
2012
104
Notes to the Consolidated Financial Statements
Half Year toMar 12 Sep 11 Mar 11
$m $m $m
General reserve for credit lossesBalance at beginning of period 716 751 698 Transfer (to)/from retained profits (6) (35) 53
Balance at end of period 710 716 751
Available for sale investments reserveBalance at beginning of period 47 56 73 Revaluation gains/(losses) 71 (10) (26)Gains from sale transferred to the income statement (15) (11) (9)Impairment transferred to the income statement - - 10 Tax on available for sale investments reserve (17) 12 8
Balance at end of period 86 47 56
Half Year toMar 12 Sep 11 Mar 11
Reconciliation of movement in retained profits $m $m $mBalance at beginning of period 17,667 16,931 16,028 Actuarial (losses)/gains on defined benefit superannuation plans (205) (145) 225 Tax on items taken directly to/(from) equity 39 30 (69)Net profit attributable to owners of the Company 2,052 2,791 2,428 Transfer from/(to) general reserve for credit losses 6 35 (53)Transfer from/(to) general reserves 314 (215) 114 Transfer of shares, options and rights lapsed from equity-based compensation reserve - 136 - Dividends paid (1,903) (1,785) (1,628)Distributions on other equity instruments (105) (111) (114)
Balance at end of period 17,865 17,667 16,931

Half Year Results
2012
105
Notes to the Consolidated Financial Statements
13. Notes to the Cash Flow Statement
(a) Reconciliation of net profit attributable to owners of the Company to net cash (used in)/provided by operating activities
Half Year toMar 12 Sep 11 Mar 11
$m $m $mNet profit attributable to owners of the Company 2,052 2,791 2,428 Add/(deduct) non-cash items in the income statement:
Decrease/(increase) in interest receivable 191 225 (447)(Decrease)/increase in interest payable (330) (51) 342 Decrease in unearned income and deferred net fee income (291) (31) (176)Fair value movements in assets, liabilities and derivatives held at fair value (544) 269 1,439 (Decrease)/increase in personnel provisions (316) 203 (166)(Decrease)/increase in other operating provisions (40) 206 (101)Equity-based payments recognised in equity or reserves 116 82 7 Superannuation costs - defined benefit superannuation plans 24 20 24 Impairment losses on non-financial assets 350 16 - Impairment losses on financial assets - - 10 Charge to provide for bad and doubtful debts 1,321 827 923 Depreciation and amortisation expense 342 298 326 Movement in life insurance policyholder liabilities 2,916 (3,275) 2,445 Unrealised (gain)/loss on investments relating to life insurance business (3,504) 5,715 (2,113)Decrease/(increase) in other assets 1,119 588 (374)Increase/(decrease) in other liabilities 356 (429) 21 Increase/(decrease) in income tax payable 175 984 (209)Increase/(decrease) in deferred tax liabilities 230 (609) 81 (Increase)/decrease in deferred tax assets (165) (2) 92
Operating cash flow items not included in profit (4,559) 4,158 (7,357)Investing or financing cash flow items included in profit:
Gain on disposal of controlled entities, before income tax - - (11)Gain on investments classified as available for sale (15) (11) (9)Loss on disposal of disposal of property, plant, equipment and other assets - 14 2
Net cash (used in)/provided by operating activities (572) 11,988 (2,823)
(b) Reconciliation of cash and cash equivalents Cash and cash equivalents comprise short-term, highly liquid investments that are readily convertible to known amounts of cash within three months and are subject to an insignificant risk of change in value. They are held for the purposes of meeting short-term cash commitments (rather than for investment or other purposes) and include cash and liquid assets, amounts due from other banks, including securities held under reverse repurchase agreements, and short-term government securities.
Cash and cash equivalents as shown in the cash flow statement is reconciled to the related items on the balance sheet as follows:
Half Year toMar 12 Sep 11 Mar 11
Cash and cash equivalents $m $m $mAssetsCash and liquid assets 23,376 27,093 22,534 Treasury and other eligible bills 42 159 773 Due from other banks (excluding mandatory deposits with supervisory central banks) 52,300 45,241 36,552
75,718 72,493 59,859
Liabilities Due to other banks (41,184) (36,487) (34,628)
Total cash and cash equivalents 34,534 36,006 25,231

Half Year Results
2012
106
Notes to the Consolidated Financial Statements
(c) Non-cash financing and investing activitiesHalf Year to
Mar 12 Sep 11 Mar 11$m $m $m
New share issuesDividend reinvestment plan 700 729 635 Bonus share plan 25 24 22
Movement in assets under finance lease (1) 5 10
(d) Acquisitions of controlled entities and business combinations On 1 October 2011, the Group acquired 100% of the issued share capital of Antares Capital Partners Limited (Antares), formerly known as Aviva Investors Australia Limited. Antares is an Australian investment management business and the acquisition is expected to enhance the Group’s offering in Australian equities. The acquisition agreement contains a provision for contingent consideration of up to $10 million depending on the relative position of the ASX 200 as at 1 April 2012 relative to where it was on 3 August 2011. The fair value of this contingent consideration has been assessed as $6 million as at acquisition date and this amount was paid in April 2012.
Goodwill arose on the acquisition as the purchase consideration included a premium for the intrinsic value in the expanded distribution network and capabilities and the enhanced offering to customers. None of the goodwill is expected to be deductible for tax purposes. The accounting for the acquisition has been provisionally determined as at 31 March 2012 and will be finalised prior to 30 September 2012.
Since the acquisition date, Antares has not contributed a material amount to the net operating income and the statutory net profit of the Group.
Details of the acquisitions were as follows:
Half Year toMar 12 Sep 11 Mar 11
Consideration transferred $m $m $mCash paid 50 - 14 Deferred or contingent consideration 6 (1) 13
Total consideration transferred 56 (1) 27
Half Year toMar 12 Sep 11 Mar 11
Recognised amounts of identifiable assets acquired and liabilities assumed $m $m $mCash and liquid assets 14 - 8 Other intangible assets - 9 - Deferred tax assets 6 - - Other assets 6 - 2 Provisions (18) - (1)Deferred tax liabilities - (3) - Other liabilities (2) - -
Net identifiable assets and liabilities 6 6 9 Less: Fair value of equity interest in the acquiree held before the consideration date included in other assets (1) - - (11)Goodwill on acquisition 50 (7) 29
Total purchase consideration 56 (1) 27 Less: Deferred or contingent consideration (6) 1 (13)Less: Cash and cash equivalents acquired
Cash and liquid assets (14) - (8)
Net cash outflow 36 - 6
(1) There was nil gain or loss recognised as a result of re-measuring to fair value of the equity interest in the acquiree held before the business combination.

Half Year Results
2012
107
Notes to the Consolidated Financial Statements
(e) Loss of control of controlled entities Half year to
Mar 12 Sep 11 Mar 11Loss of control of controlled entities $m $m $mNet assets over which control was lost - - - Gain on disposal - - 11
Cash consideration received - - 11 Less: Cash and cash equivalents disposed - - -
Net cash inflow from loss of control of controlled entities - - 11
(f) Reconciliation of goodwillThe following is a reconciliation of the carrying amount of goodwill:
Half year toMar 12 Sep 11 Mar 11
Movements in goodwill $m $m $mBalance at beginning of period 5,567 5,533 5,546 Additions from the acquisition of controlled entities and business combinations (1) 50 (7) 33 Impairment losses recognised on UK Banking (295) - - Foreign currency translation adjustments (43) 41 (46)
Balance at end of period 5,279 5,567 5,533
(1) Includes an increase to goodwill from the revision to provisionally determined acquisition accounting of nil (September 2011 nil, March 2011 $4 million).
(g) Investments in associates and joint venturesThe Group holds no material interests in associates or joint venture entities as at 31 March 2012.
Half Year Results
2012
108
Notes to the Consolidated Financial Statements
14. Contingent Liabilities
(i) Legal proceedingsEntities within the Group are defendants from time to time in legal proceedings arising from the conduct of their business.
There are contingent liabilities in respect of claims, potential claims and court proceedings against entities of the Group. Where appropriate, provisions have been made. The aggregate of potential liability in respect thereof cannot be accurately assessed.
(ii) Contingent liability - Class actions On 18 November 2010, Maurice Blackburn Lawyers (an Australian law firm) commenced a class action proceeding against the Group in the Supreme Court of Victoria in relation to its exposure to certain Collateralised Debt Obligations (CDOs). Maurice Blackburn Lawyers allege that in 2008 the Group contravened certain misleading and deceptive conduct and continuous disclosure provisions of the Corporations Act 2001 (Cth) in relation to its exposure to the CDOs. The loss claimed by class members has not yet been identified in the proceeding. The proceeding is being vigorously defended.
On 16 December 2011, Maurice Blackburn Lawyers commenced a class action proceeding against the Group in relation to the payment of exception fees, along with similar proceedings against several other financial institutions. The quantum of the claim against the Group has not yet been identified in the proceeding. The proceeding is being vigorously defended.
(iii) Contingent liability - United Kingdom Financial Services Compensation SchemeThe United Kingdom (UK) Financial Services Compensation Scheme (FSCS) provides compensation to depositors in the event that a financial institution is unable to repay amounts due. Following the failure of a number of financial institutions, claims have been triggered against the FSCS, initially to pay interest on borrowings which the FSCS has raised from the UK Government to support the protected deposits. These borrowings are anticipated to be repaid from the realisation of the assets of the institutions. In the interim, the FSCS has estimated levies due to 31 March 2012 and an accrual is presently held for the Group’s calculated liability for this period. If the assets of the failed institutions are insufficient to repay the Government loan, additional levies will become payable in future periods.
(iv) Claims for potential mis-selling of Payment Protection Insurance Market wide issues relating to the UK banking industry payment protection insurance (PPI) issue are ongoing.
A provision of £169 million is held for this matter. The provision reflects an assessment of future PPI claims based upon estimates, statistical analysis and assumptions in relation to a wide range of uncertain factors, including how many PPI claims will be made against Clydesdale Bank PLC, for what value, and the prospects of mis-selling being established in relation to those claims. The final amount required to settle the potential liability is therefore uncertain. The Group continues to keep the matter under review.
Half Year Results
2012
109
Notes to the Consolidated Financial Statements
15. Events Subsequent to Balance DateThe Group announced the outcome of the strategic review of UK Banking on 30 April 2012. The main outcomes of the review are to: - Simplify the business model to focus on retail
operations and SME business lending in Scotland and Northern England.
- Improve the UK Banking balance sheet structure by transferring the vast majority of its commercial real estate (CRE) assets to NAB in the first half of the 2013 financial year (as at 31 March 2012 the portfolio to be transferred has an outstanding balance before provisions of approximately £6.2 billion).
- Place the transferred portfolio into run-off to be managed separately.
Restructuring costs totalling £195 million ($300 million) will be incurred relating to redundancy, software impairment, lease break fees and other costs, of which £36 million ($54 million) has been recognised in the Income Statement as at 31 March 2012. An estimated £139 million ($214 million) will be incurred in the half year ending 30 September 2012, with the remainder being incurred by the end of the 2015 financial year.
The implementation of the UK Banking restructure remains subject to final prudential regulatory approvals.

Half Year Results
2012
110
Directors’ Declaration
Directors’ Declaration
The directors of National Australia Bank Limited declare that, in the directors’ opinion:
a) as at the date of this declaration, there are reasonable grounds to believe that the Company will be able to pay its debts as and when they become due and payable; and
b) the financial statements and the notes, as set out on pages 82 to 109, are in accordance with the Corporations Act 2001 (Cth), including:
i) section 304, which requires that the half-year financial report comply with Accounting Standards made by the Australian Accounting Standards Board for the purposes of the Corporations Act 2001 (Cth) and any further requirements in the Corporations Regulations 2001; and
ii) section 305, which requires that the financial statements and notes give a true and fair view of the financial position of the Group as at 31 March 2012, and of the performance of the Group for the six months ended 31 March 2012.
Dated this 10th day of May, 2012 and signed in accordance with a resolution of the directors.
Michael A ChaneyChairman
Cameron ClyneGroup Chief Executive Officer

Liability limited by a scheme approved under Professional Standards Legislation
To the members of National Australia Bank Limited
Report on the Half Year Financial Report We have reviewed the accompanying half year financial report of National Australia Bank Limited (the “Company”), which comprises the consolidated balance sheet as at 31 March 2012, the consolidated income statement, consolidated statement of comprehensive income, consolidated statement of changes in equity and consolidated cash flow statement for the half year ended on that date, other explanatory notes, and the directors’ declaration of the consolidated entity comprising the Company and the entities it controlled (the “Group”) at the half year end or from time to time during the half year.
Directors’ Responsibility for the Half Year Financial Report The directors of the Company are responsible for the preparation of the half year financial report that gives a true and fair view in accordance with Australian Accounting Standards and the Corporations Act 2001 and for such internal controls as the directors determine are necessary to enable the preparation of the half year financial report that is free from material misstatement, whether due to fraud or error.
Auditor’s Responsibility Our responsibility is to express a conclusion on the half year financial report based on our review. We conducted our review in accordance with Auditing Standard on Review Engagements ASRE 2410 Review of a Financial Report Performed by the Independent Auditor of the Entity, in order to state whether, on the basis of the procedures described, we have become aware of any matter that makes us believe that the financial report is not in accordance with the Corporations Act 2001 including: giving a true and fair view of the consolidated entity’s financial position as at 31 March 2012 and its performance for the half year ended on that date; and complying with Accounting Standard AASB 134 Interim Financial Reporting and the Corporations Regulations 2001. As the auditor of National Australia Bank Limited and the entities it controlled during the half year, ASRE 2410 requires that we comply with the ethical requirements relevant to the audit of the annual financial report.
A review of a half year financial report consists of making enquiries, primarily of persons responsible for financial and accounting matters, and applying analytical and other review procedures. A review is substantially less in scope than an audit conducted in accordance with Australian Auditing Standards and consequently does not enable us to obtain assurance that we would become aware of all significant matters that might be identified in an audit. Accordingly, we do not express an audit opinion.
Independence In conducting our review, we have complied with the independence requirements of the Corporations Act 2001. We have given to the directors of the Company a written Auditor’s Independence Declaration, a copy of which is included in the Directors’ Report.

2
Conclusion Based on our review, which is not an audit, we have not become aware of any matter that makes us believe that the half year financial report of National Australia Bank Limited is not in accordance with the Corporations Act 2001, including:
a) giving a true and fair view of the Group’s financial position as at 31 March 2012 and of its performance for the half year ended on that date; and
b) complying with Accounting Standard AASB 134 Interim Financial Reporting and the Corporations Regulations 2001.
Ernst & Young
AJ (Tony) Johnson Partner Melbourne 10 May 2012

113
Half Year Results
2012Section 6
Supplementary Information
1. Disclosures on Special Purpose Entities 114
2. Net Interest Margins and Spreads 124
3. Loans and Advances by Industry and Geography 126
4. Average Balance Sheet and Related Interest 128
5. Capital Adequacy 131
6. Earnings per Share 134
7. Life Insurance Operations 135
8. Other Income Excluding Wealth 136
9. Operating Expenses Excluding Wealth 137
10. Net Interest Income / Other Operating Income Analysis - Wholesale Banking 138
11. Asset Funding 139
12. Number of Ordinary Shares 140
13. Exchange Rates 140
14. Australian Life Company Margins 140
15. ASX Appendix 4D 140
16. Reconciliation between Statutory Net Profit and Cash Earnings 141
17. NAB Wealth Reconciling Items 144
18. Divisional Performance Summary Excluding Foreign Currency Movements 146

Half Year Results
2012
114
Supplementary Information
1. Disclosures on Special Purpose EntitiesThe following supplementary disclosures are based on Financial Stability Board (FSB) recommendations that were included in a report entitled Enhancing Market and Institutional Resilience.
(a) Special Purpose EntitiesControlled entities are those entities, including Special Purpose Entities (SPEs), over which the Group has the power to govern the financial and operating policies so as to obtain benefits from their activities. Control rather than ownership interest is the sole criterion for determining a parent entity relationship. SPEs require consolidation in circumstances such as those where the Group has access to the majority of the residual income or is exposed to the majority of the residual risk associated with the SPE.
These supplementary disclosures focus on the exposure of the Group through its use of SPEs for various types of programs (both on and off balance sheet) including: - Securitisation SPEs. - Funding program SPEs. - Other SPEs.
(b) Securitisation SPEs
ObjectivesThe Group engages in securitisation activities for two purposes: - Securitisation activities for business purposes,
including arranging and managing securitisations for third parties (clients) as well as securities arbitrage (funding of purchased assets) activities (1), primarily through SPEs that provide funding for single or multiple transactions.
- Securitisation of its own assets for funding and liquidity purposes, primarily for risk and capital management reasons. These transactions have always been recorded on the balance sheet since the adoption of IFRS in 2006 as the derecognition criteria are not met.
The first category represents third party asset securitisation SPEs. The Group’s participation in these SPEs is discussed below.
Third party asset securitisation SPEsNAB sponsored securitisation SPEs for client securitisation assets and third party transactions
For these transactions, securitisation structures are established by the Group, comprising one or numerous SPEs to purchase and fund customer assets, including in securitised form. Previously, securitisation structures also included purchasing of rated securities arbitrage assets (purchased assets). Securities arbitrage activities have been discontinued by the Group. Each SPE funds the acquisition of assets or securities backed by the assets by: - The issuance of debt securities (medium term notes
or MTN) directly into the market (term securitisation). - The issuance of debt securities (asset backed
commercial paper or ABCP) via an issuing entity (ABCP conduit funding). Standby liquidity facilities are typically made available to the ABCP conduits to fund acquired assets in the event that ABCP cannot be rolled or reissued to external investors.
- The drawdown under funding facilities (securitisation funding facilities and warehouse facilities) provided by the Group directly to the SPE.
Ordinary equity in the securitisation SPE is typically held by a third party.
Most of the transactions in which the Group gains exposure to the securitisation SPEs are transactions funded through its sponsored multi-seller ABCP conduits and by securitisation funding facilities and warehouse facilities provided to the NAB sponsored SPEs established under Titan Securitisation, TSL (USA) Inc., Quasar Securitisation, CentreStar and MiraStar Securitisation. The Group undertakes one or more of the following roles of arranger, manager (through wholly-owned subsidiaries), standby liquidity provider, securitisation funding facility provider, asset liquidity provider, warehouse facility provider, derivative provider and dealer.
The NAB sponsored securitisation SPEs are consolidated in the financial statements.
Non-NAB sponsored securitisation SPEs for third party securitisation assets
For these transactions, securitisation SPEs are established by market participants, other than the Group, to acquire and fund various assets by issuing securities to external investors. The Group’s exposures to these SPEs arise from provision of standby liquidity facilities that can be drawn in the event that ABCP cannot be rolled or reissued to external investors and, in some cases, other facilities provided to fund and support acquired assets. These entities are generally not consolidated, with facilities provided by the Group (and drawn) being included in loans and advances.
Securitisation funding and standby liquidity facilitiesThe Group’s securitisation SPE exposures fall into two categories: purchased assets, which were acquired on set investment criteria to seed a new ABCP conduit or achieve critical mass; and client originated assets, which were originated as part of a broader client relationship. Within these categories the SPE exposures are categorised by asset class, resulting in the grouping of the exposures based on common features and risks.
Table 1 summarises the Group’s exposures to both NAB sponsored and non-NAB sponsored SPEs via securitisation funding facilities and standby liquidity facilities provided to ABCP conduits. Table 2 separates those exposures which are managed by Specialised Group Assets (SGA) and Wholesale Banking. Both tables show the facility limits extended by the Group, the amount drawn and available to be drawn under the respective facilities, and related provisions. It also shows the total securities issued by the relevant SPEs including ABCP and MTN, the carrying value of the SPE assets (other than cash), and the associated fair value.
Note: The standby liquidity facilities are only available to fund repayment of outstanding ABCP in cases where it cannot be rolled or reissued to external investors. For these facilities, the unutilised limit over and above the drawn and available amount cannot be accessed to fund additional assets until ABCP is reissued.
Selected comparative information for 30 September 2011 is provided, with further detail available in the 2011 Full Year Results.(1) Securities arbitrage (funding of purchased assets) activities have
been discontinued by the Group and, along with several client originated SPE exposures no longer deemed part of the Group’s core activities (largely Northern Hemisphere originated exposures), are being managed separately as part of the SGA division.

Half Year Results
2012
115
Supplementary Information
Group facilities SPE
Table 1 LimitDrawn &
available (1)Drawn-
down Provisions (2)Securities on issue (3)
Total asset
value (4)Fair
value (5)
As at 31 March 2012 $m $m $m $m $m $m $mSPE other purchased assets:
Infrastructure (credit wrapped bonds) 150 150 150 - - 150 148 Leveraged loans (CLOs) 1,317 1,317 1,317 - - 1,317 1,224 Commercial property (CMBS) 513 513 513 - - 513 446 Corporates (SCDO) (6) 540 540 540 - - 540 540
Total SPE other purchased assets 2,520 2,520 2,520 - - 2,520 2,358
NAB client originated assets:Auto / equipment 101 94 94 (4) - 94 90 Credit wrapped bonds 566 501 501 - - 501 442 Prime residential mortgages 2,678 1,969 969 - 2,657 3,626 3,626 Non-conforming residential mortgages 532 294 294 - 5 299 288 Sub-prime residential mortgages 79 79 79 - - 79 69 Commercial property (CMBS) 1 1 1 - 28 29 29 Credit wrapped ABS 512 512 512 (86) - 512 285 Other (7) 581 311 311 - - 311 299
Total NAB client originated assets 5,050 3,761 2,761 (90) 2,690 5,451 5,128 Represented by:
NAB sponsored SPEs 2,392 2,066 2,066 - 718 2,784 2,465 Non-NAB sponsored SPEs 2,658 1,695 695 - 1,972 2,667 2,663
Total NAB client originated assets 5,050 3,761 2,761 (3) 2,690 5,451 5,128
Total standby liquidity facilities (8) 7,570 6,281 5,281 (93) 2,690 7,971 7,486

Half Year Results
2012
116
Supplementary Information
Group facilities SPE
LimitDrawn &
available (1)Drawn-
down Provisions (2)Securities on issue (3)
Total asset
value (4)Fair
value (5)
As at 30 September 2011 $m $m $m $m $m $m $mTotal SPE purchased ABS CDOs 223 223 223 (107) - 223 60 Total SPE other purchased assets 3,439 3,439 3,439 - - 3,439 2,941 Total NAB client originated assets 6,210 4,697 3,507 (97) 2,286 5,793 5,403 Represented by:
NAB sponsored SPEs 3,040 2,713 2,713 - 577 3,290 2,904 Non-NAB sponsored SPEs 3,170 1,984 794 - 1,709 2,503 2,499
Total NAB client originated assets 6,210 4,697 3,507 (2) 2,286 5,793 5,403
Total standby liquidity facilities 9,872 8,359 7,169 (206) 2,286 9,455 8,404
(1) Drawn and available represents amounts drawn-down under the facility, and amounts currently available to be drawn (for standby liquidity facilities and securitisation funding facilities this is limited to the amounts that maybe required to repay maturing ABCP if it cannot be rolled).
(2) Includes both specific and collective provisions. Provisions include exchange rate movements. The specific provisions have been allocated against the specific asset classes whilst the collective provisions have been included in the totals. The provisions disclosed are shown net of any expected recoveries under the risk mitigation strategy (refer “Protection purchased to hedge exposure to SPE other purchased assets”).
(3) Securities on issue exclude amounts drawn under the facilities and include ABCP issued of $1,000 million (NAB does not hold any of the ABCP on issue) and MTN of $1,690 million.(4) Comprises total gross non-cash assets before provisions of the SPEs. For non-NAB sponsored SPEs, this only includes that portion of the SPE assets to which the Group is exposed
through the securitisation funding facilities or the standby liquidity facilities. The drawn-down amounts on these facilities are recorded on the Group’s balance sheet.(5) The estimated fair values are based on relevant information at 31 March 2012 and 30 September 2011 respectively. These estimates involve matters of judgement, as changes in
assumptions could have a material impact on the amounts estimated.There are various limitations inherent in this fair value disclosure particularly in the current market where, due to the uncertainty in the market, prices may not represent the underlying value. Not all of the Group’s financial instruments can be exchanged in an active trading market. The Group obtains the fair values for investment securities from quoted market prices, where available. Where securities are unlisted and quoted market prices are not available, the Group obtains the fair value by means of anticipated discounted cash flows and other valuation techniques that are commonly used by market participants. These techniques address factors such as interest rates, credit risk and liquidity. In addition, it is the Group’s intent to hold its financial instruments to maturity. The difference to fair value represents the significant change in discount rates in the current depressed markets. This is relevant in a trading environment, but is not relevant to assets held to maturity and loans and advances. This is consistent with the treatment of assets of the wider Group.The fair value of the SCDOs reflects the Group’s exposure subsequent to the purchase of additional protection (refer “Protection purchased to hedge exposure to SPE other purchased assets” for further information). The fair value of infrastructure (credit wrapped bonds), credit wrapped bonds and credit wrapped ABS ascribes minimal value to the protection afforded by insurance policies from financial guarantee (monoline) insurers.
(6) The limit, drawn and available, drawn-down amounts and asset value represent the two remaining (out of six original) underlying asset exposures which are entitled to recovery under the risk mitigation strategy (refer “Protection purchased to hedge exposure to SPE other purchased assets”). SGA has removed the economic risk associated with the six sold protection SCDO derivative exposures.
(7) Other exposures includes trade receivables and other asset backed securities.(8) The movement in drawn and available from 30 September 2011 to 31 March 2012 is comprised of a net $1.9 billion reduction for repayments and terminations offset by new facilities
and $0.2 billion reduction attributable to exchange rate movements.

Half Year Results
2012
117
Supplementary Information
Table 2 shows the SPE exposures, related provisions, carrying value of the SPE assets (other than cash) and the associated fair value by Division.
Group facilities SPE
Table 2 LimitDrawn & available
Drawn- down Provisions (2)
Securities on issue
Total asset value
Fair value
Divisional distribution (1) $m $m $m $m $m $m $m
As at 31 March 2012Specialised Group Assets managed:
Leveraged loans (CLOs) 1,317 1,317 1,317 - - 1,317 1,224 Commercial property (CMBS) 513 513 513 - - 513 446 Corporates (SCDO) 540 540 540 - - 540 540 Infrastructure (credit wrapped bonds) 150 150 150 - - 150 148 Credit wrapped bonds 566 501 501 - - 501 442 Credit wrapped ABS 512 512 512 (86) - 512 285 Non-conforming residential mortgages 100 100 100 - - 100 89 Sub-prime residential mortgages 79 79 79 - - 79 69 Other (4) 34 34 34 - - 34 22
Total Specialised Group Assets (2)(3) 3,811 3,746 3,746 (89) - 3,746 3,265
Wholesale Banking managed:Auto / equipment 101 94 94 (4) - 94 90 Commercial property (CMBS) 1 1 1 - 28 29 29 Prime residential mortgages 2,678 1,969 969 - 2,657 3,626 3,626 Non-conforming residential mortgages 432 194 194 - 5 199 199 Other (4) 547 277 277 - - 277 277
Total Wholesale Banking (5) 3,759 2,535 1,535 (4) 2,690 4,225 4,221 Represented by:
NAB sponsored SPEs 1,101 840 840 - 718 1,558 1,558
Non-NAB sponsored SPEs 2,658 1,695 695 - 1,972 2,667 2,663
Total Wholesale Banking (2) (5) 3,759 2,535 1,535 (4) 2,690 4,225 4,221
Total exposure to standby liquidity facilities 7,570 6,281 5,281 (93) 2,690 7,971 7,486
Group facilities SPE
LimitDrawn & available
Drawn- down Provisions (2)
Securities on issue
Total asset value
Fair value
As at 30 September 2011 $m $m $m $m $m $m $m
Specialised Group Assets managed:Represented by:
NAB sponsored SPEs 5,489 5,415 5,415 - - 5,415 4,405
Total Specialised Group Assets (3) 5,489 5,415 5,415 (201) - 5,415 4,405
Wholesale Banking managed:
Represented by:NAB sponsored SPEs 1,213 960 960 - 577 1,537 1,500 Non-NAB sponsored SPEs 3,170 1,984 794 - 1,709 2,503 2,499
Total Wholesale Banking (5) 4,383 2,944 1,754 (5) 2,286 4,040 3,999
Total exposure to standby liquidity facilities 9,872 8,359 7,169 (206) 2,286 9,455 8,404
(1) Management of underlying exposure i.e. the management of the exposure between Wholesale Banking and SGA.(2) Provisions include both specific and collective provisions. Collective provisions for SGA ($3.0 million) and Wholesale Banking ($0.3 million) have been calculated across the portfolio
of NAB sponsored and non-NAB sponsored assets. The specific provisions have been allocated against the specific asset classes whilst the collective provisions have been included in the totals.
(3) The movement in drawn and available from 30 September 2011 to 31 March 2012 is comprised of a net $1.6 billion reduction for repayments and terminations and $0.1 billion reduction attributable to exchange rate movements.
(4) Other exposures include trade receivables and other asset backed securities.(5) The movement in drawn and available from 30 September 2011 to 31 March 2012 is comprised of an overall reduction of $0.4 billion due to repayments and terminations offset by new
facilities.

Half Year Results
2012
118
Supplementary Information
Table 3 shows the total drawn and available securitisation funding and standby liquidity facilities of the Group to securitisation SPEs by geography.
Table 3
Australia & New
Zealand EuropeNorth
AmericaAsia &
other
Total drawn
& available
Weighted average term to
maturity (2)
Geographic distribution (1) $m $m $m $m $m yrs
As at 31 March 2012SPE other purchased assets:
Infrastructure (credit wrapped bonds) (3) 150 - - - 150 0.6 Leveraged loans (CLOs) (4) - 656 661 - 1,317 4.4 Commercial property (CMBS) (5) - 465 48 - 513 2.3 Corporates (SCDO) (6) 11 172 336 21 540 3.8
Total SPE other purchased assets 161 1,293 1,045 21 2,520 3.6
NAB client originated assets:Auto / equipment 94 - - - 94 0.6 Credit wrapped bonds (3) 501 - - - 501 8.0 Prime residential mortgages 1,969 - - - 1,969 24.5 Non-conforming residential mortgages 194 100 - - 294 22.8 Sub-prime residential mortgages - - 79 - 79 23.7 Commercial property (CMBS) 1 - - - 1 0.1 Credit wrapped ABS (3) - - 502 10 512 24.1 Other 277 - 34 - 311 2.9
Total NAB client originated assets 3,036 100 615 10 3,761 19.7
Total exposure to standby liquidity facilities 3,197 1,393 1,660 31 6,281 13.3
Managed within:Wholesale Banking 2,535 - - - 2,535 21.9 Specialised Group Assets 662 1,393 1,660 31 3,746 7.9
Total exposure to standby liquidity facilities 3,197 1,393 1,660 31 6,281 13.3
Australia & New
Zealand EuropeNorth
AmericaAsia &
other
Total drawn
& available
Weighted average term to
maturityAs at 30 September 2011 $m $m $m $m $m yrsTotal SPE purchased ABS CDOs - - 223 - 223 26.2 Total SPE other purchased assets 198 1,754 1,422 65 3,439 3.9 Total NAB client originated assets 3,446 166 963 122 4,697 18.4
Total exposure to standby liquidity facilities 3,644 1,920 2,608 187 8,359 11.9
(1) Location of underlying exposure i.e. the location of the ultimate borrower/reference entity within the portfolios on a look through basis.(2) Reflects the weighted average contractual maturity of the underlying exposure of the SPE on a look through basis.(3) Credit wrapped bonds and ABS are wrapped by financial guarantee (monoline) insurers.(4) Includes nine transactions, in all but one case with exposure to the most senior class of notes, and initial subordination ranging from 23-38%. Reported defaults to date range from
0-6% with modest realised losses on underlying corporate loan collateral. Excess spread available to cover ongoing losses generally exceeds 1% per annum of the current principal balance of each CLO transaction.
(5) Includes four UK transactions backed by Greater London and regional properties, with exposure to the most senior bonds, and ratio of relevant note tranche to property value ranging from 53-82%. In general, the properties securing larger loans are let with quality tenants, have low vacancy rates and good lease profiles. The loan vintages are generally 2006 and 2007.
(6) The limit, drawn and available, drawn-down amounts and asset value represent the two remaining (out of six original) underlying asset exposures which are entitled to recovery under the risk mitigation strategy (refer “Protection purchased to hedge exposure to SPE other purchased assets”). SGA has removed the economic risk associated with the six sold protection SCDO derivative exposures.

Half Year Results
2012
119
Supplementary Information
Further analysis of facilitiesRating analysis
The last remaining ABS CDO was sold during the current year.
Current S&P equivalent ratings - $2.5 billion SPE other purchased assets (1)
Current S&P equivalent ratings - $3.8 billion NAB client originated assets split by business (1) (2)
A+/AA- (SGA)45%
BBB+/BBB/BBB-((SGA)15%
AA/AA- (SGA)30%
AAA (SGA)10%
Sub Investmentgrade (WB)
1%Sub Investment
grade (SGA)7%
BBB+/BBB/BBB-(WB)4%
BBB+/BBB/BBB-(SGA)16%
A+/A/A- (WB)18%
A+/A/A- (SGA)3%
AA/AA- (WB)20%
AA/AA- (SGA)2%
AAA (WB)25%
AAA (SGA)4%
(1) Includes internally rated assets mapped to S&P risk grades, taking into account the risk mitigation strategy on the SCDO’s. These exposures only exist within SGA.
(1) Includes NAB internally rated assets mapped to S&P risk grades.(2) The current ratings of credit wrapped bonds are based on the BBB+ ratings of the
underlying assets.
Asset quality information relevant to specific exposures
Table 4 shows asset quality and past due analysis of underlying collateral of NAB client originated assets.
Table 4
Weighted average
current LVR
Mortgage insurance coverage
Days past due
31-60 61-90 >90As at 31 March 2012 % % % % %
Specialised Group Assets managed:Non-conforming residential mortgages (1) 82.54% - 4.63% 2.33% 15.19% Sub-prime residential mortgages (1) 80.39% 52.37% 3.55% 1.24% 6.57%
Wholesale Banking managed:Auto / equipment (2) n/a n/a 0.75% 0.53% 0.95% Prime residential mortgages 68.72% 89.84% 1.19% 0.36% 1.92% Non-conforming residential mortgages 62.00% 2.00% - 1.00% 1.00%
(1) Current mortgage insurance coverage on sub-prime residential mortgages is shown. The >90 days percentage for sub-prime residential mortgages does not include loans in foreclosure or homes foreclosed upon but not liquidated. Total sub-prime foreclosures represent an additional 29.41% of the current principal balance. Foreclosures and repossessed properties for non-conforming residential mortgages represent 1.69% of the current principal balance which together with >90 days represents 16.88% of the current principal balance. The above percentages excludes sub-prime residential mortgage exposures that exists within Credit wrapped ABS.
(2) All auto/equipment transactions benefit from various types of credit enhancements including subordination and excess spread.

Half Year Results
2012
120
Supplementary Information
Vintage of sub-prime and Alt-A exposures (1) (2) Industry splits - SPE other purchased assets (1) (2)
20
40
60
80
100
120
140
2007 2006 2005 Prior to 2005
$m
Vintage - Subprime
26% 19%
7%31%
21%3%
46%
11%
36%
0%
20%
40%
60%
80%
100%
Leveraged loans (CLOs) Corporates (SCDO)
Industrial
Telecommunications, media & technology
Sovereign
Finance
Consumer
(1) US sub-prime exposure of the Group was $109 million as at 31 March 2012. This amount represents $79 million of sub-prime residential mortgage backed securities and $30 million as part of credit wrapped ABS in the NAB client originated assets. These exposures only exist within SGA.
(2) US Alt-A exposure of the Group was $118 million as at 31 March 2012, fully represented as part of credit wrapped ABS in the NAB client originated assets. These exposures only exist within SGA.
(1) Leverage loans (CLOs) total $1.3 billion.(2) Corporates (SCDO) total $0.5 billion.
Securitisation SPE credit exposure to the financial guarantor sector (monoline insurers)Table 5 summarises the indirect exposures to third party transactions supported by monoline financial guarantees. In the event of monoline failure, the benefit of the financial guarantee falls away resulting in exposure to the underlying asset.
Exposures to monoline insurers
Table 5Mar 12
$mSep 11
$m
Specialised Group Assets managed:Infrastructure (credit wrapped bonds) (1) 150 150 Credit wrapped bonds (1) 566 564 Credit wrapped ABS (2) 366 570 Other 34 36
Total Specialised Group Assets (3) 1,116 1,320
(1) These bonds include those issued by well known essential infrastructure and energy borrowers and are themselves high quality investment grade assets.
(2) Credit wrapped ABS benefit from a monoline financial guarantee including both portfolio and security level policies.
(3) There are no Wholesale Banking exposures which rely on monoline insurers.
Current S&P rating of monolines (1)
AA+,1%
B,59%
NR,40%
(1) The unrated (NR) monoline insurer provides a guarantee on the credit wrapped bonds. The ratings of the underlying assets are rated between BBB+ and D.
Protection purchased to hedge exposure to SPE other purchased assetsIn September 2008 the Group completed a risk mitigation strategy in relation to its exposure to Corporates (SCDO) within its securitisation SPE portfolio. As a result, long-dated hedges were entered into with a large, highly reputable, global bank counterparty.
As announced on 22 March 2012, the Group entered into transactions to remove the economic risk on the two remaining SCDO assets.
To date the Group has recovered losses of $747 million relating to write downs of the underlying notes as a result of credit events within the portfolio. Consistent with the Group’s expectation, and the above risk mitigation strategy, the Group has recovered all of its losses on the original investment associated with these write downs. The recovery under the hedging strategy was recognised within Other operating income in the Income Statement.

Half Year Results
2012
121
Supplementary Information
Other exposures
In addition to securitisation funding facilities and standby liquidity facilities discussed above, there are securitisation SPE exposures arising from warehouse facilities (refer Table 6), asset liquidity facilities ($702 million), credit enhancements ($218 million), investments in securitisation debt securities ($4,074 million), derivatives ($236 million), lines of credit ($66 million) and redraw facilities ($2 million).
Derivative transactions include interest rate and currency derivatives provided to securitisation SPEs.
Warehouse facilities are funding facilities provided to SPEs holding client assets until such time as the facility is refinanced by ABCP conduits or the term securitisation market. Typically these facilities are reviewed annually. These facilities are in addition to securitisation funding facilities and standby liquidity facilities.
Table 6 shows the limit and drawn amount under the facility. The undrawn limit is available to fund additional assets.
Table 6 LimitDrawn-
downAs at 31 March 2012 $m $m
Wholesale Banking managed:Prime residential mortgages 4,120 3,786 Non-conforming residential mortgages 1,426 1,242 Auto / equipment 428 304 Other 150 137
Total warehouse facilities - Wholesale Banking (1) 6,124 5,469
Total warehouse facilities 6,124 5,469
LimitDrawn-
downAs at 30 September 2011 $m $m
Total warehouse facilities 5,719 4,656
(1) Of the drawn-down amount $1.3 billion (September 2011 $1.2 billion) is via consolidated NAB-sponsored SPEs resulting in the recognition of the underlying assets on the balance sheet. There are no warehouse facilities in SGA.
Table 7 shows the available asset quality and past due analysis of underlying collateral of warehouse facilities.
Table 7
Weighted average
current LVR
Mortgage Insurance coverage
Days Past Due
31-60 61-90 > 90As at 31 March 2012 % % % % %Wholesale Banking managed:
Auto / equipment n/a n/a 1.00% - 1.51% Prime residential mortgages (1) 69.28% 97.89% 0.19% 0.97% 1.57% Non-conforming residential mortgages 72.69% - 1.22% 0.77% 1.58% Other n/a n/a - - 1.00%
(1) Includes the most senior position in a transaction, structured to invest in fully insured non-conforming prime mortgages.

Half Year Results
2012
122
Supplementary Information
Risk-weights for securitisation exposureTable 8 shows the risk weights for securitisation exposures as calculated under the Australian Prudential Standard for Securitisation (APS 120), predominantly using the Standardised Approach and includes SPE exposures (Table 1), warehouse facilities (Table 6) and other securitisation SPE exposures disclosed in the “Other exposures” section above. Following a change in treatment, the risk-weighted asset (RWA) percentages applied to the Credit wrapped ABS exposure have been amended resulting in a reduction of RWAs of $3.2 billion and an increase in deductions of $229 million. The sale of the remaining ABS CDO in March 2012 reduced deductions by $116 million. The termination of the remaining two sold protection SCDO derivative exposures reduced RWAs by $1.5 billion.
Table 8
Mar 12 Sep 11Exposure (1) RWA Exposure (1) RWA
$m $m $m $mSpecialised Group Assets managed:
> 10% ≤ 25% 125 18 895 167 > 25% ≤ 35% 48 17 130 46 > 35% ≤ 50% 1,193 509 901 452 > 50% ≤ 75% 218 152 196 139 > 75% ≤ 100% 1,497 1,497 1,531 1,531 >100% ≤ 650% 93 432 1,170 5,206 Deductions 230 - 116 -
Total Specialised Group Assets 3,404 2,625 4,939 7,541 Wholesale Banking managed:
≤ 10% 7,921 556 8,027 563 > 10% ≤ 25% 5,174 746 4,906 695 > 25% ≤ 35% 209 64 42 13 > 35% ≤ 50% 14 7 14 7 > 50% ≤ 75% 210 155 215 159 > 75% ≤ 100% 27 27 16 16 >100% ≤ 650% 30 134 20 55 Deductions 2 - 24 -
Total Wholesale Banking (2) 13,587 1,689 13,264 1,508 Total securitisation exposure 16,991 4,314 18,203 9,049
(1) Refer to Table 9 for further details on how the exposures relate to the other relevant tables within this Disclosure on Special Purpose Entities.(2) Wholesale Banking includes BNZ exposures of $143 million (September 2011 $74 million). The RWAs for these exposures are $21 million (September 2011 $25 million).
Securitisation exposuresTable 9 shows how the various securitisation exposures as disclosed within this Disclosure on Special Purpose Entities reconcile to the above securitisation exposure as calculated under APS 120.
Mar 12 Sep 11Table 9 $m $mTotal group facilities (Table 1) 7,570 9,872 Total warehouse facilities (Table 6) 6,124 5,719 Total other exposures (1) 5,298 4,669
Less:Other banking book exposures (2) (1,371) (1,256)Specific provisions (Table 1) (3) (90) (111)SCDO notes protected by hedging (4) (540) (690)
Total securitisation exposures (APS 120) 16,991 18,203
Other securities (5) 30 34
Total securitisation exposures 17,021 18,237
(1) The other exposures includes asset liquidity facilities $702 million (September 2011 $699 million), redraw facilities $2 million (September 2011 $17 million), derivative transactions $236 million (September 2011 $133 million), credit enhancements $218 million (September 2011 $247 million), lines of credit $66 million (September 2011 $nil) and investment in securitisation debt securities $4,074 million (September 2011 $3,573 million). The increase reflects additional assets in Wholesale Banking.
(2) The banking book exposures relate to those exposures which are treated as mortgages from a prudential standard perspective and therefore excluded from the securitisation exposures under APS 120.
(3) The specific provisions relate to the auto/equipment and credit wrapped ABS asset classes as disclosed in Table 1. Securitisation exposures are disclosed net of these provisions in the above table.
(4) This represents the two remaining (out of six original) underlying asset exposures which are entitled to recovery under the risk mitigation strategy.
(5) Includes exposure to securitisation SPEs which are not subject to APS 120 but rather APS 113 and APS 116 for the purposes of calculating the associated RWA. These exposures are required to be disclosed under APS 330 and therefore included in the Risk and Capital Report.
Roles in securitisationThe Group may undertake any of the following roles in its third party asset securitisation activities: - Arranger (the structurer of securitisation transactions). - Sponsor (the entity that established the
securitisation SPEs and often provides other services. NAB sponsored SPEs are established under Titan Securitisation, TSL (USA) Inc., Quasar Securitisation, CentreStar and MiraStar Securitisation legal structures).
- Manager (operator of securitisation SPEs including managing assets and liabilities and providing accounting and administrative services).
- Securitisation funding facility provider (a lender to securitisation SPEs where tenor of the funding extends beyond one year and may match the expected redemption date of the underlying security held by the SPE).
- Standby liquidity provider (a provider of liquidity available to repay ABCP if unable to reissue).
- Asset liquidity provider (a provider of liquidity to cover mismatches in interest cash flows for securitisation structures).
- Redemption provider (a provider of liquidity to cover mismatch in principal cash flows for securitisation structures).
- Warehouse facility provider (a lender to securitisation SPEs pending refinance via issuance of securities).
- Derivative provider. - Investor in securities issued. - Letter of credit provider (a provider of credit
enhancement to securitisation structures). - Dealer (a buyer and seller in the primary and
secondary markets of securities).

Half Year Results
2012
123
Supplementary Information
Accounting treatmentIn general, facilities provided to securitisations are treated the same way as facilities to any other borrower or counterparty.
Interest and line fees received are treated as revenue in the period in which they are accrued. Arrangement fees are treated as revenue and recognised as revenue over the life of the securitisation transaction.
Most of these facilities fund NAB sponsored securitisation SPEs which are consolidated by the Group. On consolidation the facilities are eliminated and the underlying liabilities and assets, including held to maturity investments, in the SPEs are brought onto the Group’s balance sheet. Held to maturity investments are accounted for at amortised cost, net of any provision for impairment.
Derivatives such as interest rate swaps, basis swaps or cross-currency swaps have the same accounting treatment as non-securitisation derivatives.
(c) Funding program SPEsThe Group has established programs to raise funding from the issue of equity instruments.
Material funding programs of the Group that use SPEs are as follows:
Mar 12 Sep 11Table 10 $m $mTrust Preferred Securities 975 975 Trust Preferred Securities II 1,014 1,014 National Capital Instruments 397 397 BNZ Income Securities 380 380 BNZ Income Securities 2 203 203
The SPEs used in the above funding programs are consolidated by the Group under IFRS and are recorded on balance sheet as equity items of the Group.
Other funding programs of the Group do not use SPEs and are recorded in the books of the Company. Further details on funding programs can be found at www.nabgroup.com.
(d) Other SPEsThe Group is involved in transactions that involve the use of SPEs. All of these SPEs are recorded on the balance sheet.
Mar 12 Sep 11Table 11 $m $mConsolidated SPEs
Group exposure excluding SGAInvestments in debt securities 301 684 Investments in property trusts 185 128 Funding transactions - (1,914)Lease finance 335 66
SGA ExposureLease finance 777 831
The Group invests in debt instruments through various SPEs, mainly in the form of bonds, certificates of deposits and loans. The assets within the portfolio are subject to the Group’s normal credit approval, hedging and review processes.
The Group also utilises SPEs to invest in a range of property and other equity related investments as well as a means to access alternate sources of funding.
Lease financing involves extending finance to clients in order to meet their particular asset financing requirements mainly in the mining, mobile infrastructure and transport industries.

Half Year Results
2012
124
Supplementary Information
2. Net Interest Margins and SpreadsHalf Year to
Mar 12 Sep 11 Mar 11 Mar 12 v Mar 12 vGroup % % % Sep 11 Mar 11Net interest spread (1) 1.74 1.82 1.79 (8 bps) (5 bps)Benefit of net free liabilities, provisions and equity 0.42 0.45 0.43 (3 bps) (1 bps)
Net interest margin - statutory basis (2) 2.16 2.27 2.22 (11 bps) (6 bps)
(1) Net interest spread represents the difference between the average interest rate earned and the average interest rate incurred on funds.(2) Net interest margin is net interest income as a percentage of average interest earning assets.
Half Year toMovement
in mix % of Group AIEA
Mar 12 Mar 11Average interest earning assets $bn Mix % $bn Mix %Business Banking 197.6 31.9 190.6 33.6 (1.7)Personal Banking 143.3 23.2 123.8 21.8 1.4 Wholesale Banking 184.9 29.9 153.5 27.1 2.8 NZ Banking 45.6 7.4 43.5 7.7 (0.3)UK Banking 65.3 10.6 66.2 11.7 (1.1)Great Western Bank 7.0 1.1 7.1 1.3 (0.2)Specialised Group Assets 8.5 1.4 11.8 2.1 (0.7)Other (1) (33.3) (5.5) (29.9) (5.3) (0.2)
Group 618.9 100.0 566.6 100.0 -
Half Year to
NIM Change
Mar 12 Mar 11Net interest income and margins $m NIM % $m NIM %Business Banking 2,530 2.56 2,446 2.57 (1 bps)Personal Banking 1,445 2.02 1,368 2.22 (20 bps)Wholesale Banking 784 0.85 522 0.68 17 bps NZ Banking 549 2.41 487 2.24 17 bps UK Banking 684 2.09 768 2.33 (24 bps)Great Western Bank 132 3.78 155 4.38 (60 bps)Specialised Group Assets 54 1.27 65 1.10 17 bps Other (1) 530 n/a 493 n/a n/a
Group - cash earnings basis 6,708 2.17 6,304 2.23 (6 bps)
NAB Wealth net interest income (36) (0.01) (25) (0.01) -
Group - statutory basis 6,672 2.16 6,279 2.22 (6 bps)
Half year ended March 2012 v Half year ended March 2011Impact of Impact on
Group NIM
Change in Change inContribution to Group Margin NIM (2) MIX (3)
Business Banking - (1 bps) (1 bps)Personal Banking (4 bps) - (4 bps)Wholesale Banking 5 bps (4 bps) 1 bps NZ Banking 1 bps - 1 bps UK Banking (3 bps) - (3 bps)Great Western Bank (1 bps) - (1 bps)Specialised Group Assets - 1 bps 1 bps Other (1) (1 bps) 1 bps -
Group - cash earnings basis (3 bps) (3 bps) (6 bps)
NAB Wealth net interest income - - -
Group - statutory basis (3 bps) (3 bps) (6 bps)
(1) Includes NAB Wealth, Group Funding, other supporting units and eliminations.(2) The increase/(decrease) in net interest margin assuming no change in mix of average interest earning assets (AIEA).(3) The increase/(decrease) in net interest margin caused by changes in divisional mix of average interest earning assets.

Half Year Results
2012
125
Supplementary Information
Half Year toMovement
in mix % of Group AIEA
Mar 12 Sep 11Average interest earning assets $bn Mix % $bn Mix %Business Banking 197.6 31.9 194.0 32.6 (0.7)Personal Banking 143.3 23.2 134.2 22.6 0.6 Wholesale Banking 184.9 29.9 175.3 29.5 0.4 NZ Banking 45.6 7.4 44.8 7.5 (0.1)UK Banking 65.3 10.6 64.4 10.8 (0.2)
Great Western Bank 7.0 1.1 6.6 1.1 - Specialised Group Assets 8.5 1.4 9.8 1.6 (0.2)Other (1) (33.3) (5.5) (34.5) (5.7) 0.2
Group 618.9 100.0 594.6 100.0 -
Half Year to
NIM Change
Mar 12 Sep 11Net interest income and margins $m NIM % $m NIM %Business Banking 2,530 2.56 2,587 2.66 (10 bps)Personal Banking 1,445 2.02 1,458 2.17 (15 bps)Wholesale Banking 784 0.85 708 0.81 4 bps NZ Banking 549 2.41 528 2.35 6 bps UK Banking 684 2.09 754 2.33 (24 bps)Great Western Bank 132 3.78 130 3.99 (21 bps)Specialised Group Assets 54 1.27 58 1.18 9 bps Other (1) 530 n/a 565 n/a n/a
Group - cash earnings basis 6,708 2.17 6,788 2.28 (11 bps)
NAB Wealth net interest income (36) (0.01) (33) (0.01) -
Group - statutory basis 6,672 2.16 6,755 2.27 (11 bps)
Half year ended March 2012 v Half year ended September 2011
Impact of Impact on Group
NIMChange in Change in
Contribution to Group Margin NIM (2) MIX (3)
Business Banking (4 bps) - (4 bps)Personal Banking (3 bps) - (3 bps)Wholesale Banking 1 bps - 1 bps NZ Banking - - - UK Banking (3 bps) - (3 bps)Great Western Bank - - - Specialised Group Assets - - - Other (1) (1 bps) (1 bps) (2 bps)
Group - cash earnings basis (10 bps) (1 bps) (11 bps)
NAB Wealth net interest income - - -
Group - statutory basis (10 bps) (1 bps) (11 bps)
(1) Includes NAB Wealth, Group Funding and other supporting units.(2) The increase/(decrease) in net interest margin assuming no change in mix of average interest earning assets (AIEA).(3) The increase/(decrease) in net interest margin caused by changes in divisional mix of average interest earning assets.

Half Year Results
2012
126
Supplementary Information
3. Loans and Advances by Industry and Geography
Australia EuropeNew
ZealandUnited States Asia Total
As at 31 March 2012 $m $m $m $m $m $mGovernment and public authorities 1,627 57 274 108 - 2,066 Agriculture, forestry, fishing and mining 18,082 2,867 8,371 1,192 14 30,526 Financial, investment and insurance 12,331 3,716 575 482 61 17,165 Real estate - construction 1,743 6,518 468 336 - 9,065 Manufacturing 8,333 1,767 1,686 6 547 12,339 Instalment loans to individuals and other personal lending
(including credit cards) 9,530 3,805 1,577 52 5 14,969 Real estate - mortgage 213,075 22,466 21,954 540 1,399 259,434 Asset and lease financing 12,783 2,168 15 - 8 14,974 Commercial property services 47,884 4,711 5,987 32 430 59,044 Other commercial and industrial 50,643 10,086 4,953 3,266 1,877 70,825
Gross loans and advances including acceptances (1) 376,031 58,161 45,860 6,014 4,341 490,407
Deduct:Unearned income and deferred net fee income (1,633) (316) (36) (12) (21) (2,018)Provisions for doubtful debts (2,394) (1,147) (265) (67) (12) (3,885)
Total net loans and advances including acceptances 372,004 56,698 45,559 5,935 4,308 484,504
Australia EuropeNew
ZealandUnited States Asia Total
As at 30 September 2011 (2) $m $m $m $m $m $mGovernment and public authorities 1,589 53 288 72 - 2,002 Agriculture, forestry, fishing and mining 16,811 3,043 8,220 1,040 30 29,144 Financial, investment and insurance 11,768 3,925 579 1,177 88 17,537 Real estate - construction 1,729 7,428 450 179 - 9,786 Manufacturing 8,040 1,980 1,576 426 470 12,492 Instalment loans to individuals and other personal lending
(including credit cards) 9,547 4,073 2,063 - 5 15,688 Real estate - mortgage 207,272 22,306 21,535 615 1,336 253,064 Asset and lease financing 12,877 2,407 16 - 7 15,307 Commercial property services 48,445 5,187 5,373 24 290 59,319 Other commercial and industrial 47,916 10,765 4,625 3,121 1,359 67,786
Gross loans and advances including acceptances (1) 365,994 61,167 44,725 6,654 3,585 482,125
Deduct:Unearned income and deferred net fee income (1,826) (394) (31) (14) (22) (2,287)
Provisions for doubtful debts (2,680) (910) (296) (82) (12) (3,980)
Total net loans and advances including acceptances 361,488 59,863 44,398 6,558 3,551 475,858

Half Year Results
2012
127
Supplementary Information
Australia EuropeNew
ZealandUnited States Asia Total
As at 31 March 2011 $m $m $m $m $m $mGovernment and public authorities 1,489 61 366 126 9 2,051 Agriculture, forestry, fishing and mining 14,851 2,781 7,276 919 19 25,846 Financial, investment and insurance 10,338 3,458 570 790 70 15,226 Real estate - construction 2,163 7,560 434 512 - 10,669 Manufacturing 7,705 1,810 1,659 22 88 11,284 Instalment loans to individuals and other personal lending
(including credit cards) 9,542 4,072 1,936 127 5 15,682 Real estate - mortgage 195,319 20,464 19,783 586 1,160 237,312 Asset and lease financing 13,027 2,479 16 - 8 15,530 Commercial property services 45,050 5,322 5,098 36 152 55,658 Other commercial and industrial 50,945 10,508 4,197 2,913 1,425 69,988
Gross loans and advances including acceptances (1) 350,429 58,515 41,335 6,031 2,936 459,246
Deduct:Unearned income and deferred net fee income (1,750) (481) (30) (11) (14) (2,286)Provisions for doubtful debts (2,835) (872) (290) (73) (10) (4,080)
Total net loans and advances including acceptances 345,844 57,162 41,015 5,947 2,912 452,880
(1) Includes loans at fair value. (2) For the half year ended 30 September 2011, certain reclassifications have occurred to better align underlying loan balances with regulatory classifications.

Half Year Results
2012
128
Supplementary Information
4. Average Balance Sheet and Related InterestThe following tables set forth the major categories of interest earning assets and interest bearing liabilities, together with their respective interest rates earned or incurred by the Group. Averages are predominantly daily averages. Amounts classified as Other International represent interest earning assets and interest bearing liabilities of the controlled entities and overseas branches domiciled in New Zealand, United States and Asia. Impaired assets are included within loans and advances in interest earning assets.
Average assets and interest income
Half Year Ended Mar 12 Half Year Ended Sep 11 Half Year Ended Mar 11Average balance Interest
Average rate
Average balance Interest
Average rate
Average balance Interest
Average rate
$m $m % $m $m % $m $m %Average interest earning
assetsDue from other banks
Australia 17,320 305 3.5 16,935 337 4.0 13,552 260 3.8 Europe 22,328 46 0.4 25,562 55 0.4 24,137 58 0.5 Other International 12,869 32 0.5 5,926 34 1.1 4,488 34 1.5
Marketable debt securitiesAustralia 35,194 859 4.9 30,192 810 5.4 26,805 692 5.2 Europe 14,689 129 1.8 16,863 121 1.4 15,058 94 1.3 Other International 13,968 110 1.6 15,521 125 1.6 14,557 124 1.7
Loans and advances - housingAustralia 209,824 6,771 6.5 201,168 6,755 6.7 188,286 6,286 6.7 Europe 21,687 356 3.3 20,849 347 3.3 20,656 344 3.3 Other International 23,267 663 5.7 22,733 658 5.8 21,979 672 6.1
Loans and advances - non-housingAustralia 118,134 4,443 7.5 110,467 4,333 7.8 104,626 4,115 7.9 Europe 36,229 828 4.6 37,598 818 4.3 38,699 833 4.3 Other International 31,352 903 5.8 29,966 858 5.7 29,281 870 6.0
AcceptancesAustralia 41,588 1,579 7.6 44,762 1,764 7.9 48,032 1,845 7.7 Europe 10 - - 12 - - 14 - -
Other interest earning assetsAustralia 2,267 509 n/a 3,833 456 n/a 2,733 407 n/aEurope 14,068 61 n/a 7,250 38 n/a 9,722 38 n/aOther International 4,151 52 n/a 4,941 60 n/a 3,999 29 n/a
Total average interest earning assets and interest revenue by:Australia 424,327 14,466 6.8 407,357 14,455 7.1 384,034 13,605 7.1 Europe 109,011 1,420 2.6 108,134 1,379 2.5 108,286 1,367 2.5 Other International 85,607 1,760 4.1 79,087 1,735 4.4 74,304 1,729 4.7
Total average interest earning assets and interest revenue 618,945 17,646 5.7 594,578 17,569 5.9 566,624 16,701 5.9
Average non-interest earning assets
Investments relating to life insurance business (1)
Australia 65,102 65,808 65,767
Other International 47 47 40
Other assets 64,669 59,314 57,405 Total average non-interest
earning assets 129,818 125,169 123,212
Provision for doubtful debtsAustralia (2,690) (2,961) (3,006)
Europe (584) (705) (866)
Other International (387) (384) (366)Total average assets 745,102 715,697 685,598 Percentage of total average interest
earning assets applicable to international operations 31.4% 31.5% 32.2%
(1) Included within investments relating to life insurance business are interest earning debt securities. The interest earned from these securities is reported in life insurance income, and has therefore been treated as non-interest earning for the purposes of this note. The assets and liabilities held in the statutory funds of the Group’s Australian life insurance business are subject to the restrictions of the Life Insurance Act 1995 (Cth).

Half Year Results
2012
129
Supplementary Information
Average liabilities and interest expense
Half Year Ended Mar 12 Half Year Ended Sep 11 Half Year Ended Mar 11Average balance Interest
Average rate
Average balance Interest
Average rate
Average balance Interest
Average rate
$m $m % $m $m % $m $m %Average interest bearing
liabilitiesDue to other banks
Australia 22,121 503 4.5 21,650 524 4.8 20,753 441 4.3 Europe 13,267 14 0.2 14,111 22 0.3 11,448 12 0.2 Other International 4,781 31 1.3 4,732 53 2.2 3,908 44 2.3
On-demand and short-term depositsAustralia 100,101 1,865 3.7 96,932 1,916 3.9 93,366 1,810 3.9 Europe 25,046 82 0.7 26,821 76 0.6 28,079 78 0.6 Other International 18,185 104 1.1 17,623 95 1.1 14,203 98 1.4
Certificates of depositAustralia 29,088 670 4.6 20,922 518 4.9 18,386 448 4.9 Europe 30,430 76 0.5 31,366 69 0.4 29,228 61 0.4 Other International 23,719 72 0.6 16,617 50 0.6 13,209 46 0.7
Term depositsAustralia 104,025 2,993 5.8 94,268 2,781 5.9 91,734 2,657 5.8 Europe 15,847 174 2.2 15,880 155 1.9 17,104 162 1.9 Other International 28,955 439 3.0 29,956 452 3.0 28,974 467 3.2
Other borrowingsAustralia 3,919 71 3.6 4,865 70 2.9 5,423 137 5.1 Europe 1,410 3 0.4 1,345 1 0.1 254 1 0.8 Other International 16,819 27 0.3 14,592 20 0.3 12,174 17 0.3
Liability on acceptancesAustralia 8,885 356 8.0 10,700 421 7.8 12,696 485 7.7 Europe 10 - - 12 - - 14 - -
Bonds, notes and subordinated debtAustralia 90,702 3,080 6.8 87,938 3,172 7.2 88,964 3,010 6.8 Europe 4,177 29 1.4 5,788 48 1.7 6,837 51 1.5 Other International 9,967 206 4.1 9,186 182 4.0 8,120 156 3.9
Other interest bearing liabilitiesAustralia 274 5 n/a 1,254 4 n/a 238 11 n/aEurope 435 10 n/a 31 - n/a 35 6 n/aOther International 2,505 164 n/a 3,059 185 n/a 1,777 224 n/a
Total average interest bearing liabilities and interest expense by:Australia 359,115 9,543 5.3 338,529 9,406 5.5 331,560 8,999 5.4 Europe 90,622 388 0.9 95,354 371 0.8 92,999 371 0.8 Other International 104,931 1,043 2.0 95,765 1,037 2.2 82,365 1,052 2.6
Total average interest bearing liabilities and interest expense 554,668 10,974 4.0 529,648 10,814 4.1 506,924 10,422 4.1

Half Year Results
2012
130
Supplementary Information
Average liabilitiesHalf Year Ended
Mar 12 Sep 11 Mar 11$m $m $m
Average non-interest bearing liabilitiesDeposits not bearing interest:
Australia 16,904 15,839 14,124
Europe 2,292 2,113 1,996
Other International 2,635 2,697 1,699
Life insurance policy liabilities:Australia 54,582 55,258 55,706
Other International 1 10 -
Other liabilities 72,139 69,438 65,873
Total average non-interest bearing liabilities 148,553 145,355 139,398
Total average liabilities 703,221 675,003 646,322
Average equityOrdinary shares 20,701 19,996 19,017
Trust Preferred Securities 975 975 975
Trust Preferred Securities II 1,014 1,014 1,014
National Income Securities 1,945 1,945 1,945
National Capital Instruments 397 397 397
BNZ Income Securities 380 380 380
BNZ Income Securities 2 203 203 203
Contributed equity 25,615 24,910 23,931 Reserves (1,376) (1,390) (1,044)Retained profits 17,614 17,156 16,374
Parent entity interest 41,853 40,676 39,261
Non-controlling interest in controlled entities 28 18 15
Total average equity 41,881 40,694 39,276
Total average liabilities and equity 745,102 715,697 685,598
Percentage of total average interest bearing liabilities applicable to international operations 35.3% 36.1% 34.6%

Half Year Results
2012
131
Supplementary Information
5. Capital AdequacyUnder APRA’s Prudential Standards, life insurance and funds management activities are de-consolidated from the National Australia Bank Group for the purposes of calculating capital adequacy and excluded from the risk based capital adequacy framework. The intangible component of the investment in these controlled entities is deducted from Tier 1 capital, with the balance of the investment deducted 50% from Tier 1 and 50% from Tier 2 capital. Additionally, any profits from these activities included in the Group’s results are excluded from the determination of Tier 1 capital to the extent that they have not been remitted to the Company.
As at31 Mar 12 30 Sep 11 31 Mar 11
Reconciliation to shareholders’ funds $m $m $mContributed equity 26,090 25,274 24,365 Reserves (1,438) (773) (1,491)Retained profits 17,865 17,667 16,931 Non-controlling interest in controlled entities 38 20 15
Total equity per consolidated balance sheet 42,555 42,188 39,820 Liability-accounted Residual Tier 1 hybrid capital (1) 2,238 2,322 2,242 Treasury shares 939 782 1,040 Eligible deferred fee income 227 266 251 Revaluation reserves (162) (123) (124)General reserve for credit losses (710) (716) (751)Estimated dividend (2,015) (1,937) (1,823)Estimated reinvestment under dividend reinvestment plan and bonus share plan 806 800 720 Deconsolidation of Wealth Management profits (net of dividends) (354) (495) (345)
Adjusted total equity for capital purposes 43,524 43,087 41,030 Banking goodwill (1,321) (1,695) (1,667)Wealth Management goodwill and other intangibles (4,230) (4,253) (4,277)DTA (excluding DTA on the collective provision for doubtful debts) (2) (794) (990) (717)Non qualifying non-controlling interest (13) (13) (12)Capitalised expenses (3) (121) (99) (87)Capitalised software (excluding Wealth Management) (1,275) (1,225) (1,077)Defined benefit superannuation plans surplus (15) (15) (12)Change in own creditworthiness (57) (97) (37)Cash flow hedge reserve (4) (334) (391) (127)Deductions taken 50% from Tier 1 and 50% from Tier 2:
Investment in non-consolidated controlled entities (net of intangible component) (827) (801) (866)Expected loss in excess of eligible provisions (282) (348) (252)Other (142) (85) (161)
Tier 1 capital 34,113 33,075 31,738

Half Year Results
2012
132
Supplementary Information
As at31 Mar 12 30 Sep 11 31 Mar 11
$m $m $mCollective provision for doubtful debts (5) 476 681 682 Revaluation reserves 73 56 56 Perpetual floating rate notes 161 172 162 Eligible dated subordinated debt 5,098 5,658 7,761 Deductions taken 50% from Tier 1 and 50% from Tier 2:
Investment in non-consolidated controlled entities (net of intangible component) (827) (801) (866)Expected loss in excess of eligible provisions (282) (348) (252)Other (142) (85) (161)
Tier 2 capital 4,557 5,333 7,382
Total capital 38,670 38,408 39,120
Risk-weighted assets - credit risk 300,185 308,648 311,625 Risk-weighted assets - market risk 5,277 2,968 3,159 Risk-weighted assets - operational risk 23,810 22,255 21,862 Risk-weighted assets - interest rate risk in the banking book 6,281 7,198 8,565
Total risk-weighted assets 335,553 341,069 345,211
Risk adjusted capital ratios
Tier 1 10.17% 9.70% 9.19%
Total capital 11.52% 11.26% 11.33%
As at31 Mar 12 30 Sep 11 31 Mar 11
Regulatory capital summary $m $m $mFundamental Tier 1 capital 36,371 35,850 33,874 Non-innovative residual Tier 1 capital 2,742 2,742 2,742 Innovative residual Tier 1 capital 4,411 4,495 4,414
Total residual Tier 1 capital 7,153 7,237 7,156 Tier 1 deductions (9,411) (10,012) (9,292)
Tier 1 capital 34,113 33,075 31,738 Tier 2 capital 4,557 5,333 7,382
Total capital 38,670 38,408 39,120
(1) Residual Tier 1 capital that is classified as debt for accounting purposes but qualifies as Tier 1 capital for regulatory purposes. This includes National Capital Instruments issued in September 2006, Residual Tier 1 Convertible Notes issued in September 2008, Residual Tier 1 Stapled Securities issued in September 2008 and September 2009, and Residual Tier 1 Capital Notes issued in September 2009.
(2) APRA requires any excess deferred tax assets (DTA) (excluding DTA on the collective provision for doubtful debts) over deferred tax liabilities to be deducted from Tier 1 capital.(3) Comprises capitalised costs associated with debt raisings and securitisations. Loan origination fees are netted against eligible deferred fee income.(4) For regulatory capital purposes the cash flow hedge reserve is treated on a pre-tax basis.(5) Includes the component of the Group’s collective provision relating to securitisation exposure and assets where RWAs are calculated under the standardised approach.

Half Year Results
2012
133
Supplementary Information
Risk Weighted Assets as at
Exposures as at
31 Mar 12 30 Sep 11 31 Mar 11 31 Mar 12 30 Sep 11 31 Mar 11Basel II $m $m $m $m $m $mCredit risk (1)
IRB approachCorporate (including SME) 109,312 112,620 116,297 193,723 189,882 177,571 Sovereign (2) 1,290 1,170 1,028 43,882 35,881 26,913 Bank (3) 8,179 7,617 6,651 78,607 71,438 58,223 Residential mortgage (3) 56,351 51,620 51,389 270,525 250,960 239,040 Qualifying revolving retail (3) 4,055 4,377 4,186 11,100 10,978 10,693 Retail SME 7,318 8,227 8,985 19,212 19,656 19,706 Other retail 3,652 3,594 3,699 4,591 4,590 4,542
Total IRB approach 190,157 189,225 192,235 621,640 583,385 536,688
Specialised lending (SL) 45,439 41,752 41,762 54,330 49,406 46,842
Standardised approachAustralian and foreign governments 81 76 49 4,248 4,412 2,951 Bank 205 163 269 9,661 10,508 6,753 Residential mortgage 18,823 23,202 21,785 34,963 45,533 41,023 Corporate 29,979 32,863 27,698 30,424 33,202 28,065 Other 3,165 3,618 9,171 3,648 4,095 9,724
Total standardised approach 52,253 59,922 58,972 82,944 97,750 88,516
OtherSecuritisation (4) 4,314 9,049 10,209 16,991 18,203 16,925 Equity 2,006 1,949 1,541 570 501 399 Other (5) 6,016 6,751 6,906 9,540 10,158 9,955
Total other 12,336 17,749 18,656 27,101 28,862 27,279
Total credit risk 300,185 308,648 311,625 786,015 759,403 699,325
Market risk (6) 5,277 2,968 3,159 Operational risk 23,810 22,255 21,862 Interest rate risk in the banking book 6,281 7,198 8,565
Total risk-weighted assets & exposures 335,553 341,069 345,211
(1) Risk Weighted Assets which are calculated in accordance with APRA’s requirements under Basel II, are required to incorporate a scaling factor of 1.06 to assets that are not subject to specific risk weights.
(2) ‘Sovereign’ includes government guaranteed exposures.(3) For IRB approach: ‘Bank’ includes ADIs, overseas banks and non-commercial public sector entities. ‘Residential mortgage’ includes exposures that are partly or fully secured by
residential properties. ‘Qualifying revolving retail’ exposures are revolving, unsecured and unconditionally cancellable (both contractually and in practice), for individuals and not explicitly for business purposes.
(4) Following a change in treatment, the RWA percentages applied to the credit wrapped ABS exposure have been amended resulting in a reduction of RWA by $3.2 billion. The termination of the remaining two sold protection SCDO derivative exposures reduced RWA by $1.5 billion.
(5) ‘Other’ includes non-lending asset exposures.(6) The increase in Market Risk RWA as at 31 March 2012 was predominantly driven by the implementation of the revised Prudential Standard APS 116 ‘Capital Adequacy: Market Risk’
which became effective 1 January 2012.
Wealth Management capital adequacy positionThe Group conservatively manages the capital adequacy and solvency position of its Wealth Management entities separately from that of the banking business by reference to regulatory and internal requirements. The principal National Wealth Management entities are separately regulated and need to meet APRA’s capital adequacy and solvency standards.
In addition, internal Board policy ensures that capital is held in excess of minimum regulatory capital requirements in order to provide a conservative buffer.

Half Year Results
2012
134
Supplementary Information
6. Earnings per ShareHalf Year to
Mar 12 Sep 11 Mar 11Earnings per Share Basic Diluted (1) Basic Diluted Basic DilutedEarnings ($m)Net profit attributable to owners of the Company 2,052 2,052 2,791 2,791 2,428 2,428 Distributions on other equity instruments (124) (124) (130) (130) (132) (132)Potential dilutive adjustments
Interest expense on convertible notes (after tax) - - - 46 - 45
Adjusted earnings 1,928 1,928 2,661 2,707 2,296 2,341
Weighted average ordinary shares (no. ‘000)Weighted average ordinary shares (net of treasury shares) 2,171,827 2,171,827 2,138,995 2,138,995 2,109,971 2,109,971 Potential dilutive ordinary shares
Performance options and performance rights - 1,925 - 1,294 - 1,646 Partly paid ordinary shares - 68 - 97 - 114
Employee share plans - 7,946 - 8,830 - 6,550 Convertible notes - - - 47,519 - 44,207
Total weighted average ordinary shares 2,171,827 2,181,766 2,138,995 2,196,735 2,109,971 2,162,488
Earnings per share (cents) 88.8 88.4 124.4 123.2 108.8 108.3
(1) During the half year ended 31 March 2012, the impact of all convertible notes has not been included in the diluted earnings per share because they were anti-dilutive.
Half Year toMar 12 Sep 11 Mar 11
Cash Earnings per Share Basic Diluted Basic Diluted Basic Diluted
Earnings ($m)Cash earnings - ongoing operations (1) 2,828 2,828 2,792 2,792 2,668 2,668 Distributions on other equity instruments (19) (19) (19) (19) (18) (18)Potential dilutive adjustments
Interest expense on convertible notes (after tax) - 45 - 46 - 45
Adjusted cash earnings 2,809 2,854 2,773 2,819 2,650 2,695
Weighted average ordinary shares (no. ‘000)Weighted average ordinary shares 2,224,966 2,224,966 2,184,494 2,184,494 2,154,891 2,154,891 Potential dilutive weighted average ordinary shares
Performance options and performance rights - 1,925 - 1,294 - 1,646 Partly paid ordinary shares - 68 - 97 - 114
Employee share plans - 7,946 - 8,830 - 6,550 Convertible notes - 46,818 - 47,519 - 44,207
Total weighted average ordinary shares 2,224,966 2,281,723 2,184,494 2,242,234 2,154,891 2,207,408
Cash earnings per share (cents) 126.2 125.1 126.9 125.7 123.0 122.1
(1) For a reconciliation between the Group’s cash earnings and net profit attributable to owners of the Company refer to Note 16 in Section 6.
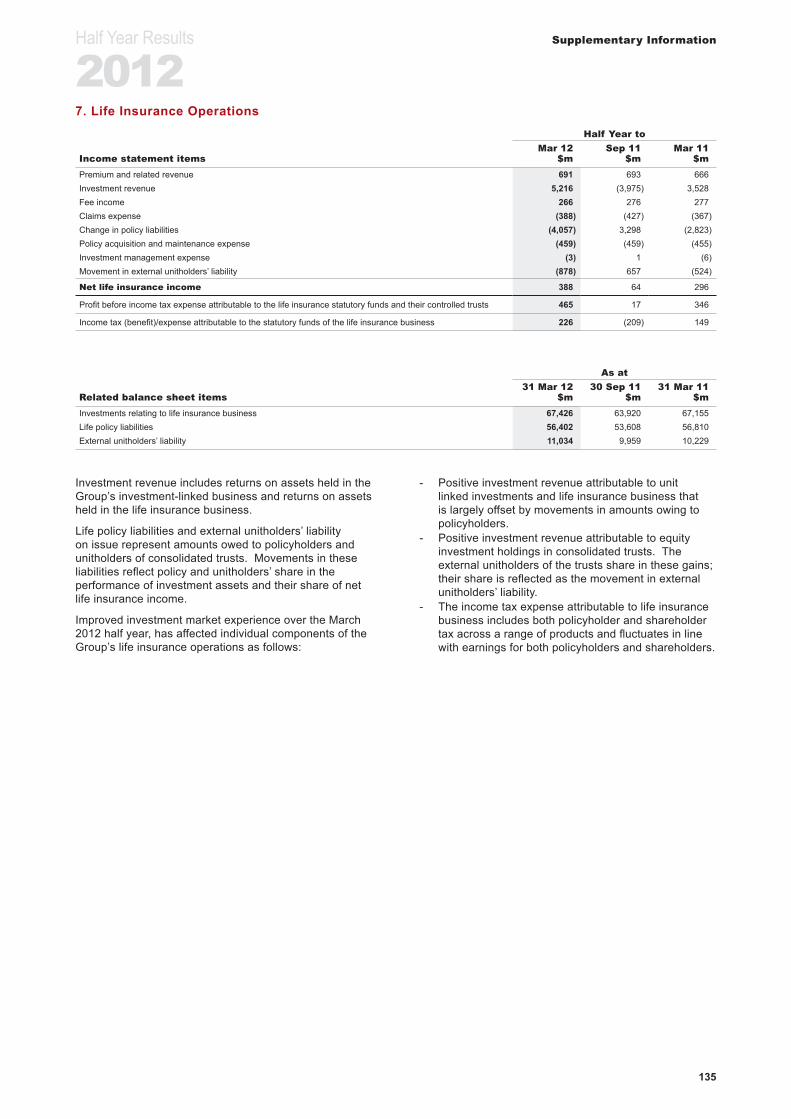
Half Year Results
2012
135
Supplementary Information
7. Life Insurance OperationsHalf Year to
Mar 12 Sep 11 Mar 11Income statement items $m $m $mPremium and related revenue 691 693 666 Investment revenue 5,216 (3,975) 3,528 Fee income 266 276 277 Claims expense (388) (427) (367)Change in policy liabilities (4,057) 3,298 (2,823)Policy acquisition and maintenance expense (459) (459) (455)Investment management expense (3) 1 (6)Movement in external unitholders’ liability (878) 657 (524)
Net life insurance income 388 64 296
Profit before income tax expense attributable to the life insurance statutory funds and their controlled trusts 465 17 346
Income tax (benefit)/expense attributable to the statutory funds of the life insurance business 226 (209) 149
As at31 Mar 12 30 Sep 11 31 Mar 11
Related balance sheet items $m $m $mInvestments relating to life insurance business 67,426 63,920 67,155 Life policy liabilities 56,402 53,608 56,810 External unitholders’ liability 11,034 9,959 10,229
Investment revenue includes returns on assets held in the Group’s investment-linked business and returns on assets held in the life insurance business.
Life policy liabilities and external unitholders’ liability on issue represent amounts owed to policyholders and unitholders of consolidated trusts. Movements in these liabilities reflect policy and unitholders’ share in the performance of investment assets and their share of net life insurance income.
Improved investment market experience over the March 2012 half year, has affected individual components of the Group’s life insurance operations as follows:
- Positive investment revenue attributable to unit linked investments and life insurance business that is largely offset by movements in amounts owing to policyholders.
- Positive investment revenue attributable to equity investment holdings in consolidated trusts. The external unitholders of the trusts share in these gains; their share is reflected as the movement in external unitholders’ liability.
- The income tax expense attributable to life insurance business includes both policyholder and shareholder tax across a range of products and fluctuates in line with earnings for both policyholders and shareholders.

Half Year Results
2012
136
Supplementary Information
8. Other Income Excluding WealthHalf Year to
Mar 12 Sep 11 Mar 11$m $m $m
Gains less losses on financial instruments at fair valueTrading securities 264 677 240 Trading derivatives:
Trading and risk management purposes (83) (1,399) 373 Recovery on SCDO risk mitigation trades 219 - -
Assets, liabilities and derivatives designated in hedge relationships (1) 200 235 (344)Assets and liabilities designated at fair value (280) 375 (475)Impairment of investments - available for sale - - (10)Other (18) (17) 16
Total gains less losses on financial instruments at fair value 302 (129) (200)
Other operating incomeDividend revenue 8 7 10 Gains from sale of investments - available for sale 15 11 9 Gains from sale of property, plant and equipment and other assets - 2 1 Banking fees 454 458 448 Money transfer fees 327 324 323 Fees and commissions 428 423 482 Investment management fees 4 3 3 Fleet management fees 13 13 10 Rentals received on leased vehicle assets 7 9 10 Revaluation (losses)/gains on investment properties (8) 1 3 Other income (149) (32) (17)
Total other operating income 1,099 1,219 1,282
Total other income 1,401 1,090 1,082
(1) Represents hedge ineffectiveness of designated hedging relationships, plus economic hedges of long-term funding that do not meet the requirements for hedge accounting.
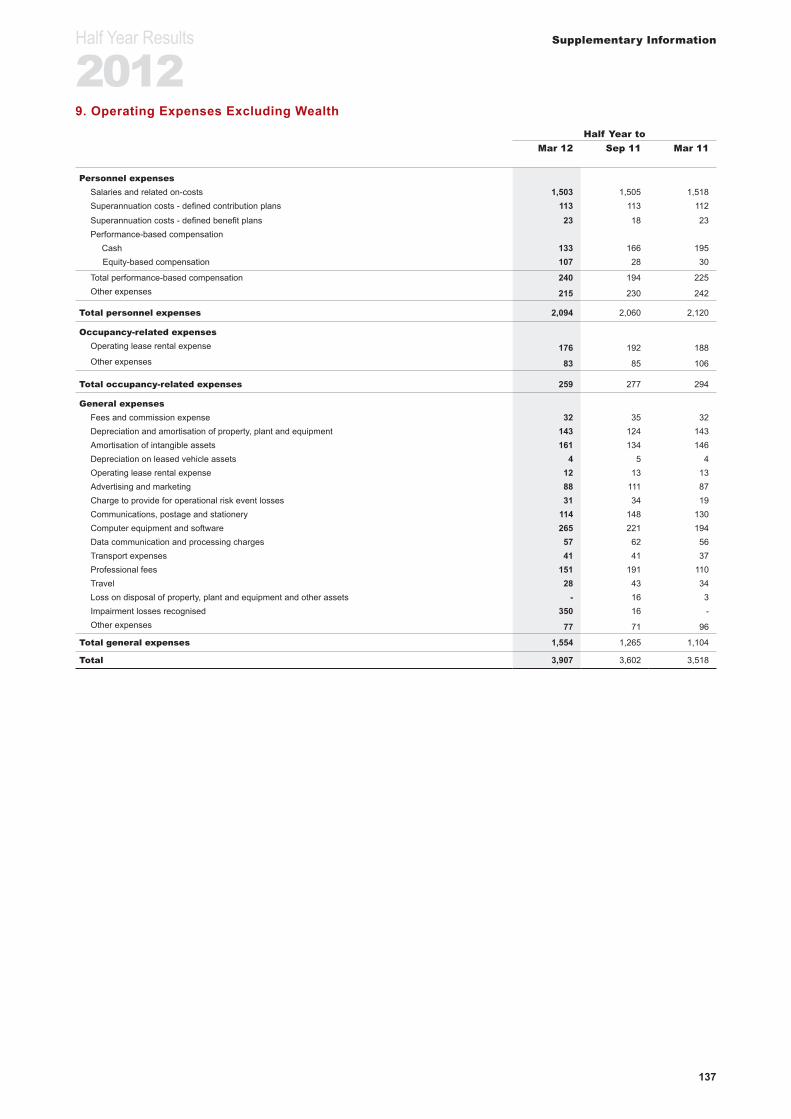
Half Year Results
2012
137
Supplementary Information
9. Operating Expenses Excluding WealthHalf Year to
Mar 12 Sep 11 Mar 11
Personnel expensesSalaries and related on-costs 1,503 1,505 1,518 Superannuation costs - defined contribution plans 113 113 112
Superannuation costs - defined benefit plans 23 18 23 Performance-based compensation
Cash 133 166 195 Equity-based compensation 107 28 30
Total performance-based compensation 240 194 225 Other expenses 215 230 242
Total personnel expenses 2,094 2,060 2,120
Occupancy-related expensesOperating lease rental expense 176 192 188 Other expenses 83 85 106
Total occupancy-related expenses 259 277 294
General expensesFees and commission expense 32 35 32 Depreciation and amortisation of property, plant and equipment 143 124 143 Amortisation of intangible assets 161 134 146 Depreciation on leased vehicle assets 4 5 4 Operating lease rental expense 12 13 13 Advertising and marketing 88 111 87 Charge to provide for operational risk event losses 31 34 19 Communications, postage and stationery 114 148 130 Computer equipment and software 265 221 194 Data communication and processing charges 57 62 56 Transport expenses 41 41 37 Professional fees 151 191 110 Travel 28 43 34 Loss on disposal of property, plant and equipment and other assets - 16 3 Impairment losses recognised 350 16 - Other expenses 77 71 96
Total general expenses 1,554 1,265 1,104
Total 3,907 3,602 3,518

Sup
plem
enta
ry I
nfor
mat
ion
Half Y
ear R
esult
s
2012
138
10. N
et In
tere
st In
com
e / O
ther
Ope
ratin
g In
com
e A
naly
sis
- Who
lesa
le B
anki
ng
Hal
f ye
ar e
nded
Mar
12
Hal
f ye
ar e
nded
Sep
11
Hal
f ye
ar e
nded
Mar
11
Oth
er O
pera
ting
Inc
ome
Oth
er O
pera
ting
Inc
ome
Oth
er O
pera
ting
Inc
ome
NII
Trad
ing
(1)
Fees
&
Com
m.
Oth
er
Inco
me
(1)
Tota
l O
OI
Tota
l R
even
ueN
IITr
adin
g (1
)Fe
es &
C
omm
.O
ther
In
com
e (1
)To
tal
OO
ITo
tal
Rev
enue
NII
Trad
ing
(1)
Fees
&
Com
m.
Oth
er
Inco
me
(1)
Tota
l O
OI
Tota
l R
even
ue$m
$m$m
$m$m
$m$m
$m$m
$m$m
$m$m
$m$m
$m$m
$mR
isk
Inco
me
558
(78)
015
(63)
495
509
(347
)0
12 (3
35)
174
326
900
1010
042
6C
usto
mer
Inco
me
226
346
127
2549
872
419
932
311
548
486
685
196
199
144
3237
557
1
Tota
l Rev
enue
784
268
127
4043
512
1970
8 (2
4)11
560
151
859
522
289
144
4247
599
7
(1)
Exclu
ding i
ntern
al fun
ding t
rans
actio
ns w
ith B
NZIF.

Half Year Results
2012
139
Supplementary Information
11. Asset Funding
As atMar 12 Sep 11 Mar 11 Mar 12 vs
Sep 11 %Mar 12 vs Mar 11 %Customer deposits $m $m $m
On-demand and short-term deposits 142,777 145,700 138,206 (2.0) 3.3Term deposits 152,260 142,243 135,200 7.0 12.6Deposits not bearing interest 22,685 21,324 18,415 6.4 23.2Due to other banks 3,553 7,634 6,052 (53.5) (41.3)Customer deposits at fair value 2,291 2,679 3,007 (14.5) (23.8)
Total customer deposits 323,566 319,580 300,880 1.2 7.5
Wholesale fundingBonds, notes and subordinated debt 96,849 99,768 91,449 (2.9) 5.9Other debt issues 2,399 2,494 2,404 (3.8) (0.2)Preference shares and other contributed equity 4,914 4,914 4,914 - - Certificates of deposit 79,476 75,505 59,823 5.3 32.9Due to other banks 39,983 32,528 31,397 22.9 27.3Other borrowings 10,494 11,814 9,447 (11.2) 11.1Securities sold under repurchase agreements 10,574 6,379 3,220 65.8 largeLiability on acceptances 7,984 10,633 11,774 (24.9) (32.2)Other financial liabilities at fair value 19,065 21,047 16,550 (9.4) 15.2
Total wholesale funding 271,738 265,082 230,978 2.5 17.6
Total funding liabilities 595,304 584,662 531,858 1.8 11.9
Total equity excluding preference shares and other contributed equity 37,641 37,274 34,906 1.0 7.8 Life insurance liabilities (1) 67,436 63,567 67,039 6.1 0.6
Other liabilities 56,462 68,254 55,660 (17.3) 1.4
Total liabilities and equity 756,843 753,757 689,463 0.4 9.8
Wholesale funding by maturityShort-term funding:
Short-term funding of core assets 56,169 50,459 53,193 11.3 5.6Other short-term funding 99,634 96,624 70,150 3.1 42.0
Term funding:less than 1 year residual maturity 20,079 22,459 21,925 (10.6) (8.4)greater than 1 year residual maturity 95,856 95,540 85,710 0.3 11.8
Total wholesale funding by maturity (2) 271,738 265,082 230,978 2.5 17.6
(1) Comprises life policy liabilities and external unitholders’ liability.(2) The overall increase in wholesale funding from March 2011 to March 2012 was mainly attributable to:
(i) an increase in liquid assets, which was funded with short term wholesale funding ($17.7 billion); and (ii) an increase in term funding greater than 1 year residual maturity ($10.1 billion).

Half Year Results
2012
140
Supplementary Information
12. Number of Ordinary SharesHalf Year to
Mar 12 Sep 11 Mar 11No. ‘000 No. ‘000 No. ‘000
Ordinary shares, fully paidBalance at beginning of period 2,201,189 2,169,658 2,133,341 Shares issued:
Dividend reinvestment plan 30,884 30,347 27,273 Bonus share plan 1,082 976 949 Employee share plans 5,435 82 7,901 Executive option plan no. 2 669 100 194
Paying up of partly paid shares 44 26 -
2,239,303 2,201,189 2,169,658
Ordinary shares, partly paid to 25 centsBalance at beginning of period 157 183 183 Paying up of partly paid shares (44) (26) -
113 157 183
Total number of ordinary shares on issue at end of period (including treasury shares) 2,239,416 2,201,346 2,169,841
Less: treasury shares (57,888) (48,390) (42,608)
Total number of ordinary shares on issue at end of period (excluding treasury shares) 2,181,528 2,152,956 2,127,233
13. Exchange Rates
Income Statement - average Balance Sheet - spotHalf Year to As at
Mar 12 Sep 11 Mar 11 Mar 12 Sep 11 Mar 11British Pounds 0.6577 0.6519 0.6261 0.6509 0.6268 0.6417 Euros 0.7776 0.7405 0.7311 0.7791 0.7206 0.7304 United States Dollars 1.0334 1.0563 0.9962 1.0406 0.9764 1.0335 New Zealand Dollars 1.2960 1.2955 1.3161 1.2689 1.2756 1.3578
14. Australian Life Company Margins
Half Year toSources of Operating Profit from Australian Mar 12 Sep 11 Mar 11 Mar 12 v Mar 12 vLife Companies life insurance funds $m $m $m Sep 11 % Mar 11 %Life company - planned profit margins 151 156 153 (3.2) (1.3)Life company - experience profit 35 (8) 20 large 75.0
Life company operating margins (1) 186 148 173 25.7 7.5 IoRE (after tax) (2) 51 73 30 (30.1) 70.0
Net profit of life insurance funds after non-controlling interest 237 221 203 7.2 16.7
(1) Reflects operating profit of all business types (investment or insurance) written through life insurance funds.(2) Includes investment earnings on shareholders’ retained profits and capital from life businesses after non-controlling interest of $56 million (Half Year September 2011 $25 million, Half
Year March 2011 $52 million) and IoRE discount rate variation of ($5 million) (Half Year September 2011 $48 million, Half Year March 2011 ($22 million)), IoRE attributable to non life insurance funds of ($26 million) (Half Year September 2011 ($24 million), Half Year March 2011 ($23 million)) is excluded.
15. ASX Appendix 4DCross Reference Index PageResults for Announcement to the Market (4D Item 2) Inside front coverDividends (4D Item 5) 94Dividend dates (4D Item 5) Inside front coverDividend Reinvestment Plan (4D Item 6) 94Net tangible assets per ordinary share (4D Item 3) 95Details of entities over which control has been gained or lost (4D Item 4) 106-107Details of associates and joint venture entities (4D Item 7) 107

Half Y
ear R
esult
s
2012
141
141
Sup
plem
enta
ry I
nfor
mat
ion
16. R
econ
cilia
tion
betw
een
Sta
tuto
ry N
et P
rofit
and
Cas
h E
arni
ngs
Hal
f Ye
ar e
nded
Sta
tuto
ry
Net
P
rofit
NA
B
Wea
lth
adj.
(1)
Dis
tri-
buti
ons
Trea
sury
sh
ares
Fair
val
ue
and
hedg
e in
effe
c.
IoR
E
disc
. ra
te
UK
Pay
men
t P
rote
ctio
n In
sura
nce
prov
isio
n
Hed
ging
co
sts
on
SC
DO
as
sets
Liti
gati
on
expe
nse
Sof
twar
e im
pair
men
tG
oodw
ill
impa
irm
ent
Am
orti
sati
on
of a
cqui
red
inta
ngib
le
asse
ts
Due
di
ligen
ce,
acqu
isit
ion
and
inte
grat
ion
cost
sC
ash
Ear
ning
s
31 M
arch
201
2$m
$m$m
$m$m
$m$m
$m$m
$m$m
$m$m
$m
Net
inte
rest
inco
me
6,6
72
36
- -
- -
- -
- -
- -
- 6
,708
N
et li
fe in
sura
nce
inco
me
388
(4
98)
- 1
03
- 7
-
- -
- -
- -
- O
ther
ope
ratin
g in
com
e 1
,900
(4
32)
- -
(151
) -
182
1
41
- -
- -
- 1
,640
N
AB
Wea
lth n
et o
pera
ting
inco
me
- 7
60
- -
- -
- -
- -
- -
- 7
60
Net
ope
ratin
g in
com
e 8
,960
(1
34)
- 1
03
(151
) 7
1
82
141
-
- -
- -
9,1
08
Ope
ratin
g ex
pens
es
(4,4
02)
(56)
- -
- -
- -
32
54
295
6
5 6
0 (3
,952
)
Ope
ratin
g pr
ofit p
re-c
harg
e to
pro
vide
fo
r dou
btfu
l deb
ts 4
,558
(1
90)
- 1
03
(151
) 7
1
82
141
3
2 5
4 2
95
65
60
5,1
56
Cha
rge
to p
rovi
de fo
r dou
btfu
l deb
ts (2
) (1
,321
) -
- -
190
-
- -
- -
- -
- (1
,131
)
Ope
ratin
g pr
ofit b
efor
e ta
x 3
,237
(1
90)
- 1
03
39
7
182
1
41
32
54
295
6
5 6
0 4
,025
In
com
e ta
x (e
xpen
se)/b
enefi
t (1
,183
) 1
59
- (1
1) 1
(2
) -
(42)
(8)
- -
(14)
(21)
(1,1
21)
Ope
rati
ng p
rofit
bef
ore
dist
ribu
tion
s an
d no
n-co
ntro
lling
inte
rest
2,0
54
(31)
- 9
2 4
0 5
1
82
99
24
54
295
5
1 3
9 2
,904
N
et p
rofit
- no
n-co
ntro
lling
inte
rest
(2)
1
- -
- -
- -
- -
- -
- (1
)Io
RE
(afte
r tax
) -
30
- -
- -
- -
- -
- -
- 3
0 D
istri
butio
ns -
- (1
05)
- -
- -
- -
- -
- -
(105
)
Net
pro
fit a
ttri
buta
ble
to o
wne
rs
of t
he C
ompa
ny 2
,052
-
(105
) 9
2 4
0 5
1
82
99
24
54
295
5
1 3
9 2
,828
(1)
Refer
to N
ote 17
in S
ectio
n 6 fo
r fur
ther d
etails
rega
rding
the N
AB W
ealth
adjus
tmen
t.(2
)Inc
ludes
prov
ision
s ass
ociat
ed w
ith th
e defa
ult of
fully
hedg
ed S
CDO
asse
ts, w
here
for s
tatuto
ry pu
rpos
es th
e offs
etting
reco
very
is re
cord
ed as
othe
r ope
ratin
g inc
ome.
For
cash
earn
ings t
hese
items
are r
epor
ted ne
t.

Half Y
ear R
esult
s
2012
142
Sup
plem
enta
ry I
nfor
mat
ion
Sup
plem
enta
ry I
nfor
mat
ion
Hal
f Ye
ar e
nded
Sta
tuto
ry
Net
Pro
fit
NA
B
Wea
lth
adj.
(1)
Dis
tri-
buti
ons
Trea
sury
sh
ares
Fair
val
ue
and
hedg
e in
effe
c.Io
RE
dis
c.
rate
UK
P
aym
ent
Pro
tect
ion
Insu
ranc
e pr
ovis
ion
Hed
ging
co
sts
on
SC
DO
as
sets
Liti
gati
on
expe
nse
Am
orti
sati
on
of in
tang
ible
as
sets
Due
di
ligen
ce,
acqu
isit
ion
and
inte
grat
ion
cost
sC
ash
Ear
ning
s30
Sep
tem
ber
2011
$m$m
$m$m
$m$m
$m$m
$m$m
$m$m
Net
inte
rest
inco
me
6,7
55
33
- -
- -
- -
- -
- 6
,788
N
et li
fe in
sura
nce
inco
me
64
99
- (9
5) -
(68)
- -
- -
- -
Oth
er o
pera
ting
inco
me
1,7
37
(627
) -
- (1
94)
- 1
56
219
-
- -
1,2
91
NA
B W
ealth
net
ope
ratin
g in
com
e -
716
-
- -
- -
- -
- -
716
Net
ope
ratin
g in
com
e 8
,556
2
21
- (9
5) (1
94)
(68)
156
2
19
- -
- 8
,795
O
pera
ting
expe
nses
(4
,248
) 7
3 -
- -
- -
- 7
5
2 1
33
(3,9
83)
Ope
ratin
g pr
ofit p
re c
harg
e to
pro
vide
for d
oubt
ful
debt
s 4
,308
2
94
- (9
5) (1
94)
(68)
156
2
19
7
52
133
4
,812
C
harg
e to
pro
vide
for d
oubt
ful d
ebts
(827
) -
- -
(7)
- -
- -
- -
(834
)
Ope
ratin
g pr
ofit b
efor
e ta
x 3
,481
2
94
- (9
5) (2
01)
(68)
156
2
19
7
52
133
3
,978
In
com
e ta
x (e
xpen
se)/b
enefi
t (6
90)
(295
) -
15
55
20
(39)
(92)
(3)
(11)
(36)
(1,0
76)
Ope
rati
ng p
rofit
bef
ore
dist
ribu
tion
s an
d no
n-co
ntro
lling
inte
rest
2,7
91
(1)
- (8
0) (1
46)
(48)
117
1
27
4
41
97
2,9
02
Net
pro
fit -
non-
cont
rolli
ng in
tere
st -
- -
- -
- -
- -
- -
- Io
RE
(afte
r tax
) -
1
- -
- -
- -
- -
- 1
D
istri
butio
ns -
- (1
11)
- -
- -
- -
- -
(111
)
Net
pro
fit a
ttri
buta
ble
to o
wne
rs o
f th
e C
ompa
ny 2
,791
-
(111
) (8
0) (1
46)
(48)
117
1
27
4
41
97
2,7
92
(1)
Refer
to N
ote 17
in S
ectio
n 6 fo
r fur
ther d
etails
rega
rding
the N
AB W
ealth
adjus
tmen
t.

142
Half Y
ear R
esult
s
2012
143
143
Sup
plem
enta
ry I
nfor
mat
ion
Hal
f Ye
ar e
nded
Sta
tuto
ry
Net
Pro
fit
NA
B
Wea
lth
adj.
(1)
Dis
tri-
buti
ons
Trea
sury
sh
ares
Fair
val
ue
and
hedg
e in
effe
c.Io
RE
dis
c.
rate
Am
orti
sati
on
of a
cqui
red
inta
ngib
le
asse
ts
ExC
aps
taxa
tion
as
smt.
Due
di
ligen
ce,
acqu
isit
ion
and
inte
grat
ion
cost
sC
ash
Ear
ning
s31
Mar
ch 2
011
$m$m
$m$m
$m$m
$m$m
$m$m
Net
inte
rest
inco
me
6,2
79
25
- -
- -
- -
- 6
,304
N
et li
fe in
sura
nce
inco
me
296
(3
74)
- 4
7 -
31
- -
- -
Oth
er o
pera
ting
inco
me
1,7
12
(519
) -
- 5
32
- -
- -
1,7
25
NA
B W
ealth
net
ope
ratin
g in
com
e -
770
-
- -
- -
- -
770
Net
ope
ratin
g in
com
e 8
,287
(9
8) -
47
532
3
1 -
- -
8,7
99
Ope
ratin
g ex
pens
es
(4,1
17)
(22)
- -
- -
52
- 9
6 (3
,991
)
Ope
ratin
g pr
ofit p
re c
harg
e to
pro
vide
for d
oubt
ful d
ebts
4,1
70
(120
) -
47
532
3
1 5
2 -
96
4,8
08
Cha
rge
to p
rovi
de fo
r dou
btfu
l deb
ts (9
23)
- -
- (6
5) -
- -
- (9
88)
Ope
ratin
g P
rofit
bef
ore
tax
3,2
47
(120
) -
47
467
3
1 5
2 -
96
3,8
20
Inco
me
tax
(exp
ense
)/ben
efit
(818
) 9
1 -
(6)
(140
) (9
) (1
1) (1
42)
(31)
(1,0
66)
Ope
rati
ng p
rofit
bef
ore
dist
ribu
tion
s an
d no
n-co
ntro
lling
inte
rest
2,4
29
(29)
- 4
1 3
27
22
41
(142
) 6
5 2
,754
N
et p
rofit
- no
n-co
ntro
lling
inte
rest
(1)
- -
- -
- -
- -
(1)
IoR
E (a
fter t
ax)
- 2
9 -
- -
- -
- -
29
Dis
tribu
tions
- -
(114
) -
- -
- -
- (1
14)
Net
pro
fit a
ttri
buta
ble
to o
wne
rs o
f th
e C
ompa
ny 2
,428
-
(114
) 4
1 3
27
22
41
(142
) 6
5 2
,668
(1)
Refer
to N
ote 17
in S
ectio
n 6 fo
r fur
ther d
etails
rega
rding
the N
AB W
ealth
adjus
tmen
t.

Half Year Results
2012
144
Supplementary Information
17. NAB Wealth Reconciling ItemsLife Reclassification (a)
Half Year endedCash
IoRE (i)
Policy-holder tax (ii)
Other NLII reclass-
ification (iii)
Non-life reclas-
sification (b) OtherNAB
Wealth adj.31 March 2012 $m $m $m $m $m $mNet interest income 37 - - (6) 5 36 Net life insurance income (75) (126) (298) - 1 (498)Other operating income - - 32 (461) (3) (432)NAB Wealth net operating income - - 427 333 - 760
Net operating income (38) (126) 161 (134) 3 (134)Operating expenses - - (184) 134 (6) (56)
Operating profit pre-charge to provide for doubtful debts (38) (126) (23) - (3) (190)Charge to provide for doubtful debts 1 - (7) - 6 -
Operating profit before tax (37) (126) (30) - 3 (190)Income tax expense 7 126 30 (4) 159
Operating profit before distributions and non-controlling interest (30) - - - (1) (31)
Net profit - non-controlling interest - - - - 1 1 IoRE (after tax) 30 - - - - 30 Distributions - - - - - -
Net profit attributable to owners of the Company - - - - - -
Life Reclassification (a)
Half Year endedCash
IoRE (i)
Policy-holder tax (ii)
Other NLII reclass-
ification (iii)
Non-life reclass-
ification (b) OtherNAB
Wealth adj.30 September 2011 $m $m $m $m $m $mNet interest income 35 - - (2) - 33 Net life insurance income (46) 318 (173) - - 99 Other operating income - - 23 (650) - (627)NAB Wealth net operating income - - 323 386 7 716
Net operating income (11) 318 173 (266) 7 221 Operating expenses - - (185) 266 (8) 73
Operating profit pre-charge to provide for doubtful debts (11) 318 (12) - (1) 294 Charge to provide for doubtful debts - - - - - -
Operating profit before tax (11) 318 (12) - (1) 294 Income tax expense 10 (318) 12 - 1 (295)
Operating profit before distributions and non-controlling interest (1) - - - - (1)
Net profit - non-controlling interest - - - - - - IoRE (after tax) 1 - - - - 1 Distributions - - - - - -
Net profit attributable to owners of the Company - - - - - -

Half Year Results
2012
145
Supplementary Information
Life Reclassification (a)
Half Year endedCash
IoRE (i)
Policy-holder tax (ii)
Other NLII reclass-
ification (iii)
Non-life reclass-
ification (b) OtherNAB
Wealth adj.31 March 2011 $m $m $m $m $m $mNet interest income 32 - - (7) - 25 Net life insurance income (70) (64) (240) - - (374)Other operating income - - 21 (540) - (519)NAB Wealth net operating income - - 392 385 (7) 770
Net operating income (38) (64) 173 (162) (7) (98)Operating expenses - - (184) 162 - (22)
Operating profit pre-charge to provide for doubtful debts (38) (64) (11) - (7) (120)Charge to provide for doubtful debts - - - - - -
Operating profit before tax (38) (64) (11) - (7) (120)Income tax expense 9 64 11 - 7 91
Operating profit before distributions and non-controlling interest (29) - - - - (29)
Net profit - non-controlling interest - - - - - - IoRE (after tax) 29 - - - - 29 Distributions - - - - - -
Net profit attributable to owners of the Company - - - - - -
(a) Reclassification of Net Life Insurance Income (NLII).NLII is a statutory disclosure only and as such all items shown under NLII are reclassified for management reporting purposes. A summary of the respective NLII adjustments is provided below: (i) Cash IoRE: Interest on Retained Earnings is a separately disclosed item for management reporting purposes. Under the statutory view, components of IoRE are disclosed in the following
lines: - Net Interest income: this is the net interest cost of subordinated and senior debt raised for capital management purposes. - NLII: includes interest earnings on insurance VARC (Value of Acquisition Recovery Components) and investment earnings on surplus assets.(ii) Policyholder tax reclassification: The NAB Wealth investment linked business is written within statutory funds. As a result NLII includes both shareholder and policyholder amounts for statutory reporting
purposes. For management reporting purposes only the shareholder component is disclosed. From a statutory reporting disclosure point of view all policyholder amounts offset within the NLII disclosure, except for tax on the investment-linked business. As a result there is a reclassification between NLII and tax for these amounts.
(iii) Other NLII Reclassification: These are all other components of NLII, not adjusted for above, which are included in NAB Wealth net operating income, operating expenses and income tax expense in the
management view. These include premiums, investment earnings, claims, change in policy liabilities, policy acquisition and maintenance costs and investments management costs.
(b) Non-Life Reclassifications:Non-life net interest income, other operating income and volume related expenses (included in operating expenses) are reclassified to NAB Wealth net operating income for management reporting purposes.

Half Y
ear R
esult
s
2012
146
Sup
plem
enta
ry I
nfor
mat
ion
Sup
plem
enta
ry I
nfor
mat
ion
18. D
ivis
iona
l Per
form
ance
Sum
mar
y E
xclu
ding
For
eign
Cur
renc
y M
ovem
ents
Hal
f ye
ar e
nded
Bus
ines
s B
anki
ngP
erso
nal
Ban
king
Who
lesa
le
Ban
king
NA
B
Wea
lth
NZ
B
anki
ngU
K
Ban
king
GW
B
Spe
cial
ised
G
roup
A
sset
s
Cor
pora
te
Func
tion
s &
Oth
er (1
)D
istr
ibut
ions
&
Elim
inat
ions
Gro
up
Cas
h E
arni
ngs
31 M
arch
201
2 at
31
Mar
ch 2
011
FX r
ate
$m$m
$m$m
$m$m
$m$m
$m$m
$mN
et in
tere
st in
com
e 2
,530
1
,445
7
98
163
5
40
718
1
37
56
369
-
6,7
56
Oth
er o
pera
ting
inco
me
517
2
86
438
1
8 1
77
228
3
7 2
3 (3
1) (4
8) 1
,645
N
AB
Wea
lth n
et o
pera
ting
inco
me
- -
- 7
60
- -
- -
- -
760
Net
ope
ratin
g in
com
e 3
,047
1
,731
1
,236
9
41
717
9
46
174
7
9 3
38
(48)
9,1
61
Ope
ratin
g ex
pens
es (8
75)
(902
) (4
70)
(571
) (2
85)
(556
) (8
7) (1
9) (2
68)
48
(3,9
85)
Und
erly
ing
profi
t 2
,172
8
29
766
3
70
432
3
90
87
60
70
- 5
,176
(C
harg
e to
pro
vide
for)
/ben
efit f
or b
ad a
nd d
oubt
ful d
ebts
(372
) (1
69)
(50)
(5)
(25)
(451
) (1
4) (7
5) -
- (1
,161
)
Cas
h ea
rnin
gs b
efor
e ta
x, Io
RE
, dis
tribu
tion
and
non-
cont
rolli
ng in
tere
st 1
,800
6
60
716
3
65
407
(6
1) 7
3 (1
5) 7
0 -
4,0
15
Inco
me
tax
(exp
ense
)/ben
efit
(536
) (1
96)
(191
) (1
04)
(114
) 2
1 (2
3) -
24
- (1
,119
)
Cas
h ea
rnin
gs b
efor
e Io
RE
, dis
trib
utio
n an
d no
n-co
ntro
lling
in
tere
st 1
,264
4
64
525
2
61
293
(4
0) 5
0 (1
5) 9
4 -
2,8
96
Net
pro
fit -
non-
cont
rolli
ng in
tere
st -
- -
(1)
- -
- -
- -
(1)
IoR
E -
- -
30
- -
- -
- -
30
Dis
tribu
tions
- -
- -
- -
- -
- (1
07)
(107
)
Cas
h ea
rnin
gs/(d
efici
t) 1
,264
4
64
525
2
90
293
(4
0) 5
0 (1
5) 9
4 (1
07)
2,8
18
(1)
Corp
orate
Fun
ction
s & O
ther in
clude
s Gro
up F
undin
g, Gr
oup B
usine
ss S
ervic
es, o
ther s
uppo
rting u
nits a
nd A
sia B
ankin
g.

146
Half Y
ear R
esult
s
2012
147
147
Sup
plem
enta
ry I
nfor
mat
ion
Hal
f ye
ar e
nded
Bus
ines
s B
anki
ngP
erso
nal
Ban
king
Who
lesa
le
Ban
king
NA
B
Wea
lth
NZ
B
anki
ngU
K
Ban
king
Spe
cial
ised
G
roup
A
sset
sG
WB
Cor
pora
te
Func
tion
s &
Oth
er (1
)D
istr
ibut
ions
&
Elim
inat
ions
Gro
up
Cas
h E
arni
ngs
31 M
arch
201
2 at
30
Sep
tem
ber
2011
FX
rat
e$m
$m$m
$m$m
$m$m
$m$m
$mN
et in
tere
st in
com
e 2
,530
1
,445
7
84
163
5
49
690
5
4 1
29
364
-
6,7
08
Oth
er o
pera
ting
inco
me
517
2
86
436
1
8 1
80
219
3
8 3
5 (3
3) (4
7) 1
,649
N
AB
Wea
lth n
et o
pera
ting
inco
me
- -
- 7
60
- -
- -
- -
760
Net
ope
ratin
g in
com
e 3
,047
1
,731
1
,220
9
41
729
9
09
92
164
3
31
(47)
9,1
17
Ope
ratin
g ex
pens
es (8
75)
(902
) (4
65)
(571
) (2
89)
(534
) (1
8) (8
2) (2
65)
47
(3,9
54)
Und
erly
ing
profi
t 2
,172
8
29
755
3
70
440
3
75
74
82
66
- 5
,163
(C
harg
e to
pro
vide
for)
/ben
efit f
or b
ad a
nd d
oubt
ful d
ebts
(372
) (1
69)
(47)
(5)
(26)
(433
) (7
2) (1
3) -
- (1
,137
)
Cas
h ea
rnin
gs b
efor
e ta
x, Io
RE
, dis
tribu
tion
and
non-
cont
rolli
ng in
tere
st 1
,800
6
60
708
3
65
414
(5
8) 2
6
9 6
6 -
4,0
26
Inco
me
tax
(exp
ense
)/ben
efit
(536
) (1
96)
(189
) (1
04)
(116
) 2
0 (1
) (2
2) 2
4 -
(1,1
20)
Cas
h ea
rnin
gs b
efor
e Io
RE
, dis
trib
utio
n an
d no
n-co
ntro
lling
in
tere
st 1
,264
4
64
519
2
61
298
(3
8) 1
4
7 9
0 -
2,9
06
Net
pro
fit -
non-
cont
rolli
ng in
tere
st -
- -
(1)
- -
- -
- -
(1)
IoR
E -
- -
30
- -
- -
- -
30
Dis
tribu
tions
- -
- -
- -
- -
- (1
04)
(104
)
Cas
h ea
rnin
gs/(d
efici
t) 1
,264
4
64
519
2
90
298
(3
8) 1
4
7 9
0 (1
04)
2,8
31
(1)
Corp
orate
Fun
ction
s & O
ther in
clude
s Gro
up F
undin
g, Gr
oup B
usine
ss S
ervic
es, o
ther s
uppo
rting u
nits a
nd A
sia B
ankin
g.

Half Year Results
2012
148
Supplementary Information
This page has been left blank intentionally.

Half Year Results
2012
149
Glossary of Terms
Section 7
Glossary of Terms

Half Year Results
2012
150
Glossary of Terms
Term DescriptionABCP Asset-backed commercial paper.ABS Asset-backed securities.
Alt-A In USA, residential mortgage loans advanced to borrowers falling just outside prime lending criteria, but without the more significant credit or debt servicing limitations seen in subprime lending.
APRA Australian Prudential Regulation Authority.ASX Australian Securities Exchange.ATO Australian Taxation Office.Auto / Equipment Automotive and equipment receivables.Average assets Represents the average of assets over the period adjusted for disposed operations.Banking Banking operations include the Group’s:
- Retail, business, institutional and agri-business banking operations operating in Business Banking, Personal Banking, UK Banking, NZ Banking, NAB Wealth and Great Western Bank.- Global Capital Markets and Treasury, Specialised Finance, Financial Institutions business within Wholesale Banking.
- Asian operations and Group Funding within Corporate Functions and Other.Banking Cost to Income Ratio Represents banking operating expenses (before inter-segment eliminations) plus the operating expenses of Specialised
Group Assets (SGA) as a percentage of total banking operating revenue (before inter-segment eliminations) inclusive of the operating revenue of SGA.
Cash earnings Is a non IFRS key performance measure that excludes certain items within the calculation of net profit attributable to owners of the Company. It is also a key performance measure used by the investment community, as well as by those Australian peers of the Group with a similar business portfolio. These specified items are excluded in order to better reflect what NAB considers to be the underlying performance of the Group. Many of the adjustments below are more effectively applied on a consolidated basis and therefore at a divisional level cash earnings reflects the performance of the business segment as it is managed. It does not refer to, or in any way purport to represent the cash flows, funding or liquidity position of the Group. It does not refer to any amount represented on a cash flow statement. Cash earnings is defined as:
Net profit attributable to owners of the CompanyAdjusted for:
DistributionsTreasury sharesFair value and hedge ineffectivenessIoRE discount rate variationUK Payment Protection Insurance provisionLitigation expenseHedging costs on SCDO assetsGoodwill impairment
Software impairmentRefund of tax on exchangeable capital units (ExCaps) settlementAmortisation of acquired intangible assetsDue diligence, acquisition and integration costs
Cash earnings on risk-weighted assets Calculated as cash earnings (annualised) divided by average risk-weighted assets. Average risk-weighted assets are calculated as the average of the current and previous two quarters’ risk-weighted assets.
Cash earnings per share - basic Calculated as cash earnings (annualised) divided by the weighted average number of shares adjusted to include treasury shares.
Cash earnings per share - diluted Cash earnings (annualised), adjusted for interest expense on exchangeable capital units, divided by the weighted average number of ordinary shares, adjusted to include treasury shares.
Cash return on equity Calculated as cash earnings divided by average shareholders’ equity, excluding non-controlling interests and other equity instruments and adjusted for treasury shares.
CDO Collateralised Debt Obligation.CDS Credit Default Swap.CLO Collateralised Loan Obligations.CMBS Commercial Mortgage-Backed Securities.Conduit SPE used to fund assets through the issuance of ABCP or MTN.Core Assets Represents loans and advances to customers and banks (including leases and acceptances), investments held to
maturity, other financial assets at fair value, fixed assets and other assets; net of other liabilities.Credit wrapped ABS Securities backed by monoline-guaranteed portfolios of ABS.Credit wrapped bonds Monoline-guaranteed infrastructure, utility and energy related corporate bonds.Customer Deposits Deposits (Interest Bearing, Non-Interest Bearing, Term Deposits, Central Bank Deposits).Customer Funding Index (CFI) Customer Deposits divided by Core Assets.Disposed operations Are operations that will not form part of the continuing Group. These include operations sold and those that have been
announced to the market that have yet to reach completion. This may differ from the treatment for statutory accounting purposes but facilitates a like-for-like comparison.
Distributions Payments to holders of other equity instruments issues such as National Income Securities, Trust Preferred Securities, Trust Preferred Securities II and National Capital Instruments.
Dividend Payout Ratio Dividends paid on ordinary shares divided by cash earnings per share.Due diligence, acquisition and integration costs
Represent costs relating to due diligence on business acquisition and disposal activities and costs associated with integrating acquisitions with the NAB operating model and reporting platforms.
Earnings Per Share Calculated in accordance with the requirements of AASB 133 “Earnings per Share.”ExCaps taxation assessment Represents the reduction, in the year ended 30 September 2009, of the carrying value of the $309 million receivable
due from the Australian Taxation Office in relation to its exchangeable capital units (ExCaps) to nil. The ATO disallowed the Group’s objections to the ExCaps taxation assessments. Subsequently the Group settled and obtained a refund of $142 million previously paid to the Australian Taxation Office in relation to the ExCaps assessment.

Half Year Results
2012
151
Glossary of Terms
Fair value Fair value is defined as the amount for which an asset could be exchanged, or a liability settled, between willing parties in an arms length transaction.
Fair value and hedge ineffectiveness Represents volatility attributable to the Group’s application of the fair value option, ineffectiveness from designated accounting and economic hedge relationships and economic hedges of significant approved funding activities where hedge accounting has not been applied.
FDIC Federal Deposit Insurance Corporation.FSB Financial Stability Board.FSCS United Kingdom Financial Services Compensation Scheme.Full time equivalent employees (FTEs) Includes all full time staff, part time, fixed term and casual staff equivalents, as well as agency temps and external
contractors either self employed or employed by a third party agency. Note: This does not include consultants, IT professional services, outsourced service providers and non executive directors.
GAAP Represents generally accepted accounting principles.GRCL calculation methodology The general reserve for credit losses (GRCL) is an estimate of the reasonable and prudent expected credit losses over
the remaining life of the portfolio and on non-defaulted assets. The GRCL is calculated as a collective provision for doubtful debts, excluding securitisation and provisions on default no-loss assets. The difference between the GRCL and accounting collective provisions is covered with an additional top-up, created through a transfer from retained earnings to reflect losses expected as a result of future events that are not recognised in the Group’s collective provision for accounting purposes.
GSJBW Goldman Sachs JBWere.GWB Great Western Bank.Impaired Assets Consist of:
- retail loans (excluding unsecured portfolio managed facilities) which are contractually past due 90 days with security insufficient to cover principal and arrears of interest revenue;- non retail loans which are contractually past due and there is sufficient doubt about the ultimate collectability of principal and interest; and- impaired off-balance sheet credit exposures where current circumstances indicate that losses may be incurred. Unsecured portfolio managed facilities are also classified as impaired assets when they become 180 days past due (if not written off).
Insurance Includes the provision of personal and Group insurance by NAB Wealth. Investments Includes funds managed in the provision of investment and superannuation solutions by NAB Wealth.IoRE Investment earnings (net of tax) on shareholders retained profits and capital from life businesses, net of capital funding
costs (IoRE) is comprised of three items:- investment earnings on surplus assets which are held in the Statutory Funds to meet capital adequacy requirements under the Life Insurance Act 1995 (Cth).- interest on deferred acquisition costs (net of reinsurance) included in insurance policy liabilities resulting from the unwind of discounting.- less the borrowing costs of any capital funding initiatives.
IoRE discount rate variation The profit impact of a change in value of deferred acquisition costs (net of reinsurance) included in insurance policy liabilities resulting from a movement in the inflation adjusted risk free discount rate.
IRB approach The internal ratings based approach refers to the processes employed by the Group to estimate credit risk. This is achieved through the use of internally developed models to assess the potential credit losses using the outputs from the probability of default, loss given default and exposure at default models.
‘Jaws’ The difference between the percentage growth in revenue on the preceding period and the percentage growth in the expenses on the preceding period, calculated on a cash earnings basis.
Leveraged loans CLOs CLOs backed by pools of broadly syndicated commercial bank loans.Litigation expense Represents litigation expenses in relation to non-recurring litigation matters.LMI Lenders Mortgage Insurance.Marketable debt securities Comprises trading securities, investments - available for sale and investments - held to maturity.Monolines Monoline Insurers (monoline insurance companies) guarantee the timely payment of interest and repayment of principal
in case an issuer of the guaranteed instrument defaults. They are so named because they provide service to only one industry.
MTN Medium Term Notes.Net interest margin Net interest income as a percentage of average interest earning assets.Net profit attributable to owners of the Company
Represents the Group’s statutory profit after tax and reflects the amount of net profit that is attributable to owners.
Net profit attributable to non-controlling interest
Reflects the allocation of profit to non-controlling interests in the Group, and is adjusted from net profit to reflect the amount of net profit that is attributable to owners.
Net Tangible Assets per Ordinary Share Net assets excluding intangible assets, non-controlling interests, preference shares and other equity instruments divided by ordinary shares on issue at the end of the period.
Non-conforming residential mortgages In Australia and UK, residential mortgage loans that are advanced to borrowers who do not generally meet prime lending guidelines and LMI eligibility.
Non-LMI prime residential mortgage Prime residential mortgages but without LMI cover.Non-impaired assets 90+ days past due Non-impaired assets 90+ days past due consist of well-secured assets that are more than 90 days past due and
portfolio-managed facilities that are not well secured and between 90 and 180 days past due.Non-retail deposits and other borrowings Comprises deposits held by Wholesale Banking and Specialised Group Assets, certificates of deposits, securities sold
under agreements to repurchase, and borrowings.Prime residential mortgages In Australia, residential mortgage loans advanced by traditional residential mortgage lenders and eligible to be covered
by an LMI policy.Retail deposits Comprises on-demand and savings deposits, term deposits and non-interest bearing deposits in Personal Banking,
Business Banking (excluding institutional customers), UK Banking, NZ Banking, NAB Wealth, Great Western Bank and Asia Banking.
Risk weighted assets On and off balance sheet assets of the Bank are allocated a risk weighting based on the amount of capital required to support the asset. Under Basel II the Group calculates risk weighted assets for credit risk, market risk, operational risk and interest rate risk in the banking book.
SCDO Synthetic Collateralised Debt Obligation.
Half Year Results
2012
152
Glossary of Terms
Scorecards A decision model incorporating algorithms that calculates a customer risk score, the outcome of which is used in the credit assessment process.
Securitisation Structured finance technique which involves pooling and packaging cash-flow converting financial assets into securities that can be sold to investors.
Senior tranche ABS CDO CDO of ABS where a conduit has invested in the most senior note.Special Purpose Entity (SPE) An entity created to accomplish a narrow well-defined objective (e.g. securitisation of financial assets). An SPE
may take the form of a corporation, trust, partnership or unincorporated entity. SPEs are often created with legal arrangements that impose strict limits on the activities of the SPE.
Stable Funding Index (SFI) Term Funding Index (TFI) plus Customer Funding Index (CFI).Sub-prime residential mortgages In USA, residential mortgage loans advanced to borrowers unable to qualify under traditional lending criteria due to
poor credit history or debt payment capacity.Term Funding Index (TFI) Term Wholesale Funding (with a remaining maturity to first call date greater than 12 months) divided by Core Assets.Tier 1 ratio Tier 1 capital as defined by APRA divided by risk weighted assets.Tier 2 ratio Tier 2 capital as defined by APRA divided by risk weighted assets.Total Shareholder Return (TSR) Total Shareholder Return (TSR) is a concept used to compare the performance of different companies’ stocks and
shares over time. It combines share price appreciation and dividends paid to show the total return to the shareholder. The absolute size of the TSR will vary with stock markets, but the relative position reflects the market perception of overall performance relative to a reference group.
Treasury shares Shares in National Australia Bank Limited held by the Group’s life insurance business and in trust by a controlled entity of the Group to meet the requirements of employee incentive schemes. The unrealised mark-to-market movements arising from changes in the share price, dividend income and realised profit and losses arising from share sales from shares held by the Group’s life insurance business are eliminated for statutory reporting purposes.
VARC Value of Acquisition Recovery Components. It is a component, net of reinsurance costs, of insurance policy liabilities. It is the current termination value less insurance policy liabilities, and represents the value of acquisition costs recoverable from future premiums.
Weighted Average Number of Shares Calculated in accordance with the requirements of AASB 133 ‘Earnings per Share.’

www.nab.com.au
© 2012 National Australia Bank Limited ABN 12 004 044 937 AFSL 230686 (05/12)